UNITED STATES
SECURITIES AND EXCHANGE COMMISSION
Washington, D.C. 20549
FormN-CSR
CERTIFIED SHAREHOLDER REPORT OF REGISTERED
MANAGEMENT INVESTMENT COMPANIES
Investment Company Act File Number:811-01545
Eaton Vance Special Investment Trust
(Exact Name of Registrant as Specified in Charter)
Two International Place, Boston, Massachusetts 02110
(Address of Principal Executive Offices)
Maureen A. Gemma
Two International Place, Boston, Massachusetts 02110
(Name and Address of Agent for Services)
(617)482-8260
(Registrant’s Telephone Number)
December��31
Date of Fiscal Year End
December 31, 2019
Date of Reporting Period
Item 1. Reports to Stockholders

Eaton Vance
Balanced Fund
Annual Report
December 31, 2019
Important Note. Beginning on January 1, 2021, as permitted by regulations adopted by the Securities and Exchange Commission, paper copies of the Fund’s annual and semi-annual shareholder reports will no longer be sent by mail unless you specifically request paper copies of the reports. Instead, the reports will be made available on the Fund’s website (eatonvance.com/funddocuments), and you will be notified by mail each time a report is posted and provided with a website address to access the report.
If you already elected to receive shareholder reports electronically, you will not be affected by this change and you need not take any action. If you are a direct investor, you may elect to receive shareholder reports and other communications from the Fund electronically by signing up for e-Delivery at eatonvance.com/edelivery. If you own your shares through a financial intermediary (such as a broker-dealer or bank), you must contact your financial intermediary to sign up.
You may elect to receive all future Fund shareholder reports in paper free of charge. If you are a direct investor, you can inform the Fund that you wish to continue receiving paper copies of your shareholder reports by calling 1-800-262-1122. If you own these shares through a financial intermediary, you must contact your financial intermediary or follow instructions included with this disclosure, if applicable, to elect to continue to receive paper copies of your shareholder reports. Your election to receive reports in paper will apply to all Eaton Vance funds held directly or to all funds held through your financial intermediary, as applicable.

Commodity Futures Trading Commission Registration. Effective December 31, 2012, the Commodity Futures Trading Commission (“CFTC”) adopted certain regulatory changes that subject registered investment companies and advisers to regulation by the CFTC if a fund invests more than a prescribed level of its assets in certain CFTC-regulated instruments (including futures, certain options and swap agreements) or markets itself as providing investment exposure to such instruments. The Fund has claimed an exclusion from the definition of the term “commodity pool operator” under the Commodity Exchange Act. Accordingly, neither the Fund nor the adviser with respect to the operation of the Fund is subject to CFTC regulation. Because of its management of other strategies, the Fund’s adviser is registered with the CFTC as a commodity pool operator and a commodity trading advisor.
Fund shares are not insured by the FDIC and are not deposits or other obligations of, or guaranteed by, any depository institution. Shares are subject to investment risks, including possible loss of principal invested.
This report must be preceded or accompanied by a current summary prospectus or prospectus. Before investing, investors should consider carefully the investment objective, risks, and charges and expenses of a mutual fund. This and other important information is contained in the summary prospectus and prospectus, which can be obtained from a financial intermediary. Prospective investors should read the prospectus carefully before investing. For further information, please call 1-800-262-1122.
Annual ReportDecember 31, 2019
Eaton Vance
Balanced Fund
Table of Contents
Management’s Discussion of Fund Performance | 2 | |||
Performance | 3 | |||
Fund Profile | 4 | |||
Endnotes and Additional Disclosures | 5 | |||
Fund Expenses | 6 | |||
Financial Statements | 7 | |||
Report of Independent Registered Public Accounting Firm | 20 and 32 | |||
Federal Tax Information | 21 | |||
Management and Organization | 33 | |||
Important Notices | 36 | |||
Eaton Vance
Balanced Fund
December 31, 2019
Management’s Discussion of Fund Performance1
Economic and Market Conditions
With virtually every U.S. equity index posting strong double-digit returns for the12-month period ended December 31, 2019 — and bond markets solidly in the black as well — 2019 was a good year for investments.
As the new year dawned in January 2019, investors appeared to be taking a “glass is half full” approach. Although U.S. manufacturing output and business investment remained weak — held back by slowing global growth and anon-again/off-again U.S.-China trade war — strong spending by U.S. consumers and dovish remarks by the U.S. Federal Reserve (the Fed) combined to lift investor sentiment. U.S. unemployment, meanwhile, remained low and hiring remained strong.
As a result, U.S. stocks across multiple markets climbed from January through April 2019. Overseas, central banks around the world began to cut interest rates and employ other tools to stimulate their respective economies. Even a global stock pullback in May proved to be temporary, and the U.S. and global stock rallies resumed in June and July. After a down August, U.S. equities rallied again during the final months of the period, spurred by optimism about a U.S.-China trade détente and better-than-expected U.S. employment reports.
After holding interest rates steady through the first half of the year, the Fed cut its benchmark interest rate on July 31, 2019 — its first reduction in over a decade — followed by two additional rate cuts in September and October to end the period at1.50%-1.75%. By the end of the third quarter, 60 central banks around the world had lowered their interest rates as well.
During the12-month period ended December 31, 2019, the blue-chip Dow Jones Industrial Average®2 returned 25.34%, while the broader U.S. equity market, represented by the S&P 500® Index, returned 31.49%. The technology-laden Nasdaq Composite Index returned 36.69% during the period.Large-cap U.S. stocks, as measured by the S&P 500® Index, generally outperformed theirsmall-cap counterparts, as measured by the Russell 2000® Index. As a group, growth stocks outpaced value stocks in both large-andsmall-cap categories as measured by the Russell growth and value indexes.
Fueled by the Fed rate cuts amid continued economic growth with low inflation, bond markets delivered healthy returns during the period. Interest rates fell broadly across asset classes and maturities. The yield on the benchmark10-year Treasury declined from 2.68% at the start of the year to 1.92% at year-end. The Bloomberg Barclays U.S. Aggregate Bond Index returned 8.72% for the period. As investors sought higher yields, both investment-grade corporate bonds and lower quality high yield securities outpaced U.S. Treasurys during the period.
Fund Performance
For the12-month period ended December 31, 2019, Eaton Vance Balanced Fund (the Fund) returned 23.63% for Class A shares at net asset value (NAV), underperforming its primary benchmark, the S&P 500® Index (the Index), which returned 31.49%.
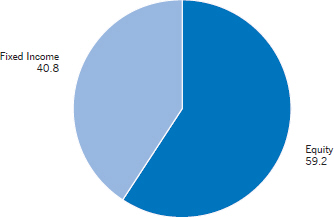
Atperiod-end, 59% of the Fund was invested in equities through Stock Portfolio, while 41% was invested in fixed-income securities through Core Bond Portfolio. In the Fund’s equity allocation, stock selections in the information technology (IT), communication services, and consumer discretionary sectors detracted from Fund performance versus the Index.
In IT, Stock Portfolio’s underweight in semiconductor and telecommunications equipment firm QUALCOMM, Inc. (QUALCOMM), and then selling the stock during the period,
detracted from relative performance versus the Index during the period. After the Stock Portfolio sold QUALCOMM, the company’s stock price rose sharply following the firm’s settlement with Apple, Inc., which involved a long-running dispute over licensing fees for QUALCOMM technology.
In communication services, Stock Portfolio’s overweight position in broadband and cellular service provider Verizon Communications, Inc. hurt relative results versus the Index. While the stock delivered double-digit gains, it underperformed the market during a period when investors favored companies viewed as having higher growth potential thancell-service providers.
Canadian apparel maker Gildan Activewear, Inc. (Gildan), anout-of-Index holding in the consumer discretionary sector, also detracted from Fund performance versus the Index. Gildan’s stock price declined after it surprised the market in October 2019 with an announcement that annual sales and earnings would be lower than projected. The security was sold during the period.
On the positive side, the Stock Portfolio’s stock selections in the health care, financials, and industrials sectors contributed to Fund performance versus the Index. In health care, not owning global pharmaceutical firm Pfizer, Inc. (Pfizer), an Index component, helped performance versus the Index. Underperformance of Upjohn Co., Pfizer’s generic drug division, along with difficulties surrounding the merger of Upjohn and generics firm Mylan NV, caused Pfizer’s stock to decline during the period.
The Stock Portfolio initiated a position in Bristol-Myers Squibb Co. (Bristol-Myers), another global pharmaceutical firm, in May 2019 after its stock price declined on the announcement of Bristol-Myers’ intent to acquire rival Celgene Corp. (Celgene). Bristol-Myers’ stock subsequently rose — and contributed to relative performance versus the Index — due to positive data from a Celgene cancer drug trial, as well as the market’s recognition that Celgene’s new products were more effective than initially perceived.
Not owning Warren Buffet’s multinational holding company Berkshire Hathaway, Inc. (Berkshire Hathaway), an Index component in the financials sector, aided performance relative to the Index as well. The stock underperformed the market as investors reacted negatively to Berkshire Hathaway’s inability to find a large acquisition during the period to put its growing cash reserves to work
In the industrials sector, performance versus the Index benefited from Stock Portfolio’sout-of-Index position in Gardner Denver Holdings, Inc. (Gardner Denver), a conglomerate that manufactures compressors, pumps, and blowers. The stock outperformed the Index after Gardner Denver announced a pending merger with Ingersoll Rand PLC’s pumps business, making Gardner Denver the second-largest player in its industry.
Among Core Bond Portfolio’s fixed-income holdings, an overweight position in investment-grade corporate bonds contributed the most to Fund returns relative to the Fund’s secondary benchmark, the Bloomberg Barclays U.S Aggregate Bond Index (the Secondary Index).Out-of-Secondary Index allocations to high yield corporate bonds and bank loans also contributed to relative Fund performance. All three sectors outperformed U.S. Treasury securities during the period, as investors sought higher income potential.
Conversely, Core Bond Portfolio’s shorter-than-Secondary Index duration6 detracted from relative Fund performance, as interest rates fell sharply during the period. An overweight allocation toasset-backed securities also detracted from relative results versus the Secondary Index, as the fixed-income market lagged during the period.
See Endnotes and Additional Disclosures in this report.
Past performance is no guarantee of future results. Returns are historical and are calculated by determining the percentage change in net asset value (NAV) or offering price (as applicable) with all distributions reinvested. Investment return and principal value will fluctuate so that shares, when redeemed, may be worth more or less than their original cost. Performance for periods less than or equal to one year is cumulative. Performance is for the stated time period only; due to market volatility, current Fund performance may be lower or higher than the quoted return. For performance as of the most recent month-end, please refer to eatonvance.com.
| 2 |
Eaton Vance
Balanced Fund
December 31, 2019
Performance2,3
Portfolio ManagersCharles B. Gaffney, Vishal Khanduja, CFA and Brian S. Ellis, CFA
| % Average Annual Total Returns | Class Inception Date | Performance Inception Date | One Year | Five Years | Ten Years | |||||||||||||||
Class A at NAV | 04/01/1932 | 04/01/1932 | 23.63 | % | 7.79 | % | 9.03 | % | ||||||||||||
Class A with 5.75% Maximum Sales Charge | — | — | 16.46 | 6.51 | 8.39 | |||||||||||||||
Class C at NAV | 11/02/1993 | 04/01/1932 | 22.71 | 7.01 | 8.23 | |||||||||||||||
Class C with 1% Maximum Sales Charge | — | — | 21.71 | 7.01 | 8.23 | |||||||||||||||
Class I at NAV | 09/28/2012 | 04/01/1932 | 24.07 | 8.08 | 9.23 | |||||||||||||||
Class R at NAV | 05/02/2016 | 04/01/1932 | 23.31 | 7.60 | 8.93 | |||||||||||||||
Class R6 at NAV | 05/02/2016 | 04/01/1932 | 24.11 | 8.12 | 9.25 | |||||||||||||||
S&P 500® Index | — | — | 31.49 | % | 11.69 | % | 13.55 | % | ||||||||||||
Bloomberg Barclays U.S. Aggregate Bond Index | — | — | 8.72 | 3.05 | 3.74 | |||||||||||||||
Blended Index | — | — | 22.18 | 8.37 | 9.77 | |||||||||||||||
% Total Annual Operating Expense Ratios4 | Class A | Class C | Class I | Class R | Class R6 | |||||||||||||||
Gross | 1.01 | % | 1.76 | % | 0.76 | % | 1.26 | % | 0.72 | % | ||||||||||
Net | 0.98 | 1.73 | 0.73 | 1.23 | 0.69 | |||||||||||||||
Growth of $10,000
This graph shows the change in value of a hypothetical investment of $10,000 in Class A of the Fund for the period indicated. For comparison, the same investment is shown in the indicated index.
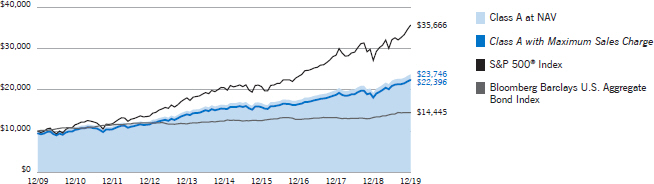
| Growth of Investment3 | Amount Invested | Period Beginning | At NAV | With Maximum Sales Charge | ||||||||||||
Class C | $ | 10,000 | 12/31/2009 | $ | 22,071 | N.A. | ||||||||||
Class I | $ | 250,000 | 12/31/2009 | $ | 604,906 | N.A. | ||||||||||
Class R | $ | 10,000 | 12/31/2009 | $ | 23,540 | N.A. | ||||||||||
Class R6 | $ | 1,000,000 | 12/31/2009 | $ | 2,424,466 | N.A. | ||||||||||
See Endnotes and Additional Disclosures in this report.
Past performance is no guarantee of future results. Returns are historical and are calculated by determining the percentage change in net asset value (NAV) or offering price (as applicable) with all distributions reinvested. Investment return and principal value will fluctuate so that shares, when redeemed, may be worth more or less than their original cost. Performance for periods less than or equal to one year is cumulative. Performance is for the stated time period only; due to market volatility, current Fund performance may be lower or higher than the quoted return. For performance as of the most recentmonth-end, please refer to eatonvance.com.
| 3 |
Eaton Vance
Balanced Fund
December 31, 2019
Fund Profile5
Asset Allocation (% of total investments)
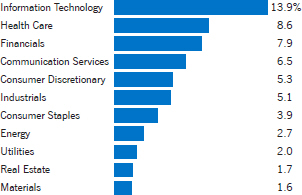
Equity Investments Sector Allocation (% of total investments)
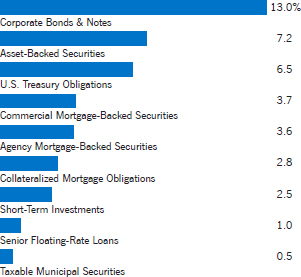
Fixed Income Allocation (% of total investments)
See Endnotes and Additional Disclosures in this report.
| 4 |
Eaton Vance
Balanced Fund
December 31, 2019
Endnotes and Additional Disclosures
| 1 | The views expressed in this report are those of the portfolio manager(s) and are current only through the date stated at the top of this page. These views are subject to change at any time based upon market or other conditions, and Eaton Vance and the Fund(s) disclaim any responsibility to update such views. These views may not be relied upon as investment advice and, because investment decisions are based on many factors, may not be relied upon as an indication of trading intent on behalf of any Eaton Vance fund. This commentary may contain statements that are not historical facts, referred to as “forward looking statements.” The Fund’s actual future results may differ significantly from those stated in any forward looking statement, depending on factors such as changes in securities or financial markets or general economic conditions, the volume of sales and purchases of Fund shares, the continuation of investment advisory, administrative and service contracts, and other risks discussed from time to time in the Fund’s filings with the Securities and Exchange Commission. |
| 2 | Dow Jones Industrial Average® is a price-weighted average of 30 blue-chip stocks that are generally the leaders in their industry. S&P 500® Index is an unmanaged index of large-cap stocks commonly used as a measure of U.S. stock market performance. S&P Dow Jones Indices are a product of S&P Dow Jones Indices LLC (“S&P DJI”) and have been licensed for use. S&P® and S&P 500® are registered trademarks of S&P DJI; Dow Jones® is a registered trademark of Dow Jones Trademark Holdings LLC (“Dow Jones”); S&P DJI, Dow Jones and their respective affiliates do not sponsor, endorse, sell or promote the Fund, will not have any liability with respect thereto and do not have any liability for any errors, omissions, or interruptions of the S&P Dow Jones Indices. Nasdaq Composite Index is a market capitalization-weighted index of all domestic and international securities listed on Nasdaq. Source: Nasdaq, Inc. The information is provided by Nasdaq (with its affiliates, are referred to as the “Corporations”) and Nasdaq’s third party licensors on an “as is” basis and the Corporations make no guarantees and bear no liability of any kind with respect to the information or the Fund. Russell 2000® Index is an unmanaged index of 2,000 U.S.small-cap stocks. Bloomberg Barclays U.S. Aggregate Bond Index is an unmanaged index of domestic investment-grade bonds, including corporate, government andmortgage-backed securities. The Blended Index consists of 60% S&P 500® Index and 40% Bloomberg Barclays U.S. Aggregate Bond Index, rebalanced monthly Unless otherwise stated, index returns do not reflect the effect of any applicable sales charges, commissions, expenses, taxes or leverage, as applicable. It is not possible to invest directly in an index. |
| 3 | Total Returns at NAV do not include applicable sales charges. If sales charges were deducted, the returns would be lower. Total Returns shown with maximum sales charge reflect the stated maximum sales charge. Unless otherwise stated, performance does not reflect the deduction of taxes on Fund distributions or redemptions of Fund shares. |
Performance prior to the inception date of a class may be linked to the performance of an older class of the Fund. This linked performance is adjusted for any applicable sales charge, but is not adjusted for class expense differences. If adjusted for such differences, the performance would be different. The performance of Class I and Class R is linked to Class A and the performance of Class R6 is linked to Class I. Performance presented in the Financial Highlights included in the financial statements is not linked. |
| 4 | Source: Fund prospectus. Net expense ratios reflect a contractual expense reimbursement that continues through 4/30/20. Without the reimbursement, performance would have been lower. The expense ratios for the current reporting period can be found in the Financial Highlights section of this report. |
| 5 | Fund invests in one or more affiliated investment companies (Portfolios). References to investments are to the aggregate holdings of the Fund, including its pro rata share of each Portfolio in which it invests |
| 6 | Duration is a measure of the expected change in price of a bond — in percentage terms — given a one percent change in interest rates, all else being constant. Securities with lower durations tend to be less sensitive to interest rate changes. |
Fund profile subject to change due to active management. |
| 5 |
Eaton Vance
Balanced Fund
December 31, 2019
Fund Expenses
Example: As a Fund shareholder, you incur two types of costs: (1) transaction costs, including sales charges (loads) on purchases and redemption fees (if applicable); and (2) ongoing costs, including management fees; distribution and/or service fees; and other Fund expenses. This Example is intended to help you understand your ongoing costs (in dollars) of Fund investing and to compare these costs with the ongoing costs of investing in other mutual funds. The Example is based on an investment of $1,000 invested at the beginning of the period and held for the entire period (July 1, 2019 – December 31, 2019).
Actual Expenses: The first section of the table below provides information about actual account values and actual expenses. You may use the information in this section, together with the amount you invested, to estimate the expenses that you paid over the period. Simply divide your account value by $1,000 (for example, an $8,600 account value divided by $1,000 = 8.6), then multiply the result by the number in the first section under the heading entitled “Expenses Paid During Period” to estimate the expenses you paid on your account during this period.
Hypothetical Example for Comparison Purposes: The second section of the table below provides information about hypothetical account values and hypothetical expenses based on the actual Fund expense ratio and an assumed rate of return of 5% per year (before expenses), which is not the actual Fund return. The hypothetical account values and expenses may not be used to estimate the actual ending account balance or expenses you paid for the period. You may use this information to compare the ongoing costs of investing in your Fund and other funds. To do so, compare this 5% hypothetical example with the 5% hypothetical examples that appear in the shareholder reports of the other funds.
Please note that the expenses shown in the table are meant to highlight your ongoing costs only and do not reflect any transactional costs, such as sales charges (loads) or redemption fees (if applicable). Therefore, the second section of the table is useful in comparing ongoing costs only, and will not help you determine the relative total costs of owning different funds. In addition, if these transactional costs were included, your costs would be higher.
| Beginning Account Value (7/1/19) | Ending Account Value (12/31/19) | Expenses Paid During Period* (7/1/19 – 12/31/19) | Annualized Expense Ratio | |||||||||||||
Actual | ||||||||||||||||
Class A | $ | 1,000.00 | $ | 1,069.90 | $ | 5.11 | 0.98 | % | ||||||||
Class C | $ | 1,000.00 | $ | 1,066.60 | $ | 9.01 | 1.73 | % | ||||||||
Class I | $ | 1,000.00 | $ | 1,072.40 | $ | 3.81 | 0.73 | % | ||||||||
Class R | $ | 1,000.00 | $ | 1,069.00 | $ | 6.41 | 1.23 | % | ||||||||
Class R6 | $ | 1,000.00 | $ | 1,072.60 | $ | 3.55 | 0.68 | % | ||||||||
Hypothetical | ||||||||||||||||
(5% return per year before expenses) | ||||||||||||||||
Class A | $ | 1,000.00 | $ | 1,020.30 | $ | 4.99 | 0.98 | % | ||||||||
Class C | $ | 1,000.00 | $ | 1,016.50 | $ | 8.79 | 1.73 | % | ||||||||
Class I | $ | 1,000.00 | $ | 1,021.50 | $ | 3.72 | 0.73 | % | ||||||||
Class R | $ | 1,000.00 | $ | 1,019.00 | $ | 6.26 | 1.23 | % | ||||||||
Class R6 | $ | 1,000.00 | $ | 1,021.80 | $ | 3.47 | 0.68 | % | ||||||||
| * | Expenses are equal to the Fund’s annualized expense ratio for the indicated Class, multiplied by the average account value over the period, multiplied by 184/365 (to reflect the one-half year period). The Example assumes that the $1,000 was invested at the net asset value per share determined at the close of business on June 30, 2019. The Example reflects the expenses of both the Fund and the Portfolios. |
| 6 |
Eaton Vance
Balanced Fund
December 31, 2019
Statement of Assets and Liabilities
| Assets | December 31, 2019 | |||
Investment in Core Bond Portfolio, at value (identified cost, $381,754,050) | $ | 385,214,229 | ||
Investment in Stock Portfolio, at value (identified cost, $435,325,828) | 574,499,388 | |||
Receivable for Fund shares sold | 1,967,454 | |||
Total assets | $ | 961,681,071 | ||
| Liabilities | ||||
Payable for Fund shares redeemed | $ | 1,118,028 | ||
Payable to affiliates: | ||||
Administration fee | 32,231 | |||
Distribution and service fees | 275,259 | |||
Trustees’ fees | 125 | |||
Accrued expenses | 275,675 | |||
Total liabilities | $ | 1,701,318 | ||
Net Assets | $ | 959,979,753 | ||
| Sources of Net Assets | ||||
Paid-in capital | $ | 794,138,093 | ||
Distributable earnings | 165,841,660 | |||
Net Assets | $ | 959,979,753 | ||
| Class A Shares | ||||
Net Assets | $ | 353,168,620 | ||
Shares Outstanding | 35,847,278 | |||
Net Asset Value and Redemption Price Per Share | ||||
(net assets ÷ shares of beneficial interest outstanding) | $ | 9.85 | ||
Maximum Offering Price Per Share | ||||
(100 ÷ 94.25 of net asset value per share) | $ | 10.45 | ||
| Class C Shares | ||||
Net Assets | $ | 236,215,414 | ||
Shares Outstanding | 23,866,564 | |||
Net Asset Value and Offering Price Per Share* | ||||
(net assets ÷ shares of beneficial interest outstanding) | $ | 9.90 | ||
| Class I Shares | ||||
Net Assets | $ | 322,436,454 | ||
Shares Outstanding | 32,717,322 | |||
Net Asset Value, Offering Price and Redemption Price Per Share | ||||
(net assets ÷ shares of beneficial interest outstanding) | $ | 9.86 | ||
| Class R Shares | ||||
Net Assets | $ | 5,904,608 | ||
Shares Outstanding | 601,301 | |||
Net Asset Value, Offering Price and Redemption Price Per Share | ||||
(net assets ÷ shares of beneficial interest outstanding) | $ | 9.82 | ||
| Class R6 Shares | ||||
Net Assets | $ | 42,254,657 | ||
Shares Outstanding | 4,286,797 | |||
Net Asset Value, Offering Price and Redemption Price Per Share | ||||
(net assets ÷ shares of beneficial interest outstanding) | $ | 9.86 | ||
On sales of $50,000 or more, the offering price of Class A shares is reduced.
| * | Redemption price per share is equal to the net asset value less any applicable contingent deferred sales charge. |
| 7 | See Notes to Financial Statements. |
Eaton Vance
Balanced Fund
December 31, 2019
Statement of Operations
| Investment Income | Year Ended December 31, 2019 | |||
Dividends allocated from Portfolios (net of foreign taxes, $83,379) | $ | 8,622,823 | ||
Interest allocated from Portfolios (net of foreign taxes, $4,861) | 11,557,642 | |||
Expenses allocated from Portfolios | (5,017,588 | ) | ||
Total investment income from Portfolios | $ | 15,162,877 | ||
| Expenses | ||||
Administration fee | $ | 348,170 | ||
Distribution and service fees | ||||
Class A | 851,843 | |||
Class B | 6,471 | |||
Class C | 2,234,421 | |||
Class R | 19,764 | |||
Trustees’ fees and expenses | 500 | |||
Custodian fee | 60,382 | |||
Transfer and dividend disbursing agent fees | 599,028 | |||
Legal and accounting services | 56,165 | |||
Printing and postage | 79,935 | |||
Registration fees | 108,134 | |||
Miscellaneous | 67,447 | |||
Total expenses | $ | 4,432,260 | ||
Net investment income | $ | 10,730,617 | ||
| Realized and Unrealized Gain (Loss) from Portfolios | ||||
Net realized gain (loss) — | ||||
Investment transactions | $ | 35,514,507 | ||
Financial futures contracts | 4,933,034 | |||
Foreign currency transactions | 212 | |||
Net realized gain | $ | 40,447,753 | ||
Change in unrealized appreciation (depreciation) — | ||||
Investments | $ | 130,210,187 | ||
Financial futures contracts | (2,236,237 | ) | ||
Foreign currency | 1,739 | |||
Net change in unrealized appreciation (depreciation) | $ | 127,975,689 | ||
Net realized and unrealized gain | $ | 168,423,442 | ||
Net increase in net assets from operations | $ | 179,154,059 | ||
| 8 | See Notes to Financial Statements. |
Eaton Vance
Balanced Fund
December 31, 2019
Statements of Changes in Net Assets
| Year Ended December 31, | ||||||||
| Increase (Decrease) in Net Assets | 2019 | 2018 | ||||||
From operations — | ||||||||
Net investment income | $ | 10,730,617 | $ | 10,753,583 | ||||
Net realized gain | 40,447,753 | 36,889,139 | (1) | |||||
Net change in unrealized appreciation (depreciation) | 127,975,689 | (75,919,790 | ) | |||||
Net increase (decrease) in net assets from operations | $ | 179,154,059 | $ | (28,277,068 | ) | |||
Distributions to shareholders — | ||||||||
Class A | $ | (13,354,072 | ) | $ | (18,739,469 | ) | ||
Class B | (4,525 | ) | (91,266 | ) | ||||
Class C | (7,054,249 | ) | (12,205,962 | ) | ||||
Class I | (12,155,136 | ) | (13,826,475 | ) | ||||
Class R | (180,605 | ) | (135,021 | ) | ||||
Class R6 | (1,599,307 | ) | (1,789,678 | ) | ||||
Total distributions to shareholders | $ | (34,347,894 | ) | $ | (46,787,871 | ) | ||
Transactions in shares of beneficial interest — | ||||||||
Proceeds from sale of shares | ||||||||
Class A | $ | 53,482,468 | $ | 36,195,194 | ||||
Class B | 190 | 102,651 | ||||||
Class C | 33,197,069 | 32,946,973 | ||||||
Class I | 130,863,717 | 84,683,057 | ||||||
Class R | 3,294,963 | 2,505,931 | ||||||
Class R6 | 13,926,389 | 8,927,546 | ||||||
Net asset value of shares issued to shareholders in payment of distributions declared | ||||||||
Class A | 12,267,588 | 17,050,458 | ||||||
Class B | 4,171 | 75,196 | ||||||
Class C | 6,717,511 | 11,694,047 | ||||||
Class I | 10,372,652 | 12,115,212 | ||||||
Class R | 180,605 | 135,021 | ||||||
Class R6 | 1,599,307 | 1,789,678 | ||||||
Cost of shares redeemed | ||||||||
Class A | (85,709,944 | ) | (65,301,961 | ) | ||||
Class B | (271,291 | ) | (382,402 | ) | ||||
Class C | (44,503,151 | ) | (60,203,295 | ) | ||||
Class I | (69,730,525 | ) | (87,201,665 | ) | ||||
Class R | (669,135 | ) | (419,113 | ) | ||||
Class R6 | (7,122,601 | ) | (7,265,449 | ) | ||||
Net asset value of shares converted(2) | ||||||||
Class A | 20,785,169 | 1,881,655 | ||||||
Class B | (1,316,238 | ) | (1,881,655 | ) | ||||
Class C | (19,468,931 | ) | — | |||||
Net increase (decrease) in net assets from Fund share transactions | $ | 57,899,983 | $ | (12,552,921 | ) | |||
Other capital — | ||||||||
Portfolio transaction fee contributed to Stock Portfolio | $ | (279,711 | ) | $ | (210,067 | ) | ||
Portfolio transaction fee allocated from Stock Portfolio | 264,070 | 199,641 | ||||||
Net decrease in net assets from other capital | $ | (15,641 | ) | $ | (10,426 | ) | ||
Net increase (decrease) in net assets | $ | 202,690,507 | $ | (87,628,286 | ) | |||
| Net Assets |
| |||||||
At beginning of year | $ | 757,289,246 | $ | 844,917,532 | ||||
At end of year | $ | 959,979,753 | $ | 757,289,246 | ||||
| (1) | Includes $1,736,702 of net realized gains from redemptions in-kind. |
| (2) | Includes the conversion of Class B to Class A shares at the close of business on October 15, 2019 upon the termination of Class B. |
| 9 | See Notes to Financial Statements. |
Eaton Vance
Balanced Fund
December 31, 2019
Financial Highlights
| Class A | ||||||||||||||||||||
| Year Ended December 31, | ||||||||||||||||||||
| 2019 | 2018 | 2017 | 2016 | 2015 | ||||||||||||||||
Net asset value — Beginning of year | $ | 8.280 | $ | 9.110 | $ | 8.410 | $ | 8.190 | $ | 8.460 | ||||||||||
| Income (Loss) From Operations |
| |||||||||||||||||||
Net investment income(1) | $ | 0.125 | $ | 0.132 | $ | 0.124 | $ | 0.114 | $ | 0.088 | ||||||||||
Net realized and unrealized gain (loss) | 1.819 | (0.424 | ) | 1.003 | 0.261 | 0.139 | ||||||||||||||
Total income (loss) from operations | $ | 1.944 | $ | (0.292 | ) | $ | 1.127 | $ | 0.375 | $ | 0.227 | |||||||||
| Less Distributions |
| |||||||||||||||||||
From net investment income | $ | (0.127 | ) | $ | (0.146 | ) | $ | (0.139 | ) | $ | (0.123 | ) | $ | (0.116 | ) | |||||
From net realized gain | (0.247 | ) | (0.392 | ) | (0.288 | ) | (0.032 | ) | (0.381 | ) | ||||||||||
Total distributions | $ | (0.374 | ) | $ | (0.538 | ) | $ | (0.427 | ) | $ | (0.155 | ) | $ | (0.497 | ) | |||||
Portfolio transaction fee, net(1) | $ | (0.000 | )(2) | $ | (0.000 | )(2) | $ | 0.000 | (2) | $ | (0.000 | )(2) | $ | — | ||||||
Net asset value — End of year | $ | 9.850 | $ | 8.280 | $ | 9.110 | $ | 8.410 | $ | 8.190 | ||||||||||
Total Return(3) | 23.63 | % | (3.43 | )%(4) | 13.53 | %(4) | 4.60 | %(4) | 2.65 | %(4) | ||||||||||
| Ratios/Supplemental Data |
| |||||||||||||||||||
Net assets, end of year (000’s omitted) | $ | 353,169 | $ | 294,742 | $ | 333,860 | $ | 374,579 | $ | 293,994 | ||||||||||
Ratios (as a percentage of average daily net assets):(5) | ||||||||||||||||||||
Expenses(6) | 0.98 | % | 0.98 | %(4) | 0.98 | %(4) | 0.98 | %(4) | 1.05 | %(4) | ||||||||||
Net investment income | 1.34 | % | 1.45 | % | 1.41 | % | 1.38 | % | 1.05 | % | ||||||||||
Portfolio Turnover of the Fund(7) | 12 | % | 7 | % | 4 | % | 11 | % | 2 | % | ||||||||||
| (1) | Computed using average shares outstanding. |
| (2) | Amount is less than $0.0005 or $(0.0005), as applicable. |
| (3) | Returns are historical and are calculated by determining the percentage change in net asset value with all distributions reinvested and do not reflect the effect of sales charges. |
| (4) | The administrator of the Fund reimbursed certain operating expenses (equal to 0.03%, 0.01%, 0.03% and less than 0.005% of average daily net assets for the years ended December 31, 2018, 2017, 2016 and 2015, respectively). Absent this reimbursement, total return would be lower. |
| (5) | Includes the Fund’s share of the Portfolios’ allocated expenses. |
| (6) | Excludes the effect of custody fee credits, if any, of less than 0.005%. Effective September 1, 2015, custody fee credits, which were earned on cash deposit balances, were discontinued by the custodian. |
| (7) | Percentage is based on the Fund’s contributions to and withdrawals from the Portfolios and excludes the investment activity of the Portfolios. |
| 10 | See Notes to Financial Statements. |
Eaton Vance
Balanced Fund
December 31, 2019
Financial Highlights — continued
| Class C | ||||||||||||||||||||
| Year Ended December 31, | ||||||||||||||||||||
| 2019 | 2018 | 2017 | 2016 | 2015 | ||||||||||||||||
Net asset value — Beginning of year | $ | 8.310 | $ | 9.140 | $ | 8.440 | $ | 8.220 | $ | 8.500 | ||||||||||
| Income (Loss) From Operations |
| |||||||||||||||||||
Net investment income(1) | $ | 0.055 | $ | 0.064 | $ | 0.058 | $ | 0.052 | $ | 0.026 | ||||||||||
Net realized and unrealized gain (loss) | 1.837 | (0.426 | ) | 1.001 | 0.266 | 0.138 | ||||||||||||||
Total income (loss) from operations | $ | 1.892 | $ | (0.362 | ) | $ | 1.059 | $ | 0.318 | $ | 0.164 | |||||||||
| Less Distributions |
| |||||||||||||||||||
From net investment income | $ | (0.055 | ) | $ | (0.076 | ) | $ | (0.071 | ) | $ | (0.066 | ) | $ | (0.063 | ) | |||||
From net realized gain | (0.247 | ) | (0.392 | ) | (0.288 | ) | (0.032 | ) | (0.381 | ) | ||||||||||
Total distributions | $ | (0.302 | ) | $ | (0.468 | ) | $ | (0.359 | ) | $ | (0.098 | ) | $ | (0.444 | ) | |||||
Portfolio transaction fee, net(1) | $ | (0.000 | )(2) | $ | (0.000 | )(2) | $ | 0.000 | (2) | $ | (0.000 | )(2) | $ | — | ||||||
Net asset value — End of year | $ | 9.900 | $ | 8.310 | $ | 9.140 | $ | 8.440 | $ | 8.220 | ||||||||||
Total Return(3) | 22.71 | % | (4.03 | )%(4) | 12.63 | %(4) | 3.88 | %(4) | 1.86 | %(4) | ||||||||||
| Ratios/Supplemental Data |
| |||||||||||||||||||
Net assets, end of year (000’s omitted) | $ | 236,215 | $ | 221,669 | $ | 258,844 | $ | 254,656 | $ | 137,051 | ||||||||||
Ratios (as a percentage of average daily net assets):(5) | ||||||||||||||||||||
Expenses(6) | 1.73 | % | 1.73 | %(4) | 1.73 | %(4) | 1.73 | %(4) | 1.80 | %(4) | ||||||||||
Net investment income | 0.59 | % | 0.70 | % | 0.65 | % | 0.63 | % | 0.30 | % | ||||||||||
Portfolio Turnover of the Fund(7) | 12 | % | 7 | % | 4 | % | 11 | % | 2 | % | ||||||||||
| (1) | Computed using average shares outstanding. |
| (2) | Amount is less than $0.0005 or $(0.0005), as applicable. |
| (3) | Returns are historical and are calculated by determining the percentage change in net asset value with all distributions reinvested and do not reflect the effect of sales charges. |
| (4) | The administrator of the Fund reimbursed certain operating expenses (equal to 0.03%, 0.01%, 0.03% and less than 0.005% of average daily net assets for the years ended December 31, 2018, 2017, 2016 and 2015, respectively). Absent this reimbursement, total return would be lower. |
| (5) | Includes the Fund’s share of the Portfolios’ allocated expenses. |
| (6) | Excludes the effect of custody fee credits, if any, of less than 0.005%. Effective September 1, 2015, custody fee credits, which were earned on cash deposit balances, were discontinued by the custodian. |
| (7) | Percentage is based on the Fund’s contributions to and withdrawals from the Portfolios and excludes the investment activity of the Portfolios. |
| 11 | See Notes to Financial Statements. |
Eaton Vance
Balanced Fund
December 31, 2019
Financial Highlights — continued
| Class I | ||||||||||||||||||||
| Year Ended December 31, | ||||||||||||||||||||
| 2019 | 2018 | 2017 | 2016 | 2015 | ||||||||||||||||
Net asset value — Beginning of year | $ | 8.280 | $ | 9.110 | $ | 8.410 | $ | 8.190 | $ | 8.460 | ||||||||||
| Income (Loss) From Operations |
| |||||||||||||||||||
Net investment income(1) | $ | 0.149 | $ | 0.156 | $ | 0.147 | $ | 0.137 | $ | 0.109 | ||||||||||
Net realized and unrealized gain (loss) | 1.830 | (0.425 | ) | 1.002 | 0.258 | 0.138 | ||||||||||||||
Total income (loss) from operations | $ | 1.979 | $ | (0.269 | ) | $ | 1.149 | $ | 0.395 | $ | 0.247 | |||||||||
| Less Distributions |
| |||||||||||||||||||
From net investment income | $ | (0.152 | ) | $ | (0.169 | ) | $ | (0.161 | ) | $ | (0.143 | ) | $ | (0.136 | ) | |||||
From net realized gain | (0.247 | ) | (0.392 | ) | (0.288 | ) | (0.032 | ) | (0.381 | ) | ||||||||||
Total distributions | $ | (0.399 | ) | $ | (0.561 | ) | $ | (0.449 | ) | $ | (0.175 | ) | $ | (0.517 | ) | |||||
Portfolio transaction fee, net(1) | $ | (0.000 | )(2) | $ | (0.000 | )(2) | $ | 0.000 | (2) | $ | (0.000 | )(2) | $ | — | ||||||
Net asset value — End of year | $ | 9.860 | $ | 8.280 | $ | 9.110 | $ | 8.410 | $ | 8.190 | ||||||||||
Total Return(3) | 24.07 | % | (3.19 | )%(4) | 13.81 | %(4) | 4.86 | %(4) | 2.88 | %(4) | ||||||||||
| Ratios/Supplemental Data |
| |||||||||||||||||||
Net assets, end of year (000’s omitted) | $ | 322,436 | $ | 208,740 | $ | 220,522 | $ | 211,211 | $ | 78,055 | ||||||||||
Ratios (as a percentage of average daily net assets):(5) | ||||||||||||||||||||
Expenses(6) | 0.73 | % | 0.73 | %(4) | 0.73 | %(4) | 0.73 | %(4) | 0.80 | %(4) | ||||||||||
Net investment income | 1.59 | % | 1.70 | % | 1.66 | % | 1.63 | % | 1.29 | % | ||||||||||
Portfolio Turnover of the Fund(7) | 12 | % | 7 | % | 4 | % | 11 | % | 2 | % | ||||||||||
| (1) | Computed using average shares outstanding. |
| (2) | Amount is less than $0.0005 or $(0.0005), as applicable. |
| (3) | Returns are historical and are calculated by determining the percentage change in net asset value with all distributions reinvested. |
| (4) | The administrator of the Fund reimbursed certain operating expenses (equal to 0.03%, 0.01%, 0.03% and less than 0.005% of average daily net assets for the years ended December 31, 2018, 2017, 2016 and 2015, respectively). Absent this reimbursement, total return would be lower. |
| (5) | Includes the Fund’s share of the Portfolios’ allocated expenses. |
| (6) | Excludes the effect of custody fee credits, if any, of less than 0.005%. Effective September 1, 2015, custody fee credits, which were earned on cash deposit balances, were discontinued by the custodian. |
| (7) | Percentage is based on the Fund’s contributions to and withdrawals from the Portfolios and excludes the investment activity of the Portfolios. |
| 12 | See Notes to Financial Statements. |
Eaton Vance
Balanced Fund
December 31, 2019
Financial Highlights — continued
| Class R | ||||||||||||||||
| Year Ended December 31, | Period Ended December 31, 2016(1) | |||||||||||||||
| 2019 | 2018 | 2017 | ||||||||||||||
Net asset value — Beginning of period | $ | 8.260 | $ | 9.090 | $ | 8.400 | $ | 8.290 | ||||||||
| Income (Loss) From Operations |
| |||||||||||||||
Net investment income(2) | $ | 0.102 | $ | 0.115 | $ | 0.104 | $ | 0.075 | ||||||||
Net realized and unrealized gain (loss) | 1.812 | (0.423 | ) | 0.996 | 0.152 | |||||||||||
Total income (loss) from operations | $ | 1.914 | $ | (0.308 | ) | $ | 1.100 | $ | 0.227 | |||||||
| Less Distributions |
| |||||||||||||||
From net investment income | $ | (0.107 | ) | $ | (0.130 | ) | $ | (0.122 | ) | $ | (0.085 | ) | ||||
From net realized gain | (0.247 | ) | (0.392 | ) | (0.288 | ) | (0.032 | ) | ||||||||
Total distributions | $ | (0.354 | ) | $ | (0.522 | ) | $ | (0.410 | ) | $ | (0.117 | ) | ||||
Portfolio transaction fee, net(2) | $ | (0.000 | )(3) | $ | (0.000 | )(3) | $ | 0.000 | (3) | $ | (0.000 | )(3) | ||||
Net asset value — End of period | $ | 9.820 | $ | 8.260 | $ | 9.090 | $ | 8.400 | ||||||||
Total Return(4) | 23.31 | % | (3.61 | )%(5) | 13.22 | %(5) | 2.73 | %(5)(6) | ||||||||
| Ratios/Supplemental Data |
| |||||||||||||||
Net assets, end of period (000’s omitted) | $ | 5,905 | $ | 2,514 | $ | 561 | $ | 178 | ||||||||
Ratios (as a percentage of average daily net assets):(7) | ||||||||||||||||
Expenses(8) | 1.23 | % | 1.23 | %(5) | 1.23 | %(5) | 1.23 | %(5)(9) | ||||||||
Net investment income | 1.08 | % | 1.27 | % | 1.17 | % | 1.33 | %(9) | ||||||||
Portfolio Turnover of the Fund(10) | 12 | % | 7 | % | 4 | % | 11 | %(11) | ||||||||
| (1) | For the period from commencement of operations on May 2, 2016 to December 31, 2016. |
| (2) | Computed using average shares outstanding. |
| (3) | Amount is less than $0.0005 or $(0.0005), as applicable. |
| (4) | Returns are historical and are calculated by determining the percentage change in net asset value with all distributions reinvested. |
| (5) | The administrator of the Fund reimbursed certain operating expenses (equal to 0.03%, 0.01% and 0.03% of average daily net assets for the years ended December 31, 2018 and 2017 and the period ended December 31, 2016, respectively). Absent this reimbursement, total return would be lower. |
| (6) | Not annualized. |
| (7) | Includes the Fund’s share of the Portfolios’ allocated expenses. |
| (8) | Excludes the effect of custody fee credits, if any, of less than 0.005%. Effective September 1, 2015, custody fee credits, which were earned on cash deposit balances, were discontinued by the custodian. |
| (9) | Annualized. |
| (10) | Percentage is based on the Fund’s contributions to and withdrawals from the Portfolios and excludes the investment activity of the Portfolios. |
| (11) | For the Fund’s year ended December 31, 2016. |
| 13 | See Notes to Financial Statements. |
Eaton Vance
Balanced Fund
December 31, 2019
Financial Highlights — continued
| Class R6 | ||||||||||||||||
| Year Ended December 31, | Period Ended December 31, 2016(1) | |||||||||||||||
| 2019 | 2018 | 2017 | ||||||||||||||
Net asset value — Beginning of period | $ | 8.280 | $ | 9.110 | $ | 8.420 | $ | 8.300 | ||||||||
| Income (Loss) From Operations |
| |||||||||||||||
Net investment income(2) | $ | 0.153 | $ | 0.160 | $ | 0.146 | $ | 0.088 | ||||||||
Net realized and unrealized gain (loss) | 1.829 | (0.423 | ) | 0.999 | 0.170 | |||||||||||
Total income (loss) from operations | $ | 1.982 | $ | (0.263 | ) | $ | 1.145 | $ | 0.258 | |||||||
| Less Distributions |
| |||||||||||||||
From net investment income | $ | (0.155 | ) | $ | (0.175 | ) | $ | (0.167 | ) | $ | (0.106 | ) | ||||
From net realized gain | (0.247 | ) | (0.392 | ) | (0.288 | ) | (0.032 | ) | ||||||||
Total distributions | $ | (0.402 | ) | $ | (0.567 | ) | $ | (0.455 | ) | $ | (0.138 | ) | ||||
Portfolio transaction fee, net(2) | $ | (0.000 | )(3) | $ | (0.000 | )(3) | $ | 0.000 | (3) | $ | (0.000 | )(3) | ||||
Net asset value — End of period | $ | 9.860 | $ | 8.280 | $ | 9.110 | $ | 8.420 | ||||||||
Total Return(4) | 24.11 | % | (3.13 | )%(5) | 13.75 | %(5) | 3.11 | %(5)(6) | ||||||||
| Ratios/Supplemental Data |
| |||||||||||||||
Net assets, end of period (000’s omitted) | $ | 42,255 | $ | 28,215 | $ | 27,492 | $ | 7 | ||||||||
Ratios (as a percentage of average daily net assets):(7) | ||||||||||||||||
Expenses(8) | 0.68 | % | 0.69 | %(5) | 0.69 | %(5) | 0.69 | %(5)(9) | ||||||||
Net investment income | 1.63 | % | 1.74 | % | 1.62 | % | 1.58 | %(9) | ||||||||
Portfolio Turnover of the Fund(10) | 12 | % | 7 | % | 4 | % | 11 | %(11) | ||||||||
| (1) | For the period from commencement of operations on May 2, 2016 to December 31, 2016. |
| (2) | Computed using average shares outstanding. |
| (3) | Amount is less than $0.0005 or $(0.0005), as applicable. |
| (4) | Returns are historical and are calculated by determining the percentage change in net asset value with all distributions reinvested. |
| (5) | The administrator of the Fund reimbursed certain operating expenses (equal to 0.03%, 0.01% and 0.03% of average daily net assets for the years ended December 31, 2018 and 2017 and the period ended December 31, 2016, respectively). Absent this reimbursement, total return would be lower. |
| (6) | Not annualized. |
| (7) | Includes the Fund’s share of the Portfolios’ allocated expenses. |
| (8) | Excludes the effect of custody fee credits, if any, of less than 0.005%. Effective September 1, 2015, custody fee credits, which were earned on cash deposit balances, were discontinued by the custodian. |
| (9) | Annualized. |
| (10) | Percentage is based on the Fund’s contributions to and withdrawals from the Portfolios and excludes the investment activity of the Portfolios. |
| (11) | For the Fund’s year ended December 31, 2016. |
| 14 | See Notes to Financial Statements. |
Eaton Vance
Balanced Fund
December 31, 2019
Notes to Financial Statements
1 Significant Accounting Policies
Eaton Vance Balanced Fund (the Fund) is a diversified series of Eaton Vance Special Investment Trust (the Trust). The Trust is a Massachusetts business trust registered under the Investment Company Act of 1940, as amended (the 1940 Act), as an open-end management investment company. The Fund offers five classes of shares. Class A shares are generally sold subject to a sales charge imposed at time of purchase. Class C shares are sold at net asset value and are generally subject to a contingent deferred sales charge (see Note 5). Effective January 25, 2019, Class C shares generally automatically convert to Class A shares ten years after their purchase as described in the Fund’s prospectus. Class I, Class R and Class R6 shares are sold at net asset value and are not subject to a sales charge. The Fund previously offered Class B shares, which beginning January 1, 2012, were only available for purchase upon exchange from another Eaton Vance fund or through reinvestment of distributions. Class B shares automatically converted to Class A shares eight years after their purchase as described in the Fund’s prospectus. At the close of business on October 15, 2019, Class B shares were converted into Class A shares and Class B was terminated. Each class represents a pro-rata interest in the Fund, but votes separately on class-specific matters and (as noted below) is subject to different expenses. Realized and unrealized gains and losses and net investment income and losses, other than class-specific expenses, are allocated daily to each class of shares based on the relative net assets of each class to the total net assets of the Fund. Sub-accounting, recordkeeping and similar administrative fees payable to financial intermediaries, which are a component of transfer and dividend disbursing agent fees on the Statement of Operations, are not allocated to Class R6 shares. Each class of shares differs in its distribution plan and certain other class-specific expenses. The Fund’s investment objective is to provide current income and long-term growth of capital. The Fund currently pursues its objective by investing all of its investable assets in interests in two portfolios managed by Eaton Vance Management (EVM) or its affiliates (the Portfolios), which are Massachusetts business trusts. The value of the Fund’s investments in the Portfolios reflects the Fund’s proportionate interest in their net assets. The Fund’s proportionate interest in each of the Portfolio’s net assets at December 31, 2019 were as follows: Core Bond Portfolio (65.2%) and Stock Portfolio (84.0%). The performance of the Fund is directly affected by the performance of the Portfolios. The financial statements of Stock Portfolio, including the portfolio of investments, are included elsewhere in this report and should be read in conjunction with the Fund’s financial statements. A copy of Core Bond Portfolio’s financial statements is available by calling Eaton Vance at 1-800-262-1122 or in the EDGAR database on the Securities and Exchange Commission’s website at www.sec.gov.
The following is a summary of significant accounting policies of the Fund. The policies are in conformity with accounting principles generally accepted in the United States of America (U.S. GAAP). The Fund is an investment company and follows accounting and reporting guidance in the Financial Accounting Standards Board (FASB) Accounting Standards Codification Topic 946.
A Investment Valuation — Valuation of securities by Stock Portfolio is discussed in Note 1A of the Portfolio’s Notes to Financial Statements, which are included elsewhere in this report. Such policies are consistent with those of Core Bond Portfolio.
Additional valuation policies for Core Bond Portfolio (the Portfolio) are as follows:
Debt Obligations. Debt obligations are generally valued on the basis of valuations provided by third party pricing services, as derived from such services’ pricing models. Inputs to the models may include, but are not limited to, reported trades, executable bid and ask prices, broker/dealer quotations, prices or yields of securities with similar characteristics, interest rates, anticipated prepayments, benchmark curves or information pertaining to the issuer, as well as industry and economic events. The pricing services may use a matrix approach, which considers information regarding securities with similar characteristics to determine the valuation for a security. Short-term debt obligations purchased with a remaining maturity of sixty days or less for which a valuation from a third party pricing service is not readily available may be valued at amortized cost, which approximates fair value.
Senior Floating-Rate Loans. Interests in senior floating-rate loans (Senior Loans) for which reliable market quotations are readily available are valued generally at the average mean of bid and ask quotations obtained from a third party pricing service.
Derivatives. Financial futures contracts are valued at the closing settlement price established by the board of trade or exchange on which they are traded.
B Income — The Fund’s net investment income or loss consists of the Fund’s pro-rata share of the net investment income or loss of the Portfolios, less all actual and accrued expenses of the Fund.
C Federal Taxes — The Fund’s policy is to comply with the provisions of the Internal Revenue Code applicable to regulated investment companies and to distribute to shareholders each year substantially all of its net investment income, and all or substantially all of its net realized capital gains. Accordingly, no provision for federal income or excise tax is necessary.
As of December 31, 2019, the Fund had no uncertain tax positions that would require financial statement recognition, de-recognition, or disclosure. The Fund files a U.S. federal income tax return annually after its fiscal year-end, which is subject to examination by the Internal Revenue Service for a period of three years from the date of filing.
D Expenses — The majority of expenses of the Trust are directly identifiable to an individual fund. Expenses which are not readily identifiable to a specific fund are allocated taking into consideration, among other things, the nature and type of expense and the relative size of the funds.
E Use of Estimates — The preparation of the financial statements in conformity with U.S. GAAP requires management to make estimates and assumptions that affect the reported amounts of assets and liabilities at the date of the financial statements and the reported amounts of income and expense during the reporting period. Actual results could differ from those estimates.
| 15 |
Eaton Vance
Balanced Fund
December 31, 2019
Notes to Financial Statements — continued
F Indemnifications — Under the Trust’s organizational documents, its officers and Trustees may be indemnified against certain liabilities and expenses arising out of the performance of their duties to the Fund. Under Massachusetts law, if certain conditions prevail, shareholders of a Massachusetts business trust (such as the Trust) could be deemed to have personal liability for the obligations of the Trust. However, the Trust’s Declaration of Trust contains an express disclaimer of liability on the part of Fund shareholders and the By-laws provide that the Trust shall assume, upon request by the shareholder, the defense on behalf of any Fund shareholders. Moreover, the By-laws also provide for indemnification out of Fund property of any shareholder held personally liable solely by reason of being or having been a shareholder for all loss or expense arising from such liability. Additionally, in the normal course of business, the Fund enters into agreements with service providers that may contain indemnification clauses. The Fund’s maximum exposure under these arrangements is unknown as this would involve future claims that may be made against the Fund that have not yet occurred.
G Other — Investment transactions are accounted for on a trade date basis.
2 Distributions to Shareholders and Income Tax Information
It is the present policy of the Fund to make quarterly distributions of all or substantially all of its net investment income and to distribute annually all or substantially all of its net realized capital gains. Distributions to shareholders are recorded on the ex-dividend date. Distributions are declared separately for each class of shares. Shareholders may reinvest income and capital gain distributions in additional shares of the same class of the Fund at the net asset value as of the ex-dividend date or, at the election of the shareholder, receive distributions in cash. Distributions to shareholders are determined in accordance with income tax regulations, which may differ from U.S. GAAP. As required by U.S. GAAP, only distributions in excess of tax basis earnings and profits are reported in the financial statements as a return of capital. Permanent differences between book and tax accounting relating to distributions are reclassified to paid-in capital. For tax purposes, distributions from short-term capital gains are considered to be from ordinary income.
The tax character of distributions declared for the years ended December 31, 2019 and December 31, 2018 was as follows:
| Year Ended December 31, | ||||||||
| 2019 | 2018 | |||||||
Ordinary income | $ | 14,517,243 | $ | 21,180,027 | ||||
Long-term capital gains | $ | 19,830,651 | $ | 25,607,844 | ||||
During the year ended December 31, 2019, distributable earnings was decreased by $2,648,018 and paid-in capital was increased by $2,648,018 due to the Fund’s use of equalization accounting and differences between book and tax accounting for the Fund’s investment in the Portfolios. Tax equalization accounting allows the Fund to treat as a distribution that portion of redemption proceeds representing a redeeming shareholder’s portion of undistributed taxable income and net capital gains. These reclassifications had no effect on the net assets or net asset value per share of the Fund.
As of December 31, 2019, the components of distributable earnings (accumulated loss) on a tax basis were as follows:
Undistributed ordinary income | $ | 2,372,755 | ||
Undistributed long-term capital gains | $ | 8,170,886 | ||
Net unrealized appreciation | $ | 155,298,019 | ||
3 Investment Adviser Fee and Other Transactions with Affiliates
The investment adviser fee is earned by EVM as compensation for investment advisory services rendered to the Fund. Pursuant to an investment advisory agreement effective October 18, 2018, between the Fund and EVM, the investment adviser fee is computed on investable Fund assets that are not invested in other investment companies for which EVM or its affiliates serve as investment adviser (“Investable Assets”) at the following annual rates: for equity securities — 0.600% up to $500 million and 0.575% from $500 million up to $1 billion of the Fund’s average daily net Investable Assets and at reduced rates when average daily net Investable Assets are $1 billion or more; and for income securities and cash — 0.450% up to $1 billion of the Fund’s average daily net Investable Assets, and at reduced rates when average daily net Investable Assets are $1 billion or more. For the year ended December 31, 2019, the Fund incurred no investment adviser fee on Investable Assets. To the extent the Fund’s assets are invested in the Portfolios, the Fund is allocated its share of the Portfolios’ investment adviser fees. The Portfolios have engaged Boston Management and Research (BMR), a subsidiary of EVM, to render investment advisory services. See Note 2 of the Portfolios’ Notes to Financial Statements. For the year ended December 31, 2019, the Fund’s allocated portion of investment adviser fees paid by the Portfolios amounted to $4,675,881 or 0.54% of the Fund’s average daily net assets. The administration fee is earned by EVM as compensation for administrative services rendered to the Fund. The fee is computed at an annual rate of 0.04% of the Fund’s average daily net assets. For the year ended December 31, 2019, the administration fee amounted to $348,170. EVM has agreed to reimburse the Fund’s expenses to the extent that total annual operating expenses (relating to ordinary operating expenses only) exceed 0.98%, 1.73%, 0.73%, 1.23% and 0.69% of the Fund’s average daily net assets for Class A, Class C, Class I, Class R and Class R6, respectively, and prior to October 16, 2019,
| 16 |
Eaton Vance
Balanced Fund
December 31, 2019
Notes to Financial Statements — continued
1.73% of the Fund’s average daily net assets for Class B. This agreement may be changed or terminated after April 30, 2020. Pursuant to this agreement, no operating expenses were allocated to EVM for the year ended December 31, 2019.
EVM provides sub-transfer agency and related services to the Fund pursuant to a Sub-Transfer Agency Support Services Agreement. For the year ended December 31, 2019, EVM earned $85,734 from the Fund pursuant to such agreement, which is included in transfer and dividend disbursing agent fees on the Statement of Operations. The Fund was informed that Eaton Vance Distributors, Inc. (EVD), an affiliate of EVM, received $108,355 as its portion of the sales charge on sales of Class A shares for the year ended December 31, 2019. EVD also received distribution and service fees from Class A, Class B, Class C and Class R shares (see Note 4) and contingent deferred sales charges (see Note 5).
Trustees and officers of the Fund and the Portfolios who are members of EVM’s or BMR’s organizations receive remuneration for their services to the Fund out of the investment adviser fee. Certain officers and Trustees of the Fund and the Portfolios are officers of the above organizations.
4 Distribution Plans
The Fund has in effect a distribution plan for Class A shares (Class A Plan) pursuant to Rule 12b-1 under the 1940 Act. Pursuant to the Class A Plan, the Fund pays EVD a distribution and service fee of 0.25% per annum of its average daily net assets attributable to Class A shares for distribution services and facilities provided to the Fund by EVD, as well as for personal services and/or the maintenance of shareholder accounts. Distribution and service fees paid or accrued to EVD for the year ended December 31, 2019 amounted to $851,843 for Class A shares.
The Fund also has in effect distribution plans for Class C shares (Class C Plan), Class R shares (Class R Plan) and prior to October 16, 2019, Class B shares (Class B Plan) pursuant to Rule 12b-1 under the 1940 Act. Pursuant to the Class B and Class C Plans, the Fund paid/pays EVD amounts equal to 0.75% per annum of its average daily net assets attributable to Class B and Class C shares for providing ongoing distribution services and facilities to the Fund. For the year ended December 31, 2019, the Fund paid or accrued to EVD $4,853 and $1,675,816 for Class B and Class C shares, respectively.
The Class R Plan requires the Fund to pay EVD an amount up to 0.50% per annum of its average daily net assets attributable to Class R shares for providing ongoing distribution services and facilities to the Fund. The Trustees of the Trust have currently limited Class R distribution payments to 0.25% per annum of the average daily net assets attributable to Class R shares. For the year ended December 31, 2019, the Fund paid or accrued to EVD $9,882 for Class R shares.
Pursuant to the Class B, Class C and Class R Plans, the Fund also made/makes payments of service fees to EVD, financial intermediaries and other persons in amounts equal to 0.25% per annum of its average daily net assets attributable to that class. Service fees paid or accrued are for personal services and/or the maintenance of shareholder accounts. They are separate and distinct from the sales commissions and distribution fees payable to EVD. Service fees paid or accrued for the year ended December 31, 2019 amounted to $1,618, $558,605 and $9,882 for Class B, Class C and Class R shares, respectively.
Distribution and service fees are subject to the limitations contained in the Financial Industry Regulatory Authority Rule 2341(d) and for Class B, were further limited to a 5% maximum sales charge as determined in accordance with such rule.
5 Contingent Deferred Sales Charges
A contingent deferred sales charge (CDSC) generally is imposed on redemptions of Class C shares made within one year of purchase and prior to October 16, 2019, on redemptions of Class B shares made within six years of purchase. Class A shares may be subject to a 1% CDSC if redeemed within 18 months of purchase (depending on the circumstances of purchase). Generally, the CDSC is based upon the lower of the net asset value at date of redemption or date of purchase. No charge is levied on shares acquired by reinvestment of dividends or capital gain distributions. The CDSC for Class B shares was imposed at declining rates that began at 5% in the case of redemptions in the first and second year after purchase, declining one percentage point each subsequent year. Class C shares are subject to a 1% CDSC if redeemed within one year of purchase. For the year ended December 31, 2019, the Fund was informed that EVD received approximately $300 and $13,000 of CDSCs paid by Class A and Class C shareholders, respectively, and no CDSCs paid by Class B shareholders.
6 Investment Transactions
For the year ended December 31, 2019, increases and decreases in the Fund’s investments in the Portfolios were as follows:
| Portfolio | Contributions | Withdrawals | ||||||
Core Bond Portfolio | $ | 63,837,970 | $ | 40,988,338 | ||||
Stock Portfolio | 58,144,295 | 63,803,707 | ||||||
| 17 |
Eaton Vance
Balanced Fund
December 31, 2019
Notes to Financial Statements — continued
In addition, a Portfolio transaction fee is imposed by Stock Portfolio on the combined daily inflows or outflows of the Fund and Stock Portfolio’s other investors as more fully described at Note 1H of Stock Portfolio’s financial statements included herein. Such fee is allocated to the Fund based on its pro-rata interest in Stock Portfolio. The amount of the Portfolio transaction fee imposed on the Fund, if any, and the allocation of such fee are presented as Other capital on the Statements of Changes in Net Assets.
7 Shares of Beneficial Interest
The Fund’s Declaration of Trust permits the Trustees to issue an unlimited number of full and fractional shares of beneficial interest (without par value). Such shares may be issued in a number of different series (such as the Fund) and classes. Transactions in Fund shares were as follows:
| Year Ended December 31, | ||||||||
| Class A | 2019 | 2018 | ||||||
Sales | 5,704,561 | 3,974,276 | ||||||
Issued to shareholders electing to receive payments of distributions in Fund shares | 1,274,423 | 1,955,621 | ||||||
Redemptions | (9,108,143 | ) | (7,190,686 | ) | ||||
Converted from Class B shares | 146,241 | 206,017 | ||||||
Converted from Class C shares | 2,227,942 | — | ||||||
Net increase (decrease) | 245,024 | (1,054,772 | ) | |||||
| Year Ended December 31, | ||||||||
| Class B | 2019(1) | 2018 | ||||||
Sales | 21 | 11,130 | ||||||
Issued to shareholders electing to receive payments of distributions in Fund shares | 447 | 8,605 | ||||||
Redemptions | (29,604 | ) | (43,085 | ) | ||||
Converted to Class A shares | (140,376 | ) | (205,611 | ) | ||||
Net decrease | (169,512 | ) | (228,961 | ) | ||||
| Year Ended December 31, | ||||||||
| Class C | 2019 | 2018 | ||||||
Sales | 3,509,184 | 3,593,719 | ||||||
Issued to shareholders electing to receive payments of distributions in Fund shares | 691,129 | 1,343,199 | ||||||
Redemptions | (4,767,786 | ) | (6,583,869 | ) | ||||
Converted to Class A shares | (2,225,270 | ) | — | |||||
Net decrease | (2,792,743 | ) | (1,646,951 | ) | ||||
| Year Ended December 31, | ||||||||
| Class I | 2019 | 2018 | ||||||
Sales | 13,916,289 | 9,218,867 | ||||||
Issued to shareholders electing to receive payments of distributions in Fund shares | 1,076,617 | 1,387,914 | ||||||
Redemptions | (7,480,042 | ) | (9,606,842 | ) | ||||
Net increase | 7,512,864 | 999,939 | ||||||
| 18 |
Eaton Vance
Balanced Fund
December 31, 2019
Notes to Financial Statements — continued
| Year Ended December 31, | ||||||||
| Class R | 2019 | 2018 | ||||||
Sales | 348,702 | 273,640 | ||||||
Issued to shareholders electing to receive payments of distributions in Fund shares | 18,726 | 15,680 | ||||||
Redemptions | (70,599 | ) | (46,563 | ) | ||||
Net increase | 296,829 | 242,757 | ||||||
| Year Ended December 31, | ||||||||
| Class R6 | 2019 | 2018 | ||||||
Sales | 1,459,105 | 978,178 | ||||||
Issued to shareholders electing to receive payments of distributions in Fund shares | 166,020 | 205,202 | ||||||
Redemptions | (745,068 | ) | (793,374 | ) | ||||
Net increase | 880,057 | 390,006 | ||||||
| (1) | At the close of business on October 15, 2019, Class B shares were converted into Class A and Class B was terminated. |
8 Fair Value Measurements
Under generally accepted accounting principles for fair value measurements, a three-tier hierarchy to prioritize the assumptions, referred to as inputs, is used in valuation techniques to measure fair value. The three-tier hierarchy of inputs is summarized in the three broad levels listed below.
| • | Level 1 – quoted prices in active markets for identical investments |
| • | Level 2 – other significant observable inputs (including quoted prices for similar investments, interest rates, prepayment speeds, credit risk, etc.) |
| • | Level 3 – significant unobservable inputs (including a fund’s own assumptions in determining the fair value of investments) |
In cases where the inputs used to measure fair value fall in different levels of the fair value hierarchy, the level disclosed is determined based on the lowest level input that is significant to the fair value measurement in its entirety. The inputs or methodology used for valuing securities are not necessarily an indication of the risk associated with investing in those securities. At December 31, 2019 and December 31, 2018, the Fund’s investment in Core Bond Portfolio, whose financial statements are not included but are available elsewhere as discussed in Note 1, and in Stock Portfolio were valued based on Level 1 inputs.
| 19 |
Eaton Vance
Balanced Fund
December 31, 2019
Report of Independent Registered Public Accounting Firm
To the Trustees of Eaton Vance Special Investment Trust and Shareholders of Eaton Vance Balanced Fund:
Opinion on the Financial Statements and Financial Highlights
We have audited the accompanying statement of assets and liabilities of Eaton Vance Balanced Fund (the “Fund”) (one of the funds constituting Eaton Vance Special Investment Trust), as of December 31, 2019, the related statement of operations for the year then ended, the statements of changes in net assets for each of the two years in the period then ended, the financial highlights for each of the five years in the period then ended, and the related notes. In our opinion, the financial statements and financial highlights present fairly, in all material respects, the financial position of the Fund as of December 31, 2019, and the results of its operations for the year then ended, the changes in its net assets for each of the two years in the period then ended, and the financial highlights for each of the five years in the period then ended in conformity with accounting principles generally accepted in the United States of America.
Basis for Opinion
These financial statements and financial highlights are the responsibility of the Fund’s management. Our responsibility is to express an opinion on the Fund’s financial statements and financial highlights based on our audits. We are a public accounting firm registered with the Public Company Accounting Oversight Board (United States) (PCAOB) and are required to be independent with respect to the Fund in accordance with the U.S. federal securities laws and the applicable rules and regulations of the Securities and Exchange Commission and the PCAOB.
We conducted our audits in accordance with the standards of the PCAOB. Those standards require that we plan and perform the audit to obtain reasonable assurance about whether the financial statements and financial highlights are free of material misstatement, whether due to error or fraud. The Fund is not required to have, nor were we engaged to perform, an audit of its internal control over financial reporting. As part of our audits we are required to obtain an understanding of internal control over financial reporting but not for the purpose of expressing an opinion on the effectiveness of the Fund’s internal control over financial reporting. Accordingly, we express no such opinion.
Our audits included performing procedures to assess the risks of material misstatement of the financial statements and financial highlights, whether due to error or fraud, and performing procedures that respond to those risks. Such procedures included examining, on a test basis, evidence regarding the amounts and disclosures in the financial statements and financial highlights. Our audits also included evaluating the accounting principles used and significant estimates made by management, as well as evaluating the overall presentation of the financial statements and financial highlights. We believe that our audits provide a reasonable basis for our opinion.
/s/ Deloitte & Touche LLP
Boston, Massachusetts
February 24, 2020
We have served as the auditor of one or more Eaton Vance investment companies since 1959.
| 20 |
Eaton Vance
Balanced Fund
December 31, 2019
Federal Tax Information (Unaudited)
The Form 1099-DIV you received in February 2020 showed the tax status of all distributions paid to your account in calendar year 2019. Shareholders are advised to consult their own tax adviser with respect to the tax consequences of their investment in the Fund. As required by the Internal Revenue Code and/or regulations, shareholders must be notified regarding the status of qualified business income, qualified dividend income for individuals, the dividends received deduction for corporations and capital gains dividends.
Qualified Business Income. For the fiscal year ended December 31, 2019, the Fund designates approximately $319,995, or up to the maximum amount of such dividends allowable pursuant to the Internal Revenue Code, as qualified business income.
Qualified Dividend Income. For the fiscal year ended December 31, 2019, the Fund designates approximately $8,017,117, or up to the maximum amount of such dividends allowable pursuant to the Internal Revenue Code, as qualified dividend income eligible for the reduced tax rate of 15%.
Dividends Received Deduction. Corporate shareholders are generally entitled to take the dividends received deduction on the portion of the Fund’s dividend distribution that qualifies under tax law. For the Fund’s fiscal 2019 ordinary income dividends, 35.45% qualifies for the corporate dividends received deduction.
Capital Gains Dividends. The Fund hereby designates as a capital gain dividend with respect to the taxable year ended December 31, 2019, $25,909,849 or, if subsequently determined to be different, the net capital gain of such year.
| 21 |
Stock Portfolio
December 31, 2019
Portfolio of Investments
| Common Stocks— 99.0% |
| |||||||
| Security | Shares | Value | ||||||
| Aerospace & Defense — 1.1% | ||||||||
Hexcel Corp. | 103,500 | $ | 7,587,585 | |||||
| $ | 7,587,585 | |||||||
| Banks — 6.3% | ||||||||
Bank of America Corp. | 451,440 | $ | 15,899,717 | |||||
JPMorgan Chase & Co. | 111,420 | 15,531,948 | ||||||
PNC Financial Services Group, Inc. (The) | 72,340 | 11,547,634 | ||||||
| $ | 42,979,299 | |||||||
| Beverages — 2.6% | ||||||||
PepsiCo, Inc. | 132,800 | $ | 18,149,776 | |||||
| $ | 18,149,776 | |||||||
| Capital Markets — 1.0% | ||||||||
Tradeweb Markets, Inc., Class A | 148,739 | $ | 6,894,053 | |||||
| $ | 6,894,053 | |||||||
| Chemicals — 0.6% | ||||||||
Ecolab, Inc. | 21,100 | $ | 4,072,089 | |||||
| $ | 4,072,089 | |||||||
| Commercial Services & Supplies — 1.3% | ||||||||
Waste Management, Inc. | 77,882 | $ | 8,875,433 | |||||
| $ | 8,875,433 | |||||||
| Communications Equipment — 1.3% | ||||||||
Cisco Systems, Inc. | 189,800 | $ | 9,102,808 | |||||
| $ | 9,102,808 | |||||||
| Consumer Finance — 1.4% | ||||||||
American Express Co. | 75,960 | $ | 9,456,260 | |||||
| $ | 9,456,260 | |||||||
| Diversified Telecommunication Services — 2.0% | ||||||||
Verizon Communications, Inc. | 220,190 | $ | 13,519,666 | |||||
| $ | 13,519,666 | |||||||
| Electric Utilities — 1.3% | ||||||||
NextEra Energy, Inc. | 35,596 | $ | 8,619,927 | |||||
| $ | 8,619,927 | |||||||
| Security | Shares | Value | ||||||
| Electrical Equipment — 3.0% | ||||||||
AMETEK, Inc. | 123,600 | $ | 12,327,864 | |||||
Emerson Electric Co. | 111,842 | 8,529,071 | ||||||
| $ | 20,856,935 | |||||||
| Electronic Equipment, Instruments & Components — 0.5% | ||||||||
Zebra Technologies Corp., Class A(1) | 14,700 | $ | 3,754,968 | |||||
| $ | 3,754,968 | |||||||
| Entertainment — 2.0% | ||||||||
Walt Disney Co. (The) | 92,826 | $ | 13,425,424 | |||||
| $ | 13,425,424 | |||||||
| Equity Real Estate Investment Trusts (REITs) — 2.9% | ||||||||
American Tower Corp. | 55,300 | $ | 12,709,046 | |||||
AvalonBay Communities, Inc. | 33,780 | 7,083,666 | ||||||
| $ | 19,792,712 | |||||||
| Food Products — 2.3% | ||||||||
Mondelez International, Inc., Class A | 286,920 | $ | 15,803,554 | |||||
| $ | 15,803,554 | |||||||
| Health Care Equipment & Supplies — 4.4% | ||||||||
Abbott Laboratories | 83,200 | $ | 7,226,752 | |||||
Boston Scientific Corp.(1) | 186,620 | 8,438,956 | ||||||
Danaher Corp. | 95,566 | 14,667,470 | ||||||
| $ | 30,333,178 | |||||||
| Health Care Providers & Services — 2.5% | ||||||||
Anthem, Inc. | 55,960 | $ | 16,901,599 | |||||
| $ | 16,901,599 | |||||||
| Household Products — 1.5% | ||||||||
Kimberly-Clark Corp. | 73,900 | $ | 10,164,945 | |||||
| $ | 10,164,945 | |||||||
| Insurance — 4.6% | ||||||||
American International Group, Inc. | 199,740 | $ | 10,252,654 | |||||
Assurant, Inc. | 42,100 | 5,518,468 | ||||||
First American Financial Corp. | 107,372 | 6,261,935 | ||||||
Progressive Corp. (The) | 132,000 | 9,555,480 | ||||||
| $ | 31,588,537 | |||||||
| 22 | See Notes to Financial Statements. |
Stock Portfolio
December 31, 2019
Portfolio of Investments — continued
| Security | Shares | Value | ||||||
| Interactive Media & Services — 6.9% | ||||||||
Alphabet, Inc., Class C(1) | 23,329 | $ | 31,191,340 | |||||
Facebook, Inc., Class A(1) | 78,544 | 16,121,156 | ||||||
| $ | 47,312,496 | |||||||
| Internet & Direct Marketing Retail — 3.5% | ||||||||
Amazon.com, Inc.(1) | 12,822 | $ | 23,693,005 | |||||
| $ | 23,693,005 | |||||||
| IT Services — 7.5% | ||||||||
Cognizant Technology Solutions Corp., Class A | 160,512 | $ | 9,954,954 | |||||
Fidelity National Information Services, Inc. | 102,300 | 14,228,907 | ||||||
PayPal Holdings, Inc.(1) | 78,100 | 8,448,077 | ||||||
Visa, Inc., Class A | 98,100 | 18,432,990 | ||||||
| $ | 51,064,928 | |||||||
| Life Sciences Tools & Services — 2.1% | ||||||||
Thermo Fisher Scientific, Inc. | 43,300 | $ | 14,066,871 | |||||
| $ | 14,066,871 | |||||||
| Machinery — 2.2% | ||||||||
Gardner Denver Holdings, Inc.(1) | 220,920 | $ | 8,103,346 | |||||
Stanley Black & Decker, Inc. | 41,200 | 6,828,488 | ||||||
| $ | 14,931,834 | |||||||
| Metals & Mining — 2.0% | ||||||||
Steel Dynamics, Inc. | 402,700 | $ | 13,707,908 | |||||
| $ | 13,707,908 | |||||||
| Multi-Utilities — 2.1% | ||||||||
CMS Energy Corp. | 106,300 | $ | 6,679,892 | |||||
Sempra Energy | 52,942 | 8,019,654 | ||||||
| $ | 14,699,546 | |||||||
| Oil, Gas & Consumable Fuels — 4.5% | ||||||||
ConocoPhillips | 102,086 | $ | 6,638,653 | |||||
EOG Resources, Inc. | 61,500 | 5,151,240 | ||||||
Exxon Mobil Corp. | 157,044 | 10,958,530 | ||||||
Phillips 66 | 69,425 | 7,734,639 | ||||||
| $ | 30,483,062 | |||||||
| Pharmaceuticals — 5.4% | ||||||||
Bristol-Myers Squibb Co. | 233,100 | $ | 14,962,689 | |||||
Catalent, Inc.(1) | 97,700 | 5,500,510 | ||||||
| Security | Shares | Value | ||||||
| Pharmaceuticals(continued) | ||||||||
GlaxoSmithKline PLC ADR | 73,300 | $ | 3,444,367 | |||||
Merck & Co., Inc. | 140,400 | 12,769,380 | ||||||
| $ | 36,676,946 | |||||||
| Road & Rail — 0.9% | ||||||||
CSX Corp. | 85,700 | $ | 6,201,252 | |||||
| $ | 6,201,252 | |||||||
| Semiconductors & Semiconductor Equipment— 3.2% | ||||||||
ASML Holding NV - NY Shares | 11,800 | $ | 3,492,092 | |||||
Taiwan Semiconductor Manufacturing Co., Ltd. ADR | 141,123 | 8,199,246 | ||||||
Texas Instruments, Inc. | 78,579 | 10,080,900 | ||||||
| $ | 21,772,238 | |||||||
| Software— 6.8% | ||||||||
Adobe, Inc.(1) | 22,978 | $ | 7,578,374 | |||||
Intuit, Inc. | 17,536 | 4,593,205 | ||||||
Microsoft Corp. | 215,720 | 34,019,044 | ||||||
| $ | 46,190,623 | |||||||
| Specialty Retail— 5.4% | ||||||||
Home Depot, Inc. (The) | 55,188 | $ | 12,051,955 | |||||
Lowe’s Cos., Inc. | 136,306 | 16,324,007 | ||||||
TJX Cos., Inc. (The) | 139,940 | 8,544,736 | ||||||
| $ | 36,920,698 | |||||||
| Technology Hardware, Storage & Peripherals— 3.9% | ||||||||
Apple, Inc. | 91,797 | $ | 26,956,189 | |||||
| $ | 26,956,189 | |||||||
Total Common Stocks |
| $ | 676,556,344 | |||||
| Rights— 0.1% |
| |||||||
| Security | Shares | Value | ||||||
| Pharmaceuticals— 0.1% | ||||||||
Bristol-Myers Squibb Co. CVR, Exp. 3/31/21(1) | 320,300 | $ | 964,103 | |||||
Total Rights |
| $ | 964,103 | |||||
| 23 | See Notes to Financial Statements. |
Stock Portfolio
December 31, 2019
Portfolio of Investments — continued
| Short-Term Investments— 0.8% |
| |||||
| Description | Units | Value | ||||
Eaton Vance Cash Reserves Fund, LLC, 1.78%(2) | 5,512,026 | $ | 5,512,026 | |||
Total Short-Term Investments | $ | 5,512,026 | ||||
Total Investments — 99.9% | $ | 683,032,473 | ||||
Other Assets, Less Liabilities — 0.1% | $ | 515,045 | ||||
Net Assets — 100.0% | $ | 683,547,518 | ||||
The percentage shown for each investment category in the Portfolio of Investments is based on net assets.
| (1) | Non-income producing security. |
| (2) | Affiliated investment company, available to Eaton Vance portfolios and funds, which invests in high quality, U.S. dollar denominated money market instruments. The rate shown is the annualizedseven-day yield as of December 31, 2019. |
| Abbreviations: | ||||
| ADR | — | American Depositary Receipt | ||
| CVR | — | Contingent Value Rights | ||
| 24 | See Notes to Financial Statements. |
Stock Portfolio
December 31, 2019
Statement of Assets and Liabilities
| Assets | December 31, 2019 | |||
Unaffiliated investments, at value (identified cost, $501,172,455) | $ | 677,520,447 | ||
Affiliated investment, at value (identified cost, $5,511,762) | 5,512,026 | |||
Foreign currency, at value (identified cost, $16,206) | 16,204 | |||
Dividends receivable | 823,919 | |||
Dividends receivable from affiliated investment | 9,135 | |||
Tax reclaims receivable | 157,340 | |||
Total assets | $ | 684,039,071 | ||
| Liabilities |
| |||
Payable to affiliates: | ||||
Investment adviser fee | $ | 338,988 | ||
Trustees’ fees | 7,953 | |||
Accrued expenses | 144,612 | |||
Total liabilities | $ | 491,553 | ||
Net Assets applicable to investors’ interest in Portfolio | $ | 683,547,518 | ||
| 25 | See Notes to Financial Statements. |
Stock Portfolio
December 31, 2019
Statement of Operations
| Investment Income | Year Ended December 31, 2019 | |||
Dividends (net of foreign taxes, $99,328) | $ | 10,052,771 | ||
Dividends from affiliated investment | 63,749 | |||
Total investment income | $ | 10,116,520 | ||
| Expenses |
| |||
Investment adviser fee | $ | 3,702,875 | ||
Trustees’ fees and expenses | 23,862 | |||
Custodian fee | 142,399 | |||
Legal and accounting services | 50,091 | |||
Miscellaneous | 24,691 | |||
Total expenses | $ | 3,943,918 | ||
Net investment income | $ | 6,172,602 | ||
| Realized and Unrealized Gain (Loss) |
| |||
Net realized gain (loss) — | ||||
Investment transactions | $ | 37,237,059 | ||
Investment transactions — affiliated investment | (377 | ) | ||
Foreign currency transactions | 253 | |||
Net realized gain | $ | 37,236,935 | ||
Change in unrealized appreciation (depreciation) — | ||||
Investments | $ | 139,851,452 | ||
Investments — affiliated investment | 262 | |||
Foreign currency | 2,081 | |||
Net change in unrealized appreciation (depreciation) | $ | 139,853,795 | ||
Net realized and unrealized gain | $ | 177,090,730 | ||
Net increase in net assets from operations | $ | 183,263,332 | ||
| 26 | See Notes to Financial Statements. |
Stock Portfolio
December 31, 2019
Statements of Changes in Net Assets
| Year Ended December 31, | ||||||||
| Increase (Decrease) in Net Assets | 2019 | 2018 | ||||||
From operations — | ||||||||
Net investment income | $ | 6,172,602 | $ | 7,128,802 | ||||
Net realized gain | 37,236,935 | 50,384,018 | (1) | |||||
Net change in unrealized appreciation (depreciation) | 139,853,795 | (84,773,096 | ) | |||||
Net increase (decrease) in net assets from operations | $ | 183,263,332 | $ | (27,260,276 | ) | |||
Capital transactions — | ||||||||
Contributions | $ | 63,196,014 | $ | 19,957,986 | ||||
Withdrawals | (79,842,250 | ) | (123,729,807 | ) | ||||
Portfolio transaction fee | 315,199 | 242,333 | ||||||
Net decrease in net assets from capital transactions | $ | (16,331,037 | ) | $ | (103,529,488 | ) | ||
Net increase (decrease) in net assets | $ | 166,932,295 | $ | (130,789,764 | ) | |||
| Net Assets |
| |||||||
At beginning of year | $ | 516,615,223 | $ | 647,404,987 | ||||
At end of year | $ | 683,547,518 | $ | 516,615,223 | ||||
| (1) | Includes $2,091,763 of net realized gains from redemptionsin-kind. |
| 27 | See Notes to Financial Statements. |
Stock Portfolio
December 31, 2019
Financial Highlights
| Year Ended December 31, | ||||||||||||||||||||
| Ratios/Supplemental Data | 2019 | 2018 | 2017 | 2016 | 2015 | |||||||||||||||
Ratios (as a percentage of average daily net assets): | ||||||||||||||||||||
Expenses(1) | 0.63 | % | 0.64 | % | 0.64 | % | 0.65 | % | 0.70 | % | ||||||||||
Net investment income | 0.99 | % | 1.14 | % | 1.38 | % | 1.60 | % | 1.16 | % | ||||||||||
Portfolio Turnover | 55 | % | 90 | % | 101 | % | 118 | % | 96 | % | ||||||||||
Total Return | 35.47 | % | (5.57 | )% | 20.31 | % | 7.14 | % | 4.88 | % | ||||||||||
Net assets, end of year (000’s omitted) | $ | 683,548 | $ | 516,615 | $ | 647,405 | $ | 640,973 | $ | 395,492 | ||||||||||
| (1) | Excludes the effect of custody fee credits, if any, of less than 0.005%. Effective September 1, 2015, custody fee credits, which were earned on cash deposit balances, were discontinued by the custodian. |
| 28 | See Notes to Financial Statements. |
Stock Portfolio
December 31, 2019
Notes to Financial Statements
1 Significant Accounting Policies
Stock Portfolio (the Portfolio) is a Massachusetts business trust registered under the Investment Company Act of 1940, as amended (the 1940 Act), as a diversified,open-end management investment company. The Portfolio’s investment objective is to achieve long-term capital appreciation by investing in a diversified portfolio of equity securities. The Declaration of Trust permits the Trustees to issue interests in the Portfolio. At December 31, 2019, Eaton Vance Stock Fund, Eaton Vance Stock NextShares and Eaton Vance Balanced Fund held an interest of 14.9%, 1.0% and 84.0%, respectively, in the Portfolio.
The following is a summary of significant accounting policies of the Portfolio. The policies are in conformity with accounting principles generally accepted in the United States of America (U.S. GAAP). The Portfolio is an investment company and follows accounting and reporting guidance in the Financial Accounting Standards Board (FASB) Accounting Standards Codification Topic 946.
A Investment Valuation — The following methodologies are used to determine the market value or fair value of investments.
Equity Securities. Equity securities listed on a U.S. securities exchange generally are valued at the last sale or closing price on the day of valuation or, if no sales took place on such date, at the mean between the closing bid and ask prices on the exchange where such securities are principally traded. Equity securities listed on the NASDAQ Global or Global Select Market generally are valued at the NASDAQ official closing price. Unlisted or listed securities for which closing sales prices or closing quotations are not available are valued at the mean between the latest available bid and ask prices.
Foreign Securities and Currencies. Foreign securities and currencies are valued in U.S. dollars, based on foreign currency exchange rate quotations supplied by a third party pricing service. The pricing service uses a proprietary model to determine the exchange rate. Inputs to the model include reported trades and implied bid/ask spreads. The daily valuation of exchange-traded foreign securities generally is determined as of the close of trading on the principal exchange on which such securities trade. Events occurring after the close of trading on foreign exchanges may result in adjustments to the valuation of foreign securities to more accurately reflect their fair value as of the close of regular trading on the New York Stock Exchange. When valuing foreign equity securities that meet certain criteria, the Portfolio’s Trustees have approved the use of a fair value service that values such securities to reflect market trading that occurs after the close of the applicable foreign markets of comparable securities or other instruments that have a strong correlation to the fair-valued securities.
Affiliated Fund. The Portfolio may invest in Eaton Vance Cash Reserves Fund, LLC (Cash Reserves Fund), an affiliated investment company managed by
Eaton Vance Management (EVM). While Cash Reserves Fund is not a registered money market mutual fund, it conducts all of its investment activities in accordance with the requirements of Rule2a-7 under the 1940 Act. Investments in Cash Reserves Fund are valued at the closing net asset value per unit on the valuation day. Cash Reserves Fund generally values its investment securities based on available market quotations provided by a third party pricing service.
Fair Valuation. Investments for which valuations or market quotations are not readily available or are deemed unreliable are valued at fair value using methods determined in good faith by or at the direction of the Trustees of the Portfolio in a manner that most fairly reflects the security’s “fair value”, which is the amount that the Portfolio might reasonably expect to receive for the security upon its current sale in the ordinary course. Each such determination is based on a consideration of relevant factors, which are likely to vary from one pricing context to another. These factors may include, but are not limited to, the type of security, the existence of any contractual restrictions on the security’s disposition, the price and extent of public trading in similar securities of the issuer or of comparable companies or entities, quotations or relevant information obtained from broker/dealers or other market participants, information obtained from the issuer, analysts, and/or the appropriate stock exchange (for exchange-traded securities), an analysis of the company’s or entity’s financial statements, and an evaluation of the forces that influence the issuer and the market(s) in which the security is purchased and sold.
B Investment Transactions — Investment transactions for financial statement purposes are accounted for on a trade date basis. Realized gains and losses on investments sold are determined on the basis of identified cost.
C Income — Dividend income is recorded on theex-dividend date for dividends received in cash and/or securities. However, if theex-dividend date has passed, certain dividends from foreign securities are recorded as the Portfolio is informed of theex-dividend date. Withholding taxes on foreign dividends and capital gains have been provided for in accordance with the Portfolio’s understanding of the applicable countries’ tax rules and rates.
D Federal Taxes — The Portfolio has elected to be treated as a partnership for federal tax purposes. No provision is made by the Portfolio for federal or state taxes on any taxable income of the Portfolio because each investor in the Portfolio is ultimately responsible for the payment of any taxes on its share of taxable income. Since at least one of the Portfolio’s investors is a regulated investment company that invests all or substantially all of its assets in the Portfolio, the Portfolio normally must satisfy the applicable source of income and diversification requirements (under the Internal Revenue Code) in order for its investors to satisfy them. The Portfolio will allocate, at least annually among its investors, each investor’s distributive share of the Portfolio’s net investment income, net realized capital gains and losses and any other items of income, gain, loss, deduction or credit.
As of December 31, 2019, the Portfolio had no uncertain tax positions that would require financial statement recognition,de-recognition, or disclosure. The Portfolio files a U.S. federal income tax return annually after its fiscalyear-end, which is subject to examination by the Internal Revenue Service for a period of three years from the date of filing.
E Foreign Currency Translation — Investment valuations, other assets, and liabilities initially expressed in foreign currencies are translated each business day into U.S. dollars based upon current exchange rates. Purchases and sales of foreign investment securities and income and expenses denominated in
| 29 |
Stock Portfolio
December 31, 2019
Notes to Financial Statements — continued
foreign currencies are translated into U.S. dollars based upon currency exchange rates in effect on the respective dates of such transactions. Recognized gains or losses on investment transactions attributable to changes in foreign currency exchange rates are recorded for financial statement purposes as net realized gains and losses on investments. That portion of unrealized gains and losses on investments that results from fluctuations in foreign currency exchange rates is not separately disclosed.
F Use of Estimates — The preparation of the financial statements in conformity with U.S. GAAP requires management to make estimates and assumptions that affect the reported amounts of assets and liabilities at the date of the financial statements and the reported amounts of income and expense during the reporting period. Actual results could differ from those estimates.
G Indemnifications — Under the Portfolio’s organizational documents, its officers and Trustees may be indemnified against certain liabilities and expenses arising out of the performance of their duties to the Portfolio. Under Massachusetts law, if certain conditions prevail, interestholders in the Portfolio could be deemed to have personal liability for the obligations of the Portfolio. However, the Portfolio’s Declaration of Trust contains an express disclaimer of liability on the part of Portfolio interestholders. Additionally, in the normal course of business, the Portfolio enters into agreements with service providers that may contain indemnification clauses. The Portfolio’s maximum exposure under these arrangements is unknown as this would involve future claims that may be made against the Portfolio that have not yet occurred.
H Capital Transactions — To seek to protect the Portfolio (and, indirectly, other investors in the Portfolio) against the costs of accommodating investor inflows and outflows, the Portfolio imposes a fee (“Portfolio transaction fee”) on inflows and outflows by Portfolio investors. The Portfolio transaction fee is sized to cover the estimated cost to the Portfolio of, in connection with issuing interests, converting the cash and/or other instruments it receives to the desired composition and, in connection with redeeming its interests, converting Portfolio holdings to cash and/or other instruments to be distributed. Such fee, which may vary over time, is limited to amounts that have been authorized by the Board of Trustees and determined by EVM to be appropriate. The maximum Portfolio transaction fee is 2% of the amount of net contributions or withdrawals. The Portfolio transaction fee is recorded as a component of capital transactions on the Statements of Changes in Net Assets.
2 Investment Adviser Fee and Other Transactions with Affiliates
The investment adviser fee is earned by Boston Management and Research (BMR), a subsidiary of EVM, as compensation for investment advisory services rendered to the Portfolio. Pursuant to the investment advisory agreement and subsequent fee reduction agreement between the Portfolio and BMR, the fee is computed at an annual rate of 0.60% of the Portfolio’s average daily net assets up to $500 million and 0.575% from $500 million but less than $1 billion, and is payable monthly. On net assets of $1 billion or over, the annual fee is reduced. The fee reduction cannot be terminated or reduced without the approval of a majority vote of the Trustees of the Portfolio who are not interested persons of BMR or the Portfolio and by the vote of a majority of the holders of interest in the Portfolio. For the year ended December 31, 2019, the Portfolio’s investment adviser fee amounted to $3,702,875 or 0.59% of the Portfolio’s average daily net assets. The Portfolio invests its cash in Cash Reserves Fund. EVM does not currently receive a fee for advisory services provided to Cash Reserves Fund.
Trustees and officers of the Portfolio who are members of EVM’s or BMR’s organizations receive remuneration for their services to the Portfolio out of the investment adviser fee. Trustees of the Portfolio who are not affiliated with the investment adviser may elect to defer receipt of all or a percentage of their annual fees in accordance with the terms of the Trustees Deferred Compensation Plan. For the year ended December 31, 2019, no significant amounts have been deferred. Certain officers and Trustees of the Portfolio are officers of the above organizations.
3 Purchases and Sales of Investments
Purchases and sales of investments, other than short-term obligations, aggregated $339,548,841 and $353,500,921, respectively, for the year ended December 31, 2019.
4 Federal Income Tax Basis of Investments
The cost and unrealized appreciation (depreciation) of investments of the Portfolio at December 31, 2019, as determined on a federal income tax basis, were as follows:
Aggregate cost | $ | 507,636,901 | ||
Gross unrealized appreciation | $ | 177,139,783 | ||
Gross unrealized depreciation | (1,744,211 | ) | ||
Net unrealized appreciation | $ | 175,395,572 | ||
| 30 |
Stock Portfolio
December 31, 2019
Notes to Financial Statements — continued
5 Line of Credit
The Portfolio participates with other portfolios and funds managed by EVM and its affiliates in an $800 million unsecured line of credit agreement with a group of banks, which is in effect through October 27, 2020. In connection with the renewal of the agreement on October 29, 2019, funds managed by Calvert Research and Management, an affiliate of EVM, were added as participating funds to the agreement and the borrowing limit was increased from $625 million. Borrowings are made by the Portfolio solely to facilitate the handling of unusual and/or unanticipated short-term cash requirements. Interest is charged to the Portfolio based on its borrowings at an amount above either the Eurodollar rate or Federal Funds rate. In addition, a fee computed at an annual rate of 0.15% on the daily unused portion of the line of credit is allocated among the participating portfolios and funds at the end of each quarter. Because the line of credit is not available exclusively to the Portfolio, it may be unable to borrow some or all of its requested amounts at any particular time. The Portfolio did not have any significant borrowings or allocated fees during the year ended December 31, 2019.
6 Investments in Affiliated Funds
At December 31, 2019, the value of the Portfolio’s investment in affiliated funds was $5,512,026, which represents 0.8% of the Portfolio’s net assets. Transactions in affiliated funds by the Portfolio for the year ended December 31, 2019 were as follows:
| Name of affiliated fund | Value, beginning of period | Purchases | Sales proceeds | Net realized gain (loss) | Change in unrealized appreciation (depreciation) | Value, end of period | Dividend income | Units, end of period | ||||||||||||||||||||||||
Short-Term Investments |
| |||||||||||||||||||||||||||||||
Eaton Vance Cash Reserves Fund, LLC, 1.78% | $ | 46,118 | $ | 106,004,358 | $ | (100,538,335 | ) | $ | (377 | ) | $ | 262 | $ | 5,512,026 | $ | 63,749 | 5,512,026 | |||||||||||||||
7 Fair Value Measurements
Under generally accepted accounting principles for fair value measurements, a three-tier hierarchy to prioritize the assumptions, referred to as inputs, is used in valuation techniques to measure fair value. The three-tier hierarchy of inputs is summarized in the three broad levels listed below.
| • | Level 1 – quoted prices in active markets for identical investments |
| • | Level 2 – other significant observable inputs (including quoted prices for similar investments, interest rates, prepayment speeds, credit risk, etc.) |
| • | Level 3 – significant unobservable inputs (including a fund’s own assumptions in determining the fair value of investments) |
In cases where the inputs used to measure fair value fall in different levels of the fair value hierarchy, the level disclosed is determined based on the lowest level input that is significant to the fair value measurement in its entirety. The inputs or methodology used for valuing securities are not necessarily an indication of the risk associated with investing in those securities.
At December 31, 2019, the hierarchy of inputs used in valuing the Portfolio’s investments, which are carried at value, were as follows:
| Asset Description | Level 1 | Level 2 | Level 3 | Total | ||||||||||||
Common Stocks | $ | 676,556,344 | * | $ | — | $ | — | $ | 676,556,344 | |||||||
Rights | 964,103 | — | — | 964,103 | ||||||||||||
Short-Term Investments | — | 5,512,026 | — | 5,512,026 | ||||||||||||
Total Investments | $ | 677,520,447 | $ | 5,512,026 | $ | — | $ | 683,032,473 | ||||||||
| * | The level classification by major category of investments is the same as the category presentation in the Portfolio of Investments. |
| 31 |
Stock Portfolio
December 31, 2019
Report of Independent Registered Public Accounting Firm
To the Trustees and Investors of Stock Portfolio:
Opinion on the Financial Statements and Financial Highlights
We have audited the accompanying statement of assets and liabilities of Stock Portfolio (the “Portfolio”), including the portfolio of investments, as of December 31, 2019, the related statement of operations for the year then ended, the statements of changes in net assets for each of the two years in the period then ended, the financial highlights for each of the five years in the period then ended, and the related notes. In our opinion, the financial statements and financial highlights present fairly, in all material respects, the financial position of the Portfolio as of December 31, 2019, and the results of its operations for the year then ended, the changes in its net assets for each of the two years in the period then ended, and the financial highlights for each of the five years in the period then ended, in conformity with accounting principles generally accepted in the United States of America.
Basis for Opinion
These financial statements and financial highlights are the responsibility of the Portfolio’s management. Our responsibility is to express an opinion on the Portfolio’s financial statements and financial highlights based on our audits. We are a public accounting firm registered with the Public Company Accounting Oversight Board (United States) (PCAOB) and are required to be independent with respect to the Portfolio in accordance with the U.S. federal securities laws and the applicable rules and regulations of the Securities and Exchange Commission and the PCAOB.
We conducted our audits in accordance with the standards of the PCAOB. Those standards require that we plan and perform the audit to obtain reasonable assurance about whether the financial statements and financial highlights are free of material misstatement, whether due to error or fraud. The Portfolio is not required to have, nor were we engaged to perform, an audit of its internal control over financial reporting. As part of our audits we are required to obtain an understanding of internal control over financial reporting but not for the purpose of expressing an opinion on the effectiveness of the Portfolio’s internal control over financial reporting. Accordingly, we express no such opinion.
Our audits included performing procedures to assess the risks of material misstatement of the financial statements and financial highlights, whether due to error or fraud, and performing procedures that respond to those risks. Such procedures included examining, on a test basis, evidence regarding the amounts and disclosures in the financial statements and financial highlights. Our audits also included evaluating the accounting principles used and significant estimates made by management, as well as evaluating the overall presentation of the financial statements and financial highlights. Our procedures included confirmation of securities owned as of December 31, 2019, by correspondence with the custodian and brokers; when replies were not received from brokers, we performed other auditing procedures. We believe that our audits provide a reasonable basis for our opinion.
/s/ Deloitte & Touche LLP
Boston, Massachusetts
February 21, 2020
We have served as the auditor of one or more Eaton Vance investment companies since 1959.
| 32 |
Eaton Vance
Balanced Fund
December 31, 2019
Management and Organization
Fund Management. The Trustees of Eaton Vance Special Investment Trust (the Trust), Core Bond Portfolio (CBP) and Stock Portfolio (SP) (the Portfolios) are responsible for the overall management and supervision of the Trust’s and Portfolios’ affairs. The Trustees and officers of the Trust and the Portfolios are listed below. Except as indicated, each individual has held the office shown or other offices in the same company for the last five years. Trustees and officers of the Trust and the Portfolios hold indefinite terms of office. The “noninterested Trustees” consist of those Trustees who are not “interested persons” of the Trust and the Portfolios, as that term is defined under the 1940 Act. The business address of each Trustee and officer is Two International Place, Boston, Massachusetts 02110. As used below, “EVC” refers to Eaton Vance Corp., “EV” refers to Eaton Vance, Inc., “EVM” refers to Eaton Vance Management, “BMR” refers to Boston Management and Research and “EVD” refers to Eaton Vance Distributors, Inc. EVC and EV are the corporate parent and trustee, respectively, of EVM and BMR. EVD is the Fund’s principal underwriter, the Portfolios’ placement agent and a wholly-owned subsidiary of EVC. Each officer affiliated with Eaton Vance may hold a position with other Eaton Vance affiliates that is comparable to his or her position with EVM listed below. Each Trustee oversees 159 portfolios in the Eaton Vance Complex (including all master and feeder funds in a master feeder structure). Each officer serves as an officer of certain other Eaton Vance funds. Each Trustee and officer serves until his or her successor is elected.
| Name and Year of Birth | Position(s) with the Trust Portfolios | Trustee Since(1) | Principal Occupation(s) and Directorships During Past Five Years and Other Relevant Experience | |||
| Interested Trustee | ||||||
Thomas E. Faust Jr. 1958 | Trustee | 2007 | Chairman, Chief Executive Officer and President of EVC, Director and President of EV, Chief Executive Officer and President of EVM and BMR, and Director of EVD. Trustee and/or officer of 159 registered investment companies. Mr. Faust is an interested person because of his positions with EVM, BMR, EVD, EVC and EV, which are affiliates of the Trust and the Portfolios. Directorships in the Last Five Years. Director of EVC and Hexavest Inc. (investment management firm). | |||
| Noninterested Trustees | ||||||
Mark R. Fetting 1954 | Trustee | 2016 | Private investor. Formerly held various positions at Legg Mason, Inc. (investment management firm) (2000-2012), including President, Chief Executive Officer, Director and Chairman (2008-2012), Senior Executive Vice President(2004-2008) and Executive Vice President (2001-2004). Formerly, President of Legg Mason family of funds (2001-2008). Formerly, Division President and Senior Officer of Prudential Financial Group, Inc. and related companies (investment management firm)(1991-2000). Other Directorships in the Last Five Years. None. | |||
Cynthia E. Frost 1961 | Trustee | 2014 | Private investor. Formerly, Chief Investment Officer of Brown University (university endowment) (2000-2012). Formerly, Portfolio Strategist for Duke Management Company (university endowment manager) (1995-2000). Formerly, Managing Director, Cambridge Associates (investment consulting company)(1989-1995). Formerly, Consultant, Bain and Company (management consulting firm)(1987-1989). Formerly, Senior Equity Analyst, BA Investment Management Company (1983-1985). Other Directorships in the Last Five Years. None. | |||
George J. Gorman 1952 | Trustee | 2014 | Principal at George J. Gorman LLC (consulting firm). Formerly, Senior Partner at Ernst & Young LLP (a registered public accounting firm) (1974-2009). Other Directorships in the Last Five Years. Formerly, Trustee of the BofA Funds Series Trust (11 funds) (2011-2014) and of the Ashmore Funds (9 funds)(2010-2014). | |||
Valerie A. Mosley 1960 | Trustee | 2014 | Chairwoman and Chief Executive Officer of Valmo Ventures (a consulting and investment firm). Former Partner and Senior Vice President, Portfolio Manager and Investment Strategist at Wellington Management Company, LLP (investment management firm) (1992-2012). Former Chief Investment Officer, PG Corbin Asset Management (1990-1992). Formerly worked in institutional corporate bond sales at Kidder Peabody (1986-1990). Other Directorships in the Last Five Years. Director of Envestnet, Inc. (provider of intelligent systems for wealth management and financial wellness) (since 2018). Director of Dynex Capital, Inc. (mortgage REIT) (since 2013). | |||
| 33 |
Eaton Vance
Balanced Fund
December 31, 2019
Management and Organization — continued
| Name and Year of Birth | Position(s) with the Trust Portfolios | Trustee Since(1) | Principal Occupation(s) and Directorships During Past Five Years and Other Relevant Experience | |||
| Noninterested Trustees (continued) | ||||||
William H. Park 1947 | Chairperson of the Board and Trustee | 2016 (Chairperson) 2003 (Trustee) | Private investor. Formerly, Consultant (management and transactional)(2012-2014). Formerly, Chief Financial Officer, Aveon Group L.P. (investment management firm) (2010-2011). Formerly, Vice Chairman, Commercial Industrial Finance Corp. (specialty finance company) (2006-2010). Formerly, President and Chief Executive Officer, Prizm Capital Management, LLC (investment management firm) (2002-2005). Formerly, Executive Vice President and Chief Financial Officer, United Asset Management Corporation (investment management firm) (1982-2001). Formerly, Senior Manager, Price Waterhouse (now PricewaterhouseCoopers) (a registered public accounting firm) (1972-1981). Other Directorships in the Last Five Years. None. | |||
Helen Frame Peters 1948 | Trustee | 2008 | Professor of Finance, Carroll School of Management, Boston College. Formerly, Dean, Carroll School of Management, Boston College (2000-2002). Formerly, Chief Investment Officer, Fixed Income, Scudder Kemper Investments (investment management firm) (1998-1999). Formerly, Chief Investment Officer, Equity and Fixed Income, Colonial Management Associates (investment management firm)(1991-1998). Other Directorships in the Last Five Years. None. | |||
Keith Quinton 1958 | Trustee | 2018 | Independent Investment Committee Member at New Hampshire Retirement System (since 2017). Advisory Committee member at Northfield Information Services, Inc. (risk management analytics provider) (since 2016). Formerly, Portfolio Manager and Senior Quantitative Analyst at Fidelity Investments (investment management firm)(2001-2014). Other Directorships in the Last Five Years. Director of New Hampshire Municipal Bond Bank (since 2016). | |||
Marcus L. Smith 1966 | Trustee | 2018 | Member of Posse Boston Advisory Board (foundation) (since 2015). Trustee at University of Mount Union (since 2008). Formerly, Portfolio Manager at MFS Investment Management (investment management firm) (1994-2017). Other Directorships in the Last Five Years. Director of MSCI Inc. (global provider of investment decision support tools) (since 2017). Formerly, Director of DCT Industrial Trust Inc. (logistics real estate company) (2017-2018). | |||
Susan J. Sutherland 1957 | Trustee | 2015 | Private investor. Formerly, Associate, Counsel and Partner at Skadden, Arps, Slate, Meagher & Flom LLP (law firm) (1982-2013). Other Directorships in the Last Five Years. Formerly, Director of Montpelier Re Holdings Ltd. (global provider of customized insurance and reinsurance products) (2013-2015). | |||
Scott E. Wennerholm 1959 | Trustee | 2016 | Formerly, Trustee at Wheelock College (postsecondary institution) (2012-2018). Formerly, Consultant at GF Parish Group (executive recruiting firm) (2016-2017). Formerly, Chief Operating Officer and Executive Vice President at BNY Mellon Asset Management (investment management firm) (2005-2011). Formerly, Chief Operating Officer and Chief Financial Officer at Natixis Global Asset Management (investment management firm) (1997-2004). Formerly, Vice President at Fidelity Investments Institutional Services (investment management firm) (1994-1997). Other Directorships in the Last Five Years. None. | |||
| Name and Year of Birth | Position(s) and the Portfolios | Officer Since(2) | Principal Occupation(s) During Past Five Years | |||
| Principal Officers who are not Trustees | ||||||
Payson F. Swaffield 1956 | President of the Trust and of CBP | 2003 | Vice President and Chief Income Investment Officer of EVM and BMR. Also Vice President of Calvert Research and Management (“CRM”). | |||
Edward J. Perkin 1972 | President of SP | 2014 | Chief Equity Investment Officer and Vice President of EVM and BMR since 2014. Also Vice President of Calvert Research and Management (“CRM”) since 2016. | |||
| 34 |
Eaton Vance
Balanced Fund
December 31, 2019
Management and Organization — continued
| Name and Year of Birth | Position(s) and the Portfolios | Officer Since(2) | Principal Occupation(s) During Past Five Years | |||
| Principal Officers who are not Trustees (continued) | ||||||
Maureen A. Gemma 1960 | Vice President, Secretary and Chief Legal Officer | 2005 | Vice President of EVM and BMR. Also Vice President of CRM. | |||
James F. Kirchner 1967 | Treasurer | 2007 | Vice President of EVM and BMR. Also Vice President of CRM. | |||
Richard F. Froio 1968 | Chief Compliance Officer | 2017 | Vice President of EVM and BMR since 2017. Formerly Deputy Chief Compliance Officer (Adviser/Funds) and Chief Compliance Officer (Distribution) at PIMCO (2012-2017) and Managing Director at BlackRock/Barclays Global Investors (2009-2012). | |||
| (1) | Year first appointed to serve as Trustee for a fund in the Eaton Vance family of funds. Each Trustee has served continuously since appointment unless indicated otherwise. |
| (2) | Year first elected to serve as officer of a fund in the Eaton Vance family of funds when the officer has served continuously. Otherwise, year of most recent election as an officer of a fund in the Eaton Vance family of funds. Titles may have changed since initial election. |
The SAI for the Fund includes additional information about the Trustees and officers of the Fund and the Portfolios and can be obtained without charge on Eaton Vance’s website at www.eatonvance.com or by calling 1-800-262-1122.
| 35 |
Eaton Vance Funds
IMPORTANT NOTICES
Privacy. The Eaton Vance organization is committed to ensuring your financial privacy. Each entity listed below has adopted a privacy policy and procedures (“Privacy Program”) Eaton Vance believes is reasonably designed to protect your personal information and to govern when and with whom Eaton Vance may share your personal information.
| • | At the time of opening an account, Eaton Vance generally requires you to provide us with certain information such as name, address, social security number, tax status, account numbers, and account balances. This information is necessary for us to both open an account for you and to allow us to satisfy legal requirements such as applicable anti-money laundering reviews and know-your-customer requirements. |
| • | On an ongoing basis, in the normal course of servicing your account, Eaton Vance may share your information with unaffiliated third parties that perform various services for Eaton Vance and/or your account. These third parties include transfer agents, custodians, broker/dealers and our professional advisers, including auditors, accountants, and legal counsel. Eaton Vance may additionally share your personal information with our affiliates. |
| • | We believe our Privacy Program is reasonably designed to protect the confidentiality of your personal information and to prevent unauthorized access to that information. |
| • | We reserve the right to change our Privacy Program at any time upon proper notification to you. You may want to review our Privacy Program periodically for changes by accessing the link on our homepage: www.eatonvance.com. |
Our pledge of protecting your personal information applies to the following entities within the Eaton Vance organization: the Eaton Vance Family of Funds, Eaton Vance Management, Eaton Vance Investment Counsel, Eaton Vance Distributors, Inc., Eaton Vance Trust Company, Eaton Vance Management (International) Limited, Eaton Vance Advisers International Limited, Eaton Vance Global Advisors Limited, Eaton Vance Management’s Real Estate Investment Group, Boston Management and Research, Calvert Research and Management, and Calvert Funds. This Privacy Notice supersedes all previously issued privacy disclosures. For more information about our Privacy Program or about how your personal information may be used, please call 1-800-262-1122.
Delivery of Shareholder Documents. The Securities and Exchange Commission (SEC) permits funds to deliver only one copy of shareholder documents, including prospectuses, proxy statements and shareholder reports, to fund investors with multiple accounts at the same residential or post office box address. This practice is often called “householding” and it helps eliminate duplicate mailings to shareholders.Eaton Vance, or your financial intermediary, may household the mailing of your documents indefinitely unless you instruct Eaton Vance, or your financial intermediary, otherwise.If you would prefer that your Eaton Vance documents not be householded, please contact Eaton Vance at1-800-262-1122, or contact your financial intermediary. Your instructions that householding not apply to delivery of your Eaton Vance documents will typically be effective within 30 days of receipt by Eaton Vance or your financial intermediary.
Portfolio Holdings. Each Eaton Vance Fund and its underlying Portfolio(s) (if applicable) files a schedule of portfolio holdings on Part F toForm N-PORT with the SEC for the first and third quarters of each fiscal year. The Form N-PORT will be available on the Eaton Vance website at www.eatonvance.com, by calling Eaton Vance at 1-800-262-1122 or in the EDGAR database on the SEC’s website at www.sec.gov.
Proxy Voting. From time to time, funds are required to vote proxies related to the securities held by the funds. The Eaton Vance Funds or their underlying Portfolios (if applicable) vote proxies according to a set of policies and procedures approved by the Funds’ and Portfolios’ Boards. You may obtain a description of these policies and procedures and information on how the Funds or Portfolios voted proxies relating to portfolio securities during the most recent 12-month period ended June 30, without charge, upon request, by calling 1-800-262-1122 and by accessing the SEC’s website at www.sec.gov.
| 36 |
Investment Adviser of Core Bond Portfolio and Stock Portfolio
Boston Management and Research
Two International Place
Boston, MA 02110
Investment Adviser and Administrator of Eaton Vance Balanced Fund
Eaton Vance Management
Two International Place
Boston, MA 02110
Principal Underwriter*
Eaton Vance Distributors, Inc.
Two International Place
Boston, MA 02110
(617) 482-8260
Custodian
State Street Bank and Trust Company
State Street Financial Center, One Lincoln Street
Boston, MA 02111
Transfer Agent
BNY Mellon Investment Servicing (US) Inc.
Attn: Eaton Vance Funds
P.O. Box 9653
Providence, RI 02940-9653
(800) 262-1122
Independent Registered Public Accounting Firm
Deloitte & Touche LLP
200 Berkeley Street
Boston, MA 02116-5022
Fund Offices
Two International Place
Boston, MA 02110
| * | FINRA BrokerCheck. Investors may check the background of their Investment Professional by contacting the Financial Industry Regulatory Authority (FINRA). FINRA BrokerCheck is a free tool to help investors check the professional background of current and former FINRA-registered securities firms and brokers. FINRA BrokerCheck is available by calling 1-800-289-9999 and at www.FINRA.org. The FINRA BrokerCheck brochure describing this program is available to investors at www.FINRA.org. |

162 12.31.19

Eaton Vance
Core Bond Fund
Annual Report
December 31, 2019
Important Note. Beginning on January 1, 2021, as permitted by regulations adopted by the Securities and Exchange Commission, paper copies of the Fund’s annual and semi-annual shareholder reports will no longer be sent by mail unless you specifically request paper copies of the reports. Instead, the reports will be made available on the Fund’s website (eatonvance.com/funddocuments), and you will be notified by mail each time a report is posted and provided with a website address to access the report.
If you already elected to receive shareholder reports electronically, you will not be affected by this change and you need not take any action. If you are a direct investor, you may elect to receive shareholder reports and other communications from the Fund electronically by signing up for e-Delivery at eatonvance.com/edelivery. If you own your shares through a financial intermediary (such as a broker-dealer or bank), you must contact your financial intermediary to sign up.
You may elect to receive all future Fund shareholder reports in paper free of charge. If you are a direct investor, you can inform the Fund that you wish to continue receiving paper copies of your shareholder reports by calling 1-800-262-1122. If you own these shares through a financial intermediary, you must contact your financial intermediary or follow instructions included with this disclosure, if applicable, to elect to continue to receive paper copies of your shareholder reports. Your election to receive reports in paper will apply to all Eaton Vance funds held directly or to all funds held through your financial intermediary, as applicable.

Commodity Futures Trading Commission Registration. Effective December 31, 2012, the Commodity Futures Trading Commission (“CFTC”) adopted certain regulatory changes that subject registered investment companies and advisers to regulation by the CFTC if a fund invests more than a prescribed level of its assets in certain CFTC-regulated instruments (including futures, certain options and swap agreements) or markets itself as providing investment exposure to such instruments. The Fund has claimed an exclusion from the definition of the term “commodity pool operator” under the Commodity Exchange Act. Accordingly, neither the Fund nor the adviser with respect to the operation of the Fund is subject to CFTC regulation. Because of its management of other strategies, the Fund’s adviser is registered with the CFTC as a commodity pool operator and a commodity trading advisor.
Fund shares are not insured by the FDIC and are not deposits or other obligations of, or guaranteed by, any depository institution. Shares are subject to investment risks, including possible loss of principal invested.
This report must be preceded or accompanied by a current summary prospectus or prospectus. Before investing, investors should consider carefully the investment objective, risks, and charges and expenses of a mutual fund. This and other important information is contained in the summary prospectus and prospectus, which can be obtained from a financial intermediary. Prospective investors should read the prospectus carefully before investing. For further information, please call 1-800-262-1122.
Annual ReportDecember 31, 2019
Eaton Vance
Core Bond Fund
Table of Contents
Management’s Discussion of Fund Performance | 2 | |||
Performance | 3 | |||
Fund Profile | 4 | |||
Endnotes and Additional Disclosures | 5 | |||
Fund Expenses | 6 | |||
Financial Statements | 7 | |||
Report of Independent Registered Public Accounting Firm | 15 and 35 | |||
Federal Tax Information | 16 | |||
Management and Organization | 36 | |||
Important Notices | 39 | |||
Eaton Vance
Core Bond Fund
December 31, 2019
Management’s Discussion of Fund Performance1
Economic and Market Conditions
The12-month period ended December 31, 2019 marked a dramatic turnaround in fixed-income markets from the prior year as the rising interest rate environment of 2018 gave way to a falling interest-rate climate against the backdrop of multiple domestic and international uncertainties.
After a bond rally at the end of 2018 sparked by the U.S. Federal Reserve (the Fed) lowering the number of rate increases projected for 2019, the first two months of 2019 were relatively quiet for bonds. Downward pressure on interest rates and upward pressure on bond prices resumed in March 2019 and continued through most of the period propelled by lower-than-desired inflation, low European interest rates, and anon-again/off-again U.S.-China trade conflict. These factors fueled investor concerns about both U.S. and global growth potential.
After holding interest rates steady through the first half of 2019, the Fed cut its benchmark interest rate to 2.00%- 2.25% on July 31— its first reduction in over a decade — followed by two more quarter-point interest-rate drops in September and October to a range of1.50%-1.75%. Lower rates are intended to help stimulate economic activity by making borrowing costs relatively more affordable.
Late in the year, economic data suggested that international policymaker efforts to bolster their respective economies were starting to pay off. Although U.S. manufacturing activity remained weak, the services sector of the economy — nearly 90% of GDP — continued to expand and holiday retail sales grew at a solid pace.
Adding to economic optimism, the U.S. and China announced a so-called “phase-one” trade agreement on December 13. Days later, British lawmakers endorsed Prime Minister Johnson’s plan for the U.K.’s departure from the European Union, lowering fears of a “no-deal exit” scenario.
As a whole, the period was marked by strong performance across U.S. bond markets. The Bloomberg Barclays U.S. Aggregate Bond Index,2 a broad measure of the U.S. bond market, returned 8.72%. The Bloomberg Barclays U.S. Corporate Bond Index, a measure of U.S. corporate investment-grade bonds, finished 2019 with a 14.54% return — its best calendar-year performance since 2009. High yield fixed-income securities also performed well with the ICE BofAML U.S. High Yield Index returning 14.41% during the period ended December 31, 2019.
Fund Performance
For the12-month period ended December 31, 2019, Eaton Vance Core Bond Fund (the Fund) returned 9.00% for Class A shares at net asset value (NAV), outperforming its benchmark, the Bloomberg Barclays U.S. Aggregate Bond Index (the Index), which returned 8.72%.
The Fund’s sector positioning overall was a strong contributor to performance relative to the Index during the period. An underweight allocation to U.S. Treasurys and an overweight allocation to investment-grade corporate bonds were particularly beneficial.Out-of-Index allocations to high yield securities and bank loans further enhanced performance.
The Fund’syield-curve6 positioning also contributed to returns relative to the Index.
Security selection overall within the Fund was also a positive contributor. Selections within investment-grade corporate bonds,mortgage-backed securities, and commercial mortgage- backed securities were especially beneficial.
The Fund’s shorter-than-Index duration was a leading detractor from relative returns asshort-term interest rates declined during the period. Duration is a measure of the expected change in the price of a bond — in percentage terms — given aone-percent change in interest rates, all else being constant. Securities with lower durations tend to be less sensitive to interest-rate changes.
Overweight allocations toasset-backed securities andout-of- Index allocations to U.S. Treasury Inflation-Protected Securities detracted from relative performance.
See Endnotes and Additional Disclosures in this report.
Past performance is no guarantee of future results. Returns are historical and are calculated by determining the percentage change in net asset value (NAV) or offering price (as applicable) with all distributions reinvested. Investment return and principal value will fluctuate so that shares, when redeemed, may be worth more or less than their original cost. Performance for periods less than or equal to one year is cumulative. Performance is for the stated time period only; due to market volatility, current Fund performance may be lower or higher than the quoted return. For performance as of the most recentmonth-end, please refer to eatonvance.com.
| 2 |
Eaton Vance
Core Bond Fund
December 31, 2019
Performance2,3
Portfolio ManagersVishal Khanduja, CFA and Brian S. Ellis, CFA
| % Average Annual Total Returns | Class Inception Date | Performance Inception Date | One Year | Five Years | Ten Years | |||||||||||||||
Class A at NAV | 01/05/2009 | 03/07/2000 | 9.00 | % | 2.89 | % | 3.70 | % | ||||||||||||
Class A with 4.75% Maximum Sales Charge | — | — | 3.86 | 1.89 | 3.20 | |||||||||||||||
Class I at NAV | 03/21/2007 | 03/07/2000 | 9.29 | 3.15 | 3.94 | |||||||||||||||
Bloomberg Barclays U.S. Aggregate Bond Index | — | — | 8.72 | % | 3.05 | % | 3.74 | % | ||||||||||||
| % Total Annual Operating Expense Ratios4 | Class A | Class I | ||||||||||||||||||
Gross | 0.85 | % | 0.60 | % | ||||||||||||||||
Net | 0.74 | 0.49 | ||||||||||||||||||
Growth of $10,000
This graph shows the change in value of a hypothetical investment of $10,000 in Class A of the Fund for the period indicated. For comparison, the same investment is shown in the indicated index.
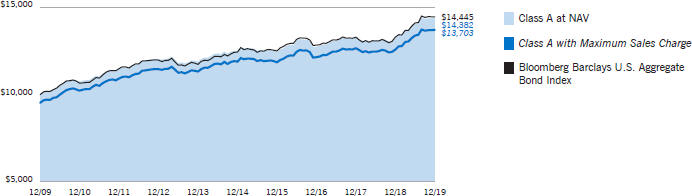
| Growth of Investment | Amount Invested | Period Beginning | At NAV | With Maximum Sales Charge | ||||||||||||
Class I | $ | 250,000 | 12/31/2009 | $ | 368,054 | N.A. | ||||||||||
See Endnotes and Additional Disclosures in this report.
Past performance is no guarantee of future results. Returns are historical and are calculated by determining the percentage change in net asset value (NAV) or offering price (as applicable) with all distributions reinvested. Investment return and principal value will fluctuate so that shares, when redeemed, may be worth more or less than their original cost. Performance for periods less than or equal to one year is cumulative. Performance is for the stated time period only; due to market volatility, current Fund performance may be lower or higher than the quoted return. For performance as of the most recent month-end, please refer to eatonvance.com.
| 3 |
Eaton Vance
Core Bond Fund
December 31, 2019
Fund Profile5
Asset Allocation (% of total investments)
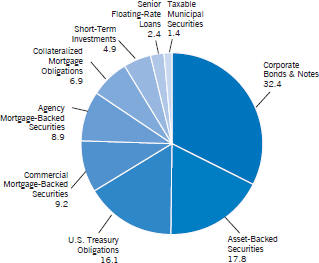
See Endnotes and Additional Disclosures in this report.
| 4 |
Eaton Vance
Core Bond Fund
December 31, 2019
Endnotes and Additional Disclosures
| 1 | The views expressed in this report are those of the portfolio manager(s) and are current only through the date stated at the top of this page. These views are subject to change at any time based upon market or other conditions, and Eaton Vance and the Fund(s) disclaim any responsibility to update such views. These views may not be relied upon as investment advice and, because investment decisions are based on many factors, may not be relied upon as an indication of trading intent on behalf of any Eaton Vance fund. This commentary may contain statements that are not historical facts, referred to as “forward looking statements.” The Fund’s actual future results may differ significantly from those stated in any forward looking statement, depending on factors such as changes in securities or financial markets or general economic conditions, the volume of sales and purchases of Fund shares, the continuation of investment advisory, administrative and service contracts, and other risks discussed from time to time in the Fund’s filings with the Securities and Exchange Commission. |
| 2 | Bloomberg Barclays U.S. Aggregate Bond Index is an unmanaged index of domestic investment-grade bonds, including corporate, government andmortgage-backed securities. Bloomberg Barclays U.S. Corporate Bond Index measures the performance of investment-grade U.S. corporate securities with a maturity of one year or more. ICE BofAML U.S. High Yield Index is an unmanaged index of below-investment grade U.S. corporate bonds. ICE® BofAML® indices are not for redistribution or other uses; provided “as is”, without warranties, and with no liability. Eaton Vance has prepared this report and ICE Data Indices, LLC does not endorse it, or guarantee, review, or endorse Eaton Vance’s products. BofAML® is a licensed registered trademark of Bank of America Corporation in the United States and other countries. |
| 3 | Total Returns at NAV do not include applicable sales charges. If sales charges were deducted, the returns would be lower. Total Returns shown with maximum sales charge reflect the stated maximum sales charge. Unless otherwise stated, performance does not reflect the deduction of taxes on Fund distributions or redemptions of Fund shares. |
| 4 | Source: Fund prospectus. Net expense ratios reflect a contractual expense reimbursement that continues through 4/30/20. Without the reimbursement, performance would have been lower. The expense ratios for the current reporting period can be found in the Financial Highlights section of this report. |
| 5 | Fund invests in an affiliated investment company (Portfolio) with the same objective(s) and policies as the Fund. References to investments are to the Portfolio’s holdings. |
| 6 | Yield curve is a graphical representation of the yields offered by bonds of various maturities. The yield curve flattens when long-term interest rates fall and/orshort-term interest rates increase, and the yield curve steepens when long-term interest rates increase and/orshort-term interest rates fall. |
Fund profile subject to change due to active management. |
| 5 |
Eaton Vance
Core Bond Fund
December 31, 2019
Fund Expenses
Example: As a Fund shareholder, you incur two types of costs: (1) transaction costs, including sales charges (loads) on purchases and redemption fees (if applicable); and (2) ongoing costs, including management fees; distribution and/or service fees; and other Fund expenses. This Example is intended to help you understand your ongoing costs (in dollars) of Fund investing and to compare these costs with the ongoing costs of investing in other mutual funds. The Example is based on an investment of $1,000 invested at the beginning of the period and held for the entire period (July 1, 2019 – December 31, 2019).
Actual Expenses: The first section of the table below provides information about actual account values and actual expenses. You may use the information in this section, together with the amount you invested, to estimate the expenses that you paid over the period. Simply divide your account value by $1,000 (for example, an $8,600 account value divided by $1,000 = 8.6), then multiply the result by the number in the first section under the heading entitled “Expenses Paid During Period” to estimate the expenses you paid on your account during this period.
Hypothetical Example for Comparison Purposes: The second section of the table below provides information about hypothetical account values and hypothetical expenses based on the actual Fund expense ratio and an assumed rate of return of 5% per year (before expenses), which is not the actual Fund return. The hypothetical account values and expenses may not be used to estimate the actual ending account balance or expenses you paid for the period. You may use this information to compare the ongoing costs of investing in your Fund and other funds. To do so, compare this 5% hypothetical example with the 5% hypothetical examples that appear in the shareholder reports of the other funds.
Please note that the expenses shown in the table are meant to highlight your ongoing costs only and do not reflect any transactional costs, such as sales charges (loads) or redemption fees (if applicable). Therefore, the second section of the table is useful in comparing ongoing costs only, and will not help you determine the relative total costs of owning different funds. In addition, if these transactional costs were included, your costs would be higher.
| Beginning Account Value (7/1/19) | Ending Account Value (12/31/19) | Expenses Paid During Period* (7/1/19 – 12/31/19) | Annualized Expense Ratio | |||||||||||||
Actual | ||||||||||||||||
Class A | $ | 1,000.00 | $ | 1,024.20 | $ | 3.78 | ** | 0.74 | % | |||||||
Class I | $ | 1,000.00 | $ | 1,024.50 | $ | 2.50 | ** | 0.49 | % | |||||||
Hypothetical | ||||||||||||||||
(5% return per year before expenses) | ||||||||||||||||
Class A | $ | 1,000.00 | $ | 1,021.50 | $ | 3.77 | ** | 0.74 | % | |||||||
Class I | $ | 1,000.00 | $ | 1,022.70 | $ | 2.50 | ** | 0.49 | % | |||||||
| * | Expenses are equal to the Fund’s annualized expense ratio for the indicated Class, multiplied by the average account value over the period, multiplied by 184/365 (to reflect the one-half year period). The Example assumes that the $1,000 was invested at the net asset value per share determined at the close of business on June 30, 2019. The Example reflects the expenses of both the Fund and the Portfolio. |
| ** | Absent an allocation of certain expenses to affiliates, expenses would be higher. |
| 6 |
Eaton Vance
Core Bond Fund
December 31, 2019
Statement of Assets and Liabilities
| Assets | December 31, 2019 | |||
Investment in Core Bond Portfolio, at value (identified cost, $200,885,531) | $ | 205,175,362 | ||
Receivable for Fund shares sold | 883,157 | |||
Receivable from affiliate | 11,176 | |||
Total assets | $ | 206,069,695 | ||
| Liabilities |
| |||
Payable for Fund shares redeemed | $ | 173,055 | ||
Distributions payable | 3,370 | |||
Payable to affiliates: | ||||
Distribution and service fees | 6,009 | |||
Trustees’ fees | 125 | |||
Accrued expenses | 59,239 | |||
Total liabilities | $ | 241,798 | ||
Net Assets | $ | 205,827,897 | ||
| Sources of Net Assets |
| |||
Paid-in capital | $ | 202,928,421 | ||
Distributable earnings | 2,899,476 | |||
Total | $ | 205,827,897 | ||
| Class A Shares |
| |||
Net Assets | $ | 28,309,276 | ||
Shares Outstanding | 2,828,670 | |||
Net Asset Value and Redemption Price Per Share | ||||
(net assets ÷ shares of beneficial interest outstanding) | $ | 10.01 | ||
Maximum Offering Price Per Share | ||||
(100 ÷ 95.25 of net asset value per share) | $ | 10.51 | ||
| Class I Shares |
| |||
Net Assets | $ | 177,518,621 | ||
Shares Outstanding | 17,763,408 | |||
Net Asset Value, Offering Price and Redemption Price Per Share | ||||
(net assets ÷ shares of beneficial interest outstanding) | $ | 9.99 | ||
On sales of $50,000 or more, the offering price of Class A shares is reduced.
| 7 | See Notes to Financial Statements. |
Eaton Vance
Core Bond Fund
December 31, 2019
Statement of Operations
| Investment Income | Year Ended December 31, 2019 | |||
Interest allocated from Portfolio | $ | 6,330,601 | ||
Dividends allocated from Portfolio | 73,986 | |||
Expenses allocated from Portfolio | (935,026 | ) | ||
Total investment income from Portfolio | $ | 5,469,561 | ||
| Expenses |
| |||
Distribution and service fees | ||||
Class A | $ | 73,523 | ||
Trustees’ fees and expenses | 500 | |||
Custodian fee | 23,302 | |||
Transfer and dividend disbursing agent fees | 57,237 | |||
Legal and accounting services | 27,500 | |||
Printing and postage | 21,162 | |||
Registration fees | 47,924 | |||
Miscellaneous | 10,372 | |||
Total expenses | $ | 261,520 | ||
Deduct — | ||||
Allocation of expenses to affiliate | $ | 187,986 | ||
Total expense reductions | $ | 187,986 | ||
Net expenses | $ | 73,534 | ||
Net investment income | $ | 5,396,027 | ||
| Realized and Unrealized Gain (Loss) from Portfolio |
| |||
Net realized gain (loss) — | ||||
Investment transactions | $ | 2,061,804 | ||
Financial futures contracts | 2,697,858 | |||
Net realized gain | $ | 4,759,662 | ||
Change in unrealized appreciation (depreciation) — | ||||
Investments | $ | 7,280,224 | ||
Financial futures contracts | (1,328,084 | ) | ||
Net change in unrealized appreciation (depreciation) | $ | 5,952,140 | ||
Net realized and unrealized gain | $ | 10,711,802 | ||
Net increase in net assets from operations | $ | 16,107,829 | ||
| 8 | See Notes to Financial Statements. |
Eaton Vance
Core Bond Fund
December 31, 2019
Statements of Changes in Net Assets
| Year Ended December 31, | ||||||||
| Increase (Decrease) in Net Assets | 2019 | 2018 | ||||||
From operations — | ||||||||
Net investment income | $ | 5,396,027 | $ | 5,040,012 | ||||
Net realized gain (loss) | 4,759,662 | (2,479,961 | ) | |||||
Net change in unrealized appreciation (depreciation) | 5,952,140 | (3,209,441 | ) | |||||
Net increase (decrease) in net assets from operations | $ | 16,107,829 | $ | (649,390 | ) | |||
Distributions to shareholders — | ||||||||
Class A | $ | (963,106 | ) | $ | (955,400 | ) | ||
Class I | (5,772,342 | ) | (4,523,043 | ) | ||||
Total distributions to shareholders | $ | (6,735,448 | ) | $ | (5,478,443 | ) | ||
Transactions in shares of beneficial interest — | ||||||||
Proceeds from sale of shares | ||||||||
Class A | $ | 12,358,118 | $ | 17,879,570 | ||||
Class I | 108,295,651 | 59,409,118 | ||||||
Net asset value of shares issued to shareholders in payment of distributions declared | ||||||||
Class A | 923,776 | 919,296 | ||||||
Class I | 5,760,672 | 4,324,343 | ||||||
Cost of shares redeemed | ||||||||
Class A | (11,648,518 | ) | (26,440,216 | ) | ||||
Class I | (93,611,358 | ) | (40,364,801 | ) | ||||
Net increase in net assets from Fund share transactions | $ | 22,078,341 | $ | 15,727,310 | ||||
Net increase in net assets | $ | 31,450,722 | $ | 9,599,477 | ||||
| Net Assets |
| |||||||
At beginning of year | $ | 174,377,175 | $ | 164,777,698 | ||||
At end of year | $ | 205,827,897 | $ | 174,377,175 | ||||
| 9 | See Notes to Financial Statements. |
Eaton Vance
Core Bond Fund
December 31, 2019
Financial Highlights
| Class A | ||||||||||||||||||||
| Year Ended December 31, | ||||||||||||||||||||
| 2019 | 2018 | 2017 | 2016 | 2015 | ||||||||||||||||
Net asset value — Beginning of year | $ | 9.490 | $ | 9.840 | $ | 9.690 | $ | 9.690 | $ | 9.980 | ||||||||||
| Income (Loss) From Operations | ||||||||||||||||||||
Net investment income(1) | $ | 0.260 | $ | 0.273 | $ | 0.217 | $ | 0.168 | $ | 0.173 | ||||||||||
Net realized and unrealized gain (loss) | 0.587 | (0.338 | ) | 0.187 | 0.075 | (0.201 | ) | |||||||||||||
Total income (loss) from operations | $ | 0.847 | $ | (0.065 | ) | $ | 0.404 | $ | 0.243 | $ | (0.028 | ) | ||||||||
| Less Distributions | ||||||||||||||||||||
From net investment income | $ | (0.278 | ) | $ | (0.285 | ) | $ | (0.254 | ) | $ | (0.243 | ) | $ | (0.258 | ) | |||||
From net realized gain | (0.049 | ) | — | — | — | (0.004 | ) | |||||||||||||
Total distributions | $ | (0.327 | ) | $ | (0.285 | ) | $ | (0.254 | ) | $ | (0.243 | ) | $ | (0.262 | ) | |||||
Net asset value — End of year | $ | 10.010 | $ | 9.490 | $ | 9.840 | $ | 9.690 | $ | 9.690 | ||||||||||
Total Return(2)(3) | 9.00 | % | (0.64 | )% | 4.20 | % | 2.48 | % | (0.31 | )% | ||||||||||
| Ratios/Supplemental Data | ||||||||||||||||||||
Net assets, end of year (000’s omitted) | $ | 28,309 | $ | 25,158 | $ | 34,064 | $ | 37,290 | $ | 34,501 | ||||||||||
Ratios (as a percentage of average daily net assets):(4) | ||||||||||||||||||||
Expenses(3)(5) | 0.74 | % | 0.74 | % | 0.75 | % | 0.75 | % | 0.75 | % | ||||||||||
Net investment income | 2.63 | % | 2.85 | % | 2.21 | % | 1.69 | % | 1.75 | % | ||||||||||
Portfolio Turnover of the Portfolio | 89 | % | 65 | % | 123 | % | 132 | % | 159 | % | ||||||||||
| (1) | Computed using average shares outstanding. |
| (2) | Returns are historical and are calculated by determining the percentage change in net asset value with all distributions reinvested and do not reflect the effect of sales charges. |
| (3) | The investment adviser of the Portfolio and/or the administrator reimbursed certain operating expenses (equal to 0.11%, 0.11%, 0.11%, 0.11% and 0.21% of average daily net assets for the years ended December 31, 2019, 2018, 2017, 2016 and 2015, respectively). Absent this reimbursement, total return would be lower. |
| (4) | Includes the Fund’s share of the Portfolio’s allocated expenses. |
| (5) | Excludes the effect of custody fee credits, if any, of less than 0.005%. Effective September 1, 2015, custody fee credits, which were earned on cash deposit balances, were discontinued by the custodian. |
| 10 | See Notes to Financial Statements. |
Eaton Vance
Core Bond Fund
December 31, 2019
Financial Highlights — continued
| Class I | ||||||||||||||||||||
| Year Ended December 31, | ||||||||||||||||||||
| 2019 | 2018 | 2017 | 2016 | 2015 | ||||||||||||||||
Net asset value — Beginning of year | $ | 9.470 | $ | 9.830 | $ | 9.680 | $ | 9.680 | $ | 9.960 | ||||||||||
| Income (Loss) From Operations | ||||||||||||||||||||
Net investment income(1) | $ | 0.283 | $ | 0.282 | $ | 0.241 | $ | 0.193 | $ | 0.199 | ||||||||||
Net realized and unrealized gain (loss) | 0.588 | (0.333 | ) | 0.187 | 0.074 | (0.193 | ) | |||||||||||||
Total income (loss) from operations | $ | 0.871 | $ | (0.051 | ) | $ | 0.428 | $ | 0.267 | $ | 0.006 | |||||||||
| Less Distributions | ||||||||||||||||||||
From net investment income | $ | (0.302 | ) | $ | (0.309 | ) | $ | (0.278 | ) | $ | (0.267 | ) | $ | (0.282 | ) | |||||
From net realized gain | (0.049 | ) | — | — | — | (0.004 | ) | |||||||||||||
Total distributions | $ | (0.351 | ) | $ | (0.309 | ) | $ | (0.278 | ) | $ | (0.267 | ) | $ | (0.286 | ) | |||||
Net asset value — End of year | $ | 9.990 | $ | 9.470 | $ | 9.830 | $ | 9.680 | $ | 9.680 | ||||||||||
Total Return(2)(3) | 9.29 | % | (0.50 | )% | 4.47 | % | 2.73 | % | 0.04 | % | ||||||||||
| Ratios/Supplemental Data | ||||||||||||||||||||
Net assets, end of year (000’s omitted) | $ | 177,519 | $ | 149,220 | $ | 130,714 | $ | 115,294 | $ | 55,607 | ||||||||||
Ratios (as a percentage of average daily net assets):(4) | ||||||||||||||||||||
Expenses(3)(5) | 0.49 | % | 0.49 | % | 0.50 | % | 0.50 | % | 0.50 | % | ||||||||||
Net investment income | 2.87 | % | 2.95 | % | 2.46 | % | 1.95 | % | 2.01 | % | ||||||||||
Portfolio Turnover of the Portfolio | 89 | % | 65 | % | 123 | % | 132 | % | 159 | % | ||||||||||
| (1) | Computed using average shares outstanding. |
| (2) | Returns are historical and are calculated by determining the percentage change in net asset value with all distributions reinvested. |
| (3) | The investment adviser of the Portfolio and/or the administrator reimbursed certain operating expenses (equal to 0.11%, 0.11%, 0.11%, 0.11% and 0.21% of average daily net assets for the years ended December 31, 2019, 2018, 2017, 2016 and 2015, respectively). Absent this reimbursement, total return would be lower. |
| (4) | Includes the Fund’s share of the Portfolio’s allocated expenses. |
| (5) | Excludes the effect of custody fee credits, if any, of less than 0.005%. Effective September 1, 2015, custody fee credits, which were earned on cash deposit balances, were discontinued by the custodian. |
| 11 | See Notes to Financial Statements. |
Eaton Vance
Core Bond Fund
December 31, 2019
Notes to Financial Statements
1 Significant Accounting Policies
Eaton Vance Core Bond Fund (the Fund) is a diversified series of Eaton Vance Special Investment Trust (the Trust). The Trust is a Massachusetts business trust registered under the Investment Company Act of 1940, as amended (the 1940 Act), as an open-end management investment company. The Fund offers two classes of shares. Class A shares are generally sold subject to a sales charge imposed at time of purchase. Class I shares are sold at net asset value and are not subject to a sales charge. Each class represents a pro-rata interest in the Fund, but votes separately on class-specific matters and (as noted below) is subject to different expenses. Realized and unrealized gains and losses are allocated daily to each class of shares based on the relative net assets of each class to the total net assets of the Fund. Net investment income, other than class-specific expenses, is allocated daily to each class of shares based upon the ratio of the value of each class’s paid shares to the total value of all paid shares. Each class of shares differs in its distribution plan and certain other class-specific expenses. The Fund invests all of its investable assets in interests in Core Bond Portfolio (the Portfolio), a Massachusetts business trust, having the same investment objectives and policies as the Fund. The value of the Fund’s investment in the Portfolio reflects the Fund’s proportionate interest in the net assets of the Portfolio (34.8% at December 31, 2019). The performance of the Fund is directly affected by the performance of the Portfolio. The financial statements of the Portfolio, including the portfolio of investments, are included elsewhere in this report and should be read in conjunction with the Fund’s financial statements.
The following is a summary of significant accounting policies of the Fund. The policies are in conformity with accounting principles generally accepted in the United States of America (U.S. GAAP). The Fund is an investment company and follows accounting and reporting guidance in the Financial Accounting Standards Board (FASB) Accounting Standards Codification Topic 946.
A Investment Valuation — Valuation of securities by the Portfolio is discussed in Note 1A of the Portfolio’s Notes to Financial Statements, which are included elsewhere in this report.
B Income — The Fund’s net investment income or loss consists of the Fund’s pro-rata share of the net investment income or loss of the Portfolio, less all actual and accrued expenses of the Fund.
C Federal Taxes — The Fund’s policy is to comply with the provisions of the Internal Revenue Code applicable to regulated investment companies and to distribute to shareholders each year substantially all of its net investment income, and all or substantially all of its net realized capital gains. Accordingly, no provision for federal income or excise tax is necessary.
As of December 31, 2019, the Fund had no uncertain tax positions that would require financial statement recognition, de-recognition, or disclosure. The Fund files a U.S. federal income tax return annually after its fiscal year-end, which is subject to examination by the Internal Revenue Service for a period of three years from the date of filing.
D Expenses — The majority of expenses of the Trust are directly identifiable to an individual fund. Expenses which are not readily identifiable to a specific fund are allocated taking into consideration, among other things, the nature and type of expense and the relative size of the funds.
E Use of Estimates — The preparation of the financial statements in conformity with U.S. GAAP requires management to make estimates and assumptions that affect the reported amounts of assets and liabilities at the date of the financial statements and the reported amounts of income and expense during the reporting period. Actual results could differ from those estimates.
F Indemnifications — Under the Trust’s organizational documents, its officers and Trustees may be indemnified against certain liabilities and expenses arising out of the performance of their duties to the Fund. Under Massachusetts law, if certain conditions prevail, shareholders of a Massachusetts business trust (such as the Trust) could be deemed to have personal liability for the obligations of the Trust. However, the Trust’s Declaration of Trust contains an express disclaimer of liability on the part of Fund shareholders and the By-laws provide that the Trust shall assume, upon request by the shareholder, the defense on behalf of any Fund shareholders. Moreover, the By-laws also provide for indemnification out of Fund property of any shareholder held personally liable solely by reason of being or having been a shareholder for all loss or expense arising from such liability. Additionally, in the normal course of business, the Fund enters into agreements with service providers that may contain indemnification clauses. The Fund’s maximum exposure under these arrangements is unknown as this would involve future claims that may be made against the Fund that have not yet occurred.
G Other — Investment transactions are accounted for on a trade date basis.
2 Distributions to Shareholders and Income Tax Information
The Fund declares dividends daily to shareholders of record at the time of declaration. Distributions are generally paid monthly. Distributions of realized capital gains are made at least annually. Distributions are declared separately for each class of shares. Shareholders may reinvest income and capital gain distributions in additional shares of the same class of the Fund at the net asset value as of the reinvestment date or, at the election of the shareholder, receive distributions in cash. Distributions to shareholders are determined in accordance with income tax regulations, which may differ from U.S. GAAP. As required by U.S. GAAP, only distributions in excess of tax basis earnings and profits are reported in the financial statements as a return of capital. Permanent differences between book and tax accounting relating to distributions are reclassified to paid-in capital. For tax purposes, distributions from short-term capital gains are considered to be from ordinary income.
| 12 |
Eaton Vance
Core Bond Fund
December 31, 2019
Notes to Financial Statements — continued
The tax character of distributions declared for the years ended December 31, 2019 and December 31, 2018 was as follows:
| Year Ended December 31, | ||||||||
| 2019 | 2018 | |||||||
Ordinary income | $ | 6,671,580 | $ | 5,478,443 | ||||
Long-term capital gains | $ | 63,868 | $ | — | ||||
During the year ended December 31, 2019, distributable earnings was decreased by $75,562 and paid-in capital was increased by $75,562 due to the Fund’s use of equalization accounting. Tax equalization accounting allows the Fund to treat as a distribution that portion of redemption proceeds representing a redeeming shareholder’s portion of undistributed taxable income and net capital gains. These reclassifications had no effect on the net assets or net asset value per share of the Fund.
As of December 31, 2019, the components of distributable earnings (accumulated loss) on a tax basis were as follows:
Post October capital losses | $ | (74,983 | ) | |
Net unrealized appreciation | $ | 2,977,829 | ||
Distributions payable | $ | (3,370 | ) | |
At December 31, 2019, the Fund had a net capital loss of $74,983 attributable to security transactions incurred after October 31, 2019 that it has elected to defer. This net capital loss is treated as arising on the first day of the Fund’s taxable year ending December 31, 2020.
3 Transactions with Affiliates
Eaton Vance Management (EVM) serves as the administrator of the Fund, but receives no compensation. The Portfolio has engaged Boston Management and Research (BMR), a subsidiary of EVM, to render investment advisory services. See Note 2 of the Portfolio’s Notes to Financial Statements which are included elsewhere in this report. EVM has agreed to reimburse the Fund’s expenses to the extent that total annual operating expenses (relating to ordinary operating expenses only) exceed 0.74% and 0.49% of the Fund’s average daily net assets for Class A and Class I, respectively. This agreement may be changed or terminated after April 30, 2020. Pursuant to this agreement, EVM was allocated $187,986 of the Fund’s operating expenses for the year ended December 31, 2019.
EVM provides sub-transfer agency and related services to the Fund pursuant to a Sub-Transfer Agency Support Services Agreement. For the year ended December 31, 2019, EVM earned $4,880 from the Fund pursuant to such agreement, which is included in transfer and dividend disbursing agent fees on the Statement of Operations. The Fund was informed that Eaton Vance Distributors, Inc. (EVD), an affiliate of EVM and the Fund’s principal underwriter, received $7,189 as its portion of the sales charge on sales of Class A shares for the year ended December 31, 2019. EVD also received distribution and service fees from Class A shares (see Note 4).
Trustees and officers of the Fund who are members of EVM’s or BMR’s organizations receive remuneration for their services to the Fund out of the investment adviser fee. Certain officers and Trustees of the Fund and the Portfolio are officers of the above organizations.
4 Distribution Plan
The Fund has in effect a distribution plan for Class A shares (Class A Plan) pursuant to Rule 12b-1 under the 1940 Act. Pursuant to the Class A Plan, the Fund pays EVD a distribution and service fee of 0.25% per annum of its average daily net assets attributable to Class A shares for distribution services and facilities provided to the Fund by EVD, as well as for personal services and/or the maintenance of shareholder accounts. Distribution and service fees paid or accrued to EVD for the year ended December 31, 2019 amounted to $73,523 for Class A shares.
Distribution and service fees are subject to the limitations contained in the Financial Industry Regulatory Authority Rule 2341(d).
5 Contingent Deferred Sales Charges
Class A shares may be subject to a 1% contingent deferred sales charge (CDSC) if redeemed within 18 months of purchase (depending on the circumstances of purchase). Generally, the CDSC is based upon the lower of the net asset value at date of redemption or date of purchase. No charge is levied on shares acquired by reinvestment of dividends or capital gain distributions. For the year ended December 31, 2019, the Fund was informed that EVD received no CDSCs paid by Class A shareholders.
| 13 |
Eaton Vance
Core Bond Fund
December 31, 2019
Notes to Financial Statements — continued
6 Investment Transactions
For the year ended December 31, 2019, increases and decreases in the Fund’s investment in the Portfolio aggregated $92,552,895 and $77,414,204, respectively.
7 Shares of Beneficial Interest
The Fund’s Declaration of Trust permits the Trustees to issue an unlimited number of full and fractional shares of beneficial interest (without par value). Such shares may be issued in a number of different series (such as the Fund) and classes. Transactions in Fund shares were as follows:
| Year Ended December 31, | ||||||||
| Class A | 2019 | 2018 | ||||||
Sales | 1,260,246 | 1,867,429 | ||||||
Issued to shareholders electing to receive payments of distributions in Fund shares | 93,092 | 96,166 | ||||||
Redemptions | (1,176,422 | ) | (2,774,477 | ) | ||||
Net increase (decrease) | 176,916 | (810,882 | ) | |||||
| Year Ended December 31, | ||||||||
| Class I | 2019 | 2018 | ||||||
Sales | 10,946,987 | 6,221,419 | ||||||
Issued to shareholders electing to receive payments of distributions in Fund shares | 581,278 | 453,570 | ||||||
Redemptions | (9,515,425 | ) | (4,226,204 | ) | ||||
Net increase | 2,012,840 | 2,448,785 | ||||||
At December 31, 2019, donor advised and pooled income funds (established and maintained by a public charity) managed by EVM and an Eaton Vance collective investment trust owned in the aggregate 51.6% of the value of the outstanding shares of the Fund.
| 14 |
Eaton Vance
Core Bond Fund
December 31, 2019
Report of Independent Registered Public Accounting Firm
To the Trustees of Eaton Vance Special Investment Trust and Shareholders of Eaton Vance Core Bond Fund:
Opinion on the Financial Statements and Financial Highlights
We have audited the accompanying statement of assets and liabilities of Eaton Vance Core Bond Fund (the “Fund”) (one of the funds constituting Eaton Vance Special Investment Trust), as of December 31, 2019, the related statement of operations for the year then ended, the statements of changes in net assets for each of the two years in the period then ended, the financial highlights for each of the five years in the period then ended, and the related notes. In our opinion, the financial statements and financial highlights present fairly, in all material respects, the financial position of the Fund as of December 31, 2019, and the results of its operations for the year then ended, the changes in its net assets for each of the two years in the period then ended, and the financial highlights for each of the five years in the period then ended, in conformity with accounting principles generally accepted in the United States of America.
Basis for Opinion
These financial statements and financial highlights are the responsibility of the Fund’s management. Our responsibility is to express an opinion on the Fund’s financial statements and financial highlights based on our audits. We are a public accounting firm registered with the Public Company Accounting Oversight Board (United States) (PCAOB) and are required to be independent with respect to the Fund in accordance with the U.S. federal securities laws and the applicable rules and regulations of the Securities and Exchange Commission and the PCAOB.
We conducted our audits in accordance with the standards of the PCAOB. Those standards require that we plan and perform the audit to obtain reasonable assurance about whether the financial statements and financial highlights are free of material misstatement, whether due to error or fraud. The Fund is not required to have, nor were we engaged to perform, an audit of its internal control over financial reporting. As part of our audits we are required to obtain an understanding of internal control over financial reporting but not for the purpose of expressing an opinion on the effectiveness of the Fund’s internal control over financial reporting. Accordingly, we express no such opinion.
Our audits included performing procedures to assess the risks of material misstatement of the financial statements and financial highlights, whether due to error or fraud, and performing procedures that respond to those risks. Such procedures included examining, on a test basis, evidence regarding the amounts and disclosures in the financial statements and financial highlights. Our audits also included evaluating the accounting principles used and significant estimates made by management, as well as evaluating the overall presentation of the financial statements and financial highlights. We believe that our audits provide a reasonable basis for our opinion.
/s/ Deloitte & Touche LLP
Boston, Massachusetts
February 24, 2020
We have served as the auditor of one or more Eaton Vance investment companies since 1959.
| 15 |
Eaton Vance
Core Bond Fund
December 31, 2019
Federal Tax Information (Unaudited)
The Form 1099-DIV you received in February 2020 showed the tax status of all distributions paid to your account in calendar year 2019. Shareholders are advised to consult their own tax adviser with respect to the tax consequences of their investment in the Fund. As required by the Internal Revenue Code and/or regulations, shareholders must be notified regarding the status of capital gains dividends.
Capital Gains Dividends. The Fund hereby designates as a capital gain dividend with respect to the taxable year ended December 31, 2019, $63,868 or, if subsequently determined to be different, the net capital gain of such year.
| 16 |
Core Bond Portfolio
December 31, 2019
Portfolio of Investments
| Corporate Bonds & Notes — 32.6% |
| |||||||
| Security | Principal Amount (000’s omitted) | Value | ||||||
| Aerospace & Defense — 0.3% | ||||||||
Azul Investments LLP, 5.875%, 10/26/24(1) | $ | 625 | $ | 649,953 | ||||
WestJet Airlines, Ltd., 3.50%, 6/16/21(1) | 985 | 1,000,852 | ||||||
| $ | 1,650,805 | |||||||
| Automotive — 1.9% | ||||||||
Ford Motor Credit Co., LLC, 2.853%, (3 mo. USD LIBOR + 0.81%), 4/5/21(2) | $ | 705 | $ | 701,885 | ||||
Ford Motor Credit Co., LLC, 2.881%, (3 mo. USD LIBOR + 0.88%), 10/12/21(2) | 1,566 | 1,552,993 | ||||||
Ford Motor Credit Co., LLC, 2.979%, 8/3/22 | 2,203 | 2,206,047 | ||||||
Ford Motor Credit Co., LLC, 4.140%, 2/15/23 | 300 | 308,662 | ||||||
General Motors Co., 4.20%, 10/1/27 | 2,383 | 2,491,538 | ||||||
General Motors Co., 5.40%, 4/1/48 | 1,563 | 1,617,078 | ||||||
General Motors Financial Co., Inc., 2.862%, (3 mo. USD LIBOR + 0.85%), 4/9/21(2) | 805 | 806,778 | ||||||
General Motors Financial Co., Inc., 3.033%, (3 mo. USD LIBOR + 0.99%), 1/5/23(2) | 1,110 | 1,104,044 | ||||||
General Motors Financial Co., Inc., 3.50%, 11/7/24 | 453 | 466,778 | ||||||
| $ | 11,255,803 | |||||||
| Banks — 11.3% | ||||||||
Alliance Data Systems Corp., | $ | 1,337 | $ | 1,337,000 | ||||
Banco Safra SA, 4.125%, 2/8/23(1) | 1,210 | 1,243,789 | ||||||
Bank of America Corp., 2.314%, (3 mo. USD LIBOR + 0.38%), 1/23/22(2) | 2,207 | 2,209,940 | ||||||
Bank of America Corp., 2.881% to 4/24/22, 4/24/23(3) | 1,425 | 1,450,281 | ||||||
Bank of America Corp., 3.124% to 1/20/22, 1/20/23(3) | 2,420 | 2,468,689 | ||||||
Bank of America Corp., 3.30%, 1/11/23 | 1,237 | 1,279,339 | ||||||
Bank of America Corp., 3.499% to 5/17/21, 5/17/22(3) | 1,005 | 1,025,160 | ||||||
Bank of America Corp., 3.55% to | 2,400 | 2,491,982 | ||||||
Bank of America Corp., 3.593% to 7/21/27, 7/21/28(3) | 5,030 | 5,330,194 | ||||||
Bank of America Corp., 3.974% to 2/7/29, 2/7/30(3) | 807 | 887,203 | ||||||
Barclays PLC, 4.836%, 5/9/28 | 1,610 | 1,735,661 | ||||||
Capital One Bank (USA), N.A., 3.375%, 2/15/23 | 892 | 921,613 | ||||||
Capital One Financial Corp., 2.656%, (3 mo. USD LIBOR + 0.72%), 1/30/23(2) | 2,300 | 2,303,684 | ||||||
Capital One Financial Corp., 3.30%, 10/30/24 | 3,227 | 3,359,975 | ||||||
Capital One Financial Corp., 3.75%, 4/24/24 | 700 | 737,091 | ||||||
Citigroup, Inc., 2.976% to 11/5/29, 11/5/30(3) | 1,748 | 1,774,766 | ||||||
Citigroup, Inc., 3.142% to 1/24/22, 1/24/23(3) | 1,302 | 1,329,040 | ||||||
Citigroup, Inc., 3.668% to 7/24/27, 7/24/28(3) | 1,685 | 1,795,632 | ||||||
Citigroup, Inc., 3.70%, 1/12/26 | 1,000 | 1,066,263 | ||||||
Citigroup, Inc., 3.887% to 1/10/27, 1/10/28(3) | 909 | 979,190 | ||||||
| Security | Principal Amount (000’s omitted) | Value | ||||||
| Banks (continued) | ||||||||
Citigroup, Inc., 4.075% to 4/23/28, 4/23/29(3) | $ | 1,855 | $ | 2,032,534 | ||||
Citizens Financial Group, Inc., 4.30%, 12/3/25 | 1,399 | 1,503,146 | ||||||
Commonwealth Bank of Australia, 2.50%, 9/18/22(1) | 1,050 | 1,063,789 | ||||||
Commonwealth Bank of Australia, 3.61% to 9/12/29, 9/12/34(1)(3) | 982 | 987,610 | ||||||
Deutsche Bank AG, 3.192%, (3 mo. USD LIBOR + 1.29%), 2/4/21(2) | 2,450 | 2,454,475 | ||||||
Discover Bank, 4.682% to 8/9/23, 8/9/28(3) | 1,200 | 1,255,080 | ||||||
Discover Financial Services, 3.95%, 11/6/24 | 490 | 520,169 | ||||||
Goldman Sachs Group, Inc. (The), 2.905% to 7/24/22, 7/24/23(3) | 1,909 | 1,943,619 | ||||||
Goldman Sachs Group, Inc. (The), 3.75%, 2/25/26 | 970 | 1,026,553 | ||||||
Goldman Sachs Group, Inc. (The), 3.85%, 1/26/27 | 1,510 | 1,607,091 | ||||||
Goldman Sachs Group, Inc. (The), 5.75%, 1/24/22 | 951 | 1,020,810 | ||||||
JPMorgan Chase & Co., 2.70%, 5/18/23 | 1,988 | 2,028,704 | ||||||
JPMorgan Chase & Co., 2.739% to 10/15/29, 10/15/30(3) | 2,156 | 2,155,667 | ||||||
JPMorgan Chase & Co., 3.782% to 2/1/27, 2/1/28(3) | 1,000 | 1,077,986 | ||||||
JPMorgan Chase & Co., 3.797% to 7/23/23, 7/23/24(3) | 1,500 | 1,580,967 | ||||||
JPMorgan Chase & Co., 5.625%, 8/16/43 | 628 | 840,636 | ||||||
Morgan Stanley, 3.772% to 1/24/28, 1/24/29(3) | 1,020 | 1,097,460 | ||||||
Morgan Stanley, 4.00%, 7/23/25 | 1,920 | 2,077,599 | ||||||
Morgan Stanley, 4.875%, 11/1/22 | 1,132 | 1,213,111 | ||||||
PPTT, 2006-A GS, Class A, 5.932%(1)(4)(5) | 259 | 262,650 | ||||||
Regions Financial Corp., 2.75%, 8/14/22 | 640 | 651,458 | ||||||
Santander Holdings USA, Inc., 4.50%, 7/17/25 | 712 | 768,444 | ||||||
Synovus Financial Corp., 3.125%, 11/1/22 | 622 | 629,822 | ||||||
Western Union Co. (The), 2.85%, 1/10/25 | 1,314 | 1,318,692 | ||||||
| $ | 66,844,564 | |||||||
| Building Materials — 0.8% | ||||||||
Owens Corning, 3.95%, 8/15/29 | $ | 4,100 | $ | 4,270,261 | ||||
Vulcan Materials Co., 4.50%, 6/15/47 | 479 | 525,751 | ||||||
| $ | 4,796,012 | |||||||
| Chemicals — 1.5% | ||||||||
Alpek SAB de CV, 4.25%, 9/18/29(1) | $ | 920 | $ | 940,010 | ||||
Braskem Netherlands Finance BV, 4.50%, 1/31/30(1) | 2,288 | 2,279,992 | ||||||
Braskem Netherlands Finance BV, 5.875%, 1/31/50(1) | 2,288 | 2,275,988 | ||||||
Celanese US Holdings, LLC, 3.50%, 5/8/24 | 1,750 | 1,809,386 | ||||||
Huntsman International, LLC, 4.50%, 5/1/29 | 1,627 | 1,728,054 | ||||||
| $ | 9,033,430 | |||||||
| Commercial Services — 0.2% | ||||||||
Ashtead Capital, Inc., 4.25%, 11/1/29(1) | $ | 1,112 | $ | 1,138,410 | ||||
| $ | 1,138,410 | |||||||
| 17 | See Notes to Financial Statements. |
Core Bond Portfolio
December 31, 2019
Portfolio of Investments — continued
| Security | Principal Amount (000’s omitted) | Value | ||||||
| Computers — 0.6% | ||||||||
Dell International, LLC/EMC Corp., 4.42%, 6/15/21(1) | $ | 1,350 | $ | 1,389,323 | ||||
DXC Technology Co., 4.25%, 4/15/24 | 229 | 243,222 | ||||||
DXC Technology Co., 4.75%, 4/15/27 | 983 | 1,058,468 | ||||||
Hewlett Packard Enterprise Co., 2.763%, (3 mo. USD LIBOR + 0.72%), 10/5/21(2) | 1,079 | 1,079,148 | ||||||
| $ | 3,770,161 | |||||||
| Diversified Financial Services — 2.8% | ||||||||
Air Lease Corp., 3.375%, 6/1/21 | $ | 700 | $ | 711,913 | ||||
Ally Financial, Inc., 4.125%, 3/30/20 | 1,160 | 1,165,730 | ||||||
Banco BTG Pactual SA/Cayman Islands, 4.50%, 1/10/25(1) | 3,000 | 3,045,000 | ||||||
Brookfield Finance, Inc., 3.90%, 1/25/28 | 1,943 | 2,090,416 | ||||||
Credit Acceptance Corp., 5.125%, 12/31/24(1) | 660 | 687,034 | ||||||
Jefferies Group, LLC/Jefferies Group Capital Finance, Inc., 4.15%, 1/23/30 | 2,336 | 2,475,991 | ||||||
KKR Group Finance Co. VI, LLC, 3.75%, 7/1/29(1) | 1,589 | 1,693,402 | ||||||
Neuberger Berman Group, LLC/Neuberger Berman Finance Corp., 4.50%, 3/15/27(1) | 432 | 460,636 | ||||||
Neuberger Berman Group, LLC/Neuberger Berman Finance Corp., 4.875%, 4/15/45(1) | 707 | 726,387 | ||||||
Synchrony Financial, 3.132%, (3 mo. USD LIBOR + 1.23%), 2/3/20(2) | 3,465 | 3,467,767 | ||||||
| $ | 16,524,276 | |||||||
| Electric Utilities — 0.3% | ||||||||
Entergy Corp., 4.00%, 7/15/22 | $ | 1,046 | $ | 1,091,759 | ||||
ITC Holdings Corp., 4.05%, 7/1/23 | 680 | 713,879 | ||||||
| $ | 1,805,638 | |||||||
| Electrical and Electronic Equipment — 0.8% | ||||||||
Jabil, Inc., 3.95%, 1/12/28 | $ | 2,136 | $ | 2,194,016 | ||||
Jabil, Inc., 4.70%, 9/15/22 | 959 | 1,016,460 | ||||||
NXP B.V./NXP Funding, LLC, 4.625%, 6/1/23(1) | 1,100 | 1,176,147 | ||||||
| $ | 4,386,623 | |||||||
| Energy — 0.2% | ||||||||
Empresa Electrica Cochrane SpA, 5.50%, 5/14/27(1) | $ | 905 | $ | 946,856 | ||||
| $ | 946,856 | |||||||
| Foods — 0.5% | ||||||||
Smithfield Foods, Inc., 2.65%, 10/3/21(1) | $ | 1,304 | $ | 1,296,438 | ||||
Smithfield Foods, Inc., 3.35%, 2/1/22(1) | 1,482 | 1,486,518 | ||||||
| $ | 2,782,956 | |||||||
| Security | Principal Amount (000’s omitted) | Value | ||||||
| Health Care — 0.1% | ||||||||
Centene Corp., 4.25%, 12/15/27(1) | $ | 798 | $ | 822,419 | ||||
| $ | 822,419 | |||||||
| Healthcare Products — 0.2% | ||||||||
Becton Dickinson and Co., 2.836%, (3 mo. USD LIBOR + 0.88%), 12/29/20(2) | $ | 1,315 | $ | 1,315,669 | ||||
| $ | 1,315,669 | |||||||
| Insurance — 0.2% | ||||||||
Marsh & McLennan Cos., Inc., 3.161%, (3 mo. USD LIBOR + 1.20%), 12/29/21(2) | $ | 753 | $ | 753,714 | ||||
Principal Financial Group, Inc., 4.30%, 11/15/46 | 534 | 603,405 | ||||||
| $ | 1,357,119 | |||||||
| Internet Software & Services — 0.1% | ||||||||
Twitter, Inc., 3.875%, 12/15/27(1) | $ | 818 | $ | 819,620 | ||||
| $ | 819,620 | |||||||
| Machinery — 0.7% | ||||||||
nVent Finance S.a.r.l., 4.55%, 4/15/28 | $ | 2,700 | $ | 2,801,786 | ||||
Westinghouse Air Brake Technologies Corp., 3.194%, (3 mo. USD LIBOR + 1.30%), | 431 | 431,068 | ||||||
Westinghouse Air Brake Technologies Corp., 4.95%, 9/15/28 | 566 | 622,784 | ||||||
| $ | 3,855,638 | |||||||
| Media — 0.8% | ||||||||
Comcast Corp., 2.349%, (3 mo. USD LIBOR + 0.44%), 10/1/21(2) | $ | 960 | $ | 964,973 | ||||
Comcast Corp., 4.70%, 10/15/48 | 613 | 755,592 | ||||||
Discovery Communications, LLC, 5.20%, 9/20/47 | 2,560 | 2,980,346 | ||||||
| $ | 4,700,911 | |||||||
| Oil and Gas — 1.6% | ||||||||
National Oilwell Varco, Inc., 3.60%, 12/1/29 | $ | 3,850 | $ | 3,862,895 | ||||
Neptune Energy Bondco PLC, 6.625%, 5/15/25(1) | 2,381 | 2,385,452 | ||||||
Noble Energy, Inc., 3.90%, 11/15/24 | 937 | 990,278 | ||||||
Oceaneering International, Inc., 4.65%, 11/15/24 | 576 | 565,920 | ||||||
Patterson-UTI Energy, Inc., 3.95%, 2/1/28 | 1,830 | 1,779,070 | ||||||
| $ | 9,583,615 | |||||||
| 18 | See Notes to Financial Statements. |
Core Bond Portfolio
December 31, 2019
Portfolio of Investments — continued
| Security | Principal Amount (000’s omitted) | Value | ||||||
| Pharmaceuticals — 1.3% | ||||||||
CVS Health Corp., 3.00%, 8/15/26 | $ | 2,836 | $ | 2,894,318 | ||||
CVS Health Corp., 4.10%, 3/25/25 | 998 | 1,071,159 | ||||||
CVS Health Corp., 4.30%, 3/25/28 | 3,219 | 3,515,552 | ||||||
| $ | 7,481,029 | |||||||
| Pipelines — 0.8% | ||||||||
Gulfstream Natural Gas, 4.60%, 9/15/25(1) | $ | 431 | $ | 465,939 | ||||
Plains All America Pipeline, L.P./PAA Finance Corp., 3.55%, 12/15/29 | 1,851 | 1,825,645 | ||||||
Sabine Pass Liquefaction, LLC, 5.00%, 3/15/27 | 750 | 825,363 | ||||||
Sabine Pass Liquefaction, LLC, 5.625%, 3/1/25 | 880 | 990,817 | ||||||
Sunoco Logistics Partners Operations, L.P., 4.40%, 4/1/21 | 582 | 596,023 | ||||||
| $ | 4,703,787 | |||||||
| Real Estate Investment Trusts (REITs) — 1.6% | ||||||||
DDR Corp., 3.625%, 2/1/25 | $ | 874 | $ | 901,313 | ||||
Digital Realty Trust, L.P., 3.70%, 8/15/27 | 1,272 | 1,347,555 | ||||||
Newmark Group, Inc., 6.125%, 11/15/23 | 2,890 | 3,186,813 | ||||||
SBA Tower Trust, 2.836%, 1/15/25(1) | 3,865 | 3,907,669 | ||||||
| $ | 9,343,350 | |||||||
| Retail – Specialty and Apparel — 1.4% | ||||||||
Best Buy Co., Inc., 4.45%, 10/1/28 | $ | 1,020 | $ | 1,118,971 | ||||
Nordstrom, Inc., 4.375%, 4/1/30 | 1,398 | 1,426,579 | ||||||
Nordstrom, Inc., 5.00%, 1/15/44 | 1,835 | 1,797,371 | ||||||
Reliance Intermediate Holdings, L.P., 6.50%, 4/1/23(1) | 295 | 303,235 | ||||||
Tapestry, Inc., 4.125%, 7/15/27 | 3,491 | 3,567,487 | ||||||
| $ | 8,213,643 | |||||||
| Technology — 0.1% | ||||||||
Western Digital Corp., 4.75%, 2/15/26 | $ | 700 | $ | 731,063 | ||||
| $ | 731,063 | |||||||
| Telecommunications — 1.2% | ||||||||
AT&T, Inc., 4.30%, 2/15/30 | $ | 3,197 | $ | 3,554,802 | ||||
AT&T, Inc., 4.50%, 3/9/48 | 2,250 | 2,486,460 | ||||||
AT&T, Inc., 5.35%, 12/15/43 | 1,000 | 1,186,808 | ||||||
| $ | 7,228,070 | |||||||
| Transportation — 0.4% | ||||||||
SMBC Aviation Capital Finance DAC, 3.00%, 7/15/22(1) | $ | 914 | $ | 930,169 | ||||
SMBC Aviation Capital Finance DAC, 3.55%, 4/15/24(1) | 1,200 | 1,246,318 | ||||||
| $ | 2,176,487 | |||||||
| Security | Principal Amount (000’s omitted) | Value | ||||||
| Utilities — 0.9% | ||||||||
American Water Capital Corp., 2.95%, 9/1/27 | $ | 1,426 | $ | 1,457,176 | ||||
Baltimore Gas & Electric Co., 3.50%, 8/15/46 | 1,580 | 1,607,014 | ||||||
Southern Co. Gas Capital Corp., 2.45%, 10/1/23 | 1,060 | 1,067,362 | ||||||
Southern Co. Gas Capital Corp., 3.95%, 10/1/46 | 1,270 | 1,312,002 | ||||||
| $ | 5,443,554 | |||||||
Total Corporate Bonds & Notes |
| $ | 192,711,508 | |||||
| Agency Mortgage-Backed Securities — 9.0% |
| |||||||
| Security | Principal Amount (000’s omitted) | Value | ||||||
| Federal Home Loan Mortgage Corp.: | ||||||||
Pool #A93547, 4.50%, 8/1/40 | $ | 676 | $ | 735,050 | ||||
Pool #C03490, 4.50%, 8/1/40 | 494 | 537,646 | ||||||
Pool #C09031, 2.50%, 2/1/43 | 1,575 | 1,571,325 | ||||||
Pool #G07589, 5.50%, 6/1/41 | 2,270 | 2,558,023 | ||||||
Pool #G08596, 4.50%, 7/1/44 | 665 | 716,818 | ||||||
Pool #G08670, 3.00%, 10/1/45 | 1,235 | 1,266,448 | ||||||
Pool #G08701, 3.00%, 4/1/46 | 1,876 | 1,922,826 | ||||||
Pool #G08717, 4.00%, 8/1/46 | 1,557 | 1,645,739 | ||||||
Pool #G08738, 3.50%, 12/1/46 | 1,557 | 1,619,795 | ||||||
Pool #G08758, 4.00%, 4/1/47 | 1,405 | 1,474,831 | ||||||
Pool #G60608, 4.00%, 5/1/46 | 2,671 | 2,835,381 | ||||||
Pool #G60761, 3.00%, 10/1/43 | 1,796 | 1,849,282 | ||||||
Pool #Q17453, 3.50%, 4/1/43 | 1,499 | 1,578,187 | ||||||
Pool #Q34310, 3.50%, 6/1/45 | 1,648 | 1,724,658 | ||||||
Pool #Q40264, 3.50%, 5/1/46 | 1,358 | 1,415,277 | ||||||
Pool #Q45051, 3.00%, 12/1/46 | 3,018 | 3,106,254 | ||||||
Pool #Q46889, 3.50%, 3/1/47 | 2,246 | 2,360,649 | ||||||
Pool #Q47999, 4.00%, 5/1/47 | 2,916 | 3,106,895 | ||||||
| $ | 32,025,084 | |||||||
| Federal National Mortgage Association: | ||||||||
Pool #AB3678, 3.50%, 10/1/41 | $ | 3,083 | $ | 3,273,435 | ||||
Pool #AL7524, 5.00%, 7/1/41 | 719 | 788,799 | ||||||
Pool #AS3892, 4.00%, 11/1/44 | 950 | 1,011,004 | ||||||
Pool #AS5332, 4.00%, 7/1/45 | 998 | 1,061,877 | ||||||
Pool #AS6014, 4.00%, 10/1/45 | 695 | 740,107 | ||||||
Pool #AS9721, 4.00%, 6/1/47 | 2,316 | 2,434,676 | ||||||
Pool #BA0891, 3.50%, 1/1/46 | 2,062 | 2,151,869 | ||||||
Pool #BA3938, 3.50%, 1/1/46 | 1,570 | 1,638,454 | ||||||
Pool #BD1183, 3.50%, 12/1/46 | 1,090 | 1,135,161 | ||||||
Pool #BE2316, 3.50%, 1/1/47 | 2,664 | 2,767,317 | ||||||
| 19 | See Notes to Financial Statements. |
Core Bond Portfolio
December 31, 2019
Portfolio of Investments — continued
| Security | Principal Amount (000’s omitted) | Value | ||||||
| Federal National Mortgage Association: (continued) | ||||||||
Pool #MA1789, 4.50%, 2/1/44 | $ | 677 | $ | 730,595 | ||||
Pool #MA2653, 4.00%, 6/1/46 | 1,620 | 1,710,893 | ||||||
| $ | 19,444,187 | |||||||
| Government National Mortgage Association: | ||||||||
Pool #AQ1784, 3.50%, 12/20/45 | $ | 1,522 | $ | 1,615,537 | ||||
| $ | 1,615,537 | |||||||
Total Agency Mortgage-Backed Securities |
| $ | 53,084,808 | |||||
| Collateralized Mortgage Obligations — 7.0% |
| |||||||
| Security | Principal Amount (000’s omitted) | Value | ||||||
| Federal Home Loan Mortgage Corp.: | ||||||||
Series 4030, Class PA, 3.50%, 6/15/40 | $ | 1,101 | $ | 1,116,791 | ||||
Series 4423, Class A, 3.50%, 10/15/39 | 590 | 592,064 | ||||||
| $ | 1,708,855 | |||||||
| Federal Home Loan Mortgage Corp. Structured Agency Credit Risk Debt Notes: | ||||||||
Series 2017-DNA3, Class M3, 4.292%, (1 mo. USD LIBOR + 2.50%), 3/25/30(2) | $ | 1,889 | $ | 1,934,911 | ||||
Series 2018-DNA1, Class M1, 2.242%, (1 mo. USD LIBOR + 0.45%), 7/25/30(2) | 480 | 480,635 | ||||||
Series 2018-DNA1, Class M2AT, 2.842%, (1 mo. USD LIBOR + 1.05%), 7/25/30(2) | 1,755 | 1,753,147 | ||||||
Series 2019-DNA3, Class M1, 2.522%, (1 mo. USD LIBOR + 0.73%), 7/25/49(1)(2) | 419 | 419,613 | ||||||
Series 2019-DNA3, Class M2, 3.842%, (1 mo. USD LIBOR + 2.05%), 7/25/49(1)(2) | 2,688 | 2,702,942 | ||||||
Series 2019-DNA4, Class M1, 2.492%, (1 mo. USD LIBOR + 0.70%), | 1,005 | 1,006,153 | ||||||
Series 2019-HQA2, Class M2, 3.842%, (1 mo. USD LIBOR + 2.05%), 4/25/49(1)(2) | 1,210 | 1,215,784 | ||||||
Series 2019-HQA3, Class M1, 2.542%, (1 mo. USD LIBOR + 0.75%), 9/25/49(1)(2) | 355 | 355,545 | ||||||
Series 2019-HQA3, Class M2, 3.642%, (1 mo. USD LIBOR + 1.85%), 9/25/49(1)(2) | 304 | 304,258 | ||||||
| $ | 10,172,988 | |||||||
| Federal National Mortgage Association: | ||||||||
Series 2005-58, Class MA, 5.50%, 7/25/35 | $ | 190 | $ | 206,763 | ||||
Series 2011-135, Class PK, 4.50%, 5/25/40 | 733 | 752,731 | ||||||
Series 2013-6, Class HD, 1.50%, 12/25/42 | 196 | 188,160 | ||||||
Series 2014-70, Class KP, 3.50%, 3/25/44 | 1,030 | 1,077,405 | ||||||
Series 2018-M4, Class A2, 3.045%, 3/25/28(6) | 1,721 | 1,803,145 | ||||||
Series 2019-M1, Class A2, 3.555%, 9/25/28(6) | 4,835 | 5,236,838 | ||||||
| Security | Principal Amount (000’s omitted) | Value | ||||||
| Federal National Mortgage Association: (continued) | ||||||||
Series 2019-M9, Class A2, | $ | 1,290 | $ | 1,336,337 | ||||
Series 2019-M22, Class A2, 2.522%, 8/25/29(6) | 5,900 | 5,923,966 | ||||||
| $ | 16,525,345 | |||||||
| Federal National Mortgage Association Connecticut Avenue Securities: | ||||||||
Series 2013-C01, Class M2, 7.042%, (1 mo. USD LIBOR + 5.25%), 10/25/23(2) | $ | 1,957 | $ | 2,159,334 | ||||
Series 2014-C02, Class 1M2, 4.392%, (1 mo. USD LIBOR + 2.60%), 5/25/24(2) | 1,887 | 1,973,599 | ||||||
Series 2014-C02, Class 2M2, 4.392%, (1 mo. USD LIBOR + 2.60%), 5/25/24(2) | 798 | 828,849 | ||||||
Series 2014-C03, Class 1M2, 4.792%, (1 mo. USD LIBOR + 3.00%), 7/25/24(2) | 1,011 | 1,065,395 | ||||||
Series 2014-C03, Class 2M2, 4.692%, (1 mo. USD LIBOR + 2.90%), 7/25/24(2) | 1,589 | 1,659,630 | ||||||
Series 2017-C06, Class 1M2, 4.442%, (1 mo. USD LIBOR + 2.65%), 2/25/30(2) | 1,275 | 1,307,622 | ||||||
Series 2018-C03, Class 1M1, 2.472%, (1 mo. USD LIBOR + 0.68%), 10/25/30(2) | 222 | 222,636 | ||||||
Series 2019-R05, Class 1M1, 2.542%, (1 mo. USD LIBOR + 0.75%), 7/25/39(1)(2) | 500 | 500,327 | ||||||
Series 2019-R05, Class 1M2, 3.792%, (1 mo. USD LIBOR + 2.00%), 7/25/39(1)(2) | 875 | 880,248 | ||||||
Series 2019-R06, Class 2M1, 2.542%, (1 mo. USD LIBOR + 0.75%), 9/25/39(1)(2) | 2,139 | 2,142,293 | ||||||
| $ | 12,739,933 | |||||||
Total Collateralized Mortgage Obligations |
| $ | 41,147,121 | |||||
| Commercial Mortgage-Backed Securities — 9.3% |
| |||||||
| Security | Principal Amount (000’s omitted) | Value | ||||||
| BAMLL Commercial Mortgage Securities Trust | ||||||||
Series 2019-BPR, Class DNM, 3.843%, 11/5/32(1)(6) | $ | 3,325 | $ | 3,305,296 | ||||
Series 2019-BPR, Class FNM, 3.843%, 11/5/32(1)(6) | 1,635 | 1,391,494 | ||||||
| BX Commercial Mortgage Trust | ||||||||
Series 2019-XL, Class A, 2.66%, (1 mo. USD LIBOR + 0.92%), 10/15/36(1)(2) | 3,320 | 3,326,698 | ||||||
Series 2019-XL, Class B, 2.82%, (1 mo. USD LIBOR + 1.08%), 10/15/36(1)(2) | 1,320 | 1,323,261 | ||||||
| CFCRE Commercial Mortgage Trust | ||||||||
Series 2016-C7, Class C, | 1,250 | 1,310,524 | ||||||
Series 2016-C7, Class D, | 2,000 | 1,975,739 | ||||||
| Citigroup Commercial Mortgage Trust | ||||||||
Series 2017-MDRB, Class C, 4.24%, (1 mo. USD LIBOR + 2.50%), 7/15/30(1)(2) | 3,000 | 3,001,589 | ||||||
| 20 | See Notes to Financial Statements. |
Core Bond Portfolio
December 31, 2019
Portfolio of Investments — continued
| Security | Principal Amount (000’s omitted) | Value | ||||||
| COMM Mortgage Trust | ||||||||
Series 2014-CR19, Class A3, 3.53%, 8/10/47 | $ | 2,536 | $ | 2,534,537 | ||||
Series 2014-CR21, Class C, 4.428%, 12/10/47(6) | 500 | 524,819 | ||||||
| Credit Suisse Mortgage Trust | ||||||||
Series 2016-NXSR, Class C, 4.36%, 12/15/49(6) | 1,775 | 1,839,506 | ||||||
| JPMBB Commercial Mortgage Securities Trust | ||||||||
Series 2014-C22, Class C, 4.557%, 9/15/47(6) | 2,530 | 2,584,340 | ||||||
Series 2014-C22, Class D, 4.557%, 9/15/47(1)(6) | 990 | 903,630 | ||||||
Series 2014-C25, Class D, 3.951%, 11/15/47(1)(6) | 1,960 | 1,765,148 | ||||||
| JPMorgan Chase Commercial Mortgage Securities Trust | ||||||||
Series 2011-C5, Class D, | 2,000 | 2,043,198 | ||||||
Series 2012-CBX, Class AS, 4.271%, 6/15/45 | 3,325 | 3,461,312 | ||||||
Series 2013-C13, Class D, 4.065%, 1/15/46(1)(6) | 2,000 | 2,058,658 | ||||||
| Morgan Stanley Capital I Trust | ||||||||
Series 2016-UB12, Class D, 3.312%, 12/15/49(1) | 1,745 | 1,359,109 | ||||||
Series 2019-BPR, Class A, 3.14%, (1 mo. USD LIBOR + 1.40%), 5/15/36(1)(2) | 2,500 | 2,498,149 | ||||||
| Motel 6 Trust | ||||||||
Series 2017-MTL6, Class C, 3.14%, (1 mo. USD LIBOR + 1.40%), 8/15/34(1)(2) | 2,391 | 2,393,726 | ||||||
Series 2017-MTL6, Class D, 3.89%, (1 mo. USD LIBOR + 2.15%), 8/15/34(1)(2) | 494 | 494,946 | ||||||
| Natixis Commercial Mortgage Securities Trust | ||||||||
Series 2018-FL1, Class C, 3.965%, (1 mo. USD LIBOR + 2.20%), 6/15/35(1)(2) | 5,000 | 4,980,127 | ||||||
| RETL Trust | ||||||||
Series 2019-RVP, Class A, 2.89%, (1 mo. USD LIBOR + 1.15%), 3/15/36(1)(2) | 1,831 | 1,834,490 | ||||||
Series 2019-RVP, Class B, 3.29%, (1 mo. USD LIBOR + 1.55%), 3/15/36(1)(2) | 2,550 | 2,555,980 | ||||||
| Toorak Mortgage Corp., Ltd. | ||||||||
Series 2018-1, Class A1, 4.336% to 4/25/21, 8/25/21(1)(7) | 1,330 | 1,338,482 | ||||||
| VMC Finance, LLC | ||||||||
Series 2018-FL2, Class A, 2.657%, (1 mo. USD LIBOR + 0.92%), 10/15/35(1)(2) | 2,857 | 2,862,968 | ||||||
| Wells Fargo Commercial Mortgage Trust | ||||||||
Series 2015-LC22, Class C, 4.534%, 9/15/58(6) | 900 | 947,875 | ||||||
Series 2016-C35, Class D, 3.142%, 7/15/48(1) | 500 | 436,094 | ||||||
Total Commercial Mortgage-Backed Securities |
| $ | 55,051,695 | |||||
| Asset-Backed Securities — 17.9% |
| |||||||
| Security | Principal Amount (000’s omitted) | Value | ||||||
| Adams Outdoor Advertising L.P. | ||||||||
Series 2018-1, Class A, 4.81%, 11/15/48(1) | $ | 738 | $ | 766,182 | ||||
| Security | Principal Amount (000’s omitted) | Value | ||||||
| Avant Loans Funding Trust | ||||||||
Series 2019-A, Class A, 3.48%, 7/15/22(1) | $ | 421 | $ | 423,035 | ||||
Series 2019-B, Class A, 2.72%, 10/15/26(1) | 1,809 | 1,810,991 | ||||||
| Avis Budget Rental Car Funding, LLC | ||||||||
Series 2014-2A, Class A, 2.50%, 2/20/21(1) | 2,999 | 2,999,266 | ||||||
| Canyon Capital CLO, Ltd. | ||||||||
Series 2016-1A, Class BR, 3.701%, (3 mo. USD LIBOR + 1.70%), 7/15/31(1)(2) | 1,000 | 990,890 | ||||||
Series 2016-1A, Class DR, 4.801%, (3 mo. USD LIBOR + 2.80%), 7/15/31(1)(2) | 1,000 | 965,293 | ||||||
| Carlyle Global Market Strategies CLO, Ltd. | ||||||||
Series 2014-3RA, Class A2, 3.486%, (3 mo. USD LIBOR + 1.55%), 7/27/31(1)(2) | 1,000 | 988,980 | ||||||
Series 2014-3RA, Class C, 4.886%, (3 mo. USD LIBOR + 2.95%), 7/27/31(1)(2) | 1,000 | 930,716 | ||||||
| CarMax Auto Owner Trust | ||||||||
Series 2016-1, Class C, 2.52%, 10/15/21 | 990 | 991,075 | ||||||
Series 2017-2, Class A3, 1.93%, 3/15/22 | 657 | 657,135 | ||||||
| CIG Auto Receivables Trust | ||||||||
Series 2019-1A, Class A, 3.33%, 8/15/24(1) | 1,374 | 1,382,261 | ||||||
| CNH Equipment Trust | ||||||||
Series 2017-A, Class A3, 2.07%, 5/16/22 | 659 | 659,328 | ||||||
| Coinstar Funding, LLC | ||||||||
Series 2017-1A, Class A2, 5.216%, 4/25/47(1) | 1,321 | 1,356,060 | ||||||
| Conn’s Receivables Funding, LLC | ||||||||
Series 2018-A, Class A, 3.25%, 1/15/23(1) | 85 | 85,566 | ||||||
Series 2019-A, Class A, 3.40%, 10/16/23(1) | 415 | 418,510 | ||||||
Series 2019-B, Class A, 2.66%, 6/17/24(1) | 3,592 | 3,598,163 | ||||||
| Consumer Loan Underlying Bond Credit Trust | ||||||||
Series 2019-P2, Class A, 2.47%, 10/15/26(1) | 1,613 | 1,614,333 | ||||||
| Credit Acceptance Auto Loan Trust | ||||||||
Series 2017-2A, Class A, 2.55%, 2/17/26(1) | 1,135 | 1,136,130 | ||||||
| DB Master Finance, LLC | ||||||||
Series 2017-1A, Class A2II, 4.03%, 11/20/47(1) | 333 | 341,373 | ||||||
| Drive Auto Receivables Trust | ||||||||
Series 2017-BA, Class D, 3.72%, 10/17/22(1) | 896 | 899,912 | ||||||
Series 2018-1, Class C, 3.22%, 3/15/23 | 951 | 952,989 | ||||||
| Driven Brands Funding, LLC | ||||||||
Series 2018-1A, Class A2, 4.739%, 4/20/48(1) | 763 | 793,059 | ||||||
| Dryden Senior Loan Fund | ||||||||
Series 2018-55A, Class D, 4.851%, (3 mo. USD LIBOR + 2.85%), 4/15/31(1)(2) | 1,000 | 945,137 | ||||||
| Enterprise Fleet Financing, LLC | ||||||||
Series 2017-1, Class A2, 2.13%, 7/20/22(1) | 349 | 348,735 | ||||||
| Exeter Automobile Receivables Trust | ||||||||
Series 2017-1A, Class B, 3.00%, 12/15/21(1) | 796 | 796,888 | ||||||
Series 2019-3A, Class A, 2.59%, 9/15/22(1) | 1,563 | 1,565,903 | ||||||
| 21 | See Notes to Financial Statements. |
Core Bond Portfolio
December 31, 2019
Portfolio of Investments — continued
| Security | Principal Amount (000’s omitted) | Value | ||||||
| FOCUS Brands Funding, LLC | ||||||||
Series 2017-1A, Class A2II, | $ | 975 | $ | 1,025,683 | ||||
| Foundation Finance Trust | ||||||||
Series 2017-1A, Class A, 3.30%, 7/15/33(1) | 1,301 | 1,307,242 | ||||||
| FREED ABS Trust | ||||||||
Series 2019-2, Class A, 2.62%, 11/18/26(1) | 4,357 | 4,357,416 | ||||||
| Hardee’s Funding, LLC | ||||||||
Series 2018-1A, Class A2I, 4.25%, 6/20/48(1) | 968 | 974,573 | ||||||
| Hertz Fleet Lease Funding, L.P. | ||||||||
Series 2017-1, Class A2, 2.13%, 4/10/31(1) | 426 | 427,326 | ||||||
| Horizon Aircraft Finance I, Ltd. | ||||||||
Series 2018-1, Class A, 4.458%, 12/15/38(1) | 3,249 | 3,337,288 | ||||||
| Horizon Aircraft Finance III, Ltd. | ||||||||
Series 2019-2, Class A, 3.425%, 11/15/39(1) | 1,600 | 1,592,999 | ||||||
| Jack in the Box Funding, LLC | ||||||||
Series 2019-1A, Class A2I, | 1,110 | 1,119,568 | ||||||
| LL ABS Trust | ||||||||
Series 2019-1A, Class A, 2.87%, 3/15/27(1) | 1,975 | 1,975,161 | ||||||
| MelTel Land Funding, LLC | ||||||||
Series 2019-1A, Class B, 4.701%, 4/15/49(1) | 960 | 983,547 | ||||||
| Mercedes-Benz Auto Lease Trust | ||||||||
Series 2019-A, Class A2, 3.01%, 2/16/21 | 1,226 | 1,227,920 | ||||||
| Mercedes-Benz Auto Receivables Trust | ||||||||
Series 2016-1, Class A3, 1.26%, 2/16/21 | 38 | 37,940 | ||||||
| OneMain Financial Issuance Trust | ||||||||
Series 2017-1A, Class A1, 2.37%, 9/14/32(1) | 1,890 | 1,889,777 | ||||||
| OSCAR US Funding X, LLC | ||||||||
Series 2019-1A, Class A2, 3.10%, 4/11/22(1) | 1,352 | 1,358,601 | ||||||
| Planet Fitness Master Issuer, LLC | ||||||||
Series 2018-1A, Class A2I, 4.262%, 9/5/48(1) | 2,054 | 2,093,484 | ||||||
Series 2019-1A, Class A2, | 1,040 | 1,026,484 | ||||||
| Prestige Auto Receivables Trust | ||||||||
Series 2019-1A, Class A2, 2.44%, 7/15/22(1) | 1,298 | 1,299,765 | ||||||
| Prosper Marketplace Issuance Trust | ||||||||
Series 2018-1A, Class B, 3.90%, 6/17/24(1) | 280 | 280,578 | ||||||
Series 2018-2A, Class A, 3.35%, 10/15/24(1) | 720 | 721,908 | ||||||
| Purchasing Power Funding, LLC | ||||||||
Series 2018-A, Class A, 3.34%, 8/15/22(1) | 6,000 | 6,009,121 | ||||||
| SERVPRO Master Issuer, LLC | ||||||||
Series 2019-1A, Class A2, | 4,514 | 4,543,481 | ||||||
| Skopos Auto Receivables Trust | ||||||||
Series 2019-1A, Class A, 2.90%, 12/15/22(1) | 2,880 | 2,884,462 | ||||||
| Small Business Lending Trust | ||||||||
Series 2019-A, Class A, 2.85%, 7/15/26(1) | 1,153 | 1,152,939 | ||||||
| SpringCastle Funding Asset-Backed Notes | ||||||||
Series 2019-AA, Class A, 3.20%, 5/27/36(1) | 2,413 | 2,422,416 | ||||||
| Security | Principal Amount (000’s omitted) | Value | ||||||
| Springleaf Funding Trust | ||||||||
Series 2016-AA, Class A, | $ | 463 | $ | 463,256 | ||||
| Stack Infrastructure Issuer, LLC | ||||||||
Series 2019-1A, Class A2, | 5,211 | 5,458,643 | ||||||
Series 2019-2A, Class A2, | 710 | 709,509 | ||||||
| Start, Ltd. | ||||||||
Series 2019-1, Class B, 5.095%, 3/15/44(1) | 1,623 | 1,661,837 | ||||||
| TCF Auto Receivables Owner Trust | ||||||||
Series 2016-PT1A, Class A, | 249 | 249,179 | ||||||
| Tesla Auto Lease Trust | ||||||||
Series 2018-B, Class A, 3.71%, 8/20/21(1) | 976 | 988,372 | ||||||
Series 2018-B, Class C, 4.36%, 10/20/21(1) | 1,050 | 1,078,211 | ||||||
Series 2019-A, Class A3, | 3,680 | 3,675,070 | ||||||
| Thunderbolt Aircraft Lease, Ltd. | ||||||||
Series 2017-A, Class B, 5.75% to 4/15/24, 5/17/32(1)(7) | 1,407 | 1,455,394 | ||||||
| Towd Point Asset Trust | ||||||||
Series 2018-SL1, Class A, 2.308%, (1 mo. USD LIBOR + 0.60%), 1/25/46(1)(2) | 4,941 | 4,865,951 | ||||||
| Upgrade Receivables Trust | ||||||||
Series 2019-1A, Class B, 4.09%, 3/15/25(1) | 2,000 | 2,014,864 | ||||||
Series 2019-2A, Class A, | 3,224 | 3,229,539 | ||||||
| Upland CLO, Ltd. | ||||||||
Series 2016-1A, Class CR, 4.866%, (3 mo. USD LIBOR + 2.90%), 4/20/31(1)(2) | 1,000 | 953,031 | ||||||
| Vantage Data Centers Issuer, LLC | ||||||||
Series 2018-1A, Class A2, | 1,358 | 1,400,385 | ||||||
Series 2019-1A, Class A2, | 2,003 | 2,017,059 | ||||||
| Veros Automobile Receivables Trust | ||||||||
Series 2018-1, Class A, 3.63%, 5/15/23(1) | 1,231 | 1,234,163 | ||||||
| Voya CLO, Ltd. | ||||||||
Series 2018-2A, Class B1, 3.551%, (3 mo. USD LIBOR + 1.55%), 7/15/31(1)(2) | 1,000 | 991,307 | ||||||
| Wheels SPV, LLC | ||||||||
Series 2017-1A, Class A2, | 768 | 768,256 | ||||||
Total Asset-Backed Securities | $ | 105,681,615 | ||||||
| U.S. Treasury Obligations — 16.2% |
| |||||||
| Security | Principal Amount (000’s omitted) | Value | ||||||
U.S. Treasury Bond, 3.00%, 2/15/49 | $ | 3,200 | $ | 3,606,940 | ||||
U.S. Treasury Bond, 3.125%, 5/15/48 | 1,270 | 1,461,123 | ||||||
U.S. Treasury Bond, 3.375%, 11/15/48 | 2,070 | 2,495,374 | ||||||
U.S. Treasury Inflation-Protected Note, 0.625%, 4/15/23(8) | 2,771 | 2,814,439 | ||||||
| 22 | See Notes to Financial Statements. |
Core Bond Portfolio
December 31, 2019
Portfolio of Investments — continued
| Security | Principal Amount (000’s omitted) | Value | ||||||
U.S. Treasury Inflation-Protected Note, 0.75%, 7/15/28(8) | $ | 19,571 | $ | 20,595,508 | ||||
U.S. Treasury Note, 1.25%, 8/31/24 | 4,900 | 4,802,638 | ||||||
U.S. Treasury Note, 1.625%, 6/30/21 | 19,480 | 19,488,184 | ||||||
U.S. Treasury Note, 1.75%, 7/31/21 | 20,085 | 20,132,708 | ||||||
U.S. Treasury Note, 1.75%, 7/31/24 | 4,253 | 4,263,410 | ||||||
U.S. Treasury Note, 1.75%, 11/15/29 | 3,401 | 3,347,460 | ||||||
U.S. Treasury Note, 2.125%, 3/31/24 | 2,050 | 2,086,580 | ||||||
U.S. Treasury Note, 2.50%, 2/15/22 | 7,500 | 7,641,364 | ||||||
U.S. Treasury Note, 2.625%, 12/31/25 | 562 | 588,912 | ||||||
U.S. Treasury Note, 2.875%, 9/30/23 | 2,410 | 2,515,717 | ||||||
Total U.S. Treasury Obligations |
| $ | 95,840,357 | |||||
| Taxable Municipal Securities — 1.4% |
| |||||||
| Security | Principal Amount (000’s omitted) | Value | ||||||
| Special Tax Revenue — 0.2% | ||||||||
California Health Facilities Financing Authority, (No Place Like Home Program), 3.034%, 6/1/34 | $ | 1,430 | $ | 1,419,418 | ||||
| $ | 1,419,418 | |||||||
| Water and Sewer — 1.2% | ||||||||
San Francisco City and County Public Utilities Commission, CA, Water Revenue, Green Bonds, 3.303%, 11/1/39(9) | $ | 6,750 | $ | 6,741,090 | ||||
| $ | 6,741,090 | |||||||
Total Taxable Municipal Securities | $ | 8,160,508 | ||||||
| Senior Floating-Rate Loans — 2.5%(10) |
| |||||||
| Borrower/Tranche Description | Principal Amount (000’s omitted) | Value | ||||||
| Building and Development — 0.2% | ||||||||
Cushman & Wakefield U.S. Borrower, LLC, Term Loan, 5.049%, (1 mo. USD LIBOR + 3.25%), 8/21/25 | $ | 1,234 | $ | 1,240,739 | ||||
| $ | 1,240,739 | |||||||
| Cable and Satellite Television — 0.2% | ||||||||
Ziggo Secured Finance Partnership, Term Loan, 4.24%, (1 mo. USD LIBOR + 2.50%), 4/15/25 | $ | 1,000 | $ | 1,002,292 | ||||
| $ | 1,002,292 | |||||||
| Borrower/Tranche Description | Principal Amount (000’s omitted) | Value | ||||||
| Cosmetics / Toiletries — 0.0%(11) | ||||||||
Prestige Brands, Inc., Term Loan, 3.799%, (1 mo. USD LIBOR + 2.00%), 1/26/24 | $ | 174 | $ | 175,425 | ||||
| $ | 175,425 | |||||||
| Drugs — 0.3% | ||||||||
Jaguar Holding Company II, Term Loan, 4.299%, (1 mo. USD LIBOR + 2.50%), 8/18/22 | $ | 1,846 | $ | 1,858,221 | ||||
| $ | 1,858,221 | |||||||
| Electronics / Electrical — 0.9% | ||||||||
Epicor Software Corporation, Term Loan, 5.05%, (1 mo. USD LIBOR + 3.25%), 6/1/22 | $ | 1,082 | $ | 1,090,960 | ||||
Go Daddy Operating Company, LLC, Term Loan, 3.549%, (1 mo. USD LIBOR + 1.75%), 2/15/24 | 179 | 180,154 | ||||||
Hyland Software, Inc., Term Loan, 5.299%, (1 mo. USD LIBOR + 3.50%), 7/1/24 | 1,022 | 1,032,103 | ||||||
Infor (US), Inc., Term Loan, 4.695%, (3 mo. USD LIBOR + 2.75%), 2/1/22 | 1,854 | 1,864,803 | ||||||
MA FinanceCo., LLC, Term Loan, 4.299%, (1 mo. USD LIBOR + 2.50%), 6/21/24 | 78 | 78,191 | ||||||
Seattle Spinco, Inc., Term Loan, 4.299%, (1 mo. USD LIBOR + 2.50%), 6/21/24 | 526 | 528,039 | ||||||
SolarWinds Holdings, Inc., Term Loan, 4.549%, (1 mo. USD LIBOR + 2.75%), 2/5/24 | 287 | 289,642 | ||||||
| $ | 5,063,892 | |||||||
| Equipment Leasing — 0.2% | ||||||||
Avolon TLB Borrower 1 (US), LLC, Term Loan, 3.515%, (1 mo. USD LIBOR + 1.75%), 1/15/25 | $ | 1,138 | $ | 1,146,975 | ||||
| $ | 1,146,975 | |||||||
| Food / Drug Retailers — 0.1% | ||||||||
Albertsons, LLC, Term Loan, 4.549%, (1 mo. USD LIBOR + 2.75%), 11/17/25 | $ | 252 | $ | 254,619 | ||||
| $ | 254,619 | |||||||
| Health Care — 0.2% | ||||||||
Change Healthcare Holdings, LLC, Term Loan, 4.299%, (1 mo. USD LIBOR + 2.50%), 3/1/24 | $ | 837 | $ | 841,409 | ||||
| $ | 841,409 | |||||||
| Industrial Equipment — 0.0%(11) | ||||||||
Rexnord, LLC, Term Loan, 3.535%, (1 mo. USD LIBOR + 1.75%), 8/21/24 | $ | 148 | $ | 149,365 | ||||
| $ | 149,365 | |||||||
| 23 | See Notes to Financial Statements. |
Core Bond Portfolio
December 31, 2019
Portfolio of Investments — continued
| Borrower/Tranche Description | Principal Amount (000’s omitted) | Value | ||||||
| Insurance — 0.1% | ||||||||
Asurion, LLC, Term Loan, 11/3/23(12) | $ | 800 | $ | 805,917 | ||||
| $ | 805,917 | |||||||
| Leisure Goods / Activities / Movies — 0.0%(11) | ||||||||
Bombardier Recreational Products, Inc., Term Loan, 3.799%, (1 mo. USD LIBOR + 2.00%), 5/23/25 | $ | 247 | $ | 248,599 | ||||
| $ | 248,599 | |||||||
| Lodging and Casinos — 0.0%(11) | ||||||||
ESH Hospitality, Inc., Term Loan, 3.799%, (1 mo. USD LIBOR + 2.00%), 9/18/26 | $ | 144 | $ | 145,023 | ||||
| $ | 145,023 | |||||||
| Telecommunications — 0.3% | ||||||||
CenturyLink, Inc., Term Loan, 1/31/25(12) | $ | 490 | $ | 492,586 | ||||
Level 3 Financing, Inc., Term Loan, 3.549%, (1 mo. USD LIBOR + 1.75%), 3/1/27 | 250 | 251,131 | ||||||
Sprint Communications, Inc., Term Loan, 4.313%, (1 mo. USD LIBOR + 2.50%), 2/2/24 | 837 | 831,590 | ||||||
| $ | 1,575,307 | |||||||
Total Senior Floating-Rate Loans |
| $ | 14,507,783 | |||||
| Short-Term Investments — 5.0% |
| |||||||
| Commercial Paper — 1.2% | ||||||||
| Security | Principal Amount (000’s omitted) | Value | ||||||
Jabil, Inc., 2.27%, 2/6/20(1)(13) | $ | 5,830 | $ | 5,814,673 | ||||
Sherwin Williams Co. (The), | 1,280 | 1,279,667 | ||||||
Total Commercial Paper |
| $ | 7,094,340 | |||||
| Other — 3.8% |
| |||||||
| Description | Units | Value | ||||||
Eaton Vance Cash Reserves Fund, LLC, 1.78%(14) | 22,272,569 | $ | 22,272,569 | |||||
Total Other |
| $ | 22,272,569 | |||||
Total Short-Term Investments |
| $ | 29,366,909 | |||||
Total Investments — 100.9% |
| $ | 595,552,304 | |||||
Other Assets, Less Liabilities — (0.9)% |
| $ | (5,162,516 | ) | ||||
Net Assets — 100.0% |
| $ | 590,389,788 | |||||
The percentage shown for each investment category in the Portfolio of Investments is based on net assets.
| (1) | Security exempt from registration pursuant to Rule 144A under the Securities Act of 1933, as amended. These securities may be sold in certain transactions in reliance on an exemption from registration (normally to qualified institutional buyers). At December 31, 2019, the aggregate value of these securities is $196,594,118 or 33.3% of the Portfolio’s net assets. |
| (2) | Variable rate security. The stated interest rate represents the rate in effect at December 31, 2019. |
| (3) | Security converts to variable rate after the indicated fixed-rate coupon period. |
| (4) | Perpetual security with no stated maturity date but may be subject to calls by the issuer. |
| (5) | Variable rate security. The stated interest rate, which resets quarterly, is determined at auction and represents the rate in effect at December 31, 2019. |
| (6) | Weighted average fixed-rate coupon that changes/updates monthly. Rate shown is the rate at December 31, 2019. |
| (7) | Step coupon security. Interest rate represents the rate in effect at December 31, 2019. |
| (8) | Inflation-linked security whose principal is adjusted for inflation based on changes in the U.S. Consumer Price Index. Interest is calculated based on the inflation-adjusted principal. |
| (9) | When-issued security. |
| (10) | Senior floating-rate loans (Senior Loans) often require prepayments from excess cash flows or permit the borrowers to repay at their election. The degree to which borrowers repay, whether as a contractual requirement or at their election, cannot be predicted with accuracy. As a result, the actual remaining maturity may be substantially less than the stated maturities shown. However, Senior Loans will typically have an expected average life of approximately two to four years. Senior Loans typically have rates of interest which are redetermined periodically by reference to a base lending rate, plus a spread. These base lending rates are primarily the London Interbank Offered Rate (“LIBOR”) and secondarily, the prime rate offered by one or more major United States banks (the “Prime Rate”). Base lending rates may be subject to a floor, or minimum rate. |
| (11) | Amount is less than 0.05%. |
| 24 | See Notes to Financial Statements. |
Core Bond Portfolio
December 31, 2019
Portfolio of Investments — continued
| (12) | This Senior Loan will settle after December 31, 2019, at which time the interest rate will be determined. |
| (13) | Security exempt from registration under Section 4(2) of the Securities Act of 1933. Such securities may be sold in transactions exempt from registration only to dealers in that program or other “accredited investors.” At December 31, 2019, the aggregate value of these securities is $7,094,340, representing 1.2% of the Portfolio’s net assets. |
| (14) | Affiliated investment company, available to Eaton Vance portfolios and funds, which invests in high quality, U.S. dollar denominated money market instruments. The rate shown is the annualized seven-day yield as of December 31, 2019. |
| Futures Contracts | ||||||||||||||||||||
| Description | Number of Contracts | Position | Expiration Date | Notional Amount | Value/Unrealized Appreciation (Depreciation) | |||||||||||||||
Interest Rate Futures | ||||||||||||||||||||
| U.S. 2-Year Treasury Note | 235 | Long | 3/31/20 | $ | 50,642,500 | $ | (40,750 | ) | ||||||||||||
| U.S. 5-Year Treasury Note | 66 | Long | 3/31/20 | 7,828,219 | (35,163 | ) | ||||||||||||||
| U.S. Long Treasury Bond | 50 | Short | 3/20/20 | (7,795,312 | ) | 43,674 | ||||||||||||||
| U.S. Ultra 10-Year Treasury Note | 52 | Short | 3/20/20 | (7,316,563 | ) | 84,170 | ||||||||||||||
| U.S. Ultra-Long Treasury Bond | 233 | Long | 3/20/20 | 42,325,906 | (1,587,763 | ) | ||||||||||||||
| $ | (1,535,832 | ) | ||||||||||||||||||
Abbreviations:
| LIBOR | – | London Interbank Offered Rate | ||
| PPTT | – | Preferred Pass-Through Trust | ||
Currency Abbreviations:
| USD | – | United States Dollar | ||
| 25 | See Notes to Financial Statements. |
Core Bond Portfolio
December 31, 2019
Statement of Assets and Liabilities
| Assets | December 31, 2019 | |||
Unaffiliated investments, at value (identified cost, $562,909,669) | $ | 573,279,735 | ||
Affiliated investment, at value (identified cost, $22,271,976) | 22,272,569 | |||
Cash | 205,047 | |||
Deposits for derivatives collateral — financial futures contracts | 1,031,920 | |||
Interest receivable | 2,991,582 | |||
Dividends receivable from affiliated investment | 33,481 | |||
Receivable for investments sold | 88,083 | |||
Receivable from affiliate | 11,522 | |||
Total assets | $ | 599,913,939 | ||
| Liabilities | ||||
Payable for investments purchased | $ | 2,122,532 | ||
Payable for when-issued securities | 6,750,000 | |||
Payable for variation margin on open financial futures contracts | 233,832 | |||
Payable to affiliates: | ||||
Investment adviser fee | 225,449 | |||
Trustees’ fees | 6,758 | |||
Accrued expenses | 185,580 | |||
Total liabilities | $ | 9,524,151 | ||
Net Assets applicable to investors’ interest in Portfolio | $ | 590,389,788 | ||
| 26 | See Notes to Financial Statements. |
Core Bond Portfolio
December 31, 2019
Statement of Operations
| Investment Income | Year Ended December 31, 2019 | |||
Interest | $ | 17,888,252 | ||
Dividends from affiliated investment | 210,249 | |||
Total investment income | $ | 18,098,501 | ||
| Expenses | ||||
Investment adviser fee | $ | 2,428,571 | ||
Trustees’ fees and expenses | 29,363 | |||
Custodian fee | 147,277 | |||
Legal and accounting services | 88,903 | |||
Miscellaneous | 16,542 | |||
Total expenses | $ | 2,710,656 | ||
Deduct — | ||||
Allocation of expenses to affiliate | $ | 66,097 | ||
Total expense reductions | $ | 66,097 | ||
Net expenses | $ | 2,644,559 | ||
Net investment income | $ | 15,453,942 | ||
| Realized and Unrealized Gain (Loss) | ||||
Net realized gain (loss) — | ||||
Investment transactions | $ | 6,271,033 | ||
Investment transactions — affiliated investment | (2,283 | ) | ||
Financial futures contracts | 7,630,894 | |||
Net realized gain | $ | 13,899,644 | ||
Change in unrealized appreciation (depreciation) — | ||||
Investments | $ | 20,595,871 | ||
Investments — affiliated investment | 508 | |||
Financial futures contracts | (3,564,323 | ) | ||
Net change in unrealized appreciation (depreciation) | $ | 17,032,056 | ||
Net realized and unrealized gain | $ | 30,931,700 | ||
Net increase in net assets from operations | $ | 46,385,642 | ||
| 27 | See Notes to Financial Statements. |
Core Bond Portfolio
December 31, 2019
Statements of Changes in Net Assets
| Year Ended December 31, | ||||||||
| Increase (Decrease) in Net Assets | 2019 | 2018 | ||||||
From operations — | ||||||||
Net investment income | $ | 15,453,942 | $ | 14,523,505 | ||||
Net realized gain (loss) | 13,899,644 | (7,137,519 | ) | |||||
Net change in unrealized appreciation (depreciation) | 17,032,056 | (8,981,258 | ) | |||||
Net increase (decrease) in net assets from operations | $ | 46,385,642 | $ | (1,595,272 | ) | |||
Capital transactions — | ||||||||
Contributions | $ | 156,390,865 | $ | 86,298,166 | ||||
Withdrawals | (118,402,543 | ) | (58,051,164 | ) | ||||
Net increase in net assets from capital transactions | $ | 37,988,322 | $ | 28,247,002 | ||||
Net increase in net assets | $ | 84,373,964 | $ | 26,651,730 | ||||
| Net Assets | ||||||||
At beginning of year | $ | 506,015,824 | $ | 479,364,094 | ||||
At end of year | $ | 590,389,788 | $ | 506,015,824 | ||||
| 28 | See Notes to Financial Statements. |
Core Bond Portfolio
December 31, 2019
Financial Highlights
| Year Ended December 31, | ||||||||||||||||||||
| Ratios/Supplemental Data | 2019 | 2018 | 2017 | 2016 | 2015 | |||||||||||||||
Ratios (as a percentage of average daily net assets): | ||||||||||||||||||||
Expenses(1)(2) | 0.49 | % | 0.49 | % | 0.49 | % | 0.50 | % | 0.50 | % | ||||||||||
Net investment income | 2.86 | % | 2.98 | % | 2.46 | % | 2.01 | % | 2.00 | % | ||||||||||
Portfolio Turnover | 89 | % | 65 | % | 123 | % | 132 | %(3) | 159 | %(3) | ||||||||||
Total Return(2) | 9.28 | % | (0.50 | )% | 4.48 | % | 2.73 | % | 0.04 | % | ||||||||||
Net assets, end of year (000’s omitted) | $ | 590,390 | $ | 506,016 | $ | 479,364 | $ | 484,256 | $ | 342,684 | ||||||||||
| (1) | Excludes the effect of custody fee credits, if any, of less than 0.005%. Effective September 1, 2015, custody fee credits, which were earned on cash deposit balances, were discontinued by the custodian. |
| (2) | The investment adviser reimbursed certain operating expenses (equal to 0.01%, 0.02%, 0.01%, 0.01% and 0.02% of average daily net assets for the years ended December 31, 2019, 2018, 2017, 2016 and 2015, respectively). Absent this reimbursement, total return would be lower. |
| (3) | Includes the effect of To Be Announced (TBA) transactions. |
| 29 | See Notes to Financial Statements. |
Core Bond Portfolio
December 31, 2019
Notes to Financial Statements
1 Significant Accounting Policies
Core Bond Portfolio (the Portfolio) is a Massachusetts business trust registered under the Investment Company Act of 1940, as amended (the 1940 Act), as a diversified, open-end management investment company. The Portfolio’s investment objectives are to seek current income and total return. The Declaration of Trust permits the Trustees to issue interests in the Portfolio. At December 31, 2019, Eaton Vance Balanced Fund and Eaton Vance Core Bond Fund held an interest of 65.2% and 34.8%, respectively, in the Portfolio.
The following is a summary of significant accounting policies of the Portfolio. The policies are in conformity with accounting principles generally accepted in the United States of America (U.S. GAAP). The Portfolio is an investment company and follows accounting and reporting guidance in the Financial Accounting Standards Board (FASB) Accounting Standards Codification Topic 946.
A Investment Valuation— The following methodologies are used to determine the market value or fair value of investments.
Debt Obligations. Debt obligations are generally valued on the basis of valuations provided by third party pricing services, as derived from such services’ pricing models. Inputs to the models may include, but are not limited to, reported trades, executable bid and ask prices, broker/dealer quotations, prices or yields of securities with similar characteristics, interest rates, anticipated prepayments, benchmark curves or information pertaining to the issuer, as well as industry and economic events. The pricing services may use a matrix approach, which considers information regarding securities with similar characteristics to determine the valuation for a security. Short-term debt obligations purchased with a remaining maturity of sixty days or less for which a valuation from a third party pricing service is not readily available may be valued at amortized cost, which approximates fair value.
Senior Floating-Rate Loans. Interests in senior floating-rate loans (Senior Loans) for which reliable market quotations are readily available are valued generally at the average mean of bid and ask quotations obtained from a third party pricing service.
Derivatives. Financial futures contracts are valued at the closing settlement price established by the board of trade or exchange on which they are traded.
Affiliated Fund.The Portfolio may invest in Eaton Vance Cash Reserves Fund, LLC (Cash Reserves Fund), an affiliated investment company managed by Eaton Vance Management (EVM). While Cash Reserves Fund is not a registered money market mutual fund, it conducts all of its investment activities in accordance with the requirements of Rule 2a-7 under the 1940 Act. Investments in Cash Reserves Fund are valued at the closing net asset value per unit on the valuation day. Cash Reserves Fund generally values its investment securities based on available market quotations provided by a third party pricing service.
Fair Valuation.Investments for which valuations or market quotations are not readily available or are deemed unreliable are valued at fair value using methods determined in good faith by or at the direction of the Trustees of the Portfolio in a manner that most fairly reflects the security’s “fair value”, which is the amount that the Portfolio might reasonably expect to receive for the security upon its current sale in the ordinary course. Each such determination is based on a consideration of relevant factors, which are likely to vary from one pricing context to another. These factors may include, but are not limited to, the type of security, the existence of any contractual restrictions on the security’s disposition, the price and extent of public trading in similar securities of the issuer or of comparable companies or entities, quotations or relevant information obtained from broker/dealers or other market participants, information obtained from the issuer, analysts, and/or the appropriate stock exchange (for exchange-traded securities), an analysis of the company’s or entity’s financial statements, and an evaluation of the forces that influence the issuer and the market(s) in which the security is purchased and sold.
B Investment Transactions— Investment transactions for financial statement purposes are accounted for on a trade date basis. Realized gains and losses on investments sold are determined on the basis of identified cost.
C Income— Interest income is recorded on the basis of interest accrued, adjusted for amortization of premium or accretion of discount. Inflation adjustments to the principal amount of inflation-adjusted bonds and notes are reflected as interest income. Deflation adjustments to the principal amount of an inflation-adjusted bond or note are reflected as reductions to interest income to the extent of interest income previously recorded on such bond or note. Dividend income is recorded on the ex-dividend date for dividends received in cash and/or securities.
D Federal Taxes— The Portfolio has elected to be treated as a partnership for federal tax purposes. No provision is made by the Portfolio for federal or state taxes on any taxable income of the Portfolio because each investor in the Portfolio is ultimately responsible for the payment of any taxes on its share of taxable income. Since at least one of the Portfolio’s investors is a regulated investment company that invests all or substantially all of its assets in the Portfolio, the Portfolio normally must satisfy the applicable source of income and diversification requirements (under the Internal Revenue Code) in order for its investors to satisfy them. The Portfolio will allocate, at least annually among its investors, each investor’s distributive share of the Portfolio’s net investment income, net realized capital gains and losses and any other items of income, gain, loss, deduction or credit.
As of December 31, 2019, the Portfolio had no uncertain tax positions that would require financial statement recognition, de-recognition, or disclosure. The Portfolio files a U.S. federal income tax return annually after its fiscal year-end, which is subject to examination by the Internal Revenue Service for a period of three years from the date of filing.
E Unfunded Loan Commitments— The Portfolio may enter into certain loan agreements all or a portion of which may be unfunded. The Portfolio is obligated to fund these commitments at the borrower’s discretion. These commitments, if any, are disclosed in the accompanying Portfolio of Investments.
| 30 |
Core Bond Portfolio
December 31, 2019
Notes to Financial Statements — continued
F Use of Estimates— The preparation of the financial statements in conformity with U.S. GAAP requires management to make estimates and assumptions that affect the reported amounts of assets and liabilities at the date of the financial statements and the reported amounts of income and expense during the reporting period. Actual results could differ from those estimates.
G Indemnifications— Under the Portfolio’s organizational documents, its officers and Trustees may be indemnified against certain liabilities and expenses arising out of the performance of their duties to the Portfolio. Under Massachusetts law, if certain conditions prevail, interestholders in the Portfolio could be deemed to have personal liability for the obligations of the Portfolio. However, the Portfolio’s Declaration of Trust contains an express disclaimer of liability on the part of Portfolio interestholders. Additionally, in the normal course of business, the Portfolio enters into agreements with service providers that may contain indemnification clauses. The Portfolio’s maximum exposure under these arrangements is unknown as this would involve future claims that may be made against the Portfolio that have not yet occurred.
H Financial Futures Contracts— Upon entering into a financial futures contract, the Portfolio is required to deposit with the broker, either in cash or securities, an amount equal to a certain percentage of the contract amount (initial margin). Subsequent payments, known as variation margin, are made or received by the Portfolio each business day, depending on the daily fluctuations in the value of the underlying security, and are recorded as unrealized gains or losses by the Portfolio. Gains (losses) are realized upon the expiration or closing of the financial futures contracts. Should market conditions change unexpectedly, the Portfolio may not achieve the anticipated benefits of the financial futures contracts and may realize a loss. Futures contracts have minimal counterparty risk as they are exchange traded and the clearinghouse for the exchange is substituted as the counterparty, guaranteeing counterparty performance.
I When-Issued Securities and Delayed Delivery Transactions— The Portfolio may purchase or sell securities on a delayed delivery or when-issued basis. Payment and delivery may take place after the customary settlement period for that security. At the time the transaction is negotiated, the price of the security that will be delivered is fixed. The Portfolio maintains cash and/or security positions for these commitments such that sufficient liquid assets will be available to make payments upon settlement. Securities purchased on a delayed delivery or when-issued basis are marked-to-market daily and begin earning interest on settlement date. Losses may arise due to changes in the market value of the underlying securities or if the counterparty does not perform under the contract.
2 Investment Adviser Fee and Other Transactions with Affiliates
The investment adviser fee is earned by Boston Management and Research (BMR), a subsidiary of EVM, as compensation for investment advisory services rendered to the Portfolio. Pursuant to the investment advisory agreement and subsequent fee reduction agreement between the Portfolio and BMR, the fee is computed at an annual rate of 0.45% of the Portfolio’s average daily net assets up to $1 billion and at reduced rates on average daily net assets of $1 billion or more, and is payable monthly. The fee reduction cannot be terminated or reduced without the approval of a majority vote of the Trustees of the Portfolio who are not interested persons of BMR or the Portfolio and by the vote of a majority of the holders of interest in the Portfolio. For the year ended December 31, 2019, the Portfolio’s investment adviser fee amounted to $2,428,571 or 0.45% of the Portfolio’s average daily net assets. Pursuant to a voluntary expense reimbursement, BMR was allocated $66,097 of the Portfolio’s operating expenses for the year ended December 31, 2019. The Portfolio invests its cash in Cash Reserves Fund. EVM does not currently receive a fee for advisory services provided to Cash Reserves Fund.
Trustees and officers of the Portfolio who are members of EVM’s or BMR’s organizations receive remuneration for their services to the Portfolio out of the investment adviser fee. Trustees of the Portfolio who are not affiliated with the investment adviser may elect to defer receipt of all or a percentage of their annual fees in accordance with the terms of the Trustees Deferred Compensation Plan. For the year ended December 31, 2019, no significant amounts have been deferred. Certain officers and Trustees of the Portfolio are officers of the above organizations.
During the year ended December 31, 2019, BMR reimbursed the Portfolio $3,160 for a net realized loss due to a trading error. The amount of the reimbursement had an impact on total return of less than 0.01%.
3 Purchases and Sales of Investments
Purchases and sales of investments, other than short-term obligations and including maturities and paydowns, for the year ended December 31, 2019 were as follows:
| Purchases | Sales | |||||||
Investments (non-U.S. Government) | $ | 242,686,800 | $ | 234,936,201 | ||||
U.S. Government and Agency Securities | 270,397,163 | 229,906,169 | ||||||
| $ | 513,083,963 | $ | 464,842,370 | |||||
| 31 |
Core Bond Portfolio
December 31, 2019
Notes to Financial Statements — continued
4 Federal Income Tax Basis of Investments
The cost and unrealized appreciation (depreciation) of investments, including open derivative contracts, of the Portfolio at December 31, 2019, as determined on a federal income tax basis, were as follows:
Aggregate cost | $ | 585,844,864 | ||
Gross unrealized appreciation | $ | 10,993,003 | ||
Gross unrealized depreciation | (1,285,563 | ) | ||
Net unrealized appreciation | $ | 9,707,440 | ||
5 Financial Instruments
The Portfolio may trade in financial instruments with off-balance sheet risk in the normal course of its investing activities. These financial instruments may include futures contracts and may involve, to a varying degree, elements of risk in excess of the amounts recognized for financial statement purposes. The notional or contractual amounts of these instruments represent the investment the Portfolio has in particular classes of financial instruments and do not necessarily represent the amounts potentially subject to risk. The measurement of the risks associated with these instruments is meaningful only when all related and offsetting transactions are considered. A summary of obligations under these financial instruments at December 31, 2019 is included in the Portfolio of Investments. At December 31, 2019, the Portfolio had sufficient cash and/or securities to cover commitments under these contracts.
The Portfolio is subject to interest rate risk in the normal course of pursuing its investment objectives. Because the Portfolio holds fixed-rate bonds, the value of these bonds may decrease if interest rates rise. The Portfolio enters into U.S. Treasury futures contracts to hedge against fluctuations in interest rates.
The fair value of open derivative instruments (not considered to be hedging instruments for accounting disclosure purposes) and whose primary underlying risk exposure is interest rate risk at December 31, 2019 was as follows:
| Fair Value | ||||||||
| Derivative | Asset Derivative(1) | Liability Derivative(1) | ||||||
Financial futures contracts | $ | 127,844 | $ | (1,663,676 | ) | |||
| (1) | Only the current day’s variation margin on open futures contracts is reported within the Statement of Assets and Liabilities as Receivable or Payable for variation margin on open financial futures contracts, as applicable. |
The effect of derivative instruments (not considered to be hedging instruments for accounting disclosure purposes) on the Statement of Operations and whose primary underlying risk exposure is interest rate risk for the year ended December 31, 2019 was as follows:
| Derivative | Realized Gain (Loss) on Derivatives Recognized in Income(1) | Change in Unrealized Appreciation (Depreciation) on Derivatives Recognized in Income(2) | ||||||
Financial futures contracts | $ | 7,630,894 | $ | (3,564,323 | ) | |||
| (1) | Statement of Operations location: Net realized gain (loss) – Financial futures contracts. |
| (2) | Statement of Operations location: Change in unrealized appreciation (depreciation) – Financial futures contracts. |
The average notional cost of futures contracts outstanding during the year ended December 31, 2019, which is indicative of the volume of this derivative type, was approximately as follows:
| Futures Contracts — Long | Futures Contracts — Short | |||||
| $84,214,000 | $ | 12,198,000 | ||||
| 32 |
Core Bond Portfolio
December 31, 2019
Notes to Financial Statements — continued
6 Line of Credit
The Portfolio participates with other portfolios and funds managed by EVM and its affiliates in an $800 million unsecured line of credit agreement with a group of banks, which is in effect through October 27, 2020. In connection with the renewal of the agreement on October 29, 2019, funds managed by Calvert Research and Management, an affiliate of EVM, were added as participating funds to the agreement and the borrowing limit was increased from $625 million. Borrowings are made by the Portfolio solely to facilitate the handling of unusual and/or unanticipated short-term cash requirements. Interest is charged to the Portfolio based on its borrowings at an amount above either the Eurodollar rate or Federal Funds rate. In addition, a fee computed at an annual rate of 0.15% on the daily unused portion of the line of credit is allocated among the participating portfolios and funds at the end of each quarter. Because the line of credit is not available exclusively to the Portfolio, it may be unable to borrow some or all of its requested amounts at any particular time. The Portfolio did not have any significant borrowings or allocated fees during the year ended December 31, 2019.
7 Investments in Affiliated Funds
At December 31, 2019, the value of the Portfolio’s investment in affiliated funds was $22,272,569, which represents 3.8% of the Portfolio’s net assets. Transactions in affiliated funds by the Portfolio for the year ended December 31, 2019 were as follows:
| Name of affiliated fund | Value, beginning of period | Purchases | Sales proceeds | Net realized gain (loss) | Change in unrealized appreciation (depreciation) | Value, end of period | Dividend income | Units, end of period | ||||||||||||||||||||||||
Short-Term Investments | ||||||||||||||||||||||||||||||||
Eaton Vance Cash Reserves Fund, LLC, 1.78% | $ | 6,203,972 | $ | 299,923,118 | $ | (283,852,746 | ) | $ | (2,283 | ) | $ | 508 | $ | 22,272,569 | $ | 210,249 | 22,272,569 | |||||||||||||||
8 Fair Value Measurements
Under generally accepted accounting principles for fair value measurements, a three-tier hierarchy to prioritize the assumptions, referred to as inputs, is used in valuation techniques to measure fair value. The three-tier hierarchy of inputs is summarized in the three broad levels listed below.
| • | Level 1 – quoted prices in active markets for identical investments |
| • | Level 2 – other significant observable inputs (including quoted prices for similar investments, interest rates, prepayment speeds, credit risk, etc.) |
| • | Level 3 – significant unobservable inputs (including a fund’s own assumptions in determining the fair value of investments) |
In cases where the inputs used to measure fair value fall in different levels of the fair value hierarchy, the level disclosed is determined based on the lowest level input that is significant to the fair value measurement in its entirety. The inputs or methodology used for valuing securities are not necessarily an indication of the risk associated with investing in those securities.
| 33 |
Core Bond Portfolio
December 31, 2019
Notes to Financial Statements — continued
At December 31, 2019, the hierarchy of inputs used in valuing the Portfolio’s investments and open derivative instruments, which are carried at value, were as follows:
| Asset Description | Level 1 | Level 2 | Level 3 | Total | ||||||||||||
Corporate Bonds & Notes | $ | — | $ | 192,711,508 | $ | — | $ | 192,711,508 | ||||||||
Agency Mortgage-Backed Securities | — | 53,084,808 | — | 53,084,808 | ||||||||||||
Collateralized Mortgage Obligations | — | 41,147,121 | — | 41,147,121 | ||||||||||||
Commercial Mortgage-Backed Securities | — | 55,051,695 | — | 55,051,695 | ||||||||||||
Asset-Backed Securities | — | 105,681,615 | — | 105,681,615 | ||||||||||||
U.S. Treasury Obligations | — | 95,840,357 | — | 95,840,357 | ||||||||||||
Taxable Municipal Securities | — | 8,160,508 | — | 8,160,508 | ||||||||||||
Senior Floating-Rate Loans | — | 14,507,783 | — | 14,507,783 | ||||||||||||
Short-Term Investments — | ||||||||||||||||
Commercial Paper | — | 7,094,340 | — | 7,094,340 | ||||||||||||
Other | — | 22,272,569 | — | 22,272,569 | ||||||||||||
Total Investments | $ | — | $ | 595,552,304 | $ | — | $ | 595,552,304 | ||||||||
Futures Contracts | $ | 127,844 | $ | — | $ | — | $ | 127,844 | ||||||||
Total | $ | 127,844 | $ | 595,552,304 | $ | — | $ | 595,680,148 | ||||||||
Liability Description | ||||||||||||||||
Futures Contracts | $ | (1,663,676 | ) | $ | — | $ | — | $ | (1,663,676 | ) | ||||||
Total | $ | (1,663,676 | ) | $ | — | $ | — | $ | (1,663,676 | ) | ||||||
| 34 |
Core Bond Portfolio
December 31, 2019
Report of Independent Registered Public Accounting Firm
To the Trustees and Investors of Core Bond Portfolio:
Opinion on the Financial Statements and Financial Highlights
We have audited the accompanying statement of assets and liabilities of Core Bond Portfolio (the “Portfolio”), including the portfolio of investments, as of December 31, 2019, the related statement of operations for the year then ended, the statements of changes in net assets for each of the two years in the period then ended, the financial highlights for each of the five years in the period then ended, and the related notes. In our opinion, the financial statements and financial highlights present fairly, in all material respects, the financial position of the Portfolio as of December 31, 2019, and the results of its operations for the year then ended, the changes in its net assets for each of the two years in the period then ended, and the financial highlights for each of the five years in the period then ended, in conformity with accounting principles generally accepted in the United States of America.
Basis for Opinion
These financial statements and financial highlights are the responsibility of the Portfolio’s management. Our responsibility is to express an opinion on the Portfolio’s financial statements and financial highlights based on our audits. We are a public accounting firm registered with the Public Company Accounting Oversight Board (United States) (PCAOB) and are required to be independent with respect to the Portfolio in accordance with the U.S. federal securities laws and the applicable rules and regulations of the Securities and Exchange Commission and the PCAOB.
We conducted our audits in accordance with the standards of the PCAOB. Those standards require that we plan and perform the audit to obtain reasonable assurance about whether the financial statements and financial highlights are free of material misstatement, whether due to error or fraud. The Portfolio is not required to have, nor were we engaged to perform, an audit of its internal control over financial reporting. As part of our audits we are required to obtain an understanding of internal control over financial reporting but not for the purpose of expressing an opinion on the effectiveness of the Portfolio’s internal control over financial reporting. Accordingly, we express no such opinion.
Our audits included performing procedures to assess the risks of material misstatement of the financial statements and financial highlights, whether due to error or fraud, and performing procedures that respond to those risks. Such procedures included examining, on a test basis, evidence regarding the amounts and disclosures in the financial statements and financial highlights. Our audits also included evaluating the accounting principles used and significant estimates made by management, as well as evaluating the overall presentation of the financial statements and financial highlights. Our procedures included confirmation of securities and senior loans owned as of December 31, 2019, by correspondence with the custodian, brokers and selling or agent banks; when replies were not received from brokers and selling or agent banks, we performed other auditing procedures. We believe that our audits provide a reasonable basis for our opinion.
/s/ Deloitte & Touche LLP
Boston, Massachusetts
February 24, 2020
We have served as the auditor of one or more Eaton Vance investment companies since 1959.
| 35 |
Eaton Vance
Core Bond Fund
December 31, 2019
Management and Organization
Fund Management. The Trustees of Eaton Vance Special Investment Trust (the Trust) and Core Bond Portfolio (the Portfolio) are responsible for the overall management and supervision of the Trust’s and Portfolio’s affairs. The Trustees and officers of the Trust and the Portfolio are listed below. Except as indicated, each individual has held the office shown or other offices in the same company for the last five years. Trustees and officers of the Trust and the Portfolio hold indefinite terms of office. The “noninterested Trustees” consist of those Trustees who are not “interested persons” of the Trust and the Portfolio, as that term is defined under the 1940 Act. The business address of each Trustee and officer is Two International Place, Boston, Massachusetts 02110. As used below, “EVC” refers to Eaton Vance Corp., “EV” refers to Eaton Vance, Inc., “EVM” refers to Eaton Vance Management, “BMR” refers to Boston Management and Research and “EVD” refers to Eaton Vance Distributors, Inc. EVC and EV are the corporate parent and trustee, respectively, of EVM and BMR. EVD is the Fund’s principal underwriter, the Portfolio’s placement agent and a wholly-owned subsidiary of EVC. Each officer affiliated with Eaton Vance may hold a position with other Eaton Vance affiliates that is comparable to his or her position with EVM listed below. Each Trustee oversees 159 portfolios in the Eaton Vance Complex (including all master and feeder funds in a master feeder structure). Each officer serves as an officer of certain other Eaton Vance funds. Each Trustee and officer serves until his or her successor is elected.
| Name and Year of Birth | Position(s) with the Trust and the Portfolio | Trustee Since(1) | Principal Occupation(s) and Directorships During Past Five Years and Other Relevant Experience | |||
| Interested Trustee | ||||||
Thomas E. Faust Jr. 1958 | Trustee | 2007 | Chairman, Chief Executive Officer and President of EVC, Director and President of EV, Chief Executive Officer and President of EVM and BMR, and Director of EVD. Trustee and/or officer of 159 registered investment companies. Mr. Faust is an interested person because of his positions with EVM, BMR, EVD, EVC and EV, which are affiliates of the Trust and the Portfolio. Directorships in the Last Five Years. Director of EVC and Hexavest Inc. (investment management firm). | |||
| Noninterested Trustees | ||||||
Mark R. Fetting 1954 | Trustee | 2016 | Private investor. Formerly held various positions at Legg Mason, Inc. (investment management firm) (2000-2012), including President, Chief Executive Officer, Director and Chairman (2008-2012), Senior Executive Vice President(2004-2008) and Executive Vice President (2001-2004). Formerly, President of Legg Mason family of funds (2001-2008). Formerly, Division President and Senior Officer of Prudential Financial Group, Inc. and related companies (investment management firm) (1991-2000). Other Directorships in the Last Five Years. None. | |||
Cynthia E. Frost 1961 | Trustee | 2014 | Private investor. Formerly, Chief Investment Officer of Brown University (university endowment) (2000-2012). Formerly, Portfolio Strategist for Duke Management Company (university endowment manager) (1995-2000). Formerly, Managing Director, Cambridge Associates (investment consulting company) (1989-1995). Formerly, Consultant, Bain and Company (management consulting firm)(1987-1989). Formerly, Senior Equity Analyst, BA Investment Management Company (1983-1985). Other Directorships in the Last Five Years. None. | |||
George J. Gorman 1952 | Trustee | 2014 | Principal at George J. Gorman LLC (consulting firm). Formerly, Senior Partner at Ernst & Young LLP (a registered public accounting firm) (1974-2009). Other Directorships in the Last Five Years. Formerly, Trustee of the BofA Funds Series Trust (11 funds) (2011-2014) and of the Ashmore Funds (9 funds)(2010-2014). | |||
Valerie A. Mosley 1960 | Trustee | 2014 | Chairwoman and Chief Executive Officer of Valmo Ventures (a consulting and investment firm). Former Partner and Senior Vice President, Portfolio Manager and Investment Strategist at Wellington Management Company, LLP (investment management firm) (1992-2012). Former Chief Investment Officer, PG Corbin Asset Management (1990-1992). Formerly worked in institutional corporate bond sales at Kidder Peabody (1986-1990). Other Directorships in the Last Five Years. Director of Envestnet, Inc. (provider of intelligent systems for wealth management and financial wellness) (since 2018). Director of Dynex Capital, Inc. (mortgage REIT) (since 2013). | |||
| 36 |
Eaton Vance
Core Bond Fund
December 31, 2019
Management and Organization — continued
| Name and Year of Birth | Position(s) with the Trust and the Portfolio | Trustee Since(1) | Principal Occupation(s) and Directorships During Past Five Years and Other Relevant Experience | |||
| Noninterested Trustees (continued) | ||||||
William H. Park 1947 | Chairperson of the Board and Trustee | 2016 (Chairperson) 2003 (Trustee) | Private investor. Formerly, Consultant (management and transactional)(2012-2014). Formerly, Chief Financial Officer, Aveon Group L.P. (investment management firm) (2010-2011). Formerly, Vice Chairman, Commercial Industrial Finance Corp. (specialty finance company) (2006-2010). Formerly, President and Chief Executive Officer, Prizm Capital Management, LLC (investment management firm) (2002-2005). Formerly, Executive Vice President and Chief Financial Officer, United Asset Management Corporation (investment management firm) (1982-2001). Formerly, Senior Manager, Price Waterhouse (now PricewaterhouseCoopers) (a registered public accounting firm)(1972-1981). Other Directorships in the Last Five Years. None. | |||
Helen Frame Peters 1948 | Trustee | 2008 | Professor of Finance, Carroll School of Management, Boston College. Formerly, Dean, Carroll School of Management, Boston College (2000-2002). Formerly, Chief Investment Officer, Fixed Income, Scudder Kemper Investments (investment management firm) (1998-1999). Formerly, Chief Investment Officer, Equity and Fixed Income, Colonial Management Associates (investment management firm) (1991-1998). Other Directorships in the Last Five Years. None. | |||
Keith Quinton 1958 | Trustee | 2018 | Independent Investment Committee Member at New Hampshire Retirement System (since 2017). Advisory Committee member at Northfield Information Services, Inc. (risk management analytics provider) (since 2016). Formerly, Portfolio Manager and Senior Quantitative Analyst at Fidelity Investments (investment management firm) (2001-2014). Other Directorships in the Last Five Years. Director of New Hampshire Municipal Bond Bank (since 2016). | |||
Marcus L. Smith 1966 | Trustee | 2018 | Member of Posse Boston Advisory Board (foundation) (since 2015). Trustee at University of Mount Union (since 2008). Formerly, Portfolio Manager at MFS Investment Management (investment management firm) (1994-2017). Other Directorships in the Last Five Years. Director of MSCI Inc. (global provider of investment decision support tools) (since 2017). Formerly, Director of DCT Industrial Trust Inc. (logistics real estate company) (2017-2018). | |||
Susan J. Sutherland 1957 | Trustee | 2015 | Private investor. Formerly, Associate, Counsel and Partner at Skadden, Arps, Slate, Meagher & Flom LLP (law firm) (1982-2013). Other Directorships in the Last Five Years. Formerly, Director of Montpelier Re Holdings Ltd. (global provider of customized insurance and reinsurance products) (2013-2015). | |||
Scott E. Wennerholm 1959 | Trustee | 2016 | Formerly, Trustee at Wheelock College (postsecondary institution) (2012-2018). Formerly, Consultant at GF Parish Group (executive recruiting firm)(2016-2017). Formerly, Chief Operating Officer and Executive Vice President at BNY Mellon Asset Management (investment management firm) (2005-2011). Formerly, Chief Operating Officer and Chief Financial Officer at Natixis Global Asset Management (investment management firm) (1997-2004). Formerly, Vice President at Fidelity Investments Institutional Services (investment management firm) (1994-1997). Other Directorships in the Last Five Years. None. | |||
| Name and Year of Birth | Position(s) and the Portfolio | Officer Since(2) | Principal Occupation(s) During Past Five Years | |||
| Principal Officers who are not Trustees | ||||||
Payson F. Swaffield 1956 | President | 2003 | Vice President and Chief Income Investment Officer of EVM and BMR. Also Vice President of Calvert Research and Management (“CRM”). | |||
| 37 |
Eaton Vance
Core Bond Fund
December 31, 2019
Management and Organization — continued
| Name and Year of Birth | Position(s) and the Portfolio | Officer Since(2) | Principal Occupation(s) During Past Five Years | |||
| Principal Officers who are not Trustees (continued) | ||||||
Maureen A. Gemma 1960 | Vice President, Secretary and Chief Legal Officer | 2005 | Vice President of EVM and BMR. Also Vice President of CRM. | |||
James F. Kirchner 1967 | Treasurer | 2007 | Vice President of EVM and BMR. Also Vice President of CRM. | |||
Richard F. Froio 1968 | Chief Compliance Officer | 2017 | Vice President of EVM and BMR since 2017. Formerly, Deputy Chief Compliance Officer (Adviser/Funds) and Chief Compliance Officer (Distribution) at PIMCO (2012-2017) and Managing Director at BlackRock/Barclays Global Investors (2009-2012). | |||
| (1) | Year first appointed to serve as Trustee for a fund in the Eaton Vance family of funds. Each Trustee has served continuously since appointment unless indicated otherwise. |
| (2) | Year first elected to serve as officer of a fund in the Eaton Vance family of funds when the officer has served continuously. Otherwise, year of most recent election as an officer of a fund in the Eaton Vance family of funds. Titles may have changed since initial election. |
The SAI for the Fund includes additional information about the Trustees and officers of the Fund and the Portfolio and can be obtained without charge on Eaton Vance’s website at www.eatonvance.com or by calling 1-800-262-1122.
| 38 |
Eaton Vance Funds
IMPORTANT NOTICES
Privacy. The Eaton Vance organization is committed to ensuring your financial privacy. Each entity listed below has adopted a privacy policy and procedures (“Privacy Program”) Eaton Vance believes is reasonably designed to protect your personal information and to govern when and with whom Eaton Vance may share your personal information.
| • | At the time of opening an account, Eaton Vance generally requires you to provide us with certain information such as name, address, social security number, tax status, account numbers, and account balances. This information is necessary for us to both open an account for you and to allow us to satisfy legal requirements such as applicable anti-money laundering reviews and know-your-customer requirements. |
| • | On an ongoing basis, in the normal course of servicing your account, Eaton Vance may share your information with unaffiliated third parties that perform various services for Eaton Vance and/or your account. These third parties include transfer agents, custodians, broker/dealers and our professional advisers, including auditors, accountants, and legal counsel. Eaton Vance may additionally share your personal information with our affiliates. |
| • | We believe our Privacy Program is reasonably designed to protect the confidentiality of your personal information and to prevent unauthorized access to that information. |
| • | We reserve the right to change our Privacy Program at any time upon proper notification to you. You may want to review our Privacy Program periodically for changes by accessing the link on our homepage: www.eatonvance.com. |
Our pledge of protecting your personal information applies to the following entities within the Eaton Vance organization: the Eaton Vance Family of Funds, Eaton Vance Management, Eaton Vance Investment Counsel, Eaton Vance Distributors, Inc., Eaton Vance Trust Company, Eaton Vance Management (International) Limited, Eaton Vance Advisers International Limited, Eaton Vance Global Advisors Limited, Eaton Vance Management’s Real Estate Investment Group, Boston Management and Research, Calvert Research and Management, and Calvert Funds. This Privacy Notice supersedes all previously issued privacy disclosures. For more information about our Privacy Program or about how your personal information may be used, please call 1-800-262-1122.
Delivery of Shareholder Documents. The Securities and Exchange Commission (SEC) permits funds to deliver only one copy of shareholder documents, including prospectuses, proxy statements and shareholder reports, to fund investors with multiple accounts at the same residential or post office box address. This practice is often called “householding” and it helps eliminate duplicate mailings to shareholders.Eaton Vance, or your financial intermediary, may household the mailing of your documents indefinitely unless you instruct Eaton Vance, or your financial intermediary, otherwise.If you would prefer that your Eaton Vance documents not be householded, please contact Eaton Vanceat 1-800-262-1122, or contact your financial intermediary. Your instructions that householding not apply to delivery of your Eaton Vance documents will typically be effective within 30 days of receipt by Eaton Vance or your financial intermediary.
Portfolio Holdings. Each Eaton Vance Fund and its underlying Portfolio(s) (if applicable) files a schedule of portfolio holdings on Part F toForm N-PORT with the SEC for the first and third quarters of each fiscal year. The Form N-PORT will be available on the Eaton Vance website at www.eatonvance.com, by calling Eaton Vance at 1-800-262-1122 or in the EDGAR database on the SEC’s website at www.sec.gov.
Proxy Voting. From time to time, funds are required to vote proxies related to the securities held by the funds. The Eaton Vance Funds or their underlying Portfolios (if applicable) vote proxies according to a set of policies and procedures approved by the Funds’ and Portfolios’ Boards. You may obtain a description of these policies and procedures and information on how the Funds or Portfolios voted proxies relating to portfolio securities during the most recent 12-month period ended June 30, without charge, upon request, by calling 1-800-262-1122 and by accessing the SEC’s website at www.sec.gov.
| 39 |
This Page Intentionally Left Blank
Investment Adviser of Core Bond Portfolio
Boston Management and Research
Two International Place
Boston, MA 02110
Administrator of Eaton Vance Core Bond Fund
Eaton Vance Management
Two International Place
Boston, MA 02110
Principal Underwriter*
Eaton Vance Distributors, Inc.
Two International Place
Boston, MA 02110
(617) 482-8260
Custodian
State Street Bank and Trust Company
State Street Financial Center, One Lincoln Street
Boston, MA 02111
Transfer Agent
BNY Mellon Investment Servicing (US) Inc.
Attn: Eaton Vance Funds
P.O. Box 9653
Providence, RI 02940-9653
(800) 262-1122
Independent Registered Public Accounting Firm
Deloitte & Touche LLP
200 Berkeley Street
Boston, MA 02116-5022
Fund Offices
Two International Place
Boston, MA 02110
| * | FINRA BrokerCheck. Investors may check the background of their Investment Professional by contacting the Financial Industry Regulatory Authority (FINRA). FINRA BrokerCheck is a free tool to help investors check the professional background of current and former FINRA-registered securities firms and brokers. FINRA BrokerCheck is available by calling 1-800-289-9999 and at www.FINRA.org. The FINRA BrokerCheck brochure describing this program is available to investors at www.FINRA.org. |

2978 12.31.19

Eaton Vance
Dividend Builder Fund
Annual Report
December 31, 2019
Important Note. Beginning on January 1, 2021, as permitted by regulations adopted by the Securities and Exchange Commission, paper copies of the Fund’s annual and semi-annual shareholder reports will no longer be sent by mail unless you specifically request paper copies of the reports. Instead, the reports will be made available on the Fund’s website (eatonvance.com/funddocuments), and you will be notified by mail each time a report is posted and provided with a website address to access the report.
If you already elected to receive shareholder reports electronically, you will not be affected by this change and you need not take any action. If you are a direct investor, you may elect to receive shareholder reports and other communications from the Fund electronically by signing up for e-Delivery at eatonvance.com/edelivery. If you own your shares through a financial intermediary (such as a broker-dealer or bank), you must contact your financial intermediary to sign up.
You may elect to receive all future Fund shareholder reports in paper free of charge. If you are a direct investor, you can inform the Fund that you wish to continue receiving paper copies of your shareholder reports by calling 1-800-262-1122. If you own these shares through a financial intermediary, you must contact your financial intermediary or follow instructions included with this disclosure, if applicable, to elect to continue to receive paper copies of your shareholder reports. Your election to receive reports in paper will apply to all Eaton Vance funds held directly or to all funds held through your financial intermediary, as applicable.

Commodity Futures Trading Commission Registration. Effective December 31, 2012, the Commodity Futures Trading Commission (“CFTC”) adopted certain regulatory changes that subject registered investment companies and advisers to regulation by the CFTC if a fund invests more than a prescribed level of its assets in certain CFTC-regulated instruments (including futures, certain options and swap agreements) or markets itself as providing investment exposure to such instruments. The Fund has claimed an exclusion from the definition of the term “commodity pool operator” under the Commodity Exchange Act. Accordingly, neither the Fund nor the adviser with respect to the operation of the Fund is subject to CFTC regulation. Because of its management of other strategies, the Fund’s adviser is registered with the CFTC as a commodity pool operator and a commodity trading advisor.
Fund shares are not insured by the FDIC and are not deposits or other obligations of, or guaranteed by, any depository institution. Shares are subject to investment risks, including possible loss of principal invested.
This report must be preceded or accompanied by a current summary prospectus or prospectus. Before investing, investors should consider carefully the investment objective, risks, and charges and expenses of a mutual fund. This and other important information is contained in the summary prospectus and prospectus, which can be obtained from a financial intermediary. Prospective investors should read the prospectus carefully before investing. For further information, please call 1-800-262-1122.
Annual ReportDecember 31, 2019
Eaton Vance
Dividend Builder Fund
Table of Contents
Management’s Discussion of Fund Performance | 2 | |||
Performance | 3 | |||
Fund Profile | 4 | |||
Endnotes and Additional Disclosures | 5 | |||
Fund Expenses | 6 | |||
Financial Statements | 7 | |||
Report of Independent Registered Public Accounting Firm | 22 | |||
Federal Tax Information | 23 | |||
Management and Organization | 24 | |||
Important Notices | 26 | |||
Eaton Vance
Dividend Builder Fund
December 31, 2019
Management’s Discussion of Fund Performance1
Economic and Market Conditions
With virtually every U.S. equity index posting strong double-digit returns for the12-month period ended December 31, 2019 — and bond markets solidly in the black as well — 2019 was a good year for investments.
As the new year dawned in January 2019, investors appeared to be taking a “glass is half full” approach. Although U.S. manufacturing output and business investment remained weak — held back by slowing global growth and anon-again/off-again U.S.-China trade war — strong spending by U.S. consumers and dovish remarks by the U.S. Federal Reserve (the Fed) combined to lift investor sentiment. After four federal funds rate hikes the previous year, markets began to project the Fed might actually lower rates in 2019 to stimulate the economy. U.S. unemployment, meanwhile, remained low and hiring remained strong.
As a result, U.S. stocks across multiple markets climbed from January through April 2019. Overseas, central banks around the world began to cut interest rates and employ other tools to stimulate their respective economies. Even a global stock pullback in May — sparked by heightened concerns about the U.S.-China trade spat — proved to be temporary, and the U.S. and global stock rallies resumed in June and July.
After holding interest rates steady through the first half of the year, the Fed cut the federal funds rate on July 31, 2019 — its first reduction in over a decade — followed by two additional rate cuts in September and October to end the period at1.50%-1.75%. By end of the third quarter, 60 central banks around the world had lowered their interest rates as well.
After falling in August, U.S. equities rallied again during the final months of the period, spurred by optimism about a U.S.-China trade détente and better-than-expected U.S. employment reports. The year ended with two events in December that did much to allay investor concerns about international trade and tariffs: passage of the United States-Mexico-Canada Agreement by the U.S. House of Representatives and the Trump administration’s agreement to aso-called “phase–one” trade deal with China.
During the12-month period ended December 31, 2019, the blue-chip Dow Jones Industrial Average®2 returned 25.34%, while the broader U.S. equity market, as measured by the S&P 500® Index, returned 31.49%. The technology-laden Nasdaq Composite Index returned 36.69% during the period.Large-cap U.S. stocks, as measured by the S&P 500® Index, generally outperformed theirsmall-cap counterparts, as measured by the Russell 2000® Index. As a group, growth stocks outpaced value stocks in both large- andsmall-cap categories, as measured by the Russell growth and value indexes.
Fund Performance
For the12-month period ended December 31, 2019, Eaton Vance Dividend Builder Fund (the Fund) returned 31.09% for Class A shares at net asset value (NAV), underperforming its benchmark, the S&P 500® Index (the Index), which returned 31.49%.
The Fund’s underperformance of the Index resulted from sector and industry allocations, which narrowly outweighed the positive effect from stock selection.
The utilities sector was the largest detractor from relative Fund performance versus the Index due to stock selection. Within the sector, electric utility company Duke Energy Corp. underperformed its peers due to operational struggles at some of the company’s power plants.
The communication services sector also detracted from Fund performance relative to the Index during the period due to stock selection. In the diversified telecommunications industry, Verizon Telecommunications, Inc. was among the Fund’s worst-performing individual stocks, as investors shunned the traditionally defensive stock amid a strong market rally led by growth stocks.
An underweight in the outperforming information technology (IT) sector also constrained relative Fund returns during the period. In the lagging IT services industry, global IT services provider Cognizant Technology Solutions Corp. was the Fund’s worst-performing stock amid slowing sales growth. An overweight position in the underperforming communications equipment industry also hurt Fund performance relative to the Index during the period.
On the positive side, the health care sector contributed most to Fund results relative to the Index due to stock selection. In the outperforming health care equipment & supplies industry, Danaher Corp., a leading medical technology company, was among the Fund’s top individual stocks after earnings exceeded expectations. Stock selections in the health care providers & services industry and the biotechnology industry also boosted relative Fund results versus the Index during the period.
Stock selections in the financials sector also contributed to Fund performance relative to the Index during the period. JPMorgan Chase & Co., the largest U.S. bank, was among the Fund’s individual stock leaders due to improved investor sentiment amid subsiding recession fears. Market data giant S&P Global, Inc. was also among the Fund’s leading stocks behind strong growth and high earnings forecast. The Fund’s lack of exposure to the lagging diversified financial services industry also contributed to relative Fund performance versus the Index during the period.
Stock selections in the industrials sector aided relative Fund performance versus the Index during the period. Within the sector, the aerospace & defense industry recorded notable results. Defense giant Lockheed Martin Corp. was among the Fund’s leading individual stocks after it beat earnings forecasts.
The Fund’s top stock overall was semiconductor manufacturer QUALCOMM, Inc. (QUALCOMM), which gained investor interest after the company announced an agreement with its largest customer, Apple, Inc., on licensing fees. Byperiod-end, QUALCOMM was sold from the Fund.
See Endnotes and Additional Disclosures in this report.
Past performance is no guarantee of future results. Returns are historical and are calculated by determining the percentage change in net asset value (NAV) or offering price (as applicable) with all distributions reinvested. Investment return and principal value will fluctuate so that shares, when redeemed, may be worth more or less than their original cost. Performance for periods less than or equal to one year is cumulative. Performance is for the stated time period only; due to market volatility, current Fund performance may be lower or higher than the quoted return. For performance as of the most recentmonth-end, please refer to eatonvance.com.
| 2 |
Eaton Vance
Dividend Builder Fund
December 31, 2019
Performance2,3
Portfolio Manager Charles B. Gaffney
| % Average Annual Total Returns | Class Inception Date | Performance Inception Date | One Year | Five Years | Ten Years | |||||||||||||||
Class A at NAV | 12/18/1981 | 12/18/1981 | 31.09 | % | 10.62 | % | 11.25 | % | ||||||||||||
Class A with 5.75% Maximum Sales Charge | — | — | 23.58 | 9.31 | 10.59 | |||||||||||||||
Class C at NAV | 11/01/1993 | 12/18/1981 | 30.13 | 9.79 | 10.41 | |||||||||||||||
Class C with 1% Maximum Sales Charge | — | — | 29.13 | 9.79 | 10.41 | |||||||||||||||
Class I at NAV | 06/20/2005 | 12/18/1981 | 31.44 | 10.89 | 11.52 | |||||||||||||||
S&P 500® Index | — | — | 31.49 | % | 11.69 | % | 13.55 | % | ||||||||||||
| % Total Annual Operating Expense Ratios4 | Class A | Class C | Class I | |||||||||
| 1.02 | % | 1.77 | % | 0.77 | % | |||||||
Growth of $10,000
This graph shows the change in value of a hypothetical investment of $10,000 in Class A of the Fund for the period indicated. For comparison, the same investment is shown in the indicated index.
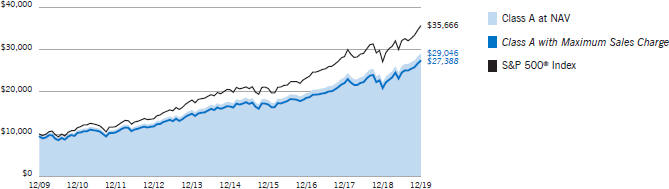
| Growth of Investment | Amount Invested | Period Beginning | At NAV | With Maximum Sales Charge | ||||||||||||
Class C | $ | 10,000 | 12/31/2009 | $ | 26,944 | N.A. | ||||||||||
Class I | $ | 250,000 | 12/31/2009 | $ | 744,510 | N.A. | ||||||||||
See Endnotes and Additional Disclosures in this report.
Past performance is no guarantee of future results. Returns are historical and are calculated by determining the percentage change in net asset value (NAV) or offering price (as applicable) with all distributions reinvested. Investment return and principal value will fluctuate so that shares, when redeemed, may be worth more or less than their original cost. Performance for periods less than or equal to one year is cumulative. Performance is for the stated time period only; due to market volatility, current Fund performance may be lower or higher than the quoted return. For performance as of the most recentmonth-end, please refer to eatonvance.com.
| 3 |
Eaton Vance
Dividend Builder Fund
December 31, 2019
Fund Profile
Sector Allocation (% of net assets)5
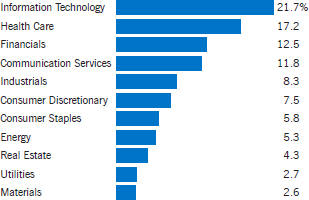
Top 10 Holdings (% of net assets)5
Microsoft Corp. | 5.4 | % | ||
Apple, Inc. | 4.7 | |||
Johnson & Johnson | 2.7 | |||
AbbVie, Inc. | 2.3 | |||
UnitedHealth Group, Inc. | 2.3 | |||
JPMorgan Chase & Co. | 2.3 | |||
PepsiCo, Inc. | 2.2 | |||
Visa, Inc., Class A | 2.2 | |||
Broadcom, Inc. | 2.0 | |||
Medtronic PLC | 2.0 | |||
Total | 28.1 | % | ||
See Endnotes and Additional Disclosures in this report.
| 4 |
Eaton Vance
Dividend Builder Fund
December 31, 2019
Endnotes and Additional Disclosures
| 1 | The views expressed in this report are those of the portfolio manager(s) and are current only through the date stated at the top of this page. These views are subject to change at any time based upon market or other conditions, and Eaton Vance and the Fund(s) disclaim any responsibility to update such views. These views may not be relied upon as investment advice and, because investment decisions are based on many factors, may not be relied upon as an indication of trading intent on behalf of any Eaton Vance fund. This commentary may contain statements that are not historical facts, referred to as “forward looking statements.” The Fund’s actual future results may differ significantly from those stated in any forward looking statement, depending on factors such as changes in securities or financial markets or general economic conditions, the volume of sales and purchases of Fund shares, the continuation of investment advisory, administrative and service contracts, and other risks discussed from time to time in the Fund’s filings with the Securities and Exchange Commission. |
| 2 | Dow Jones Industrial Average®is a price-weighted average of 30 blue-chip stocks that are generally the leaders in their industry. S&P 500®Index is an unmanaged index of large- cap stocks commonly used as a measure of U.S. stock market performance. S&P Dow Jones Indices are a product of S&P Dow Jones Indices LLC (“S&P DJI”) and have been licensed for use. S&P®and S&P 500®are registered trademarks of S&P DJI; Dow Jones®is a registered trademark of Dow Jones Trademark Holdings LLC (“Dow Jones”); S&P DJI, Dow Jones and their respective affiliates do not sponsor, endorse, sell or promote the Fund, will not have any liability with respect thereto and do not have any liability for any errors, omissions, or interruptions of the S&P Dow Jones Indices. Nasdaq Composite Index is a market capitalization- weighted index of all domestic and international securities listed on Nasdaq. Source: Nasdaq, Inc. The information is provided by Nasdaq (with its affiliates, are referred to as the “Corporations”) and Nasdaq’s third party licensors on an “as is” basis and the Corporations make no guarantees and bear no liability of any kind with respect to the information or the Fund. Russell 2000®Index is an unmanaged index of 2,000 U.S.small-cap stocks. Unless otherwise stated, index returns do not reflect the effect of any applicable sales charges, commissions, expenses, taxes or leverage, as applicable. It is not possible to invest directly in an index. |
| 3 | Total Returns at NAV do not include applicable sales charges. If sales charges were deducted, the returns would be lower. Total Returns shown with maximum sales charge reflect the stated maximum sales charge. Unless otherwise stated, performance does not reflect the deduction of taxes on Fund distributions or redemptions of Fund shares. |
| 4 | Source: Fund prospectus. The expense ratios for the current reporting period can be found in the Financial Highlights section of this report. |
| 5 | Excludes cash and cash equivalents. |
Fund profile subject to change due to active management. |
| 5 |
Eaton Vance
Dividend Builder Fund
December 31, 2019
Fund Expenses
Example: As a Fund shareholder, you incur two types of costs: (1) transaction costs, including sales charges (loads) on purchases and redemption fees (if applicable); and (2) ongoing costs, including management fees; distribution and/or service fees; and other Fund expenses. This Example is intended to help you understand your ongoing costs (in dollars) of Fund investing and to compare these costs with the ongoing costs of investing in other mutual funds. The Example is based on an investment of $1,000 invested at the beginning of the period and held for the entire period (July 1, 2019 – December 31, 2019).
Actual Expenses: The first section of the table below provides information about actual account values and actual expenses. You may use the information in this section, together with the amount you invested, to estimate the expenses that you paid over the period. Simply divide your account value by $1,000 (for example, an $8,600 account value divided by $1,000 = 8.6), then multiply the result by the number in the first section under the heading entitled “Expenses Paid During Period” to estimate the expenses you paid on your account during this period.
Hypothetical Example for Comparison Purposes: The second section of the table below provides information about hypothetical account values and hypothetical expenses based on the actual Fund expense ratio and an assumed rate of return of 5% per year (before expenses), which is not the actual Fund return. The hypothetical account values and expenses may not be used to estimate the actual ending account balance or expenses you paid for the period. You may use this information to compare the ongoing costs of investing in your Fund and other funds. To do so, compare this 5% hypothetical example with the 5% hypothetical examples that appear in the shareholder reports of the other funds.
Please note that the expenses shown in the table are meant to highlight your ongoing costs only and do not reflect any transactional costs, such as sales charges (loads) or redemption fees (if applicable). Therefore, the second section of the table is useful in comparing ongoing costs only, and will not help you determine the relative total costs of owning different funds. In addition, if these transactional costs were included, your costs would be higher.
| Beginning Account Value (7/1/19) | Ending Account Value (12/31/19) | Expenses Paid During Period* (7/1/19 – 12/31/19) | Annualized Expense Ratio | |||||||||||||
Actual | ||||||||||||||||
Class A | $ | 1,000.00 | $ | 1,115.60 | $ | 5.39 | 1.01 | % | ||||||||
Class C | $ | 1,000.00 | $ | 1,111.20 | $ | 9.37 | 1.76 | % | ||||||||
Class I | $ | 1,000.00 | $ | 1,117.10 | $ | 4.06 | 0.76 | % | ||||||||
Hypothetical | ||||||||||||||||
(5% return per year before expenses) | ||||||||||||||||
Class A | $ | 1,000.00 | $ | 1,020.10 | $ | 5.14 | 1.01 | % | ||||||||
Class C | $ | 1,000.00 | $ | 1,016.30 | $ | 8.94 | 1.76 | % | ||||||||
Class I | $ | 1,000.00 | $ | 1,021.40 | $ | 3.87 | 0.76 | % | ||||||||
| * | Expenses are equal to the Fund’s annualized expense ratio for the indicated Class, multiplied by the average account value over the period, multiplied by 184/365 (to reflect the one-half year period). The Example assumes that the $1,000 was invested at the net asset value per share determined at the close of business on June 30, 2019. |
| 6 |
Eaton Vance
Dividend Builder Fund
December 31, 2019
Portfolio of Investments
| Common Stocks — 99.7% |
| |||||||
| Security | Shares | Value | ||||||
| Aerospace & Defense — 5.0% | ||||||||
Boeing Co. (The) | 40,400 | $ | 13,160,704 | |||||
L3Harris Technologies, Inc. | 90,500 | 17,907,235 | ||||||
Lockheed Martin Corp. | 41,800 | 16,276,084 | ||||||
| $ | 47,344,023 | |||||||
| Banks — 4.1% | ||||||||
Bank of America Corp. | 491,100 | $ | 17,296,542 | |||||
JPMorgan Chase & Co. | 156,100 | 21,760,340 | ||||||
| $ | 39,056,882 | |||||||
| Beverages — 3.8% | ||||||||
Coca-Cola Co. (The) | 265,200 | $ | 14,678,820 | |||||
PepsiCo, Inc. | 153,900 | 21,033,513 | ||||||
| $ | 35,712,333 | |||||||
| Biotechnology — 2.3% | ||||||||
AbbVie, Inc. | 249,800 | $ | 22,117,292 | |||||
| $ | 22,117,292 | |||||||
| Building Products — 0.5% | ||||||||
A.O. Smith Corp. | 105,500 | $ | 5,026,020 | |||||
| $ | 5,026,020 | |||||||
| Capital Markets — 4.2% | ||||||||
CME Group, Inc. | 90,200 | $ | 18,104,944 | |||||
S&P Global, Inc. | 44,000 | 12,014,200 | ||||||
Tradeweb Markets, Inc., Class A | 208,327 | 9,655,956 | ||||||
| $ | 39,775,100 | |||||||
| Chemicals — 2.6% | ||||||||
Dow, Inc. | 323,833 | $ | 17,723,380 | |||||
Valvoline, Inc. | 317,700 | 6,801,957 | ||||||
| $ | 24,525,337 | |||||||
| Communications Equipment — 1.6% | ||||||||
Cisco Systems, Inc. | 313,800 | $ | 15,049,848 | |||||
| $ | 15,049,848 | |||||||
| Diversified Telecommunication Services — 3.9% | ||||||||
AT&T, Inc. | 485,600 | $ | 18,977,248 | |||||
Verizon Communications, Inc. | 298,380 | 18,320,532 | ||||||
| $ | 37,297,780 | |||||||
| Security | Shares | Value | ||||||
| Electric Utilities — 1.5% | ||||||||
Duke Energy Corp. | 157,600 | $ | 14,374,696 | |||||
| $ | 14,374,696 | |||||||
| Electrical Equipment — 0.9% | ||||||||
Emerson Electric Co. | 107,600 | $ | 8,205,576 | |||||
| $ | 8,205,576 | |||||||
| Electronic Equipment, Instruments & Components — 0.5% | ||||||||
Zebra Technologies Corp., Class A(1) | 18,600 | $ | 4,751,184 | |||||
| $ | 4,751,184 | |||||||
| Energy Equipment & Services — 0.7% | ||||||||
Schlumberger, Ltd. | 168,900 | $ | 6,789,780 | |||||
| $ | 6,789,780 | |||||||
| Entertainment — 1.9% | ||||||||
Walt Disney Co. (The) | 127,200 | $ | 18,396,936 | |||||
| $ | 18,396,936 | |||||||
| Equity Real Estate Investment Trusts (REITs) — 4.3% | ||||||||
Lamar Advertising Co., Class A | 170,600 | $ | 15,227,756 | |||||
Mid-America Apartment Communities, Inc. | 105,800 | 13,950,788 | ||||||
National Retail Properties, Inc. | 208,400 | 11,174,408 | ||||||
| $ | 40,352,952 | |||||||
| Food Products — 0.8% | ||||||||
Conagra Brands, Inc. | 208,800 | $ | 7,149,312 | |||||
| $ | 7,149,312 | |||||||
| Health Care Equipment & Supplies — 3.9% | ||||||||
Danaher Corp. | 115,100 | $ | 17,665,548 | |||||
Medtronic PLC | 167,400 | 18,991,530 | ||||||
| $ | 36,657,078 | |||||||
| Health Care Providers & Services — 3.8% | ||||||||
Anthem, Inc. | 47,500 | $ | 14,346,425 | |||||
UnitedHealth Group, Inc. | 75,100 | 22,077,898 | ||||||
| $ | 36,424,323 | |||||||
| Independent Power and Renewable Electricity Producers — 1.2% | ||||||||
NextEra Energy Partners, L.P. | 216,100 | $ | 11,377,665 | |||||
| $ | 11,377,665 | |||||||
| 7 | See Notes to Financial Statements. |
Eaton Vance
Dividend Builder Fund
December 31, 2019
Portfolio of Investments — continued
| Security | Shares | Value | ||||||
| Insurance — 4.2% | ||||||||
Chubb, Ltd. | 104,400 | $ | 16,250,904 | |||||
First American Financial Corp. | 191,200 | 11,150,784 | ||||||
Progressive Corp. (The) | 168,700 | 12,212,193 | ||||||
| $ | 39,613,881 | |||||||
| Interactive Media & Services — 4.7% | ||||||||
Alphabet, Inc., Class A(1) | 9,300 | $ | 12,456,327 | |||||
Alphabet, Inc., Class C(1) | 10,714 | 14,324,832 | ||||||
Facebook, Inc., Class A(1) | 84,700 | 17,384,675 | ||||||
| $ | 44,165,834 | |||||||
| Internet & Direct Marketing Retail — 1.6% | ||||||||
Amazon.com, Inc.(1) | 8,300 | $ | 15,337,072 | |||||
| $ | 15,337,072 | |||||||
| IT Services — 5.7% | ||||||||
Cognizant Technology Solutions Corp., Class A | 273,300 | $ | 16,950,066 | |||||
Fidelity National Information Services, Inc. | 114,800 | 15,967,532 | ||||||
Visa, Inc., Class A | 110,200 | 20,706,580 | ||||||
| $ | 53,624,178 | |||||||
| Media — 1.3% | ||||||||
Comcast Corp., Class A | 264,300 | $ | 11,885,571 | |||||
| $ | 11,885,571 | |||||||
| Oil, Gas & Consumable Fuels — 4.6% | ||||||||
BP PLC | 2,102,500 | $ | 13,226,413 | |||||
ConocoPhillips | 187,900 | 12,219,137 | ||||||
Enterprise Products Partners, LP | 258,400 | 7,276,544 | ||||||
Phillips 66 | 95,200 | 10,606,232 | ||||||
| $ | 43,328,326 | |||||||
| Pharmaceuticals — 7.2% | ||||||||
AstraZeneca PLC ADR | 192,300 | $ | 9,588,078 | |||||
Eli Lilly & Co. | 69,800 | 9,173,814 | ||||||
GlaxoSmithKline PLC ADR | 205,000 | 9,632,950 | ||||||
Johnson & Johnson | 172,000 | 25,089,640 | ||||||
Pfizer, Inc. | 370,300 | 14,508,354 | ||||||
| $ | 67,992,836 | |||||||
| Professional Services — 1.1% | ||||||||
IHS Markit, Ltd.(1) | 139,500 | $ | 10,511,325 | |||||
| $ | 10,511,325 | |||||||
| Security | Shares | Value | ||||||
| Road & Rail — 0.8% | ||||||||
CSX Corp. | 105,800 | $ | 7,655,688 | |||||
| $ | 7,655,688 | |||||||
| Semiconductors & Semiconductor Equipment — 3.8% | ||||||||
Broadcom, Inc. | 61,200 | $ | 19,340,424 | |||||
Texas Instruments, Inc. | 131,800 | 16,908,622 | ||||||
| $ | 36,249,046 | |||||||
| Software — 5.4% | ||||||||
Microsoft Corp. | 324,467 | $ | 51,168,446 | |||||
| $ | 51,168,446 | |||||||
| Specialty Retail — 5.0% | ||||||||
Best Buy Co., Inc. | 142,000 | $ | 12,467,600 | |||||
Home Depot, Inc. (The) | 82,200 | 17,950,836 | ||||||
Lowe’s Cos., Inc. | 144,800 | 17,341,248 | ||||||
| $ | 47,759,684 | |||||||
| Technology Hardware, Storage & Peripherals — 4.7% | ||||||||
Apple, Inc. | 150,237 | $ | 44,117,095 | |||||
| $ | 44,117,095 | |||||||
| Textiles, Apparel & Luxury Goods — 0.8% | ||||||||
Gildan Activewear, Inc. | 255,400 | $ | 7,541,962 | |||||
| $ | 7,541,962 | |||||||
| Tobacco — 1.3% | ||||||||
Philip Morris International, Inc. | 145,400 | $ | 12,372,086 | |||||
| $ | 12,372,086 | |||||||
Total Common Stocks |
| $ | 943,707,147 | |||||
| 8 | See Notes to Financial Statements. |
Eaton Vance
Dividend Builder Fund
December 31, 2019
Portfolio of Investments — continued
| Short-Term Investments — 0.3% |
| |||||||
| Description | Units | Value | ||||||
Eaton Vance Cash Reserves Fund, LLC, 1.78%(2) | 3,124,549 | $ | 3,124,549 | |||||
Total Short-Term Investments |
| $ | 3,124,549 | |||||
Total Investments — 100.0% |
| $ | 946,831,696 | |||||
Other Assets, Less Liabilities — (0.0)%(3) |
| $ | (153,334 | ) | ||||
Net Assets — 100.0% |
| $ | 946,678,362 | |||||
The percentage shown for each investment category in the Portfolio of Investments is based on net assets.
| (1) | Non-income producing security. |
| (2) | Affiliated investment company, available to Eaton Vance portfolios and funds, which invests in high quality, U.S. dollar denominated money market instruments. The rate shown is the annualized seven-day yield as of December 31, 2019. |
| (3) | Amount is less than (0.05)%. |
Abbreviations:
| ADR | – | American Depositary Receipt | ||
| 9 | See Notes to Financial Statements. |
Eaton Vance
Dividend Builder Fund
December 31, 2019
Statement of Assets and Liabilities
| Assets | December 31, 2019 | |||
Unaffiliated investments, at value (identified cost, $728,704,475) | $ | 943,707,147 | ||
Affiliated investment, at value (identified cost, $3,124,254) | 3,124,549 | |||
Dividends receivable | 1,079,230 | |||
Dividends receivable from affiliated investment | 3,185 | |||
Receivable for Fund shares sold | 153,302 | |||
Securities lending income receivable | 816 | |||
Tax reclaims receivable | 472,958 | |||
Total assets | $ | 948,541,187 | ||
| Liabilities | ||||
Payable for Fund shares redeemed | $ | 757,579 | ||
Payable to affiliates: | ||||
Investment adviser fee | 507,636 | |||
Distribution and service fees | 196,599 | |||
Trustees’ fees | 11,180 | |||
Accrued expenses | 389,831 | |||
Total liabilities | $ | 1,862,825 | ||
Net Assets | $ | 946,678,362 | ||
| Sources of Net Assets | ||||
Paid-in capital | $ | 722,745,200 | ||
Distributable earnings | 223,933,162 | |||
Total | $ | 946,678,362 | ||
| Class A Shares | ||||
Net Assets | $ | 706,042,521 | ||
Shares Outstanding | 45,231,092 | |||
Net Asset Value and Redemption Price Per Share | ||||
(net assets ÷ shares of beneficial interest outstanding) | $ | 15.61 | ||
Maximum Offering Price Per Share | ||||
(100 ÷ 94.25 of net asset value per share) | $ | 16.56 | ||
| Class C Shares | ||||
Net Assets | $ | 56,585,420 | ||
Shares Outstanding | 3,601,460 | |||
Net Asset Value and Offering Price Per Share* | ||||
(net assets ÷ shares of beneficial interest outstanding) | $ | 15.71 | ||
| Class I Shares | ||||
Net Assets | $ | 184,050,421 | ||
Shares Outstanding | 11,801,472 | |||
Net Asset Value, Offering Price and Redemption Price Per Share | ||||
(net assets ÷ shares of beneficial interest outstanding) | $ | 15.60 | ||
On sales of $50,000 or more, the offering price of Class A shares is reduced.
| * | Redemption price per share is equal to the net asset value less any applicable contingent deferred sales charge. |
| 10 | See Notes to Financial Statements. |
Eaton Vance
Dividend Builder Fund
December 31, 2019
Statement of Operations
| Investment Income | Year Ended December 31, 2019 | |||
Dividends (net of foreign taxes, $62,170) | $ | 22,930,470 | ||
Dividends from affiliated investment | 36,043 | |||
Securities lending income, net | 50,402 | |||
Total investment income | $ | 23,016,915 | ||
| Expenses | ||||
Investment adviser fee | $ | 5,692,354 | ||
Distribution and service fees | ||||
Class A | 1,642,613 | |||
Class C | 668,200 | |||
Trustees’ fees and expenses | 46,378 | |||
Custodian fee | 218,723 | |||
Transfer and dividend disbursing agent fees | 579,336 | |||
Legal and accounting services | 95,936 | |||
Printing and postage | 62,263 | |||
Registration fees | 50,763 | |||
Miscellaneous | 69,985 | |||
Total expenses | $ | 9,126,551 | ||
Net investment income | $ | 13,890,364 | ||
| Realized and Unrealized Gain (Loss) | ||||
Net realized gain (loss) — | ||||
Investment transactions | $ | 39,597,241 | ||
Investment transactions — affiliated investment | 473 | |||
Foreign currency transactions | (10,295 | ) | ||
Net realized gain | $ | 39,587,419 | ||
Change in unrealized appreciation (depreciation) — | ||||
Investments | $ | 185,441,398 | ||
Investments — affiliated investment | 173 | |||
Foreign currency | 25,649 | |||
Net change in unrealized appreciation (depreciation) | $ | 185,467,220 | ||
Net realized and unrealized gain | $ | 225,054,639 | ||
Net increase in net assets from operations | $ | 238,945,003 | ||
| 11 | See Notes to Financial Statements. |
Eaton Vance
Dividend Builder Fund
December 31, 2019
Statements of Changes in Net Assets
| Year Ended December 31, | ||||||||
| Increase (Decrease) in Net Assets | 2019 | 2018 | ||||||
From operations — |
| |||||||
Net investment income | $ | 13,890,364 | $ | 15,129,134 | ||||
Net realized gain | 39,587,419 | 61,838,152 | ||||||
Net change in unrealized appreciation (depreciation) | 185,467,220 | (121,209,521 | ) | |||||
Net increase (decrease) in net assets from operations | $ | 238,945,003 | $ | (44,242,235 | ) | |||
Distributions to shareholders — | ||||||||
Class A | $ | (33,030,164 | ) | $ | (57,837,835 | ) | ||
Class C | (2,459,995 | ) | (10,520,298 | ) | ||||
Class I | (8,866,386 | ) | (15,180,599 | ) | ||||
Total distributions to shareholders | $ | (44,356,545 | ) | $ | (83,538,732 | ) | ||
Transactions in shares of beneficial interest — | ||||||||
Proceeds from sale of shares | ||||||||
Class A | $ | 23,949,621 | $ | 33,642,047 | ||||
Class C | 4,164,570 | 7,151,055 | ||||||
Class I | 28,404,364 | 39,331,886 | ||||||
Net asset value of shares issued to shareholders in payment of distributions declared | ||||||||
Class A | 28,167,592 | 49,523,310 | ||||||
Class C | 2,196,425 | 9,745,958 | ||||||
Class I | 8,147,696 | 13,846,361 | ||||||
Cost of shares redeemed | ||||||||
Class A | (99,367,228 | ) | (110,827,967 | ) | ||||
Class C | (20,862,137 | ) | (41,604,558 | ) | ||||
Class I | (34,763,671 | ) | (49,296,866 | ) | ||||
Net asset value of shares converted | ||||||||
Class A | 52,800,847 | — | ||||||
Class C | (52,800,847 | ) | — | |||||
Net decrease in net assets from Fund share transactions | $ | (59,962,768 | ) | $ | (48,488,774 | ) | ||
Net increase (decrease) in net assets | $ | 134,625,690 | $ | (176,269,741 | ) | |||
| Net Assets |
| |||||||
At beginning of year | $ | 812,052,672 | $ | 988,322,413 | ||||
At end of year | $ | 946,678,362 | $ | 812,052,672 | ||||
| 12 | See Notes to Financial Statements. |
Eaton Vance
Dividend Builder Fund
December 31, 2019
Financial Highlights
| Class A | ||||||||||||||||||||
| Year Ended December 31, | ||||||||||||||||||||
| 2019 | 2018 | 2017 | 2016 | 2015 | ||||||||||||||||
Net asset value — Beginning of year | $ | 12.510 | $ | 14.550 | $ | 13.510 | $ | 13.110 | $ | 14.190 | ||||||||||
| Income (Loss) From Operations | ||||||||||||||||||||
Net investment income(1) | $ | 0.227 | $ | 0.242 | $ | 0.282 | $ | 0.278 | $ | 0.238 | ||||||||||
Net realized and unrealized gain (loss) | 3.607 | (0.942 | ) | 2.212 | 0.907 | 0.178 | ||||||||||||||
Total income (loss) from operations | $ | 3.834 | $ | (0.700 | ) | $ | 2.494 | $ | 1.185 | $ | 0.416 | |||||||||
| Less Distributions | ||||||||||||||||||||
From net investment income | $ | (0.264 | ) | $ | (0.264 | ) | $ | (0.264 | ) | $ | (0.264 | ) | $ | (0.236 | ) | |||||
From net realized gain | (0.470 | ) | (1.076 | ) | (1.190 | ) | (0.521 | ) | (1.260 | ) | ||||||||||
Total distributions | $ | (0.734 | ) | $ | (1.340 | ) | $ | (1.454 | ) | $ | (0.785 | ) | $ | (1.496 | ) | |||||
Net asset value — End of year | $ | 15.610 | $ | 12.510 | $ | 14.550 | $ | 13.510 | $ | 13.110 | ||||||||||
Total Return(2) | 31.09 | % | (5.40 | )% | 18.89 | % | 9.21 | % | 2.91 | % | ||||||||||
| Ratios/Supplemental Data | ||||||||||||||||||||
Net assets, end of year (000’s omitted) | $ | 706,043 | $ | 558,487 | $ | 674,421 | $ | 685,372 | $ | 711,199 | ||||||||||
Ratios (as a percentage of average daily net assets):(3) | ||||||||||||||||||||
Expenses(4) | 1.01 | % | 1.02 | % | 1.03 | % | 1.04 | % | 1.04 | % | ||||||||||
Net investment income | 1.57 | % | 1.66 | % | 1.98 | % | 2.09 | % | 1.67 | % | ||||||||||
Portfolio Turnover of the Portfolio(5) | — | 37 | %(6) | 86 | % | 97 | % | 99 | % | |||||||||||
Portfolio Turnover of the Fund | 55 | % | 41 | %(6)(7) | — | — | — | |||||||||||||
| (1) | Computed using average shares outstanding. |
| (2) | Returns are historical and are calculated by determining the percentage change in net asset value with all distributions reinvested and do not reflect the effect of sales charges. |
| (3) | Includes the Fund’s share of the Portfolio’s allocated expenses for the period while the Fund was investing in the Portfolio. |
| (4) | Excludes the effect of custody fee credits, if any, of less than 0.005%. Effective September 1, 2015, custody fee credits, which were earned on cash deposit balances, were discontinued by the custodian. |
| (5) | Portfolio turnover represents the rate of portfolio activity for the period while the Fund was investing in the Portfolio. |
| (6) | Not annualized. |
| (7) | For the period from June 11, 2018 through December 31, 2018 when the Fund was making investments directly in securities. |
References to Portfolio herein are to Dividend Builder Portfolio, a Massachusetts business trust having the same investment objective and policies as the Fund, in which the Fund invested all of its investable assets prior to June 11, 2018.
| 13 | See Notes to Financial Statements. |
Eaton Vance
Dividend Builder Fund
December 31, 2019
Financial Highlights — continued
| Class C | ||||||||||||||||||||
| Year Ended December 31, | ||||||||||||||||||||
| 2019 | 2018 | 2017 | 2016 | 2015 | ||||||||||||||||
Net asset value — Beginning of year | $ | 12.580 | $ | 14.620 | $ | 13.580 | $ | 13.160 | $ | 14.250 | ||||||||||
| Income (Loss) From Operations | ||||||||||||||||||||
Net investment income(1) | $ | 0.115 | $ | 0.133 | $ | 0.177 | $ | 0.179 | $ | 0.132 | ||||||||||
Net realized and unrealized gain (loss) | 3.636 | (0.945 | ) | 2.209 | 0.926 | 0.167 | ||||||||||||||
Total income (loss) from operations | $ | 3.751 | $ | (0.812 | ) | $ | 2.386 | $ | 1.105 | $ | 0.299 | |||||||||
| Less Distributions | ||||||||||||||||||||
From net investment income | $ | (0.151 | ) | $ | (0.152 | ) | $ | (0.156 | ) | $ | (0.164 | ) | $ | (0.129 | ) | |||||
From net realized gain | (0.470 | ) | (1.076 | ) | (1.190 | ) | (0.521 | ) | (1.260 | ) | ||||||||||
Total distributions | $ | (0.621 | ) | $ | (1.228 | ) | $ | (1.346 | ) | $ | (0.685 | ) | $ | (1.389 | ) | |||||
Net asset value — End of year | $ | 15.710 | $ | 12.580 | $ | 14.620 | $ | 13.580 | $ | 13.160 | ||||||||||
Total Return(2) | 30.13 | % | (6.09 | )% | 17.89 | % | 8.51 | % | 2.05 | % | ||||||||||
| Ratios/Supplemental Data | ||||||||||||||||||||
Net assets, end of year (000’s omitted) | $ | 56,585 | $ | 107,495 | $ | 149,298 | $ | 163,138 | $ | 165,915 | ||||||||||
Ratios (as a percentage of average daily net assets):(3) | ||||||||||||||||||||
Expenses(4) | 1.77 | % | 1.77 | % | 1.78 | % | 1.79 | % | 1.79 | % | ||||||||||
Net investment income | 0.80 | % | 0.91 | % | 1.24 | % | 1.34 | % | 0.92 | % | ||||||||||
Portfolio Turnover of the Portfolio(5) | — | 37 | %(6) | 86 | % | 97 | % | 99 | % | |||||||||||
Portfolio Turnover of the Fund | 55 | % | 41 | %(6)(7) | — | — | — | |||||||||||||
| (1) | Computed using average shares outstanding. |
| (2) | Returns are historical and are calculated by determining the percentage change in net asset value with all distributions reinvested and do not reflect the effect of sales charges. |
| (3) | Includes the Fund’s share of the Portfolio’s allocated expenses for the period while the Fund was investing in the Portfolio. |
| (4) | Excludes the effect of custody fee credits, if any, of less than 0.005%. Effective September 1, 2015, custody fee credits, which were earned on cash deposit balances, were discontinued by the custodian. |
| (5) | Portfolio turnover represents the rate of portfolio activity for the period while the Fund was investing in the Portfolio. |
| (6) | Not annualized. |
| (7) | For the period from June 11, 2018 through December 31, 2018 when the Fund was making investments directly in securities. |
References to Portfolio herein are to Dividend Builder Portfolio, a Massachusetts business trust having the same investment objective and policies as the Fund, in which the Fund invested all of its investable assets prior to June 11, 2018.
| 14 | See Notes to Financial Statements. |
Eaton Vance
Dividend Builder Fund
December 31, 2019
Financial Highlights — continued
| Class I | ||||||||||||||||||||
| Year Ended December 31, | ||||||||||||||||||||
| 2019 | 2018 | 2017 | 2016 | 2015 | ||||||||||||||||
Net asset value — Beginning of year | $ | 12.500 | $ | 14.530 | $ | 13.500 | $ | 13.100 | $ | 14.180 | ||||||||||
| Income (Loss) From Operations | ||||||||||||||||||||
Net investment income(1) | $ | 0.262 | $ | 0.279 | $ | 0.316 | $ | 0.312 | $ | 0.274 | ||||||||||
Net realized and unrealized gain (loss) | 3.608 | (0.932 | ) | 2.204 | 0.906 | 0.178 | ||||||||||||||
Total income (loss) from operations | $ | 3.870 | $ | (0.653 | ) | $ | 2.520 | $ | 1.218 | $ | 0.452 | |||||||||
| Less Distributions | ||||||||||||||||||||
From net investment income | $ | (0.300 | ) | $ | (0.301 | ) | $ | (0.300 | ) | $ | (0.297 | ) | $ | (0.272 | ) | |||||
From net realized gain | (0.470 | ) | (1.076 | ) | (1.190 | ) | (0.521 | ) | (1.260 | ) | ||||||||||
Total distributions | $ | (0.770 | ) | $ | (1.377 | ) | $ | (1.490 | ) | $ | (0.818 | ) | $ | (1.532 | ) | |||||
Net asset value — End of year | $ | 15.600 | $ | 12.500 | $ | 14.530 | $ | 13.500 | $ | 13.100 | ||||||||||
Total Return(2) | 31.44 | % | (5.10 | )% | 19.12 | % | 9.49 | % | 3.10 | % | ||||||||||
| Ratios/Supplemental Data | ||||||||||||||||||||
Net assets, end of year (000’s omitted) | $ | 184,050 | $ | 146,070 | $ | 164,604 | $ | 113,726 | $ | 107,963 | ||||||||||
Ratios (as a percentage of average daily net assets):(3) | ||||||||||||||||||||
Expenses(4) | 0.76 | % | 0.77 | % | 0.78 | % | 0.79 | % | 0.79 | % | ||||||||||
Net investment income | 1.82 | % | 1.92 | % | 2.22 | % | 2.35 | % | 1.92 | % | ||||||||||
Portfolio Turnover of the Portfolio(5) | — | 37 | %(6) | 86 | % | 97 | % | 99 | % | |||||||||||
Portfolio Turnover of the Fund | 55 | % | 41 | %(6)(7) | — | — | — | |||||||||||||
| (1) | Computed using average shares outstanding. |
| (2) | Returns are historical and are calculated by determining the percentage change in net asset value with all distributions reinvested. |
| (3) | Includes the Fund’s share of the Portfolio’s allocated expenses for the period while the Fund was investing in the Portfolio. |
| (4) | Excludes the effect of custody fee credits, if any, of less than 0.005%. Effective September 1, 2015, custody fee credits, which were earned on cash deposit balances, were discontinued by the custodian. |
| (5) | Portfolio turnover represents the rate of portfolio activity for the period while the Fund was investing in the Portfolio. |
| (6) | Not annualized. |
| (7) | For the period from June 11, 2018 through December 31, 2018 when the Fund was making investments directly in securities. |
References to Portfolio herein are to Dividend Builder Portfolio, a Massachusetts business trust having the same investment objective and policies as the Fund, in which the Fund invested all of its investable assets prior to June 11, 2018.
| 15 | See Notes to Financial Statements. |
Eaton Vance
Dividend Builder Fund
December 31, 2019
Notes to Financial Statements
1 Significant Accounting Policies
Eaton Vance Dividend Builder Fund (the Fund) is a diversified series of Eaton Vance Special Investment Trust (the Trust). The Trust is a Massachusetts business trust registered under the Investment Company Act of 1940, as amended (the 1940 Act), as an open-end management investment company. The Fund’s investment objective is to seek total return. The Fund offers three classes of shares. Class A shares are generally sold subject to a sales charge imposed at time of purchase. Class C shares are sold at net asset value and are generally subject to a contingent deferred sales charge (see Note 5). Class I shares are sold at net asset value and are not subject to a sales charge. Effective January 25, 2019, Class C shares generally will automatically convert to Class A shares ten years after their purchase as described in the Fund’s prospectus. Each class represents a pro-rata interest in the Fund, but votes separately on class-specific matters and (as noted below) is subject to different expenses. Realized and unrealized gains and losses and net investment income and losses, other than class-specific expenses, are allocated daily to each class of shares based on the relative net assets of each class to the total net assets of the Fund. Each class of shares differs in its distribution plan and certain other class-specific expenses.
The following is a summary of significant accounting policies of the Fund. The policies are in conformity with accounting principles generally accepted in the United States of America (U.S. GAAP). The Fund is an investment company and follows accounting and reporting guidance in the Financial Accounting Standards Board (FASB) Accounting Standards Codification Topic 946.
A Investment Valuation — The following methodologies are used to determine the market value or fair value of investments.
Equity Securities. Equity securities listed on a U.S. securities exchange generally are valued at the last sale or closing price on the day of valuation or, if no sales took place on such date, at the mean between the closing bid and ask prices on the exchange where such securities are principally traded. Equity securities listed on the NASDAQ Global or Global Select Market generally are valued at the NASDAQ official closing price. Unlisted or listed securities for which closing sales prices or closing quotations are not available are valued at the mean between the latest available bid and ask prices.
Foreign Securities and Currencies. Foreign securities and currencies are valued in U.S. dollars, based on foreign currency exchange rate quotations supplied by a third party pricing service. The pricing service uses a proprietary model to determine the exchange rate. Inputs to the model include reported trades and implied bid/ask spreads. The daily valuation of exchange-traded foreign securities generally is determined as of the close of trading on the principal exchange on which such securities trade. Events occurring after the close of trading on foreign exchanges may result in adjustments to the valuation of foreign securities to more accurately reflect their fair value as of the close of regular trading on the New York Stock Exchange. When valuing foreign equity securities that meet certain criteria, the Fund’s Trustees have approved the use of a fair value service that values such securities to reflect market trading that occurs after the close of the applicable foreign markets of comparable securities or other instruments that have a strong correlation to the fair-valued securities.
Affiliated Fund. The Fund may invest in Eaton Vance Cash Reserves Fund, LLC (Cash Reserves Fund), an affiliated investment company managed by Eaton Vance Management (EVM). While Cash Reserves Fund is not a registered money market mutual fund, it conducts all of its investment activities in accordance with the requirements of Rule 2a-7 under the 1940 Act. Investments in Cash Reserves Fund are valued at the closing net asset value per unit on the valuation day. Cash Reserves Fund generally values its investment securities based on available market quotations provided by a third party pricing service.
Fair Valuation. Investments for which valuations or market quotations are not readily available or are deemed unreliable are valued at fair value using methods determined in good faith by or at the direction of the Trustees of the Fund in a manner that most fairly reflects the security’s “fair value”, which is the amount that the Fund might reasonably expect to receive for the security upon its current sale in the ordinary course. Each such determination is based on a consideration of relevant factors, which are likely to vary from one pricing context to another. These factors may include, but are not limited to, the type of security, the existence of any contractual restrictions on the security’s disposition, the price and extent of public trading in similar securities of the issuer or of comparable companies or entities, quotations or relevant information obtained from broker/dealers or other market participants, information obtained from the issuer, analysts, and/or the appropriate stock exchange (for exchange-traded securities), an analysis of the company’s or entity’s financial statements, and an evaluation of the forces that influence the issuer and the market(s) in which the security is purchased and sold.
B Investment Transactions — Investment transactions for financial statement purposes are accounted for on a trade date basis. Realized gains and losses on investments sold are determined on the basis of identified cost.
C Income — Dividend income is recorded on the ex-dividend date for dividends received in cash and/or securities. However, if the ex-dividend date has passed, certain dividends from foreign securities are recorded as the Fund is informed of the ex-dividend date. Withholding taxes on foreign dividends and capital gains have been provided for in accordance with the Fund’s understanding of the applicable countries’ tax rules and rates. In consideration of recent decisions rendered by European courts, the Fund has filed additional tax reclaims for previously withheld taxes on dividends earned in certain European Union countries. These filings are subject to various administrative and judicial proceedings within these countries. Due to the uncertainty as to the ultimate resolution of these proceedings, the likelihood of receipt of these reclaims, and the potential timing of payment, no amounts are reflected in the Fund’s financial statements for such outstanding reclaims.
D Federal Taxes — The Fund’s policy is to comply with the provisions of the Internal Revenue Code applicable to regulated investment companies and to distribute to shareholders each year substantially all of its net investment income, and all or substantially all of its net realized capital gains. Accordingly, no provision for federal income or excise tax is necessary.
| 16 |
Eaton Vance
Dividend Builder Fund
December 31, 2019
Notes to Financial Statements — continued
As of December 31, 2019, the Fund had no uncertain tax positions that would require financial statement recognition, de-recognition, or disclosure. The Fund files a U.S. federal income tax return annually after its fiscal year-end, which is subject to examination by the Internal Revenue Service for a period of three years from the date of filing.
E Expenses — The majority of expenses of the Trust are directly identifiable to an individual fund. Expenses which are not readily identifiable to a specific fund are allocated taking into consideration, among other things, the nature and type of expense and the relative size of the funds.
F Foreign Currency Translation — Investment valuations, other assets, and liabilities initially expressed in foreign currencies are translated each business day into U.S. dollars based upon current exchange rates. Purchases and sales of foreign investment securities and income and expenses denominated in foreign currencies are translated into U.S. dollars based upon currency exchange rates in effect on the respective dates of such transactions. Recognized gains or losses on investment transactions attributable to changes in foreign currency exchange rates are recorded for financial statement purposes as net realized gains and losses on investments. That portion of unrealized gains and losses on investments that results from fluctuations in foreign currency exchange rates is not separately disclosed.
G Use of Estimates — The preparation of the financial statements in conformity with U.S. GAAP requires management to make estimates and assumptions that affect the reported amounts of assets and liabilities at the date of the financial statements and the reported amounts of income and expense during the reporting period. Actual results could differ from those estimates.
H Indemnifications — Under the Trust’s organizational documents, its officers and Trustees may be indemnified against certain liabilities and expenses arising out of the performance of their duties to the Fund. Under Massachusetts law, if certain conditions prevail, shareholders of a Massachusetts business trust (such as the Trust) could be deemed to have personal liability for the obligations of the Trust. However, the Trust’s Declaration of Trust contains an express disclaimer of liability on the part of Fund shareholders and the By-laws provide that the Trust shall assume, upon request by the shareholder, the defense on behalf of any Fund shareholders. Moreover, the By-laws also provide for indemnification out of Fund property of any shareholder held personally liable solely by reason of being or having been a shareholder for all loss or expense arising from such liability. Additionally, in the normal course of business, the Fund enters into agreements with service providers that may contain indemnification clauses. The Fund’s maximum exposure under these arrangements is unknown as this would involve future claims that may be made against the Fund that have not yet occurred.
2 Distributions to Shareholders and Income Tax Information
It is the present policy of the Fund to make monthly distributions of all or substantially all of its net investment income and to distribute annually all or substantially all of its net realized capital gains. Distributions to shareholders are recorded on the ex-dividend date. Distributions are declared separately for each class of shares. Shareholders may reinvest income and capital gain distributions in additional shares of the same class of the Fund at the net asset value as of the ex-dividend date or, at the election of the shareholder, receive distributions in cash. Distributions to shareholders are determined in accordance with income tax regulations, which may differ from U.S. GAAP. As required by U.S. GAAP, only distributions in excess of tax basis earnings and profits are reported in the financial statements as a return of capital. Permanent differences between book and tax accounting relating to distributions are reclassified to paid-in capital. For tax purposes, distributions from short-term capital gains are considered to be from ordinary income.
The tax character of distributions declared for the years ended December 31, 2019 and December 31, 2018 was as follows:
| Year Ended December 31, | ||||||||
| 2019 | 2018 | |||||||
Ordinary income | $ | 17,556,442 | $ | 33,393,057 | ||||
Long-term capital gains | $ | 26,800,103 | $ | 50,145,675 | ||||
During the year ended December 31, 2019, distributable earnings was decreased by $2,972,100 and paid-in capital was increased by $2,972,100 due to the Fund’s use of equalization accounting and differences between book and tax accounting. Tax equalization accounting allows the Fund to treat as a distribution that portion of redemption proceeds representing a redeeming shareholder’s portion of undistributed taxable income and net capital gains. These reclassifications had no effect on the net assets or net asset value per share of the Fund.
As of December 31, 2019, the components of distributable earnings (accumulated loss) on a tax basis were as follows:
Undistributed ordinary income | $ | 4,873,890 | ||
Undistributed long-term capital gains | $ | 5,712,267 | ||
Net unrealized appreciation | $ | 213,347,005 | ||
| 17 |
Eaton Vance
Dividend Builder Fund
December 31, 2019
Notes to Financial Statements — continued
The cost and unrealized appreciation (depreciation) of investments of the Fund at December 31, 2019, as determined on a federal income tax basis, were as follows:
Aggregate cost | $ | 733,512,110 | ||
Gross unrealized appreciation | $ | 218,382,182 | ||
Gross unrealized depreciation | (5,062,596 | ) | ||
Net unrealized appreciation | $ | 213,319,586 | ||
3 Investment Adviser Fee and Other Transactions with Affiliates
The investment adviser fee is earned by Boston Management and Research (BMR), a subsidiary of EVM, as compensation for investment advisory services rendered to the Fund. The fee is computed at an annual rate of 0.65% of the Fund’s average daily net assets up to $500 million, 0.625% from $500 million up to $1 billion, 0.600% from $1 billion up to $1.5 billion, 0.550% from $1.5 billion up to $2 billion, 0.500% from $2 billion up to $3 billion and at reduced rates on daily net assets of $3 billion or more, and is payable monthly. For the year ended December 31, 2019, the investment adviser fee amounted to $5,692,354 or 0.64% of the Fund’s average daily net assets. The Fund invests its cash in Cash Reserves Fund. EVM does not currently receive a fee for advisory services provided to Cash Reserves Fund.
EVM serves as the administrator of the Fund, but receives no compensation. EVM provides sub-transfer agency and related services to the Fund pursuant to a Sub-Transfer Agency Support Services Agreement. For the year ended December 31, 2019, EVM earned $104,741 from the Fund pursuant to such agreement, which is included in transfer and dividend disbursing agent fees on the Statement of Operations. The Fund was informed that Eaton Vance Distributors, Inc. (EVD), an affiliate of EVM and the Fund’s principal underwriter, received $30,781 as its portion of the sales charge on sales of Class A shares for the year ended December 31, 2019. EVD also received distribution and service fees from Class A and Class C shares (see Note 4) and contingent deferred sales charges (see Note 5).
Trustees and officers of the Fund who are members of EVM’s or BMR’s organizations receive remuneration for their services to the Fund out of the investment adviser fee. Trustees of the Fund who are not affiliated with the investment adviser may elect to defer receipt of all or a percentage of their annual fees in accordance with the terms of the Trustees Deferred Compensation Plan. For the year ended December 31, 2019, no significant amounts have been deferred. Certain officers and Trustees of the Fund are officers of the above organizations.
4 Distribution Plans
The Fund has in effect a distribution plan for Class A shares (Class A Plan) pursuant to Rule 12b-1 under the 1940 Act. Pursuant to the Class A Plan, the Fund pays EVD a distribution and service fee of 0.25% per annum of its average daily net assets attributable to Class A shares for distribution services and facilities provided to the Fund by EVD, as well as for personal services and/or the maintenance of shareholder accounts. Distribution and service fees paid or accrued to EVD for the year ended December 31, 2019 amounted to $1,642,613 for Class A shares.
The Fund also has in effect a distribution plan for Class C shares (Class C Plan) pursuant to Rule 12b-1 under the 1940 Act. Pursuant to the Class C Plan, the Fund pays EVD amounts equal to 0.75% per annum of its average daily net assets attributable to Class C shares for providing ongoing distribution services and facilities to the Fund. For the year ended December 31, 2019, the Fund paid or accrued to EVD $501,150 for Class C shares.
Pursuant to the Class C Plan, the Fund also makes payments of service fees to EVD, financial intermediaries and other persons in amounts equal to 0.25% per annum of its average daily net assets attributable to that class. Service fees paid or accrued are for personal services and/or the maintenance of shareholder accounts. They are separate and distinct from the sales commissions and distribution fees payable to EVD. Service fees paid or accrued for the year ended December 31, 2019 amounted to $167,050 for Class C shares.
Distribution and service fees are subject to the limitations contained in the Financial Industry Regulatory Authority Rule 2341(d).
5 Contingent Deferred Sales Charges
A contingent deferred sales charge (CDSC) of 1% generally is imposed on redemptions of Class C shares made within one year of purchase. Class A shares may be subject to a 1% CDSC if redeemed within 18 months of purchase (depending on the circumstances of purchase). Generally, the CDSC is based upon the lower of the net asset value at date of redemption or date of purchase. No charge is levied on shares acquired by reinvestment of dividends or capital gain distributions. For the year ended December 31, 2019, the Fund was informed that EVD received approximately $2,000 of CDSCs paid by Class C shareholders and no CDSCs paid by Class A shareholders.
| 18 |
Eaton Vance
Dividend Builder Fund
December 31, 2019
Notes to Financial Statements — continued
6 Purchases and Sales of Investments
Purchases and sales of investments, other than short-term obligations, aggregated $491,400,006 and $579,037,248, respectively, for the year ended December 31, 2019.
7 Shares of Beneficial Interest
The Fund’s Declaration of Trust permits the Trustees to issue an unlimited number of full and fractional shares of beneficial interest (without par value). Such shares may be issued in a number of different series (such as the Fund) and classes. Transactions in Fund shares were as follows:
| Year Ended December 31, | ||||||||
| Class A | 2019 | 2018 | ||||||
Sales | 1,656,682 | 2,359,977 | ||||||
Issued to shareholders electing to receive payments of distributions in Fund shares | 1,906,692 | 3,615,097 | ||||||
Redemptions | (6,912,680 | ) | (7,693,976 | ) | ||||
Converted from Class C shares | 3,937,445 | — | ||||||
Net increase (decrease) | 588,139 | (1,718,902 | ) | |||||
| Year Ended December 31, | ||||||||
| Class C | 2019 | 2018 | ||||||
Sales | 284,321 | 497,780 | ||||||
Issued to shareholders electing to receive payments of distributions in Fund shares | 147,852 | 710,355 | ||||||
Redemptions | (1,460,281 | ) | (2,875,129 | ) | ||||
Converted to Class A shares | (3,913,810 | ) | — | |||||
Net decrease | (4,941,918 | ) | (1,666,994 | ) | ||||
| Year Ended December 31, | ||||||||
| Class I | 2019 | 2018 | ||||||
Sales | 1,984,411 | 2,739,086 | ||||||
Issued to shareholders electing to receive payments of distributions in Fund shares | 552,655 | 1,010,772 | ||||||
Redemptions | (2,422,215 | ) | (3,388,128 | ) | ||||
Net increase | 114,851 | 361,730 | ||||||
8 Line of Credit
The Fund participates with other portfolios and funds managed by EVM and its affiliates in an $800 million unsecured line of credit agreement with a group of banks, which is in effect through October 27, 2020. In connection with the renewal of the agreement on October 29, 2019, funds managed by Calvert Research and Management, an affiliate of EVM, were added as participating funds to the agreement and the borrowing limit was increased from $625 million. Borrowings are made by the Fund solely to facilitate the handling of unusual and/or unanticipated short-term cash requirements. Interest is charged to the Fund based on its borrowings at an amount above either the Eurodollar rate or Federal Funds rate. In addition, a fee computed at an annual rate of 0.15% on the daily unused portion of the line of credit is allocated among the participating portfolios and funds at the end of each quarter. Because the line of credit is not available exclusively to the Fund, it may be unable to borrow some or all of its requested amounts at any particular time. The Fund did not have any significant borrowings or allocated fees during the year ended December 31, 2019.
| 19 |
Eaton Vance
Dividend Builder Fund
December 31, 2019
Notes to Financial Statements — continued
9 Securities Lending Agreement
The Fund has established a securities lending agreement with State Street Bank and Trust Company (SSBT) as securities lending agent in which the Fund lends portfolio securities to qualified borrowers in exchange for collateral consisting of either cash or securities issued or guaranteed by the U.S. Government or its agencies or instrumentalities in an amount at least equal to the market value of the securities on loan. The market value of securities loaned is determined daily and any additional required collateral is delivered to the Fund on the next business day. Cash collateral is invested in the State Street Navigator Securities Lending Government Money Market Portfolio, a money market fund registered under the 1940 Act. The Fund earns interest on the amount invested but it must pay (and at times receive from) the broker a loan rebate fee computed as a varying percentage of the collateral received. For security loans secured by non-cash collateral, the Fund earns a negotiated lending fee from the borrower. A portion of the income earned by the Fund from its investment of cash collateral, net of rebate fees, and lending fees received is allocated to SSBT for its services as lending agent and the portion allocated to the Fund is presented as securities lending income, net on the Statement of Operations. Non-cash collateral is held by the lending agent on behalf of the Fund and cannot be sold or re-pledged by the Fund; accordingly, such collateral is not reflected in the Statement of Assets and Liabilities.
The Fund is subject to possible delay in the recovery of loaned securities. Pursuant to the securities lending agreement, SSBT has provided indemnification to the Fund in the event of default by a borrower with respect to a loan. The Fund bears the risk of loss with respect to the investment of cash collateral.
At December 31, 2019, the Fund had no securities on loan.
10 Investments in Affiliated Funds
At December 31, 2019, the value of the Fund’s investment in affiliated funds was $3,124,549, which represents 0.3% of the Fund’s net assets. Transactions in affiliated funds by the Fund for the year ended December 31, 2019 were as follows:
| Name of affiliated fund | Value, beginning of period | Purchases | Sales proceeds | Net realized gain (loss) | Change in unrealized appreciation (depreciation) | Value, end of period | Dividend income | Units, end of period | ||||||||||||||||||||||||
Short-Term Investments | ||||||||||||||||||||||||||||||||
Eaton Vance Cash Reserves Fund, LLC, 1.78% | $ | 1,475,314 | $ | 102,310,622 | $ | (100,662,033 | ) | $ | 473 | $ | 173 | $ | 3,124,549 | $ | 36,043 | 3,124,549 | ||||||||||||||||
11 Fair Value Measurements
Under generally accepted accounting principles for fair value measurements, a three-tier hierarchy to prioritize the assumptions, referred to as inputs, is used in valuation techniques to measure fair value. The three-tier hierarchy of inputs is summarized in the three broad levels listed below.
| • | Level 1 – quoted prices in active markets for identical investments |
| • | Level 2 – other significant observable inputs (including quoted prices for similar investments, interest rates, prepayment speeds, credit risk, etc.) |
| • | Level 3 – significant unobservable inputs (including a fund’s own assumptions in determining the fair value of investments) |
In cases where the inputs used to measure fair value fall in different levels of the fair value hierarchy, the level disclosed is determined based on the lowest level input that is significant to the fair value measurement in its entirety. The inputs or methodology used for valuing securities are not necessarily an indication of the risk associated with investing in those securities.
| 20 |
Eaton Vance
Dividend Builder Fund
December 31, 2019
Notes to Financial Statements — continued
At December 31, 2019, the hierarchy of inputs used in valuing the Fund’s investments, which are carried at value, were as follows:
| Asset Description | Level 1 | Level 2 | Level 3 | Total | ||||||||||||
Common Stocks | ||||||||||||||||
Communication Services | $ | 111,746,121 | $ | — | $ | — | $ | 111,746,121 | ||||||||
Consumer Discretionary | 70,638,718 | — | — | 70,638,718 | ||||||||||||
Consumer Staples | 55,233,731 | — | — | 55,233,731 | ||||||||||||
Energy | 36,891,693 | 13,226,413 | — | 50,118,106 | ||||||||||||
Financials | 118,445,863 | — | — | 118,445,863 | ||||||||||||
Health Care | 163,191,529 | — | — | 163,191,529 | ||||||||||||
Industrials | 78,742,632 | — | — | 78,742,632 | ||||||||||||
Information Technology | 204,959,797 | — | — | 204,959,797 | ||||||||||||
Materials | 24,525,337 | — | — | 24,525,337 | ||||||||||||
Real Estate | 40,352,952 | — | — | 40,352,952 | ||||||||||||
Utilities | 25,752,361 | — | — | 25,752,361 | ||||||||||||
Total Common Stocks | $ | 930,480,734 | $ | 13,226,413 | * | $ | — | $ | 943,707,147 | |||||||
Short-Term Investments | $ | — | $ | 3,124,549 | $ | — | $ | 3,124,549 | ||||||||
Total Investments | $ | 930,480,734 | $ | 16,350,962 | $ | — | $ | 946,831,696 | ||||||||
| * | Includes foreign equity securities whose values were adjusted to reflect market trading of comparable securities or other correlated instruments that occurred after the close of trading in their applicable foreign markets. |
| 21 |
Eaton Vance
Dividend Builder Fund
December 31, 2019
Report of Independent Registered Public Accounting Firm
To the Trustees of Eaton Vance Special Investment Trust and Shareholders of Eaton Vance Dividend Builder Fund:
Opinion on the Financial Statements and Financial Highlights
We have audited the accompanying statement of assets and liabilities of Eaton Vance Dividend Builder Fund (the “Fund”) (one of the funds constituting Eaton Vance Special Investment Trust), including the portfolio of investments, as of December 31, 2019, the related statement of operations for the year then ended, the statements of changes in net assets for each of the two years in the period then ended, the financial highlights for each of the five years in the period then ended, and the related notes. In our opinion, the financial statements and financial highlights present fairly, in all material respects, the financial position of the Fund as of December 31, 2019, and the results of its operations for the year then ended, the changes in its net assets for each of the two years in the period then ended, and the financial highlights for each of the five years in the period then ended in conformity with accounting principles generally accepted in the United States of America.
Basis for Opinion
These financial statements and financial highlights are the responsibility of the Fund’s management. Our responsibility is to express an opinion on the Fund’s financial statements and financial highlights based on our audits. We are a public accounting firm registered with the Public Company Accounting Oversight Board (United States) (PCAOB) and are required to be independent with respect to the Fund in accordance with the U.S. federal securities laws and the applicable rules and regulations of the Securities and Exchange Commission and the PCAOB.
We conducted our audits in accordance with the standards of the PCAOB. Those standards require that we plan and perform the audit to obtain reasonable assurance about whether the financial statements and financial highlights are free of material misstatement, whether due to error or fraud. The Fund is not required to have, nor were we engaged to perform, an audit of its internal control over financial reporting. As part of our audits we are required to obtain an understanding of internal control over financial reporting but not for the purpose of expressing an opinion on the effectiveness of the Fund’s internal control over financial reporting. Accordingly, we express no such opinion.
Our audits included performing procedures to assess the risks of material misstatement of the financial statements and financial highlights, whether due to error or fraud, and performing procedures that respond to those risks. Such procedures included examining, on a test basis, evidence regarding the amounts and disclosures in the financial statements and financial highlights. Our audits also included evaluating the accounting principles used and significant estimates made by management, as well as evaluating the overall presentation of the financial statements and financial highlights. Our procedures included confirmation of securities owned as of December 31, 2019, by correspondence with the custodian and brokers; when replies were not received from brokers, we performed other auditing procedures. We believe that our audits provide a reasonable basis for our opinion.
/s/ Deloitte & Touche LLP
Boston, Massachusetts
February 24, 2020
We have served as the auditor of one or more Eaton Vance investment companies since 1959.
| 22 |
Eaton Vance
Dividend Builder Fund
December 31, 2019
Federal Tax Information (Unaudited)
The Form 1099-DIV you received in February 2020 showed the tax status of all distributions paid to your account in calendar year 2019. Shareholders are advised to consult their own tax adviser with respect to the tax consequences of their investment in the Fund. As required by the Internal Revenue Code and/or regulations, shareholders must be notified regarding the status of qualified dividend income for individuals, the dividends received deduction for corporations and capital gains dividends.
Qualified Dividend Income. For the fiscal year ended December 31, 2019, the Fund designates approximately $20,221,806, or up to the maximum amount of such dividends allowable pursuant to the Internal Revenue Code, as qualified dividend income eligible for the reduced tax rate of 15%.
Dividends Received Deduction. Corporate shareholders are generally entitled to take the dividends received deduction on the portion of the Fund’s dividend distribution that qualifies under tax law. For the Fund’s fiscal 2019 ordinary income dividends, 81.22% qualifies for the corporate dividends received deduction.
Capital Gains Dividends. The Fund hereby designates as a capital gain dividend with respect to the taxable year ended December 31, 2019, $27,456,862 or, if subsequently determined to be different, the net capital gain of such year.
| 23 |
Eaton Vance
Dividend Builder Fund
December 31, 2019
Management and Organization
Fund Management. The Trustees of Eaton Vance Special Investment Trust (the Trust) are responsible for the overall management and supervision of the Trust’s affairs. The Trustees and officers of the Trust are listed below. Except as indicated, each individual has held the office shown or other offices in the same company for the last five years. Trustees and officers of the Trust hold indefinite terms of office. The “noninterested Trustees” consist of those Trustees who are not “interested persons” of the Trust, as that term is defined under the 1940 Act. The business address of each Trustee and officer is Two International Place, Boston, Massachusetts 02110. As used below, “EVC” refers to Eaton Vance Corp., “EV” refers to Eaton Vance, Inc., “EVM” refers to Eaton Vance Management, “BMR” refers to Boston Management and Research and “EVD” refers to Eaton Vance Distributors, Inc. EVC and EV are the corporate parent and trustee, respectively, of EVM and BMR. EVD is the Fund’s principal underwriter and a wholly-owned subsidiary of EVC. Each officer affiliated with Eaton Vance may hold a position with other Eaton Vance affiliates that is comparable to his or her position with EVM listed below. Each Trustee oversees 159 portfolios in the Eaton Vance Complex (including all master and feeder funds in a master feeder structure). Each officer serves as an officer of certain other Eaton Vance funds. Each Trustee and officer serves until his or her successor is elected.
| Name and Year of Birth | Position(s) with the Trust | Trustee Since(1) | Principal Occupation(s) and Directorships During Past Five Years and Other Relevant Experience | |||
| Interested Trustee | ||||||
Thomas E. Faust Jr. 1958 | Trustee | 2007 | Chairman, Chief Executive Officer and President of EVC, Director and President of EV, Chief Executive Officer and President of EVM and BMR, and Director of EVD. Trustee and/or officer of 159 registered investment companies. Mr. Faust is an interested person because of his positions with EVM, BMR, EVD, EVC and EV, which are affiliates of the Trust. Directorships in the Last Five Years. Director of EVC and Hexavest Inc. (investment management firm). | |||
| Noninterested Trustees | ||||||
Mark R. Fetting 1954 | Trustee | 2016 | Private investor. Formerly held various positions at Legg Mason, Inc. (investment management firm) (2000-2012), including President, Chief Executive Officer, Director and Chairman (2008-2012), Senior Executive Vice President(2004-2008) and Executive Vice President (2001-2004). Formerly, President of Legg Mason family of funds (2001-2008). Formerly, Division President and Senior Officer of Prudential Financial Group, Inc. and related companies (investment management firm) (1991-2000). Other Directorships in the Last Five Years.None. | |||
Cynthia E. Frost 1961 | Trustee | 2014 | Private investor. Formerly, Chief Investment Officer of Brown University (university endowment) (2000-2012). Formerly, Portfolio Strategist for Duke Management Company (university endowment manager) (1995-2000). Formerly, Managing Director, Cambridge Associates (investment consulting company) (1989-1995). Formerly, Consultant, Bain and Company (management consulting firm)(1987-1989). Formerly, Senior Equity Analyst, BA Investment Management Company (1983-1985). Other Directorships in the Last Five Years.None. | |||
George J. Gorman 1952 | Trustee | 2014 | Principal at George J. Gorman LLC (consulting firm). Formerly, Senior Partner at Ernst & Young LLP (a registered public accounting firm) (1974-2009). Directorships in the Last Five Years. Formerly, Trustee of the BofA Funds Series Trust (11 funds) (2011-2014) and of the Ashmore Funds (9 funds)(2010-2014). | |||
Valerie A. Mosley 1960 | Trustee | 2014 | Chairwoman and Chief Executive Officer of Valmo Ventures (a consulting and investment firm). Former Partner and Senior Vice President, Portfolio Manager and Investment Strategist at Wellington Management Company, LLP (investment management firm) (1992-2012). Former Chief Investment Officer, PG Corbin Asset Management (1990-1992). Formerly worked in institutional corporate bond sales at Kidder Peabody (1986-1990). Other Directorships in the Last Five Years. Director of Envestnet, Inc. (provider of intelligent systems for wealth management and financial wellness) (since 2018). Director of Dynex Capital, Inc. (mortgage REIT) (since 2013). | |||
| 24 |
Eaton Vance
Dividend Builder Fund
December 31, 2019
Management and Organization — continued
| Name and Year of Birth | Position(s) with the Trust | Trustee Since(1) | Principal Occupation(s) and Directorships During Past Five Years and Other Relevant Experience | |||
| Noninterested Trustees (continued) | ||||||
William H. Park 1947 | Chairperson of the Board and Trustee | 2016 (Chairperson) 2003 (Trustee) | Private investor. Formerly, Consultant (management and transactional)(2012-2014). Formerly, Chief Financial Officer, Aveon Group L.P. (investment management firm) (2010-2011). Formerly, Vice Chairman, Commercial Industrial Finance Corp. (specialty finance company) (2006-2010). Formerly, President and Chief Executive Officer, Prizm Capital Management, LLC (investment management firm) (2002-2005). Formerly, Executive Vice President and Chief Financial Officer, United Asset Management Corporation (investment management firm) (1982-2001). Formerly, Senior Manager, Price Waterhouse (now PricewaterhouseCoopers) (a registered public accounting firm)(1972-1981). Other Directorships in the Last Five Years.None. | |||
Helen Frame Peters 1948 | Trustee | 2008 | Professor of Finance, Carroll School of Management, Boston College. Formerly, Dean, Carroll School of Management, Boston College (2000-2002). Formerly, Chief Investment Officer, Fixed Income, Scudder Kemper Investments (investment management firm) (1998-1999). Formerly, Chief Investment Officer, Equity and Fixed Income, Colonial Management Associates (investment management firm) (1991-1998). Other Directorships in the Last Five Years.None. | |||
Keith Quinton 1958 | Trustee | 2018 | Independent Investment Committee Member at New Hampshire Retirement System (since 2017). Advisory Committee member at Northfield Information Services, Inc. (risk management analytics provider) (since 2016). Formerly, Portfolio Manager and Senior Quantitative Analyst at Fidelity Investments (investment management firm) (2001-2014). Other Directorships in the Last Five Years. Director of New Hampshire Municipal Bond Bank (since 2016). | |||
Marcus L. Smith 1966 | Trustee | 2018 | Member of Posse Boston Advisory Board (foundation) (since 2015). Trustee at University of Mount Union (since 2008). Formerly, Portfolio Manager at MFS Investment Management (investment management firm) (1994-2017). Other Directorships in the Last Five Years. Director of MSCI Inc. (global provider of investment decision support tools) (since 2017). Formerly, Director of DCT Industrial Trust Inc. (logistics real estate company) (2017-2018). | |||
Susan J. Sutherland 1957 | Trustee | 2015 | Private investor. Formerly, Associate, Counsel and Partner at Skadden, Arps, Slate, Meagher & Flom LLP (law firm) (1982-2013). Other Directorships in the Last Five Years. Formerly, Director of Montpelier Re Holdings Ltd. (global provider of customized insurance and reinsurance products) (2013-2015). | |||
Scott E. Wennerholm 1959 | Trustee | 2016 | Formerly, Trustee at Wheelock College (postsecondary institution) (2012-2018). Formerly, Consultant at GF Parish Group (executive recruiting firm) (2016-2017). Formerly, Chief Operating Officer and Executive Vice President at BNY Mellon Asset Management (investment management firm) (2005-2011). Formerly, Chief Operating Officer and Chief Financial Officer at Natixis Global Asset Management (investment management firm) (1997-2004). Formerly, Vice President at Fidelity Investments Institutional Services (investment management firm) (1994-1997). Other Directorships in the Last Five Years.None. | |||
| 25 |
Eaton Vance Funds
IMPORTANT NOTICES
Privacy. The Eaton Vance organization is committed to ensuring your financial privacy. Each entity listed below has adopted a privacy policy and procedures (“Privacy Program”) Eaton Vance believes is reasonably designed to protect your personal information and to govern when and with whom Eaton Vance may share your personal information.
| • | At the time of opening an account, Eaton Vance generally requires you to provide us with certain information such as name, address, social security number, tax status, account numbers, and account balances. This information is necessary for us to both open an account for you and to allow us to satisfy legal requirements such as applicable anti-money laundering reviews and know-your-customer requirements. |
| • | On an ongoing basis, in the normal course of servicing your account, Eaton Vance may share your information with unaffiliated third parties that perform various services for Eaton Vance and/or your account. These third parties include transfer agents, custodians, broker/dealers and our professional advisers, including auditors, accountants, and legal counsel. Eaton Vance may additionally share your personal information with our affiliates. |
| • | We believe our Privacy Program is reasonably designed to protect the confidentiality of your personal information and to prevent unauthorized access to that information. |
| • | We reserve the right to change our Privacy Program at any time upon proper notification to you. You may want to review our Privacy Program periodically for changes by accessing the link on our homepage: www.eatonvance.com. |
Our pledge of protecting your personal information applies to the following entities within the Eaton Vance organization: the Eaton Vance Family of Funds, Eaton Vance Management, Eaton Vance Investment Counsel, Eaton Vance Distributors, Inc., Eaton Vance Trust Company, Eaton Vance Management (International) Limited, Eaton Vance Advisers International Limited, Eaton Vance Global Advisors Limited, Eaton Vance Management’s Real Estate Investment Group, Boston Management and Research, Calvert Research and Management, and Calvert Funds. This Privacy Notice supersedes all previously issued privacy disclosures. For more information about our Privacy Program or about how your personal information may be used, please call 1-800-262-1122.
Delivery of Shareholder Documents. The Securities and Exchange Commission (SEC) permits funds to deliver only one copy of shareholder documents, including prospectuses, proxy statements and shareholder reports, to fund investors with multiple accounts at the same residential or post office box address. This practice is often called “householding” and it helps eliminate duplicate mailings to shareholders.Eaton Vance, or your financial intermediary, may household the mailing of your documents indefinitely unless you instruct Eaton Vance, or your financial intermediary, otherwise.If you would prefer that your Eaton Vance documents not be householded, please contact Eaton Vanceat 1-800-262-1122, or contact your financial intermediary. Your instructions that householding not apply to delivery of your Eaton Vance documents will typically be effective within 30 days of receipt by Eaton Vance or your financial intermediary.
Portfolio Holdings. Each Eaton Vance Fund and its underlying Portfolio(s) (if applicable) files a schedule of portfolio holdings on Part F toForm N-PORT with the SEC for the first and third quarters of each fiscal year. The Form N-PORT will be available on the Eaton Vance website at www.eatonvance.com, by calling Eaton Vance at 1-800-262-1122 or in the EDGAR database on the SEC’s website at www.sec.gov.
Proxy Voting. From time to time, funds are required to vote proxies related to the securities held by the funds. The Eaton Vance Funds or their underlying Portfolios (if applicable) vote proxies according to a set of policies and procedures approved by the Funds’ and Portfolios’ Boards. You may obtain a description of these policies and procedures and information on how the Funds or Portfolios voted proxies relating to portfolio securities during the most recent 12-month period ended June 30, without charge, upon request, by calling 1-800-262-1122 and by accessing the SEC’s website at www.sec.gov.
| 26 |
This Page Intentionally Left Blank
This Page Intentionally Left Blank
Investment Adviser
Boston Management and Research
Two International Place
Boston, MA 02110
Administrator
Eaton Vance Management
Two International Place
Boston, MA 02110
Principal Underwriter*
Eaton Vance Distributors, Inc.
Two International Place
Boston, MA 02110
(617) 482-8260
Custodian
State Street Bank and Trust Company
State Street Financial Center, One Lincoln Street
Boston, MA 02111
Transfer Agent
BNY Mellon Investment Servicing (US) Inc.
Attn: Eaton Vance Funds
P.O. Box 9653
Providence, RI 02940-9653
(800) 262-1122
Independent Registered Public Accounting Firm
Deloitte & Touche LLP
200 Berkeley Street
Boston, MA 02116-5022
Fund Offices
Two International Place
Boston, MA 02110
| * | FINRA BrokerCheck. Investors may check the background of their Investment Professional by contacting the Financial Industry Regulatory Authority (FINRA). FINRA BrokerCheck is a free tool to help investors check the professional background of current and former FINRA-registered securities firms and brokers. FINRA BrokerCheck is available by calling 1-800-289-9999 and at www.FINRA.org. The FINRA BrokerCheck brochure describing this program is available to investors at www.FINRA.org. |

159 12.31.19

Eaton Vance
Greater India Fund
Annual Report
December 31, 2019
Important Note. Beginning on January 1, 2021, as permitted by regulations adopted by the Securities and Exchange Commission, paper copies of the Fund’s annual and semi-annual shareholder reports will no longer be sent by mail unless you specifically request paper copies of the reports. Instead, the reports will be made available on the Fund’s website (eatonvance.com/funddocuments), and you will be notified by mail each time a report is posted and provided with a website address to access the report.
If you already elected to receive shareholder reports electronically, you will not be affected by this change and you need not take any action. If you are a direct investor, you may elect to receive shareholder reports and other communications from the Fund electronically by signing up for e-Delivery at eatonvance.com/edelivery. If you own your shares through a financial intermediary (such as a broker-dealer or bank), you must contact your financial intermediary to sign up.
You may elect to receive all future Fund shareholder reports in paper free of charge. If you are a direct investor, you can inform the Fund that you wish to continue receiving paper copies of your shareholder reports by calling 1-800-262-1122. If you own these shares through a financial intermediary, you must contact your financial intermediary or follow instructions included with this disclosure, if applicable, to elect to continue to receive paper copies of your shareholder reports. Your election to receive reports in paper will apply to all Eaton Vance funds held directly or to all funds held through your financial intermediary, as applicable.

Commodity Futures Trading Commission Registration. Effective December 31, 2012, the Commodity Futures Trading Commission (“CFTC”) adopted certain regulatory changes that subject registered investment companies and advisers to regulation by the CFTC if a fund invests more than a prescribed level of its assets in certain CFTC-regulated instruments (including futures, certain options and swap agreements) or markets itself as providing investment exposure to such instruments. The Fund has claimed an exclusion from the definition of the term “commodity pool operator” under the Commodity Exchange Act. Accordingly, neither the Fund nor the adviser with respect to the operation of the Fund is subject to CFTC regulation. Because of its management of other strategies, the Fund’s adviser is registered with the CFTC as a commodity pool operator and a commodity trading advisor.
Fund shares are not insured by the FDIC and are not deposits or other obligations of, or guaranteed by, any depository institution. Shares are subject to investment risks, including possible loss of principal invested.
This report must be preceded or accompanied by a current summary prospectus or prospectus. Before investing, investors should consider carefully the investment objective, risks, and charges and expenses of a mutual fund. This and other important information is contained in the summary prospectus and prospectus, which can be obtained from a financial intermediary. Prospective investors should read the prospectus carefully before investing. For further information, please call1-800-262-1122.
Annual ReportDecember 31, 2019
Eaton Vance
Greater India Fund
Table of Contents
Management’s Discussion of Fund Performance | 2 | |||
Performance | 3 | |||
Fund Profile | 4 | |||
Endnotes and Additional Disclosures | 5 | |||
Fund Expenses | 6 | |||
Financial Statements | 7 | |||
Report of Independent Registered Public Accounting Firm | 17 and 29 | |||
Federal Tax Information | 18 | |||
Management and Organization | 30 | |||
Important Notices | 33 | |||
Eaton Vance
Greater India Fund
December 31, 2019
Management’s Discussion of Fund Performance1
Economic and Market Conditions
During an election year in which Prime Minister Modi’s Bharatiya Janata Party(BJP)-led National Democratic Alliance returned to power in May 2019, India’s stock market reacted positively during the12-month period ended December 31, 2019. Despite geopolitical tensions with Pakistan, uncertainties over the elections and government budgets, the MSCI India Index (the Index)2 returned 7.58% during the period.
In July 2019, India’s finance minister presented a fiscal year budget that focused oninvestment-led growth instead of providing a near-term consumption stimulus. Following the budget announcement, the Indian equity market corrected substantially, eliminatingyear-to-date gains primary due to concerns related to proposed surcharge increases on high-income individuals including a segment of foreign investors.
Following the budget announcement, the government also announced a series of measures to boost the economy and revive investor sentiment. Those measures included enhancing banking liquidity and credit; support for the automotive sector; public sector bank consolidation; improved governance standards; and relief for exporters and the housing sector. The biggest surprise was a domestic corporate tax rate cut — from a peak rate of 30% down to 22% — that helped trigger the biggestsingle-day jump in stock prices in over a decade.
In October 2019, the Reserve Bank of India reduced its repo rate — the rate at which the central bank lends money to commercial banks — for the fifth time during the year, lowering it by 135 basis points. In November, India’s Finance Minister announced the creation of a INR 250 billion fund to provide priority debt financing for the completion of stalled housing projects that are in the affordable/middle-income housing sector. This action was considered positive for real-estate focusednon-banking finance companies in need of liquidity to help revive stuck projects.
India’s real GDP growth decelerated from 5.0% in the second quarter of 2019, to 4.5% in the third quarter of 2019 on a year-over-year basis, which was in line with consensus expectations.
Fund Performance
For the12-month period ended December 31, 2019, Eaton Vance Greater India Fund (the Fund) returned 10.46% for Class A shares at net asset value (NAV), outperforming the Index, which returned 7.58%.
Strong stock selection drove the Fund’s outperformance during the period, while sector allocation modestly detracted. Stock selection was strongest in the health care, consumer discretionary, financials and communication services sectors. An overweight allocation to financials and an underweight allocation to utilities contributed to relative performance versus the Index.
Within the communication services sector, an overweight position in Info Edge India, Ltd. (Info Edge), a leading Internet company, was the largest contributor to returns relative to the Index. Info Edge’s naukri.com is a leader in the online job search market in India. The stock outperformed the interactive media & services market on the back of robust billings growth during the period.
Anout-of-Index position in Abbott India, Ltd., a top pharmaceutical manufacturer within India’s health care sector, contributed to returns during the period. The stock outperformed as the company reported strong quarterly results and the company’s leading brands grew faster than competitors’ during the period.
Stock selection was weakest in the materials and information technology sectors, while certain holdings within the communication services and energy sectors were also detractors. An underweight allocation to energy was the largest detractor from a sector allocation standpoint during the period.
Within the energy sector, an underweight position in Reliance Industries, Ltd. (Reliance), a refiner and manufacturer of petro-chemicals, was the largest detractor relative to the Index. One of the largest companies in India by market capitalization, Reliance’s stock price rose on the back of strong business performance during the period.
An underweight position in Bharti Airtel, Ltd., a telecom services provider, detracted from returns relative to the Index. The Indian telecom industry has faced intensifying competition over the past three years, resulting in shrinking revenues and a tightening of margins causing industry consolidation. The company’s stock price outperformed the industry on the back of strong business fundamentals.
See Endnotes and Additional Disclosures in this report.
Past performance is no guarantee of future results. Returns are historical and are calculated by determining the percentage change in net asset value (NAV) or offering price (as applicable) with all distributions reinvested. Investment return and principal value will fluctuate so that shares, when redeemed, may be worth more or less than their original cost. Performance for periods less than or equal to one year is cumulative. Performance is for the stated time period only; due to market volatility, current Fund performance may be lower or higher than the quoted return. For performance as of the most recentmonth-end, please refer to eatonvance.com.
| 2 |
Eaton Vance
Greater India Fund
December 31, 2019
Performance2,3
Portfolio ManagerHiren Dasani, CFA, of Goldman Sachs Asset Management, L.P. (GSAM)
| % Average Annual Total Returns | Class Inception Date | Performance Inception Date | One Year | Five Years | Ten Years | |||||||||||||||
Class A at NAV | 05/02/1994 | 05/02/1994 | 10.46 | % | 6.51 | % | 5.04 | % | ||||||||||||
Class A with 5.75% Maximum Sales Charge | — | — | 4.12 | 5.25 | 4.43 | |||||||||||||||
Class C at NAV | 07/07/2006 | 05/02/1994 | 9.69 | 5.77 | 4.33 | |||||||||||||||
Class C with 1% Maximum Sales Charge | — | — | 8.69 | 5.77 | 4.33 | |||||||||||||||
Class I at NAV | 10/01/2009 | 05/02/1994 | 10.79 | 6.83 | 5.37 | |||||||||||||||
MSCI India Index | — | — | 7.58 | % | 5.06 | % | 3.85 | % | ||||||||||||
| % Total Annual Operating Expense Ratios4 | Class A | Class C | Class I | |||||||||||||||||
| 1.62 | % | 2.32 | % | 1.32 | % | |||||||||||||||
Growth of $10,000
This graph shows the change in value of a hypothetical investment of $10,000 in Class A of the Fund for the period indicated. For comparison, the same investment is shown in the indicated index.
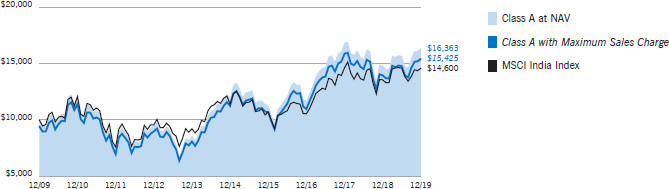
| Growth of Investment | Amount Invested | Period Beginning | At NAV | With Maximum Sales Charge | ||||||||||||
Class C | $ | 10,000 | 12/31/2009 | $ | 15,276 | N.A. | ||||||||||
Class I | $ | 250,000 | 12/31/2009 | $ | 421,902 | N.A. | ||||||||||
See Endnotes and Additional Disclosures in this report.
Past performance is no guarantee of future results. Returns are historical and are calculated by determining the percentage change in net asset value (NAV) or offering price (as applicable) with all distributions reinvested. Investment return and principal value will fluctuate so that shares, when redeemed, may be worth more or less than their original cost. Performance for periods less than or equal to one year is cumulative. Performance is for the stated time period only; due to market volatility, current Fund performance may be lower or higher than the quoted return. For performance as of the most recentmonth-end, please refer to eatonvance.com.
| 3 |
Eaton Vance
Greater India Fund
December 31, 2019
Fund Profile5
Sector Allocation (% of net assets)6
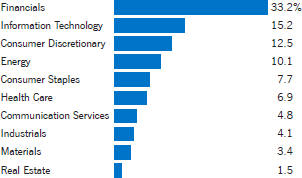
Top 10 Holdings (% of net assets)6
Infosys, Ltd. | 9.2 | % | ||
Reliance Industries, Ltd. | 7.2 | |||
ICICI Bank, Ltd. | 7.0 | |||
Axis Bank, Ltd. | 6.4 | |||
Maruti Suzuki India, Ltd. | 5.4 | |||
Housing Development Finance Corp., Ltd. | 4.8 | |||
Bajaj Finance, Ltd. | 4.2 | |||
HDFC Bank, Ltd. | 4.1 | |||
Info Edge India, Ltd. | 2.9 | |||
Bharat Petroleum Corp., Ltd. | 2.9 | |||
Total | 54.1 | % | ||
See Endnotes and Additional Disclosures in this report.
| 4 |
Eaton Vance
Greater India Fund
December 31, 2019
Endnotes and Additional Disclosures
| 1 | The views expressed in this report are those of the portfolio manager(s) and are current only through the date stated at the top of this page. These views are subject to change at any time based upon market or other conditions, and Eaton Vance and the Fund(s) disclaim any responsibility to update such views. These views may not be relied upon as investment advice and, because investment decisions are based on many factors, may not be relied upon as an indication of trading intent on behalf of any Eaton Vance fund. This commentary may contain statements that are not historical facts, referred to as “forward looking statements.” The Fund’s actual future results may differ significantly from those stated in any forward looking statement, depending on factors such as changes in securities or financial markets or general economic conditions, the volume of sales and purchases of Fund shares, the continuation of investment advisory, administrative and service contracts, and other risks discussed from time to time in the Fund’s filings with the Securities and Exchange Commission. |
| 2 | MSCI India Index is an unmanaged index of common stocks traded in the India market. MSCI indexes are net of foreign withholding taxes. Source: MSCI. MSCI data may not be reproduced or used for any other purpose. MSCI provides no warranties, has not prepared or approved this report, and has no liability hereunder. Unless otherwise stated, index returns do not reflect the effect of any applicable sales charges, commissions, expenses, taxes or leverage, as applicable. It is not possible to invest directly in an index. |
| 3 | Total Returns at NAV do not include applicable sales charges. If sales charges were deducted, the returns would be lower. Total Returns shown with maximum sales charge reflect the stated maximum sales charge. Unless otherwise stated, performance does not reflect the deduction of taxes on Fund distributions or redemptions of Fund shares. |
Effective September 15, 2016, Goldman Sachs Asset Management International (GSAM beginning October 19, 2017) begansub-advising the Fund. Performance prior to September 15, 2016, reflects the Fund’s performance under a formersub-adviser. |
| 4 | Source: Fund prospectus. The expense ratios for the current reporting period can be found in the Financial Highlights section of this report. |
| 5 | Fund primarily invests in an affiliated investment company (Portfolio) with the same objective(s) and policies as the Fund and may also invest directly. Unless otherwise noted, references to investments are to the aggregate holdings of the Fund and the Portfolio. |
| 6 | Excludes cash and cash equivalents. |
Fund profile subject to change due to active management. |
| 5 |
Eaton Vance
Greater India Fund
December 31, 2019
Fund Expenses
Example: As a Fund shareholder, you incur two types of costs: (1) transaction costs, including sales charges (loads) on purchases and redemption fees (if applicable); and (2) ongoing costs, including management fees; distribution and/or service fees; and other Fund expenses. This Example is intended to help you understand your ongoing costs (in dollars) of Fund investing and to compare these costs with the ongoing costs of investing in other mutual funds. The Example is based on an investment of $1,000 invested at the beginning of the period and held for the entire period (July 1, 2019 – December 31, 2019).
Actual Expenses: The first section of the table below provides information about actual account values and actual expenses. You may use the information in this section, together with the amount you invested, to estimate the expenses that you paid over the period. Simply divide your account value by $1,000 (for example, an $8,600 account value divided by $1,000 = 8.6), then multiply the result by the number in the first section under the heading entitled “Expenses Paid During Period” to estimate the expenses you paid on your account during this period.
Hypothetical Example for Comparison Purposes: The second section of the table below provides information about hypothetical account values and hypothetical expenses based on the actual Fund expense ratio and an assumed rate of return of 5% per year (before expenses), which is not the actual Fund return. The hypothetical account values and expenses may not be used to estimate the actual ending account balance or expenses you paid for the period. You may use this information to compare the ongoing costs of investing in your Fund and other funds. To do so, compare this 5% hypothetical example with the 5% hypothetical examples that appear in the shareholder reports of the other funds.
Please note that the expenses shown in the table are meant to highlight your ongoing costs only and do not reflect any transactional costs, such as sales charges (loads) or redemption fees (if applicable). Therefore, the second section of the table is useful in comparing ongoing costs only, and will not help you determine the relative total costs of owning different funds. In addition, if these transactional costs were included, your costs would be higher.
Beginning Account Value | Ending Account Value | Expenses Paid During Period* | Annualized Expense | |||||||||||||
Actual | ||||||||||||||||
Class A | $ | 1,000.00 | $ | 1,043.30 | $ | 8.29 | 1.61 | % | ||||||||
Class C | $ | 1,000.00 | $ | 1,039.60 | $ | 11.88 | 2.31 | % | ||||||||
Class I | $ | 1,000.00 | $ | 1,045.20 | $ | 6.75 | 1.31 | % | ||||||||
Hypothetical | ||||||||||||||||
(5% return per year before expenses) | ||||||||||||||||
Class A | $ | 1,000.00 | $ | 1,017.10 | $ | 8.19 | 1.61 | % | ||||||||
Class C | $ | 1,000.00 | $ | 1,013.60 | $ | 11.72 | 2.31 | % | ||||||||
Class I | $ | 1,000.00 | $ | 1,018.60 | $ | 6.67 | 1.31 | % | ||||||||
| * | Expenses are equal to the Fund’s annualized expense ratio for the indicated Class, multiplied by the average account value over the period, multiplied by 184/365 (to reflect theone-half year period). The Example assumes that the $1,000 was invested at the net asset value per share determined at the close of business on June 30, 2019. The Example reflects the expenses of both the Fund and the Portfolio. |
| 6 |
Eaton Vance
Greater India Fund
December 31, 2019
Statement of Assets and Liabilities
| Assets | December 31, 2019 | |||
Investment in Greater India Portfolio, at value (identified cost, $156,458,064) | $ | 216,810,518 | ||
Receivable for Fund shares sold | 51,090 | |||
Total assets | $ | 216,861,608 | ||
| Liabilities |
| |||
Payable for Fund shares redeemed | $ | 683,858 | ||
Payable to affiliates: | ||||
Administration fee | 27,538 | |||
Distribution and service fees | 51,729 | |||
Trustees’ fees | 125 | |||
Accrued expenses | 104,171 | |||
Total liabilities | $ | 867,421 | ||
Net Assets | $ | 215,994,187 | ||
| Sources of Net Assets |
| |||
Paid-in capital | $ | 159,601,422 | ||
Distributable earnings | 56,392,765 | |||
Total | $ | 215,994,187 | ||
| Class A Shares |
| |||
Net Assets | $ | 163,335,273 | ||
Shares Outstanding | 4,761,639 | |||
Net Asset Value and Redemption Price Per Share | ||||
(net assets ÷ shares of beneficial interest outstanding) | $ | 34.30 | ||
Maximum Offering Price Per Share | ||||
(100 ÷ 94.25 of net asset value per share) | $ | 36.39 | ||
| Class C Shares |
| |||
Net Assets | $ | 11,898,180 | ||
Shares Outstanding | 407,028 | |||
Net Asset Value and Offering Price Per Share* | ||||
(net assets ÷ shares of beneficial interest outstanding) | $ | 29.23 | ||
| Class I Shares |
| |||
Net Assets | $ | 40,760,734 | ||
Shares Outstanding | 1,158,186 | |||
Net Asset Value, Offering Price and Redemption Price Per Share | ||||
(net assets ÷ shares of beneficial interest outstanding) | $ | 35.19 | ||
On sales of $50,000 or more, the offering price of Class A shares is reduced.
| * | Redemption price per share is equal to the net asset value less any applicable contingent deferred sales charge. |
| 7 | See Notes to Financial Statements. |
Eaton Vance
Greater India Fund
December 31, 2019
Statement of Operations
| Investment Income | Year Ended December 31, 2019 | |||
Dividends allocated from Portfolio | $ | 2,158,676 | ||
Interest allocated from Portfolio | 70,434 | |||
Expenses allocated from Portfolio | (2,081,503 | ) | ||
Total investment income from Portfolio | $ | 147,607 | ||
| Expenses | ||||
Administration fee | $ | 317,131 | ||
Distribution and service fees | ||||
Class A | 477,742 | |||
Class B | 2,677 | |||
Class C | 137,525 | |||
Trustees’ fees and expenses | 500 | |||
Custodian fee | 24,742 | |||
Transfer and dividend disbursing agent fees | 238,842 | |||
Legal and accounting services | 32,884 | |||
Printing and postage | 45,720 | |||
Registration fees | 58,535 | |||
Miscellaneous | 14,251 | |||
Total expenses | $ | 1,350,549 | ||
Net investment loss | $ | (1,202,942 | ) | |
| Realized and Unrealized Gain (Loss) from Portfolio | ||||
Net realized gain (loss) — | ||||
Investment transactions | $ | 2,289,839 | ||
Financial futures contracts | 12,955 | |||
Foreign currency transactions | (69,182 | ) | ||
Net realized gain | $ | 2,233,612 | ||
Change in unrealized appreciation (depreciation) — | ||||
Investments | $ | 20,051,173 | ||
Financial futures contracts | (109,516 | ) | ||
Foreign currency | (4,063 | ) | ||
Net change in unrealized appreciation (depreciation) | $ | 19,937,594 | ||
Net realized and unrealized gain | $ | 22,171,206 | ||
Net increase in net assets from operations | $ | 20,968,264 | ||
| 8 | See Notes to Financial Statements. |
Eaton Vance
Greater India Fund
December 31, 2019
Statements of Changes in Net Assets
| Year Ended December 31, | ||||||||
| Increase (Decrease) in Net Assets | 2019 | 2018 | ||||||
From operations — | ||||||||
Net investment loss | $ | (1,202,942 | ) | $ | (1,121,824 | ) | ||
Net realized gain | 2,233,612 | 10,201,255 | ||||||
Net change in unrealized appreciation (depreciation) | 19,937,594 | (41,771,783 | ) | |||||
Net increase (decrease) in net assets from operations | $ | 20,968,264 | $ | (32,692,352 | ) | |||
Distributions to shareholders — | ||||||||
Class A | $ | (4,591,828 | ) | $ | (1,884,637 | ) | ||
Class B | (8,912 | ) | (13,568 | ) | ||||
Class C | (433,321 | ) | (325,992 | ) | ||||
Class I | (1,059,604 | ) | (459,954 | ) | ||||
Total distributions to shareholders | $ | (6,093,665 | ) | $ | (2,684,151 | ) | ||
Transactions in shares of beneficial interest — | ||||||||
Proceeds from sale of shares | ||||||||
Class A | $ | 8,144,780 | $ | 11,152,692 | ||||
Class B | 736 | 5,913 | ||||||
Class C | 1,654,639 | 1,727,576 | ||||||
Class I | 17,577,702 | 13,797,287 | ||||||
Net asset value of shares issued to shareholders in payment of distributions declared | ||||||||
Class A | 4,145,063 | 1,696,856 | ||||||
Class B | 8,067 | 12,588 | ||||||
Class C | 376,242 | 299,083 | ||||||
Class I | 864,768 | 368,069 | ||||||
Cost of shares redeemed | ||||||||
Class A | (22,105,068 | ) | (28,089,646 | ) | ||||
Class B | (50,711 | ) | (182,325 | ) | ||||
Class C | (4,331,484 | ) | (6,291,868 | ) | ||||
Class I | (17,968,399 | ) | (19,199,899 | ) | ||||
Net asset value of shares converted(1) | ||||||||
Class A | 8,818,338 | 1,085,292 | ||||||
Class B | (564,214 | ) | (1,085,292 | ) | ||||
Class C | (8,254,124 | ) | — | |||||
Net decrease in net assets from Fund share transactions | $ | (11,683,665 | ) | $ | (24,703,674 | ) | ||
Net increase (decrease) in net assets | $ | 3,190,934 | $ | (60,080,177 | ) | |||
| Net Assets |
| |||||||
At beginning of year | $ | 212,803,253 | $ | 272,883,430 | ||||
At end of year | $ | 215,994,187 | $ | 212,803,253 | ||||
| (1) | Includes the conversion of Class B to Class A shares at the close of business on August 15, 2019 upon the termination of Class B. |
| 9 | See Notes to Financial Statements. |
Eaton Vance
Greater India Fund
December 31, 2019
Financial Highlights
| Class A | ||||||||||||||||||||
| Year Ended December 31, | ||||||||||||||||||||
| 2019 | 2018 | 2017 | 2016 | 2015 | ||||||||||||||||
Net asset value — Beginning of year | $ | 32.020 | $ | 36.830 | $ | 26.300 | $ | 25.770 | $ | 27.310 | ||||||||||
| Income (Loss) From Operations | ||||||||||||||||||||
Net investment income (loss)(1) | $ | (0.188 | ) | $ | (0.150 | ) | $ | 0.016 | $ | (0.200 | ) | $ | (0.245 | ) | ||||||
Net realized and unrealized gain (loss) | 3.424 | (4.284 | ) | 11.737 | 0.878 | (1.090 | ) | |||||||||||||
Total income (loss) from operations | $ | 3.236 | $ | (4.434 | ) | $ | 11.753 | $ | 0.678 | $ | (1.335 | ) | ||||||||
| Less Distributions | ||||||||||||||||||||
From net investment income | $ | — | $ | (0.376 | ) | $ | (1.223 | ) | $ | (0.148 | ) | $ | (0.205 | ) | ||||||
From net realized gain | (0.956 | ) | — | — | — | — | ||||||||||||||
Total distributions | $ | (0.956 | ) | $ | (0.376 | ) | $ | (1.223 | ) | $ | (0.148 | ) | $ | (0.205 | ) | |||||
Net asset value — End of year | $ | 34.300 | $ | 32.020 | $ | 36.830 | $ | 26.300 | $ | 25.770 | ||||||||||
Total Return(2) | 10.46 | % | (12.13 | )% | 44.80 | % | 2.64 | %(3) | (4.96 | )%(3) | ||||||||||
| Ratios/Supplemental Data |
| |||||||||||||||||||
Net assets, end of year (000’s omitted) | $ | 163,335 | $ | 152,967 | $ | 192,016 | $ | 149,950 | $ | 172,386 | ||||||||||
Ratios (as a percentage of average daily net assets):(4) | ||||||||||||||||||||
Expenses(5) | 1.63 | % | 1.62 | % | 1.68 | % | 1.88 | %(3) | 1.88 | %(3) | ||||||||||
Net investment income (loss) | (0.58 | )% | (0.44 | )% | 0.05 | % | (0.75 | )% | (0.88 | )% | ||||||||||
Portfolio Turnover of the Portfolio | 21 | % | 29 | % | 25 | % | 91 | % | 30 | % | ||||||||||
| (1) | Computed using average shares outstanding. |
| (2) | Returns are historical and are calculated by determining the percentage change in net asset value with all distributions reinvested and do not reflect the effect of sales charges. |
| (3) | The investment adviser andsub-adviser of the Portfolio reimbursed certain operating expenses (equal to 0.02% and 0.02% of average daily net assets for the years ended December 31, 2016 and 2015, respectively). Absent this reimbursement, total return would be lower. |
| (4) | Includes the Fund’s share of the Portfolio’s allocated expenses. |
| (5) | Excludes the effect of custody fee credits, if any, of less than 0.005%. Effective September 1, 2015, custody fee credits, which were earned on cash deposit balances, were discontinued by the custodian. |
| 10 | See Notes to Financial Statements. |
Eaton Vance
Greater India Fund
December 31, 2019
Financial Highlights — continued
| Class C | ||||||||||||||||||||
| Year Ended December 31, | ||||||||||||||||||||
| 2019 | 2018 | 2017 | 2016 | 2015 | ||||||||||||||||
Net asset value — Beginning of year | $ | 27.620 | $ | 32.050 | $ | 23.020 | $ | 22.580 | $ | 24.120 | ||||||||||
| Income (Loss) From Operations | ||||||||||||||||||||
Net investment loss(1) | $ | (0.363 | ) | $ | (0.334 | ) | $ | (0.186 | ) | $ | (0.336 | ) | $ | (0.383 | ) | |||||
Net realized and unrealized gain (loss) | 2.929 | (3.720 | ) | 10.247 | 0.776 | (0.954 | ) | |||||||||||||
Total income (loss) from operations | $ | 2.566 | $ | (4.054 | ) | $ | 10.061 | $ | 0.440 | $ | (1.337 | ) | ||||||||
| Less Distributions | ||||||||||||||||||||
From net investment income | $ | — | $ | (0.376 | ) | $ | (1.031 | ) | $ | — | $ | (0.203 | ) | |||||||
From net realized gain | (0.956 | ) | — | — | — | — | ||||||||||||||
Total distributions | $ | (0.956 | ) | $ | (0.376 | ) | $ | (1.031 | ) | $ | — | $ | (0.203 | ) | ||||||
Net asset value — End of year | $ | 29.230 | $ | 27.620 | $ | 32.050 | $ | 23.020 | $ | 22.580 | ||||||||||
Total Return(2) | 9.69 | % | (12.76 | )% | 43.81 | % | 1.95 | %(3) | (5.63 | )%(3) | ||||||||||
| Ratios/Supplemental Data |
| |||||||||||||||||||
Net assets, end of year (000’s omitted) | $ | 11,898 | $ | 21,891 | $ | 30,195 | $ | 22,335 | $ | 28,276 | ||||||||||
Ratios (as a percentage of average daily net assets):(4) | ||||||||||||||||||||
Expenses(5) | 2.33 | % | 2.32 | % | 2.38 | % | 2.58 | %(3) | 2.58 | %(3) | ||||||||||
Net investment loss | (1.30 | )% | (1.14 | )% | (0.65 | )% | (1.44 | )% | (1.56 | )% | ||||||||||
Portfolio Turnover of the Portfolio | 21 | % | 29 | % | 25 | % | 91 | % | 30 | % | ||||||||||
| (1) | Computed using average shares outstanding. |
| (2) | Returns are historical and are calculated by determining the percentage change in net asset value with all distributions reinvested and do not reflect the effect of sales charges. |
| (3) | The investment adviser andsub-adviser of the Portfolio reimbursed certain operating expenses (equal to 0.02% and 0.02% of average daily net assets for the years ended December 31, 2016 and 2015, respectively). Absent this reimbursement, total return would be lower. |
| (4) | Includes the Fund’s share of the Portfolio’s allocated expenses. |
| (5) | Excludes the effect of custody fee credits, if any, of less than 0.005%. Effective September 1, 2015, custody fee credits, which were earned on cash deposit balances, were discontinued by the custodian. |
| 11 | See Notes to Financial Statements. |
Eaton Vance
Greater India Fund
December 31, 2019
Financial Highlights — continued
| Class I | ||||||||||||||||||||
| Year Ended December 31, | ||||||||||||||||||||
| 2019 | 2018 | 2017 | 2016 | 2015 | ||||||||||||||||
Net asset value — Beginning of year | $ | 32.730 | $ | 37.520 | $ | 26.770 | $ | 26.230 | $ | 27.710 | ||||||||||
| Income (Loss) From Operations | ||||||||||||||||||||
Net investment income (loss)(1) | $ | (0.092 | ) | $ | (0.047 | )�� | $ | 0.140 | $ | (0.126 | ) | $ | (0.166 | ) | ||||||
Net realized and unrealized gain (loss) | 3.508 | (4.367 | ) | 11.936 | 0.900 | (1.108 | ) | |||||||||||||
Total income (loss) from operations | $ | 3.416 | $ | (4.414 | ) | $ | 12.076 | $ | 0.774 | $ | (1.274 | ) | ||||||||
| Less Distributions | ||||||||||||||||||||
From net investment income | $ | — | $ | (0.376 | ) | $ | (1.326 | ) | $ | (0.234 | ) | $ | (0.206 | ) | ||||||
From net realized gain | (0.956 | ) | — | — | — | — | ||||||||||||||
Total distributions | $ | (0.956 | ) | $ | (0.376 | ) | $ | (1.326 | ) | $ | (0.234 | ) | $ | (0.206 | ) | |||||
Net asset value — End of year | $ | 35.190 | $ | 32.730 | $ | 37.520 | $ | 26.770 | $ | 26.230 | ||||||||||
Total Return(2) | 10.79 | % | (11.85 | )% | 45.22 | % | 2.97 | %(3) | (4.70 | )%(3) | ||||||||||
| Ratios/Supplemental Data |
| |||||||||||||||||||
Net assets, end of year (000’s omitted) | $ | 40,761 | $ | 37,330 | $ | 48,595 | $ | 26,866 | $ | 29,959 | ||||||||||
Ratios (as a percentage of average daily net assets):(4) | ||||||||||||||||||||
Expenses(5) | 1.33 | % | 1.32 | % | 1.38 | % | 1.58 | %(3) | 1.58 | %(3) | ||||||||||
Net investment income (loss) | (0.27 | )% | (0.14 | )% | 0.41 | % | (0.46 | )% | (0.59 | )% | ||||||||||
Portfolio Turnover of the Portfolio | 21 | % | 29 | % | 25 | % | 91 | % | 30 | % | ||||||||||
| (1) | Computed using average shares outstanding. |
| (2) | Returns are historical and are calculated by determining the percentage change in net asset value with all distributions reinvested. |
| (3) | The investment adviser andsub-adviser of the Portfolio reimbursed certain operating expenses (equal to 0.02% and 0.02% of average daily net assets for the years ended December 31, 2016 and 2015, respectively). Absent this reimbursement, total return would be lower. |
| (4) | Includes the Fund’s share of the Portfolio’s allocated expenses. |
| (5) | Excludes the effect of custody fee credits, if any, of less than 0.005%. Effective September 1, 2015, custody fee credits, which were earned on cash deposit balances, were discontinued by the custodian. |
| 12 | See Notes to Financial Statements. |
Eaton Vance
Greater India Fund
December 31, 2019
Notes to Financial Statements
1 Significant Accounting Policies
Eaton Vance Greater India Fund (the Fund) is anon-diversified series of Eaton Vance Special Investment Trust (the Trust). The Trust is a Massachusetts business trust registered under the Investment Company Act of 1940, as amended (the 1940 Act), as anopen-end management investment company. The Fund offers three classes of shares. Class A shares are generally sold subject to a sales charge imposed at time of purchase. Class C shares are sold at net asset value and are generally subject to a contingent deferred sales charge (see Note 5). Effective January 25, 2019, Class C shares generally automatically convert to Class A shares ten years after their purchase as described in the Fund’s prospectus. Class I shares are sold at net asset value and are not subject to a sales charge. The Fund previously offered Class B shares, which beginning January 1, 2012, were only available for purchase upon exchange from another Eaton Vance fund or through reinvestment of distributions. Class B shares automatically converted to Class A shares eight years after their purchase as described in the Fund’s prospectus. At the close of business on August 15, 2019, Class B shares were converted to Class A shares and Class B was terminated. Each class represents apro-rata interest in the Fund, but votes separately on class-specific matters and (as noted below) is subject to different expenses. Realized and unrealized gains and losses and net investment income and losses, other than class-specific expenses, are allocated daily to each class of shares based on the relative net assets of each class to the total net assets of the Fund. Each class of shares differs in its distribution plan and certain other class-specific expenses. The Fund invests all of its investable assets in interests in Greater India Portfolio (the Portfolio), a Massachusetts business trust, having the same investment objective and policies as the Fund. The value of the Fund’s investment in the Portfolio reflects the Fund’s proportionate interest in the net assets of the Portfolio (99.9% at December 31, 2019). The performance of the Fund is directly affected by the performance of the Portfolio. The financial statements of the Portfolio, including the portfolio of investments, are included elsewhere in this report and should be read in conjunction with the Fund’s financial statements.
The following is a summary of significant accounting policies of the Fund. The policies are in conformity with accounting principles generally accepted in the United States of America (U.S. GAAP). The Fund is an investment company and follows accounting and reporting guidance in the Financial Accounting Standards Board (FASB) Accounting Standards Codification Topic 946.
A Investment Valuation — Valuation of securities by the Portfolio is discussed in Note 1A of the Portfolio’s Notes to Financial Statements, which are included elsewhere in this report.
B Income — The Fund’s net investment income or loss consists of the Fund’spro-rata share of the net investment income or loss of the Portfolio, less all actual and accrued expenses of the Fund.
C Federal and Other Taxes — The Fund’s policy is to comply with the provisions of the Internal Revenue Code applicable to regulated investment companies and to distribute to shareholders each year substantially all of its net investment income, and all or substantially all of its net realized capital gains. Accordingly, no provision for federal income or excise tax is necessary.
In addition to the requirements of the Internal Revenue Code, the Fund may also be required to recognize itspro-rata share of the capital gains taxes incurred by the Portfolio. In doing so, the daily net asset value would reflect the Fund’spro-rata share of the estimated reserve for such taxes incurred by the Portfolio.
As of December 31, 2019, the Fund had no uncertain tax positions that would require financial statement recognition,de-recognition, or disclosure. The Fund files a U.S. federal income tax return annually after its fiscalyear-end, which is subject to examination by the Internal Revenue Service for a period of three years from the date of filing.
D Expenses — The majority of expenses of the Trust are directly identifiable to an individual fund. Expenses which are not readily identifiable to a specific fund are allocated taking into consideration, among other things, the nature and type of expense and the relative size of the funds.
E Use of Estimates — The preparation of the financial statements in conformity with U.S. GAAP requires management to make estimates and assumptions that affect the reported amounts of assets and liabilities at the date of the financial statements and the reported amounts of income and expense during the reporting period. Actual results could differ from those estimates.
F Indemnifications — Under the Trust’s organizational documents, its officers and Trustees may be indemnified against certain liabilities and expenses arising out of the performance of their duties to the Fund. Under Massachusetts law, if certain conditions prevail, shareholders of a Massachusetts business trust (such as the Trust) could be deemed to have personal liability for the obligations of the Trust. However, the Trust’s Declaration of Trust contains an express disclaimer of liability on the part of Fund shareholders and theBy-laws provide that the Trust shall assume, upon request by the shareholder, the defense on behalf of any Fund shareholders. Moreover, theBy-laws also provide for indemnification out of Fund property of any shareholder held personally liable solely by reason of being or having been a shareholder for all loss or expense arising from such liability. Additionally, in the normal course of business, the Fund enters into agreements with service providers that may contain indemnification clauses. The Fund’s maximum exposure under these arrangements is unknown as this would involve future claims that may be made against the Fund that have not yet occurred.
G Other — Investment transactions are accounted for on a trade date basis.
| 13 |
Eaton Vance
Greater India Fund
December 31, 2019
Notes to Financial Statements — continued
2 Distributions to Shareholders and Income Tax Information
It is the present policy of the Fund to make at least one distribution annually (normally in December) of all or substantially all of its net investment income and to distribute annually all or substantially all of its net realized capital gains. Distributions to shareholders are recorded on theex-dividend date. Distributions are declared separately for each class of shares. Shareholders may reinvest income and capital gain distributions in additional shares of the same class of the Fund at the net asset value as of theex-dividend date or, at the election of the shareholder, receive distributions in cash. Distributions to shareholders are determined in accordance with income tax regulations, which may differ from U.S. GAAP. As required by U.S. GAAP, only distributions in excess of tax basis earnings and profits are reported in the financial statements as a return of capital. Permanent differences between book and tax accounting relating to distributions are reclassified topaid-in capital. For tax purposes, distributions from short-term capital gains are considered to be from ordinary income.
The tax character of distributions declared for the years ended December 31, 2019 and December 31, 2018 was as follows:
| Year Ended December 31, | ||||||||
| 2019 | 2018 | |||||||
Ordinary income | $ | — | $ | 2,684,151 | ||||
Long-term capital gains | $ | 6,093,665 | $ | — | ||||
During the year ended December 31, 2019, distributable earnings was increased by $1,288,424 andpaid-in capital was decreased by $1,288,424 due to differences between book and tax accounting for net operating losses. These reclassifications had no effect on the net assets or net asset value per share of the Fund.
As of December 31, 2019, the components of distributable earnings (accumulated loss) on a tax basis were as follows:
Undistributed long-term capital gains | $ | 564,160 | ||
Net unrealized appreciation | $ | 55,828,605 | ||
3 Investment Adviser Fee and Other Transactions with Affiliates
The investment adviser fee is earned by Boston Management and Research (BMR), a subsidiary of Eaton Vance Management (EVM), as compensation for management and investment advisory services rendered to the Fund. The fee is computed at an annual rate of 0.85% of the Fund’s average daily net assets that are not invested in other investment companies for which BMR or its affiliates serve as investment adviser and receive an advisory fee (“Investable Assets”) up to $500 million and is payable monthly. On Investable Assets of $500 million and over, the annual fee is reduced. Pursuant to asub-advisory agreement, BMR pays Goldman Sachs Asset Management, L.P. a portion of its investment adviser fee forsub-advisory services provided to the Fund. For the year ended December 31, 2019, the Fund incurred no investment adviser fee on Investable Assets. To the extent the Fund’s assets are invested in the Portfolio, the Fund is allocated its share of the Portfolio’s investment adviser fee. The Portfolio has engaged BMR to render investment advisory services. See Note 2 of the Portfolio’s Notes to Financial Statements which are included elsewhere in this report. The administration fee is earned by EVM as compensation for administering the business affairs of the Fund and is computed at an annual rate of 0.15% of the Fund’s average daily net assets. For the year ended December 31, 2019, the administration fee amounted to $317,131.
EVM providessub-transfer agency and related services to the Fund pursuant to aSub-Transfer Agency Support Services Agreement. For the year ended December 31, 2019, EVM earned $33,308 from the Fund pursuant to such agreement, which is included in transfer and dividend disbursing agent fees on the Statement of Operations. The Fund was informed that Eaton Vance Distributors, Inc. (EVD), an affiliate of EVM and the Fund’s principal underwriter, received $20,266 as its portion of the sales charge on sales of Class A shares for the year ended December 31, 2019. EVD also received distribution and service fees from Class A, Class B and Class C shares (see Note 4) and contingent deferred sales charges (see Note 5).
Trustees and officers of the Fund who are members of EVM’s or BMR’s organizations receive remuneration for their services to the Fund out of the investment adviser fee and administration fee. Certain officers and Trustees of the Fund and the Portfolio are officers of the above organizations.
4 Distribution Plans
The Fund has in effect a distribution plan for Class A shares (Class A Plan) pursuant to Rule12b-1 under the 1940 Act. Pursuant to the Class A Plan, the Fund pays EVD a distribution and service fee of 0.30% per annum of its average daily net assets attributable to Class A shares for distribution services and facilities provided to the Fund by EVD, as well as for personal services and/or the maintenance of shareholder accounts. Distribution and service fees paid or accrued to EVD for the year ended December 31, 2019 amounted to $477,742 for Class A shares.
| 14 |
Eaton Vance
Greater India Fund
December 31, 2019
Notes to Financial Statements — continued
The Fund also has in effect distribution plans for Class C shares (Class C Plan) and prior to August 16, 2019, Class B shares (Class B Plan) pursuant to Rule12b-1 under the 1940 Act. Pursuant to the Class B and Class C Plans, the Fund paid/pays EVD amounts equal to 0.75% per annum of its average daily net assets attributable to Class B and Class C shares for providing ongoing distribution services and facilities to the Fund. For the year ended December 31, 2019, the Fund paid or accrued to EVD $2,008 and $103,144 for Class B and Class C shares, respectively.
Pursuant to the Class B and Class C Plans, the Fund also made/makes payments of service fees to EVD, financial intermediaries and other persons in amounts equal to 0.25% per annum of its average daily net assets attributable to that class. Service fees paid or accrued are for personal services and/or the maintenance of shareholder accounts. They are separate and distinct from the sales commissions and distribution fees payable to EVD. Service fees paid or accrued for the year ended December 31, 2019 amounted to $669 and $34,381 for Class B and Class C shares, respectively.
Distribution and service fees are subject to the limitations contained in the Financial Industry Regulatory Authority Rule 2341(d) and for Class B, were further limited to a 5% maximum sales charge as determined in accordance with such rule.
5 Contingent Deferred Sales Charges
A contingent deferred sales charge (CDSC) generally is imposed on redemptions of Class C shares made within one year of purchase and prior to August 16, 2019, on redemptions of Class B shares made within six years of purchase. Class A shares may be subject to a 1% CDSC if redeemed within 18 months of purchase (depending on the circumstances of purchase). Generally, the CDSC is based upon the lower of the net asset value at date of redemption or date of purchase. No charge is levied on shares acquired by reinvestment of dividends or capital gain distributions. The CDSC for Class B shares was imposed at declining rates that began at 5% in the case of redemptions in the first and second year after purchase, declining one percentage point each subsequent year. Class C shares are subject to a 1% CDSC if redeemed within one year of purchase. For the year ended December 31, 2019, the Fund was informed that EVD received approximately $5,000 and $2,000 of CDSCs paid by Class A and Class C shareholders, respectively, and no CDSCs paid by Class B shareholders.
6 Investment Transactions
For the year ended December 31, 2019, increases and decreases in the Fund’s investment in the Portfolio aggregated $12,649,694 and $31,342,570, respectively.
7 Shares of Beneficial Interest
The Fund’s Declaration of Trust permits the Trustees to issue an unlimited number of full and fractional shares of beneficial interest (without par value). Such shares may be issued in a number of different series (such as the Fund) and classes. Transactions in Fund shares were as follows:
| Year Ended December 31, | ||||||||
| Class A | 2019 | 2018 | ||||||
Sales | 251,172 | 322,437 | ||||||
Issued to shareholders electing to receive payments of distributions in Fund shares | 135,062 | 48,083 | ||||||
Redemptions | (680,177 | ) | (838,993 | ) | ||||
Converted from Class B shares | 18,163 | 32,196 | ||||||
Converted from Class C shares | 260,718 | — | ||||||
Net decrease | (15,062 | ) | (436,277 | ) | ||||
| Year Ended December 31, | ||||||||
| Class B | 2019(1) | 2018 | ||||||
Sales | 28 | 184 | ||||||
Issued to shareholders electing to receive payments of distributions in Fund shares | 305 | 409 | ||||||
Redemptions | (1,747 | ) | (5,969 | ) | ||||
Converted to Class A shares | (20,705 | ) | (36,857 | ) | ||||
Net decrease | (22,119 | ) | (42,233 | ) | ||||
| 15 |
Eaton Vance
Greater India Fund
December 31, 2019
Notes to Financial Statements — continued
| Year Ended December 31, | ||||||||
| Class C | 2019 | 2018 | ||||||
Sales | 58,720 | 57,221 | ||||||
Issued to shareholders electing to receive payments of distributions in Fund shares | 14,344 | 9,800 | ||||||
Redemptions | (155,685 | ) | (216,692 | ) | ||||
Converted to Class A shares | (302,832 | ) | — | |||||
Net decrease | (385,453 | ) | (149,671 | ) | ||||
| Year Ended December 31, | ||||||||
| Class I | 2019 | 2018 | ||||||
Sales | 529,425 | 394,522 | ||||||
Issued to shareholders electing to receive payments of distributions in Fund shares | 27,497 | 10,218 | ||||||
Redemptions | (539,364 | ) | (559,188 | ) | ||||
Net increase (decrease) | 17,558 | (154,448 | ) | |||||
| (1) | At the close of business on August 15, 2019, Class B shares were converted into Class A and Class B was terminated. |
| 16 |
Eaton Vance
Greater India Fund
December 31, 2019
Report of Independent Registered Public Accounting Firm
To the Trustees of Eaton Vance Special Investment Trust and Shareholders of Eaton Vance Greater India Fund:
Opinion on the Financial Statements and Financial Highlights
We have audited the accompanying statement of assets and liabilities of Eaton Vance Greater India Fund (the “Fund”) (one of the funds constituting Eaton Vance Special Investment Trust), as of December 31, 2019, the related statement of operations for the year then ended, the statements of changes in net assets for each of the two years in the period then ended, the financial highlights for each of the five years in the period then ended, and the related notes. In our opinion, the financial statements and financial highlights present fairly, in all material respects, the financial position of the Fund as of December 31, 2019, and the results of its operations for the year then ended, the changes in its net assets for each of the two years in the period then ended, and the financial highlights for each of the five years in the period then ended, in conformity with accounting principles generally accepted in the United States of America.
Basis for Opinion
These financial statements and financial highlights are the responsibility of the Fund’s management. Our responsibility is to express an opinion on the Fund’s financial statements and financial highlights based on our audits. We are a public accounting firm registered with the Public Company Accounting Oversight Board (United States) (PCAOB) and are required to be independent with respect to the Fund in accordance with the U.S. federal securities laws and the applicable rules and regulations of the Securities and Exchange Commission and the PCAOB.
We conducted our audits in accordance with the standards of the PCAOB. Those standards require that we plan and perform the audit to obtain reasonable assurance about whether the financial statements and financial highlights are free of material misstatement, whether due to error or fraud. The Fund is not required to have, nor were we engaged to perform, an audit of its internal control over financial reporting. As part of our audits we are required to obtain an understanding of internal control over financial reporting but not for the purpose of expressing an opinion on the effectiveness of the Fund’s internal control over financial reporting. Accordingly, we express no such opinion.
Our audits included performing procedures to assess the risks of material misstatement of the financial statements and financial highlights, whether due to error or fraud, and performing procedures that respond to those risks. Such procedures included examining, on a test basis, evidence regarding the amounts and disclosures in the financial statements and financial highlights. Our audits also included evaluating the accounting principles used and significant estimates made by management, as well as evaluating the overall presentation of the financial statements and financial highlights. We believe that our audits provide a reasonable basis for our opinion.
/s/ Deloitte & Touche LLP
Boston, Massachusetts
February 24, 2020
We have served as the auditor of one or more Eaton Vance investment companies since 1959.
| 17 |
Eaton Vance
Greater India Fund
December 31, 2019
Federal Tax Information (Unaudited)
The Form1099-DIV you received in February 2020 showed the tax status of all distributions paid to your account in calendar year 2019. Shareholders are advised to consult their own tax adviser with respect to the tax consequences of their investment in the Fund. As required by the Internal Revenue Code and/or regulations, shareholders must be notified regarding the status of capital gains dividends.
Capital Gains Dividends. The Fund hereby designates as a capital gain dividend with respect to the taxable year ended December 31, 2019, $565,344 or, if subsequently determined to be different, the net capital gain of such year.
| 18 |
Greater India Portfolio
December 31, 2019
Portfolio of Investments
| Common Stocks— 99.4% |
| |||||||
| Security | Shares | Value | ||||||
| India — 99.4% | ||||||||
| Airlines — 0.6% | ||||||||
InterGlobe Aviation, Ltd.(1) | 69,143 | $ | 1,292,275 | |||||
| $ | 1,292,275 | |||||||
| Auto Components — 1.2% | ||||||||
MRF, Ltd. | 2,872 | $ | 2,664,593 | |||||
| $ | 2,664,593 | |||||||
| Automobiles — 7.2% | ||||||||
Eicher Motors, Ltd. | 12,698 | $ | 3,989,478 | |||||
Maruti Suzuki India, Ltd. | 112,782 | 11,647,093 | ||||||
| $ | 15,636,571 | |||||||
| Banks — 17.5% | ||||||||
Axis Bank, Ltd. | 1,313,598 | $ | 13,856,438 | |||||
HDFC Bank, Ltd. | 500,807 | 8,960,056 | ||||||
ICICI Bank, Ltd. | 1,988,851 | 15,075,973 | ||||||
| $ | 37,892,467 | |||||||
| Beverages — 0.7% | ||||||||
United Breweries, Ltd. | 79,318 | $ | 1,410,077 | |||||
| $ | 1,410,077 | |||||||
| Capital Markets — 1.0% | ||||||||
Reliance Nippon Life Asset Management, Ltd.(1) | 423,638 | $ | 2,105,114 | |||||
| $ | 2,105,114 | |||||||
| Construction & Engineering — 1.4% | ||||||||
Voltas, Ltd. | 338,897 | $ | 3,116,423 | |||||
| $ | 3,116,423 | |||||||
| Construction Materials — 2.8% | ||||||||
Dalmia Bharat, Ltd. | 144,462 | $ | 1,638,494 | |||||
UltraTech Cement, Ltd. | 78,030 | 4,434,444 | ||||||
| $ | 6,072,938 | |||||||
| Consumer Finance — 5.4% | ||||||||
Bajaj Finance, Ltd. | 154,929 | $ | 9,175,063 | |||||
Mahindra & Mahindra Financial Services, Ltd. | 211,453 | 953,691 | ||||||
Muthoot Finance, Ltd. | 140,035 | 1,493,769 | ||||||
| $ | 11,622,523 | |||||||
| Security | Shares | Value | ||||||
| Diversified Financial Services — 1.4% | ||||||||
Bajaj Holdings & Investment, Ltd. | 62,107 | $ | 2,974,220 | |||||
| $ | 2,974,220 | |||||||
| Electrical Equipment — 0.2% | ||||||||
Graphite India, Ltd. | 83,106 | $ | 352,867 | |||||
| $ | 352,867 | |||||||
| Food Products — 2.3% | ||||||||
GlaxoSmithKline Consumer Healthcare, Ltd. | 18,061 | $ | 2,097,027 | |||||
Nestle India, Ltd. | 14,010 | 2,899,503 | ||||||
| $ | 4,996,530 | |||||||
| Hotels, Restaurants & Leisure — 0.9% | ||||||||
Indian Hotels Co., Ltd. (The) | 923,711 | $ | 1,868,566 | |||||
| $ | 1,868,566 | |||||||
| Household Durables — 2.6% | ||||||||
Crompton Greaves Consumer Electricals, Ltd. | 752,799 | $ | 2,521,469 | |||||
Whirlpool of India, Ltd. | 94,054 | 3,106,873 | ||||||
| $ | 5,628,342 | |||||||
| Household Products — 2.4% | ||||||||
Hindustan Unilever, Ltd. | 191,309 | $ | 5,148,351 | |||||
| $ | 5,148,351 | |||||||
| Insurance — 3.2% | ||||||||
ICICI Lombard General Insurance Co., Ltd.(1) | 150,940 | $ | 2,920,655 | |||||
SBI Life Insurance Co., Ltd.(1) | 294,967 | 3,973,581 | ||||||
| $ | 6,894,236 | |||||||
| Interactive Media & Services — 2.9% | ||||||||
Info Edge India, Ltd. | 179,046 | $ | 6,373,086 | |||||
| $ | 6,373,086 | |||||||
| IT Services — 15.2% | ||||||||
HCL Technologies, Ltd. | 666,868 | $ | 5,317,092 | |||||
Infosys, Ltd. | 1,934,828 | 19,948,081 | ||||||
Infosys, Ltd. ADR | 123,774 | 1,277,348 | ||||||
Larsen & Toubro Infotech, Ltd.(1) | 86,224 | 2,114,667 | ||||||
Tech Mahindra, Ltd. | 404,122 | 4,310,827 | ||||||
| $ | 32,968,015 | |||||||
| 19 | See Notes to Financial Statements. |
Greater India Portfolio
December 31, 2019
Portfolio of Investments — continued
| Security | Shares | Value | ||||||
| Life Sciences Tools & Services — 2.1% | ||||||||
Divi’s Laboratories, Ltd. | 179,518 | $ | 4,626,298 | |||||
| $ | 4,626,298 | |||||||
| Machinery — 1.9% | ||||||||
AIA Engineering, Ltd. | 86,037 | $ | 1,988,567 | |||||
Thermax, Ltd. | 144,311 | 2,210,678 | ||||||
| $ | 4,199,245 | |||||||
| Metals & Mining — 0.6% | ||||||||
Hindustan Zinc, Ltd.(2) | 239,372 | $ | 703,679 | |||||
NMDC, Ltd. | 323,564 | 585,666 | ||||||
| $ | 1,289,345 | |||||||
| Oil, Gas & Consumable Fuels — 10.1% | ||||||||
Bharat Petroleum Corp., Ltd. | 906,962 | $ | 6,237,216 | |||||
Reliance Industries, Ltd. | 737,611 | 15,666,428 | ||||||
| $ | 21,903,644 | |||||||
| Personal Products — 2.4% | ||||||||
Marico, Ltd. | 526,595 | $ | 2,514,426 | |||||
Procter & Gamble Hygiene & Health Care, Ltd. | 16,984 | 2,703,571 | ||||||
| $ | 5,217,997 | |||||||
| Pharmaceuticals — 4.7% | ||||||||
Abbott India, Ltd. | 32,581 | $ | 5,955,485 | |||||
Eris Lifesciences, Ltd.(1)(2) | 105,000 | 696,506 | ||||||
Lupin, Ltd. | 197,697 | 2,120,197 | ||||||
Torrent Pharmaceuticals, Ltd. | 58,307 | 1,509,355 | ||||||
| $ | 10,281,543 | |||||||
| Real Estate Management & Development — 1.4% | ||||||||
Oberoi Realty, Ltd. | 214,170 | $ | 1,592,175 | |||||
Prestige Estates Projects, Ltd. | 325,464 | 1,539,991 | ||||||
| $ | 3,132,166 | |||||||
| Textiles, Apparel & Luxury Goods — 0.6% | ||||||||
Aditya Birla Fashion and Retail, Ltd.(2) | 387,379 | $ | 1,255,370 | |||||
| $ | 1,255,370 | |||||||
| Thrifts & Mortgage Finance — 4.8% | ||||||||
Housing Development Finance Corp., Ltd. | 310,202 | $ | 10,490,859 | |||||
| $ | 10,490,859 | |||||||
| Security | Shares | Value | ||||||
| Wireless Telecommunication Services — 1.9% | ||||||||
Bharti Airtel, Ltd. | 632,214 | $ | 4,039,196 | |||||
| $ | 4,039,196 | |||||||
Total India |
| $ | 215,452,857 | |||||
Total Common Stocks |
| $ | 215,452,857 | |||||
Total Investments — 99.4% |
| $ | 215,452,857 | |||||
Other Assets, Less Liabilities — 0.6% |
| $ | 1,359,618 | |||||
Net Assets — 100.0% |
| $ | 216,812,475 | |||||
The percentage shown for each investment category in the Portfolio of Investments is based on net assets.
| (1) | Security exempt from registration pursuant to Rule 144A under the Securities Act of 1933, as amended. These securities may be sold in certain transactions in reliance on an exemption from registration (normally to qualified institutional buyers). At December 31, 2019, the aggregate value of these securities is $13,102,798 or 6.0% of the Portfolio’s net assets. |
| (2) | Non-income producing security. |
Abbreviations:
| ADR | – | American Depositary Receipt | ||
| 20 | See Notes to Financial Statements. |
Greater India Portfolio
December 31, 2019
Statement of Assets and Liabilities
| Assets | December 31, 2019 | |||
Unaffiliated investments, at value (identified cost, $155,165,630) | $ | 215,452,857 | ||
Cash | 1,384,552 | |||
Receivable for investments sold | 271,887 | |||
Receivable for foreign taxes | 43,182 | |||
Total assets | $ | 217,152,478 | ||
| Liabilities |
| |||
Payable for investments purchased | $ | 1,699 | ||
Payable to affiliates: | ||||
Investment adviser fee | 156,207 | |||
Trustees’ fees | 2,823 | |||
Accrued expenses | 179,274 | |||
Total liabilities | $ | 340,003 | ||
Net Assets applicable to investors’ interest in Portfolio | $ | 216,812,475 | ||
| 21 | See Notes to Financial Statements. |
Greater India Portfolio
December 31, 2019
Statement of Operations
| Investment Income | Year Ended December 31, 2019 | |||
Dividends | $ | 2,158,694 | ||
Interest | 70,435 | |||
Total investment income | $ | 2,229,129 | ||
| Expenses | ||||
Investment adviser fee | $ | 1,799,105 | ||
Trustees’ fees and expenses | 11,975 | |||
Custodian fee | 158,598 | |||
Legal and accounting services | 98,254 | |||
Miscellaneous | 13,588 | |||
Total expenses | $ | 2,081,520 | ||
Net investment income | $ | 147,609 | ||
| Realized and Unrealized Gain (Loss) | ||||
Net realized gain (loss) — | ||||
Investment transactions | $ | 2,289,863 | ||
Financial futures contracts | 12,955 | |||
Foreign currency transactions | (69,183 | ) | ||
Net realized gain | $ | 2,233,635 | ||
Change in unrealized appreciation (depreciation) — | ||||
Investments | $ | 20,051,348 | ||
Financial futures contracts | (109,517 | ) | ||
Foreign currency | (4,064 | ) | ||
Net change in unrealized appreciation (depreciation) | $ | 19,937,767 | ||
Net realized and unrealized gain | $ | 22,171,402 | ||
Net increase in net assets from operations | $ | 22,319,011 | ||
| 22 | See Notes to Financial Statements. |
Greater India Portfolio
December 31, 2019
Statements of Changes in Net Assets
| Year Ended December 31, | ||||||||
| Increase (Decrease) in Net Assets | 2019 | 2018 | ||||||
From operations — | ||||||||
Net investment income | $ | 147,609 | $ | 459,186 | ||||
Net realized gain | 2,233,635 | 10,201,328 | ||||||
Net change in unrealized appreciation (depreciation) | 19,937,767 | (41,772,091 | ) | |||||
Net increase (decrease) in net assets from operations | $ | 22,319,011 | $ | (31,111,577 | ) | |||
Capital transactions — | ||||||||
Contributions | $ | 12,649,694 | $ | 9,325,256 | ||||
Withdrawals | (31,342,570 | ) | (38,464,729 | ) | ||||
Net decrease in net assets from capital transactions | $ | (18,692,876 | ) | $ | (29,139,473 | ) | ||
Net increase (decrease) in net assets | $ | 3,626,135 | $ | (60,251,050 | ) | |||
| Net Assets |
| |||||||
At beginning of year | $ | 213,186,340 | $ | 273,437,390 | ||||
At end of year | $ | 216,812,475 | $ | 213,186,340 | ||||
| 23 | See Notes to Financial Statements. |
Greater India Portfolio
December 31, 2019
Financial Highlights
| Year Ended December 31, | ||||||||||||||||||||
| Ratios/Supplemental Data | 2019 | 2018 | 2017 | 2016 | 2015 | |||||||||||||||
Ratios (as a percentage of average daily net assets): | ||||||||||||||||||||
Expenses(1) | 0.98 | % | 0.98 | % | 0.98 | % | 1.19 | % | 1.23 | % | ||||||||||
Net investment income (loss) | 0.07 | % | 0.19 | % | 0.76 | % | (0.06 | )% | (0.23 | )% | ||||||||||
Portfolio Turnover | 21 | % | 29 | % | 25 | % | 91 | % | 30 | % | ||||||||||
Total Return | 11.17 | % | (11.57 | )% | 45.78 | % | 3.35 | % | (4.33 | )% | ||||||||||
Net assets, end of year (000’s omitted) | $ | 216,812 | $ | 213,186 | $ | 273,437 | $ | 203,663 | $ | 238,167 | ||||||||||
| (1) | Excludes the effect of custody fee credits, if any, of less than 0.005%. Effective September 1, 2015, custody fee credits, which were earned on cash deposit balances, were discontinued by the custodian. |
| 24 | See Notes to Financial Statements. |
Greater India Portfolio
December 31, 2019
Notes to Financial Statements
1 Significant Accounting Policies
Greater India Portfolio (the Portfolio) is a Massachusetts business trust registered under the Investment Company Act of 1940, as amended (the 1940 Act), as anon-diversified,open-end management investment company. The Portfolio’s investment objective is to seek long-term capital appreciation. The Declaration of Trust permits the Trustees to issue interests in the Portfolio. At December 31, 2019, Eaton Vance Greater India Fund held a 99.9% interest in the Portfolio.
The following is a summary of significant accounting policies of the Portfolio. The policies are in conformity with accounting principles generally accepted in the United States of America (U.S. GAAP). The Portfolio is an investment company and follows accounting and reporting guidance in the Financial Accounting Standards Board (FASB) Accounting Standards Codification Topic 946.
A Investment Valuation — The following methodologies are used to determine the market value or fair value of investments.
Equity Securities. Equity securities listed on a U.S. securities exchange generally are valued at the last sale or closing price on the day of valuation or, if no sales took place on such date, at the mean between the closing bid and ask prices on the exchange where such securities are principally traded. Equity securities listed on the NASDAQ Global or Global Select Market generally are valued at the NASDAQ official closing price. Unlisted or listed securities for which closing sales prices or closing quotations are not available are valued at the mean between the latest available bid and ask prices.
Derivatives. Financial futures contracts are valued at the closing settlement price established by the board of trade or exchange on which they are traded, with adjustments for fair valuation for certain foreign financial futures contracts as described below.
Foreign Securities, Financial Futures Contracts and Currencies.Foreign securities, financial futures contracts and currencies are valued in U.S. dollars, based on foreign currency exchange rate quotations supplied by a third party pricing service. The pricing service uses a proprietary model to determine the exchange rate. Inputs to the model include reported trades and implied bid/ask spreads. The daily valuation of exchange-traded foreign securities and certain exchange-traded foreign financial futures contracts generally is determined as of the close of trading on the principal exchange on which such securities and contracts trade. Foreign ownership of shares of certain Indian companies may be subject to limitations. When foreign ownership of such an Indian company’s shares approaches the limitation, foreign investors may be willing to pay a premium to the local share price to acquire shares from other foreign investors. Such shares are valued at the closing price for foreign investors as provided by the exchange on which they trade. Events occurring after the close of trading on foreign exchanges may result in adjustments to the valuation of foreign securities and certain foreign financial futures contracts to more accurately reflect their fair value as of the close of regular trading on the New York Stock Exchange. When valuing foreign equity securities and foreign financial futures contracts that meet certain criteria, the Portfolio’s Trustees have approved the use of a fair value service that values such securities and foreign financial futures contracts to reflect market trading that occurs after the close of the applicable foreign markets of comparable securities or other instruments that have a strong correlation to the fair-valued securities and foreign financial futures contracts.
Fair Valuation. Investments for which valuations or market quotations are not readily available or are deemed unreliable are valued at fair value using methods determined in good faith by or at the direction of the Trustees of the Portfolio in a manner that most fairly reflects the security’s “fair value”, which is the amount that the Portfolio might reasonably expect to receive for the security upon its current sale in the ordinary course. Each such determination is based on a consideration of relevant factors, which are likely to vary from one pricing context to another. These factors may include, but are not limited to, the type of security, the existence of any contractual restrictions on the security’s disposition, the price and extent of public trading in similar securities of the issuer or of comparable companies or entities, quotations or relevant information obtained from broker/dealers or other market participants, information obtained from the issuer, analysts, and/or the appropriate stock exchange (for exchange-traded securities), an analysis of the company’s or entity’s financial statements, and an evaluation of the forces that influence the issuer and the market(s) in which the security is purchased and sold.
B Investment Transactions — Investment transactions for financial statement purposes are accounted for on a trade date basis. Realized gains and losses on investments sold are determined on the basis of identified cost.
C Income — Dividend income is recorded on theex-dividend date for dividends received in cash and/or securities. However, if theex-dividend date has passed, certain dividends from foreign securities are recorded as the Portfolio is informed of theex-dividend date.Non-cash dividends are recorded at the fair value of the securities received. Withholding taxes on foreign dividends and capital gains have been provided for in accordance with the Portfolio’s understanding of the applicable countries’ tax rules and rates. Interest income is recorded on the basis of interest accrued.
D Federal and Other Taxes — The Portfolio has elected to be treated as a partnership for federal tax purposes. No provision is made by the Portfolio for federal or state taxes on any taxable income of the Portfolio because each investor in the Portfolio is ultimately responsible for the payment of any taxes on its share of taxable income. Since at least one of the Portfolio’s investors is a regulated investment company that invests all or substantially all of its assets in the Portfolio, the Portfolio normally must satisfy the applicable source of income and diversification requirements (under the Internal Revenue Code) in order for its investors to satisfy them. The Portfolio will allocate, at least annually among its investors, each investor’s distributive share of the Portfolio’s net investment income, net realized capital gains and losses and any other items of income, gain, loss, deduction or credit.
In addition to the requirements of the Internal Revenue Code, the Portfolio may also be subject to local taxes on the recognition of capital gains in India. In determining the daily net asset value, the Portfolio estimates the accrual for such taxes, if any, based on the unrealized appreciation on certain portfolio securities, the holding period of such securities, the related tax rates, and the availability of any realized losses in excess of gains that may be carried forward to offset future gains. Taxes attributable to unrealized appreciation are included in the change in unrealized appreciation (depreciation) on investments. Capital gains taxes on certain Indian securities sold at a gain are included in net realized gain (loss) on investments. As of March 31, 2019,
| 25 |
Greater India Portfolio
December 31, 2019
Notes to Financial Statements — continued
the Portfolio, for tax reporting in India, had accumulated losses of INR 1,605,271,344 (having a value of approximately $22,490,000 at December 31, 2019) that can be carried forward to offset future realized gains from the sale of certain Indian securities that would otherwise be subject to Indian capital gain taxes. These accumulated losses expire on March 31, 2020 (INR 535,151,798), March 31, 2022 (INR 90,144,310), March 31, 2026 (INR 74,501,836) and March 31, 2027 (INR 905,473,400). Of the accumulated losses as of March 31, 2019, INR 737,942,377 are short-term and INR 867,328,967 are long-term.
As of December 31, 2019, the Portfolio had no uncertain tax positions that would require financial statement recognition,de-recognition, or disclosure. The Portfolio files a U.S. federal income tax return annually after its fiscalyear-end, which is subject to examination by the Internal Revenue Service for a period of three years from the date of filing. The Portfolio also files a tax return in India annually as of March 31st. Such tax returns are subject to examination by the Indian tax authorities for open years as determined by the statute of limitations, which is generally a period of up to 7 years after a tax return is filed.
E Foreign Currency Translation — Investment valuations, other assets, and liabilities initially expressed in foreign currencies are translated each business day into U.S. dollars based upon current exchange rates. Purchases and sales of foreign investment securities and income and expenses denominated in foreign currencies are translated into U.S. dollars based upon currency exchange rates in effect on the respective dates of such transactions. Recognized gains or losses on investment transactions attributable to changes in foreign currency exchange rates are recorded for financial statement purposes as net realized gains and losses on investments. That portion of unrealized gains and losses on investments that results from fluctuations in foreign currency exchange rates is not separately disclosed.
F Use of Estimates — The preparation of the financial statements in conformity with U.S. GAAP requires management to make estimates and assumptions that affect the reported amounts of assets and liabilities at the date of the financial statements and the reported amounts of income and expense during the reporting period. Actual results could differ from those estimates.
G Indemnifications — Under the Portfolio’s organizational documents, its officers and Trustees may be indemnified against certain liabilities and expenses arising out of the performance of their duties to the Portfolio. Under Massachusetts law, if certain conditions prevail, interestholders in the Portfolio could be deemed to have personal liability for the obligations of the Portfolio. However, the Portfolio’s Declaration of Trust contains an express disclaimer of liability on the part of Portfolio interestholders. Additionally, in the normal course of business, the Portfolio enters into agreements with service providers that may contain indemnification clauses. The Portfolio’s maximum exposure under these arrangements is unknown as this would involve future claims that may be made against the Portfolio that have not yet occurred.
H Financial Futures Contracts — Upon entering into a financial futures contract, the Portfolio is required to deposit with the broker, either in cash or securities, an amount equal to a certain percentage of the contract amount (initial margin). Subsequent payments, known as variation margin, are made or received by the Portfolio each business day, depending on the daily fluctuations in the value of the underlying security or index, and are recorded as unrealized gains or losses by the Portfolio. Gains (losses) are realized upon the expiration or closing of the financial futures contracts. Should market conditions change unexpectedly, the Portfolio may not achieve the anticipated benefits of the financial futures contracts and may realize a loss. Futures contracts have minimal counterparty risk as they are exchange traded and the clearinghouse for the exchange is substituted as the counterparty, guaranteeing counterparty performance.
2 Investment Adviser Fee and Other Transactions with Affiliates
The investment adviser fee is earned by Boston Management and Research (BMR), a subsidiary of EVM, as compensation for management and investment advisory services rendered to the Portfolio. Pursuant to the investment advisory agreement and subsequent fee reduction agreement between the Portfolio and BMR, the fee is computed at an annual rate of 0.85% of the Portfolio’s average daily net assets up to $500 million and is payable monthly. On net assets of $500 million and over, the annual fee is reduced. The fee reduction cannot be terminated or reduced without the approval of a majority vote of the Trustees of the Portfolio who are not interested persons of BMR or the Portfolio and by vote of a majority of the holders of interest in the Portfolio. For the year ended December 31, 2019, the investment adviser fee amounted to $1,799,105 or 0.85% of the Portfolio’s average daily net assets. Pursuant to asub-advisory agreement, BMR pays Goldman Sachs Asset Management, L.P. a portion of its investment adviser fee forsub-advisory services provided to the Portfolio.
Trustees and officers of the Portfolio who are members of EVM’s or BMR’s organizations receive remuneration for their services to the Portfolio out of the investment adviser fee. Trustees of the Portfolio who are not affiliated with the investment adviser may elect to defer receipt of all or a percentage of their annual fees in accordance with the terms of the Trustees Deferred Compensation Plan. For the year ended December 31, 2019, no significant amounts have been deferred. Certain officers and Trustees of the Portfolio are officers of the above organizations.
3 Purchases and Sales of Investments
Purchases and sales of investments, other than short-term obligations, aggregated $43,217,601 and $56,310,401, respectively, for the year ended December 31, 2019.
| 26 |
Greater India Portfolio
December 31, 2019
Notes to Financial Statements — continued
4 Federal Income Tax Basis of Investments
The cost and unrealized appreciation (depreciation) of investments of the Portfolio at December 31, 2019, as determined on a federal income tax basis, were as follows:
Aggregate cost | $ | 162,495,287 | ||
Gross unrealized appreciation | $ | 56,143,087 | ||
Gross unrealized depreciation | (3,185,517 | ) | ||
Net unrealized appreciation | $ | 52,957,570 | ||
5 Financial Instruments
The Portfolio may trade in financial instruments withoff-balance sheet risk in the normal course of its investing activities. These financial instruments may include financial futures contracts and may involve, to a varying degree, elements of risk in excess of the amounts recognized for financial statement purposes. The notional or contractual amounts of these instruments represent the investment the Portfolio has in particular classes of financial instruments and do not necessarily represent the amounts potentially subject to risk. The measurement of the risks associated with these instruments is meaningful only when all related and offsetting transactions are considered. At December 31, 2019, there were no obligations outstanding under these financial instruments.
The Portfolio is subject to equity price risk in the normal course of pursuing its investment objective. During the year ended December 31, 2019, the Portfolio entered into equity index futures contracts to manage cash flows.
The effect of derivative instruments (not considered to be hedging instruments for accounting disclosure purposes) on the Statement of Operations and whose primary underlying risk exposure is equity price risk for the year ended December 31, 2019 was as follows:
| Derivative | Realized Gain (Loss) on Derivatives Recognized in Income(1) | Change in Unrealized Appreciation (Depreciation) on Derivatives Recognized in Income(2) | ||||||
Financial futures contracts | $ | 12,955 | $ | (109,517 | ) | |||
| (1) | Statement of Operations location: Net realized gain (loss) – Financial futures contracts. |
| (2) | Statement of Operations location: Change in unrealized appreciation (depreciation) – Financial futures contracts. |
The average notional cost of futures contracts (long) outstanding during the year ended December 31, 2019, which is indicative of the volume of this derivative type, was approximately $5,476,000.
6 Line of Credit
The Portfolio participates with other portfolios and funds managed by EVM and its affiliates in an $800 million unsecured line of credit agreement with a group of banks, which is in effect through October 27, 2020. In connection with the renewal of the agreement on October 29, 2019, funds managed by Calvert Research and Management, an affiliate of EVM, were added as participating funds to the agreement and the borrowing limit was increased from $625 million. Borrowings are made by the Portfolio solely to facilitate the handling of unusual and/or unanticipated short-term cash requirements. Interest is charged to the Portfolio based on its borrowings at an amount above either the Eurodollar rate or Federal Funds rate. In addition, a fee computed at an annual rate of 0.15% on the daily unused portion of the line of credit is allocated among the participating portfolios and funds at the end of each quarter. Because the line of credit is not available exclusively to the Portfolio, it may be unable to borrow some or all of its requested amounts at any particular time. The Portfolio did not have any significant borrowings or allocated fees during the year ended December 31, 2019.
7 Risks Associated with Foreign Investments
Investing in securities issued by companies whose principal business activities are outside the United States may involve significant risks not present in domestic investments. For example, there is generally less publicly available information about foreign companies, particularly those not subject to the disclosure and reporting requirements of the U.S. securities laws. Certain foreign issuers are generally not bound by uniform accounting, auditing, and financial reporting requirements and standards of practice comparable to those applicable to domestic issuers. Investments in foreign securities also involve the risk of possible adverse changes in investment or exchange control regulations, expropriation or confiscatory taxation, limitation on the removal of funds
| 27 |
Greater India Portfolio
December 31, 2019
Notes to Financial Statements — continued
or other assets of the Portfolio, political or financial instability or diplomatic and other developments which could affect such investments. Foreign securities markets, while growing in volume and sophistication, are generally not as developed as those in the United States, and securities of some foreign issuers (particularly those located in developing countries) may be less liquid and more volatile than securities of comparable U.S. companies. In general, there is less overall governmental supervision and regulation of foreign securities markets, broker/dealers and issuers than in the United States.
The securities markets in the India region are substantially smaller, less liquid and more volatile than the major securities markets in the United States, which may result in trading or price volatility and difficulties in the settlement and recording of transactions, and in interpreting and applying relevant laws and regulations. Governmental actions can have a significant effect on the economic conditions in the India region, which could adversely affect the value and liquidity of investments.
8 Fair Value Measurements
Under generally accepted accounting principles for fair value measurements, a three-tier hierarchy to prioritize the assumptions, referred to as inputs, is used in valuation techniques to measure fair value. The three-tier hierarchy of inputs is summarized in the three broad levels listed below.
| • | Level 1 – quoted prices in active markets for identical investments |
| • | Level 2 – other significant observable inputs (including quoted prices for similar investments, interest rates, prepayment speeds, credit risk, etc.) |
| • | Level 3 – significant unobservable inputs (including a fund’s own assumptions in determining the fair value of investments) |
In cases where the inputs used to measure fair value fall in different levels of the fair value hierarchy, the level disclosed is determined based on the lowest level input that is significant to the fair value measurement in its entirety. The inputs or methodology used for valuing securities are not necessarily an indication of the risk associated with investing in those securities.
At December 31, 2019, the hierarchy of inputs used in valuing the Portfolio’s investments, which are carried at value, were as follows:
| Asset Description | Level 1 | Level 2 | Level 3 | Total | ||||||||||||
Common Stocks | ||||||||||||||||
Communication Services | $ | — | $ | 10,412,282 | $ | — | $ | 10,412,282 | ||||||||
Consumer Discretionary | — | 27,053,442 | — | 27,053,442 | ||||||||||||
Consumer Staples | — | 16,772,955 | — | 16,772,955 | ||||||||||||
Energy | — | 21,903,644 | — | 21,903,644 | ||||||||||||
Financials | — | 71,979,419 | — | 71,979,419 | ||||||||||||
Health Care | — | 14,907,841 | — | 14,907,841 | ||||||||||||
Industrials | — | 8,960,810 | — | 8,960,810 | ||||||||||||
Information Technology | 1,277,348 | 31,690,667 | — | 32,968,015 | ||||||||||||
Materials | — | 7,362,283 | — | 7,362,283 | ||||||||||||
Real Estate | — | 3,132,166 | — | 3,132,166 | ||||||||||||
Total Common Stocks | $ | 1,277,348 | $ | 214,175,509 | * | $ | — | $ | 215,452,857 | |||||||
Total Investments | $ | 1,277,348 | $ | 214,175,509 | $ | — | $ | 215,452,857 | ||||||||
| * | Includes foreign equity securities whose values were adjusted to reflect market trading of comparable securities or other correlated instruments that occurred after the close of trading in their applicable foreign markets. |
| 28 |
Greater India Portfolio
December 31, 2019
Report of Independent Registered Public Accounting Firm
To the Trustees and Investors of Greater India Portfolio:
Opinion on the Financial Statements and Financial Highlights
We have audited the accompanying statement of assets and liabilities of Greater India Portfolio (the “Portfolio”), including the portfolio of investments, as of December 31, 2019, the related statement of operations for the year then ended, the statements of changes in net assets for each of the two years in the period then ended, the financial highlights for each of the five years in the period then ended, and the related notes. In our opinion, the financial statements and financial highlights present fairly, in all material respects, the financial position of the Portfolio as of December 31, 2019, and the results of its operations for the year then ended, the changes in its net assets for each of the two years in the period then ended, and the financial highlights for each of the five years in the period then ended, in conformity with accounting principles generally accepted in the United States of America.
Basis for Opinion
These financial statements and financial highlights are the responsibility of the Portfolio’s management. Our responsibility is to express an opinion on the Portfolio’s financial statements and financial highlights based on our audits. We are a public accounting firm registered with the Public Company Accounting Oversight Board (United States) (PCAOB) and are required to be independent with respect to the Portfolio in accordance with the U.S. federal securities laws and the applicable rules and regulations of the Securities and Exchange Commission and the PCAOB.
We conducted our audits in accordance with the standards of the PCAOB. Those standards require that we plan and perform the audit to obtain reasonable assurance about whether the financial statements and financial highlights are free of material misstatement, whether due to error or fraud. The Portfolio is not required to have, nor were we engaged to perform, an audit of its internal control over financial reporting. As part of our audits we are required to obtain an understanding of internal control over financial reporting but not for the purpose of expressing an opinion on the effectiveness of the Portfolio’s internal control over financial reporting. Accordingly, we express no such opinion.
Our audits included performing procedures to assess the risks of material misstatement of the financial statements and financial highlights, whether due to error or fraud, and performing procedures that respond to those risks. Such procedures included examining, on a test basis, evidence regarding the amounts and disclosures in the financial statements and financial highlights. Our audits also included evaluating the accounting principles used and significant estimates made by management, as well as evaluating the overall presentation of the financial statements and financial highlights. Our procedures included confirmation of securities owned as of December 31, 2019, by correspondence with the custodian and brokers; when replies were not received from brokers, we performed other auditing procedures. We believe that our audits provide a reasonable basis for our opinion.
/s/ Deloitte & Touche LLP
Boston, Massachusetts
February 24, 2020
We have served as the auditor of one or more Eaton Vance investment companies since 1959.
| 29 |
Eaton Vance
Greater India Fund
December 31, 2019
Management and Organization
Fund Management. The Trustees of Eaton Vance Special Investment Trust (the Trust) and Greater India Portfolio (the Portfolio) are responsible for the overall management and supervision of the Trust’s and Portfolio’s affairs. The Trustees and officers of the Trust and the Portfolio are listed below. Except as indicated, each individual has held the office shown or other offices in the same company for the last five years. Trustees and officers of the Trust and the Portfolio hold indefinite terms of office. The “noninterested Trustees” consist of those Trustees who are not “interested persons” of the Trust and the Portfolio, as that term is defined under the 1940 Act. The business address of each Trustee and officer is Two International Place, Boston, Massachusetts 02110. As used below, “EVC” refers to Eaton Vance Corp., “EV” refers to Eaton Vance, Inc., “EVM” refers to Eaton Vance Management, “BMR” refers to Boston Management and Research and “EVD” refers to Eaton Vance Distributors, Inc. EVC and EV are the corporate parent and trustee, respectively, of EVM and BMR. EVD is the Fund’s principal underwriter, the Portfolio’s placement agent and a wholly-owned subsidiary of EVC. Each officer affiliated with Eaton Vance may hold a position with other Eaton Vance affiliates that is comparable to his or her position with EVM listed below. Each Trustee oversees 159 portfolios in the Eaton Vance Complex (including all master and feeder funds in a master feeder structure). Each officer serves as an officer of certain other Eaton Vance funds. Each Trustee and officer serves until his or her successor is elected.
| Name and Year of Birth | Position(s) with the Trust and the Portfolio | Trustee Since(1) | Principal Occupation(s) and Directorships During Past Five Years and Other Relevant Experience | |||
| Interested Trustee | ||||||
Thomas E. Faust Jr. 1958 | Trustee | 2007 | Chairman, Chief Executive Officer and President of EVC, Director and President of EV, Chief Executive Officer and President of EVM and BMR, and Director of EVD. Trustee and/or officer of 159 registered investment companies. Mr. Faust is an interested person because of his positions with EVM, BMR, EVD, EVC and EV, which are affiliates of the Trust and the Portfolio. Directorships in the Last Five Years. Director of EVC and Hexavest Inc. (investment management firm). | |||
| Noninterested Trustees | ||||||
Mark R. Fetting 1954 | Trustee | 2016 | Private investor. Formerly held various positions at Legg Mason, Inc. (investment management firm) (2000-2012), including President, Chief Executive Officer, Director and Chairman (2008-2012), Senior Executive Vice President (2004-2008) and Executive Vice President (2001-2004). Formerly, President of Legg Mason family of funds (2001-2008). Formerly, Division President and Senior Officer of Prudential Financial Group, Inc. and related companies (investment management firm)(1991-2000). Other Directorships in the Last Five Years.None. | |||
Cynthia E. Frost 1961 | Trustee | 2014 | Private investor. Formerly, Chief Investment Officer of Brown University (university endowment) (2000-2012). Formerly, Portfolio Strategist for Duke Management Company (university endowment manager) (1995-2000). Formerly, Managing Director, Cambridge Associates (investment consulting company) (1989-1995). Formerly, Consultant, Bain and Company (management consulting firm)(1987-1989). Formerly, Senior Equity Analyst, BA Investment Management Company (1983-1985). Other Directorships in the Last Five Years.None. | |||
George J. Gorman 1952 | Trustee | 2014 | Principal at George J. Gorman LLC (consulting firm). Formerly, Senior Partner at Ernst & Young LLP (a registered public accounting firm) (1974-2009). Other Directorships in the Last Five Years.Formerly, Trustee of the BofA Funds Series Trust (11 funds) (2011-2014) and of the Ashmore Funds (9 funds)(2010-2014). | |||
Valerie A. Mosley 1960 | Trustee | 2014 | Chairwoman and Chief Executive Officer of Valmo Ventures (a consulting and investment firm). Former Partner and Senior Vice President, Portfolio Manager and Investment Strategist at Wellington Management Company, LLP (investment management firm) (1992-2012). Former Chief Investment Officer, PG Corbin Asset Management (1990-1992). Formerly worked in institutional corporate bond sales at Kidder Peabody (1986-1990). Other Directorships in the Last Five Years. Director of Envestnet, Inc. (provider of intelligent systems for wealth management and financial wellness) (since 2018). Director of Dynex Capital, Inc. (mortgage REIT) (since 2013). | |||
| 30 |
Eaton Vance
Greater India Fund
December 31, 2019
Management and Organization — continued
| Name and Year of Birth | �� | Position(s) with the Trust and the Portfolio | Trustee Since(1) | Principal Occupation(s) and Directorships During Past Five Years and Other Relevant Experience | ||
| Noninterested Trustees (continued) | ||||||
William H. Park 1947 | Chairperson of the Board and Trustee | 2016 (Chairperson) 2003 (Trustee) | Private investor. Formerly, Consultant (management and transactional) (2012-2014). Formerly, Chief Financial Officer, Aveon Group L.P. (investment management firm) (2010-2011). Formerly, Vice Chairman, Commercial Industrial Finance Corp. (specialty finance company) (2006-2010). Formerly, President and Chief Executive Officer, Prizm Capital Management, LLC (investment management firm)(2002-2005). Formerly, Executive Vice President and Chief Financial Officer, United Asset Management Corporation (investment management firm) (1982-2001). Formerly, Senior Manager, Price Waterhouse (now PricewaterhouseCoopers) (a registered public accounting firm) (1972-1981). Other Directorships in the Last Five Years.None. | |||
Helen Frame Peters 1948 | Trustee | 2008 | Professor of Finance, Carroll School of Management, Boston College. Formerly, Dean, Carroll School of Management, Boston College (2000-2002). Formerly, Chief Investment Officer, Fixed Income, Scudder Kemper Investments (investment management firm) (1998-1999). Formerly, Chief Investment Officer, Equity and Fixed Income, Colonial Management Associates (investment management firm)(1991-1998). Other Directorships in the Last Five Years. None. | |||
Keith Quinton 1958 | Trustee | 2018 | Independent Investment Committee Member at New Hampshire Retirement System (since 2017). Advisory Committee member at Northfield Information Services, Inc. (risk management analytics provider) (since 2016). Formerly, Portfolio Manager and Senior Quantitative Analyst at Fidelity Investments (investment management firm) (2001-2014). Other Directorships in the Last Five Years. Director of New Hampshire Municipal Bond Bank (since 2016). | |||
Marcus L. Smith 1966 | Trustee | 2018 | Member of Posse Boston Advisory Board (foundation) (since 2015). Trustee at University of Mount Union (since 2008). Formerly, Portfolio Manager at MFS Investment Management (investment management firm) (1994-2017). Other Directorships in the Last Five Years. Director of MSCI Inc. (global provider of investment decision support tools) (since 2017). Formerly, Director of DCT Industrial Trust Inc. (logistics real estate company) (2017-2018). | |||
Susan J. Sutherland 1957 | Trustee | 2015 | Private investor. Formerly, Associate, Counsel and Partner at Skadden, Arps, Slate, Meagher & Flom LLP (law firm) (1982-2013). Other Directorships in the Last Five Years. Formerly, Director of Montpelier Re Holdings Ltd. (global provider of customized insurance and reinsurance products) (2013-2015). | |||
Scott E. Wennerholm 1959 | Trustee | 2016 | Formerly, Trustee at Wheelock College (postsecondary institution) (2012-2018). Formerly, Consultant at GF Parish Group (executive recruiting firm) (2016-2017). Formerly, Chief Operating Officer and Executive Vice President at BNY Mellon Asset Management (investment management firm) (2005-2011). Formerly, Chief Operating Officer and Chief Financial Officer at Natixis Global Asset Management (investment management firm) (1997-2004). Formerly, Vice President at Fidelity Investments Institutional Services (investment management firm) (1994-1997). Other Directorships in the Last Five Years. None. | |||
| Name and Year of Birth | Position(s) and the Portfolio | Officer Since(2) | Principal Occupation(s) During Past Five Years | |||
| Principal Officers who are not Trustees | ||||||
Payson F. Swaffield 1956 | President of the Trust | 2003 | Vice President and Chief Income Investment Officer of EVM and BMR. Also Vice President of Calvert Research and Management (“CRM”). | |||
| 31 |
Eaton Vance
Greater India Fund
December 31, 2019
Management and Organization — continued
| Name and Year of Birth | Position(s) and the Portfolio | Officer Since(2) | Principal Occupation(s) During Past Five Years | |||
| Principal Officers who are not Trustees (continued) | ||||||
Edward J. Perkin 1972 | President of the Portfolio | 2014 | Chief Equity Investment Officer and Vice President of EVM and BMR since 2014. Also Vice President of Calvert Research and Management (“CRM”) since 2016. | |||
Maureen A. Gemma 1960 | Vice President, Secretary and Chief Legal Officer | 2005 | Vice President of EVM and BMR. Also Vice President of CRM. | |||
James F. Kirchner 1967 | Treasurer | 2007 | Vice President of EVM and BMR. Also Vice President of CRM. | |||
Richard F. Froio 1968 | Chief Compliance Officer | 2017 | Vice President of EVM and BMR since 2017. Formerly Deputy Chief Compliance Officer (Adviser/Funds) and Chief Compliance Officer (Distribution) at PIMCO (2012-2017) and Managing Director at BlackRock/Barclays Global Investors (2009-2012). | |||
| (1) | Year first appointed to serve as Trustee for a fund in the Eaton Vance family of funds. Each Trustee has served continuously since appointment unless indicated otherwise. |
| (2) | Year first elected to serve as officer of a fund in the Eaton Vance family of funds when the officer has served continuously. Otherwise, year of most recent election as an officer of a fund in the Eaton Vance family of funds. Titles may have changed since initial election. |
The SAI for the Fund includes additional information about the Trustees and officers of the Fund and the Portfolio and can be obtained without charge on Eaton Vance’s website at www.eatonvance.com or by calling1-800-262-1122.
| 32 |
Eaton Vance Funds
IMPORTANT NOTICES
Privacy. The Eaton Vance organization is committed to ensuring your financial privacy. Each entity listed below has adopted a privacy policy and procedures (“Privacy Program”) Eaton Vance believes is reasonably designed to protect your personal information and to govern when and with whom Eaton Vance may share your personal information.
| • | At the time of opening an account, Eaton Vance generally requires you to provide us with certain information such as name, address, social security number, tax status, account numbers, and account balances. This information is necessary for us to both open an account for you and to allow us to satisfy legal requirements such as applicable anti-money laundering reviews and know-your-customer requirements. |
| • | On an ongoing basis, in the normal course of servicing your account, Eaton Vance may share your information with unaffiliated third parties that perform various services for Eaton Vance and/or your account. These third parties include transfer agents, custodians, broker/dealers and our professional advisers, including auditors, accountants, and legal counsel. Eaton Vance may additionally share your personal information with our affiliates. |
| • | We believe our Privacy Program is reasonably designed to protect the confidentiality of your personal information and to prevent unauthorized access to that information. |
| • | We reserve the right to change our Privacy Program at any time upon proper notification to you. You may want to review our Privacy Program periodically for changes by accessing the link on our homepage: www.eatonvance.com. |
Our pledge of protecting your personal information applies to the following entities within the Eaton Vance organization: the Eaton Vance Family of Funds, Eaton Vance Management, Eaton Vance Investment Counsel, Eaton Vance Distributors, Inc., Eaton Vance Trust Company, Eaton Vance Management (International) Limited, Eaton Vance Advisers International Limited, Eaton Vance Global Advisors Limited, Eaton Vance Management’s Real Estate Investment Group, Boston Management and Research, Calvert Research and Management, and Calvert Funds. This Privacy Notice supersedes all previously issued privacy disclosures. For more information about our Privacy Program or about how your personal information may be used, please call1-800-262-1122.
Delivery of Shareholder Documents. The Securities and Exchange Commission (SEC) permits funds to deliver only one copy of shareholder documents, including prospectuses, proxy statements and shareholder reports, to fund investors with multiple accounts at the same residential or post office box address. This practice is often called “householding” and it helps eliminate duplicate mailings to shareholders.Eaton Vance, or your financial intermediary, may household the mailing of your documents indefinitely unless you instruct Eaton Vance, or your financial intermediary, otherwise.If you would prefer that your Eaton Vance documents not be householded, please contact Eaton Vance at1-800-262-1122, or contact your financial intermediary. Your instructions that householding not apply to delivery of your Eaton Vance documents will typically be effective within 30 days of receipt by Eaton Vance or your financial intermediary.
Portfolio Holdings. Each Eaton Vance Fund and its underlying Portfolio(s) (if applicable) files a schedule of portfolio holdings on Part F toForm N-PORT with the SEC for the first and third quarters of each fiscal year. The FormN-PORT will be available on the Eaton Vance website at www.eatonvance.com, by calling Eaton Vance at1-800-262-1122 or in the EDGAR database on the SEC’s website at www.sec.gov.
Proxy Voting. From time to time, funds are required to vote proxies related to the securities held by the funds. The Eaton Vance Funds or their underlying Portfolios (if applicable) vote proxies according to a set of policies and procedures approved by the Funds’ and Portfolios’ Boards. You may obtain a description of these policies and procedures and information on how the Funds or Portfolios voted proxies relating to portfolio securities during the most recent12-month period ended June 30, without charge, upon request, by calling1-800-262-1122 and by accessing the SEC’s website at www.sec.gov.
| 33 |
This Page Intentionally Left Blank
This Page Intentionally Left Blank
This Page Intentionally Left Blank
Investment Adviser of Eaton Vance Greater India Fund and Greater India Portfolio
Boston Management and Research
Two International Place
Boston, MA 02110
InvestmentSub-Adviser of Eaton Vance Greater India Fund and Greater India Portfolio
Goldman Sachs Asset Management, L.P.
200 West Street
New York, NY 10282
Administrator of Eaton Vance Greater India Fund
Eaton Vance Management
Two International Place
Boston, MA 02110
Principal Underwriter*
Eaton Vance Distributors, Inc.
Two International Place
Boston, MA 02110
(617)482-8260
Custodian
State Street Bank and Trust Company
State Street Financial Center, One Lincoln Street
Boston, MA 02111
Transfer Agent
BNY Mellon Investment Servicing (US) Inc.
Attn: Eaton Vance Funds
P.O. Box 9653
Providence, RI 02940-9653
(800)262-1122
Independent Registered Public Accounting Firm
Deloitte & Touche LLP
200 Berkeley Street
Boston, MA 02116-5022
Fund Offices
Two International Place
Boston, MA 02110
| * | FINRA BrokerCheck. Investors may check the background of their Investment Professional by contacting the Financial Industry Regulatory Authority (FINRA). FINRA BrokerCheck is a free tool to help investors check the professional background of current and former FINRA-registered securities firms and brokers. FINRA BrokerCheck is available by calling1-800-289-9999 and at www.FINRA.org. The FINRA BrokerCheck brochure describing this program is available to investors at www.FINRA.org. |

142 12.31.19

Eaton Vance
Growth Fund
Annual Report
December 31, 2019
Important Note. Beginning on January 1, 2021, as permitted by regulations adopted by the Securities and Exchange Commission, paper copies of the Fund’s annual and semi-annual shareholder reports will no longer be sent by mail unless you specifically request paper copies of the reports. Instead, the reports will be made available on the Fund’s website (eatonvance.com/funddocuments), and you will be notified by mail each time a report is posted and provided with a website address to access the report.
If you already elected to receive shareholder reports electronically, you will not be affected by this change and you need not take any action. If you are a direct investor, you may elect to receive shareholder reports and other communications from the Fund electronically by signing up fore-Delivery at eatonvance.com/edelivery. If you own your shares through a financial intermediary (such as a broker-dealer or bank), you must contact your financial intermediary to sign up.
You may elect to receive all future Fund shareholder reports in paper free of charge. If you are a direct investor, you can inform the Fund that you wish to continue receiving paper copies of your shareholder reports by calling1-800-262-1122. If you own these shares through a financial intermediary, you must contact your financial intermediary or follow instructions included with this disclosure, if applicable, to elect to continue to receive paper copies of your shareholder reports. Your election to receive reports in paper will apply to all Eaton Vance funds held directly or to all funds held through your financial intermediary, as applicable.

Commodity Futures Trading Commission Registration. Effective December 31, 2012, the Commodity Futures Trading Commission (“CFTC”) adopted certain regulatory changes that subject registered investment companies and advisers to regulation by the CFTC if a fund invests more than a prescribed level of its assets in certain CFTC-regulated instruments (including futures, certain options and swap agreements) or markets itself as providing investment exposure to such instruments. The Fund has claimed an exclusion from the definition of the term “commodity pool operator” under the Commodity Exchange Act. Accordingly, neither the Fund nor the adviser with respect to the operation of the Fund is subject to CFTC regulation. Because of its management of other strategies, the Fund’s adviser is registered with the CFTC as a commodity pool operator and a commodity trading advisor.
Fund shares are not insured by the FDIC and are not deposits or other obligations of, or guaranteed by, any depository institution. Shares are subject to investment risks, including possible loss of principal invested.
This report must be preceded or accompanied by a current summary prospectus or prospectus. Before investing, investors should consider carefully the investment objective, risks, and charges and expenses of a mutual fund. This and other important information is contained in the summary prospectus and prospectus, which can be obtained from a financial intermediary. Prospective investors should read the prospectus carefully before investing. For further information, please call1-800-262-1122.
Annual ReportDecember 31, 2019
Eaton Vance
Growth Fund
Table of Contents
Management’s Discussion of Fund Performance | 2 | |||
Performance | 3 | |||
Fund Profile | 4 | |||
Endnotes and Additional Disclosures | 5 | |||
Fund Expenses | 6 | |||
Financial Statements | 7 | |||
Report of Independent Registered Public Accounting Firm | 23 | |||
Federal Tax Information | 24 | |||
Management and Organization | 25 | |||
Important Notices | 27 | |||
Eaton Vance
Growth Fund
December 31, 2019
Management’s Discussion of Fund Performance1
Economic and Market Conditions
With virtually every U.S. equity index posting strong double-digit returns for the 12-month period ended December 31, 2019 — and bond markets solidly in the black as well — 2019 was a good year for investments.
As the new year dawned in January 2019, investors appeared to be taking a “glass is half full” approach. Although U.S. manufacturing output and business investment remained weak — held back by slowing global growth and an on-again/off-again U.S.-China trade war — strong spending by U.S. consumers and dovish remarks by the U.S. Federal Reserve (the Fed) combined to lift investor sentiment. After four federal funds rate hikes the previous year, markets began to project the Fed might actually lower rates in 2019 to stimulate the economy. U.S. unemployment, meanwhile, remained low and hiring remained strong.
As a result, U.S. stocks across multiple markets climbed from January through April 2019. Overseas, central banks around the world began to cut interest rates and employ other tools to stimulate their respective economies. Even a global stock pullback in May — sparked by heightened concerns about the U.S.-China trade spat — proved to be temporary, and the U.S. and global stock rallies resumed in June and July.
After holding interest rates steady through the first half of the year, the Fed cut the federal funds rate on July 31, 2019 — its first reduction in over a decade — followed by two additional rate cuts in September and October to end the period at 1.50%-1.75%. By end of the third quarter, 60 central banks around the world had lowered their interest rates as well.
After falling in August, U.S. equities rallied again during the final months of the period, spurred by optimism about a U.S.-China trade détente and better-than-expected U.S. employment reports. The year ended with two events in December that did much to allay investor concerns about international trade and tariffs: passage of the United States-Mexico-Canada Agreement by the U.S. House of Representatives and the Trump administration’s agreement to a so-called “phase–one” trade deal with China.
During the 12-month period ended December 31, 2019, the blue-chip Dow Jones Industrial Average®2 returned 25.34%, while the broader U.S. equity market, as measured by the S&P 500® Index, returned 31.49%. The technology-laden Nasdaq Composite Index returned 36.69% during the period. Large-cap U.S. stocks, as measured by the S&P 500® Index, generally outperformed their small-cap counterparts, as measured by the Russell 2000® Index. As a group, growth stocks outpaced value stocks in both large- and small-cap categories, as measured by the Russell growth and value indexes.
Fund Performance
For the 12-month period ended December 31, 2019, Eaton Vance Growth Fund (the Fund) returned 30.38% for Class A shares at net asset value (NAV), underperforming its benchmark, the Russell 1000® Growth Index (the Index), which returned 36.39%
The Fund underperformed the Index due primarily to stock selection, although sector and industry allocation also detracted from relative performance. Of the 11 market sectors in the Index, the Fund had positive returns in the 10 sectors in which it was invested. The Index had positive returns in all 11 sectors, but only one sector — information technology (IT) — had returns that outpaced the Index as a whole.
As a diversified Fund, the returns relative to the Index during the period were constrained by the outperformance and concentrated stock leadership in the IT sector. Within the sector, Fund positions in the software industry were a drag on returns during the period. Security software company SailPoint Technologies Holdings, Inc. and webhosting leader GoDaddy, Inc. were among the Fund’s weakest individual performers as their stock prices retreated after disappointing financial results. The Fund’s biggest detractor was the underweighting of computer and smartphone leader Apple, Inc., which generated sizeable stock returns despite earnings deceleration.
Stock selection in the communication services sector also detracted from Fund results relative to the Index. While Walt Disney Co. was among the Fund’s best-performing stocks on an absolute basis, an overweight to the lagging entertainment industry offset strong absolute returns.
The financials sector hampered Fund performance relative to the Index during the period largely due to stock selection. Brokerage giant Charles Schwab Corp. was among the Fund’s poorest-performing stocks amid mounting competitive pressures on fees and the business implications of continued consolidation in the retail brokerage industry.
On the positive side, the health care sector contributed to relative Fund performance versus the Index due to stock selection. The best-performing stock within the Fund was biotech oncology company Loxo Oncology, Inc., an out-of-Index holding, whose stock price jumped when it was acquired by a major pharmaceutical company.
The consumer discretionary sector also contributed to Fund results relative to the Index due to stock selection. In the outperforming auto components industry, Aptiv PLC, a smart auto components manufacturer, was one of the Fund’s leading stocks after reporting strong sales growth. The Fund’s underweight position in the lagging hotels, restaurants & leisure industry also boosted Fund performance relative to the Index.
Stock selection and an underweight position in the industrials sector also aided Fund results relative to the Index, as the sector trailed during the period. In particular, the Fund’s lack of exposure to the underperforming industrial conglomerates and machinery industries contributed to relative Fund performance versus the Index during the period.
See Endnotes and Additional Disclosures in this report.
Past performance is no guarantee of future results. Returns are historical and are calculated by determining the percentage change in net asset value (NAV) or offering price (as applicable) with all distributions reinvested. Investment return and principal value will fluctuate so that shares, when redeemed, may be worth more or less than their original cost. Performance for periods less than or equal to one year is cumulative. Performance is for the stated time period only; due to market volatility, current Fund performance may be lower or higher than the quoted return. For performance as of the most recent month-end, please refer to eatonvance.com.
| 2 |
Eaton Vance
Growth Fund
December 31, 2019
Performance2,3
Portfolio ManagersLewis R. Piantedosi and Yana S. Barton, CFA
% Average Annual Total Returns | Class Inception Date | Performance Inception Date | One Year | Five Years | Ten Years | |||||||||||||||
Class A at NAV | 09/09/2002 | 09/09/2002 | 30.38 | % | 12.41 | % | 12.95 | % | ||||||||||||
Class A with 5.75% Maximum Sales Charge | — | — | 22.88 | 11.09 | 12.28 | |||||||||||||||
Class C at NAV | 09/09/2002 | 09/09/2002 | 29.35 | 11.57 | 12.11 | |||||||||||||||
Class C with 1% Maximum Sales Charge | — | — | 28.35 | 11.57 | 12.11 | |||||||||||||||
Class I at NAV | 05/03/2007 | 09/09/2002 | 30.65 | 12.69 | 13.23 | |||||||||||||||
Class R at NAV | 08/03/2009 | 09/09/2002 | 30.03 | 12.12 | 12.67 | |||||||||||||||
Russell 1000® Growth Index | — | — | 36.39 | % | 14.62 | % | 15.21 | % | ||||||||||||
| % Total Annual Operating Expense Ratios4 | Class A | Class C | Class I | Class R | ||||||||||||||||
Gross | 1.09 | % | 1.84 | % | 0.84 | % | 1.34 | % | ||||||||||||
Net | 1.05 | 1.80 | 0.80 | 1.30 | ||||||||||||||||
Growth of $10,000
This graph shows the change in value of a hypothetical investment of $10,000 in Class A of the Fund for the period indicated. For comparison, the same investment is shown in the indicated index.
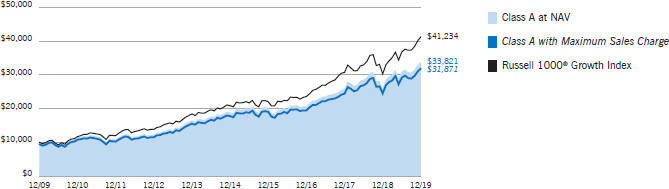
| Growth of Investment | Amount Invested | Period Beginning | At NAV | With Maximum Sales Charge | ||||||||||||
Class C | $ | 10,000 | 12/31/2009 | $ | 31,371 | N.A. | ||||||||||
Class I | $ | 250,000 | 12/31/2009 | $ | 866,568 | N.A. | ||||||||||
Class R | $ | 10,000 | 12/31/2009 | $ | 32,991 | N.A. | ||||||||||
See Endnotes and Additional Disclosures in this report.
Past performance is no guarantee of future results. Returns are historical and are calculated by determining the percentage change in net asset value (NAV) or offering price (as applicable) with all distributions reinvested. Investment return and principal value will fluctuate so that shares, when redeemed, may be worth more or less than their original cost. Performance for periods less than or equal to one year is cumulative. Performance is for the stated time period only; due to market volatility, current Fund performance may be lower or higher than the quoted return. For performance as of the most recent month-end, please refer to eatonvance.com.
| 3 |
Eaton Vance
Growth Fund
December 31, 2019
Fund Profile
Sector Allocation (% of net assets)5
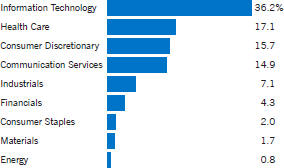
Top 10 Holdings (% of net assets)5
Amazon.com, Inc. | 7.7 | % | ||
Visa, Inc., Class A | 6.4 | |||
Microsoft Corp. | 5.2 | |||
Alphabet, Inc., Class C | 4.6 | |||
Alphabet, Inc., Class A | 3.5 | |||
Adobe, Inc. | 3.3 | |||
salesforce.com, Inc. | 3.2 | |||
QUALCOMM, Inc. | 2.8 | |||
Facebook, Inc., Class A | 2.6 | |||
Apple, Inc. | 2.1 | |||
Total | 41.4 | % | ||
See Endnotes and Additional Disclosures in this report.
| 4 |
Eaton Vance
Growth Fund
December 31, 2019
Endnotes and Additional Disclosures
| 1 | The views expressed in this report are those of the portfolio manager(s) and are current only through the date stated at the top of this page. These views are subject to change at any time based upon market or other conditions, and Eaton Vance and the Fund(s) disclaim any responsibility to update such views. These views may not be relied upon as investment advice and, because investment decisions are based on many factors, may not be relied upon as an indication of trading intent on behalf of any Eaton Vance fund. This commentary may contain statements that are not historical facts, referred to as “forward looking statements.” The Fund’s actual future results may differ significantly from those stated in any forward looking statement, depending on factors such as changes in securities or financial markets or general economic conditions, the volume of sales and purchases of Fund shares, the continuation of investment advisory, administrative and service contracts, and other risks discussed from time to time in the Fund’s filings with the Securities and Exchange Commission. |
| 2 | Dow Jones Industrial Average® is a price-weighted average of 30 blue-chip stocks that are generally the leaders in their industry. S&P 500® Index is an unmanaged index of large-cap stocks commonly used as a measure of U.S. stock market performance. S&P Dow Jones Indices are a product of S&P Dow Jones Indices LLC (“S&P DJI”) and have been licensed for use. S&P® and S&P 500® are registered trademarks of S&P DJI; Dow Jones® is a registered trademark of Dow Jones Trademark Holdings LLC (“Dow Jones”); S&P DJI, Dow Jones and their respective affiliates do not sponsor, endorse, sell or promote the Fund, will not have any liability with respect thereto and do not have any liability for any errors, omissions, or interruptions of the S&P Dow Jones Indices. Nasdaq Composite Index is a market capitalization-weighted index of all domestic and international securities listed on Nasdaq. Source: Nasdaq, Inc. The information is provided by Nasdaq (with its affiliates, are referred to as the “Corporations”) and Nasdaq’s third party licensors on an “as is” basis and the Corporations make no guarantees and bear no liability of any kind with respect to the information or the Fund. Russell 2000® Index is an unmanaged index of 2,000 U.S. small-cap stocks. Russell 1000® Growth Index is an unmanaged index of U.S. large-cap growth stocks. Unless otherwise stated, index returns do not reflect the effect of any applicable sales charges, commissions, expenses, taxes or leverage, as applicable. It is not possible to invest directly in an index. |
| 3 | Total Returns at NAV do not include applicable sales charges. If sales charges were deducted, the returns would be lower. Total Returns shown with maximum sales charge reflect the stated maximum sales charge. Unless otherwise stated, performance does not reflect the deduction of taxes on Fund distributions or redemptions of Fund shares. |
| 4 | Source: Fund prospectus. Net expense ratios reflect a contractual expense reimbursement that continues through 4/30/20. Without the reimbursement, performance would have been lower. The expense ratios for the current reporting period can be found in the Financial Highlights section of this report. |
| 5 | Excludes cash and cash equivalents. |
Fund profile subject to change due to active management. |
| 5 |
Eaton Vance
Growth Fund
December 31, 2019
Fund Expenses
Example: As a Fund shareholder, you incur two types of costs: (1) transaction costs, including sales charges (loads) on purchases and redemption fees (if applicable); and (2) ongoing costs, including management fees; distribution and/or service fees; and other Fund expenses. This Example is intended to help you understand your ongoing costs (in dollars) of Fund investing and to compare these costs with the ongoing costs of investing in other mutual funds. The Example is based on an investment of $1,000 invested at the beginning of the period and held for the entire period (July 1, 2019 – December 31, 2019).
Actual Expenses: The first section of the table below provides information about actual account values and actual expenses. You may use the information in this section, together with the amount you invested, to estimate the expenses that you paid over the period. Simply divide your account value by $1,000 (for example, an $8,600 account value divided by $1,000 = 8.6), then multiply the result by the number in the first section under the heading entitled “Expenses Paid During Period” to estimate the expenses you paid on your account during this period.
Hypothetical Example for Comparison Purposes: The second section of the table below provides information about hypothetical account values and hypothetical expenses based on the actual Fund expense ratio and an assumed rate of return of 5% per year (before expenses), which is not the actual Fund return. The hypothetical account values and expenses may not be used to estimate the actual ending account balance or expenses you paid for the period. You may use this information to compare the ongoing costs of investing in your Fund and other funds. To do so, compare this 5% hypothetical example with the 5% hypothetical examples that appear in the shareholder reports of the other funds.
Please note that the expenses shown in the table are meant to highlight your ongoing costs only and do not reflect any transactional costs, such as sales charges (loads) or redemption fees (if applicable). Therefore, the second section of the table is useful in comparing ongoing costs only, and will not help you determine the relative total costs of owning different funds. In addition, if these transactional costs were included, your costs would be higher.
| Beginning Account Value (7/1/19) | Ending Account Value (12/31/19) | Expenses Paid During Period* (7/1/19 – 12/31/19) | Annualized Ratio | |||||||||||||
Actual | ||||||||||||||||
Class A | $ | 1,000.00 | $ | 1,095.10 | $ | 5.54 | ** | 1.05 | % | |||||||
Class C | $ | 1,000.00 | $ | 1,090.50 | $ | 9.48 | ** | 1.80 | % | |||||||
Class I | $ | 1,000.00 | $ | 1,096.10 | $ | 4.23 | ** | 0.80 | % | |||||||
Class R | $ | 1,000.00 | $ | 1,093.30 | $ | 6.86 | ** | 1.30 | % | |||||||
Hypothetical | ||||||||||||||||
(5% return per year before expenses) | ||||||||||||||||
Class A | $ | 1,000.00 | $ | 1,019.90 | $ | 5.35 | ** | 1.05 | % | |||||||
Class C | $ | 1,000.00 | $ | 1,016.10 | $ | 9.15 | ** | 1.80 | % | |||||||
Class I | $ | 1,000.00 | $ | 1,021.20 | $ | 4.08 | ** | 0.80 | % | |||||||
Class R | $ | 1,000.00 | $ | 1,018.70 | $ | 6.61 | ** | 1.30 | % | |||||||
| * | Expenses are equal to the Fund’s annualized expense ratio for the indicated Class, multiplied by the average account value over the period, multiplied by 184/365 (to reflect theone-half year period). The Example assumes that the $1,000 was invested at the net asset value per share determined at the close of business on June 30, 2019. |
| ** | Absent an allocation of certain expenses to an affiliate, expenses would be higher. |
| 6 |
Eaton Vance
Growth Fund
December 31, 2019
Portfolio of Investments
| Common Stocks— 99.5% |
| |||||||
| Security | Shares | Value | ||||||
| Aerospace & Defense— 2.8% | ||||||||
Boeing Co. (The) | 11,149 | $ | 3,631,898 | |||||
Hexcel Corp. | 30,176 | 2,212,202 | ||||||
Raytheon Co. | 13,682 | 3,006,483 | ||||||
| $ | 8,850,583 | |||||||
| Auto Components— 1.9% | ||||||||
Aptiv PLC | 65,303 | $ | 6,201,826 | |||||
| $ | 6,201,826 | |||||||
| Banks— 3.2% | ||||||||
Bank of America Corp. | 154,228 | $ | 5,431,910 | |||||
JPMorgan Chase & Co. | 34,721 | 4,840,107 | ||||||
| $ | 10,272,017 | |||||||
| Beverages— 1.4% | ||||||||
Coca-Cola Co. (The) | 54,728 | $ | 3,029,195 | |||||
PepsiCo, Inc. | 10,960 | 1,497,903 | ||||||
| $ | 4,527,098 | |||||||
| Biotechnology— 3.4% | ||||||||
Amgen, Inc. | 3,593 | $ | 866,165 | |||||
Argenx SE ADR(1) | 13,135 | 2,108,430 | ||||||
Blueprint Medicines Corp.(1) | 23,281 | 1,865,041 | ||||||
Deciphera Pharmaceuticals, Inc.(1) | 12,500 | 778,000 | ||||||
Exact Sciences Corp.(1)(2) | 19,210 | 1,776,541 | ||||||
Mirati Therapeutics, Inc.(1)(2) | 8,918 | 1,149,173 | ||||||
Vertex Pharmaceuticals, Inc.(1) | 11,442 | 2,505,226 | ||||||
| $ | 11,048,576 | |||||||
| Building Products— 0.7% | ||||||||
Fortune Brands Home & Security, Inc. | 32,747 | $ | 2,139,689 | |||||
| $ | 2,139,689 | |||||||
| Capital Markets— 1.1% | ||||||||
Charles Schwab Corp. (The) | 71,777 | $ | 3,413,714 | |||||
| $ | 3,413,714 | |||||||
| Chemicals— 1.0% | ||||||||
LyondellBasell Industries NV, Class A | 22,910 | $ | 2,164,537 | |||||
Sherwin-Williams Co. (The) | 1,752 | 1,022,362 | ||||||
| $ | 3,186,899 | |||||||
| Security | Shares | Value | ||||||
| Commercial Services & Supplies— 1.5% | ||||||||
Waste Connections, Inc. | 24,582 | $ | 2,231,800 | |||||
Waste Management, Inc. | 24,017 | 2,736,977 | ||||||
| $ | 4,968,777 | |||||||
| Communications Equipment— 0.8% | ||||||||
Arista Networks, Inc.(1) | 12,328 | $ | 2,507,515 | |||||
| $ | 2,507,515 | |||||||
| Containers & Packaging— 0.7% | ||||||||
Avery Dennison Corp. | 16,570 | $ | 2,167,687 | |||||
| $ | 2,167,687 | |||||||
| Electrical Equipment— 1.4% | ||||||||
AMETEK, Inc. | 44,928 | $ | 4,481,119 | |||||
| $ | 4,481,119 | |||||||
| Electronic Equipment, Instruments & Components— 1.6% | ||||||||
Zebra Technologies Corp., Class A(1) | 20,065 | $ | 5,125,404 | |||||
| $ | 5,125,404 | |||||||
| Energy Equipment & Services— 0.8% | ||||||||
Schlumberger, Ltd. | 64,088 | $ | 2,576,338 | |||||
| $ | 2,576,338 | |||||||
| Entertainment— 2.0% | ||||||||
Netflix, Inc.(1) | 4,281 | $ | 1,385,203 | |||||
Walt Disney Co. (The) | 34,404 | 4,975,851 | ||||||
| $ | 6,361,054 | |||||||
| Food Products— 0.6% | ||||||||
Mondelez International, Inc., Class A | 35,710 | $ | 1,966,907 | |||||
| $ | 1,966,907 | |||||||
| Health Care Equipment & Supplies— 5.5% | ||||||||
Abbott Laboratories | 37,217 | $ | 3,232,669 | |||||
Boston Scientific Corp.(1) | 111,747 | 5,053,199 | ||||||
Danaher Corp. | 24,191 | 3,712,835 | ||||||
Intuitive Surgical, Inc.(1) | 9,784 | 5,783,811 | ||||||
| $ | 17,782,514 | |||||||
| Health Care Providers & Services— 1.9% | ||||||||
Anthem, Inc. | 20,230 | $ | 6,110,067 | |||||
| $ | 6,110,067 | |||||||
| 7 | See Notes to Financial Statements. |
Eaton Vance
Growth Fund
December 31, 2019
Portfolio of Investments — continued
| Security | Shares | Value | ||||||
| Hotels, Restaurants & Leisure— 1.6% | ||||||||
Planet Fitness, Inc., Class A(1) | 35,609 | $ | 2,659,280 | |||||
Wynn Resorts, Ltd. | 18,406 | 2,556,041 | ||||||
| $ | 5,215,321 | |||||||
| Interactive Media & Services— 12.3% | ||||||||
Alphabet, Inc., Class A(1) | 8,421 | $ | 11,279,003 | |||||
Alphabet, Inc., Class C(1) | 11,107 | 14,850,281 | ||||||
Facebook, Inc., Class A(1) | 40,343 | 8,280,401 | ||||||
IAC/InterActiveCorp.(1) | 12,524 | 3,119,854 | ||||||
Twitter, Inc.(1) | 59,692 | 1,913,128 | ||||||
| $ | 39,442,667 | |||||||
| Internet & Direct Marketing Retail— 7.7% | ||||||||
Amazon.com, Inc.(1) | 13,478 | $ | 24,905,187 | |||||
| $ | 24,905,187 | |||||||
| IT Services— 10.2% | ||||||||
GoDaddy, Inc., Class A(1) | 88,384 | $ | 6,003,041 | |||||
PayPal Holdings, Inc.(1) | 59,265 | 6,410,695 | ||||||
Visa, Inc., Class A | 109,095 | 20,498,951 | ||||||
| $ | 32,912,687 | |||||||
| Life Sciences Tools & Services— 1.9% | ||||||||
10X Genomics, Inc., Class A(1) | 12,837 | $ | 978,821 | |||||
Agilent Technologies, Inc. | 31,797 | 2,712,602 | ||||||
Illumina, Inc.(1) | 7,378 | 2,447,578 | ||||||
| $ | 6,139,001 | |||||||
| Media— 0.7% | ||||||||
Fox Corp., Class A | 57,209 | $ | 2,120,738 | |||||
| $ | 2,120,738 | |||||||
| Pharmaceuticals— 4.0% | ||||||||
AstraZeneca PLC ADR | 55,883 | $ | 2,786,326 | |||||
Bristol-Myers Squibb Co. | 59,953 | 3,848,383 | ||||||
Merck & Co., Inc. | 69,620 | 6,331,939 | ||||||
| $ | 12,966,648 | |||||||
| Road & Rail— 0.8% | ||||||||
CSX Corp. | 35,597 | $ | 2,575,799 | |||||
| $ | 2,575,799 | |||||||
| Security | Shares | Value | ||||||
| Semiconductors & Semiconductor Equipment— 5.4% | ||||||||
Micron Technology, Inc.(1) | 66,267 | $ | 3,563,839 | |||||
QUALCOMM, Inc. | 103,756 | 9,154,392 | ||||||
Texas Instruments, Inc. | 37,385 | 4,796,122 | ||||||
| $ | 17,514,353 | |||||||
| Software— 16.1% | ||||||||
Adobe, Inc.(1) | 32,014 | $ | 10,558,537 | |||||
Intuit, Inc. | 21,629 | 5,665,284 | ||||||
Microsoft Corp. | 105,550 | 16,645,235 | ||||||
Palo Alto Networks, Inc.(1) | 8,700 | 2,011,875 | ||||||
SailPoint Technologies Holding, Inc.(1) | 108,795 | 2,567,562 | ||||||
salesforce.com, Inc.(1) | 64,309 | 10,459,216 | ||||||
Zscaler, Inc.(1)(2) | 84,549 | 3,931,529 | ||||||
| $ | 51,839,238 | |||||||
| Specialty Retail— 2.7% | ||||||||
Lowe’s Cos., Inc. | 54,730 | $ | 6,554,465 | |||||
TJX Cos., Inc. (The) | 34,703 | 2,118,965 | ||||||
| $ | 8,673,430 | |||||||
| Technology Hardware, Storage & Peripherals— 2.1% | ||||||||
Apple, Inc. | 22,845 | $ | 6,708,434 | |||||
| $ | 6,708,434 | |||||||
| Textiles, Apparel & Luxury Goods— 1.7% | ||||||||
NIKE, Inc., Class B | 54,758 | $ | 5,547,533 | |||||
| $ | 5,547,533 | |||||||
Total Common Stocks |
| $ | 320,248,820 | |||||
| Rights— 0.3% | ||||||||
| Security | Shares | Value | ||||||
| Pharmaceuticals— 0.3% | ||||||||
Bristol-Myers Squibb Co. CVR, Exp. 3/31/21(1) | 363,471 | $ | 1,094,048 | |||||
Total Rights |
| $ | 1,094,048 | |||||
| 8 | See Notes to Financial Statements. |
Eaton Vance
Growth Fund
December 31, 2019
Portfolio of Investments — continued
| Short-Term Investments— 0.3% | ||||||||
| Description | Units | Value | ||||||
Eaton Vance Cash Reserves Fund, LLC, 1.78%(3) | 891,636 | $ | 891,636 | |||||
Total Short-Term Investments |
| $ | 891,636 | |||||
Total Investments — 100.1% |
| $ | 322,234,504 | |||||
Other Assets, Less Liabilities — (0.1)% | $ | (366,849 | ) | |||||
Net Assets — 100.0% | $ | 321,867,655 | ||||||
The percentage shown for each investment category in the Portfolio of Investments is based on net assets.
| (1) | Non-income producing security. |
| (2) | All or a portion of this security was on loan at December 31, 2019. The aggregate market value of securities on loan at December 31, 2019 was $6,788,458. |
| (3) | Affiliated investment company, available to Eaton Vance portfolios and funds, which invests in high quality, U.S. dollar denominated money market instruments. The rate shown is the annualizedseven-day yield as of December 31, 2019. |
Abbreviations:
| ADR | – | American Depositary Receipt | ||
| CVR | – | Contingent Value Rights | ||
| 9 | See Notes to Financial Statements. |
Eaton Vance
Growth Fund
December 31, 2019
Statement of Assets and Liabilities
| Assets | December 31, 2019 | |||
Unaffiliated investments, at value including $6,788,458 of securities on loan (identified cost, $170,271,466) | $ | 321,342,868 | ||
Affiliated investment, at value (identified cost, $891,565) | 891,636 | |||
Dividends receivable | 150,015 | |||
Dividends receivable from affiliated investment | 810 | |||
Receivable for Fund shares sold | 93,680 | |||
Securities lending income receivable | 634 | |||
Tax reclaims receivable | 110,796 | |||
Receivable from affiliate | 17,221 | |||
Total assets | $ | 322,607,660 | ||
| Liabilities |
| |||
Payable for Fund shares redeemed | $ | 300,573 | ||
Payable to affiliates: | ||||
Investment adviser fee | 175,682 | |||
Distribution and service fees | 65,372 | |||
Trustees’ fees | 4,425 | |||
Accrued expenses | 193,953 | |||
Total liabilities | $ | 740,005 | ||
Net Assets | $ | 321,867,655 | ||
| Sources of Net Assets |
| |||
Paid-in capital | $ | 165,448,994 | ||
Distributable earnings | 156,418,661 | |||
Total | $ | 321,867,655 | ||
| Class A Shares | ||||
Net Assets | $ | 236,456,504 | ||
Shares Outstanding | 8,406,995 | |||
Net Asset Value and Redemption Price Per Share | ||||
(net assets ÷ shares of beneficial interest outstanding) | $ | 28.13 | ||
Maximum Offering Price Per Share | ||||
(100 ÷ 94.25 of net asset value per share) | $ | 29.85 | ||
| Class C Shares |
| |||
Net Assets | $ | 17,501,109 | ||
Shares Outstanding | 768,096 | |||
Net Asset Value and Offering Price Per Share* | ||||
(net assets ÷ shares of beneficial interest outstanding) | $ | 22.79 | ||
| Class I Shares |
| |||
Net Assets | $ | 65,646,347 | ||
Shares Outstanding | 2,247,974 | |||
Net Asset Value, Offering Price and Redemption Price Per Share | ||||
(net assets ÷ shares of beneficial interest outstanding) | $ | 29.20 | ||
| Class R Shares |
| |||
Net Assets | $ | 2,263,695 | ||
Shares Outstanding | 83,123 | |||
Net Asset Value, Offering Price and Redemption Price Per Share | ||||
(net assets ÷ shares of beneficial interest outstanding) | $ | 27.23 | ||
On sales of $50,000 or more, the offering price of Class A shares is reduced.
| ||||
| * | Redemption price per share is equal to the net asset value less any applicable contingent deferred sales charge. |
| 10 | See Notes to Financial Statements. |
Eaton Vance
Growth Fund
December 31, 2019
Statement of Operations
| Investment Income | Year Ended December 31, 2019 | |||
Dividends (net of foreign taxes, $15,214) | $ | 2,962,093 | ||
Dividends from affiliated investment | 22,524 | |||
Securities lending income, net | 26,374 | |||
Total investment income | $ | 3,010,991 | ||
| Expenses | ||||
Investment adviser fee | $ | 2,143,890 | ||
Distribution and service fees | ||||
Class A | 569,710 | |||
Class C | 215,972 | |||
Class R | 14,458 | |||
Trustees’ fees and expenses | 18,192 | |||
Custodian fee | 87,506 | |||
Transfer and dividend disbursing agent fees | 329,030 | |||
Legal and accounting services | 55,165 | |||
Printing and postage | 38,628 | |||
Registration fees | 59,803 | |||
Miscellaneous | 30,894 | |||
Total expenses | $ | 3,563,248 | ||
Deduct — | ||||
Allocation of expenses to affiliate | $ | 116,796 | ||
Total expense reductions | $ | 116,796 | ||
Net expenses | $ | 3,446,452 | ||
Net investment loss | $ | (435,461 | ) | |
| Realized and Unrealized Gain (Loss) | ||||
Net realized gain (loss) — | ||||
Investment transactions | $ | 38,424,135 | ||
Investment transactions — affiliated investment | (622 | ) | ||
Foreign currency transactions | 91 | |||
Net realized gain | $ | 38,423,604 | ||
Change in unrealized appreciation (depreciation) — | ||||
Investments | $ | 49,261,393 | ||
Investments — affiliated investment | 64 | |||
Foreign currency | (132 | ) | ||
Net change in unrealized appreciation (depreciation) | $ | 49,261,325 | ||
Net realized and unrealized gain | $ | 87,684,929 | ||
Net increase in net assets from operations | $ | 87,249,468 | ||
| 11 | See Notes to Financial Statements. |
Eaton Vance
Growth Fund
December 31, 2019
Statements of Changes in Net Assets
| Year Ended December 31, | ||||||||
| Increase (Decrease) in Net Assets | 2019 | 2018 | ||||||
From operations — |
| |||||||
Net investment loss | $ | (435,461 | ) | $ | (521,866 | ) | ||
Net realized gain | 38,423,604 | 34,461,123 | ||||||
Net change in unrealized appreciation (depreciation) | 49,261,325 | (31,206,770 | ) | |||||
Net increase in net assets from operations | $ | 87,249,468 | $ | 2,732,487 | ||||
Distributions to shareholders — |
| |||||||
Class A | $ | (19,933,190 | ) | $ | (24,204,622 | ) | ||
Class C | (1,838,413 | ) | (5,206,991 | ) | ||||
Class I | (5,682,677 | ) | (9,715,041 | ) | ||||
Class R | (190,725 | ) | (374,416 | ) | ||||
Total distributions to shareholders | $ | (27,645,005 | ) | $ | (39,501,070 | ) | ||
Transactions in shares of beneficial interest — |
| |||||||
Proceeds from sale of shares |
| |||||||
Class A | $ | 11,587,924 | $ | 16,474,915 | ||||
Class C | 1,833,899 | 4,753,672 | ||||||
Class I | 15,275,659 | 21,385,481 | ||||||
Class R | 407,315 | 742,398 | ||||||
Net asset value of shares issued to shareholders in payment of distributions declared |
| |||||||
Class A | 18,389,458 | 22,215,152 | ||||||
Class C | 1,635,011 | 4,834,021 | ||||||
Class I | 5,539,930 | 9,519,787 | ||||||
Class R | 157,118 | 296,311 | ||||||
Cost of shares redeemed |
| |||||||
Class A | (38,424,586 | ) | (36,050,791 | ) | ||||
Class C | (8,928,687 | ) | (11,236,195 | ) | ||||
Class I | (50,226,391 | ) | (21,372,672 | ) | ||||
Class R | (1,903,334 | ) | (1,151,015 | ) | ||||
Net asset value of shares converted |
| |||||||
Class A | 16,669,280 | — | ||||||
Class C | (16,669,280 | ) | — | |||||
Net increase (decrease) in net assets from Fund share transactions | $ | (44,656,684 | ) | $ | 10,411,064 | |||
Net increase (decrease) in net assets | $ | 14,947,779 | $ | (26,357,519 | ) | |||
| Net Assets |
| |||||||
At beginning of year | $ | 306,919,876 | $ | 333,277,395 | ||||
At end of year | $ | 321,867,655 | $ | 306,919,876 | ||||
| 12 | See Notes to Financial Statements. |
Eaton Vance
Growth Fund
December 31, 2019
Financial Highlights
| Class A | ||||||||||||||||||||
| Year Ended December 31, | ||||||||||||||||||||
| 2019 | 2018 | 2017 | 2016 | 2015 | ||||||||||||||||
Net asset value — Beginning of year | $ | 23.610 | $ | 26.650 | $ | 22.300 | $ | 22.230 | $ | 21.670 | ||||||||||
| Income (Loss) From Operations | ||||||||||||||||||||
Net investment income (loss)(1) | $ | (0.037 | ) | $ | (0.034 | ) | $ | (0.021 | ) | $ | 0.047 | $ | 0.140 | |||||||
Net realized and unrealized gain | 7.095 | 0.301 | 5.680 | 0.451 | 1.387 | |||||||||||||||
Total income from operations | $ | 7.058 | $ | 0.267 | $ | 5.659 | $ | 0.498 | $ | 1.527 | ||||||||||
| Less Distributions | ||||||||||||||||||||
From net investment income | $ | — | $ | — | $ | (0.029 | ) | $ | (0.085 | ) | $ | — | ||||||||
From net realized gain | (2.538 | ) | (3.307 | ) | (1.280 | ) | (0.343 | ) | (0.967 | ) | ||||||||||
Total distributions | $ | (2.538 | ) | $ | (3.307 | ) | $ | (1.309 | ) | $ | (0.428 | ) | $ | (0.967 | ) | |||||
Net asset value — End of year | $ | 28.130 | $ | 23.610 | $ | 26.650 | $ | 22.300 | $ | 22.230 | ||||||||||
Total Return(2)(3) | 30.38 | % | 0.27 | % | 25.42 | % | 2.32 | % | 7.04 | % | ||||||||||
| Ratios/Supplemental Data | ||||||||||||||||||||
Net assets, end of year (000’s omitted) | $ | 236,457 | $ | 190,017 | $ | 209,606 | $ | 194,018 | $ | 214,135 | ||||||||||
Ratios (as a percentage of average daily net assets): | ||||||||||||||||||||
Expenses(3)(4) | 1.05 | % | 1.05 | %(5) | 1.05 | %(5) | 1.05 | %(5) | 1.05 | %(5) | ||||||||||
Net investment income (loss) | (0.14 | )% | (0.12 | )%(5) | (0.08 | )%(5) | 0.22 | %(5) | 0.62 | %(5) | ||||||||||
Portfolio Turnover of the Portfolio | — | 20 | %(6)(7) | 50 | %(7) | 60 | %(7) | 55 | %(7) | |||||||||||
Portfolio Turnover of the Fund | 40 | % | 28 | %(6)(8) | — | — | — | |||||||||||||
| (1) | Computed using average shares outstanding. |
| (2) | Returns are historical and are calculated by determining the percentage change in net asset value with all distributions reinvested and do not reflect the effect of sales charges. |
| (3) | The administrator reimbursed certain operating expenses (equal to 0.04%, 0.04%, 0.06%, 0.08% and 0.07% of average daily net assets for the years ended December 31, 2019, 2018, 2017, 2016 and 2015, respectively). Absent this reimbursement, total return would be lower. |
| (4) | Excludes the effect of custody fee credits, if any, of less than 0.005%. Effective September 1, 2015, custody fee credits, which were earned on cash deposit balances, were discontinued by the custodian. |
| (5) | Includes the Fund’s share of the Portfolio’s allocated expenses for the period while the Fund was investing in the Portfolio. |
| (6) | Not annualized. |
| (7) | Portfolio turnover represents the rate of portfolio activity for the period while the Fund was investing in the Portfolio. |
| (8) | For the period from May 14, 2018 through December 31, 2018 when the Fund was making investments directly in securities. |
References to Portfolio herein are to Growth Portfolio, a Massachusetts business trust in which the Fund invested all of its investable assets prior to the close of business on May 11, 2018 and which had the same investment objective and policies as the Fund during such period.
| 13 | See Notes to Financial Statements. |
Eaton Vance
Growth Fund
December 31, 2019
Financial Highlights — continued
| Class C | ||||||||||||||||||||
| Year Ended December 31, | ||||||||||||||||||||
| 2019 | 2018 | 2017 | 2016 | 2015 | ||||||||||||||||
Net asset value — Beginning of year | $ | 19.660 | $ | 22.870 | $ | 19.410 | $ | 19.460 | $ | 19.230 | ||||||||||
| Income (Loss) From Operations | ||||||||||||||||||||
Net investment loss(1) | $ | (0.206 | ) | $ | (0.214 | ) | $ | (0.183 | ) | $ | (0.101 | ) | $ | (0.025 | ) | |||||
Net realized and unrealized gain | 5.874 | 0.311 | 4.923 | 0.394 | 1.222 | |||||||||||||||
Total income from operations | $ | 5.668 | $ | 0.097 | $ | 4.740 | $ | 0.293 | $ | 1.197 | ||||||||||
| Less Distributions | ||||||||||||||||||||
From net realized gain | $ | (2.538 | ) | $ | (3.307 | ) | $ | (1.280 | ) | $ | (0.343 | ) | $ | (0.967 | ) | |||||
Total distributions | $ | (2.538 | ) | $ | (3.307 | ) | $ | (1.280 | ) | $ | (0.343 | ) | $ | (0.967 | ) | |||||
Net asset value — End of year | $ | 22.790 | $ | 19.660 | $ | 22.870 | $ | 19.410 | $ | 19.460 | ||||||||||
Total Return(2)(3) | 29.35 | % | (0.43 | )% | 24.45 | % | 1.57 | % | 6.20 | % | ||||||||||
| Ratios/Supplemental Data | ||||||||||||||||||||
Net assets, end of year (000’s omitted) | $ | 17,501 | $ | 35,061 | $ | 41,450 | $ | 41,272 | $ | 48,285 | ||||||||||
Ratios (as a percentage of average daily net assets): | ||||||||||||||||||||
Expenses(3)(4) | 1.80 | % | 1.80 | %(5) | 1.80 | %(5) | 1.80 | %(5) | 1.80 | %(5) | ||||||||||
Net investment loss | (0.91 | )% | (0.87 | )%(5) | (0.83 | )%(5) | (0.53 | )%(5) | (0.13 | )%(5) | ||||||||||
Portfolio Turnover of the Portfolio | — | 20 | %(6)(7) | 50 | %(7) | 60 | %(7) | 55 | %(7) | |||||||||||
Portfolio Turnover of the Fund | 40 | % | 28 | %(6)(8) | — | — | — | |||||||||||||
| (1) | Computed using average shares outstanding. |
| (2) | Returns are historical and are calculated by determining the percentage change in net asset value with all distributions reinvested and do not reflect the effect of sales charges. |
| (3) | The administrator reimbursed certain operating expenses (equal to 0.04%, 0.04%, 0.06%, 0.08% and 0.07% of average daily net assets for the years ended December 31, 2019, 2018, 2017, 2016 and 2015, respectively). Absent this reimbursement, total return would be lower. |
| (4) | Excludes the effect of custody fee credits, if any, of less than 0.005%. Effective September 1, 2015, custody fee credits, which were earned on cash deposit balances, were discontinued by the custodian. |
| (5) | Includes the Fund’s share of the Portfolio’s allocated expenses for the period while the Fund was investing in the Portfolio. |
| (6) | Not annualized. |
| (7) | Portfolio turnover represents the rate of portfolio activity for the period while the Fund was investing in the Portfolio. |
| (8) | For the period from May 14, 2018 through December 31, 2018 when the Fund was making investments directly in securities. |
References to Portfolio herein are to Growth Portfolio, a Massachusetts business trust in which the Fund invested all of its investable assets prior to the close of business on May 11, 2018 and which had the same investment objective and policies as the Fund during such period.
| 14 | See Notes to Financial Statements. |
Eaton Vance
Growth Fund
December 31, 2019
Financial Highlights — continued
| Class I | ||||||||||||||||||||
| Year Ended December 31, | ||||||||||||||||||||
| 2019 | 2018 | 2017 | 2016 | 2015 | ||||||||||||||||
Net asset value — Beginning of year | $ | 24.380 | $ | 27.340 | $ | 22.850 | $ | 22.760 | $ | 22.120 | ||||||||||
| Income (Loss) From Operations | ||||||||||||||||||||
Net investment income(1) | $ | 0.029 | $ | 0.040 | $ | 0.043 | $ | 0.108 | $ | 0.192 | ||||||||||
Net realized and unrealized gain | 7.329 | 0.307 | 5.820 | 0.461 | 1.415 | |||||||||||||||
Total income from operations | $ | 7.358 | $ | 0.347 | $ | 5.863 | $ | 0.569 | $ | 1.607 | ||||||||||
| Less Distributions | ||||||||||||||||||||
From net investment income | $ | — | $ | — | $ | (0.093 | ) | $ | (0.136 | ) | $ | — | ||||||||
From net realized gain | (2.538 | ) | (3.307 | ) | (1.280 | ) | (0.343 | ) | (0.967 | ) | ||||||||||
Total distributions | $ | (2.538 | ) | $ | (3.307 | ) | $ | (1.373 | ) | $ | (0.479 | ) | $ | (0.967 | ) | |||||
Net asset value — End of year | $ | 29.200 | $ | 24.380 | $ | 27.340 | $ | 22.850 | $ | 22.760 | ||||||||||
Total Return(2)(3) | 30.65 | % | 0.56 | % | 25.72 | % | 2.59 | % | 7.26 | % | ||||||||||
| Ratios/Supplemental Data | ||||||||||||||||||||
Net assets, end of year (000’s omitted) | $ | 65,646 | $ | 78,812 | $ | 78,775 | $ | 61,036 | $ | 58,746 | ||||||||||
Ratios (as a percentage of average daily net assets): | ||||||||||||||||||||
Expenses(3)(4) | 0.80 | % | 0.80 | %(5) | 0.80 | %(5) | 0.80 | %(5) | 0.80 | %(5) | ||||||||||
Net investment income | 0.10 | % | 0.14 | %(5) | 0.16 | %(5) | 0.48 | %(5) | 0.84 | %(5) | ||||||||||
Portfolio Turnover of the Portfolio | — | 20 | %(6)(7) | 50 | %(7) | 60 | %(7) | 55 | %(7) | |||||||||||
Portfolio Turnover of the Fund | 40 | % | 28 | %(6)(8) | — | — | — | |||||||||||||
| (1) | Computed using average shares outstanding. |
| (2) | Returns are historical and are calculated by determining the percentage change in net asset value with all distributions reinvested. |
| (3) | The administrator reimbursed certain operating expenses (equal to 0.04%, 0.04%, 0.06%, 0.08% and 0.07% of average daily net assets for the years ended December 31, 2019, 2018, 2017, 2016 and 2015, respectively). Absent this reimbursement, total return would be lower. |
| (4) | Excludes the effect of custody fee credits, if any, of less than 0.005%. Effective September 1, 2015, custody fee credits, which were earned on cash deposit balances, were discontinued by the custodian. |
| (5) | Includes the Fund’s share of the Portfolio’s allocated expenses for the period while the Fund was investing in the Portfolio. |
| (6) | Not annualized. |
| (7) | Portfolio turnover represents the rate of portfolio activity for the period while the Fund was investing in the Portfolio. |
| (8) | For the period from May 14, 2018 through December 31, 2018 when the Fund was making investments directly in securities. |
References to Portfolio herein are to Growth Portfolio, a Massachusetts business trust in which the Fund invested all of its investable assets prior to the close of business on May 11, 2018 and which had the same investment objective and policies as the Fund during such period.
| 15 | See Notes to Financial Statements. |
Eaton Vance
Growth Fund
December 31, 2019
Financial Highlights — continued
| Class R | ||||||||||||||||||||
| Year Ended December 31, | ||||||||||||||||||||
| 2019 | 2018 | 2017 | 2016 | 2015 | ||||||||||||||||
Net asset value — Beginning of year | $ | 22.980 | $ | 26.090 | $ | 21.880 | $ | 21.800 | $ | 21.320 | ||||||||||
| Income (Loss) From Operations | ||||||||||||||||||||
Net investment income (loss)(1) | $ | (0.105 | ) | $ | (0.104 | ) | $ | (0.082 | ) | $ | (0.010 | ) | $ | 0.059 | ||||||
Net realized and unrealized gain | 6.893 | 0.301 | 5.572 | 0.439 | 1.388 | |||||||||||||||
Total income from operations | $ | 6.788 | $ | 0.197 | $ | 5.490 | $ | 0.429 | $ | 1.447 | ||||||||||
| Less Distributions | ||||||||||||||||||||
From net investment income | $ | — | $ | — | $ | — | $ | (0.006 | ) | $ | — | |||||||||
From net realized gain | (2.538 | ) | (3.307 | ) | (1.280 | ) | (0.343 | ) | (0.967 | ) | ||||||||||
Total distributions | $ | (2.538 | ) | $ | (3.307 | ) | $ | (1.280 | ) | $ | (0.349 | ) | $ | (0.967 | ) | |||||
Net asset value — End of year | $ | 27.230 | $ | 22.980 | $ | 26.090 | $ | 21.880 | $ | 21.800 | ||||||||||
Total Return(2)(3) | 30.03 | % | 0.01 | % | 25.12 | % | 2.03 | % | 6.77 | % | ||||||||||
| Ratios/Supplemental Data | ||||||||||||||||||||
Net assets, end of year (000’s omitted) | $ | 2,264 | $ | 3,030 | $ | 3,447 | $ | 3,217 | $ | 4,186 | ||||||||||
Ratios (as a percentage of average daily net assets): | ||||||||||||||||||||
Expenses(3)(4) | 1.30 | % | 1.30 | %(5) | 1.30 | %(5) | 1.30 | %(5) | 1.30 | %(5) | ||||||||||
Net investment income (loss) | (0.39 | )% | (0.37 | )%(5) | (0.33 | )%(5) | (0.05 | )%(5) | 0.27 | %(5) | ||||||||||
Portfolio Turnover of the Portfolio | — | 20 | %(6)(7) | 50 | %(7) | 60 | %(7) | 55 | %(7) | |||||||||||
Portfolio Turnover of the Fund | 40 | % | 28 | %(6)(8) | — | — | — | |||||||||||||
| (1) | Computed using average shares outstanding. |
| (2) | Returns are historical and are calculated by determining the percentage change in net asset value with all distributions reinvested. |
| (3) | The administrator reimbursed certain operating expenses (equal to 0.04%, 0.04%, 0.06%, 0.08% and 0.07% of average daily net assets for the years ended December 31, 2019, 2018, 2017, 2016 and 2015, respectively). Absent this reimbursement, total return would be lower. |
| (4) | Excludes the effect of custody fee credits, if any, of less than 0.005%. Effective September 1, 2015, custody fee credits, which were earned on cash deposit balances, were discontinued by the custodian. |
| (5) | Includes the Fund’s share of the Portfolio’s allocated expenses for the period while the Fund was investing in the Portfolio. |
| (6) | Not annualized. |
| (7) | Portfolio turnover represents the rate of portfolio activity for the period while the Fund was investing in the Portfolio. |
| (8) | For the period from May 14, 2018 through December 31, 2018 when the Fund was making investments directly in securities. |
References to Portfolio herein are to Growth Portfolio, a Massachusetts business trust in which the Fund invested all of its investable assets prior to the close of business on May 11, 2018 and which had the same investment objective and policies as the Fund during such period.
| 16 | See Notes to Financial Statements. |
Eaton Vance
Growth Fund
December 31, 2019
Notes to Financial Statements
1 Significant Accounting Policies
Eaton Vance Growth Fund (the Fund) is a diversified series of Eaton Vance Special Investment Trust (the Trust). The Trust is a Massachusetts business trust registered under the Investment Company Act of 1940, as amended (the 1940 Act), as anopen-end management investment company. The Fund’s investment objective is to seek total return. The Fund offers four classes of shares. Class A shares are generally sold subject to a sales charge imposed at time of purchase. Class C shares are sold at net asset value and are generally subject to a contingent deferred sales charge (see Note 5). Effective January 25, 2019, Class C shares generally automatically convert to Class A shares ten years after their purchase as described in the Fund’s prospectus. Class I and Class R shares are sold at net asset value and are not subject to a sales charge. Each class represents apro-rata interest in the Fund, but votes separately on class-specific matters and (as noted below) is subject to different expenses. Realized and unrealized gains and losses and net investment income and losses, other than class-specific expenses, are allocated daily to each class of shares based on the relative net assets of each class to the total net assets of the Fund. Each class of shares differs in its distribution plan and certain other class-specific expenses.
The following is a summary of significant accounting policies of the Fund. The policies are in conformity with accounting principles generally accepted in the United States of America (U.S. GAAP). The Fund is an investment company and follows accounting and reporting guidance in the Financial Accounting Standards Board (FASB) Accounting Standards Codification Topic 946.
A Investment Valuation — The following methodologies are used to determine the market value or fair value of investments.
Equity Securities.Equity securities listed on a U.S. securities exchange generally are valued at the last sale or closing price on the day of valuation or, if no sales took place on such date, at the mean between the closing bid and ask prices on the exchange where such securities are principally traded. Equity securities listed on the NASDAQ Global or Global Select Market generally are valued at the NASDAQ official closing price. Unlisted or listed securities for which closing sales prices or closing quotations are not available are valued at the mean between the latest available bid and ask prices.
Affiliated Fund.The Fund may invest in Eaton Vance Cash Reserves Fund, LLC (Cash Reserves Fund), an affiliated investment company managed by Eaton Vance Management (EVM). While Cash Reserves Fund is not a registered money market mutual fund, it conducts all of its investment activities in accordance with the requirements of Rule2a-7 under the 1940 Act. Investments in Cash Reserves Fund are valued at the closing net asset value per unit on the valuation day. Cash Reserves Fund generally values its investment securities based on available market quotations provided by a third party pricing service.
Fair Valuation.Investments for which valuations or market quotations are not readily available or are deemed unreliable are valued at fair value using methods determined in good faith by or at the direction of the Trustees of the Fund in a manner that most fairly reflects the security’s “fair value”, which is the amount that the Fund might reasonably expect to receive for the security upon its current sale in the ordinary course. Each such determination is based on a consideration of relevant factors, which are likely to vary from one pricing context to another. These factors may include, but are not limited to, the type of security, the existence of any contractual restrictions on the security’s disposition, the price and extent of public trading in similar securities of the issuer or of comparable companies or entities, quotations or relevant information obtained from broker/dealers or other market participants, information obtained from the issuer, analysts, and/or the appropriate stock exchange (for exchange-traded securities), an analysis of the company’s or entity’s financial statements, and an evaluation of the forces that influence the issuer and the market(s) in which the security is purchased and sold.
B Investment Transactions — Investment transactions for financial statement purposes are accounted for on a trade date basis. Realized gains and losses on investments sold are determined on the basis of identified cost.
C Income — Dividend income is recorded on theex-dividend date for dividends received in cash and/or securities. Withholding taxes on foreign dividends and capital gains have been provided for in accordance with the Fund’s understanding of the applicable countries’ tax rules and rates.
D Federal Taxes — The Fund’s policy is to comply with the provisions of the Internal Revenue Code applicable to regulated investment companies and to distribute to shareholders each year substantially all of its net investment income, and all or substantially all of its net realized capital gains. Accordingly, no provision for federal income or excise tax is necessary.
As of December 31, 2019, the Fund had no uncertain tax positions that would require financial statement recognition,de-recognition, or disclosure. The Fund files a U.S. federal income tax return annually after its fiscalyear-end, which is subject to examination by the Internal Revenue Service for a period of three years from the date of filing.
E Expenses — The majority of expenses of the Trust are directly identifiable to an individual fund. Expenses which are not readily identifiable to a specific fund are allocated taking into consideration, among other things, the nature and type of expense and the relative size of the funds.
F Foreign Currency Translation — Other assets and liabilities initially expressed in foreign currencies are translated each business day into U.S. dollars based upon current exchange rates. Income and expenses denominated in foreign currencies are translated into U.S. dollars based upon currency exchange rates in effect on the respective dates of such transactions.
G Use of Estimates — The preparation of the financial statements in conformity with U.S. GAAP requires management to make estimates and assumptions that affect the reported amounts of assets and liabilities at the date of the financial statements and the reported amounts of income and expense during the reporting period. Actual results could differ from those estimates.
| 17 |
Eaton Vance
Growth Fund
December 31, 2019
Notes to Financial Statements — continued
H Indemnifications — Under the Trust’s organizational documents, its officers and Trustees may be indemnified against certain liabilities and expenses arising out of the performance of their duties to the Fund. Under Massachusetts law, if certain conditions prevail, shareholders of a Massachusetts business trust (such as the Trust) could be deemed to have personal liability for the obligations of the Trust. However, the Trust’s Declaration of Trust contains an express disclaimer of liability on the part of Fund shareholders and theBy-laws provide that the Trust shall assume, upon request by the shareholder, the defense on behalf of any Fund shareholders. Moreover, theBy-laws also provide for indemnification out of Fund property of any shareholder held personally liable solely by reason of being or having been a shareholder for all loss or expense arising from such liability. Additionally, in the normal course of business, the Fund enters into agreements with service providers that may contain indemnification clauses. The Fund’s maximum exposure under these arrangements is unknown as this would involve future claims that may be made against the Fund that have not yet occurred.
2 Distributions to Shareholders and Income Tax Information
It is the present policy of the Fund to make at least one distribution annually (normally in December) of all or substantially all of its net investment income and to distribute annually all or substantially all of its net realized capital gains. Distributions to shareholders are recorded on theex-dividend date. Distributions are declared separately for each class of shares. Shareholders may reinvest income and capital gain distributions in additional shares of the same class of the Fund at the net asset value as of theex-dividend date or, at the election of the shareholder, receive distributions in cash. Distributions to shareholders are determined in accordance with income tax regulations, which may differ from U.S. GAAP. As required by U.S. GAAP, only distributions in excess of tax basis earnings and profits are reported in the financial statements as a return of capital. Permanent differences between book and tax accounting relating to distributions are reclassified topaid-in capital. For tax purposes, distributions from short-term capital gains are considered to be from ordinary income.
The tax character of distributions declared for the years ended December 31, 2019 and December 31, 2018 was as follows:
| Year Ended December 31, | ||||||||
| 2019 | 2018 | |||||||
Long-term capital gains | $ | 27,645,005 | $ | 39,501,070 | ||||
During the year ended December 31, 2019, distributable earnings was decreased by $2,562,625 andpaid-in capital was increased by $2,562,625 due to the Fund’s use of equalization accounting and differences between book and tax accounting for net operating losses. Tax equalization accounting allows the Fund to treat as a distribution that portion of redemption proceeds representing a redeeming shareholder’s portion of undistributed taxable income and net capital gains. These reclassifications had no effect on the net assets or net asset value per share of the Fund.
As of December 31, 2019, the components of distributable earnings (accumulated loss) on a tax basis were as follows:
Undistributed long-term capital gains | $ | 5,483,941 | ||
Net unrealized appreciation | $ | 150,934,720 | ||
The cost and unrealized appreciation (depreciation) of investments of the Fund at December 31, 2019, as determined on a federal income tax basis, were as follows:
Aggregate cost | $ | 171,299,770 | ||
Gross unrealized appreciation | $ | 152,007,885 | ||
Gross unrealized depreciation | (1,073,151 | ) | ||
Net unrealized appreciation | $ | 150,934,734 | ||
3 Investment Adviser Fee and Other Transactions with Affiliates
The investment adviser fee is earned by Boston Management and Research (BMR), a subsidiary of EVM, as compensation for investment advisory services rendered to the Fund. The fee is computed at an annual rate of 0.65% of the Fund’s average daily net assets up to $500 million and is payable monthly. On net assets of $500 million and over, the annual fee is reduced. For the year ended December 31, 2019, the Fund’s investment adviser fee amounted to $2,143,890 or 0.65% of the Fund’s average daily net assets. The Fund invests its cash in Cash Reserves Fund. EVM does not currently receive a fee for advisory services provided to Cash Reserves Fund.
| 18 |
Eaton Vance
Growth Fund
December 31, 2019
Notes to Financial Statements — continued
EVM serves as the administrator of the Fund, but currently receives no compensation. EVM has agreed to reimburse the Fund’s expenses to the extent that total annual operating expenses (relating to ordinary operating expenses only) exceed 1.05%, 1.80%, 0.80% and 1.30% of the Fund’s average daily net assets for Class A, Class C, Class I and Class R, respectively. This agreement may be changed or terminated after April 30, 2020. Pursuant to this agreement, EVM was allocated $116,796 of the Fund’s operating expenses for the year ended December 31, 2019.
EVM providessub-transfer agency and related services to the Fund pursuant to aSub-Transfer Agency Support Services Agreement. For the year ended December 31, 2019, EVM earned $87,136 from the Fund pursuant to such agreement, which is included in transfer and dividend disbursing agent fees on the Statement of Operations. The Fund was informed that Eaton Vance Distributors, Inc. (EVD), an affiliate of EVM and the Fund’s principal underwriter, received $13,126 as its portion of the sales charge on sales of Class A shares for the year ended December 31, 2019. EVD also received distribution and service fees from Class A, Class C and Class R shares (see Note 4) and contingent deferred sales charges (see Note 5).
Trustees and officers of the Fund who are members of EVM’s or BMR’s organizations receive remuneration for their services to the Fund out of the investment adviser fee. Trustees of the Fund who are not affiliated with the investment adviser may elect to defer receipt of all or a percentage of their annual fees in accordance with the terms of the Trustees Deferred Compensation Plan. For the year ended December 31, 2019, no significant amounts have been deferred. Certain officers and Trustees of the Fund are officers of the above organizations.
4 Distribution Plans
The Fund has in effect a distribution plan for Class A shares (Class A Plan) pursuant to Rule12b-1 under the 1940 Act. Pursuant to the Class A Plan, the Fund pays EVD a distribution and service fee of 0.25% per annum of its average daily net assets attributable to Class A shares for distribution services and facilities provided to the Fund by EVD, as well as for personal services and/or the maintenance of shareholder accounts. Distribution and service fees paid or accrued to EVD for the year ended December 31, 2019 amounted to $569,710 for Class A shares. The Fund also has in effect distribution plans for Class C shares (Class C Plan) and Class R shares (Class R Plan) pursuant to Rule12b-1 under the 1940 Act. Pursuant to the Class C Plan, the Fund pays EVD amounts equal to 0.75% per annum of its average daily net assets attributable to Class C shares for providing ongoing distribution services and facilities to the Fund. For the year ended December 31, 2019, the Fund paid or accrued to EVD $161,979 for Class C shares. The Class R Plan requires the Fund to pay EVD an amount up to 0.50% per annum of its average daily net assets attributable to Class R shares for providing ongoing distribution services and facilities to the Fund. The Trustees of the Trust have currently limited Class R distribution payments to 0.25% per annum of the average daily net assets attributable to Class R shares. For the year ended December 31, 2019, the Fund paid or accrued to EVD $7,229 for Class R shares.
Pursuant to the Class C and Class R Plans, the Fund also makes payments of service fees to EVD, financial intermediaries and other persons in amounts equal to 0.25% per annum of its average daily net assets attributable to that class. Service fees paid or accrued are for personal services and/or the maintenance of shareholder accounts. They are separate and distinct from the sales commissions and distribution fees payable to EVD. Service fees paid or accrued for the year ended December 31, 2019 amounted to $53,993 and $7,229 for Class C and Class R shares, respectively.
Distribution and service fees are subject to the limitations contained in the Financial Industry Regulatory Authority Rule 2341(d).
5 Contingent Deferred Sales Charges
A contingent deferred sales charge (CDSC) of 1% generally is imposed on redemptions of Class C shares made within one year of purchase. Class A shares may be subject to a 1% CDSC if redeemed within 18 months of purchase (depending on the circumstances of purchase). Generally, the CDSC is based upon the lower of the net asset value at date of redemption or date of purchase. No charge is levied on shares acquired by reinvestment of dividends or capital gain distributions. For the year ended December 31, 2019, the Fund was informed that EVD received approximately $1,000 and $1,000 of CDSCs paid by Class A and Class C shareholders, respectively.
6 Purchases and Sales of Investments
Purchases and sales of investments, other than short-term obligations, aggregated $130,421,426 and $203,318,344, respectively, for the year ended December 31, 2019. Included in sales are proceeds of $19,229,080 from the sale of securities by the Fund to investment companies advised by EVM or its affiliates that resulted in a net realized gain of $6,282,640.
| 19 |
Eaton Vance
Growth Fund
December 31, 2019
Notes to Financial Statements — continued
7 Shares of Beneficial Interest
The Fund’s Declaration of Trust permits the Trustees to issue an unlimited number of full and fractional shares of beneficial interest (without par value). Such shares may be issued in a number of different series (such as the Fund) and classes. Transactions in Fund shares were as follows:
| Year Ended December 31, | ||||||||
| Class A | 2019 | 2018 | ||||||
Sales | 424,596 | 576,003 | ||||||
Issued to shareholders electing to receive payments of distributions in Fund shares | 683,115 | 885,772 | ||||||
Redemptions | (1,391,551 | ) | (1,281,054 | ) | ||||
Converted from Class C shares | 643,576 | — | ||||||
Net increase | 359,736 | 180,721 | ||||||
| Year Ended December 31, | ||||||||
| Class C | 2019 | 2018 | ||||||
Sales | 80,631 | 200,067 | ||||||
Issued to shareholders electing to receive payments of distributions in Fund shares | 74,932 | 231,293 | ||||||
Redemptions | (396,688 | ) | (460,150 | ) | ||||
Converted to Class A shares | (774,084 | ) | — | |||||
Net decrease | (1,015,209 | ) | (28,790 | ) | ||||
| Year Ended December 31, | ||||||||
| Class I | 2019 | 2018 | ||||||
Sales | 528,614 | 730,159 | ||||||
Issued to shareholders electing to receive payments of distributions in Fund shares | 198,209 | 367,701 | ||||||
Redemptions | (1,711,650 | ) | (746,214 | ) | ||||
Net increase (decrease) | (984,827 | ) | 351,646 | |||||
| Year Ended December 31, | ||||||||
| Class R | 2019 | 2018 | ||||||
Sales | 15,637 | 27,438 | ||||||
Issued to shareholders electing to receive payments of distributions in Fund shares | 6,027 | 12,134 | ||||||
Redemptions | (70,349 | ) | (39,918 | ) | ||||
Net decrease | (48,685 | ) | (346 | ) | ||||
8 Line of Credit
The Fund participates with other portfolios and funds managed by EVM and its affiliates in an $800 million unsecured line of credit agreement with a group of banks, which is in effect through October 27, 2020. In connection with the renewal of the agreement on October 29, 2019, funds managed by Calvert Research and Management, an affiliate of EVM, were added as participating funds to the agreement and the borrowing limit was increased from $625 million. Borrowings are made by the Fund solely to facilitate the handling of unusual and/or unanticipated short-term cash requirements. Interest is charged to the Fund based on its borrowings at an amount above either the Eurodollar rate or Federal Funds rate. In addition, a fee computed at an annual rate of 0.15% on the daily unused portion of the line of credit is allocated among the participating portfolios and funds at the end of each quarter. Because
| 20 |
Eaton Vance
Growth Fund
December 31, 2019
Notes to Financial Statements — continued
the line of credit is not available exclusively to the Fund, it may be unable to borrow some or all of its requested amounts at any particular time. The Fund did not have any significant borrowings or allocated fees during the year ended December 31, 2019.
9 Securities Lending Agreement
The Fund has established a securities lending agreement with State Street Bank and Trust Company (SSBT) as securities lending agent in which the Fund lends portfolio securities to qualified borrowers in exchange for collateral consisting of either cash or securities issued or guaranteed by the U.S. Government or its agencies or instrumentalities in an amount at least equal to the market value of the securities on loan. The market value of securities loaned is determined daily and any additional required collateral is delivered to the Fund on the next business day. Cash collateral is invested in the State Street Navigator Securities Lending Government Money Market Portfolio, a money market fund registered under the 1940 Act. The Fund earns interest on the amount invested but it must pay (and at times receive from) the broker a loan rebate fee computed as a varying percentage of the collateral received. For security loans secured bynon-cash collateral, the Fund earns a negotiated lending fee from the borrower. A portion of the income earned by the Fund from its investment of cash collateral, net of rebate fees, and lending fees received is allocated to SSBT for its services as lending agent and the portion allocated to the Fund is presented as securities lending income, net on the Statement of Operations.Non-cash collateral is held by the lending agent on behalf of the Fund and cannot be sold orre-pledged by the Fund; accordingly, such collateral is not reflected in the Statement of Assets and Liabilities.
The Fund is subject to possible delay in the recovery of loaned securities. Pursuant to the securities lending agreement, SSBT has provided indemnification to the Fund in the event of default by a borrower with respect to a loan. The Fund bears the risk of loss with respect to the investment of cash collateral.
At December 31, 2019, the value of the securities loaned (all common stocks) and the value of the collateral received, which exceeded the value of the securities loaned, amounted to $6,788,458 and $6,915,204, respectively. Collateral received was comprised of U.S. government and/or agencies securities. The securities lending transactions have no contractual maturity date and each of the Fund and borrower has the option to terminate a loan at any time.
10 Investments in Affiliated Funds
At December 31, 2019, the value of the Fund’s investment in affiliated funds was $891,636, which represents 0.3% of the Fund’s net assets. Transactions in affiliated funds by the Fund for the year ended December 31, 2019 were as follows:
| Name of affiliated fund | Value, beginning of period | Purchases | Sales proceeds | Net realized gain (loss) | Change in unrealized appreciation (depreciation) | Value, end of period | Dividend income | Units, end of period | ||||||||||||||||||||||||
Short-Term Investments |
| |||||||||||||||||||||||||||||||
Eaton Vance Cash Reserves Fund, LLC, 1.78% | $ | 709,276 | $ | 47,361,573 | $ | (47,178,655 | ) | $ | (622 | ) | $ | 64 | $ | 891,636 | $ | 22,524 | 891,636 | |||||||||||||||
11 Fair Value Measurements
Under generally accepted accounting principles for fair value measurements, a three-tier hierarchy to prioritize the assumptions, referred to as inputs, is used in valuation techniques to measure fair value. The three-tier hierarchy of inputs is summarized in the three broad levels listed below.
| • | Level 1 – quoted prices in active markets for identical investments |
| • | Level 2 – other significant observable inputs (including quoted prices for similar investments, interest rates, prepayment speeds, credit risk, etc.) |
| • | Level 3 – significant unobservable inputs (including a fund’s own assumptions in determining the fair value of investments) |
In cases where the inputs used to measure fair value fall in different levels of the fair value hierarchy, the level disclosed is determined based on the lowest level input that is significant to the fair value measurement in its entirety. The inputs or methodology used for valuing securities are not necessarily an indication of the risk associated with investing in those securities.
| 21 |
Eaton Vance
Growth Fund
December 31, 2019
Notes to Financial Statements — continued
At December 31, 2019, the hierarchy of inputs used in valuing the Fund’s investments, which are carried at value, were as follows:
| Asset Description | Level 1 | Level 2 | Level 3 | Total | ||||||||||||
Common Stocks | $ | 320,248,820 | * | $ | — | $ | — | $ | 320,248,820 | |||||||
Rights | 1,094,048 | — | — | 1,094,048 | ||||||||||||
Short-Term Investments | — | 891,636 | — | 891,636 | ||||||||||||
Total Investments | $ | 321,342,868 | $ | 891,636 | $ | — | $ | 322,234,504 | ||||||||
| * | The level classification by major category of investments is the same as the category presentation in the Portfolio of Investments. |
| 22 |
Eaton Vance
Growth Fund
December 31, 2019
Report of Independent Registered Public Accounting Firm
To the Trustees of Eaton Vance Special Investment Trust and Shareholders of Eaton Vance Growth Fund:
Opinion on the Financial Statements and Financial Highlights
We have audited the accompanying statement of assets and liabilities of Eaton Vance Growth Fund (the “Fund”) (one of the funds constituting Eaton Vance Special Investment Trust), including the portfolio of investments, as of December 31, 2019, the related statement of operations for the year then ended, the statements of changes in net assets for each of the two years in the period then ended, the financial highlights for each of the five years in the period then ended, and the related notes. In our opinion, the financial statements and financial highlights present fairly, in all material respects, the financial position of the Fund as of December 31, 2019, and the results of its operations for the year then ended, the changes in its net assets for each of the two years in the period then ended, and the financial highlights for each of the five years in the period then ended, in conformity with accounting principles generally accepted in the United States of America.
Basis for Opinion
These financial statements and financial highlights are the responsibility of the Fund’s management. Our responsibility is to express an opinion on the Fund’s financial statements and financial highlights based on our audits. We are a public accounting firm registered with the Public Company Accounting Oversight Board (United States) (PCAOB) and are required to be independent with respect to the Fund in accordance with the U.S. federal securities laws and the applicable rules and regulations of the Securities and Exchange Commission and the PCAOB.
We conducted our audits in accordance with the standards of the PCAOB. Those standards require that we plan and perform the audit to obtain reasonable assurance about whether the financial statements and financial highlights are free of material misstatement, whether due to error or fraud. The Fund is not required to have, nor were we engaged to perform, an audit of its internal control over financial reporting. As part of our audits we are required to obtain an understanding of internal control over financial reporting but not for the purpose of expressing an opinion on the effectiveness of the Fund’s internal control over financial reporting. Accordingly, we express no such opinion.
Our audits included performing procedures to assess the risks of material misstatement of the financial statements and financial highlights, whether due to error or fraud, and performing procedures that respond to those risks. Such procedures included examining, on a test basis, evidence regarding the amounts and disclosures in the financial statements and financial highlights. Our audits also included evaluating the accounting principles used and significant estimates made by management, as well as evaluating the overall presentation of the financial statements and financial highlights. Our procedures included confirmation of securities owned as of December 31, 2019, by correspondence with the custodian and brokers; when replies were not received from brokers, we performed other auditing procedures. We believe that our audits provide a reasonable basis for our opinion.
/s/ Deloitte & Touche LLP
Boston, Massachusetts
February 21, 2020
We have served as the auditor of one or more Eaton Vance investment companies since 1959.
| 23 |
Eaton Vance
Growth Fund
December 31, 2019
Federal Tax Information (Unaudited)
The Form1099-DIV you received in February 2020 showed the tax status of all distributions paid to your account in calendar year 2019. Shareholders are advised to consult their own tax adviser with respect to the tax consequences of their investment in the Fund. As required by the Internal Revenue Code and/or regulations, shareholders must be notified regarding the status of capital gains dividends.
Capital Gains Dividends. The Fund hereby designates as a capital gain dividend with respect to the taxable year ended December 31, 2019, $36,112,201 or, if subsequently determined to be different, the net capital gain of such year.
| 24 |
Eaton Vance
Growth Fund
December 31, 2019
Management and Organization
Fund Management. The Trustees of Eaton Vance Special Investment Trust (the Trust) are responsible for the overall management and supervision of the Trust’s affairs. The Trustees and officers of the Trust are listed below. Except as indicated, each individual has held the office shown or other offices in the same company for the last five years. Trustees and officers of the Trust hold indefinite terms of office. The “noninterested Trustees” consist of those Trustees who are not “interested persons” of the Trust, as that term is defined under the 1940 Act. The business address of each Trustee and officer is Two International Place, Boston, Massachusetts 02110. As used below, “EVC” refers to Eaton Vance Corp., “EV” refers to Eaton Vance, Inc., “EVM” refers to Eaton Vance Management, “BMR” refers to Boston Management and Research and “EVD” refers to Eaton Vance Distributors, Inc. EVC and EV are the corporate parent and trustee, respectively, of EVM and BMR. EVD is the Fund’s principal underwriter and a wholly-owned subsidiary of EVC. Each officer affiliated with Eaton Vance may hold a position with other Eaton Vance affiliates that is comparable to his or her position with EVM listed below. Each Trustee oversees 159 portfolios in the Eaton Vance Complex (including all master and feeder funds in a master feeder structure). Each officer serves as an officer of certain other Eaton Vance funds. Each Trustee and officer serves until his or her successor is elected.
| Name and Year of Birth | Position(s) with the | Trustee Since(1) | Principal Occupation(s) and Directorships During Past Five Years and Other Relevant Experience | |||
| Interested Trustee | ||||||
Thomas E. Faust Jr. 1958 | Trustee | 2007 | Chairman, Chief Executive Officer and President of EVC, Director and President of EV, Chief Executive Officer and President of EVM and BMR, and Director of EVD. Trustee and/or officer of 159 registered investment companies. Mr. Faust is an interested person because of his positions with EVM, BMR, EVD, EVC and EV, which are affiliates of the Trust. Directorships in the Last Five Years.Director of EVC and Hexavest Inc. (investment management firm). | |||
| Noninterested Trustees | ||||||
Mark R. Fetting 1954 | Trustee | 2016 | Private investor. Formerly held various positions at Legg Mason, Inc. (investment management firm) (2000-2012), including President, Chief Executive Officer, Director and Chairman (2008-2012), Senior Executive Vice President (2004-2008) and Executive Vice President (2001-2004). Formerly, President of Legg Mason family of funds (2001-2008). Formerly, Division President and Senior Officer of Prudential Financial Group, Inc. and related companies (investment management firm)(1991-2000). Other Directorships in the Last Five Years. None. | |||
Cynthia E. Frost 1961 | Trustee | 2014 | Private investor. Formerly, Chief Investment Officer of Brown University (university endowment) (2000-2012). Formerly, Portfolio Strategist for Duke Management Company (university endowment manager) (1995-2000). Formerly, Managing Director, Cambridge Associates (investment consulting company) (1989-1995). Formerly, Consultant, Bain and Company (management consulting firm) (1987-1989). Formerly, Senior Equity Analyst, BA Investment Management Company (1983-1985). Other Directorships in the Last Five Years.None. | |||
George J. Gorman 1952 | Trustee | 2014 | Principal at George J. Gorman LLC (consulting firm). Formerly, Senior Partner at Ernst & Young LLP (a registered public accounting firm) (1974-2009). Other Directorships in the Last Five Years.Formerly, Trustee of the BofA Funds Series Trust (11 funds) (2011-2014) and of the Ashmore Funds (9 funds) (2010-2014). | |||
Valerie A. Mosley 1960 | Trustee | 2014 | Chairwoman and Chief Executive Officer of Valmo Ventures (a consulting and investment firm). Former Partner and Senior Vice President, Portfolio Manager and Investment Strategist at Wellington Management Company, LLP (investment management firm) (1992-2012). Former Chief Investment Officer, PG Corbin Asset Management (1990-1992). Formerly worked in institutional corporate bond sales at Kidder Peabody (1986-1990). Other Directorships in the Last Five Years.Director of Envestnet, Inc. (provider of intelligent systems for wealth management and financial wellness) (since 2018). Director of Dynex Capital, Inc. (mortgage REIT) (since 2013). | |||
William H. Park 1947 | Chairperson of the Board and Trustee | 2016 (Chairperson) 2003 (Trustee) | Private investor. Formerly, Consultant (management and transactional) (2012-2014). Formerly, Chief Financial Officer, Aveon Group L.P. (investment management firm) (2010-2011). Formerly, Vice Chairman, Commercial Industrial Finance Corp. (specialty finance company) (2006-2010). Formerly, President and Chief Executive Officer, Prizm Capital Management, LLC (investment management firm) (2002-2005). Formerly, Executive Vice President and Chief Financial Officer, United Asset Management Corporation (investment management firm) (1982-2001). Formerly, Senior Manager, Price Waterhouse (now PricewaterhouseCoopers) (a registered public accounting firm) (1972-1981). Other Directorships in the Last Five Years.None. | |||
| 25 |
Eaton Vance
Growth Fund
December 31, 2019
Management and Organization — continued
| Name and Year of Birth | Position(s) with the | Trustee Since(1) | Principal Occupation(s) and Directorships During Past Five Years and Other Relevant Experience | |||
| Noninterested Trustees (continued) | ||||||
Helen Frame Peters 1948 | Trustee | 2008 | Professor of Finance, Carroll School of Management, Boston College. Formerly, Dean, Carroll School of Management, Boston College (2000-2002). Formerly, Chief Investment Officer, Fixed Income, Scudder Kemper Investments (investment management firm) (1998-1999). Formerly, Chief Investment Officer, Equity and Fixed Income, Colonial Management Associates (investment management firm) (1991-1998). Other Directorships in the Last Five Years. None. | |||
Keith Quinton 1958 | Trustee | 2018 | Independent Investment Committee Member at New Hampshire Retirement System (since 2017). Advisory Committee member at Northfield Information Services, Inc. (risk management analytics provider) (since 2016). Formerly, Portfolio Manager and Senior Quantitative Analyst at Fidelity Investments (investment management firm)(2001-2014). Other Directorships in the Last Five Years. Director of New Hampshire Municipal Bond Bank (since 2016). | |||
Marcus L. Smith 1966 | Trustee | 2018 | Member of Posse Boston Advisory Board (foundation) (since 2015). Trustee at University of Mount Union (since 2008). Formerly, Portfolio Manager at MFS Investment Management (investment management firm) (1994-2017). Other Directorships in the Last Five Years. Director of MSCI Inc. (global provider of investment decision support tools) (since 2017). Formerly, Director of DCT Industrial Trust Inc. (logistics real estate company) (2017-2018). | |||
Susan J. Sutherland 1957 | Trustee | 2015 | Private investor. Formerly, Associate, Counsel and Partner at Skadden, Arps, Slate, Meagher & Flom LLP (law firm) (1982-2013). Other Directorships in the Last Five Years. Formerly, Director of Montpelier Re Holdings Ltd. (global provider of customized insurance and reinsurance products) (2013-2015). | |||
Scott E. Wennerholm 1959 | Trustee | 2016 | Formerly, Trustee at Wheelock College (postsecondary institution) (2012-2018). Formerly, Consultant at GF Parish Group (executive recruiting firm) (2016-2017). Formerly, Chief Operating Officer and Executive Vice President at BNY Mellon Asset Management (investment management firm) (2005-2011). Formerly, Chief Operating Officer and Chief Financial Officer at Natixis Global Asset Management (investment management firm) (1997-2004). Formerly, Vice President at Fidelity Investments Institutional Services (investment management firm) (1994-1997). Other Directorships in the Last Five Years. None. | |||
| Name and Year of Birth | Position(s) with the Trust | Officer Since(2) | Principal Occupation(s) During Past Five Years | |||
| Principal Officers who are not Trustees | ||||||
Payson F. Swaffield 1956 | President of the Trust | 2003 | Vice President and Chief Income Investment Officer of EVM and BMR. Also Vice President of Calvert Research and Management (“CRM”). | |||
Maureen A. Gemma 1960 | Vice President, Secretary and Chief Legal Officer | 2005 | Vice President of EVM and BMR. Also Vice President of CRM. | |||
James F. Kirchner 1967 | Treasurer | 2007 | Vice President of EVM and BMR. Also Vice President of CRM. | |||
Richard F. Froio 1968 | Chief Compliance Officer | 2017 | Vice President of EVM and BMR since 2017. Formerly Deputy Chief Compliance Officer (Adviser/Funds) and Chief Compliance Officer (Distribution) at PIMCO (2012-2017) and Managing Director at BlackRock/Barclays Global Investors (2009-2012). | |||
| (1) | Year first appointed to serve as Trustee for a fund in the Eaton Vance family of funds. Each Trustee has served continuously since appointment unless indicated otherwise. |
| (2) | Year first elected to serve as officer of a fund in the Eaton Vance family of funds when the officer has served continuously. Otherwise, year of most recent election as an officer of a fund in the Eaton Vance family of funds. Titles may have changed since initial election. |
The SAI for the Fund includes additional information about the Trustees and officers of the Fund and can be obtained without charge on Eaton Vance’s website at www.eatonvance.com or by calling1-800-262-1122.
| 26 |
Eaton Vance Funds
IMPORTANT NOTICES
Privacy. The Eaton Vance organization is committed to ensuring your financial privacy. Each entity listed below has adopted a privacy policy and procedures (“Privacy Program”) Eaton Vance believes is reasonably designed to protect your personal information and to govern when and with whom Eaton Vance may share your personal information.
| • | At the time of opening an account, Eaton Vance generally requires you to provide us with certain information such as name, address, social security number, tax status, account numbers, and account balances. This information is necessary for us to both open an account for you and to allow us to satisfy legal requirements such as applicable anti-money laundering reviews and know-your-customer requirements. |
| • | On an ongoing basis, in the normal course of servicing your account, Eaton Vance may share your information with unaffiliated third parties that perform various services for Eaton Vance and/or your account. These third parties include transfer agents, custodians, broker/dealers and our professional advisers, including auditors, accountants, and legal counsel. Eaton Vance may additionally share your personal information with our affiliates. |
| • | We believe our Privacy Program is reasonably designed to protect the confidentiality of your personal information and to prevent unauthorized access to that information. |
| • | We reserve the right to change our Privacy Program at any time upon proper notification to you. You may want to review our Privacy Program periodically for changes by accessing the link on our homepage: www.eatonvance.com. |
Our pledge of protecting your personal information applies to the following entities within the Eaton Vance organization: the Eaton Vance Family of Funds, Eaton Vance Management, Eaton Vance Investment Counsel, Eaton Vance Distributors, Inc., Eaton Vance Trust Company, Eaton Vance Management (International) Limited, Eaton Vance Advisers International Limited, Eaton Vance Global Advisors Limited, Eaton Vance Management’s Real Estate Investment Group, Boston Management and Research, Calvert Research and Management, and Calvert Funds. This Privacy Notice supersedes all previously issued privacy disclosures. For more information about our Privacy Program or about how your personal information may be used, please call1-800-262-1122.
Delivery of Shareholder Documents. The Securities and Exchange Commission (SEC) permits funds to deliver only one copy of shareholder documents, including prospectuses, proxy statements and shareholder reports, to fund investors with multiple accounts at the same residential or post office box address. This practice is often called “householding” and it helps eliminate duplicate mailings to shareholders.Eaton Vance, or your financial intermediary, may household the mailing of your documents indefinitely unless you instruct Eaton Vance, or your financial intermediary, otherwise.If you would prefer that your Eaton Vance documents not be householded, please contact Eaton Vance at1-800-262-1122, or contact your financial intermediary. Your instructions that householding not apply to delivery of your Eaton Vance documents will typically be effective within 30 days of receipt by Eaton Vance or your financial intermediary.
Portfolio Holdings. Each Eaton Vance Fund and its underlying Portfolio(s) (if applicable) files a schedule of portfolio holdings on Part F toForm N-PORT with the SEC for the first and third quarters of each fiscal year. The FormN-PORT will be available on the Eaton Vance website at www.eatonvance.com, by calling Eaton Vance at1-800-262-1122 or in the EDGAR database on the SEC’s website at www.sec.gov.
Proxy Voting. From time to time, funds are required to vote proxies related to the securities held by the funds. The Eaton Vance Funds or their underlying Portfolios (if applicable) vote proxies according to a set of policies and procedures approved by the Funds’ and Portfolios’ Boards. You may obtain a description of these policies and procedures and information on how the Funds or Portfolios voted proxies relating to portfolio securities during the most recent12-month period ended June 30, without charge, upon request, by calling1-800-262-1122 and by accessing the SEC’s website at www.sec.gov.
| 27 |
This Page Intentionally Left Blank
Investment Adviser
Boston Management and Research
Two International Place
Boston, MA 02110
Administrator
Eaton Vance Management
Two International Place
Boston, MA 02110
Principal Underwriter*
Eaton Vance Distributors, Inc.
Two International Place
Boston, MA 02110
(617)482-8260
Custodian
State Street Bank and Trust Company
State Street Financial Center, One Lincoln Street
Boston, MA 02111
Transfer Agent
BNY Mellon Investment Servicing (US) Inc.
Attn: Eaton Vance Funds
P.O. Box 9653
Providence, RI 02940-9653
(800)262-1122
Independent Registered Public Accounting Firm
Deloitte & Touche LLP
200 Berkeley Street
Boston, MA 02116-5022
Fund Offices
Two International Place
Boston, MA 02110
| * | FINRA BrokerCheck. Investors may check the background of their Investment Professional by contacting the Financial Industry Regulatory Authority (FINRA). FINRA BrokerCheck is a free tool to help investors check the professional background of current and former FINRA-registered securities firms and brokers. FINRA BrokerCheck is available by calling1-800-289-9999 and at www.FINRA.org. The FINRA BrokerCheck brochure describing this program is available to investors at www.FINRA.org. |

1559 12.31.19

Eaton Vance
Large-Cap Value Fund
Annual Report
December 31, 2019
Important Note. Beginning on January 1, 2021, as permitted by regulations adopted by the Securities and Exchange Commission, paper copies of the Fund’s annual and semi-annual shareholder reports will no longer be sent by mail unless you specifically request paper copies of the reports. Instead, the reports will be made available on the Fund’s website (eatonvance.com/funddocuments), and you will be notified by mail each time a report is posted and provided with a website address to access the report.
If you already elected to receive shareholder reports electronically, you will not be affected by this change and you need not take any action. If you are a direct investor, you may elect to receive shareholder reports and other communications from the Fund electronically by signing up fore-Delivery at eatonvance.com/edelivery. If you own your shares through a financial intermediary (such as a broker-dealer or bank), you must contact your financial intermediary to sign up.
You may elect to receive all future Fund shareholder reports in paper free of charge. If you are a direct investor, you can inform the Fund that you wish to continue receiving paper copies of your shareholder reports by calling1-800-262-1122. If you own these shares through a financial intermediary, you must contact your financial intermediary or follow instructions included with this disclosure, if applicable, to elect to continue to receive paper copies of your shareholder reports. Your election to receive reports in paper will apply to all Eaton Vance funds held directly or to all funds held through your financial intermediary, as applicable.

Commodity Futures Trading Commission Registration. Effective December 31, 2012, the Commodity Futures Trading Commission (“CFTC”) adopted certain regulatory changes that subject registered investment companies and advisers to regulation by the CFTC if a fund invests more than a prescribed level of its assets in certain CFTC-regulated instruments (including futures, certain options and swap agreements) or markets itself as providing investment exposure to such instruments. The Fund has claimed an exclusion from the definition of the term “commodity pool operator” under the Commodity Exchange Act. Accordingly, neither the Fund nor the adviser with respect to the operation of the Fund is subject to CFTC regulation. Because of its management of other strategies, the Fund’s adviser is registered with the CFTC as a commodity pool operator and a commodity trading advisor.
Fund shares are not insured by the FDIC and are not deposits or other obligations of, or guaranteed by, any depository institution. Shares are subject to investment risks, including possible loss of principal invested.
This report must be preceded or accompanied by a current summary prospectus or prospectus. Before investing, investors should consider carefully the investment objective, risks, and charges and expenses of a mutual fund. This and other important information is contained in the summary prospectus and prospectus, which can be obtained from a financial intermediary. Prospective investors should read the prospectus carefully before investing. For further information, please call1-800-262-1122.
Annual ReportDecember 31, 2019
Eaton Vance
Large-Cap Value Fund
Table of Contents
Management’s Discussion of Fund Performance | 2 | |||
Performance | 3 | |||
Fund Profile | 4 | |||
Endnotes and Additional Disclosures | 5 | |||
Fund Expenses | 6 | |||
Financial Statements | 7 | |||
Report of Independent Registered Public Accounting Firm | 25 | |||
Federal Tax Information | 26 | |||
Management and Organization | 27 | |||
Important Notices | 30 | |||
Eaton Vance
Large-Cap Value Fund
December 31, 2019
Management’s Discussion of Fund Performance1
Economic and Market Conditions
With virtually every U.S. equity index posting strong double-digit returns for the12-month period ended December 31, 2019 — and bond markets solidly in the black as well — 2019 was a good year for investments.
As the new year dawned in January 2019, investors appeared to be taking a “glass is half full” approach. Although U.S. manufacturing output and business investment remained weak — held back by slowing global growth and anon-again/off-again U.S.-China trade war — strong spending by U.S. consumers and dovish remarks by the U.S. Federal Reserve (the Fed) combined to lift investor sentiment. After four federal funds rate hikes the previous year, markets began to project the Fed might actually lower rates in 2019 to stimulate the economy. U.S. unemployment, meanwhile, remained low and hiring remained strong.
As a result, U.S. stocks across multiple markets climbed from January through April 2019. Overseas, central banks around the world began to cut interest rates and employ other tools to stimulate their respective economies. Even a global stock pullback in May — sparked by heightened concerns about the U.S.-China trade spat — proved to be temporary, and the U.S. and global stock rallies resumed in June and July.
After holding interest rates steady through the first half of the year, the Fed cut the federal funds rate on July 31, 2019 — its first reduction in over a decade — followed by two additional rate cuts in September and October to end the period at1.50%-1.75%. By end of the third quarter, 60 central banks around the world had lowered their interest rates as well.
After falling in August, U.S. equities rallied again during the final months of the period, spurred by optimism about a U.S.-China trade détente and better-than-expected U.S. employment reports. The year ended with two events in December that did much to allay investor concerns about international trade and tariffs: passage of the United States-Mexico-Canada Agreement by the U.S. House of Representatives and the Trump administration’s agreement to aso-called “phase–one” trade deal with China.
During the12-month period ended December 31, 2019, the blue-chip Dow Jones Industrial Average®2 returned 25.34%, while the broader U.S. equity market, as measured by the S&P 500® Index, returned 31.49%. The technology-laden Nasdaq Composite Index returned 36.69% during the period.Large-cap U.S. stocks, as measured by the S&P 500® Index, generally outperformed theirsmall-cap counterparts, as measured by the Russell 2000® Index. As a group, growth stocks outpaced value stocks in both large- andsmall-cap categories, as measured by the Russell growth and value indexes.
Fund Performance
For the12-month period ended December 31, 2019, Eaton VanceLarge-Cap Value Fund (the Fund) returned 29.79% for Class A shares at net asset value (NAV), outperforming its benchmark, the Russell 1000® Value Index (the Index), which returned 26.54%.
Stock selection in the financials, utilities, and consumer staples sectors contributed to Fund performance versus the Index. Underweighting Warren Buffet’s multinational conglomerate Berkshire Hathaway, Inc., relative to the Index, aided performance versus the Index in financials. While the stock delivered positive performance, it underperformed the broader equity market due to difficulties in its packaged-food holdings, including Kraft Heinz Co., challenges in its insurance businesses, and a weakening environment for its railroad holding, BNSF Railway Co. Elsewhere in financials, the Fund’s overweight positions in select bank stocks — PNC Financial Services Group, Inc. and Bank of America Corp. — helped relative results. After a difficult year in 2018, the banking industry performed generally well in 2019, as recession fears abated and interest rates appeared to stop falling in the final quarter of the year.
In the utilities sector, an overweight position in NextEra Energy, Inc. (NextEra) helped Fund returns relative to the Index. Aided by a focus on renewable energy sources, including wind and solar, NextEra reported steady revenue streams and profit growth during the period. An overweight holding in household and personal care products firm Procter & Gamble Co. aided relative performance in consumer staples. After several years of little to no growth in earnings per share, the company grew earnings in 2019 after bringing in a new CEO, driving down costs, and improving its product portfolio.
In contrast, communication services was the only sector to detract from performance versus the Index during the period, due to stock selection within the sector. Not owning telecom services provider and Index component AT&T, Inc. detracted from relative performance in the sector after an activist investor became involved with the company and its stock price appreciated outpacing its sector peers. Also in communication services, the Fund’s overweight position in broadband and cellular service provider Verizon Communications, Inc. hurt relative results, despite posting a double-digit price gain. The stock underperformed the broader market, held back by stiff pricing competition for wireless services and a slow launch of its much-anticipated 5G rollout.
Significant detractors from relative performance in other sectors included overweight positions in chemical firm DuPont de Nemours, Inc. (DuPont) in the materials sector and luxury fashion firm Tapestry, Inc. (Tapestry) — parent company of Coach, Kate Spade and Stuart Weitzman — in the consumer discretionary sector. Tapestry’s stock price declined as its Kate Spade brand underperformed investor expectations and management offered little visibility into how it planned to improve results. Byperiod-end, the stock was sold from the Fund. Shares of Dupont declined in the second half of 2019 amid uncertainty around trade tensions and headwinds in key end markets, including automobiles and electronics.
See Endnotes and Additional Disclosures in this report.
Past performance is no guarantee of future results. Returns are historical and are calculated by determining the percentage change in net asset value (NAV) or offering price (as applicable) with all distributions reinvested. Investment return and principal value will fluctuate so that shares, when redeemed, may be worth more or less than their original cost. Performance for periods less than or equal to one year is cumulative. Performance is for the stated time period only; due to market volatility, current Fund performance may be lower or higher than the quoted return. For performance as of the most recentmonth-end, please refer to eatonvance.com.
| 2 |
Eaton Vance
Large-Cap Value Fund
December 31, 2019
Performance2,3
Portfolio ManagersEdward J. Perkin, CFA, Aaron S. Dunn, CFA and Bradley T. Galko, CFA
| % Average Annual Total Returns | Class Inception Date | Performance Inception Date | One Year | Five Years | Ten Years | |||||||||||||||
Class A at NAV | 09/23/1931 | 09/23/1931 | 29.79 | % | 8.51 | % | 10.14 | % | ||||||||||||
Class A with 5.75% Maximum Sales Charge | — | — | 22.30 | 7.24 | 9.49 | |||||||||||||||
Class C at NAV | 11/04/1994 | 09/23/1931 | 28.82 | 7.70 | 9.32 | |||||||||||||||
Class C with 1% Maximum Sales Charge | — | — | 27.82 | 7.70 | 9.32 | |||||||||||||||
Class I at NAV | 12/28/2004 | 09/23/1931 | 30.11 | 8.78 | 10.42 | |||||||||||||||
Class R at NAV | 02/18/2004 | 09/23/1931 | 29.48 | 8.24 | 9.86 | |||||||||||||||
Class R6 at NAV | 07/01/2014 | 09/23/1931 | 30.17 | 8.86 | 10.46 | |||||||||||||||
Russell 1000® Value Index | — | — | 26.54 | % | 8.28 | % | 11.79 | % | ||||||||||||
| % Total Annual Operating Expense Ratios4 | Class A | Class C | Class I | Class R | Class R6 | |||||||||||||||
| 1.06 | % | 1.81 | % | 0.81 | % | 1.31 | % | 0.72 | % | |||||||||||
Growth of $10,000
This graph shows the change in value of a hypothetical investment of $10,000 in Class A of the Fund for the period indicated. For comparison, the same investment is shown in the indicated index.
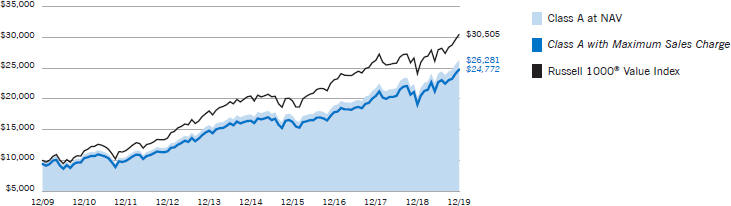
| Growth of Investment3 | Amount Invested | Period Beginning | At NAV | With Maximum Sales Charge | ||||||||||||
Class C | $ | 10,000 | 12/31/2009 | $ | 24,381 | N.A. | ||||||||||
Class I | $ | 250,000 | 12/31/2009 | $ | 673,745 | N.A. | ||||||||||
Class R | $ | 10,000 | 12/31/2009 | $ | 25,624 | N.A. | ||||||||||
Class R6 | $ | 1,000,000 | 12/31/2009 | $ | 2,706,651 | N.A. | ||||||||||
See Endnotes and Additional Disclosures in this report.
Past performance is no guarantee of future results. Returns are historical and are calculated by determining the percentage change in net asset value (NAV) or offering price (as applicable) with all distributions reinvested. Investment return and principal value will fluctuate so that shares, when redeemed, may be worth more or less than their original cost. Performance for periods less than or equal to one year is cumulative. Performance is for the stated time period only; due to market volatility, current Fund performance may be lower or higher than the quoted return. For performance as of the most recentmonth-end, please refer to eatonvance.com.
| 3 |
Eaton Vance
Large-Cap Value Fund
December 31, 2019
Fund Profile
Sector Allocation (% of net assets)5
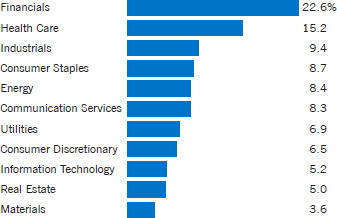
Top 10 Holdings (% of net assets)5
Verizon Communications, Inc. | 4.2 | % | ||
Berkshire Hathaway, Inc., Class B | 3.9 | |||
Bank of America Corp. | 3.4 | |||
Walt Disney Co. (The) | 3.3 | |||
Procter & Gamble Co. (The) | 2.7 | |||
Exxon Mobil Corp. | 2.7 | |||
NextEra Energy, Inc. | 2.4 | |||
PNC Financial Services Group, Inc. (The) | 2.4 | |||
Mondelez International, Inc., Class A | 2.2 | |||
Johnson & Johnson | 2.2 | |||
Total | 29.4 | % | ||
See Endnotes and Additional Disclosures in this report.
| 4 |
Eaton Vance
Large-Cap Value Fund
December 31, 2019
Endnotes and Additional Disclosures
| 1 | The views expressed in this report are those of the portfolio manager(s) and are current only through the date stated at the top of this page. These views are subject to change at any time based upon market or other conditions, and Eaton Vance and the Fund(s) disclaim any responsibility to update such views. These views may not be relied upon as investment advice and, because investment decisions are based on many factors, may not be relied upon as an indication of trading intent on behalf of any Eaton Vance fund. This commentary may contain statements that are not historical facts, referred to as “forward looking statements.” The Fund’s actual future results may differ significantly from those stated in any forward looking statement, depending on factors such as changes in securities or financial markets or general economic conditions, the volume of sales and purchases of Fund shares, the continuation of investment advisory, administrative and service contracts, and other risks discussed from time to time in the Fund’s filings with the Securities and Exchange Commission. |
| 2 | Dow Jones Industrial Average® is a price-weighted average of 30 blue-chip stocks that are generally the leaders in their industry. S&P 500® Index is an unmanaged index oflarge-cap stocks commonly used as a measure of U.S. stock market performance. S&P Dow Jones Indices are a product of S&P Dow Jones Indices LLC (“S&P DJI”) and have been licensed for use. S&P® and S&P 500® are registered trademarks of S&P DJI; Dow Jones® is a registered trademark of Dow Jones Trademark Holdings LLC (“Dow Jones”); S&P DJI, Dow Jones and their respective affiliates do not sponsor, endorse, sell or promote the Fund, will not have any liability with respect thereto and do not have any liability for any errors, omissions, or interruptions of the S&P Dow Jones Indices. Nasdaq Composite Index is a market capitalization-weighted index of all domestic and international securities listed on Nasdaq. Source: Nasdaq, Inc. The information is provided by Nasdaq (with its affiliates, are referred to as the “Corporations”) and Nasdaq’s third party licensors on an “as is” basis and the Corporations make no guarantees and bear no liability of any kind with respect to the information or the Fund. Russell 2000® Index is an unmanaged index of 2,000 U.S.small-cap stocks. Russell 1000® Value Index is an unmanaged index of U.S.large-cap value stocks. Unless otherwise stated, index returns do not reflect the effect of any applicable sales charges, commissions, expenses, taxes or leverage, as applicable. It is not possible to invest directly in an index. |
| 3 | Total Returns at NAV do not include applicable sales charges. If sales charges were deducted, the returns would be lower. Total Returns shown with maximum sales charge reflect the stated maximum sales charge. Unless otherwise stated, performance does not reflect the deduction of taxes on Fund distributions or redemptions of Fund shares. |
Performance prior to the inception date of a class may be linked to the performance of an older class of the Fund. This linked performance is adjusted for any applicable sales charge, but is not adjusted for class expense differences. If adjusted for such differences, the performance would be different. The performance of Class R6 is linked to Class I. Performance presented in the Financial Highlights included in the financial statements is not linked. |
| 4 | Source: Fund prospectus. The expense ratios for the current reporting period can be found in the Financial Highlights section of this report. |
| 5 | Excludes cash and cash equivalents. |
Fund profile subject to change due to active management. |
Important Notice to Shareholders
Effective February 3, 2020, the Fund is managed by Edward J. Perkin, Aaron S. Dunn and Bradley T. Galko. |
| 5 |
Eaton Vance
Large-Cap Value Fund
December 31, 2019
Fund Expenses
Example: As a Fund shareholder, you incur two types of costs: (1) transaction costs, including sales charges (loads) on purchases and redemption fees (if applicable); and (2) ongoing costs, including management fees; distribution and/or service fees; and other Fund expenses. This Example is intended to help you understand your ongoing costs (in dollars) of Fund investing and to compare these costs with the ongoing costs of investing in other mutual funds. The Example is based on an investment of $1,000 invested at the beginning of the period and held for the entire period (July 1, 2019 – December 31, 2019).
Actual Expenses: The first section of the table below provides information about actual account values and actual expenses. You may use the information in this section, together with the amount you invested, to estimate the expenses that you paid over the period. Simply divide your account value by $1,000 (for example, an $8,600 account value divided by $1,000 = 8.6), then multiply the result by the number in the first section under the heading entitled “Expenses Paid During Period” to estimate the expenses you paid on your account during this period.
Hypothetical Example for Comparison Purposes: The second section of the table below provides information about hypothetical account values and hypothetical expenses based on the actual Fund expense ratio and an assumed rate of return of 5% per year (before expenses), which is not the actual Fund return. The hypothetical account values and expenses may not be used to estimate the actual ending account balance or expenses you paid for the period. You may use this information to compare the ongoing costs of investing in your Fund and other funds. To do so, compare this 5% hypothetical example with the 5% hypothetical examples that appear in the shareholder reports of the other funds.
Please note that the expenses shown in the table are meant to highlight your ongoing costs only and do not reflect any transactional costs, such as sales charges (loads) or redemption fees (if applicable). Therefore, the second section of the table is useful in comparing ongoing costs only, and will not help you determine the relative total costs of owning different funds. In addition, if these transactional costs were included, your costs would be higher.
| Beginning Account Value (7/1/19) | Ending Account Value (12/31/19) | Expenses Paid During Period* (7/1/19 – 12/31/19) | Annualized Expense Ratio | |||||||||||||
Actual | ||||||||||||||||
Class A | $ | 1,000.00 | $ | 1,089.00 | $ | 5.48 | 1.04 | % | ||||||||
Class C | $ | 1,000.00 | $ | 1,085.20 | $ | 9.41 | 1.79 | % | ||||||||
Class I | $ | 1,000.00 | $ | 1,090.50 | $ | 4.16 | 0.79 | % | ||||||||
Class R | $ | 1,000.00 | $ | 1,087.80 | $ | 6.79 | 1.29 | % | ||||||||
Class R6 | $ | 1,000.00 | $ | 1,090.80 | $ | 3.79 | 0.72 | % | ||||||||
Hypothetical | ||||||||||||||||
(5% return per year before expenses) | ||||||||||||||||
Class A | $ | 1,000.00 | $ | 1,020.00 | $ | 5.30 | 1.04 | % | ||||||||
Class C | $ | 1,000.00 | $ | 1,016.20 | $ | 9.10 | 1.79 | % | ||||||||
Class I | $ | 1,000.00 | $ | 1,021.20 | $ | 4.02 | 0.79 | % | ||||||||
Class R | $ | 1,000.00 | $ | 1,018.70 | $ | 6.56 | 1.29 | % | ||||||||
Class R6 | $ | 1,000.00 | $ | 1,021.60 | $ | 3.67 | 0.72 | % | ||||||||
| * | Expenses are equal to the Fund’s annualized expense ratio for the indicated Class, multiplied by the average account value over the period, multiplied by 184/365 (to reflect theone-half year period). The Example assumes that the $1,000 was invested at the net asset value per share determined at the close of business on June 30, 2019. |
| 6 |
Eaton Vance
Large-Cap Value Fund
December 31, 2019
Portfolio of Investments
| Common Stocks — 99.8% |
| |||||||
| Security | Shares | Value | ||||||
| Aerospace & Defense— 3.3% | ||||||||
Boeing Co. (The) | 26,419 | $ | 8,606,254 | |||||
Hexcel Corp. | 223,513 | 16,385,738 | ||||||
Huntington Ingalls Industries, Inc. | 74,307 | 18,642,140 | ||||||
Textron, Inc. | 308,747 | 13,770,116 | ||||||
| $ | 57,404,248 | |||||||
| Banks— 8.7% | ||||||||
Bank of America Corp. | 1,652,445 | $ | 58,199,113 | |||||
KeyCorp | 963,444 | 19,500,107 | ||||||
PNC Financial Services Group, Inc. (The) | 258,945 | 41,335,390 | ||||||
Sterling Bancorp | 555,618 | 11,712,427 | ||||||
U.S. Bancorp | 309,079 | 18,325,294 | ||||||
| $ | 149,072,331 | |||||||
| Beverages— 2.7% | ||||||||
Constellation Brands, Inc., Class A | 113,187 | $ | 21,477,233 | |||||
PepsiCo, Inc. | 183,356 | 25,059,265 | ||||||
| $ | 46,536,498 | |||||||
| Biotechnology— 1.2% | ||||||||
Gilead Sciences, Inc. | 330,932 | $ | 21,503,961 | |||||
| $ | 21,503,961 | |||||||
| Building Products— 0.6% | ||||||||
A.O. Smith Corp. | 232,045 | $ | 11,054,624 | |||||
| $ | 11,054,624 | |||||||
| Capital Markets— 4.5% | ||||||||
Goldman Sachs Group, Inc. (The) | 127,457 | $ | 29,306,188 | |||||
Northern Trust Corp. | 178,031 | 18,914,014 | ||||||
Raymond James Financial, Inc. | 319,266 | 28,561,536 | ||||||
| $ | 76,781,738 | |||||||
| Chemicals— 1.2% | ||||||||
DuPont de Nemours, Inc. | 314,924 | $ | 20,218,121 | |||||
| $ | 20,218,121 | |||||||
| Communications Equipment— 0.5% | ||||||||
Cisco Systems, Inc. | 194,054 | $ | 9,306,830 | |||||
| $ | 9,306,830 | |||||||
| Security | Shares | Value | ||||||
| Consumer Finance— 1.2% | ||||||||
American Express Co. | 159,935 | $ | 19,910,308 | |||||
| $ | 19,910,308 | |||||||
| Containers & Packaging— 1.0% | ||||||||
Packaging Corp. of America | 148,822 | $ | 16,666,576 | |||||
| $ | 16,666,576 | |||||||
| Diversified Financial Services— 3.9% | ||||||||
Berkshire Hathaway, Inc., Class B(1) | 294,197 | $ | 66,635,620 | |||||
| $ | 66,635,620 | |||||||
| Diversified Telecommunication Services— 4.2% | ||||||||
Verizon Communications, Inc. | 1,188,064 | $ | 72,947,130 | |||||
| $ | 72,947,130 | |||||||
| Electric Utilities— 4.4% | ||||||||
Edison International | 440,373 | $ | 33,208,528 | |||||
NextEra Energy, Inc. | 172,772 | 41,838,467 | ||||||
| $ | 75,046,995 | |||||||
| Electrical Equipment— 1.6% | ||||||||
Eaton Corp. PLC | 290,865 | $ | 27,550,733 | |||||
| $ | 27,550,733 | |||||||
| Energy Equipment & Services— 1.0% | ||||||||
Schlumberger, Ltd. | 419,103 | $ | 16,847,941 | |||||
| $ | 16,847,941 | |||||||
| Entertainment— 3.3% | ||||||||
Walt Disney Co. (The) | 388,085 | $ | 56,128,734 | |||||
| $ | 56,128,734 | |||||||
| Equity Real Estate Investment Trusts (REITs)— 5.0% | ||||||||
AvalonBay Communities, Inc. | 138,379 | $ | 29,018,076 | |||||
Cousins Properties, Inc. | 436,655 | 17,990,186 | ||||||
CubeSmart | 820,675 | 25,834,849 | ||||||
Mid-America Apartment Communities, Inc. | 98,065 | 12,930,851 | ||||||
| $ | 85,773,962 | |||||||
| Food Products— 2.2% | ||||||||
Mondelez International, Inc., Class A | 694,944 | $ | 38,277,515 | |||||
| $ | 38,277,515 | |||||||
| 7 | See Notes to Financial Statements. |
Eaton Vance
Large-Cap Value Fund
December 31, 2019
Portfolio of Investments — continued
| Security | Shares | Value | ||||||
| Health Care Equipment & Supplies— 4.6% | ||||||||
Abbott Laboratories | 304,691 | $ | 26,465,460 | |||||
Baxter International, Inc. | 260,211 | 21,758,844 | ||||||
Medtronic PLC | 276,316 | 31,348,050 | ||||||
| $ | 79,572,354 | |||||||
| Health Care Providers & Services— 1.0% | ||||||||
Anthem, Inc. | 57,640 | $ | 17,409,009 | |||||
| $ | 17,409,009 | |||||||
| Hotels, Restaurants & Leisure— 0.8% | ||||||||
Marriott International, Inc., Class A | 95,368 | $ | 14,441,576 | |||||
| $ | 14,441,576 | |||||||
| Household Durables— 1.0% | ||||||||
D.R. Horton, Inc. | 322,730 | $ | 17,024,007 | |||||
| $ | 17,024,007 | |||||||
| Household Products— 2.7% | ||||||||
Procter & Gamble Co. (The) | 378,097 | $ | 47,224,315 | |||||
| $ | 47,224,315 | |||||||
| Insurance— 4.4% | ||||||||
Allstate Corp. (The) | 201,466 | $ | 22,654,852 | |||||
American International Group, Inc. | 560,099 | 28,749,882 | ||||||
Progressive Corp. (The) | 348,283 | 25,212,206 | ||||||
| $ | 76,616,940 | |||||||
| IT Services— 3.6% | ||||||||
Cognizant Technology Solutions Corp., Class A | 508,586 | $ | 31,542,504 | |||||
Fidelity National Information Services, Inc. | 225,236 | 31,328,075 | ||||||
| $ | 62,870,579 | |||||||
| Machinery— 3.8% | ||||||||
Gardner Denver Holdings, Inc.(1) | 642,532 | $ | 23,568,074 | |||||
Parker-Hannifin Corp. | 101,088 | 20,805,932 | ||||||
Stanley Black & Decker, Inc. | 126,357 | 20,942,409 | ||||||
| $ | 65,316,415 | |||||||
| Media— 0.8% | ||||||||
Fox Corp., Class A | 390,609 | $ | 14,479,876 | |||||
| $ | 14,479,876 | |||||||
| Security | Shares | Value | ||||||
| Metals & Mining— 1.5% | ||||||||
Steel Dynamics, Inc. | 745,192 | $ | 25,366,336 | |||||
| $ | 25,366,336 | |||||||
| Multi-Utilities— 2.6% | ||||||||
CMS Energy Corp. | 368,867 | $ | 23,179,602 | |||||
Sempra Energy | 142,308 | 21,556,816 | ||||||
| $ | 44,736,418 | |||||||
| Oil, Gas & Consumable Fuels— 7.4% | ||||||||
ConocoPhillips | 477,545 | $ | 31,054,751 | |||||
EOG Resources, Inc. | 231,277 | 19,371,762 | ||||||
Exxon Mobil Corp. | 655,898 | 45,768,563 | ||||||
Phillips 66 | 201,454 | 22,443,990 | ||||||
Pioneer Natural Resources Co. | 61,598 | 9,324,089 | ||||||
| $ | 127,963,155 | |||||||
| Pharmaceuticals— 8.3% | ||||||||
Bristol-Myers Squibb Co. | 522,792 | $ | 33,558,018 | |||||
GlaxoSmithKline PLC ADR | 563,516 | 26,479,617 | ||||||
Johnson & Johnson | 257,114 | 37,505,219 | ||||||
Merck & Co., Inc. | 212,550 | 19,331,423 | ||||||
Sanofi | 263,367 | 26,449,271 | ||||||
| $ | 143,323,548 | |||||||
| Semiconductors & Semiconductor Equipment— 1.0% | ||||||||
NXP Semiconductors NV | 67,610 | $ | 8,604,049 | |||||
QUALCOMM, Inc. | 90,480 | 7,983,050 | ||||||
| $ | 16,587,099 | |||||||
| Specialty Retail— 4.2% | ||||||||
Best Buy Co., Inc. | 253,104 | $ | 22,222,531 | |||||
Lowe’s Cos., Inc. | 185,022 | 22,158,235 | ||||||
TJX Cos., Inc. (The) | 301,165 | 18,389,135 | ||||||
Tractor Supply Co. | 98,809 | 9,232,713 | ||||||
| $ | 72,002,614 | |||||||
| Textiles, Apparel & Luxury Goods— 0.5% | ||||||||
Ralph Lauren Corp., Class A | 80,400 | $ | 9,424,488 | |||||
| $ | 9,424,488 | |||||||
| 8 | See Notes to Financial Statements. |
Eaton Vance
Large-Cap Value Fund
December 31, 2019
Portfolio of Investments — continued
| Security | Shares | Value | ||||||
| Tobacco— 1.1% | ||||||||
Altria Group, Inc. | 373,241 | $ | 18,628,458 | |||||
| $ | 18,628,458 | |||||||
Total Common Stocks |
| $ | 1,720,651,052 | |||||
| Short-Term Investments— 0.2% |
| |||||||
| Description | Units | Value | ||||||
Eaton Vance Cash Reserves Fund, LLC, | 2,748,856 | $ | 2,748,856 | |||||
Total Short-Term Investments |
| $ | 2,748,856 | |||||
Total Investments — 100.0% |
| $ | 1,723,399,908 | |||||
Other Assets, Less Liabilities — 0.0%(3) |
| $ | 394,708 | |||||
Net Assets — 100.0% |
| $ | 1,723,794,616 | |||||
The percentage shown for each investment category in the Portfolio of Investments is based on net assets.
| (1) | Non-income producing security. |
| (2) | Affiliated investment company, available to Eaton Vance portfolios and funds, which invests in high quality, U.S. dollar denominated money market instruments. The rate shown is the annualizedseven-day yield as of December 31, 2019. |
| (3) | Amount is less than 0.05%. |
Abbreviations:
| ADR | – | American Depositary Receipt | ||
| 9 | See Notes to Financial Statements. |
Eaton Vance
Large-Cap Value Fund
December 31, 2019
Statement of Assets and Liabilities
| Assets | December 31, 2019 | |||
Unaffiliated investments, at value (identified cost, $1,427,708,075) | $ | 1,720,651,052 | ||
Affiliated investment fund, at value (identified cost, $2,748,651) | 2,748,856 | |||
Dividends receivable | 3,791,814 | |||
Dividends receivable from affiliated investment | 4,218 | |||
Receivable for investments sold | 7,797,649 | |||
Receivable for Fund shares sold | 1,042,342 | |||
Tax reclaims receivable | 1,015,351 | |||
Total assets | $ | 1,737,051,282 | ||
| Liabilities |
| |||
Payable for Fund shares redeemed | $ | 11,347,163 | ||
Payable to affiliates: |
| |||
Investment adviser fee | 911,797 | |||
Distribution and service fees | 223,994 | |||
Trustees’ fees | 21,425 | |||
Accrued expenses | 752,287 | |||
Total liabilities | $ | 13,256,666 | ||
Net Assets | $ | 1,723,794,616 | ||
| Sources of Net Assets |
| |||
Paid-in capital | $ | 1,426,050,009 | ||
Distributable earnings | 297,744,607 | |||
Total | $ | 1,723,794,616 | ||
| 10 | See Notes to Financial Statements. |
Eaton Vance
Large-Cap Value Fund
December 31, 2019
Statement of Assets and Liabilities — continued
| Class A Shares | December 31, 2019 | |||
Net Assets | $ | 711,972,374 | ||
Shares Outstanding | 33,935,725 | |||
Net Asset Value and Redemption Price Per Share |
| |||
(net assets ÷ shares of beneficial interest outstanding) | $ | 20.98 | ||
Maximum Offering Price Per Share |
| |||
(100 ÷ 94.25 of net asset value per share) | $ | 22.26 | ||
| Class C Shares |
| |||
Net Assets | $ | 56,343,805 | ||
Shares Outstanding | 2,676,892 | |||
Net Asset Value and Offering Price Per Share* |
| |||
(net assets ÷ shares of beneficial interest outstanding) | $ | 21.05 | ||
| Class I Shares |
| |||
Net Assets | $ | 819,291,959 | ||
Shares Outstanding | 38,883,738 | |||
Net Asset Value, Offering Price and Redemption Price Per Share |
| |||
(net assets ÷ shares of beneficial interest outstanding) | $ | 21.07 | ||
| Class R Shares |
| |||
Net Assets | $ | 59,472,920 | ||
Shares Outstanding | 2,842,927 | |||
Net Asset Value, Offering Price and Redemption Price Per Share |
| |||
(net assets ÷ shares of beneficial interest outstanding) | $ | 20.92 | ||
| Class R6 Shares |
| |||
Net Assets | $ | 76,713,558 | ||
Shares Outstanding | 3,638,476 | |||
Net Asset Value, Offering Price and Redemption Price Per Share |
| |||
(net assets ÷ shares of beneficial interest outstanding) | $ | 21.08 | ||
On sales of $50,000 or more, the offering price of Class A shares is reduced.
| * | Redemption price per share is equal to the net asset value less any applicable contingent deferred sales charge. |
| 11 | See Notes to Financial Statements. |
Eaton Vance
Large-Cap Value Fund
December 31, 2019
Statement of Operations
| Investment Income | Year Ended December 31, 2019 | |||
Dividends (net of foreign taxes, $65,222) | $ | 39,877,533 | ||
Dividends from affiliated investment | 132,953 | |||
Securities lending income, net | 10,773 | |||
Total investment income | $ | 40,021,259 | ||
| Expenses |
| |||
Investment adviser fee | $ | 10,551,262 | ||
Distribution and service fees |
| |||
Class A | 1,706,342 | |||
Class C | 767,626 | |||
Class R | 311,806 | |||
Trustees’ fees and expenses | 87,928 | |||
Custodian fee | 353,105 | |||
Transfer and dividend disbursing agent fees | 1,425,587 | |||
Legal and accounting services | 94,261 | |||
Printing and postage | 152,409 | |||
Registration fees | 79,009 | |||
ReFlow liquidity program fees | 514,983 | |||
Miscellaneous | 81,263 | |||
Total expenses | $ | 16,125,581 | ||
Net investment income | $ | 23,895,678 | ||
| Realized and Unrealized Gain (Loss) |
| |||
Net realized gain (loss) — |
| |||
Investment transactions | $ | 113,476,678 | (1) | |
Investment transactions — affiliated investment | 2,068 | |||
Foreign currency transactions | (220,395 | ) | ||
Net realized gain | $ | 113,258,351 | ||
Change in unrealized appreciation (depreciation) — |
| |||
Investments | $ | 300,051,802 | ||
Investments — affiliated investment | (158 | ) | ||
Foreign currency | 186,310 | |||
Net change in unrealized appreciation (depreciation) | $ | 300,237,954 | ||
Net realized and unrealized gain | $ | 413,496,305 | ||
Net increase in net assets from operations | $ | 437,391,983 | ||
| (1) | Includes $83,682,794 of net realized gains from redemptionsin-kind. |
| 12 | See Notes to Financial Statements. |
Eaton Vance
Large-Cap Value Fund
December 31, 2019
Statements of Changes in Net Assets
| Year Ended December 31, | ||||||||
| Increase (Decrease) in Net Assets | 2019 | 2018 | ||||||
From operations — | ||||||||
Net investment income | $ | 23,895,678 | $ | 26,674,732 | ||||
Net realized gain | 113,258,351 | (1) | 220,083,081 | (2) | ||||
Net change in unrealized appreciation (depreciation) | 300,237,954 | (356,298,881 | ) | |||||
Net increase (decrease) in net assets from operations | $ | 437,391,983 | $ | (109,541,068 | ) | |||
Distributions to shareholders — |
| |||||||
Class A | $ | (14,362,572 | ) | $ | (57,881,635 | ) | ||
Class C | (642,775 | ) | (16,506,261 | ) | ||||
Class I | (18,425,036 | ) | (77,304,463 | ) | ||||
Class R | (1,096,140 | ) | (6,120,235 | ) | ||||
Class R6 | (1,845,970 | ) | (9,922,733 | ) | ||||
Total distributions to shareholders | $ | (36,372,493 | ) | $ | (167,735,327 | ) | ||
Transactions in shares of beneficial interest — |
| |||||||
Proceeds from sale of shares |
| |||||||
Class A | $ | 51,422,891 | $ | 62,416,237 | ||||
Class C | 3,902,820 | 8,855,103 | ||||||
Class I | 349,749,276 | 530,560,658 | ||||||
Class R | 5,479,685 | 9,564,235 | ||||||
Class R6 | 17,341,875 | 140,837,725 | ||||||
Net asset value of shares issued to shareholders in payment of distributions declared |
| |||||||
Class A | 12,956,260 | 51,912,348 | ||||||
Class C | 496,741 | 14,842,384 | ||||||
Class I | 15,088,154 | 63,075,579 | ||||||
Class R | 1,043,410 | 5,696,271 | ||||||
Class R6 | 1,845,970 | 9,922,733 | ||||||
Cost of shares redeemed |
| |||||||
Class A | (164,929,105 | ) | (209,351,072 | ) | ||||
Class C | (35,204,466 | ) | (66,338,072 | ) | ||||
Class I | (467,430,748 | ) | (762,027,970 | ) | ||||
Class R | (23,017,996 | ) | (30,384,832 | ) | ||||
Class R6 | (34,851,423 | ) | (151,555,385 | ) | ||||
Net asset value of shares converted |
| |||||||
Class A | 104,995,531 | — | ||||||
Class C | (104,995,531 | ) | — | |||||
Net decrease in net assets from Fund share transactions | $ | (266,106,656 | ) | $ | (321,974,058 | ) | ||
Net increase (decrease) in net assets | $ | 134,912,834 | $ | (599,250,453 | ) | |||
| Net Assets |
| |||||||
At beginning of year | $ | 1,588,881,782 | $ | 2,188,132,235 | ||||
At end of year | $ | 1,723,794,616 | $ | 1,588,881,782 | ||||
| (1) | Includes $83,682,794 of net realized gains from redemptionsin-kind. |
| (2) | Includes $76,505,274 of net realized gains from redemptionsin-kind. |
| 13 | See Notes to Financial Statements. |
Eaton Vance
Large-Cap Value Fund
December 31, 2019
Financial Highlights
| Class A | ||||||||||||||||||||
| Year Ended December 31, | ||||||||||||||||||||
| 2019 | 2018 | 2017 | 2016 | 2015 | ||||||||||||||||
Net asset value — Beginning of year | $ | 16.500 | $ | 19.520 | $ | 18.030 | $ | 16.690 | $ | 18.740 | ||||||||||
| Income (Loss) From Operations |
| |||||||||||||||||||
Net investment income(1) | $ | 0.256 | $ | 0.254 | $ | 0.246 | $ | 0.279 | $ | 0.246 | ||||||||||
Net realized and unrealized gain (loss) | 4.638 | (1.470 | ) | 2.393 | 1.301 | (0.456 | ) | |||||||||||||
Total income (loss) from operations | $ | 4.894 | $ | (1.216 | ) | $ | 2.639 | $ | 1.580 | $ | (0.210 | ) | ||||||||
| Less Distributions |
| |||||||||||||||||||
From net investment income | $ | (0.248 | ) | $ | (0.240 | ) | $ | (0.240 | ) | $ | (0.240 | ) | $ | (0.260 | ) | |||||
From net realized gain | (0.166 | ) | (1.564 | ) | (0.909 | ) | — | (1.580 | ) | |||||||||||
Total distributions | $ | (0.414 | ) | $ | (1.804 | ) | $ | (1.149 | ) | $ | (0.240 | ) | $ | (1.840 | ) | |||||
Net asset value — End of year | $ | 20.980 | $ | 16.500 | $ | 19.520 | $ | 18.030 | $ | 16.690 | ||||||||||
Total Return(2) | 29.79 | % | (6.83 | )% | 14.80 | % | 9.56 | % | (1.08 | )% | ||||||||||
| Ratios/Supplemental Data |
| |||||||||||||||||||
Net assets, end of year (000’s omitted) | $ | 711,972 | $ | 549,515 | $ | 741,193 | $ | 942,192 | $ | 1,127,754 | ||||||||||
Ratios (as a percentage of average daily net assets): |
| |||||||||||||||||||
Expenses(3) | 1.04 | % | 1.06 | %(4) | 1.06 | %(4) | 1.06 | %(4) | 1.05 | %(4) | ||||||||||
Net investment income | 1.33 | % | 1.30 | %(4) | 1.31 | %(4) | 1.67 | %(4) | 1.33 | %(4) | ||||||||||
Portfolio Turnover of the Portfolio(5) | — | 34 | %(6) | 105 | % | 94 | % | 98 | % | |||||||||||
Portfolio Turnover of the Fund | 62 | % | 48 | %(6)(7) | — | — | — | |||||||||||||
| (1) | Computed using average shares outstanding. |
| (2) | Returns are historical and are calculated by determining the percentage change in net asset value with all distributions reinvested and do not reflect the effect of sales charges. |
| (3) | Excludes the effect of custody fee credits, if any, of less than 0.005%. Effective September 1, 2015, custody fee credits, which were earned on cash deposit balances, were discontinued by the custodian. |
| (4) | Includes the Fund’s share of the Portfolio’s allocated expenses for the period while the Fund was investing in the Portfolio. |
| (5) | Portfolio turnover represents the rate of portfolio activity for the period while the Fund was investing in the Portfolio. |
| (6) | Not annualized. |
| (7) | For the period from June 18, 2018 through December 31, 2018 when the Fund was making investments directly in securities. |
References to Portfolio herein are toLarge-Cap Value Portfolio, a Massachusetts business trust in which the Fund invested all of its investable assets prior to the close of business on June 15, 2018 and which had the same investment objective and policies as the Fund during such period.
| 14 | See Notes to Financial Statements. |
Eaton Vance
Large-Cap Value Fund
December 31, 2019
Financial Highlights — continued
| Class C | ||||||||||||||||||||
| Year Ended December 31, | ||||||||||||||||||||
| 2019 | 2018 | 2017 | 2016 | 2015 | ||||||||||||||||
Net asset value — Beginning of year | $ | 16.520 | $ | 19.540 | $ | 18.040 | $ | 16.700 | $ | 18.750 | ||||||||||
| Income (Loss) From Operations |
| |||||||||||||||||||
Net investment income(1) | $ | 0.103 | $ | 0.107 | $ | 0.107 | $ | 0.154 | $ | 0.107 | ||||||||||
Net realized and unrealized gain (loss) | 4.655 | (1.473 | ) | 2.394 | 1.298 | (0.453 | ) | |||||||||||||
Total income (loss) from operations | $ | 4.758 | $ | (1.366 | ) | $ | 2.501 | $ | 1.452 | $ | (0.346 | ) | ||||||||
| Less Distributions |
| |||||||||||||||||||
From net investment income | $ | (0.062 | ) | $ | (0.090 | ) | $ | (0.092 | ) | $ | (0.112 | ) | $ | (0.124 | ) | |||||
From net realized gain | (0.166 | ) | (1.564 | ) | (0.909 | ) | — | (1.580 | ) | |||||||||||
Total distributions | $ | (0.228 | ) | $ | (1.654 | ) | $ | (1.001 | ) | $ | (0.112 | ) | $ | (1.704 | ) | |||||
Net asset value — End of year | $ | 21.050 | $ | 16.520 | $ | 19.540 | $ | 18.040 | $ | 16.700 | ||||||||||
Total Return(2) | 28.82 | % | (7.53 | )% | 13.96 | % | 8.74 | % | (1.82 | )% | ||||||||||
| Ratios/Supplemental Data |
| |||||||||||||||||||
Net assets, end of year (000’s omitted) | $ | 56,344 | $ | 168,783 | $ | 241,192 | $ | 300,456 | $ | 345,531 | ||||||||||
Ratios (as a percentage of average daily net assets): |
| |||||||||||||||||||
Expenses(3) | 1.80 | % | 1.81 | %(4) | 1.81 | %(4) | 1.81 | %(4) | 1.80 | %(4) | ||||||||||
Net investment income | 0.54 | % | 0.55 | %(4) | 0.57 | %(4) | 0.92 | %(4) | 0.58 | %(4) | ||||||||||
Portfolio Turnover of the Portfolio(5) | — | 34 | %(6) | 105 | % | 94 | % | 98 | % | |||||||||||
Portfolio Turnover of the Fund | 62 | % | 48 | %(6)(7) | — | — | — | |||||||||||||
| (1) | Computed using average shares outstanding. |
| (2) | Returns are historical and are calculated by determining the percentage change in net asset value with all distributions reinvested and do not reflect the effect of sales charges. |
| (3) | Excludes the effect of custody fee credits, if any, of less than 0.005%. Effective September 1, 2015, custody fee credits, which were earned on cash deposit balances, were discontinued by the custodian. |
| (4) | Includes the Fund’s share of the Portfolio’s allocated expenses for the period while the Fund was investing in the Portfolio. |
| (5) | Portfolio turnover represents the rate of portfolio activity for the period while the Fund was investing in the Portfolio. |
| (6) | Not annualized. |
| (7) | For the period from June 18, 2018 through December 31, 2018 when the Fund was making investments directly in securities. |
References to Portfolio herein are toLarge-Cap Value Portfolio, a Massachusetts business trust in which the Fund invested all of its investable assets prior to the close of business on June 15, 2018 and which had the same investment objective and policies as the Fund during such period.
| 15 | See Notes to Financial Statements. |
Eaton Vance
Large-Cap Value Fund
December 31, 2019
Financial Highlights — continued
| Class I | ||||||||||||||||||||
| Year Ended December 31, | ||||||||||||||||||||
| 2019 | 2018 | 2017 | 2016 | 2015 | ||||||||||||||||
Net asset value — Beginning of year | $ | 16.570 | $ | 19.590 | $ | 18.090 | $ | 16.750 | $ | 18.800 | ||||||||||
| Income (Loss) From Operations |
| |||||||||||||||||||
Net investment income(1) | $ | 0.305 | $ | 0.306 | $ | 0.296 | $ | 0.323 | $ | 0.293 | ||||||||||
Net realized and unrealized gain (loss) | 4.658 | (1.472 | ) | 2.401 | 1.300 | (0.458 | ) | |||||||||||||
Total income (loss) from operations | $ | 4.963 | $ | (1.166 | ) | $ | 2.697 | $ | 1.623 | $ | (0.165 | ) | ||||||||
| Less Distributions |
| |||||||||||||||||||
From net investment income | $ | (0.297 | ) | $ | (0.290 | ) | $ | (0.288 | ) | $ | (0.283 | ) | $ | (0.305 | ) | |||||
From net realized gain | (0.166 | ) | (1.564 | ) | (0.909 | ) | — | (1.580 | ) | |||||||||||
Total distributions | $ | (0.463 | ) | $ | (1.854 | ) | $ | (1.197 | ) | $ | (0.283 | ) | $ | (1.885 | ) | |||||
Net asset value — End of year | $ | 21.070 | $ | 16.570 | $ | 19.590 | $ | 18.090 | $ | 16.750 | ||||||||||
Total Return(2) | 30.11 | % | (6.57 | )% | 15.10 | % | 9.80 | % | (0.83 | )% | ||||||||||
| Ratios/Supplemental Data |
| |||||||||||||||||||
Net assets, end of year (000’s omitted) | $ | 819,292 | $ | 736,581 | $ | 1,032,300 | $ | 1,555,075 | $ | 1,664,998 | ||||||||||
Ratios (as a percentage of average daily net assets): |
| |||||||||||||||||||
Expenses(3) | 0.79 | % | 0.81 | %(4) | 0.81 | %(4) | 0.81 | %(4) | 0.80 | %(4) | ||||||||||
Net investment income | 1.58 | % | 1.56 | %(4) | 1.57 | %(4) | 1.92 | %(4) | 1.58 | %(4) | ||||||||||
Portfolio Turnover of the Portfolio(5) | — | 34 | %(6) | 105 | % | 94 | % | 98 | % | |||||||||||
Portfolio Turnover of the Fund | 62 | % | 48 | %(6)(7) | — | — | — | |||||||||||||
| (1) | Computed using average shares outstanding. |
| (2) | Returns are historical and are calculated by determining the percentage change in net asset value with all distributions reinvested. |
| (3) | Excludes the effect of custody fee credits, if any, of less than 0.005%. Effective September 1, 2015, custody fee credits, which were earned on cash deposit balances, were discontinued by the custodian. |
| (4) | Includes the Fund’s share of the Portfolio’s allocated expenses for the period while the Fund was investing in the Portfolio. |
| (5) | Portfolio turnover represents the rate of portfolio activity for the period while the Fund was investing in the Portfolio. |
| (6) | Not annualized. |
| (7) | For the period from June 18, 2018 through December 31, 2018 when the Fund was making investments directly in securities. |
References to Portfolio herein are toLarge-Cap Value Portfolio, a Massachusetts business trust in which the Fund invested all of its investable assets prior to the close of business on June 15, 2018 and which had the same investment objective and policies as the Fund during such period.
| 16 | See Notes to Financial Statements. |
Eaton Vance
Large-Cap Value Fund
December 31, 2019
Financial Highlights — continued
| Class R | ||||||||||||||||||||
| Year Ended December 31, | ||||||||||||||||||||
| 2019 | 2018 | 2017 | 2016 | 2015 | ||||||||||||||||
Net asset value — Beginning of year | $ | 16.450 | $ | 19.460 | $ | 17.980 | $ | 16.650 | $ | 18.690 | ||||||||||
| Income (Loss) From Operations |
| |||||||||||||||||||
Net investment income(1) | $ | 0.206 | $ | 0.204 | $ | 0.199 | $ | 0.237 | $ | 0.199 | ||||||||||
Net realized and unrealized gain (loss) | 4.626 | (1.460 | ) | 2.382 | 1.292 | (0.445 | ) | |||||||||||||
Total income (loss) from operations | $ | 4.832 | $ | (1.256 | ) | $ | 2.581 | $ | 1.529 | $ | (0.246 | ) | ||||||||
| Less Distributions |
| |||||||||||||||||||
From net investment income | $ | (0.196 | ) | $ | (0.190 | ) | $ | (0.192 | ) | $ | (0.199 | ) | $ | (0.214 | ) | |||||
From net realized gain | (0.166 | ) | (1.564 | ) | (0.909 | ) | — | (1.580 | ) | |||||||||||
Total distributions | $ | (0.362 | ) | $ | (1.754 | ) | $ | (1.101 | ) | $ | (0.199 | ) | $ | (1.794 | ) | |||||
Net asset value — End of year | $ | 20.920 | $ | 16.450 | $ | 19.460 | $ | 17.980 | $ | 16.650 | ||||||||||
Total Return(2) | 29.48 | % | (7.04 | )% | 14.50 | % | 9.26 | % | (1.33 | )% | ||||||||||
| Ratios/Supplemental Data |
| |||||||||||||||||||
Net assets, end of year (000’s omitted) | $ | 59,473 | $ | 60,984 | $ | 86,706 | $ | 101,010 | $ | 109,468 | ||||||||||
Ratios (as a percentage of average daily net assets): |
| |||||||||||||||||||
Expenses(3) | 1.30 | % | 1.31 | %(4) | 1.31 | %(4) | 1.31 | %(4) | 1.30 | %(4) | ||||||||||
Net investment income | 1.08 | % | 1.05 | %(4) | 1.06 | %(4) | 1.42 | %(4) | 1.08 | %(4) | ||||||||||
Portfolio Turnover of the Portfolio(5) | — | 34 | %(6) | 105 | % | 94 | % | 98 | % | |||||||||||
Portfolio Turnover of the Fund | 62 | % | 48 | %(6)(7) | — | — | — | |||||||||||||
| (1) | Computed using average shares outstanding. |
| (2) | Returns are historical and are calculated by determining the percentage change in net asset value with all distributions reinvested. |
| (3) | Excludes the effect of custody fee credits, if any, of less than 0.005%. Effective September 1, 2015, custody fee credits, which were earned on cash deposit balances, were discontinued by the custodian. |
| (4) | Includes the Fund’s share of the Portfolio’s allocated expenses for the period while the Fund was investing in the Portfolio. |
| (5) | Portfolio turnover represents the rate of portfolio activity for the period while the Fund was investing in the Portfolio. |
| (6) | Not annualized. |
| (7) | For the period from June 18, 2018 through December 31, 2018 when the Fund was making investments directly in securities. |
References to Portfolio herein are toLarge-Cap Value Portfolio, a Massachusetts business trust in which the Fund invested all of its investable assets prior to the close of business on June 15, 2018 and which had the same investment objective and policies as the Fund during such period.
| 17 | See Notes to Financial Statements. |
Eaton Vance
Large-Cap Value Fund
December 31, 2019
Financial Highlights — continued
| Class R6 | ||||||||||||||||||||
| Year Ended December 31, | ||||||||||||||||||||
| 2019 | 2018 | 2017 | 2016 | 2015 | ||||||||||||||||
Net asset value — Beginning of year | $ | 16.580 | $ | 19.610 | $ | 18.100 | $ | 16.760 | $ | 18.810 | ||||||||||
| Income (Loss) From Operations |
| |||||||||||||||||||
Net investment income(1) | $ | 0.320 | $ | 0.310 | $ | 0.311 | $ | 0.339 | $ | 0.321 | ||||||||||
Net realized and unrealized gain (loss) | 4.656 | (1.470 | ) | 2.413 | 1.301 | (0.469 | ) | |||||||||||||
Total income (loss) from operations | $ | 4.976 | $ | (1.160 | ) | $ | 2.724 | $ | 1.640 | $ | (0.148 | ) | ||||||||
| Less Distributions |
| |||||||||||||||||||
From net investment income | $ | (0.310 | ) | $ | (0.306 | ) | $ | (0.305 | ) | $ | (0.300 | ) | $ | (0.322 | ) | |||||
From net realized gain | (0.166 | ) | (1.564 | ) | (0.909 | ) | — | (1.580 | ) | |||||||||||
Total distributions | $ | (0.476 | ) | $ | (1.870 | ) | $ | (1.214 | ) | $ | (0.300 | ) | $ | (1.902 | ) | |||||
Net asset value — End of year | $ | 21.080 | $ | 16.580 | $ | 19.610 | $ | 18.100 | $ | 16.760 | ||||||||||
Total Return(2) | 30.17 | % | (6.54 | )% | 15.25 | % | 9.90 | % | (0.79 | )% | ||||||||||
| Ratios/Supplemental Data |
| |||||||||||||||||||
Net assets, end of year (000’s omitted) | $ | 76,714 | $ | 73,019 | $ | 86,742 | $ | 38,485 | $ | 32,525 | ||||||||||
Ratios (as a percentage of average daily net assets): |
| |||||||||||||||||||
Expenses(3) | 0.72 | % | 0.72 | %(4) | 0.73 | %(4) | 0.71 | %(4) | 0.71 | %(4) | ||||||||||
Net investment income | 1.66 | % | 1.57 | %(4) | 1.64 | %(4) | 2.01 | %(4) | 1.73 | %(4) | ||||||||||
Portfolio Turnover of the Portfolio(5) | — | 34 | %(6) | 105 | % | 94 | % | 98 | % | |||||||||||
Portfolio Turnover of the Fund | 62 | % | 48 | %(6)(7) | — | — | — | |||||||||||||
| (1) | Computed using average shares outstanding. |
| (2) | Returns are historical and are calculated by determining the percentage change in net asset value with all distributions reinvested. |
| (3) | Excludes the effect of custody fee credits, if any, of less than 0.005%. Effective September 1, 2015, custody fee credits, which were earned on cash deposit balances, were discontinued by the custodian. |
| (4) | Includes the Fund’s share of the Portfolio’s allocated expenses for the period while the Fund was investing in the Portfolio. |
| (5) | Portfolio turnover represents the rate of portfolio activity for the period while the Fund was investing in the Portfolio. |
| (6) | Not annualized. |
| (7) | For the period from June 18, 2018 through December 31, 2018 when the Fund was making investments directly in securities. |
References to Portfolio herein are toLarge-Cap Value Portfolio, a Massachusetts business trust in which the Fund invested all of its investable assets prior to the close of business on June 15, 2018 and which had the same investment objective and policies as the Fund during such period.
| 18 | See Notes to Financial Statements. |
Eaton Vance
Large-Cap Value Fund
December 31, 2019
Notes to Financial Statements
1 Significant Accounting Policies
Eaton VanceLarge-Cap Value Fund (the Fund) is a diversified series of Eaton Vance Special Investment Trust (the Trust). The Trust is a Massachusetts business trust registered under the Investment Company Act of 1940, as amended (the 1940 Act), as anopen-end management investment company. The Fund’s investment objective is to seek total return. The Fund offers five classes of shares. Class A shares are generally sold subject to a sales charge imposed at time of purchase. Class C shares are sold at net asset value and are generally subject to a contingent deferred sales charge (see Note 5). Effective January 25, 2019, Class C shares generally automatically convert to Class A shares ten years after their purchase as described in the Fund’s prospectus. Class I, Class R and Class R6 shares are sold at net asset value and are not subject to a sales charge.
Each class represents apro-rata interest in the Fund, but votes separately on class-specific matters and (as noted below) is subject to different expenses. Realized and unrealized gains and losses and net investment income and losses, other than class-specific expenses, are allocated daily to each class of shares based on the relative net assets of each class to the total net assets of the Fund.Sub-accounting, recordkeeping and similar administrative fees payable to financial intermediaries, which are a component of transfer and dividend disbursing agent fees on the Statement of Operations, are not allocated to Class R6 shares. Each class of shares differs in its distribution plan and certain other class-specific expenses.
The following is a summary of significant accounting policies of the Fund. The policies are in conformity with accounting principles generally accepted in the United States of America (U.S. GAAP). The Fund is an investment company and follows accounting and reporting guidance in the Financial Accounting Standards Board (FASB) Accounting Standards Codification Topic 946.
A Investment Valuation — The following methodologies are used to determine the market value or fair value of investments.
Equity Securities.Equity securities listed on a U.S. securities exchange generally are valued at the last sale or closing price on the day of valuation or, if no sales took place on such date, at the mean between the closing bid and ask prices on the exchange where such securities are principally traded. Equity securities listed on the NASDAQ Global or Global Select Market generally are valued at the NASDAQ official closing price. Unlisted or listed securities for which closing sales prices or closing quotations are not available are valued at the mean between the latest available bid and ask prices.
Foreign Securities and Currencies.Foreign securities and currencies are valued in U.S. dollars, based on foreign currency exchange rate quotations supplied by a third party pricing service. The pricing service uses a proprietary model to determine the exchange rate. Inputs to the model include reported trades and implied bid/ask spreads. The daily valuation of exchange-traded foreign securities generally is determined as of the close of trading on the principal exchange on which such securities trade. Events occurring after the close of trading on foreign exchanges may result in adjustments to the valuation of foreign securities to more accurately reflect their fair value as of the close of regular trading on the New York Stock Exchange. When valuing foreign equity securities that meet certain criteria, the Fund’s Trustees have approved the use of a fair value service that values such securities to reflect market trading that occurs after the close of the applicable foreign markets of comparable securities or other instruments that have a strong correlation to the fair-valued securities.
Affiliated Fund.The Fund may invest in Eaton Vance Cash Reserves Fund, LLC (Cash Reserves Fund), an affiliated investment company managed by Eaton Vance Management (EVM). While Cash Reserves Fund is not a registered money market mutual fund, it conducts all of its investment activities in accordance with the requirements of Rule2a-7 under the 1940 Act. Investments in Cash Reserves Fund are valued at the closing net asset value per unit
on the valuation day. Cash Reserves Fund generally values its investment securities based on available market quotations provided by a third party pricing service.
Other. Investments in registered investment companies (including money market funds) that do not trade on an exchange are valued at the net asset value per share on the valuation day.
Fair Valuation.Investments for which valuations or market quotations are not readily available or are deemed unreliable are valued at fair value using methods determined in good faith by or at the direction of the Trustees of the Fund in a manner that most fairly reflects the security’s “fair value”, which is the amount that the Fund might reasonably expect to receive for the security upon its current sale in the ordinary course. Each such determination is based on a consideration of relevant factors, which are likely to vary from one pricing context to another. These factors may include, but are not limited to, the type of security, the existence of any contractual restrictions on the security’s disposition, the price and extent of public trading in similar securities of the issuer or of comparable companies or entities, quotations or relevant information obtained from broker/dealers or other market participants, information obtained from the issuer, analysts, and/or the appropriate stock exchange (for exchange-traded securities), an analysis of the company’s or entity’s financial statements, and an evaluation of the forces that influence the issuer and the market(s) in which the security is purchased and sold.
B Investment Transactions — Investment transactions for financial statement purposes are accounted for on a trade date basis. Realized gains and losses on investments sold are determined on the basis of identified cost.
C Income — Dividend income is recorded on theex-dividend date for dividends received in cash and/or securities. However, if theex-dividend date has passed, certain dividends from foreign securities are recorded as the Fund is informed of theex-dividend date. Withholding taxes on foreign dividends and capital gains have been provided for in accordance with the Fund’s understanding of the applicable countries’ tax rules and rates. In consideration of recent decisions rendered by European courts, the Fund has filed additional tax reclaims for previously withheld taxes on dividends earned in certain European Union countries. These filings are subject to various administrative and judicial proceedings within these countries. Due to the uncertainty as to the ultimate resolution of these proceedings, the likelihood of receipt of these reclaims, and the potential timing of payment, no amounts are reflected in the Fund’s financial statements for such outstanding reclaims. Distributions from investment companies are recorded as dividend income, capital gains or return of capital based on the nature of the distribution.
| 19 |
Eaton Vance
Large-Cap Value Fund
December 31, 2019
Notes to Financial Statements — continued
D Federal Taxes — The Fund’s policy is to comply with the provisions of the Internal Revenue Code applicable to regulated investment companies and to distribute to shareholders each year substantially all of its net investment income, and all or substantially all of its net realized capital gains. Accordingly, no provision for federal income or excise tax is necessary.
As of December 31, 2019, the Fund had no uncertain tax positions that would require financial statement recognition,de-recognition, or disclosure. The Fund files a U.S. federal income tax return annually after its fiscalyear-end, which is subject to examination by the Internal Revenue Service for a period of three years from the date of filing.
E Expenses — The majority of expenses of the Trust are directly identifiable to an individual fund. Expenses which are not readily identifiable to a specific fund are allocated taking into consideration, among other things, the nature and type of expense and the relative size of the funds.
F Foreign Currency Translation — Investment valuations, other assets, and liabilities initially expressed in foreign currencies are translated each business day into U.S. dollars based upon current exchange rates. Purchases and sales of foreign investment securities and income and expenses denominated in foreign currencies are translated into U.S. dollars based upon currency exchange rates in effect on the respective dates of such transactions. Recognized gains or losses on investment transactions attributable to changes in foreign currency exchange rates are recorded for financial statement purposes as net realized gains and losses on investments. That portion of unrealized gains and losses on investments that results from fluctuations in foreign currency exchange rates is not separately disclosed.
G Use of Estimates — The preparation of the financial statements in conformity with U.S. GAAP requires management to make estimates and assumptions that affect the reported amounts of assets and liabilities at the date of the financial statements and the reported amounts of income and expense during the reporting period. Actual results could differ from those estimates.
H Indemnifications — Under the Trust’s organizational documents, its officers and Trustees may be indemnified against certain liabilities and expenses arising out of the performance of their duties to the Fund. Under Massachusetts law, if certain conditions prevail, shareholders of a Massachusetts business trust (such as the Trust) could be deemed to have personal liability for the obligations of the Trust. However, the Trust’s Declaration of Trust contains an express disclaimer of liability on the part of Fund shareholders and theBy-laws provide that the Trust shall assume, upon request by the shareholder, the defense on behalf of any Fund shareholders. Moreover, theBy-laws also provide for indemnification out of Fund property of any shareholder held personally liable solely by reason of being or having been a shareholder for all loss or expense arising from such liability. Additionally, in the normal course of business, the Fund enters into agreements with service providers that may contain indemnification clauses. The Fund’s maximum exposure under these arrangements is unknown as this would involve future claims that may be made against the Fund that have not yet occurred.
2 Distributions to Shareholders and Income Tax Information
It is the present policy of the Fund to make quarterly distributions of all or substantially all of its net investment income and to distribute annually all or substantially all of its net realized capital gains. Distributions to shareholders are recorded on theex-dividend date. Distributions are declared separately for each class of shares. Shareholders may reinvest income and capital gain distributions in additional shares of the same class of the Fund at the net asset value as of theex-dividend date or, at the election of the shareholder, receive distributions in cash. Distributions to shareholders are determined in accordance with income tax regulations, which may differ from U.S. GAAP. As required by U.S. GAAP, only distributions in excess of tax basis earnings and profits are reported in the financial statements as a return of capital. Permanent differences between book and tax accounting relating to distributions are reclassified topaid-in capital. For tax purposes, distributions from short-term capital gains are considered to be from ordinary income.
The tax character of distributions declared for the years ended December 31, 2019 and December 31, 2018 was as follows:
| Year Ended December 31, | ||||||||
| 2019 | 2018 | |||||||
Ordinary income | $ | 22,820,364 | $ | 24,689,422 | ||||
Long-term capital gains | $ | 13,552,129 | $ | 143,045,905 | ||||
During the year ended December 31, 2019, distributable earnings was decreased by $86,914,908 andpaid-in capital was increased by $86,914,908 due to the Fund’s use of equalization accounting and differences between book and tax accounting, primarily for redemptionsin-kind. Tax equalization accounting allows the Fund to treat as a distribution that portion of redemption proceeds representing a redeeming shareholder’s portion of undistributed taxable income and net capital gains. These reclassifications had no effect on the net assets or net asset value per share of the Fund.
| 20 |
Eaton Vance
Large-Cap Value Fund
December 31, 2019
Notes to Financial Statements — continued
As of December 31, 2019, the components of distributable earnings (accumulated loss) on a tax basis were as follows:
Undistributed ordinary income | $ | 3,140,054 | ||
Undistributed long-term capital gains | $ | 8,304,912 | ||
Net unrealized appreciation | $ | 286,299,641 | ||
The cost and unrealized appreciation (depreciation) of investments of the Fund at December 31, 2019, as determined on a federal income tax basis, were as follows:
Aggregate cost | $ | 1,437,101,520 | ||
Gross unrealized appreciation | $ | 305,173,514 | ||
Gross unrealized depreciation | (18,875,126 | ) | ||
Net unrealized appreciation | $ | 286,298,388 | ||
3 Investment Adviser Fee and Other Transactions with Affiliates
The investment adviser fee is earned by Boston Management and Research (BMR), a subsidiary of EVM, as compensation for investment advisory services rendered to the Fund. The fee is computed at an annual rate of 0.625% of the Fund’s average daily net assets up to $2 billion, 0.60% on net assets of $2 billion but less than $5 billion and at reduced rates on daily net assets of $5 billion and over, and is payable monthly. For the year ended December 31, 2019, the investment adviser fee amounted to $10,551,262 or 0.625% of the Fund’s average daily net assets. The Fund invests its cash in Cash Reserves Fund. EVM does not currently receive a fee for advisory services provided to Cash Reserves Fund.
EVM serves as the administrator of the Fund, but receives no compensation. EVM providessub-transfer agency and related services to the Fund pursuant to aSub-Transfer Agency Support Services Agreement. For the year ended December 31, 2019, EVM earned $114,944 from the Fund pursuant to such agreement, which is included in transfer and dividend disbursing agent fees on the Statement of Operations. The Fund was informed that Eaton Vance Distributors, Inc. (EVD), an affiliate of EVM and the Fund’s principal underwriter, received $16,981 as its portion of the sales charge on sales of Class A shares for the year ended December 31, 2019. EVD also received distribution and service fees from Class A, Class C and Class R shares (see Note 4) and contingent deferred sales charges (see Note 5).
Trustees and officers of the Fund who are members of EVM’s or BMR’s organizations receive remuneration for their services to the Fund out of the investment adviser fee. Trustees of the Fund who are not affiliated with the investment adviser may elect to defer receipt of all or a percentage of their annual fees in accordance with the terms of the Trustees Deferred Compensation Plan. For the year ended December 31, 2019, no significant amounts have been deferred. Certain officers and Trustees of the Fund are officers of the above organizations.
4 Distribution Plans
The Fund has in effect a distribution plan for Class A shares (Class A Plan) pursuant to Rule12b-1 under the 1940 Act. Pursuant to the Class A Plan, the Fund pays EVD a distribution and service fee of 0.25% per annum of its average daily net assets attributable to Class A shares for distribution services and facilities provided to the Fund by EVD, as well as for personal services and/or the maintenance of shareholder accounts. Distribution and service fees paid or accrued to EVD for the year ended December 31, 2019 amounted to $1,706,342 for Class A shares.
The Fund also has in effect distribution plans for Class C shares (Class C Plan) and Class R shares (Class R Plan) pursuant to Rule12b-1 under the 1940 Act. Pursuant to the Class C Plan, the Fund pays EVD amounts equal to 0.75% per annum of its average daily net assets attributable to Class C shares for providing ongoing distribution services and facilities to the Fund. For the year ended December 31, 2019, the Fund paid or accrued to EVD $575,719 for Class C shares.
The Class R Plan requires the Fund to pay EVD an amount up to 0.50% per annum of its average daily net assets attributable to Class R shares for providing ongoing distribution services and facilities to the Fund. The Trustees of the Trust have currently limited Class R distribution payments to 0.25% per annum of the average daily net assets attributable to Class R shares. For the year ended December 31, 2019, the Fund paid or accrued to EVD $155,903 for Class R shares.
Pursuant to the Class C and Class R Plans, the Fund also makes payments of service fees to EVD, financial intermediaries and other persons in amounts equal to 0.25% per annum of its average daily net assets attributable to that class. Service fees paid or accrued are for personal services and/or the
| 21 |
Eaton Vance
Large-Cap Value Fund
December 31, 2019
Notes to Financial Statements — continued
maintenance of shareholder accounts. They are separate and distinct from the sales commissions and distribution fees payable to EVD. Service fees paid or accrued for the year ended December 31, 2019 amounted to $191,907 and $155,903 for Class C and Class R shares, respectively.
Distribution and service fees are subject to the limitations contained in the Financial Industry Regulatory Authority Rule 2341(d).
5 Contingent Deferred Sales Charges
A contingent deferred sales charge (CDSC) of 1% generally is imposed on redemptions of Class C shares made within one year of purchase. Class A shares may be subject to a 1% CDSC if redeemed within 18 months of purchase (depending on the circumstances of purchase). Generally, the CDSC is based upon the lower of the net asset value at date of redemption or date of purchase. No charge is levied on shares acquired by reinvestment of dividends or capital gain distributions. For the year ended December 31, 2019, the Fund was informed that EVD received less than $100 and approximately $5,000 of CDSCs paid by Class A and Class C shareholders, respectively.
6 Purchases and Sales of Investments
Purchases and sales of investments, other than short-term obligations andin-kind transactions, aggregated $1,035,298,904 and $1,037,505,360, respectively, for the year ended December 31, 2019.In-kind sales for the year ended December 31, 2019 aggregated $273,735,639.
7 Shares of Beneficial Interest
The Fund’s Declaration of Trust permits the Trustees to issue an unlimited number of full and fractional shares of beneficial interest (without par value). Such shares may be issued in a number of different series (such as the Fund) and classes. Sales and redemptions of Class I shares include shares purchased and redeemed in connection with the ReFlow liquidity program, a program designed to provide an alternative liquidity source for mutual funds experiencing net redemptions of their shares. Transactions in Fund shares were as follows:
| Year Ended December 31, | ||||||||
| Class A | 2019 | 2018 | ||||||
Sales | 2,680,967 | 3,229,434 | ||||||
Issued to shareholders electing to receive payments of distributions in Fund shares | 647,324 | 2,895,017 | ||||||
Redemptions | (8,586,649 | ) | (10,802,967 | ) | ||||
Converted from Class C shares | 5,898,076 | — | ||||||
Net increase (decrease) | 639,718 | (4,678,516 | ) | |||||
| Year Ended December 31, | ||||||||
| Class C | 2019 | 2018 | ||||||
Sales | 202,727 | 467,859 | ||||||
Issued to shareholders electing to receive payments of distributions in Fund shares | 24,074 | 831,675 | ||||||
Redemptions | (1,873,072 | ) | (3,430,078 | ) | ||||
Converted to Class A shares | (5,892,167 | ) | — | |||||
Net decrease | (7,538,438 | ) | (2,130,544 | ) | ||||
| Year Ended December 31, | ||||||||
| Class I | 2019 | 2018 | ||||||
Sales | 18,216,329 | 27,452,103 | ||||||
Issued to shareholders electing to receive payments of distributions in Fund shares | 752,462 | 3,500,040 | ||||||
Redemptions | (24,528,454 | ) | (39,195,998 | ) | ||||
Net decrease | (5,559,663 | ) | (8,243,855 | ) | ||||
| 22 |
Eaton Vance
Large-Cap Value Fund
December 31, 2019
Notes to Financial Statements — continued
| Year Ended December 31, | ||||||||
| Class R | 2019 | 2018 | ||||||
Sales | 285,086 | 494,807 | ||||||
Issued to shareholders electing to receive payments of distributions in Fund shares | 52,192 | 319,168 | ||||||
Redemptions | (1,200,474 | ) | (1,562,335 | ) | ||||
Net decrease | (863,196 | ) | (748,360 | ) | ||||
| Year Ended December 31, | ||||||||
| Class R6 | 2019 | 2018 | ||||||
Sales | 906,307 | 7,126,880 | ||||||
Issued to shareholders electing to receive payments of distributions in Fund shares | 92,425 | 535,679 | ||||||
Redemptions | (1,763,659 | ) | (7,683,357 | ) | ||||
Net decrease | (764,927 | ) | (20,798 | ) | ||||
8 Line of Credit
The Fund participates with other portfolios and funds managed by EVM and its affiliates in an $800 million unsecured line of credit agreement with a group of banks, which is in effect through October 27, 2020. In connection with the renewal of the agreement on October 29, 2019, funds managed by Calvert Research and Management, an affiliate of EVM, were added as participating funds to the agreement and the borrowing limit was increased from $625 million. Borrowings are made by the Fund solely to facilitate the handling of unusual and/or unanticipated short-term cash requirements. Interest is charged to the Fund based on its borrowings at an amount above either the Eurodollar rate or Federal Funds rate. In addition, a fee computed at an annual rate of 0.15% on the daily unused portion of the line of credit is allocated among the participating portfolios and funds at the end of each quarter. Because the line of credit is not available exclusively to the Fund, it may be unable to borrow some or all of its requested amounts at any particular time. The Fund did not have any significant borrowings or allocated fees during the year ended December 31, 2019.
9 Investments in Affiliated Funds
At December 31, 2019, the value of the Fund’s investment in affiliated funds was $2,748,856, which represents 0.2% of the Fund’s net assets. Transactions in affiliated funds by the Fund for the year ended December 31, 2019 were as follows:
| Name of affiliated fund | Value, beginning of period | Purchases | Sales proceeds | Net realized gain (loss) | Change in unrealized appreciation (depreciation) | Value, end of period | Dividend income | Units, end of period | ||||||||||||||||||||||||
Short-Term Investments |
| |||||||||||||||||||||||||||||||
Eaton Vance Cash Reserves Fund, LLC, 1.78% | $ | 6,566,966 | $ | 285,854,763 | $ | 289,674,783 | $ | 2,068 | $ | (158 | ) | $ | 2,748,856 | $ | 132,953 | 2,748,856 | ||||||||||||||||
10 Securities Lending Agreement
The Fund has established a securities lending agreement with State Street Bank and Trust Company (SSBT) as securities lending agent in which the Fund lends portfolio securities to qualified borrowers in exchange for collateral consisting of either cash or securities issued or guaranteed by the U.S. government or its agencies or instrumentalities in an amount at least equal to the market value of the securities on loan. The market value of securities loaned is determined daily and any additional required collateral is delivered to the Fund on the next business day. Cash collateral is invested in the State Street Navigator Securities Lending Government Money Market Portfolio, a money market fund registered under the 1940 Act. The Fund earns interest on the amount invested but it must pay (and at times receive from) the broker a loan rebate fee computed as a varying percentage of the collateral received. For security loans secured bynon-cash collateral, the Fund earns a negotiated lending fee from the borrower. A portion of the income earned by the Fund from its investment of cash collateral, net of rebate fees, and lending fees received is allocated to SSBT for its services as lending agent and the portion
| 23 |
Eaton Vance
Large-Cap Value Fund
December 31, 2019
Notes to Financial Statements — continued
allocated to the Fund is presented as securities lending income, net on the Statement of Operations.Non-cash collateral is held by the lending agent on behalf of the Fund and cannot be sold orre-pledged by the Fund; accordingly, such collateral is not reflected in the Statement of Assets and Liabilities.
The Fund is subject to possible delay in the recovery of loaned securities. Pursuant to the securities lending agreement, SSBT has provided indemnification to the Fund in the event of default by a borrower with respect to a loan. The Fund bears the risk of loss with respect to the investment of cash collateral. At December 31, 2019, the Fund had no securities on loan.
11 Fair Value Measurements
Under generally accepted accounting principles for fair value measurements, a three-tier hierarchy to prioritize the assumptions, referred to as inputs, is used in valuation techniques to measure fair value. The three-tier hierarchy of inputs is summarized in the three broad levels listed below.
| • | Level 1 – quoted prices in active markets for identical investments |
| • | Level 2 – other significant observable inputs (including quoted prices for similar investments, interest rates, prepayment speeds, credit risk, etc.) |
| • | Level 3 – significant unobservable inputs (including a fund’s own assumptions in determining the fair value of investments) |
In cases where the inputs used to measure fair value fall in different levels of the fair value hierarchy, the level disclosed is determined based on the lowest level input that is significant to the fair value measurement in its entirety. The inputs or methodology used for valuing securities are not necessarily an indication of the risk associated with investing in those securities.
At December 31, 2019, the hierarchy of inputs used in valuing the Fund’s investments, which are carried at value, were as follows:
| Asset Description | Level 1 | Level 2 | Level 3 | Total | ||||||||||||
Common Stocks | ||||||||||||||||
Communication Services | $ | 143,555,740 | $ | — | $ | — | $ | 143,555,740 | ||||||||
Consumer Discretionary | 112,892,685 | — | — | 112,892,685 | ||||||||||||
Consumer Staples | 150,666,786 | — | — | 150,666,786 | ||||||||||||
Energy | 144,811,096 | — | — | 144,811,096 | ||||||||||||
Financials | 389,016,937 | — | — | 389,016,937 | ||||||||||||
Health Care | 235,359,601 | 26,449,271 | — | 261,808,872 | ||||||||||||
Industrials | 161,326,020 | — | — | 161,326,020 | ||||||||||||
Information Technology | 88,764,508 | — | — | 88,764,508 | ||||||||||||
Materials | 62,251,033 | — | — | 62,251,033 | ||||||||||||
Real Estate | 85,773,962 | — | — | 85,773,962 | ||||||||||||
Utilities | 119,783,413 | — | — | 119,783,413 | ||||||||||||
Total Common Stocks | $ | 1,694,201,781 | $ | 26,449,271 | * | $ | — | $ | 1,720,651,052 | |||||||
Short-Term Investments | $ | — | $ | 2,748,856 | $ | — | $ | 2,748,856 | ||||||||
Total Investments | $ | 1,694,201,781 | $ | 29,198,127 | $ | — | $ | 1,723,399,908 | ||||||||
| * | Includes foreign equity securities whose values were adjusted to reflect market trading of comparable securities or other correlated instruments that occurred after the close of trading in their applicable foreign markets. |
| 24 |
Eaton Vance
Large-Cap Value Fund
December 31, 2019
Report of Independent Registered Public Accounting Firm
To the Trustees of Eaton Vance Special Investment Trust and Shareholders of Eaton VanceLarge-Cap Value Fund:
Opinion on the Financial Statements and Financial Highlights
We have audited the accompanying statement of assets and liabilities of Eaton VanceLarge-Cap Value Fund (the “Fund”) (one of the funds constituting Eaton Vance Special Investment Trust), including the portfolio of investments, as of December 31, 2019, the related statement of operations for the year then ended, the statements of changes in net assets for each of the two years in the period then ended, the financial highlights for each of the five years in the period then ended, and the related notes. In our opinion, the financial statements and financial highlights present fairly, in all material respects, the financial position of the Fund as of December 31, 2019, and the results of its operations for the year then ended, the changes in its net assets for each of the two years in the period then ended, and the financial highlights for each of the five years in the period then ended, in conformity with accounting principles generally accepted in the United States of America.
Basis for Opinion
These financial statements and financial highlights are the responsibility of the Fund’s management. Our responsibility is to express an opinion on the Fund’s financial statements and financial highlights based on our audits. We are a public accounting firm registered with the Public Company Accounting Oversight Board (United States) (PCAOB) and are required to be independent with respect to the Fund in accordance with the U.S. federal securities laws and the applicable rules and regulations of the Securities and Exchange Commission and the PCAOB.
We conducted our audits in accordance with the standards of the PCAOB. Those standards require that we plan and perform the audit to obtain reasonable assurance about whether the financial statements and financial highlights are free of material misstatement, whether due to error or fraud. The Fund is not required to have, nor were we engaged to perform, an audit of its internal control over financial reporting. As part of our audits we are required to obtain an understanding of internal control over financial reporting but not for the purpose of expressing an opinion on the effectiveness of the Fund’s internal control over financial reporting. Accordingly, we express no such opinion.
Our audits included performing procedures to assess the risks of material misstatement of the financial statements and financial highlights, whether due to error or fraud, and performing procedures that respond to those risks. Such procedures included examining, on a test basis, evidence regarding the amounts and disclosures in the financial statements and financial highlights. Our audits also included evaluating the accounting principles used and significant estimates made by management, as well as evaluating the overall presentation of the financial statements and financial highlights. Our procedures included confirmation of securities owned as of December 31, 2019, by correspondence with the custodian and brokers; when replies were not received from brokers, we performed other auditing procedures. We believe that our audits provide a reasonable basis for our opinion.
/s/ Deloitte & Touche LLP
Boston, Massachusetts
February 21, 2020
We have served as the auditor of one or more Eaton Vance investment companies since 1959.
| 25 |
Eaton Vance
Large-Cap Value Fund
December 31, 2019
Federal Tax Information (Unaudited)
The Form1099-DIV you received in February 2020 showed the tax status of all distributions paid to your account in calendar year 2019. Shareholders are advised to consult their own tax adviser with respect to the tax consequences of their investment in the Fund. As required by the Internal Revenue Code and/or regulations, shareholders must be notified regarding the status of qualified dividend income for individuals, the dividends received deduction for corporations and capital gains dividends.
Qualified Dividend Income. For the fiscal year ended December 31, 2019, the Fund designates approximately $36,177,366, or up to the maximum amount of such dividends allowable pursuant to the Internal Revenue Code, as qualified dividend income eligible for the reduced tax rate of 15%.
Dividends Received Deduction. Corporate shareholders are generally entitled to take the dividends received deduction on the portion of the Fund’s dividend distribution that qualifies under tax law. For the Fund’s fiscal 2019 ordinary income dividends, 100% qualifies for the corporate dividends received deduction.
Capital Gains Dividends. The Fund hereby designates as a capital gain dividend with respect to the taxable year ended December 31, 2019, $24,587,383 or, if subsequently determined to be different, the net capital gain of such year.
| 26 |
Eaton Vance
Large-Cap Value Fund
December 31, 2019
Management and Organization
Fund Management. The Trustees of Eaton Vance Special Investment Trust (the Trust) are responsible for the overall management and supervision of the Trust’s affairs. The Trustees and officers of the Trust are listed below. Except as indicated, each individual has held the office shown or other offices in the same company for the last five years. Trustees and officers of the Trust hold indefinite terms of office. The “noninterested Trustees” consist of those Trustees who are not “interested persons” of the Trust, as that term is defined under the 1940 Act. The business address of each Trustee and officer is Two International Place, Boston, Massachusetts 02110. As used below, “EVC” refers to Eaton Vance Corp., “EV” refers to Eaton Vance, Inc., “EVM” refers to Eaton Vance Management, “BMR” refers to Boston Management and Research and “EVD” refers to Eaton Vance Distributors, Inc. EVC and EV are the corporate parent and trustee, respectively, of EVM and BMR. EVD is the Fund’s principal underwriter and a wholly-owned subsidiary of EVC. Each officer affiliated with Eaton Vance may hold a position with other Eaton Vance affiliates that is comparable to his or her position with EVM listed below. Each Trustee oversees 159 portfolios in the Eaton Vance Complex (including all master and feeder funds in a master feeder structure). Each officer serves as an officer of certain other Eaton Vance funds. Each Trustee and officer serves until his or her successor is elected.
| Name and Year of Birth | Position(s) with the Trust | Trustee Since(1) | Principal Occupation(s) and Directorships During Past Five Years and Other Relevant Experience | |||
| Interested Trustee | ||||||
Thomas E. Faust Jr. 1958 | Trustee | 2007 | Chairman, Chief Executive Officer and President of EVC, Director and President of EV, Chief Executive Officer and President of EVM and BMR, and Director of EVD. Trustee and/or officer of 159 registered investment companies. Mr. Faust is an interested person because of his positions with EVM, BMR, EVD, EVC and EV, which are affiliates of the Trust. Directorships in the Last Five Years.Director of EVC and Hexavest Inc. (investment management firm). | |||
| Noninterested Trustees | ||||||
Mark R. Fetting 1954 | Trustee | 2016 | Private investor. Formerly held various positions at Legg Mason, Inc. (investment management firm) (2000-2012), including President, Chief Executive Officer, Director and Chairman (2008-2012), Senior Executive Vice President (2004-2008) and Executive Vice President (2001-2004). Formerly, President of Legg Mason family of funds (2001-2008). Formerly, Division President and Senior Officer of Prudential Financial Group, Inc. and related companies (investment management firm) (1991-2000). Other Directorships in the Last Five Years. None. | |||
Cynthia E. Frost 1961 | Trustee | 2014 | Private investor. Formerly, Chief Investment Officer of Brown University (university endowment) (2000-2012). Formerly, Portfolio Strategist for Duke Management Company (university endowment manager) (1995-2000). Formerly, Managing Director, Cambridge Associates (investment consulting company) (1989-1995). Formerly, Consultant, Bain and Company (management consulting firm) (1987-1989). Formerly, Senior Equity Analyst, BA Investment Management Company (1983-1985). Other Directorships in the Last Five Years.None. | |||
George J. Gorman 1952 | Trustee | 2014 | Principal at George J. Gorman LLC (consulting firm). Formerly, Senior Partner at Ernst & Young LLP (a registered public accounting firm) (1974-2009). Other Directorships in the Last Five Years.Formerly, Trustee of the BofA Funds Series Trust (11 funds) (2011-2014) and of the Ashmore Funds (9 funds) (2010-2014). | |||
Valerie A. Mosley 1960 | Trustee | 2014 | Chairwoman and Chief Executive Officer of Valmo Ventures (a consulting and investment firm). Former Partner and Senior Vice President, Portfolio Manager and Investment Strategist at Wellington Management Company, LLP (investment management firm) (1992-2012). Former Chief Investment Officer, PG Corbin Asset Management (1990-1992). Formerly worked in institutional corporate bond sales at Kidder Peabody (1986-1990). Other Directorships in the Last Five Years.Director of Envestnet, Inc. (provider of intelligent systems for wealth management and financial wellness) (since 2018). Director of Dynex Capital, Inc. (mortgage REIT) (since 2013). | |||
| 27 |
Eaton Vance
Large-Cap Value Fund
December 31, 2019
Management and Organization — continued
| Name and Year of Birth | Position(s) with the Trust | Trustee Since(1) | Principal Occupation(s) and Directorships During Past Five Years and Other Relevant Experience | |||
| Noninterested Trustees (continued) | ||||||
William H. Park 1947 | Chairperson of the Board and Trustee | 2016 (Chairperson) 2003 (Trustee) | Private investor. Formerly, Consultant (management and transactional)(2012-2014). Formerly, Chief Financial Officer, Aveon Group L.P. (investment management firm) (2010-2011). Formerly, Vice Chairman, Commercial Industrial Finance Corp. (specialty finance company) (2006-2010). Formerly, President and Chief Executive Officer, Prizm Capital Management, LLC (investment management firm) (2002-2005). Formerly, Executive Vice President and Chief Financial Officer, United Asset Management Corporation (investment management firm) (1982-2001). Formerly, Senior Manager, Price Waterhouse (now PricewaterhouseCoopers) (a registered public accounting firm)(1972-1981). Other Directorships in the Last Five Years.None. | |||
Helen Frame Peters 1948 | Trustee | 2008 | Professor of Finance, Carroll School of Management, Boston College. Formerly, Dean, Carroll School of Management, Boston College (2000-2002). Formerly, Chief Investment Officer, Fixed Income, Scudder Kemper Investments (investment management firm) (1998-1999). Formerly, Chief Investment Officer, Equity and Fixed Income, Colonial Management Associates (investment management firm) (1991-1998). Other Directorships in the Last Five Years. None. | |||
Keith Quinton 1958 | Trustee | 2018 | Independent Investment Committee Member at New Hampshire Retirement System (since 2017). Advisory Committee member at Northfield Information Services, Inc. (risk management analytics provider) (since 2016). Formerly, Portfolio Manager and Senior Quantitative Analyst at Fidelity Investments (investment management firm) (2001-2014). Other Directorships in the Last Five Years. Director of New Hampshire Municipal Bond Bank (since 2016). | |||
Marcus L. Smith 1966 | Trustee | 2018 | Member of Posse Boston Advisory Board (foundation) (since 2015). Trustee at University of Mount Union (since 2008). Formerly, Portfolio Manager at MFS Investment Management (investment management firm) (1994-2017). Other Directorships in the Last Five Years. Director of MSCI Inc. (global provider of investment decision support tools) (since 2017). Formerly, Director of DCT Industrial Trust Inc. (logistics real estate company) (2017-2018). | |||
Susan J. Sutherland 1957 | Trustee | 2015 | Private investor. Formerly, Associate, Counsel and Partner at Skadden, Arps, Slate, Meagher & Flom LLP (law firm) (1982-2013). Other Directorships in the Last Five Years. Formerly, Director of Montpelier Re Holdings Ltd. (global provider of customized insurance and reinsurance products) (2013-2015). | |||
Scott E. Wennerholm 1959 | Trustee | 2016 | Formerly, Trustee at Wheelock College (postsecondary institution) (2012-2018). Formerly, Consultant at GF Parish Group (executive recruiting firm) (2016-2017). Formerly, Chief Operating Officer and Executive Vice President at BNY Mellon Asset Management (investment management firm) (2005-2011). Formerly, Chief Operating Officer and Chief Financial Officer at Natixis Global Asset Management (investment management firm) (1997-2004). Formerly, Vice President at Fidelity Investments Institutional Services (investment management firm) (1994-1997). Other Directorships in the Last Five Years. None. | |||
| Name and Year of Birth | Position(s) with the Trust | Officer Since(2) | Principal Occupation(s) During Past Five Years | |||
| Principal Officers who are not Trustees | ||||||
Payson F. Swaffield 1956 | President of the Trust | 2003 | Vice President and Chief Income Investment Officer of EVM and BMR. Also Vice President of Calvert Research and Management (“CRM”). | |||
Maureen A. Gemma 1960 | Vice President, Secretary and Chief Legal Officer | 2005 | Vice President of EVM and BMR. Also Vice President of CRM. | |||
| 28 |
Eaton Vance
Large-Cap Value Fund
December 31, 2019
Management and Organization — continued
| Name and Year of Birth | Position(s) with the Trust | Officer Since(2) | Principal Occupation(s) During Past Five Years | |||
| Principal Officers who are not Trustees (continued) | ||||||
James F. Kirchner 1967 | Treasurer | 2007 | Vice President of EVM and BMR. Also Vice President of CRM. | |||
Richard F. Froio 1968 | Chief Compliance Officer | 2017 | Vice President of EVM and BMR since 2017. Formerly Deputy Chief Compliance Officer (Adviser/Funds) and Chief Compliance Officer (Distribution) at PIMCO (2012-2017) and Managing Director at BlackRock/Barclays Global Investors (2009-2012). | |||
| (1) | Year first appointed to serve as Trustee for a fund in the Eaton Vance family of funds. Each Trustee has served continuously since appointment unless indicated otherwise. |
| (2) | Year first elected to serve as officer of a fund in the Eaton Vance family of funds when the officer has served continuously. Otherwise, year of most recent election as an officer of a fund in the Eaton Vance family of funds. Titles may have changed since initial election. |
The SAI for the Fund includes additional information about the Trustees and officers of the Fund and can be obtained without charge on Eaton Vance’s website at www.eatonvance.com or by calling 1-800-262-1122.
| 29 |
Eaton Vance Funds
IMPORTANT NOTICES
Privacy. The Eaton Vance organization is committed to ensuring your financial privacy. Each entity listed below has adopted a privacy policy and procedures (“Privacy Program”) Eaton Vance believes is reasonably designed to protect your personal information and to govern when and with whom Eaton Vance may share your personal information.
| • | At the time of opening an account, Eaton Vance generally requires you to provide us with certain information such as name, address, social security number, tax status, account numbers, and account balances. This information is necessary for us to both open an account for you and to allow us to satisfy legal requirements such as applicable anti-money laundering reviews and know-your-customer requirements. |
| • | On an ongoing basis, in the normal course of servicing your account, Eaton Vance may share your information with unaffiliated third parties that perform various services for Eaton Vance and/or your account. These third parties include transfer agents, custodians, broker/dealers and our professional advisers, including auditors, accountants, and legal counsel. Eaton Vance may additionally share your personal information with our affiliates. |
| • | We believe our Privacy Program is reasonably designed to protect the confidentiality of your personal information and to prevent unauthorized access to that information. |
| • | We reserve the right to change our Privacy Program at any time upon proper notification to you. You may want to review our Privacy Program periodically for changes by accessing the link on our homepage: www.eatonvance.com. |
Our pledge of protecting your personal information applies to the following entities within the Eaton Vance organization: the Eaton Vance Family of Funds, Eaton Vance Management, Eaton Vance Investment Counsel, Eaton Vance Distributors, Inc., Eaton Vance Trust Company, Eaton Vance Management (International) Limited, Eaton Vance Advisers International Limited, Eaton Vance Global Advisors Limited, Eaton Vance Management’s Real Estate Investment Group, Boston Management and Research, Calvert Research and Management, and Calvert Funds. This Privacy Notice supersedes all previously issued privacy disclosures. For more information about our Privacy Program or about how your personal information may be used, please call1-800-262-1122.
Delivery of Shareholder Documents. The Securities and Exchange Commission (SEC) permits funds to deliver only one copy of shareholder documents, including prospectuses, proxy statements and shareholder reports, to fund investors with multiple accounts at the same residential or post office box address. This practice is often called “householding” and it helps eliminate duplicate mailings to shareholders.Eaton Vance, or your financial intermediary, may household the mailing of your documents indefinitely unless you instruct Eaton Vance, or your financial intermediary, otherwise.If you would prefer that your Eaton Vance documents not be householded, please contact Eaton Vance at1-800-262-1122, or contact your financial intermediary. Your instructions that householding not apply to delivery of your Eaton Vance documents will typically be effective within 30 days of receipt by Eaton Vance or your financial intermediary.
Portfolio Holdings. Each Eaton Vance Fund and its underlying Portfolio(s) (if applicable) files a schedule of portfolio holdings on Part F toForm N-PORT with the SEC for the first and third quarters of each fiscal year. The FormN-PORT will be available on the Eaton Vance website at www.eatonvance.com, by calling Eaton Vance at1-800-262-1122 or in the EDGAR database on the SEC’s website at www.sec.gov.
Proxy Voting. From time to time, funds are required to vote proxies related to the securities held by the funds. The Eaton Vance Funds or their underlying Portfolios (if applicable) vote proxies according to a set of policies and procedures approved by the Funds’ and Portfolios’ Boards. You may obtain a description of these policies and procedures and information on how the Funds or Portfolios voted proxies relating to portfolio securities during the most recent12-month period ended June 30, without charge, upon request, by calling1-800-262-1122 and by accessing the SEC’s website at www.sec.gov.
| 30 |
This Page Intentionally Left Blank
This Page Intentionally Left Blank
Investment Adviser
Boston Management and Research
Two International Place
Boston, MA 02110
Administrator
Eaton Vance Management
Two International Place
Boston, MA 02110
Principal Underwriter*
Eaton Vance Distributors, Inc.
Two International Place
Boston, MA 02110
(617)482-8260
Custodian
State Street Bank and Trust Company
State Street Financial Center, One Lincoln Street
Boston, MA 02111
Transfer Agent
BNY Mellon Investment Servicing (US) Inc.
Attn: Eaton Vance Funds
P.O. Box 9653
Providence, RI 02940-9653
(800)262-1122
Independent Registered Public Accounting Firm
Deloitte & Touche LLP
200 Berkeley Street
Boston, MA 02116-5022
Fund Offices
Two International Place
Boston, MA 02110
| * | FINRA BrokerCheck. Investors may check the background of their Investment Professional by contacting the Financial Industry Regulatory Authority (FINRA). FINRA BrokerCheck is a free tool to help investors check the professional background of current and former FINRA-registered securities firms and brokers. FINRA BrokerCheck is available by calling1-800-289-9999 and at www.FINRA.org. The FINRA BrokerCheck brochure describing this program is available to investors at www.FINRA.org. |

173 12.31.19

Eaton Vance
Real Estate Fund
Annual Report
December 31, 2019
Important Note. Beginning on January 1, 2021, as permitted by regulations adopted by the Securities and Exchange Commission, paper copies of the Fund’s annual and semi-annual shareholder reports will no longer be sent by mail unless you specifically request paper copies of the reports. Instead, the reports will be made available on the Fund’s website (eatonvance.com/funddocuments), and you will be notified by mail each time a report is posted and provided with a website address to access the report.
If you already elected to receive shareholder reports electronically, you will not be affected by this change and you need not take any action. If you are a direct investor, you may elect to receive shareholder reports and other communications from the Fund electronically by signing up fore-Delivery at eatonvance.com/edelivery. If you own your shares through a financial intermediary (such as a broker-dealer or bank), you must contact your financial intermediary to sign up.
You may elect to receive all future Fund shareholder reports in paper free of charge. If you are a direct investor, you can inform the Fund that you wish to continue receiving paper copies of your shareholder reports by calling1-800-262-1122. If you own these shares through a financial intermediary, you must contact your financial intermediary or follow instructions included with this disclosure, if applicable, to elect to continue to receive paper copies of your shareholder reports. Your election to receive reports in paper will apply to all Eaton Vance funds held directly or to all funds held through your financial intermediary, as applicable.

Commodity Futures Trading Commission Registration. Effective December 31, 2012, the Commodity Futures Trading Commission (“CFTC”) adopted certain regulatory changes that subject registered investment companies and advisers to regulation by the CFTC if a fund invests more than a prescribed level of its assets in certain CFTC-regulated instruments (including futures, certain options and swap agreements) or markets itself as providing investment exposure to such instruments. The Fund has claimed an exclusion from the definition of the term “commodity pool operator” under the Commodity Exchange Act. Accordingly, neither the Fund nor the adviser with respect to the operation of the Fund is subject to CFTC regulation. Because of its management of other strategies, the Fund’s adviser is registered with the CFTC as a commodity pool operator and a commodity trading advisor.
Fund shares are not insured by the FDIC and are not deposits or other obligations of, or guaranteed by, any depository institution. Shares are subject to investment risks, including possible loss of principal invested.
This report must be preceded or accompanied by a current summary prospectus or prospectus. Before investing, investors should consider carefully the investment objective, risks, and charges and expenses of a mutual fund. This and other important information is contained in the summary prospectus and prospectus, which can be obtained from a financial intermediary. Prospective investors should read the prospectus carefully before investing. For further information, please call1-800-262-1122.
Annual ReportDecember 31, 2019
Eaton Vance
Real Estate Fund
Table of Contents
Management’s Discussion of Fund Performance | 2 | |||
Performance | 3 | |||
Fund Profile | 4 | |||
Endnotes and Additional Disclosures | 5 | |||
Fund Expenses | 6 | |||
Financial Statements | 7 | |||
Report of Independent Registered Public Accounting Firm | 19 | |||
Federal Tax Information | 20 | |||
Management and Organization | 21 | |||
Important Notices | 24 | |||
Eaton Vance
Real Estate Fund
December 31, 2019
Management’s Discussion of Fund Performance1
Economic and Market Conditions
With virtually every U.S. equity index posting strong double-digit returns for the12-month period ended December 31, 2019 — and bond markets solidly in the black as well — 2019 was a good year for investments.
As the new year dawned in January 2019, investors appeared to be taking a “glass is half full” approach. Although U.S. manufacturing output and business investment remained weak — held back by slowing global growth and anon-again/off-again U.S.-China trade war — strong spending by U.S. consumers and dovish remarks by the U.S. Federal Reserve (the Fed) combined to lift investor sentiment. After four federal funds rate hikes the previous year, markets began to project the Fed might actually lower rates in 2019 to stimulate the economy. U.S. unemployment, meanwhile, remained low and hiring remained strong.
As a result, U.S. stocks across multiple markets climbed from January through April 2019. Overseas, central banks around the world began to cut interest rates and employ other tools to stimulate their respective economies. Even a global stock pullback in May — sparked by heightened concerns about the U.S.-China trade spat — proved to be temporary, and the U.S. and global stock rallies resumed in June and July.
After holding interest rates steady through the first half of the year, the Fed cut the federal funds rate on July 31,
2019 — its first reduction in over a decade — followed by two additional rate cuts in September and October to end the period at1.50%-1.75%. By end of the third quarter, 60 central banks around the world had lowered their interest rates as well.
After falling in August, U.S. equities rallied again during the final months of the period, spurred by optimism about a U.S.-China trade détente and better-than-expected U.S. employment reports. The year ended with two events in December that did much to allay investor concerns about international trade and tariffs: passage of the United States-Mexico-Canada Agreement by the U.S. House of Representatives and the Trump administration’s agreement to aso-called “phase–one” trade deal with China.
During the12-month period ended December 31, 2019, the blue-chip Dow Jones Industrial Average®2 returned 25.34%, while the broader U.S. equity market, as measured by the S&P 500® Index, returned 31.49%. The technology-laden Nasdaq Composite Index returned 36.69% during the period.Large-cap U.S. stocks, as measured by the S&P 500® Index, generally outperformed theirsmall-cap counterparts, as measured by the Russell 2000® Index. As a group, growth stocks outpaced value stocks in both large- andsmall-cap categories, as measured by the Russell growth and value indexes.
Fund Performance
For the12-month period ended December 31, 2019, Eaton Vance Real Estate Fund (the Fund) returned 23.99% for Class A shares at net asset value (NAV), outperforming its primary benchmark, the Dow Jones U.S. Select Real Estate Securities Index (the Index), which returned 23.10%.
The Fund outperformed the Index due to stock selection, as well as sector and industry allocations. All 10 property-type groups in the Fund had positive absolute returns during the period. The Index had positive returns in all eight of its industry groups.
Although slightly lagging the broader stock market, real estate investment trusts (REITs), which represented a majority of the Fund’s holdings during the period, delivered very strong results. REITs benefited from declining long-term interest rates during the period, as income-seeking investors were attracted by the higher payouts offered by REITs. REITs also benefited from favorable supply-demand balance across most markets and property types.
The hotels, resorts & cruise lines group, anout-of-Index holding, made the largest contribution to relative Fund performance versus the Index during the period. Leading hotel management and franchise companies Hilton Worldwide Holdings, Inc. and Marriott International, Inc. both outperformed amid strong growth in room counts for both companies and a favorable long-term outlook for the global lodging industry.
Another sector, the hotel & resort REIT property group also contributed to relative Fund results versus the Index due to an underweight position in this lagging sector. In particular, the Fund’s lack of exposure to Host Hotels & Resorts, Inc. benefited Fund results, as the stock performed poorly during the period.
The Fund’s underweight position in the health care sector boosted Fund performance relative to the Index. The sector delivered weak results largely due to excess supply in the senior living housing market. Within the group, the Fund’s underweight position in Ventas, Inc., a REIT focused on senior housing, medical office buildings, and other health care-related real estate, aided relative Fund results versus the Index.
Conversely, the industrial property-type group detracted from relative Fund performance due to a modest underweight in the outperforming sector versus the Index. In particular, an underweight in warehouse REIT ProLogis, Inc. constrained relative Fund results, as it outperformed the Index during the period.
See Endnotes and Additional Disclosures in this report.
Past performance is no guarantee of future results. Returns are historical and are calculated by determining the percentage change in net asset value (NAV) or offering price (as applicable) with all distributions reinvested. Investment return and principal value will fluctuate so that shares, when redeemed, may be worth more or less than their original cost. Performance for periods less than or equal to one year is cumulative. Performance is for the stated time period only; due to market volatility, current Fund performance may be lower or higher than the quoted return. For performance as of the most recentmonth-end, please refer to eatonvance.com.
| 2 |
Eaton Vance
Real Estate Fund
December 31, 2019
Performance2,3
Portfolio Manager J. Scott Craig
| % Average Annual Total Returns | Class Inception Date | Performance Inception Date | One Year | Five Years | Ten Years | |||||||||||||||
Class A at NAV | 06/09/2010 | 04/28/2006 | 23.99 | % | 6.53 | % | 11.31 | % | ||||||||||||
Class A with 5.75% Maximum Sales Charge | — | — | 16.84 | 5.27 | 10.65 | |||||||||||||||
Class I at NAV | 04/28/2006 | 04/28/2006 | 24.39 | 6.81 | 11.57 | |||||||||||||||
Dow Jones U.S. Select Real Estate Securities Index | — | — | 23.10 | % | 6.39 | % | 11.54 | % | ||||||||||||
S&P 500® Index | — | — | 31.49 | 11.69 | 13.55 | |||||||||||||||
| % Total Annual Operating Expense Ratios4 | Class A | Class I | ||||||||||||||||||
Gross | 1.41 | % | 1.16 | % | ||||||||||||||||
Net | 1.25 | 1.00 | ||||||||||||||||||
Growth of $10,0003
This graph shows the change in value of a hypothetical investment of $10,000 in Class A of the Fund for the period indicated. For comparison, the same investment is shown in the indicated index.
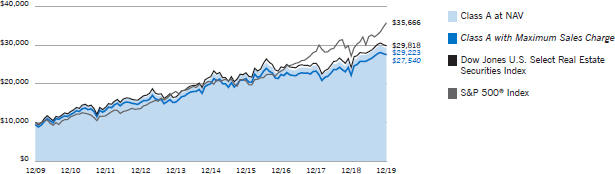
| Growth of Investment | Amount Invested | Period Beginning | At NAV | With Maximum Sales Charge | ||||||||||||
Class I | $ | 250,000 | 12/31/2009 | $ | 747,547 | N.A. | ||||||||||
See Endnotes and Additional Disclosures in this report.
Past performance is no guarantee of future results. Returns are historical and are calculated by determining the percentage change in net asset value (NAV) or offering price (as applicable) with all distributions reinvested. Investment return and principal value will fluctuate so that shares, when redeemed, may be worth more or less than their original cost. Performance for periods less than or equal to one year is cumulative. Performance is for the stated time period only; due to market volatility, current Fund performance may be lower or higher than the quoted return. For performance as of the most recentmonth-end, please refer to eatonvance.com.
| 3 |
Eaton Vance
Real Estate Fund
December 31, 2019
Fund Profile
Sector Allocation (% of net assets)5
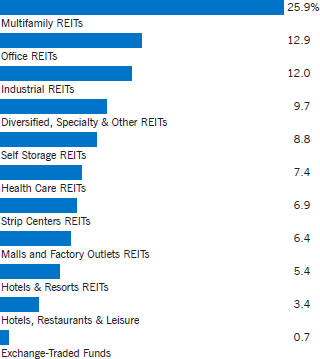
Top 10 Holdings (% of net assets)5
AvalonBay Communities, Inc. | 6.5 | % | ||
Simon Property Group, Inc. | 6.4 | |||
Equity Residential | 5.8 | |||
ProLogis, Inc. | 5.3 | |||
Public Storage | 4.5 | |||
Mid-America Apartment Communities, Inc. | 4.2 | |||
Boston Properties, Inc. | 3.8 | |||
Invitation Homes, Inc. | 3.5 | |||
Cousins Properties, Inc. | 2.7 | |||
CubeSmart | 2.6 | |||
Total | 45.3 | % | ||
See Endnotes and Additional Disclosures in this report.
| 4 |
Eaton Vance
Real Estate Fund
December 31, 2019
Endnotes and Additional Disclosures
| 1 | The views expressed in this report are those of the portfolio manager(s) and are current only through the date stated at the top of this page. These views are subject to change at any time based upon market or other conditions, and Eaton Vance and the Fund(s) disclaim any responsibility to update such views. These views may not be relied upon as investment advice and, because investment decisions are based on many factors, may not be relied upon as an indication of trading intent on behalf of any Eaton Vance fund. This commentary may contain statements that are not historical facts, referred to as “forward looking statements.” The Fund’s actual future results may differ significantly from those stated in any forward looking statement, depending on factors such as changes in securities or financial markets or general economic conditions, the volume of sales and purchases of Fund shares, the continuation of investment advisory, administrative and service contracts, and other risks discussed from time to time in the Fund’s filings with the Securities and Exchange Commission. |
| 2 | Dow Jones Industrial Average® is a price-weighted average of 30 blue-chip stocks that are generally the leaders in their industry. S&P 500® Index is an unmanaged index oflarge-cap stocks commonly used as a measure of U.S. stock market performance. Dow Jones U.S. Select Real Estate Securities Index is an unmanaged index of publicly traded real estate securities. S&P Dow Jones Indices are a product of S&P Dow Jones Indices LLC (“S&P DJI”) and have been licensed for use. S&P® and S&P 500® are registered trademarks of S&P DJI; Dow Jones® is a registered trademark of Dow Jones Trademark Holdings LLC (“Dow Jones”); S&P DJI, Dow Jones and their respective affiliates do not sponsor, endorse, sell or promote the Fund, will not have any liability with respect thereto and do not have any liability for any errors, omissions, or interruptions of the S&P Dow Jones Indices. Nasdaq Composite Index is a market capitalization-weighted index of all domestic and international securities listed on Nasdaq. Source: Nasdaq, Inc. The information is provided by Nasdaq (with its affiliates, are referred to as the “Corporations”) and Nasdaq’s third party licensors on an “as is” basis and the Corporations make no guarantees and bear no liability of any kind with respect to the information or the Fund. Russell 2000® Index is an unmanaged index of 2,000 U.S.small-cap stocks. Unless otherwise stated, index returns do not reflect the effect of any applicable sales charges, commissions, expenses, taxes or leverage, as applicable. It is not possible to invest directly in an index. |
| 3 | Total Returns at NAV do not include applicable sales charges. If sales charges were deducted, the returns would be lower. Total Returns shown with maximum sales charge reflect the stated maximum sales charge. Unless otherwise stated, performance does not reflect the deduction of taxes on Fund distributions or redemptions of Fund shares. |
Performance prior to the inception date of a class may be linked to the performance of an older class of the Fund. This linked performance is adjusted for any applicable sales charge, but is not adjusted for class expense differences. If adjusted for such differences, the performance would be different. The performance of Class A is linked to Class I. Performance presented in the Financial Highlights included in the financial statements is not linked. |
| 4 | Source: Fund prospectus. Net expense ratios reflect a contractual expense reimbursement that continues through 4/30/20. Without the reimbursement, performance would have been lower. The expense ratios for the current reporting period can be found in the Financial Highlights section of this report. |
| 5 | Excludes cash and cash equivalents. |
Fund profile subject to change due to active management. |
| 5 |
Eaton Vance
Real Estate Fund
December 31, 2019
Fund Expenses
Example: As a Fund shareholder, you incur two types of costs: (1) transaction costs, including sales charges (loads) on purchases and redemption fees (if applicable); and (2) ongoing costs, including management fees; distribution and/or service fees; and other Fund expenses. This Example is intended to help you understand your ongoing costs (in dollars) of Fund investing and to compare these costs with the ongoing costs of investing in other mutual funds. The Example is based on an investment of $1,000 invested at the beginning of the period and held for the entire period (July 1, 2019 – December 31, 2019).
Actual Expenses: The first section of the table below provides information about actual account values and actual expenses. You may use the information in this section, together with the amount you invested, to estimate the expenses that you paid over the period. Simply divide your account value by $1,000 (for example, an $8,600 account value divided by $1,000 = 8.6), then multiply the result by the number in the first section under the heading entitled “Expenses Paid During Period” to estimate the expenses you paid on your account during this period.
Hypothetical Example for Comparison Purposes: The second section of the table below provides information about hypothetical account values and hypothetical expenses based on the actual Fund expense ratio and an assumed rate of return of 5% per year (before expenses), which is not the actual Fund return. The hypothetical account values and expenses may not be used to estimate the actual ending account balance or expenses you paid for the period. You may use this information to compare the ongoing costs of investing in your Fund and other funds. To do so, compare this 5% hypothetical example with the 5% hypothetical examples that appear in the shareholder reports of the other funds.
Please note that the expenses shown in the table are meant to highlight your ongoing costs only and do not reflect any transactional costs, such as sales charges (loads) or redemption fees (if applicable). Therefore, the second section of the table is useful in comparing ongoing costs only, and will not help you determine the relative total costs of owning different funds. In addition, if these transactional costs were included, your costs would be higher.
| Beginning Account Value (7/1/19) | Ending Account Value (12/31/19) | Expenses Paid During Period* (7/1/19 – 12/31/19) | Annualized Expense Ratio | |||||||||||||
Actual | ||||||||||||||||
Class A | $ | 1,000.00 | $ | 1,050.80 | $ | 6.51 | ** | 1.26 | % | |||||||
Class I | $ | 1,000.00 | $ | 1,052.10 | $ | 5.22 | ** | 1.01 | % | |||||||
Hypothetical | ||||||||||||||||
(5% return per year before expenses) | ||||||||||||||||
Class A | $ | 1,000.00 | $ | 1,018.90 | $ | 6.41 | ** | 1.26 | % | |||||||
Class I | $ | 1,000.00 | $ | 1,020.10 | $ | 5.14 | ** | 1.01 | % | |||||||
| * | Expenses are equal to the Fund’s annualized expense ratio for the indicated Class, multiplied by the average account value over the period, multiplied by 184/365 (to reflect theone-half year period). The Example assumes that the $1,000 was invested at the net asset value per share determined at the close of business on June 30, 2019. |
| ** | Absent an allocation of certain expenses to an affiliate, expenses would be higher. |
| 6 |
Eaton Vance
Real Estate Fund
December 31, 2019
Portfolio of Investments
| Common Stocks — 98.8% |
| |||||||
| Security | Shares | Value | ||||||
| Hotels, Restaurants & Leisure — 3.4% | ||||||||
Hilton Worldwide Holdings, Inc. | 6,472 | $ | 717,810 | |||||
Marriott International, Inc., Class A | 4,624 | 700,212 | ||||||
| $ | 1,418,022 | |||||||
| Real Estate Investment Trusts — 95.4% |
| |||||||
| Security | Shares | Value | ||||||
| Diversified, Specialty & Other — 9.7% | ||||||||
CoreSite Realty Corp. | 7,927 | $ | 888,775 | |||||
Digital Realty Trust, Inc. | 4,132 | 494,765 | ||||||
Equinix, Inc. | 937 | 546,927 | ||||||
National Retail Properties, Inc. | 9,677 | 518,881 | ||||||
PS Business Parks, Inc. | 2,310 | 380,850 | ||||||
STORE Capital Corp. | 14,075 | 524,153 | ||||||
Vornado Realty Trust | 9,236 | 614,194 | ||||||
| $ | 3,968,545 | |||||||
| Health Care — 7.4% | ||||||||
Healthcare Realty Trust, Inc. | 15,994 | $ | 533,720 | |||||
Healthpeak Properties, Inc. | 19,643 | 677,094 | ||||||
Ventas, Inc. | 16,151 | 932,559 | ||||||
Welltower, Inc. | 10,844 | 886,822 | ||||||
| $ | 3,030,195 | |||||||
| Hotels & Resorts — 5.4% | ||||||||
Apple Hospitality REIT, Inc. | 29,600 | $ | 481,000 | |||||
DiamondRock Hospitality Co. | 37,910 | 420,043 | ||||||
Summit Hotel Properties, Inc. | 40,209 | 496,179 | ||||||
Sunstone Hotel Investors, Inc. | 59,850 | 833,112 | ||||||
| $ | 2,230,334 | |||||||
| Industrial — 12.0% | ||||||||
Duke Realty Corp. | 23,331 | $ | 808,886 | |||||
EastGroup Properties, Inc. | 3,959 | 525,240 | ||||||
First Industrial Realty Trust, Inc. | 18,055 | 749,463 | ||||||
ProLogis, Inc. | 24,548 | 2,188,209 | ||||||
Rexford Industrial Realty, Inc. | 9,245 | 422,219 | ||||||
Terreno Realty Corp. | 4,465 | 241,735 | ||||||
| $ | 4,935,752 | |||||||
| Malls and Factory Outlets — 6.4% | ||||||||
Simon Property Group, Inc. | 17,715 | $ | 2,638,827 | |||||
| $ | 2,638,827 | |||||||
| Security | Shares | Value | ||||||
| Multifamily — 25.9% | ||||||||
American Campus Communities, Inc. | 9,252 | $ | 435,122 | |||||
American Homes 4 Rent, Class A | 25,742 | 674,698 | ||||||
AvalonBay Communities, Inc. | 12,746 | 2,672,836 | ||||||
Camden Property Trust | 8,082 | 857,500 | ||||||
Equity Residential | 29,373 | 2,376,863 | ||||||
Essex Property Trust, Inc. | 1,497 | 450,387 | ||||||
Invitation Homes, Inc. | 47,900 | 1,435,563 | ||||||
Mid-America Apartment Communities, Inc. | 12,973 | 1,710,620 | ||||||
| $ | 10,613,589 | |||||||
| Office — 12.9% | ||||||||
Boston Properties, Inc. | 11,448 | $ | 1,578,221 | |||||
Corporate Office Properties Trust | 8,440 | 247,967 | ||||||
Cousins Properties, Inc. | 26,975 | 1,111,370 | ||||||
Douglas Emmett, Inc. | 9,332 | 409,675 | ||||||
Highwoods Properties, Inc. | 20,614 | 1,008,231 | ||||||
Hudson Pacific Properties, Inc. | 15,969 | 601,233 | ||||||
JBG Smith Properties | 7,970 | 317,923 | ||||||
| $ | 5,274,620 | |||||||
| Self Storage — 8.8% | ||||||||
CubeSmart | 33,922 | $ | 1,067,865 | |||||
Extra Space Storage, Inc. | 6,761 | 714,097 | ||||||
Public Storage | 8,597 | 1,830,817 | ||||||
| $ | 3,612,779 | |||||||
| Strip Centers — 6.9% | ||||||||
Acadia Realty Trust | 13,674 | $ | 354,567 | |||||
Brixmor Property Group, Inc. | 14,331 | 309,693 | ||||||
Federal Realty Investment Trust | 5,958 | 766,974 | ||||||
Kimco Realty Corp. | 17,454 | 361,472 | ||||||
Regency Centers Corp. | 12,480 | 787,363 | ||||||
SITE Centers Corp. | 17,500 | 245,350 | ||||||
| $ | 2,825,419 | |||||||
Total Real Estate Investment Trusts |
| $ | 39,130,060 | |||||
Total Common Stocks |
| $ | 40,548,082 | |||||
| 7 | See Notes to Financial Statements. |
Eaton Vance
Real Estate Fund
December 31, 2019
Portfolio of Investments — continued
| Exchange-Traded Funds — 0.7% | ||||||||
| Security | Shares | Value | ||||||
iShares U.S. Real Estate ETF | 2,938 | $ | 273,469 | |||||
Total Exchange-Traded Funds |
| $ | 273,469 | |||||
| Short-Term Investments — 0.2% | ||||||||
| Description | Units | Value | ||||||
Eaton Vance Cash Reserves Fund, LLC, 1.78%(1) | 80,949 | $ | 80,949 | |||||
Total Short-Term Investments |
| $ | 80,949 | |||||
Total Investments — 99.7% |
| $ | 40,902,500 | |||||
Other Assets, Less Liabilities — 0.3% |
| $ | 123,024 | |||||
Net Assets — 100.0% |
| $ | 41,025,524 | |||||
The percentage shown for each investment category in the Portfolio of Investments is based on net assets.
| (1) | Affiliated investment company, available to Eaton Vance portfolios and funds, which invests in high quality, U.S. dollar denominated money market instruments. The rate shown is the annualizedseven-day yield as of December 31, 2019. |
| 8 | See Notes to Financial Statements. |
Eaton Vance
Real Estate Fund
December 31, 2019
Statement of Assets and Liabilities
| Assets | December 31, 2019 | |||
Unaffiliated investments, at value (identified cost, $28,354,126) | $ | 40,821,551 | ||
Affiliated investment, at value (identified cost, $80,945) | 80,949 | |||
Dividends receivable | 194,422 | |||
Dividends receivable from affiliated investment | 226 | |||
Receivable for Fund shares sold | 36,729 | |||
Receivable from affiliate | 12,494 | |||
Total assets | $ | 41,146,371 | ||
| Liabilities |
| |||
Payable for Fund shares redeemed | $ | 18,969 | ||
Payable to affiliates: | ||||
Investment adviser fee | 22,408 | |||
Administration fee | 5,171 | |||
Distribution and service fees | 2,114 | |||
Trustees’ fees | 735 | |||
Accrued expenses | 71,450 | |||
Total liabilities | $ | 120,847 | ||
Net Assets | $ | 41,025,524 | ||
| Sources of Net Assets |
| |||
Paid-in capital | $ | 29,035,001 | ||
Distributable earnings | 11,990,523 | |||
Total | $ | 41,025,524 | ||
| Class A Shares |
| |||
Net Assets | $ | 9,862,409 | ||
Shares Outstanding | 641,489 | |||
Net Asset Value and Redemption Price Per Share | ||||
(net assets ÷ shares of beneficial interest outstanding) | $ | 15.37 | ||
Maximum Offering Price Per Share | ||||
(100 ÷ 94.25 of net asset value per share) | $ | 16.31 | ||
| Class I Shares |
| |||
Net Assets | $ | 31,163,115 | ||
Shares Outstanding | 2,027,455 | |||
Net Asset Value, Offering Price and Redemption Price Per Share | ||||
(net assets ÷ shares of beneficial interest outstanding) | $ | 15.37 | ||
On sales of $50,000 or more, the offering price of Class A shares is reduced.
| 9 | See Notes to Financial Statements. |
Eaton Vance
Real Estate Fund
December 31, 2019
Statement of Operations
| Investment Income | Year Ended December 31, 2019 | |||
Dividends | $ | 1,346,057 | ||
Dividends from affiliated investment | 4,295 | |||
Total investment income | $ | 1,350,352 | ||
| Expenses |
| |||
Investment adviser fee | $ | 305,708 | ||
Administration fee | 70,548 | |||
Distribution and service fees | ||||
Class A | 25,145 | |||
Trustees’ fees and expenses | 3,226 | |||
Custodian fee | 27,893 | |||
Transfer and dividend disbursing agent fees | 47,464 | |||
Legal and accounting services | 46,288 | |||
Printing and postage | 17,766 | |||
Registration fees | 27,186 | |||
Interest expense | 6,288 | |||
Miscellaneous | 12,275 | |||
Total expenses | $ | 589,787 | ||
Deduct — | ||||
Allocation of expenses to affiliate | $ | 88,034 | ||
Total expense reductions | $ | 88,034 | ||
Net expenses | $ | 501,753 | ||
Net investment income | $ | 848,599 | ||
| Realized and Unrealized Gain (Loss) |
| |||
Net realized gain (loss) — | ||||
Investment transactions | $ | 1,336,965 | ||
Investment transactions — affiliated investment | 12 | |||
Capital gain distributions received | 380,221 | |||
Net realized gain | $ | 1,717,198 | ||
Change in unrealized appreciation (depreciation) — | ||||
Investments | $ | 7,561,990 | ||
Investments — affiliated investment | 4 | |||
Net change in unrealized appreciation (depreciation) | $ | 7,561,994 | ||
Net realized and unrealized gain | $ | 9,279,192 | ||
Net increase in net assets from operations | $ | 10,127,791 | ||
| 10 | See Notes to Financial Statements. |
Eaton Vance
Real Estate Fund
December 31, 2019
Statements of Changes in Net Assets
| Year Ended December 31, | ||||||||
| Increase (Decrease) in Net Assets | 2019 | 2018 | ||||||
From operations — | ||||||||
Net investment income | $ | 848,599 | $ | 1,097,794 | ||||
Net realized gain | 1,717,198 | 85,216 | ||||||
Net change in unrealized appreciation (depreciation) | 7,561,994 | (2,929,899 | ) | |||||
Net increase (decrease) in net assets from operations | $ | 10,127,791 | $ | (1,746,889 | ) | |||
Distributions to shareholders — | ||||||||
Class A | $ | (417,371 | ) | $ | (261,715 | ) | ||
Class I | (1,473,075 | ) | (1,368,966 | ) | ||||
Total distributions to shareholders | $ | (1,890,446 | ) | $ | (1,630,681 | ) | ||
Transactions in shares of beneficial interest — | ||||||||
Proceeds from sale of shares | ||||||||
Class A | $ | 1,451,704 | $ | 1,877,008 | ||||
Class I | 7,485,217 | 26,287,130 | ||||||
Net asset value of shares issued to shareholders in payment of distributions declared | ||||||||
Class A | 417,271 | 261,497 | ||||||
Class I | 1,463,391 | 1,315,399 | ||||||
Cost of shares redeemed | ||||||||
Class A | (2,859,584 | ) | (3,919,114 | ) | ||||
Class I | (29,218,017 | ) | (16,502,409 | ) | ||||
Net increase (decrease) in net assets from Fund share transactions | $ | (21,260,018 | ) | $ | 9,319,511 | |||
Net increase (decrease) in net assets | $ | (13,022,673 | ) | $ | 5,941,941 | |||
| Net Assets |
| |||||||
At beginning of year | $ | 54,048,197 | $ | 48,106,256 | ||||
At end of year | $ | 41,025,524 | $ | 54,048,197 | ||||
| 11 | See Notes to Financial Statements. |
Eaton Vance
Real Estate Fund
December 31, 2019
Financial Highlights
| Class A | ||||||||||||||||||||
| Year Ended December 31, | ||||||||||||||||||||
| 2019 | 2018 | 2017 | 2016 | 2015 | ||||||||||||||||
Net asset value — Beginning of year | $ | 12.930 | $ | 13.930 | $ | 13.700 | $ | 13.790 | $ | 14.030 | ||||||||||
| Income (Loss) From Operations |
| |||||||||||||||||||
Net investment income(1) | $ | 0.249 | $ | 0.237 | $ | 0.199 | $ | 0.158 | $ | 0.192 | ||||||||||
Net realized and unrealized gain (loss) | 2.839 | (0.870 | ) | 0.333 | 0.518 | 0.660 | ||||||||||||||
Total income (loss) from operations | $ | 3.088 | $ | (0.633 | ) | $ | 0.532 | $ | 0.676 | $ | 0.852 | |||||||||
| Less Distributions |
| |||||||||||||||||||
From net investment income | $ | (0.249 | ) | $ | (0.246 | ) | $ | (0.212 | ) | $ | (0.226 | ) | $ | (0.227 | ) | |||||
From net realized gain | (0.399 | ) | (0.121 | ) | (0.090 | ) | (0.540 | ) | (0.865 | ) | ||||||||||
Total distributions | $ | (0.648 | ) | $ | (0.367 | ) | $ | (0.302 | ) | $ | (0.766 | ) | $ | (1.092 | ) | |||||
Net asset value — End of year | $ | 15.370 | $ | 12.930 | $ | 13.930 | $ | 13.700 | $ | 13.790 | ||||||||||
Total Return(2)(3) | 23.99 | % | (4.61 | )% | 3.93 | % | 4.94 | % | 6.40 | % | ||||||||||
| Ratios/Supplemental Data |
| |||||||||||||||||||
Net assets, end of year (000’s omitted) | $ | 9,862 | $ | 9,169 | $ | 11,766 | $ | 21,078 | $ | 21,880 | ||||||||||
Ratios (as a percentage of average daily net assets): | ||||||||||||||||||||
Expenses(3) | 1.26 | %(4) | 1.25 | % | 1.25 | % | 1.25 | % | 1.25 | % | ||||||||||
Net investment income | 1.64 | % | 1.76 | % | 1.45 | % | 1.13 | % | 1.38 | % | ||||||||||
Portfolio Turnover | 18 | % | 35 | % | 36 | % | 52 | % | 72 | % | ||||||||||
| (1) | Computed using average shares outstanding. |
| (2) | Returns are historical and are calculated by determining the percentage change in net asset value with all distributions reinvested and do not reflect the effect of sales charges. |
| (3) | The administrator reimbursed certain operating expenses (equal to 0.19%, 0.16%, 0.17%, 0.23% and 0.30% of average daily net assets for the years ended December 31, 2019, 2018, 2017, 2016 and 2015, respectively). Absent this reimbursement, total return would be lower. |
| (4) | Includes interest expense of 0.01% for the year ended December 31, 2019. |
| 12 | See Notes to Financial Statements. |
Eaton Vance
Real Estate Fund
December 31, 2019
Financial Highlights — continued
| Class I | ||||||||||||||||||||
| Year Ended December 31, | ||||||||||||||||||||
| 2019 | 2018 | 2017 | 2016 | 2015 | ||||||||||||||||
Net asset value — Beginning of year | $ | 12.920 | $ | 13.930 | $ | 13.700 | $ | 13.800 | $ | 14.030 | ||||||||||
| Income (Loss) From Operations |
| |||||||||||||||||||
Net investment income(1) | $ | 0.280 | $ | 0.286 | $ | 0.271 | $ | 0.200 | $ | 0.192 | ||||||||||
Net realized and unrealized gain (loss) | 2.856 | (0.894 | ) | 0.301 | 0.501 | 0.703 | ||||||||||||||
Total income (loss) from operations | $ | 3.136 | $ | (0.608 | ) | $ | 0.572 | $ | 0.701 | $ | 0.895 | |||||||||
| Less Distributions |
| |||||||||||||||||||
From net investment income | $ | (0.287 | ) | $ | (0.281 | ) | $ | (0.252 | ) | $ | (0.261 | ) | $ | (0.260 | ) | |||||
From net realized gain | (0.399 | ) | (0.121 | ) | (0.090 | ) | (0.540 | ) | (0.865 | ) | ||||||||||
Total distributions | $ | (0.686 | ) | $ | (0.402 | ) | $ | (0.342 | ) | $ | (0.801 | ) | $ | (1.125 | ) | |||||
Net asset value — End of year | $ | 15.370 | $ | 12.920 | $ | 13.930 | $ | 13.700 | $ | 13.800 | ||||||||||
Total Return(2)(3) | 24.39 | % | (4.43 | )% | 4.23 | % | 5.12 | % | 6.73 | % | ||||||||||
| Ratios/Supplemental Data |
| |||||||||||||||||||
Net assets, end of year (000’s omitted) | $ | 31,163 | $ | 44,879 | $ | 36,340 | $ | 25,930 | $ | 17,044 | ||||||||||
Ratios (as a percentage of average daily net assets): | ||||||||||||||||||||
Expenses(3) | 1.01 | %(4) | 1.00 | % | 1.00 | % | 1.00 | % | 1.00 | % | ||||||||||
Net investment income | 1.85 | % | 2.12 | % | 1.97 | % | 1.43 | % | 1.37 | % | ||||||||||
Portfolio Turnover | 18 | % | 35 | % | 36 | % | 52 | % | 72 | % | ||||||||||
| (1) | Computed using average shares outstanding. |
| (2) | Returns are historical and are calculated by determining the percentage change in net asset value with all distributions reinvested. |
| (3) | The administrator reimbursed certain operating expenses (equal to 0.19%, 0.16%, 0.17%, 0.23% and 0.30% of average daily net assets for the years ended December 31, 2019, 2018, 2017, 2016 and 2015, respectively). Absent this reimbursement, total return would be lower. |
| (4) | Includes interest expense of 0.01% for the year ended December 31, 2019. |
| 13 | See Notes to Financial Statements. |
Eaton Vance
Real Estate Fund
December 31, 2019
Notes to Financial Statements
1 Significant Accounting Policies
Eaton Vance Real Estate Fund (the Fund) is anon-diversified series of Eaton Vance Special Investment Trust (the Trust). The Trust is a Massachusetts business trust registered under the Investment Company Act of 1940, as amended (the 1940 Act), as anopen-end management investment company. The Fund’s investment objective is to seek total return. The Fund offers two classes of shares. Class A shares are generally sold subject to a sales charge imposed at time of purchase. Class I shares are sold at net asset value and are not subject to a sales charge. Each class represents apro-rata interest in the Fund, but votes separately on class-specific matters and (as noted below) is subject to different expenses. Realized and unrealized gains and losses and net investment income and losses, other than class-specific expenses, are allocated daily to each class of shares based on the relative net assets of each class to the total net assets of the Fund. Each class of shares differs in its distribution plan and certain other class-specific expenses.
The following is a summary of significant accounting policies of the Fund. The policies are in conformity with accounting principles generally accepted in the United States of America (U.S. GAAP). The Fund is an investment company and follows accounting and reporting guidance in the Financial Accounting Standards Board (FASB) Accounting Standards Codification Topic 946.
A Investment Valuation — The following methodologies are used to determine the market value or fair value of investments.
Equity Securities.Equity securities listed on a U.S. securities exchange generally are valued at the last sale or closing price on the day of valuation or, if no sales took place on such date, at the mean between the closing bid and ask prices on the exchange where such securities are principally traded. Equity securities listed on the NASDAQ Global or Global Select Market generally are valued at the NASDAQ official closing price. Unlisted or listed securities for which closing sales prices or closing quotations are not available are valued at the mean between the latest available bid and ask prices.
Affiliated Fund.The Fund may invest in Eaton Vance Cash Reserves Fund, LLC (Cash Reserves Fund), an affiliated investment company managed by Eaton Vance Management (EVM). While Cash Reserves Fund is not a registered money market mutual fund, it conducts all of its investment activities in accordance with the requirements of Rule2a-7 under the 1940 Act. Investments in Cash Reserves Fund are valued at the closing net asset value per unit on the valuation day. Cash Reserves Fund generally values its investment securities based on available market quotations provided by a third party pricing service.
Fair Valuation.Investments for which valuations or market quotations are not readily available or are deemed unreliable are valued at fair value using methods determined in good faith by or at the direction of the Trustees of the Fund in a manner that most fairly reflects the security’s “fair value”, which is the amount that the Fund might reasonably expect to receive for the security upon its current sale in the ordinary course. Each such determination is based on a consideration of relevant factors, which are likely to vary from one pricing context to another. These factors may include, but are not limited to, the type of security, the existence of any contractual restrictions on the security’s disposition, the price and extent of public trading in similar securities of the issuer or of comparable companies or entities, quotations or relevant information obtained from broker/dealers or other market participants, information obtained from the issuer, analysts, and/or the appropriate stock exchange (for exchange-traded securities), an analysis of the company’s or entity’s financial statements, and an evaluation of the forces that influence the issuer and the market(s) in which the security is purchased and sold.
B Investment Transactions — Investment transactions for financial statement purposes are accounted for on a trade date basis. Realized gains and losses on investments sold are determined on the basis of identified cost.
C Income — Dividend income is recorded on theex-dividend date for dividends received in cash and/or securities. Dividends from real estate investment trusts (REITs) and distributions from investment companies are recorded as income, capital gains or return of capital based on the nature of the distribution.
D Federal Taxes — The Fund’s policy is to comply with the provisions of the Internal Revenue Code applicable to regulated investment companies and to distribute to shareholders each year substantially all of its net investment income, and all or substantially all of its net realized capital gains. Accordingly, no provision for federal income or excise tax is necessary.
As of December 31, 2019, the Fund had no uncertain tax positions that would require financial statement recognition,de-recognition, or disclosure. The Fund files a U.S. federal income tax return annually after its fiscalyear-end, which is subject to examination by the Internal Revenue Service for a period of three years from the date of filing.
E Expenses — The majority of expenses of the Trust are directly identifiable to an individual fund. Expenses which are not readily identifiable to a specific fund are allocated taking into consideration, among other things, the nature and type of expense and the relative size of the funds.
F Use of Estimates — The preparation of the financial statements in conformity with U.S. GAAP requires management to make estimates and assumptions that affect the reported amounts of assets and liabilities at the date of the financial statements and the reported amounts of income and expense during the reporting period. Actual results could differ from those estimates.
G Indemnifications — Under the Trust’s organizational documents, its officers and Trustees may be indemnified against certain liabilities and expenses arising out of the performance of their duties to the Fund. Under Massachusetts law, if certain conditions prevail, shareholders of a Massachusetts business trust (such as the Trust) could be deemed to have personal liability for the obligations of the Trust. However, the Trust’s Declaration of Trust contains an express disclaimer of liability on the part of Fund shareholders and theBy-laws provide that the Trust shall assume, upon request by the shareholder, the defense on behalf of any Fund shareholders. Moreover, theBy-laws also provide for indemnification out of Fund property of any shareholder held personally
| 14 |
Eaton Vance
Real Estate Fund
December 31, 2019
Notes to Financial Statements — continued
liable solely by reason of being or having been a shareholder for all loss or expense arising from such liability. Additionally, in the normal course of business, the Fund enters into agreements with service providers that may contain indemnification clauses. The Fund’s maximum exposure under these arrangements is unknown as this would involve future claims that may be made against the Fund that have not yet occurred.
2 Distributions to Shareholders and Income Tax Information
It is the present policy of the Fund to make at least quarterly distributions of substantially all of the distributions it receives from its REIT investments, less expenses, as well as income from other investments. Such distributions may be comprised of income, return of capital, and capital gains. The Fund may also realize capital gains on the sale of its REIT shares and other investments. Distributions of these gains, if any, will be made annually. In addition, the Fund may occasionally be required to make supplemental distributions at some other time during the year. Distributions to shareholders are recorded on theex-dividend date. Distributions are declared separately for each class of shares. Shareholders may reinvest income and capital gain distributions in additional shares of the same class of the Fund at the net asset value as of theex-dividend date or, at the election of the shareholder, receive distributions in cash. Distributions to shareholders are determined in accordance with income tax regulations, which may differ from U.S. GAAP. As required by U.S. GAAP, only distributions in excess of tax basis earnings and profits are reported in the financial statements as a return of capital. Permanent differences between book and tax accounting relating to distributions are reclassified topaid-in capital. For tax purposes, distributions from short-term capital gains are considered to be from ordinary income.
The tax character of distributions declared for the years ended December 31, 2019 and December 31, 2018 was as follows:
| Year Ended December 31, | ||||||||
| 2019 | 2018 | |||||||
Ordinary income | $ | 850,326 | $ | 1,322,533 | ||||
Long-term capital gains | $ | 1,040,120 | $ | 308,148 | ||||
During the year ended December 31, 2019, distributable earnings was decreased by $227,799 andpaid-in capital was increased by $227,799 due to the Fund’s use of equalization accounting and differences between book and tax accounting. Tax equalization accounting allows the Fund to treat as a distribution that portion of redemption proceeds representing a redeeming shareholder’s portion of undistributed taxable income and net capital gains. These reclassifications had no effect on the net assets or net asset value per share of the Fund.
As of December 31, 2019, the components of distributable earnings (accumulated loss) on a tax basis were as follows:
Undistributed long-term capital gains | $ | 94,622 | ||
Net unrealized appreciation | $ | 11,895,901 | ||
The cost and unrealized appreciation (depreciation) of investments of the Fund at December 31, 2019, as determined on a federal income tax basis, were as follows:
Aggregate cost | $ | 29,006,599 | ||
Gross unrealized appreciation | $ | 11,951,299 | ||
Gross unrealized depreciation | (55,398 | ) | ||
Net unrealized appreciation | $ | 11,895,901 | ||
3 Investment Adviser Fee and Other Transactions with Affiliates
The investment adviser fee is earned by EVM as compensation for management and investment advisory services rendered to the Fund. The fee is computed at an annual rate of 0.65% of the Fund’s average daily net assets and is payable monthly. For the year ended December 31, 2019, the Fund’s investment adviser fee amounted to $305,708. The Fund invests its cash in Cash Reserves Fund. EVM does not currently receive a fee for advisory services provided to Cash Reserves Fund. The administration fee is earned by EVM for administering the business affairs of the Fund and is computed at an annual rate of 0.15% of the Fund’s average daily net assets. For the year ended December 31, 2019, the administration fee amounted to $70,548. EVM has agreed to reimburse the Fund’s expenses to the extent that total annual operating expenses (relating to ordinary operating expenses only and excluding expenses such as brokerage commissions, acquired fund fees and expenses of unaffiliated funds, borrowing costs, taxes or litigation expenses)
| 15 |
Eaton Vance
Real Estate Fund
December 31, 2019
Notes to Financial Statements — continued
exceed 1.25% and 1.00% of the Fund’s average daily net assets for Class A and Class I, respectively. This agreement may be changed or terminated after April 30, 2020. Pursuant to this agreement, EVM was allocated $88,034of the Fund’s operating expenses for the year ended December 31, 2019.
EVM providessub-transfer agency and related services to the Fund pursuant to aSub-Transfer Agency Support Services Agreement. For the year ended December 31, 2019, EVM earned $4,273 from the Fund pursuant to such agreement, which is included in transfer and dividend disbursing agent fees on the Statement of Operations. The Fund was informed that Eaton Vance Distributors, Inc. (EVD), an affiliate of EVM and the Fund’s principal underwriter, received $1,387 as its portion of the sales charge on sales of Class A shares for the year ended December 31, 2019. EVD also received distribution and service fees from Class A (see Note 4).
Trustees and officers of the Fund who are members of EVM’s organization receive remuneration for their services to the Fund out of the investment adviser fee. Trustees of the Fund who are not affiliated with the investment adviser may elect to defer receipt of all or a percentage of their annual fees in accordance with the terms of the Trustees Deferred Compensation Plan. For the year ended December 31, 2019, no significant amounts have been deferred. Certain officers and Trustees of the Fund are officers of EVM.
4 Distribution Plan
The Fund has in effect a distribution plan for Class A shares (Class A Plan) pursuant to Rule12b-1 under the 1940 Act. Pursuant to the Class A Plan, the Fund pays EVD a distribution and service fee of 0.25% per annum of its average daily net assets attributable to Class A shares for distribution services and facilities provided to the Fund by EVD, as well as for personal services and/or the maintenance of shareholder accounts. Distribution and service fees paid or accrued to EVD for the year ended December 31, 2019 amounted to $25,145 for Class A shares.
Distribution and service fees are subject to the limitations contained in the Financial Industry Regulatory Authority Rule 2341(d).
5 Contingent Deferred Sales Charges
Class A shares may be subject to a 1% contingent deferred sales charge (CDSC) if redeemed within 18 months of purchase (depending on the circumstances of purchase). Generally, the CDSC is based upon the lower of the net asset value at date of redemption or date of purchase. No charge is levied on shares acquired by reinvestment of dividends or capital gain distributions. For the year ended December 31, 2019, the Fund was informed that EVD received no CDSCs paid by Class A shareholders.
6 Purchases and Sales of Investments
Purchases and sales of investments, other than short-term obligations, aggregated $8,556,871 and $30,319,968, respectively, for the year ended December 31, 2019.
7 Shares of Beneficial Interest
The Fund’s Declaration of Trust permits the Trustees to issue an unlimited number of full and fractional shares of beneficial interest (without par value). Such shares may be issued in a number of different series (such as the Fund) and classes. Transactions in Fund shares were as follows:
| Year Ended December 31, | ||||||||
| Class A | 2019 | 2018 | ||||||
Sales | 94,334 | 138,910 | ||||||
Issued to shareholders electing to receive payments of distributions in Fund shares | 27,415 | 19,567 | ||||||
Redemptions | (189,489 | ) | (293,811 | ) | ||||
Net decrease | (67,740 | ) | (135,334 | ) | ||||
| 16 |
Eaton Vance
Real Estate Fund
December 31, 2019
Notes to Financial Statements — continued
| Year Ended December 31, | ||||||||
| Class I | 2019 | 2018 | ||||||
Sales | 496,679 | 1,998,237 | ||||||
Issued to shareholders electing to receive payments of distributions in Fund shares | 96,149 | 98,358 | ||||||
Redemptions | (2,037,689 | ) | (1,233,071 | ) | ||||
Net increase (decrease) | (1,444,861 | ) | 863,524 | |||||
8 Line of Credit
The Fund participates with other portfolios and funds managed by EVM and its affiliates in an $800 million unsecured line of credit agreement with a group of banks, which is in effect through October 27, 2020. In connection with the renewal of the agreement on October 29, 2019, funds managed by Calvert Research and Management, an affiliate of EVM, were added as participating funds to the agreement and the borrowing limit was increased from $625 million. Borrowings are made by the Fund solely to facilitate the handling of unusual and/or unanticipated short-term cash requirements. Interest is charged to the Fund based on its borrowings at an amount above either the Eurodollar rate or Federal Funds rate. In addition, a fee computed at an annual rate of 0.15% on the daily unused portion of the line of credit is allocated among the participating portfolios and funds at the end of each quarter. Because the line of credit is not available exclusively to the Fund, it may be unable to borrow some or all of its requested amounts at any particular time. Average borrowings and the average interest rate (excluding fees) for the year ended December 31, 2019 were $188,493 and 3.34%, respectively.
9 Concentration of Risk
In accordance with the Fund’s strategy, under normal market conditions, the Fund’s investments are concentrated in equity securities of companies primarily engaged in the real estate industry, such as REITs and other real estate-related investments. Securities of companies in the real estate industry are subject to special risks including changes in real estate values, property taxes, interest rates, cash flow of underlying real estate assets, occupancy rates, government regulations affecting zoning, land use and rents, and the management skill and creditworthiness of the issuer.
10 Investments in Affiliated Funds
At December 31, 2019, the value of the Fund’s investment in affiliated funds was $80,949, which represents 0.2% of the Fund’s net assets. Transactions in affiliated funds by the Fund for the year ended December 31, 2019 were as follows:
| Name of affiliated fund | Value, beginning of period | Purchases | Sales proceeds | Net realized gain (loss) | Change in unrealized appreciation (depreciation) | Value, end of period | Dividend income | Units, end of period | ||||||||||||||||||||||||
Short-Term Investments | ||||||||||||||||||||||||||||||||
Eaton Vance Cash Reserves Fund, LLC, 1.78% | $ | 130,262 | $ | 7,783,420 | $ | (7,832,749 | ) | $ | 12 | $ | 4 | $ | 80,949 | $ | 4,295 | 80,949 | ||||||||||||||||
11 Fair Value Measurements
Under generally accepted accounting principles for fair value measurements, a three-tier hierarchy to prioritize the assumptions, referred to as inputs, is used in valuation techniques to measure fair value. The three-tier hierarchy of inputs is summarized in the three broad levels listed below.
| • | Level 1 – quoted prices in active markets for identical investments |
| • | Level 2 – other significant observable inputs (including quoted prices for similar investments, interest rates, prepayment speeds, credit risk, etc.) |
| • | Level 3 – significant unobservable inputs (including a fund’s own assumptions in determining the fair value of investments) |
In cases where the inputs used to measure fair value fall in different levels of the fair value hierarchy, the level disclosed is determined based on the lowest level input that is significant to the fair value measurement in its entirety. The inputs or methodology used for valuing securities are not necessarily an indication of the risk associated with investing in those securities.
| 17 |
Eaton Vance
Real Estate Fund
December 31, 2019
Notes to Financial Statements — continued
At December 31, 2019, the hierarchy of inputs used in valuing the Fund’s investments, which are carried at value, were as follows:
| Asset Description | Level 1 | Level 2 | Level 3 | Total | ||||||||||||
Common Stocks | $ | 40,548,082 | * | $ | — | $ | — | $ | 40,548,082 | |||||||
Exchange-Traded Funds | 273,469 | — | — | 273,469 | ||||||||||||
Short-Term Investments | — | 80,949 | — | 80,949 | ||||||||||||
Total Investments | $ | 40,821,551 | $ | 80,949 | $ | — | $ | 40,902,500 | ||||||||
| * | The level classification by major category of investments is the same as the category presentation in the Portfolio of Investments. |
| 18 |
Eaton Vance
Real Estate Fund
December 31, 2019
Report of Independent Registered Public Accounting Firm
To the Trustees of Eaton Vance Special Investment Trust and Shareholders of Eaton Vance Real Estate Fund:
Opinion on the Financial Statements and Financial Highlights
We have audited the accompanying statement of assets and liabilities of Eaton Vance Real Estate Fund (the “Fund”) (one of the funds constituting Eaton Vance Special Investment Trust), including the portfolio of investments, as of December 31, 2019, the related statement of operations for the year then ended, the statements of changes in net assets for each of the two years in the period then ended, the financial highlights for each of the five years in the period then ended, and the related notes. In our opinion, the financial statements and financial highlights present fairly, in all material respects, the financial position of the Fund as of December 31, 2019, and the results of its operations for the year then ended, the changes in its net assets for each of the two years in the period then ended, and the financial highlights for each of the five years in the period then ended, in conformity with accounting principles generally accepted in the United States of America.
Basis for Opinion
These financial statements and financial highlights are the responsibility of the Fund’s management. Our responsibility is to express an opinion on the Fund’s financial statements and financial highlights based on our audits. We are a public accounting firm registered with the Public Company Accounting Oversight Board (United States) (PCAOB) and are required to be independent with respect to the Fund in accordance with the U.S. federal securities laws and the applicable rules and regulations of the Securities and Exchange Commission and the PCAOB.
We conducted our audits in accordance with the standards of the PCAOB. Those standards require that we plan and perform the audit to obtain reasonable assurance about whether the financial statements and financial highlights are free of material misstatement, whether due to error or fraud. The Fund is not required to have, nor were we engaged to perform, an audit of its internal control over financial reporting. As part of our audits we are required to obtain an understanding of internal control over financial reporting but not for the purpose of expressing an opinion on the effectiveness of the Fund’s internal control over financial reporting. Accordingly, we express no such opinion.
Our audits included performing procedures to assess the risks of material misstatement of the financial statements and financial highlights, whether due to error or fraud, and performing procedures that respond to those risks. Such procedures included examining, on a test basis, evidence regarding the amounts and disclosures in the financial statements and financial highlights. Our audits also included evaluating the accounting principles used and significant estimates made by management, as well as evaluating the overall presentation of the financial statements and financial highlights. Our procedures included confirmation of securities owned as of December 31, 2019, by correspondence with the custodian and brokers; when replies were not received from brokers, we performed other auditing procedures. We believe that our audits provide a reasonable basis for our opinion.
/s/ Deloitte & Touche LLP
Boston, Massachusetts
February 24, 2020
We have served as the auditor of one or more Eaton Vance investment companies since 1959.
| 19 |
Eaton Vance
Real Estate Fund
December 31, 2019
Federal Tax Information (Unaudited)
The Form1099-DIV you received in March 2020 showed the tax status of all distributions paid to your account in calendar year 2019. Shareholders are advised to consult their own tax adviser with respect to the tax consequences of their investment in the Fund. As required by the Internal Revenue Code and/or regulations, shareholders must be notified regarding the status of qualified business income, qualified dividend income for individuals, the dividends received deduction for corporations and capital gains dividends.
Qualified Business Income. For the fiscal year ended December 31, 2019, the Fund designates $752,563, or up to the maximum amount of such dividends allowable pursuant to the Internal Revenue Code, as qualified business income.
Qualified Dividend Income. For the fiscal year ended December 31, 2019, the Fund designates approximately $42,600, or up to the maximum amount of such dividends allowable pursuant to the Internal Revenue Code, as qualified dividend income eligible for the reduced tax rate of 15%.
Dividends Received Deduction. Corporate shareholders are generally entitled to take the dividends received deduction on the portion of the Fund’s dividend distribution that qualifies under tax law. For the Fund’s fiscal 2019 ordinary income dividends, 1.89% qualifies for the corporate dividends received deduction.
Capital Gains Dividends. The Fund hereby designates as a capital gain dividend with respect to the taxable year ended December 31, 2019, $1,363,831 or, if subsequently determined to be different, the net capital gain of such year.
| 20 |
Eaton Vance
Real Estate Fund
December 31, 2019
Management and Organization
Fund Management. The Trustees of Eaton Vance Special Investment Trust (the Trust) are responsible for the overall management and supervision of the Trust’s affairs. The Trustees and officers of the Trust are listed below. Except as indicated, each individual has held the office shown or other offices in the same company for the last five years. Trustees and officers of the Trust hold indefinite terms of office. The “noninterested Trustees” consist of those Trustees who are not “interested persons” of the Trust, as that term is defined under the 1940 Act. The business address of each Trustee and officer is Two International Place, Boston, Massachusetts 02110. As used below, “EVC” refers to Eaton Vance Corp., “EV” refers to Eaton Vance, Inc., “EVM” refers to Eaton Vance Management, “BMR” refers to Boston Management and Research and “EVD” refers to Eaton Vance Distributors, Inc. EVC and EV are the corporate parent and trustee, respectively, of EVM and BMR. EVD is the Fund’s principal underwriter and a wholly-owned subsidiary of EVC. Each officer affiliated with Eaton Vance may hold a position with other Eaton Vance affiliates that is comparable to his or her position with EVM listed below. Each Trustee oversees 159 portfolios in the Eaton Vance Complex (including all master and feeder funds in a master feeder structure). Each officer serves as an officer of certain other Eaton Vance funds. Each Trustee and officer serves until his or her successor is elected.
| Name and Year of Birth | Position(s) with the | Trustee Since(1) | Principal Occupation(s) and Directorships During Past Five Years and Other Relevant Experience | |||
| Interested Trustee | ||||||
Thomas E. Faust Jr. 1958 | Trustee | 2007 | Chairman, Chief Executive Officer and President of EVC, Director and President of EV, Chief Executive Officer and President of EVM and BMR, and Director of EVD. Trustee and/or officer of 159 registered investment companies. Mr. Faust is an interested person because of his positions with EVM, BMR, EVD, EVC and EV, which are affiliates of the Trust. Directorships in the Last Five Years.Director of EVC and Hexavest Inc. (investment management firm). | |||
| Noninterested Trustees | ||||||
Mark R. Fetting 1954 | Trustee | 2016 | Private investor. Formerly held various positions at Legg Mason, Inc. (investment management firm) (2000-2012), including President, Chief Executive Officer, Director and Chairman (2008-2012), Senior Executive Vice President (2004-2008) and Executive Vice President (2001-2004). Formerly, President of Legg Mason family of funds (2001-2008). Formerly, Division President and Senior Officer of Prudential Financial Group, Inc. and related companies (investment management firm)(1991-2000). Other Directorships in the Last Five Years. None | |||
Cynthia E. Frost 1961 | Trustee | 2014 | Private investor. Formerly, Chief Investment Officer of Brown University (university endowment) (2000-2012). Formerly, Portfolio Strategist for Duke Management Company (university endowment manager) (1995-2000). Formerly, Managing Director, Cambridge Associates (investment consulting company) (1989-1995). Formerly, Consultant, Bain and Company (management consulting firm) (1987-1989). Formerly, Senior Equity Analyst, BA Investment Management Company (1983-1985). Other Directorships in the Last Five Years.None. | |||
George J. Gorman 1952 | Trustee | 2014 | Principal at George J. Gorman LLC (consulting firm). Formerly, Senior Partner at Ernst & Young LLP (a registered public accounting firm) (1974-2009). Other Directorships in the Last Five Years.Formerly, Trustee of the BofA Funds Series Trust (11 funds) (2011-2014) and of the Ashmore Funds (9 funds) (2010-2014). | |||
Valerie A. Mosley 1960 | Trustee | 2014 | Chairwoman and Chief Executive Officer of Valmo Ventures (a consulting and investment firm). Former Partner and Senior Vice President, Portfolio Manager and Investment Strategist at Wellington Management Company, LLP (investment management firm) (1992-2012). Former Chief Investment Officer, PG Corbin Asset Management (1990-1992). Formerly worked in institutional corporate bond sales at Kidder Peabody (1986-1990). Other Directorships in the Last Five Years.Director of Envestnet, Inc. (provider of intelligent systems for wealth management and financial wellness) (since 2018). Director of Dynex Capital, Inc. (mortgage REIT) (since 2013). | |||
| 21 |
Eaton Vance
Real Estate Fund
December 31, 2019
Management and Organization — continued
| Name and Year of Birth | Position(s) with the | Trustee Since(1) | Principal Occupation(s) and Directorships During Past Five Years and Other Relevant Experience | |||
| Noninterested Trustees (continued) | ||||||
William H. Park 1947 | Chairperson of the Board and Trustee | 2016 (Chairperson) 2003 (Trustee) | Private investor. Formerly, Consultant (management and transactional) (2012-2014). Formerly, Chief Financial Officer, Aveon Group L.P. (investment management firm) (2010-2011). Formerly, Vice Chairman, Commercial Industrial Finance Corp. (specialty finance company) (2006-2010). Formerly, President and Chief Executive Officer, Prizm Capital Management, LLC (investment management firm) (2002-2005). Formerly, Executive Vice President and Chief Financial Officer, United Asset Management Corporation (investment management firm) (1982-2001). Formerly, Senior Manager, Price Waterhouse (now PricewaterhouseCoopers) (a registered public accounting firm) (1972-1981). Other Directorships in the Last Five Years.None. | |||
Helen Frame Peters 1948 | Trustee | 2008 | Professor of Finance, Carroll School of Management, Boston College. Formerly, Dean, Carroll School of Management, Boston College (2000-2002). Formerly, Chief Investment Officer, Fixed Income, Scudder Kemper Investments (investment management firm) (1998-1999). Formerly, Chief Investment Officer, Equity and Fixed Income, Colonial Management Associates (investment management firm) (1991-1998). Other Directorships in the Last Five Years. None. | |||
Keith Quinton 1958 | Trustee | 2018 | Independent Investment Committee Member at New Hampshire Retirement System (since 2017). Advisory Committee member at Northfield Information Services, Inc. (risk management analytics provider) (since 2016). Formerly, Portfolio Manager and Senior Quantitative Analyst at Fidelity Investments (investment management firm)(2001-2014). Other Directorships in the Last Five Years. Director of New Hampshire Municipal Bond Bank (since 2016). | |||
Marcus L. Smith 1966 | Trustee | 2018 | Member of Posse Boston Advisory Board (foundation) (since 2015). Trustee at University of Mount Union (since 2008). Formerly, Portfolio Manager at MFS Investment Management (investment management firm) (1994-2017). Other Directorships in the Last Five Years. Director of MSCI Inc. (global provider of investment decision support tools) (since 2017). Formerly, Director of DCT Industrial Trust Inc. (logistics real estate company) (2017-2018). | |||
Susan J. Sutherland 1957 | Trustee | 2015 | Private investor. Formerly, Associate, Counsel and Partner at Skadden, Arps, Slate, Meagher & Flom LLP (law firm) (1982-2013). Other Directorships in the Last Five Years. Formerly, Director of Montpelier Re Holdings Ltd. (global provider of customized insurance and reinsurance products) (2013-2015). | |||
Scott E. Wennerholm 1959 | Trustee | 2016 | Formerly, Trustee at Wheelock College (postsecondary institution) (2012-2018). Formerly, Consultant at GF Parish Group (executive recruiting firm) (2016-2017). Formerly, Chief Operating Officer and Executive Vice President at BNY Mellon Asset Management (investment management firm) (2005-2011). Formerly, Chief Operating Officer and Chief Financial Officer at Natixis Global Asset Management (investment management firm) (1997-2004). Formerly, Vice President at Fidelity Investments Institutional Services (investment management firm) (1994-1997). Other Directorships in the Last Five Years. None. | |||
| Name and Year of Birth | Position(s) with the Trust | Officer Since(2) | Principal Occupation(s) During Past Five Years | |||
| Principal Officers who are not Trustees | ||||||
Payson F. Swaffield 1956 | President | 2003 | Vice President and Chief Income Investment Officer of EVM and BMR. Also Vice President of Calvert Research and Management (“CRM”). | |||
Maureen A. Gemma 1960 | Vice President, Secretary and Chief Legal Officer | 2005 | Vice President of EVM and BMR. Also Vice President of CRM. | |||
| 22 |
Eaton Vance
Real Estate Fund
December 31, 2019
Management and Organization — continued
| Name and Year of Birth | Position(s) with the Trust | Officer Since(2) | Principal Occupation(s) During Past Five Years | |||
| Principal Officers who are not Trustees (continued) | ||||||
James F. Kirchner 1967 | Treasurer | 2007 | Vice President of EVM and BMR. Also Vice President of CRM. | |||
Richard F. Froio 1968 | Chief Compliance Officer | 2017 | Vice President of EVM and BMR since 2017. Formerly Deputy Chief Compliance Officer (Adviser/Funds) and Chief Compliance Officer (Distribution) at PIMCO (2012-2017) and Managing Director at BlackRock/Barclays Global Investors (2009-2012). | |||
| (1) | Year first appointed to serve as Trustee for a fund in the Eaton Vance family of funds. Each Trustee has served continuously since appointment unless indicated otherwise. |
| (2) | Year first elected to serve as officer of a fund in the Eaton Vance family of funds when the officer has served continuously. Otherwise, year of most recent election as an officer of a fund in the Eaton Vance family of funds. Titles may have changed since initial election. |
The SAI for the Fund includes additional information about the Trustees and officers of the Fund and can be obtained without charge on Eaton Vance’s website at www.eatonvance.com or by calling1-800-262-1122.
| 23 |
Eaton Vance Funds
IMPORTANT NOTICES
Privacy. The Eaton Vance organization is committed to ensuring your financial privacy. Each entity listed below has adopted a privacy policy and procedures (“Privacy Program”) Eaton Vance believes is reasonably designed to protect your personal information and to govern when and with whom Eaton Vance may share your personal information.
| • | At the time of opening an account, Eaton Vance generally requires you to provide us with certain information such as name, address, social security number, tax status, account numbers, and account balances. This information is necessary for us to both open an account for you and to allow us to satisfy legal requirements such as applicable anti-money laundering reviews and know-your-customer requirements. |
| • | On an ongoing basis, in the normal course of servicing your account, Eaton Vance may share your information with unaffiliated third parties that perform various services for Eaton Vance and/or your account. These third parties include transfer agents, custodians, broker/dealers and our professional advisers, including auditors, accountants, and legal counsel. Eaton Vance may additionally share your personal information with our affiliates. |
| • | We believe our Privacy Program is reasonably designed to protect the confidentiality of your personal information and to prevent unauthorized access to that information. |
| • | We reserve the right to change our Privacy Program at any time upon proper notification to you. You may want to review our Privacy Program periodically for changes by accessing the link on our homepage: www.eatonvance.com. |
Our pledge of protecting your personal information applies to the following entities within the Eaton Vance organization: the Eaton Vance Family of Funds, Eaton Vance Management, Eaton Vance Investment Counsel, Eaton Vance Distributors, Inc., Eaton Vance Trust Company, Eaton Vance Management (International) Limited, Eaton Vance Advisers International Limited, Eaton Vance Global Advisors Limited, Eaton Vance Management’s Real Estate Investment Group, Boston Management and Research, Calvert Research and Management, and Calvert Funds. This Privacy Notice supersedes all previously issued privacy disclosures. For more information about our Privacy Program or about how your personal information may be used, please call1-800-262-1122.
Delivery of Shareholder Documents. The Securities and Exchange Commission (SEC) permits funds to deliver only one copy of shareholder documents, including prospectuses, proxy statements and shareholder reports, to fund investors with multiple accounts at the same residential or post office box address. This practice is often called “householding” and it helps eliminate duplicate mailings to shareholders.Eaton Vance, or your financial intermediary, may household the mailing of your documents indefinitely unless you instruct Eaton Vance, or your financial intermediary, otherwise.If you would prefer that your Eaton Vance documents not be householded, please contact Eaton Vance at1-800-262-1122, or contact your financial intermediary. Your instructions that householding not apply to delivery of your Eaton Vance documents will typically be effective within 30 days of receipt by Eaton Vance or your financial intermediary.
Portfolio Holdings. Each Eaton Vance Fund and its underlying Portfolio(s) (if applicable) files a schedule of portfolio holdings on Part F toForm N-PORT with the SEC for the first and third quarters of each fiscal year. The FormN-PORT will be available on the Eaton Vance website at www.eatonvance.com, by calling Eaton Vance at1-800-262-1122 or in the EDGAR database on the SEC’s website at www.sec.gov.
Proxy Voting. From time to time, funds are required to vote proxies related to the securities held by the funds. The Eaton Vance Funds or their underlying Portfolios (if applicable) vote proxies according to a set of policies and procedures approved by the Funds’ and Portfolios’ Boards. You may obtain a description of these policies and procedures and information on how the Funds or Portfolios voted proxies relating to portfolio securities during the most recent12-month period ended June 30, without charge, upon request, by calling1-800-262-1122 and by accessing the SEC’s website at www.sec.gov.
| 24 |
Investment Adviser and Administrator
Eaton Vance Management
Two International Place
Boston, MA 02110
Principal Underwriter*
Eaton Vance Distributors, Inc.
Two International Place
Boston, MA 02110
(617)482-8260
Custodian
State Street Bank and Trust Company
State Street Financial Center, One Lincoln Street
Boston, MA 02111
Transfer Agent
BNY Mellon Investment Servicing (US) Inc.
Attn: Eaton Vance Funds
P.O. Box 9653
Providence, RI 02940-9653
(800)262-1122
Independent Registered Public Accounting Firm
Deloitte & Touche LLP
200 Berkeley Street
Boston, MA 02116-5022
Fund Offices
Two International Place
Boston, MA 02110
| * | FINRA BrokerCheck. Investors may check the background of their Investment Professional by contacting the Financial Industry Regulatory Authority (FINRA). FINRA BrokerCheck is a free tool to help investors check the professional background of current and former FINRA-registered securities firms and brokers. FINRA BrokerCheck is available by calling1-800-289-9999 and at www.FINRA.org. The FINRA BrokerCheck brochure describing this program is available to investors at www.FINRA.org. |

2685 12.31.19

Eaton Vance
Small-Cap Fund
Annual Report
December 31, 2019
Important Note. Beginning on January 1, 2021, as permitted by regulations adopted by the Securities and Exchange Commission, paper copies of the Fund’s annual and semi-annual shareholder reports will no longer be sent by mail unless you specifically request paper copies of the reports. Instead, the reports will be made available on the Fund’s website (eatonvance.com/funddocuments), and you will be notified by mail each time a report is posted and provided with a website address to access the report.
If you already elected to receive shareholder reports electronically, you will not be affected by this change and you need not take any action. If you are a direct investor, you may elect to receive shareholder reports and other communications from the Fund electronically by signing up fore-Delivery at eatonvance.com/edelivery. If you own your shares through a financial intermediary (such as a broker-dealer or bank), you must contact your financial intermediary to sign up.
You may elect to receive all future Fund shareholder reports in paper free of charge. If you are a direct investor, you can inform the Fund that you wish to continue receiving paper copies of your shareholder reports by calling1-800-262-1122. If you own these shares through a financial intermediary, you must contact your financial intermediary or follow instructions included with this disclosure, if applicable, to elect to continue to receive paper copies of your shareholder reports. Your election to receive reports in paper will apply to all Eaton Vance funds held directly or to all funds held through your financial intermediary, as applicable.

Commodity Futures Trading Commission Registration. Effective December 31, 2012, the Commodity Futures Trading Commission (“CFTC”) adopted certain regulatory changes that subject registered investment companies and advisers to regulation by the CFTC if a fund invests more than a prescribed level of its assets in certain CFTC-regulated instruments (including futures, certain options and swap agreements) or markets itself as providing investment exposure to such instruments. The Fund has claimed an exclusion from the definition of the term “commodity pool operator” under the Commodity Exchange Act. Accordingly, neither the Fund nor the adviser with respect to the operation of the Fund is subject to CFTC regulation. Because of its management of other strategies, the Fund’s adviser is registered with the CFTC as a commodity pool operator and a commodity trading advisor.
Fund shares are not insured by the FDIC and are not deposits or other obligations of, or guaranteed by, any depository institution. Shares are subject to investment risks, including possible loss of principal invested.
This report must be preceded or accompanied by a current summary prospectus or prospectus. Before investing, investors should consider carefully the investment objective, risks, and charges and expenses of a mutual fund. This and other important information is contained in the summary prospectus and prospectus, which can be obtained from a financial intermediary. Prospective investors should read the prospectus carefully before investing. For further information, please call1-800-262-1122.
Annual ReportDecember 31, 2019
Eaton Vance
Small-Cap Fund
Table of Contents
Management’s Discussion of Fund Performance | 2 | |||
Performance | 3 | |||
Fund Profile | 4 | |||
Endnotes and Additional Disclosures | 5 | |||
Fund Expenses | 6 | |||
Financial Statements | 7 | |||
Report of Independent Registered Public Accounting Firm | 22 | |||
Federal Tax Information | 23 | |||
Management and Organization | 24 | |||
Important Notices | 26 | |||
Eaton Vance
Small-Cap Fund
December 31, 2019
Management’s Discussion of Fund Performance1
Economic and Market Conditions
With virtually every U.S. equity index posting strong double-digit returns for the12-month period ended December 31, 2019 — and bond markets solidly in the black as well — 2019 was a good year for investments.
As the new year dawned in January 2019, investors appeared to be taking a “glass is half full” approach. Although U.S. manufacturing output and business investment remained weak — held back by slowing global growth and anon-again/off-again U.S.-China trade war — strong spending by U.S. consumers and dovish remarks by the U.S. Federal Reserve (the Fed) combined to lift investor sentiment. After four federal funds rate hikes the previous year, markets began to project the Fed might actually lower rates in 2019 to stimulate the economy. U.S. unemployment, meanwhile, remained low and hiring remained strong.
As a result, U.S. stocks across multiple markets climbed from January through April 2019. Overseas, central banks around the world began to cut interest rates and employ other tools to stimulate their respective economies. Even a global stock pullback in May — sparked by heightened concerns about the U.S.-China trade spat — proved to be temporary, and the U.S. and global stock rallies resumed in June and July.
After holding interest rates steady through the first half of the year, the Fed cut the federal funds rate on July 31, 2019 — its first reduction in over a decade — followed by two additional rate cuts in September and October to end the period at1.50%-1.75%. By end of the third quarter, 60 central banks around the world had lowered their interest rates as well.
After falling in August, U.S. equities rallied again during the final months of the period, spurred by optimism about a U.S.-China trade détente and better-than-expected U.S. employment reports. The year ended with two events in December that did much to allay investor concerns about international trade and tariffs: passage of the United States-Mexico-Canada Agreement by the U.S. House of Representatives and the Trump administration’s agreement to aso-called “phase–one” trade deal with China.
During the12-month period ended December 31, 2019, the blue-chip Dow Jones Industrial Average®2 returned 25.34%, while the broader U.S. equity market, as measured by the S&P 500® Index, returned 31.49%. The technology-laden Nasdaq Composite Index returned 36.69% during the period.Large-cap U.S. stocks, as measured by the S&P 500® Index, generally outperformed theirsmall-cap counterparts, as measured by the Russell 2000® Index. As a group, growth stocks outpaced value stocks in both large- andsmall-cap categories, as measured by the Russell growth and value indexes.
Fund Performance
For the12-month period ended December 31, 2019, Eaton VanceSmall-Cap Fund returned 27.54% for Class A shares at net asset value (NAV), outperforming its benchmark, the Russell 2000® Index (the Index), which returned 25.52%.
The Fund outperformed the Index due to sector and industry allocations along with favorable stock selections. Of the Index’s 11 market sectors, the Fund had positive absolute returns in nine sectors. The Index itself had positive returns in 10 sectors.
The financials sector contributed most to relative Fund performance versus the Index, largely due to stock selection. Among the Fund’stop-performing individual stocks within this sector was asset manager Cohen & Steers, Inc., which specializes in real estate investment trusts (REITs). The company beat earnings forecasts behind strong investor demand for REITs, as investors pursued investments offering higher levels of income in the declining interest rate environment. Specialty insurer Kinsale Capital Group, Inc. (Kinsale) was also among the Fund’s leading stocks amid rapid growth and market-share gains. Byperiod-end, Kinsale was sold from the Fund.
The industrials sector contributed to returns relative to the Index due to stock selections and an overweight position in this outperforming sector. Within the industrials sector, the Fund’s holdings in the machinery industry also contributed to returns during the period. Diversified machinery firm Woodward, Inc. was one of the Fund’s leading individual stocks after reporting solid growth in its aerospace business during the period.
The Fund’s underweight position in the lagging energy sector aided relative Fund performance versus the Index during the period. Thetop-performing individual stock in the Fund was contract pharmaceuticals manufacturer Catalent, Inc. In addition to exceeding earnings expectations, the company made two large acquisitions during the period.
Conversely, the consumer discretionary sector detracted from relative Fund performance versus the Index due to stock selection. In the lagging diversified consumer services industry, online education provider Grand Canyon Education, Inc. was one of the Fund’s poorest-performing individual stocks as it dealt with regulatory issues. Auto components manufacturer Dorman Products, Inc. was also among the Fund’s weakest stocks after a disappointing earnings report amid weak demand. The Fund’s lack of exposure to the outperforming household durables sector was a drag on Fund results relative to the Index during the period.
Stock selection in the materials sector also detracted from Fund results relative to the Index during the period. In the chemicals industry, lubricants company Valvoline, Inc. was one of the Fund’s poorest-performing stocks as it faced a more competitive retail environment. The utilities sector also detracted from relative Fund performance versus the Index, dragged down by stock selection in the electric utilities industry. Overall, the Fund’s weakest individual stock was medical equipment company ICU Medical, Inc., which reported disappointing earnings amid growing competition during the period.
See Endnotes and Additional Disclosures in this report.
Past performance is no guarantee of future results. Returns are historical and are calculated by determining the percentage change in net asset value (NAV) or offering price (as applicable) with all distributions reinvested. Investment return and principal value will fluctuate so that shares, when redeemed, may be worth more or less than their original cost. Performance for periods less than or equal to one year is cumulative. Performance is for the stated time period only; due to market volatility, current Fund performance may be lower or higher than the quoted return. For performance as of the most recentmonth-end, please refer to eatonvance.com.
| 2 |
Eaton Vance
Small-Cap Fund
December 31, 2019
Performance2,3
Portfolio ManagersMichael D. McLean, CFA and J. Griffith Noble, CFA
| % Average Annual Total Returns | Class Inception Date | Performance Inception Date | One Year | Five Years | Ten Years | |||||||||||||||
Class A at NAV | 01/02/1997 | 01/02/1997 | 27.54 | % | 9.87 | % | 11.44 | % | ||||||||||||
Class A with 5.75% Maximum Sales Charge | — | — | 20.18 | 8.58 | 10.79 | |||||||||||||||
Class C at NAV | 05/03/2002 | 01/02/1997 | 26.54 | 9.04 | 10.60 | |||||||||||||||
Class C with 1% Maximum Sales Charge | — | — | 25.54 | 9.04 | 10.60 | |||||||||||||||
Class I at NAV | | 09/02/2008 | | | 01/02/1997 | | | 27.81 | | | 10.14 | | | 11.71 | | |||||
Class R at NAV | 08/03/2009 | 01/02/1997 | 27.18 | 9.59 | 11.16 | |||||||||||||||
Russell 2000® Index | — | — | 25.52 | % | 8.22 | % | 11.82 | % | ||||||||||||
% Total Annual Operating Expense Ratios4 | Class A | Class C | Class I | Class R | ||||||||||||||||
Gross | 1.52 | % | 2.27 | % | 1.27 | % | 1.77 | % | ||||||||||||
Net | 1.21 | 1.96 | 0.96 | 1.46 | ||||||||||||||||
Growth of $10,000
This graph shows the change in value of a hypothetical investment of $10,000 in Class A of the Fund for the period indicated. For comparison, the same investment is shown in the indicated index.
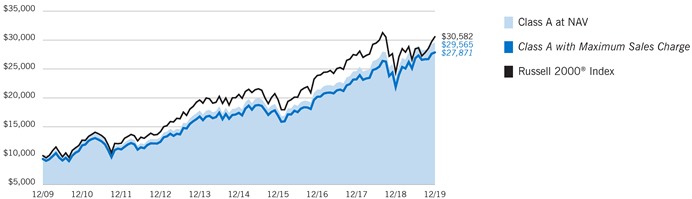
| Growth of Investment | Amount Invested | Period Beginning | At NAV | With Maximum Sales Charge | ||||||||||||
Class C | $ | 10,000 | 12/31/2009 | $ | 27,410 | N.A. | ||||||||||
Class I | $ | 250,000 | 12/31/2009 | $ | 757,068 | N.A. | ||||||||||
Class R | $ | 10,000 | 12/31/2009 | $ | 28,818 | N.A. | ||||||||||
See Endnotes and Additional Disclosures in this report.
Past performance is no guarantee of future results. Returns are historical and are calculated by determining the percentage change in net asset value (NAV) or offering price (as applicable) with all distributions reinvested. Investment return and principal value will fluctuate so that shares, when redeemed, may be worth more or less than their original cost. Performance for periods less than or equal to one year is cumulative. Performance is for the stated time period only; due to market volatility, current Fund performance may be lower or higher than the quoted return. For performance as of the most recentmonth-end, please refer to eatonvance.com.
| 3 |
Eaton Vance
Small-Cap Fund
December 31, 2019
Fund Profile
Sector Allocation (% of net assets)5
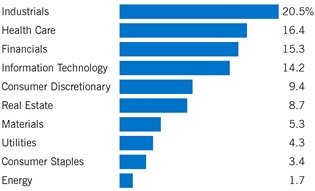
Top 10 Holdings (% of net assets)5
ACI Worldwide, Inc. | 3.3 | % | ||
Choice Hotels International, Inc. | 2.6 | |||
RealPage, Inc. | 2.5 | |||
Mueller Water Products, Inc., Class A | 2.3 | |||
Hexcel Corp. | 2.2 | |||
Amedisys, Inc. | 2.1 | |||
Healthcare Realty Trust, Inc. | 2.0 | |||
Woodward, Inc. | 2.0 | |||
ICU Medical, Inc. | 1.9 | |||
NewMarket Corp. | 1.8 | |||
Total | 22.7 | |||
See Endnotes and Additional Disclosures in this report.
| 4 |
Eaton Vance
Small-Cap Fund
December 31, 2019
Endnotes and Additional Disclosures
| 1 | The views expressed in this report are those of the portfolio manager(s) and are current only through the date stated at the top of this page. These views are subject to change at any time based upon market or other conditions, and Eaton Vance and the Fund(s) disclaim any responsibility to update such views. These views may not be relied upon as investment advice and, because investment decisions are based on many factors, may not be relied upon as an indication of trading intent on behalf of any Eaton Vance fund. This commentary may contain statements that are not historical facts, referred to as “forward looking statements.” The Fund’s actual future results may differ significantly from those stated in any forward looking statement, depending on factors such as changes in securities or financial markets or general economic conditions, the volume of sales and purchases of Fund shares, the continuation of investment advisory, administrative and service contracts, and other risks discussed from time to time in the Fund’s filings with the Securities and Exchange Commission. |
| 2 | Dow Jones Industrial Average®is a price-weighted average of 30 blue-chip stocks that are generally the leaders in their industry. S&P 500®Index is an unmanaged index of large- cap stocks commonly used as a measure of U.S. stock market performance. S&P Dow Jones Indices are a product of S&P Dow Jones Indices LLC (“S&P DJI”) and have been licensed for use. S&P®and S&P 500®are registered trademarks of S&P DJI; Dow Jones®is a registered trademark of Dow Jones Trademark Holdings LLC (“Dow Jones”); S&P DJI, Dow Jones and their respective affiliates do not sponsor, endorse, sell or promote the Fund, will not have any liability with respect thereto and do not have any liability for any errors, omissions, or interruptions of the S&P Dow Jones Indices. Nasdaq Composite Index is a market capitalization- weighted index of all domestic and international securities listed on Nasdaq. Source: Nasdaq, Inc. The information is provided by Nasdaq (with its affiliates, are referred to as the “Corporations”) and Nasdaq’s third party licensors on an “as is” basis and the Corporations make no guarantees and bear no liability of any kind with respect to the information or the Fund. Russell 2000®Index is an unmanaged index of 2,000 U.S.small-cap stocks. Unless otherwise stated, index returns do not reflect the effect of any applicable sales charges, commissions, expenses, taxes or leverage, as applicable. It is not possible to invest directly in an index. |
| 3 | Total Returns at NAV do not include applicable sales charges. If sales charges were deducted, the returns would be lower. Total Returns shown with maximum sales charge reflect the stated maximum sales charge. Unless otherwise stated, performance does not reflect the deduction of taxes on Fund distributions or redemptions of Fund shares. |
| 4 | Source: Fund prospectus. Net expense ratios reflect a contractual expense reimbursement that continues through 4/30/20. Without the reimbursement, performance would have been lower. The expense ratios for the current reporting period can be found in the Financial Highlights section of this report. |
| 5 | Excludes cash and cash equivalents. |
Fund profile subject to change due to active management. |
| 5 |
Eaton Vance
Small-Cap Fund
December 31, 2019
Fund Expenses
Example: As a Fund shareholder, you incur two types of costs: (1) transaction costs, including sales charges (loads) on purchases and redemption fees (if applicable); and (2) ongoing costs, including management fees; distribution and/or service fees; and other Fund expenses. This Example is intended to help you understand your ongoing costs (in dollars) of Fund investing and to compare these costs with the ongoing costs of investing in other mutual funds. The Example is based on an investment of $1,000 invested at the beginning of the period and held for the entire period (July 1, 2019 – December 31, 2019).
Actual Expenses: The first section of the table below provides information about actual account values and actual expenses. You may use the information in this section, together with the amount you invested, to estimate the expenses that you paid over the period. Simply divide your account value by $1,000 (for example, an $8,600 account value divided by $1,000 = 8.6), then multiply the result by the number in the first section under the heading entitled “Expenses Paid During Period” to estimate the expenses you paid on your account during this period.
Hypothetical Example for Comparison Purposes: The second section of the table below provides information about hypothetical account values and hypothetical expenses based on the actual Fund expense ratio and an assumed rate of return of 5% per year (before expenses), which is not the actual Fund return. The hypothetical account values and expenses may not be used to estimate the actual ending account balance or expenses you paid for the period. You may use this information to compare the ongoing costs of investing in your Fund and other funds. To do so, compare this 5% hypothetical example with the 5% hypothetical examples that appear in the shareholder reports of the other funds.
Please note that the expenses shown in the table are meant to highlight your ongoing costs only and do not reflect any transactional costs, such as sales charges (loads) or redemption fees (if applicable). Therefore, the second section of the table is useful in comparing ongoing costs only, and will not help you determine the relative total costs of owning different funds. In addition, if these transactional costs were included, your costs would be higher.
| Beginning Account Value (7/1/19) | Ending Account Value (12/31/19) | Expenses Paid During Period* (7/1/19 – 12/31/19) | Annualized Expense Ratio | |||||||||||||
Actual | ||||||||||||||||
Class A | $ | 1,000.00 | $ | 1,037.10 | $ | 6.21 | ** | 1.21 | % | |||||||
Class C | $ | 1,000.00 | $ | 1,032.80 | $ | 10.04 | ** | 1.96 | % | |||||||
Class I | $ | 1,000.00 | $ | 1,038.60 | $ | 4.93 | ** | 0.96 | % | |||||||
Class R | $ | 1,000.00 | $ | 1,035.80 | $ | 7.49 | ** | 1.46 | % | |||||||
Hypothetical | ||||||||||||||||
(5% return per year before expenses) | ||||||||||||||||
Class A | $ | 1,000.00 | $ | 1,019.10 | $ | 6.16 | ** | 1.21 | % | |||||||
Class C | $ | 1,000.00 | $ | 1,015.30 | $ | 9.96 | ** | 1.96 | % | |||||||
Class I | $ | 1,000.00 | $ | 1,020.40 | $ | 4.89 | ** | 0.96 | % | |||||||
Class R | $ | 1,000.00 | $ | 1,017.80 | $ | 7.43 | ** | 1.46 | % | |||||||
| * | Expenses are equal to the Fund’s annualized expense ratio for the indicated Class, multiplied by the average account value over the period, multiplied by 184/365 (to reflect theone-half year period). The Example assumes that the $1,000 was invested at the net asset value per share determined at the close of business on June 30, 2019. |
| ** | Absent an allocation of certain expenses to an affiliate, expenses would be higher. |
| 6 |
Eaton Vance
Small-Cap Fund
December 31, 2019
Portfolio of Investments
| Common Stocks— 99.2% |
| |||||||
| Security | Shares | Value | ||||||
| Aerospace & Defense— 3.6% | ||||||||
Hexcel Corp. | 25,686 | $ | 1,883,040 | |||||
Mercury Systems, Inc.(1) | 17,880 | 1,235,687 | ||||||
| $ | 3,118,727 | |||||||
| Auto Components— 1.7% | ||||||||
Dorman Products, Inc.(1) | 12,787 | $ | 968,232 | |||||
Visteon Corp.(1) | 5,927 | 513,219 | ||||||
| $ | 1,481,451 | |||||||
| Banks— 8.7% | ||||||||
City Holding Co. | 8,397 | $ | 688,134 | |||||
Columbia Banking System, Inc. | 31,510 | 1,281,984 | ||||||
Community Bank System, Inc. | 21,597 | 1,532,091 | ||||||
First Citizens BancShares, Inc., Class A | 2,562 | 1,363,522 | ||||||
Independent Bank Corp. | 8,007 | 666,583 | ||||||
Sterling Bancorp | 44,007 | 927,668 | ||||||
Stock Yards Bancorp, Inc. | 26,585 | 1,091,580 | ||||||
| $ | 7,551,562 | |||||||
| Biotechnology— 2.6% | ||||||||
Emergent BioSolutions, Inc.(1) | 24,216 | $ | 1,306,453 | |||||
Ligand Pharmaceuticals, Inc.(1) | 9,310 | 970,940 | ||||||
| $ | 2,277,393 | |||||||
| Building Products— 2.1% | ||||||||
CSW Industrials, Inc. | 6,860 | $ | 528,220 | |||||
Trex Co., Inc.(1) | 14,276 | 1,283,127 | ||||||
| $ | 1,811,347 | |||||||
| Capital Markets— 0.6% | ||||||||
Cohen & Steers, Inc. | 7,743 | $ | 485,951 | |||||
| $ | 485,951 | |||||||
| Chemicals— 5.3% | ||||||||
Balchem Corp. | 14,326 | $ | 1,455,951 | |||||
NewMarket Corp. | 3,286 | 1,598,705 | ||||||
Valvoline, Inc. | 74,530 | 1,595,687 | ||||||
| $ | 4,650,343 | |||||||
| Commercial Services & Supplies— 2.8% | ||||||||
Brink’s Co. (The) | 15,163 | $ | 1,374,981 | |||||
Viad Corp. | 15,816 | 1,067,580 | ||||||
| $ | 2,442,561 | |||||||
| Security | Shares | Value | ||||||
| Diversified Consumer Services— 2.0% | ||||||||
Grand Canyon Education, Inc.(1) | 3,254 | $ | 311,701 | |||||
K12, Inc.(1) | 24,278 | 494,057 | ||||||
ServiceMaster Global Holdings, Inc.(1) | 23,188 | 896,448 | ||||||
| $ | 1,702,206 | |||||||
| Electric Utilities— 1.6% | ||||||||
ALLETE, Inc. | 16,715 | $ | 1,356,757 | |||||
| $ | 1,356,757 | |||||||
| Energy Equipment & Services— 0.6% | ||||||||
Oceaneering International, Inc.(1) | 36,684 | $ | 546,958 | |||||
| $ | 546,958 | |||||||
| Equity Real Estate Investment Trusts (REITs)— 8.7% | ||||||||
CubeSmart | 38,433 | $ | 1,209,871 | |||||
EastGroup Properties, Inc. | 11,609 | 1,540,166 | ||||||
Essential Properties Realty Trust, Inc. | 34,978 | 867,804 | ||||||
Healthcare Realty Trust, Inc. | 52,535 | 1,753,093 | ||||||
Rexford Industrial Realty, Inc. | 33,833 | 1,545,153 | ||||||
STORE Capital Corp. | 17,246 | 642,241 | ||||||
| $ | 7,558,328 | |||||||
| Food & Staples Retailing— 1.3% | ||||||||
BJ’s Wholesale Club Holdings, Inc.(1) | 32,832 | $ | 746,600 | |||||
Performance Food Group Co.(1) | 6,879 | 354,131 | ||||||
| $ | 1,100,731 | |||||||
| Food Products— 2.2% | ||||||||
Calavo Growers, Inc. | 3,941 | $ | 357,015 | |||||
J&J Snack Foods Corp. | 1,757 | 323,762 | ||||||
Lancaster Colony Corp. | 2,847 | 455,805 | ||||||
Nomad Foods, Ltd.(1) | 33,154 | 741,655 | ||||||
| $ | 1,878,237 | |||||||
| Gas Utilities— 1.8% | ||||||||
ONE Gas, Inc. | 16,819 | $ | 1,573,754 | |||||
| $ | 1,573,754 | |||||||
| Health Care Equipment & Supplies— 6.0% | ||||||||
Envista Holdings Corp.(1) | 30,443 | $ | 902,331 | |||||
Haemonetics Corp.(1) | 11,670 | 1,340,883 | ||||||
ICU Medical, Inc.(1) | 8,962 | 1,676,969 | ||||||
Integra LifeSciences Holdings Corp.(1) | 22,089 | 1,287,347 | ||||||
| $ | 5,207,530 | |||||||
| 7 | See Notes to Financial Statements. |
Eaton Vance
Small-Cap Fund
December 31, 2019
Portfolio of Investments — continued
| Security | Shares | Value | ||||||
| Health Care Providers & Services— 6.6% | ||||||||
Addus HomeCare Corp.(1) | 14,394 | $ | 1,399,385 | |||||
Amedisys, Inc.(1) | 11,170 | 1,864,496 | ||||||
Chemed Corp. | 3,538 | 1,554,102 | ||||||
R1 RCM, Inc.(1) | 71,716 | 930,874 | ||||||
| $ | 5,748,857 | |||||||
| Hotels, Restaurants & Leisure— 2.6% | ||||||||
Choice Hotels International, Inc. | 21,839 | $ | 2,258,808 | |||||
| $ | 2,258,808 | |||||||
| Insurance— 5.2% | ||||||||
AMERISAFE, Inc. | 12,510 | $ | 826,035 | |||||
First American Financial Corp. | 11,437 | 667,006 | ||||||
Horace Mann Educators Corp. | 30,654 | 1,338,354 | ||||||
RLI Corp. | 7,623 | 686,222 | ||||||
Selective Insurance Group, Inc. | 15,174 | 989,193 | ||||||
| $ | 4,506,810 | |||||||
| IT Services— 3.2% | ||||||||
Euronet Worldwide, Inc.(1) | 9,039 | $ | 1,424,185 | |||||
NIC, Inc. | 61,342 | 1,370,993 | ||||||
| $ | 2,795,178 | |||||||
| Machinery— 5.8% | ||||||||
Mueller Water Products, Inc., Class A | 163,774 | $ | 1,962,012 | |||||
RBC Bearings, Inc.(1) | 5,797 | 917,897 | ||||||
Welbilt, Inc.(1) | 29,114 | 454,470 | ||||||
Woodward, Inc. | 14,559 | 1,724,368 | ||||||
| $ | 5,058,747 | |||||||
| Marine— 1.7% | ||||||||
Kirby Corp.(1) | 17,052 | $ | 1,526,666 | |||||
| $ | 1,526,666 | |||||||
| Oil, Gas & Consumable Fuels— 1.0% | ||||||||
Gulfport Energy Corp.(1) | 66,412 | $ | 201,893 | |||||
Jagged Peak Energy, Inc.(1) | 34,374 | 291,835 | ||||||
PDC Energy, Inc.(1) | 15,236 | 398,726 | ||||||
| $ | 892,454 | |||||||
| Pharmaceuticals— 1.2% | ||||||||
Catalent, Inc.(1) | 18,125 | $ | 1,020,437 | |||||
| $ | 1,020,437 | |||||||
| Security | Shares | Value | ||||||
| Professional Services— 1.5% | ||||||||
CBIZ, Inc.(1) | 47,412 | $ | 1,278,227 | |||||
| $ | 1,278,227 | |||||||
| Road & Rail— 1.5% | ||||||||
Landstar System, Inc. | 11,153 | $ | 1,269,992 | |||||
| $ | 1,269,992 | |||||||
| Software— 10.9% | ||||||||
ACI Worldwide, Inc.(1) | 76,358 | $ | 2,892,823 | |||||
Altair Engineering, Inc., Class A(1) | 44,497 | 1,597,887 | ||||||
CDK Global, Inc. | 24,021 | 1,313,468 | ||||||
Envestnet, Inc.(1) | 22,072 | 1,536,873 | ||||||
RealPage, Inc.(1) | 40,357 | 2,169,189 | ||||||
| $ | 9,510,240 | |||||||
| Specialty Retail— 2.6% | ||||||||
Hudson, Ltd., Class A(1) | 27,384 | $ | 420,071 | |||||
Monro, Inc. | 5,200 | 406,640 | ||||||
National Vision Holdings, Inc.(1) | 44,971 | 1,458,409 | ||||||
| $ | 2,285,120 | |||||||
| Textiles, Apparel & Luxury Goods— 0.5% | ||||||||
Columbia Sportswear Co. | 4,248 | $ | 425,607 | |||||
| $ | 425,607 | |||||||
| Thrifts & Mortgage Finance— 0.9% | ||||||||
Essent Group, Ltd. | 14,933 | $ | 776,367 | |||||
| $ | 776,367 | |||||||
| Trading Companies & Distributors— 1.5% | ||||||||
Applied Industrial Technologies, Inc. | 19,398 | $ | 1,293,653 | |||||
| $ | 1,293,653 | |||||||
| Water Utilities— 0.9% | ||||||||
Middlesex Water Co. | 12,303 | $ | 782,102 | |||||
| $ | 782,102 | |||||||
Total Common Stocks |
| $ | 86,173,101 | |||||
| 8 | See Notes to Financial Statements. |
Eaton Vance
Small-Cap Fund
December 31, 2019
Portfolio of Investments — continued
| Short-Term Investments— 1.2% | ||||||||
| Description | Units | Value | ||||||
Eaton Vance Cash Reserves Fund, LLC, 1.78%(2) | 1,022,542 | $ | 1,022,542 | |||||
Total Short-Term Investments |
| $ | 1,022,542 | |||||
Total Investments — 100.4% |
| $ | 87,195,643 | |||||
Other Assets, Less Liabilities — (0.4)% | $ | (305,510 | ) | |||||
Net Assets — 100.0% | $ | 86,890,133 | ||||||
The percentage shown for each investment category in the Portfolio of Investments is based on net assets.
| (1) | Non-income producing security. |
| (2) | Affiliated investment company, available to Eaton Vance portfolios and funds, which invests in high quality, U.S. dollar denominated money market instruments. The rate shown is the annualizedseven-day yield as of December 31, 2019. |
| 9 | See Notes to Financial Statements. |
Eaton Vance
Small-Cap Fund
December 31, 2019
Statement of Assets and Liabilities
| Assets | December 31, 2019 | |||
Unaffiliated investments, at value (identified cost, $67,010,095) | $ | 86,173,101 | ||
Affiliated investment, at value (identified cost, $1,022,445) | 1,022,542 | |||
Dividends receivable | 76,499 | |||
Dividends receivable from affiliated investment | 839 | |||
Receivable for Fund shares sold | 175,029 | |||
Receivable from affiliate | 19,702 | |||
Total assets | $ | 87,467,712 | ||
| Liabilities |
| |||
Payable for investments purchased | $ | 146,949 | ||
Payable for Fund shares redeemed | 267,425 | |||
Payable to affiliates: | ||||
Investment adviser fee | 55,006 | |||
Administration fee | 11,001 | |||
Distribution and service fees | 9,486 | |||
Trustees’ fees | 1,163 | |||
Accrued expenses | 86,549 | |||
Total liabilities | $ | 577,579 | ||
Net Assets | $ | 86,890,133 | ||
| Sources of Net Assets |
| |||
Paid-in capital | $ | 67,115,041 | ||
Distributable earnings | 19,775,092 | |||
Net Assets | $ | 86,890,133 | ||
| Class A Shares |
| |||
Net Assets | $ | 24,529,653 | ||
Shares Outstanding | 1,860,149 | |||
Net Asset Value and Redemption Price Per Share | ||||
(net assets ÷ shares of beneficial interest outstanding) | $ | 13.19 | ||
Maximum Offering Price Per Share | ||||
(100 ÷ 94.25 of net asset value per share) | $ | 13.99 | ||
| Class C Shares |
| |||
Net Assets | $ | 4,563,860 | ||
Shares Outstanding | 432,574 | |||
Net Asset Value and Offering Price Per Share* | ||||
(net assets ÷ shares of beneficial interest outstanding) | $ | 10.55 | ||
| Class I Shares |
| |||
Net Assets | $ | 57,201,679 | ||
Shares Outstanding | 3,857,021 | |||
Net Asset Value, Offering Price and Redemption Price Per Share | ||||
(net assets ÷ shares of beneficial interest outstanding) | $ | 14.83 | ||
| Class R Shares |
| |||
Net Assets | $ | 594,941 | ||
Shares Outstanding | 47,437 | |||
Net Asset Value, Offering Price and Redemption Price Per Share | ||||
(net assets ÷ shares of beneficial interest outstanding) | $ | 12.54 | ||
On sales of $50,000 or more, the offering price of Class A shares is reduced.
| * | Redemption price per share is equal to the net asset value less any applicable contingent deferred sales charge. |
| 10 | See Notes to Financial Statements. |
Eaton Vance
Small-Cap Fund
December 31, 2019
Statement of Operations
| Investment Income | Year Ended December 31, 2019 | |||
Dividends (net of foreign taxes, $2,055) | $ | 869,860 | ||
Dividends from affiliated investment | 19,171 | |||
Total investment income | $ | 889,031 | ||
| Expenses | ||||
Investment adviser fee | $ | 578,418 | ||
Administration fee | 115,684 | |||
Distribution and service fees | ||||
Class A | 60,738 | |||
Class C | 48,891 | |||
Class R | 4,824 | |||
Trustees’ fees and expenses | 4,517 | |||
Custodian fee | 30,679 | |||
Transfer and dividend disbursing agent fees | 91,460 | |||
Legal and accounting services | 45,835 | |||
Printing and postage | 24,872 | |||
Registration fees | 55,654 | |||
Miscellaneous | 16,998 | |||
Total expenses | $ | 1,078,570 | ||
Deduct — | ||||
Allocation of expenses to affiliate | $ | 223,095 | ||
Total expense reductions | $ | 223,095 | ||
Net expenses | $ | 855,475 | ||
Net investment income | $ | 33,556 | ||
| Realized and Unrealized Gain (Loss) | ||||
Net realized gain (loss) — | ||||
Investment transactions | $ | 5,396,774 | ||
Investment transactions — affiliated investment | (27 | ) | ||
Net realized gain | $ | 5,396,747 | ||
Change in unrealized appreciation (depreciation) — | ||||
Investments | $ | 11,837,383 | ||
Investments — affiliated investment | 94 | |||
Net change in unrealized appreciation (depreciation) | $ | 11,837,477 | ||
Net realized and unrealized gain | $ | 17,234,224 | ||
Net increase in net assets from operations | $ | 17,267,780 | ||
| 11 | See Notes to Financial Statements. |
Eaton Vance
Small-Cap Fund
December 31, 2019
Statements of Changes in Net Assets
| Year Ended December 31, | ||||||||
| Increase (Decrease) in Net Assets | 2019 | 2018 | ||||||
From operations — |
| |||||||
Net investment income (loss) | $ | 33,556 | $ | (103,436 | ) | |||
Net realized gain | 5,396,747 | 9,635,803 | ||||||
Net change in unrealized appreciation (depreciation) | 11,837,477 | (13,460,997 | ) | |||||
Net increase (decrease) in net assets from operations | $ | 17,267,780 | $ | (3,928,630 | ) | |||
Distributions to shareholders — |
| |||||||
Class A | $ | (1,755,293 | ) | $ | (2,254,742 | ) | ||
Class C | (396,798 | ) | (1,016,241 | ) | ||||
Class I | (3,423,138 | ) | (3,938,296 | ) | ||||
Class R | (52,605 | ) | (91,038 | ) | ||||
Total distributions to shareholders | $ | (5,627,834 | ) | $ | (7,300,317 | ) | ||
Transactions in shares of beneficial interest — |
| |||||||
Proceeds from sale of shares |
| |||||||
Class A | $ | 3,261,995 | $ | 3,623,121 | ||||
Class C | 647,700 | 2,116,310 | ||||||
Class I | 23,966,549 | 6,703,355 | ||||||
Class R | 252,084 | 400,213 | ||||||
Net asset value of shares issued to shareholders in payment of distributions declared |
| |||||||
Class A | 1,668,660 | 2,180,383 | ||||||
Class C | 369,254 | 974,220 | ||||||
Class I | 3,325,272 | 3,791,027 | ||||||
Class R | 52,605 | 91,038 | ||||||
Cost of shares redeemed |
| |||||||
Class A | (5,760,756 | ) | (7,937,543 | ) | ||||
Class C | (2,541,967 | ) | (3,747,056 | ) | ||||
Class I | (11,899,907 | ) | (14,858,960 | ) | ||||
Class R | (671,868 | ) | (265,029 | ) | ||||
Net asset value of shares converted |
| |||||||
Class A | 2,186,365 | — | ||||||
Class C | (2,186,365 | ) | — | |||||
Net increase (decrease) in net assets from Fund share transactions | $ | 12,669,621 | $ | (6,928,921 | ) | |||
Net increase (decrease) in net assets | $ | 24,309,567 | $ | (18,157,868 | ) | |||
| Net Assets |
| |||||||
At beginning of year | $ | 62,580,566 | $ | 80,738,434 | ||||
At end of year | $ | 86,890,133 | $ | 62,580,566 | ||||
| 12 | See Notes to Financial Statements. |
Eaton Vance
Small-Cap Fund
December 31, 2019
Financial Highlights
| Class A | ||||||||||||||||||||
| Year Ended December 31, | ||||||||||||||||||||
| 2019 | 2018 | 2017 | 2016 | 2015 | ||||||||||||||||
Net asset value — Beginning of year | $ | 11.100 | $ | 13.150 | $ | 12.740 | $ | 12.200 | $ | 15.320 | ||||||||||
| Income (Loss) From Operations | ||||||||||||||||||||
Net investment loss(1) | $ | (0.008 | ) | $ | (0.026 | ) | $ | (0.057 | ) | $ | (0.053 | ) | $ | (0.078 | ) | |||||
Net realized and unrealized gain (loss) | 3.046 | (0.660 | ) | 1.916 | 2.361 | (0.205 | ) | |||||||||||||
Total income (loss) from operations | $ | 3.038 | $ | (0.686 | ) | $ | 1.859 | $ | 2.308 | $ | (0.283 | ) | ||||||||
| Less Distributions | ||||||||||||||||||||
From net realized gain | $ | (0.948 | ) | $ | (1.364 | ) | $ | (1.449 | ) | $ | (1.768 | ) | $ | (2.837 | ) | |||||
Total distributions | $ | (0.948 | ) | $ | (1.364 | ) | $ | (1.449 | ) | $ | (1.768 | ) | $ | (2.837 | ) | |||||
Net asset value — End of year | $ | 13.190 | $ | 11.100 | $ | 13.150 | $ | 12.740 | $ | 12.200 | ||||||||||
Total Return(2) | 27.54 | %(3) | (5.81 | )%(3) | 14.91 | %(3) | 19.32 | % | (2.78 | )% | ||||||||||
| Ratios/Supplemental Data | ||||||||||||||||||||
Net assets, end of year (000’s omitted) | $ | 24,530 | $ | 19,329 | $ | 24,865 | $ | 30,174 | $ | 26,391 | ||||||||||
Ratios (as a percentage of average daily net assets): | ||||||||||||||||||||
Expenses(4) | 1.21 | %(3) | 1.35 | %(3) | 1.42 | %(3) | 1.52 | % | 1.43 | % | ||||||||||
Net investment loss | (0.06 | )% | (0.19 | )% | (0.43 | )% | (0.43 | )% | (0.52 | )% | ||||||||||
Portfolio Turnover | 54 | % | 44 | % | 50 | % | 76 | % | 71 | % | ||||||||||
| (1) | Computed using average shares outstanding. |
| (2) | Returns are historical and are calculated by determining the percentage change in net asset value with all distributions reinvested and do not reflect the effect of sales charges. |
| (3) | The administrator reimbursed certain operating expenses (equal to 0.29%, 0.17% and 0.10% of average daily net assets for the years ended December 31, 2019, 2018 and 2017, respectively). Absent this reimbursement, total return would be lower. |
| (4) | Excludes the effect of custody fee credits, if any, of less than 0.005%. Effective September 1, 2015, custody fee credits, which were earned on cash deposit balances, were discontinued by the custodian. |
| 13 | See Notes to Financial Statements. |
Eaton Vance
Small-Cap Fund
December 31, 2019
Financial Highlights — continued
| Class C | ||||||||||||||||||||
| Year Ended December 31, | ||||||||||||||||||||
| 2019 | 2018 | 2017 | 2016 | 2015 | ||||||||||||||||
Net asset value — Beginning of year | $ | 9.100 | $ | 11.110 | $ | 11.040 | $ | 10.850 | $ | 14.040 | ||||||||||
| Income (Loss) From Operations | ||||||||||||||||||||
Net investment loss(1) | $ | (0.092 | ) | $ | (0.108 | ) | $ | (0.133 | ) | $ | (0.129 | ) | $ | (0.173 | ) | |||||
Net realized and unrealized gain (loss) | 2.490 | (0.538 | ) | 1.652 | 2.087 | (0.180 | ) | |||||||||||||
Total income (loss) from operations | $ | 2.398 | $ | (0.646 | ) | $ | 1.519 | $ | 1.958 | $ | (0.353 | ) | ||||||||
| Less Distributions | ||||||||||||||||||||
From net realized gain | $ | (0.948 | ) | $ | (1.364 | ) | $ | (1.449 | ) | $ | (1.768 | ) | $ | (2.837 | ) | |||||
Total distributions | $ | (0.948 | ) | $ | (1.364 | ) | $ | (1.449 | ) | $ | (1.768 | ) | $ | (2.837 | ) | |||||
Net asset value — End of year | $ | 10.550 | $ | 9.100 | $ | 11.110 | $ | 11.040 | $ | 10.850 | ||||||||||
Total Return(2) | 26.54 | %(3) | (6.52 | )%(3) | 14.11 | %(3) | 18.47 | % | (3.59 | )% | ||||||||||
| Ratios/Supplemental Data | ||||||||||||||||||||
Net assets, end of year (000’s omitted) | $ | 4,564 | $ | 7,356 | $ | 9,565 | $ | 10,001 | $ | 9,040 | ||||||||||
Ratios (as a percentage of average daily net assets): | ||||||||||||||||||||
Expenses(4) | 1.96 | %(3) | 2.10 | %(3) | 2.17 | %(3) | 2.27 | % | 2.18 | % | ||||||||||
Net investment loss | (0.87 | )% | (0.94 | )% | (1.17 | )% | (1.18 | )% | (1.27 | )% | ||||||||||
Portfolio Turnover | 54 | % | 44 | % | 50 | % | 76 | % | 71 | % | ||||||||||
| (1) | Computed using average shares outstanding. |
| (2) | Returns are historical and are calculated by determining the percentage change in net asset value with all distributions reinvested and do not reflect the effect of sales charges. |
| (3) | The administrator reimbursed certain operating expenses (equal to 0.29%, 0.17% and 0.10% of average daily net assets for the years ended December 31, 2019, 2018 and 2017, respectively). Absent this reimbursement, total return would be lower. |
| (4) | Excludes the effect of custody fee credits, if any, of less than 0.005%. Effective September 1, 2015, custody fee credits, which were earned on cash deposit balances, were discontinued by the custodian. |
| 14 | See Notes to Financial Statements. |
Eaton Vance
Small-Cap Fund
December 31, 2019
Financial Highlights — continued
| Class I | ||||||||||||||||||||
| Year Ended December 31, | ||||||||||||||||||||
| 2019 | 2018 | 2017 | 2016 | 2015 | ||||||||||||||||
Net asset value — Beginning of year | $ | 12.360 | $ | 14.450 | $ | 13.840 | $ | 13.080 | $ | 16.190 | ||||||||||
| Income (Loss) From Operations | ||||||||||||||||||||
Net investment income (loss)(1) | $ | 0.029 | $ | 0.010 | $ | (0.022 | ) | $ | (0.027 | ) | $ | (0.043 | ) | |||||||
Net realized and unrealized gain (loss) | 3.389 | (0.736 | ) | 2.081 | 2.555 | (0.230 | ) | |||||||||||||
Total income (loss) from operations | $ | 3.418 | $ | (0.726 | ) | $ | 2.059 | $ | 2.528 | $ | (0.273 | ) | ||||||||
| Less Distributions | ||||||||||||||||||||
From net realized gain | $ | (0.948 | ) | $ | (1.364 | ) | $ | (1.449 | ) | $ | (1.768 | ) | $ | (2.837 | ) | |||||
Total distributions | $ | (0.948 | ) | $ | (1.364 | ) | $ | (1.449 | ) | $ | (1.768 | ) | $ | (2.837 | ) | |||||
Net asset value — End of year | $ | 14.830 | $ | 12.360 | $ | 14.450 | $ | 13.840 | $ | 13.080 | ||||||||||
Total Return(2) | 27.81 | %(3) | (5.57 | )%(3) | 15.17 | %(3) | 19.70 | % | (2.57 | )% | ||||||||||
| Ratios/Supplemental Data | ||||||||||||||||||||
Net assets, end of year (000’s omitted) | $ | 57,202 | $ | 35,097 | $ | 45,587 | $ | 34,888 | $ | 52,335 | ||||||||||
Ratios (as a percentage of average daily net assets): | ||||||||||||||||||||
Expenses(4) | 0.96 | %(3) | 1.10 | %(3) | 1.16 | %(3) | 1.27 | % | 1.18 | % | ||||||||||
Net investment income (loss) | 0.20 | % | 0.07 | % | (0.15 | )% | (0.21 | )% | (0.27 | )% | ||||||||||
Portfolio Turnover | 54 | % | 44 | % | 50 | % | 76 | % | 71 | % | ||||||||||
| (1) | Computed using average shares outstanding. |
| (2) | Returns are historical and are calculated by determining the percentage change in net asset value with all distributions reinvested. |
| (3) | The administrator reimbursed certain operating expenses (equal to 0.29%, 0.17% and 0.10% of average daily net assets for the years ended December 31, 2019, 2018 and 2017, respectively). Absent this reimbursement, total return would be lower. |
| (4) | Excludes the effect of custody fee credits, if any, of less than 0.005%. Effective September 1, 2015, custody fee credits, which were earned on cash deposit balances, were discontinued by the custodian. |
| 15 | See Notes to Financial Statements. |
Eaton Vance
Small-Cap Fund
December 31, 2019
Financial Highlights — continued
| Class R | ||||||||||||||||||||
| Year Ended December 31, | ||||||||||||||||||||
| 2019 | 2018 | 2017 | 2016 | 2015 | ||||||||||||||||
Net asset value — Beginning of year | $ | 10.620 | $ | 12.670 | $ | 12.350 | $ | 11.900 | $ | 15.050 | ||||||||||
| Income (Loss) From Operations | ||||||||||||||||||||
Net investment loss(1) | $ | (0.042 | ) | $ | (0.053 | ) | $ | (0.084 | ) | $ | (0.078 | ) | $ | (0.113 | ) | |||||
Net realized and unrealized gain (loss) | 2.910 | (0.633 | ) | 1.853 | 2.296 | (0.200 | ) | |||||||||||||
Total income (loss) from operations | $ | 2.868 | $ | (0.686 | ) | $ | 1.769 | $ | 2.218 | $ | (0.313 | ) | ||||||||
| Less Distributions | ||||||||||||||||||||
From net realized gain | $ | (0.948 | ) | $ | (1.364 | ) | $ | (1.449 | ) | $ | (1.768 | ) | $ | (2.837 | ) | |||||
Total distributions | $ | (0.948 | ) | $ | (1.364 | ) | $ | (1.449 | ) | $ | (1.768 | ) | $ | (2.837 | ) | |||||
Net asset value — End of year | $ | 12.540 | $ | 10.620 | $ | 12.670 | $ | 12.350 | $ | 11.900 | ||||||||||
Total Return(2) | 27.18 | %(3) | (6.04 | )%(3) | 14.64 | %(3) | 19.04 | % | (3.05 | )% | ||||||||||
| Ratios/Supplemental Data | ||||||||||||||||||||
Net assets, end of year (000’s omitted) | $ | 595 | $ | 799 | $ | 722 | $ | 567 | $ | 289 | ||||||||||
Ratios (as a percentage of average daily net assets): | ||||||||||||||||||||
Expenses(4) | 1.46 | %(3) | 1.60 | %(3) | 1.66 | %(3) | 1.77 | % | 1.68 | % | ||||||||||
Net investment loss | (0.34 | )% | (0.40 | )% | (0.66 | )% | (0.64 | )% | (0.77 | )% | ||||||||||
Portfolio Turnover | 54 | % | 44 | % | 50 | % | 76 | % | 71 | % | ||||||||||
| (1) | Computed using average shares outstanding. |
| (2) | Returns are historical and are calculated by determining the percentage change in net asset value with all distributions reinvested. |
| (3) | The administrator reimbursed certain operating expenses (equal to 0.29%, 0.17% and 0.10% of average daily net assets for the years ended December 31, 2019, 2018 and 2017, respectively). Absent this reimbursement, total return would be lower. |
| (4) | Excludes the effect of custody fee credits, if any, of less than 0.005%. Effective September 1, 2015, custody fee credits, which were earned on cash deposit balances, were discontinued by the custodian. |
| 16 | See Notes to Financial Statements. |
Eaton Vance
Small-Cap Fund
December 31, 2019
Notes to Financial Statements
1 Significant Accounting Policies
Eaton VanceSmall-Cap Fund (the Fund) is a diversified series of Eaton Vance Special Investment Trust (the Trust). The Trust is a Massachusetts business trust registered under the Investment Company Act of 1940, as amended (the 1940 Act), as anopen-end management investment company. The Fund’s investment objective is to seek long-term capital appreciation. The Fund offers four classes of shares. Class A shares are generally sold subject to a sales charge imposed at time of purchase. Class C shares are sold at net asset value and are generally subject to a contingent deferred sales charge (see Note 5). Effective January 25, 2019, Class C shares generally automatically convert to Class A shares ten years after their purchase as described in the Fund’s prospectus. Class I and Class R shares are sold at net asset value and are not subject to a sales charge. Each class represents apro-rata interest in the Fund, but votes separately on class-specific matters and (as noted below) is subject to different expenses. Realized and unrealized gains and losses and net investment income and losses, other than class-specific expenses, are allocated daily to each class of shares based on the relative net assets of each class to the total net assets of the Fund. Each class of shares differs in its distribution plan and certain other class-specific expenses.
The following is a summary of significant accounting policies of the Fund. The policies are in conformity with accounting principles generally accepted in the United States of America (U.S. GAAP). The Fund is an investment company and follows accounting and reporting guidance in the Financial Accounting Standards Board (FASB) Accounting Standards Codification Topic 946.
A Investment Valuation — The following methodologies are used to determine the market value or fair value of investments.
Equity Securities.Equity securities listed on a U.S. securities exchange generally are valued at the last sale or closing price on the day of valuation or, if no sales took place on such date, at the mean between the closing bid and ask prices on the exchange where such securities are principally traded. Equity securities listed on the NASDAQ Global or Global Select Market generally are valued at the NASDAQ official closing price. Unlisted or listed securities for which closing sales prices or closing quotations are not available are valued at the mean between the latest available bid and ask prices.
Affiliated Fund.The Fund may invest in Eaton Vance Cash Reserves Fund, LLC (Cash Reserves Fund), an affiliated investment company managed by Eaton Vance Management (EVM). While Cash Reserves Fund is not a registered money market mutual fund, it conducts all of its investment activities in accordance with the requirements of Rule2a-7 under the 1940 Act. Investments in Cash Reserves Fund are valued at the closing net asset value per unit on the valuation day. Cash Reserves Fund generally values its investment securities based on available market quotations provided by a third party pricing service.
Fair Valuation.Investments for which valuations or market quotations are not readily available or are deemed unreliable are valued at fair value using methods determined in good faith by or at the direction of the Trustees of the Fund in a manner that most fairly reflects the security’s “fair value”, which is the amount that the Fund might reasonably expect to receive for the security upon its current sale in the ordinary course. Each such determination is based on a consideration of relevant factors, which are likely to vary from one pricing context to another. These factors may include, but are not limited to, the type of security, the existence of any contractual restrictions on the security’s disposition, the price and extent of public trading in similar securities of the issuer or of comparable companies or entities, quotations or relevant information obtained from broker/dealers or other market participants, information obtained from the issuer, analysts, and/or the appropriate stock exchange (for exchange-traded securities), an analysis of the company’s or entity’s financial statements, and an evaluation of the forces that influence the issuer and the market(s) in which the security is purchased and sold.
B Investment Transactions — Investment transactions for financial statement purposes are accounted for on a trade date basis. Realized gains and losses on investments sold are determined on the basis of identified cost.
C Income — Dividend income is recorded on theex-dividend date for dividends received in cash and/or securities. Withholding taxes on foreign dividends and capital gains have been provided for in accordance with the Fund’s understanding of the applicable countries’ tax rules and rates.
D Federal Taxes — The Fund’s policy is to comply with the provisions of the Internal Revenue Code applicable to regulated investment companies and to distribute to shareholders each year substantially all of its net investment income, and all or substantially all of its net realized capital gains. Accordingly, no provision for federal income or excise tax is necessary.
As of December 31, 2019, the Fund had no uncertain tax positions that would require financial statement recognition,de-recognition, or disclosure. The Fund files a U.S. federal income tax return annually after its fiscalyear-end, which is subject to examination by the Internal Revenue Service for a period of three years from the date of filing.
E Expenses — The majority of expenses of the Trust are directly identifiable to an individual fund. Expenses which are not readily identifiable to a specific fund are allocated taking into consideration, among other things, the nature and type of expense and the relative size of the funds.
F Use of Estimates — The preparation of the financial statements in conformity with U.S. GAAP requires management to make estimates and assumptions that affect the reported amounts of assets and liabilities at the date of the financial statements and the reported amounts of income and expense during the reporting period. Actual results could differ from those estimates.
G Indemnifications — Under the Trust’s organizational documents, its officers and Trustees may be indemnified against certain liabilities and expenses arising out of the performance of their duties to the Fund. Under Massachusetts law, if certain conditions prevail, shareholders of a Massachusetts business trust (such as the Trust) could be deemed to have personal liability for the obligations of the Trust. However, the Trust’s Declaration of Trust contains an express disclaimer of liability on the part of Fund shareholders and theBy-laws provide that the Trust shall assume, upon request by the shareholder, the
| 17 |
Eaton Vance
Small-Cap Fund
December 31, 2019
Notes to Financial Statements — continued
defense on behalf of any Fund shareholders. Moreover, theBy-laws also provide for indemnification out of Fund property of any shareholder held personally liable solely by reason of being or having been a shareholder for all loss or expense arising from such liability. Additionally, in the normal course of business, the Fund enters into agreements with service providers that may contain indemnification clauses. The Fund’s maximum exposure under these arrangements is unknown as this would involve future claims that may be made against the Fund that have not yet occurred.
2 Distributions to Shareholders and Income Tax Information
It is the present policy of the Fund to make at least one distribution annually (normally in December) of all or substantially all of its net investment income and to distribute annually all or substantially all of its net realized capital gains. Distributions to shareholders are recorded on theex-dividend date. Distributions are declared separately for each class of shares. Shareholders may reinvest income and capital gain distributions in additional shares of the same class of the Fund at the net asset value as of theex-dividend date or, at the election of the shareholder, receive distributions in cash. Distributions to shareholders are determined in accordance with income tax regulations, which may differ from U.S. GAAP. As required by U.S. GAAP, only distributions in excess of tax basis earnings and profits are reported in the financial statements as a return of capital. Permanent differences between book and tax accounting relating to distributions are reclassified topaid-in capital. For tax purposes, distributions from short-term capital gains are considered to be from ordinary income.
The tax character of distributions declared for the years ended December 31, 2019 and December 31, 2018 was as follows:
| Year Ended December 31, | ||||||||
| 2019 | 2018 | |||||||
Ordinary income | $ | 427,797 | $ | 973,145 | ||||
Long-term capital gains | $ | 5,200,037 | $ | 6,327,172 | ||||
During the year ended December 31, 2019, distributable earnings was decreased by $572,808 andpaid-in capital was increased by $572,808 due to the Fund’s use of equalization accounting. Tax equalization accounting allows the Fund to treat as a distribution that portion of redemption proceeds representing a redeeming shareholder’s portion of undistributed taxable income and net capital gains. These reclassifications had no effect on the net assets or net asset value per share of the Fund.
As of December 31, 2019, the components of distributable earnings (accumulated loss) on a tax basis were as follows:
Undistributed ordinary income | $ | 118,700 | ||
Undistributed long-term capital gains | $ | 696,396 | ||
Net unrealized appreciation | $ | 18,959,996 | ||
The cost and unrealized appreciation (depreciation) of investments of the Fund at December 31, 2019, as determined on a federal income tax basis, were as follows:
Aggregate cost | $ | 68,235,647 | ||
Gross unrealized appreciation | $ | 20,173,024 | ||
Gross unrealized depreciation | (1,213,028 | ) | ||
Net unrealized appreciation | $ | 18,959,996 | ||
3 Investment Adviser Fee and Other Transactions with Affiliates
The investment adviser fee is earned by Boston Management and Research (BMR), a subsidiary of EVM, as compensation for investment advisory services rendered to the Fund. The fee is computed at an annual rate of 0.75% of the Fund’s average daily net assets up to $500 million and is payable monthly. On net assets of $500 million and over, the annual fee is reduced. For the year ended December 31, 2019, the Fund’s investment adviser fee amounted to $578,418 or 0.75% of the Fund’s average daily net assets. The Fund invests its cash in Cash Reserves Fund. EVM does not currently receive a fee for advisory services provided to Cash Reserves Fund. The administration fee is earned by EVM for administering the business affairs of the Fund and is computed at an annual rate of 0.15% of the Fund’s average daily net assets. For the year ended December 31, 2019, the administration fee amounted to $115,684.
| 18 |
Eaton Vance
Small-Cap Fund
December 31, 2019
Notes to Financial Statements — continued
EVM has agreed to reimburse the Fund’s expenses to the extent that total annual operating expenses (relating to ordinary operating expenses only) exceed 1.21%, 1.96%, 0.96% and 1.46% of the Fund’s average daily net assets for Class A, Class C, Class I and Class R, respectively. This agreement may be changed or terminated after April 30, 2020. Pursuant to this agreement, EVM was allocated $223,095 of the Fund’s operating expenses for the year ended December 31, 2019.
EVM providessub-transfer agency and related services to the Fund pursuant to aSub-Transfer Agency Support Services Agreement. For the year ended December 31, 2019, EVM earned $15,076 from the Fund pursuant to such agreement, which is included in transfer and dividend disbursing agent fees on the Statement of Operations. The Fund was informed that Eaton Vance Distributors, Inc. (EVD), an affiliate of EVM and the Fund’s principal underwriter, received $3,613 as its portion of the sales charge on sales of Class A shares for the year ended December 31, 2019. EVD also received distribution and service fees from Class A, Class C and Class R shares (see Note 4) and contingent deferred sales charges (see Note 5).
Trustees and officers of the Fund who are members of EVM’s or BMR’s organizations receive remuneration for their services to the Fund out of the investment adviser fee. Trustees of the Fund who are not affiliated with the investment adviser may elect to defer receipt of all or a percentage of their annual fees in accordance with the terms of the Trustees Deferred Compensation Plan. For the year ended December 31, 2019, no significant amounts have been deferred. Certain officers and Trustees of the Fund are officers of the above organizations.
4 Distribution Plans
The Fund has in effect a distribution plan for Class A shares (Class A Plan) pursuant to Rule12b-1 under the 1940 Act. Pursuant to the Class A Plan, the Fund pays EVD a distribution and service fee of 0.25% per annum of its average daily net assets attributable to Class A shares for distribution services and facilities provided to the Fund by EVD, as well as for personal services and/or the maintenance of shareholder accounts. Distribution and service fees paid or accrued to EVD for the year ended December 31, 2019 amounted to $60,738 for Class A shares.
The Fund also has in effect distribution plans for Class C shares (Class C Plan) and Class R shares (Class R Plan) pursuant to Rule12b-1 under the 1940 Act. Pursuant to the Class C Plan, the Fund pays EVD amounts equal to 0.75% per annum of its average daily net assets attributable to Class C shares for providing ongoing distribution services and facilities to the Fund. For the year ended December 31, 2019, the Fund paid or accrued to EVD $36,669 for Class C shares.
The Class R Plan requires the Fund to pay EVD an amount up to 0.50% per annum of its average daily net assets attributable to Class R shares for providing ongoing distribution services and facilities to the Fund. The Trustees of the Trust have currently limited Class R distribution payments to 0.25% per annum of the average daily net assets attributable to Class R shares. For the year ended December 31, 2019, the Fund paid or accrued to EVD $2,412 for Class R shares.
Pursuant to the Class C and Class R Plans, the Fund also makes payments of service fees to EVD, financial intermediaries and other persons in amounts equal to 0.25% per annum of its average daily net assets attributable to that class. Service fees paid or accrued are for personal services and/or the maintenance of shareholder accounts. They are separate and distinct from the sales commissions and distribution fees payable to EVD. Service fees paid or accrued for the year ended December 31, 2019 amounted to $12,222 and $2,412 for Class C and Class R shares, respectively.
Distribution and service fees are subject to the limitations contained in the Financial Industry Regulatory Authority Rule 2341(d).
5 Contingent Deferred Sales Charges
A contingent deferred sales charge (CDSC) of 1% generally is imposed on redemptions of Class C shares made within one year of purchase. Class A shares may be subject to a 1% CDSC if redeemed within 18 months of purchase (depending on the circumstances of purchase). Generally, the CDSC is based upon the lower of the net asset value at date of redemption or date of purchase. No charge is levied on shares acquired by reinvestment of dividends or capital gain distributions. For the year ended December 31, 2019, the Fund was informed that EVD received approximately $1,000 of CDSCs paid by Class C shareholders and no CDSCs paid by Class A shareholders.
6 Purchases and Sales of Investments
Purchases and sales of investments, other than short-term obligations, aggregated $47,476,830 and $41,328,641, respectively, for the year ended December 31, 2019.
| 19 |
Eaton Vance
Small-Cap Fund
December 31, 2019
Notes to Financial Statements — continued
7 Shares of Beneficial Interest
The Fund’s Declaration of Trust permits the Trustees to issue an unlimited number of full and fractional shares of beneficial interest (without par value). Such shares may be issued in a number of different series (such as the Fund) and classes. Transactions in Fund shares were as follows:
| Year Ended December 31, | ||||||||
| Class A | 2019 | 2018 | ||||||
Sales | 252,982 | 258,149 | ||||||
Issued to shareholders electing to receive payments of distributions in Fund shares | 127,108 | 185,092 | ||||||
Redemptions | (441,932 | ) | (593,147 | ) | ||||
Converted from Class C shares | 180,687 | — | ||||||
Net increase (decrease) | 118,845 | (149,906 | ) | |||||
| Year Ended December 31, | ||||||||
| Class C | 2019 | 2018 | ||||||
Sales | 61,141 | 186,200 | ||||||
Issued to shareholders electing to receive payments of distributions in Fund shares | 35,006 | 100,851 | ||||||
Redemptions | (251,122 | ) | (339,855 | ) | ||||
Converted to Class A shares | (220,838 | ) | — | |||||
Net decrease | (375,813 | ) | (52,804 | ) | ||||
| Year Ended December 31, | ||||||||
| Class I | 2019 | 2018 | ||||||
Sales | 1,613,928 | 440,035 | ||||||
Issued to shareholders electing to receive payments of distributions in Fund shares | 225,769 | 288,950 | ||||||
Redemptions | (822,530 | ) | (1,044,718 | ) | ||||
Net increase (decrease) | 1,017,167 | (315,733 | ) | |||||
| Year Ended December 31, | ||||||||
| Class R | 2019 | 2018 | ||||||
Sales | 20,396 | 30,244 | ||||||
Issued to shareholders electing to receive payments of distributions in Fund shares | 4,192 | 8,071 | ||||||
Redemptions | (52,386 | ) | (20,029 | ) | ||||
Net increase (decrease) | (27,798 | ) | 18,286 | |||||
8 Line of Credit
The Fund participates with other portfolios and funds managed by EVM and its affiliates in an $800 million unsecured line of credit agreement with a group of banks, which is in effect through October 27, 2020. In connection with the renewal of the agreement on October 29, 2019, funds managed by Calvert Research and Management, an affiliate of EVM, were added as participating funds to the agreement and the borrowing limit was increased from $625 million. Borrowings are made by the Fund solely to facilitate the handling of unusual and/or unanticipated short-term cash requirements. Interest is charged to the Fund based on its borrowings at an amount above either the Eurodollar rate or Federal Funds rate. In addition, a fee computed at an annual rate of 0.15% on the daily unused portion of the line of credit is allocated among the participating portfolios and funds at the end of each quarter. Because the line of credit is not available exclusively to the Fund, it may be unable to borrow some or all of its requested amounts at any particular time. The Fund did not have any significant borrowings or allocated fees during the year ended December 31, 2019.
| 20 |
Eaton Vance
Small-Cap Fund
December 31, 2019
Notes to Financial Statements — continued
9 Investments in Affiliated Funds
At December 31, 2019, the value of the Fund’s investment in affiliated funds was $1,022,542, which represents 1.2% of the Fund’s net assets. Transactions in affiliated funds by the Fund for the year ended December 31, 2019 were as follows:
| Name of affiliated fund | Value, beginning of period | Purchases | Sales proceeds | Net realized gain (loss) | Change in unrealized appreciation (depreciation) | Value, end of period | Dividend income | Units, end of period | ||||||||||||||||||||||||
Short-Term Investments |
| |||||||||||||||||||||||||||||||
Eaton Vance Cash Reserves Fund, LLC, 1.78% | $ | 40,124 | $ | 34,243,907 | $ | (33,261,556 | ) | $ | (27 | ) | $ | 94 | $ | 1,022,542 | $ | 19,171 | 1,022,542 | |||||||||||||||
10 Fair Value Measurements
Under generally accepted accounting principles for fair value measurements, a three-tier hierarchy to prioritize the assumptions, referred to as inputs, is used in valuation techniques to measure fair value. The three-tier hierarchy of inputs is summarized in the three broad levels listed below.
| • | Level 1 – quoted prices in active markets for identical investments |
| • | Level 2 – other significant observable inputs (including quoted prices for similar investments, interest rates, prepayment speeds, credit risk, etc.) |
| • | Level 3 – significant unobservable inputs (including a fund’s own assumptions in determining the fair value of investments) |
In cases where the inputs used to measure fair value fall in different levels of the fair value hierarchy, the level disclosed is determined based on the lowest level input that is significant to the fair value measurement in its entirety. The inputs or methodology used for valuing securities are not necessarily an indication of the risk associated with investing in those securities.
At December 31, 2019, the hierarchy of inputs used in valuing the Fund’s investments, which are carried at value, were as follows:
| Asset Description | Level 1 | Level 2 | Level 3 | Total | ||||||||||||
Common Stocks | $ | 86,173,101 | * | $ | — | $ | — | $ | 86,173,101 | |||||||
Short-Term Investments | — | 1,022,542 | — | 1,022,542 | ||||||||||||
Total Investments | $ | 86,173,101 | $ | 1,022,542 | $ | — | $ | 87,195,643 | ||||||||
| * | The level classification by major category of investments is the same as the category presentation in the Portfolio of Investments. |
| 21 |
Eaton Vance
Small-Cap Fund
December 31, 2019
Report of Independent Registered Public Accounting Firm
To the Trustees of Eaton Vance Special Investment Trust and Shareholders of Eaton VanceSmall-Cap Fund:
Opinion on the Financial Statements and Financial Highlights
We have audited the accompanying statement of assets and liabilities of Eaton VanceSmall-Cap Fund (the “Fund”) (one of the funds constituting Eaton Vance Special Investment Trust), including the portfolio of investments, as of December 31, 2019, the related statement of operations for the year then ended, the statements of changes in net assets for each of the two years in the period then ended, the financial highlights for each of the five years in the period then ended, and the related notes. In our opinion, the financial statements and financial highlights present fairly, in all material respects, the financial position of the Fund as of December 31, 2019, and the results of its operations for the year then ended, the changes in its net assets for each of the two years in the period then ended, and the financial highlights for each of the five years in the period then ended, in conformity with accounting principles generally accepted in the United States of America.
Basis for Opinion
These financial statements and financial highlights are the responsibility of the Fund’s management. Our responsibility is to express an opinion on the Fund’s financial statements and financial highlights based on our audits. We are a public accounting firm registered with the Public Company Accounting Oversight Board (United States) (PCAOB) and are required to be independent with respect to the Fund in accordance with the U.S. federal securities laws and the applicable rules and regulations of the Securities and Exchange Commission and the PCAOB.
We conducted our audits in accordance with the standards of the PCAOB. Those standards require that we plan and perform the audit to obtain reasonable assurance about whether the financial statements and financial highlights are free of material misstatement, whether due to error or fraud. The Fund is not required to have, nor were we engaged to perform, an audit of its internal control over financial reporting. As part of our audits we are required to obtain an understanding of internal control over financial reporting but not for the purpose of expressing an opinion on the effectiveness of the Fund’s internal control over financial reporting. Accordingly, we express no such opinion.
Our audits included performing procedures to assess the risks of material misstatement of the financial statements and financial highlights, whether due to error or fraud, and performing procedures that respond to those risks. Such procedures included examining, on a test basis, evidence regarding the amounts and disclosures in the financial statements and financial highlights. Our audits also included evaluating the accounting principles used and significant estimates made by management, as well as evaluating the overall presentation of the financial statements and financial highlights. Our procedures included confirmation of securities owned as of December 31, 2019, by correspondence with the custodian and brokers; when replies were not received from brokers, we performed other auditing procedures. We believe that our audits provide a reasonable basis for our opinion.
/s/ Deloitte & Touche LLP
Boston, Massachusetts
February 21, 2020
We have served as the auditor of one or more Eaton Vance investment companies since 1959.
| 22 |
Eaton Vance
Small-Cap Fund
December 31, 2019
Federal Tax Information (Unaudited)
The Form1099-DIV you received in February 2020 showed the tax status of all distributions paid to your account in calendar year 2019. Shareholders are advised to consult their own tax adviser with respect to the tax consequences of their investment in the Fund. As required by the Internal Revenue Code and/or regulations, shareholders must be notified regarding the status of qualified dividend income for individuals, the dividends received deduction for corporations and capital gains dividends.
Qualified Dividend Income. For the fiscal year ended December 31, 2019, the Fund designates approximately $646,056, or up to the maximum amount of such dividends allowable pursuant to the Internal Revenue Code, as qualified dividend income eligible for the reduced tax rate of 15%.
Dividends Received Deduction. Corporate shareholders are generally entitled to take the dividends received deduction on the portion of the Fund’s dividend distribution that qualifies under tax law. For the Fund’s fiscal 2019 ordinary income dividends, 98.37% qualifies for the corporate dividends received deduction.
Capital Gains Dividends. The Fund hereby designates as a capital gain dividend with respect to the taxable year ended December 31, 2019, $4,724,070 or, if subsequently determined to be different, the net capital gain of such year.
| 23 |
Eaton Vance
Small-Cap Fund
December 31, 2019
Management and Organization
Fund Management. The Trustees of Eaton Vance Special Investment Trust (the Trust) are responsible for the overall management and supervision of the Trust’s affairs. The Trustees and officers of the Trust are listed below. Except as indicated, each individual has held the office shown or other offices in the same company for the last five years. Trustees and officers of the Trust hold indefinite terms of office. The “noninterested Trustees” consist of those Trustees who are not “interested persons” of the Trust, as that term is defined under the 1940 Act. The business address of each Trustee and officer is Two International Place, Boston, Massachusetts 02110. As used below, “EVC” refers to Eaton Vance Corp., “EV” refers to Eaton Vance, Inc., “EVM” refers to Eaton Vance Management, “BMR” refers to Boston Management and Research and “EVD” refers to Eaton Vance Distributors, Inc. EVC and EV are the corporate parent and trustee, respectively, of EVM and BMR. EVD is the Fund’s principal underwriter and a wholly-owned subsidiary of EVC. Each officer affiliated with Eaton Vance may hold a position with other Eaton Vance affiliates that is comparable to his or her position with EVM listed below. Each Trustee oversees 159 portfolios in the Eaton Vance Complex (including all master and feeder funds in a master feeder structure). Each officer serves as an officer of certain other Eaton Vance funds. Each Trustee and officer serves until his or her successor is elected.
| Name and Year of Birth | Position(s) with the Trust | Trustee Since(1) | Principal Occupation(s) and Directorships During Past Five Years and Other Relevant Experience | |||
| Interested Trustee | ||||||
Thomas E. Faust Jr. 1958 | Trustee | 2007 | Chairman, Chief Executive Officer and President of EVC, Director and President of EV, Chief Executive Officer and President of EVM and BMR, and Director of EVD. Trustee and/or officer of 159 registered investment companies. Mr. Faust is an interested person because of his positions with EVM, BMR, EVD, EVC and EV, which are affiliates of the Trust. Directorships in the Last Five Years.Director of EVC and Hexavest Inc. (investment management firm). | |||
| Noninterested Trustees | ||||||
Mark R. Fetting 1954 | Trustee | 2016 | Private investor. Formerly held various positions at Legg Mason, Inc. (investment management firm) (2000-2012), including President, Chief Executive Officer, Director and Chairman (2008-2012), Senior Executive Vice President (2004-2008) and Executive Vice President (2001-2004). Formerly, President of Legg Mason family of funds (2001-2008). Formerly, Division President and Senior Officer of Prudential Financial Group, Inc. and related companies (investment management firm)(1991-2000). Other Directorships in the Last Five Years. None. | |||
Cynthia E. Frost 1961 | Trustee | 2014 | Private investor. Formerly, Chief Investment Officer of Brown University (university endowment) (2000-2012). Formerly, Portfolio Strategist for Duke Management Company (university endowment manager) (1995-2000). Formerly, Managing Director, Cambridge Associates (investment consulting company) (1989-1995). Formerly, Consultant, Bain and Company (management consulting firm) (1987-1989). Formerly, Senior Equity Analyst, BA Investment Management Company (1983-1985). Other Directorships in the Last Five Years.None. | |||
George J. Gorman 1952 | Trustee | 2014 | Principal at George J. Gorman LLC (consulting firm). Formerly, Senior Partner at Ernst & Young LLP (a registered public accounting firm) (1974-2009). Other Directorships in the Last Five Years.Formerly, Trustee of the BofA Funds Series Trust (11 funds) (2011-2014) and of the Ashmore Funds (9 funds) (2010-2014). | |||
Valerie A. Mosley 1960 | Trustee | 2014 | Chairwoman and Chief Executive Officer of Valmo Ventures (a consulting and investment firm). Former Partner and Senior Vice President, Portfolio Manager and Investment Strategist at Wellington Management Company, LLP (investment management firm) (1992-2012). Former Chief Investment Officer, PG Corbin Asset Management (1990-1992). Formerly worked in institutional corporate bond sales at Kidder Peabody (1986-1990). Other Directorships in the Last Five Years.Director of Envestnet, Inc. (provider of intelligent systems for wealth management and financial wellness) (since 2018). Director of Dynex Capital, Inc. (mortgage REIT) (since 2013). | |||
William H. Park 1947 | Chairperson of the Board and Trustee | 2016 (Chairperson) 2003 (Trustee) | Private investor. Formerly, Consultant (management and transactional) (2012-2014). Formerly, Chief Financial Officer, Aveon Group L.P. (investment management firm) (2010-2011). Formerly, Vice Chairman, Commercial Industrial Finance Corp. (specialty finance company) (2006-2010). Formerly, President and Chief Executive Officer, Prizm Capital Management, LLC (investment management firm) (2002-2005). Formerly, Executive Vice President and Chief Financial Officer, United Asset Management Corporation (investment management firm) (1982-2001). Formerly, Senior Manager, Price Waterhouse (now PricewaterhouseCoopers) (a registered public accounting firm) (1972-1981). Other Directorships in the Last Five Years.None. | |||
| 24 |
Eaton Vance
Small-Cap Fund
December 31, 2019
Management and Organization — continued
| Name and Year of Birth | Position(s) with the Trust | Trustee Since(1) | Principal Occupation(s) and Directorships During Past Five Years and Other Relevant Experience | |||
| Noninterested Trustees (continued) | ||||||
Helen Frame Peters 1948 | Trustee | 2008 | Professor of Finance, Carroll School of Management, Boston College. Formerly, Dean, Carroll School of Management, Boston College (2000-2002). Formerly, Chief Investment Officer, Fixed Income, Scudder Kemper Investments (investment management firm) (1998-1999). Formerly, Chief Investment Officer, Equity and Fixed Income, Colonial Management Associates (investment management firm) (1991-1998). Other Directorships in the Last Five Years. None. | |||
Keith Quinton 1958 | Trustee | 2018 | Independent Investment Committee Member at New Hampshire Retirement System (since 2017). Advisory Committee member at Northfield Information Services, Inc. (risk management analytics provider) (since 2016). Formerly, Portfolio Manager and Senior Quantitative Analyst at Fidelity Investments (investment management firm) (2001-2014). Other Directorships in the Last Five Years. Director of New Hampshire Municipal Bond Bank (since 2016). | |||
Marcus L. Smith 1966 | Trustee | 2018 | Member of Posse Boston Advisory Board (foundation) (since 2015). Trustee at University of Mount Union (since 2008). Formerly, Portfolio Manager at MFS Investment Management (investment management firm) (1994-2017). Other Directorships in the Last Five Years. Director of MSCI Inc. (global provider of investment decision support tools) (since 2017). Formerly, Director of DCT Industrial Trust Inc. (logistics real estate company) (2017-2018). | |||
Susan J. Sutherland 1957 | Trustee | 2015 | Private investor. Formerly, Associate, Counsel and Partner at Skadden, Arps, Slate, Meagher & Flom LLP (law firm) (1982-2013). Other Directorships in the Last Five Years. Formerly, Director of Montpelier Re Holdings Ltd. (global provider of customized insurance and reinsurance products) (2013-2015). | |||
Scott E. Wennerholm 1959 | Trustee | 2016 | Formerly, Trustee at Wheelock College (postsecondary institution) (2012-2018). Formerly, Consultant at GF Parish Group (executive recruiting firm) (2016-2017). Formerly, Chief Operating Officer and Executive Vice President at BNY Mellon Asset Management (investment management firm) (2005-2011). Formerly, Chief Operating Officer and Chief Financial Officer at Natixis Global Asset Management (investment management firm) (1997-2004). Formerly, Vice President at Fidelity Investments Institutional Services (investment management firm) (1994-1997). Other Directorships in the Last Five Years. None. | |||
| Name and Year of Birth | Position(s) with the Trust | Officer Since(2) | Principal Occupation(s) During Past Five Years | |||
| Principal Officers who are not Trustees | ||||||
Payson F. Swaffield 1956 | President | 2003 | Vice President and Chief Income Investment Officer of EVM and BMR. Also Vice President of Calvert Research and Management (“CRM”). | |||
Maureen A. Gemma 1960 | Vice President, Secretary and Chief Legal Officer | 2005 | Vice President of EVM and BMR. Also Vice President of CRM. | |||
James F. Kirchner 1967 | Treasurer | 2007 | Vice President of EVM and BMR. Also Vice President of CRM. | |||
Richard F. Froio 1968 | Chief Compliance Officer | 2017 | Vice President of EVM and BMR since 2017. Formerly Deputy Chief Compliance Officer (Adviser/Funds) and Chief Compliance Officer (Distribution) at PIMCO (2012-2017) and Managing Director at BlackRock/Barclays Global Investors (2009-2012). | |||
| (1) | Year first appointed to serve as Trustee for a fund in the Eaton Vance family of funds. Each Trustee has served continuously since appointment unless indicated otherwise. |
| (2) | Year first elected to serve as officer of a fund in the Eaton Vance family of funds when the officer has served continuously. Otherwise, year of most recent election as an officer of a fund in the Eaton Vance family of funds. Titles may have changed since initial election. |
The SAI for the Fund includes additional information about the Trustees and officers of the Fund and can be obtained without charge on Eaton Vance’s website at www.eatonvance.com or by calling1-800-262-1122.
| 25 |
Eaton Vance Funds
IMPORTANT NOTICES
Privacy. The Eaton Vance organization is committed to ensuring your financial privacy. Each entity listed below has adopted a privacy policy and procedures (“Privacy Program”) Eaton Vance believes is reasonably designed to protect your personal information and to govern when and with whom Eaton Vance may share your personal information.
| • | At the time of opening an account, Eaton Vance generally requires you to provide us with certain information such as name, address, social security number, tax status, account numbers, and account balances. This information is necessary for us to both open an account for you and to allow us to satisfy legal requirements such as applicable anti-money laundering reviews and know-your-customer requirements. |
| • | On an ongoing basis, in the normal course of servicing your account, Eaton Vance may share your information with unaffiliated third parties that perform various services for Eaton Vance and/or your account. These third parties include transfer agents, custodians, broker/dealers and our professional advisers, including auditors, accountants, and legal counsel. Eaton Vance may additionally share your personal information with our affiliates. |
| • | We believe our Privacy Program is reasonably designed to protect the confidentiality of your personal information and to prevent unauthorized access to that information. |
| • | We reserve the right to change our Privacy Program at any time upon proper notification to you. You may want to review our Privacy Program periodically for changes by accessing the link on our homepage: www.eatonvance.com. |
Our pledge of protecting your personal information applies to the following entities within the Eaton Vance organization: the Eaton Vance Family of Funds, Eaton Vance Management, Eaton Vance Investment Counsel, Eaton Vance Distributors, Inc., Eaton Vance Trust Company, Eaton Vance Management (International) Limited, Eaton Vance Advisers International Limited, Eaton Vance Global Advisors Limited, Eaton Vance Management’s Real Estate Investment Group, Boston Management and Research, Calvert Research and Management, and Calvert Funds. This Privacy Notice supersedes all previously issued privacy disclosures. For more information about our Privacy Program or about how your personal information may be used, please call1-800-262-1122.
Delivery of Shareholder Documents. The Securities and Exchange Commission (SEC) permits funds to deliver only one copy of shareholder documents, including prospectuses, proxy statements and shareholder reports, to fund investors with multiple accounts at the same residential or post office box address. This practice is often called “householding” and it helps eliminate duplicate mailings to shareholders.Eaton Vance, or your financial intermediary, may household the mailing of your documents indefinitely unless you instruct Eaton Vance, or your financial intermediary, otherwise.If you would prefer that your Eaton Vance documents not be householded, please contact Eaton Vance at1-800-262-1122, or contact your financial intermediary. Your instructions that householding not apply to delivery of your Eaton Vance documents will typically be effective within 30 days of receipt by Eaton Vance or your financial intermediary.
Portfolio Holdings. Each Eaton Vance Fund and its underlying Portfolio(s) (if applicable) files a schedule of portfolio holdings on Part F toForm N-PORT with the SEC for the first and third quarters of each fiscal year. The FormN-PORT will be available on the Eaton Vance website at www.eatonvance.com, by calling Eaton Vance at1-800-262-1122 or in the EDGAR database on the SEC’s website at www.sec.gov.
Proxy Voting. From time to time, funds are required to vote proxies related to the securities held by the funds. The Eaton Vance Funds or their underlying Portfolios (if applicable) vote proxies according to a set of policies and procedures approved by the Funds’ and Portfolios’ Boards. You may obtain a description of these policies and procedures and information on how the Funds or Portfolios voted proxies relating to portfolio securities during the most recent12-month period ended June 30, without charge, upon request, by calling1-800-262-1122 and by accessing the SEC’s website at www.sec.gov.
| 26 |
This Page Intentionally Left Blank
This Page Intentionally Left Blank
Investment Adviser
Boston Management and Research
Two International Place
Boston, MA 02110
Administrator
Eaton Vance Management
Two International Place
Boston, MA 02110
Principal Underwriter*
Eaton Vance Distributors, Inc.
Two International Place
Boston, MA 02110
(617)482-8260
Custodian
State Street Bank and Trust Company
State Street Financial Center, One Lincoln Street
Boston, MA 02111
Transfer Agent
BNY Mellon Investment Servicing (US) Inc.
Attn: Eaton Vance Funds
P.O. Box 9653
Providence, RI 02940-9653
(800)262-1122
Independent Registered Public Accounting Firm
Deloitte & Touche LLP
200 Berkeley Street
Boston, MA 02116-5022
Fund Offices
Two International Place
Boston, MA 02110
| * | FINRA BrokerCheck. Investors may check the background of their Investment Professional by contacting the Financial Industry Regulatory Authority (FINRA). FINRA BrokerCheck is a free tool to help investors check the professional background of current and former FINRA-registered securities firms and brokers. FINRA BrokerCheck is available by calling1-800-289-9999 and at www.FINRA.org. The FINRA BrokerCheck brochure describing this program is available to investors at www.FINRA.org. |

164 12.31.19

Eaton Vance
Special Equities Fund
Annual Report
December 31, 2019
Important Note. Beginning on January 1, 2021, as permitted by regulations adopted by the Securities and Exchange Commission, paper copies of the Fund’s annual and semi-annual shareholder reports will no longer be sent by mail unless you specifically request paper copies of the reports. Instead, the reports will be made available on the Fund’s website (eatonvance.com/funddocuments), and you will be notified by mail each time a report is posted and provided with a website address to access the report.
If you already elected to receive shareholder reports electronically, you will not be affected by this change and you need not take any action. If you are a direct investor, you may elect to receive shareholder reports and other communications from the Fund electronically by signing up for e-Delivery at eatonvance.com/edelivery. If you own your shares through a financial intermediary (such as a broker-dealer or bank), you must contact your financial intermediary to sign up.
You may elect to receive all future Fund shareholder reports in paper free of charge. If you are a direct investor, you can inform the Fund that you wish to continue receiving paper copies of your shareholder reports by calling 1-800-262-1122. If you own these shares through a financial intermediary, you must contact your financial intermediary or follow instructions included with this disclosure, if applicable, to elect to continue to receive paper copies of your shareholder reports. Your election to receive reports in paper will apply to all Eaton Vance funds held directly or to all funds held through your financial intermediary, as applicable.

Commodity Futures Trading Commission Registration. Effective December 31, 2012, the Commodity Futures Trading Commission (“CFTC”) adopted certain regulatory changes that subject registered investment companies and advisers to regulation by the CFTC if a fund invests more than a prescribed level of its assets in certain CFTC-regulated instruments (including futures, certain options and swap agreements) or markets itself as providing investment exposure to such instruments. The Fund has claimed an exclusion from the definition of the term “commodity pool operator” under the Commodity Exchange Act. Accordingly, neither the Fund nor the adviser with respect to the operation of the Fund is subject to CFTC regulation. Because of its management of other strategies, the Fund’s adviser is registered with the CFTC as a commodity pool operator and a commodity trading advisor.
Fund shares are not insured by the FDIC and are not deposits or other obligations of, or guaranteed by, any depository institution. Shares are subject to investment risks, including possible loss of principal invested.
This report must be preceded or accompanied by a current summary prospectus or prospectus. Before investing, investors should consider carefully the investment objective, risks, and charges and expenses of a mutual fund. This and other important information is contained in the summary prospectus and prospectus, which can be obtained from a financial intermediary. Prospective investors should read the prospectus carefully before investing. For further information, please call 1-800-262-1122.
Annual ReportDecember 31, 2019
Eaton Vance
Special Equities Fund
Table of Contents
Management’s Discussion of Fund Performance | 2 | |||
Performance | 3 | |||
Fund Profile | 4 | |||
Endnotes and Additional Disclosures | 5 | |||
Fund Expenses | 6 | |||
Financial Statements | 7 | |||
Report of Independent Registered Public Accounting Firm | 21 | |||
Federal Tax Information | 22 | |||
Management and Organization | 23 | |||
Important Notices | 26 | |||
Eaton Vance
Special Equities Fund
December 31, 2019
Management’s Discussion of Fund Performance1
Economic and Market Conditions
With virtually every U.S. equity index posting strong double-digit returns for the 12-month period ended December 31, 2019 — and bond markets solidly in the black as well — 2019 was a good year for investments.
As the new year dawned in January 2019, investors appeared to be taking a “glass is half full” approach. Although U.S. manufacturing output and business investment remained weak — held back by slowing global growth and an on-again/off-again U.S.-China trade war — strong spending by U.S. consumers and dovish remarks by the U.S. Federal Reserve (the Fed) combined to lift investor sentiment. After four federal funds rate hikes the previous year, markets began to project the Fed might actually lower rates in 2019 to stimulate the economy. U.S. unemployment, meanwhile, remained low and hiring remained strong.
As a result, U.S. stocks across multiple markets climbed from January through April 2019. Overseas, central banks around the world began to cut interest rates and employ other tools to stimulate their respective economies. Even a global stock pullback in May — sparked by heightened concerns about the U.S.-China trade spat — proved to be temporary, and the U.S. and global stock rallies resumed in June and July.
After holding interest rates steady through the first half of the year, the Fed cut the federal funds rate on July 31, 2019 — its first reduction in over a decade — followed by two additional rate cuts in September and October to end the period at 1.50%-1.75%. By end of the third quarter, 60 central banks around the world had lowered their interest rates as well.
After falling in August, U.S. equities rallied again during the final months of the period, spurred by optimism about a U.S.-China trade détente and better-than-expected U.S. employment reports. The year ended with two events in December that did much to allay investor concerns about international trade and tariffs: passage of the United States-Mexico-Canada Agreement by the U.S. House of Representatives and the Trump administration’s agreement to a so-called “phase–one” trade deal with China.
During the 12-month period ended December 31, 2019, the blue-chip Dow Jones Industrial Average®2 returned 25.34%, while the broader U.S. equity market, as measured by the S&P 500® Index, returned 31.49%. The technology-laden Nasdaq Composite Index returned 36.69% during the period. Large-cap U.S. stocks, as measured by the S&P 500® Index, generally outperformed their small-cap counterparts, as measured by the Russell 2000® Index. As a group, growth stocks outpaced value stocks in both large- and small-cap categories, as measured by the Russell growth and value indexes.
Fund Performance
For the 12-month period ended December 31, 2019, Eaton Vance Special Equities Fund returned 28.12% for Class A shares at net asset value (NAV), outperforming its benchmark, the Russell 2500TM Index (the Index), which returned 27.77%.
The Fund outperformed the Index largely due to stock selection. Sector and industry allocations within sectors also made positive contributions to Fund performance relative to the Index. Of the 11 market sectors within the Index, the Fund had positive returns in nine of the 10 sectors in which it was invested. The Index itself had positive returns in 10 sectors.
The financials sector contributed most to relative Fund performance versus the Index, due to stock selection and an underweight position in this lagging sector. The Fund’s top-performing individual stock within this sector was asset manager Cohen & Steers, Inc., which specializes in real estate investment trusts (REITs). The company beat earnings forecasts behind strong investor demand for REITs, as investors pursued investments offering higher levels of income in the declining interest-rate environment. Specialty insurer Kinsale Capital Group, Inc. (Kinsale) was also among the Fund’s leading stocks amid rapid growth and market-share gains. By period-end, Kinsale was sold from the Fund.
Stock selection along with an overweight position in the outperforming industrials sector also boosted Fund performance relative to the Index. In particular, the commercial services & supplies industry and the road & rail industry delivered notable results during the period. Railroad firm Kansas City Southern was one of the Fund’s leading individual stocks after reporting solid earnings growth.
The health care industry contributed to relative Fund returns versus the Index thanks to stock selection along with an overweight position in this outperforming sector. In the pharmaceuticals industry, contract manufacturer Catalent, Inc. was among the Fund’s leading stocks amid better-than-forecast earnings and two large acquisitions.
Conversely, the information technology sector — the highest performing sector in the Index — was the Fund’s biggest detractor from relative performance versus the Index, due to stock selection as well as an underweight position. In particular, the Fund’s lack of exposure to the semiconductors & semiconductor equipment industry, which outperformed the Index, constrained relative Fund returns during the period. In the software industry, RealPage, Inc., which provides software to the real estate industry, was one of the Fund’s poorest-performing stocks amid slowing growth.
The consumer discretionary sector also detracted from Fund performance relative to the Index during the period. In the diversified consumer services industry, online education provider Grand Canyon Education, Inc. was among the Fund’s weakest individual stocks as it dealt with regulatory issues. Gildan Activewear, Inc. (Gildan), a supplier of T-shirts to corporate customers, also lagged during the period amid weak demand. By period-end, Gildan was sold from the Fund.
Stock selection in the communication services sector also constrained Fund performance relative to the Index. The Fund’s worst-performing stock during the period was Eventbrite, Inc. (Eventbrite), a supplier of event-planning software. The company reported disappointing earnings and also experienced problems integrating a major acquisition. By period-end, Eventbrite was sold from the Fund.
See Endnotes and Additional Disclosures in this report.
Past performance is no guarantee of future results. Returns are historical and are calculated by determining the percentage change in net asset value (NAV) or offering price (as applicable) with all distributions reinvested. Investment return and principal value will fluctuate so that shares, when redeemed, may be worth more or less than their original cost. Performance for periods less than or equal to one year is cumulative. Performance is for the stated time period only; due to market volatility, current Fund performance may be lower or higher than the quoted return. For performance as of the most recent month-end, please refer to eatonvance.com.
| 2 |
Eaton Vance
Special Equities Fund
December 31, 2019
Performance2,3
Portfolio Managers Michael D. McLean, CFA and J. Griffith Noble, CFA
| % Average Annual Total Returns | Class Inception Date | Performance Inception Date | One Year | Five Years | Ten Years | |||||||||||||||
Class A at NAV | 04/22/1968 | 04/22/1968 | 28.12 | % | 9.48 | % | 10.70 | % | ||||||||||||
Class A with 5.75% Maximum Sales Charge | — | — | 20.75 | 8.20 | 10.05 | |||||||||||||||
Class C at NAV | 11/17/1994 | 04/22/1968 | 27.14 | 8.66 | 9.87 | |||||||||||||||
Class C with 1% Maximum Sales Charge | — | — | 26.14 | 8.66 | 9.87 | |||||||||||||||
Class I at NAV | 07/29/2011 | 04/22/1968 | 28.40 | 9.76 | 10.94 | |||||||||||||||
Russell 2500™ Index | — | — | 27.77 | % | 8.92 | % | 12.57 | % | ||||||||||||
| % Total Annual Operating Expense Ratios4 | Class A | Class C | Class I | |||||||||||||||||
Gross | 1.37 | % | 2.12 | % | 1.12 | % | ||||||||||||||
Net | 1.20 | 1.95 | 0.95 | |||||||||||||||||
Growth of $10,000
This graph shows the change in value of a hypothetical investment of $10,000 in Class A of the Fund for the period indicated. For comparison, the same investment is shown in the indicated index.
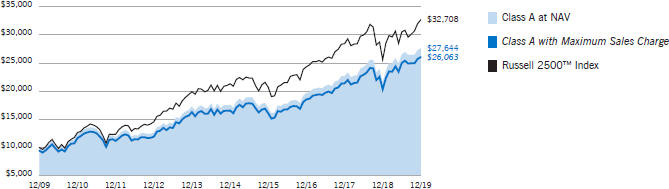
| Growth of Investment3 | Amount Invested | Period Beginning | At NAV | With Maximum Sales Charge | ||||||||||||
Class C | $ | 10,000 | 12/31/2009 | $ | 25,646 | N.A. | ||||||||||
Class I | $ | 250,000 | 12/31/2009 | $ | 706,170 | N.A. | ||||||||||
See Endnotes and Additional Disclosures in this report.
Past performance is no guarantee of future results. Returns are historical and are calculated by determining the percentage change in net asset value (NAV) or offering price (as applicable) with all distributions reinvested. Investment return and principal value will fluctuate so that shares, when redeemed, may be worth more or less than their original cost. Performance for periods less than or equal to one year is cumulative. Performance is for the stated time period only; due to market volatility, current Fund performance may be lower or higher than the quoted return. For performance as of the most recent month-end, please refer to eatonvance.com.
| 3 |
Eaton Vance
Special Equities Fund
December 31, 2019
Fund Profile
Sector Allocation (% of net assets)5
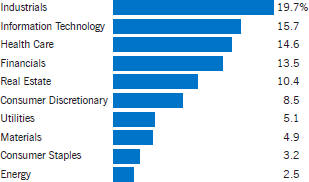
Top 10 Holdings (% of net assets)5
ACI Worldwide, Inc. | 3.2 | % | ||
Choice Hotels International, Inc. | 2.5 | |||
RealPage, Inc. | 2.3 | |||
Euronet Worldwide, Inc. | 2.3 | |||
Black Knight, Inc. | 2.3 | |||
Hexcel Corp. | 2.2 | |||
Kansas City Southern | 2.0 | |||
Rexford Industrial Realty, Inc. | 1.9 | |||
National Retail Properties, Inc. | 1.8 | |||
Mueller Water Products, Inc., Class A | 1.8 | |||
Total | 22.3 | % | ||
See Endnotes and Additional Disclosures in this report.
| 4 |
Eaton Vance
Special Equities Fund
December 31, 2019
Endnotes and Additional Disclosures
| 1 | The views expressed in this report are those of the portfolio manager(s) and are current only through the date stated at the top of this page. These views are subject to change at any time based upon market or other conditions, and Eaton Vance and the Fund(s) disclaim any responsibility to update such views. These views may not be relied upon as investment advice and, because investment decisions are based on many factors, may not be relied upon as an indication of trading intent on behalf of any Eaton Vance fund. This commentary may contain statements that are not historical facts, referred to as “forward looking statements.” The Fund’s actual future results may differ significantly from those stated in any forward looking statement, depending on factors such as changes in securities or financial markets or general economic conditions, the volume of sales and purchases of Fund shares, the continuation of investment advisory, administrative and service contracts, and other risks discussed from time to time in the Fund’s filings with the Securities and Exchange Commission. |
| 2 | Dow Jones Industrial Average® is a price-weighted average of 30 blue-chip stocks that are generally the leaders in their industry. S&P 500® Index is an unmanaged index of large-cap stocks commonly used as a measure of U.S. stock market performance. NASDAQ Composite Index is a market capitalization-weighted index of all domestic and international securities listed on NASDAQ. Source: Nasdaq, Inc. The information is provided by Nasdaq (with its affiliates, are referred to as the “Corporations”) and Nasdaq’s third party licensors on an “as is” basis and the Corporations make no guarantees and bear no liability of any kind with respect to the information or the Fund. Russell 2000® Index is an unmanaged index of 2,000 U.S. small-cap stocks. Russell 2500™ Index is an unmanaged index of approximately 2,500 small- and midcap U.S. stocks. Unless otherwise stated, index returns do not reflect the effect of any applicable sales charges, commissions, expenses, taxes or leverage, as applicable. It is not possible to invest directly in an index. |
| 3 | Total Returns at NAV do not include applicable sales charges. If sales charges were deducted, the returns would be lower. Total Returns shown with maximum sales charge reflect the stated maximum sales charge. Unless otherwise stated, performance does not reflect the deduction of taxes on Fund distributions or redemptions of Fund shares. |
Performance prior to the inception date of a class may be linked to the performance of an older class of the Fund. This linked performance is adjusted for any applicable sales charge, but is not adjusted for class expense differences. If adjusted for such differences, the performance would be different. The performance of Class I is linked to Class A. Performance presented in the Financial Highlights included in the financial statements is not linked. |
| 4 | Source: Fund prospectus. Net expense ratios reflect a contractual expense reimbursement that continues through 4/30/21. Without the reimbursement, performance would have been lower. The expense ratios for the current reporting period can be found in the Financial Highlights section of this report. |
| 5 | Excludes cash and cash equivalents. |
Fund profile subject to change due to active management. |
| 5 |
Eaton Vance
Special Equities Fund
December 31, 2019
Fund Expenses
Example: As a Fund shareholder, you incur two types of costs: (1) transaction costs, including sales charges (loads) on purchases and redemption fees (if applicable); and (2) ongoing costs, including management fees; distribution and/or service fees; and other Fund expenses. This Example is intended to help you understand your ongoing costs (in dollars) of Fund investing and to compare these costs with the ongoing costs of investing in other mutual funds. The Example is based on an investment of $1,000 invested at the beginning of the period and held for the entire period (July 1, 2019 – December 31, 2019).
Actual Expenses: The first section of the table below provides information about actual account values and actual expenses. You may use the information in this section, together with the amount you invested, to estimate the expenses that you paid over the period. Simply divide your account value by $1,000 (for example, an $8,600 account value divided by $1,000 = 8.6), then multiply the result by the number in the first section under the heading entitled “Expenses Paid During Period” to estimate the expenses you paid on your account during this period.
Hypothetical Example for Comparison Purposes: The second section of the table below provides information about hypothetical account values and hypothetical expenses based on the actual Fund expense ratio and an assumed rate of return of 5% per year (before expenses), which is not the actual Fund return. The hypothetical account values and expenses may not be used to estimate the actual ending account balance or expenses you paid for the period. You may use this information to compare the ongoing costs of investing in your Fund and other funds. To do so, compare this 5% hypothetical example with the 5% hypothetical examples that appear in the shareholder reports of the other funds.
Please note that the expenses shown in the table are meant to highlight your ongoing costs only and do not reflect any transactional costs, such as sales charges (loads) or redemption fees (if applicable). Therefore, the second section of the table is useful in comparing ongoing costs only, and will not help you determine the relative total costs of owning different funds. In addition, if these transactional costs were included, your costs would be higher.
| Beginning Account Value (7/1/19) | Ending Account Value (12/31/19) | Expenses Paid During Period* (7/1/19 – 12/31/19) | Annualized Expense Ratio | |||||||||||||
Actual | ||||||||||||||||
Class A | $ | 1,000.00 | $ | 1,042.00 | $ | 6.28 | ** | 1.22 | % | |||||||
Class C | $ | 1,000.00 | $ | 1,037.80 | $ | 10.12 | ** | 1.97 | % | |||||||
Class I | $ | 1,000.00 | $ | 1,042.90 | $ | 4.99 | ** | 0.97 | % | |||||||
Hypothetical | ||||||||||||||||
(5% return per year before expenses) | ||||||||||||||||
Class A | $ | 1,000.00 | $ | 1,019.10 | $ | 6.21 | ** | 1.22 | % | |||||||
Class C | $ | 1,000.00 | $ | 1,015.30 | $ | 10.01 | ** | 1.97 | % | |||||||
Class I | $ | 1,000.00 | $ | 1,020.30 | $ | 4.94 | ** | 0.97 | % | |||||||
Effective October 1, 2019, the contractual expense caps of the Fund changed. If these changes had been in place during the entire reporting period, the actual and hypothetical ending accounting values, expenses paid and annualized expense ratios would have been as follows:
| Beginning Account Value (7/1/19) | Ending Account Value (12/31/19) | Expenses Paid During Period* (7/1/19 – 12/31/19) | Annualized Expense Ratio | |||||||||||||
Actual | ||||||||||||||||
Class A | $ | 1,000.00 | $ | 1,042.00 | $ | 6.18 | ** | 1.20 | % | |||||||
Class C | $ | 1,000.00 | $ | 1,037.80 | $ | 10.02 | ** | 1.95 | % | |||||||
Class I | $ | 1,000.00 | $ | 1,042.90 | $ | 4.89 | ** | 0.95 | % | |||||||
Hypothetical | ||||||||||||||||
(5% return per year before expenses) | ||||||||||||||||
Class A | $ | 1,000.00 | $ | 1,019.20 | $ | 6.11 | ** | 1.20 | % | |||||||
Class C | $ | 1,000.00 | $ | 1,015.40 | $ | 9.91 | ** | 1.95 | % | |||||||
Class I | $ | 1,000.00 | $ | 1,020.40 | $ | 4.84 | ** | 0.95 | % | |||||||
| * | Expenses are equal to the Fund’s annualized expense ratio for the indicated Class, multiplied by the average account value over the period, multiplied by 184/365 (to reflect the one-half year period). The Example assumes that the $1,000 was invested at the net asset value per share determined at the close of business on June 30, 2019. |
| ** | Absent an allocation of certain expenses to an affiliate, expenses would be higher. |
| 6 |
Eaton Vance
Special Equities Fund
December 31, 2019
Portfolio of Investments
| Common Stocks — 98.1% |
| |||||||
| Security | Shares | Value | ||||||
| Aerospace & Defense — 3.5% | ||||||||
Hexcel Corp. | 15,176 | $ | 1,112,553 | |||||
Mercury Systems, Inc.(1) | 9,781 | 675,965 | ||||||
| $ | 1,788,518 | |||||||
| Auto Components — 1.3% | ||||||||
Dorman Products, Inc.(1) | 5,790 | $ | 438,419 | |||||
Visteon Corp.(1) | 2,375 | 205,651 | ||||||
| $ | 644,070 | |||||||
| Banks — 7.1% | ||||||||
Commerce Bancshares, Inc. | 10,605 | $ | 720,504 | |||||
Community Bank System, Inc. | 8,820 | 625,691 | ||||||
First Citizens BancShares, Inc., Class A | 1,335 | 710,500 | ||||||
First Republic Bank | 5,223 | 613,441 | ||||||
Sterling Bancorp | 23,413 | 493,546 | ||||||
Stock Yards Bancorp, Inc. | 11,375 | 467,058 | ||||||
| $ | 3,630,740 | |||||||
| Biotechnology — 1.8% | ||||||||
Emergent BioSolutions, Inc.(1) | 10,735 | $ | 579,154 | |||||
Ligand Pharmaceuticals, Inc.(1) | 3,325 | 346,764 | ||||||
| $ | 925,918 | |||||||
| Building Products — 1.5% | ||||||||
CSW Industrials, Inc. | 3,350 | $ | 257,950 | |||||
Trex Co., Inc.(1) | 5,440 | 488,947 | ||||||
| $ | 746,897 | |||||||
| Capital Markets — 1.5% | ||||||||
Cohen & Steers, Inc. | 7,494 | $ | 470,323 | |||||
Tradeweb Markets, Inc., Class A | 6,290 | 291,542 | ||||||
| $ | 761,865 | |||||||
| Chemicals — 4.3% | ||||||||
Balchem Corp. | 6,337 | $ | 644,029 | |||||
NewMarket Corp. | 1,385 | 673,830 | ||||||
Valvoline, Inc. | 41,985 | 898,899 | ||||||
| $ | 2,216,758 | |||||||
| Commercial Services & Supplies — 2.3% | ||||||||
Brink’s Co. (The) | 8,366 | $ | 758,629 | |||||
Viad Corp. | 5,885 | 397,237 | ||||||
| $ | 1,155,866 | |||||||
| Security | Shares | Value | ||||||
| Containers & Packaging — 0.6% | ||||||||
Ball Corp. | 4,705 | $ | 304,272 | |||||
| $ | 304,272 | |||||||
| Diversified Consumer Services — 2.0% | ||||||||
Grand Canyon Education, Inc.(1) | 1,833 | $ | 175,583 | |||||
K12, Inc.(1) | 12,970 | 263,940 | ||||||
ServiceMaster Global Holdings, Inc.(1) | 15,420 | 596,137 | ||||||
| $ | 1,035,660 | |||||||
| Electric Utilities — 1.4% | ||||||||
Alliant Energy Corp. | 13,289 | $ | 727,174 | |||||
| $ | 727,174 | |||||||
| Electrical Equipment — 1.5% | ||||||||
AMETEK, Inc. | 7,790 | $ | 776,975 | |||||
| $ | 776,975 | |||||||
| Energy Equipment & Services — 0.5% | ||||||||
Oceaneering International, Inc.(1) | 16,530 | $ | 246,462 | |||||
| $ | 246,462 | |||||||
| Equity Real Estate Investment Trusts (REITs) — 10.4% | ||||||||
CubeSmart | 21,662 | $ | 681,920 | |||||
EastGroup Properties, Inc. | 6,795 | 901,492 | ||||||
Essex Property Trust, Inc. | 1,886 | 567,422 | ||||||
Federal Realty Investment Trust | 2,619 | 337,144 | ||||||
Healthcare Realty Trust, Inc. | 27,410 | 914,672 | ||||||
National Retail Properties, Inc. | 17,390 | 932,452 | ||||||
Rexford Industrial Realty, Inc. | 21,150 | 965,920 | ||||||
| $ | 5,301,022 | |||||||
| Food & Staples Retailing — 1.2% | ||||||||
BJ’s Wholesale Club Holdings, Inc.(1) | 17,895 | $ | 406,932 | |||||
Performance Food Group Co.(1) | 3,928 | 202,214 | ||||||
| $ | 609,146 | |||||||
| Food Products — 2.0% | ||||||||
Calavo Growers, Inc. | 2,305 | $ | 208,810 | |||||
J&J Snack Foods Corp. | 770 | 141,888 | ||||||
Lancaster Colony Corp. | 1,605 | 256,960 | ||||||
Nomad Foods, Ltd.(1) | 19,000 | 425,030 | ||||||
| $ | 1,032,688 | |||||||
| 7 | See Notes to Financial Statements. |
Eaton Vance
Special Equities Fund
December 31, 2019
Portfolio of Investments — continued
| Security | Shares | Value | ||||||
| Gas Utilities — 1.4% | ||||||||
ONE Gas, Inc. | 7,740 | $ | 724,232 | |||||
| $ | 724,232 | |||||||
| Health Care Equipment & Supplies — 6.4% | ||||||||
Cooper Cos., Inc. (The) | 891 | $ | 286,269 | |||||
Envista Holdings Corp.(1) | 17,815 | 528,037 | ||||||
Haemonetics Corp.(1) | 4,870 | 559,563 | ||||||
ICU Medical, Inc.(1) | 2,898 | 542,274 | ||||||
Integra LifeSciences Holdings Corp.(1) | 4,754 | 277,063 | ||||||
Teleflex, Inc. | 1,614 | 607,574 | ||||||
West Pharmaceutical Services, Inc. | 2,974 | 447,082 | ||||||
| $ | 3,247,862 | |||||||
| Health Care Providers & Services — 4.6% | ||||||||
Addus HomeCare Corp.(1) | 6,055 | $ | 588,667 | |||||
Amedisys, Inc.(1) | 5,240 | 874,661 | ||||||
Chemed Corp. | 1,305 | 573,234 | ||||||
R1 RCM, Inc.(1) | 23,480 | 304,771 | ||||||
| $ | 2,341,333 | |||||||
| Hotels, Restaurants & Leisure — 2.5% | ||||||||
Choice Hotels International, Inc. | 12,380 | $ | 1,280,463 | |||||
| $ | 1,280,463 | |||||||
| Insurance — 4.1% | ||||||||
AMERISAFE, Inc. | 4,165 | $ | 275,015 | |||||
First American Financial Corp. | 5,021 | 292,825 | ||||||
Horace Mann Educators Corp. | 15,735 | 686,990 | ||||||
RLI Corp. | 5,857 | 527,247 | ||||||
Selective Insurance Group, Inc. | 5,070 | 330,513 | ||||||
| $ | 2,112,590 | |||||||
| IT Services — 5.8% | ||||||||
Black Knight, Inc.(1) | 17,947 | $ | 1,157,223 | |||||
Euronet Worldwide, Inc.(1) | 7,446 | 1,173,192 | ||||||
NIC, Inc. | 29,215 | 652,955 | ||||||
| $ | 2,983,370 | |||||||
| Machinery — 4.4% | ||||||||
Mueller Water Products, Inc., Class A | 77,050 | $ | 923,059 | |||||
RBC Bearings, Inc.(1) | 1,941 | 307,338 | ||||||
Welbilt, Inc.(1) | 14,080 | 219,789 | ||||||
Woodward, Inc. | 6,565 | 777,558 | ||||||
| $ | 2,227,744 | |||||||
| Security | Shares | Value | ||||||
| Marine — 1.3% | ||||||||
Kirby Corp.(1) | 7,683 | $ | 687,859 | |||||
| $ | 687,859 | |||||||
| Multi-Utilities — 1.6% | ||||||||
CMS Energy Corp. | 13,405 | $ | 842,370 | |||||
| $ | 842,370 | |||||||
| Oil, Gas & Consumable Fuels — 2.0% | ||||||||
Diamondback Energy, Inc. | 7,110 | $ | 660,234 | |||||
Gulfport Energy Corp.(1) | 16,500 | 50,160 | ||||||
Jagged Peak Energy, Inc.(1) | 13,234 | 112,357 | ||||||
PDC Energy, Inc.(1) | 8,035 | 210,276 | ||||||
| $ | 1,033,027 | |||||||
| Pharmaceuticals — 1.8% | ||||||||
Catalent, Inc.(1) | 6,035 | $ | 339,770 | |||||
Jazz Pharmaceuticals PLC(1) | 3,945 | 588,910 | ||||||
| $ | 928,680 | |||||||
| Professional Services — 1.1% | ||||||||
CBIZ, Inc.(1) | 21,450 | $ | 578,292 | |||||
| $ | 578,292 | |||||||
| Road & Rail — 2.7% | ||||||||
Kansas City Southern | 6,620 | $ | 1,013,919 | |||||
Landstar System, Inc. | 3,160 | 359,829 | ||||||
| $ | 1,373,748 | |||||||
| Software — 9.8% | ||||||||
ACI Worldwide, Inc.(1) | 43,198 | $ | 1,636,556 | |||||
Altair Engineering, Inc., Class A(1) | 24,117 | 866,042 | ||||||
CDK Global, Inc. | 11,805 | 645,497 | ||||||
Envestnet, Inc.(1) | 9,985 | 695,256 | ||||||
RealPage, Inc.(1) | 22,048 | 1,185,080 | ||||||
| $ | 5,028,431 | |||||||
| Specialty Retail — 2.4% | ||||||||
Hudson, Ltd., Class A(1) | 11,645 | $ | 178,634 | |||||
Monro, Inc. | 2,430 | 190,026 | ||||||
National Vision Holdings, Inc.(1) | 25,660 | 832,154 | ||||||
| $ | 1,200,814 | |||||||
| 8 | See Notes to Financial Statements. |
Eaton Vance
Special Equities Fund
December 31, 2019
Portfolio of Investments — continued
| Security | Shares | Value | ||||||
| Textiles, Apparel & Luxury Goods — 0.4% | ||||||||
Columbia Sportswear Co. | 1,990 | $ | 199,378 | |||||
| $ | 199,378 | |||||||
| Thrifts & Mortgage Finance — 0.8% | ||||||||
Essent Group, Ltd. | 7,779 | $ | 404,430 | |||||
| $ | 404,430 | |||||||
| Trading Companies & Distributors — 1.5% | ||||||||
Applied Industrial Technologies, Inc. | 11,184 | $ | 745,861 | |||||
| $ | 745,861 | |||||||
| Water Utilities — 0.6% | ||||||||
Middlesex Water Co. | 4,745 | $ | 301,640 | |||||
| $ | 301,640 | |||||||
Total Common Stocks |
| $ | 50,146,155 | |||||
| Short-Term Investments — 1.9% |
| |||||||
| Description | Units | Value | ||||||
Eaton Vance Cash Reserves Fund, LLC, 1.78%(2) | 971,029 | $ | 971,029 | |||||
Total Short-Term Investments |
| $ | 971,029 | |||||
Total Investments — 100.0% |
| $ | 51,117,184 | |||||
Other Assets, Less Liabilities — 0.0%(3) |
| $ | 21,342 | |||||
Net Assets — 100.0% |
| $ | 51,138,526 | |||||
The percentage shown for each investment category in the Portfolio of Investments is based on net assets.
| (1) | Non-income producing security. |
| (2) | Affiliated investment company, available to Eaton Vance portfolios and funds, which invests in high quality, U.S. dollar denominated money market instruments. The rate shown is the annualized seven-day yield as of December 31, 2019. |
| (3) | Amount is less than 0.05%. |
| 9 | See Notes to Financial Statements. |
Eaton Vance
Special Equities Fund
December 31, 2019
Statement of Assets and Liabilities
| Assets | December 31, 2019 | |||
Unaffiliated investments, at value (identified cost, $37,163,984) | $ | 50,146,155 | ||
Affiliated investment, at value (identified cost, $970,988) | 971,029 | |||
Dividends receivable | 39,127 | |||
Dividends receivable from affiliated investment | 998 | |||
Receivable for Fund shares sold | 170,641 | |||
Receivable from affiliate | 5,763 | |||
Total assets | $ | 51,333,713 | ||
| Liabilities | ||||
Payable for investments purchased | $ | 85,970 | ||
Payable for Fund shares redeemed | 5,065 | |||
Payable to affiliates: | ||||
Investment adviser fee | 26,194 | |||
Distribution and service fees | 7,714 | |||
Trustees’ fees | 725 | |||
Accrued expenses | 69,519 | |||
Total liabilities | $ | 195,187 | ||
Net Assets | $ | 51,138,526 | ||
| Sources of Net Assets | ||||
Paid-in capital | $ | 37,748,427 | ||
Distributable earnings | 13,390,099 | |||
Net Assets | $ | 51,138,526 | ||
| Class A Shares | ||||
Net Assets | $ | 32,825,179 | ||
Shares Outstanding | 1,351,079 | |||
Net Asset Value and Redemption Price Per Share | ||||
(net assets ÷ shares of beneficial interest outstanding) | $ | 24.30 | ||
Maximum Offering Price Per Share | ||||
(100 ÷ 94.25 of net asset value per share) | $ | 25.78 | ||
| Class C Shares | ||||
Net Assets | $ | 956,513 | ||
Shares Outstanding | 45,673 | |||
Net Asset Value and Offering Price Per Share* | ||||
(net assets ÷ shares of beneficial interest outstanding) | $ | 20.94 | ||
| Class I Shares | ||||
Net Assets | $ | 17,356,834 | ||
Shares Outstanding | 694,032 | |||
Net Asset Value, Offering Price and Redemption Price Per Share | ||||
(net assets ÷ shares of beneficial interest outstanding) | $ | 25.01 | ||
On sales of $50,000 or more, the offering price of Class A shares is reduced.
| * | Redemption price per share is equal to the net asset value less any applicable contingent deferred sales charge. |
| 10 | See Notes to Financial Statements. |
Eaton Vance
Special Equities Fund
December 31, 2019
Statement of Operations
| Investment Income | Year Ended December 31, 2019 | |||
Dividends (net of foreign taxes, $1,429) | $ | 540,986 | ||
Dividends from affiliated investment | 9,743 | |||
Total investment income | $ | 550,729 | ||
| Expenses | ||||
Investment adviser fee | $ | 299,937 | ||
Distribution and service fees | ||||
Class A | 82,182 | |||
Class C | 9,884 | |||
Trustees’ fees and expenses | 2,939 | |||
Custodian fee | 25,665 | |||
Transfer and dividend disbursing agent fees | 62,743 | |||
Legal and accounting services | 41,132 | |||
Printing and postage | 18,388 | |||
Registration fees | 42,997 | |||
Miscellaneous | 13,660 | |||
Total expenses | $ | 599,527 | ||
Deduct — | ||||
Allocation of expenses to affiliate | $ | 10,689 | ||
Total expense reductions | $ | 10,689 | ||
Net expenses | $ | 588,838 | ||
Net investment loss | $ | (38,109 | ) | |
| Realized and Unrealized Gain (Loss) | ||||
Net realized gain (loss) — | ||||
Investment transactions | $ | 2,286,563 | ||
Investment transactions — affiliated investment | (38 | ) | ||
Net realized gain | $ | 2,286,525 | ||
Change in unrealized appreciation (depreciation) — | ||||
Investments | $ | 9,213,075 | ||
Investments — affiliated investment | 36 | |||
Net change in unrealized appreciation (depreciation) | $ | 9,213,111 | ||
Net realized and unrealized gain | $ | 11,499,636 | ||
Net increase in net assets from operations | $ | 11,461,527 | ||
| 11 | See Notes to Financial Statements. |
Eaton Vance
Special Equities Fund
December 31, 2019
Statements of Changes in Net Assets
| Year Ended December 31, | ||||||||
| Increase (Decrease) in Net Assets | 2019 | 2018 | ||||||
From operations — | ||||||||
Net investment loss | $ | (38,109 | ) | $ | (55,591 | ) | ||
Net realized gain | 2,286,525 | 4,591,740 | ||||||
Net change in unrealized appreciation (depreciation) | 9,213,111 | (6,520,753 | ) | |||||
Net increase (decrease) in net assets from operations | $ | 11,461,527 | $ | (1,984,604 | ) | |||
Distributions to shareholders — | ||||||||
Class A | $ | (1,432,333 | ) | $ | (2,501,084 | ) | ||
Class C | (47,924 | ) | (152,745 | ) | ||||
Class I | (683,967 | ) | (936,941 | ) | ||||
Total distributions to shareholders | $ | (2,164,224 | ) | $ | (3,590,770 | ) | ||
Transactions in shares of beneficial interest — | ||||||||
Proceeds from sale of shares | ||||||||
Class A | $ | 925,631 | $ | 1,157,319 | ||||
Class C | 47,571 | 187,769 | ||||||
Class I | 6,507,487 | 3,283,176 | ||||||
Net asset value of shares issued to shareholders in payment of distributions declared | ||||||||
Class A | 1,204,363 | 2,050,820 | ||||||
Class C | 47,823 | 150,290 | ||||||
Class I | 678,594 | 927,608 | ||||||
Cost of shares redeemed | ||||||||
Class A | (4,699,984 | ) | (3,300,392 | ) | ||||
Class C | (282,146 | ) | (902,688 | ) | ||||
Class I | (3,626,142 | ) | (2,796,758 | ) | ||||
Net asset value of shares converted | ||||||||
Class A | 529,438 | — | ||||||
Class C | (529,438 | ) | — | |||||
Net increase in net assets from Fund share transactions | $ | 803,197 | $ | 757,144 | ||||
Net increase (decrease) in net assets | $ | 10,100,500 | $ | (4,818,230 | ) | |||
| Net Assets | ||||||||
At beginning of year | $ | 41,038,026 | $ | 45,856,256 | ||||
At end of year | $ | 51,138,526 | $ | 41,038,026 | ||||
| 12 | See Notes to Financial Statements. |
Eaton Vance
Special Equities Fund
December 31, 2019
Financial Highlights
| Class A | ||||||||||||||||||||
| Year Ended December 31, | ||||||||||||||||||||
| 2019 | 2018 | 2017 | 2016 | 2015 | ||||||||||||||||
Net asset value — Beginning of year | $ | 19.820 | $ | 22.700 | $ | 21.100 | $ | 19.550 | $ | 22.460 | ||||||||||
| Income (Loss) From Operations | ||||||||||||||||||||
Net investment loss(1) | $ | (0.034 | ) | $ | (0.036 | ) | $ | (0.070 | ) | $ | (0.058 | ) | $ | (0.111 | ) | |||||
Net realized and unrealized gain (loss) | 5.586 | (0.982 | ) | 3.281 | 3.025 | (0.539 | ) | |||||||||||||
Total income (loss) from operations | $ | 5.552 | $ | (1.018 | ) | $ | 3.211 | $ | 2.967 | $ | (0.650 | ) | ||||||||
| Less Distributions | ||||||||||||||||||||
From net realized gain | $ | (1.072 | ) | $ | (1.862 | ) | $ | (1.611 | ) | $ | (1.417 | ) | $ | (2.260 | ) | |||||
Total distributions | $ | (1.072 | ) | $ | (1.862 | ) | $ | (1.611 | ) | $ | (1.417 | ) | $ | (2.260 | ) | |||||
Net asset value — End of year | $ | 24.300 | $ | 19.820 | $ | 22.700 | $ | 21.100 | $ | 19.550 | ||||||||||
Total Return(2) | 28.12 | %(3) | (4.95 | )%(3) | 15.38 | %(3) | 15.44 | % | (2.99 | )% | ||||||||||
| Ratios/Supplemental Data |
| |||||||||||||||||||
Net assets, end of year (000’s omitted) | $ | 32,825 | $ | 28,419 | $ | 32,397 | $ | 32,005 | $ | 30,930 | ||||||||||
Ratios (as a percentage of average daily net assets): | ||||||||||||||||||||
Expenses(4) | 1.29 | %(3) | 1.35 | %(3) | 1.36 | %(3) | 1.41 | % | 1.32 | % | ||||||||||
Net investment loss | (0.14 | )% | (0.15 | )% | (0.32 | )% | (0.29 | )% | (0.48 | )% | ||||||||||
Portfolio Turnover | 39 | % | 41 | % | 65 | % | 67 | % | 83 | % | ||||||||||
| (1) | Computed using average shares outstanding. |
| (2) | Returns are historical and are calculated by determining the percentage change in net asset value with all distributions reinvested and do not reflect the effect of sales charges. |
| (3) | The administrator reimbursed certain operating expenses (equal to 0.02%, 0.02% and 0.01% of average daily net assets for the years ended December 31, 2019, 2018 and 2017, respectively). Absent this reimbursement, total return would be lower. |
| (4) | Excludes the effect of custody fee credits, if any, of less than 0.005%. Effective September 1, 2015, custody fee credits, which were earned on cash deposit balances, were discontinued by the custodian. |
| 13 | See Notes to Financial Statements. |
Eaton Vance
Special Equities Fund
December 31, 2019
Financial Highlights — continued
| Class C | ||||||||||||||||||||
| Year Ended December 31, | ||||||||||||||||||||
| 2019 | 2018 | 2017 | 2016 | 2015 | ||||||||||||||||
Net asset value — Beginning of year | $ | 17.330 | $ | 20.230 | $ | 19.110 | $ | 17.960 | $ | 20.970 | ||||||||||
| Income (Loss) From Operations | ||||||||||||||||||||
Net investment loss(1) | $ | (0.191 | ) | $ | (0.195 | ) | $ | (0.215 | ) | $ | (0.191 | ) | $ | (0.262 | ) | |||||
Net realized and unrealized gain (loss) | 4.873 | (0.843 | ) | 2.946 | 2.758 | (0.488 | ) | |||||||||||||
Total income (loss) from operations | $ | 4.682 | $ | (1.038 | ) | $ | 2.731 | $ | 2.567 | $ | (0.750 | ) | ||||||||
| Less Distributions | ||||||||||||||||||||
From net realized gain | $ | (1.072 | ) | $ | (1.862 | ) | $ | (1.611 | ) | $ | (1.417 | ) | $ | (2.260 | ) | |||||
Total distributions | $ | (1.072 | ) | $ | (1.862 | ) | $ | (1.611 | ) | $ | (1.417 | ) | $ | (2.260 | ) | |||||
Net asset value — End of year | $ | 20.940 | $ | 17.330 | $ | 20.230 | $ | 19.110 | $ | 17.960 | ||||||||||
Total Return(2) | 27.14 | %(3) | (5.66 | )%(3) | 14.46 | %(3) | 14.57 | % | (3.68 | )% | ||||||||||
| Ratios/Supplemental Data |
| |||||||||||||||||||
Net assets, end of year (000’s omitted) | $ | 957 | $ | 1,461 | $ | 2,243 | $ | 2,316 | $ | 2,925 | ||||||||||
Ratios (as a percentage of average daily net assets): | ||||||||||||||||||||
Expenses(4) | 2.04 | %(3) | 2.10 | %(3) | 2.11 | %(3) | 2.16 | % | 2.06 | % | ||||||||||
Net investment loss | (0.94 | )% | (0.93 | )% | (1.07 | )% | (1.05 | )% | (1.22 | )% | ||||||||||
Portfolio Turnover | 39 | % | 41 | % | 65 | % | 67 | % | 83 | % | ||||||||||
| (1) | Computed using average shares outstanding. |
| (2) | Returns are historical and are calculated by determining the percentage change in net asset value with all distributions reinvested and do not reflect the effect of sales charges. |
| (3) | The administrator reimbursed certain operating expenses (equal to 0.02%, 0.02% and 0.01% of average daily net assets for the years ended December 31, 2019, 2018 and 2017, respectively). Absent this reimbursement, total return would be lower. |
| (4) | Excludes the effect of custody fee credits, if any, of less than 0.005%. Effective September 1, 2015, custody fee credits, which were earned on cash deposit balances, were discontinued by the custodian. |
| 14 | See Notes to Financial Statements. |
Eaton Vance
Special Equities Fund
December 31, 2019
Financial Highlights — continued
| Class I | ||||||||||||||||||||
| Year Ended December 31, | ||||||||||||||||||||
| 2019 | 2018 | 2017 | 2016 | 2015 | ||||||||||||||||
Net asset value — Beginning of year | $ | 20.330 | $ | 23.170 | $ | 21.460 | $ | 19.820 | $ | 22.670 | ||||||||||
| Income (Loss) From Operations | ||||||||||||||||||||
Net investment income (loss)(1) | $ | 0.032 | $ | 0.028 | $ | (0.010 | ) | $ | (0.009 | ) | $ | (0.047 | ) | |||||||
Net realized and unrealized gain (loss) | 5.720 | (1.006 | ) | 3.331 | 3.066 | (0.543 | ) | |||||||||||||
Total income (loss) from operations | $ | 5.752 | $ | (0.978 | ) | $ | 3.321 | $ | 3.057 | $ | (0.590 | ) | ||||||||
| Less Distributions | ||||||||||||||||||||
From net realized gain | $ | (1.072 | ) | $ | (1.862 | ) | $ | (1.611 | ) | $ | (1.417 | ) | $ | (2.260 | ) | |||||
Total distributions | $ | (1.072 | ) | $ | (1.862 | ) | $ | (1.611 | ) | $ | (1.417 | ) | $ | (2.260 | ) | |||||
Net asset value — End of year | $ | 25.010 | $ | 20.330 | $ | 23.170 | $ | 21.460 | $ | 19.820 | ||||||||||
Total Return(2) | 28.40 | %(3) | (4.67 | )%(3) | 15.63 | %(3) | 15.69 | % | (2.70 | )% | ||||||||||
| Ratios/Supplemental Data |
| |||||||||||||||||||
Net assets, end of year (000’s omitted) | $ | 17,357 | $ | 11,158 | $ | 11,216 | $ | 5,954 | $ | 9,087 | ||||||||||
Ratios (as a percentage of average daily net assets): | ||||||||||||||||||||
Expenses(4) | 1.03 | %(3) | 1.10 | %(3) | 1.11 | %(3) | 1.16 | % | 1.07 | % | ||||||||||
Net investment income (loss) | 0.13 | % | 0.12 | % | (0.04 | )% | (0.05 | )% | (0.20 | )% | ||||||||||
Portfolio Turnover | 39 | % | 41 | % | 65 | % | 67 | % | 83 | % | ||||||||||
| (1) | Computed using average shares outstanding. |
| (2) | Returns are historical and are calculated by determining the percentage change in net asset value with all distributions reinvested. |
| (3) | The administrator reimbursed certain operating expenses (equal to 0.02%, 0.02% and 0.01% of average daily net assets for the years ended December 31, 2019, 2018 and 2017, respectively). Absent this reimbursement, total return would be lower. |
| (4) | Excludes the effect of custody fee credits, if any, of less than 0.005%. Effective September 1, 2015, custody fee credits, which were earned on cash deposit balances, were discontinued by the custodian. |
| 15 | See Notes to Financial Statements. |
Eaton Vance
Special Equities Fund
December 31, 2019
Notes to Financial Statements
1 Significant Accounting Policies
Eaton Vance Special Equities Fund (the Fund) is a diversified series of Eaton Vance Special Investment Trust (the Trust). The Trust is a Massachusetts business trust registered under the Investment Company Act of 1940, as amended (the 1940 Act), as an open-end management investment company. The Fund’s investment objective is to provide growth of capital. The Fund offers three classes of shares. Class A shares are generally sold subject to a sales charge imposed at time of purchase. Class C shares are sold at net asset value and are generally subject to a contingent deferred sales charge (see Note 5). Effective January 25, 2019, Class C shares generally automatically convert to Class A shares ten years after their purchase as described in the Fund’s prospectus. Class I shares are sold at net asset value and are not subject to a sales charge. Each class represents a pro-rata interest in the Fund, but votes separately on class-specific matters and (as noted below) is subject to different expenses. Realized and unrealized gains and losses and net investment income and losses, other than class-specific expenses, are allocated daily to each class of shares based on the relative net assets of each class to the total net assets of the Fund. Each class of shares differs in its distribution plan and certain other class-specific expenses.
The following is a summary of significant accounting policies of the Fund. The policies are in conformity with accounting principles generally accepted in the United States of America (U.S. GAAP). The Fund is an investment company and follows accounting and reporting guidance in the Financial Accounting Standards Board (FASB) Accounting Standards Codification Topic 946.
A Investment Valuation — The following methodologies are used to determine the market value or fair value of investments.
Equity Securities.Equity securities listed on a U.S. securities exchange generally are valued at the last sale or closing price on the day of valuation or, if no sales took place on such date, at the mean between the closing bid and ask prices on the exchange where such securities are principally traded. Equity securities listed on the NASDAQ Global or Global Select Market generally are valued at the NASDAQ official closing price. Unlisted or listed securities for which closing sales prices or closing quotations are not available are valued at the mean between the latest available bid and ask prices.
Affiliated Fund.The Fund may invest in Eaton Vance Cash Reserves Fund, LLC (Cash Reserves Fund), an affiliated investment company managed by Eaton Vance Management (EVM). While Cash Reserves Fund is not a registered money market mutual fund, it conducts all of its investment activities in accordance with the requirements of Rule 2a-7 under the 1940 Act. Investments in Cash Reserves Fund are valued at the closing net asset value per unit on the valuation day. Cash Reserves Fund generally values its investment securities based on available market quotations provided by a third party pricing service.
Fair Valuation.Investments for which valuations or market quotations are not readily available or are deemed unreliable are valued at fair value using methods determined in good faith by or at the direction of the Trustees of the Fund in a manner that most fairly reflects the security’s “fair value”, which is the amount that the Fund might reasonably expect to receive for the security upon its current sale in the ordinary course. Each such determination is based on a consideration of relevant factors, which are likely to vary from one pricing context to another. These factors may include, but are not limited to, the type of security, the existence of any contractual restrictions on the security’s disposition, the price and extent of public trading in similar securities of the issuer or of comparable companies or entities, quotations or relevant information obtained from broker/dealers or other market participants, information obtained from the issuer, analysts, and/or the appropriate stock exchange (for exchange-traded securities), an analysis of the company’s or entity’s financial statements, and an evaluation of the forces that influence the issuer and the market(s) in which the security is purchased and sold.
B Investment Transactions — Investment transactions for financial statement purposes are accounted for on a trade date basis. Realized gains and losses on investments sold are determined on the basis of identified cost.
C Income — Dividend income is recorded on the ex-dividend date for dividends received in cash and/or securities. However, if the ex-dividend date has passed, certain dividends from foreign securities are recorded as the Fund is informed of the ex-dividend date. Withholding taxes on foreign dividends and capital gains have been provided for in accordance with the Fund’s understanding of the applicable countries’ tax rules and rates. Distributions from investment companies are recorded as dividend income, capital gains or return of capital based on the nature of the distribution.
D Federal Taxes — The Fund’s policy is to comply with the provisions of the Internal Revenue Code applicable to regulated investment companies and to distribute to shareholders each year substantially all of its net investment income, and all or substantially all of its net realized capital gains. Accordingly, no provision for federal income or excise tax is necessary.
As of December 31, 2019, the Fund had no uncertain tax positions that would require financial statement recognition, de-recognition, or disclosure. The Fund files a U.S. federal income tax return annually after its fiscal year-end, which is subject to examination by the Internal Revenue Service for a period of three years from the date of filing.
E Expenses — The majority of expenses of the Trust are directly identifiable to an individual fund. Expenses which are not readily identifiable to a specific fund are allocated taking into consideration, among other things, the nature and type of expense and the relative size of the funds.
F Use of Estimates — The preparation of the financial statements in conformity with U.S. GAAP requires management to make estimates and assumptions that affect the reported amounts of assets and liabilities at the date of the financial statements and the reported amounts of income and expense during the reporting period. Actual results could differ from those estimates.
G Indemnifications — Under the Trust’s organizational documents, its officers and Trustees may be indemnified against certain liabilities and expenses arising out of the performance of their duties to the Fund. Under Massachusetts law, if certain conditions prevail, shareholders of a Massachusetts business
| 16 |
Eaton Vance
Special Equities Fund
December 31, 2019
Notes to Financial Statements — continued
trust (such as the Trust) could be deemed to have personal liability for the obligations of the Trust. However, the Trust’s Declaration of Trust contains an express disclaimer of liability on the part of Fund shareholders and the By-laws provide that the Trust shall assume, upon request by the shareholder, the defense on behalf of any Fund shareholders. Moreover, the By-laws also provide for indemnification out of Fund property of any shareholder held personally liable solely by reason of being or having been a shareholder for all loss or expense arising from such liability. Additionally, in the normal course of business, the Fund enters into agreements with service providers that may contain indemnification clauses. The Fund’s maximum exposure under these arrangements is unknown as this would involve future claims that may be made against the Fund that have not yet occurred.
2 Distributions to Shareholders and Income Tax Information
It is the present policy of the Fund to make at least one distribution annually (normally in December) of all or substantially all of its net investment income and to distribute annually all or substantially all of its net realized capital gains. Distributions to shareholders are recorded on the ex-dividend date. Distributions are declared separately for each class of shares. Shareholders may reinvest income and capital gain distributions in additional shares of the same class of the Fund at the net asset value as of the ex-dividend date or, at the election of the shareholder, receive distributions in cash. Distributions to shareholders are determined in accordance with income tax regulations, which may differ from U.S. GAAP. As required by U.S. GAAP, only distributions in excess of tax basis earnings and profits are reported in the financial statements as a return of capital. Permanent differences between book and tax accounting relating to distributions are reclassified to paid-in capital. For tax purposes, distributions from short-term capital gains are considered to be from ordinary income.
The tax character of distributions declared for the years ended December 31, 2019 and December 31, 2018 was as follows:
| Year Ended December 31, | ||||||||
| 2019 | 2018 | |||||||
Ordinary income | $ | 454,418 | $ | 578,280 | ||||
Long-term capital gains | $ | 1,709,806 | $ | 3,012,490 | ||||
During the year ended December 31, 2019, distributable earnings was decreased by $169,441 and paid-in capital was increased by $169,441 primarily due to the Fund’s use of equalization accounting. Tax equalization accounting allows the Fund to treat as a distribution that portion of redemption proceeds representing a redeeming shareholder’s portion of undistributed taxable income and net capital gains. These reclassifications had no effect on the net assets or net asset value per share of the Fund.
As of December 31, 2019, the components of distributable earnings (accumulated loss) on a tax basis were as follows:
Undistributed ordinary income | $ | 39,689 | ||
Undistributed long-term capital gains | $ | 357,632 | ||
Net unrealized appreciation | $ | 12,992,778 | ||
The cost and unrealized appreciation (depreciation) of investments of the Fund at December 31, 2019, as determined on a federal income tax basis, were as follows:
Aggregate cost | $ | 38,124,406 | ||
Gross unrealized appreciation | $ | 13,641,522 | ||
Gross unrealized depreciation | (648,744 | ) | ||
Net unrealized appreciation | $ | 12,992,778 | ||
3 Investment Adviser Fee and Other Transactions with Affiliates
The investment adviser fee is earned by Boston Management and Research (BMR), a subsidiary of EVM, as compensation for investment advisory services rendered to the Fund. The fee is computed at an annual rate of 0.625% of the Fund’s average daily net assets and is payable monthly. For the year ended December 31, 2019, the Fund’s investment adviser fee amounted to $299,937. The Fund invests its cash in Cash Reserves Fund. EVM does not currently receive a fee for advisory services provided to Cash Reserves Fund. EVM also serves as administrator of the Fund, but receives no compensation.
| 17 |
Eaton Vance
Special Equities Fund
December 31, 2019
Notes to Financial Statements — continued
EVM has agreed to reimburse the Fund’s expenses to the extent that total annual operating expenses (relating to ordinary operating expenses only) exceed 1.20%, 1.95% and 0.95% (1.35%, 2.10% and 1.10% prior to October 1, 2019) of the Fund’s average daily net assets for Class A, Class C and Class I, respectively, through April 30, 2021. Thereafter, the reimbursement may be changed or terminated at any time. Pursuant to this agreement, EVM was allocated $10,689 of the Fund’s operating expenses for the year ended December 31, 2019.
EVM provides sub-transfer agency and related services to the Fund pursuant to a Sub-Transfer Agency Support Services Agreement. For the year ended December 31, 2019, EVM earned $25,394 from the Fund pursuant to such agreement, which is included in transfer and dividend disbursing agent fees on the Statement of Operations. The Fund was informed that Eaton Vance Distributors, Inc. (EVD), an affiliate of EVM and the Fund’s principal underwriter, received $1,580 as its portion of the sales charge on sales of Class A shares for the year ended December 31, 2019. EVD also received distribution and service fees from Class A and Class C shares (see Note 4).
Trustees and officers of the Fund who are members of EVM’s or BMR’s organizations receive remuneration for their services to the Fund out of the investment adviser fee. Trustees of the Fund who are not affiliated with the investment adviser may elect to defer receipt of all or a percentage of their annual fees in accordance with the terms of the Trustees Deferred Compensation Plan. For the year ended December 31, 2019, no significant amounts have been deferred. Certain officers and Trustees of the Fund are officers of the above organizations.
4 Distribution Plans
The Fund has in effect a distribution plan for Class A shares (Class A Plan) pursuant to Rule 12b-1 under the 1940 Act. Pursuant to the Class A Plan, the Fund pays EVD a distribution and service fee of 0.25% per annum of its average daily net assets attributable to Class A shares for distribution services and facilities provided to the Fund by EVD, as well as for personal services and/or the maintenance of shareholder accounts. Distribution and service fees paid or accrued to EVD for the year ended December 31, 2019 amounted to $82,182 for Class A shares.
The Fund also has in effect a distribution plan for Class C shares (Class C Plan) pursuant to Rule 12b-1 under the 1940 Act. Pursuant to the Class C Plan, the Fund pays EVD amounts equal to 0.75% per annum of its average daily net assets attributable to Class C shares for providing ongoing distribution services and facilities to the Fund. For the year ended December 31, 2019, the Fund paid or accrued to EVD $7,413 for Class C shares.
Pursuant to the Class C Plan, the Fund also makes payments of service fees to EVD, financial intermediaries and other persons in amounts equal to 0.25% per annum of its average daily net assets attributable to that class. Service fees paid or accrued are for personal services and/or the maintenance of shareholder accounts. They are separate and distinct from the sales commissions and distribution fees payable to EVD. Service fees paid or accrued for the year ended December 31, 2019 amounted to $2,471 for Class C shares.
Distribution and service fees are subject to the limitations contained in the Financial Industry Regulatory Authority Rule 2341(d).
5 Contingent Deferred Sales Charges
A contingent deferred sales charge (CDSC) of 1% generally is imposed on redemptions of Class C shares made within one year of purchase. Class A shares may be subject to a 1% CDSC if redeemed within 18 months of purchase (depending on the circumstances of purchase). Generally, the CDSC is based upon the lower of the net asset value at date of redemption or date of purchase. No charge is levied on shares acquired by reinvestment of dividends or capital gain distributions. For the year ended December 31, 2019, the Fund was informed that EVD received no CDSCs paid by Class A and Class C shareholders.
6 Purchases and Sales of Investments
Purchases and sales of investments, other than short-term obligations, aggregated $18,691,612 and $21,159,309, respectively, for the year ended December 31, 2019.
| 18 |
Eaton Vance
Special Equities Fund
December 31, 2019
Notes to Financial Statements — continued
7 Shares of Beneficial Interest
The Fund’s Declaration of Trust permits the Trustees to issue an unlimited number of full and fractional shares of beneficial interest (without par value). Such shares may be issued in a number of different series (such as the Fund) and classes. Transactions in Fund shares were as follows:
| Year Ended December 31, | ||||||||
| Class A | 2019 | 2018 | ||||||
Sales | 39,822 | 51,058 | ||||||
Issued to shareholders electing to receive payments of distributions in Fund shares | 50,177 | 97,565 | ||||||
Redemptions | (197,564 | ) | (142,160 | ) | ||||
Converted from Class C shares | 24,778 | — | ||||||
Net increase (decrease) | (82,787 | ) | 6,463 | |||||
| Year Ended December 31, | ||||||||
| Class C | 2019 | 2018 | ||||||
Sales | 2,438 | 8,747 | ||||||
Issued to shareholders electing to receive payments of distributions in Fund shares | 2,307 | 8,172 | ||||||
Redemptions | (14,983 | ) | (43,525 | ) | ||||
Converted to Class A shares | (28,363 | ) | — | |||||
Net decrease | (38,601 | ) | (26,606 | ) | ||||
| Year Ended December 31, | ||||||||
| Class I | 2019 | 2018 | ||||||
Sales | 265,744 | 138,332 | ||||||
Issued to shareholders electing to receive payments of distributions in Fund shares | 27,498 | 43,044 | ||||||
Redemptions | (148,187 | ) | (116,436 | ) | ||||
Net increase | 145,055 | 64,940 | ||||||
At December 31, 2019, an Eaton Vance collective investment trust and donor advised and pooled income funds (established and maintained by a public charity) managed by EVM owned in the aggregate 26.2% of the value of the outstanding shares of the Fund.
8 Line of Credit
The Fund participates with other portfolios and funds managed by EVM and its affiliates in an $800 million unsecured line of credit agreement with a group of banks, which is in effect through October 27, 2020. In connection with the renewal of the agreement on October 29, 2019, funds managed by Calvert Research and Management, an affiliate of EVM, were added as participating funds to the agreement and the borrowing limit was increased from $625 million. Borrowings are made by the Fund solely to facilitate the handling of unusual and/or unanticipated short-term cash requirements. Interest is charged to the Fund based on its borrowings at an amount above either the Eurodollar rate or Federal Funds rate. In addition, a fee computed at an annual rate of 0.15% on the daily unused portion of the line of credit is allocated among the participating portfolios and funds at the end of each quarter. Because the line of credit is not available exclusively to the Fund, it may be unable to borrow some or all of its requested amounts at any particular time. The Fund did not have any significant borrowings or allocated fees during the year ended December 31, 2019.
| 19 |
Eaton Vance
Special Equities Fund
December 31, 2019
Notes to Financial Statements — continued
9 Investments in Affiliated Funds
At December 31, 2019, the value of the Fund’s investment in affiliated funds was $971,029, which represents 1.9% of the Fund’s net assets. Transactions in affiliated funds by the Fund for the year ended December 31, 2019 were as follows:
| Name of affiliated fund | Value, beginning of period | Purchases | Sales proceeds | Net realized gain (loss) | Change in unrealized appreciation (depreciation) | Value, end of period | Dividend income | Units, end of period | ||||||||||||||||||||||||
Short-Term Investments | ||||||||||||||||||||||||||||||||
Eaton Vance Cash Reserves Fund, LLC, 1.78% | $ | 353,718 | $ | 10,605,298 | $ | (9,987,985 | ) | $ | (38 | ) | $ | 36 | $ | 971,029 | $ | 9,743 | 971,029 | |||||||||||||||
10 Fair Value Measurements
Under generally accepted accounting principles for fair value measurements, a three-tier hierarchy to prioritize the assumptions, referred to as inputs, is used in valuation techniques to measure fair value. The three-tier hierarchy of inputs is summarized in the three broad levels listed below.
| • | Level 1 – quoted prices in active markets for identical investments |
| • | Level 2 – other significant observable inputs (including quoted prices for similar investments, interest rates, prepayment speeds, credit risk, etc.) |
| • | Level 3 – significant unobservable inputs (including a fund’s own assumptions in determining the fair value of investments) |
In cases where the inputs used to measure fair value fall in different levels of the fair value hierarchy, the level disclosed is determined based on the lowest level input that is significant to the fair value measurement in its entirety. The inputs or methodology used for valuing securities are not necessarily an indication of the risk associated with investing in those securities.
At December 31, 2019, the hierarchy of inputs used in valuing the Fund’s investments, which are carried at value, were as follows:
| Asset Description | Level 1 | Level 2 | Level 3 | Total | ||||||||||||
Common Stocks | $ | 50,146,155 | * | $ | — | $ | — | $ | 50,146,155 | |||||||
Short-Term Investments | — | 971,029 | — | 971,029 | ||||||||||||
Total Investments | $ | 50,146,155 | $ | 971,029 | $ | — | $ | 51,117,184 | ||||||||
| * | The level classification by major category of investments is the same as the category presentation in the Portfolio of Investments. |
| 20 |
Eaton Vance
Special Equities Fund
December 31, 2019
Report of Independent Registered Public Accounting Firm
To the Trustees of Eaton Vance Special Investment Trust and Shareholders of Eaton Vance Special Equities Fund:
Opinion on the Financial Statements and Financial Highlights
We have audited the accompanying statement of assets and liabilities of Eaton Vance Special Equities Fund (the “Fund”) (one of the funds constituting Eaton Vance Special Investment Trust), including the portfolio of investments, as of December 31, 2019, the related statement of operations for the year then ended, the statements of changes in net assets for each of the two years in the period then ended, the financial highlights for each of the five years in the period then ended, and the related notes. In our opinion, the financial statements and financial highlights present fairly, in all material respects, the financial position of the Fund as of December 31, 2019, and the results of its operations for the year then ended, the changes in its net assets for each of the two years in the period then ended, and the financial highlights for each of the five years in the period then ended, in conformity with accounting principles generally accepted in the United States of America.
Basis for Opinion
These financial statements and financial highlights are the responsibility of the Fund’s management. Our responsibility is to express an opinion on the Fund’s financial statements and financial highlights based on our audits. We are a public accounting firm registered with the Public Company Accounting Oversight Board (United States) (PCAOB) and are required to be independent with respect to the Fund in accordance with the U.S. federal securities laws and the applicable rules and regulations of the Securities and Exchange Commission and the PCAOB.
We conducted our audits in accordance with the standards of the PCAOB. Those standards require that we plan and perform the audit to obtain reasonable assurance about whether the financial statements and financial highlights are free of material misstatement, whether due to error or fraud. The Fund is not required to have, nor were we engaged to perform, an audit of its internal control over financial reporting. As part of our audits we are required to obtain an understanding of internal control over financial reporting but not for the purpose of expressing an opinion on the effectiveness of the Fund’s internal control over financial reporting. Accordingly, we express no such opinion.
Our audits included performing procedures to assess the risks of material misstatement of the financial statements and financial highlights, whether due to error or fraud, and performing procedures that respond to those risks. Such procedures included examining, on a test basis, evidence regarding the amounts and disclosures in the financial statements and financial highlights. Our audits also included evaluating the accounting principles used and significant estimates made by management, as well as evaluating the overall presentation of the financial statements and financial highlights. Our procedures included confirmation of securities owned as of December 31, 2019, by correspondence with the custodian and brokers; when replies were not received from brokers, we performed other auditing procedures. We believe that our audits provide a reasonable basis for our opinion.
/s/ Deloitte & Touche LLP
Boston, Massachusetts
February 24, 2020
We have served as the auditor of one or more Eaton Vance investment companies since 1959.
| 21 |
Eaton Vance
Special Equities Fund
December 31, 2019
Federal Tax Information (Unaudited)
The Form 1099-DIV you received in February 2020 showed the tax status of all distributions paid to your account in calendar year 2019. Shareholders are advised to consult their own tax adviser with respect to the tax consequences of their investment in the Fund. As required by the Internal Revenue Code and/or regulations, shareholders must be notified regarding the status of qualified dividend income for individuals, the dividends received deduction for corporations and capital gains dividends.
Qualified Dividend Income. For the fiscal year ended December 31, 2019, the Fund designates approximately $387,475, or up to the maximum amount of such dividends allowable pursuant to the Internal Revenue Code, as qualified dividend income eligible for the reduced tax rate of 15%.
Dividends Received Deduction. Corporate shareholders are generally entitled to take the dividends received deduction on the portion of the Fund’s dividend distribution that qualifies under tax law. For the Fund’s fiscal 2019 ordinary income dividends, 80.55% qualifies for the corporate dividends received deduction.
Capital Gains Dividends. The Fund hereby designates as a capital gain dividend with respect to the taxable year ended December 31, 2019, $1,829,435 or, if subsequently determined to be different, the net capital gain of such year.
| 22 |
Eaton Vance
Special Equities Fund
December 31, 2019
Management and Organization
Fund Management. The Trustees of Eaton Vance Special Investment Trust (the Trust) are responsible for the overall management and supervision of the Trust’s affairs. The Trustees and officers of the Trust are listed below. Except as indicated, each individual has held the office shown or other offices in the same company for the last five years. Trustees and officers of the Trust hold indefinite terms of office. The “noninterested Trustees” consist of those Trustees who are not “interested persons” of the Trust, as that term is defined under the 1940 Act. The business address of each Trustee and officer is Two International Place, Boston, Massachusetts 02110. As used below, “EVC” refers to Eaton Vance Corp., “EV” refers to Eaton Vance, Inc., “EVM” refers to Eaton Vance Management, “BMR” refers to Boston Management and Research and “EVD” refers to Eaton Vance Distributors, Inc. EVC and EV are the corporate parent and trustee, respectively, of EVM and BMR. EVD is the Fund’s principal underwriter and a wholly-owned subsidiary of EVC. Each officer affiliated with Eaton Vance may hold a position with other Eaton Vance affiliates that is comparable to his or her position with EVM listed below. Each Trustee oversees 159 portfolios in the Eaton Vance Complex (including all master and feeder funds in a master feeder structure). Each officer serves as an officer of certain other Eaton Vance funds. Each Trustee and officer serves until his or her successor is elected.
| Name and Year of Birth | Position(s) with the | Trustee Since(1) | Principal Occupation(s) and Directorships During Past Five Years and Other Relevant Experience | |||
| Interested Trustee | ||||||
Thomas E. Faust Jr. 1958 | Trustee | 2007 | Chairman, Chief Executive Officer and President of EVC, Director and President of EV, Chief Executive Officer and President of EVM and BMR, and Director of EVD. Trustee and/or officer of 159 registered investment companies. Mr. Faust is an interested person because of his positions with EVM, BMR, EVD, EVC and EV, which are affiliates of the Trust. Directorships in the Last Five Years. Director of EVC and Hexavest Inc. (investment management firm). | |||
| Noninterested Trustees | ||||||
Mark R. Fetting 1954 | Trustee | 2016 | Private investor. Formerly held various positions at Legg Mason, Inc. (investment management firm) (2000-2012), including President, Chief Executive Officer, Director and Chairman (2008-2012), Senior Executive Vice President(2004-2008) and Executive Vice President (2001-2004). Formerly, President of Legg Mason family of funds (2001-2008). Formerly, Division President and Senior Officer of Prudential Financial Group, Inc. and related companies (investment management firm) (1991-2000). Other Directorships in the Last Five Years. None. | |||
Cynthia E. Frost 1961 | Trustee | 2014 | Private investor. Formerly, Chief Investment Officer of Brown University (university endowment) (2000-2012). Formerly, Portfolio Strategist for Duke Management Company (university endowment manager) (1995-2000). Formerly, Managing Director, Cambridge Associates (investment consulting company) (1989-1995). Formerly, Consultant, Bain and Company (management consulting firm) (1987-1989). Formerly, Senior Equity Analyst, BA Investment Management Company (1983-1985). Other Directorships in the Last Five Years. None. | |||
George J. Gorman 1952 | Trustee | 2014 | Principal at George J. Gorman LLC (consulting firm). Formerly, Senior Partner at Ernst & Young LLP (a registered public accounting firm) (1974-2009). Other Directorships in the Last Five Years. Formerly, Trustee of the BofA Funds Series Trust (11 funds) (2011-2014) and of the Ashmore Funds (9 funds) (2010-2014). | |||
Valerie A. Mosley 1960 | Trustee | 2014 | Chairwoman and Chief Executive Officer of Valmo Ventures (a consulting and investment firm). Former Partner and Senior Vice President, Portfolio Manager and Investment Strategist at Wellington Management Company, LLP (investment management firm) (1992-2012). Former Chief Investment Officer, PG Corbin Asset Management (1990-1992). Formerly worked in institutional corporate bond sales at Kidder Peabody (1986-1990). Other Directorships in the Last Five Years. Director of Envestnet, Inc. (provider of intelligent systems for wealth management and financial wellness) (since 2018). Director of Dynex Capital, Inc. (mortgage REIT) (since 2013). | |||
| 23 |
Eaton Vance
Special Equities Fund
December 31, 2019
Management and Organization — continued
| Name and Year of Birth | Position(s) with the | Trustee Since(1) | Principal Occupation(s) and Directorships During Past Five Years and Other Relevant Experience | |||
| Noninterested Trustees (continued) | ||||||
William H. Park 1947 | Chairperson of the Board and Trustee | 2016 (Chairperson) 2003 (Trustee) | Private investor. Formerly, Consultant (management and transactional)(2012-2014). Formerly, Chief Financial Officer, Aveon Group L.P. (investment management firm) (2010-2011). Formerly, Vice Chairman, Commercial Industrial Finance Corp. (specialty finance company) (2006-2010). Formerly, President and Chief Executive Officer, Prizm Capital Management, LLC (investment management firm) (2002-2005). Formerly, Executive Vice President and Chief Financial Officer, United Asset Management Corporation (investment management firm) (1982-2001). Formerly, Senior Manager, Price Waterhouse (now PricewaterhouseCoopers) (a registered public accounting firm)(1972-1981). Other Directorships in the Last Five Years. None. | |||
Helen Frame Peters 1948 | Trustee | 2008 | Professor of Finance, Carroll School of Management, Boston College. Formerly, Dean, Carroll School of Management, Boston College (2000-2002). Formerly, Chief Investment Officer, Fixed Income, Scudder Kemper Investments (investment management firm) (1998-1999). Formerly, Chief Investment Officer, Equity and Fixed Income, Colonial Management Associates (investment management firm) (1991-1998). Other Directorships in the Last Five Years. None. | |||
Keith Quinton 1958 | Trustee | 2018 | Independent Investment Committee Member at New Hampshire Retirement System (since 2017). Advisory Committee member at Northfield Information Services, Inc. (risk management analytics provider) (since 2016). Formerly, Portfolio Manager and Senior Quantitative Analyst at Fidelity Investments (investment management firm) (2001-2014). Other Directorships in the Last Five Years. Director of New Hampshire Municipal Bond Bank (since 2016). | |||
Marcus L. Smith 1966 | Trustee | 2018 | Member of Posse Boston Advisory Board (foundation) (since 2015). Trustee at University of Mount Union (since 2008). Formerly, Portfolio Manager at MFS Investment Management (investment management firm) (1994-2017). Other Directorships in the Last Five Years. Director of MSCI Inc. (global provider of investment decision support tools) (since 2017). Formerly, Director of DCT Industrial Trust Inc. (logistics real estate company) (2017-2018). | |||
Susan J. Sutherland 1957 | Trustee | 2015 | Private investor. Formerly, Associate, Counsel and Partner at Skadden, Arps, Slate, Meagher & Flom LLP (law firm) (1982-2013). Other Directorships in the Last Five Years. Formerly, Director of Montpelier Re Holdings Ltd. (global provider of customized insurance and reinsurance products) (2013-2015). | |||
Scott E. Wennerholm 1959 | Trustee | 2016 | Formerly, Trustee at Wheelock College (postsecondary institution) (2012-2018). Formerly, Consultant at GF Parish Group (executive recruiting firm) (2016-2017). Formerly, Chief Operating Officer and Executive Vice President at BNY Mellon Asset Management (investment management firm) (2005-2011). Formerly, Chief Operating Officer and Chief Financial Officer at Natixis Global Asset Management (investment management firm) (1997-2004). Formerly, Vice President at Fidelity Investments Institutional Services (investment management firm) (1994-1997). Other Directorships in the Last Five Years. None. | |||
| Name and Year of Birth | Position(s) with the Trust | Officer Since(2) | Principal Occupation(s) During Past Five Years | |||
| Principal Officers who are not Trustees | ||||||
Payson F. Swaffield 1956 | President | 2003 | Vice President and Chief Income Investment Officer of EVM and BMR. Also Vice President of Calvert Research and Management (“CRM”). | |||
Maureen A. Gemma 1960 | Vice President, Secretary and Chief Legal Officer | 2005 | Vice President of EVM and BMR. Also Vice President of CRM. | |||
| 24 |
Eaton Vance
Special Equities Fund
December 31, 2019
Management and Organization — continued
| Name and Year of Birth | Position(s) with the Trust | Officer Since(2) | Principal Occupation(s) During Past Five Years | |||
| Principal Officers who are not Trustees (continued) | ||||||
James F. Kirchner 1967 | Treasurer | 2007 | Vice President of EVM and BMR. Also Vice President of CRM. | |||
Richard F. Froio 1968 | Chief Compliance Officer | 2017 | Vice President of EVM and BMR since 2017. Formerly Deputy Chief Compliance Officer (Adviser/Funds) and Chief Compliance Officer (Distribution) at PIMCO (2012-2017) and Managing Director at BlackRock/Barclays Global Investors (2009-2012). | |||
| (1) | Year first appointed to serve as Trustee for a fund in the Eaton Vance family of funds. Each Trustee has served continuously since appointment unless indicated otherwise. |
| (2) | Year first elected to serve as officer of a fund in the Eaton Vance family of funds when the officer has served continuously. Otherwise, year of most recent election as an officer of a fund in the Eaton Vance family of funds. Titles may have changed since initial election. |
The SAI for the Fund includes additional information about the Trustees and officers of the Fund and can be obtained without charge on Eaton Vance’s website at www.eatonvance.com or by calling 1-800-262-1122.
| 25 |
Eaton Vance Funds
IMPORTANT NOTICES
Privacy. The Eaton Vance organization is committed to ensuring your financial privacy. Each entity listed below has adopted a privacy policy and procedures (“Privacy Program”) Eaton Vance believes is reasonably designed to protect your personal information and to govern when and with whom Eaton Vance may share your personal information.
| • | At the time of opening an account, Eaton Vance generally requires you to provide us with certain information such as name, address, social security number, tax status, account numbers, and account balances. This information is necessary for us to both open an account for you and to allow us to satisfy legal requirements such as applicable anti-money laundering reviews and know-your-customer requirements. |
| • | On an ongoing basis, in the normal course of servicing your account, Eaton Vance may share your information with unaffiliated third parties that perform various services for Eaton Vance and/or your account. These third parties include transfer agents, custodians, broker/dealers and our professional advisers, including auditors, accountants, and legal counsel. Eaton Vance may additionally share your personal information with our affiliates. |
| • | We believe our Privacy Program is reasonably designed to protect the confidentiality of your personal information and to prevent unauthorized access to that information. |
| • | We reserve the right to change our Privacy Program at any time upon proper notification to you. You may want to review our Privacy Program periodically for changes by accessing the link on our homepage: www.eatonvance.com. |
Our pledge of protecting your personal information applies to the following entities within the Eaton Vance organization: the Eaton Vance Family of Funds, Eaton Vance Management, Eaton Vance Investment Counsel, Eaton Vance Distributors, Inc., Eaton Vance Trust Company, Eaton Vance Management (International) Limited, Eaton Vance Advisers International Limited, Eaton Vance Global Advisors Limited, Eaton Vance Management’s Real Estate Investment Group, Boston Management and Research, Calvert Research and Management, and Calvert Funds. This Privacy Notice supersedes all previously issued privacy disclosures. For more information about our Privacy Program or about how your personal information may be used, please call 1-800-262-1122.
Delivery of Shareholder Documents. The Securities and Exchange Commission (SEC) permits funds to deliver only one copy of shareholder documents, including prospectuses, proxy statements and shareholder reports, to fund investors with multiple accounts at the same residential or post office box address. This practice is often called “householding” and it helps eliminate duplicate mailings to shareholders. Eaton Vance, or your financial intermediary, may household the mailing of your documents indefinitely unless you instruct Eaton Vance, or your financial intermediary, otherwise. If you would prefer that your Eaton Vance documents not be householded, please contact Eaton Vanceat 1-800-262-1122, or contact your financial intermediary. Your instructions that householding not apply to delivery of your Eaton Vance documents will be effective within 30 days of receipt by Eaton Vance or your financial intermediary.
Portfolio Holdings. Each Eaton Vance Fund and its underlying Portfolio(s) (if applicable) files a schedule of portfolio holdings on Part F to Form N-PORT with the SEC for the first and third quarters of each fiscal year. The Form N-PORT will be available on the Eaton Vance website at www.eatonvance.com, by calling Eaton Vance at 1-800-262-1122 or in the EDGAR database on the SEC’s website at www.sec.gov.
Proxy Voting. From time to time, funds are required to vote proxies related to the securities held by the funds. The Eaton Vance Funds or their underlying Portfolios (if applicable) vote proxies according to a set of policies and procedures approved by the Funds’ and Portfolios’ Boards. You may obtain a description of these policies and procedures and information on how the Funds or Portfolios voted proxies relating to portfolio securities during the most recent 12-month period ended June 30, without charge, upon request, by calling 1-800-262-1122 and by accessing the SEC’s website at www.sec.gov.
| 26 |
This Page Intentionally Left Blank
This Page Intentionally Left Blank
Investment Adviser
Boston Management and Research
Two International Place
Boston, MA 02110
Administrator
Eaton Vance Management
Two International Place
Boston, MA 02110
Principal Underwriter*
Eaton Vance Distributors, Inc.
Two International Place
Boston, MA 02110
(617) 482-8260
Custodian
State Street Bank and Trust Company
State Street Financial Center, One Lincoln Street
Boston, MA 02111
Transfer Agent
BNY Mellon Investment Servicing (US) Inc.
Attn: Eaton Vance Funds
P.O. Box 9653
Providence, RI 02940-9653
(800) 262-1122
Independent Registered Public Accounting Firm
Deloitte & Touche LLP
200 Berkeley Street
Boston, MA 02116-5022
Fund Offices
Two International Place
Boston, MA 02110
| * | FINRA BrokerCheck. Investors may check the background of their Investment Professional by contacting the Financial Industry Regulatory Authority (FINRA). FINRA BrokerCheck is a free tool to help investors check the professional background of current and former FINRA-registered securities firms and brokers. FINRA BrokerCheck is available by calling 1-800-289-9999 and at www.FINRA.org. The FINRA BrokerCheck brochure describing this program is available to investors at www.FINRA.org. |

172 12.31.19
Item 2. Code of Ethics
The registrant has adopted a code of ethics applicable to its Principal Executive Officer, Principal Financial Officer and Principal Accounting Officer. The registrant undertakes to provide a copy of such code of ethics to any person upon request, without charge, by calling1-800-262-1122. The registrant has not amended the code of ethics as described in FormN-CSR during the period covered by this report. The registrant has not granted any waiver, including an implicit waiver, from a provision of the code of ethics as described in FormN-CSR during the period covered by this report.
Item 3. Audit Committee Financial Expert
The registrant’s Board has designated George J. Gorman and William H. Park, each an independent trustee, as audit committee financial experts. Mr. Gorman is a certified public accountant who is the Principal at George J. Gorman LLC (a consulting firm). Previously, Mr. Gorman served in various capacities at Ernst & Young LLP (a registered public accounting firm), including as Senior Partner. Mr. Gorman also has experience serving as an independent trustee and audit committee financial expert of other mutual fund complexes. Mr. Park is a certified public accountant who is a private investor. Previously, he served as a consultant, as the Chief Financial Officer of Aveon Group, L.P. (an investment management firm), as the Vice Chairman of Commercial Industrial Finance Corp. (specialty finance company), as President and Chief Executive Officer of Prizm Capital Management, LLC (investment management firm), as Executive Vice President and Chief Financial Officer of United Asset Management Corporation (an institutional investment management firm) and as a Senior Manager at Price Waterhouse (now PricewaterhouseCoopers) (a registered public accounting firm).
Item 4. Principal Accountant Fees and Services
Eaton Vance Balanced Fund, Eaton Vance Core Bond Fund, Eaton Vance Dividend Builder Fund, Eaton Vance Greater India Fund, Eaton Vance Growth Fund, Eaton VanceLarge-Cap Value Fund, Eaton Vance Real Estate Fund, Eaton VanceSmall-Cap Fund and Eaton Vance Special Equities Fund (the “Fund(s)”) are series of Eaton Vance Special Investment Trust (the “Trust”), a Massachusetts business trust, which, including the Funds, contains a total of 11 series (the “Series”). The Trust is registered under the Investment Company Act of 1940 as anopen-end management investment company. This FormN-CSR relates to the Funds’ annual reports.
(a)-(d)
The following tables present the aggregate fees billed to each Fund for the Fund’s fiscal years ended December 31, 2018 and December 31, 2019 by the registrant’s principal accountant, Deloitte & Touche LLP (“D&T”), for professional services rendered for the audit of the Fund’s annual financial statements and fees billed for other services rendered by D&T during such periods.
Eaton Vance Balanced Fund | 12/31/18 | 12/31/19 | ||||||
Audit Fees | $ | 24,140 | $ | 24,450 | ||||
Audit-Related Fees(1) | $ | 0 | $ | 0 | ||||
Tax Fees(2) | $ | 17,401 | $ | 17,043 | ||||
All Other Fees(3) | $ | 0 | $ | 0 | ||||
|
|
|
| |||||
Total | $ | 41,541 | $ | 41,493 | ||||
|
|
|
| |||||
Eaton Vance Core Bond Fund Fiscal Years Ended | 12/31/18 | 12/31/19 | ||||||
Audit Fees | $ | 15,050 | $ | 15,250 | ||||
Audit-Related Fees(1) | $ | 0 | $ | 0 | ||||
Tax Fees(2) | $ | 12,101 | $ | 11,683 | ||||
All Other Fees(3) | $ | 0 | $ | 0 | ||||
|
|
|
| |||||
Total | $ | 27,151 | $ | 26,933 | ||||
|
|
|
| |||||
Eaton Vance Dividend Builder Fund Fiscal Years Ended | 12/31/18 | 12/31/19 | ||||||
Audit Fees | $ | 47,020 | $ | 47,650 | ||||
Audit-Related Fees(1) | $ | 0 | $ | 0 | ||||
Tax Fees(2) | $ | 15,790 | $ | 15,336 | ||||
All Other Fees(3) | $ | 0 | $ | 0 | ||||
|
|
|
| |||||
Total | $ | 62,810 | $ | 62,986 | ||||
|
|
|
| |||||
Eaton Vance Greater India Fund Fiscal Years Ended | 12/31/18 | 12/31/19 | ||||||
Audit Fees | $ | 16,150 | $ | 16,350 | ||||
Audit-Related Fees(1) | $ | 0 | $ | 0 | ||||
Tax Fees(2) | $ | 9,989 | $ | 11,316 | ||||
All Other Fees(3) | $ | 0 | $ | 0 | ||||
|
|
|
| |||||
Total | $ | 26,139 | $ | 27,666 | ||||
|
|
|
| |||||
Eaton Vance Growth Fund Fiscal Years Ended | 12/31/18 | 12/31/19 | ||||||
Audit Fees | $ | 34,980 | $ | 35,450 | ||||
Audit-Related Fees(1) | $ | 0 | $ | 0 | ||||
Tax Fees(2) | $ | 13,719 | $ | 13,850 | ||||
All Other Fees(3) | $ | 0 | $ | 0 | ||||
|
|
|
| |||||
Total | $ | 48,699 | $ | 49,300 | ||||
|
|
|
| |||||
Eaton VanceLarge-Cap Value Fund Fiscal Years Ended | 12/31/18 | 12/31/19 | ||||||
Audit Fees | $ | 48,270 | $ | 48,950 | ||||
Audit-Related Fees(1) | $ | 0 | $ | 0 | ||||
Tax Fees(2) | $ | 16,545 | $ | 16,174 | ||||
All Other Fees(3) | $ | 0 | $ | 0 | ||||
|
|
|
| |||||
Total | $ | 64,815 | $ | 65,124 | ||||
|
|
|
| |||||
Eaton Vance Real Estate Fund Fiscal Years Ended | 12/31/18 | 12/31/19 | ||||||
Audit Fees | $ | 32,380 | $ | 32,850 | ||||
Audit-Related Fees(1) | $ | 0 | $ | 0 | ||||
Tax Fees(2) | $ | 12,842 | $ | 12,415 | ||||
All Other Fees(3) | $ | 0 | $ | 0 | ||||
|
|
|
| |||||
Total | $ | 45,222 | $ | 45,265 | ||||
|
|
|
| |||||
Eaton VanceSmall-Cap Fund Fiscal Years Ended | 12/31/18 | 12/31/19 | ||||||
Audit Fees | $ | 32,640 | $ | 33,050 | ||||
Audit-Related Fees(1) | $ | 0 | $ | 0 | ||||
Tax Fees(2) | $ | 11,740 | $ | 11,297 | ||||
All Other Fees(3) | $ | 0 | $ | 0 | ||||
|
|
|
| |||||
Total | $ | 44,380 | $ | 44,347 | ||||
|
|
|
| |||||
Eaton Vance Special Equities Fund Fiscal Years Ended | 12/31/18 | 12/31/19 | ||||||
Audit Fees | $ | 29,060 | $ | 29,450 | ||||
Audit-Related Fees(1) | $ | 0 | $ | 0 | ||||
Tax Fees(2) | $ | 11,190 | $ | 10,738 | ||||
All Other Fees(3) | $ | 0 | $ | 0 | ||||
|
|
|
| |||||
Total | $ | 40,250 | $ | 40,188 | ||||
|
|
|
| |||||
| (1) | Audit-related fees consist of the aggregate fees billed for assurance and related services that are reasonably related to the performance of the audit of financial statements and are not reported under the category of audit fees. |
| (2) | Tax fees consist of the aggregate fees billed for professional services rendered by the principal accountant relating to tax compliance, tax advice, and tax planning and specifically include fees for tax return preparation and other related tax compliance/planning matters. |
| (3) | All other fees consist of the aggregate fees billed for products and services provided by the principal accountant other than audit, audit-related, and tax services. |
The various Series comprising the Trust have differing fiscal year ends (August 31, October 31, November 30 or December 31). The following table presents the aggregate audit, audit-related, tax, and other fees billed to all of the Series in the Trust by D&T for the last two fiscal years of each Series.
Fiscal Years Ended* | 8/31/18 | 10/31/18 | 11/30/18 | 12/31/18 | 8/31/19 | 10/31/19 | 12/31/19 | |||||||||||||||||||||
Audit Fees | $ | 37,050 | $ | 127,240 | $ | 27,380 | $ | 279,690 | $ | 37,550 | $ | 104,800 | $ | 283,450 | ||||||||||||||
Audit-Related Fees(1) | $ | 0 | $ | 0 | $ | 0 | $ | 0 | $ | 0 | $ | 0 | $ | 0 | ||||||||||||||
Tax Fees(2) | $ | 10,000 | $ | 72,001 | $ | 10,761 | $ | 121,317 | $ | 9,550 | $ | 32,002 | $ | 119,852 | ||||||||||||||
All Other Fees(3) | $ | 0 | $ | 0 | $ | 0 | $ | 0 | $ | 0 | $ | 0 | $ | 0 | ||||||||||||||
|
|
|
|
|
|
|
|
|
|
|
|
|
| |||||||||||||||
Total | $ | 47,050 | $ | 199,241 | $ | 38,141 | $ | 401,007 | $ | 47,100 | $ | 136,802 | $ | 403,302 | ||||||||||||||
|
|
|
|
|
|
|
|
|
|
|
|
|
| |||||||||||||||
| * | Information is not presented for the fiscal period ended 11/30/19 as no Series in the Trust with such fiscal period end was in operation during such period. |
| (1) | Audit-related fees consist of the aggregate fees billed for assurance and related services that are reasonably related to the performance of the audit of financial statements and are not reported under the category of audit fees. |
| (2) | Tax fees consist of the aggregate fees billed for professional services rendered by the principal accountant relating to tax compliance, tax advice, and tax planning and specifically include fees for tax return preparation and other related tax compliance/planning matters. |
| (3) | All other fees consist of the aggregate fees billed for products and services provided by the principal accountant other than audit, audit-related, and tax services. |
(e)(1) The registrant’s audit committee has adopted policies and procedures relating to thepre-approval of services provided by the registrant’s principal accountant (the“Pre-Approval Policies”). ThePre-Approval
Policies establish a framework intended to assist the audit committee in the proper discharge of itspre-approval responsibilities. As a general matter, thePre-Approval Policies (i) specify certain types of audit, audit-related, tax, and other services determined to bepre-approved by the audit committee; and (ii) delineate specific procedures governing the mechanics of thepre-approval process, including the approval and monitoring of audit andnon-audit service fees. Unless a service is specificallypre-approved under thePre-Approval Policies, it must be separatelypre-approved by the audit committee.
ThePre-Approval Policies and the types of audit andnon-audit servicespre-approved therein must be reviewed and ratified by the registrant’s audit committee at least annually. The registrant’s audit committee maintains full responsibility for the appointment, compensation, and oversight of the work of the registrant’s principal accountant.
(e)(2) No services described in paragraphs (b)-(d) above were approved by the registrant’s audit committee pursuant to the “de minimis exception” set forth in Rule2-01 (c)(7)(i)(C) of RegulationS-X.
(f) Not applicable.
(g)The following table presents (i) the aggregatenon-audit fees (i.e., fees for audit-related, tax, and other services) billed for services rendered to all of the Series in the Trust by D&T for the last two fiscal years of each Series; and (ii) the aggregatenon-audit fees (i.e., fees for audit-related, tax, and other services) billed to the Eaton Vance organization by D&T for the last two fiscal years of each Series.
Fiscal Years Ended* | 8/31/18 | 10/31/18 | 11/30/18 | 12/31/18 | 8/31/19 | 10/31/19 | 12/31/19 | |||||||||||||||||||||
Registrant(1) | $ | 10,000 | $ | 72,001 | $ | 10,761 | $ | 121,317 | $ | 9,550 | $ | 32,002 | $ | 119,852 | ||||||||||||||
Eaton Vance(2) | $ | 74,355 | $ | 126,485 | $ | 126,485 | $ | 126,485 | $ | 8,000 | $ | 59,903 | $ | 59,903 | ||||||||||||||
| * | Information is not presented for the fiscal period ended 11/30/19 as no Series in the Trust with such fiscal period end was in operation during such period. |
| (1) | Includes all of the Series of the Trust. During the fiscal years reported above, certain of the Funds were “feeder” funds in a “master-feeder” fund structure or funds of funds. |
| (2) | Various subsidiaries of Eaton Vance Corp. act in either an investment advisory and/or service provider capacity with respect to the Series and/or their respective “master” funds (if applicable). |
(h) The registrant’s audit committee has considered whether the provision by the registrant’s principal accountant ofnon-audit services to the registrant’s investment adviser and any entity controlling, controlled by, or under common control with the adviser that provides ongoing services to the registrant that were notpre-approved pursuant to Rule2-01(c)(7)(ii) of RegulationS-X is compatible with maintaining the principal accountant’s independence.
Item 5. Audit Committee of Listed Registrants
Not applicable.
Item 6. Schedule of Investments
Please see schedule of investments contained in the Report to Stockholders included under Item 1 of this FormN-CSR.
Item 7. Disclosure of Proxy Voting Policies and Procedures forClosed-End Management Investment Companies
Not applicable.
Item 8. Portfolio Managers ofClosed-End Management Investment Companies
Not applicable.
Item 9. Purchases of Equity Securities byClosed-End Management Investment Company and Affiliated Purchasers
Not applicable.
Item 10. Submission of Matters to a Vote of Security Holders
No material changes.
Item 11. Controls and Procedures
(a) It is the conclusion of the registrant’s principal executive officer and principal financial officer that the effectiveness of the registrant’s current disclosure controls and procedures (such disclosure controls and procedures having been evaluated within 90 days of the date of this filing) provide reasonable assurance that the information required to be disclosed by the registrant has been recorded, processed, summarized and reported within the time period specified in the Commission’s rules and forms and that the information required to be disclosed by the registrant has been accumulated and communicated to the registrant’s principal executive officer and principal financial officer in order to allow timely decisions regarding required disclosure.
(b) There have been no changes in the registrant’s internal controls over financial reporting during the period covered by this report that has materially affected, or is reasonably likely to materially affect, the registrant’s internal control over financial reporting.
Item 12. Disclosure of Securities Lending Activities forClosed-End Management Investment Companies
Not applicable.
Item 13. Exhibits
(a)(1) | Registrant’s Code of Ethics – Not applicable (please see Item 2). | |
(a)(2)(i) | Treasurer’s Section 302 certification. | |
(a)(2)(ii) | President’s Section 302 certification. | |
(b) | Combined Section 906 certification. | |
Signatures
Pursuant to the requirements of the Securities Exchange Act of 1934 and the Investment Company Act of 1940, the registrant has duly caused this report to be signed on its behalf by the undersigned, thereunto duly authorized.
Eaton Vance Special Investment Trust
| By: | /s/ Payson F. Swaffield | |
| Payson F. Swaffield | ||
| President |
Date: February 24, 2020
Pursuant to the requirements of the Securities Exchange Act of 1934 and the Investment Company Act of 1940, this report has been signed below by the following persons on behalf of the registrant and in the capacities and on the dates indicated.
| By: | /s/ James F. Kirchner | |
| James F. Kirchner | ||
| Treasurer |
Date: February 24, 2020
| By: | /s/ Payson F. Swaffield | |
| Payson F. Swaffield | ||
| President |
Date: February 24, 2020