UNITED STATES
SECURITIES AND EXCHANGE COMMISSION
Washington, D.C. 20549
FORM N-CSR
CERTIFIED SHAREHOLDER REPORT OF REGISTERED
MANAGEMENT INVESTMENT COMPANIES
Investment Company Act File Number: 811-02958
T. Rowe Price International Funds, Inc.
(Exact name of registrant as specified in charter)
100 East Pratt Street, Baltimore, MD 21202
(Address of principal executive offices)
David Oestreicher
100 East Pratt Street, Baltimore, MD 21202
(Name and address of agent for service)
Registrant’s telephone number, including area code: (410) 345-2000
Date of fiscal year end: December 31
Date of reporting period: December 31, 2024
Item 1. Reports to Shareholders
(a) Report pursuant to Rule 30e-1
Annual Shareholder Report
December 31, 2024
Emerging Markets Local Currency Bond Fund
This annual shareholder report contains important information about Emerging Markets Local Currency Bond Fund (the "fund") for the period of January 1, 2024 to December 31, 2024. You can find the fund’s prospectus, financial information on Form N‑CSR (which includes required tax information for dividends), holdings, proxy voting information, and other information atwww.troweprice.com/prospectus. You can also request this information without charge by contacting T. Rowe Price at 1‑800‑638‑5660 or info@troweprice.com or contacting your intermediary.
What were the fund costs for the last year? (based on a hypothetical $10,000 investment)
| | Costs of a $10,000 investment | Costs paid as a percentage of a $10,000 investment |
|---|
| Emerging Markets Local Currency Bond Fund - Investor Class | $100 | 1.02% |
|---|
What drove fund performance during the past 12 months?
- Global fixed income markets fell over the 12-month reporting period due to weaker currencies versus the dollar and rising bond yields at the end of the period, despite many central banks easing monetary policy.
The fund benefited from its developed market hedges over the period relative to the J.P. Morgan GBI - EM Global Diversified. In particular, our short duration hedges in the U.S. and eurozone heading into the hawkish December Federal Reserve meeting contributed. Additionally, a long position in the Turkish lira had a positive impact amid supportive macroeconomic trends and policies.
Against the style-specific index, the fund’s overweight to duration in Brazil and long position in the Brazilian real were detrimental amid investor concerns over the government's spending plans and wide budget deficit. An underweight to duration in China dragged on performance as local yields fell over the reporting period with China’s central bank maintaining mostly stimulative monetary policy.
The fund seeks to provide high income and some capital appreciation primarily through a focus on sovereign debt denominated in the currencies of the respective emerging markets. During the period, the fund added to currencies outside of the style-specific benchmark, such as the Egyptian pound and the Nigerian naira, due to attractive yields.
The fund held material exposure to derivatives, including currency and interest rate derivatives. The fund’s derivatives exposure, including currency forwards and interest rate derivatives, had a negative impact on absolute performance.
How has the fund performed?
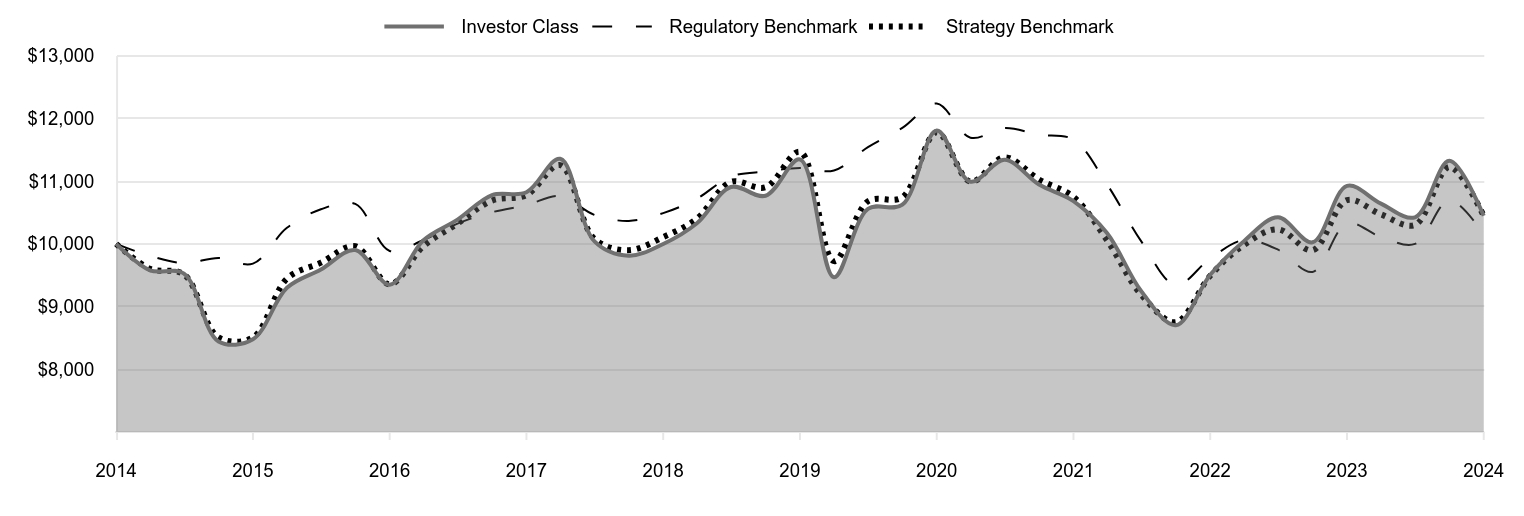
Cumulative Returns of a Hypothetical $10,000 Investment as of December 31, 2024
| Investor Class | Regulatory Benchmark | Strategy Benchmark |
|---|
| 2014 | 10,000 | 10,000 | 10,000 |
|---|
| 2015 | 9,578 | 9,808 | 9,604 |
|---|
| 2015 | 9,526 | 9,692 | 9,512 |
|---|
| 2015 | 8,444 | 9,775 | 8,509 |
|---|
| 2015 | 8,480 | 9,685 | 8,508 |
|---|
| 2016 | 9,300 | 10,256 | 9,445 |
|---|
| 2016 | 9,592 | 10,552 | 9,701 |
|---|
| 2016 | 9,901 | 10,638 | 9,961 |
|---|
| 2016 | 9,350 | 9,887 | 9,354 |
|---|
| 2017 | 10,058 | 10,061 | 9,962 |
|---|
| 2017 | 10,386 | 10,323 | 10,323 |
|---|
| 2017 | 10,779 | 10,505 | 10,690 |
|---|
| 2017 | 10,823 | 10,618 | 10,777 |
|---|
| 2018 | 11,357 | 10,762 | 11,256 |
|---|
| 2018 | 10,043 | 10,463 | 10,083 |
|---|
| 2018 | 9,811 | 10,366 | 9,899 |
|---|
| 2018 | 9,998 | 10,490 | 10,108 |
|---|
| 2019 | 10,329 | 10,721 | 10,403 |
|---|
| 2019 | 10,907 | 11,075 | 10,989 |
|---|
| 2019 | 10,767 | 11,154 | 10,902 |
|---|
| 2019 | 11,346 | 11,208 | 11,469 |
|---|
| 2020 | 9,469 | 11,171 | 9,725 |
|---|
| 2020 | 10,557 | 11,542 | 10,679 |
|---|
| 2020 | 10,624 | 11,849 | 10,744 |
|---|
| 2020 | 11,809 | 12,238 | 11,778 |
|---|
| 2021 | 10,991 | 11,693 | 10,992 |
|---|
| 2021 | 11,341 | 11,846 | 11,381 |
|---|
| 2021 | 10,946 | 11,741 | 11,027 |
|---|
| 2021 | 10,682 | 11,662 | 10,748 |
|---|
| 2022 | 10,168 | 10,944 | 10,054 |
|---|
| 2022 | 9,244 | 10,040 | 9,186 |
|---|
| 2022 | 8,703 | 9,343 | 8,752 |
|---|
| 2022 | 9,507 | 9,767 | 9,492 |
|---|
| 2023 | 10,043 | 10,061 | 9,982 |
|---|
| 2023 | 10,423 | 9,907 | 10,232 |
|---|
| 2023 | 10,025 | 9,552 | 9,899 |
|---|
| 2023 | 10,924 | 10,326 | 10,698 |
|---|
| 2024 | 10,641 | 10,111 | 10,471 |
|---|
| 2024 | 10,424 | 9,999 | 10,301 |
|---|
| 2024 | 11,324 | 10,697 | 11,227 |
|---|
| 2024 | 10,447 | 10,151 | 10,443 |
|---|
202501-4140694, 202502-4108441
Average Annual Total Returns
| | 1 Year | 5 Years | 10 Years |
|---|
| Emerging Markets Local Currency Bond Fund (Investor Class) | -4.37% | -1.64% | 0.44% |
|---|
| Bloomberg Global Aggregate Bond Index (Regulatory Benchmark) | -1.69 | -1.96 | 0.15 |
|---|
| J.P. Morgan GBI - EM Global Diversified (Strategy Benchmark) | -2.38 | -1.86 | 0.43 |
|---|
The preceding line graph shows the value of a hypothetical $10,000 investment in the fund over the past 10 fiscal year periods or since inception (for funds lacking 10-year records). The fund’s performance information included in the line graph and table above is compared with a regulatory required index that represents an overall securities market (Regulatory Benchmark). In addition, the line graph and table may also include one or more indexes that more closely aligns to the fund's investment strategy (Strategy Benchmark(s)). Due to new SEC Rules on shareholder reporting the fund adopted a new broad-based securities market index, referred to as the Regulatory Benchmark. Market index returns do not include expenses, which are deducted from fund returns. The fund's total return figures reflect the reinvestment of dividends and capital gains, if any.Neither the fund’s returns nor the index returns reflect the deduction of taxes that a shareholder would pay on fund distributions or redemptions of fund shares.The fund’s past performance is not a good predictor of the fund’s future performance.Updated performance information can be found at www.troweprice.com.
What are some fund statistics?
- Total Net Assets (000s)$295,456
- Number of Portfolio Holdings319
- Investment Advisory Fees Paid (000s)$442
- Portfolio Turnover Rate75.2%
What did the fund invest in?
Geographic Allocation (as a % of Net Assets)
| Indonesia | 12.1% |
| United States | 9.4 |
| South Africa | 8.0 |
| Thailand | 7.3 |
| Colombia | 5.8 |
| Malaysia | 5.7 |
| Mexico | 5.4 |
| China | 4.9 |
| Poland | 4.7 |
| Other | 36.7 |
Top Ten Holdings (as a % of Net Assets)
| Republic of Indonesia | 11.1% |
| Republic of South Africa | 8.0 |
| Kingdom of Thailand | 7.3 |
| Government of Malaysia | 5.7 |
| U.S. Treasury Bills | 5.7 |
| Republic of Colombia | 5.6 |
| United Mexican States | 5.2 |
| People's Republic of China | 4.7 |
| Republic of Poland | 4.7 |
| Czech Republic | 4.3 |
If you invest directly with T. Rowe Price, you can elect to receive future shareholder reports or other important documents through electronic delivery by enrolling at www.troweprice.com/paperless. If you invest through a financial intermediary such as an investment advisor, a bank, retirement plan sponsor or a brokerage firm, please contact that organization and ask if it can provide electronic delivery.
Bloomberg and J.P. Morgan do not accept any liability for any errors or omissions in the indexes or data, and hereby expressly disclaim all warranties of originality, accuracy, completeness, timeliness, merchantability and fitness for a particular purpose. No party may rely on any indexes or data contained in this communication. Visit www.troweprice.com/en/us/market-data-disclosures for additional legal notices & disclaimers.
Emerging Markets Local Currency Bond Fund
Investor Class (PRELX)
T. Rowe Price Investment Services, Inc.
100 East Pratt Street
Baltimore, MD 21202
Annual Shareholder Report
December 31, 2024
Emerging Markets Local Currency Bond Fund
This annual shareholder report contains important information about Emerging Markets Local Currency Bond Fund (the "fund") for the period of January 1, 2024 to December 31, 2024. You can find the fund’s prospectus, financial information on Form N‑CSR (which includes required tax information for dividends), holdings, proxy voting information, and other information atwww.troweprice.com/prospectus. You can also request this information without charge by contacting T. Rowe Price at 1‑800‑638‑5660 or info@troweprice.com or contacting your intermediary.
What were the fund costs for the last year? (based on a hypothetical $10,000 investment)
| | Costs of a $10,000 investment | Costs paid as a percentage of a $10,000 investment |
|---|
| Emerging Markets Local Currency Bond Fund - Advisor Class | $108 | 1.10% |
|---|
What drove fund performance during the past 12 months?
- Global fixed income markets fell over the 12-month reporting period due to weaker currencies versus the dollar and rising bond yields at the end of the period, despite many central banks easing monetary policy.
The fund benefited from its developed market hedges over the period relative to the J.P. Morgan GBI - EM Global Diversified. In particular, our short duration hedges in the U.S. and eurozone heading into the hawkish December Federal Reserve meeting contributed. Additionally, a long position in the Turkish lira had a positive impact amid supportive macroeconomic trends and policies.
Against the style-specific index, the fund’s overweight to duration in Brazil and long position in the Brazilian real were detrimental amid investor concerns over the government's spending plans and wide budget deficit. An underweight to duration in China dragged on performance as local yields fell over the reporting period with China’s central bank maintaining mostly stimulative monetary policy.
The fund seeks to provide high income and some capital appreciation primarily through a focus on sovereign debt denominated in the currencies of the respective emerging markets. During the period, the fund added to currencies outside of the style-specific benchmark, such as the Egyptian pound and the Nigerian naira, due to attractive yields.
The fund held material exposure to derivatives, including currency and interest rate derivatives. The fund’s derivatives exposure, including currency forwards and interest rate derivatives, had a negative impact on absolute performance.
How has the fund performed?
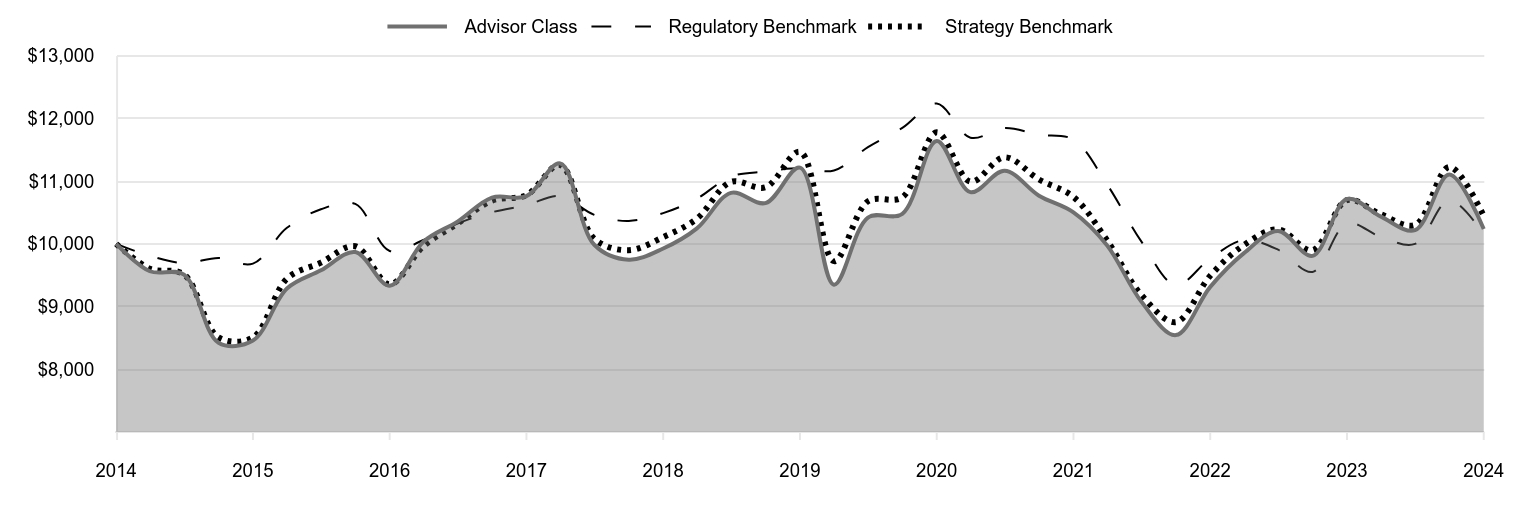
Cumulative Returns of a Hypothetical $10,000 Investment as of December 31, 2024
| Advisor Class | Regulatory Benchmark | Strategy Benchmark |
|---|
| 2014 | 10,000 | 10,000 | 10,000 |
|---|
| 2015 | 9,563 | 9,808 | 9,604 |
|---|
| 2015 | 9,508 | 9,692 | 9,512 |
|---|
| 2015 | 8,424 | 9,775 | 8,509 |
|---|
| 2015 | 8,458 | 9,685 | 8,508 |
|---|
| 2016 | 9,288 | 10,256 | 9,445 |
|---|
| 2016 | 9,578 | 10,552 | 9,701 |
|---|
| 2016 | 9,870 | 10,638 | 9,961 |
|---|
| 2016 | 9,332 | 9,887 | 9,354 |
|---|
| 2017 | 10,034 | 10,061 | 9,962 |
|---|
| 2017 | 10,355 | 10,323 | 10,323 |
|---|
| 2017 | 10,739 | 10,505 | 10,690 |
|---|
| 2017 | 10,760 | 10,618 | 10,777 |
|---|
| 2018 | 11,283 | 10,762 | 11,256 |
|---|
| 2018 | 9,986 | 10,463 | 10,083 |
|---|
| 2018 | 9,748 | 10,366 | 9,899 |
|---|
| 2018 | 9,926 | 10,490 | 10,108 |
|---|
| 2019 | 10,247 | 10,721 | 10,403 |
|---|
| 2019 | 10,814 | 11,075 | 10,989 |
|---|
| 2019 | 10,650 | 11,154 | 10,902 |
|---|
| 2019 | 11,215 | 11,208 | 11,469 |
|---|
| 2020 | 9,349 | 11,171 | 9,725 |
|---|
| 2020 | 10,420 | 11,542 | 10,679 |
|---|
| 2020 | 10,480 | 11,849 | 10,744 |
|---|
| 2020 | 11,641 | 12,238 | 11,778 |
|---|
| 2021 | 10,825 | 11,693 | 10,992 |
|---|
| 2021 | 11,165 | 11,846 | 11,381 |
|---|
| 2021 | 10,768 | 11,741 | 11,027 |
|---|
| 2021 | 10,502 | 11,662 | 10,748 |
|---|
| 2022 | 9,973 | 10,944 | 10,054 |
|---|
| 2022 | 9,081 | 10,040 | 9,186 |
|---|
| 2022 | 8,545 | 9,343 | 8,752 |
|---|
| 2022 | 9,314 | 9,767 | 9,492 |
|---|
| 2023 | 9,852 | 10,061 | 9,982 |
|---|
| 2023 | 10,205 | 9,907 | 10,232 |
|---|
| 2023 | 9,809 | 9,552 | 9,899 |
|---|
| 2023 | 10,715 | 10,326 | 10,698 |
|---|
| 2024 | 10,434 | 10,111 | 10,471 |
|---|
| 2024 | 10,218 | 9,999 | 10,301 |
|---|
| 2024 | 11,105 | 10,697 | 11,227 |
|---|
| 2024 | 10,237 | 10,151 | 10,443 |
|---|
202501-4140694, 202502-4108441
Average Annual Total Returns
| | 1 Year | 5 Years | 10 Years |
|---|
| Emerging Markets Local Currency Bond Fund (Advisor Class) | -4.46% | -1.81% | 0.23% |
|---|
| Bloomberg Global Aggregate Bond Index (Regulatory Benchmark) | -1.69 | -1.96 | 0.15 |
|---|
| J.P. Morgan GBI - EM Global Diversified (Strategy Benchmark) | -2.38 | -1.86 | 0.43 |
|---|
The preceding line graph shows the value of a hypothetical $10,000 investment in the fund over the past 10 fiscal year periods or since inception (for funds lacking 10-year records). The fund’s performance information included in the line graph and table above is compared with a regulatory required index that represents an overall securities market (Regulatory Benchmark). In addition, the line graph and table may also include one or more indexes that more closely aligns to the fund's investment strategy (Strategy Benchmark(s)). Due to new SEC Rules on shareholder reporting the fund adopted a new broad-based securities market index, referred to as the Regulatory Benchmark. Market index returns do not include expenses, which are deducted from fund returns. The fund's total return figures reflect the reinvestment of dividends and capital gains, if any.Neither the fund’s returns nor the index returns reflect the deduction of taxes that a shareholder would pay on fund distributions or redemptions of fund shares.The fund’s past performance is not a good predictor of the fund’s future performance.Updated performance information can be found at www.troweprice.com.
What are some fund statistics?
- Total Net Assets (000s)$295,456
- Number of Portfolio Holdings319
- Investment Advisory Fees Paid (000s)$442
- Portfolio Turnover Rate75.2%
What did the fund invest in?
Geographic Allocation (as a % of Net Assets)
| Indonesia | 12.1% |
| United States | 9.4 |
| South Africa | 8.0 |
| Thailand | 7.3 |
| Colombia | 5.8 |
| Malaysia | 5.7 |
| Mexico | 5.4 |
| China | 4.9 |
| Poland | 4.7 |
| Other | 36.7 |
Top Ten Holdings (as a % of Net Assets)
| Republic of Indonesia | 11.1% |
| Republic of South Africa | 8.0 |
| Kingdom of Thailand | 7.3 |
| Government of Malaysia | 5.7 |
| U.S. Treasury Bills | 5.7 |
| Republic of Colombia | 5.6 |
| United Mexican States | 5.2 |
| People's Republic of China | 4.7 |
| Republic of Poland | 4.7 |
| Czech Republic | 4.3 |
If you invest directly with T. Rowe Price, you can elect to receive future shareholder reports or other important documents through electronic delivery by enrolling at www.troweprice.com/paperless. If you invest through a financial intermediary such as an investment advisor, a bank, retirement plan sponsor or a brokerage firm, please contact that organization and ask if it can provide electronic delivery.
Bloomberg and J.P. Morgan do not accept any liability for any errors or omissions in the indexes or data, and hereby expressly disclaim all warranties of originality, accuracy, completeness, timeliness, merchantability and fitness for a particular purpose. No party may rely on any indexes or data contained in this communication. Visit www.troweprice.com/en/us/market-data-disclosures for additional legal notices & disclaimers.
Emerging Markets Local Currency Bond Fund
Advisor Class (PAELX)
T. Rowe Price Investment Services, Inc.
100 East Pratt Street
Baltimore, MD 21202
Annual Shareholder Report
December 31, 2024
Emerging Markets Local Currency Bond Fund
This annual shareholder report contains important information about Emerging Markets Local Currency Bond Fund (the "fund") for the period of January 1, 2024 to December 31, 2024. You can find the fund’s prospectus, financial information on Form N‑CSR (which includes required tax information for dividends), holdings, proxy voting information, and other information atwww.troweprice.com/prospectus. You can also request this information without charge by contacting T. Rowe Price at 1‑800‑638‑5660 or info@troweprice.com or contacting your intermediary.
What were the fund costs for the last year? (based on a hypothetical $10,000 investment)
| | Costs of a $10,000 investment | Costs paid as a percentage of a $10,000 investment |
|---|
| Emerging Markets Local Currency Bond Fund - I Class | $69 | 0.70% |
|---|
What drove fund performance during the past 12 months?
- Global fixed income markets fell over the 12-month reporting period due to weaker currencies versus the dollar and rising bond yields at the end of the period, despite many central banks easing monetary policy.
The fund benefited from its developed market hedges over the period relative to the J.P. Morgan GBI - EM Global Diversified. In particular, our short duration hedges in the U.S. and eurozone heading into the hawkish December Federal Reserve meeting contributed. Additionally, a long position in the Turkish lira had a positive impact amid supportive macroeconomic trends and policies.
Against the style-specific index, the fund’s overweight to duration in Brazil and long position in the Brazilian real were detrimental amid investor concerns over the government's spending plans and wide budget deficit. An underweight to duration in China dragged on performance as local yields fell over the reporting period with China’s central bank maintaining mostly stimulative monetary policy.
The fund seeks to provide high income and some capital appreciation primarily through a focus on sovereign debt denominated in the currencies of the respective emerging markets. During the period, the fund added to currencies outside of the style-specific benchmark, such as the Egyptian pound and the Nigerian naira, due to attractive yields.
The fund held material exposure to derivatives, including currency and interest rate derivatives. The fund’s derivatives exposure, including currency forwards and interest rate derivatives, had a negative impact on absolute performance.
How has the fund performed?
Cumulative Returns of a Hypothetical $500,000 Investment as of December 31, 2024
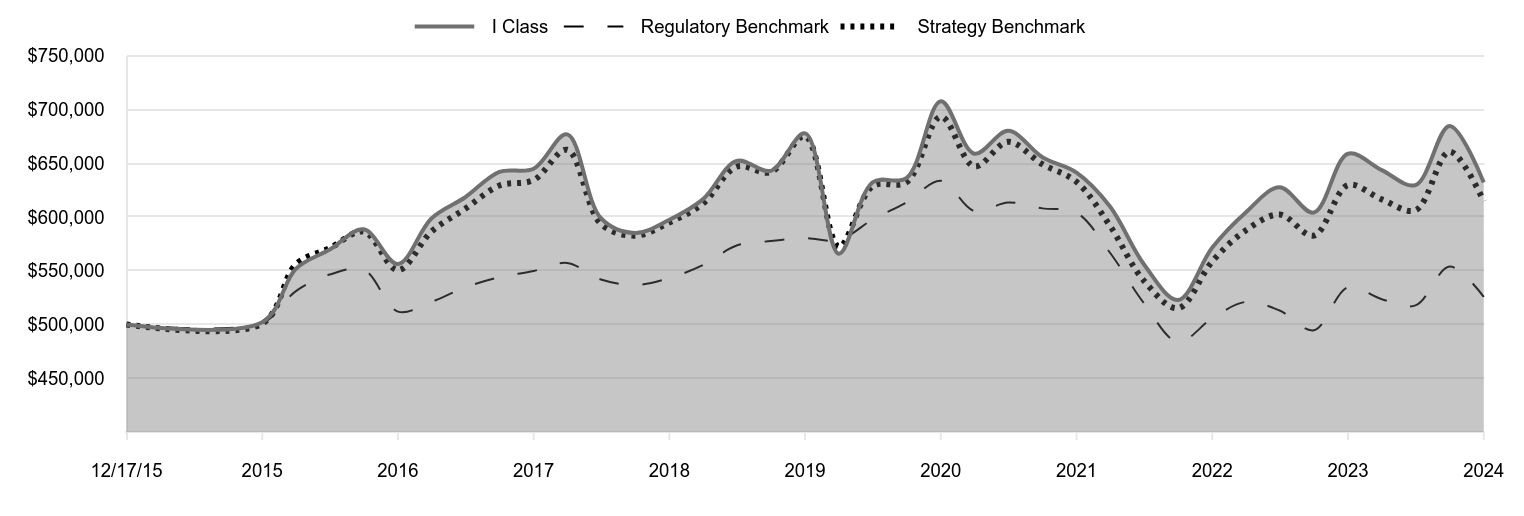
| I Class | Regulatory Benchmark | Strategy Benchmark |
|---|
| 12/17/15 | 500,000 | 500,000 | 500,000 |
|---|
| 12/31/15 | 502,124 | 501,507 | 500,806 |
|---|
| 3/31/16 | 551,903 | 531,091 | 555,972 |
|---|
| 6/30/16 | 569,679 | 546,441 | 571,018 |
|---|
| 9/30/16 | 588,518 | 550,902 | 586,313 |
|---|
| 12/31/16 | 556,183 | 511,968 | 550,593 |
|---|
| 3/31/17 | 598,643 | 520,986 | 586,390 |
|---|
| 6/30/17 | 618,390 | 534,542 | 607,638 |
|---|
| 9/30/17 | 641,980 | 543,970 | 629,218 |
|---|
| 12/31/17 | 644,833 | 549,828 | 634,354 |
|---|
| 3/31/18 | 676,837 | 557,313 | 662,544 |
|---|
| 6/30/18 | 598,810 | 541,807 | 593,495 |
|---|
| 9/30/18 | 585,135 | 536,802 | 582,663 |
|---|
| 12/31/18 | 597,430 | 543,231 | 594,954 |
|---|
| 3/31/19 | 616,390 | 555,192 | 612,330 |
|---|
| 6/30/19 | 652,137 | 573,483 | 646,840 |
|---|
| 9/30/19 | 642,957 | 577,583 | 641,714 |
|---|
| 12/31/19 | 677,777 | 580,386 | 675,108 |
|---|
| 3/31/20 | 565,821 | 578,489 | 572,409 |
|---|
| 6/30/20 | 632,215 | 597,697 | 628,596 |
|---|
| 9/30/20 | 636,475 | 613,605 | 632,438 |
|---|
| 12/31/20 | 707,593 | 633,759 | 693,294 |
|---|
| 3/31/21 | 658,835 | 605,488 | 646,994 |
|---|
| 6/30/21 | 680,129 | 613,436 | 669,882 |
|---|
| 9/30/21 | 655,625 | 608,017 | 649,095 |
|---|
| 12/31/21 | 641,309 | 603,928 | 632,649 |
|---|
| 3/31/22 | 609,727 | 566,721 | 591,777 |
|---|
| 6/30/22 | 556,029 | 519,898 | 540,720 |
|---|
| 9/30/22 | 522,769 | 483,794 | 515,168 |
|---|
| 12/31/22 | 571,544 | 505,799 | 558,723 |
|---|
| 3/31/23 | 604,222 | 521,007 | 587,544 |
|---|
| 6/30/23 | 627,596 | 513,036 | 602,266 |
|---|
| 9/30/23 | 604,105 | 494,638 | 582,648 |
|---|
| 12/31/23 | 658,830 | 534,706 | 629,687 |
|---|
| 3/31/24 | 643,562 | 523,568 | 616,366 |
|---|
| 6/30/24 | 629,695 | 517,785 | 606,306 |
|---|
| 9/30/24 | 684,605 | 553,942 | 660,833 |
|---|
| 12/31/24 | 632,112 | 525,674 | 614,689 |
|---|
202501-4140694, 202502-4108441
Average Annual Total Returns
| | 1 Year | 5 Years | Since Inception 12/17/15 |
|---|
| Emerging Markets Local Currency Bond Fund (I Class) | -4.06% | -1.39% | 2.63% |
|---|
| Bloomberg Global Aggregate Bond Index (Regulatory Benchmark) | -1.69 | -1.96 | 0.56 |
|---|
| J.P. Morgan GBI - EM Global Diversified (Strategy Benchmark) | -2.38 | -1.86 | 2.31 |
|---|
The preceding line graph shows the value of a hypothetical $500,000 investment in the fund over the past 10 fiscal year periods or since inception (for funds lacking 10-year records). The fund’s performance information included in the line graph and table above is compared with a regulatory required index that represents an overall securities market (Regulatory Benchmark). In addition, the line graph and table may also include one or more indexes that more closely aligns to the fund's investment strategy (Strategy Benchmark(s)). Due to new SEC Rules on shareholder reporting the fund adopted a new broad-based securities market index, referred to as the Regulatory Benchmark. Market index returns do not include expenses, which are deducted from fund returns. The fund's total return figures reflect the reinvestment of dividends and capital gains, if any.Neither the fund’s returns nor the index returns reflect the deduction of taxes that a shareholder would pay on fund distributions or redemptions of fund shares.The fund’s past performance is not a good predictor of the fund’s future performance.Updated performance information can be found at www.troweprice.com.
What are some fund statistics?
- Total Net Assets (000s)$295,456
- Number of Portfolio Holdings319
- Investment Advisory Fees Paid (000s)$442
- Portfolio Turnover Rate75.2%
What did the fund invest in?
Geographic Allocation (as a % of Net Assets)
| Indonesia | 12.1% |
| United States | 9.4 |
| South Africa | 8.0 |
| Thailand | 7.3 |
| Colombia | 5.8 |
| Malaysia | 5.7 |
| Mexico | 5.4 |
| China | 4.9 |
| Poland | 4.7 |
| Other | 36.7 |
Top Ten Holdings (as a % of Net Assets)
| Republic of Indonesia | 11.1% |
| Republic of South Africa | 8.0 |
| Kingdom of Thailand | 7.3 |
| Government of Malaysia | 5.7 |
| U.S. Treasury Bills | 5.7 |
| Republic of Colombia | 5.6 |
| United Mexican States | 5.2 |
| People's Republic of China | 4.7 |
| Republic of Poland | 4.7 |
| Czech Republic | 4.3 |
If you invest directly with T. Rowe Price, you can elect to receive future shareholder reports or other important documents through electronic delivery by enrolling at www.troweprice.com/paperless. If you invest through a financial intermediary such as an investment advisor, a bank, retirement plan sponsor or a brokerage firm, please contact that organization and ask if it can provide electronic delivery.
Bloomberg and J.P. Morgan do not accept any liability for any errors or omissions in the indexes or data, and hereby expressly disclaim all warranties of originality, accuracy, completeness, timeliness, merchantability and fitness for a particular purpose. No party may rely on any indexes or data contained in this communication. Visit www.troweprice.com/en/us/market-data-disclosures for additional legal notices & disclaimers.
Emerging Markets Local Currency Bond Fund
I Class (TEIMX)
T. Rowe Price Investment Services, Inc.
100 East Pratt Street
Baltimore, MD 21202
Annual Shareholder Report
December 31, 2024
Emerging Markets Local Currency Bond Fund
This annual shareholder report contains important information about Emerging Markets Local Currency Bond Fund (the "fund") for the period of January 1, 2024 to December 31, 2024. You can find the fund’s prospectus, financial information on Form N‑CSR (which includes required tax information for dividends), holdings, proxy voting information, and other information atwww.troweprice.com/prospectus. You can also request this information without charge by contacting T. Rowe Price at 1‑800‑638‑5660 or info@troweprice.com or contacting your intermediary.
What were the fund costs for the last year? (based on a hypothetical $10,000 investment)
| | Costs of a $10,000 investment | Costs paid as a percentage of a $10,000 investment |
|---|
| Emerging Markets Local Currency Bond Fund - Z Class | $0 | 0.00% |
|---|
What drove fund performance during the past 12 months?
- Global fixed income markets fell over the 12-month reporting period due to weaker currencies versus the dollar and rising bond yields at the end of the period, despite many central banks easing monetary policy.
The fund benefited from its developed market hedges over the period relative to the J.P. Morgan GBI - EM Global Diversified. In particular, our short duration hedges in the U.S. and eurozone heading into the hawkish December Federal Reserve meeting contributed. Additionally, a long position in the Turkish lira had a positive impact amid supportive macroeconomic trends and policies.
Against the style-specific index, the fund’s overweight to duration in Brazil and long position in the Brazilian real were detrimental amid investor concerns over the government's spending plans and wide budget deficit. An underweight to duration in China dragged on performance as local yields fell over the reporting period with China’s central bank maintaining mostly stimulative monetary policy.
The fund seeks to provide high income and some capital appreciation primarily through a focus on sovereign debt denominated in the currencies of the respective emerging markets. During the period, the fund added to currencies outside of the style-specific benchmark, such as the Egyptian pound and the Nigerian naira, due to attractive yields.
The fund held material exposure to derivatives, including currency and interest rate derivatives. The fund’s derivatives exposure, including currency forwards and interest rate derivatives, had a negative impact on absolute performance.
How has the fund performed?
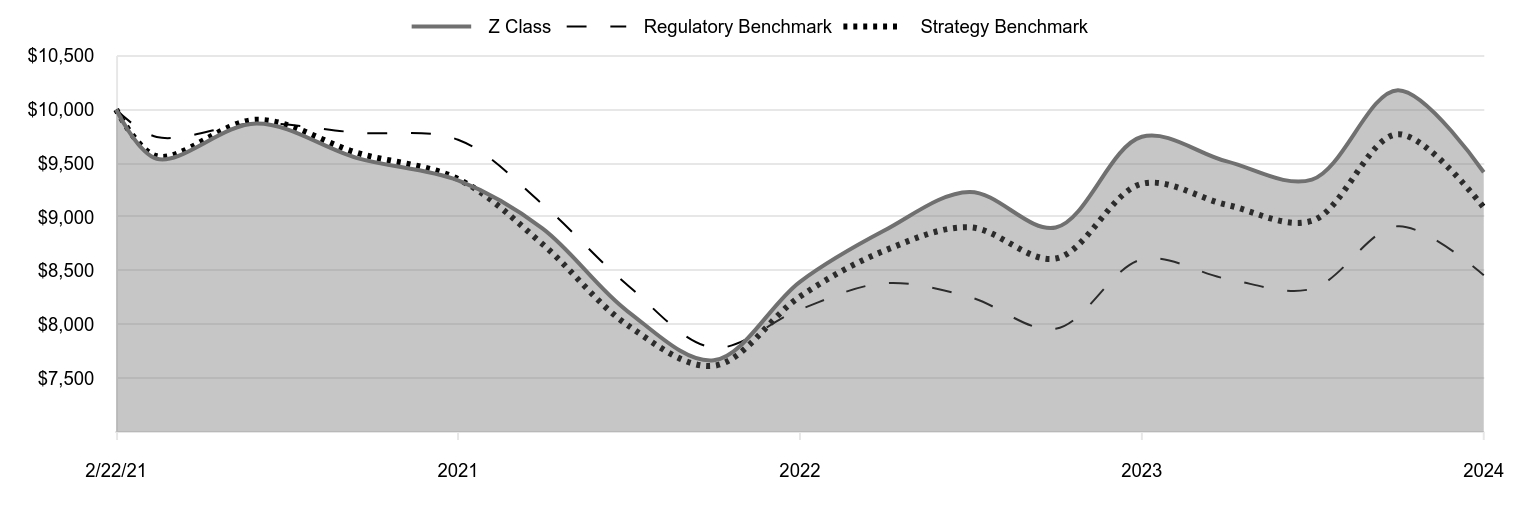
Cumulative Returns of a Hypothetical $10,000 Investment as of December 31, 2024
| Z Class | Regulatory Benchmark | Strategy Benchmark |
|---|
| 2/22/21 | 10,000 | 10,000 | 10,000 |
|---|
| 3/31/21 | 9,542 | 9,744 | 9,565 |
|---|
| 6/30/21 | 9,870 | 9,872 | 9,904 |
|---|
| 9/30/21 | 9,548 | 9,784 | 9,596 |
|---|
| 12/31/21 | 9,340 | 9,719 | 9,353 |
|---|
| 3/31/22 | 8,894 | 9,120 | 8,749 |
|---|
| 6/30/22 | 8,123 | 8,366 | 7,994 |
|---|
| 9/30/22 | 7,667 | 7,785 | 7,616 |
|---|
| 12/31/22 | 8,397 | 8,140 | 8,260 |
|---|
| 3/31/23 | 8,874 | 8,384 | 8,686 |
|---|
| 6/30/23 | 9,233 | 8,256 | 8,904 |
|---|
| 9/30/23 | 8,902 | 7,960 | 8,614 |
|---|
| 12/31/23 | 9,746 | 8,605 | 9,309 |
|---|
| 3/31/24 | 9,517 | 8,425 | 9,113 |
|---|
| 6/30/24 | 9,347 | 8,332 | 8,964 |
|---|
| 9/30/24 | 10,180 | 8,914 | 9,770 |
|---|
| 12/31/24 | 9,416 | 8,459 | 9,088 |
|---|
202501-4140694, 202502-4108441
Average Annual Total Returns
| | 1 Year | Since Inception 2/22/21 |
|---|
| Emerging Markets Local Currency Bond Fund (Z Class) | -3.39% | -1.55% |
|---|
| Bloomberg Global Aggregate Bond Index (Regulatory Benchmark) | -1.69 | -4.25 |
|---|
| J.P. Morgan GBI - EM Global Diversified (Strategy Benchmark) | -2.38 | -2.45 |
|---|
The preceding line graph shows the value of a hypothetical $10,000 investment in the fund over the past 10 fiscal year periods or since inception (for funds lacking 10-year records). The fund’s performance information included in the line graph and table above is compared with a regulatory required index that represents an overall securities market (Regulatory Benchmark). In addition, the line graph and table may also include one or more indexes that more closely aligns to the fund's investment strategy (Strategy Benchmark(s)). Due to new SEC Rules on shareholder reporting the fund adopted a new broad-based securities market index, referred to as the Regulatory Benchmark. Market index returns do not include expenses, which are deducted from fund returns. The fund's total return figures reflect the reinvestment of dividends and capital gains, if any.Neither the fund’s returns nor the index returns reflect the deduction of taxes that a shareholder would pay on fund distributions or redemptions of fund shares.The fund’s past performance is not a good predictor of the fund’s future performance.Updated performance information can be found at www.troweprice.com.
What are some fund statistics?
- Total Net Assets (000s)$295,456
- Number of Portfolio Holdings319
- Investment Advisory Fees Paid (000s)$442
- Portfolio Turnover Rate75.2%
What did the fund invest in?
Geographic Allocation (as a % of Net Assets)
| Indonesia | 12.1% |
| United States | 9.4 |
| South Africa | 8.0 |
| Thailand | 7.3 |
| Colombia | 5.8 |
| Malaysia | 5.7 |
| Mexico | 5.4 |
| China | 4.9 |
| Poland | 4.7 |
| Other | 36.7 |
Top Ten Holdings (as a % of Net Assets)
| Republic of Indonesia | 11.1% |
| Republic of South Africa | 8.0 |
| Kingdom of Thailand | 7.3 |
| Government of Malaysia | 5.7 |
| U.S. Treasury Bills | 5.7 |
| Republic of Colombia | 5.6 |
| United Mexican States | 5.2 |
| People's Republic of China | 4.7 |
| Republic of Poland | 4.7 |
| Czech Republic | 4.3 |
If you invest directly with T. Rowe Price, you can elect to receive future shareholder reports or other important documents through electronic delivery by enrolling at www.troweprice.com/paperless. If you invest through a financial intermediary such as an investment advisor, a bank, retirement plan sponsor or a brokerage firm, please contact that organization and ask if it can provide electronic delivery.
Bloomberg and J.P. Morgan do not accept any liability for any errors or omissions in the indexes or data, and hereby expressly disclaim all warranties of originality, accuracy, completeness, timeliness, merchantability and fitness for a particular purpose. No party may rely on any indexes or data contained in this communication. Visit www.troweprice.com/en/us/market-data-disclosures for additional legal notices & disclaimers.
Emerging Markets Local Currency Bond Fund
Z Class (TRZFX)
T. Rowe Price Investment Services, Inc.
100 East Pratt Street
Baltimore, MD 21202
Item 1. (b) Notice pursuant to Rule 30e-3.
Not applicable.
Item 2. Code of Ethics.
The registrant has adopted a code of ethics, as defined in Item 2 of Form N-CSR, applicable to its principal executive officer, principal financial officer, principal accounting officer or controller, or persons performing similar functions. A copy of this code of ethics is filed as an exhibit to this Form N-CSR. No substantive amendments were approved or waivers were granted to this code of ethics during the period covered by this report.
Item 3. Audit Committee Financial Expert.
The registrant’s Board of Directors has determined that Mr. Paul F. McBride qualifies as an audit committee financial expert, as defined in Item 3 of Form N-CSR. Mr. McBride is considered independent for purposes of Item 3 of Form N-CSR.
Item 4. Principal Accountant Fees and Services.
(a) – (d) Aggregate fees billed for the last two fiscal years for professional services rendered to, or on behalf of, the registrant by the registrant’s principal accountant were as follows:
| | | | | | | | | | | | | | |
| | | | | 2024 | | | | | | 2023 | |
| | Audit Fees | | $ | 39,999 | | | | | | | $ | 40,833 | |
| | Audit-Related Fees | | | - | | | | | | | | - | |
| | Tax Fees | | | - | | | | | | | | - | |
| | All Other Fees | | | - | | | | | | | | - | |
Audit fees include amounts related to the audit of the registrant’s annual financial statements and services normally provided by the accountant in connection with statutory and regulatory filings. Audit-related fees include amounts reasonably related to the performance of the audit of the registrant’s financial statements and specifically include the issuance of a report on internal controls and, if applicable, agreed-upon procedures related to fund acquisitions. Tax fees include amounts related to services for tax compliance, tax planning, and tax advice. The nature of these services specifically includes the review of distribution calculations and the preparation of Federal, state, and excise tax returns. All other fees include the registrant’s pro-rata share of amounts for agreed-upon procedures in conjunction with service contract approvals by the registrant’s Board of Directors/Trustees.
(e)(1) The registrant’s audit committee has adopted a policy whereby audit and non-audit services performed by the registrant’s principal accountant for the registrant, its investment adviser, and any entity controlling, controlled by, or under common control with the investment adviser that provides ongoing services to the registrant require pre-approval in advance at regularly scheduled audit committee meetings. If such a service is required between regularly scheduled audit committee meetings, pre-approval may be authorized by one audit committee member with ratification at the next scheduled audit committee meeting. Waiver of pre-approval for audit or non-audit services requiring fees of a de minimis amount is not permitted.
(2) No services included in (b) – (d) above were approved pursuant to paragraph (c)(7)(i)(C) of Rule 2-01 of Regulation S-X.
(f) Less than 50 percent of the hours expended on the principal accountant’s engagement to audit the registrant’s financial statements for the most recent fiscal year were attributed to work performed by persons other than the principal accountant’s full-time, permanent employees.
(g) The aggregate fees billed for the most recent fiscal year and the preceding fiscal year by the registrant’s principal accountant for non-audit services rendered to the registrant, its investment adviser, and any entity controlling, controlled by, or under common control with the investment adviser that provides ongoing services to the registrant were $1,262,000 and $1,524,000, respectively.
(h) All non-audit services rendered in (g) above were pre-approved by the registrant’s audit committee. Accordingly, these services were considered by the registrant’s audit committee in maintaining the principal accountant’s independence.
(i) Not applicable.
(j) Not applicable.
Item 5. Audit Committee of Listed Registrants.
Not applicable.
Item 6. Investments.
(a) Not applicable. The complete schedule of investments is included in Item 7 of this Form N-CSR.
(b) Not applicable.
Item 7. Financial Statements and Financial Highlights for Open-End Management Investment Companies.
(a – b) Report pursuant to Regulation S-X.
Financial
Highlights
Portfolio
of
Investments
Financial
Statements
and
Notes
Additional
Fund
Information
Financial
Statements
and
Other
Information
For
more
insights
from
T.
Rowe
Price
investment
professionals,
go
to
troweprice.com
.
T.
ROWE
PRICE
PRELX
Emerging
Markets
Local
Currency
Bond
Fund
PAELX
Emerging
Markets
Local
Currency
Bond
Fund–
.
Advisor Class
TEIMX
Emerging
Markets
Local
Currency
Bond
Fund–
.
I Class
TRZFX
Emerging
Markets
Local
Currency
Bond
Fund–
.
Z Class
T.
ROWE
PRICE
Emerging
Markets
Local
Currency
Bond
Fund
For
a
share
outstanding
throughout
each
period
The
accompanying
notes
are
an
integral
part
of
these
financial
statements.
Investor
Class
..
Year
..
..
Ended
.
12/31/24
12/31/23
12/31/22
12/31/21
12/31/20
NET
ASSET
VALUE
Beginning
of
period
$
5
.07
$
4
.68
$
5
.56
$
6
.44
$
6
.48
Investment
activities
Net
investment
income
(1)(2)
0
.30
0
.29
0
.27
0
.27
0
.27
Net
realized
and
unrealized
gain/loss
(
0
.51
)
0
.39
(
0
.88
)
(
0
.87
)
(
0
.03
)
Total
from
investment
activities
(
0
.21
)
0
.68
(
0
.61
)
(
0
.60
)
0
.24
Distributions
Net
investment
income
(
0
.15
)
(
0
.24
)
—
(
0
.18
)
(
0
.03
)
Tax
return
of
capital
(
0
.14
)
(
0
.05
)
(
0
.27
)
(
0
.10
)
(
0
.25
)
Total
distributions
(
0
.29
)
(
0
.29
)
(
0
.27
)
(
0
.28
)
(
0
.28
)
NET
ASSET
VALUE
End
of
period
$
4
.57
$
5
.07
$
4
.68
$
5
.56
$
6
.44
Ratios/Supplemental
Data
Total
return
(2)(3)
(
4
.37
)
%
14
.91
%
(
11
.00
)
%
(
9
.54
)
%
4
.08
%
Ratios
to
average
net
assets:
(2)
Gross
expenses
before
waivers/payments
by
Price
Associates
1
.07
%
1
.01
%
1
.01
%
0
.92
%
0
.94
%
Net
expenses
after
waivers/
payments
by
Price
Associates
1
.02
%
1
.01
%
1
.01
%
0
.92
%
0
.94
%
Net
investment
income
6
.14
%
6
.07
%
5
.48
%
4
.41
%
4
.58
%
Portfolio
turnover
rate
75
.2
%
107
.6
%
104
.4
%
83
.1
%
76
.1
%
Net
assets,
end
of
period
(in
thousands)
$18,751
$27,683
$31,914
$54,575
$416,391
0
%
0
%
0
%
0
%
0
%
(1)
Per
share
amounts
calculated
using
average
shares
outstanding
method.
(2)
Includes
the
impact
of
expense-related
arrangements
with
Price
Associates.
(3)
Total
return
reflects
the
rate
that
an
investor
would
have
earned
on
an
investment
in
the
fund
during
each
period,
assuming
reinvestment
of
all
distributions,
and
payment
of
no
redemption
or
account
fees,
if
applicable.
T.
ROWE
PRICE
Emerging
Markets
Local
Currency
Bond
Fund
For
a
share
outstanding
throughout
each
period
The
accompanying
notes
are
an
integral
part
of
these
financial
statements.
Advisor
Class
..
Year
..
..
Ended
.
12/31/24
12/31/23
12/31/22
12/31/21
12/31/20
NET
ASSET
VALUE
Beginning
of
period
$
5
.04
$
4
.66
$
5
.55
$
6
.43
$
6
.47
Investment
activities
Net
investment
income
(1)(2)
0
.29
0
.29
0
.26
0
.26
0
.27
Net
realized
and
unrealized
gain/loss
(
0
.51
)
0
.39
(
0
.89
)
(
0
.88
)
(
0
.05
)
Total
from
investment
activities
(
0
.22
)
0
.68
(
0
.63
)
(
0
.62
)
0
.22
Distributions
Net
investment
income
(
0
.14
)
(
0
.25
)
—
(
0
.17
)
(
0
.02
)
Tax
return
of
capital
(
0
.14
)
(
0
.05
)
(
0
.26
)
(
0
.09
)
(
0
.24
)
Total
distributions
(
0
.28
)
(
0
.30
)
(
0
.26
)
(
0
.26
)
(
0
.26
)
NET
ASSET
VALUE
End
of
period
$
4
.54
$
5
.04
$
4
.66
$
5
.55
$
6
.43
Ratios/Supplemental
Data
Total
return
(2)(3)
(
4
.46
)
%
15
.03
%
(
11
.31
)
%
(
9
.79
)
%
3
.81
%
Ratios
to
average
net
assets:
(2)
Gross
expenses
before
waivers/payments
by
Price
Associates
20
.50
%
4
.54
%
3
.83
%
2
.89
%
1
.93
%
Net
expenses
after
waivers/payments
by
Price
Associates
1
.10
%
1
.10
%
1
.10
%
1
.18
%
1
.20
%
Net
investment
income
6
.04
%
5
.98
%
5
.28
%
4
.35
%
4
.48
%
Portfolio
turnover
rate
75
.2
%
107
.6
%
104
.4
%
83
.1
%
76
.1
%
Net
assets,
end
of
period
(in
thousands)
$3
$15
$15
$34
$49
0
%
0
%
0
%
0
%
0
%
(1)
Per
share
amounts
calculated
using
average
shares
outstanding
method.
(2)
Includes
the
impact
of
expense-related
arrangements
with
Price
Associates.
(3)
Total
return
reflects
the
rate
that
an
investor
would
have
earned
on
an
investment
in
the
fund
during
each
period,
assuming
reinvestment
of
all
distributions,
and
payment
of
no
redemption
or
account
fees,
if
applicable.
T.
ROWE
PRICE
Emerging
Markets
Local
Currency
Bond
Fund
For
a
share
outstanding
throughout
each
period
The
accompanying
notes
are
an
integral
part
of
these
financial
statements.
I
Class
..
Year
..
..
Ended
.
12/31/24
12/31/23
12/31/22
12/31/21
12/31/20
NET
ASSET
VALUE
Beginning
of
period
$
5
.07
$
4
.68
$
5
.57
$
6
.45
$
6
.48
Investment
activities
Net
investment
income
(1)(2)
0
.31
0
.31
0
.28
0
.28
0
.28
Net
realized
and
unrealized
gain/loss
(
0
.51
)
0
.38
(
0
.89
)
(
0
.87
)
(
0
.02
)
Total
from
investment
activities
(
0
.20
)
0
.69
(
0
.61
)
(
0
.59
)
0
.26
Distributions
Net
investment
income
(
0
.15
)
(
0
.25
)
—
(
0
.19
)
(
0
.03
)
Tax
return
of
capital
(
0
.15
)
(
0
.05
)
(
0
.28
)
(
0
.10
)
(
0
.26
)
Total
distributions
(
0
.30
)
(
0
.30
)
(
0
.28
)
(
0
.29
)
(
0
.29
)
NET
ASSET
VALUE
End
of
period
$
4
.57
$
5
.07
$
4
.68
$
5
.57
$
6
.45
Ratios/Supplemental
Data
Total
return
(2)(3)
(
4
.06
)
%
15
.27
%
(
10
.88
)
%
(
9
.37
)
%
4
.40
%
Ratios
to
average
net
assets:
(2)
Gross
expenses
before
waivers/payments
by
Price
Associates
0
.79
%
0
.77
%
0
.77
%
0
.80
%
0
.82
%
Net
expenses
after
waivers/payments
by
Price
Associates
0
.70
%
0
.70
%
0
.70
%
0
.76
%
0
.79
%
Net
investment
income
6
.47
%
6
.37
%
5
.81
%
4
.68
%
4
.67
%
Portfolio
turnover
rate
75
.2
%
107
.6
%
104
.4
%
83
.1
%
76
.1
%
Net
assets,
end
of
period
(in
thousands)
$93,008
$99,666
$91,372
$119,612
$101,341
0
%
0
%
0
%
0
%
0
%
(1)
Per
share
amounts
calculated
using
average
shares
outstanding
method.
(2)
Includes
the
impact
of
expense-related
arrangements
with
Price
Associates.
(3)
Total
return
reflects
the
rate
that
an
investor
would
have
earned
on
an
investment
in
the
fund
during
each
period,
assuming
reinvestment
of
all
distributions,
and
payment
of
no
redemption
or
account
fees,
if
applicable.
T.
ROWE
PRICE
Emerging
Markets
Local
Currency
Bond
Fund
For
a
share
outstanding
throughout
each
period
The
accompanying
notes
are
an
integral
part
of
these
financial
statements.
Z
Class
(1)
..
Year
..
..
Ended
.
2/22/21
(1)
Through
12/31/21
12/31/24
12/31/23
12/31/22
NET
ASSET
VALUE
Beginning
of
period
$
5
.07
$
4
.68
$
5
.56
$
6
.25
Investment
activities
Net
investment
income
(2)(3)
0
.35
0
.34
0
.32
0
.28
Net
realized
and
unrealized
gain/loss
(
0
.52
)
0
.39
(
0
.88
)
(
0
.68
)
Total
from
investment
activities
(
0
.17
)
0
.73
(
0
.56
)
(
0
.40
)
Distributions
Net
investment
income
(
0
.17
)
(
0
.28
)
—
(
0
.19
)
Tax
return
of
capital
(
0
.16
)
(
0
.06
)
(
0
.32
)
(
0
.10
)
Total
distributions
(
0
.33
)
(
0
.34
)
(
0
.32
)
(
0
.29
)
NET
ASSET
VALUE
End
of
period
$
4
.57
$
5
.07
$
4
.68
$
5
.56
Ratios/Supplemental
Data
Total
return
(3)(4)
(
3
.39
)
%
16
.07
%
(
10
.10
)
%
(
6
.60
)
%
Ratios
to
average
net
assets:
(3)
Gross
expenses
before
waivers/payments
by
Price
Associates
0
.77
%
0
.75
%
0
.75
%
0
.79
%
(5)
Net
expenses
after
waivers/payments
by
Price
Associates
0
.00
%
0
.00
%
0
.00
%
0
.00
%
(5)
Net
investment
income
7
.16
%
7
.08
%
6
.53
%
5
.54
%
(5)
Portfolio
turnover
rate
75
.2
%
107
.6
%
104
.4
%
83
.1
%
Net
assets,
end
of
period
(in
thousands)
$183,694
$198,633
$240,172
$270,153
0
%
0
%
0
%
0
%
(1)
Inception
date
(2)
Per
share
amounts
calculated
using
average
shares
outstanding
method.
(3)
Includes
the
impact
of
expense-related
arrangements
with
Price
Associates.
(4)
Total
return
reflects
the
rate
that
an
investor
would
have
earned
on
an
investment
in
the
fund
during
each
period,
assuming
reinvestment
of
all
distributions,
and
payment
of
no
redemption
or
account
fees,
if
applicable.
Total
return
is
not
annualized
for
periods
less
than
one
year.
(5)
Annualized
T.
ROWE
PRICE
Emerging
Markets
Local
Currency
Bond
Fund
December
31,
2024
Par/Shares
$
Value
(
Cost
and
value
in
$000s)
‡
ANGOLA 0.9%
Government
Bonds 0.9%
Republic
of
Angola,
8.25%,
5/9/28
(USD)
985,000
929
Republic
of
Angola,
9.50%,
11/12/25
(USD)
1,678,000
1,684
Total
Angola
(Cost
$2,610)
2,613
BRAZIL 4.5%
Government
Bonds 4.5%
Brazil
Notas
do
Tesouro
Nacional,
Series
NTNF,
10.00%,
1/1/27
18,975,000
2,786
Brazil
Notas
do
Tesouro
Nacional,
Series
NTNF,
10.00%,
1/1/31
36,527,000
4,713
Brazil
Notas
do
Tesouro
Nacional,
Series
NTNF,
10.00%,
1/1/33
4,502,000
560
Brazil
Notas
do
Tesouro
Nacional,
Series
NTNF,
10.00%,
1/1/35
34,130,000
4,149
Republic
of
Brazil,
3.875%,
6/12/30
(USD)
1,215,000
1,071
Total
Brazil
(Cost
$17,113)
13,279
CHILE 0.8%
Government
Bonds 0.8%
Bonos
de
la
Tesoreria
de
la
Republica
en
pesos,
4.70%,
9/1/30 (1)
1,675,000,000
1,594
Bonos
de
la
Tesoreria
de
la
Republica
en
pesos,
5.00%,
10/1/28 (1)
900,000,000
880
Total
Chile
(Cost
$2,629)
2,474
CHINA 4.9%
Convertible
Bonds 0.2%
NIO,
3.875%,
10/15/29
(USD)
700,000
526
526
Corporate
Bonds 0.0%
Agile
Group
Holdings,
5.75%,
1/2/25
(USD) (2)(3)
540,000
53
Times
China
Holdings,
6.75%,
7/8/25
(USD) (2)(3)
1,000,000
41
94
T.
ROWE
PRICE
Emerging
Markets
Local
Currency
Bond
Fund
Par/Shares
$
Value
(Cost
and
value
in
$000s)
Government
Bonds 4.7%
People's
Republic
of
China,
Series
INBK,
2.11%,
8/25/34
12,750,000
1,812
People's
Republic
of
China,
Series
INBK,
2.47%,
7/25/54
10,000,000
1,514
People's
Republic
of
China,
Series
INBK,
3.01%,
5/13/28
9,600,000
1,391
People's
Republic
of
China,
Series
INBK,
3.13%,
11/21/29
52,050,000
7,719
People's
Republic
of
China,
Series
INBK,
3.81%,
9/14/50
7,350,000
1,379
13,815
Total
China
(Cost
$15,661)
14,435
COLOMBIA 5.8%
Government
Bonds 5.6%
Republic
of
Colombia,
Series
B,
6.00%,
4/28/28
28,473,800,000
5,689
Republic
of
Colombia,
Series
B,
7.00%,
3/26/31
2,497,000,000
466
Republic
of
Colombia,
Series
B,
7.25%,
10/18/34
11,541,700,000
1,952
Republic
of
Colombia,
Series
B,
9.25%,
5/28/42
10,000,000,000
1,757
Republic
of
Colombia,
Series
B,
13.25%,
2/9/33
11,803,300,000
2,898
Republic
of
Colombia,
Series
G,
7.00%,
3/26/31
20,577,900,000
3,836
16,598
Private
Investment
Company 0.2%
Bona
Fide
Investments
Feeder
LLC,
Acquisition
Date:
6/7/23,
Cost $247
(USD) (3)(4)
†
322
Bona
Fide
Investments
Holdings
III,
Acquisition
Date:
6/14/24,
Cost $200
(USD) (3)(4)
†
203
525
Total
Colombia
(Cost
$17,340)
17,123
CZECH
REPUBLIC 4.3%
Government
Bonds 4.3%
Czech
Republic,
Series
49,
4.20%,
12/4/36
44,830,000
1,828
Czech
Republic,
Series
78,
2.50%,
8/25/28
115,510,000
4,552
Czech
Republic,
Series
103,
2.00%,
10/13/33
179,610,000
6,242
Total
Czech
Republic
(Cost
$13,254)
12,622
DOMINICAN
REPUBLIC 0.3%
Government
Bonds 0.3%
Dominican
Republic,
10.75%,
6/1/36 (1)
44,800,000
781
Total
Dominican
Republic
(Cost
$753)
781
T.
ROWE
PRICE
Emerging
Markets
Local
Currency
Bond
Fund
Par/Shares
$
Value
(Cost
and
value
in
$000s)
EGYPT 1.1%
Government
Bonds 1.1%
Arab
Republic
of
Egypt,
8.50%,
1/31/47
(USD)
1,150,000
895
Arab
Republic
of
Egypt,
Series
5YR,
14.369%,
10/20/25
28,100,000
501
Arab
Republic
of
Egypt
Treasury
Bills,
Series
364D,
28.499%,
3/11/25
6,500,000
122
Arab
Republic
of
Egypt
Treasury
Bills,
Series
364D,
28.60%,
3/4/25
11,225,000
211
Arab
Republic
of
Egypt
Treasury
Bills,
Series
364D,
30.827%,
3/18/25
86,200,000
1,607
Total
Egypt
(Cost
$4,400)
3,336
EL
SALVADOR 1.1%
Government
Bonds 1.1%
Republic
of
El
Salvador,
5.875%,
1/30/25
(USD)
2,024,000
2,015
Republic
of
El
Salvador,
8.25%,
4/10/32
(USD)
800,000
813
Republic
of
El
Salvador,
9.65%,
11/21/54
(USD) (1)
410,000
433
Total
El
Salvador
(Cost
$3,217)
3,261
HUNGARY 2.4%
Government
Bonds 2.4%
Republic
of
Hungary,
Series
26/H,
9.50%,
10/21/26
324,000,000
861
Republic
of
Hungary,
Series
28/B,
4.50%,
3/23/28
1,687,090,000
4,021
Republic
of
Hungary,
Series
33/A,
2.25%,
4/20/33
1,038,210,000
1,916
Republic
of
Hungary,
Series
38/A,
3.00%,
10/27/38
217,910,000
362
Total
Hungary
(Cost
$7,867)
7,160
INDIA 4.0%
Corporate
Bonds 0.5%
HDFC
Bank,
8.10%,
3/22/25
130,000,000
1,519
1,519
Government
Bonds 3.5%
Republic
of
India,
6.54%,
1/17/32
113,970,000
1,316
Republic
of
India,
6.67%,
12/17/50
141,000,000
1,593
Republic
of
India,
7.26%,
8/22/32
61,500,000
739
Republic
of
India,
7.26%,
2/6/33
484,000,000
5,824
T.
ROWE
PRICE
Emerging
Markets
Local
Currency
Bond
Fund
Par/Shares
$
Value
(Cost
and
value
in
$000s)
Republic
of
India,
7.36%,
9/12/52
76,570,000
932
10,404
Total
India
(Cost
$12,531)
11,923
INDONESIA 12.1%
Corporate
Bonds 1.0%
Standard
Chartered
Bank,
Series
emtN
,
CLN
(Reference:
Republic
of
Indonesia),
9.00%,
3/20/29 (1)
46,100,000,000
3,068
3,068
Government
Bonds 11.1%
Republic
of
Indonesia,
Series
FR65,
6.625%,
5/15/33
55,446,000,000
3,357
Republic
of
Indonesia,
Series
FR72,
8.25%,
5/15/36
52,375,000,000
3,544
Republic
of
Indonesia,
Series
FR73,
8.75%,
5/15/31
115,957,000,000
7,829
Republic
of
Indonesia,
Series
FR82,
7.00%,
9/15/30
49,268,000,000
3,058
Republic
of
Indonesia,
Series
FR83,
7.50%,
4/15/40
69,458,000,000
4,474
Republic
of
Indonesia,
Series
FR86,
5.50%,
4/15/26
24,400,000,000
1,487
Republic
of
Indonesia,
Series
FR90,
5.125%,
4/15/27
90,570,000,000
5,406
Republic
of
Indonesia,
Series
100,
6.625%,
2/15/34
59,295,000,000
3,591
32,746
Total
Indonesia
(Cost
$38,574)
35,814
IVORY
COAST 0.3%
Government
Bonds 0.3%
Republic
of
Ivory
Coast,
7.625%,
1/30/33
(USD) (1)
790,000
772
Total
Ivory
Coast
(Cost
$779)
772
JORDAN 0.5%
Government
Bonds 0.5%
Kingdom
of
Jordan,
4.95%,
7/7/25
(USD)
1,605,000
1,582
Total
Jordan
(Cost
$1,586)
1,582
MALAYSIA 5.7%
Government
Bonds 5.7%
Government
of
Malaysia,
Series
0120,
4.065%,
6/15/50
10,675,000
2,353
Government
of
Malaysia,
Series
0318,
4.642%,
11/7/33
12,179,000
2,888
Government
of
Malaysia,
Series
0322,
4.504%,
4/30/29
4,700,000
1,088
Government
of
Malaysia,
Series
0411,
4.232%,
6/30/31
2,200,000
505
T.
ROWE
PRICE
Emerging
Markets
Local
Currency
Bond
Fund
Par/Shares
$
Value
(Cost
and
value
in
$000s)
Government
of
Malaysia,
Series
0519,
3.757%,
5/22/40
31,375,000
6,823
Government
of
Malaysia,
Series
0713,
4.935%,
9/30/43
12,890,000
3,198
Total
Malaysia
(Cost
$16,844)
16,855
MEXICO 5.4%
Government
Bonds 5.4%
Petroleos
Mexicanos
,
Series
14-2,
7.47%,
11/12/26
12,010,000
526
United
Mexican
States,
Series
M,
7.50%,
5/26/33
39,150,000
1,588
United
Mexican
States,
Series
M,
7.75%,
5/29/31
80,000,000
3,425
United
Mexican
States,
Series
M,
7.75%,
11/23/34
2,955,000
119
United
Mexican
States,
Series
M,
8.00%,
7/31/53
8,627,000
314
United
Mexican
States,
Series
M,
8.50%,
5/31/29
37,830,000
1,719
United
Mexican
States,
Series
M,
8.50%,
11/18/38
200,860,000
8,219
Total
Mexico
(Cost
$18,544)
15,910
MONTENEGRO 0.4%
Government
Bonds 0.4%
Republic
of
Montenegro,
7.25%,
3/12/31
(USD) (1)
1,110,000
1,140
Total
Montenegro
(Cost
$1,117)
1,140
NETHERLANDS 0.1%
Government
Bonds 0.1%
Nederlandse
Financierings-Maatschappij
voor
Ontwikkelingslanden
,
35.00%,
7/22/25
(TRY)
11,000,000
301
Total
Netherlands
(Cost
$329)
301
NIGERIA 0.7%
Government
Bonds 0.7%
Federal
Republic
of
Nigeria
OMO
Bill,
Series
361D,
29.604%,
5/20/25
1,138,000,000
673
Federal
Republic
of
Nigeria
Treasury
Bill,
Series
364D,
22.631%,
3/6/25
2,421,000,000
1,505
Total
Nigeria
(Cost
$2,248)
2,178
PERU 3.4%
Government
Bonds 3.4%
Republic
of
Peru,
6.15%,
8/12/32
15,177,000
4,008
Republic
of
Peru,
6.35%,
8/12/28
1,386,000
388
T.
ROWE
PRICE
Emerging
Markets
Local
Currency
Bond
Fund
Par/Shares
$
Value
(Cost
and
value
in
$000s)
Republic
of
Peru,
6.90%,
8/12/37
11,614,000
3,070
Republic
of
Peru,
8.20%,
8/12/26
8,710,000
2,450
Total
Peru
(Cost
$9,523)
9,916
POLAND 4.7%
Government
Bonds 4.7%
Republic
of
Poland,
Series
CPI,
Inflation-Indexed,
2.00%,
8/25/36
7,003,427
1,501
Republic
of
Poland,
Series
0429,
5.75%,
4/25/29
8,730,000
2,133
Republic
of
Poland,
Series
1029,
2.75%,
10/25/29
6,100,000
1,312
Republic
of
Poland,
Series
1033,
6.00%,
10/25/33
36,091,000
8,853
Total
Poland
(Cost
$14,471)
13,799
ROMANIA 2.7%
Corporate
Bonds 0.6%
Banca
Transilvania
,
VR,
8.875%,
4/27/27
(EUR) (5)
1,520,000
1,668
1,668
Government
Bonds 2.1%
Republic
of
Romania,
Series
10Y,
5.00%,
2/12/29
15,085,000
2,919
Republic
of
Romania,
Series
10Y,
6.70%,
2/25/32
7,250,000
1,459
Republic
of
Romania,
Series
5Y,
4.25%,
4/28/36
11,605,000
1,845
6,223
Total
Romania
(Cost
$8,283)
7,891
SERBIA 0.3%
Government
Bonds 0.3%
Republic
of
Serbia,
1.50%,
6/26/29
(EUR)
1,050,000
981
Total
Serbia
(Cost
$977)
981
SLOVENIA 0.3%
Corporate
Bonds 0.3%
Nova
Ljubljanska
Banka,
VR,
6.875%,
1/24/34 (5)
900,000
1,002
Total
Slovenia
(Cost
$1,015)
1,002
T.
ROWE
PRICE
Emerging
Markets
Local
Currency
Bond
Fund
Par/Shares
$
Value
(Cost
and
value
in
$000s)
SOUTH
AFRICA 8.0%
Government
Bonds 8.0%
Republic
of
South
Africa,
Series
R213,
7.00%,
2/28/31
60,239,000
2,837
Republic
of
South
Africa,
Series
2032,
8.25%,
3/31/32
91,583,000
4,494
Republic
of
South
Africa,
Series
2035,
8.875%,
2/28/35
233,328,000
11,264
Republic
of
South
Africa,
Series
2044,
8.75%,
1/31/44
115,554,000
4,969
Total
South
Africa
(Cost
$23,054)
23,564
SRI
LANKA 0.3%
Government
Bonds 0.3%
Republic
of
Sri
Lanka,
4.00%,
4/15/28
(USD) (1)
214,784
202
Republic
of
Sri
Lanka,
STEP,
1.00%,
6/15/38
(USD) (1)
592,200
386
Republic
of
Sri
Lanka,
STEP,
3.10%,
1/15/30
(USD) (1)
70,441
58
Republic
of
Sri
Lanka,
STEP,
3.35%,
3/15/33
(USD) (1)
138,169
105
Republic
of
Sri
Lanka,
STEP,
3.60%,
6/15/35
(USD) (1)
93,296
68
Republic
of
Sri
Lanka,
STEP,
3.60%,
5/15/36
(USD) (1)
64,750
49
Republic
of
Sri
Lanka,
STEP,
3.60%,
2/15/38
(USD) (1)
129,554
99
Total
Sri
Lanka
(Cost
$949)
967
SUPRANATIONAL 1.6%
Government
Bonds 1.6%
European
Bank
for
Reconstruction
&
Development,
Series
GMTN,
5.60%,
1/30/25
(IDR)
17,230,000,000
1,069
International
Bank
for
Reconstruction
&
Development,
Series
GDIF,
4.60%,
2/9/26
(IDR)
22,000,000,000
1,334
International
Bank
for
Reconstruction
&
Development,
Series
GMTN,
4.90%,
2/12/26
(INR)
90,700,000
1,033
International
Finance,
3.59%,
2/26/26
(COP)
5,750,000,000
1,224
Total
Supranational
(Cost
$5,235)
4,660
TANZANIA 0.3%
Convertible
Bonds 0.3%
HTA
Group,
2.875%,
3/18/27
(USD)
800,000
731
Total
Tanzania
(Cost
$698)
731
T.
ROWE
PRICE
Emerging
Markets
Local
Currency
Bond
Fund
Par/Shares
$
Value
(Cost
and
value
in
$000s)
THAILAND 7.3%
Government
Bonds 7.3%
Kingdom
of
Thailand,
1.585%,
12/17/35
208,817,000
5,701
Kingdom
of
Thailand,
2.00%,
12/17/31
52,920,000
1,534
Kingdom
of
Thailand,
2.00%,
6/17/42
56,850,000
1,528
Kingdom
of
Thailand,
2.40%,
3/17/29
45,000,000
1,337
Kingdom
of
Thailand,
2.80%,
6/17/34
44,285,000
1,356
Kingdom
of
Thailand,
3.40%,
6/17/36
28,213,000
916
Kingdom
of
Thailand,
3.65%,
6/20/31
53,867,000
1,722
Kingdom
of
Thailand,
3.775%,
6/25/32
152,005,000
4,931
Kingdom
of
Thailand,
Series
ILB,
Inflation-Indexed,
1.25%,
3/12/28
93,259,853
2,664
Total
Thailand
(Cost
$21,084)
21,689
TÜRKIYE 2.3%
Corporate
Bonds 0.2%
Coca-Cola
Icecek
,
50.50%,
4/28/25
26,150,000
721
721
Government
Bonds 2.1%
Republic
of
Türkiye
,
Series
10Y,
17.80%,
7/13/33
54,753,000
1,072
Republic
of
Türkiye
,
Series
10Y,
26.20%,
10/5/33
90,210,000
2,450
Republic
of
Türkiye
,
Series
5Y,
30.00%,
9/12/29
31,000,000
860
Republic
of
Türkiye
,
Series
5Y,
31.08%,
11/8/28
63,430,000
1,775
6,157
Total
Türkiye
(Cost
$7,786)
6,878
UNITED
STATES 0.4%
Convertible
Bonds 0.3%
Citigroup
Global
Markets
Holdings,
Series
1299,
Zero
Coupon,
2/26/26
(HKD)
3,000,000
370
Goldman
Sachs
Finance
Corp.
International,
Series
700,
Zero
Coupon,
3/15/27
500,000
602
972
T.
ROWE
PRICE
Emerging
Markets
Local
Currency
Bond
Fund
Par/Shares
$
Value
(Cost
and
value
in
$000s)
Corporate
Bonds 0.1%
Goldman
Sachs
Group,
45.00%,
2/10/25
(TRY)
10,600,000
295
295
Total
United
States
(Cost
$1,365)
1,267
URUGUAY 1.0%
Government
Bonds 1.0%
Republic
of
Uruguay,
8.25%,
5/21/31
39,445,000
841
Republic
of
Uruguay,
9.75%,
7/20/33
86,380,000
1,978
Total
Uruguay
(Cost
$3,231)
2,819
UZBEKISTAN 0.4%
Government
Bonds 0.4%
National
Bank
of
Uzbekistan,
8.50%,
7/5/29
(USD)
1,090,000
1,114
Total
Uzbekistan
(Cost
$1,088)
1,114
ZAMBIA 0.2%
Government
Bonds 0.2%
Republic
of
Zambia,
13.00%,
9/20/31
23,000,000
596
Total
Zambia
(Cost
$595)
596
SHORT-TERM
INVESTMENTS 9.0%
Money
Market
Funds 3.3%
T.
Rowe
Price
Government
Reserve
Fund,
4.53% (6)(7)
9,804,890
9,805
9,805
U.S.
Treasury
Obligations 5.7%
U.S.
Treasury
Bills,
4.13%,
5/15/25 (8)
10,670,000
10,506
U.S.
Treasury
Bills,
4.491%,
2/27/25 (8)
6,300,000
6,259
16,765
Total
Short-Term
Investments
(Cost
$26,570)
26,570
T.
ROWE
PRICE
Emerging
Markets
Local
Currency
Bond
Fund
(Amounts
in
000s,
except
for
contracts)
OPTIONS
PURCHASED 0.1%
Exchange-Traded
Options
Purchased
0.0%
Description
Contracts
Notional
Amount
$
Value
U.S.
Treasury
10-Year
Notes
Futures,
Call,
1/24/25
@
$110.50 (3)
54
5,873
9
U.S.
Treasury
10-Year
Notes
Futures,
Put,
1/24/25
@
$109.50 (3)
42
4,568
48
Total
Exchange-Traded
Options
Purchased
(Cost
$31)
57
OTC
Options
Purchased
0.1%
Counterparty
Description
Contracts
Notional
Amount
$
Value
Bank
of
America
USD
/
SGD,
Call,
2/6/25
@
SGD1.36 (3)
1
3,062
21
HSBC
Bank
USD
/
CNH,
Call,
5/8/25
@
CNH7.30 (3)
1
2,290
37
HSBC
Bank
USD
/
EUR,
Call,
1/31/25
@
USD1.03 (3)
1
4,586
31
HSBC
Bank
USD
/
PLN,
Call,
2/27/25
@
PLN4.26 (3)
1
1,528
11
HSBC
Bank
USD
/
SGD,
Call,
2/6/25
@
SGD1.36 (3)
1
3,007
21
Morgan
Stanley
USD
/
CNH,
Call,
2/6/25
@
CNH7.25 (3)
1
3,104
47
Morgan
Stanley
USD
/
CNH,
Call,
5/8/25
@
CNH7.30 (3)
1
4,627
74
Morgan
Stanley
USD
/
SGD,
Call,
2/6/25
@
SGD1.36 (3)
1
3,062
22
UBS
Investment
Bank
USD
/
CNH,
Call,
3/20/25
@
CNH7.35 (3)
1
4,510
46
T.
ROWE
PRICE
Emerging
Markets
Local
Currency
Bond
Fund
(Amounts
in
000s,
except
for
contracts)
Counterparty
Description
Contracts
Notional
Amount
$
Value
Wells
Fargo
USD
/
EUR,
Call,
1/31/25
@
USD1.03 (3)
1
4,586
31
Total
OTC
Options
Purchased
(Cost
$244)
341
Total
Options
Purchased
(Cost
$275)
398
Total
Investments
in
Securities
97.6%
of
Net
Assets
(Cost
$303,595)
$
288,401
‡
Country
classifications
are
generally
based
on
MSCI
categories
or
another
unaffiliated
third
party
data
provider;
Par/Shares
and
Notional
Amount
are
denominated
in
the
currency
of
the
country
presented
unless
otherwise
noted.
†
Investment
fund
is
not
unitized.
(1)
Security
was
purchased
pursuant
to
Rule
144A
under
the
Securities
Act
of
1933
and
may
be
resold
in
transactions
exempt
from
registration
only
to
qualified
institutional
buyers.
Total
value
of
such
securities
at
period-end
amounts
to
$9,635
and
represents
3.3%
of
net
assets.
(2)
Security
is
in
default
or
has
failed
to
make
a
scheduled
interest
and/or
principal
payment.
(3)
Non-income
producing
(4)
Security
cannot
be
offered
for
public
resale
without
first
being
registered
under
the
Securities
Act
of
1933
and
related
rules
("restricted
security").
Acquisition
date
represents
the
day
on
which
an
enforceable
right
to
acquire
such
security
is
obtained
and
is
presented
along
with
related
cost
in
the
security
description.
The
fund
may
have
registration
rights
for
certain
restricted
securities.
Any
costs
related
to
such
registration
are
generally
borne
by
the
issuer.
The
aggregate
value
of
restricted
securities
(excluding
144A
holdings)
at
period
end
amounts
to
$525
and
represents
0.2%
of
net
assets.
(5)
Security
is
a
fix-to-float
security,
which
carries
a
fixed
coupon
until
a
certain
date,
upon
which
it
switches
to
a
floating
rate.
Reference
rate
and
spread
are
provided
if
the
rate
is
currently
floating.
(6)
Seven-day
yield
(7)
Affiliated
Companies
(8)
At
December
31,
2024,
all
or
a
portion
of
this
security
is
pledged
as
collateral
and/or
margin
deposit
to
cover
future
funding
obligations.
1
Day
INR
MIBOR
One
day
INR
MIBOR
(Mumbai
interbank
offered
rate)
3M
ZAR
JIBOR
Three
month
ZAR
JIBOR
(Johannesburg
Interbank
average
rate)
6M
EURIBOR
Six
month
EURIBOR
(Euro
interbank
offered
rate)
6M
PLN
WIBOR
Six
month
PLN
WIBOR
(Warsaw
interbank
offered
rate)
T.
ROWE
PRICE
Emerging
Markets
Local
Currency
Bond
Fund
.
.
.
.
.
.
.
.
.
.
BRL
Brazilian
Real
BRL
CDI
One
day
Brazilian
interbank
deposit
rate
CHF
Swiss
Franc
CLN
Credit-Linked
Note
CLP
Chilean
Peso
CNH
Offshore
China
Renminbi
COP
Colombian
Peso
CPI
Consumer
Price
Index
CZK
Czech
Koruna
EGP
Egyptian
Pound
EUR
Euro
HKD
Hong
Kong
Dollar
HUF
Hungarian
Forint
IDR
Indonesian
Rupiah
INR
Indian
Rupee
JPY
Japanese
Yen
KZT
Kazakhstan
Tenge
MXIBTIIE
Mexican
Interbank
28
day
interest
rate
MXN
Mexican
Peso
MYR
Malaysian
Ringgit
OTC
Over-the-counter
PEN
Peruvian
New
Sol
PHP
Philippines
Peso
PLN
Polish
Zloty
RON
New
Romanian
Leu
RSD
Serbian
Dinar
SGD
Singapore
Dollar
STEP
Stepped
coupon
bond
for
which
the
coupon
rate
of
interest
adjusts
on
specified
date(s);
rate
shown
is
effective
rate
at
period-end.
THB
Thai
Baht
TRY
Turkish
Lira
TWD
Taiwan
Dollar
USD
U.S.
Dollar
UYU
Uruguayan
Peso
VR
Variable
Rate;
rate
shown
is
effective
rate
at
period-end.
The
rates
for
certain
variable
rate
securities
are
not
based
on
a
published
reference
rate
and
spread
but
are
determined
by
the
issuer
or
agent
and
based
on
current
market
conditions.
ZAR
South
African
Rand
T.
ROWE
PRICE
Emerging
Markets
Local
Currency
Bond
Fund
(Amounts
in
000s)
SWAPS
(0.5)%
Description
Notional
Amount
$
Value
Upfront
Payments/
$
(Receipts)
Unrealized
$
Gain/(Loss)
BILATERAL
SWAPS
(0.2)%
Interest
Rate
Swaps
(0.2)%
Brazil
(0.2)%
Goldman
Sachs,
2
Year
Interest
Rate
Swap,
Receive
Fixed
12.290%
at
Maturity,
Pay
Variable
12.15%,
(BRL
CDI)
at
Maturity,
1/4/27
14,000
(103)
—
(103)
Morgan
Stanley,
3
Year
Interest
Rate
Swap,
Receive
Fixed
10.820%
at
Maturity,
Pay
Variable
12.15%,
(BRL
CDI)
at
Maturity,
1/4/27
20,500
(227)
—
(227)
Morgan
Stanley,
3
Year
Interest
Rate
Swap,
Receive
Fixed
9.795%
at
Maturity,
Pay
Variable
12.15%,
(BRL
CDI)
at
Maturity,
1/4/27
15,395
(224)
—
(224)
Morgan
Stanley,
3
Year
Interest
Rate
Swap,
Receive
Fixed
9.870%
at
Maturity,
Pay
Variable
12.15%,
(BRL
CDI)
at
Maturity,
1/4/27
11,000
(157)
—
(157)
Total
Brazil
—
(711)
China
0.0%
Citibank,
7
Year
Interest
Rate
Swap,
Receive
Fixed
2.650%
Quarterly,
Pay
Variable
2.30%,
(7
Day
Interbank
Repo)
Quarterly,
5/15/30
5,573
49
—
49
Total
China
—
49
Total
Bilateral
Interest
Rate
Swaps
—
(662)
Total
Bilateral
Swaps
—
(662)
Description
Notional
Amount
$
Value
Initial
$
Value
**
Unrealized
$
Gain/(Loss)
CENTRALLY
CLEARED
SWAPS
(0.3)%
Credit
Default
Swaps,
Protection
Bought
(0.3)%
Foreign/Europe
(0.4)%
Protection
Bought
(Relevant
Credit:
Markit
iTraxx
Crossover-S42,
5
Year
Index),
Pay
5.00%
Quarterly,
Receive
upon
credit
default,
12/20/29
14,570
(1,209)
(1,293)
84
Total
Foreign/Europe
84
T.
ROWE
PRICE
Emerging
Markets
Local
Currency
Bond
Fund
(Amounts
in
000s)
Description
Notional
Amount
$
Value
Initial
$
Value**
Unrealized
$
Gain/(Loss)
Qatar
(0.0)%
Protection
Bought
(Relevant
Credit:
State
of
Qatar),
Pay
1.00%
Quarterly,
Receive
upon
credit
default,
12/20/28
(USD)
1,870
(45)
(31)
(14)
Total
Qatar
(14)
United
States
0.1%
Protection
Bought
(Relevant
Credit:
Markit
CDX.EM-S41,
5
Year
Index),
Pay
1.00%
Quarterly,
Receive
upon
credit
default,
6/20/29
5,855
138
158
(20)
Total
United
States
(20)
Total
Centrally
Cleared
Credit
Default
Swaps,
Protection
Bought
50
Interest
Rate
Swaps
0.0%
China
0.1%
5
Year
Interest
Rate
Swap,
Receive
Fixed
1.435%
Quarterly,
Pay
Variable
1.730%
(7
Day
Interbank
Repo)
Quarterly,
12/19/29
7,400
2
—
2
5
Year
Interest
Rate
Swap,
Receive
Fixed
1.795%
Quarterly,
Pay
Variable
1.730%
(7
Day
Interbank
Repo)
Quarterly,
8/1/29
7,000
17
—
17
5
Year
Interest
Rate
Swap,
Receive
Fixed
1.797%
Quarterly,
Pay
Variable
2.200%
(7
Day
Interbank
Repo)
Quarterly,
9/3/29
8,183
20
—
20
5
Year
Interest
Rate
Swap,
Receive
Fixed
1.922%
Quarterly,
Pay
Variable
2.240%
(7
Day
Interbank
Repo)
Quarterly,
6/28/29
21,000
66
—
66
5
Year
Interest
Rate
Swap,
Receive
Fixed
2.710%
Quarterly,
Pay
Variable
2.200%
(7
Day
Interbank
Repo)
Quarterly,
12/27/27
27,200
145
—
145
5
Year
Interest
Rate
Swap,
Receive
Fixed
2.765%
Quarterly,
Pay
Variable
2.240%
(7
Day
Interbank
Repo)
Quarterly,
12/16/27
5,200
29
—
29
Total
China
279
T.
ROWE
PRICE
Emerging
Markets
Local
Currency
Bond
Fund
(Amounts
in
000s)
Description
Notional
Amount
$
Value
Initial
$
Value**
Unrealized
$
Gain/(Loss)
Foreign/Europe
0.0%
5
Year
Interest
Rate
Swap,
Pay
Fixed
2.230%
Annually,
Receive
Variable
2.597%
(6M
EURIBOR)
Semi-Annually,
12/27/29
3,413
3
—
3
Total
Foreign/Europe
3
India
0.0%
5
Year
Interest
Rate
Swap,
Receive
Fixed
6.022%
Semi-Annually,
Pay
Variable
7.150%
(1
Day
INR
MIBOR)
Semi-Annually,
10/3/29
161,000
(15)
—
(15)
5
Year
Interest
Rate
Swap,
Receive
Fixed
6.067%
Semi-Annually,
Pay
Variable
7.150%
(1
Day
INR
MIBOR)
Semi-Annually,
9/3/29
254,000
(17)
—
(17)
5
Year
Interest
Rate
Swap,
Receive
Fixed
6.229%
Semi-Annually,
Pay
Variable
7.150%
(1
Day
INR
MIBOR)
Semi-Annually,
8/1/29
185,000
2
—
2
5
Year
Interest
Rate
Swap,
Receive
Fixed
6.252%
Semi-Annually,
Pay
Variable
7.150%
(1
Day
INR
MIBOR)
Semi-Annually,
12/15/28
130,615
2
—
2
5
Year
Interest
Rate
Swap,
Receive
Fixed
6.293%
Semi-Annually,
Pay
Variable
7.150%
(1
Day
INR
MIBOR)
Semi-Annually,
11/5/29
166,000
6
—
6
5
Year
Interest
Rate
Swap,
Receive
Fixed
6.374%
Semi-Annually,
Pay
Variable
7.150%
(1
Day
INR
MIBOR)
Semi-Annually,
5/17/29
187,075
13
—
13
7
Year
Interest
Rate
Swap,
Receive
Fixed
6.350%
Semi-Annually,
Pay
Variable
7.150%
(1
Day
INR
MIBOR)
Semi-Annually,
6/20/31
114,500
9
—
9
7
Year
Interest
Rate
Swap,
Receive
Fixed
6.576%
Semi-Annually,
Pay
Variable
7.150%
(1
Day
INR
MIBOR)
Semi-Annually,
4/21/31
110,728
24
—
24
10
Year
Interest
Rate
Swap,
Receive
Fixed
6.331%
Semi-Annually,
Pay
Variable
7.150%
(1
Day
INR
MIBOR)
Semi-Annually,
11/6/34
95,500
8
—
8
Total
India
32
T.
ROWE
PRICE
Emerging
Markets
Local
Currency
Bond
Fund
(Amounts
in
000s)
Description
Notional
Amount
$
Value
Initial
$
Value**
Unrealized
$
Gain/(Loss)
Mexico
(0.1)%
3
Year
Interest
Rate
Swap,
Receive
Fixed
8.965%
28
Days,
Pay
Variable
10.300%
(MXIBTIIE)
28
Days,
11/18/27
70,549
(14)
—
(14)
5
Year
Interest
Rate
Swap,
Receive
Fixed
8.850%
28
Days,
Pay
Variable
10.300%
(MXIBTIIE)
28
Days,
11/15/29
106,812
(70)
—
(70)
8
Year
Interest
Rate
Swap,
Receive
Fixed
8.926%
28
Days,
Pay
Variable
10.300%
(MXIBTIIE)
28
Days,
11/11/32
43,471
(44)
—
(44)
Total
Mexico
(128)
Poland
0.0%
4
Year
Interest
Rate
Swap,
Receive
Fixed
5.080%
Annually,
Pay
Variable
5.840%
(6M
PLN
WIBOR)
Semi-
Annually,
5/9/28
11,915
76
—
76
5
Year
Interest
Rate
Swap,
Receive
Fixed
4.357%
Annually,
Pay
Variable
5.850%
(6M
PLN
WIBOR)
Semi-
Annually,
9/25/29
5,900
(43)
—
(43)
Total
Poland
33
South
Africa
0.0%
5
Year
Interest
Rate
Swap,
Receive
Fixed
8.124%
Quarterly,
Pay
Variable
7.783%
(3M
ZAR
JIBOR)
Quarterly,
6/25/29
57,342
54
—
54
Total
South
Africa
54
Total
Centrally
Cleared
Interest
Rate
Swaps
273
Zero-Coupon
Inflation
Swaps
(0.0)%
United
States
(0.0)%
10
Year
Zero-Coupon
Inflation
Swap
Pay
Fixed
2.423%
at
Maturity,
Receive
Variable
(Change
in
CPI)
at
Maturity,
10/4/34
2,165
7
—
7
T.
ROWE
PRICE
Emerging
Markets
Local
Currency
Bond
Fund
(Amounts
in
000s)
Description
Notional
Amount
$
Value
Initial
$
Value**
Unrealized
$
Gain/(Loss)
10
Year
Zero-Coupon
Inflation
Swap
Pay
Fixed
2.590%
at
Maturity,
Receive
Variable
(Change
in
CPI)
at
Maturity,
11/8/34
943
(9)
—
(9)
Total
United
States
(2)
Total
Centrally
Cleared
Zero-Coupon
Inflation
Swaps
(2)
Total
Centrally
Cleared
Swaps
321
Net
payments
(receipts)
of
variation
margin
to
date
(274)
Variation
margin
receivable
(payable)
on
centrally
cleared
swaps
$
47
**
Includes
interest
purchased
or
sold
but
not
yet
collected
of
less
than
$(1).
T.
ROWE
PRICE
Emerging
Markets
Local
Currency
Bond
Fund
(Amounts
in
000s)
FORWARD
CURRENCY
EXCHANGE
CONTRACTS
Counterparty
Settlement
Receive
Deliver
Unrealized
Gain/(Loss)
Bank
of
America
1/16/25
EGP
33,566
USD
659
$
(4)
Bank
of
America
1/16/25
TRY
107,491
USD
2,849
141
Bank
of
America
1/16/25
USD
848
TRY
32,314
(51)
Bank
of
America
1/17/25
HUF
869,535
USD
2,339
(152)
Bank
of
America
1/17/25
RON
27,767
USD
6,082
(307)
Bank
of
America
1/17/25
USD
1,582
KZT
788,529
85
Bank
of
America
1/17/25
USD
3,040
RON
14,033
121
Bank
of
America
1/24/25
CZK
42,114
USD
1,805
(73)
Bank
of
America
2/14/25
PLN
10,245
USD
2,544
(68)
Bank
of
America
2/14/25
USD
2,359
PLN
9,608
36
Bank
of
America
2/14/25
USD
1,290
PLN
5,391
(13)
Bank
of
America
3/7/25
MYR
29,276
USD
6,598
(57)
Bank
of
America
3/7/25
THB
55,636
USD
1,641
(2)
Bank
of
America
3/7/25
USD
1,662
MYR
7,406
8
Barclays
Bank
1/16/25
TRY
31,377
USD
824
49
Barclays
Bank
1/17/25
ZAR
58,005
USD
3,257
(188)
Barclays
Bank
1/24/25
USD
900
JPY
133,241
50
BNP
Paribas
1/17/25
HUF
684,881
USD
1,746
(23)
BNP
Paribas
1/17/25
INR
299,400
USD
3,570
(79)
BNP
Paribas
1/17/25
USD
930
IDR
14,492,461
34
BNP
Paribas
1/17/25
USD
1,606
PEN
6,008
9
BNP
Paribas
1/17/25
USD
1,765
PEN
6,681
(12)
BNP
Paribas
1/17/25
USD
1,576
RON
7,419
33
BNP
Paribas
1/17/25
ZAR
43,364
USD
2,440
(146)
BNP
Paribas
2/14/25
PLN
8,266
USD
2,043
(45)
BNP
Paribas
2/21/25
USD
1,515
EUR
1,442
18
BNP
Paribas
3/6/25
BRL
3,357
USD
559
(22)
BNP
Paribas
3/7/25
COP
5,858,423
USD
1,332
(15)
BNP
Paribas
3/7/25
PHP
88,829
USD
1,534
(14)
BNP
Paribas
3/7/25
USD
2,022
COP
9,053,130
(14)
BNP
Paribas
3/7/25
USD
2,603
THB
89,920
(46)
BNP
Paribas
3/14/25
CNH
14,197
USD
1,963
(25)
BNP
Paribas
3/14/25
USD
731
CNH
5,280
10
BNY
Mellon
1/17/25
INR
441,180
USD
5,184
(41)
BNY
Mellon
1/17/25
USD
1,713
IDR
27,693,638
1
BNY
Mellon
1/17/25
USD
647
INR
54,907
6
Canadian
Imperial
Bank
of
Commerce
3/14/25
CNH
4,535
USD
653
(34)
Citibank
1/16/25
USD
806
EGP
41,322
(2)
Citibank
1/16/25
USD
964
TRY
35,385
(20)
Citibank
1/17/25
RON
24,446
USD
5,154
(70)
T.
ROWE
PRICE
Emerging
Markets
Local
Currency
Bond
Fund
(Amounts
in
000s)
FORWARD
CURRENCY
EXCHANGE
CONTRACTS
(CONTINUED)
Counterparty
Settlement
Receive
Deliver
Unrealized
Gain/(Loss)
Citibank
1/17/25
USD
1,616
HUF
633,992
$
22
Citibank
1/17/25
USD
1,970
IDR
30,503,601
84
Citibank
1/21/25
RSD
10,011
USD
94
(5)
Citibank
1/24/25
MXN
13,424
USD
655
(14)
Citibank
1/24/25
USD
1,553
CHF
1,381
27
Citibank
1/24/25
USD
927
MXN
18,992
20
Citibank
2/14/25
PLN
38,227
USD
9,287
(46)
Citibank
3/6/25
USD
360
BRL
2,235
2
Citibank
3/7/25
USD
6,861
COP
30,455,704
10
Deutsche
Bank
1/17/25
INR
98,693
USD
1,165
(14)
Deutsche
Bank
1/17/25
USD
1,583
INR
133,577
25
Deutsche
Bank
1/17/25
ZAR
15,869
USD
847
(7)
Deutsche
Bank
2/7/25
CLP
4,090,035
USD
4,316
(205)
Deutsche
Bank
2/21/25
EUR
1,929
USD
2,029
(27)
Deutsche
Bank
2/21/25
USD
8,235
EUR
7,775
163
Deutsche
Bank
3/6/25
USD
969
BRL
5,935
20
Deutsche
Bank
3/14/25
CNH
2,154
USD
296
(2)
Goldman
Sachs
1/17/25
INR
138,801
USD
1,647
(29)
Goldman
Sachs
1/17/25
PEN
2,504
USD
670
(4)
Goldman
Sachs
1/17/25
USD
1,683
IDR
25,621,349
99
Goldman
Sachs
1/17/25
USD
4,722
TWD
150,644
136
Goldman
Sachs
1/24/25
MXN
3,764
USD
181
(1)
Goldman
Sachs
3/6/25
BRL
90,067
USD
15,205
(800)
Goldman
Sachs
3/6/25
USD
1,405
BRL
8,426
58
Goldman
Sachs
3/7/25
THB
19,907
USD
578
9
HSBC
Bank
1/16/25
USD
991
TRY
36,458
(23)
HSBC
Bank
1/17/25
USD
825
IDR
12,656,782
43
HSBC
Bank
1/24/25
JPY
465,604
USD
3,074
(106)
HSBC
Bank
1/24/25
MXN
214,269
USD
10,819
(587)
HSBC
Bank
1/24/25
USD
2,174
CZK
51,287
65
HSBC
Bank
2/7/25
USD
1,558
CLP
1,513,323
37
HSBC
Bank
2/21/25
EUR
1,215
USD
1,291
(29)
HSBC
Bank
2/21/25
USD
1,514
EUR
1,447
12
HSBC
Bank
3/7/25
MYR
36,421
USD
8,197
(60)
HSBC
Bank
3/14/25
CNH
17,560
USD
2,424
(26)
JPMorgan
Chase
1/16/25
TRY
34,318
USD
889
66
JPMorgan
Chase
1/16/25
USD
1,884
TRY
70,950
(90)
JPMorgan
Chase
1/17/25
HUF
200,715
USD
544
(39)
JPMorgan
Chase
1/17/25
INR
125,595
USD
1,473
(9)
JPMorgan
Chase
1/17/25
USD
754
HUF
293,709
15
JPMorgan
Chase
1/17/25
USD
1,273
IDR
20,294,329
19
T.
ROWE
PRICE
Emerging
Markets
Local
Currency
Bond
Fund
(Amounts
in
000s)
FORWARD
CURRENCY
EXCHANGE
CONTRACTS
(CONTINUED)
Counterparty
Settlement
Receive
Deliver
Unrealized
Gain/(Loss)
JPMorgan
Chase
1/17/25
USD
1,199
PEN
4,501
$
2
JPMorgan
Chase
1/17/25
USD
800
RON
3,734
23
JPMorgan
Chase
1/17/25
USD
1,201
ZAR
21,526
62
JPMorgan
Chase
1/17/25
ZAR
19,639
USD
1,083
(44)
JPMorgan
Chase
1/21/25
RSD
54,876
USD
496
(10)
JPMorgan
Chase
1/24/25
CZK
15,937
USD
668
(12)
JPMorgan
Chase
1/24/25
JPY
228,968
USD
1,536
(77)
JPMorgan
Chase
1/24/25
MXN
103,774
USD
5,022
(66)
JPMorgan
Chase
1/24/25
USD
633
CZK
14,899
20
JPMorgan
Chase
1/24/25
USD
1,474
JPY
230,650
4
JPMorgan
Chase
1/24/25
USD
1,933
MXN
39,397
52
JPMorgan
Chase
2/4/25
USD
355
HKD
2,760
(1)
JPMorgan
Chase
2/21/25
EUR
2,657
USD
2,781
(23)
JPMorgan
Chase
2/21/25
RSD
64,886
USD
588
(14)
JPMorgan
Chase
3/4/25
EGP
39,070
USD
754
(6)
JPMorgan
Chase
3/6/25
BRL
6,114
USD
995
(17)
JPMorgan
Chase
3/6/25
USD
1,243
BRL
7,760
2
JPMorgan
Chase
3/7/25
MYR
2,081
USD
471
(6)
JPMorgan
Chase
3/7/25
THB
24,304
USD
717
(1)
JPMorgan
Chase
3/7/25
USD
478
COP
2,135,766
(2)
JPMorgan
Chase
3/7/25
USD
788
MYR
3,497
7
JPMorgan
Chase
3/7/25
USD
513
THB
17,666
(8)
JPMorgan
Chase
3/7/25
USD
1,495
UYU
65,993
(4)
JPMorgan
Chase
3/14/25
CNH
38,226
USD
5,261
(42)
JPMorgan
Chase
3/14/25
USD
2,073
CNH
14,551
87
Morgan
Stanley
1/17/25
IDR
2,461,762
USD
153
(1)
Morgan
Stanley
2/21/25
EUR
803
USD
846
(12)
Nomura
Securities
International
1/24/25
USD
1,550
JPY
236,133
45
RBC
Dominion
Securities
1/17/25
IDR
10,479,913
USD
660
(12)
RBC
Dominion
Securities
1/17/25
USD
959
INR
81,430
9
RBC
Dominion
Securities
1/24/25
JPY
235,067
USD
1,544
(46)
RBC
Dominion
Securities
1/24/25
USD
2,273
CHF
2,007
56
RBC
Dominion
Securities
2/21/25
USD
1,495
EUR
1,435
6
Societe
Generale
1/17/25
KZT
788,529
USD
1,600
(104)
Societe
Generale
2/7/25
CLP
3,147,975
USD
3,157
7
Societe
Generale
2/7/25
USD
3,009
CLP
2,919,848
74
T.
ROWE
PRICE
Emerging
Markets
Local
Currency
Bond
Fund
(Amounts
in
000s)
FORWARD
CURRENCY
EXCHANGE
CONTRACTS
(CONTINUED)
Counterparty
Settlement
Receive
Deliver
Unrealized
Gain/(Loss)
Standard
Chartered
2/21/25
EUR
747
USD
793
$
(17)
Standard
Chartered
3/14/25
USD
830
CNH
6,053
3
State
Street
1/17/25
USD
1,452
TWD
46,400
40
State
Street
1/17/25
USD
1,953
ZAR
35,511
74
State
Street
1/24/25
CZK
127,860
USD
5,547
(289)
State
Street
1/24/25
USD
1,557
CZK
37,852
—
Toronto-Dominion
Bank
1/24/25
USD
684
CHF
613
6
UBS
Investment
Bank
1/16/25
TRY
6,601
USD
180
4
UBS
Investment
Bank
1/16/25
USD
926
TRY
33,488
(5)
UBS
Investment
Bank
1/17/25
INR
65,168
USD
774
(14)
UBS
Investment
Bank
1/17/25
USD
1,491
IDR
24,373,492
(16)
UBS
Investment
Bank
1/17/25
USD
1,563
RON
7,381
28
UBS
Investment
Bank
1/24/25
CHF
2,726
USD
3,113
(101)
UBS
Investment
Bank
1/24/25
USD
3,186
CHF
2,726
174
UBS
Investment
Bank
1/24/25
USD
671
JPY
99,453
37
UBS
Investment
Bank
2/14/25
USD
826
PLN
3,392
6
UBS
Investment
Bank
3/6/25
USD
663
BRL
4,073
11
UBS
Investment
Bank
3/7/25
THB
13,795
USD
397
9
UBS
Investment
Bank
3/14/25
CNH
18,879
USD
2,611
(33)
Wells
Fargo
1/17/25
USD
2,994
PEN
11,217
10
Net
unrealized
gain
(loss)
on
open
forward
currency
exchange
contracts
$
(2,238)
T.
ROWE
PRICE
Emerging
Markets
Local
Currency
Bond
Fund
FUTURES
CONTRACTS
($000s)
Expiration
Date
Notional
Amount
Value
and
Unrealized
Gain
(Loss)
Short,
10
Euro
BOBL
contracts
3/25
(1,221)
$
14
Short,
26
Euro
BUND
contracts
3/25
(3,594)
37
Short,
38
Mini
ten
year
JGB
contracts
3/25
(3,432)
10
Long,
42
U.S.
Treasury
Notes
five
year
contracts
3/25
4,465
(11)
Short,
32
U.S.
Treasury
Notes
ten
year
contracts
3/25
(3,480)
60
Short,
34
Ultra
U.S.
Treasury
Bonds
contracts
3/25
(4,043)
128
Long,
23
Ultra
U.S.
Treasury
Notes
ten
year
contracts
3/25
2,560
(67)
Net
payments
(receipts)
of
variation
margin
to
date
(164)
Variation
margin
receivable
(payable)
on
open
futures
contracts
$
7
T.
ROWE
PRICE
Emerging
Markets
Local
Currency
Bond
Fund
The
accompanying
notes
are
an
integral
part
of
these
financial
statements.
AFFILIATED
COMPANIES
($000s)
The
fund
may
invest
in
certain
securities
that
are
considered
affiliated
companies.
As
defined
by
the
1940
Act,
an
affiliated
company
is
one
in
which
the
fund
owns
5%
or
more
of
the
outstanding
voting
securities,
or
a
company
that
is
under
common
ownership
or
control.
The
following
securities
were
considered
affiliated
companies
for
all
or
some
portion
of
the
year
ended
December
31,
2024.
Net
realized
gain
(loss),
investment
income,
change
in
net
unrealized
gain/loss,
and
purchase
and
sales
cost
reflect
all
activity
for
the
period
then
ended.
Affiliate
Net
Realized
Gain
(Loss)
Change
in
Net
Unrealized
Gain/Loss
Investment
Income
T.
Rowe
Price
Government
Reserve
Fund,
4.53%
$
—#
$
—
$
487+
Supplementary
Investment
Schedule
Affiliate
Value
12/31/23
Purchase
Cost
Sales
Cost
Value
12/31/24
T.
Rowe
Price
Government
Reserve
Fund,
4.53%
$
13,565
¤
¤
$
9,805^
#
Capital
gain
distributions
from
underlying
Price
funds
represented
$0
of
the
net
realized
gain
(loss).
+
Investment
income
comprised
$487
of
dividend
income
and
$0
of
interest
income.
¤
Purchase
and
sale
information
not
shown
for
cash
management
funds.
^
The
cost
basis
of
investments
in
affiliated
companies
was
$9,805.
T.
ROWE
PRICE
Emerging
Markets
Local
Currency
Bond
Fund
December
31,
2024
Statement
of
Assets
and
Liabilities
($000s,
except
shares
and
per
share
amounts)
Assets
Investments
in
securities,
at
value
(cost
$303,595)
$
288,401
Interest
receivable
6,419
Foreign
currency
(cost
$5,023)
4,344
Unrealized
gain
on
forward
currency
exchange
contracts
2,391
Due
from
affiliates
112
Receivable
for
shares
sold
103
Cash
58
Unrealized
gain
on
bilateral
swaps
49
Variation
margin
receivable
on
centrally
cleared
swaps
47
Variation
margin
receivable
on
futures
contracts
7
Other
assets
270
Total
assets
302,201
Liabilities
Unrealized
loss
on
forward
currency
exchange
contracts
4,629
Payable
for
investment
securities
purchased
934
Unrealized
loss
on
bilateral
swaps
711
Payable
for
shares
redeemed
293
Investment
management
fees
payable
164
Other
liabilities
14
Total
liabilities
6,745
Commitments
and
Contingent
Liabilities
(note
7
)
NET
ASSETS
$
295,456
T.
ROWE
PRICE
Emerging
Markets
Local
Currency
Bond
Fund
December
31,
2024
Statement
of
Assets
and
Liabilities
($000s,
except
shares
and
per
share
amounts)
The
accompanying
notes
are
an
integral
part
of
these
financial
statements.
Net
Assets
Consist
of:
Total
distributable
earnings
(loss)
$
(
75,498
)
Paid-in
capital
applicable
to
64,647,947
shares
of
$0.01
par
value
capital
stock
outstanding;
18,000,000,000
shares
of
the
Corporation
authorized
370,954
NET
ASSETS
$
295,456
NET
ASSET
VALUE
PER
SHARE
Investor
Class
(Net
assets:
$18,751;
Shares
outstanding:
4,100,498)
$
4.57
Advisor
Class
(Net
assets:
$3;
Shares
outstanding:
754)
$
4.54
I
Class
(Net
assets:
$93,008;
Shares
outstanding:
20,334,466)
$
4.57
Z
Class
(Net
assets:
$183,694;
Shares
outstanding:
40,212,229)
$
4.57
T.
ROWE
PRICE
Emerging
Markets
Local
Currency
Bond
Fund
Year
Ended
12/31/24
Investment
Income
(Loss)
Income
.
Interest
(net
of
foreign
taxes
of
$342)
$
21,934
Dividend
487
Total
income
22,421
Expenses
Investment
management
2,017
Shareholder
servicing
Investor
Class
$
64
Advisor
Class
1
I
Class
9
74
Prospectus
and
shareholder
reports
Investor
Class
7
I
Class
8
Z
Class
5
20
Custody
and
accounting
258
Registration
63
Legal
and
audit
54
Directors
1
Miscellaneous
19
Waived
/
paid
by
Price
Associates
(
1,575
)
Total
expenses
931
Net
investment
income
21,490
T.
ROWE
PRICE
Emerging
Markets
Local
Currency
Bond
Fund
The
accompanying
notes
are
an
integral
part
of
these
financial
statements.
Year
Ended
12/31/24
Realized
and
Unrealized
Gain
/
Loss
–
Net
realized
gain
(loss)
Securities
(net
of
foreign
taxes
of
$76)
(
1,309
)
Futures
301
Swaps
(
802
)
Forward
currency
exchange
contracts
(
2,727
)
Foreign
currency
transactions
(
888
)
Net
realized
loss
(
5,425
)
Change
in
net
unrealized
gain
/
loss
Securities
(
22,383
)
Futures
509
Swaps
(
688
)
Forward
currency
exchange
contracts
(
3,949
)
Other
assets
and
liabilities
denominated
in
foreign
currencies
(
863
)
Change
in
net
unrealized
gain
/
loss
(
27,374
)
Net
realized
and
unrealized
gain
/
loss
(
32,799
)
DECREASE
IN
NET
ASSETS
FROM
OPERATIONS
$
(
11,309
)
T.
ROWE
PRICE
Emerging
Markets
Local
Currency
Bond
Fund
Statement
of
Changes
in
Net
Assets
Year
.
.
.
.
.
.
.
.
.
.
.
.
.
.
Ended
.
.
.
.
.
.
.
.
.
.
.
.
.
.
12/31/24
12/31/23
Increase
(Decrease)
in
Net
Assets
Operations
Net
investment
income
$
21,490
$
24,872
Net
realized
loss
(5,425)
(13,990)
Change
in
net
unrealized
gain
/
loss
(27,374)
37,259
Increase
(decrease)
in
net
assets
from
operations
(11,309)
48,141
Distributions
to
shareholders
Net
earnings
Investor
Class
(707)
(1,257)
Advisor
Class
–
(1)
I
Class
(3,143)
(5,026)
Z
Class
(6,768)
(13,834)
Tax
return
of
capital
–
–
Investor
Class
(691)
(269)
Advisor
Class
–
–
I
Class
(2,991)
(1,066)
Z
Class
(6,428)
(3,000)
Decrease
in
net
assets
from
distributions
(20,728)
(24,453)
Capital
share
transactions
*
Shares
sold
Investor
Class
4,444
13,744
Advisor
Class
1
–
I
Class
15,173
30,397
Z
Class
4,311
17,228
Distributions
reinvested
Investor
Class
1,314
1,427
Advisor
Class
–
1
I
Class
6,014
5,971
Z
Class
13,194
16,778
Shares
redeemed
Investor
Class
(12,305)
(21,383)
Advisor
Class
(12)
(1)
I
Class
(17,767)
(35,710)
Z
Class
(12,871)
(89,616)
Increase
(decrease)
in
net
assets
from
capital
share
transactions
1,496
(61,164)
T.
ROWE
PRICE
Emerging
Markets
Local
Currency
Bond
Fund
Statement
of
Changes
in
Net
Assets
The
accompanying
notes
are
an
integral
part
of
these
financial
statements.
Year
.
.
.
.
.
.
.
.
.
.
.
.
.
.
Ended
.
.
.
.
.
.
.
.
.
.
.
.
.
.
12/31/24
12/31/23
Net
Assets
Decrease
during
period
(30,541)
(37,476)
Beginning
of
period
325,997
363,473
End
of
period
$
295,456
$
325,997
*Share
information
(000s)
Shares
sold
Investor
Class
918
2,808
Advisor
Class
–
(1)
–
I
Class
3,119
6,195
Z
Class
930
3,487
Distributions
reinvested
Investor
Class
273
293
Advisor
Class
–
(1)
–
(1)
I
Class
1,251
1,224
Z
Class
2,747
3,444
Shares
redeemed
Investor
Class
(2,551)
(4,461)
Advisor
Class
(2)
–
(1)
I
Class
(3,687)
(7,285)
Z
Class
(2,640)
(19,116)
Increase
(decrease)
in
shares
outstanding
358
(13,411)
(1)
Amount
rounds
to
less
than
1,000
shares
T.
ROWE
PRICE
Emerging
Markets
Local
Currency
Bond
Fund
NOTES
TO
FINANCIAL
STATEMENTS
T.
Rowe
Price
International
Funds,
Inc. (the
corporation) is
registered
under
the
Investment
Company
Act
of
1940
(the
1940
Act).
The
Emerging
Markets
Local
Currency
Bond
Fund
(the
fund)
is a
nondiversified, open-end
management
investment
company
established
by
the
corporation. The
fund
seeks to
provide
high
income
and
capital
appreciation.
The
fund
has four classes
of
shares:
the
Emerging
Markets
Local
Currency
Bond
Fund
(Investor
Class),
the
Emerging
Markets
Local
Currency
Bond
Fund–Advisor
Class
(Advisor
Class),
the
Emerging
Markets
Local
Currency
Bond
Fund–I
Class
(I
Class)
and
the
Emerging
Markets
Local
Currency
Bond
Fund–Z
Class
(Z
Class).
Advisor
Class
shares
are
sold
only
through
various
brokers
and
other
financial
intermediaries.
I
Class
shares
require
a
$500,000
initial
investment
minimum,
although
the
minimum
generally
is
waived
or
reduced
for
financial
intermediaries,
eligible
retirement
plans,
and
certain
other
accounts.
The
Z
Class
is
only
available
to
funds
advised
by
T.
Rowe
Price
Associates,
Inc.
and
its
affiliates
and
other
clients
that
are
subject
to
a
contractual
fee
for
investment
management
services.
The
Advisor
Class
operates
under
a
Board-approved
Rule
12b-1
plan
pursuant
to
which
the
class
compensates
financial
intermediaries
for
distribution,
shareholder
servicing,
and/or
certain
administrative
services;
the
Investor,
I
and
Z
Classes
do
not
pay
Rule
12b-1
fees. Each
class
has
exclusive
voting
rights
on
matters
related
solely
to
that
class;
separate
voting
rights
on
matters
that
relate
to
all
classes;
and,
in
all
other
respects,
the
same
rights
and
obligations
as
the
other
classes.
NOTE
1
-
SIGNIFICANT
ACCOUNTING
POLICIES
Basis
of
Preparation
The fund
is
an
investment
company
and
follows
accounting
and
reporting
guidance
in
the
Financial
Accounting
Standards
Board
(FASB)
Accounting
Standards
Codification
Topic
946
(ASC
946).
The
accompanying
financial
statements
were
prepared
in
accordance
with
accounting
principles
generally
accepted
in
the
United
States
of
America
(GAAP),
including,
but
not
limited
to,
ASC
946.
GAAP
requires
the
use
of
estimates
made
by
management.
Management
believes
that
estimates
and
valuations
are
appropriate;
however,
actual
results
may
differ
from
those
estimates,
and
the
valuations
reflected
in
the
accompanying
financial
statements
may
differ
from
the
value
ultimately
realized
upon
sale
or
maturity.
T.
ROWE
PRICE
Emerging
Markets
Local
Currency
Bond
Fund
Investment
Transactions,
Investment
Income,
and
Distributions
Investment
transactions
are
accounted
for
on
the
trade
date
basis.
Income
and
expenses
are
recorded
on
the
accrual
basis.
Realized
gains
and
losses
are
reported
on
the
identified
cost
basis. Premiums
and
discounts
on
debt
securities
are
amortized
for
financial
reporting
purposes. Inflation
adjustments
to
the
principal
amount
of
inflation-indexed
bonds
are
reflected
as
interest
income. Income
tax-related
interest
and
penalties,
if
incurred,
are
recorded
as
income
tax
expense. Dividends
received
from other
investment
companies are
reflected
as
dividend income;
capital
gain
distributions
are
reflected
as
realized
gain/
loss. Dividend
income and
capital
gain
distributions
are
recorded
on
the
ex-dividend
date. Earnings
on
investments
recognized
as
partnerships
for
federal
income
tax
purposes
reflect
the
tax
character
of
such
earnings. Non-
cash
dividends,
if
any,
are
recorded
at
the
fair
market
value
of
the
asset
received. Proceeds
from
litigation
payments,
if
any,
are
included
in
either
net
realized
gain
(loss)
or
change
in
net
unrealized
gain/loss
from
securities. Distributions
to
shareholders
are
recorded
on
the
ex-dividend
date. Income
distributions,
if
any, are
declared
by
each
class daily
and
paid
monthly. A
capital
gain
distribution,
if
any, may
also
be
declared
and
paid
by
the
fund
annually.
Currency
Translation
Assets,
including
investments,
and
liabilities
denominated
in
foreign
currencies
are
translated
into
U.S.
dollar
values
each
day
at
the
prevailing
exchange
rate,
using
the
mean
of
the
bid
and
asked
prices
of
such
currencies
against
U.S.
dollars
as
provided
by
an
outside
pricing
service.
Purchases
and
sales
of
securities,
income,
and
expenses
are
translated
into
U.S.
dollars
at
the
prevailing
exchange
rate
on
the
respective
date
of
such
transaction.
The
effect
of
changes
in
foreign
currency
exchange
rates
on
realized
and
unrealized
security
gains
and
losses
is
not
bifurcated
from
the
portion
attributable
to
changes
in
market
prices.
Class
Accounting
Shareholder
servicing,
prospectus,
and
shareholder
report
expenses
incurred
by
each
class
are
charged
directly
to
the
class
to
which
they
relate.
Expenses
common
to
all
classes
and
investment
income
are
allocated
to
the
classes
based
upon
the
relative
daily
net
assets
of
each
class’s
settled
shares;
realized
and
unrealized
gains
and
losses
are
allocated
based
upon
the
relative
daily
net
assets
of
each
class’s
outstanding
shares.
The
Advisor
Class
pays
Rule
12b-1
fees,
in
an
amount
not
exceeding
0.25%
of
the
class’s
average
daily
net
assets;
during
the
year
ended
December
31,
2024,
the
Advisor
Class
incurred
less
than
$1,000
in
these
fees.
T.
ROWE
PRICE
Emerging
Markets
Local
Currency
Bond
Fund
Capital
Transactions
Each
investor’s
interest
in
the
net
assets
of the
fund
is
represented
by
fund
shares. The
fund’s
net
asset
value
(NAV)
per
share
is
computed
at
the
close
of
the
New
York
Stock
Exchange
(NYSE),
normally
4
p.m.
Eastern
time,
each
day
the
NYSE
is
open
for
business.
However,
the
NAV
per
share
may
be
calculated
at
a
time
other
than
the
normal
close
of
the
NYSE
if
trading
on
the
NYSE
is
restricted,
if
the
NYSE
closes
earlier,
or
as
may
be
permitted
by
the
SEC.
Purchases
and
redemptions
of
fund
shares
are
transacted
at
the
next-computed
NAV
per
share,
after
receipt
of
the
transaction
order
by
T.
Rowe
Price
Associates,
Inc.,
or
its
agents.
New
Accounting
Guidance
In December
2023,
the
FASB
issued
Accounting
Standards
Update
(ASU),
ASU
2023-09,
Income
Taxes
(Topic
740)
–
Improvements
to
Income
Taxes
Disclosures,
which
enhances
the
transparency
of
income
tax
disclosures.
The
ASU
requires
public
entities,
on
an
annual
basis,
to
provide
disclosure
of
specific
categories
in
the
rate
reconciliation,
as
well
as
disclosure
of
income
taxes
paid
disaggregated
by
jurisdiction.
The
amendments
under
this
ASU
are
required
to
be
applied
prospectively
and
are
effective
for
fiscal
years
beginning
after
December
15,
2024.
Management
expects
that
adoption
of
the
guidance
will
not
have
a
material
impact
on
the
fund’s
financial
statements.
Indemnification
In
the
normal
course
of
business, the
fund
may
provide
indemnification
in
connection
with
its
officers
and
directors,
service
providers,
and/or
private
company
investments. The
fund’s
maximum
exposure
under
these
arrangements
is
unknown;
however,
the
risk
of
material
loss
is
currently
considered
to
be
remote.
NOTE
2
-
VALUATION
Fair
Value
The
fund’s
financial
instruments
are
valued
at
the
close
of
the
NYSE
and
are
reported
at
fair
value,
which
GAAP
defines
as
the
price
that
would
be
received
to
sell
an
asset
or
paid
to
transfer
a
liability
in
an
orderly
transaction
between
market
participants
at
the
measurement
date. The fund’s
Board
of
Directors
(the
Board)
has
designated
T.
Rowe
Price
Associates,
Inc.
as
the
fund’s
valuation
designee
(Valuation
Designee).
Subject
to
oversight
by
the
Board,
the
Valuation
Designee
performs
the
following
functions
in
performing
fair
value
determinations:
assesses
and
manages
valuation
risks;
establishes
and
applies
fair
value
methodologies;
tests
fair
value
methodologies;
and
evaluates
pricing
vendors
and
pricing
agents.
The
duties
T.
ROWE
PRICE
Emerging
Markets
Local
Currency
Bond
Fund
and
responsibilities
of
the
Valuation
Designee
are
performed
by
its
Valuation
Committee. The
Valuation
Designee provides
periodic
reporting
to
the
Board
on
valuation
matters.
Various
valuation
techniques
and
inputs
are
used
to
determine
the
fair
value
of
financial
instruments.
GAAP
establishes
the
following
fair
value
hierarchy
that
categorizes
the
inputs
used
to
measure
fair
value:
Level
1
–
quoted
prices
(unadjusted)
in
active
markets
for
identical
financial
instruments
that
the
fund
can
access
at
the
reporting
date
Level
2
–
inputs
other
than
Level
1
quoted
prices
that
are
observable,
either
directly
or
indirectly
(including,
but
not
limited
to,
quoted
prices
for
similar
financial
instruments
in
active
markets,
quoted
prices
for
identical
or
similar
financial
instruments
in
inactive
markets,
interest
rates
and
yield
curves,
implied
volatilities,
and
credit
spreads)
Level
3
–
unobservable
inputs
(including
the Valuation
Designee’s assumptions
in
determining
fair
value)
Observable
inputs
are
developed
using
market
data,
such
as
publicly
available
information
about
actual
events
or
transactions,
and
reflect
the
assumptions
that
market
participants
would
use
to
price
the
financial
instrument.
Unobservable
inputs
are
those
for
which
market
data
are
not
available
and
are
developed
using
the
best
information
available
about
the
assumptions
that
market
participants
would
use
to
price
the
financial
instrument.
GAAP
requires
valuation
techniques
to
maximize
the
use
of
relevant
observable
inputs
and
minimize
the
use
of
unobservable
inputs.
When
multiple
inputs
are
used
to
derive
fair
value,
the
financial
instrument
is
assigned
to
the
level
within
the
fair
value
hierarchy
based
on
the
lowest-level
input
that
is
significant
to
the
fair
value
of
the
financial
instrument.
Input
levels
are
not
necessarily
an
indication
of
the
risk
or
liquidity
associated
with
financial
instruments
at
that
level
but
rather
the
degree
of
judgment
used
in
determining
those
values.
Valuation
Techniques
Debt
securities
generally
are
traded
in
the over-the-
counter
(OTC)
market
and
are
valued
at
prices
furnished
by
independent
pricing
services
or
by
broker
dealers
who
make
markets
in
such
securities.
When
valuing
securities,
the
independent
pricing
services
consider
factors
such
as,
but
not
limited
to,
the
yield
or
price
of
bonds
of
comparable
quality,
coupon,
maturity,
and
type,
as
well
as
prices
quoted
by
dealers
who
make
markets
in
such
securities.
T.
ROWE
PRICE
Emerging
Markets
Local
Currency
Bond
Fund
Investments
in
mutual
funds
are
valued
at
the
mutual
fund’s
closing
NAV
per
share
on
the
day
of
valuation.
Investments
in
private
investment
companies
are
valued
at
the
investee’s
NAV
per
share
as
of
the
valuation
date,
if
available.
If
the
investee’s
NAV
is
not
available
as
of
the
valuation
date
or
is
not
calculated
in
accordance
with
GAAP,
the
Valuation Designee
may
adjust
the
investee’s
NAV
to
reflect
fair
value
at
the
valuation
date.
Listed
options,
and
OTC
options
with
a
listed
equivalent,
are
valued
at
the
mean
of
the
closing
bid
and
asked
prices
and
exchange-traded
options
on
futures
contracts
are
valued
at
closing
settlement
prices.
Futures
contracts
are
valued
at
closing
settlement
prices.
Forward
currency
exchange
contracts
are
valued
using
the
prevailing
forward
exchange
rate.
Swaps
are
valued
at
prices
furnished
by
an
independent
pricing
service
or
independent
swap
dealers.
Assets
and
liabilities
other
than
financial
instruments,
including
short-term
receivables
and
payables,
are
carried
at
cost,
or
estimated
realizable
value,
if
less,
which
approximates
fair
value.
Investments
for
which
market
quotations are
not
readily
available
or
deemed
unreliable
are
valued
at
fair
value
as
determined
in
good
faith
by
the
Valuation
Designee.
The
Valuation
Designee
has
adopted
methodologies
for
determining
the
fair
value
of
investments
for
which
market
quotations
are
not
readily
available
or
deemed
unreliable,
including
the
use
of
other
pricing
sources.
Factors
used
in
determining
fair
value
vary
by
type
of
investment
and
may
include
market
or
investment
specific
considerations.
The
Valuation
Designee typically
will
afford
greatest
weight
to
actual
prices
in
arm’s
length
transactions,
to
the
extent
they
represent
orderly
transactions
between
market
participants,
transaction
information
can
be
reliably
obtained,
and
prices
are
deemed
representative
of
fair
value.
However,
the
Valuation
Designee may
also
consider
other
valuation
methods
such
as
market-based
valuation
multiples;
a
discount
or
premium
from
market
value
of
a
similar,
freely
traded
security
of
the
same
issuer;
discounted
cash
flows;
yield
to
maturity;
or
some
combination.
Fair
value
determinations
are
reviewed
on
a
regular
basis.
Because
any
fair
value
determination
involves
a
significant
amount
of
judgment,
there
is
a
degree
of
subjectivity
inherent
in
such
pricing
decisions. Fair
value
prices
determined
by
the
Valuation
Designee could
differ
from
those
of
other
market
participants,
and
it
is
possible
that
the
fair
value
determined
for
a
security
may
be
materially
different
from
the
value
that
could
be
realized
upon
the
sale
of
that
security.
T.
ROWE
PRICE
Emerging
Markets
Local
Currency
Bond
Fund
Valuation
Inputs
The
following
table
summarizes
the
fund’s
financial
instruments,
based
on
the
inputs
used
to
determine
their
fair
values
on
December
31,
2024
(for
further
detail
by
category,
please
refer
to
the
accompanying
Portfolio
of
Investments):
($000s)
Level
1
Level
2
Level
3
Total
Value
Assets
Fixed
Income
Securities
1
$
—
$
260,908
$
—
$
260,908
Private
Investment
Company
2
—
—
—
525
Short-Term
Investments
9,805
16,765
—
26,570
Options
Purchased
57
341
—
398
Total
Securities
9,862
278,014
—
288,401
Swaps*
—
616
—
616
Forward
Currency
Exchange
Contracts
—
2,391
—
2,391
Futures
Contracts*
249
—
—
249
Total
$
10,111
$
281,021
$
—
$
291,657
Liabilities
Swaps*
$
—
$
957
$
—
$
957
Forward
Currency
Exchange
Contracts
—
4,629
—
4,629
Futures
Contracts*
78
—
—
78
Total
$
78
$
5,586
$
—
$
5,664
1
Includes
Convertible
Bonds,
Corporate
Bonds
and
Government
Bonds.
2
In
accordance
with
Subtopic
820-10,
certain
investments
that
are
measured
at
fair
value
using
the
net
asset
value
per
share
(or
its
equivalent)
practical
expedient
have
not
been
classified
in
the
fair
value
hierarchy.
The
fair
value
amounts
presented
in
this
table
are
intended
to
permit
reconciliation
of
the
fair
value
hierarchy
to
the
amounts
presented
in
the
Portfolio
of
Investments.
*
The
fair
value
presented
includes
cumulative
gain
(loss)
on
open
futures
contracts
and
centrally
cleared
swaps;
however,
the
net
value
reflected
on
the
accompanying
Portfolio
of
Investments
is
only
the
unsettled
variation
margin
receivable
(payable)
at
that
date.
T.
ROWE
PRICE
Emerging
Markets
Local
Currency
Bond
Fund
NOTE
3
-
DERIVATIVE
INSTRUMENTS
During
the
year ended
December
31,
2024,
the
fund
invested
in
derivative
instruments.
As
defined
by
GAAP,
a
derivative
is
a
financial
instrument
whose
value
is
derived
from
an
underlying
security
price,
foreign
exchange
rate,
interest
rate,
index
of
prices
or
rates,
or
other
variable;
it
requires
little
or
no
initial
investment
and
permits
or
requires
net
settlement
or
delivery
of
cash
or
other
assets.
The
fund
invests
in
derivatives
only
if
the
expected
risks
and
rewards
are
consistent
with
its
investment
objectives,
policies,
and
overall
risk
profile,
as
described
in
its
prospectus
and
Statement
of
Additional
Information.
The
fund
may
use
derivatives
for
a
variety
of
purposes
and
may
use
them
to
establish
both
long
and
short
positions
within
the
fund’s
portfolio.
Potential
uses
include
to
hedge
against
declines
in
principal
value,
increase
yield,
invest
in
an
asset
with
greater
efficiency
and
at
a
lower
cost
than
is
possible
through
direct
investment,
to
enhance
return,
or
to
adjust
portfolio
duration
and
credit
exposure.
The
risks
associated
with
the
use
of
derivatives
are
different
from,
and
potentially
much
greater
than,
the
risks
associated
with
investing
directly
in
the
instruments
on
which
the
derivatives
are
based.
The
fund
values
its
derivatives
at
fair
value
and
recognizes
changes
in
fair
value
currently
in
its
results
of
operations.
Accordingly,
the
fund
does
not
follow
hedge
accounting,
even
for
derivatives
employed
as
economic
hedges.
Generally,
the
fund
accounts
for
its
derivatives
on
a
gross
basis.
It
does
not
offset
the
fair
value
of
derivative
liabilities
against
the
fair
value
of
derivative
assets
on
its
financial
statements,
nor
does
it
offset
the
fair
value
of
derivative
instruments
against
the
right
to
reclaim
or
obligation
to
return
collateral.
The
following
table
summarizes
the
fair
value
of
the
fund’s
derivative
instruments
held
as
of
December
31,
2024,
and
the
related
location
on
the
accompanying
Statement
of
Assets
and
Liabilities,
presented
by
primary
underlying
risk
exposure:
T.
ROWE
PRICE
Emerging
Markets
Local
Currency
Bond
Fund
($000s)
Location
on
Statement
of
Assets
and
Liabilities
Fair
Value*
Assets
Inflation
derivatives
Centrally
Cleared
Swaps
$
7
Interest
rate
derivatives
Bilateral
Swaps,
Centrally
Cleared
Swaps,
Futures,
Securities^
831
Foreign
exchange
derivatives
Forwards,
Securities^
2,732
Credit
derivatives
Centrally
Cleared
Swaps
84
^
,*
Total
$
3,654
^
,*
Liabilities
Inflation
derivatives
Centrally
Cleared
Swaps
$
9
Interest
rate
derivatives
Bilateral
Swaps,
Centrally
Cleared
Swaps,
Futures
992
Foreign
exchange
derivatives
Forwards
4,629
Credit
derivatives
Centrally
Cleared
Swaps
34
Total
$
5,664
*
The
fair
value
presented
includes
cumulative
gain
(loss)
on
open
futures
contracts
and
centrally
cleared
swaps;
however,
the
value
reflected
on
the
accompanying
Statement
of
Assets
and
Liabilities
is
only
the
unsettled
variation
margin
receivable
(payable)
at
that
date.
^
Options
purchased
are
reported
as
securities
and
are
reflected
in
the
accompanying
Portfolio
of
Investments.
T.
ROWE
PRICE
Emerging
Markets
Local
Currency
Bond
Fund
Additionally,
the
amount
of
gains
and
losses
on
derivative
instruments
recognized
in
fund
earnings
during
the
year ended
December
31,
2024,
and
the
related
location
on
the
accompanying
Statement
of
Operations
is
summarized
in
the
following
table
by
primary
underlying
risk
exposure:
Counterparty
Risk
and
Collateral
The
fund
invests
in
derivatives
in
various
markets,
which
expose
it
to
differing
levels
of
counterparty
risk.
Counterparty
risk
on
exchange-traded
and
centrally
cleared
derivative
contracts,
such
as
futures,
exchange-traded
options,
and
centrally
cleared
swaps,
is
minimal
because
the
clearinghouse
provides
protection
against
counterparty
defaults.
For
futures
and
centrally
cleared
swaps,
the
fund
is
required
to
deposit
collateral
in
an
amount
specified
by
the
clearinghouse
and
the
clearing
firm
(margin
($000s)
Location
of
Gain
(Loss)
on
Statement
of
Operations
Securities^
Futures
Forward
Currency
Exchange
Contracts
Swaps
Total
Realized
Gain
(Loss)
Inflation
derivatives
$
—
$
—
$
—
$
(9)
$
(9)
Interest
rate
derivatives
(128)
301
—
(447)
(274)
Foreign
exchange
derivatives
(57)
—
(2,727)
—
(2,784)
Credit
derivatives
—
—
—
(346)
(346)
Total
$
(185)
$
301
$
(2,727)
$
(802)
$
(3,413)
Change
in
Unrealized
Gain
(Loss)
Inflation
derivatives
$
—
$
—
$
—
$
6
$
6
Interest
rate
derivatives
26
509
—
(866)
(331)
Foreign
exchange
derivatives
145
—
(3,949)
—
(3,804)
Credit
derivatives
—
—
—
172
172
Total
$
171
$
509
$
(3,949)
$
(688)
$
(3,957)
^
Options
purchased
are
reported
as
securities.
T.
ROWE
PRICE
Emerging
Markets
Local
Currency
Bond
Fund
requirement),
and
the
margin
requirement
must
be
maintained
over
the
life
of
the
contract.
Each
clearinghouse
and
clearing
firm,
in
its
sole
discretion,
may
adjust
the
margin
requirements
applicable
to
the
fund.
Derivatives,
such
as
non-cleared bilateral
swaps,
forward
currency
exchange
contracts,
and
OTC
options,
that
are
transacted
and
settle
directly
with
a
counterparty
(bilateral
derivatives)
may
expose
the
fund
to
greater
counterparty
risk.
To
mitigate
this
risk,
the
fund
has
entered
into
master
netting
arrangements
(MNAs)
with
certain
counterparties
that
permit
net
settlement
under
specified
conditions
and,
for
certain
counterparties,
also
require
the
exchange
of
collateral
to
cover
mark-to-market
exposure.
MNAs
may
be
in
the
form
of
International
Swaps
and
Derivatives
Association
master
agreements
(ISDAs)
or
foreign
exchange
letter
agreements
(FX
letters).
MNAs
provide
the
ability
to
offset
amounts
the
fund
owes
a
counterparty
against
amounts
the
counterparty
owes
the
fund
(net
settlement).
Both
ISDAs
and
FX
letters
generally
allow
termination
of
transactions
and
net
settlement
upon
the
occurrence
of
contractually
specified
events,
such
as
failure
to
pay
or
bankruptcy.
In
addition,
ISDAs
specify
other
events,
the
occurrence
of
which
would
allow
one
of
the
parties
to
terminate.
For
example,
a
downgrade
in
credit
rating
of
a
counterparty
below
a
specified
rating
would
allow
the
fund
to
terminate,
while
a
decline
in
the
fund’s
net
assets
of
more
than
a
specified
percentage
would
allow
the
counterparty
to
terminate.
Upon
termination,
all
transactions
with
that
counterparty
would
be
liquidated
and
a
net
termination
amount
settled.
ISDAs
typically
include
collateral
agreements
whereas
FX
letters
do
not.
Collateral
requirements
are
determined
daily
based
on
the
net
aggregate
unrealized
gain
or
loss
on
all
bilateral
derivatives
with
a
counterparty,
subject
to
minimum
transfer
amounts
that
typically
range
from
$100,000
to
$250,000.
Any
additional
collateral
required
due
to
changes
in
security
values
is
typically
transferred
the
next
business
day.
Collateral
may
be
in
the
form
of
cash
or
debt
securities
issued
by
the
U.S.
government
or
related
agencies,
although
other
securities
may
be
used
depending
on
the
terms
outlined
in
the
applicable
MNA.
Cash
posted
by
the
fund
is
reflected
as
cash
deposits
in
the
accompanying
financial
statements
and
generally
is
restricted
from
withdrawal
by
the
fund;
securities
posted
by
the
fund
are
so
noted
in
the
accompanying
Portfolio
of
Investments;
both
remain
in
the
fund’s
assets.
Collateral
pledged
by
counterparties
is
not
included
in
the
fund’s
assets
because
the
fund
does
not
obtain
effective
control
over
those
assets.
For
bilateral
derivatives,
collateral
posted
by
the
fund
is
held
in
a
segregated
account
at
the
fund’s
custodian.
While
typically
not
sold
in
the
same
manner
T.
ROWE
PRICE
Emerging
Markets
Local
Currency
Bond
Fund
as
equity
or
fixed
income
securities,
exchange-traded
or
centrally
cleared
derivatives
may
be
closed
out
only
on
the
exchange
or
clearinghouse
where
the
contracts
were
cleared,
and
OTC
and
bilateral
derivatives
may
be
unwound
with
counterparties
or
transactions
assigned
to
other
counterparties
to
allow
the
fund
to
exit
the
transaction.
This
ability
is
subject
to
the
liquidity
of
underlying
positions. As
of
December
31,
2024,
securities
valued
at $2,398,000
had
been
posted
by
the
fund
for
exchange-traded
and/or
centrally
cleared
derivatives.
T.
ROWE
PRICE
Emerging
Markets
Local
Currency
Bond
Fund
The
following
table
summarizes
the
fund’s
OTC
and
bilateral
derivatives
at
the
reporting
date
by
loss
exposure
to
each
counterparty
after
consideration
of
collateral,
if
any.
Forward
Currency
Exchange
Contracts
The
fund
is
subject
to
foreign
currency
exchange
rate
risk
in
the
normal
course
of
pursuing
its
investment
objectives.
It may use
forward
currency
exchange
contracts
(forwards)
primarily
($000s)
Gross
Value
on
Statements
of
Assets
and
Liabilities
Net
amount
due
(to)/from
Counterparty
or
Exchange
Collateral
Pledged
(Received)
by
Fund
Loss
Exposure,
After
Collateral*
(not
less
than
$0)
Counterparty
Assets
Liabilities
Bank
of
America
$
412
$
(727)
$
(315)
$
173
$
—
Barclays
Bank
99
(188)
(89)
—
—
BNP
Paribas
104
(441)
(337)
261
—
BNY
Mellon
7
(41)
(34)
—
—
Canadian
Imperial
Bank
of
Commerce
—
(34)
(34)
—
—
Citibank
214
(157)
57
(310)
—
Deutsche
Bank
208
(255)
(47)
—
—
Goldman
Sachs
302
(937)
(635)
437
—
HSBC
Bank
257
(831)
(574)
354
—
JPMorgan
Chase
359
(471)
(112)
—
—
Morgan
Stanley
143
(621)
(478)
516
38
Nomura
Securities
International
45
—
45
—
45
RBC
Dominion
Securities
71
(58)
13
—
13
Societe
Generale
81
(104)
(23)
—
—
Standard
Chartered
3
(17)
(14)
1
—
State
Street
114
(289)
(175)
226
51
Toronto-Dominion
Bank
6
—
6
—
6
UBS
Investment
Bank
315
(169)
146
—
146
Wells
Fargo
41
—
41
—
41
Total
$
2,781
$
(5,340)
*
In
situations
such
as
counterparty
default
or
bankruptcy,
the
fund
may
have
further
rights
of
offset
against
amounts
due
to
or
from
the
counterparty
under
other
agreements.
T.
ROWE
PRICE
Emerging
Markets
Local
Currency
Bond
Fund
to
protect
its
non-U.S.
dollar-denominated
securities
from
adverse
currency
movements
or
to
increase
exposure
to
a
particular
foreign
currency,
to
shift
the
fund’s
foreign
currency
exposure
from
one
country
to
another,
or
to
enhance
the
fund’s
return.
A
forward
involves
an
obligation
to
purchase
or
sell
a
fixed
amount
of
a
specific
currency
on
a
future
date
at
a
price
set
at
the
time
of
the
contract.
Although
certain
forwards
may
be
settled
by
exchanging
only
the
net
gain
or
loss
on
the
contract,
most
forwards
are
settled
with
the
exchange
of
the
underlying
currencies
in
accordance
with
the
specified
terms.
Forwards
are
valued
at
the
unrealized
gain
or
loss
on
the
contract,
which
reflects
the
net
amount
the
fund
either
is
entitled
to
receive
or
obligated
to
deliver,
as
measured
by
the
difference
between
the
forward
exchange
rates
at
the
date
of
entry
into
the
contract
and
the
forward
rates
at
the
reporting
date.
Appreciated
forwards
are
reflected
as
assets
and
depreciated
forwards
are
reflected
as
liabilities
on
the
accompanying
Statement
of
Assets
and
Liabilities.
When
a
contract
is
closed,
a
realized
gain
or
loss
is
recorded
on
the
accompanying
Statement
of
Operations.
Risks
related
to
the
use
of
forwards
include
the
possible
failure
of
counterparties
to
meet
the
terms
of
the
agreements;
that
anticipated
currency
movements
will
not
occur,
thereby
reducing
the
fund’s
total
return;
and
the
potential
for
losses
in
excess
of
the
fund’s
initial
investment.
During
the
year ended
December
31,
2024,
the
volume
of
the
fund’s
activity
in
forwards,
based
on
underlying
notional
amounts,
was
generally
between
41%
and
48%
of
net
assets.
Futures
Contracts
The
fund
is
subject
to interest
rate
risk in
the
normal
course
of
pursuing
its
investment
objectives
and
uses
futures
contracts
to
help
manage
such
risk.
The fund
may
enter
into
futures
contracts
to
manage
exposure
to
interest
rate
and
yield
curve
movements,
security
prices,
foreign
currencies,
and
mortgage
prepayments;
as
an
efficient
means
of
adjusting
exposure
to
all
or
part
of
a
target
market;
as
a
cash
management
tool;
or
to
adjust
portfolio
duration. A
futures
contract
provides
for
the
future
sale
by
one
party
and
purchase
by
another
of
a
specified
amount
of
a
specific
underlying
financial
instrument
at
an
agreed-upon
price,
date,
time,
and
place.
The
fund
currently
invests
only
in
exchange-traded
futures,
which
generally
are
standardized
as
to
maturity
date,
underlying
financial
instrument,
and
other
contract
terms.
Payments
are
made
or
received
by
the
fund
each
day
to
settle
daily
fluctuations
in
the
value
of
the
contract
(variation
margin),
which
reflect
changes
in
the
value
of
the
underlying
financial
instrument.
Variation
margin
is
recorded
as
unrealized
gain
or
loss
until
the
contract
is
closed.
The
value
of
a
futures
contract
included
in
net
assets
is
the
amount
of
unsettled
variation
margin;
net
variation
margin
receivable
is
reflected
as
an
asset
and
net
variation
margin
payable
is
reflected
T.
ROWE
PRICE
Emerging
Markets
Local
Currency
Bond
Fund
as
a
liability
on
the
accompanying
Statement
of
Assets
and
Liabilities.
When
a
contract
is
closed,
a
realized
gain
or
loss
is
recorded
on
the
accompanying
Statement
of
Operations.
Risks
related
to
the
use
of
futures
contracts
include
possible
illiquidity
of
the
futures
markets,
contract
prices
that
can
be
highly
volatile
and
imperfectly
correlated
to
movements
in
hedged
security
values
and/
or
interest
rates,
and
potential
losses
in
excess
of
the
fund’s
initial
investment.
During
the
year ended
December
31,
2024,
the
volume
of
the
fund’s
activity
in
futures,
based
on
underlying
notional
amounts,
was
generally
between
3%
and
7%
of
net
assets.
Options
The
fund
is
subject
to interest
rate
risk
and
foreign
currency
exchange
rate
risk in
the
normal
course
of
pursuing
its
investment
objectives
and
uses
options
to
help
manage
such
risks.
The
fund
may
use
options
to
manage
exposure
to
security
prices,
interest
rates,
foreign
currencies,
and
credit
quality;
as
an
efficient
means
of
adjusting
exposure
to
all
or
a
part
of
a
target
market;
to
enhance
income;
as
a
cash
management
tool;
or
to
adjust
credit
exposure.
The
fund
may
buy
or
sell
options
that
can
be
settled
either
directly
with
the
counterparty
(OTC
option)
or
through
a
central
clearinghouse
(exchange-traded
option).
Options
are
included
in
net
assets
at
fair
value,
options
purchased
are
included
in
Investments
in
Securities,
and
options
written
are
separately
reflected
as
a
liability
on
the
accompanying
Statement
of
Assets
and
Liabilities.
Premiums
on
unexercised,
expired
options
are
recorded
as
realized
gains
or
losses
on
the
accompanying
Statement
of
Operations;
premiums
on
exercised
options
are
recorded
as
an
adjustment
to
the
proceeds
from
the
sale
or
cost
of
the
purchase.
The
difference
between
the
premium
and
the
amount
received
or
paid
in
a
closing
transaction
is
also
treated
as
realized
gain
or
loss
on
the
accompanying
Statement
of
Operations.
In
return
for
a
premium
paid,
currency
options
give
the
holder
the
right,
but
not
the
obligation,
to
buy
and
sell
currency
at
a
specified
exchange
rate;
although
certain
currency
options
may
be
settled
by
exchanging
only
the
net
gain
or
loss
on
the
contract.
In
return
for
a
premium
paid,
call
and
put
options
on
futures
give
the
holder
the
right,
but
not
the
obligation,
to
purchase
or
sell,
respectively,
a
position
in
a
particular
futures
contract
at
a
specified
exercise
price. Risks related
to
the
use
of
options
include
possible
illiquidity
of
the
options
markets;
trading
restrictions
imposed
by
an
exchange
or
counterparty;
possible
failure
of
counterparties
to
meet
the
terms
of
the
agreements;
movements
in
the
underlying
asset
values,
interest
rates
and
currency
values;
and,
for
options
written,
the
potential
for
losses
to
exceed
any
premium
received
by
the
fund.
During
the
year ended
December
31,
2024,
the
volume
of
the
fund’s
activity
in
options,
based
on
underlying
notional
amounts,
was
generally
between
2%
and
16%
of
net
assets.
T.
ROWE
PRICE
Emerging
Markets
Local
Currency
Bond
Fund
Swaps
The
fund
is
subject
to
interest
rate
risk,
credit
risk
and
inflation
risk in
the
normal
course
of
pursuing
its
investment
objectives
and
uses
swap
contracts
to
help
manage
such
risks.
The
fund
may
use
swaps
in
an
effort
to
manage
both
long
and
short
exposure
to
changes
in
interest
rates,
inflation
rates,
and
credit
quality;
to
adjust
overall
exposure
to
certain
markets;
to
enhance
total
return
or
protect
the
value
of
portfolio
securities;
to
serve
as
a
cash
management
tool;
or
to
adjust
portfolio
duration
and
credit
exposure.
Swap
agreements
can
be
settled
either
directly
with
the
counterparty
(bilateral
swap)
or
through
a
central
clearinghouse
(centrally
cleared
swap).
Fluctuations
in
the
fair
value
of
a
contract
are
reflected
in
unrealized
gain
or
loss
and
are
reclassified
to
realized
gain
or
loss
on
the
accompanying
Statement
of
Operations upon
contract
termination
or
cash
settlement.
Net
periodic
receipts
or
payments
required
by
a
contract
increase
or
decrease,
respectively,
the
value
of
the
contract
until
the
contractual
payment
date,
at
which
time
such
amounts
are
reclassified
from
unrealized
to
realized
gain
or
loss
on
the
accompanying
Statement
of
Operations.
For
bilateral
swaps,
cash
payments
are
made
or
received
by
the
fund
on
a
periodic
basis
in
accordance
with
contract
terms;
unrealized
gain
on
contracts
and
premiums
paid
are
reflected
as
assets
and
unrealized
loss
on
contracts
and
premiums
received
are
reflected
as
liabilities
on
the
accompanying
Statement
of
Assets
and
Liabilities.
For
bilateral
swaps,
premiums
paid
or
received
are
amortized
over
the
life
of
the
swap
and
are
recognized
as
realized
gain
or
loss
on
the
accompanying
Statement
of
Operations.
For
centrally
cleared
swaps,
payments
are
made
or
received
by
the
fund
each
day
to
settle
the
daily
fluctuation
in
the
value
of
the
contract
(variation
margin).
Accordingly,
the
value
of
a
centrally
cleared
swap
included
in
net
assets
is
the
unsettled
variation
margin;
net
variation
margin
receivable
is
reflected
as
an
asset
and
net
variation
margin
payable
is
reflected
as
a
liability
on
the
accompanying
Statement
of
Assets
and
Liabilities.
Interest
rate
swaps
are
agreements
to
exchange
cash
flows
based
on
the
difference
between
specified
interest
rates
applied
to
a
notional
principal
amount
for
a
specified
period
of
time.
Risks
related
to
the
use
of
interest
rate
swaps
include
the
potential
for
unanticipated
movements
in
interest
or
currency
rates,
the
possible
failure
of
a
counterparty
to
perform
in
accordance
with
the
terms
of
the
swap
agreements,
potential
government
regulation
that
could
adversely
affect
the
fund’s
swap
investments,
and
potential
losses
in
excess
of
the
fund’s
initial
investment.
Credit
default
swaps
are
agreements
where
one
party
(the
protection
buyer)
agrees
to
make
periodic
payments
to
another
party
(the
protection
seller)
in
exchange
for
protection
against
specified
credit
events,
such
as
certain
defaults
T.
ROWE
PRICE
Emerging
Markets
Local
Currency
Bond
Fund
and
bankruptcies
related
to
an
underlying
credit
instrument,
or
issuer
or
index
of
such
instruments.
Upon
occurrence
of
a
specified
credit
event,
the
protection
seller
is
required
to
pay
the
buyer
the
difference
between
the
notional
amount
of
the
swap
and
the
value
of
the
underlying
credit,
either
in
the
form
of
a
net
cash
settlement
or
by
paying
the
gross
notional
amount
and
accepting
delivery
of
the
relevant
underlying
credit.
For
credit
default
swaps
where
the
underlying
credit
is
an
index,
a
specified
credit
event
may
affect
all
or
individual
underlying
securities
included
in
the
index
and
will
be
settled
based
upon
the
relative
weighting
of
the
affected
underlying
security(ies)
within
the
index. Risks
related
to
the
use
of
credit
default
swaps
include
the
possible
inability
of
the
fund
to
accurately
assess
the
current
and
future
creditworthiness
of
underlying
issuers,
the
possible
failure
of
a
counterparty
to
perform
in
accordance
with
the
terms
of
the
swap
agreements,
potential
government
regulation
that
could
adversely
affect
the
fund’s
swap
investments,
and
potential
losses
in
excess
of
the
fund’s
initial
investment.
Zero-coupon
inflation
swaps
are
agreements
to
exchange
cash
flows,
on
the
contract’s
maturity
date,
based
on
the
difference
between
a
predetermined
fixed
rate
and
the
cumulative
change
in
the
consumer
price
index,
both
applied
to
a
notional
principal
amount
for
a
specified
period
of
time.
Risks
related
to
the
use
of
zero-coupon
inflation
swaps
include
the
potential
for
unanticipated
movements
in
inflation
rates,
the
possible
failure
of
a
counterparty
to
perform
in
accordance
with
the
terms
of
the
swap
agreements,
potential
government
regulation
that
could
adversely
affect
the
fund’s
swap
investments,
and
potential
losses
in
excess
of
the
fund’s
initial
investment.
During
the
year ended
December
31,
2024,
the
volume
of
the
fund’s
activity
in
swaps,
based
on
underlying
notional
amounts,
was
generally
between
15%
and
29%
of
net
assets.
NOTE
4
-
OTHER
INVESTMENT
TRANSACTIONS
Consistent
with
its
investment
objective, the
fund
engages
in
the
following
practices
to
manage
exposure
to
certain
risks
and/or
to
enhance
performance.
The
investment
objective,
policies,
program,
and
risk
factors
of the
fund
are
described
more
fully
in the
fund’s prospectus
and
Statement
of
Additional
Information.
Emerging
and
Frontier
Markets
The fund
invests,
either
directly
or
through
investments
in
other
T.
Rowe
Price
funds,
in
securities
of
companies
located
in,
issued
by
governments
of,
or
denominated
in
or
linked
to
the
currencies
of
T.
ROWE
PRICE
Emerging
Markets
Local
Currency
Bond
Fund
emerging
and
frontier
market
countries.
Emerging
markets,
and
to
a
greater
extent
frontier
markets, tend
to
have
economic
structures
that
are
less
diverse
and
mature,
less
developed
legal
and
regulatory
regimes,
and
political
systems
that
are
less
stable,
than
those
of
developed
countries.
These
markets
may
be
subject
to
greater
political,
economic,
and
social
uncertainty
and
differing
accounting
standards
and
regulatory
environments
that
may
potentially
impact
the
fund’s
ability
to
buy
or
sell
certain
securities
or
repatriate
proceeds
to
U.S.
dollars.
Emerging
markets
securities
exchanges
are
more
likely
to
experience
delays
with
the
clearing
and
settling
of
trades,
as
well
as
the
custody
of
holdings
by
local
banks,
agents,
and
depositories.
Such
securities
are
often
subject
to
greater
price
volatility,
less
liquidity,
and
higher
rates
of
inflation
than
U.S.
securities.
Investing
in
frontier
markets
is
typically
significantly
riskier
than
investing
in
other
countries,
including
emerging
markets.
Noninvestment-Grade
Debt
The
fund
invests,
either
directly
or
through
its
investment
in
other
T.
Rowe
Price
funds,
in
noninvestment-grade
debt,
including
“high
yield”
or
“junk”
bonds
or
leveraged
loans.
Noninvestment-grade
debt
issuers
are
more
likely
to
suffer
an
adverse
change
in
financial
condition
that
would
result
in
the
inability
to
meet
a
financial
obligation.
The
noninvestment-
grade
debt
market
may
experience
sudden
and
sharp
price
swings
due
to
a
variety
of
factors
that
may
decrease
the
ability
of
issuers
to
make
principal
and
interest
payments
and
adversely
affect
the
liquidity
or
value,
or
both,
of
such
securities.
Accordingly,
securities
issued
by
such
companies
carry
a
higher
risk
of
default
and
should
be
considered
speculative.
Restricted
Securities
The
fund
invests
in
securities
that
are
subject
to
legal
or
contractual
restrictions
on
resale.
Prompt
sale
of
such
securities
at
an
acceptable
price
may
be
difficult
and
may
involve
substantial
delays
and
additional
costs.
Other
Purchases
and
sales
of
portfolio
securities
other
than
in-kind
transactions,
if
any, short-term
and
U.S.
government securities
aggregated $207,502,000 and
$220,823,000,
respectively,
for
the
year ended
December
31,
2024.
T.
ROWE
PRICE
Emerging
Markets
Local
Currency
Bond
Fund
NOTE
5
-
FEDERAL
INCOME
TAXES
Generally,
no
provision
for
federal
income
taxes
is
required
since
the
fund
intends
to continue
to
qualify
as
a
regulated
investment
company
under
Subchapter
M
of
the
Internal
Revenue
Code
and
distribute
to
shareholders
all
of
its taxable
income
and
gains.
Distributions
determined
in
accordance
with
federal
income
tax
regulations
may
differ
in
amount
or
character
from
net
investment
income
and
realized
gains
for
financial
reporting
purposes.
The
fund
files
U.S.
federal,
state,
and
local
tax
returns
as
required.
The
fund’s
tax
returns
are
subject
to
examination
by
the
relevant
tax
authorities
until
expiration
of
the
applicable
statute
of
limitations,
which
is
generally
three
years
after
the
filing
of
the
tax
return
but
which
can
be
extended
to
six
years
in
certain
circumstances.
Tax
returns
for
open
years
have
incorporated
no
uncertain
tax
positions
that
require
a
provision
for
income
taxes.
Capital
accounts
within
the
financial
reporting
records
are
adjusted
for
permanent
book/tax
differences
to
reflect
tax
character
but
are
not
adjusted
for
temporary
differences.
The
permanent
book/tax
adjustments,
if
any,
have
no
impact
on
results
of
operations
or
net
assets.
The
permanent
book/tax
adjustments
relate
primarily
to
the
character
of
net
currency
gains
or
losses
and
the
character
of
income
on
swaps.
The
tax
character
of
distributions
paid
for
the
periods
presented
was
as
follows:
($000s)
December
31,
2024
December
31,
2023
Ordinary
income
(including
short-term
capital
gains,
if
any)
$
10,618
$
20,118
Return
of
capital
10,110
4,335
Total
distributions
$
20,728
$
24,453
T.
ROWE
PRICE
Emerging
Markets
Local
Currency
Bond
Fund
At
December
31,
2024,
the
tax-basis
cost
of
investments
(including
derivatives,
if
any)
and
gross
unrealized
appreciation
and
depreciation
were as
follows:
At
December
31,
2024,
the
tax-basis
components
of
accumulated
net
earnings
(loss)
were
as
follows:
Temporary
differences
between
book-basis
and
tax-basis
components
of
total
distributable
earnings
(loss)
arise
when
certain
items
of
income,
gain,
or
loss
are
recognized
in
different
periods
for
financial
statement
purposes
versus
for
tax
purposes;
these
differences
will
reverse
in
a
subsequent
reporting
period.
The
temporary
differences
relate
primarily
to
the
deferral
of
losses
from
wash
sales
and
the
realization
of
gains/losses
on
certain
open
derivative
contracts.
The
loss
carryforwards
and
deferrals
primarily
relate
to
capital
loss
carryforwards,
late-
year
ordinary
loss
deferrals
and
straddle
deferrals.
Capital
loss
carryforwards
are
available
indefinitely
to
offset
future
realized
capital
gains.
The
fund
has
elected
to
defer
certain
losses
to
the
first
day
of
the
following
fiscal
year
for
late-year
ordinary
loss
deferrals.
Other
temporary
differences
relate
primarily
to
differences
in
the
treatment
of
hyperinflationary
currencies.
NOTE
6
-
FOREIGN TAXES
The
fund
is
subject
to
foreign
income
taxes
imposed
by
certain
countries
in
which
it
invests.
Additionally,
capital
gains
realized
upon
disposition
of
securities
issued
in
or
by
certain
foreign
countries
are
subject
to
capital
gains
tax
imposed
by
those
countries.
All
taxes
are
computed
in
accordance
with
the
applicable
foreign
tax
law,
and,
to
the
extent
permitted,
capital
losses
are
used
to
offset
($000s)
Cost
of
investments
$
306,868
Unrealized
appreciation
$
8,867
Unrealized
depreciation
(29,928)
Net
unrealized
appreciation
(depreciation)
$
(21,061)
($000s)
Overdistributed
ordinary
income
$
(1,666)
Net
unrealized
appreciation
(depreciation)
(21,061)
Loss
carryforwards
and
deferrals
(52,771)
Total
distributable
earnings
(loss)
$
(75,498)
T.
ROWE
PRICE
Emerging
Markets
Local
Currency
Bond
Fund
capital
gains.
Taxes
attributable
to
income
are
accrued
by
the
fund
as
a
reduction
of
income.
Current
and
deferred
tax
expense
attributable
to
capital
gains
is
reflected
as
a
component
of
realized
or
change
in
unrealized
gain/
loss
on
securities
in
the
accompanying
financial
statements.
To
the
extent
that
the
fund
has
country
specific
capital
loss
carryforwards,
such
carryforwards
are
applied
against
net
unrealized
gains
when
determining
the
deferred
tax
liability.
Any
deferred
tax
liability
incurred
by
the
fund
is
included
in
either
Other
liabilities
or
Deferred
tax
liability
on
the
accompanying
Statement
of
Assets
and
Liabilities.
NOTE
7
-
RELATED
PARTY
TRANSACTIONS
The
fund
is
managed
by
T.
Rowe
Price
Associates,
Inc.
(Price
Associates),
a
wholly
owned
subsidiary
of
T.
Rowe
Price
Group,
Inc.
(Price
Group). Price
Associates
has
entered
into
a
sub-advisory
agreement(s)
with
one
or
more
of
its
wholly
owned
subsidiaries,
to
provide
investment
advisory
services
to
the
fund.
The
investment
management
agreement
between
the
fund
and
Price
Associates
provides
for
an
annual
investment
management
fee,
which
is
computed
daily
and
paid
monthly. The
fee
consists
of
an
individual
fund
fee,
equal
to
0.36%
of
the
fund’s
average
daily
net
assets,
and
a
group
fee.
The
group
fee
rate
is
calculated
based
on
the
combined
net
assets
of
certain
mutual
funds
sponsored
by
Price
Associates
(the
group)
applied
to
a
graduated
fee
schedule,
with
rates
ranging
from
0.48%
for
the
first
$1
billion
of
assets
to
0.260%
for
assets
in
excess
of
$845
billion.
The
fund’s
group
fee
is
determined
by
applying
the
group
fee
rate
to
the
fund’s
average
daily
net
assets. At
December
31,
2024,
the
effective
annual
group
fee
rate
was
0.28%.
The Investor
Class and Advisor
Class are
each
subject
to
a
contractual
expense
limitation
through
the
expense
limitation
dates
indicated
in
the
table
below.
This
agreement
will
continue
through
the
expense
limitation
dates
indicated
in
the
table
below,
and
may
be
renewed,
revised,
or
revoked
only
with
approval
of
the
fund’s
Board.
During
the
limitation
period,
Price
Associates
is required
to
waive
or
pay
any
expenses
(excluding
interest;
expenses
related
to
borrowings,
taxes,
and
brokerage;
non-recurring,
extraordinary
expenses;
and
acquired
fund
fees
and
expenses)
that
would
otherwise
cause
the class’s ratio
of
annualized
total
expenses
to
average
net
assets
(net
expense
ratio)
to
exceed
its
expense
limitation.
Each
class
is
required
to
repay
Price
Associates
for
expenses
previously
waived/paid
to
the
extent
the
class’s net
assets
grow
or
expenses
decline
sufficiently
to
allow
repayment
without
causing
the class’s net
expense
ratio
(after
the
repayment
is
taken
into
account)
to
exceed
the
lesser
of:
(1)
T.
ROWE
PRICE
Emerging
Markets
Local
Currency
Bond
Fund
the
expense
limitation
in
place
at
the
time
such
amounts
were
waived;
or
(2)
the class’s
current
expense
limitation.
However,
no
repayment
will
be
made
more
than
three
years
after
the
date
of
a
payment
or
waiver.
The
I
Class
is
also
subject
to
an
operating
expense
limitation
(I
Class
Limit)
pursuant
to
which
Price
Associates
is
contractually
required
to
pay
all
operating
expenses
of
the
I
Class,
excluding
management
fees;
interest;
expenses
related
to
borrowings,
taxes,
and
brokerage; non-recurring,
extraordinary expenses; and
acquired
fund
fees
and
expenses, to
the
extent
such
operating
expenses,
on
an
annualized
basis,
exceed
the
I
Class
Limit. This
agreement
will
continue
through
the
expense
limitation
date
indicated
in
the
table
below,
and
may
be
renewed,
revised,
or
revoked
only
with
approval
of
the
fund’s
Board.
The
I
Class
is
required
to
repay
Price
Associates
for
expenses
previously
paid
to
the
extent
the
class’s
net
assets
grow
or
expenses
decline
sufficiently
to
allow
repayment
without
causing
the
class’s
operating
expenses
(after
the
repayment
is
taken
into
account)
to
exceed
the
lesser
of:
(1)
the
I
Class
Limit
in
place
at
the
time
such
amounts
were
paid;
or
(2)
the
current
I
Class
Limit.
However,
no
repayment
will
be
made
more
than
three
years
after
the
date
of
a
payment
or
waiver.
The
Z
Class
is
also
subject
to
a
contractual
expense
limitation
agreement
whereby
Price
Associates
has
agreed
to
waive
and/or
bear
all
of
the
Z
Class’
expenses
(excluding
interest;
expenses
related
to
borrowings,
taxes,
and
brokerage;
non-recurring,
extraordinary
expenses;
and
acquired
fund
fees
and
expenses)
in
their
entirety.
This
fee
waiver
and/or
expense
reimbursement
arrangement
is
expected
to
remain
in
place
indefinitely,
and
the
agreement
may
only
be
amended
or
terminated
with
approval
by
the
fund’s
Board.
Expenses
of
the
fund
waived/paid
by
the
manager
are
not
subject
to
later
repayment
by
the
fund.
T.
ROWE
PRICE
Emerging
Markets
Local
Currency
Bond
Fund
Pursuant
to
these
agreements,
expenses
were waived/paid
by
and/or
repaid
to
Price
Associates
during
the year
ended December
31,
2024 as
indicated
in
the
table
below.
Including
these
amounts,
expenses
previously
waived/paid
by
Price
Associates
in
the
amount
of $236,000 remain
subject
to
repayment
by
the
fund
at
December
31,
2024. Any
repayment
of
expenses
previously
waived/paid
by
Price
Associates
during
the
period
would
be
included
in
the
net
investment
income
and
expense
ratios
presented
on
the
accompanying
Financial
Highlights.
In
addition,
the
fund
has
entered
into
service
agreements
with
Price
Associates
and
two
wholly
owned
subsidiaries
of
Price
Associates,
each
an
affiliate
of
the
fund
(collectively,
Price).
Price
Associates
provides
certain
accounting
and
administrative
services
to
the
fund.
T.
Rowe
Price
Services,
Inc.
provides
shareholder
and
administrative
services
in
its
capacity
as
the
fund’s
transfer
and
dividend-disbursing
agent.
T.
Rowe
Price
Retirement
Plan
Services,
Inc.
provides
subaccounting
and
recordkeeping
services
for
certain
retirement
accounts
invested
in
the
Investor
Class
and
Advisor
Class.
For
the
year
ended
December
31,
2024,
expenses
incurred
pursuant
to
these
service
agreements
were
$122,000
for
Price
Associates;
$46,000
for
T.
Rowe
Price
Services,
Inc.;
and
less
than
$1,000
for
T.
Rowe
Price
Retirement
Plan
Services,
Inc.
All
amounts
due
to
and
due
from
Price,
exclusive
of
investment
management
fees
payable,
are
presented
net
on
the
accompanying
Statement
of
Assets
and
Liabilities.
T.
Rowe
Price
Investment
Services,
Inc.
(Investment
Services)
serves
as
distributor
to
the
fund.
Pursuant
to
an
underwriting
agreement,
no
compensation
for
any
distribution
services
provided
is
paid
to
Investment
Services
by
the
fund
(except
for
12b-1
fees
under
a
Board-approved
Rule
12b-1
plan).
Mutual
funds,
trusts,
and
other
accounts
managed
by
Price
Associates
or
its
affiliates
(collectively,
Price
Funds
and
accounts)
may
invest
in
the
fund.
No
Price
fund
or
account
may
invest
for
the
purpose
of
exercising
management
Investor
Class
Advisor
Class
I
Class
Z
Class
Expense
limitation/I
Class
Limit
1.02%
1.10%
0.05%
0.00%
Expense
limitation
date
04/30/26
04/30/26
04/30/26
N/A
(Waived)/repaid
during
the
period
($000s)
$(11)
$(1)
$(91)
$(1,472)
T.
ROWE
PRICE
Emerging
Markets
Local
Currency
Bond
Fund
or
control
over
the
fund.
At
December
31,
2024, approximately
18%
of
the
I
Class's
and
100%
of
the
Z
Class's
outstanding
shares
were
held
by
Price
Funds
and
accounts.
The fund
may
invest
its
cash
reserves
in
certain
open-end
management
investment
companies
managed
by
Price
Associates
and
considered
affiliates
of
the
fund:
the
T.
Rowe
Price
Government
Reserve
Fund
or
the
T.
Rowe
Price
Treasury
Reserve
Fund,
organized
as
money
market
funds
(together,
the
Price
Reserve
Funds).
The
Price
Reserve
Funds
are
offered
as
short-term
investment
options
to
mutual
funds,
trusts,
and
other
accounts
managed
by
Price
Associates
or
its
affiliates
and
are
not
available
for
direct
purchase
by
members
of
the
public.
Cash
collateral
from
securities
lending,
if
any,
is
invested
in
the
T.
Rowe
Price
Government
Reserve Fund. The
Price
Reserve
Funds
pay
no
investment
management
fees.
As
of
December
31,
2024,
T.
Rowe
Price
Group,
Inc.,
or
its
wholly
owned
subsidiaries,
owned
216
shares
of
the
Advisor
Class,
representing
29%
of
the
Advisor
Class's
net
assets.
The fund may
participate
in
securities
purchase
and
sale
transactions
with
other
funds
or
accounts
advised
by
Price
Associates
(cross
trades),
in
accordance
with
procedures
adopted
by the
fund’s
Board
and
Securities
and
Exchange
Commission
rules,
which
require,
among
other
things,
that
such
purchase
and
sale
cross
trades
be
effected
at
the
independent
current
market
price
of
the
security.
During
the
year
ended
December
31,
2024,
the
fund
had
no
purchases
or
sales
cross
trades
with
other
funds
or
accounts
advised
by
Price
Associates.
NOTE
8
-
SEGMENT
REPORTING
Operating
segments
are
defined
as
components
of
a
company
that
engage
in
business
activities
and
for
which
discrete
financial
information
is
available
and
regularly
reviewed
by
the
chief
operating
decision
maker
(CODM)
in
deciding
how
to
allocate
resources
and
assess
performance.
The
Management
Committee
of
Price
Associates
acts
as
the
fund’s
CODM.
The
fund
makes
investments
in
accordance
with
its
investment
objective
as
outlined
in
the
Prospectus
and
is
considered
one
reportable
segment
because
the
CODM
allocates
resources
and
assesses
the
operating
results
of
the
fund
on
the
whole.
T.
ROWE
PRICE
Emerging
Markets
Local
Currency
Bond
Fund
The
fund’s
revenue
is
derived
from
investments
in
portfolio
of
securities.
The
CODM
allocates
resources
and
assesses
performance
based
on
the
operating
results
of
the
fund,
which
is
consistent
with
the
results
presented
in
the
statement
of
operations,
statement
of
changes
in
net
assets
and
financial
highlights.
The
CODM
compares
the
fund’s
performance
to
its
benchmark
index
and
evaluates
the
positioning
of
the
fund
in
relation
to
its
investment
objective.
The
measure
of
segment
assets
is
net
assets
of
the
fund
which
is
disclosed
in
the
statement
of
assets
and
liabilities.
The
accounting
policies
of
the
segment
are
the
same
as
those
described
in
the
summary
of
significant
accounting
policies.
The
financial
statements
include
all
details
of
the
segment
assets,
segment
revenue
and
expenses;
and
reflect
the
financial
results
of
the
segment.
NOTE
9
-
OTHER
MATTERS
Unpredictable environmental,
political,
social
and
economic
events,
including
but
not
limited
to,
environmental
or
natural
disasters,
war
and
conflict
(including
Russia’s
military
invasion
of
Ukraine
and
the
conflict
in
Israel,
Gaza
and
surrounding
areas),
terrorism,
geopolitical
developments
(including
trading
and
tariff
arrangements,
sanctions
and
cybersecurity
attacks),
and
public
health
epidemics
(including
the
global
outbreak
of
COVID-19)
and
similar
public
health
threats,
may
significantly
affect
the
economy
and
the
markets
and
issuers
in
which
a
fund
invests.
The
extent
and
duration
of
such
events
and
resulting
market
disruptions
cannot
be
predicted.
These
and
other
similar
events
may
cause
instability
across
global
markets,
including
reduced
liquidity
and
disruptions
in
trading
markets,
while
some
events
may
affect
certain
geographic
regions,
countries,
sectors,
and
industries
more
significantly
than
others,
and
exacerbate
other
pre-existing
political,
social,
and
economic
risks.
The
fund’s
performance
could
be
negatively
impacted
if
the
value
of
a
portfolio
holding
were
harmed
by
these
or
such
events.
Management
actively
monitors
the
risks
and
financial
impacts
arising
from
such
events.
T.
ROWE
PRICE
Emerging
Markets
Local
Currency
Bond
Fund
REPORT
OF
INDEPENDENT
REGISTERED
PUBLIC
ACCOUNTING
FIRM
To
the
Board
of
Directors
of
T.
Rowe
Price
International
Funds,
Inc.
and
Shareholders
of
T.
Rowe
Price
Emerging
Markets
Local
Currency
Bond
Fund
Opinion
on
the
Financial
Statements
We
have
audited
the
accompanying
statement
of
assets
and
liabilities,
including
the
portfolio
of
investments,
of
T.
Rowe
Price
Emerging
Markets
Local
Currency
Bond
Fund
(one
of
the
funds
constituting
T.
Rowe
Price
International
Funds,
Inc.,
referred
to
hereafter
as
the
"Fund")
as
of
December
31,
2024,
the
related
statement
of
operations
for
the
year
ended
December
31,
2024,
the
statement
of
changes
in
net
assets
for
each
of
the
two
years
in
the
period
ended
December
31,
2024,
including
the
related
notes,
and
the
financial
highlights
for
each
of
the
periods
indicated
therein
(collectively
referred
to
as
the
“financial
statements”).
In
our
opinion,
the
financial
statements
present
fairly,
in
all
material
respects,
the
financial
position
of
the
Fund
as
of
December
31,
2024,
the
results
of
its
operations
for
the
year
then
ended,
the
changes
in
its
net
assets
for
each
of
the
two
years
in
the
period
ended
December
31,
2024
and
the
financial
highlights
for
each
of
the
periods
indicated
therein,
in
conformity
with
accounting
principles
generally
accepted
in
the
United
States
of
America.
Basis
for
Opinion
These
financial
statements
are
the
responsibility
of
the
Fund’s
management.
Our
responsibility
is
to
express
an
opinion
on
the
Fund’s
financial
statements
based
on
our
audits.
We
are
a
public
accounting
firm
registered
with
the
Public
Company
Accounting
Oversight
Board
(United
States)
(PCAOB)
and
are
required
to
be
independent
with
respect
to
the
Fund
in
accordance
with
the
U.S.
federal
securities
laws
and
the
applicable
rules
and
regulations
of
the
Securities
and
Exchange
Commission
and
the
PCAOB.
We
conducted
our
audits
of
these
financial
statements
in
accordance
with
the
standards
of
the
PCAOB.
Those
standards
require
that
we
plan
and
perform
the
audit
to
obtain
reasonable
assurance
about
whether
the
financial
statements
are
free
of
material
misstatement,
whether
due
to
error
or
fraud.
T.
ROWE
PRICE
Emerging
Markets
Local
Currency
Bond
Fund
Our
audits
included
performing
procedures
to
assess
the
risks
of
material
misstatement
of
the
financial
statements,
whether
due
to
error
or
fraud,
and
performing
procedures
that
respond
to
those
risks.
Such
procedures
included
examining,
on
a
test
basis,
evidence
regarding
the
amounts
and
disclosures
in
the
financial
statements.
Our
audits
also
included
evaluating
the
accounting
principles
used
and
significant
estimates
made
by
management,
as
well
as
evaluating
the
overall
presentation
of
the
financial
statements.
Our
procedures
included
confirmation
of
securities
owned
as
of
December
31,
2024
by
correspondence
with
the
custodians,
transfer
agent
and
brokers;
when
replies
were
not
received
from
brokers,
we
performed
other
auditing
procedures.
We
believe
that
our
audits
provide
a
reasonable
basis
for
our
opinion.
/s/
PricewaterhouseCoopers
LLP
Baltimore,
Maryland
February
18,
2025
We
have
served
as
the
auditor
of
one
or
more
investment
companies
in
the
T.
Rowe
Price
group
of
investment
companies
since
1973.
REPORT
OF
INDEPENDENT
REGISTERED
PUBLIC
ACCOUNTING
FIRM
(continued)
T.
ROWE
PRICE
Emerging
Markets
Local
Currency
Bond
Fund
TAX
INFORMATION
(UNAUDITED)
FOR
THE
TAX
YEAR
ENDED 12/31/24
We
are
providing
this
information
as
required
by
the
Internal
Revenue
Code.
The
amounts
shown
may
differ
from
those
elsewhere
in
this
report
because
of
differences
between
tax
and
financial
reporting
requirements.
For
shareholders
subject
to
interest
expense
deduction
limitation
under
Section
163(j),
$19,679,000
of
the
fund’s
income
qualifies
as
a
Section
163(j)
interest
dividend
and
can
be
treated
as
interest
income
for
purposes
of
Section
163(j),
subject
to
holding
period
requirements
and
other
limitations.
100
East
Pratt
Street
Baltimore,
MD
21202
T.
Rowe
Price
Investment
Services,
Inc.
Call
1-800-225-5132
to
request
a
prospectus
or
summary
prospectus;
each
includes
investment
objectives,
risks,
fees,
expenses,
and
other
information
that
you
should
read
and
consider
carefully
before
investing.
F192-050
2/25
Item 8. Changes in and Disagreements with Accountants for Open-End Management Investment Companies.
Not applicable.
Item 9. Proxy Disclosures for Open-End Management Investment Companies.
Not applicable.
Item 10. Remuneration Paid to Directors, Officers, and Others of Open-End Management Investment Companies.
Remuneration paid to Directors is included in Item 7 of this Form N-CSR.
Item 11. Statement Regarding Basis for Approval of Investment Advisory Contract.
If applicable, see Item 7.
Item 12. Disclosure of Proxy Voting Policies and Procedures for Closed-End Management Investment Companies.
Not applicable.
Item 13. Portfolio Managers of Closed-End Management Investment Companies.
Not applicable.
Item 14. Purchases of Equity Securities by Closed-End Management Investment Company and Affiliated Purchasers.
Not applicable.
Item 15. Submission of Matters to a Vote of Security Holders.
There has been no change to the procedures by which shareholders may recommend nominees to the registrant’s board of directors.
Item 16. Controls and Procedures.
(a) The registrant’s principal executive officer and principal financial officer have evaluated the registrant’s disclosure controls and procedures within 90 days of this filing and have concluded that the registrant’s disclosure controls and procedures were effective, as of that date, in ensuring that information required to be disclosed by the registrant in this Form N-CSR was recorded, processed, summarized, and reported timely.
(b) The registrant’s principal executive officer and principal financial officer are aware of no change in the registrant’s internal control over financial reporting that occurred during the period covered by this report that has materially affected, or is reasonably likely to materially affect, the registrant’s internal control over financial reporting.
Item 17. Disclosure of Securities Lending Activities for Closed-End Management Investment Companies.
Not applicable.
Item 18. Recovery of Erroneously Awarded Compensation.
Not applicable.
Item 19. Exhibits.
SIGNATURES
Pursuant to the requirements of the Securities Exchange Act of 1934 and the Investment Company Act of 1940, the registrant has duly caused this report to be signed on its behalf by the undersigned, thereunto duly authorized.
| | | | |
| T. Rowe Price International Funds, Inc. |
| | |
| By | | /s/ David Oestreicher | | |
| | David Oestreicher | | |
| | Principal Executive Officer | | |
| | |
| Date | | February 18, 2025 | | |
Pursuant to the requirements of the Securities Exchange Act of 1934 and the Investment Company Act of 1940, this report has been signed below by the following persons on behalf of the registrant and in the capacities and on the dates indicated.
| | | | |
| By | | /s/ David Oestreicher | | |
| | David Oestreicher | | |
| | Principal Executive Officer | | |
| | |
| Date | | February 18, 2025 | | |
| | | | |
| By | | /s/ Alan S. Dupski | | |
| | Alan S. Dupski | | |
| | Principal Financial Officer | | |
| | |
| Date | | February 18, 2025 | | |