UNITED STATES
SECURITIES AND EXCHANGE COMMISSION
Washington, D.C. 20549
FORM N-CSR
CERTIFIED SHAREHOLDER REPORT OF REGISTERED
MANAGEMENT INVESTMENT COMPANIES
Investment Company Act File Number: 811-02958
T. Rowe Price International Funds, Inc.
(Exact name of registrant as specified in charter)
100 East Pratt Street, Baltimore, MD 21202
(Address of principal executive offices)
David Oestreicher
100 East Pratt Street, Baltimore, MD 21202
(Name and address of agent for service)
Registrant’s telephone number, including area code: (410) 345-2000
Date of fiscal year end: December 31
Date of reporting period: December 31, 2024
Item 1. Reports to Shareholders
(a) Report pursuant to Rule 30e-1
Annual Shareholder Report
December 31, 2024
International Bond Fund (USD Hedged)
This annual shareholder report contains important information about International Bond Fund (USD Hedged) (the "fund") for the period of January 1, 2024 to December 31, 2024. You can find the fund’s prospectus, financial information on Form N‑CSR (which includes required tax information for dividends), holdings, proxy voting information, and other information atwww.troweprice.com/prospectus. You can also request this information without charge by contacting T. Rowe Price at 1‑800‑638‑5660 or info@troweprice.com or contacting your intermediary.
What were the fund costs for the last year? (based on a hypothetical $10,000 investment)
| | Costs of a $10,000 investment | Costs paid as a percentage of a $10,000 investment |
|---|
| International Bond Fund (USD Hedged) - Investor Class | $80 | 0.79% |
|---|
What drove fund performance during the past 12 months?
Global fixed income markets fell over the 12-month reporting period due to weaker currencies versus the dollar and rising bond yields at the end of the period, despite many central banks easing monetary policy.
The fund benefited from its exposure to euro-denominated government-related bonds and corporate credit relative to the Bloomberg Global Aggregate ex USD Bond (USD Hedged) Index. Additionally, the fund’s short currency exposure in the Chinese yuan and Taiwanese dollar, relative to the benchmark, added value amid U.S. dollar strength during the reporting period.
Against the USD hedged index, an underweighting duration in China dragged on performance as local yields fell over the reporting period, with China’s central bank maintaining mostly stimulative monetary policy. Long exposure in the Brazilian real detracted as the country suffered amid investor concerns over the government's spending plans and wide budget deficit.
The fund seeks to provide current income and capital appreciation primarily through a focus on non-U.S. dollar-denominated bonds. During the period, the fund shifted to a long position in the U.S. dollar due to the anticipation of near-term dollar strength.
The fund held material exposure to derivatives, including currency, interest rate, and credit derivatives. The fund’s derivatives exposure to currency forwards had a positive impact on absolute performance.
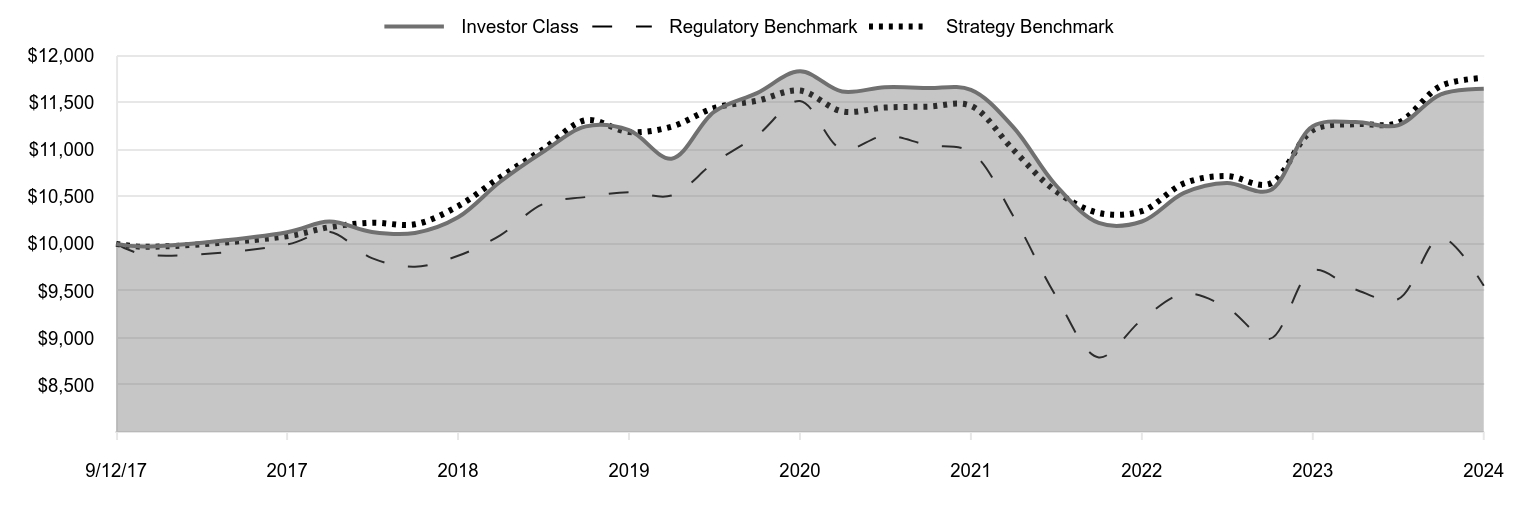
How has the fund performed?
Cumulative Returns of a Hypothetical $10,000 Investment as of December 31, 2024
| Investor Class | Regulatory Benchmark | Strategy Benchmark |
|---|
| 9/12/17 | 10,000 | 10,000 | 10,000 |
|---|
| 9/30/17 | 9,972 | 9,887 | 9,969 |
|---|
| 12/31/17 | 10,124 | 9,993 | 10,082 |
|---|
| 3/31/18 | 10,237 | 10,129 | 10,177 |
|---|
| 6/30/18 | 10,126 | 9,848 | 10,225 |
|---|
| 9/30/18 | 10,116 | 9,757 | 10,208 |
|---|
| 12/31/18 | 10,282 | 9,873 | 10,402 |
|---|
| 3/31/19 | 10,660 | 10,091 | 10,709 |
|---|
| 6/30/19 | 10,976 | 10,423 | 11,003 |
|---|
| 9/30/19 | 11,249 | 10,498 | 11,315 |
|---|
| 12/31/19 | 11,208 | 10,549 | 11,189 |
|---|
| 3/31/20 | 10,905 | 10,514 | 11,246 |
|---|
| 6/30/20 | 11,404 | 10,863 | 11,444 |
|---|
| 9/30/20 | 11,603 | 11,152 | 11,521 |
|---|
| 12/31/20 | 11,834 | 11,519 | 11,630 |
|---|
| 3/31/21 | 11,620 | 11,005 | 11,409 |
|---|
| 6/30/21 | 11,665 | 11,149 | 11,449 |
|---|
| 9/30/21 | 11,657 | 11,051 | 11,459 |
|---|
| 12/31/21 | 11,638 | 10,977 | 11,467 |
|---|
| 3/31/22 | 11,244 | 10,300 | 11,003 |
|---|
| 6/30/22 | 10,626 | 9,449 | 10,562 |
|---|
| 9/30/22 | 10,222 | 8,793 | 10,329 |
|---|
| 12/31/22 | 10,238 | 9,193 | 10,348 |
|---|
| 3/31/23 | 10,542 | 9,470 | 10,643 |
|---|
| 6/30/23 | 10,647 | 9,325 | 10,721 |
|---|
| 9/30/23 | 10,567 | 8,990 | 10,638 |
|---|
| 12/31/23 | 11,250 | 9,718 | 11,208 |
|---|
| 3/31/24 | 11,295 | 9,516 | 11,273 |
|---|
| 6/30/24 | 11,260 | 9,411 | 11,286 |
|---|
| 9/30/24 | 11,590 | 10,068 | 11,679 |
|---|
| 12/31/24 | 11,649 | 9,554 | 11,765 |
|---|
202501-4140694, 202502-4108520
Average Annual Total Returns
| | 1 Year | 5 Years | Since Inception 9/12/17 |
|---|
| International Bond Fund (USD Hedged) (Investor Class) | 3.55% | 0.78% | 2.11% |
|---|
| Bloomberg Global Aggregate Bond Index (Regulatory Benchmark) | -1.69 | -1.96 | -0.62 |
|---|
| Bloomberg Global Aggregate ex USD Bond (USD Hedged) Index (Strategy Benchmark) | 4.97 | 1.01 | 2.25 |
|---|
The preceding line graph shows the value of a hypothetical $10,000 investment in the fund over the past 10 fiscal year periods or since inception (for funds lacking 10-year records). The fund’s performance information included in the line graph and table above is compared with a regulatory required index that represents an overall securities market (Regulatory Benchmark). In addition, the line graph and table may also include one or more indexes that more closely aligns to the fund's investment strategy (Strategy Benchmark(s)). Due to new SEC Rules on shareholder reporting the fund adopted a new broad-based securities market index, referred to as the Regulatory Benchmark. Market index returns do not include expenses, which are deducted from fund returns. The fund's total return figures reflect the reinvestment of dividends and capital gains, if any.Neither the fund’s returns nor the index returns reflect the deduction of taxes that a shareholder would pay on fund distributions or redemptions of fund shares.The fund’s past performance is not a good predictor of the fund’s future performance.Updated performance information can be found at www.troweprice.com.
What are some fund statistics?
- Total Net Assets (000s)$7,116,341
- Number of Portfolio Holdings647
- Investment Advisory Fees Paid (000s)$7,381
- Portfolio Turnover Rate54.5%
What did the fund invest in?
Geographic Allocation (as a % of Net Assets)
| United States | 13.5% |
| Japan | 11.0 |
| Canada | 9.2 |
| China | 7.7 |
| France | 5.0 |
| Germany | 4.4 |
| United Kingdom | 4.4 |
| Malaysia | 3.3 |
| Indonesia | 3.0 |
| Other | 38.5 |
Top Ten Holdings (as a % of Net Assets)
| Government of Japan | 9.8% |
| People's Republic of China | 7.0 |
| U.S. Treasury Bills | 6.8 |
| Canadian Treasury Bill | 4.9 |
| Republic of France | 3.5 |
| Government of Malaysia | 3.3 |
| Republic of Indonesia | 2.8 |
| United Kingdom Gilt | 2.3 |
| Government of Canada Real Return Bond, Inflation-Indexed | 1.9 |
| Republic of Czech | 1.8 |
If you invest directly with T. Rowe Price, you can elect to receive future shareholder reports or other important documents through electronic delivery by enrolling at www.troweprice.com/paperless. If you invest through a financial intermediary such as an investment advisor, a bank, retirement plan sponsor or a brokerage firm, please contact that organization and ask if it can provide electronic delivery.
Bloomberg does not accept any liability for any errors or omissions in the indexes or data, and hereby expressly disclaim all warranties of originality, accuracy, completeness, timeliness, merchantability and fitness for a particular purpose. No party may rely on any indexes or data contained in this communication. Visit www.troweprice.com/en/us/market-data-disclosures for additional legal notices & disclaimers.
International Bond Fund (USD Hedged)
Investor Class (TNIBX)
T. Rowe Price Investment Services, Inc.
100 East Pratt Street
Baltimore, MD 21202
Annual Shareholder Report
December 31, 2024
International Bond Fund (USD Hedged)
This annual shareholder report contains important information about International Bond Fund (USD Hedged) (the "fund") for the period of January 1, 2024 to December 31, 2024. You can find the fund’s prospectus, financial information on Form N‑CSR (which includes required tax information for dividends), holdings, proxy voting information, and other information atwww.troweprice.com/prospectus. You can also request this information without charge by contacting T. Rowe Price at 1‑800‑638‑5660 or info@troweprice.com or contacting your intermediary.
What were the fund costs for the last year? (based on a hypothetical $10,000 investment)
| | Costs of a $10,000 investment | Costs paid as a percentage of a $10,000 investment |
|---|
| International Bond Fund (USD Hedged) - Advisor Class | $101 | 0.99% |
|---|
What drove fund performance during the past 12 months?
Global fixed income markets fell over the 12-month reporting period due to weaker currencies versus the dollar and rising bond yields at the end of the period, despite many central banks easing monetary policy.
The fund benefited from its exposure to euro-denominated government-related bonds and corporate credit relative to the Bloomberg Global Aggregate ex USD Bond (USD Hedged) Index. Additionally, the fund’s short currency exposure in the Chinese yuan and Taiwanese dollar, relative to the benchmark, added value amid U.S. dollar strength during the reporting period.
Against the USD hedged index, an underweighting duration in China dragged on performance as local yields fell over the reporting period, with China’s central bank maintaining mostly stimulative monetary policy. Long exposure in the Brazilian real detracted as the country suffered amid investor concerns over the government's spending plans and wide budget deficit.
The fund seeks to provide current income and capital appreciation primarily through a focus on non-U.S. dollar-denominated bonds. During the period, the fund shifted to a long position in the U.S. dollar due to the anticipation of near-term dollar strength.
The fund held material exposure to derivatives, including currency, interest rate, and credit derivatives. The fund’s derivatives exposure to currency forwards had a positive impact on absolute performance.
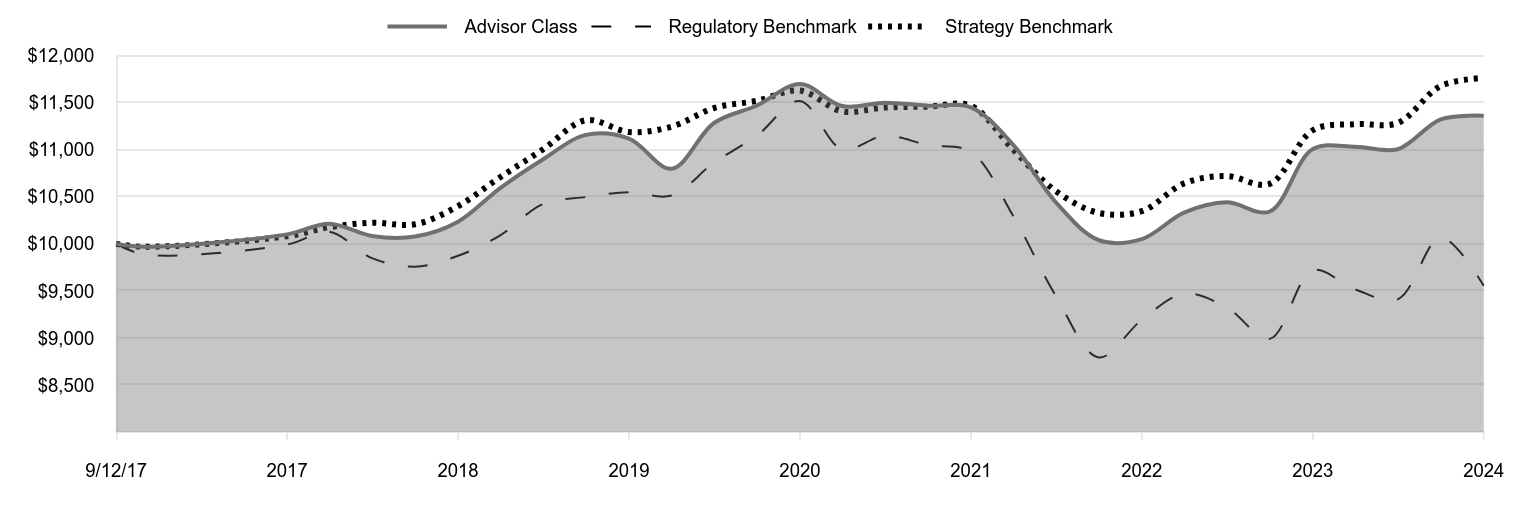
How has the fund performed?
Cumulative Returns of a Hypothetical $10,000 Investment as of December 31, 2024
| Advisor Class | Regulatory Benchmark | Strategy Benchmark |
|---|
| 9/12/17 | 10,000 | 10,000 | 10,000 |
|---|
| 9/30/17 | 9,970 | 9,887 | 9,969 |
|---|
| 12/31/17 | 10,101 | 9,993 | 10,082 |
|---|
| 3/31/18 | 10,215 | 10,129 | 10,177 |
|---|
| 6/30/18 | 10,084 | 9,848 | 10,225 |
|---|
| 9/30/18 | 10,078 | 9,757 | 10,208 |
|---|
| 12/31/18 | 10,236 | 9,873 | 10,402 |
|---|
| 3/31/19 | 10,593 | 10,091 | 10,709 |
|---|
| 6/30/19 | 10,897 | 10,423 | 11,003 |
|---|
| 9/30/19 | 11,159 | 10,498 | 11,315 |
|---|
| 12/31/19 | 11,119 | 10,549 | 11,189 |
|---|
| 3/31/20 | 10,798 | 10,514 | 11,246 |
|---|
| 6/30/20 | 11,285 | 10,863 | 11,444 |
|---|
| 9/30/20 | 11,471 | 11,152 | 11,521 |
|---|
| 12/31/20 | 11,699 | 11,519 | 11,630 |
|---|
| 3/31/21 | 11,465 | 11,005 | 11,409 |
|---|
| 6/30/21 | 11,500 | 11,149 | 11,449 |
|---|
| 9/30/21 | 11,469 | 11,051 | 11,459 |
|---|
| 12/31/21 | 11,451 | 10,977 | 11,467 |
|---|
| 3/31/22 | 11,056 | 10,300 | 11,003 |
|---|
| 6/30/22 | 10,444 | 9,449 | 10,562 |
|---|
| 9/30/22 | 10,040 | 8,793 | 10,329 |
|---|
| 12/31/22 | 10,051 | 9,193 | 10,348 |
|---|
| 3/31/23 | 10,332 | 9,470 | 10,643 |
|---|
| 6/30/23 | 10,442 | 9,325 | 10,721 |
|---|
| 9/30/23 | 10,344 | 8,990 | 10,638 |
|---|
| 12/31/23 | 11,008 | 9,718 | 11,208 |
|---|
| 3/31/24 | 11,033 | 9,516 | 11,273 |
|---|
| 6/30/24 | 11,006 | 9,411 | 11,286 |
|---|
| 9/30/24 | 11,324 | 10,068 | 11,679 |
|---|
| 12/31/24 | 11,362 | 9,554 | 11,765 |
|---|
202501-4140694, 202502-4108520
Average Annual Total Returns
| | 1 Year | 5 Years | Since Inception 9/12/17 |
|---|
| International Bond Fund (USD Hedged) (Advisor Class) | 3.21% | 0.43% | 1.76% |
|---|
| Bloomberg Global Aggregate Bond Index (Regulatory Benchmark) | -1.69 | -1.96 | -0.62 |
|---|
| Bloomberg Global Aggregate ex USD Bond (USD Hedged) Index (Strategy Benchmark) | 4.97 | 1.01 | 2.25 |
|---|
The preceding line graph shows the value of a hypothetical $10,000 investment in the fund over the past 10 fiscal year periods or since inception (for funds lacking 10-year records). The fund’s performance information included in the line graph and table above is compared with a regulatory required index that represents an overall securities market (Regulatory Benchmark). In addition, the line graph and table may also include one or more indexes that more closely aligns to the fund's investment strategy (Strategy Benchmark(s)). Due to new SEC Rules on shareholder reporting the fund adopted a new broad-based securities market index, referred to as the Regulatory Benchmark. Market index returns do not include expenses, which are deducted from fund returns. The fund's total return figures reflect the reinvestment of dividends and capital gains, if any.Neither the fund’s returns nor the index returns reflect the deduction of taxes that a shareholder would pay on fund distributions or redemptions of fund shares.The fund’s past performance is not a good predictor of the fund’s future performance.Updated performance information can be found at www.troweprice.com.
What are some fund statistics?
- Total Net Assets (000s)$7,116,341
- Number of Portfolio Holdings647
- Investment Advisory Fees Paid (000s)$7,381
- Portfolio Turnover Rate54.5%
What did the fund invest in?
Geographic Allocation (as a % of Net Assets)
| United States | 13.5% |
| Japan | 11.0 |
| Canada | 9.2 |
| China | 7.7 |
| France | 5.0 |
| Germany | 4.4 |
| United Kingdom | 4.4 |
| Malaysia | 3.3 |
| Indonesia | 3.0 |
| Other | 38.5 |
Top Ten Holdings (as a % of Net Assets)
| Government of Japan | 9.8% |
| People's Republic of China | 7.0 |
| U.S. Treasury Bills | 6.8 |
| Canadian Treasury Bill | 4.9 |
| Republic of France | 3.5 |
| Government of Malaysia | 3.3 |
| Republic of Indonesia | 2.8 |
| United Kingdom Gilt | 2.3 |
| Government of Canada Real Return Bond, Inflation-Indexed | 1.9 |
| Republic of Czech | 1.8 |
If you invest directly with T. Rowe Price, you can elect to receive future shareholder reports or other important documents through electronic delivery by enrolling at www.troweprice.com/paperless. If you invest through a financial intermediary such as an investment advisor, a bank, retirement plan sponsor or a brokerage firm, please contact that organization and ask if it can provide electronic delivery.
Bloomberg does not accept any liability for any errors or omissions in the indexes or data, and hereby expressly disclaim all warranties of originality, accuracy, completeness, timeliness, merchantability and fitness for a particular purpose. No party may rely on any indexes or data contained in this communication. Visit www.troweprice.com/en/us/market-data-disclosures for additional legal notices & disclaimers.
International Bond Fund (USD Hedged)
Advisor Class (TTABX)
T. Rowe Price Investment Services, Inc.
100 East Pratt Street
Baltimore, MD 21202
Annual Shareholder Report
December 31, 2024
International Bond Fund (USD Hedged)
This annual shareholder report contains important information about International Bond Fund (USD Hedged) (the "fund") for the period of January 1, 2024 to December 31, 2024. You can find the fund’s prospectus, financial information on Form N‑CSR (which includes required tax information for dividends), holdings, proxy voting information, and other information atwww.troweprice.com/prospectus. You can also request this information without charge by contacting T. Rowe Price at 1‑800‑638‑5660 or info@troweprice.com or contacting your intermediary.
What were the fund costs for the last year? (based on a hypothetical $10,000 investment)
| | Costs of a $10,000 investment | Costs paid as a percentage of a $10,000 investment |
|---|
| International Bond Fund (USD Hedged) - I Class | $55 | 0.54% |
|---|
What drove fund performance during the past 12 months?
Global fixed income markets fell over the 12-month reporting period due to weaker currencies versus the dollar and rising bond yields at the end of the period, despite many central banks easing monetary policy.
The fund benefited from its exposure to euro-denominated government-related bonds and corporate credit relative to the Bloomberg Global Aggregate ex USD Bond (USD Hedged) Index. Additionally, the fund’s short currency exposure in the Chinese yuan and Taiwanese dollar, relative to the benchmark, added value amid U.S. dollar strength during the reporting period.
Against the USD hedged index, an underweighting duration in China dragged on performance as local yields fell over the reporting period, with China’s central bank maintaining mostly stimulative monetary policy. Long exposure in the Brazilian real detracted as the country suffered amid investor concerns over the government's spending plans and wide budget deficit.
The fund seeks to provide current income and capital appreciation primarily through a focus on non-U.S. dollar-denominated bonds. During the period, the fund shifted to a long position in the U.S. dollar due to the anticipation of near-term dollar strength.
The fund held material exposure to derivatives, including currency, interest rate, and credit derivatives. The fund’s derivatives exposure to currency forwards had a positive impact on absolute performance.
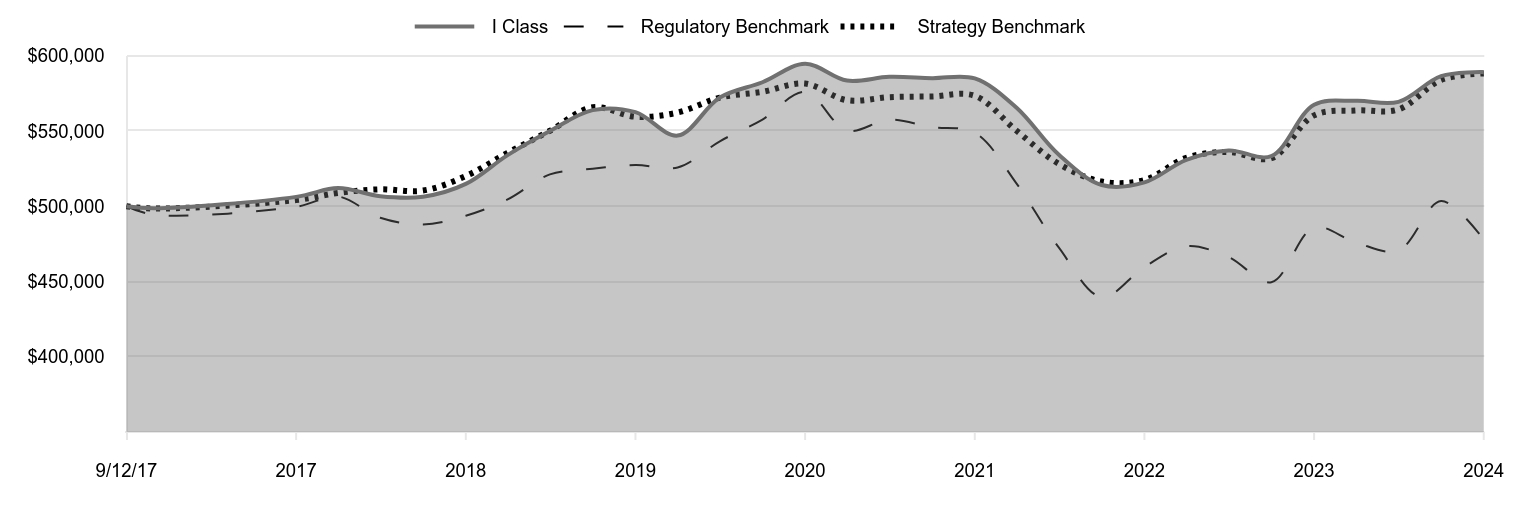
How has the fund performed?
Cumulative Returns of a Hypothetical $500,000 Investment as of December 31, 2024
| I Class | Regulatory Benchmark | Strategy Benchmark |
|---|
| 9/12/17 | 500,000 | 500,000 | 500,000 |
|---|
| 9/30/17 | 498,621 | 494,342 | 498,456 |
|---|
| 12/31/17 | 506,235 | 499,666 | 504,104 |
|---|
| 3/31/18 | 512,044 | 506,468 | 508,827 |
|---|
| 6/30/18 | 506,644 | 492,377 | 511,260 |
|---|
| 9/30/18 | 506,349 | 487,829 | 510,413 |
|---|
| 12/31/18 | 514,837 | 493,671 | 520,076 |
|---|
| 3/31/19 | 533,991 | 504,541 | 535,464 |
|---|
| 6/30/19 | 549,972 | 521,163 | 550,165 |
|---|
| 9/30/19 | 563,865 | 524,890 | 565,737 |
|---|
| 12/31/19 | 562,528 | 527,436 | 559,453 |
|---|
| 3/31/20 | 546,955 | 525,712 | 562,282 |
|---|
| 6/30/20 | 572,250 | 543,169 | 572,183 |
|---|
| 9/30/20 | 582,389 | 557,625 | 576,055 |
|---|
| 12/31/20 | 594,693 | 575,940 | 581,495 |
|---|
| 3/31/21 | 583,478 | 550,249 | 570,456 |
|---|
| 6/30/21 | 585,957 | 557,471 | 572,448 |
|---|
| 9/30/21 | 585,119 | 552,546 | 572,956 |
|---|
| 12/31/21 | 584,936 | 548,831 | 573,360 |
|---|
| 3/31/22 | 565,403 | 515,018 | 550,138 |
|---|
| 6/30/22 | 534,168 | 472,467 | 528,087 |
|---|
| 9/30/22 | 514,109 | 439,657 | 516,438 |
|---|
| 12/31/22 | 515,843 | 459,654 | 517,380 |
|---|
| 3/31/23 | 530,804 | 473,475 | 532,171 |
|---|
| 6/30/23 | 537,081 | 466,231 | 536,073 |
|---|
| 9/30/23 | 533,315 | 449,511 | 531,889 |
|---|
| 12/31/23 | 567,450 | 485,924 | 560,404 |
|---|
| 3/31/24 | 570,036 | 475,802 | 563,661 |
|---|
| 6/30/24 | 569,340 | 470,547 | 564,280 |
|---|
| 9/30/24 | 586,416 | 503,405 | 583,931 |
|---|
| 12/31/24 | 589,094 | 477,716 | 588,264 |
|---|
202501-4140694, 202502-4108520
Average Annual Total Returns
| | 1 Year | 5 Years | Since Inception 9/12/17 |
|---|
| International Bond Fund (USD Hedged) (I Class) | 3.81% | 0.93% | 2.27% |
|---|
| Bloomberg Global Aggregate Bond Index (Regulatory Benchmark) | -1.69 | -1.96 | -0.62 |
|---|
| Bloomberg Global Aggregate ex USD Bond (USD Hedged) Index (Strategy Benchmark) | 4.97 | 1.01 | 2.25 |
|---|
The preceding line graph shows the value of a hypothetical $500,000 investment in the fund over the past 10 fiscal year periods or since inception (for funds lacking 10-year records). The fund’s performance information included in the line graph and table above is compared with a regulatory required index that represents an overall securities market (Regulatory Benchmark). In addition, the line graph and table may also include one or more indexes that more closely aligns to the fund's investment strategy (Strategy Benchmark(s)). Due to new SEC Rules on shareholder reporting the fund adopted a new broad-based securities market index, referred to as the Regulatory Benchmark. Market index returns do not include expenses, which are deducted from fund returns. The fund's total return figures reflect the reinvestment of dividends and capital gains, if any.Neither the fund’s returns nor the index returns reflect the deduction of taxes that a shareholder would pay on fund distributions or redemptions of fund shares.The fund’s past performance is not a good predictor of the fund’s future performance.Updated performance information can be found at www.troweprice.com.
What are some fund statistics?
- Total Net Assets (000s)$7,116,341
- Number of Portfolio Holdings647
- Investment Advisory Fees Paid (000s)$7,381
- Portfolio Turnover Rate54.5%
What did the fund invest in?
Geographic Allocation (as a % of Net Assets)
| United States | 13.5% |
| Japan | 11.0 |
| Canada | 9.2 |
| China | 7.7 |
| France | 5.0 |
| Germany | 4.4 |
| United Kingdom | 4.4 |
| Malaysia | 3.3 |
| Indonesia | 3.0 |
| Other | 38.5 |
Top Ten Holdings (as a % of Net Assets)
| Government of Japan | 9.8% |
| People's Republic of China | 7.0 |
| U.S. Treasury Bills | 6.8 |
| Canadian Treasury Bill | 4.9 |
| Republic of France | 3.5 |
| Government of Malaysia | 3.3 |
| Republic of Indonesia | 2.8 |
| United Kingdom Gilt | 2.3 |
| Government of Canada Real Return Bond, Inflation-Indexed | 1.9 |
| Republic of Czech | 1.8 |
If you invest directly with T. Rowe Price, you can elect to receive future shareholder reports or other important documents through electronic delivery by enrolling at www.troweprice.com/paperless. If you invest through a financial intermediary such as an investment advisor, a bank, retirement plan sponsor or a brokerage firm, please contact that organization and ask if it can provide electronic delivery.
Bloomberg does not accept any liability for any errors or omissions in the indexes or data, and hereby expressly disclaim all warranties of originality, accuracy, completeness, timeliness, merchantability and fitness for a particular purpose. No party may rely on any indexes or data contained in this communication. Visit www.troweprice.com/en/us/market-data-disclosures for additional legal notices & disclaimers.
International Bond Fund (USD Hedged)
I Class (TNBMX)
T. Rowe Price Investment Services, Inc.
100 East Pratt Street
Baltimore, MD 21202
Annual Shareholder Report
December 31, 2024
International Bond Fund (USD Hedged)
This annual shareholder report contains important information about International Bond Fund (USD Hedged) (the "fund") for the period of January 1, 2024 to December 31, 2024. You can find the fund’s prospectus, financial information on Form N‑CSR (which includes required tax information for dividends), holdings, proxy voting information, and other information atwww.troweprice.com/prospectus. You can also request this information without charge by contacting T. Rowe Price at 1‑800‑638‑5660 or info@troweprice.com or contacting your intermediary.
What were the fund costs for the last year? (based on a hypothetical $10,000 investment)
| | Costs of a $10,000 investment | Costs paid as a percentage of a $10,000 investment |
|---|
| International Bond Fund (USD Hedged) - Z Class | $0 | 0.00% |
|---|
What drove fund performance during the past 12 months?
Global fixed income markets fell over the 12-month reporting period due to weaker currencies versus the dollar and rising bond yields at the end of the period, despite many central banks easing monetary policy.
The fund benefited from its exposure to euro-denominated government-related bonds and corporate credit relative to the Bloomberg Global Aggregate ex USD Bond (USD Hedged) Index. Additionally, the fund’s short currency exposure in the Chinese yuan and Taiwanese dollar, relative to the benchmark, added value amid U.S. dollar strength during the reporting period.
Against the USD hedged index, an underweighting duration in China dragged on performance as local yields fell over the reporting period, with China’s central bank maintaining mostly stimulative monetary policy. Long exposure in the Brazilian real detracted as the country suffered amid investor concerns over the government's spending plans and wide budget deficit.
The fund seeks to provide current income and capital appreciation primarily through a focus on non-U.S. dollar-denominated bonds. During the period, the fund shifted to a long position in the U.S. dollar due to the anticipation of near-term dollar strength.
The fund held material exposure to derivatives, including currency, interest rate, and credit derivatives. The fund’s derivatives exposure to currency forwards had a positive impact on absolute performance.
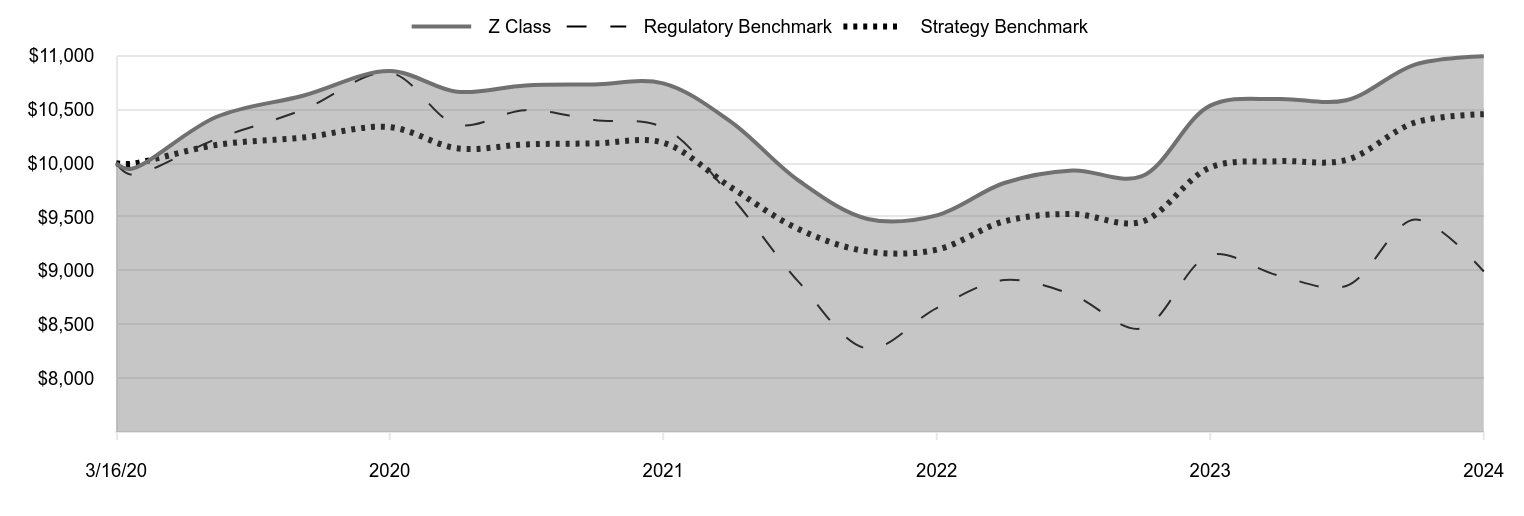
How has the fund performed?
Cumulative Returns of a Hypothetical $10,000 Investment as of December 31, 2024
| Z Class | Regulatory Benchmark | Strategy Benchmark |
|---|
| 3/16/20 | 10,000 | 10,000 | 10,000 |
|---|
| 3/31/20 | 9,947 | 9,896 | 9,994 |
|---|
| 6/30/20 | 10,430 | 10,225 | 10,170 |
|---|
| 9/30/20 | 10,628 | 10,497 | 10,239 |
|---|
| 12/31/20 | 10,857 | 10,842 | 10,336 |
|---|
| 3/31/21 | 10,665 | 10,358 | 10,139 |
|---|
| 6/30/21 | 10,724 | 10,494 | 10,175 |
|---|
| 9/30/21 | 10,733 | 10,402 | 10,184 |
|---|
| 12/31/21 | 10,743 | 10,332 | 10,191 |
|---|
| 3/31/22 | 10,387 | 9,695 | 9,778 |
|---|
| 6/30/22 | 9,837 | 8,894 | 9,386 |
|---|
| 9/30/22 | 9,482 | 8,276 | 9,179 |
|---|
| 12/31/22 | 9,515 | 8,653 | 9,196 |
|---|
| 3/31/23 | 9,816 | 8,913 | 9,459 |
|---|
| 6/30/23 | 9,933 | 8,777 | 9,528 |
|---|
| 9/30/23 | 9,877 | 8,462 | 9,454 |
|---|
| 12/31/23 | 10,536 | 9,147 | 9,961 |
|---|
| 3/31/24 | 10,598 | 8,957 | 10,019 |
|---|
| 6/30/24 | 10,586 | 8,858 | 10,030 |
|---|
| 9/30/24 | 10,918 | 9,476 | 10,379 |
|---|
| 12/31/24 | 10,996 | 8,993 | 10,456 |
|---|
202501-4140694, 202502-4108520
Average Annual Total Returns
| | 1 Year | Since Inception 3/16/20 |
|---|
| International Bond Fund (USD Hedged) (Z Class) | 4.37% | 2.00% |
|---|
| Bloomberg Global Aggregate Bond Index (Regulatory Benchmark) | -1.69 | -2.19 |
|---|
| Bloomberg Global Aggregate ex USD Bond (USD Hedged) Index (Strategy Benchmark) | 4.97 | 0.93 |
|---|
The preceding line graph shows the value of a hypothetical $10,000 investment in the fund over the past 10 fiscal year periods or since inception (for funds lacking 10-year records). The fund’s performance information included in the line graph and table above is compared with a regulatory required index that represents an overall securities market (Regulatory Benchmark). In addition, the line graph and table may also include one or more indexes that more closely aligns to the fund's investment strategy (Strategy Benchmark(s)). Due to new SEC Rules on shareholder reporting the fund adopted a new broad-based securities market index, referred to as the Regulatory Benchmark. Market index returns do not include expenses, which are deducted from fund returns. The fund's total return figures reflect the reinvestment of dividends and capital gains, if any.Neither the fund’s returns nor the index returns reflect the deduction of taxes that a shareholder would pay on fund distributions or redemptions of fund shares.The fund’s past performance is not a good predictor of the fund’s future performance.Updated performance information can be found at www.troweprice.com.
What are some fund statistics?
- Total Net Assets (000s)$7,116,341
- Number of Portfolio Holdings647
- Investment Advisory Fees Paid (000s)$7,381
- Portfolio Turnover Rate54.5%
What did the fund invest in?
Geographic Allocation (as a % of Net Assets)
| United States | 13.5% |
| Japan | 11.0 |
| Canada | 9.2 |
| China | 7.7 |
| France | 5.0 |
| Germany | 4.4 |
| United Kingdom | 4.4 |
| Malaysia | 3.3 |
| Indonesia | 3.0 |
| Other | 38.5 |
Top Ten Holdings (as a % of Net Assets)
| Government of Japan | 9.8% |
| People's Republic of China | 7.0 |
| U.S. Treasury Bills | 6.8 |
| Canadian Treasury Bill | 4.9 |
| Republic of France | 3.5 |
| Government of Malaysia | 3.3 |
| Republic of Indonesia | 2.8 |
| United Kingdom Gilt | 2.3 |
| Government of Canada Real Return Bond, Inflation-Indexed | 1.9 |
| Republic of Czech | 1.8 |
If you invest directly with T. Rowe Price, you can elect to receive future shareholder reports or other important documents through electronic delivery by enrolling at www.troweprice.com/paperless. If you invest through a financial intermediary such as an investment advisor, a bank, retirement plan sponsor or a brokerage firm, please contact that organization and ask if it can provide electronic delivery.
Bloomberg does not accept any liability for any errors or omissions in the indexes or data, and hereby expressly disclaim all warranties of originality, accuracy, completeness, timeliness, merchantability and fitness for a particular purpose. No party may rely on any indexes or data contained in this communication. Visit www.troweprice.com/en/us/market-data-disclosures for additional legal notices & disclaimers.
International Bond Fund (USD Hedged)
Z Class (TRMZX)
T. Rowe Price Investment Services, Inc.
100 East Pratt Street
Baltimore, MD 21202
Item 1. (b) Notice pursuant to Rule 30e-3.
Not applicable.
Item 2. Code of Ethics.
The registrant has adopted a code of ethics, as defined in Item 2 of Form N-CSR, applicable to its principal executive officer, principal financial officer, principal accounting officer or controller, or persons performing similar functions. A copy of this code of ethics is filed as an exhibit to this Form N-CSR. No substantive amendments were approved or waivers were granted to this code of ethics during the period covered by this report.
Item 3. Audit Committee Financial Expert.
The registrant’s Board of Directors has determined that Mr. Paul F. McBride qualifies as an audit committee financial expert, as defined in Item 3 of Form N-CSR. Mr. McBride is considered independent for purposes of Item 3 of Form N-CSR.
Item 4. Principal Accountant Fees and Services.
(a) – (d) Aggregate fees billed for the last two fiscal years for professional services rendered to, or on behalf of, the registrant by the registrant’s principal accountant were as follows:
| | | | | | |
| | | | 2024 | | 2023 |
| | Audit Fees | | $39,999 | | $39,183 |
| | Audit-Related Fees | | - | | - |
| | Tax Fees | | - | | - |
| | All Other Fees | | - | | - |
Audit fees include amounts related to the audit of the registrant’s annual financial statements and services normally provided by the accountant in connection with statutory and regulatory filings. Audit-related fees include amounts reasonably related to the performance of the audit of the registrant’s financial statements and specifically include the issuance of a report on internal controls and, if applicable, agreed-upon procedures related to fund acquisitions. Tax fees include amounts related to services for tax compliance, tax planning, and tax advice. The nature of these services specifically includes the review of distribution calculations and the preparation of Federal, state, and excise tax returns. All other fees include the registrant’s pro-rata share of amounts for agreed-upon procedures in conjunction with service contract approvals by the registrant’s Board of Directors/Trustees.
(e)(1) The registrant’s audit committee has adopted a policy whereby audit and non-audit services performed by the registrant’s principal accountant for the registrant, its investment adviser, and any entity controlling, controlled by, or under common control with the investment adviser that provides ongoing services to the registrant require pre-approval in advance at regularly scheduled audit committee meetings. If such a service is required between regularly scheduled audit committee meetings, pre-approval may be authorized by one audit committee member with ratification at the next scheduled audit committee meeting. Waiver of pre-approval for audit or non-audit services requiring fees of a de minimis amount is not permitted.
(2) No services included in (b) – (d) above were approved pursuant to paragraph (c)(7)(i)(C) of Rule 2-01 of Regulation S-X.
(f) Less than 50 percent of the hours expended on the principal accountant’s engagement to audit the registrant’s financial statements for the most recent fiscal year were attributed to work performed by persons other than the principal accountant’s full-time, permanent employees.
(g) The aggregate fees billed for the most recent fiscal year and the preceding fiscal year by the registrant’s principal accountant for non-audit services rendered to the registrant, its investment adviser, and any entity controlling, controlled by, or under common control with the investment adviser that provides ongoing services to the registrant were $1,262,000 and $1,524,000, respectively.
(h) All non-audit services rendered in (g) above were pre-approved by the registrant’s audit committee. Accordingly, these services were considered by the registrant’s audit committee in maintaining the principal accountant’s independence.
(i) Not applicable.
(j) Not applicable.
Item 5. Audit Committee of Listed Registrants.
Not applicable.
Item 6. Investments.
(a) Not applicable. The complete schedule of investments is included in Item 7 of this Form N-CSR.
(b) Not applicable.
Item 7. Financial Statements and Financial Highlights for Open-End Management Investment Companies.
(a – b) Report pursuant to Regulation S-X.
Financial
Highlights
Portfolio
of
Investments
Financial
Statements
and
Notes
Additional
Fund
Information
Financial
Statements
and
Other
Information
For
more
insights
from
T.
Rowe
Price
investment
professionals,
go
to
troweprice.com
.
T.
ROWE
PRICE
TNIBX
International
Bond
Fund
(USD
Hedged)
TTABX
International
Bond
Fund
(USD
Hedged)–
.
Advisor Class
TNBMX
International
Bond
Fund
(USD
Hedged)–
.
I Class
TRMZX
International
Bond
Fund
(USD
Hedged)–
.
Z Class
T.
ROWE
PRICE
International
Bond
Fund
(USD
Hedged)
For
a
share
outstanding
throughout
each
period
Investor
Class
..
Year
..
..
Ended
.
12/31/24
12/31/23
12/31/22
12/31/21
12/31/20
NET
ASSET
VALUE
Beginning
of
period
$
8.48
$
7.91
$
9.91
$
10.35
$
9.98
Investment
activities
Net
investment
income
(1)(2)
0.26
0.21
0.15
0.11
0.16
Net
realized
and
unrealized
gain/loss
0.04
0.56
(1.32)
(0.28)
0.39
Total
from
investment
activities
0.30
0.77
(1.17)
(0.17)
0.55
Distributions
Net
investment
income
(0.25)
(0.03)
(0.15)
(0.15)
(0.02)
Net
realized
gain
—
—
(0.68)
(0.12)
(0.06)
Tax
return
of
capital
—
(0.17)
—
—
(0.10)
Total
distributions
(0.25)
(0.20)
(0.83)
(0.27)
(0.18)
NET
ASSET
VALUE
End
of
period
$
8.53
$
8.48
$
7.91
$
9.91
$
10.35
T.
ROWE
PRICE
International
Bond
Fund
(USD
Hedged)
For
a
share
outstanding
throughout
each
period
The
accompanying
notes
are
an
integral
part
of
these
financial
statements.
Investor
Class
..
Year
..
..
Ended
.
12/31/24
12/31/23
12/31/22
12/31/21
12/31/20
Ratios/Supplemental
Data
Total
return
(2)(3)
3.55%
9.88%
(12.03)%
(1.66)%
5.59%
Ratios
to
average
net
assets:
(2)
Gross
expenses
before
waivers/payments
by
Price
Associates
0.79%
0.77%
0.75%
0.61%
0.64%
Net
expenses
after
waivers/payments
by
Price
Associates
0.79%
0.77%
0.75%
0.61%
0.64%
Net
investment
income
3.02%
2.59%
1.65%
1.04%
1.55%
Portfolio
turnover
rate
54.5%
68.9%
74.6%
35.3%
49.4%
Net
assets,
end
of
period
(in
millions)
$73
$82
$76
$218
$579
0%
0%
0%
0%
0%
(1)
Per
share
amounts
calculated
using
average
shares
outstanding
method.
(2)
Includes
the
impact
of
expense-related
arrangements
with
Price
Associates.
(3)
Total
return
reflects
the
rate
that
an
investor
would
have
earned
on
an
investment
in
the
fund
during
each
period,
assuming
reinvestment
of
all
distributions,
and
payment
of
no
redemption
or
account
fees,
if
applicable.
T.
ROWE
PRICE
International
Bond
Fund
(USD
Hedged)
For
a
share
outstanding
throughout
each
period
The
accompanying
notes
are
an
integral
part
of
these
financial
statements.
Advisor
Class
..
Year
..
..
Ended
.
12/31/24
12/31/23
12/31/22
12/31/21
12/31/20
NET
ASSET
VALUE
Beginning
of
period
$
8.46
$
7.90
$
9.90
$
10.35
$
9.98
Investment
activities
Net
investment
income
(1)(2)
0.24
0.19
0.13
0.10
0.11
Net
realized
and
unrealized
gain/loss
0.03
0.55
(1.32)
(0.32)
0.41
Total
from
investment
activities
0.27
0.74
(1.19)
(0.22)
0.52
Distributions
Net
investment
income
(0.23)
(0.02)
(0.13)
(0.11)
(0.02)
Net
realized
gain
—
—
(0.68)
(0.12)
(0.06)
Tax
return
of
capital
—
(0.16)
—
—
(0.07)
Total
distributions
(0.23)
(0.18)
(0.81)
(0.23)
(0.15)
NET
ASSET
VALUE
End
of
period
$
8.50
$
8.46
$
7.90
$
9.90
$
10.35
Ratios/Supplemental
Data
Total
return
(2)(3)
3.21%
9.52%
(12.23)%
(2.12)%
5.22%
Ratios
to
average
net
assets:
(2)
Gross
expenses
before
waivers/payments
by
Price
Associates
1.70%
0.99%
0.99%
1.08%
0.99%
Net
expenses
after
waivers/
payments
by
Price
Associates
0.99%
0.99%
0.99%
0.99%
0.99%
Net
investment
income
2.80%
2.40%
1.46%
1.03%
1.08%
Portfolio
turnover
rate
54.5%
68.9%
74.6%
35.3%
49.4%
Net
assets,
end
of
period
(in
thousands)
$75
$212
$81
$102
$106
0%
0%
0%
0%
0%
(1)
Per
share
amounts
calculated
using
average
shares
outstanding
method.
(2)
Includes
the
impact
of
expense-related
arrangements
with
Price
Associates.
(3)
Total
return
reflects
the
rate
that
an
investor
would
have
earned
on
an
investment
in
the
fund
during
each
period,
assuming
reinvestment
of
all
distributions,
and
payment
of
no
redemption
or
account
fees,
if
applicable.
T.
ROWE
PRICE
International
Bond
Fund
(USD
Hedged)
For
a
share
outstanding
throughout
each
period
The
accompanying
notes
are
an
integral
part
of
these
financial
statements.
I
Class
..
Year
..
..
Ended
.
12/31/24
12/31/23
12/31/22
12/31/21
12/31/20
NET
ASSET
VALUE
Beginning
of
period
$
8.47
$
7.91
$
9.91
$
10.36
$
9.99
Investment
activities
Net
investment
income
(1)(2)
0.28
0.23
0.17
0.15
0.16
Net
realized
and
unrealized
gain/loss
0.04
0.55
(1.32)
(0.32)
0.41
Total
from
investment
activities
0.32
0.78
(1.15)
(0.17)
0.57
Distributions
Net
investment
income
(0.27)
(0.03)
(0.17)
(0.16)
(0.03)
Net
realized
gain
—
—
(0.68)
(0.12)
(0.06)
Tax
return
of
capital
—
(0.19)
—
—
(0.11)
Total
distributions
(0.27)
(0.22)
(0.85)
(0.28)
(0.20)
NET
ASSET
VALUE
End
of
period
$
8.52
$
8.47
$
7.91
$
9.91
$
10.36
Ratios/Supplemental
Data
Total
return
(2)(3)
3.81%
10.00%
(11.81)%
(1.64)%
5.72%
Ratios
to
average
net
assets:
(2)
Gross
expenses
before
waivers/payments
by
Price
Associates
0.54%
0.54%
0.53%
0.50%
0.51%
Net
expenses
after
waivers/
payments
by
Price
Associates
0.54%
0.54%
0.53%
0.50%
0.51%
Net
investment
income
3.29%
2.84%
1.91%
1.48%
1.64%
Portfolio
turnover
rate
54.5%
68.9%
74.6%
35.3%
49.4%
Net
assets,
end
of
period
(in
millions)
$1,875
$1,488
$1,246
$555
$422
0%
0%
0%
0%
0%
(1)
Per
share
amounts
calculated
using
average
shares
outstanding
method.
(2)
Includes
the
impact
of
expense-related
arrangements
with
Price
Associates.
(3)
Total
return
reflects
the
rate
that
an
investor
would
have
earned
on
an
investment
in
the
fund
during
each
period,
assuming
reinvestment
of
all
distributions,
and
payment
of
no
redemption
or
account
fees,
if
applicable.
T.
ROWE
PRICE
International
Bond
Fund
(USD
Hedged)
For
a
share
outstanding
throughout
each
period
Z
Class
(1)
..
Year
..
..
Ended
.
3/16/20
(1)
Through
12/31/20
12/31/24
12/31/23
12/31/22
12/31/21
NET
ASSET
VALUE
Beginning
of
period
$
8.48
$
7.91
$
9.92
$
10.36
$
9.73
Investment
activities
Net
investment
income
(2)(3)
0.32
0.27
0.22
0.21
0.16
Net
realized
and
unrealized
gain/loss
0.04
0.56
(1.33)
(0.32)
0.67
Total
from
investment
activities
0.36
0.83
(1.11)
(0.11)
0.83
Distributions
Net
investment
income
(0.31)
(0.03)
(0.22)
(0.21)
(0.03)
Net
realized
gain
—
—
(0.68)
(0.12)
(0.06)
Tax
return
of
capital
—
(0.23)
—
—
(0.11)
Total
distributions
(0.31)
(0.26)
(0.90)
(0.33)
(0.20)
NET
ASSET
VALUE
End
of
period
$
8.53
$
8.48
$
7.91
$
9.92
$
10.36
T.
ROWE
PRICE
International
Bond
Fund
(USD
Hedged)
For
a
share
outstanding
throughout
each
period
The
accompanying
notes
are
an
integral
part
of
these
financial
statements.
Z
Class
(1)
..
Year
..
..
Ended
.
3/16/20
(1)
Through
12/31/20
12/31/24
12/31/23
12/31/22
12/31/21
Ratios/Supplemental
Data
Total
return
(3)(4)
4.37%
10.72%
(11.43)%
(1.05)%
8.57%
Ratios
to
average
net
assets:
(3)
Gross
expenses
before
waivers/payments
by
Price
Associates
0.50%
0.51%
0.51%
0.50%
0.50%
(5)
Net
expenses
after
waivers/payments
by
Price
Associates
0.00%
0.00%
0.00%
0.00%
0.00%
(5)
Net
investment
income
3.83%
3.37%
2.44%
2.10%
1.94%
(5)
Portfolio
turnover
rate
54.5%
68.9%
74.6%
35.3%
49.4%
Net
assets,
end
of
period
(in
millions)
$5,168
$4,488
$4,359
$5,334
$4,808
0%
0%
0%
0%
0%
(1)
Inception
date
(2)
Per
share
amounts
calculated
using
average
shares
outstanding
method.
(3)
Includes
the
impact
of
expense-related
arrangements
with
Price
Associates.
(4)
Total
return
reflects
the
rate
that
an
investor
would
have
earned
on
an
investment
in
the
fund
during
each
period,
assuming
reinvestment
of
all
distributions,
and
payment
of
no
redemption
or
account
fees,
if
applicable.
Total
return
is
not
annualized
for
periods
less
than
one
year.
(5)
Annualized
T.
ROWE
PRICE
International
Bond
Fund
(USD
Hedged)
December
31,
2024
Par/Shares
$
Value
(
Cost
and
value
in
$000s)
‡
ALBANIA 0.4%
Government
Bonds 0.4%
Republic
of
Albania,
3.50%,
6/16/27
(EUR) (1)
4,085,000
4,176
Republic
of
Albania,
5.90%,
6/9/28
(EUR) (1)
15,580,000
16,792
Republic
of
Albania,
5.90%,
6/9/28
(EUR)
5,200,000
5,604
Total
Albania
(Cost
$27,021)
26,572
AUSTRALIA 2.8%
Corporate
Bonds 0.8%
APA
Infrastructure,
2.00%,
3/22/27
(EUR)
2,580,000
2,614
APA
Infrastructure,
3.50%,
3/22/30
(GBP)
5,500,000
6,311
AusNet
Services
Holdings,
1.50%,
2/26/27
(EUR)
2,615,000
2,633
Brambles
Finance,
4.25%,
3/22/31
(EUR)
7,660,000
8,382
NBN,
4.125%,
3/15/29
(EUR)
11,070,000
12,015
Sydney
Airport
Finance,
1.75%,
4/26/28
(EUR) (2)
2,630,000
2,625
Sydney
Airport
Finance,
4.375%,
5/3/33
(EUR)
8,150,000
8,923
Transurban
Finance,
1.75%,
3/29/28
(EUR)
2,620,000
2,612
Transurban
Finance,
3.00%,
4/8/30
(EUR)
11,250,000
11,562
57,677
Government
Bonds 2.0%
Commonwealth
of
Australia,
Series
140,
4.50%,
4/21/33
126,357,000
79,344
Commonwealth
of
Australia,
Series
150,
3.00%,
3/21/47
35,872,000
16,559
New
South
Wales
Treasury,
Series
26,
4.00%,
5/20/26
76,060,600
47,047
142,950
Total
Australia
(Cost
$233,359)
200,627
AUSTRIA 0.7%
Corporate
Bonds 0.1%
Mondi
Finance
Europe,
2.375%,
4/1/28
2,505,000
2,556
2,556
Government
Bonds 0.6%
Republic
of
Austria,
0.75%,
3/20/51 (1)
48,284,000
29,819
Republic
of
Austria,
3.15%,
10/20/53 (1)
14,055,000
14,723
44,542
Total
Austria
(Cost
$48,460)
47,098
T.
ROWE
PRICE
International
Bond
Fund
(USD
Hedged)
Par/Shares
$
Value
(Cost
and
value
in
$000s)
BELGIUM 0.1%
Corporate
Bonds 0.1%
Anheuser-Busch
InBev,
1.15%,
1/22/27
2,600,000
2,616
Anheuser-Busch
InBev,
1.65%,
3/28/31
1,465,000
1,406
Total
Belgium
(Cost
$4,152)
4,022
BRAZIL 0.9%
Corporate
Bonds 0.1%
Braskem
Netherlands
Finance,
4.50%,
1/31/30
(USD)
3,114,000
2,639
MercadoLibre,
3.125%,
1/14/31
(USD)
3,470,000
3,009
5,648
Government
Bonds 0.8%
Brazil
Notas
do
Tesouro
Nacional,
Series
NTNF,
10.00%,
1/1/31
122,664,000
15,825
Brazil
Notas
do
Tesouro
Nacional,
Series
NTNF,
10.00%,
1/1/35
347,570,000
42,257
58,082
Total
Brazil
(Cost
$80,611)
63,730
BULGARIA 0.4%
Government
Bonds 0.4%
Republic
of
Bulgaria,
4.50%,
1/27/33
(EUR) (1)
8,790,000
9,903
Republic
of
Bulgaria,
4.50%,
1/27/33
(EUR)
14,433,000
16,261
Total
Bulgaria
(Cost
$24,894)
26,164
CANADA 9.2%
Asset-Backed
Securities 0.1%
Cologix
Canadian
Issuer,
Series
2022-1CAN,
Class
A2,
4.94%,
1/25/52 (1)
8,230,000
5,549
5,549
Corporate
Bonds 0.6%
Magna
International,
1.50%,
9/25/27
(EUR)
2,620,000
2,617
Royal
Bank
of
Canada,
4.125%,
7/5/28
(EUR)
2,385,000
2,575
TER
Finance
Jersey,
Series
21,
Zero
Coupon,
1/2/25
(USD) (1)(3)
17,400,000
17,396
Toronto-Dominion
Bank,
2.551%,
8/3/27
(EUR)
2,535,000
2,602
T.
ROWE
PRICE
International
Bond
Fund
(USD
Hedged)
Par/Shares
$
Value
(Cost
and
value
in
$000s)
Transcanada
Trust,
Series
17-B,
VR,
4.65%,
5/18/77 (4)
27,134,000
18,735
43,925
Government
Bonds 8.5%
Canadian
Treasury
Bill,
3.44%,
3/12/25
299,515,000
207,088
Canadian
Treasury
Bill,
3.451%,
2/27/25
200,000,000
138,437
Government
of
Canada,
Series
0318,
4.00%,
3/1/29
174,716,000
126,519
Government
of
Canada
Real
Return
Bond,
Inflation-Indexed,
Series
CPI,
4.00%,
12/1/31
161,448,567
132,604
Province
of
Ontario,
3.50%,
6/2/43
5,239,000
3,306
607,954
Total
Canada
(Cost
$691,038)
657,428
CHILE 0.7%
Corporate
Bonds 0.3%
Corp.
Nacional
del
Cobre
de
Chile,
6.30%,
9/8/53
(USD) (1)
14,659,000
14,371
Interchile,
4.50%,
6/30/56
(USD)
7,113,000
5,751
20,122
Government
Bonds 0.4%
Bonos
de
la
Tesoreria
de
la
Republica
en
pesos,
5.80%,
10/1/34 (1)
25,375,000,000
25,421
Republic
of
Chile,
4.125%,
7/5/34
(EUR)
6,420,000
6,867
32,288
Total
Chile
(Cost
$54,549)
52,410
CHINA 7.7%
Corporate
Bonds 0.2%
State
Grid
Overseas
Investment
BVI,
1.375%,
5/2/25
(EUR) (1)
10,000,000
10,288
10,288
Government
Bonds 7.5%
China
Development
Bank,
Series
1905,
3.48%,
1/8/29
250,000,000
36,866
People's
Republic
of
China,
Series
INBK,
2.28%,
3/25/31
135,000,000
19,259
People's
Republic
of
China,
Series
INBK,
2.47%,
7/25/54
228,000,000
34,530
People's
Republic
of
China,
Series
INBK,
2.60%,
9/1/32
914,200,000
133,554
People's
Republic
of
China,
Series
INBK,
2.62%,
4/15/28
110,000,000
15,717
People's
Republic
of
China,
Series
INBK,
2.69%,
8/15/32
765,000,000
112,630
People's
Republic
of
China,
Series
INBK,
3.02%,
5/27/31
45,000,000
6,715
T.
ROWE
PRICE
International
Bond
Fund
(USD
Hedged)
Par/Shares
$
Value
(Cost
and
value
in
$000s)
People's
Republic
of
China,
Series
INBK,
3.13%,
11/21/29
370,000,000
54,871
People's
Republic
of
China,
Series
INBK,
3.32%,
4/15/52
399,000,000
69,471
People's
Republic
of
China,
Series
INBK,
3.53%,
10/18/51
217,000,000
38,921
People's
Republic
of
China,
Series
INBK,
4.00%,
6/24/69
64,000,000
13,864
536,398
Total
China
(Cost
$515,138)
546,686
COLOMBIA 1.1%
Government
Bonds 1.1%
Republic
of
Colombia,
Series
B,
6.00%,
4/28/28
79,667,000,000
15,917
Republic
of
Colombia,
Series
B,
7.00%,
3/26/31
146,658,800,000
27,338
Republic
of
Colombia,
Series
B,
7.25%,
10/18/34
74,967,300,000
12,682
Republic
of
Colombia,
Series
B,
13.25%,
2/9/33
90,056,200,000
22,112
Total
Colombia
(Cost
$81,976)
78,049
CYPRUS 0.4%
Government
Bonds 0.4%
Republic
of
Cyprus,
0.95%,
1/20/32
19,769,000
17,911
Republic
of
Cyprus,
1.50%,
4/16/27
2,130,000
2,157
Republic
of
Cyprus,
2.75%,
2/26/34
2,716,000
2,749
Republic
of
Cyprus,
2.75%,
5/3/49
2,832,000
2,507
Total
Cyprus
(Cost
$31,659)
25,324
CZECH
REPUBLIC 1.8%
Government
Bonds 1.8%
Republic
of
Czech,
Series
125,
1.50%,
4/24/40
3,004,200,000
84,435
Republic
of
Czech,
Series
151,
4.90%,
4/14/34
1,018,110,000
44,268
Total
Czech
Republic
(Cost
$134,700)
128,703
DENMARK 0.7%
Corporate
Bonds 0.7%
Carlsberg
Breweries,
0.375%,
6/30/27
(EUR)
2,735,000
2,676
Carlsberg
Breweries,
0.875%,
7/1/29
(EUR)
3,773,000
3,571
Danske
Bank,
VR,
0.75%,
6/9/29
(EUR) (4)
8,420,000
8,079
Danske
Bank,
VR,
1.375%,
2/17/27
(EUR) (4)
2,440,000
2,486
Danske
Bank,
VR,
1.375%,
2/12/30
(EUR) (4)
4,700,000
4,856
Danske
Bank,
VR,
4.50%,
11/9/28
(EUR) (4)
2,410,000
2,599
Orsted,
4.875%,
1/12/32
(GBP)
5,750,000
6,948
TDC
Net,
5.056%,
5/31/28
(EUR)
2,310,000
2,489
T.
ROWE
PRICE
International
Bond
Fund
(USD
Hedged)
Par/Shares
$
Value
(Cost
and
value
in
$000s)
TDC
Net,
5.618%,
2/6/30
(EUR)
13,970,000
15,336
Total
Denmark
(Cost
$49,408)
49,040
EGYPT 0.8%
Government
Bonds 0.8%
Arab
Republic
of
Egypt,
6.375%,
4/11/31
(EUR)
19,560,000
17,905
Arab
Republic
of
Egypt
Treasury
Bills,
Series
364D,
28.499%,
3/11/25
293,200,000
5,495
Arab
Republic
of
Egypt
Treasury
Bills,
Series
364D,
28.60%,
3/4/25
506,600,000
9,546
Arab
Republic
of
Egypt
Treasury
Bills,
Series
364D,
30.248%,
3/18/25
1,408,400,000
26,260
Total
Egypt
(Cost
$61,003)
59,206
ESTONIA 0.5%
Government
Bonds 0.5%
Republic
of
Estonia,
3.25%,
1/17/34 (2)
32,500,000
34,054
Total
Estonia
(Cost
$35,375)
34,054
FINLAND 0.1%
Corporate
Bonds 0.1%
Elisa,
0.25%,
9/15/27
2,760,000
2,666
Metso,
0.875%,
5/26/28
2,775,000
2,667
Total
Finland
(Cost
$5,596)
5,333
FRANCE 5.0%
Corporate
Bonds 1.5%
Altice
France,
3.375%,
1/15/28 (1)
505,000
395
Altice
France,
5.875%,
2/1/27 (1)
1,305,000
1,080
Banque
Federative
du
Credit
Mutuel,
1.25%,
5/26/27
3,000,000
2,991
Banque
Federative
du
Credit
Mutuel,
1.375%,
7/16/28
3,100,000
3,038
Banque
Federative
du
Credit
Mutuel,
3.125%,
9/14/27
2,500,000
2,600
Banque
Federative
du
Credit
Mutuel,
5.125%,
1/13/33
5,400,000
5,932
Banque
Stellantis
France,
4.00%,
1/21/27
2,400,000
2,533
BNP
Paribas,
VR,
2.125%,
1/23/27 (4)
9,300,000
9,549
BNP
Paribas,
VR,
3.875%,
1/10/31 (4)
4,000,000
4,278
BPCE,
0.25%,
1/14/31
7,100,000
6,174
BPCE,
3.50%,
1/25/28
5,500,000
5,785
Credit
Agricole,
0.875%,
1/14/32
1,000,000
870
T.
ROWE
PRICE
International
Bond
Fund
(USD
Hedged)
Par/Shares
$
Value
(Cost
and
value
in
$000s)
Credit
Agricole,
1.875%,
12/20/26
5,200,000
5,273
Credit
Agricole
Assurances,
VR,
2.625%,
1/29/48 (4)
6,000,000
6,021
Electricite
de
France,
6.125%,
6/2/34
(GBP)
7,200,000
9,091
EssilorLuxottica,
0.375%,
11/27/27
2,700,000
2,620
Holding
d'Infrastructures
de
Transport,
1.475%,
1/18/31
8,600,000
7,907
IPD
3,
8.00%,
6/15/28 (1)
1,825,000
1,992
Loxam,
6.375%,
5/15/28
3,795,000
4,084
Orange,
3.25%,
1/15/32
(GBP)
6,500,000
7,266
RTE
Reseau
de
Transport
d'Electricite
SADIR,
0.75%,
1/12/34
7,200,000
5,949
Veolia
Environnement,
1.25%,
4/2/27
2,000,000
2,000
Veolia
Environnement,
1.94%,
1/7/30
5,700,000
5,603
103,031
Government
Bonds 3.5%
Republic
of
France,
Series
OAT,
1.25%,
5/25/36 (1)
86,453,000
72,484
Republic
of
France,
Series
OAT,
2.50%,
5/25/30 (1)
66,735,000
68,402
Republic
of
France,
Series
OAT,
2.75%,
2/25/30 (1)
69,977,000
72,594
Republic
of
France,
Series
OAT,
4.00%,
4/25/55 (1)
35,640,000
38,723
252,203
Total
France
(Cost
$378,752)
355,234
GERMANY 4.4%
Corporate
Bonds 1.1%
Daimler
Truck
International
Finance,
1.625%,
4/6/27
2,600,000
2,623
E.ON
International
Finance,
6.25%,
6/3/30
(GBP)
11,400,000
14,985
Fresenius,
1.625%,
10/8/27
2,635,000
2,657
Fresenius,
5.00%,
11/28/29
5,200,000
5,825
Gruenenthal,
3.625%,
11/15/26 (1)
990,000
1,023
Gruenenthal,
4.625%,
11/15/31 (1)
160,000
167
Gruenenthal,
6.75%,
5/15/30 (1)
530,000
586
Gruenenthal,
6.75%,
5/15/30
3,500,000
3,866
Hannover
Rueck,
1.125%,
4/18/28
2,600,000
2,563
Hannover
Rueck,
VR,
1.125%,
10/9/39 (4)
11,500,000
10,707
Hannover
Rueck,
VR,
1.75%,
10/8/40 (4)
4,800,000
4,527
Knorr-Bremse,
3.25%,
9/21/27
2,500,000
2,616
ProGroup,
5.375%,
4/15/31 (1)
2,755,000
2,779
TK
Elevator
Midco,
4.375%,
7/15/27 (1)(2)
2,745,000
2,836
Volkswagen
Bank,
4.375%,
5/3/28
2,400,000
2,564
Volkswagen
Financial
Services,
0.375%,
2/12/30
10,300,000
9,039
Volkswagen
International
Finance,
Series
10Y,
1.875%,
3/30/27
1,300,000
1,307
T.
ROWE
PRICE
International
Bond
Fund
(USD
Hedged)
Par/Shares
$
Value
(Cost
and
value
in
$000s)
Volkswagen
Leasing,
1.50%,
6/19/26
5,135,000
5,198
Volkswagen
Leasing,
1.625%,
8/15/25
5,350,000
5,492
81,360
Government
Bonds 3.3%
Bundesobligation,
Series
184,
0.00%,
10/9/26
56,436,000
56,406
Bundesrepublik
Deutschland
Bundesanleihe,
0.00%,
8/15/52
14,735,200
7,617
Bundesrepublik
Deutschland
Bundesanleihe,
2.50%,
8/15/54
37,696,000
38,234
Deutsche
Bundesrepublik,
Inflation-Indexed,
0.50%,
4/15/30
122,936,176
127,585
KfW,
4.70%,
6/2/37
(CAD)
5,202,000
3,824
233,666
Total
Germany
(Cost
$331,928)
315,026
GREECE 0.2%
Government
Bonds 0.2%
Hellenic
Republic,
0.75%,
6/18/31 (1)
17,599,000
15,995
Total
Greece
(Cost
$21,199)
15,995
HUNGARY 0.3%
Corporate
Bonds 0.1%
OTP
Bank,
VR,
7.35%,
3/4/26
(EUR) (4)
5,290,000
5,510
5,510
Government
Bonds 0.2%
Magyar
Export-Import
Bank,
6.00%,
5/16/29
(EUR)
4,370,000
4,899
Republic
of
Hungary,
Series
33/A,
2.25%,
4/20/33
2,496,670,000
4,608
Republic
of
Hungary,
Series
4Y,
5.00%,
2/22/27
(EUR)
8,464,000
9,099
18,606
Total
Hungary
(Cost
$24,131)
24,116
ICELAND 0.4%
Corporate
Bonds 0.1%
Landsbankinn,
0.375%,
5/23/25
(EUR)
8,060,000
8,271
8,271
Government
Bonds 0.3%
Republic
of
Iceland,
0.00%,
4/15/28
(EUR)
10,385,000
9,916
T.
ROWE
PRICE
International
Bond
Fund
(USD
Hedged)
Par/Shares
$
Value
(Cost
and
value
in
$000s)
Republic
of
Iceland,
3.50%,
3/21/34
(EUR)
8,096,000
8,770
18,686
Total
Iceland
(Cost
$30,379)
26,957
INDIA 1.2%
Government
Bonds 1.2%
Republic
of
India,
6.54%,
1/17/32
3,011,080,000
34,775
Republic
of
India,
7.26%,
8/22/32
4,449,100,000
53,479
Total
India
(Cost
$88,745)
88,254
INDONESIA 3.0%
Corporate
Bonds 0.2%
Freeport
Indonesia,
4.763%,
4/14/27
(USD) (2)
9,400,000
9,319
Minejesa
Capital,
5.625%,
8/10/37
(USD)
3,965,000
3,690
13,009
Government
Bonds 2.8%
Republic
of
Indonesia,
3.75%,
6/14/28
(EUR)
40,797,000
42,843
Republic
of
Indonesia,
Series
FR86,
5.50%,
4/15/26
473,000,000,000
28,833
Republic
of
Indonesia,
Series
FR91,
6.375%,
4/15/32
345,120,000,000
20,637
Republic
of
Indonesia,
Series
FR95,
6.375%,
8/15/28
153,888,000,000
9,382
Republic
of
Indonesia,
Series
FR96,
7.00%,
2/15/33
1,360,474,000,000
84,407
Republic
of
Indonesia,
Series
101,
6.875%,
4/15/29
290,698,000,000
17,988
204,090
Total
Indonesia
(Cost
$230,438)
217,099
IRELAND 0.1%
Corporate
Bonds 0.0%
Smurfit
Kappa
Treasury,
1.50%,
9/15/27
2,650,000
2,659
2,659
Government
Bonds 0.1%
Republic
of
Ireland,
1.50%,
5/15/50
2,696,000
2,111
Republic
of
Ireland,
2.00%,
2/18/45
5,630,000
5,012
7,123
Total
Ireland
(Cost
$13,442)
9,782
T.
ROWE
PRICE
International
Bond
Fund
(USD
Hedged)
Par/Shares
$
Value
(Cost
and
value
in
$000s)
ISRAEL 0.3%
Government
Bonds 0.3%
State
of
Israel,
1.50%,
1/18/27
(EUR)
21,304,000
21,183
Total
Israel
(Cost
$25,076)
21,183
ITALY 2.3%
Corporate
Bonds 0.7%
Aeroporti
di
Roma,
1.625%,
6/8/27
2,575,000
2,596
Autostrade
per
l'Italia,
1.625%,
1/25/28 (2)
2,680,000
2,656
Autostrade
per
l'Italia,
2.00%,
12/4/28
6,245,000
6,174
Autostrade
per
l'Italia,
2.00%,
1/15/30
5,620,000
5,420
CA
Auto
Bank,
4.75%,
1/25/27
2,395,000
2,560
Inter
Media
&
Communication,
6.75%,
2/9/27
5,303,935
5,588
Intesa
Sanpaolo,
1.75%,
7/4/29
12,399,000
12,151
Italgas,
1.625%,
1/19/27
2,570,000
2,609
Snam,
0.875%,
10/25/26
6,950,000
6,968
46,722
Government
Bonds 1.6%
Italy
Buoni
Poliennali
Del
Tesoro,
Series
30Y,
4.50%,
10/1/53 (1)
30,122,000
33,240
Italy
Buoni
Poliennali
Del
Tesoro,
Series
50Y,
2.80%,
3/1/67
29,785,000
23,585
Italy
Buoni
Poliennali
Del
Tesoro,
Series
CPI,
1.30%,
5/15/28 (1)
54,449,493
56,964
113,789
Total
Italy
(Cost
$173,039)
160,511
IVORY
COAST 0.3%
Government
Bonds 0.3%
Republic
of
Ivory
Coast,
5.875%,
10/17/31
(EUR) (2)
22,575,000
21,946
Total
Ivory
Coast
(Cost
$21,409)
21,946
JAPAN 11.0%
Government
Bonds 11.0%
Government
of
Japan,
Series
16,
1.30%,
3/20/63
2,914,000,000
13,101
Government
of
Japan,
Series
20,
Inflation-Indexed,
0.10%,
3/10/25
10,570,530,000
67,452
T.
ROWE
PRICE
International
Bond
Fund
(USD
Hedged)
Par/Shares
$
Value
(Cost
and
value
in
$000s)
Government
of
Japan,
Series
26,
Inflation-Indexed,
0.005%,
3/10/31
9,643,184,380
64,735
Government
of
Japan,
Series
27,
Inflation-Indexed,
0.005%,
3/10/32
4,551,429,400
30,430
Government
of
Japan,
Series
28,
Inflation-Indexed,
0.005%,
3/10/33
3,502,753,664
23,282
Government
of
Japan,
Series
29,
Inflation-Indexed,
0.005%,
3/10/34
18,993,399,864
125,516
Government
of
Japan,
Series
44,
1.70%,
9/20/44
14,906,150,000
92,128
Government
of
Japan,
Series
74,
1.00%,
3/20/52
14,495,300,000
69,960
Government
of
Japan,
Series
75,
1.30%,
6/20/52
10,616,750,000
55,177
Government
of
Japan,
Series
76,
1.40%,
9/20/52
9,384,900,000
49,832
Government
of
Japan,
Series
83,
2.20%,
6/20/54
3,454,650,000
21,772
Government
of
Japan,
Series
338,
0.40%,
3/20/25
13,396,000,000
85,180
Japan
Treasury
Discount
Bill,
Series
1273,
0.13%,
3/17/25
13,000,000,000
82,586
Total
Japan
(Cost
$957,315)
781,151
KUWAIT 0.2%
Corporate
Bonds 0.2%
MEGlobal,
2.625%,
4/28/28
(USD) (1)
9,170,000
8,308
MEGlobal,
2.625%,
4/28/28
(USD)
8,220,000
7,448
Total
Kuwait
(Cost
$16,804)
15,756
LATVIA 1.4%
Government
Bonds 1.4%
Republic
of
Latvia,
0.375%,
10/7/26
(EUR)
86,021,000
85,655
Republic
of
Latvia,
3.875%,
5/22/29
(EUR)
15,752,000
16,978
Total
Latvia
(Cost
$110,079)
102,633
LITHUANIA 0.9%
Government
Bonds 0.9%
Republic
of
Lithuania,
3.50%,
2/13/34
17,920,000
18,992
Republic
of
Lithuania,
3.875%,
6/14/33
38,084,000
41,794
Total
Lithuania
(Cost
$59,967)
60,786
LUXEMBOURG 0.4%
Corporate
Bonds 0.4%
Albion
Financing
1,
5.25%,
10/15/26
3,200,000
3,338
Altice
Financing,
4.25%,
8/15/29 (1)
1,775,000
1,391
T.
ROWE
PRICE
International
Bond
Fund
(USD
Hedged)
Par/Shares
$
Value
(Cost
and
value
in
$000s)
Blackstone
Property
Partners
Europe
Holdings,
1.75%,
3/12/29
9,970,000
9,590
Logicor
Financing,
0.875%,
1/14/31
7,100,000
6,249
Logicor
Financing,
3.25%,
11/13/28
10,800,000
11,150
Total
Luxembourg
(Cost
$34,482)
31,718
MACAO 0.4%
Corporate
Bonds 0.4%
Melco
Resorts
Finance,
4.875%,
6/6/25
(USD)
5,175,000
5,147
MGM
China
Holdings,
7.125%,
6/26/31
(USD) (1)
6,440,000
6,533
Sands
China,
3.80%,
1/8/26
(USD)
7,500,000
7,360
Wynn
Macau,
5.50%,
1/15/26
(USD)
6,500,000
6,442
Total
Macao
(Cost
$25,318)
25,482
MALAYSIA 3.3%
Government
Bonds 3.3%
Government
of
Malaysia,
Series
0119,
3.906%,
7/15/26
178,500,000
40,221
Government
of
Malaysia,
Series
0120,
4.065%,
6/15/50
79,874,000
17,608
Government
of
Malaysia,
Series
0216,
4.736%,
3/15/46
402,240,000
97,710
Government
of
Malaysia,
Series
0316,
3.90%,
11/30/26
25,840,000
5,831
Government
of
Malaysia,
Series
0318,
4.642%,
11/7/33
171,696,000
40,714
Government
of
Malaysia,
Series
0518,
4.921%,
7/6/48
134,996,000
33,714
Total
Malaysia
(Cost
$233,893)
235,798
MEXICO 2.0%
Corporate
Bonds 0.4%
America
Movil,
5.75%,
6/28/30
(GBP)
6,670,000
8,621
BBVA
Bancomer,
VR,
5.125%,
1/18/33
(USD) (4)
10,125,000
9,426
Bimbo
Bakeries
USA,
6.05%,
1/15/29
(USD) (1)
12,025,000
12,296
30,343
Government
Bonds 1.6%
Petroleos
Mexicanos,
4.875%,
2/21/28
(EUR)
20,890,000
20,522
United
Mexican
States,
Series
M,
7.50%,
5/26/33
493,709,000
20,029
United
Mexican
States,
Series
M,
8.50%,
5/31/29
1,196,115,000
54,362
United
Mexican
States,
Series
M,
8.50%,
11/18/38
402,020,000
16,450
111,363
Total
Mexico
(Cost
$156,836)
141,706
T.
ROWE
PRICE
International
Bond
Fund
(USD
Hedged)
Par/Shares
$
Value
(Cost
and
value
in
$000s)
MONTENEGRO 0.2%
Government
Bonds 0.2%
Republic
of
Montenegro,
7.25%,
3/12/31
(USD) (1)
15,190,000
15,607
Total
Montenegro
(Cost
$15,326)
15,607
MOROCCO 0.2%
Government
Bonds 0.2%
Kingdom
of
Morocco,
1.375%,
3/30/26
(EUR) (2)
12,030,000
12,128
Total
Morocco
(Cost
$12,751)
12,128
NETHERLANDS 0.7%
Corporate
Bonds 0.7%
Cooperatieve
Rabobank,
4.625%,
5/23/29
(GBP)
100,000
122
ING
Groep,
VR,
0.375%,
9/29/28 (4)
2,800,000
2,701
ING
Groep,
VR,
1.25%,
2/16/27 (4)
8,800,000
8,944
ING
Groep,
VR,
4.75%,
5/23/34 (4)
6,000,000
6,720
Nationale-Nederlanden
Bank,
0.375%,
2/26/25
5,300,000
5,466
NN
Group,
1.625%,
6/1/27
2,575,000
2,616
Sartorius
Finance,
4.50%,
9/14/32
8,000,000
8,719
Universal
Music
Group,
3.00%,
6/30/27
2,470,000
2,566
VZ
Secured
Financing,
3.50%,
1/15/32 (2)
3,900,000
3,747
Wolters
Kluwer,
1.50%,
3/22/27
2,585,000
2,611
Ziggo,
2.875%,
1/15/30
2,720,000
2,635
Total
Netherlands
(Cost
$47,868)
46,847
NEW
ZEALAND 0.1%
Corporate
Bonds 0.1%
Chorus,
3.625%,
9/7/29
(EUR)
8,130,000
8,584
Total
New
Zealand
(Cost
$8,575)
8,584
NORTH
MACEDONIA 0.1%
Government
Bonds 0.1%
Republic
of
North
Macedonia,
6.96%,
3/13/27
(EUR) (1)
5,430,000
5,870
Total
North
Macedonia
(Cost
$5,766)
5,870
T.
ROWE
PRICE
International
Bond
Fund
(USD
Hedged)
Par/Shares
$
Value
(Cost
and
value
in
$000s)
NORWAY 0.1%
Corporate
Bonds 0.1%
Avinor,
0.75%,
10/1/30
(EUR)
7,202,000
6,568
Total
Norway
(Cost
$6,611)
6,568
PERU 0.4%
Government
Bonds 0.4%
Republic
of
Peru,
5.40%,
8/12/34
98,738,000
23,975
Republic
of
Peru,
Series
REGS,
5.40%,
8/12/34
15,306,000
3,716
Total
Peru
(Cost
$26,183)
27,691
PHILIPPINES 0.1%
Government
Bonds 0.1%
Republic
of
Philippines,
0.25%,
4/28/25
(EUR)
4,245,000
4,347
Total
Philippines
(Cost
$5,102)
4,347
POLAND 1.7%
Government
Bonds 1.7%
Republic
of
Poland,
3.875%,
10/22/39
(EUR)
33,950,000
35,430
Republic
of
Poland,
Series
10Y,
3.625%,
1/11/34
(EUR)
24,550,000
25,985
Republic
of
Poland,
Series
1034,
5.00%,
10/25/34
256,306,000
58,218
Total
Poland
(Cost
$124,460)
119,633
PORTUGAL 0.2%
Corporate
Bonds 0.2%
Banco
Comercial
Portugues,
VR,
1.125%,
2/12/27 (4)
5,800,000
5,888
Banco
Comercial
Portugues,
VR,
1.75%,
4/7/28 (2)(4)
3,500,000
3,521
Banco
Comercial
Portugues,
VR,
6.888%,
12/7/27 (4)
3,900,000
4,394
Total
Portugal
(Cost
$13,479)
13,803
QATAR 0.3%
Corporate
Bonds 0.3%
QatarEnergy,
3.125%,
7/12/41
(USD)
13,050,000
9,654
QNB
Finance,
2.75%,
2/12/27
(USD) (2)
8,200,000
7,832
QNB
Finance,
4.875%,
1/30/29
(USD)
3,525,000
3,498
Total
Qatar
(Cost
$21,383)
20,984
T.
ROWE
PRICE
International
Bond
Fund
(USD
Hedged)
Par/Shares
$
Value
(Cost
and
value
in
$000s)
ROMANIA 0.3%
Corporate
Bonds 0.3%
Banca
Transilvania,
VR,
8.875%,
4/27/27
(EUR) (4)
11,240,000
12,332
RCS
&
RDS,
3.25%,
2/5/28
(EUR) (2)
6,300,000
6,319
Total
Romania
(Cost
$18,541)
18,651
SERBIA 1.1%
Corporate
Bonds 0.0%
United
Group,
4.625%,
8/15/28
(EUR) (1)
3,105,000
3,202
3,202
Government
Bonds 1.1%
Republic
of
Serbia,
1.00%,
9/23/28
(EUR) (1)
26,075,000
24,286
Republic
of
Serbia,
1.50%,
6/26/29
(EUR)
13,215,000
12,352
Republic
of
Serbia,
3.125%,
5/15/27
(EUR) (2)
40,220,000
41,095
77,733
Total
Serbia
(Cost
$88,545)
80,935
SINGAPORE 1.2%
Government
Bonds 1.2%
Government
of
Singapore,
0.50%,
11/1/25
44,175,000
31,726
Government
of
Singapore,
2.375%,
6/1/25
32,070,000
23,421
Government
of
Singapore,
2.875%,
7/1/29
40,189,000
29,483
Total
Singapore
(Cost
$82,628)
84,630
SLOVENIA 0.3%
Corporate
Bonds 0.0%
Summer
BidCo,
10.00%,
2/15/29,
(10.00%
Cash
or
10.75%
PIK) (1)(5)
428,660
455
455
Government
Bonds 0.3%
Republic
of
Slovenia,
Series
RS74,
1.50%,
3/25/35
14,085,000
12,661
Republic
of
Slovenia,
Series
RS77,
2.25%,
3/3/32
7,145,000
7,159
Republic
of
Slovenia,
Series
RS86,
0.00%,
2/12/31
4,975,000
4,396
24,216
Total
Slovenia
(Cost
$28,463)
24,671
T.
ROWE
PRICE
International
Bond
Fund
(USD
Hedged)
Par/Shares
$
Value
(Cost
and
value
in
$000s)
SOUTH
AFRICA 0.9%
Corporate
Bonds 0.1%
Anglo
American
Capital,
3.375%,
3/11/29
(GBP)
5,340,000
6,240
6,240
Government
Bonds 0.8%
Republic
of
South
Africa,
Series
2035,
8.875%,
2/28/35
1,252,774,000
60,481
60,481
Total
South
Africa
(Cost
$71,009)
66,721
SOUTH
KOREA 0.2%
Corporate
Bonds 0.2%
GS
Caltex,
1.625%,
7/27/25
(USD)
5,400,000
5,291
Shinhan
Bank,
4.50%,
4/12/28
(USD) (1)
12,100,000
11,931
Total
South
Korea
(Cost
$17,345)
17,222
SPAIN 2.5%
Corporate
Bonds 1.2%
Banco
Bilbao
Vizcaya
Argentaria,
3.375%,
9/20/27
7,900,000
8,331
Banco
Bilbao
Vizcaya
Argentaria,
VR,
5.75%,
9/15/33 (4)
2,700,000
2,975
Banco
de
Sabadell,
VR,
0.875%,
6/16/28 (4)
6,600,000
6,503
Banco
de
Sabadell,
VR,
5.00%,
6/7/29 (4)
2,300,000
2,528
Banco
de
Sabadell,
VR,
5.125%,
11/10/28 (4)
5,100,000
5,580
Banco
Santander,
1.125%,
1/17/25
5,800,000
6,004
CaixaBank,
3.75%,
9/7/29
9,300,000
9,998
CaixaBank,
VR,
0.75%,
5/26/28 (4)
2,700,000
2,661
CaixaBank,
VR,
6.25%,
2/23/33 (4)
2,600,000
2,882
Cellnex
Telecom,
1.75%,
10/23/30 (2)
13,000,000
12,378
Cirsa
Finance
International,
7.875%,
7/31/28 (1)
4,415,000
4,831
EDP
Servicios
Financieros
Espana,
4.375%,
4/4/32
5,143,000
5,641
Inmobiliaria
Colonial
Socimi,
1.625%,
11/28/25
7,300,000
7,480
Lorca
Telecom
Bondco,
4.00%,
9/18/27
8,700,000
9,008
86,800
Government
Bonds 1.3%
Kingdom
of
Spain,
0.00%,
1/31/28
72,696,000
70,023
T.
ROWE
PRICE
International
Bond
Fund
(USD
Hedged)
Par/Shares
$
Value
(Cost
and
value
in
$000s)
Kingdom
of
Spain,
1.90%,
10/31/52 (1)
25,872,000
18,763
88,786
Total
Spain
(Cost
$177,379)
175,586
SRI
LANKA 0.2%
Government
Bonds 0.2%
Republic
of
Sri
Lanka,
Series
A,
11.40%,
1/15/27
1,227,000,000
4,335
Republic
of
Sri
Lanka,
Series
A,
11.50%,
8/1/26
1,063,000,000
3,744
Republic
of
Sri
Lanka,
Series
A,
20.00%,
9/15/27
1,544,000,000
6,523
Total
Sri
Lanka
(Cost
$12,129)
14,602
SWEDEN 0.6%
Corporate
Bonds 0.2%
Autoliv,
4.25%,
3/15/28
(EUR)
2,365,000
2,521
Electrolux,
4.50%,
9/29/28
(EUR)
2,415,000
2,584
Skandinaviska
Enskilda
Banken,
0.375%,
6/21/28
(EUR)
2,865,000
2,712
Tele2,
2.125%,
5/15/28
(EUR)
2,575,000
2,585
Verisure
Holding,
3.875%,
7/15/26
(EUR) (1)
1,600,000
1,649
Verisure
Holding,
9.25%,
10/15/27
(EUR)
2,880,000
3,124
15,175
Government
Bonds 0.4%
Kingdom
of
Sweden,
Inflation-Indexed,
Series
3111,
0.125%,
6/1/32
314,610,965
27,068
27,068
Total
Sweden
(Cost
$44,357)
42,243
SWITZERLAND 0.3%
Corporate
Bonds 0.3%
ABB
Finance,
3.25%,
1/16/27
(EUR)
2,400,000
2,521
ABB
Finance,
3.375%,
1/16/31
(EUR)
4,445,000
4,722
Holcim
Finance
Luxembourg,
2.25%,
5/26/28
(EUR)
2,555,000
2,603
UBS
Group,
VR,
2.875%,
4/2/32
(EUR) (4)
7,050,000
7,102
UBS
Group,
VR,
7.75%,
3/1/29
(EUR) (4)
6,929,000
8,173
Total
Switzerland
(Cost
$24,091)
25,121
T.
ROWE
PRICE
International
Bond
Fund
(USD
Hedged)
Par/Shares
$
Value
(Cost
and
value
in
$000s)
TANZANIA 0.1%
Corporate
Bonds 0.1%
HTA
Group,
7.50%,
6/4/29
(USD) (1)
9,465,000
9,646
Total
Tanzania
(Cost
$9,426)
9,646
THAILAND 0.1%
Corporate
Bonds 0.1%
Bangkok
Bank,
VR,
3.733%,
9/25/34
(USD) (4)
7,545,000
6,844
Total
Thailand
(Cost
$7,039)
6,844
UNITED
ARAB
EMIRATES 0.3%
Corporate
Bonds 0.3%
DP
World,
5.25%,
12/24/29
(USD)
17,900,000
18,013
Total
United
Arab
Emirates
(Cost
$17,900)
18,013
UNITED
KINGDOM 4.4%
Corporate
Bonds 2.1%
Barclays,
VR,
0.577%,
8/9/29
(EUR) (4)
5,175,000
4,894
Barclays,
VR,
0.877%,
1/28/28
(EUR) (4)
2,695,000
2,672
Barclays,
VR,
6.369%,
1/31/31 (4)
4,650,000
6,030
Deuce
Finco,
5.50%,
6/15/27 (1)(2)
1,600,000
1,956
Heathrow
Funding,
2.75%,
10/13/29
8,360,000
9,393
HSBC
Holdings,
VR,
4.752%,
3/10/28
(EUR) (4)
10,715,000
11,491
Jerrold
Finco,
5.25%,
1/15/27
2,800,000
3,451
Jerrold
Finco,
7.875%,
4/15/30 (1)
345,000
437
Kane
Bidco,
5.00%,
2/15/27
(EUR)
8,420,000
8,707
Legal
&
General
Group,
VR,
5.375%,
10/27/45 (4)
5,685,000
7,101
London
Stock
Exchange
Group,
1.75%,
12/6/27
(EUR)
2,610,000
2,628
Marks
&
Spencer,
6.00%,
6/12/25
1,713,000
2,149
Motion
Finco,
7.375%,
6/15/30
(EUR) (1)
6,345,000
6,677
National
Grid
Electricity
Distribution
East
Midlands,
3.53%,
9/20/28
(EUR)
2,455,000
2,589
Nationwide
Building
Society,
VR,
1.50%,
3/8/26
(EUR) (4)
2,770,000
2,863
NatWest
Group,
VR,
0.67%,
9/14/29
(EUR) (4)
5,250,000
4,974
NatWest
Group,
VR,
0.78%,
2/26/30
(EUR) (4)
2,014,000
1,899
NatWest
Group,
VR,
1.043%,
9/14/32
(EUR) (4)
5,075,000
4,935
Next
Group,
3.625%,
5/18/28
7,491,000
9,003
Next
Group,
4.375%,
10/2/26
982,000
1,217
T.
ROWE
PRICE
International
Bond
Fund
(USD
Hedged)
Par/Shares
$
Value
(Cost
and
value
in
$000s)
Santander
U.K.
Group
Holdings,
VR,
0.603%,
9/13/29
(EUR) (4)
6,475,000
6,078
Santander
U.K.
Group
Holdings,
VR,
2.421%,
1/17/29 (4)
3,320,000
3,813
Santander
U.K.
Group
Holdings,
VR,
3.53%,
8/25/28
(EUR) (4)
5,300,000
5,545
Severn
Trent
Utilities
Finance,
4.625%,
11/30/34
5,970,000
6,959
Smiths
Group,
2.00%,
2/23/27
(EUR)
2,535,000
2,575
Standard
Chartered,
VR,
2.50%,
9/9/30
(EUR) (4)
6,670,000
6,863
Tesco
Corporate
Treasury
Services,
0.875%,
5/29/26
(EUR)
5,250,000
5,304
Tesco
Corporate
Treasury
Services,
2.75%,
4/27/30
4,850,000
5,398
Vmed
O2
U.K.
Financing
I,
4.50%,
7/15/31 (1)
5,145,000
5,491
Vmed
O2
U.K.
Financing
I,
4.50%,
7/15/31
5,630,000
6,009
149,101
Government
Bonds 2.3%
United
Kingdom
Gilt,
0.625%,
10/22/50
6,159,001
2,881
United
Kingdom
Gilt,
3.25%,
1/22/44
73,679,000
71,826
United
Kingdom
Gilt,
4.25%,
12/7/46
81,611,797
90,758
165,465
Total
United
Kingdom
(Cost
$338,778)
314,566
UNITED
STATES 4.2%
Corporate
Bonds 4.0%
AbbVie,
2.125%,
11/17/28
(EUR)
2,605,000
2,638
AbbVie,
2.625%,
11/15/28
(EUR)
5,967,000
6,137
American
Honda
Finance,
0.75%,
11/25/26
(GBP)
4,097,000
4,767
AT&T,
3.95%,
4/30/31
(EUR)
13,150,000
14,196
Athene
Global
Funding,
0.832%,
1/8/27
(EUR)
6,150,000
6,105
Bank
of
America,
VR,
1.662%,
4/25/28
(EUR) (4)
2,610,000
2,626
Becton
Dickinson
&
Company,
3.02%,
5/24/25
(GBP)
7,393,000
9,166
Becton
Dickinson
&
Company,
3.519%,
2/8/31
(EUR)
3,520,000
3,704
Becton
Dickinson
Euro
Finance,
0.334%,
8/13/28
(EUR)
4,290,000
4,059
Becton
Dickinson
Euro
Finance,
1.213%,
2/12/36
(EUR)
1,874,000
1,540
Berkshire
Hathaway
Finance,
1.50%,
3/18/30
(EUR)
5,119,000
4,947
Capital
One
Financial,
1.65%,
6/12/29
(EUR)
11,300,000
10,965
Carrier
Global,
4.125%,
5/29/28
(EUR)
2,420,000
2,608
Comcast,
0.00%,
9/14/26
(EUR)
3,000,000
2,968
Dana
Financing
Luxembourg,
8.50%,
7/15/31
(EUR) (1)
2,623,000
2,968
Dow
Chemical,
0.50%,
3/15/27
(EUR)
2,715,000
2,672
Duke
Energy,
3.75%,
4/1/31
(EUR)
8,800,000
9,261
Equinix
Europe
2
Financing,
3.65%,
9/3/33
(EUR)
9,575,000
9,943
T.
ROWE
PRICE
International
Bond
Fund
(USD
Hedged)
Par/Shares
$
Value
(Cost
and
value
in
$000s)
Equitable
Financial
Life
Global
Funding,
0.60%,
6/16/28
(EUR)
2,805,000
2,688
FedEx,
1.625%,
1/11/27
(EUR)
2,620,000
2,660
Fiserv,
1.625%,
7/1/30
(EUR)
175,000
168
Fiserv,
3.00%,
7/1/31
(GBP)
9,825,000
10,863
Fiserv,
4.50%,
5/24/31
(EUR)
10,825,000
11,946
Ford
Motor
Credit,
4.867%,
8/3/27
(EUR)
2,390,000
2,570
Ford
Motor
Credit,
5.125%,
2/20/29
(EUR)
13,525,000
14,728
General
Motors
Financial,
0.85%,
2/26/26
(EUR) (2)
10,000,000
10,132
Goldman
Sachs
Group,
1.625%,
7/27/26
(EUR)
4,137,000
4,212
Goldman
Sachs
Group,
VR,
3.625%,
10/29/29
(GBP) (4)
3,180,000
3,782
Harley-Davidson
Financial
Services,
5.125%,
4/5/26
(EUR)
8,000,000
8,468
Highland
Holdings,
0.318%,
12/15/26
(EUR)
3,635,000
3,589
JPMorgan
Chase,
VR,
1.638%,
5/18/28
(EUR) (4)
2,620,000
2,632
Medtronic
Global
Holdings,
0.375%,
10/15/28
(EUR)
2,969,000
2,811
Metropolitan
Life
Global
Funding
I,
5.00%,
1/10/30
(GBP)
570,000
716
Mondelez
International,
0.25%,
3/17/28
(EUR)
10,218,000
9,730
Mondelez
International,
1.625%,
3/8/27
(EUR)
2,575,000
2,606
Mondelez
International
Holdings
Netherlands,
0.25%,
9/9/29
(EUR) (1)
6,160,000
5,638
Morgan
Stanley,
VR,
0.406%,
10/29/27
(EUR) (4)
4,931,000
4,883
Morgan
Stanley,
VR,
0.495%,
10/26/29
(EUR) (4)
11,660,000
10,997
Morgan
Stanley,
VR,
5.148%,
1/25/34
(EUR) (4)
2,000,000
2,310
Netflix,
3.625%,
5/15/27
(EUR)
2,455,000
2,596
Netflix,
3.875%,
11/15/29
(EUR)
5,585,000
6,012
Prologis,
2.25%,
6/30/29
(GBP)
5,048,000
5,684
Thermo
Fisher
Scientific,
0.875%,
10/1/31
(EUR)
5,170,000
4,642
Thermo
Fisher
Scientific,
2.375%,
4/15/32
(EUR) (2)
842,000
829
Thermo
Fisher
Scientific
Finance
I,
0.80%,
10/18/30
(EUR)
1,890,000
1,729
U.S.
Bancorp,
VR,
4.009%,
5/21/32
(EUR) (4)
9,145,000
9,733
Upjohn
Finance,
1.362%,
6/23/27
(EUR)
2,670,000
2,665
Utah
Acquisition
Sub,
3.125%,
11/22/28
(EUR)
5,630,000
5,854
Verizon
Communications,
1.30%,
5/18/33
(EUR)
5,270,000
4,641
Verizon
Communications,
2.625%,
12/1/31
(EUR)
4,715,000
4,720
VF,
4.125%,
3/7/26
(EUR)
4,239,000
4,385
VF,
4.25%,
3/7/29
(EUR) (2)
4,355,000
4,503
Wells
Fargo,
1.00%,
2/2/27
(EUR)
2,660,000
2,647
Westlake,
1.625%,
7/17/29
(EUR)
9,435,000
9,113
289,152
T.
ROWE
PRICE
International
Bond
Fund
(USD
Hedged)
Par/Shares
$
Value
(Cost
and
value
in
$000s)
Municipal
Securities 0.2%
Puerto
Rico
Commonwealth,
GO,
VR,
11/1/43 (6)
19,438,040
11,906
11,906
Total
United
States
(Cost
$320,809)
301,058
SHORT-TERM
INVESTMENTS 8.8%
Money
Market
Funds 2.0%
T.
Rowe
Price
Government
Reserve
Fund,
4.53% (7)(8)
143,260,460
143,260
143,260
U.S.
Treasury
Obligations 6.8%
U.S.
Treasury
Bills,
4.392%,
2/27/25 (9)
213,526,000
212,121
U.S.
Treasury
Bills,
4.457%,
1/30/25
269,303,000
268,411
480,532
Total
Short-Term
Investments
(Cost
$623,669)
623,792
SECURITIES
LENDING
COLLATERAL 0.5%
INVESTMENTS
IN
A
POOLED
ACCOUNT
THROUGH
SECURITIES
LENDING
PROGRAM
WITH
JPMORGAN
CHASE
BANK 0.5%
Money
Market
Funds 0.5%
T.
Rowe
Price
Government
Reserve
Fund,
4.53% (7)(8)
32,974,473
32,974
Total
Investments
in
a
Pooled
Account
through
Securities
Lending
Program
with
JPMorgan
Chase
Bank
32,974
Total
Securities
Lending
Collateral
(Cost
$32,974)
32,974
(Amounts
in
000s,
except
for
contracts)
OPTIONS
PURCHASED 0.7%
OTC
Options
Purchased
0.7%
Counterparty
Description
Contracts
Notional
Amount
$
Value
Bank
of
America
USD
/
CAD,
Call,
12/16/25
@
CAD1.40 (10)
1
179,000
5,288
Bank
of
America
USD
/
CAD,
Put,
12/16/25
@
CAD1.40 (10)
1
179,000
3,563
T.
ROWE
PRICE
International
Bond
Fund
(USD
Hedged)
(Amounts
in
000s,
except
for
contracts)
Counterparty
Description
Contracts
Notional
Amount
$
Value
Bank
of
America
USD
/
GBP,
Call,
12/16/25
@
USD1.27 (10)
1
179,000
6,831
Bank
of
America
USD
/
GBP,
Put,
12/16/25
@
USD1.27 (10)
1
179,000
4,349
Bank
of
America
USD
/
SGD,
Call,
2/6/25
@
SGD1.36 (10)
1
70,950
496
Citibank
10
Year
Interest
Rate
Swap,
12/18/36
Pay
Fixed
2.27%
Annually,
Receive
Variable
2.57%
(6M
EURIBOR)
Semi-Annually,
12/16/26
@
2.27%*
(EUR) (10)
1
170,730
7,064
Citibank
10
Year
Interest
Rate
Swap,
12/18/36
Pay
Fixed
2.28%
Annually,
Receive
Variable
2.57%
(6M
EURIBOR)
Semi-Annually,
12/16/26
@
2.28%*
(EUR) (10)
1
170,730
7,008
Citibank
10
Year
Interest
Rate
Swap,
12/18/36
Receive
Fixed
2.27%
Annually,
Pay
Variable
2.57%
(6M
EURIBOR)
Semi-Annually,
12/16/26
@
2.27%*
(EUR) (10)
1
170,730
5,601
T.
ROWE
PRICE
International
Bond
Fund
(USD
Hedged)
(Amounts
in
000s,
except
for
contracts)
Counterparty
Description
Contracts
Notional
Amount
$
Value
Citibank
10
Year
Interest
Rate
Swap,
12/18/36
Receive
Fixed
2.28%
Annually,
Pay
Variable
2.57%
(6M
EURIBOR)
Semi-Annually,
12/16/26
@
2.28%*
(EUR) (10)
1
170,730
5,652
HSBC
Bank
USD
/
CNH,
Call,
5/8/25
@
CNH7.30 (10)
1
53,175
850
HSBC
Bank
USD
/
PLN,
Call,
2/27/25
@
PLN4.26 (10)
1
35,576
260
HSBC
Bank
USD
/
SGD,
Call,
2/6/25
@
SGD1.36 (10)
1
35,738
250
Morgan
Stanley
Credit
Default
Swap,
Protection
Bought
(Relevant
Credit:
Markit
iTraxx
Crossover-S42,
5
Year
Index,
12/20/29),
Pay
5.00%
Quarterly,
Receive
upon
credit
default,
2/19/25
@
3.25%*
(EUR) (10)
1
102,750
850
T.
ROWE
PRICE
International
Bond
Fund
(USD
Hedged)
(Amounts
in
000s,
except
for
contracts)
Counterparty
Description
Contracts
Notional
Amount
$
Value
Morgan
Stanley
Credit
Default
Swap,
Protection
Bought
(Relevant
Credit:
Markit
iTraxx
Europe-S42,
5
Year
Index,
12/20/29),
Pay
1.00%
Quarterly,
Receive
upon
credit
default,
2/19/25
@
0.65%*
(EUR) (10)
1
342,500
387
Morgan
Stanley
USD
/
CNH,
Call,
2/6/25
@
CNH7.25 (10)
1
70,757
1,074
Morgan
Stanley
USD
/
CNH,
Call,
5/8/25
@
CNH7.30 (10)
1
106,161
1,696
Morgan
Stanley
USD
/
SGD,
Call,
2/6/25
@
SGD1.36 (10)
1
71,713
501
Total
Options
Purchased
(Cost
$48,963)
51,720
Total
Investments
in
Securities
96.2%
of
Net
Assets
(Cost
$7,263,720)
$
6,846,636
‡
Country
classifications
are
generally
based
on
MSCI
categories
or
another
unaffiliated
third
party
data
provider;
Par/Shares
and
Notional
Amount
are
denominated
in
the
currency
of
the
country
presented
unless
otherwise
noted.
*
Exercise
Spread
(1)
Security
was
purchased
pursuant
to
Rule
144A
under
the
Securities
Act
of
1933
and
may
be
resold
in
transactions
exempt
from
registration
only
to
qualified
institutional
buyers.
Total
value
of
such
securities
at
period-end
amounts
to
$665,633
and
represents
9.4%
of
net
assets.
(2)
See
Note
4
.
All
or
a
portion
of
this
security
is
on
loan
at
December
31,
2024.
(3)
See
Note
2.
Level
3
in
fair
value
hierarchy.
T.
ROWE
PRICE
International
Bond
Fund
(USD
Hedged)
.
.
.
.
.
.
.
.
.
.
(4)
Security
is
a
fix-to-float
security,
which
carries
a
fixed
coupon
until
a
certain
date,
upon
which
it
switches
to
a
floating
rate.
Reference
rate
and
spread
are
provided
if
the
rate
is
currently
floating.
(5)
Security
has
the
ability
to
pay
in-kind
or
pay
in
cash.
When
applicable,
separate
rates
of
such
payments
are
disclosed.
(6)
Contingent
value
instrument
that
only
pays
out
if
a
portion
of
the
territory's
Sales
and
Use
Tax
outperforms
the
projections
in
the
Oversight
Board’s
Certified
Fiscal
Plan.
(7)
Seven-day
yield
(8)
Affiliated
Companies
(9)
At
December
31,
2024,
all
or
a
portion
of
this
security
is
pledged
as
collateral
and/or
margin
deposit
to
cover
future
funding
obligations.
(10)
Non-income
producing
1
Day
INR
MIBOR
One
day
INR
MIBOR
(Mumbai
interbank
offered
rate)
3M
SEK
STIBOR
Three
month
SEK
STIBOR
(Stockholm
interbank
offered
rate)
6M
EURIBOR
Six
month
EURIBOR
(Euro
interbank
offered
rate)
AUD
Australian
Dollar
BRL
Brazilian
Real
CAD
Canadian
Dollar
CHF
Swiss
Franc
CLP
Chilean
Peso
CNH
Offshore
China
Renminbi
COP
Colombian
Peso
CPI
Consumer
Price
Index
CZK
Czech
Koruna
EGP
Egyptian
Pound
EUR
Euro
GBP
British
Pound
GO
General
Obligation
HUF
Hungarian
Forint
ICP
Chilean
Average
Chamber
Index
IDR
Indonesian
Rupiah
INR
Indian
Rupee
JPY
Japanese
Yen
MXN
Mexican
Peso
MYR
Malaysian
Ringgit
NOK
Norwegian
Krone
NZD
New
Zealand
Dollar
OTC
Over-the-counter
PEN
Peruvian
New
Sol
PIK
Payment-in-kind
PLN
Polish
Zloty
T.
ROWE
PRICE
International
Bond
Fund
(USD
Hedged)
.
.
.
.
.
.
.
.
.
.
RON
New
Romanian
Leu
SEK
Swedish
Krona
SGD
Singapore
Dollar
SONIA
Sterling
Overnight
Index
Average
THB
Thai
Baht
TONA
Tokyo
overnight
average
rate
TRY
Turkish
Lira
TWD
Taiwan
Dollar
USD
U.S.
Dollar
VR
Variable
Rate;
rate
shown
is
effective
rate
at
period-end.
The
rates
for
certain
variable
rate
securities
are
not
based
on
a
published
reference
rate
and
spread
but
are
determined
by
the
issuer
or
agent
and
based
on
current
market
conditions.
ZAR
South
African
Rand
T.
ROWE
PRICE
International
Bond
Fund
(USD
Hedged)
(Amounts
in
000s,
except
for
contracts)
OPTIONS
WRITTEN
(0.0)%
OTC
Options
Written (0.0)%
Counterparty
Description
Contracts
Notional
Amount
$
Value
Morgan
Stanley
Credit
Default
Swap,
Protection
Sold
(Relevant
Credit:
Markit
iTraxx
Crossover-S42,
5
Year
Index,
12/20/29),
Receive
5.00%
Quarterly,
Pay
upon
credit
default,
2/19/25
@
2.88%*
(EUR)
1
102,750
(156)
Morgan
Stanley
Credit
Default
Swap,
Protection
Sold
(Relevant
Credit:
Markit
iTraxx
Europe-S42,
5
Year
Index,
12/20/29),
Receive
1.00%
Quarterly,
Pay
upon
credit
default,
2/19/25
@
0.53%*
(EUR)
1
342,500
(144)
Total
Options
Written
(Premiums
$(753))
$
(300)
T.
ROWE
PRICE
International
Bond
Fund
(USD
Hedged)
(Amounts
in
000s)
SWAPS
(0.0)%
Description
Notional
Amount
$
Value
Upfront
Payments/
$
(Receipts)
Unrealized
$
Gain/(Loss)
BILATERAL
SWAPS
0.0%
Credit
Default
Swaps,
Protection
Sold
0.0%
Greece
0.0%
Bank
of
America,
Protection
Sold (Relevant
Credit:
Hellenic
Republic,
BBB-*),
Receive
1.00%
Quarterly,
Pay
upon
credit
default,
12/20/29
(USD)
*
12,470
228
(311)
539
Citibank,
Protection
Sold (Relevant
Credit:
Hellenic
Republic,
BBB-*),
Receive
1.00%
Quarterly,
Pay
upon
credit
default,
6/20/25
(USD)
*
6,635
30
(36)
66
Morgan
Stanley,
Protection
Sold (Relevant
Credit:
Hellenic
Republic,
BBB-*),
Receive
1.00%
Quarterly,
Pay
upon
credit
default,
6/20/25
(USD)
*
2,801
13
(12)
25
Total
Greece
(359)
630
Vietnam
0.0%
Goldman
Sachs,
Protection
Sold (Relevant
Credit:
Socialist
Republic
of
Vietnam,
Ba2*),
Receive
1.00%
Quarterly,
Pay
upon
credit
default,
6/20/26
(USD)
*
21,270
169
112
57
Total
Vietnam
112
57
Total
Bilateral
Credit
Default
Swaps,
Protection
Sold
(247)
687
Total
Bilateral
Swaps
(247)
687
Description
Notional
Amount
$
Value
Initial
$
Value
**
Unrealized
$
Gain/(Loss)
CENTRALLY
CLEARED
SWAPS
(0.0)%
Credit
Default
Swaps,
Protection
Bought
(0.3)%
Canada
(0.0)%
Protection
Bought
(Relevant
Credit:
Bombardier),
Pay
5.00%
Quarterly,
Receive
upon
credit
default,
6/20/28
(USD)
14,510
(1,734)
(588)
(1,146)
Total
Canada
(1,146)
T.
ROWE
PRICE
International
Bond
Fund
(USD
Hedged)
(Amounts
in
000s)
Description
Notional
Amount
$
Value
Initial
$
Value**
Unrealized
$
Gain/(Loss)
Foreign/Europe
(0.3)%
Protection
Bought
(Relevant
Credit:
Markit
iTraxx
Crossover-S42,
5
Year
Index),
Pay
5.00%
Quarterly,
Receive
upon
credit
default,
12/20/29
273,495
(22,702)
(24,269)
1,567
Total
Foreign/Europe
1,567
United
States
0.0%
Protection
Bought
(Relevant
Credit:
Markit
CDX.EM-S41,
5
Year
Index),
Pay
1.00%
Quarterly,
Receive
upon
credit
default,
6/20/29
205,950
4,862
5,872
(1,010)
Total
United
States
(1,010)
Total
Centrally
Cleared
Credit
Default
Swaps,
Protection
Bought
(589)
Credit
Default
Swaps,
Protection
Sold
0.0%
Greece
0.0%
Protection
Sold
(Relevant
Credit:
Hellenic
Republic,
BBB-*),
Receive
1.00%
Quarterly,
Pay
upon
credit
default,
6/20/26
(USD)
3,700
44
39
5
Total
Greece
5
Spain
0.0%
Protection
Sold
(Relevant
Credit:
Cellnex
Telecom,
BBB-*),
Receive
5.00%
Quarterly,
Pay
upon
credit
default,
12/20/28
4,592
806
744
62
Total
Spain
62
Total
Centrally
Cleared
Credit
Default
Swaps,
Protection
Sold
67
Interest
Rate
Swaps
0.3%
Chile
0.0%
5
Year
Interest
Rate
Swap,
Pay
Fixed
4.733%
Semi-Annually,
Receive
Variable
5.123%
(ICP)
Semi-Annually,
10/16/29
50,397,600
1,191
—
1,191
10
Year
Interest
Rate
Swap,
Pay
Fixed
4.970%
Semi-Annually,
Receive
Variable
5.123%
(ICP)
Semi-Annually,
10/17/34
15,334,140
635
—
635
10
Year
Interest
Rate
Swap,
Pay
Fixed
4.975%
Semi-Annually,
Receive
Variable
5.123%
(ICP)
Semi-Annually,
10/16/34
15,384,460
630
—
630
T.
ROWE
PRICE
International
Bond
Fund
(USD
Hedged)
(Amounts
in
000s)
Description
Notional
Amount
$
Value
Initial
$
Value**
Unrealized
$
Gain/(Loss)
10
Year
Interest
Rate
Swap,
Pay
Fixed
5.526%
Semi-Annually,
Receive
Variable
5.123%
(ICP)
Semi-Annually,
1/2/35
12,077,675
(21)
—
(21)
10
Year
Interest
Rate
Swap,
Pay
Fixed
5.571%
Semi-Annually,
Receive
Variable
5.123%
(ICP)
Semi-Annually,
12/27/34
3,869,663
(21)
—
(21)
10
Year
Interest
Rate
Swap,
Pay
Fixed
5.601%
Semi-Annually,
Receive
Variable
5.123%
(ICP)
Semi-Annually,
12/27/34
7,246,605
(56)
—
(56)
10
Year
Interest
Rate
Swap,
Pay
Fixed
5.686%
Semi-Annually,
Receive
Variable
5.123%
(ICP)
Semi-Annually,
1/1/35
4,831,070
(70)
—
(70)
Total
Chile
2,288
China
0.1%
5
Year
Interest
Rate
Swap,
Receive
Fixed
1.653%
Quarterly,
Pay
Variable
2.240%
(7
Day
Interbank
Repo)
Quarterly,
9/20/29
104,810
169
—
169
5
Year
Interest
Rate
Swap,
Receive
Fixed
2.283%
Quarterly,
Pay
Variable
2.240%
(7
Day
Interbank
Repo)
Quarterly,
8/18/28
235,500
1,032
—
1,032
5
Year
Interest
Rate
Swap,
Receive
Fixed
2.476%
Quarterly,
Pay
Variable
1.730%
(7
Day
Interbank
Repo)
Quarterly,
6/1/28
219,090
1,105
—
1,105
5
Year
Interest
Rate
Swap,
Receive
Fixed
2.562%
Quarterly,
Pay
Variable
2.300%
(7
Day
Interbank
Repo)
Quarterly,
5/15/28
37,862
205
—
205
5
Year
Interest
Rate
Swap,
Receive
Fixed
2.568%
Quarterly,
Pay
Variable
2.200%
(7
Day
Interbank
Repo)
Quarterly,
5/16/28
128,613
701
—
701
5
Year
Interest
Rate
Swap,
Receive
Fixed
2.579%
Quarterly,
Pay
Variable
2.300%
(7
Day
Interbank
Repo)
Quarterly,
5/15/28
164,070
903
—
903
Total
China
4,115
T.
ROWE
PRICE
International
Bond
Fund
(USD
Hedged)
(Amounts
in
000s)
Description
Notional
Amount
$
Value
Initial
$
Value**
Unrealized
$
Gain/(Loss)
Foreign/Europe
0.1%
15
Year
Interest
Rate
Swap,
Pay
Fixed
2.199%
Annually,
Receive
Variable
2.654%
(6M
EURIBOR)
Semi-Annually,
12/13/39
27,750
810
—
810
15
Year
Interest
Rate
Swap,
Pay
Fixed
2.213%
Annually,
Receive
Variable
2.654%
(6M
EURIBOR)
Semi-Annually,
12/13/39
13,900
380
—
380
15
Year
Interest
Rate
Swap,
Pay
Fixed
2.244%
Annually,
Receive
Variable
2.656%
(6M
EURIBOR)
Semi-Annually,
12/16/39
13,945
325
—
325
20
Year
Interest
Rate
Swap,
Receive
Fixed
2.472%
Annually,
Pay
Variable
3.239%
(6M
EURIBOR)
Semi-Annually,
9/20/44
30,650
415
—
415
20
Year
Interest
Rate
Swap,
Receive
Fixed
2.510%
Annually,
Pay
Variable
3.375%
(6M
EURIBOR)
Semi-Annually,
8/19/44
61,600
1,140
—
1,140
Total
Foreign/Europe
3,070
India
0.0%
5
Year
Interest
Rate
Swap,
Receive
Fixed
6.278%
Semi-Annually,
Pay
Variable
7.150%
(1
Day
INR
MIBOR)
Semi-Annually,
11/5/29
843,200
26
—
26
5
Year
Interest
Rate
Swap,
Receive
Fixed
6.378%
Semi-Annually,
Pay
Variable
7.150%
(1
Day
INR
MIBOR)
Semi-Annually,
5/28/29
2,115,630
154
—
154
5
Year
Interest
Rate
Swap,
Receive
Fixed
6.387%
Semi-Annually,
Pay
Variable
7.150%
(1
Day
INR
MIBOR)
Semi-Annually,
5/28/29
2,104,731
161
—
161
5
Year
Interest
Rate
Swap,
Receive
Fixed
6.390%
Semi-Annually,
Pay
Variable
7.150%
(1
Day
INR
MIBOR)
Semi-Annually,
5/28/29
2,190,639
171
—
171
7
Year
Interest
Rate
Swap,
Receive
Fixed
5.970%
Semi-Annually,
Pay
Variable
7.150%
(1
Day
INR
MIBOR)
Semi-Annually,
9/22/31
2,575,000
(402)
—
(402)
T.
ROWE
PRICE
International
Bond
Fund
(USD
Hedged)
(Amounts
in
000s)
Description
Notional
Amount
$
Value
Initial
$
Value**
Unrealized
$
Gain/(Loss)
7
Year
Interest
Rate
Swap,
Receive
Fixed
6.283%
Semi-Annually,
Pay
Variable
7.150%
(1
Day
INR
MIBOR)
Semi-Annually,
7/21/31
3,332,000
130
—
130
7
Year
Interest
Rate
Swap,
Receive
Fixed
6.350%
Semi-Annually,
Pay
Variable
7.150%
(1
Day
INR
MIBOR)
Semi-Annually,
6/20/31
2,418,000
193
—
193
7
Year
Interest
Rate
Swap,
Receive
Fixed
6.576%
Semi-Annually,
Pay
Variable
7.150%
(1
Day
INR
MIBOR)
Semi-Annually,
4/21/31
639,169
135
—
135
Total
India
568
Japan
0.0%
5
Year
Interest
Rate
Swap,
Pay
Fixed
0.418%
Annually,
Receive
Variable
0.227%
(JPY
TONA)
Annually,
8/10/28
14,299,120
925
—
925
5
Year
Interest
Rate
Swap,
Pay
Fixed
0.544%
Annually,
Receive
Variable
0.227%
(JPY
TONA)
Annually,
11/27/28
1,750,000
79
—
79
5
Year
Interest
Rate
Swap,
Pay
Fixed
0.602%
Annually,
Receive
Variable
0.171%
(JPY
TONA)
Annually,
5/2/29
6,082,968
138
—
138
10
Year
Interest
Rate
Swap,
Pay
Fixed
0.989%
Annually,
Receive
Variable
0.227%
(JPY
TONA)
Annually,
11/13/34
5,708,000
124
—
124
Total
Japan
1,266
Sweden
0.1%
5
Year
Interest
Rate
Swap,
Pay
Fixed
2.137%
Annually,
Receive
Variable
2.554%
(3M
SEK
STIBOR)
Quarterly,
12/12/29
482,000
754
—
754
5
Year
Interest
Rate
Swap,
Pay
Fixed
2.141%
Annually,
Receive
Variable
2.554%
(3M
SEK
STIBOR)
Quarterly,
12/12/29
482,000
747
—
747
10
Year
Interest
Rate
Swap,
Pay
Fixed
2.305%
Annually,
Receive
Variable
2.554%
(3M
SEK
STIBOR)
Quarterly,
12/12/34
450,850
1,445
—
1,445
T.
ROWE
PRICE
International
Bond
Fund
(USD
Hedged)
(Amounts
in
000s)
Description
Notional
Amount
$
Value
Initial
$
Value**
Unrealized
$
Gain/(Loss)
10
Year
Interest
Rate
Swap,
Pay
Fixed
2.320%
Annually,
Receive
Variable
2.554%
(3M
SEK
STIBOR)
Quarterly,
12/12/34
450,850
1,394
—
1,394
10
Year
Interest
Rate
Swap,
Pay
Fixed
2.452%
Annually,
Receive
Variable
2.539%
(3M
SEK
STIBOR)
Quarterly,
12/19/34
511,450
1,051
—
1,051
10
Year
Interest
Rate
Swap,
Pay
Fixed
2.571%
Annually,
Receive
Variable
2.552%
(3M
SEK
STIBOR)
Quarterly,
12/25/34
686,700
764
—
764
Total
Sweden
6,155
United
Kingdom
(0.0)%
2
Year
Interest
Rate
Swap,
Receive
Fixed
4.257%
Annually,
Pay
Variable
4.716%
(GBP
SONIA)
Annually,
11/9/26
262,500
(445)
—
(445)
5
Year
Interest
Rate
Swap,
Receive
Fixed
4.070%
Annually,
Pay
Variable
4.716%
(GBP
SONIA)
Annually,
11/7/29
64,915
(35)
—
(35)
Total
United
Kingdom
(480)
Total
Centrally
Cleared
Interest
Rate
Swaps
16,982
Zero-Coupon
Inflation
Swaps
(0.0)%
Foreign/Europe
(0.0)%
5
Year
Zero-Coupon
Inflation
Swap
Pay
Fixed
1.860%
at
Maturity,
Receive
Variable
(Change
in
CPI)
at
Maturity,
9/17/29
156,000
(501)
—
(501)
T.
ROWE
PRICE
International
Bond
Fund
(USD
Hedged)
(Amounts
in
000s)
Description
Notional
Amount
$
Value
Initial
$
Value**
Unrealized
$
Gain/(Loss)
10
Year
Zero-Coupon
Inflation
Swap
Pay
Fixed
1.958%
at
Maturity,
Receive
Variable
(Change
in
CPI)
at
Maturity,
10/16/34
31,425
(239)
—
(239)
Total
Foreign/Europe
(740)
Total
Centrally
Cleared
Zero-Coupon
Inflation
Swaps
(740)
Total
Centrally
Cleared
Swaps
15,720
Net
payments
(receipts)
of
variation
margin
to
date
(15,198)
Variation
margin
receivable
(payable)
on
centrally
cleared
swaps
$
522
*
Credit
ratings
as
of
December
31,
2024.
Ratings
shown
are
from
Moody’s
Investors
Service
and
if
Moody’s
does
not
rate
a
security,
then
Standard
&
Poor’s
(S&P)
is
used.
Fitch
is
used
for
securities
that
are
not
rated
by
either
Moody’s
or
S&P.
**
Includes
interest
purchased
or
sold
but
not
yet
collected
of
$(5).
T.
ROWE
PRICE
International
Bond
Fund
(USD
Hedged)
(Amounts
in
000s)
FORWARD
CURRENCY
EXCHANGE
CONTRACTS
Counterparty
Settlement
Receive
Deliver
Unrealized
Gain/(Loss)
Bank
of
America
1/16/25
TRY
984,183
USD
26,040
$
1,337
Bank
of
America
1/16/25
USD
10,489
TRY
399,860
(634)
Bank
of
America
1/17/25
HUF
14,950,548
USD
39,800
(2,192)
Bank
of
America
1/17/25
USD
71,171
RON
328,560
2,841
Bank
of
America
1/17/25
USD
34,903
ZAR
643,727
846
Bank
of
America
1/24/25
CAD
85,856
USD
60,718
(937)
Bank
of
America
1/24/25
CZK
849,667
USD
36,420
(1,482)
Bank
of
America
1/24/25
EUR
35,640
USD
37,099
(146)
Bank
of
America
1/24/25
JPY
5,138,725
USD
34,166
(1,414)
Bank
of
America
1/24/25
NZD
827
USD
496
(33)
Bank
of
America
1/24/25
USD
10,600
AUD
16,309
505
Bank
of
America
1/24/25
USD
3,995
NOK
45,116
32
Bank
of
America
2/14/25
PLN
72,656
USD
17,970
(407)
Bank
of
America
2/14/25
USD
52,774
PLN
214,969
810
Bank
of
America
3/7/25
MYR
147,267
USD
33,387
(487)
Bank
of
America
3/7/25
THB
1,220,978
USD
36,017
(49)
Bank
of
America
3/7/25
USD
124,012
MYR
551,613
780
Barclays
Bank
1/16/25
TRY
238,744
USD
6,267
374
Barclays
Bank
1/16/25
USD
8,561
TRY
309,727
(55)
Barclays
Bank
1/17/25
USD
59,686
ZAR
1,053,628
3,942
Barclays
Bank
1/17/25
ZAR
969,802
USD
53,976
(2,667)
Barclays
Bank
1/24/25
CHF
417
USD
485
(25)
Barclays
Bank
1/24/25
JPY
27,425,316
USD
180,415
(5,617)
Barclays
Bank
1/24/25
NZD
5,042
USD
3,007
(185)
Barclays
Bank
1/24/25
USD
932
AUD
1,490
10
Barclays
Bank
1/24/25
USD
1,317
CHF
1,129
70
Barclays
Bank
1/24/25
USD
5,720
CZK
136,756
97
Barclays
Bank
1/24/25
USD
587,759
JPY
87,050,064
32,939
Barclays
Bank
2/21/25
GBP
40,871
USD
51,659
(513)
Barclays
Bank
2/21/25
USD
3,555
EUR
3,364
63
Barclays
Bank
2/21/25
USD
359,339
GBP
284,961
2,740
Barclays
Bank
2/28/25
USD
1,988
SEK
21,683
22
Barclays
Bank
3/14/25
USD
183,241
CNH
1,293,996
6,588
BNP
Paribas
1/17/25
HUF
10,447,902
USD
28,410
(2,128)
BNP
Paribas
1/17/25
PEN
22,595
USD
6,079
(70)
BNP
Paribas
1/17/25
USD
3,553
IDR
56,509,700
59
BNP
Paribas
1/17/25
USD
33,875
PEN
128,229
(232)
BNP
Paribas
1/17/25
USD
18,298
ZAR
325,213
1,092
BNP
Paribas
1/17/25
ZAR
222,428
USD
12,258
(490)
T.
ROWE
PRICE
International
Bond
Fund
(USD
Hedged)
(Amounts
in
000s)
FORWARD
CURRENCY
EXCHANGE
CONTRACTS
(CONTINUED)
Counterparty
Settlement
Receive
Deliver
Unrealized
Gain/(Loss)
BNP
Paribas
1/24/25
USD
20,339
AUD
30,901
$
1,212
BNP
Paribas
1/24/25
USD
15,506
CZK
370,444
274
BNP
Paribas
2/14/25
PLN
143,071
USD
35,369
(784)
BNP
Paribas
2/14/25
USD
36,754
PLN
148,678
814
BNP
Paribas
2/21/25
EUR
19,346
USD
20,444
(362)
BNP
Paribas
2/21/25
USD
35,519
EUR
33,805
426
BNP
Paribas
3/7/25
USD
58,939
THB
2,036,215
(1,045)
BNP
Paribas
3/14/25
CNH
169,330
USD
24,151
(1,034)
BNP
Paribas
3/14/25
USD
103,054
CNH
733,225
2,956
BNY
Mellon
1/24/25
NOK
3,123
USD
284
(10)
BNY
Mellon
1/24/25
USD
5,564
CZK
133,790
63
Canadian
Imperial
Bank
of
Commerce
1/17/25
USD
7,484
INR
636,816
59
Citibank
1/16/25
USD
17,283
EGP
886,280
(33)
Citibank
1/17/25
INR
546,531
USD
6,479
(107)
Citibank
1/17/25
RON
328,560
USD
69,779
(1,449)
Citibank
1/17/25
USD
33,564
HUF
13,164,958
447
Citibank
1/17/25
USD
73,797
IDR
1,142,916,944
3,135
Citibank
1/17/25
USD
26,013
ZAR
460,245
1,663
Citibank
1/24/25
AUD
111,458
USD
74,307
(5,318)
Citibank
1/24/25
JPY
81,807
USD
533
(12)
Citibank
1/24/25
MXN
565,448
USD
26,994
8
Citibank
1/24/25
MXN
928,090
USD
45,049
(730)
Citibank
1/24/25
USD
687
AUD
1,068
26
Citibank
1/24/25
USD
175,811
CAD
243,981
5,928
Citibank
1/24/25
USD
89,627
CHF
79,709
1,561
Citibank
1/24/25
USD
32,198
CZK
768,225
609
Citibank
1/24/25
USD
2,238
JPY
333,977
110
Citibank
2/14/25
USD
17,416
PLN
70,960
263
Citibank
2/21/25
USD
1,577
GBP
1,242
23
Citibank
2/28/25
USD
1,114
SEK
12,106
16
Citibank
3/4/25
EGP
99,817
USD
1,910
3
Citibank
3/7/25
USD
82,671
COP
366,970,516
122
Citibank
3/12/25
EGP
334,493
USD
5,979
412
Citibank
3/21/25
EUR
17,080
USD
17,834
(78)
Citigroup
Global
Markets
1/24/25
USD
18,400
MXN
378,564
323
Deutsche
Bank
1/24/25
AUD
5,376
USD
3,538
(211)
Deutsche
Bank
1/24/25
JPY
205,881
USD
1,392
(80)
Deutsche
Bank
1/24/25
NOK
494,389
USD
45,336
(1,908)
T.
ROWE
PRICE
International
Bond
Fund
(USD
Hedged)
(Amounts
in
000s)
FORWARD
CURRENCY
EXCHANGE
CONTRACTS
(CONTINUED)
Counterparty
Settlement
Receive
Deliver
Unrealized
Gain/(Loss)
Deutsche
Bank
1/24/25
USD
1,357
AUD
2,027
$
103
Deutsche
Bank
1/24/25
USD
2,403
CAD
3,412
27
Deutsche
Bank
1/24/25
USD
2,611
JPY
403,813
37
Deutsche
Bank
1/24/25
USD
2,059
JPY
324,462
(9)
Deutsche
Bank
1/24/25
USD
4,770
MXN
96,810
148
Deutsche
Bank
1/24/25
USD
32,503
NOK
361,301
766
Deutsche
Bank
1/24/25
USD
4,429
NZD
7,547
205
Deutsche
Bank
2/7/25
CLP
4,118,231
USD
4,346
(206)
Deutsche
Bank
2/14/25
USD
24,916
PLN
99,984
747
Deutsche
Bank
2/21/25
EUR
79,942
USD
84,131
(1,142)
Deutsche
Bank
2/21/25
USD
16,131
EUR
15,333
214
Deutsche
Bank
2/28/25
USD
2,166
SEK
23,727
15
Deutsche
Bank
3/21/25
USD
747,510
EUR
704,786
14,842
Goldman
Sachs
1/17/25
USD
63,056
IDR
959,987,466
3,704
Goldman
Sachs
1/17/25
USD
10,340
INR
871,270
182
Goldman
Sachs
1/17/25
USD
107,805
TWD
3,441,093
3,044
Goldman
Sachs
1/24/25
JPY
58,645
USD
388
(14)
Goldman
Sachs
1/24/25
USD
1,831
AUD
2,872
53
Goldman
Sachs
1/24/25
USD
2,036
CAD
2,837
60
Goldman
Sachs
2/21/25
EUR
7,671
USD
8,096
(132)
Goldman
Sachs
2/21/25
GBP
40,307
USD
50,983
(543)
Goldman
Sachs
2/21/25
USD
1,444
GBP
1,150
5
Goldman
Sachs
2/28/25
USD
1,569
SEK
17,220
8
Goldman
Sachs
3/6/25
BRL
176,681
USD
28,782
(523)
Goldman
Sachs
3/6/25
USD
50,397
BRL
300,762
2,293
Goldman
Sachs
3/7/25
USD
53,131
THB
1,837,569
(1,001)
Goldman
Sachs
3/14/25
CNH
485,234
USD
70,039
(3,796)
Goldman
Sachs
3/14/25
USD
5,347
CNH
37,774
190
Goldman
Sachs
3/21/25
USD
9,955
EUR
9,393
190
HSBC
Bank
1/17/25
USD
30,930
IDR
474,227,653
1,610
HSBC
Bank
1/17/25
USD
3,624
INR
305,863
58
HSBC
Bank
1/24/25
CAD
2,264
USD
1,630
(53)
HSBC
Bank
1/24/25
JPY
8,034,734
USD
53,419
(2,209)
HSBC
Bank
1/24/25
NZD
1,107
USD
648
(29)
HSBC
Bank
1/24/25
USD
995
AUD
1,539
42
HSBC
Bank
1/24/25
USD
2,998
CAD
4,307
(1)
HSBC
Bank
1/24/25
USD
802,686
EUR
717,802
58,443
HSBC
Bank
1/24/25
USD
153,979
MXN
3,045,144
8,565
HSBC
Bank
2/7/25
USD
32,098
CLP
31,170,936
768
T.
ROWE
PRICE
International
Bond
Fund
(USD
Hedged)
(Amounts
in
000s)
FORWARD
CURRENCY
EXCHANGE
CONTRACTS
(CONTINUED)
Counterparty
Settlement
Receive
Deliver
Unrealized
Gain/(Loss)
HSBC
Bank
2/21/25
USD
786,989
EUR
721,834
$
37,640
HSBC
Bank
3/7/25
USD
149,120
MYR
662,290
1,162
HSBC
Bank
3/14/25
USD
125,768
CNH
892,489
3,928
JPMorgan
Chase
1/17/25
ZAR
111,492
USD
6,154
(255)
JPMorgan
Chase
1/24/25
AUD
3,762
USD
2,507
(179)
JPMorgan
Chase
1/24/25
JPY
5,158,131
USD
34,613
(1,738)
JPMorgan
Chase
1/24/25
MXN
87,395
USD
4,298
(125)
JPMorgan
Chase
1/24/25
USD
1,322
AUD
2,113
14
JPMorgan
Chase
1/24/25
USD
391
CHF
344
11
JPMorgan
Chase
1/24/25
USD
12,261
EUR
11,672
159
JPMorgan
Chase
1/24/25
USD
2,457
JPY
375,491
64
JPMorgan
Chase
1/24/25
USD
821
NOK
9,132
19
JPMorgan
Chase
2/14/25
PLN
141,653
USD
35,275
(1,033)
JPMorgan
Chase
2/14/25
USD
16,248
PLN
66,178
250
JPMorgan
Chase
2/21/25
GBP
11,054
USD
13,867
(34)
JPMorgan
Chase
2/21/25
USD
42,285
EUR
39,294
1,493
JPMorgan
Chase
2/28/25
USD
1,160
SEK
12,770
3
JPMorgan
Chase
3/7/25
USD
11,614
THB
400,032
(171)
JPMorgan
Chase
3/14/25
USD
44,431
CNH
310,826
1,998
JPMorgan
Chase
3/21/25
USD
2,622
EUR
2,475
49
Morgan
Stanley
1/24/25
NZD
15,378
USD
9,337
(732)
Morgan
Stanley
1/24/25
USD
2,208
CAD
3,179
(6)
Morgan
Stanley
1/24/25
USD
2,231
CHF
1,951
76
Morgan
Stanley
1/24/25
USD
53,621
EUR
49,128
2,683
Morgan
Stanley
2/21/25
USD
905
GBP
720
3
Nomura
Securities
International
3/14/25
USD
18,466
CNH
134,763
68
RBC
Dominion
Securities
1/17/25
USD
3,644
IDR
57,510,997
88
RBC
Dominion
Securities
1/24/25
CHF
15,925
USD
17,889
(294)
RBC
Dominion
Securities
1/24/25
USD
6,278
AUD
10,088
34
RBC
Dominion
Securities
1/24/25
USD
2,130
CAD
2,983
53
Societe
Generale
3/7/25
USD
5,105
COP
22,580,069
26
Societe
Generale
3/21/25
USD
79,548
EUR
75,197
1,376
Standard
Chartered
1/24/25
USD
5,617
CAD
7,916
106
Standard
Chartered
2/28/25
USD
31,574
SEK
345,729
225
State
Street
1/24/25
AUD
23,529
USD
15,075
(512)
T.
ROWE
PRICE
International
Bond
Fund
(USD
Hedged)
(Amounts
in
000s)
FORWARD
CURRENCY
EXCHANGE
CONTRACTS
(CONTINUED)
Counterparty
Settlement
Receive
Deliver
Unrealized
Gain/(Loss)
State
Street
1/24/25
CAD
9,157
USD
6,561
$
(185)
State
Street
1/24/25
JPY
1,465,775
USD
9,727
(385)
State
Street
1/24/25
NZD
34
USD
21
(2)
State
Street
1/24/25
USD
72,544
AUD
108,701
5,262
State
Street
1/24/25
USD
190,853
CAD
266,149
5,535
State
Street
1/24/25
USD
78,766
CZK
1,842,572
3,000
State
Street
1/24/25
USD
15,406
JPY
2,321,156
612
State
Street
2/21/25
EUR
231
USD
246
(5)
State
Street
2/21/25
GBP
26,399
USD
33,505
(469)
State
Street
2/21/25
USD
11,892
EUR
10,903
573
State
Street
2/21/25
USD
4,297
GBP
3,382
65
State
Street
3/14/25
CNH
33,520
USD
4,845
(269)
State
Street
3/14/25
USD
7,785
CNH
55,020
274
State
Street
3/14/25
USD
85,075
SGD
113,424
1,773
State
Street
3/21/25
USD
45,756
EUR
43,105
946
Toronto-Dominion
Bank
1/24/25
CAD
1,028
USD
746
(30)
Toronto-Dominion
Bank
1/24/25
NZD
297
USD
177
(11)
Toronto-Dominion
Bank
1/24/25
USD
358,399
CAD
493,941
14,470
UBS
Investment
Bank
1/17/25
USD
4,857
INR
409,068
87
UBS
Investment
Bank
1/24/25
CHF
60,204
USD
68,730
(2,213)
UBS
Investment
Bank
1/24/25
JPY
1,062,660
USD
7,168
(395)
UBS
Investment
Bank
1/24/25
USD
2,345
AUD
3,589
124
UBS
Investment
Bank
1/24/25
USD
797
CAD
1,104
28
UBS
Investment
Bank
1/24/25
USD
97,046
CHF
83,051
5,287
UBS
Investment
Bank
1/24/25
USD
4,628
EUR
4,383
83
UBS
Investment
Bank
1/24/25
USD
439,821
JPY
65,209,472
24,203
UBS
Investment
Bank
1/24/25
USD
5,050
NOK
56,309
103
UBS
Investment
Bank
1/24/25
USD
1,394
NZD
2,296
109
UBS
Investment
Bank
2/21/25
USD
28,258
EUR
25,870
1,401
UBS
Investment
Bank
2/28/25
USD
6,192
SEK
67,821
42
UBS
Investment
Bank
3/6/25
BRL
38,143
USD
6,099
2
UBS
Investment
Bank
3/6/25
BRL
34,755
USD
5,746
(187)
UBS
Investment
Bank
3/6/25
USD
18,362
BRL
112,835
316
UBS
Investment
Bank
3/7/25
USD
52,725
THB
1,830,233
(1,190)
UBS
Investment
Bank
3/14/25
USD
279,560
CNH
1,970,016
10,618
Wells
Fargo
1/17/25
USD
53,619
PEN
200,874
190
Net
unrealized
gain
(loss)
on
open
forward
currency
exchange
contracts
$
245,548
T.
ROWE
PRICE
International
Bond
Fund
(USD
Hedged)
FUTURES
CONTRACTS
($000s)
Expiration
Date
Notional
Amount
Value
and
Unrealized
Gain
(Loss)
Long,
166
Commonwealth
of
Australia
ten
year
bond
contracts
3/25
11,598
$
(73)
Long,
783
Commonwealth
of
Australia
three
year
bond
contracts
3/25
51,446
(1)
Short,
1,228
Euro
BOBL
contracts
3/25
(149,921)
1,758
Long,
1,104
Euro
BTP
contracts
3/25
137,207
(3,020)
Short,
1,104
Euro
BUND
contracts
3/25
(152,599)
637
Long,
915
Euro
OAT
contracts
3/25
116,959
(2,608)
Short,
152
Euro
SCHATZ
contracts
3/25
(16,845)
58
Short,
248
Government
of
Canada
ten
year
bond
contracts
3/25
(21,154)
83
Short,
83
Government
of
Japan
ten
year
bond
contracts
3/25
(74,853)
323
Long,
1,201
Republic
of
South
Korea
ten
year
bond
contracts
3/25
95,385
(1,970)
Short,
1,445
Republic
of
South
Korea
three
year
bond
contracts
3/25
(104,683)
458
Long,
60
U.K.
Gilt
ten
year
contracts
3/25
6,941
25
Net
payments
(receipts)
of
variation
margin
to
date
4,302
Variation
margin
receivable
(payable)
on
open
futures
contracts
$
(28)
T.
ROWE
PRICE
International
Bond
Fund
(USD
Hedged)
The
accompanying
notes
are
an
integral
part
of
these
financial
statements.
AFFILIATED
COMPANIES
($000s)
The
fund
may
invest
in
certain
securities
that
are
considered
affiliated
companies.
As
defined
by
the
1940
Act,
an
affiliated
company
is
one
in
which
the
fund
owns
5%
or
more
of
the
outstanding
voting
securities,
or
a
company
that
is
under
common
ownership
or
control.
The
following
securities
were
considered
affiliated
companies
for
all
or
some
portion
of
the
year
ended
December
31,
2024.
Net
realized
gain
(loss),
investment
income,
change
in
net
unrealized
gain/loss,
and
purchase
and
sales
cost
reflect
all
activity
for
the
period
then
ended.
Affiliate
Net
Realized
Gain
(Loss)
Change
in
Net
Unrealized
Gain/Loss
Investment
Income
T.
Rowe
Price
Government
Reserve
Fund,
4.53%
$
—
$
—
$
7,170++
Totals
$
—#
$
—
$
7,170+
Supplementary
Investment
Schedule
Affiliate
Value
12/31/23
Purchase
Cost
Sales
Cost
Value
12/31/24
T.
Rowe
Price
Government
Reserve
Fund,
4.53%
$
167,811
¤
¤
$
176,234
Total
$
176,234^
#
Capital
gain
distributions
from
underlying
Price
funds
represented
$0
of
the
net
realized
gain
(loss).
++
Excludes
earnings
on
securities
lending
collateral,
which
are
subject
to
rebates
and
fees
as
described
in
Note
4.
+
Investment
income
comprised
$7,170
of
dividend
income
and
$0
of
interest
income.
¤
Purchase
and
sale
information
not
shown
for
cash
management
funds.
^
The
cost
basis
of
investments
in
affiliated
companies
was
$176,234.
T.
ROWE
PRICE
International
Bond
Fund
(USD
Hedged)
December
31,
2024
Statement
of
Assets
and
Liabilities
($000s,
except
shares
and
per
share
amounts)
Assets
Investments
in
securities,
at
value
(cost
$7,263,720)
$
6,846,636
Unrealized
gain
on
forward
currency
exchange
contracts
298,550
Interest
receivable
77,209
Receivable
for
shares
sold
3,711
Due
from
affiliates
2,160
Cash
1,224
Receivable
for
investment
securities
sold
1,068
Unrealized
gain
on
bilateral
swaps
687
Variation
margin
receivable
on
centrally
cleared
swaps
522
Foreign
currency
(cost
$395)
395
Bilateral
swap
premiums
paid
112
Other
assets
1,438
Total
assets
7,233,712
Liabilities
Unrealized
loss
on
forward
currency
exchange
contracts
53,002
Obligation
to
return
securities
lending
collateral
32,974
Payable
for
shares
redeemed
27,434
Investment
management
fees
payable
2,924
Bilateral
swap
premiums
received
359
Options
written
(premiums
$753)
300
Variation
margin
payable
on
futures
contracts
28
Payable
to
directors
5
Other
liabilities
345
Total
liabilities
117,371
Commitments
and
Contingent
Liabilities
(note
7
)
NET
ASSETS
$
7,116,341
T.
ROWE
PRICE
International
Bond
Fund
(USD
Hedged)
December
31,
2024
Statement
of
Assets
and
Liabilities
($000s,
except
shares
and
per
share
amounts)
The
accompanying
notes
are
an
integral
part
of
these
financial
statements.
Net
Assets
Consist
of:
Total
distributable
earnings
(loss)
$
(713,674)
Paid-in
capital
applicable
to
834,704,568
shares
of
$0.01
par
value
capital
stock
outstanding;
18,000,000,000
shares
of
the
Corporation
authorized
7,830,015
NET
ASSETS
$
7,116,341
NET
ASSET
VALUE
PER
SHARE
Investor
Class
(Net
assets:
$73,149;
Shares
outstanding:
8,579,824)
$
8.53
Advisor
Class
(Net
assets:
$75;
Shares
outstanding:
8,799)
$
8.50
I
Class
(Net
assets:
$1,874,674;
Shares
outstanding:
219,978,153)
$
8.52
Z
Class
(Net
assets:
$5,168,443;
Shares
outstanding:
606,137,792)
$
8.53
T.
ROWE
PRICE
International
Bond
Fund
(USD
Hedged)
Year
Ended
12/31/24
Investment
Income
(Loss)
Income
.
Interest
(net
of
foreign
taxes
of
$2,468)
$
242,485
Dividend
7,170
Securities
lending
255
Other
13
Total
income
249,923
Expenses
Investment
management
31,595
Shareholder
servicing
Investor
Class
$
184
Advisor
Class
1
I
Class
76
261
Prospectus
and
shareholder
reports
Investor
Class
34
I
Class
476
Z
Class
6
516
Custody
and
accounting
1,075
Registration
95
Legal
and
audit
53
Directors
21
Miscellaneous
105
Waived
/
paid
by
Price
Associates
(24,214)
Total
expenses
9,507
Net
investment
income
240,416
T.
ROWE
PRICE
International
Bond
Fund
(USD
Hedged)
The
accompanying
notes
are
an
integral
part
of
these
financial
statements.
Year
Ended
12/31/24
Realized
and
Unrealized
Gain
/
Loss
–
Net
realized
gain
(loss)
Securities
(net
of
foreign
taxes
of
$652)
(125,739)
Futures
9,985
Swaps
(18,413)
Options
written
856
Forward
currency
exchange
contracts
37,950
Foreign
currency
transactions
275
Net
realized
loss
(95,086)
Change
in
net
unrealized
gain
/
loss
Securities
(281,079)
Futures
(4,975)
Swaps
29,543
Options
written
6,449
Forward
currency
exchange
contracts
387,929
Other
assets
and
liabilities
denominated
in
foreign
currencies
(4,183)
Change
in
net
unrealized
gain
/
loss
133,684
Net
realized
and
unrealized
gain
/
loss
38,598
INCREASE
IN
NET
ASSETS
FROM
OPERATIONS
$
279,014
T.
ROWE
PRICE
International
Bond
Fund
(USD
Hedged)
Statement
of
Changes
in
Net
Assets
Year
.
.
.
.
.
.
.
.
.
.
.
.
.
.
Ended
.
.
.
.
.
.
.
.
.
.
.
.
.
.
12/31/24
12/31/23
Increase
(Decrease)
in
Net
Assets
Operations
Net
investment
income
$
240,416
$
188,031
Net
realized
loss
(95,086)
(260,433)
Change
in
net
unrealized
gain
/
loss
133,684
658,284
Increase
in
net
assets
from
operations
279,014
585,882
Distributions
to
shareholders
Net
earnings
Investor
Class
(2,201)
(256)
Advisor
Class
(2)
(1)
I
Class
(52,345)
(4,923)
Z
Class
(177,498)
(18,067)
Tax
return
of
capital
–
–
Investor
Class
–
(1,710)
Advisor
Class
–
(5)
I
Class
–
(31,617)
Z
Class
–
(124,144)
Decrease
in
net
assets
from
distributions
(232,046)
(180,723)
Capital
share
transactions
*
Shares
sold
Investor
Class
19,565
31,261
Advisor
Class
–
220
I
Class
493,014
264,733
Z
Class
1,079,486
408,895
Distributions
reinvested
Investor
Class
2,162
1,938
Advisor
Class
2
5
I
Class
52,242
36,431
Z
Class
177,601
142,067
Shares
redeemed
Investor
Class
(31,233)
(31,965)
Advisor
Class
(138)
(106)
I
Class
(170,126)
(159,598)
Z
Class
(611,477)
(721,105)
Increase
(decrease)
in
net
assets
from
capital
share
transactions
1,011,098
(27,224)
T.
ROWE
PRICE
International
Bond
Fund
(USD
Hedged)
Statement
of
Changes
in
Net
Assets
The
accompanying
notes
are
an
integral
part
of
these
financial
statements.
Year
.
.
.
.
.
.
.
.
.
.
.
.
.
.
Ended
.
.
.
.
.
.
.
.
.
.
.
.
.
.
12/31/24
12/31/23
Net
Assets
Increase
during
period
1,058,066
377,935
Beginning
of
period
6,058,275
5,680,340
End
of
period
$
7,116,341
$
6,058,275
*Share
information
(000s)
Shares
sold
Investor
Class
2,319
3,860
Advisor
Class
–
27
I
Class
58,324
33,394
Z
Class
128,464
49,494
Distributions
reinvested
Investor
Class
256
238
Advisor
Class
–
(1)
1
I
Class
6,178
4,474
Z
Class
20,994
17,452
Shares
redeemed
Investor
Class
(3,698)
(3,949)
Advisor
Class
(16)
(13)
I
Class
(20,124)
(19,699)
Z
Class
(72,397)
(88,872)
Increase
(decrease)
in
shares
outstanding
120,300
(3,593)
(1)
Amount
rounds
to
less
than
1,000
shares
T.
ROWE
PRICE
International
Bond
Fund
(USD
Hedged)
NOTES
TO
FINANCIAL
STATEMENTS
T.
Rowe
Price
International
Funds,
Inc. (the
corporation) is
registered
under
the
Investment
Company
Act
of
1940
(the
1940
Act).
The
International
Bond
Fund
(USD
Hedged)
(the
fund)
is a
nondiversified, open-end
management
investment
company
established
by
the
corporation. The
fund
seeks to
provide
current
income
and
capital
appreciation.
The
fund
has four classes
of
shares:
the
International
Bond
Fund
(USD
Hedged)
(Investor
Class),
the
International
Bond
Fund
(USD
Hedged)–Advisor
Class
(Advisor
Class),
the
International
Bond
Fund
(USD
Hedged)–I
Class
(I
Class)
and
the
International
Bond
Fund
(USD
Hedged)–Z
Class
(Z
Class).
Advisor
Class
shares
are
sold
only
through
various
brokers
and
other
financial
intermediaries.
I
Class
shares
require
a
$500,000
initial
investment
minimum,
although
the
minimum
generally
is
waived
or
reduced
for
financial
intermediaries,
eligible
retirement
plans,
and
certain
other
accounts.
The
Z
Class
is
only
available
to
funds
advised
by
T.
Rowe
Price
Associates,
Inc.
and
its
affiliates
and
other
clients
that
are
subject
to
a
contractual
fee
for
investment
management
services.
The
Advisor
Class
operates
under
a
Board-approved
Rule
12b-1
plan
pursuant
to
which
the
class
compensates
financial
intermediaries
for
distribution,
shareholder
servicing,
and/
or
certain
administrative
services;
the
Investor,
I
and
Z
Classes
do
not
pay
Rule
12b-1
fees. Each
class
has
exclusive
voting
rights
on
matters
related
solely
to
that
class;
separate
voting
rights
on
matters
that
relate
to
all
classes;
and,
in
all
other
respects,
the
same
rights
and
obligations
as
the
other
classes.
NOTE
1
-
SIGNIFICANT
ACCOUNTING
POLICIES
Basis
of
Preparation
The fund
is
an
investment
company
and
follows
accounting
and
reporting
guidance
in
the
Financial
Accounting
Standards
Board
(FASB)
Accounting
Standards
Codification
Topic
946
(ASC
946).
The
accompanying
financial
statements
were
prepared
in
accordance
with
accounting
principles
generally
accepted
in
the
United
States
of
America
(GAAP),
including,
but
not
limited
to,
ASC
946.
GAAP
requires
the
use
of
estimates
made
by
management.
Management
believes
that
estimates
and
valuations
are
appropriate;
however,
actual
results
may
differ
from
those
estimates,
and
the
valuations
reflected
in
the
accompanying
financial
statements
may
differ
from
the
value
ultimately
realized
upon
sale
or
maturity.
Investment
Transactions,
Investment
Income,
and
Distributions
Investment
transactions
are
accounted
for
on
the
trade
date
basis.
Income
and
expenses
are
recorded
on
the
accrual
basis.
Realized
gains
and
losses
are
reported
T.
ROWE
PRICE
International
Bond
Fund
(USD
Hedged)
on
the
identified
cost
basis. Premiums
and
discounts
on
debt
securities
are
amortized
for
financial
reporting
purposes. Paydown
gains
and
losses
are
recorded
as
an
adjustment
to
interest
income. Inflation
adjustments
to
the
principal
amount
of
inflation-indexed
bonds
are
reflected
as
interest
income. Income
tax-related
interest
and
penalties,
if
incurred,
are
recorded
as
income
tax
expense. Dividends
received
from other
investment
companies are
reflected
as
dividend income;
capital
gain
distributions
are
reflected
as
realized
gain/loss. Dividend
income and
capital
gain
distributions
are
recorded
on
the
ex-dividend
date. Non-cash
dividends,
if
any,
are
recorded
at
the
fair
market
value
of
the
asset
received. Distributions
to
shareholders
are
recorded
on
the
ex-dividend
date. Income
distributions,
if
any, are
declared
by
each
class daily
and
paid
monthly. A
capital
gain
distribution,
if
any, may
also
be
declared
and
paid
by
the
fund
annually.
Currency
Translation
Assets,
including
investments,
and
liabilities
denominated
in
foreign
currencies
are
translated
into
U.S.
dollar
values
each
day
at
the
prevailing
exchange
rate,
using
the
mean
of
the
bid
and
asked
prices
of
such
currencies
against
U.S.
dollars
as
provided
by
an
outside
pricing
service.
Purchases
and
sales
of
securities,
income,
and
expenses
are
translated
into
U.S.
dollars
at
the
prevailing
exchange
rate
on
the
respective
date
of
such
transaction.
The
effect
of
changes
in
foreign
currency
exchange
rates
on
realized
and
unrealized
security
gains
and
losses
is
not
bifurcated
from
the
portion
attributable
to
changes
in
market
prices.
Class
Accounting
Shareholder
servicing,
prospectus,
and
shareholder
report
expenses
incurred
by
each
class
are
charged
directly
to
the
class
to
which
they
relate.
Expenses
common
to
all
classes
and
investment
income
are
allocated
to
the
classes
based
upon
the
relative
daily
net
assets
of
each
class’s
settled
shares;
realized
and
unrealized
gains
and
losses
are
allocated
based
upon
the
relative
daily
net
assets
of
each
class’s
outstanding
shares.
The
Advisor
Class
pays
Rule
12b-1
fees,
in
an
amount
not
exceeding
0.25%
of
the
class’s
average
daily
net
assets;
during
the
year
ended
December
31,
2024,
the
Advisor
Class
incurred
less
than
$1,000
in
these
fees.
Capital
Transactions
Each
investor’s
interest
in
the
net
assets
of the
fund
is
represented
by
fund
shares. The
fund’s
net
asset
value
(NAV)
per
share
is
computed
at
the
close
of
the
New
York
Stock
Exchange
(NYSE),
normally
4
p.m.
Eastern
time,
each
day
the
NYSE
is
open
for
business.
However,
the
NAV
per
share
may
be
calculated
at
a
time
other
than
the
normal
close
of
the
NYSE
if
trading
on
the
NYSE
is
restricted,
if
the
NYSE
closes
earlier,
or
as
T.
ROWE
PRICE
International
Bond
Fund
(USD
Hedged)
may
be
permitted
by
the
SEC.
Purchases
and
redemptions
of
fund
shares
are
transacted
at
the
next-computed
NAV
per
share,
after
receipt
of
the
transaction
order
by
T.
Rowe
Price
Associates,
Inc.,
or
its
agents.
New
Accounting
Guidance
In December
2023,
the
FASB
issued
Accounting
Standards
Update
(ASU),
ASU
2023-09,
Income
Taxes
(Topic
740)
–
Improvements
to
Income
Taxes
Disclosures,
which
enhances
the
transparency
of
income
tax
disclosures.
The
ASU
requires
public
entities,
on
an
annual
basis,
to
provide
disclosure
of
specific
categories
in
the
rate
reconciliation,
as
well
as
disclosure
of
income
taxes
paid
disaggregated
by
jurisdiction.
The
amendments
under
this
ASU
are
required
to
be
applied
prospectively
and
are
effective
for
fiscal
years
beginning
after
December
15,
2024.
Management
expects
that
adoption
of
the
guidance
will
not
have
a
material
impact
on
the
fund’s
financial
statements.
Indemnification
In
the
normal
course
of
business, the
fund
may
provide
indemnification
in
connection
with
its
officers
and
directors,
service
providers,
and/or
private
company
investments. The
fund’s
maximum
exposure
under
these
arrangements
is
unknown;
however,
the
risk
of
material
loss
is
currently
considered
to
be
remote.
NOTE
2
-
VALUATION
Fair
Value
The
fund’s
financial
instruments
are
valued
at
the
close
of
the
NYSE
and
are
reported
at
fair
value,
which
GAAP
defines
as
the
price
that
would
be
received
to
sell
an
asset
or
paid
to
transfer
a
liability
in
an
orderly
transaction
between
market
participants
at
the
measurement
date. The fund’s
Board
of
Directors
(the
Board)
has
designated
T.
Rowe
Price
Associates,
Inc.
as
the
fund’s
valuation
designee
(Valuation
Designee).
Subject
to
oversight
by
the
Board,
the
Valuation
Designee
performs
the
following
functions
in
performing
fair
value
determinations:
assesses
and
manages
valuation
risks;
establishes
and
applies
fair
value
methodologies;
tests
fair
value
methodologies;
and
evaluates
pricing
vendors
and
pricing
agents.
The
duties
and
responsibilities
of
the
Valuation
Designee
are
performed
by
its
Valuation
Committee. The
Valuation
Designee provides
periodic
reporting
to
the
Board
on
valuation
matters.
Various
valuation
techniques
and
inputs
are
used
to
determine
the
fair
value
of
financial
instruments.
GAAP
establishes
the
following
fair
value
hierarchy
that
categorizes
the
inputs
used
to
measure
fair
value:
T.
ROWE
PRICE
International
Bond
Fund
(USD
Hedged)
Level
1
–
quoted
prices
(unadjusted)
in
active
markets
for
identical
financial
instruments
that
the
fund
can
access
at
the
reporting
date
Level
2
–
inputs
other
than
Level
1
quoted
prices
that
are
observable,
either
directly
or
indirectly
(including,
but
not
limited
to,
quoted
prices
for
similar
financial
instruments
in
active
markets,
quoted
prices
for
identical
or
similar
financial
instruments
in
inactive
markets,
interest
rates
and
yield
curves,
implied
volatilities,
and
credit
spreads)
Level
3
–
unobservable
inputs
(including
the Valuation
Designee’s assumptions
in
determining
fair
value)
Observable
inputs
are
developed
using
market
data,
such
as
publicly
available
information
about
actual
events
or
transactions,
and
reflect
the
assumptions
that
market
participants
would
use
to
price
the
financial
instrument.
Unobservable
inputs
are
those
for
which
market
data
are
not
available
and
are
developed
using
the
best
information
available
about
the
assumptions
that
market
participants
would
use
to
price
the
financial
instrument.
GAAP
requires
valuation
techniques
to
maximize
the
use
of
relevant
observable
inputs
and
minimize
the
use
of
unobservable
inputs.
When
multiple
inputs
are
used
to
derive
fair
value,
the
financial
instrument
is
assigned
to
the
level
within
the
fair
value
hierarchy
based
on
the
lowest-level
input
that
is
significant
to
the
fair
value
of
the
financial
instrument.
Input
levels
are
not
necessarily
an
indication
of
the
risk
or
liquidity
associated
with
financial
instruments
at
that
level
but
rather
the
degree
of
judgment
used
in
determining
those
values.
Valuation
Techniques
Debt
securities
generally
are
traded
in
the over-the-
counter
(OTC)
market
and
are
valued
at
prices
furnished
by
independent
pricing
services
or
by
broker
dealers
who
make
markets
in
such
securities.
When
valuing
securities,
the
independent
pricing
services
consider
factors
such
as,
but
not
limited
to,
the
yield
or
price
of
bonds
of
comparable
quality,
coupon,
maturity,
and
type,
as
well
as
prices
quoted
by
dealers
who
make
markets
in
such
securities.
Investments
in
mutual
funds
are
valued
at
the
mutual
fund’s
closing
NAV
per
share
on
the
day
of
valuation.
Listed
options,
and
OTC
options
with
a
listed
equivalent,
are
valued
at
the
mean
of
the
closing
bid
and
asked
prices
and
exchange-traded
options
on
futures
contracts
are
valued
at
closing
settlement
prices.
Futures
contracts
are
valued
at
closing
settlement
prices.
Forward
currency
exchange
contracts
are
valued
using
the
prevailing
forward
exchange
rate.
Swaps
are
valued
at
prices
furnished
by
an
independent
pricing
service
T.
ROWE
PRICE
International
Bond
Fund
(USD
Hedged)
or
independent
swap
dealers.
Assets
and
liabilities
other
than
financial
instruments,
including
short-term
receivables
and
payables,
are
carried
at
cost,
or
estimated
realizable
value,
if
less,
which
approximates
fair
value.
Investments
for
which
market
quotations are
not
readily
available
or
deemed
unreliable
are
valued
at
fair
value
as
determined
in
good
faith
by
the
Valuation
Designee.
The
Valuation
Designee
has
adopted
methodologies
for
determining
the
fair
value
of
investments
for
which
market
quotations
are
not
readily
available
or
deemed
unreliable,
including
the
use
of
other
pricing
sources.
Factors
used
in
determining
fair
value
vary
by
type
of
investment
and
may
include
market
or
investment
specific
considerations.
The
Valuation
Designee typically
will
afford
greatest
weight
to
actual
prices
in
arm’s
length
transactions,
to
the
extent
they
represent
orderly
transactions
between
market
participants,
transaction
information
can
be
reliably
obtained,
and
prices
are
deemed
representative
of
fair
value.
However,
the
Valuation
Designee may
also
consider
other
valuation
methods
such
as
market-based
valuation
multiples;
a
discount
or
premium
from
market
value
of
a
similar,
freely
traded
security
of
the
same
issuer;
discounted
cash
flows;
yield
to
maturity;
or
some
combination.
Fair
value
determinations
are
reviewed
on
a
regular
basis.
Because
any
fair
value
determination
involves
a
significant
amount
of
judgment,
there
is
a
degree
of
subjectivity
inherent
in
such
pricing
decisions. Fair
value
prices
determined
by
the
Valuation
Designee could
differ
from
those
of
other
market
participants,
and
it
is
possible
that
the
fair
value
determined
for
a
security
may
be
materially
different
from
the
value
that
could
be
realized
upon
the
sale
of
that
security.
T.
ROWE
PRICE
International
Bond
Fund
(USD
Hedged)
Valuation
Inputs
The
following
table
summarizes
the
fund’s
financial
instruments,
based
on
the
inputs
used
to
determine
their
fair
values
on
December
31,
2024
(for
further
detail
by
category,
please
refer
to
the
accompanying
Portfolio
of
Investments):
($000s)
Level
1
Level
2
Level
3
Total
Value
Assets
Fixed
Income
Securities
1
$
—
$
4,833,270
$
—
$
4,833,270
Corporate
Bonds
—
1,287,484
17,396
1,304,880
Short-Term
Investments
143,260
480,532
—
623,792
Securities
Lending
Collateral
32,974
—
—
32,974
Options
Purchased
—
51,720
—
51,720
Total
Securities
176,234
6,653,006
17,396
6,846,636
Swaps*
—
20,106
—
20,106
Forward
Currency
Exchange
Contracts
—
298,550
—
298,550
Futures
Contracts*
3,342
—
—
3,342
Total
$
179,576
$
6,971,662
$
17,396
$
7,168,634
Liabilities
Options
Written
$
—
$
300
$
—
$
300
Swaps*
—
3,946
—
3,946
Forward
Currency
Exchange
Contracts
—
53,002
—
53,002
Futures
Contracts*
7,672
—
—
7,672
Total
$
7,672
$
57,248
$
—
$
64,920
1
Includes
Asset-Backed
Securities,
Government
Bonds
and
Municipal
Securities.
*
The
fair
value
presented
includes
cumulative
gain
(loss)
on
open
futures
contracts
and
centrally
cleared
swaps;
however,
the
net
value
reflected
on
the
accompanying
Portfolio
of
Investments
is
only
the
unsettled
variation
margin
receivable
(payable)
at
that
date.
T.
ROWE
PRICE
International
Bond
Fund
(USD
Hedged)
NOTE
3
-
DERIVATIVE
INSTRUMENTS
During
the
year ended
December
31,
2024,
the
fund
invested
in
derivative
instruments.
As
defined
by
GAAP,
a
derivative
is
a
financial
instrument
whose
value
is
derived
from
an
underlying
security
price,
foreign
exchange
rate,
interest
rate,
index
of
prices
or
rates,
or
other
variable;
it
requires
little
or
no
initial
investment
and
permits
or
requires
net
settlement
or
delivery
of
cash
or
other
assets.
The
fund
invests
in
derivatives
only
if
the
expected
risks
and
rewards
are
consistent
with
its
investment
objectives,
policies,
and
overall
risk
profile,
as
described
in
its
prospectus
and
Statement
of
Additional
Information.
The
fund
may
use
derivatives
for
a
variety
of
purposes
and
may
use
them
to
establish
both
long
and
short
positions
within
the
fund’s
portfolio.
Potential
uses
include
to
hedge
against
declines
in
principal
value,
increase
yield,
invest
in
an
asset
with
greater
efficiency
and
at
a
lower
cost
than
is
possible
through
direct
investment,
to
enhance
return,
or
to
adjust
portfolio
duration
and
credit
exposure.
The
risks
associated
with
the
use
of
derivatives
are
different
from,
and
potentially
much
greater
than,
the
risks
associated
with
investing
directly
in
the
instruments
on
which
the
derivatives
are
based.
The
fund
values
its
derivatives
at
fair
value
and
recognizes
changes
in
fair
value
currently
in
its
results
of
operations.
Accordingly,
the
fund
does
not
follow
hedge
accounting,
even
for
derivatives
employed
as
economic
hedges.
Generally,
the
fund
accounts
for
its
derivatives
on
a
gross
basis.
It
does
not
offset
the
fair
value
of
derivative
liabilities
against
the
fair
value
of
derivative
assets
on
its
financial
statements,
nor
does
it
offset
the
fair
value
of
derivative
instruments
against
the
right
to
reclaim
or
obligation
to
return
collateral.
The
following
table
summarizes
the
fair
value
of
the
fund’s
derivative
instruments
held
as
of
December
31,
2024,
and
the
related
location
on
the
accompanying
Statement
of
Assets
and
Liabilities,
presented
by
primary
underlying
risk
exposure:
T.
ROWE
PRICE
International
Bond
Fund
(USD
Hedged)
($000s)
Location
on
Statement
of
Assets
and
Liabilities
Fair
Value*
Assets
Interest
rate
derivatives
Centrally
Cleared
Swaps,
Futures,
Securities^
$
46,699
Foreign
exchange
derivatives
Forwards,
Securities^
323,708
Credit
derivatives
Bilateral
Swaps
and
Premiums,
Centrally
Cleared
Swaps,
Securities^
3,311
^
,*
Total
$
373,718
^
,*
Liabilities
Inflation
derivatives
Centrally
Cleared
Swaps
$
740
Interest
rate
derivatives
Centrally
Cleared
Swaps,
Futures
8,722
Foreign
exchange
derivatives
Forwards
53,002
Credit
derivatives
Centrally
Cleared
Swaps,
Options
Written
2,456
Total
$
64,920
*
The
fair
value
presented
includes
cumulative
gain
(loss)
on
open
futures
contracts
and
centrally
cleared
swaps;
however,
the
value
reflected
on
the
accompanying
Statement
of
Assets
and
Liabilities
is
only
the
unsettled
variation
margin
receivable
(payable)
at
that
date.
^
Options
purchased
are
reported
as
securities
and
are
reflected
in
the
accompanying
Portfolio
of
Investments.
T.
ROWE
PRICE
International
Bond
Fund
(USD
Hedged)
Additionally,
the
amount
of
gains
and
losses
on
derivative
instruments
recognized
in
fund
earnings
during
the
year ended
December
31,
2024,
and
the
related
location
on
the
accompanying
Statement
of
Operations
is
summarized
in
the
following
table
by
primary
underlying
risk
exposure:
($000s)
Location
of
Gain
(Loss)
on
Statement
of
Operations
Securities^
Options
Written
Futures
Forward
Currency
Exchange
Contracts
Swaps
Total
Realized
Gain
(Loss)
Inflation
derivatives
$
—
$
—
$
—
$
—
$
(945)
$
(945)
Interest
rate
derivatives
—
194
9,985
—
(13,939)
(3,760)
Foreign
exchange
derivatives
(253)
—
—
37,950
—
37,697
Credit
derivatives
741
662
—
—
(3,529)
(2,126)
Total
$
488
$
856
$
9,985
$
37,950
$
(18,413)
$
30,866
Change
in
Unrealized
Gain
(Loss)
Inflation
derivatives
$
—
$
—
$
—
$
—
$
(740)
$
(740)
Interest
rate
derivatives
141
5,996
(4,975)
—
31,134
32,296
Foreign
exchange
derivatives
1,838
—
—
387,929
—
389,767
Credit
derivatives
284
453
—
—
(851)
(114)
Total
$
2,263
$
6,449
$
(4,975)
$
387,929
$
29,543
$
421,209
^
Options
purchased
are
reported
as
securities.
T.
ROWE
PRICE
International
Bond
Fund
(USD
Hedged)
Counterparty
Risk
and
Collateral
The
fund
invests
in
derivatives
in
various
markets,
which
expose
it
to
differing
levels
of
counterparty
risk.
Counterparty
risk
on
exchange-traded
and
centrally
cleared
derivative
contracts,
such
as
futures,
exchange-traded
options,
and
centrally
cleared
swaps,
is
minimal
because
the
clearinghouse
provides
protection
against
counterparty
defaults.
For
futures
and
centrally
cleared
swaps,
the
fund
is
required
to
deposit
collateral
in
an
amount
specified
by
the
clearinghouse
and
the
clearing
firm
(margin
requirement),
and
the
margin
requirement
must
be
maintained
over
the
life
of
the
contract.
Each
clearinghouse
and
clearing
firm,
in
its
sole
discretion,
may
adjust
the
margin
requirements
applicable
to
the
fund.
Derivatives,
such
as
non-cleared bilateral
swaps,
forward
currency
exchange
contracts,
and
OTC
options,
that
are
transacted
and
settle
directly
with
a
counterparty
(bilateral
derivatives)
may
expose
the
fund
to
greater
counterparty
risk.
To
mitigate
this
risk,
the
fund
has
entered
into
master
netting
arrangements
(MNAs)
with
certain
counterparties
that
permit
net
settlement
under
specified
conditions
and,
for
certain
counterparties,
also
require
the
exchange
of
collateral
to
cover
mark-to-market
exposure.
MNAs
may
be
in
the
form
of
International
Swaps
and
Derivatives
Association
master
agreements
(ISDAs)
or
foreign
exchange
letter
agreements
(FX
letters).
MNAs
provide
the
ability
to
offset
amounts
the
fund
owes
a
counterparty
against
amounts
the
counterparty
owes
the
fund
(net
settlement).
Both
ISDAs
and
FX
letters
generally
allow
termination
of
transactions
and
net
settlement
upon
the
occurrence
of
contractually
specified
events,
such
as
failure
to
pay
or
bankruptcy.
In
addition,
ISDAs
specify
other
events,
the
occurrence
of
which
would
allow
one
of
the
parties
to
terminate.
For
example,
a
downgrade
in
credit
rating
of
a
counterparty
below
a
specified
rating
would
allow
the
fund
to
terminate,
while
a
decline
in
the
fund’s
net
assets
of
more
than
a
specified
percentage
would
allow
the
counterparty
to
terminate.
Upon
termination,
all
transactions
with
that
counterparty
would
be
liquidated
and
a
net
termination
amount
settled.
ISDAs
typically
include
collateral
agreements
whereas
FX
letters
do
not.
Variation
margin
amounts
are
determined
daily
based
on
the
net
aggregate
unrealized
gain
or
loss
on
all
bilateral
derivatives
with
a
counterparty,
subject
to
minimum
transfer
amounts
that
typically
range
from
$100,000
to
$250,000.
Any
additional
variation
margin
required
due
to
changes
in
security
values
is
typically
transferred
the
next
business
day.
Initial
margin
amounts
are
determined
on
a
daily
basis
and
calculated
in
accordance
to
global
regulations
on
all
bilateral
derivatives
with
a
counterparty,
subject
to
an
initial
margin
threshold
(typically
$50,000,000
per
counterparty)
T.
ROWE
PRICE
International
Bond
Fund
(USD
Hedged)
and
a
minimum
transfer
amount
of
$100,000
to
$500,000
when
initial
margin
amounts
exceed
the
counterparty
threshold.
Any
additional
initial
margin
required
due
to
changes
in
security
values
is
typically
transferred
the
next
business
day.
Variation
margin
and
initial
margin
are
collectively
referred
to
as
collateral.
Collateral
may
be
in
the
form
of
cash
or
debt
securities
issued
by
the
U.S.
government
or
related
agencies,
and
by
the
governments
of
Canada,
France,
Germany,
Japan,
or
the
United
Kingdom,
although
other
securities
may
be
used
depending
on
the
terms
outlined
in
the
applicable
MNA.
Cash
posted
by
the
fund
is
reflected
as
cash
deposits
in
the
accompanying
financial
statements
and
generally
is
restricted
from
withdrawal
by
the
fund;
securities
posted
by
the
fund
are
so
noted
in
the
accompanying
Portfolio
of
Investments;
both
remain
in
the
fund’s
assets.
Collateral
pledged
by
counterparties
is
not
included
in
the
fund’s
assets
because
the
fund
does
not
obtain
effective
control
over
those
assets.
For
bilateral
derivatives,
collateral
posted
by
the
fund
is
held
in
a
segregated
account
at
the
fund’s
custodian.
While
typically
not
sold
in
the
same
manner
as
equity
or
fixed
income
securities,
exchange-traded
or
centrally
cleared
derivatives
may
be
closed
out
only
on
the
exchange
or
clearinghouse
where
the
contracts
were
cleared,
and
OTC
and
bilateral
derivatives
may
be
unwound
with
counterparties
or
transactions
assigned
to
other
counterparties
to
allow
the
fund
to
exit
the
transaction.
This
ability
is
subject
to
the
liquidity
of
underlying
positions. As
of
December
31,
2024,
securities
valued
at $46,620,000
had
been
posted
by
the
fund
for
exchange-traded
and/or
centrally
cleared
derivatives.
T.
ROWE
PRICE
International
Bond
Fund
(USD
Hedged)
The
following
table
summarizes
the
fund’s
OTC
and
bilateral
derivatives
at
the
reporting
date
by
loss
exposure
to
each
counterparty
after
consideration
of
collateral,
if
any.
($000s)
Gross
Value
on
Statements
of
Assets
and
Liabilities
Net
amount
due
(to)/from
Counterparty
or
Exchange
Collateral
Pledged
(Received)
by
Fund
Loss
Exposure,
After
Collateral*
(not
less
than
$0)
Counterparty
Assets
Liabilities
Bank
of
America
$
27,906
$
(7,781)
$
20,125
$
(20,127)
$
—
Barclays
Bank
46,845
(9,062)
37,783
(38,068)
—
BNP
Paribas
6,833
(6,145)
688
(160)
528
BNY
Mellon
63
(10)
53
—
53
Canadian
Imperial
Bank
of
Commerce
59
—
59
—
59
Citibank
39,681
(7,727)
31,954
(33,160)
—
Citigroup
Global
Markets
323
—
323
—
323
Deutsche
Bank
17,104
(3,556)
13,548
(10,800)
2,748
Goldman
Sachs
9,898
(6,009)
3,889
(4,570)
—
HSBC
Bank
113,576
(2,292)
111,284
(105,990)
5,294
JPMorgan
Chase
4,060
(3,535)
525
(236)
289
Morgan
Stanley
7,283
(1,038)
6,245
(5,685)
560
Nomura
Securities
International
68
—
68
—
68
RBC
Dominion
Securities
175
(294)
(119)
—
—
Societe
Generale
1,402
—
1,402
(1,144)
258
Standard
Chartered
331
—
331
(270)
61
State
Street
18,040
(1,827)
16,213
(15,361)
852
Toronto-Dominion
Bank
14,470
(41)
14,429
(14,249)
180
UBS
Investment
Bank
42,403
(3,985)
38,418
(36,748)
1,670
Wells
Fargo
190
—
190
—
190
Total
$
350,710
$
(53,302)
*
In
situations
such
as
counterparty
default
or
bankruptcy,
the
fund
may
have
further
rights
of
offset
against
amounts
due
to
or
from
the
counterparty
under
other
agreements.
T.
ROWE
PRICE
International
Bond
Fund
(USD
Hedged)
Forward
Currency
Exchange
Contracts
The
fund
is
subject
to
foreign
currency
exchange
rate
risk
in
the
normal
course
of
pursuing
its
investment
objectives.
It may use
forward
currency
exchange
contracts
(forwards)
primarily
to
protect
its
non-U.S.
dollar-denominated
securities
from
adverse
currency
movements
or
to
increase
exposure
to
a
particular
foreign
currency,
to
shift
the
fund’s
foreign
currency
exposure
from
one
country
to
another,
or
to
enhance
the
fund’s
return.
A
forward
involves
an
obligation
to
purchase
or
sell
a
fixed
amount
of
a
specific
currency
on
a
future
date
at
a
price
set
at
the
time
of
the
contract.
Although
certain
forwards
may
be
settled
by
exchanging
only
the
net
gain
or
loss
on
the
contract,
most
forwards
are
settled
with
the
exchange
of
the
underlying
currencies
in
accordance
with
the
specified
terms.
Forwards
are
valued
at
the
unrealized
gain
or
loss
on
the
contract,
which
reflects
the
net
amount
the
fund
either
is
entitled
to
receive
or
obligated
to
deliver,
as
measured
by
the
difference
between
the
forward
exchange
rates
at
the
date
of
entry
into
the
contract
and
the
forward
rates
at
the
reporting
date.
Appreciated
forwards
are
reflected
as
assets
and
depreciated
forwards
are
reflected
as
liabilities
on
the
accompanying
Statement
of
Assets
and
Liabilities.
When
a
contract
is
closed,
a
realized
gain
or
loss
is
recorded
on
the
accompanying
Statement
of
Operations.
Risks
related
to
the
use
of
forwards
include
the
possible
failure
of
counterparties
to
meet
the
terms
of
the
agreements;
that
anticipated
currency
movements
will
not
occur,
thereby
reducing
the
fund’s
total
return;
and
the
potential
for
losses
in
excess
of
the
fund’s
initial
investment.
During
the
year ended
December
31,
2024,
the
volume
of
the
fund’s
activity
in
forwards,
based
on
underlying
notional
amounts,
was
generally
between
84%
and
94%
of
net
assets.
Futures
Contracts
The
fund
is
subject
to interest
rate
risk in
the
normal
course
of
pursuing
its
investment
objectives
and
uses
futures
contracts
to
help
manage
such
risk.
The fund
may
enter
into
futures
contracts
to
manage
exposure
to
interest
rate
and
yield
curve
movements,
security
prices,
foreign
currencies,
and
mortgage
prepayments;
as
an
efficient
means
of
adjusting
exposure
to
all
or
part
of
a
target
market;
as
a
cash
management
tool;
or
to
adjust
portfolio
duration. A
futures
contract
provides
for
the
future
sale
by
one
party
and
purchase
by
another
of
a
specified
amount
of
a
specific
underlying
financial
instrument
at
an
agreed-upon
price,
date,
time,
and
place.
The
fund
currently
invests
only
in
exchange-traded
futures,
which
generally
are
standardized
as
to
maturity
date,
underlying
financial
instrument,
and
other
contract
terms.
Payments
are
made
or
received
by
the
fund
each
day
to
settle
daily
fluctuations
in
the
value
of
the
contract
(variation
margin),
which
reflect
changes
in
the
value
of
the
underlying
financial
instrument.
Variation
margin
is
recorded
as
unrealized
T.
ROWE
PRICE
International
Bond
Fund
(USD
Hedged)
gain
or
loss
until
the
contract
is
closed.
The
value
of
a
futures
contract
included
in
net
assets
is
the
amount
of
unsettled
variation
margin;
net
variation
margin
receivable
is
reflected
as
an
asset
and
net
variation
margin
payable
is
reflected
as
a
liability
on
the
accompanying
Statement
of
Assets
and
Liabilities.
When
a
contract
is
closed,
a
realized
gain
or
loss
is
recorded
on
the
accompanying
Statement
of
Operations.
Risks
related
to
the
use
of
futures
contracts
include
possible
illiquidity
of
the
futures
markets,
contract
prices
that
can
be
highly
volatile
and
imperfectly
correlated
to
movements
in
hedged
security
values
and/
or
interest
rates,
and
potential
losses
in
excess
of
the
fund’s
initial
investment.
During
the
year ended
December
31,
2024,
the
volume
of
the
fund’s
activity
in
futures,
based
on
underlying
notional
amounts,
was
generally
between
8%
and
17%
of
net
assets.
Options
The
fund
is
subject
to interest
rate
risk,
foreign
currency
exchange
rate
risk
and
credit
risk in
the
normal
course
of
pursuing
its
investment
objectives
and
uses
options
to
help
manage
such
risks.
The
fund
may
use
options
to
manage
exposure
to
security
prices,
interest
rates,
foreign
currencies,
and
credit
quality;
as
an
efficient
means
of
adjusting
exposure
to
all
or
a
part
of
a
target
market;
to
enhance
income;
as
a
cash
management
tool;
or
to
adjust
credit
exposure.
The
fund
may
buy
or
sell
options
that
can
be
settled
either
directly
with
the
counterparty
(OTC
option)
or
through
a
central
clearinghouse
(exchange-traded
option).
Options
are
included
in
net
assets
at
fair
value,
options
purchased
are
included
in
Investments
in
Securities,
and
options
written
are
separately
reflected
as
a
liability
on
the
accompanying
Statement
of
Assets
and
Liabilities.
Premiums
on
unexercised,
expired
options
are
recorded
as
realized
gains
or
losses
on
the
accompanying
Statement
of
Operations;
premiums
on
exercised
options
are
recorded
as
an
adjustment
to
the
proceeds
from
the
sale
or
cost
of
the
purchase.
The
difference
between
the
premium
and
the
amount
received
or
paid
in
a
closing
transaction
is
also
treated
as
realized
gain
or
loss
on
the
accompanying
Statement
of
Operations.
In
return
for
a
premium
paid,
currency
options
give
the
holder
the
right,
but
not
the
obligation,
to
buy
and
sell
currency
at
a
specified
exchange
rate;
although
certain
currency
options
may
be
settled
by
exchanging
only
the
net
gain
or
loss
on
the
contract.
In
return
for
a
premium
paid,
options
on
swaps
give
the
holder
the
right,
but
not
the
obligation,
to
enter
a
specified
swap
contract
on
predefined
terms.
The
exercise
price
of
an
option
on
a
credit
default
swap
is
stated
in
terms
of
a
specified
spread
that
represents
the
cost
of
credit
protection
on
the
reference
asset,
including
both
the
upfront
premium
to
open
the
position
and
future
periodic
payments.
The
exercise
price
of
an
interest
rate
swap
is
stated
in
terms
of
a
fixed
interest
rate;
generally,
there
is
no
upfront
payment
to
open
T.
ROWE
PRICE
International
Bond
Fund
(USD
Hedged)
the
position. Risks related
to
the
use
of
options
include
possible
illiquidity
of
the
options
markets;
trading
restrictions
imposed
by
an
exchange
or
counterparty;
possible
failure
of
counterparties
to
meet
the
terms
of
the
agreements;
movements
in
the
underlying
asset
values,
interest
rates,
currency
values
and
credit
ratings;
and,
for
options
written,
the
potential
for
losses
to
exceed
any
premium
received
by
the
fund.
During
the
year ended
December
31,
2024,
the
volume
of
the
fund’s
activity
in
options,
based
on
underlying
notional
amounts,
was
generally
between
1%
and
40%
of
net
assets.
Swaps
The
fund
is
subject
to
interest
rate
risk,
credit
risk
and
inflation
risk in
the
normal
course
of
pursuing
its
investment
objectives
and
uses
swap
contracts
to
help
manage
such
risks.
The
fund
may
use
swaps
in
an
effort
to
manage
both
long
and
short
exposure
to
changes
in
interest
rates,
inflation
rates,
and
credit
quality;
to
adjust
overall
exposure
to
certain
markets;
to
enhance
total
return
or
protect
the
value
of
portfolio
securities;
to
serve
as
a
cash
management
tool;
or
to
adjust
portfolio
duration
and
credit
exposure.
Swap
agreements
can
be
settled
either
directly
with
the
counterparty
(bilateral
swap)
or
through
a
central
clearinghouse
(centrally
cleared
swap).
Fluctuations
in
the
fair
value
of
a
contract
are
reflected
in
unrealized
gain
or
loss
and
are
reclassified
to
realized
gain
or
loss
on
the
accompanying
Statement
of
Operations upon
contract
termination
or
cash
settlement.
Net
periodic
receipts
or
payments
required
by
a
contract
increase
or
decrease,
respectively,
the
value
of
the
contract
until
the
contractual
payment
date,
at
which
time
such
amounts
are
reclassified
from
unrealized
to
realized
gain
or
loss
on
the
accompanying
Statement
of
Operations.
For
bilateral
swaps,
cash
payments
are
made
or
received
by
the
fund
on
a
periodic
basis
in
accordance
with
contract
terms;
unrealized
gain
on
contracts
and
premiums
paid
are
reflected
as
assets
and
unrealized
loss
on
contracts
and
premiums
received
are
reflected
as
liabilities
on
the
accompanying
Statement
of
Assets
and
Liabilities.
For
bilateral
swaps,
premiums
paid
or
received
are
amortized
over
the
life
of
the
swap
and
are
recognized
as
realized
gain
or
loss
on
the
accompanying
Statement
of
Operations.
For
centrally
cleared
swaps,
payments
are
made
or
received
by
the
fund
each
day
to
settle
the
daily
fluctuation
in
the
value
of
the
contract
(variation
margin).
Accordingly,
the
value
of
a
centrally
cleared
swap
included
in
net
assets
is
the
unsettled
variation
margin;
net
variation
margin
receivable
is
reflected
as
an
asset
and
net
variation
margin
payable
is
reflected
as
a
liability
on
the
accompanying
Statement
of
Assets
and
Liabilities.
Interest
rate
swaps
are
agreements
to
exchange
cash
flows
based
on
the
difference
between
specified
interest
rates
applied
to
a
notional
principal
amount
for
a
specified
period
of
time.
Risks
related
to
the
use
of
interest
rate
T.
ROWE
PRICE
International
Bond
Fund
(USD
Hedged)
swaps
include
the
potential
for
unanticipated
movements
in
interest
or
currency
rates,
the
possible
failure
of
a
counterparty
to
perform
in
accordance
with
the
terms
of
the
swap
agreements,
potential
government
regulation
that
could
adversely
affect
the
fund’s
swap
investments,
and
potential
losses
in
excess
of
the
fund’s
initial
investment.
Credit
default
swaps
are
agreements
where
one
party
(the
protection
buyer)
agrees
to
make
periodic
payments
to
another
party
(the
protection
seller)
in
exchange
for
protection
against
specified
credit
events,
such
as
certain
defaults
and
bankruptcies
related
to
an
underlying
credit
instrument,
or
issuer
or
index
of
such
instruments.
Upon
occurrence
of
a
specified
credit
event,
the
protection
seller
is
required
to
pay
the
buyer
the
difference
between
the
notional
amount
of
the
swap
and
the
value
of
the
underlying
credit,
either
in
the
form
of
a
net
cash
settlement
or
by
paying
the
gross
notional
amount
and
accepting
delivery
of
the
relevant
underlying
credit.
For
credit
default
swaps
where
the
underlying
credit
is
an
index,
a
specified
credit
event
may
affect
all
or
individual
underlying
securities
included
in
the
index
and
will
be
settled
based
upon
the
relative
weighting
of
the
affected
underlying
security(ies)
within
the
index. Generally,
the
payment
risk
for
the
seller
of
protection
is
inversely
related
to
the
current
market
price
or
credit
rating
of
the
underlying
credit
or
the
market
value
of
the
contract
relative
to
the
notional
amount,
which
are
indicators
of
the
markets’
valuation
of
credit
quality.
As
of
December
31,
2024,
the
notional
amount
of
protection
sold
by
the
fund
totaled $51,633,000
(0.7%
of
net
assets),
which
reflects
the
maximum
potential
amount
the
fund
could
be
required
to
pay
under
such
contracts.
Risks
related
to
the
use
of
credit
default
swaps
include
the
possible
inability
of
the
fund
to
accurately
assess
the
current
and
future
creditworthiness
of
underlying
issuers,
the
possible
failure
of
a
counterparty
to
perform
in
accordance
with
the
terms
of
the
swap
agreements,
potential
government
regulation
that
could
adversely
affect
the
fund’s
swap
investments,
and
potential
losses
in
excess
of
the
fund’s
initial
investment.
Zero-coupon
inflation
swaps
are
agreements
to
exchange
cash
flows,
on
the
contract’s
maturity
date,
based
on
the
difference
between
a
predetermined
fixed
rate
and
the
cumulative
change
in
the
consumer
price
index,
both
applied
to
a
notional
principal
amount
for
a
specified
period
of
time.
Risks
related
to
the
use
of
zero-coupon
inflation
swaps
include
the
potential
for
unanticipated
movements
in
inflation
rates,
the
possible
failure
of
a
counterparty
to
perform
in
accordance
with
the
terms
of
the
swap
agreements,
potential
government
regulation
that
could
adversely
affect
the
fund’s
swap
investments,
and
potential
losses
in
excess
of
the
fund’s
initial
investment.
T.
ROWE
PRICE
International
Bond
Fund
(USD
Hedged)
During
the
year ended
December
31,
2024,
the
volume
of
the
fund’s
activity
in
swaps,
based
on
underlying
notional
amounts,
was
generally
between
20%
and
65%
of
net
assets.
NOTE
4
-
OTHER
INVESTMENT
TRANSACTIONS
Consistent
with
its
investment
objective, the
fund
engages
in
the
following
practices
to
manage
exposure
to
certain
risks
and/or
to
enhance
performance.
The
investment
objective,
policies,
program,
and
risk
factors
of the
fund
are
described
more
fully
in the
fund’s prospectus
and
Statement
of
Additional
Information.
Emerging
and
Frontier
Markets
The fund
invests,
either
directly
or
through
investments
in
other
T.
Rowe
Price
funds,
in
securities
of
companies
located
in,
issued
by
governments
of,
or
denominated
in
or
linked
to
the
currencies
of
emerging
and
frontier
market
countries.
Emerging
markets,
and
to
a
greater
extent
frontier
markets, tend
to
have
economic
structures
that
are
less
diverse
and
mature,
less
developed
legal
and
regulatory
regimes,
and
political
systems
that
are
less
stable,
than
those
of
developed
countries.
These
markets
may
be
subject
to
greater
political,
economic,
and
social
uncertainty
and
differing
accounting
standards
and
regulatory
environments
that
may
potentially
impact
the
fund’s
ability
to
buy
or
sell
certain
securities
or
repatriate
proceeds
to
U.S.
dollars.
Emerging
markets
securities
exchanges
are
more
likely
to
experience
delays
with
the
clearing
and
settling
of
trades,
as
well
as
the
custody
of
holdings
by
local
banks,
agents,
and
depositories.
Such
securities
are
often
subject
to
greater
price
volatility,
less
liquidity,
and
higher
rates
of
inflation
than
U.S.
securities.
Investing
in
frontier
markets
is
typically
significantly
riskier
than
investing
in
other
countries,
including
emerging
markets.
Restricted
Securities
The
fund
invests
in
securities
that
are
subject
to
legal
or
contractual
restrictions
on
resale.
Prompt
sale
of
such
securities
at
an
acceptable
price
may
be
difficult
and
may
involve
substantial
delays
and
additional
costs.
Securities
Lending
The fund
may
lend
its
securities
to
approved
borrowers
to
earn
additional
income.
Its
securities
lending
activities
are
administered
by
a
lending
agent
in
accordance
with
a
securities
lending
agreement.
Security
loans
generally
do
not
have
stated
maturity
dates,
and
the
fund
may
recall
a
security
at
any
time.
The
fund
receives
collateral
in
the
form
of
cash
or
U.S.
government
securities.
Collateral
is
maintained
over
the
life
of
the
loan
in
an
amount
not
less
than
the
value
of
loaned
securities;
any
additional
collateral
required
due
to
T.
ROWE
PRICE
International
Bond
Fund
(USD
Hedged)
changes
in
security
values
is
delivered
to
the
fund
the
next
business
day.
Cash
collateral
is
invested
in
accordance
with
investment
guidelines
approved
by
fund
management.
Additionally,
the
lending
agent
indemnifies
the
fund
against
losses
resulting
from
borrower
default.
Although
risk
is
mitigated
by
the
collateral
and
indemnification,
the
fund
could
experience
a
delay
in
recovering
its
securities
and
a
possible
loss
of
income
or
value
if
the
borrower
fails
to
return
the
securities,
collateral
investments
decline
in
value,
and
the
lending
agent
fails
to
perform.
Securities
lending
revenue
consists
of
earnings
on
invested
collateral
and
borrowing
fees,
net
of
any
rebates
to
the
borrower,
compensation
to
the
lending
agent,
and
other
administrative
costs.
In
accordance
with
GAAP,
investments
made
with
cash
collateral
are
reflected
in
the
accompanying
financial
statements,
but
collateral
received
in
the
form
of
securities
is
not.
At
December
31,
2024,
the
value
of
loaned
securities
was
$30,331,000;
the
value
of
cash
collateral
and
related
investments
was
$32,974,000.
Other
Purchases
and
sales
of
portfolio
securities
other
than
in-kind
transactions,
if
any,
and short-term securities
aggregated $3,828,977,000 and
$3,041,891,000,
respectively,
for
the
year ended
December
31,
2024.
NOTE
5
-
FEDERAL
INCOME
TAXES
Generally,
no
provision
for
federal
income
taxes
is
required
since
the
fund
intends
to continue
to
qualify
as
a
regulated
investment
company
under
Subchapter
M
of
the
Internal
Revenue
Code
and
distribute
to
shareholders
all
of
its taxable
income
and
gains.
Distributions
determined
in
accordance
with
federal
income
tax
regulations
may
differ
in
amount
or
character
from
net
investment
income
and
realized
gains
for
financial
reporting
purposes.
The
fund
files
U.S.
federal,
state,
and
local
tax
returns
as
required.
The
fund’s
tax
returns
are
subject
to
examination
by
the
relevant
tax
authorities
until
expiration
of
the
applicable
statute
of
limitations,
which
is
generally
three
years
after
the
filing
of
the
tax
return
but
which
can
be
extended
to
six
years
in
certain
circumstances.
Tax
returns
for
open
years
have
incorporated
no
uncertain
tax
positions
that
require
a
provision
for
income
taxes.
Capital
accounts
within
the
financial
reporting
records
are
adjusted
for
permanent
book/tax
differences
to
reflect
tax
character
but
are
not
adjusted
for
temporary
differences.
The
permanent
book/tax
adjustments,
if
any,
have
no
impact
on
results
of
operations
or
net
assets.
The
permanent
book/tax
adjustments
relate
primarily
to
the
character
of
net
currency
gains
or
losses
and
the
character
of
income
on
swaps.
T.
ROWE
PRICE
International
Bond
Fund
(USD
Hedged)
The
tax
character
of
distributions
paid
for
the
periods
presented
was
as
follows:
At
December
31,
2024,
the
tax-basis
cost
of
investments
(including
derivatives,
if
any)
and
gross
unrealized
appreciation
and
depreciation
were as
follows:
At
December
31,
2024,
the
tax-basis
components
of
accumulated
net
earnings
(loss)
were
as
follows:
Temporary
differences
between
book-basis
and
tax-basis
components
of
total
distributable
earnings
(loss)
arise
when
certain
items
of
income,
gain,
or
loss
are
recognized
in
different
periods
for
financial
statement
purposes
versus
for
tax
purposes;
these
differences
will
reverse
in
a
subsequent
reporting
period.
The
temporary
differences
relate
primarily
to
the
deferral
of
losses
from
wash
sales,
the
realization
of
gains/losses
on
certain
open
derivative
contracts
and
the
character
of
income
on
certain
derivatives
contracts.
The
loss
carryforwards
($000s)
December
31,
2024
December
31,
2023
Ordinary
income
(including
short-term
capital
gains,
if
any)
$
232,046
$
23,247
Return
of
capital
—
157,476
Total
distributions
$
232,046
$
180,723
($000s)
Cost
of
investments
$
7,245,283
Unrealized
appreciation
$
170,512
Unrealized
depreciation
(563,451)
Net
unrealized
appreciation
(depreciation)
$
(392,939)
($000s)
Undistributed
ordinary
income
$
144,052
Net
unrealize
d
appreciation
(depreciation)
(392,939)
Loss
carryforwards
and
deferrals
(466,041)
Other
temporary
differences
1,254
Total
distributable
earnings
(loss)
$
(713,674)
T.
ROWE
PRICE
International
Bond
Fund
(USD
Hedged)
and
deferrals
primarily
relate
to
capital
loss
carryforwards
and
straddle
deferrals.
Capital
loss
carryforwards
are
available
indefinitely
to
offset
future
realized
capital
gains.
NOTE
6
-
FOREIGN TAXES
The
fund
is
subject
to
foreign
income
taxes
imposed
by
certain
countries
in
which
it
invests.
Additionally,
capital
gains
realized
upon
disposition
of
securities
issued
in
or
by
certain
foreign
countries
are
subject
to
capital
gains
tax
imposed
by
those
countries.
All
taxes
are
computed
in
accordance
with
the
applicable
foreign
tax
law,
and,
to
the
extent
permitted,
capital
losses
are
used
to
offset
capital
gains.
Taxes
attributable
to
income
are
accrued
by
the
fund
as
a
reduction
of
income.
Current
and
deferred
tax
expense
attributable
to
capital
gains
is
reflected
as
a
component
of
realized
or
change
in
unrealized
gain/
loss
on
securities
in
the
accompanying
financial
statements.
To
the
extent
that
the
fund
has
country
specific
capital
loss
carryforwards,
such
carryforwards
are
applied
against
net
unrealized
gains
when
determining
the
deferred
tax
liability.
Any
deferred
tax
liability
incurred
by
the
fund
is
included
in
either
Other
liabilities
or
Deferred
tax
liability
on
the
accompanying
Statement
of
Assets
and
Liabilities.
NOTE
7
-
RELATED
PARTY
TRANSACTIONS
The
fund
is
managed
by
T.
Rowe
Price
Associates,
Inc.
(Price
Associates),
a
wholly
owned
subsidiary
of
T.
Rowe
Price
Group,
Inc.
(Price
Group). Price
Associates
has
entered
into
a
sub-advisory
agreement(s)
with
one
or
more
of
its
wholly
owned
subsidiaries,
to
provide
investment
advisory
services
to
the
fund.
The
investment
management
agreement
between
the
fund
and
Price
Associates
provides
for
an
annual
investment
management
fee,
which
is
computed
daily
and
paid
monthly. The
fee
consists
of
an
individual
fund
fee,
equal
to
0.20%
of
the
fund’s
average
daily
net
assets,
and
a
group
fee.
The
group
fee
rate
is
calculated
based
on
the
combined
net
assets
of
certain
mutual
funds
sponsored
by
Price
Associates
(the
group)
applied
to
a
graduated
fee
schedule,
with
rates
ranging
from
0.48%
for
the
first
$1
billion
of
assets
to
0.260%
for
assets
in
excess
of
$845
billion.
The
fund’s
group
fee
is
determined
by
applying
the
group
fee
rate
to
the
fund’s
average
daily
net
assets. At
December
31,
2024,
the
effective
annual
group
fee
rate
was
0.28%.
T.
ROWE
PRICE
International
Bond
Fund
(USD
Hedged)
The Investor
Class and Advisor
Class are
each
subject
to
a
contractual
expense
limitation
through
the
expense
limitation
dates
indicated
in
the
table
below.
This
agreement
will
continue
through
the
expense
limitation
dates
indicated
in
the
table
below,
and
may
be
renewed,
revised,
or
revoked
only
with
approval
of
the
fund’s
Board.
During
the
limitation
period,
Price
Associates
is required
to
waive
or
pay
any
expenses
(excluding
interest;
expenses
related
to
borrowings,
taxes,
and
brokerage;
non-recurring,
extraordinary
expenses;
and
acquired
fund
fees
and
expenses)
that
would
otherwise
cause
the class’s ratio
of
annualized
total
expenses
to
average
net
assets
(net
expense
ratio)
to
exceed
its
expense
limitation.
Each
class
is
required
to
repay
Price
Associates
for
expenses
previously
waived/paid
to
the
extent
the
class’s net
assets
grow
or
expenses
decline
sufficiently
to
allow
repayment
without
causing
the class’s net
expense
ratio
(after
the
repayment
is
taken
into
account)
to
exceed
the
lesser
of:
(1)
the
expense
limitation
in
place
at
the
time
such
amounts
were
waived;
or
(2)
the class’s
current
expense
limitation.
However,
no
repayment
will
be
made
more
than
three
years
after
the
date
of
a
payment
or
waiver.
The
I
Class
is
also
subject
to
an
operating
expense
limitation
(I
Class
Limit)
pursuant
to
which
Price
Associates
is
contractually
required
to
pay
all
operating
expenses
of
the
I
Class,
excluding
management
fees;
interest;
expenses
related
to
borrowings,
taxes,
and
brokerage; non-recurring,
extraordinary expenses; and
acquired
fund
fees
and
expenses, to
the
extent
such
operating
expenses,
on
an
annualized
basis,
exceed
the
I
Class
Limit. This
agreement
will
continue
through
the
expense
limitation
date
indicated
in
the
table
below,
and
may
be
renewed,
revised,
or
revoked
only
with
approval
of
the
fund’s
Board.
The
I
Class
is
required
to
repay
Price
Associates
for
expenses
previously
paid
to
the
extent
the
class’s
net
assets
grow
or
expenses
decline
sufficiently
to
allow
repayment
without
causing
the
class’s
operating
expenses
(after
the
repayment
is
taken
into
account)
to
exceed
the
lesser
of:
(1)
the
I
Class
Limit
in
place
at
the
time
such
amounts
were
paid;
or
(2)
the
current
I
Class
Limit.
However,
no
repayment
will
be
made
more
than
three
years
after
the
date
of
a
payment
or
waiver.
The
Z
Class
is
also
subject
to
a
contractual
expense
limitation
agreement
whereby
Price
Associates
has
agreed
to
waive
and/or
bear
all
of
the
Z
Class’
expenses
(excluding
interest;
expenses
related
to
borrowings,
taxes,
and
brokerage;
non-recurring,
extraordinary
expenses;
and
acquired
fund
fees
and
expenses)
in
their
entirety.
This
fee
waiver
and/or
expense
reimbursement
arrangement
is
expected
to
remain
in
place
indefinitely,
and
the
agreement
may
T.
ROWE
PRICE
International
Bond
Fund
(USD
Hedged)
only
be
amended
or
terminated
with
approval
by
the
fund’s
Board.
Expenses
of
the
fund
waived/paid
by
the
manager
are
not
subject
to
later
repayment
by
the
fund.
Pursuant
to
these
agreements,
expenses
were waived/paid
by
and/or
repaid
to
Price
Associates
during
the year
ended December
31,
2024 as
indicated
in
the
table
below.
Including
these
amounts,
expenses
previously
waived/paid
by
Price
Associates
in
the
amount
of $76,000 remain
subject
to
repayment
by
the
fund
at
December
31,
2024. Any
repayment
of
expenses
previously
waived/paid
by
Price
Associates
during
the
period
would
be
included
in
the
net
investment
income
and
expense
ratios
presented
on
the
accompanying
Financial
Highlights.
In
addition,
the
fund
has
entered
into
service
agreements
with
Price
Associates
and
two
wholly
owned
subsidiaries
of
Price
Associates,
each
an
affiliate
of
the
fund
(collectively,
Price).
Price
Associates
provides
certain
accounting
and
administrative
services
to
the
fund.
T.
Rowe
Price
Services,
Inc.
provides
shareholder
and
administrative
services
in
its
capacity
as
the
fund’s
transfer
and
dividend-disbursing
agent.
T.
Rowe
Price
Retirement
Plan
Services,
Inc.
provides
subaccounting
and
recordkeeping
services
for
certain
retirement
accounts
invested
in
the
Investor
Class
and
Advisor
Class.
For
the
year
ended
December
31,
2024,
expenses
incurred
pursuant
to
these
service
agreements
were
$123,000
for
Price
Associates;
$192,000
for
T.
Rowe
Price
Services,
Inc.;
and
less
than
$1,000
for
T.
Rowe
Price
Retirement
Plan
Services,
Inc.
All
amounts
due
to
and
due
from
Price,
exclusive
of
investment
management
fees
payable,
are
presented
net
on
the
accompanying
Statement
of
Assets
and
Liabilities.
T.
Rowe
Price
Investment
Services,
Inc.
(Investment
Services)
serves
as
distributor
to
the
fund.
Pursuant
to
an
underwriting
agreement,
no
compensation
for
any
distribution
services
provided
is
paid
to
Investment
Services
by
the
fund
(except
for
12b-1
fees
under
a
Board-approved
Rule
12b-1
plan).
Investor
Class
Advisor
Class
I
Class
Z
Class
Expense
limitation/I
Class
Limit
0.84%
0.99%
0.05%
0.00%
Expense
limitation
date
04/30/26
04/30/26
04/30/26
N/A
(Waived)/repaid
during
the
period
($000s)
$—
$(1)
$(47)
$(24,166)
T.
ROWE
PRICE
International
Bond
Fund
(USD
Hedged)
Mutual
funds,
trusts,
and
other
accounts
managed
by
Price
Associates
or
its
affiliates
(collectively,
Price
Funds
and
accounts)
may
invest
in
the
fund.
No
Price
fund
or
account
may
invest
for
the
purpose
of
exercising
management
or
control
over
the
fund.
At
December
31,
2024, approximately
15%
of
the
I
Class's
and
100%
of
the
Z
Class's
outstanding
shares
were
held
by
Price
Funds
and
accounts.
The fund
may
invest
its
cash
reserves
in
certain
open-end
management
investment
companies
managed
by
Price
Associates
and
considered
affiliates
of
the
fund:
the
T.
Rowe
Price
Government
Reserve
Fund
or
the
T.
Rowe
Price
Treasury
Reserve
Fund,
organized
as
money
market
funds
(together,
the
Price
Reserve
Funds).
The
Price
Reserve
Funds
are
offered
as
short-term
investment
options
to
mutual
funds,
trusts,
and
other
accounts
managed
by
Price
Associates
or
its
affiliates
and
are
not
available
for
direct
purchase
by
members
of
the
public.
Cash
collateral
from
securities
lending,
if
any,
is
invested
in
the
T.
Rowe
Price
Government
Reserve Fund. The
Price
Reserve
Funds
pay
no
investment
management
fees.
As
of
December
31,
2024,
T.
Rowe
Price
Group,
Inc.,
or
its
wholly
owned
subsidiaries,
owned
128
shares
of
the
Advisor
Class,
representing
1%
of
the
Advisor
Class's
net
assets.
The fund may
participate
in
securities
purchase
and
sale
transactions
with
other
funds
or
accounts
advised
by
Price
Associates
(cross
trades),
in
accordance
with
procedures
adopted
by the
fund’s
Board
and
Securities
and
Exchange
Commission
rules,
which
require,
among
other
things,
that
such
purchase
and
sale
cross
trades
be
effected
at
the
independent
current
market
price
of
the
security.
During
the
year
ended
December
31,
2024,
the
fund
had
no
purchases
or
sales
cross
trades
with
other
funds
or
accounts
advised
by
Price
Associates.
NOTE
8
-
SEGMENT
REPORTING
Operating
segments
are
defined
as
components
of
a
company
that
engage
in
business
activities
and
for
which
discrete
financial
information
is
available
and
regularly
reviewed
by
the
chief
operating
decision
maker
(CODM)
in
deciding
how
to
allocate
resources
and
assess
performance.
The
Management
Committee
of
Price
Associates
acts
as
the
fund’s
CODM.
The
fund
makes
investments
in
accordance
with
its
investment
objective
as
outlined
in
the
Prospectus
and
is
considered
one
reportable
segment
because
the
CODM
allocates
resources
and
assesses
the
operating
results
of
the
fund
on
the
whole.
T.
ROWE
PRICE
International
Bond
Fund
(USD
Hedged)
The
fund’s
revenue
is
derived
from
investments
in
portfolio
of
securities.
The
CODM
allocates
resources
and
assesses
performance
based
on
the
operating
results
of
the
fund,
which
is
consistent
with
the
results
presented
in
the
statement
of
operations,
statement
of
changes
in
net
assets
and
financial
highlights.
The
CODM
compares
the
fund’s
performance
to
its
benchmark
index
and
evaluates
the
positioning
of
the
fund
in
relation
to
its
investment
objective.
The
measure
of
segment
assets
is
net
assets
of
the
fund
which
is
disclosed
in
the
statement
of
assets
and
liabilities.
The
accounting
policies
of
the
segment
are
the
same
as
those
described
in
the
summary
of
significant
accounting
policies.
The
financial
statements
include
all
details
of
the
segment
assets,
segment
revenue
and
expenses;
and
reflect
the
financial
results
of
the
segment.
NOTE
9
-
OTHER
MATTERS
Unpredictable environmental,
political,
social
and
economic
events,
including
but
not
limited
to,
environmental
or
natural
disasters,
war
and
conflict
(including
Russia’s
military
invasion
of
Ukraine
and
the
conflict
in
Israel,
Gaza
and
surrounding
areas),
terrorism,
geopolitical
developments
(including
trading
and
tariff
arrangements,
sanctions
and
cybersecurity
attacks),
and
public
health
epidemics
(including
the
global
outbreak
of
COVID-19)
and
similar
public
health
threats,
may
significantly
affect
the
economy
and
the
markets
and
issuers
in
which
a
fund
invests.
The
extent
and
duration
of
such
events
and
resulting
market
disruptions
cannot
be
predicted.
These
and
other
similar
events
may
cause
instability
across
global
markets,
including
reduced
liquidity
and
disruptions
in
trading
markets,
while
some
events
may
affect
certain
geographic
regions,
countries,
sectors,
and
industries
more
significantly
than
others,
and
exacerbate
other
pre-existing
political,
social,
and
economic
risks.
The
fund’s
performance
could
be
negatively
impacted
if
the
value
of
a
portfolio
holding
were
harmed
by
these
or
such
events.
Management
actively
monitors
the
risks
and
financial
impacts
arising
from
such
events.
T.
ROWE
PRICE
International
Bond
Fund
(USD
Hedged)
REPORT
OF
INDEPENDENT
REGISTERED
PUBLIC
ACCOUNTING
FIRM
To
the
Board
of
Directors
of
T.
Rowe
Price
International
Funds,
Inc.
and
Shareholders
of
T.
Rowe
Price
International
Bond
Fund
(USD
Hedged)
Opinion
on
the
Financial
Statements
We
have
audited
the
accompanying
statement
of
assets
and
liabilities,
including
the
portfolio
of
investments,
of
T.
Rowe
Price
International
Bond
Fund
(USD
Hedged)
(one
of
the
funds
constituting
T.
Rowe
Price
International
Funds,
Inc.,
referred
to
hereafter
as
the
"Fund")
as
of
December
31,
2024,
the
related
statement
of
operations
for
the
year
ended
December
31,
2024,
the
statement
of
changes
in
net
assets
for
each
of
the
two
years
in
the
period
ended
December
31,
2024,
including
the
related
notes,
and
the
financial
highlights
for
each
of
the
periods
indicated
therein
(collectively
referred
to
as
the
“financial
statements”).
In
our
opinion,
the
financial
statements
present
fairly,
in
all
material
respects,
the
financial
position
of
the
Fund
as
of
December
31,
2024,
the
results
of
its
operations
for
the
year
then
ended,
the
changes
in
its
net
assets
for
each
of
the
two
years
in
the
period
ended
December
31,
2024
and
the
financial
highlights
for
each
of
the
periods
indicated
therein,
in
conformity
with
accounting
principles
generally
accepted
in
the
United
States
of
America.
Basis
for
Opinion
These
financial
statements
are
the
responsibility
of
the
Fund’s
management.
Our
responsibility
is
to
express
an
opinion
on
the
Fund’s
financial
statements
based
on
our
audits.
We
are
a
public
accounting
firm
registered
with
the
Public
Company
Accounting
Oversight
Board
(United
States)
(PCAOB)
and
are
required
to
be
independent
with
respect
to
the
Fund
in
accordance
with
the
U.S.
federal
securities
laws
and
the
applicable
rules
and
regulations
of
the
Securities
and
Exchange
Commission
and
the
PCAOB.
We
conducted
our
audits
of
these
financial
statements
in
accordance
with
the
standards
of
the
PCAOB.
Those
standards
require
that
we
plan
and
perform
the
audit
to
obtain
reasonable
assurance
about
whether
the
financial
statements
are
free
of
material
misstatement,
whether
due
to
error
or
fraud.
T.
ROWE
PRICE
International
Bond
Fund
(USD
Hedged)
Our
audits
included
performing
procedures
to
assess
the
risks
of
material
misstatement
of
the
financial
statements,
whether
due
to
error
or
fraud,
and
performing
procedures
that
respond
to
those
risks.
Such
procedures
included
examining,
on
a
test
basis,
evidence
regarding
the
amounts
and
disclosures
in
the
financial
statements.
Our
audits
also
included
evaluating
the
accounting
principles
used
and
significant
estimates
made
by
management,
as
well
as
evaluating
the
overall
presentation
of
the
financial
statements.
Our
procedures
included
confirmation
of
securities
owned
as
of
December
31,
2024
by
correspondence
with
the
custodians,
transfer
agent
and
brokers;
when
replies
were
not
received
from
brokers,
we
performed
other
auditing
procedures.
We
believe
that
our
audits
provide
a
reasonable
basis
for
our
opinion.
/s/
PricewaterhouseCoopers
LLP
Baltimore,
Maryland
February
18,
2025
We
have
served
as
the
auditor
of
one
or
more
investment
companies
in
the
T.
Rowe
Price
group
of
investment
companies
since
1973.
REPORT
OF
INDEPENDENT
REGISTERED
PUBLIC
ACCOUNTING
FIRM
(continued)
T.
ROWE
PRICE
International
Bond
Fund
(USD
Hedged)
TAX
INFORMATION
(UNAUDITED)
FOR
THE
TAX
YEAR
ENDED 12/31/24
We
are
providing
this
information
as
required
by
the
Internal
Revenue
Code.
The
amounts
shown
may
differ
from
those
elsewhere
in
this
report
because
of
differences
between
tax
and
financial
reporting
requirements.
For
shareholders
subject
to
interest
expense
deduction
limitation
under
Section
163(j),
$217,729,000
of
the
fund’s
income
qualifies
as
a
Section
163(j)
interest
dividend
and
can
be
treated
as
interest
income
for
purposes
of
Section
163(j),
subject
to
holding
period
requirements
and
other
limitations.
100
East
Pratt
Street
Baltimore,
MD
21202
T.
Rowe
Price
Investment
Services,
Inc.
Call
1-800-225-5132
to
request
a
prospectus
or
summary
prospectus;
each
includes
investment
objectives,
risks,
fees,
expenses,
and
other
information
that
you
should
read
and
consider
carefully
before
investing.
F1114-050
2/25
Item 8. Changes in and Disagreements with Accountants for Open-End Management Investment Companies.
Not applicable.
Item 9. Proxy Disclosures for Open-End Management Investment Companies.
Not applicable.
Item 10. Remuneration Paid to Directors, Officers, and Others of Open-End Management Investment Companies.
Remuneration paid to Directors is included in Item 7 of this Form N-CSR.
Item 11. Statement Regarding Basis for Approval of Investment Advisory Contract.
If applicable, see Item 7.
Item 12. Disclosure of Proxy Voting Policies and Procedures for Closed-End Management Investment Companies.
Not applicable.
Item 13. Portfolio Managers of Closed-End Management Investment Companies.
Not applicable.
Item 14. Purchases of Equity Securities by Closed-End Management Investment Company and Affiliated Purchasers.
Not applicable.
Item 15. Submission of Matters to a Vote of Security Holders.
There has been no change to the procedures by which shareholders may recommend nominees to the registrant’s board of directors.
Item 16. Controls and Procedures.
(a) The registrant’s principal executive officer and principal financial officer have evaluated the registrant’s disclosure controls and procedures within 90 days of this filing and have concluded that the registrant’s disclosure controls and procedures were effective, as of that date, in ensuring that information required to be disclosed by the registrant in this Form N-CSR was recorded, processed, summarized, and reported timely.
(b) The registrant’s principal executive officer and principal financial officer are aware of no change in the registrant’s internal control over financial reporting that occurred during the period covered by this report that has materially affected, or is reasonably likely to materially affect, the registrant’s internal control over financial reporting.
Item 17. Disclosure of Securities Lending Activities for Closed-End Management Investment Companies.
Not applicable.
Item 18. Recovery of Erroneously Awarded Compensation.
Not applicable.
Item 19. Exhibits.
(a)(1) The registrant’s code of ethics pursuant to Item 2 of Form N-CSR is attached.
(2) Listing standards relating to recovery of erroneously awarded compensation: not applicable.
(3) Separate certifications by the registrant’s principal executive officer and principal financial officer, pursuant to Section 302 of the Sarbanes-Oxley Act of 2002 and required by Rule 30a-2(a) under the Investment Company Act of 1940, are attached.
(b) A certification by the registrant’s principal executive officer and principal financial officer, pursuant to Section 906 of the Sarbanes-Oxley Act of 2002 and required by Rule 30a-2(b) under the Investment Company Act of 1940, is attached.
SIGNATURES
Pursuant to the requirements of the Securities Exchange Act of 1934 and the Investment Company Act of 1940, the registrant has duly caused this report to be signed on its behalf by the undersigned, thereunto duly authorized.
| | | | |
| T. Rowe Price International Funds, Inc. |
| By | | /s/ David Oestreicher | | |
| | David Oestreicher | | |
| | Principal Executive Officer | | |
| | |
| Date | | February 18, 2025 | | |
Pursuant to the requirements of the Securities Exchange Act of 1934 and the Investment Company Act of 1940, this report has been signed below by the following persons on behalf of the registrant and in the capacities and on the dates indicated.
| | | | |
| By | | /s/ David Oestreicher | | |
| | David Oestreicher | | |
| | Principal Executive Officer | | |
| | |
| Date | | February 18, 2025 | | |
| | | | |
| By | | /s/ Alan S. Dupski | | |
| | Alan S. Dupski | | |
| | Principal Financial Officer | | |
| | |
| Date | | February 18, 2025 | | |