UNITED STATES
SECURITIES AND EXCHANGE COMMISSION
Washington, D.C. 20549
FORM N-CSR
CERTIFIED SHAREHOLDER REPORT OF REGISTERED
MANAGEMENT INVESTMENT COMPANIES
Investment Company Act File Number: 811-02958
T. Rowe Price International Funds, Inc.
(Exact name of registrant as specified in charter)
100 East Pratt Street, Baltimore, MD 21202
(Address of principal executive offices)
David Oestreicher
100 East Pratt Street, Baltimore, MD 21202
(Name and address of agent for service)
Registrant’s telephone number, including area code: (410) 345-2000
Date of fiscal year end: December 31
Date of reporting period: December 31, 2024
Item 1. Reports to Shareholders
(a) Report pursuant to Rule 30e-1
Annual Shareholder Report
December 31, 2024
This annual shareholder report contains important information about Dynamic Credit Fund (the "fund") for the period of January 1, 2024 to December 31, 2024. You can find the fund’s prospectus, financial information on Form N‑CSR (which includes required tax information for dividends), holdings, proxy voting information, and other information atwww.troweprice.com/prospectus. You can also request this information without charge by contacting T. Rowe Price at 1‑800‑638‑5660 or info@troweprice.com or contacting your intermediary.
What were the fund costs for the last year? (based on a hypothetical $10,000 investment)
| | Costs of a $10,000 investment | Costs paid as a percentage of a $10,000 investment |
|---|
| Dynamic Credit Fund - Investor Class | $65 | 0.63% |
|---|
What drove fund performance during the past 12 months?
The global investment-grade fixed income market declined over the trailing 12-month period amid rising bond yields, despite many central banks easing monetary policies, and weakening global currencies relative to the U.S. dollar.
Despite sovereign yield volatility, the fund’s credit holdings, especially among high yield, emerging markets, securitized, and bank loans, helped drive positive performance. With central banks looking to unwind restrictive monetary policy, credit sectors largely benefited from increased risk appetite and demand for attractive yields.
The fund utilizes short credit positions to reflect an investment view where our global research team has low conviction, and this sleeve of the fund weighed on performance amid a generally healthy environment for credit assets.
The fund employs a flexible, cross-sector approach to source high-conviction security selection from our global multi-sector research platform while aiming to deliver attractive returns and targeting lower beta to high yield and equities. Over the period, the fund took a mostly defensive stance in terms of credit risk and duration, but we moderated that position somewhat after the uncertainty surrounding the U.S. presidential election cleared.
The fund held material exposure to derivatives, including currency, interest rate, and credit derivatives, which we use to manage positioning more nimbly across the fund’s wide investment universe. Credit derivatives had a negative impact on performance, but other derivative exposure modestly aided returns for the period.
How has the fund performed?
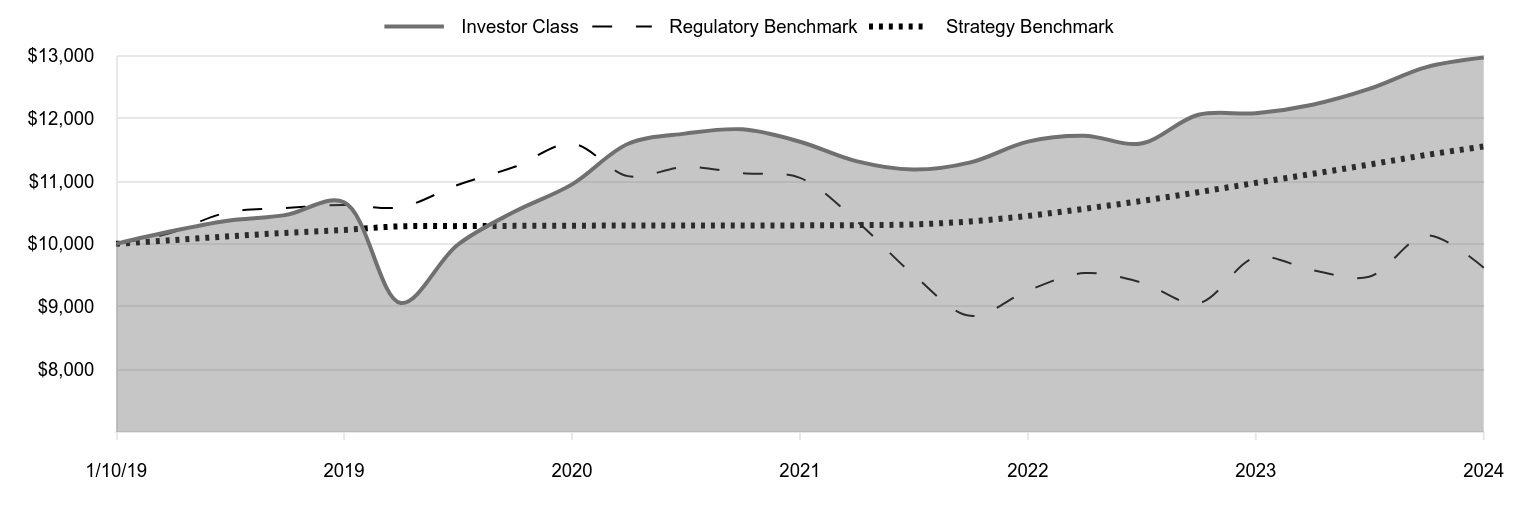
Cumulative Returns of a Hypothetical $10,000 Investment as of December 31, 2024
| Investor Class | Regulatory Benchmark | Strategy Benchmark |
|---|
| 1/10/19 | 10,000 | 10,000 | 10,000 |
|---|
| 3/31/19 | 10,188 | 10,160 | 10,054 |
|---|
| 6/30/19 | 10,365 | 10,495 | 10,118 |
|---|
| 9/30/19 | 10,458 | 10,570 | 10,175 |
|---|
| 12/31/19 | 10,664 | 10,621 | 10,222 |
|---|
| 3/31/20 | 9,057 | 10,586 | 10,280 |
|---|
| 6/30/20 | 9,982 | 10,938 | 10,283 |
|---|
| 9/30/20 | 10,516 | 11,229 | 10,287 |
|---|
| 12/31/20 | 10,949 | 11,598 | 10,290 |
|---|
| 3/31/21 | 11,596 | 11,080 | 10,292 |
|---|
| 6/30/21 | 11,758 | 11,226 | 10,292 |
|---|
| 9/30/21 | 11,826 | 11,127 | 10,294 |
|---|
| 12/31/21 | 11,629 | 11,052 | 10,295 |
|---|
| 3/31/22 | 11,320 | 10,371 | 10,299 |
|---|
| 6/30/22 | 11,186 | 9,514 | 10,310 |
|---|
| 9/30/22 | 11,300 | 8,853 | 10,358 |
|---|
| 12/31/22 | 11,631 | 9,256 | 10,446 |
|---|
| 3/31/23 | 11,724 | 9,534 | 10,559 |
|---|
| 6/30/23 | 11,600 | 9,388 | 10,683 |
|---|
| 9/30/23 | 12,058 | 9,052 | 10,824 |
|---|
| 12/31/23 | 12,083 | 9,785 | 10,973 |
|---|
| 3/31/24 | 12,219 | 9,581 | 11,116 |
|---|
| 6/30/24 | 12,470 | 9,475 | 11,264 |
|---|
| 9/30/24 | 12,818 | 10,137 | 11,418 |
|---|
| 12/31/24 | 12,971 | 9,620 | 11,553 |
|---|
202501-4140694, 202502-4108400
Average Annual Total Returns
| | 1 Year | 5 Years | Since Inception 1/10/19 |
|---|
| Dynamic Credit Fund (Investor Class) | 7.34% | 3.99% | 4.45% |
|---|
| Bloomberg Global Aggregate Bond Index (Regulatory Benchmark) | -1.69 | -1.96 | -0.65 |
|---|
| ICE BofA US 3-Month Treasury Bill Index (Strategy Benchmark) | 5.28 | 2.48 | 2.45 |
|---|
The preceding line graph shows the value of a hypothetical $10,000 investment in the fund over the past 10 fiscal year periods or since inception (for funds lacking 10-year records). The fund’s performance information included in the line graph and table above is compared with a regulatory required index that represents an overall securities market (Regulatory Benchmark). In addition, the line graph and table may also include one or more indexes that more closely aligns to the fund's investment strategy (Strategy Benchmark(s)). Due to new SEC Rules on shareholder reporting the fund adopted a new broad-based securities market index, referred to as the Regulatory Benchmark. Market index returns do not include expenses, which are deducted from fund returns. The fund's total return figures reflect the reinvestment of dividends and capital gains, if any.Neither the fund’s returns nor the index returns reflect the deduction of taxes that a shareholder would pay on fund distributions or redemptions of fund shares.The fund’s past performance is not a good predictor of the fund’s future performance.Updated performance information can be found at www.troweprice.com.
What are some fund statistics?
- Total Net Assets (000s)$1,015,889
- Number of Portfolio Holdings272
- Investment Advisory Fees Paid (000s)$(160)
- Portfolio Turnover Rate178.6%
What did the fund invest in?
Security Allocation (as a % of Net Assets)
| Corporate Bonds | 39.2% |
| Bank Loans | 14.2 |
| Government Bonds | 13.0 |
| Asset-Backed Securities | 11.6 |
| U.S. Treasury Obligations | 7.6 |
| Municipal Securities | 2.9 |
| Non-U.S. Government Mortgage-Backed Securities | 2.5 |
| Securities Lending Collateral | 2.1 |
| Short-Term and Other | 6.9 |
Top Ten Holdings (as a % of Net Assets)
| U.S. Treasury Bills | 7.5% |
| Brazil Notas do Tesouro Nacional | 4.4 |
| Republic of Colombia | 2.9 |
| Republic of Sri Lanka | 2.2 |
| Cloud Software Group | 2.2 |
| Transocean | 2.0 |
| Asurion | 2.0 |
| DISH DBS | 1.9 |
| Puerto Rico Commonwealth | 1.8 |
| DISH Network | 1.7 |
If you invest directly with T. Rowe Price, you can elect to receive future shareholder reports or other important documents through electronic delivery by enrolling at www.troweprice.com/paperless. If you invest through a financial intermediary such as an investment advisor, a bank, retirement plan sponsor or a brokerage firm, please contact that organization and ask if it can provide electronic delivery.
Bloomberg and ICE do not accept any liability for any errors or omissions in the indexes or data, and hereby expressly disclaim all warranties of originality, accuracy, completeness, timeliness, merchantability and fitness for a particular purpose. No party may rely on any indexes or data contained in this communication. Visit www.troweprice.com/en/us/market-data-disclosures for additional legal notices & disclaimers.
Dynamic Credit Fund
Investor Class (RPIDX)
T. Rowe Price Investment Services, Inc.
100 East Pratt Street
Baltimore, MD 21202
Annual Shareholder Report
December 31, 2024
This annual shareholder report contains important information about Dynamic Credit Fund (the "fund") for the period of January 1, 2024 to December 31, 2024. You can find the fund’s prospectus, financial information on Form N‑CSR (which includes required tax information for dividends), holdings, proxy voting information, and other information atwww.troweprice.com/prospectus. You can also request this information without charge by contacting T. Rowe Price at 1‑800‑638‑5660 or info@troweprice.com or contacting your intermediary.
What were the fund costs for the last year? (based on a hypothetical $10,000 investment)
| | Costs of a $10,000 investment | Costs paid as a percentage of a $10,000 investment |
|---|
| Dynamic Credit Fund - I Class | $58 | 0.56% |
|---|
What drove fund performance during the past 12 months?
The global investment-grade fixed income market declined over the trailing 12-month period amid rising bond yields, despite many central banks easing monetary policies, and weakening global currencies relative to the U.S. dollar.
Despite sovereign yield volatility, the fund’s credit holdings, especially among high yield, emerging markets, securitized, and bank loans, helped drive positive performance. With central banks looking to unwind restrictive monetary policy, credit sectors largely benefited from increased risk appetite and demand for attractive yields.
The fund utilizes short credit positions to reflect an investment view where our global research team has low conviction, and this sleeve of the fund weighed on performance amid a generally healthy environment for credit assets.
The fund employs a flexible, cross-sector approach to source high-conviction security selection from our global multi-sector research platform while aiming to deliver attractive returns and targeting lower beta to high yield and equities. Over the period, the fund took a mostly defensive stance in terms of credit risk and duration, but we moderated that position somewhat after the uncertainty surrounding the U.S. presidential election cleared.
The fund held material exposure to derivatives, including currency, interest rate, and credit derivatives, which we use to manage positioning more nimbly across the fund’s wide investment universe. Credit derivatives had a negative impact on performance, but other derivative exposure modestly aided returns for the period.
How has the fund performed?
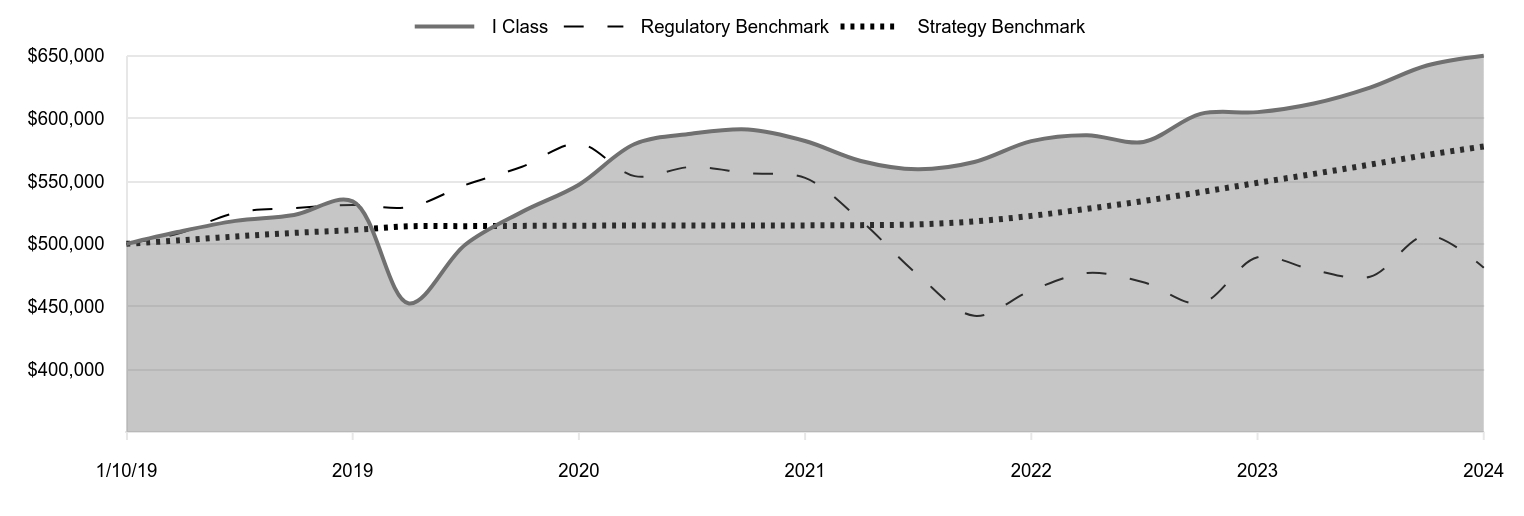
Cumulative Returns of a Hypothetical $500,000 Investment as of December 31, 2024
| I Class | Regulatory Benchmark | Strategy Benchmark |
|---|
| 1/10/19 | 500,000 | 500,000 | 500,000 |
|---|
| 3/31/19 | 509,449 | 507,997 | 502,680 |
|---|
| 6/30/19 | 518,344 | 524,733 | 505,892 |
|---|
| 9/30/19 | 522,972 | 528,485 | 508,736 |
|---|
| 12/31/19 | 533,855 | 531,049 | 511,079 |
|---|
| 3/31/20 | 452,496 | 529,313 | 514,015 |
|---|
| 6/30/20 | 499,329 | 546,889 | 514,130 |
|---|
| 9/30/20 | 525,508 | 561,444 | 514,332 |
|---|
| 12/31/20 | 547,206 | 579,885 | 514,488 |
|---|
| 3/31/21 | 579,608 | 554,018 | 514,617 |
|---|
| 6/30/21 | 587,758 | 561,290 | 514,617 |
|---|
| 9/30/21 | 591,217 | 556,331 | 514,691 |
|---|
| 12/31/21 | 582,026 | 552,590 | 514,741 |
|---|
| 3/31/22 | 566,113 | 518,545 | 514,943 |
|---|
| 6/30/22 | 559,508 | 475,703 | 515,482 |
|---|
| 9/30/22 | 565,302 | 442,669 | 517,902 |
|---|
| 12/31/22 | 581,953 | 462,803 | 522,309 |
|---|
| 3/31/23 | 586,691 | 476,718 | 527,954 |
|---|
| 6/30/23 | 581,275 | 469,425 | 534,161 |
|---|
| 9/30/23 | 603,655 | 452,590 | 541,218 |
|---|
| 12/31/23 | 605,039 | 489,252 | 548,662 |
|---|
| 3/31/24 | 611,923 | 479,061 | 555,788 |
|---|
| 6/30/24 | 624,597 | 473,770 | 563,180 |
|---|
| 9/30/24 | 642,177 | 506,853 | 570,916 |
|---|
| 12/31/24 | 649,954 | 480,988 | 577,642 |
|---|
202501-4140694, 202502-4108400
Average Annual Total Returns
| | 1 Year | 5 Years | Since Inception 1/10/19 |
|---|
| Dynamic Credit Fund (I Class) | 7.42% | 4.01% | 4.49% |
|---|
| Bloomberg Global Aggregate Bond Index (Regulatory Benchmark) | -1.69 | -1.96 | -0.65 |
|---|
| ICE BofA US 3-Month Treasury Bill Index (Strategy Benchmark) | 5.28 | 2.48 | 2.45 |
|---|
The preceding line graph shows the value of a hypothetical $500,000 investment in the fund over the past 10 fiscal year periods or since inception (for funds lacking 10-year records). The fund’s performance information included in the line graph and table above is compared with a regulatory required index that represents an overall securities market (Regulatory Benchmark). In addition, the line graph and table may also include one or more indexes that more closely aligns to the fund's investment strategy (Strategy Benchmark(s)). Due to new SEC Rules on shareholder reporting the fund adopted a new broad-based securities market index, referred to as the Regulatory Benchmark. Market index returns do not include expenses, which are deducted from fund returns. The fund's total return figures reflect the reinvestment of dividends and capital gains, if any.Neither the fund’s returns nor the index returns reflect the deduction of taxes that a shareholder would pay on fund distributions or redemptions of fund shares.The fund’s past performance is not a good predictor of the fund’s future performance.Updated performance information can be found at www.troweprice.com.
What are some fund statistics?
- Total Net Assets (000s)$1,015,889
- Number of Portfolio Holdings272
- Investment Advisory Fees Paid (000s)$(160)
- Portfolio Turnover Rate178.6%
What did the fund invest in?
Security Allocation (as a % of Net Assets)
| Corporate Bonds | 39.2% |
| Bank Loans | 14.2 |
| Government Bonds | 13.0 |
| Asset-Backed Securities | 11.6 |
| U.S. Treasury Obligations | 7.6 |
| Municipal Securities | 2.9 |
| Non-U.S. Government Mortgage-Backed Securities | 2.5 |
| Securities Lending Collateral | 2.1 |
| Short-Term and Other | 6.9 |
Top Ten Holdings (as a % of Net Assets)
| U.S. Treasury Bills | 7.5% |
| Brazil Notas do Tesouro Nacional | 4.4 |
| Republic of Colombia | 2.9 |
| Republic of Sri Lanka | 2.2 |
| Cloud Software Group | 2.2 |
| Transocean | 2.0 |
| Asurion | 2.0 |
| DISH DBS | 1.9 |
| Puerto Rico Commonwealth | 1.8 |
| DISH Network | 1.7 |
If you invest directly with T. Rowe Price, you can elect to receive future shareholder reports or other important documents through electronic delivery by enrolling at www.troweprice.com/paperless. If you invest through a financial intermediary such as an investment advisor, a bank, retirement plan sponsor or a brokerage firm, please contact that organization and ask if it can provide electronic delivery.
Bloomberg and ICE do not accept any liability for any errors or omissions in the indexes or data, and hereby expressly disclaim all warranties of originality, accuracy, completeness, timeliness, merchantability and fitness for a particular purpose. No party may rely on any indexes or data contained in this communication. Visit www.troweprice.com/en/us/market-data-disclosures for additional legal notices & disclaimers.
Dynamic Credit Fund
I Class (RPELX)
T. Rowe Price Investment Services, Inc.
100 East Pratt Street
Baltimore, MD 21202
Annual Shareholder Report
December 31, 2024
This annual shareholder report contains important information about Dynamic Credit Fund (the "fund") for the period of January 1, 2024 to December 31, 2024. You can find the fund’s prospectus, financial information on Form N‑CSR (which includes required tax information for dividends), holdings, proxy voting information, and other information atwww.troweprice.com/prospectus. You can also request this information without charge by contacting T. Rowe Price at 1‑800‑638‑5660 or info@troweprice.com or contacting your intermediary.
What were the fund costs for the last year? (based on a hypothetical $10,000 investment)
| | Costs of a $10,000 investment | Costs paid as a percentage of a $10,000 investment |
|---|
| Dynamic Credit Fund - Z Class | $0 | 0.00% |
|---|
What drove fund performance during the past 12 months?
The global investment-grade fixed income market declined over the trailing 12-month period amid rising bond yields, despite many central banks easing monetary policies, and weakening global currencies relative to the U.S. dollar.
Despite sovereign yield volatility, the fund’s credit holdings, especially among high yield, emerging markets, securitized, and bank loans, helped drive positive performance. With central banks looking to unwind restrictive monetary policy, credit sectors largely benefited from increased risk appetite and demand for attractive yields.
The fund utilizes short credit positions to reflect an investment view where our global research team has low conviction, and this sleeve of the fund weighed on performance amid a generally healthy environment for credit assets.
The fund employs a flexible, cross-sector approach to source high-conviction security selection from our global multi-sector research platform while aiming to deliver attractive returns and targeting lower beta to high yield and equities. Over the period, the fund took a mostly defensive stance in terms of credit risk and duration, but we moderated that position somewhat after the uncertainty surrounding the U.S. presidential election cleared.
The fund held material exposure to derivatives, including currency, interest rate, and credit derivatives, which we use to manage positioning more nimbly across the fund’s wide investment universe. Credit derivatives had a negative impact on performance, but other derivative exposure modestly aided returns for the period.
How has the fund performed?
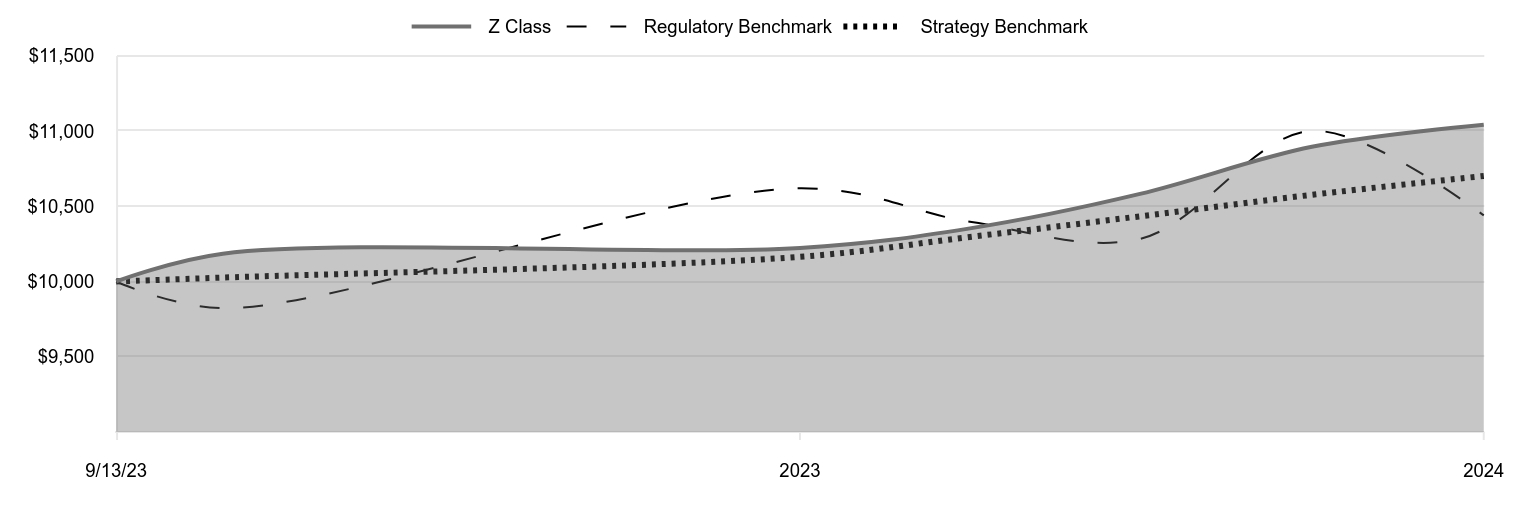
Cumulative Returns of a Hypothetical $10,000 Investment as of December 31, 2024
| Z Class | Regulatory Benchmark | Strategy Benchmark |
|---|
| 9/13/23 | 10,000 | 10,000 | 10,000 |
|---|
| 9/30/23 | 10,185 | 9,823 | 10,026 |
|---|
| 12/31/23 | 10,223 | 10,619 | 10,164 |
|---|
| 3/31/24 | 10,353 | 10,397 | 10,296 |
|---|
| 6/30/24 | 10,582 | 10,283 | 10,433 |
|---|
| 9/30/24 | 10,895 | 11,001 | 10,576 |
|---|
| 12/31/24 | 11,042 | 10,439 | 10,701 |
|---|
202501-4140694, 202502-4108400
Average Annual Total Returns
| | 1 Year | Since Inception 9/13/23 |
|---|
| Dynamic Credit Fund (Z Class) | 8.02% | 7.94% |
|---|
| Bloomberg Global Aggregate Bond Index (Regulatory Benchmark) | -1.69 | 3.37 |
|---|
| ICE BofA US 3-Month Treasury Bill Index (Strategy Benchmark) | 5.28 | 5.36 |
|---|
The preceding line graph shows the value of a hypothetical $10,000 investment in the fund over the past 10 fiscal year periods or since inception (for funds lacking 10-year records). The fund’s performance information included in the line graph and table above is compared with a regulatory required index that represents an overall securities market (Regulatory Benchmark). In addition, the line graph and table may also include one or more indexes that more closely aligns to the fund's investment strategy (Strategy Benchmark(s)). Due to new SEC Rules on shareholder reporting the fund adopted a new broad-based securities market index, referred to as the Regulatory Benchmark. Market index returns do not include expenses, which are deducted from fund returns. The fund's total return figures reflect the reinvestment of dividends and capital gains, if any.Neither the fund’s returns nor the index returns reflect the deduction of taxes that a shareholder would pay on fund distributions or redemptions of fund shares.The fund’s past performance is not a good predictor of the fund’s future performance.Updated performance information can be found at www.troweprice.com.
What are some fund statistics?
- Total Net Assets (000s)$1,015,889
- Number of Portfolio Holdings272
- Investment Advisory Fees Paid (000s)$(160)
- Portfolio Turnover Rate178.6%
What did the fund invest in?
Security Allocation (as a % of Net Assets)
| Corporate Bonds | 39.2% |
| Bank Loans | 14.2 |
| Government Bonds | 13.0 |
| Asset-Backed Securities | 11.6 |
| U.S. Treasury Obligations | 7.6 |
| Municipal Securities | 2.9 |
| Non-U.S. Government Mortgage-Backed Securities | 2.5 |
| Securities Lending Collateral | 2.1 |
| Short-Term and Other | 6.9 |
Top Ten Holdings (as a % of Net Assets)
| U.S. Treasury Bills | 7.5% |
| Brazil Notas do Tesouro Nacional | 4.4 |
| Republic of Colombia | 2.9 |
| Republic of Sri Lanka | 2.2 |
| Cloud Software Group | 2.2 |
| Transocean | 2.0 |
| Asurion | 2.0 |
| DISH DBS | 1.9 |
| Puerto Rico Commonwealth | 1.8 |
| DISH Network | 1.7 |
If you invest directly with T. Rowe Price, you can elect to receive future shareholder reports or other important documents through electronic delivery by enrolling at www.troweprice.com/paperless. If you invest through a financial intermediary such as an investment advisor, a bank, retirement plan sponsor or a brokerage firm, please contact that organization and ask if it can provide electronic delivery.
Bloomberg and ICE do not accept any liability for any errors or omissions in the indexes or data, and hereby expressly disclaim all warranties of originality, accuracy, completeness, timeliness, merchantability and fitness for a particular purpose. No party may rely on any indexes or data contained in this communication. Visit www.troweprice.com/en/us/market-data-disclosures for additional legal notices & disclaimers.
Dynamic Credit Fund
Z Class (TRCDX)
T. Rowe Price Investment Services, Inc.
100 East Pratt Street
Baltimore, MD 21202
Item 1. (b) Notice pursuant to Rule 30e-3.
Not applicable.
Item 2. Code of Ethics.
The registrant has adopted a code of ethics, as defined in Item 2 of Form N-CSR, applicable to its principal executive officer, principal financial officer, principal accounting officer or controller, or persons performing similar functions. A copy of this code of ethics is filed as an exhibit to this Form N-CSR. No substantive amendments were approved or waivers were granted to this code of ethics during the period covered by this report.
Item 3. Audit Committee Financial Expert.
The registrant’s Board of Directors has determined that Mr. Paul F. McBride qualifies as an audit committee financial expert, as defined in Item 3 of Form N-CSR. Mr. McBride is considered independent for purposes of Item 3 of Form N-CSR.
Item 4. Principal Accountant Fees and Services.
(a) – (d) Aggregate fees billed for the last two fiscal years for professional services rendered to, or on behalf of, the registrant by the registrant’s principal accountant were as follows:
| | | | | | | | | | |
| | | 2024 | | | 2023 | | | |
| | | | | | | |
Audit Fees | | | $46,029 | | | | $46,733 | |
Audit-Related Fees | | | - | | | | - | |
Tax Fees | | | - | | | | - | |
All Other Fees | | | - | | | | - | | | |
Audit fees include amounts related to the audit of the registrant’s annual financial statements and services normally provided by the accountant in connection with statutory and regulatory filings. Audit-related fees include amounts reasonably related to the performance of the audit of the registrant’s financial statements and specifically include the issuance of a report on internal controls and, if applicable, agreed-upon procedures related to fund acquisitions. Tax fees include amounts related to services for tax compliance, tax planning, and tax advice. The nature of these services specifically includes the review of distribution calculations and the preparation of Federal, state, and excise tax returns. All other fees include the registrant’s pro-rata share of amounts for agreed-upon procedures in conjunction with service contract approvals by the registrant’s Board of Directors/Trustees.
(e)(1) The registrant’s audit committee has adopted a policy whereby audit and non-audit services performed by the registrant’s principal accountant for the registrant, its investment adviser, and any entity controlling, controlled by, or under common control with the investment adviser that provides ongoing services to the registrant require pre-approval in advance at regularly scheduled audit committee meetings. If such a service is required between regularly scheduled audit committee meetings, pre-approval may be authorized by one audit committee member with ratification at the next scheduled audit committee meeting. Waiver of pre-approval for audit or non-audit services requiring fees of a de minimis amount is not permitted.
(2) No services included in (b) – (d) above were approved pursuant to paragraph (c)(7)(i)(C) of Rule 2-01 of Regulation S-X.
(f) Less than 50 percent of the hours expended on the principal accountant’s engagement to audit the registrant’s financial statements for the most recent fiscal year were attributed to work performed by persons other than the principal accountant’s full-time, permanent employees.
(g) The aggregate fees billed for the most recent fiscal year and the preceding fiscal year by the registrant’s principal accountant for non-audit services rendered to the registrant, its investment adviser, and any entity controlling, controlled by, or under common control with the investment adviser that provides ongoing services to the registrant were $1,262,000 and $1,524,000, respectively.
(h) All non-audit services rendered in (g) above were pre-approved by the registrant’s audit committee. Accordingly, these services were considered by the registrant’s audit committee in maintaining the principal accountant’s independence.
(i) Not applicable.
(j) Not applicable.
Item 5. Audit Committee of Listed Registrants.
Not applicable.
Item 6. Investments.
(a) Not applicable. The complete schedule of investments is included in Item 7 of this Form N-CSR.
(b) Not applicable.
Item 7. Financial Statements and Financial Highlights for Open-End Management Investment Companies.
(a – b) Report pursuant to Regulation S-X.
Financial
Highlights
Portfolio
of
Investments
Financial
Statements
and
Notes
Additional
Fund
Information
Financial
Statements
and
Other
Information
For
more
insights
from
T.
Rowe
Price
investment
professionals,
go
to
troweprice.com
.
T.
ROWE
PRICE
RPIDX
Dynamic
Credit
Fund
RPELX
Dynamic
Credit
Fund–
.
I Class
TRCDX
Dynamic
Credit
Fund–
.
Z Class
T.
ROWE
PRICE
Dynamic
Credit
Fund
For
a
share
outstanding
throughout
each
period
The
accompanying
notes
are
an
integral
part
of
these
financial
statements.
Investor
Class
..
Year
..
..
Ended
.
12/31/24
12/31/23
12/31/22
12/31/21
12/31/20
NET
ASSET
VALUE
Beginning
of
period
$
8.84
$
9.02
$
9.83
$
9.75
$
10.20
Investment
activities
Net
investment
income
(1)(2)
0.68
0.55
0.41
0.37
0.48
Net
realized
and
unrealized
gain/loss
(0.05)
(0.21)
(0.42)
0.24
(0.23)
Total
from
investment
activities
0.63
0.34
(0.01)
0.61
0.25
Distributions
Net
investment
income
(0.61)
(0.52)
(0.35)
(0.34)
(0.38)
Net
realized
gain
—
—
(0.45)
(0.19)
(0.32)
Total
distributions
(0.61)
(0.52)
(0.80)
(0.53)
(0.70)
NET
ASSET
VALUE
End
of
period
$
8.86
$
8.84
$
9.02
$
9.83
$
9.75
Ratios/Supplemental
Data
Total
return
(2)(3)
7.34%
3.89%
0.02%
6.21%
2.67%
Ratios
to
average
net
assets:
(2)
Gross
expenses
before
waivers/payments
by
Price
Associates
0.84%
1.31%
1.53%
1.30%
1.38%
Net
expenses
after
waivers/
payments
by
Price
Associates
0.63%
0.64%
0.63%
0.65%
0.64%
Net
investment
income
7.64%
6.14%
4.40%
3.61%
4.97%
Portfolio
turnover
rate
178.6%
146.5%
217.6%
252.1%
301.7%
Net
assets,
end
of
period
(in
thousands)
$24,593
$18,157
$29,716
$38,760
$26,423
0%
0%
0%
0%
0%
(1)
Per
share
amounts
calculated
using
average
shares
outstanding
method.
(2)
Includes
the
impact
of
expense-related
arrangements
with
Price
Associates.
(3)
Total
return
reflects
the
rate
that
an
investor
would
have
earned
on
an
investment
in
the
fund
during
each
period,
assuming
reinvestment
of
all
distributions,
and
payment
of
no
redemption
or
account
fees,
if
applicable.
T.
ROWE
PRICE
Dynamic
Credit
Fund
For
a
share
outstanding
throughout
each
period
The
accompanying
notes
are
an
integral
part
of
these
financial
statements.
I
Class
..
Year
..
..
Ended
.
12/31/24
12/31/23
12/31/22
12/31/21
12/31/20
NET
ASSET
VALUE
Beginning
of
period
$
8.83
$
9.01
$
9.83
$
9.74
$
10.21
Investment
activities
Net
investment
income
(1)(2)
0.68
0.57
0.42
0.36
0.48
Net
realized
and
unrealized
gain/loss
(0.05)
(0.22)
(0.43)
0.26
(0.25)
Total
from
investment
activities
0.63
0.35
(0.01)
0.62
0.23
Distributions
Net
investment
income
(0.61)
(0.53)
(0.36)
(0.34)
(0.38)
Net
realized
gain
—
—
(0.45)
(0.19)
(0.32)
Total
distributions
(0.61)
(0.53)
(0.81)
(0.53)
(0.70)
NET
ASSET
VALUE
End
of
period
$
8.85
$
8.83
$
9.01
$
9.83
$
9.74
Ratios/Supplemental
Data
Total
return
(2)(3)
7.42%
3.97%
(0.01)%
6.36%
2.50%
Ratios
to
average
net
assets:
(2)
Gross
expenses
before
waivers/payments
by
Price
Associates
0.58%
0.94%
1.48%
1.06%
1.30%
Net
expenses
after
waivers/payments
by
Price
Associates
0.56%
0.56%
0.56%
0.60%
0.61%
Net
investment
income
7.72%
6.43%
4.48%
3.51%
5.01%
Portfolio
turnover
rate
178.6%
146.5%
217.6%
252.1%
301.7%
Net
assets,
end
of
period
(in
thousands)
$32,409
$29,384
$5,646
$1,943
$24,169
0%
0%
0%
0%
0%
(1)
Per
share
amounts
calculated
using
average
shares
outstanding
method.
(2)
Includes
the
impact
of
expense-related
arrangements
with
Price
Associates.
(3)
Total
return
reflects
the
rate
that
an
investor
would
have
earned
on
an
investment
in
the
fund
during
each
period,
assuming
reinvestment
of
all
distributions,
and
payment
of
no
redemption
or
account
fees,
if
applicable.
T.
ROWE
PRICE
Dynamic
Credit
Fund
For
a
share
outstanding
throughout
each
period
The
accompanying
notes
are
an
integral
part
of
these
financial
statements.
Z
Class
(1)
.
.
Year
Ended
12/31/24
9/13/23
(1)
Through
12/31/23
NET
ASSET
VALUE
Beginning
of
period
$
8.83
$
8.82
Investment
activities
Net
investment
income
(2)(3)
0.73
0.19
Net
realized
and
unrealized
gain/loss
(0.05)
0.01
(4)
Total
from
investment
activities
0.68
0.20
Distributions
Net
investment
income
(0.66)
(0.19)
NET
ASSET
VALUE
End
of
period
$
8.85
$
8.83
Ratios/Supplemental
Data
Total
return
(3)(5)
8.02%
2.22%
Ratios
to
average
net
assets:
(3)
Gross
expenses
before
waivers/payments
by
Price
Associates
0.55%
0.55%
(6)
Net
expenses
after
waivers/payments
by
Price
Associates
0.00%
0.00%
(6)
Net
investment
income
8.27%
7.19%
(6)
Portfolio
turnover
rate
178.6%
146.5%
Net
assets,
end
of
period
(in
millions)
$959
$861
0%
0%
(1)
Inception
date
(2)
Per
share
amounts
calculated
using
average
shares
outstanding
method.
(3)
Includes
the
impact
of
expense-related
arrangements
with
Price
Associates.
(4)
The
amount
presented
is
inconsistent
with
the
fund's
aggregate
gains
and
losses
because
of
the
timing
of
sales
and
redemptions
of
fund
shares
in
relation
to
fluctuating
market
values
for
the
investment
portfolio.
(5)
Total
return
reflects
the
rate
that
an
investor
would
have
earned
on
an
investment
in
the
fund
during
each
period,
assuming
reinvestment
of
all
distributions,
and
payment
of
no
redemption
or
account
fees,
if
applicable.
Total
return
is
not
annualized
for
periods
less
than
one
year.
(6)
Annualized
T.
ROWE
PRICE
Dynamic
Credit
Fund
December
31,
2024
Par/Shares
$
Value
(
Cost
and
value
in
$000s)
‡
ANGOLA 1.3%
Government
Bonds 1.3%
Republic
of
Angola,
8.75%,
4/14/32
(USD)
14,725,000
13,041
Total
Angola
(Cost
$13,006)
13,041
AUSTRIA 0.9%
Corporate
Bonds 0.9%
Benteler
International,
10.50%,
5/15/28
(USD) (1)
9,075,000
9,524
Total
Austria
(Cost
$9,567)
9,524
BRAZIL 6.7%
Corporate
Bonds 2.4%
Banco
do
Estado
do
Rio
Grande
do
Sul,
VR,
5.375%,
1/28/31
(USD) (2)
665,000
656
CSN
Resources,
5.875%,
4/8/32
(USD)
12,050,000
9,736
Raizen
Fuels
Finance,
6.95%,
3/5/54
(USD) (1)(3)
5,490,000
5,419
Samarco
Mineracao,
9.00%,
6/30/31,
(9.00%
PIK)
(USD) (4)
8,296,092
8,119
23,930
Government
Bonds 4.3%
Brazil
Notas
do
Tesouro
Nacional,
Series
NTNF,
10.00%,
1/1/29
324,720,000
44,192
44,192
Total
Brazil
(Cost
$72,153)
68,122
CANADA 0.9%
Asset-Backed
Securities 0.4%
Cologix
Canadian
Issuer,
Series
2022-1CAN,
Class
A2,
4.94%,
1/25/52 (1)
6,000,000
4,045
4,045
Corporate
Bonds 0.5%
TER
Finance
Jersey,
Series
21,
Zero
Coupon,
1/2/25
(USD) (1)(5)
4,900,000
4,899
4,899
Total
Canada
(Cost
$9,205)
8,944
T.
ROWE
PRICE
Dynamic
Credit
Fund
Par/Shares
$
Value
(Cost
and
value
in
$000s)
CHILE 0.6%
Corporate
Bonds 0.6%
AES
Andes,
VR,
8.15%,
6/10/55
(USD) (1)(2)
6,040,000
6,121
Total
Chile
(Cost
$6,040)
6,121
CHINA 0.0%
Corporate
Bonds 0.0%
Kaisa
Group
Holdings,
11.95%,
10/22/22
(USD) (6)(7)
985,000
62
Total
China
(Cost
$275)
62
COLOMBIA 4.5%
Corporate
Bonds 1.6%
Bancolombia,
VR,
8.625%,
12/24/34
(USD) (2)(3)
7,410,000
7,765
Ecopetrol,
8.375%,
1/19/36
(USD)
8,370,000
8,079
15,844
Government
Bonds 2.9%
Republic
of
Colombia,
3.25%,
4/22/32
(USD)
26,490,000
20,364
Republic
of
Colombia,
4.125%,
5/15/51
(USD)
15,730,000
9,043
29,407
Private
Investment
Company 0.0%
Bona
Fide
Investments
Feeder
LLC,
Acquisition
Date:
6/7/23,
Cost $16
(USD) (6)(8)
†
21
Bona
Fide
Investments
Holdings
III,
Acquisition
Date:
6/14/24,
Cost $10
(USD) (6)(8)
†
10
31
Total
Colombia
(Cost
$46,290)
45,282
EL
SALVADOR 1.3%
Government
Bonds 1.3%
Republic
of
El
Salvador,
0.25%,
4/17/30
(USD) (1)
3,580,000
73
Republic
of
El
Salvador,
9.25%,
4/17/30
(USD) (1)
12,695,000
13,472
Total
El
Salvador
(Cost
$12,638)
13,545
T.
ROWE
PRICE
Dynamic
Credit
Fund
Par/Shares
$
Value
(Cost
and
value
in
$000s)
FRANCE 1.0%
Corporate
Bonds 1.0%
Altice
France
Holding,
10.50%,
5/15/27
(USD) (1)
14,003,000
3,956
Societe
Generale,
VR,
8.125%
(USD) (1)(2)(9)
6,030,000
5,909
Total
France
(Cost
$15,480)
9,865
GERMANY 1.4%
Corporate
Bonds 1.4%
Deutsche
Bank,
Series
2020,
VR,
6.00%
(USD) (2)(9)
14,800,000
14,504
Total
Germany
(Cost
$14,555)
14,504
GHANA 0.9%
Corporate
Bonds 0.9%
Kosmos
Energy,
8.75%,
10/1/31
(USD) (1)(3)
9,150,000
8,629
Total
Ghana
(Cost
$9,150)
8,629
ITALY 1.4%
Corporate
Bonds 1.4%
Golden
Goose,
FRN,
3M
EURIBOR
+
4.875%,
7.898%,
5/14/27
13,939,000
14,614
Total
Italy
(Cost
$14,786)
14,614
JERSEY 1.0%
Corporate
Bonds 1.0%
Africell
Holding,
10.50%,
10/23/29
(USD) (1)
10,065,000
9,889
Total
Jersey
(Cost
$10,065)
9,889
LUXEMBOURG 0.4%
Corporate
Bonds 0.4%
Altice
Financing,
9.625%,
7/15/27
(USD) (1)
3,916,000
3,603
Total
Luxembourg
(Cost
$3,885)
3,603
MAURITIUS 0.6%
Corporate
Bonds 0.6%
Axian
Telecom,
7.375%,
2/16/27
(USD) (1)
200,000
201
T.
ROWE
PRICE
Dynamic
Credit
Fund
Par/Shares
$
Value
(Cost
and
value
in
$000s)
Axian
Telecom,
7.375%,
2/16/27
(USD)
5,500,000
5,515
Total
Mauritius
(Cost
$5,307)
5,716
MEXICO 6.0%
Bank
Loans 1.4% (10)
Mercury
Data
Center
Bidco,
FRN,
3M
TSFR
+
4.75%,
9.222%,
9/5/29
(USD) (5)
15,000,000
14,925
14,925
Corporate
Bonds 4.6%
BBVA
Bancomer,
VR,
8.125%,
1/8/39
(USD) (1)(2)
13,695,000
13,981
Comision
Federal
de
Electricidad,
5.70%,
1/24/30
(USD) (1)
15,540,000
14,930
Metalsa,
3.75%,
5/4/31
(USD) (1)(3)
7,135,000
5,739
Petroleos
Mexicanos,
5.50%,
6/27/44
(USD)
5,805,000
3,616
Petroleos
Mexicanos,
6.70%,
2/16/32
(USD)
700,000
610
Petroleos
Mexicanos,
10.00%,
2/7/33
(USD) (3)
7,304,000
7,590
46,466
Total
Mexico
(Cost
$61,389)
61,391
MONTENEGRO 1.0%
Government
Bonds 1.0%
Republic
of
Montenegro,
7.25%,
3/12/31
(USD) (1)
9,640,000
9,905
Total
Montenegro
(Cost
$9,861)
9,905
SRI
LANKA 2.2%
Government
Bonds 2.2%
Republic
of
Sri
Lanka,
4.00%,
4/15/28
(USD) (1)
4,332,478
4,068
Republic
of
Sri
Lanka,
STEP,
3.10%,
1/15/30
(USD) (1)
3,457,316
2,869
Republic
of
Sri
Lanka,
STEP,
3.35%,
3/15/33
(USD) (1)
6,781,466
5,163
Republic
of
Sri
Lanka,
STEP,
3.60%,
6/15/35
(USD) (1)
4,579,050
3,320
Republic
of
Sri
Lanka,
STEP,
3.60%,
5/15/36
(USD) (1)
3,177,968
2,423
Republic
of
Sri
Lanka,
STEP,
3.60%,
2/15/38
(USD) (1)
6,358,605
4,873
Total
Sri
Lanka
(Cost
$21,794)
22,716
SURINAME 0.0%
Government
Bonds 0.0%
Republic
of
Suriname,
7.95%,
7/15/33,
(4.95%
Cash
and
3.00%
PIK)
(USD) (1)(4)
275,533
248
T.
ROWE
PRICE
Dynamic
Credit
Fund
Par/Shares
$
Value
(Cost
and
value
in
$000s)
Republic
of
Suriname,
VR,
9.00%,
12/31/50
(USD) (1)
130,000
130
Total
Suriname
(Cost
$273)
378
UNITED
KINGDOM 2.4%
Bank
Loans 1.4% (10)
CD&R
Firefly
Bidco,
FRN,
3M
EURIBOR
+
3.75%,
6.802%,
4/29/29
(EUR)
6,420,000
6,679
CD&R
Firefly
Bidco,
FRN,
GBP
SONIA
+
5.75%,
10.70%,
6/21/28
4,670,000
5,832
ZPG,
FRN,
GBP
SONIA
+
5.50%,
10.20%,
7/31/28
1,250,000
1,567
14,078
Convertible
Bonds 0.1%
Immunocore
Holdings,
2.50%,
2/1/30
(USD) (1)
553,000
464
464
Corporate
Bonds 0.9%
Vmed
O2
U.K.
Financing
I,
7.75%,
4/15/32
(USD) (1)
9,555,000
9,544
9,544
Total
United
Kingdom
(Cost
$24,402)
24,086
UNITED
STATES 52.3%
Asset-Backed
Securities 11.2%
Auxilior
Term
Funding,
Series
2023-1A,
Class
E,
10.97%,
12/15/32 (1)
6,770,000
6,946
Bayview
Opportunity
Master
Fund
VII,
Series
2024-CAR1,
Class
E,
FRN,
SOFR30A
+
3.60%,
8.169%,
12/26/31 (1)
2,267,005
2,296
Blackbird
Capital
Aircraft
Lease
Securitization,
Series
2016-
1A,
Class
A,
STEP,
6.50%,
12/16/41 (1)
165,180
165
Blue
Owl
Asset
Leasing
Trust,
Series
2024-1A,
Class
D,
8.00%,
12/15/31 (1)
5,011,000
4,995
Carvana
Auto
Receivables
Trust,
Series
2024-N2,
Class
E,
8.16%,
6/10/31 (1)
7,300,000
7,321
Driven
Brands
Funding,
Series
2019-2A,
Class
A2,
3.981%,
10/20/49 (1)
4,157,925
4,058
Elara
HGV
Timeshare
Issuer,
Series
2019-A,
Class
C,
3.45%,
1/25/34 (1)
28,648
28
Elara
HGV
Timeshare
Issuer,
Series
2023-A,
Class
D,
10.10%,
2/25/38 (1)
132,389
136
FOCUS
Brands
Funding,
Series
2023-2,
Class
A2,
8.241%,
10/30/53 (1)
8,840,700
9,314
Frontier
Issuer,
Series
2023-1,
Class
C,
11.50%,
8/20/53 (1)
10,865,765
11,588
T.
ROWE
PRICE
Dynamic
Credit
Fund
Par/Shares
$
Value
(Cost
and
value
in
$000s)
Frontier
Issuer,
Series
2024-1,
Class
C,
11.16%,
6/20/54 (1)
1,098,880
1,228
Goto
Foods
Funding,
Series
2017-1A,
Class
A2II,
5.093%,
4/30/47 (1)
2,090,500
2,060
Hardee's
Funding,
Series
2020-1A,
Class
A2,
3.981%,
12/20/50 (1)
1,597,969
1,502
Hardee's
Funding,
Series
2021-1A,
Class
A2,
2.865%,
6/20/51 (1)
1,215,900
1,089
Hardee's
Funding,
Series
2024-1A,
Class
A2,
7.253%,
3/20/54 (1)
9,835,675
10,046
Hilton
Grand
Vacations
Trust,
Series
2024-1B,
Class
D,
8.85%,
9/15/39 (1)
2,065,823
2,105
Huntington
Bank
Auto
Credit-Linked
Notes,
Series
2024-1,
Class
C,
FRN,
SOFR30A
+
3.15%,
7.755%,
5/20/32 (1)
2,107,618
2,129
Jersey
Mike's
Funding,
Series
2019-1A,
Class
A2,
4.433%,
2/15/50 (1)
230,260
227
Jersey
Mike's
Funding,
Series
2021-1A,
Class
A2I,
2.891%,
2/15/52 (1)
49,750
48
MVW,
Series
2023-2A,
Class
D,
9.33%,
11/20/40 (1)
4,378,213
4,472
Octane
Receivables
Trust,
Series
2023-1A,
Class
E,
9.25%,
8/20/30 (1)
255,000
267
Post
Road
Equipment
Finance,
Series
2024-1A,
Class
E,
8.50%,
12/15/31 (1)
3,338,000
3,302
Santander
Bank
Auto
Credit-Linked
Notes,
Series
2023-A,
Class
E,
10.068%,
6/15/33 (1)
80,479
82
Santander
Bank
Auto
Credit-Linked
Notes,
Series
2023-B,
Class
E,
8.408%,
12/15/33 (1)
4,705,278
4,812
SCF
Equipment
Leasing,
Series
2022-1A,
Class
F,
6.00%,
7/20/32 (1)
5,650,000
5,483
SCF
Equipment
Leasing,
Series
2024-1A,
Class
E,
9.00%,
12/20/34 (1)
3,300,000
3,338
SEB
Funding,
Series
2024-1A,
Class
A2,
7.386%,
4/30/54 (1)
14,435,000
14,761
Sierra
Timeshare
Receivables
Funding,
Series
2021-1A,
Class
D,
3.17%,
11/20/37 (1)
832,668
806
Sierra
Timeshare
Receivables
Funding,
Series
2023-3A,
Class
D,
9.44%,
9/20/40 (1)
3,101,487
3,201
Sierra
Timeshare
Receivables
Funding,
Series
2024-1A,
Class
D,
8.02%,
1/20/43 (1)
1,456,929
1,472
Stonepeak
ABS,
Series
2021-1A,
Class
B,
3.821%,
2/28/33 (1)
148,520
140
TPIC
SPV
I,
Series
2024-1A,
Class
A,
Acquisition
Date:
12/10/24,
Cost $4,300,
7.131%,
11/30/44 (8)
4,300,000
4,300
113,717
T.
ROWE
PRICE
Dynamic
Credit
Fund
Par/Shares
$
Value
(Cost
and
value
in
$000s)
Bank
Loans 11.4% (10)
Asurion,
FRN,
1M
TSFR
+
4.25%,
8.707%,
8/19/28
19,584,831
19,585
Asurion,
FRN,
1M
TSFR
+
5.25%,
9.721%,
1/31/28
185,904
181
Chromalloy,
FRN,
3M
TSFR
+
3.75%,
8.06%,
3/27/31
13,920,050
13,922
Cloud
Software
Group,
FRN,
1M
TSFR
+
3.75%,
8.079%,
3/21/31
7,465,000
7,481
Cloud
Software
Group,
FRN,
3M
TSFR
+
3.50%,
7.829%,
3/30/29
4,207,995
4,217
CMG
Media,
FRN,
1M
TSFR
+
3.50%,
7.929%,
6/18/29
9,763,746
8,724
CSC
Holdings,
FRN,
1M
TSFR
+
2.50%,
7.173%,
4/15/27
5,725,000
5,273
CSC
Holdings,
FRN,
1M
TSFR
+
4.50%,
8.806%,
1/18/28
9,785,202
9,579
Ellucian
Holdings,
FRN,
1M
TSFR
+
3.00%,
7.357%,
10/9/29
5,233,194
5,263
Ellucian
Holdings,
FRN,
1M
TSFR
+
4.75%,
9.107%,
11/14/32
4,925,000
5,007
Icon
Parent,
FRN,
1M
TSFR
+
3.00%,
7.516%,
11/13/31
8,815,000
8,840
LTI
Holdings,
FRN,
1M
TSFR
+
4.75%,
9.107%,
7/29/29
6,962,550
6,966
Radiate
Holdco,
FRN,
1M
TSFR
+
3.25%,
7.721%,
9/25/26
17,068,343
14,884
RFS
OPCO,
FRN,
1M
TSFR
+
4.75%,
9.079%,
4/4/31 (5)
6,264,300
6,202
116,124
Common
Stocks 0.0%
Altera
Infrastructure,
Acquisition
Date:
1/19/23,
Cost $13 (5)
(6)(8)
639
18
18
Convertible
Bonds 0.8%
Wolfspeed,
1.875%,
12/1/29
19,595,000
8,083
8,083
Convertible
Preferred
Stocks 1.5%
Ares
Management,
Series
B,
6.75%,
10/1/27
111,744
6,151
Boeing,
6.00%,
10/15/27
74,353
4,527
Kobold
Metals,
Series
C-2,
Acquisition
Date:
9/20/24,
Cost $4,009 (5)(6)(8)
51,015
4,334
15,012
Corporate
Bonds 21.0%
Alliant
Holdings
Intermediate,
6.50%,
10/1/31 (1)
9,895,000
9,747
American
Airlines,
5.75%,
4/20/29 (1)
4,618,182
4,572
AP
Grange
Holdings,
Acquisition
Date:
6/12/24,
Cost $8,925,
6.50%,
3/20/45 (5)(8)
8,925,000
8,925
At
Home
Group,
4.875%,
7/15/28 (1)
210,000
84
T.
ROWE
PRICE
Dynamic
Credit
Fund
Par/Shares
$
Value
(Cost
and
value
in
$000s)
Blackstone
Mortgage
Trust,
7.75%,
12/1/29 (1)
5,230,000
5,367
Centene,
3.00%,
10/15/30
2,458,000
2,114
Centene,
4.625%,
12/15/29
2,462,000
2,314
CHS,
10.875%,
1/15/32 (1)
5,655,000
5,818
Cloud
Software
Group,
8.25%,
6/30/32 (1)
2,939,000
3,031
Cloud
Software
Group,
9.00%,
9/30/29 (1)
7,175,000
7,274
Comstock
Resources,
6.75%,
3/1/29 (1)
8,796,000
8,554
Crescent
Energy
Finance,
7.375%,
1/15/33 (1)
5,925,000
5,762
CVS
Health,
VR,
6.75%,
12/10/54 (2)
2,305,000
2,247
DISH
DBS,
5.25%,
12/1/26 (1)
15,035,000
13,644
DISH
DBS,
5.75%,
12/1/28 (1)
606,000
518
DISH
DBS,
7.75%,
7/1/26
6,145,000
5,146
DISH
Network,
11.75%,
11/15/27 (1)
16,700,000
17,639
Icahn
Enterprises,
9.00%,
6/15/30
12,450,000
11,905
LCPR
Senior
Secured
Financing,
6.75%,
10/15/27 (1)
10,355,000
9,332
MPT
Operating
Partnership,
2.50%,
3/24/26
(GBP) (3)
12,665,000
14,013
Navient,
11.50%,
3/15/31
13,445,000
14,991
Neptune
Bidco
U.S.,
9.29%,
4/15/29 (1)
17,130,000
15,888
NGL
Energy
Operating,
8.125%,
2/15/29 (1)
3,348,000
3,381
OneMain
Finance,
7.125%,
11/15/31
11,030,000
11,237
Transocean,
8.75%,
2/15/30 (1)
19,575,500
20,163
Venture
Global
LNG,
VR,
9.00% (1)(2)(9)
9,775,000
10,203
213,869
Municipal
Securities 2.9%
Colorado
HFA,
Covenant
Living
Community,
Series
B,
4.48%,
12/1/40
235,000
189
Michigan
Tobacco
Settlement
Fin.
Auth.,
Series
B,
Zero
Coupon,
6/1/46
25,000
3
Port
of
Beaumont
Navigation
Dist.,
Jefferson
Gulf
Coast,
Series
B,
10.00%,
7/1/26 (1)
10,720,000
10,954
Puerto
Rico
Commonwealth,
GO,
VR,
11/1/43 (11)
29,468,352
18,049
Puerto
Rico
Electric
Power
Auth.,
Build
America,
5.95%,
7/1/30 (6)(12)
40,000
22
Puerto
Rico
Electric
Power
Auth.,
Build
America,
6.05%,
7/1/32 (6)(12)
150,000
81
Tobacco
Settlement
Fin.,
Series
A-1,
6.706%,
6/1/46
250,000
209
Tobacco
Settlement
Fin.
Auth.,
Series
B,
4.875%,
6/1/49
90,000
85
Tobacco
Settlement
Fin.
Auth.,
Series
B,
Zero
Coupon,
6/1/47
460,000
43
29,635
T.
ROWE
PRICE
Dynamic
Credit
Fund
Par/Shares
$
Value
(Cost
and
value
in
$000s)
Non-U.S.
Government
Mortgage-Backed
Securities 2.5%
Alen
Mortgage
Trust,
Series
2021-ACEN,
Class
A,
ARM,
1M
TSFR
+
1.264%,
5.662%,
4/15/34 (1)
2,120,000
1,966
Bayview
Financing
Trust,
Series
2024-2F,
Class
A,
CMO,
ARM,
Acquisition
Date:
8/29/24,
Cost $5,031,
8.10%,
9/25/29 (5)(8)
5,030,628
5,031
BBCMS
Mortgage
Trust,
Series
2019-BWAY,
Class
E,
ARM,
1M
TSFR
+
2.964%,
7.361%,
11/15/34 (1)
120,000
1
BBCMS
Trust,
Series
2015-SRCH,
Class
D,
ARM,
4.957%,
8/10/35 (1)
2,131,000
1,909
BSREP
Commercial
Mortgage
Trust,
Series
2021-DC,
Class
C,
ARM,
1M
TSFR
+
1.664%,
6.062%,
8/15/38 (1)
1,170,417
925
BX
Trust,
Series
2021-VIEW,
Class
F,
ARM,
1M
TSFR
+
4.044%,
8.441%,
6/15/36 (1)
145,000
136
CAFL,
Series
2021-RTL1,
Class
A1,
CMO,
STEP,
2.239%,
3/28/29 (1)
49,373
49
CAMB
Commercial
Mortgage
Trust,
Series
2019-LIFE,
Class
E,
ARM,
1M
TSFR
+
2.447%,
6.845%,
12/15/37 (1)
2,912,500
2,913
Cantor
Commercial
Real
Estate
Lending,
Series
2019-CF1,
Class
65C,
ARM,
4.123%,
5/15/52 (1)
115,000
39
Cantor
Commercial
Real
Estate
Lending,
Series
2019-CF1,
Class
65D,
ARM,
4.66%,
5/15/52 (1)
70,000
19
Finance
of
America
HECM
Buyout,
Series
2024-HB1,
Class
M5,
ARM,
6.00%,
10/1/34 (1)
8,725,000
6,287
LSTAR
Commercial
Mortgage
Trust,
Series
2017-5,
Class
D,
ARM,
4.667%,
3/10/50 (1)
220,000
176
Oceanview
Mortgage
Loan
Trust,
Series
2020-1,
Class
A3,
CMO,
ARM,
3.285%,
5/28/50 (1)
115,000
97
ONE
Mortgage
Trust,
Series
2021-PARK,
Class
D,
ARM,
1M
TSFR
+
1.614%,
6.011%,
3/15/36 (1)
711,000
679
TX
Trust,
Series
2024-HOU,
Class
D,
ARM,
1M
TSFR
+
3.239%,
7.636%,
6/15/39 (1)
2,805,000
2,803
Verus
Securitization
Trust,
Series
2021-2,
Class
M1,
CMO,
ARM,
2.187%,
2/25/66 (1)
150,000
114
Verus
Securitization
Trust,
Series
2021-5,
Class
M1,
CMO,
ARM,
2.331%,
9/25/66 (1)
3,270,000
2,259
25,403
U.S.
Government
&
Agency
Mortgage-Backed
Securities 1.0%
Federal
National
Mortgage
Assn.,
CMO,
IO
2.00%,
5/25/51
-
4/25/52
45,712,511
5,977
Government
National
Mortgage
Assn.,
CMO,
IO
2.00%,
11/20/50
-
12/20/50
4,347,185
533
T.
ROWE
PRICE
Dynamic
Credit
Fund
Par/Shares
$
Value
(Cost
and
value
in
$000s)
2.50%,
8/20/49
-
11/20/51
24,435,152
3,437
9,947
Total
United
States
(Cost
$528,636)
531,808
SHORT-TERM
INVESTMENTS 12.0%
Money
Market
Funds 4.4%
T.
Rowe
Price
Government
Reserve
Fund,
4.53% (13)(14)
45,008,624
45,009
45,009
U.S.
Treasury
Obligations 7.6%
U.S.
Treasury
Bills,
4.399%,
2/27/25 (15)
76,775,000
76,270
76,270
Total
Short-Term
Investments
(Cost
$121,254)
121,279
SECURITIES
LENDING
COLLATERAL 2.1%
INVESTMENTS
IN
A
POOLED
ACCOUNT
THROUGH
SECURITIES
LENDING
PROGRAM
WITH
JPMORGAN
CHASE
BANK 1.4%
Money
Market
Funds 1.4%
T.
Rowe
Price
Government
Reserve
Fund,
4.53% (13)(14)
14,254,626
14,255
Total
Investments
in
a
Pooled
Account
through
Securities
Lending
Program
with
JPMorgan
Chase
Bank
14,255
INVESTMENTS
IN
A
POOLED
ACCOUNT
THROUGH
SECURITIES
LENDING
PROGRAM
WITH
STATE
STREET
BANK
AND
TRUST
COMPANY 0.7%
Money
Market
Funds 0.7%
T.
Rowe
Price
Government
Reserve
Fund,
4.53% (13)(14)
7,438,238
7,438
Total
Investments
in
a
Pooled
Account
through
Securities
Lending
Program
with
State
Street
Bank
and
Trust
Company
7,438
Total
Securities
Lending
Collateral
(Cost
$21,693)
21,693
T.
ROWE
PRICE
Dynamic
Credit
Fund
(Amounts
in
000s,
except
for
contracts)
OPTIONS
PURCHASED 0.3%
OTC
Options
Purchased
0.3%
Counterparty
Description
Contracts
Notional
Amount
$
Value
Barclays
Bank
Credit
Default
Swap,
Protection
Bought
(Relevant
Credit:
Markit
CDX.
NA.HY-S43,
5
Year
Index,
12/20/29),
Pay
5.00%
Quarterly,
Receive
upon
credit
default,
4/16/25
@
1.05%* (6)
2
126,900
923
Morgan
Stanley
10
Year
Interest
Rate
Swap,
7/1/35
Pay
Fixed
4.55%
Annually,
Receive
Variable
4.49%
(SOFR)
Annually,
6/27/25
@
4.55%* (6)
1
119,735
1,096
Morgan
Stanley
Credit
Default
Swap,
Protection
Sold
(Relevant
Credit:
Markit
iTraxx
Europe-S42,
5
Year
Index,
12/20/29),
Receive
1.00%
Quarterly,
Pay
upon
credit
default,
3/19/25
@
0.50%*
(EUR) (6)
2
406,900
128
T.
ROWE
PRICE
Dynamic
Credit
Fund
(Amounts
in
000s,
except
for
contracts)
Counterparty
Description
Contracts
Notional
Amount
$
Value
Morgan
Stanley
Credit
Default
Swap,
Protection
Sold
(Relevant
Credit:
Markit
iTraxx
Europe-S42,
5
Year
Index,
12/20/29),
Receive
1.00%
Quarterly,
Pay
upon
credit
default,
3/19/25
@
0.53%*
(EUR) (6)
1
203,450
126
Morgan
Stanley
iShares
Russell
2000
ETF,
Call,
3/21/25
@
$250.00 (6)
233
5,148
30
Morgan
Stanley
S&P
500
Index,
Put,
4/17/25
@
$5,950.00 (6)
33
19,409
576
Morgan
Stanley
S&P
500
Index,
Put,
12/19/25
@
$5,700.00 (6)
23
13,528
529
Morgan
Stanley
Technology
Select
Sector
SPDR
Fund,
Call,
3/21/25
@
$230.00 (6)
66
1,535
80
Wells
Fargo
Energy
Select
Sector
SPDR
Fund,
Call,
3/21/25
@
$91.00 (6)
182
1,559
29
Wells
Fargo
SPDR
S&P
Regional
Banking
ETF,
Call,
3/21/25
@
$68.00 (6)
520
3,138
52
Total
Options
Purchased
(Cost
$4,300)
3,569
Total
Investments
in
Securities
101.2%
of
Net
Assets
(Cost
$1,036,004)
$
1,028,286
T.
ROWE
PRICE
Dynamic
Credit
Fund
‡
Country
classifications
are
generally
based
on
MSCI
categories
or
another
unaffiliated
third
party
data
provider;
Par/Shares
and
Notional
Amount
are
denominated
in
the
currency
of
the
country
presented
unless
otherwise
noted.
†
Investment
fund
is
not
unitized.
*
Exercise
Spread
(1)
Security
was
purchased
pursuant
to
Rule
144A
under
the
Securities
Act
of
1933
and
may
be
resold
in
transactions
exempt
from
registration
only
to
qualified
institutional
buyers.
Total
value
of
such
securities
at
period-end
amounts
to
$435,117
and
represents
42.8%
of
net
assets.
(2)
Security
is
a
fix-to-float
security,
which
carries
a
fixed
coupon
until
a
certain
date,
upon
which
it
switches
to
a
floating
rate.
Reference
rate
and
spread
are
provided
if
the
rate
is
currently
floating.
(3)
See
Note
4
.
All
or
a
portion
of
this
security
is
on
loan
at
December
31,
2024.
(4)
Security
has
the
ability
to
pay
in-kind
or
pay
in
cash.
When
applicable,
separate
rates
of
such
payments
are
disclosed.
(5)
See
Note
2.
Level
3
in
fair
value
hierarchy.
(6)
Non-income
producing
(7)
Security
is
in
default
or
has
failed
to
make
a
scheduled
interest
and/or
principal
payment.
(8)
Security
cannot
be
offered
for
public
resale
without
first
being
registered
under
the
Securities
Act
of
1933
and
related
rules
("restricted
security").
Acquisition
date
represents
the
day
on
which
an
enforceable
right
to
acquire
such
security
is
obtained
and
is
presented
along
with
related
cost
in
the
security
description.
The
fund
may
have
registration
rights
for
certain
restricted
securities.
Any
costs
related
to
such
registration
are
generally
borne
by
the
issuer.
The
aggregate
value
of
restricted
securities
(excluding
144A
holdings)
at
period
end
amounts
to
$22,639
and
represents
2.2%
of
net
assets.
(9)
Perpetual
security
with
no
stated
maturity
date.
(10)
Bank
loan
positions
may
involve
multiple
underlying
tranches.
In
those
instances,
the
position
presented
reflects
the
aggregate
of
those
respective
underlying
tranches
and
the
rate
presented
reflects
the
weighted
average
rate
of
the
settled
positions.
(11)
Contingent
value
instrument
that
only
pays
out
if
a
portion
of
the
territory's
Sales
and
Use
Tax
outperforms
the
projections
in
the
Oversight
Board’s
Certified
Fiscal
Plan.
(12)
Issuer
is
currently
in
a
bankruptcy
reorganization
proceeding;
the
amount
and
timing
of
future
distributions
is
uncertain.
(13)
Seven-day
yield
(14)
Affiliated
Companies
(15)
At
December
31,
2024,
all
or
a
portion
of
this
security
is
pledged
as
collateral
and/or
margin
deposit
to
cover
future
funding
obligations.
T.
ROWE
PRICE
Dynamic
Credit
Fund
1M
TSFR
One
month
term
SOFR
(Secured
overnight
financing
rate)
3M
EURIBOR
Three
month
EURIBOR
(Euro
interbank
offered
rate)
3M
TSFR
Three
month
term
SOFR
(Secured
overnight
financing
rate)
ARM
Adjustable
Rate
Mortgage
(ARM);
rate
shown
is
effective
rate
at
period-end.
The
rates
for
certain
ARMs
are
not
based
on
a
published
reference
rate
and
spread
but
may
be
determined
using
a
formula
based
on
the
rates
of
the
underlying
loans.
AUD
Australian
Dollar
BRL
Brazilian
Real
CAD
Canadian
Dollar
CHF
Swiss
Franc
CMO
Collateralized
Mortgage
Obligation
CORRA
Canadian
Overnight
Repo
Rate
Average
CPI
Consumer
Price
Index
ETF
Exchange-Traded
Fund
EUR
Euro
FRN
Floating
Rate
Note
GBP
British
Pound
GO
General
Obligation
HFA
Health
Facility
Authority
IO
Interest-only
security
for
which
the
fund
receives
interest
on
notional
principal
JPY
Japanese
Yen
NOK
Norwegian
Krone
NZD
New
Zealand
Dollar
OTC
Over-the-counter
PIK
Payment-in-kind
SEK
Swedish
Krona
SOFR
Secured
overnight
financing
rate
SOFR30A
30-day
Average
SOFR
(Secured
overnight
financing
rate)
SONIA
Sterling
Overnight
Index
Average
STEP
Stepped
coupon
bond
for
which
the
coupon
rate
of
interest
adjusts
on
specified
date(s);
rate
shown
is
effective
rate
at
period-end.
USD
U.S.
Dollar
VR
Variable
Rate;
rate
shown
is
effective
rate
at
period-end.
The
rates
for
certain
variable
rate
securities
are
not
based
on
a
published
reference
rate
and
spread
but
are
determined
by
the
issuer
or
agent
and
based
on
current
market
conditions.
T.
ROWE
PRICE
Dynamic
Credit
Fund
(Amounts
in
000s)
SWAPS
(1.1)%
Description
Notional
Amount
$
Value
Upfront
Payments/
$
(Receipts)
Unrealized
$
Gain/(Loss)
BILATERAL
SWAPS
(0.3)%
Credit
Default
Swaps,
Protection
Sold
(0.3)%
United
States
(0.3)%
Goldman
Sachs,
Protection
Sold (Relevant
Credit:
Markit
CMBX.
NA.BBB-S17,
35
Year
Index),
Receive
3.00%
Monthly,
Pay
upon
credit
default,
12/15/56
10,493
(1,118)
(1,258)
140
Morgan
Stanley,
Protection
Sold (Relevant
Credit:
Markit
CMBX.
NA.BBB-S17,
35
Year
Index),
Receive
3.00%
Monthly,
Pay
upon
credit
default,
12/15/56
15,325
(1,634)
(1,828)
194
Total
United
States
(3,086)
334
Total
Bilateral
Credit
Default
Swaps,
Protection
Sold
(3,086)
334
Total
Bilateral
Swaps
(3,086)
334
Description
Notional
Amount
$
Value
Initial
$
Value
**
Unrealized
$
Gain/(Loss)
CENTRALLY
CLEARED
SWAPS
(0.8)%
Credit
Default
Swaps,
Protection
Bought
(0.8)%
Canada
(0.0)%
Protection
Bought
(Relevant
Credit:
Bombardier),
Pay
5.00%
Quarterly,
Receive
upon
credit
default,
6/20/28
(USD)
1,515
(181)
(59)
(122)
Total
Canada
(122)
Oman
(0.0)%
Protection
Bought
(Relevant
Credit:
Sultanate
of
Oman),
Pay
1.00%
Quarterly,
Receive
upon
credit
default,
12/20/28
(USD)
10,262
(65)
270
(335)
Total
Oman
(335)
United
States
(0.8)%
Protection
Bought
(Relevant
Credit:
Delta
Air
Lines),
Pay
5.00%
Quarterly,
Receive
upon
credit
default,
6/21/27
335
(36)
(6)
(30)
T.
ROWE
PRICE
Dynamic
Credit
Fund
(Amounts
in
000s)
Description
Notional
Amount
$
Value
Initial
$
Value**
Unrealized
$
Gain/(Loss)
Protection
Bought
(Relevant
Credit:
Delta
Air
Lines),
Pay
5.00%
Quarterly,
Receive
upon
credit
default,
12/20/28
*
11,761
(1,826)
(1,581)
(245)
Protection
Bought
(Relevant
Credit:
Markit
CDX.NA.HY-S43,
5
Year
Index),
Pay
5.00%
Quarterly,
Receive
upon
credit
default,
12/20/29
38,050
(2,991)
(3,050)
59
Protection
Bought
(Relevant
Credit:
Nova
Chemicals),
Pay
5.00%
Quarterly,
Receive
upon
credit
default,
12/20/28
5,657
(694)
(290)
(404)
Protection
Bought
(Relevant
Credit:
United
Airlines
Holdings),
Pay
5.00%
Quarterly,
Receive
upon
credit
default,
6/20/29
*
18,010
(2,325)
52
(2,377)
Total
United
States
(2,997)
Total
Centrally
Cleared
Credit
Default
Swaps,
Protection
Bought
(3,454)
Credit
Default
Swaps,
Protection
Sold
(0.1)%
Luxembourg
(0.2)%
Protection
Sold
(Relevant
Credit:
SES
S.A.,
Baa3*),
Receive
1.00%
Quarterly,
Pay
upon
credit
default,
12/20/29
20,200
(2,015)
(1,418)
(597)
Total
Luxembourg
(597)
United
States
0.1%
Protection
Sold
(Relevant
Credit:
Avis
Budget
Car
Rental,
BB-*),
Receive
5.00%
Quarterly,
Pay
upon
credit
default,
6/20/27
2,826
142
115
27
Total
United
States
27
Total
Centrally
Cleared
Credit
Default
Swaps,
Protection
Sold
(570)
Interest
Rate
Swaps
0.2%
Canada
0.1%
5
Year
Interest
Rate
Swap,
Receive
Fixed
3.297%
Semi-Annually,
Pay
Variable
3.320%
(CORRA)
Semi-
Annually,
6/14/29
146,480
2,528
—
2,528
30
Year
Interest
Rate
Swap,
Pay
Fixed
3.236%
Semi-Annually,
Receive
Variable
3.320%
(CORRA)
Semi-Annually,
6/15/54
35,418
(1,035)
—
(1,035)
Total
Canada
1,493
T.
ROWE
PRICE
Dynamic
Credit
Fund
(Amounts
in
000s)
Description
Notional
Amount
$
Value
Initial
$
Value**
Unrealized
$
Gain/(Loss)
United
Kingdom
(0.1)%
2
Year
Interest
Rate
Swap,
Receive
Fixed
4.257%
Annually,
Pay
Variable
4.716%
(GBP
SONIA)
Annually,
11/9/26
209,675
(356)
—
(356)
2
Year
Interest
Rate
Swap,
Receive
Fixed
4.259%
Annually,
Pay
Variable
4.714%
(GBP
SONIA)
Annually,
11/16/26
214,333
(308)
—
(308)
Total
United
Kingdom
(664)
United
States
0.2%
5
Year
Interest
Rate
Swap,
Pay
Fixed
3.844%
Annually,
Receive
Variable
4.535%
(SOFR)
Annually,
11/27/29
56,130
537
—
537
5
Year
Interest
Rate
Swap,
Pay
Fixed
4.017%
Annually,
Receive
Variable
4.490%
(SOFR)
Annually,
1/3/30
113,545
—
—
—
10
Year
Interest
Rate
Swap,
Pay
Fixed
3.803%
Annually,
Receive
Variable
4.535%
(SOFR)
Annually,
11/27/34
30,632
692
—
692
10
Year
Interest
Rate
Swap,
Pay
Fixed
3.826%
Annually,
Receive
Variable
4.532%
(SOFR)
Annually,
11/29/34
31,080
643
—
643
10
Year
Interest
Rate
Swap,
Pay
Fixed
4.082%
Annually,
Receive
Variable
4.433%
(SOFR)
Annually,
12/25/34
30,972
(22)
—
(22)
Total
United
States
1,850
Total
Centrally
Cleared
Interest
Rate
Swaps
2,679
T.
ROWE
PRICE
Dynamic
Credit
Fund
(Amounts
in
000s)
Description
Notional
Amount
$
Value
Initial
$
Value**
Unrealized
$
Gain/(Loss)
Zero-Coupon
Inflation
Swaps
(0.1)%
United
States
(0.1)%
10
Year
Zero-Coupon
Inflation
Swap
Pay
Fixed
2.607%
at
Maturity,
Receive
Variable
(Change
in
CPI)
at
Maturity,
5/31/34
94,500
(1,413)
—
(1,413)
Total
United
States
(1,413)
Total
Centrally
Cleared
Zero-Coupon
Inflation
Swaps
(1,413)
Total
Centrally
Cleared
Swaps
(2,758)
Net
payments
(receipts)
of
variation
margin
to
date
3,075
Variation
margin
receivable
(payable)
on
centrally
cleared
swaps
$
317
*
Credit
ratings
as
of
December
31,
2024.
Ratings
shown
are
from
Moody’s
Investors
Service
and
if
Moody’s
does
not
rate
a
security,
then
Standard
&
Poor’s
(S&P)
is
used.
Fitch
is
used
for
securities
that
are
not
rated
by
either
Moody’s
or
S&P.
**
Includes
interest
purchased
or
sold
but
not
yet
collected
of
$(49).
T.
ROWE
PRICE
Dynamic
Credit
Fund
(Amounts
in
000s)
FORWARD
CURRENCY
EXCHANGE
CONTRACTS
Counterparty
Settlement
Receive
Deliver
Unrealized
Gain/(Loss)
Bank
of
America
1/24/25
NZD
102
USD
61
$
(4)
Bank
of
America
1/24/25
USD
1,243
AUD
1,912
59
Bank
of
America
1/24/25
USD
488
NOK
5,508
4
Barclays
Bank
1/24/25
JPY
18,435
USD
121
(3)
Barclays
Bank
1/24/25
NZD
629
USD
375
(23)
Barclays
Bank
1/24/25
USD
113
AUD
181
1
Barclays
Bank
1/24/25
USD
174
CHF
149
9
Barclays
Bank
2/21/25
EUR
9,840
USD
10,369
(154)
Barclays
Bank
2/21/25
GBP
1,562
USD
1,969
(14)
Barclays
Bank
2/21/25
USD
499
EUR
472
9
Barclays
Bank
2/21/25
USD
22,412
GBP
17,772
171
Barclays
Bank
2/28/25
USD
241
SEK
2,630
3
BNY
Mellon
1/24/25
NOK
12,853
USD
1,170
(41)
BNY
Mellon
2/21/25
EUR
9,800
USD
10,327
(154)
BNY
Mellon
2/21/25
USD
5,882
GBP
4,635
82
Canadian
Imperial
Bank
of
Commerce
1/24/25
CAD
6,335
USD
4,453
(42)
Citibank
1/24/25
AUD
221
USD
145
(9)
Citibank
1/24/25
USD
82
AUD
127
3
Citibank
1/24/25
USD
213
CAD
301
3
Citibank
1/24/25
USD
290
JPY
43,266
14
Citibank
2/21/25
USD
199
GBP
157
3
Citibank
2/28/25
USD
142
SEK
1,544
2
Deutsche
Bank
1/24/25
AUD
694
USD
457
(27)
Deutsche
Bank
1/24/25
JPY
748,540
USD
5,044
(273)
Deutsche
Bank
1/24/25
NOK
3,247
USD
294
(9)
Deutsche
Bank
1/24/25
USD
326
CAD
463
4
Deutsche
Bank
1/24/25
USD
325
JPY
50,284
5
Deutsche
Bank
1/24/25
USD
253
JPY
39,876
(1)
Deutsche
Bank
1/24/25
USD
407
NZD
699
16
Deutsche
Bank
2/21/25
EUR
2,233
USD
2,365
(47)
Deutsche
Bank
2/21/25
USD
24,800
EUR
23,425
483
Deutsche
Bank
2/28/25
USD
271
SEK
2,965
2
Goldman
Sachs
1/24/25
JPY
315,974
USD
2,092
(78)
Goldman
Sachs
1/24/25
USD
235
AUD
368
7
Goldman
Sachs
1/24/25
USD
273
CAD
380
8
Goldman
Sachs
2/21/25
EUR
776
USD
819
(13)
Goldman
Sachs
2/21/25
USD
5,358
GBP
4,229
66
Goldman
Sachs
2/28/25
USD
193
SEK
2,120
1
HSBC
Bank
1/24/25
CAD
296
USD
213
(7)
HSBC
Bank
1/24/25
NZD
139
USD
81
(4)
T.
ROWE
PRICE
Dynamic
Credit
Fund
(Amounts
in
000s)
FORWARD
CURRENCY
EXCHANGE
CONTRACTS
(CONTINUED)
Counterparty
Settlement
Receive
Deliver
Unrealized
Gain/(Loss)
HSBC
Bank
1/24/25
USD
263
AUD
404
$
13
HSBC
Bank
1/24/25
USD
304
CAD
436
—
HSBC
Bank
2/21/25
USD
365
EUR
350
2
JPMorgan
Chase
1/24/25
AUD
118
USD
78
(5)
JPMorgan
Chase
1/24/25
USD
161
AUD
257
2
JPMorgan
Chase
1/24/25
USD
2,853
CAD
3,995
72
JPMorgan
Chase
1/24/25
USD
252
JPY
38,433
7
JPMorgan
Chase
1/24/25
USD
51
NOK
565
1
JPMorgan
Chase
2/28/25
USD
146
SEK
1,604
—
Morgan
Stanley
1/24/25
USD
345
CAD
497
(1)
Morgan
Stanley
1/24/25
USD
283
CHF
248
9
Morgan
Stanley
2/21/25
USD
139
GBP
111
1
RBC
Dominion
Securities
1/24/25
USD
793
AUD
1,275
4
RBC
Dominion
Securities
1/24/25
USD
261
CAD
365
6
Standard
Chartered
1/24/25
JPY
761,690
USD
5,109
(254)
Standard
Chartered
2/21/25
USD
9,638
EUR
9,105
186
State
Street
1/24/25
AUD
7,360
USD
4,912
(356)
State
Street
2/21/25
EUR
583
USD
619
(14)
State
Street
2/28/25
USD
522
SEK
5,713
4
Toronto-Dominion
Bank
1/24/25
NZD
1,412
USD
844
(54)
Toronto-Dominion
Bank
1/24/25
USD
6,790
CAD
9,358
274
Toronto-Dominion
Bank
2/21/25
GBP
9,305
USD
11,694
(50)
Toronto-Dominion
Bank
2/21/25
USD
7,902
EUR
7,450
168
UBS
Investment
Bank
1/24/25
CHF
18
USD
20
—
UBS
Investment
Bank
1/24/25
USD
4,994
AUD
7,684
238
UBS
Investment
Bank
1/24/25
USD
3,181
CHF
2,738
156
UBS
Investment
Bank
1/24/25
USD
123
JPY
18,430
5
UBS
Investment
Bank
1/24/25
USD
611
NOK
6,821
12
UBS
Investment
Bank
3/6/25
USD
49,350
BRL
301,380
1,148
Net
unrealized
gain
(loss)
on
open
forward
currency
exchange
contracts
$
1,626
T.
ROWE
PRICE
Dynamic
Credit
Fund
FUTURES
CONTRACTS
($000s)
Expiration
Date
Notional
Amount
Value
and
Unrealized
Gain
(Loss)
Long,
84
Commonwealth
of
Australia
ten
year
bond
contracts
3/25
5,869
$
(38)
Short,
254
Euro
BTP
contracts
3/25
(31,568)
689
Short,
121
Euro
BUND
contracts
3/25
(16,725)
258
Long,
38
U.K.
Gilt
ten
year
contracts
3/25
4,396
(111)
Long,
284
U.S.
Treasury
Notes
ten
year
contracts
3/25
30,885
(306)
Net
payments
(receipts)
of
variation
margin
to
date
(511)
Variation
margin
receivable
(payable)
on
open
futures
contracts
$
(19)
T.
ROWE
PRICE
Dynamic
Credit
Fund
The
accompanying
notes
are
an
integral
part
of
these
financial
statements.
AFFILIATED
COMPANIES
($000s)
The
fund
may
invest
in
certain
securities
that
are
considered
affiliated
companies.
As
defined
by
the
1940
Act,
an
affiliated
company
is
one
in
which
the
fund
owns
5%
or
more
of
the
outstanding
voting
securities,
or
a
company
that
is
under
common
ownership
or
control.
The
following
securities
were
considered
affiliated
companies
for
all
or
some
portion
of
the
year
ended
December
31,
2024.
Net
realized
gain
(loss),
investment
income,
change
in
net
unrealized
gain/loss,
and
purchase
and
sales
cost
reflect
all
activity
for
the
period
then
ended.
Affiliate
Net
Realized
Gain
(Loss)
Change
in
Net
Unrealized
Gain/Loss
Investment
Income
T.
Rowe
Price
Government
Reserve
Fund,
4.53%
$
—
$
—
$
2,077++
Totals
$
—#
$
—
$
2,077+
Supplementary
Investment
Schedule
Affiliate
Value
12/31/23
Purchase
Cost
Sales
Cost
Value
12/31/24
T.
Rowe
Price
Government
Reserve
Fund,
4.53%
$
100,498
¤
¤
$
66,702
Total
$
66,702^
#
Capital
gain
distributions
from
underlying
Price
funds
represented
$0
of
the
net
realized
gain
(loss).
++
Excludes
earnings
on
securities
lending
collateral,
which
are
subject
to
rebates
and
fees
as
described
in
Note
4
.
+
Investment
income
comprised
$2,077
of
dividend
income
and
$0
of
interest
income.
¤
Purchase
and
sale
information
not
shown
for
cash
management
funds.
^
The
cost
basis
of
investments
in
affiliated
companies
was
$66,702.
T.
ROWE
PRICE
Dynamic
Credit
Fund
December
31,
2024
Statement
of
Assets
and
Liabilities
($000s,
except
shares
and
per
share
amounts)
Assets
Investments
in
securities,
at
value
(cost
$1,036,004)
$
1,028,286
Interest
and
dividends
receivable
14,031
Unrealized
gain
on
forward
currency
exchange
contracts
3,263
Receivable
for
investment
securities
sold
1,602
Receivable
for
shares
sold
731
Due
from
affiliates
430
Unrealized
gain
on
bilateral
swaps
334
Variation
margin
receivable
on
centrally
cleared
swaps
317
Foreign
currency
(cost
$287)
288
Other
assets
82
Total
assets
1,049,364
Liabilities
Obligation
to
return
securities
lending
collateral
21,693
Bilateral
swap
premiums
received
3,086
Unrealized
loss
on
forward
currency
exchange
contracts
1,637
Payable
for
investment
securities
purchased
1,534
Payable
for
shares
redeemed
647
Investment
management
fees
payable
431
Variation
margin
payable
on
futures
contracts
19
Payable
to
directors
1
Other
liabilities
4,427
Total
liabilities
33,475
Commitments
and
Contingent
Liabilities
(note
7
)
NET
ASSETS
$
1,015,889
T.
ROWE
PRICE
Dynamic
Credit
Fund
December
31,
2024
Statement
of
Assets
and
Liabilities
($000s,
except
shares
and
per
share
amounts)
The
accompanying
notes
are
an
integral
part
of
these
financial
statements.
Net
Assets
Consist
of:
Total
distributable
earnings
(loss)
$
(4,560)
Paid-in
capital
applicable
to
114,752,636
shares
of
$0.01
par
value
capital
stock
outstanding;
18,000,000,000
shares
of
the
Corporation
authorized
1,020,449
NET
ASSETS
$
1,015,889
NET
ASSET
VALUE
PER
SHARE
Investor
Class
(Net
assets:
$24,593;
Shares
outstanding:
2,775,489)
$
8.86
I
Class
(Net
assets:
$32,409;
Shares
outstanding:
3,660,060)
$
8.85
Z
Class
(Net
assets:
$958,887;
Shares
outstanding:
108,317,087)
$
8.85
T.
ROWE
PRICE
Dynamic
Credit
Fund
Year
Ended
12/31/24
Investment
Income
(Loss)
Income
.
Interest
(net
of
foreign
taxes
of
$55)
$
76,573
Dividend
2,802
Securities
lending
137
Total
income
79,512
Expenses
Investment
management
4,841
Shareholder
servicing
Investor
Class
$
51
I
Class
7
58
Prospectus
and
shareholder
reports
Investor
Class
7
I
Class
1
Z
Class
9
17
Custody
and
accounting
269
Legal
and
audit
52
Registration
42
Directors
3
Miscellaneous
56
Waived
/
paid
by
Price
Associates
(5,001)
Total
expenses
337
Net
investment
income
79,175
T.
ROWE
PRICE
Dynamic
Credit
Fund
The
accompanying
notes
are
an
integral
part
of
these
financial
statements.
Year
Ended
12/31/24
Realized
and
Unrealized
Gain
/
Loss
–
Net
realized
gain
(loss)
Securities
(net
of
foreign
taxes
of
$197)
35,736
Futures
(3,953)
Swaps
(10,499)
Options
written
3,512
Forward
currency
exchange
contracts
(5,298)
Foreign
currency
transactions
367
Net
realized
gain
19,865
Change
in
net
unrealized
gain
/
loss
Securities
(32,608)
Futures
4,267
Swaps
768
Options
written
(776)
Forward
currency
exchange
contracts
4,092
Other
assets
and
liabilities
denominated
in
foreign
currencies
(43)
Change
in
net
unrealized
gain
/
loss
(24,300)
Net
realized
and
unrealized
gain
/
loss
(4,435)
INCREASE
IN
NET
ASSETS
FROM
OPERATIONS
$
74,740
T.
ROWE
PRICE
Dynamic
Credit
Fund
Statement
of
Changes
in
Net
Assets
Year
.
.
.
.
.
.
.
.
.
.
.
.
.
.
Ended
.
.
.
.
.
.
.
.
.
.
.
.
.
.
12/31/24
12/31/23
Increase
(Decrease)
in
Net
Assets
Operations
Net
investment
income
$
79,175
$
14,716
Net
realized
gain
(loss)
19,865
(24,885)
Change
in
net
unrealized
gain
/
loss
(24,300)
17,698
Increase
in
net
assets
from
operations
74,740
7,529
Distributions
to
shareholders
Net
earnings
Investor
Class
(1,364)
(1,834)
I
Class
(2,124)
(656)
Z
Class
(68,291)
(11,355)
Decrease
in
net
assets
from
distributions
(71,779)
(13,845)
Capital
share
transactions
*
Shares
sold
Investor
Class
17,277
20,122
I
Class
13,819
29,431
Z
Class
115,044
859,238
Distributions
reinvested
Investor
Class
1,340
701
I
Class
2,101
648
Z
Class
68,404
11,501
Shares
redeemed
Investor
Class
(12,246)
(31,503)
I
Class
(12,989)
(6,083)
Z
Class
(88,702)
(4,221)
Increase
in
net
assets
from
capital
share
transactions
104,048
879,834
T.
ROWE
PRICE
Dynamic
Credit
Fund
Statement
of
Changes
in
Net
Assets
The
accompanying
notes
are
an
integral
part
of
these
financial
statements.
Year
.
.
.
.
.
.
.
.
.
.
.
.
.
.
Ended
.
.
.
.
.
.
.
.
.
.
.
.
.
.
12/31/24
12/31/23
Net
Assets
Increase
during
period
107,009
873,518
Beginning
of
period
908,880
35,362
End
of
period
$
1,015,889
$
908,880
*Share
information
(000s)
Shares
sold
Investor
Class
1,952
2,270
I
Class
1,564
3,314
Z
Class
13,041
96,750
Distributions
reinvested
Investor
Class
151
79
I
Class
238
73
Z
Class
7,738
1,303
Shares
redeemed
Investor
Class
(1,382)
(3,590)
I
Class
(1,470)
(685)
Z
Class
(10,033)
(482)
Increase
in
shares
outstanding
11,799
99,032
T.
ROWE
PRICE
Dynamic
Credit
Fund
NOTES
TO
FINANCIAL
STATEMENTS
T.
Rowe
Price
International
Funds,
Inc. (the
corporation) is
registered
under
the
Investment
Company
Act
of
1940
(the
1940
Act).
The
Dynamic
Credit
Fund
(the
fund)
is a
diversified, open-end
management
investment
company
established
by
the
corporation. The
fund
seeks total
return
through
a
combination
of
income
and
capital
appreciation.
The
fund
has three classes
of
shares:
the
Dynamic
Credit
Fund
(Investor
Class),
the
Dynamic
Credit
Fund–I
Class
(I
Class)
and
the
Dynamic
Credit
Fund–Z
Class
(Z
Class).
I
Class
shares
require
a
$500,000
initial
investment
minimum,
although
the
minimum
generally
is
waived
or
reduced
for
financial
intermediaries,
eligible
retirement
plans,
and
certain
other
accounts.
The
Z
Class
is
only
available
to
funds
advised
by
T.
Rowe
Price
Associates,
Inc.
and
its
affiliates
and
other
clients
that
are
subject
to
a
contractual
fee
for
investment
management
services. Each
class
has
exclusive
voting
rights
on
matters
related
solely
to
that
class;
separate
voting
rights
on
matters
that
relate
to
all
classes;
and,
in
all
other
respects,
the
same
rights
and
obligations
as
the
other
classes.
NOTE
1
-
SIGNIFICANT
ACCOUNTING
POLICIES
Basis
of
Preparation
The fund
is
an
investment
company
and
follows
accounting
and
reporting
guidance
in
the
Financial
Accounting
Standards
Board
(FASB)
Accounting
Standards
Codification
Topic
946
(ASC
946).
The
accompanying
financial
statements
were
prepared
in
accordance
with
accounting
principles
generally
accepted
in
the
United
States
of
America
(GAAP),
including,
but
not
limited
to,
ASC
946.
GAAP
requires
the
use
of
estimates
made
by
management.
Management
believes
that
estimates
and
valuations
are
appropriate;
however,
actual
results
may
differ
from
those
estimates,
and
the
valuations
reflected
in
the
accompanying
financial
statements
may
differ
from
the
value
ultimately
realized
upon
sale
or
maturity.
Investment
Transactions,
Investment
Income,
and
Distributions
Investment
transactions
are
accounted
for
on
the
trade
date
basis.
Income
and
expenses
are
recorded
on
the
accrual
basis.
Realized
gains
and
losses
are
reported
on
the
identified
cost
basis. Premiums
and
discounts
on
debt
securities
are
amortized
for
financial
reporting
purposes. Paydown
gains
and
losses
are
recorded
as
an
adjustment
to
interest
income. Inflation
adjustments
to
the
principal
amount
of
inflation-indexed
bonds
are
reflected
as
interest
income. Income
tax-related
interest
and
penalties,
if
incurred,
are
recorded
as
income
tax
expense. Dividends
received
from other
investment
T.
ROWE
PRICE
Dynamic
Credit
Fund
companies are
reflected
as
dividend income;
capital
gain
distributions
are
reflected
as
realized
gain/loss. Dividend
income and
capital
gain
distributions
are
recorded
on
the
ex-dividend
date. Earnings
on
investments
recognized
as
partnerships
for
federal
income
tax
purposes
reflect
the
tax
character
of
such
earnings. Non-cash
dividends,
if
any,
are
recorded
at
the
fair
market
value
of
the
asset
received. Proceeds
from
litigation
payments,
if
any,
are
included
in
either
net
realized
gain
(loss)
or
change
in
net
unrealized
gain/loss
from
securities. Distributions
to
shareholders
are
recorded
on
the
ex-dividend
date. Income
distributions,
if
any, are
declared
by
each
class daily
and
paid
monthly. A
capital
gain
distribution,
if
any, may
also
be
declared
and
paid
by
the
fund
annually.
Currency
Translation
Assets,
including
investments,
and
liabilities
denominated
in
foreign
currencies
are
translated
into
U.S.
dollar
values
each
day
at
the
prevailing
exchange
rate,
using
the
mean
of
the
bid
and
asked
prices
of
such
currencies
against
U.S.
dollars
as
provided
by
an
outside
pricing
service.
Purchases
and
sales
of
securities,
income,
and
expenses
are
translated
into
U.S.
dollars
at
the
prevailing
exchange
rate
on
the
respective
date
of
such
transaction.
The
effect
of
changes
in
foreign
currency
exchange
rates
on
realized
and
unrealized
security
gains
and
losses
is
not
bifurcated
from
the
portion
attributable
to
changes
in
market
prices.
Class
Accounting
Shareholder
servicing,
prospectus,
and
shareholder
report
expenses
incurred
by
each
class
are
charged
directly
to
the
class
to
which
they
relate.
Expenses
common
to
all
classes
and
investment
income
are
allocated
to
the
classes
based
upon
the
relative
daily
net
assets
of
each
class’s
settled
shares;
realized
and
unrealized
gains
and
losses
are
allocated
based
upon
the
relative
daily
net
assets
of
each
class’s
outstanding
shares.
Capital
Transactions
Each
investor’s
interest
in
the
net
assets
of the
fund
is
represented
by
fund
shares. The
fund’s
net
asset
value
(NAV)
per
share
is
computed
at
the
close
of
the
New
York
Stock
Exchange
(NYSE),
normally
4
p.m.
Eastern
time,
each
day
the
NYSE
is
open
for
business.
However,
the
NAV
per
share
may
be
calculated
at
a
time
other
than
the
normal
close
of
the
NYSE
if
trading
on
the
NYSE
is
restricted,
if
the
NYSE
closes
earlier,
or
as
may
be
permitted
by
the
SEC.
Purchases
and
redemptions
of
fund
shares
are
transacted
at
the
next-computed
NAV
per
share,
after
receipt
of
the
transaction
order
by
T.
Rowe
Price
Associates,
Inc.,
or
its
agents.
New
Accounting
Guidance
In December
2023,
the
FASB
issued
Accounting
Standards
Update
(ASU),
ASU
2023-09,
Income
Taxes
(Topic
740)
–
Improvements
to
Income
Taxes
Disclosures,
which
enhances
the
transparency
T.
ROWE
PRICE
Dynamic
Credit
Fund
of
income
tax
disclosures.
The
ASU
requires
public
entities,
on
an
annual
basis,
to
provide
disclosure
of
specific
categories
in
the
rate
reconciliation,
as
well
as
disclosure
of
income
taxes
paid
disaggregated
by
jurisdiction.
The
amendments
under
this
ASU
are
required
to
be
applied
prospectively
and
are
effective
for
fiscal
years
beginning
after
December
15,
2024.
Management
expects
that
adoption
of
the
guidance
will
not
have
a
material
impact
on
the
fund’s
financial
statements.
Indemnification
In
the
normal
course
of
business, the
fund
may
provide
indemnification
in
connection
with
its
officers
and
directors,
service
providers,
and/or
private
company
investments. The
fund’s
maximum
exposure
under
these
arrangements
is
unknown;
however,
the
risk
of
material
loss
is
currently
considered
to
be
remote.
NOTE
2
-
VALUATION
Fair
Value
The
fund’s
financial
instruments
are
valued
at
the
close
of
the
NYSE
and
are
reported
at
fair
value,
which
GAAP
defines
as
the
price
that
would
be
received
to
sell
an
asset
or
paid
to
transfer
a
liability
in
an
orderly
transaction
between
market
participants
at
the
measurement
date. The fund’s
Board
of
Directors
(the
Board)
has
designated
T.
Rowe
Price
Associates,
Inc.
as
the
fund’s
valuation
designee
(Valuation
Designee).
Subject
to
oversight
by
the
Board,
the
Valuation
Designee
performs
the
following
functions
in
performing
fair
value
determinations:
assesses
and
manages
valuation
risks;
establishes
and
applies
fair
value
methodologies;
tests
fair
value
methodologies;
and
evaluates
pricing
vendors
and
pricing
agents.
The
duties
and
responsibilities
of
the
Valuation
Designee
are
performed
by
its
Valuation
Committee. The
Valuation
Designee provides
periodic
reporting
to
the
Board
on
valuation
matters.
Various
valuation
techniques
and
inputs
are
used
to
determine
the
fair
value
of
financial
instruments.
GAAP
establishes
the
following
fair
value
hierarchy
that
categorizes
the
inputs
used
to
measure
fair
value:
Level
1
–
quoted
prices
(unadjusted)
in
active
markets
for
identical
financial
instruments
that
the
fund
can
access
at
the
reporting
date
T.
ROWE
PRICE
Dynamic
Credit
Fund
Level
2
–
inputs
other
than
Level
1
quoted
prices
that
are
observable,
either
directly
or
indirectly
(including,
but
not
limited
to,
quoted
prices
for
similar
financial
instruments
in
active
markets,
quoted
prices
for
identical
or
similar
financial
instruments
in
inactive
markets,
interest
rates
and
yield
curves,
implied
volatilities,
and
credit
spreads)
Level
3
–
unobservable
inputs
(including
the Valuation
Designee’s assumptions
in
determining
fair
value)
Observable
inputs
are
developed
using
market
data,
such
as
publicly
available
information
about
actual
events
or
transactions,
and
reflect
the
assumptions
that
market
participants
would
use
to
price
the
financial
instrument.
Unobservable
inputs
are
those
for
which
market
data
are
not
available
and
are
developed
using
the
best
information
available
about
the
assumptions
that
market
participants
would
use
to
price
the
financial
instrument.
GAAP
requires
valuation
techniques
to
maximize
the
use
of
relevant
observable
inputs
and
minimize
the
use
of
unobservable
inputs.
When
multiple
inputs
are
used
to
derive
fair
value,
the
financial
instrument
is
assigned
to
the
level
within
the
fair
value
hierarchy
based
on
the
lowest-level
input
that
is
significant
to
the
fair
value
of
the
financial
instrument.
Input
levels
are
not
necessarily
an
indication
of
the
risk
or
liquidity
associated
with
financial
instruments
at
that
level
but
rather
the
degree
of
judgment
used
in
determining
those
values.
Valuation
Techniques
Debt
securities
generally
are
traded
in
the over-the-
counter
(OTC)
market
and
are
valued
at
prices
furnished
by
independent
pricing
services
or
by
broker
dealers
who
make
markets
in
such
securities.
When
valuing
securities,
the
independent
pricing
services
consider
factors
such
as,
but
not
limited
to,
the
yield
or
price
of
bonds
of
comparable
quality,
coupon,
maturity,
and
type,
as
well
as
prices
quoted
by
dealers
who
make
markets
in
such
securities.
Equity
securities,
including
exchange-traded
funds, listed
or
regularly
traded
on
a
securities
exchange
or
in
the
over-the-counter
(OTC)
market
are
valued
at
the
last
quoted
sale
price
or,
for
certain
markets,
the
official
closing
price
at
the
time
the
valuations
are
made.
OTC
Bulletin
Board
securities
are
valued
at
the
mean
of
the
closing
bid
and
asked
prices.
A
security
that
is
listed
or
traded
on
more
than
one
exchange
is
valued
at
the
quotation
on
the
exchange
determined
to
be
the
primary
market
for
such
security.
Listed
securities
not
traded
on
a
particular
day
are
valued
at
the
mean
of
the
closing
bid
and
asked
prices
for
domestic
securities.
T.
ROWE
PRICE
Dynamic
Credit
Fund
Investments
in
mutual
funds
are
valued
at
the
mutual
fund’s
closing
NAV
per
share
on
the
day
of
valuation.
Investments
in
private
investment
companies
are
valued
at
the
investee’s
NAV
per
share
as
of
the
valuation
date,
if
available.
If
the
investee’s
NAV
is
not
available
as
of
the
valuation
date
or
is
not
calculated
in
accordance
with
GAAP,
the
Valuation Designee
may
adjust
the
investee’s
NAV
to
reflect
fair
value
at
the
valuation
date.
Listed
options,
and
OTC
options
with
a
listed
equivalent,
are
valued
at
the
mean
of
the
closing
bid
and
asked
prices
and
exchange-traded
options
on
futures
contracts
are
valued
at
closing
settlement
prices.
Futures
contracts
are
valued
at
closing
settlement
prices.
Forward
currency
exchange
contracts
are
valued
using
the
prevailing
forward
exchange
rate.
Swaps
are
valued
at
prices
furnished
by
an
independent
pricing
service
or
independent
swap
dealers.
Assets
and
liabilities
other
than
financial
instruments,
including
short-term
receivables
and
payables,
are
carried
at
cost,
or
estimated
realizable
value,
if
less,
which
approximates
fair
value.
Investments
for
which
market
quotations are
not
readily
available
or
deemed
unreliable
are
valued
at
fair
value
as
determined
in
good
faith
by
the
Valuation
Designee.
The
Valuation
Designee
has
adopted
methodologies
for
determining
the
fair
value
of
investments
for
which
market
quotations
are
not
readily
available
or
deemed
unreliable,
including
the
use
of
other
pricing
sources.
Factors
used
in
determining
fair
value
vary
by
type
of
investment
and
may
include
market
or
investment
specific
considerations.
The
Valuation
Designee typically
will
afford
greatest
weight
to
actual
prices
in
arm’s
length
transactions,
to
the
extent
they
represent
orderly
transactions
between
market
participants,
transaction
information
can
be
reliably
obtained,
and
prices
are
deemed
representative
of
fair
value.
However,
the
Valuation
Designee may
also
consider
other
valuation
methods
such
as
market-based
valuation
multiples;
a
discount
or
premium
from
market
value
of
a
similar,
freely
traded
security
of
the
same
issuer;
discounted
cash
flows;
yield
to
maturity;
or
some
combination.
Fair
value
determinations
are
reviewed
on
a
regular
basis.
Because
any
fair
value
determination
involves
a
significant
amount
of
judgment,
there
is
a
degree
of
subjectivity
inherent
in
such
pricing
decisions. Fair
value
prices
determined
by
the
Valuation
Designee could
differ
from
those
of
other
market
participants,
and
it
is
possible
that
the
fair
value
determined
for
a
security
may
be
materially
different
from
the
value
that
could
be
realized
upon
the
sale
of
that
security.
T.
ROWE
PRICE
Dynamic
Credit
Fund
Valuation
Inputs
The
following
table
summarizes
the
fund’s
financial
instruments,
based
on
the
inputs
used
to
determine
their
fair
values
on
December
31,
2024
(for
further
detail
by
category,
please
refer
to
the
accompanying
Portfolio
of
Investments):
($000s)
Level
1
Level
2
Level
3
Total
Value
Assets
Fixed
Income
Securities
1
$
—
$
299,075
$
—
$
299,075
Bank
Loans
—
124,000
21,127
145,127
Common
Stocks
—
—
18
18
Convertible
Preferred
Stocks
10,678
—
4,334
15,012
Corporate
Bonds
—
383,255
13,824
397,079
Non-U.S.
Government
Mortgage-Backed
Securities
—
20,372
5,031
25,403
Private
Investment
Company
2
—
—
—
31
Short-Term
Investments
45,009
76,270
—
121,279
Securities
Lending
Collateral
21,693
—
—
21,693
Options
Purchased
—
3,569
—
3,569
Total
Securities
77,380
906,541
44,334
1,028,286
Swaps*
—
4,486
—
4,486
Forward
Currency
Exchange
Contracts
—
3,263
—
3,263
Futures
Contracts*
947
—
—
947
Total
$
78,327
$
914,290
$
44,334
$
1,036,982
Liabilities
Swaps*
$
—
$
9,996
$
—
$
9,996
Forward
Currency
Exchange
Contracts
—
1,637
—
1,637
Futures
Contracts*
455
—
—
455
Total
$
455
$
11,633
$
—
$
12,088
1
Includes
Asset-Backed
Securities,
Convertible
Bonds,
Government
Bonds,
Municipal
Securities
and
U.S.
Government
&
Agency
Mortgage-Backed
Securities.
T.
ROWE
PRICE
Dynamic
Credit
Fund
Following
is
a
reconciliation
of
the
fund’s
Level
3
holdings
for
the
year ended
December
31,
2024.
Gain
(loss)
reflects
both
realized
and
change
in
unrealized
gain/loss
on
Level
3
holdings
during
the
period,
if
any,
and
is
included
on
the
accompanying
Statement
of
Operations.
The
change
in
unrealized
gain/loss
on
Level
3
instruments
held
at
December
31,
2024,
totaled $317,000 for
the
year ended
December
31,
2024.
In
accordance
with
GAAP,
the
following
table
provides
quantitative
information
about
significant
unobservable
inputs
used
to
determine
the
fair
valuations
of
the
fund’s
Level
3
assets,
by
class
of
financial
instrument.
Because
the
Valuation
Designee
considers
a
wide
variety
of
factors
and
inputs,
both
observable
and
unobservable,
in
determining
fair
values,
the
unobservable
inputs
presented
do
not
reflect
all
inputs
significant
to
the
fair
value
determination.
2
In
accordance
with
Subtopic
820-10,
certain
investments
that
are
measured
at
fair
value
using
the
net
asset
value
per
share
(or
its
equivalent)
practical
expedient
have
not
been
classified
in
the
fair
value
hierarchy.
The
fair
value
amounts
presented
in
this
table
are
intended
to
permit
reconciliation
of
the
fair
value
hierarchy
to
the
amounts
presented
in
the
Portfolio
of
Investments.
*
The
fair
value
presented
includes
cumulative
gain
(loss)
on
open
futures
contracts
and
centrally
cleared
swaps;
however,
the
net
value
reflected
on
the
accompanying
Portfolio
of
Investments
is
only
the
unsettled
variation
margin
receivable
(payable)
at
that
date.
($000s)
Beginning
Balance
12/31/23
Gain
(Loss)
During
Period
Total
Purchases
Total
Sales
Ending
Balance
12/31/24
Investment
in
Securities
Bank
Loans
$
—
$
—
$
21,143
$
(16)
$
21,127
Common
Stocks
16
2
—
—
18
Convertible
Preferred
Stocks
—
325
4,009
—
4,334
Corporate
Bonds
—
279
13,545
—
13,824
Non-U.S.
Government
Mortgage-Backed
Securities
—
—
5,340
(309)
5,031
Total
$
16
$
606
$
44,037
$
(325)
$
44,334
T.
ROWE
PRICE
Dynamic
Credit
Fund
+
Valuation
techniques
may
change
in
order
to
reflect the
Valuation
Designee’s
judgment
of
current
market
participant
assumptions.
*
Unobservable
inputs
were
weighted
by
the
relative
fair
value
of
the
instruments.
**
Represents
the
directional
change
in
the
fair
value
of
the
Level
3
investment(s)
that
would
have
resulted
from
an
increase
in
the
corresponding
input
at
period
end.
A
decrease
in
the
unobservable
input
would
have
had
the
opposite
effect.
Significant
increases
and
decreases
in
these
inputs
in
isolation
could
result
in
significantly
higher
or
lower
fair
value
measurements.
#
No
quantitative
unobservable
inputs
significant
to
the
valuation
technique
were
created
by
the
Valuation
Designee.
Investments
in
Securities
Value
(000s)
Valuation
Technique(s)+
Significant
Unobservable
Input(s)
Value
or
Range
of
Input(s)
Weighted
Average
of
Input(s)*
Impact
to
Valuation
from
an
Increase
in
Input**
Bank
Loans
$
21,127
Recent
comparable
transaction
price(s)
—#
—#
—#
—#
Common
Stocks
$
18
Recent
comparable
transaction
price(s)
—#
—#
—#
—#
Convertible
Preferred
Stocks
$
4,334
Recent
comparable
transaction
price(s)
—#
—#
—#
—#
Corporate
Bonds
$
13,824
Recent
comparable
transaction
price(s)
—#
—#
—#
—#
Market
comparable
Relative
value
—#
—#
—#
Non-U.S.
Government
Mortgage-
Backed
Securities
$
5,031
Recent
comparable
transaction
price(s)
—#
—#
—#
—#
T.
ROWE
PRICE
Dynamic
Credit
Fund
NOTE
3
-
DERIVATIVE
INSTRUMENTS
During
the
year ended
December
31,
2024,
the
fund
invested
in
derivative
instruments.
As
defined
by
GAAP,
a
derivative
is
a
financial
instrument
whose
value
is
derived
from
an
underlying
security
price,
foreign
exchange
rate,
interest
rate,
index
of
prices
or
rates,
or
other
variable;
it
requires
little
or
no
initial
investment
and
permits
or
requires
net
settlement
or
delivery
of
cash
or
other
assets.
The
fund
invests
in
derivatives
only
if
the
expected
risks
and
rewards
are
consistent
with
its
investment
objectives,
policies,
and
overall
risk
profile,
as
described
in
its
prospectus
and
Statement
of
Additional
Information.
The
fund
may
use
derivatives
for
a
variety
of
purposes
and
may
use
them
to
establish
both
long
and
short
positions
within
the
fund’s
portfolio.
Potential
uses
include
to
hedge
against
declines
in
principal
value,
increase
yield,
invest
in
an
asset
with
greater
efficiency
and
at
a
lower
cost
than
is
possible
through
direct
investment,
to
enhance
return,
or
to
adjust
portfolio
duration
and
credit
exposure.
The
risks
associated
with
the
use
of
derivatives
are
different
from,
and
potentially
much
greater
than,
the
risks
associated
with
investing
directly
in
the
instruments
on
which
the
derivatives
are
based.
The
fund
values
its
derivatives
at
fair
value
and
recognizes
changes
in
fair
value
currently
in
its
results
of
operations.
Accordingly,
the
fund
does
not
follow
hedge
accounting,
even
for
derivatives
employed
as
economic
hedges.
Generally,
the
fund
accounts
for
its
derivatives
on
a
gross
basis.
It
does
not
offset
the
fair
value
of
derivative
liabilities
against
the
fair
value
of
derivative
assets
on
its
financial
statements,
nor
does
it
offset
the
fair
value
of
derivative
instruments
against
the
right
to
reclaim
or
obligation
to
return
collateral.
The
following
table
summarizes
the
fair
value
of
the
fund’s
derivative
instruments
held
as
of
December
31,
2024,
and
the
related
location
on
the
accompanying
Statement
of
Assets
and
Liabilities,
presented
by
primary
underlying
risk
exposure:
T.
ROWE
PRICE
Dynamic
Credit
Fund
($000s)
Location
on
Statement
of
Assets
and
Liabilities
Fair
Value*
Assets
Interest
rate
derivatives
Centrally
Cleared
Swaps,
Futures,
Securities^
$
6,443
Foreign
exchange
derivatives
Forwards
3,263
Credit
derivatives
Centrally
Cleared
Swaps,
Securities^
1,263
Equity
derivatives
Securities^
1,296
^
,*
Total
$
12,265
^
,*
Liabilities
Inflation
derivatives
Centrally
Cleared
Swaps
$
1,413
Interest
rate
derivatives
Centrally
Cleared
Swaps,
Futures
2,176
Foreign
exchange
derivatives
Forwards
1,637
Credit
derivatives
Bilateral
Swaps
and
Premiums,
Centrally
Cleared
Swaps
6,862
Total
$
12,088
*
The
fair
value
presented
includes
cumulative
gain
(loss)
on
open
futures
contracts
and
centrally
cleared
swaps;
however,
the
value
reflected
on
the
accompanying
Statement
of
Assets
and
Liabilities
is
only
the
unsettled
variation
margin
receivable
(payable)
at
that
date.
^
Options
purchased
are
reported
as
securities
and
are
reflected
in
the
accompanying
Portfolio
of
Investments.
T.
ROWE
PRICE
Dynamic
Credit
Fund
Additionally,
the
amount
of
gains
and
losses
on
derivative
instruments
recognized
in
fund
earnings
during
the
year ended
December
31,
2024,
and
the
related
location
on
the
accompanying
Statement
of
Operations
is
summarized
in
the
following
table
by
primary
underlying
risk
exposure:
($000s)
Location
of
Gain
(Loss)
on
Statement
of
Operations
Securities^
Options
Written
Futures
Forward
Currency
Exchange
Contracts
Swaps
Total
Realized
Gain
(Loss)
Inflation
derivatives
$
—
$
—
$
—
$
—
$
1,243
$
1,243
Interest
rate
derivatives
5,634
760
(3,934)
—
(6,391)
(3,931)
Foreign
exchange
derivatives
(1,439)
643
—
(5,298)
—
(6,094)
Credit
derivatives
(2,588)
(524)
—
—
(5,351)
(8,463)
Equity
derivatives
(3,229)
2,633
(19)
—
—
(615)
Total
$
(1,622)
$
3,512
$
(3,953)
$
(5,298)
$
(10,499)
$
(17,860)
T.
ROWE
PRICE
Dynamic
Credit
Fund
Counterparty
Risk
and
Collateral
The
fund
invests
in
derivatives
in
various
markets,
which
expose
it
to
differing
levels
of
counterparty
risk.
Counterparty
risk
on
exchange-traded
and
centrally
cleared
derivative
contracts,
such
as
futures,
exchange-traded
options,
and
centrally
cleared
swaps,
is
minimal
because
the
clearinghouse
provides
protection
against
counterparty
defaults.
For
futures
and
centrally
cleared
swaps,
the
fund
is
required
to
deposit
collateral
in
an
amount
specified
by
the
clearinghouse
and
the
clearing
firm
(margin
requirement),
and
the
margin
requirement
must
be
maintained
over
the
life
of
the
contract.
Each
clearinghouse
and
clearing
firm,
in
its
sole
discretion,
may
adjust
the
margin
requirements
applicable
to
the
fund.
Derivatives,
such
as
non-cleared bilateral
swaps,
forward
currency
exchange
contracts,
and
OTC
options,
that
are
transacted
and
settle
directly
with
a
counterparty
(bilateral
derivatives)
may
expose
the
fund
to
greater
counterparty
risk.
To
mitigate
this
risk,
the
fund
has
entered
into
master
netting
arrangements
(MNAs)
with
certain
counterparties
that
permit
net
settlement
under
specified
conditions
and,
for
certain
counterparties,
also
require
the
exchange
of
collateral
($000s)
Location
of
Gain
(Loss)
on
Statement
of
Operations
Securities^
Options
Written
Futures
Forward
Currency
Exchange
Contracts
Swaps
Total
Change
in
Unrealized
Gain
(Loss)
Inflation
derivatives
$
—
$
—
$
—
$
—
$
(634)
$
(634)
Interest
rate
derivatives
(137)
—
4,142
—
3,384
7,389
Foreign
exchange
derivatives
527
—
—
4,092
—
4,619
Credit
derivatives
(278)
—
—
—
(1,982)
(2,260)
Equity
derivatives
1,223
(776)
125
—
—
572
Total
$
1,335
$
(776)
$
4,267
$
4,092
$
768
$
9,686
^
Options
purchased
are
reported
as
securities.
T.
ROWE
PRICE
Dynamic
Credit
Fund
to
cover
mark-to-market
exposure.
MNAs
may
be
in
the
form
of
International
Swaps
and
Derivatives
Association
master
agreements
(ISDAs)
or
foreign
exchange
letter
agreements
(FX
letters).
MNAs
provide
the
ability
to
offset
amounts
the
fund
owes
a
counterparty
against
amounts
the
counterparty
owes
the
fund
(net
settlement).
Both
ISDAs
and
FX
letters
generally
allow
termination
of
transactions
and
net
settlement
upon
the
occurrence
of
contractually
specified
events,
such
as
failure
to
pay
or
bankruptcy.
In
addition,
ISDAs
specify
other
events,
the
occurrence
of
which
would
allow
one
of
the
parties
to
terminate.
For
example,
a
downgrade
in
credit
rating
of
a
counterparty
below
a
specified
rating
would
allow
the
fund
to
terminate,
while
a
decline
in
the
fund’s
net
assets
of
more
than
a
specified
percentage
would
allow
the
counterparty
to
terminate.
Upon
termination,
all
transactions
with
that
counterparty
would
be
liquidated
and
a
net
termination
amount
settled.
ISDAs
typically
include
collateral
agreements
whereas
FX
letters
do
not.
Collateral
requirements
are
determined
daily
based
on
the
net
aggregate
unrealized
gain
or
loss
on
all
bilateral
derivatives
with
a
counterparty,
subject
to
minimum
transfer
amounts
that
typically
range
from
$100,000
to
$250,000.
Any
additional
collateral
required
due
to
changes
in
security
values
is
typically
transferred
the
next
business
day.
Collateral
may
be
in
the
form
of
cash
or
debt
securities
issued
by
the
U.S.
government
or
related
agencies,
although
other
securities
may
be
used
depending
on
the
terms
outlined
in
the
applicable
MNA.
Cash
posted
by
the
fund
is
reflected
as
cash
deposits
in
the
accompanying
financial
statements
and
generally
is
restricted
from
withdrawal
by
the
fund;
securities
posted
by
the
fund
are
so
noted
in
the
accompanying
Portfolio
of
Investments;
both
remain
in
the
fund’s
assets.
Collateral
pledged
by
counterparties
is
not
included
in
the
fund’s
assets
because
the
fund
does
not
obtain
effective
control
over
those
assets.
For
bilateral
derivatives,
collateral
posted
by
the
fund
is
held
in
a
segregated
account
at
the
fund’s
custodian.
While
typically
not
sold
in
the
same
manner
as
equity
or
fixed
income
securities,
exchange-traded
or
centrally
cleared
derivatives
may
be
closed
out
only
on
the
exchange
or
clearinghouse
where
the
contracts
were
cleared,
and
OTC
and
bilateral
derivatives
may
be
unwound
with
counterparties
or
transactions
assigned
to
other
counterparties
to
allow
the
fund
to
exit
the
transaction.
This
ability
is
subject
to
the
liquidity
of
underlying
positions. As
of
December
31,
2024,
securities
valued
at $35,958,000
had
been
posted
by
the
fund
for
exchange-traded
and/or
centrally
cleared
derivatives.
T.
ROWE
PRICE
Dynamic
Credit
Fund
The
following
table
summarizes
the
fund’s
OTC
and
bilateral
derivatives
at
the
reporting
date
by
loss
exposure
to
each
counterparty
after
consideration
of
collateral,
if
any.
Forward
Currency
Exchange
Contracts
The
fund
is
subject
to
foreign
currency
exchange
rate
risk
in
the
normal
course
of
pursuing
its
investment
objectives.
It may use
forward
currency
exchange
contracts
(forwards)
primarily
to
protect
its
non-U.S.
dollar-denominated
securities
from
adverse
currency
movements
or
to
increase
exposure
to
a
particular
foreign
currency,
to
shift
the
fund’s
foreign
currency
exposure
from
one
country
to
another,
or
to
enhance
the
fund’s
return.
A
forward
involves
an
obligation
to
purchase
or
sell
a
fixed
($000s)
Gross
Value
on
Statements
of
Assets
and
Liabilities
Net
amount
due
(to)/from
Counterparty
or
Exchange
Collateral
Pledged
(Received)
by
Fund
Loss
Exposure,
After
Collateral*
(not
less
than
$0)
Counterparty
Assets
Liabilities
Bank
of
America
$
63
$
(4)
$
59
$
—
$
59
Barclays
Bank
1,116
(194)
922
—
922
BNY
Mellon
82
(195)
(113)
—
—
Canadian
Imperial
Bank
of
Commerce
—
(42)
(42)
—
—
Citibank
25
(9)
16
—
16
Deutsche
Bank
510
(357)
153
—
153
Goldman
Sachs
82
(1,209)
(1,127)
1,116
—
HSBC
Bank
15
(11)
4
—
4
JPMorgan
Chase
82
(5)
77
—
77
Morgan
Stanley
2,575
(1,635)
940
(1,191)
—
RBC
Dominion
Securities
10
—
10
—
10
Standard
Chartered
186
(254)
(68)
—
—
State
Street
4
(370)
(366)
286
—
Toronto-Dominion
Bank
442
(104)
338
—
338
UBS
Investment
Bank
1,559
—
1,559
(1,470)
89
Wells
Fargo
81
—
81
(240)
—
Total
$
6,832
$
(4,389)
*
In
situations
such
as
counterparty
default
or
bankruptcy,
the
fund
may
have
further
rights
of
offset
against
amounts
due
to
or
from
the
counterparty
under
other
agreements.
T.
ROWE
PRICE
Dynamic
Credit
Fund
amount
of
a
specific
currency
on
a
future
date
at
a
price
set
at
the
time
of
the
contract.
Although
certain
forwards
may
be
settled
by
exchanging
only
the
net
gain
or
loss
on
the
contract,
most
forwards
are
settled
with
the
exchange
of
the
underlying
currencies
in
accordance
with
the
specified
terms.
Forwards
are
valued
at
the
unrealized
gain
or
loss
on
the
contract,
which
reflects
the
net
amount
the
fund
either
is
entitled
to
receive
or
obligated
to
deliver,
as
measured
by
the
difference
between
the
forward
exchange
rates
at
the
date
of
entry
into
the
contract
and
the
forward
rates
at
the
reporting
date.
Appreciated
forwards
are
reflected
as
assets
and
depreciated
forwards
are
reflected
as
liabilities
on
the
accompanying
Statement
of
Assets
and
Liabilities.
When
a
contract
is
closed,
a
realized
gain
or
loss
is
recorded
on
the
accompanying
Statement
of
Operations.
Risks
related
to
the
use
of
forwards
include
the
possible
failure
of
counterparties
to
meet
the
terms
of
the
agreements;
that
anticipated
currency
movements
will
not
occur,
thereby
reducing
the
fund’s
total
return;
and
the
potential
for
losses
in
excess
of
the
fund’s
initial
investment.
During
the
year ended
December
31,
2024,
the
volume
of
the
fund’s
activity
in
forwards,
based
on
underlying
notional
amounts,
was
generally
between
3%
and
19%
of
net
assets.
Futures
Contracts
The
fund
is
subject
to interest
rate
risk
and
equity
price
risk in
the
normal
course
of
pursuing
its
investment
objectives
and
uses
futures
contracts
to
help
manage
such
risks.
The fund
may
enter
into
futures
contracts
to
manage
exposure
to
interest
rate
and
yield
curve
movements,
security
prices,
foreign
currencies,
and
mortgage
prepayments;
as
an
efficient
means
of
adjusting
exposure
to
all
or
part
of
a
target
market;
as
a
cash
management
tool;
or
to
adjust
portfolio
duration. A
futures
contract
provides
for
the
future
sale
by
one
party
and
purchase
by
another
of
a
specified
amount
of
a
specific
underlying
financial
instrument
at
an
agreed-upon
price,
date,
time,
and
place.
The
fund
currently
invests
only
in
exchange-traded
futures,
which
generally
are
standardized
as
to
maturity
date,
underlying
financial
instrument,
and
other
contract
terms.
Payments
are
made
or
received
by
the
fund
each
day
to
settle
daily
fluctuations
in
the
value
of
the
contract
(variation
margin),
which
reflect
changes
in
the
value
of
the
underlying
financial
instrument.
Variation
margin
is
recorded
as
unrealized
gain
or
loss
until
the
contract
is
closed.
The
value
of
a
futures
contract
included
in
net
assets
is
the
amount
of
unsettled
variation
margin;
net
variation
margin
receivable
is
reflected
as
an
asset
and
net
variation
margin
payable
is
reflected
as
a
liability
on
the
accompanying
Statement
of
Assets
and
Liabilities.
When
a
contract
is
closed,
a
realized
gain
or
loss
is
recorded
on
the
accompanying
Statement
of
Operations.
Risks
related
to
the
use
of
futures
contracts
include
possible
illiquidity
of
the
futures
T.
ROWE
PRICE
Dynamic
Credit
Fund
markets,
contract
prices
that
can
be
highly
volatile
and
imperfectly
correlated
to
movements
in
hedged
security
values
and/or
interest
rates,
and
potential
losses
in
excess
of
the
fund’s
initial
investment.
During
the
year ended
December
31,
2024,
the
volume
of
the
fund’s
activity
in
futures,
based
on
underlying
notional
amounts,
was
generally
between
7%
and
30%
of
net
assets.
Options
The
fund
is
subject
to interest
rate
risk,
foreign
currency
exchange
rate
risk,
credit
risk
and
equity
price
risk in
the
normal
course
of
pursuing
its
investment
objectives
and
uses
options
to
help
manage
such
risks.
The
fund
may
use
options
to
manage
exposure
to
security
prices,
interest
rates,
foreign
currencies,
and
credit
quality;
as
an
efficient
means
of
adjusting
exposure
to
all
or
a
part
of
a
target
market;
to
enhance
income;
as
a
cash
management
tool;
or
to
adjust
credit
exposure.
The
fund
may
buy
or
sell
options
that
can
be
settled
either
directly
with
the
counterparty
(OTC
option)
or
through
a
central
clearinghouse
(exchange-traded
option).
Options
are
included
in
net
assets
at
fair
value,
options
purchased
are
included
in
Investments
in
Securities,
and
options
written
are
separately
reflected
as
a
liability
on
the
accompanying
Statement
of
Assets
and
Liabilities.
Premiums
on
unexercised,
expired
options
are
recorded
as
realized
gains
or
losses
on
the
accompanying
Statement
of
Operations;
premiums
on
exercised
options
are
recorded
as
an
adjustment
to
the
proceeds
from
the
sale
or
cost
of
the
purchase.
The
difference
between
the
premium
and
the
amount
received
or
paid
in
a
closing
transaction
is
also
treated
as
realized
gain
or
loss
on
the
accompanying
Statement
of
Operations.
In
return
for
a
premium
paid,
call
and
put
options
give
the
holder
the
right,
but
not
the
obligation,
to
purchase
or
sell,
respectively,
a
security
at
a
specified
exercise
price.
In
return
for
a
premium
paid,
currency
options
give
the
holder
the
right,
but
not
the
obligation,
to
buy
and
sell
currency
at
a
specified
exchange
rate;
although
certain
currency
options
may
be
settled
by
exchanging
only
the
net
gain
or
loss
on
the
contract.
In
return
for
a
premium
paid,
call
and
put
options
on
futures
give
the
holder
the
right,
but
not
the
obligation,
to
purchase
or
sell,
respectively,
a
position
in
a
particular
futures
contract
at
a
specified
exercise
price.
In
return
for
a
premium
paid,
call
and
put
index
options
give
the
holder
the
right,
but
not
the
obligation,
to
receive
cash
equal
to
the
difference
between
the
value
of
the
reference
index
on
the
exercise
date
and
the
exercise
price
of
the
option.
In
return
for
a
premium
paid,
options
on
swaps
give
the
holder
the
right,
but
not
the
obligation,
to
enter
a
specified
swap
contract
on
predefined
terms.
The
exercise
price
of
an
option
on
a
credit
default
swap
is
stated
in
terms
of
a
specified
spread
that
represents
the
cost
of
credit
protection
on
the
reference
asset,
including
both
the
upfront
premium
to
open
the
position
and
future
periodic
payments.
The
exercise
price
of
an
interest
rate
swap
is
stated
T.
ROWE
PRICE
Dynamic
Credit
Fund
in
terms
of
a
fixed
interest
rate;
generally,
there
is
no
upfront
payment
to
open
the
position. Risks related
to
the
use
of
options
include
possible
illiquidity
of
the
options
markets;
trading
restrictions
imposed
by
an
exchange
or
counterparty;
possible
failure
of
counterparties
to
meet
the
terms
of
the
agreements;
movements
in
the
underlying
asset
values,
interest
rates,
currency
values
and
credit
ratings;
and,
for
options
written,
the
potential
for
losses
to
exceed
any
premium
received
by
the
fund.
During
the
year ended
December
31,
2024,
the
volume
of
the
fund’s
activity
in
options,
based
on
underlying
notional
amounts,
was
generally
between
39%
and
159%
of
net
assets.
Swaps
The
fund
is
subject
to
interest
rate
risk,
credit
risk
and
inflation
risk in
the
normal
course
of
pursuing
its
investment
objectives
and
uses
swap
contracts
to
help
manage
such
risks.
The
fund
may
use
swaps
in
an
effort
to
manage
both
long
and
short
exposure
to
changes
in
interest
rates,
inflation
rates,
and
credit
quality;
to
adjust
overall
exposure
to
certain
markets;
to
enhance
total
return
or
protect
the
value
of
portfolio
securities;
to
serve
as
a
cash
management
tool;
or
to
adjust
portfolio
duration
and
credit
exposure.
Swap
agreements
can
be
settled
either
directly
with
the
counterparty
(bilateral
swap)
or
through
a
central
clearinghouse
(centrally
cleared
swap).
Fluctuations
in
the
fair
value
of
a
contract
are
reflected
in
unrealized
gain
or
loss
and
are
reclassified
to
realized
gain
or
loss
on
the
accompanying
Statement
of
Operations upon
contract
termination
or
cash
settlement.
Net
periodic
receipts
or
payments
required
by
a
contract
increase
or
decrease,
respectively,
the
value
of
the
contract
until
the
contractual
payment
date,
at
which
time
such
amounts
are
reclassified
from
unrealized
to
realized
gain
or
loss
on
the
accompanying
Statement
of
Operations.
For
bilateral
swaps,
cash
payments
are
made
or
received
by
the
fund
on
a
periodic
basis
in
accordance
with
contract
terms;
unrealized
gain
on
contracts
and
premiums
paid
are
reflected
as
assets
and
unrealized
loss
on
contracts
and
premiums
received
are
reflected
as
liabilities
on
the
accompanying
Statement
of
Assets
and
Liabilities.
For
bilateral
swaps,
premiums
paid
or
received
are
amortized
over
the
life
of
the
swap
and
are
recognized
as
realized
gain
or
loss
on
the
accompanying
Statement
of
Operations.
For
centrally
cleared
swaps,
payments
are
made
or
received
by
the
fund
each
day
to
settle
the
daily
fluctuation
in
the
value
of
the
contract
(variation
margin).
Accordingly,
the
value
of
a
centrally
cleared
swap
included
in
net
assets
is
the
unsettled
variation
margin;
net
variation
margin
receivable
is
reflected
as
an
asset
and
net
variation
margin
payable
is
reflected
as
a
liability
on
the
accompanying
Statement
of
Assets
and
Liabilities.
T.
ROWE
PRICE
Dynamic
Credit
Fund
Interest
rate
swaps
are
agreements
to
exchange
cash
flows
based
on
the
difference
between
specified
interest
rates
applied
to
a
notional
principal
amount
for
a
specified
period
of
time.
Risks
related
to
the
use
of
interest
rate
swaps
include
the
potential
for
unanticipated
movements
in
interest
or
currency
rates,
the
possible
failure
of
a
counterparty
to
perform
in
accordance
with
the
terms
of
the
swap
agreements,
potential
government
regulation
that
could
adversely
affect
the
fund’s
swap
investments,
and
potential
losses
in
excess
of
the
fund’s
initial
investment.
Credit
default
swaps
are
agreements
where
one
party
(the
protection
buyer)
agrees
to
make
periodic
payments
to
another
party
(the
protection
seller)
in
exchange
for
protection
against
specified
credit
events,
such
as
certain
defaults
and
bankruptcies
related
to
an
underlying
credit
instrument,
or
issuer
or
index
of
such
instruments.
Upon
occurrence
of
a
specified
credit
event,
the
protection
seller
is
required
to
pay
the
buyer
the
difference
between
the
notional
amount
of
the
swap
and
the
value
of
the
underlying
credit,
either
in
the
form
of
a
net
cash
settlement
or
by
paying
the
gross
notional
amount
and
accepting
delivery
of
the
relevant
underlying
credit.
For
credit
default
swaps
where
the
underlying
credit
is
an
index,
a
specified
credit
event
may
affect
all
or
individual
underlying
securities
included
in
the
index
and
will
be
settled
based
upon
the
relative
weighting
of
the
affected
underlying
security(ies)
within
the
index. Generally,
the
payment
risk
for
the
seller
of
protection
is
inversely
related
to
the
current
market
price
or
credit
rating
of
the
underlying
credit
or
the
market
value
of
the
contract
relative
to
the
notional
amount,
which
are
indicators
of
the
markets’
valuation
of
credit
quality.
As
of
December
31,
2024,
the
notional
amount
of
protection
sold
by
the
fund
totaled $49,568,000
(4.9%
of
net
assets),
which
reflects
the
maximum
potential
amount
the
fund
could
be
required
to
pay
under
such
contracts.
Risks
related
to
the
use
of
credit
default
swaps
include
the
possible
inability
of
the
fund
to
accurately
assess
the
current
and
future
creditworthiness
of
underlying
issuers,
the
possible
failure
of
a
counterparty
to
perform
in
accordance
with
the
terms
of
the
swap
agreements,
potential
government
regulation
that
could
adversely
affect
the
fund’s
swap
investments,
and
potential
losses
in
excess
of
the
fund’s
initial
investment.
Zero-coupon
inflation
swaps
are
agreements
to
exchange
cash
flows,
on
the
contract’s
maturity
date,
based
on
the
difference
between
a
predetermined
fixed
rate
and
the
cumulative
change
in
the
consumer
price
index,
both
applied
to
a
notional
principal
amount
for
a
specified
period
of
time.
Risks
related
to
the
use
of
zero-coupon
inflation
swaps
include
the
potential
for
unanticipated
movements
in
inflation
rates,
the
possible
failure
of
a
counterparty
to
perform
T.
ROWE
PRICE
Dynamic
Credit
Fund
in
accordance
with
the
terms
of
the
swap
agreements,
potential
government
regulation
that
could
adversely
affect
the
fund’s
swap
investments,
and
potential
losses
in
excess
of
the
fund’s
initial
investment.
Total
return
swaps
are
agreements
in
which
one
party
makes
payments
based
on
a
set
rate,
either
fixed
or
variable,
while
the
other
party
makes
payments
based
on
the
return
of
an
underlying
asset
(reference
asset),
such
as
an
index,
equity
security,
fixed
income
security
or
commodity-based
exchange-
traded
fund,
which
includes
both
the
income
it
generates
and
any
change
in
its
value.
Risks
related
to
the
use
of
total
return
swaps
include
the
potential
for
unfavorable
changes
in
the
reference
asset,
the
possible
failure
of
a
counterparty
to
perform
in
accordance
with
the
terms
of
the
swap
agreements,
potential
government
regulation
that
could
adversely
affect
the
fund’s
swap
investments,
and
potential
losses
in
excess
of
the
fund’s
initial
investment.
During
the
year ended
December
31,
2024,
the
volume
of
the
fund’s
activity
in
swaps,
based
on
underlying
notional
amounts,
was
generally
between
57%
and
135%
of
net
assets.
NOTE
4
-
OTHER
INVESTMENT
TRANSACTIONS
Consistent
with
its
investment
objective, the
fund
engages
in
the
following
practices
to
manage
exposure
to
certain
risks
and/or
to
enhance
performance.
The
investment
objective,
policies,
program,
and
risk
factors
of the
fund
are
described
more
fully
in the
fund’s prospectus
and
Statement
of
Additional
Information.
Emerging
and
Frontier
Markets
The fund
invests,
either
directly
or
through
investments
in
other
T.
Rowe
Price
funds,
in
securities
of
companies
located
in,
issued
by
governments
of,
or
denominated
in
or
linked
to
the
currencies
of
emerging
and
frontier
market
countries.
Emerging
markets,
and
to
a
greater
extent
frontier
markets, tend
to
have
economic
structures
that
are
less
diverse
and
mature,
less
developed
legal
and
regulatory
regimes,
and
political
systems
that
are
less
stable,
than
those
of
developed
countries.
These
markets
may
be
subject
to
greater
political,
economic,
and
social
uncertainty
and
differing
accounting
standards
and
regulatory
environments
that
may
potentially
impact
the
fund’s
ability
to
buy
or
sell
certain
securities
or
repatriate
proceeds
to
U.S.
dollars.
Emerging
markets
securities
exchanges
are
more
likely
to
experience
delays
with
the
clearing
and
settling
of
trades,
as
well
as
the
custody
of
holdings
by
local
banks,
agents,
and
depositories.
Such
securities
are
often
subject
T.
ROWE
PRICE
Dynamic
Credit
Fund
to
greater
price
volatility,
less
liquidity,
and
higher
rates
of
inflation
than
U.S.
securities.
Investing
in
frontier
markets
is
typically
significantly
riskier
than
investing
in
other
countries,
including
emerging
markets.
Noninvestment-Grade
Debt
The
fund
invests,
either
directly
or
through
its
investment
in
other
T.
Rowe
Price
funds,
in
noninvestment-grade
debt,
including
“high
yield”
or
“junk”
bonds
or
leveraged
loans.
Noninvestment-grade
debt
issuers
are
more
likely
to
suffer
an
adverse
change
in
financial
condition
that
would
result
in
the
inability
to
meet
a
financial
obligation.
The
noninvestment-
grade
debt
market
may
experience
sudden
and
sharp
price
swings
due
to
a
variety
of
factors
that
may
decrease
the
ability
of
issuers
to
make
principal
and
interest
payments
and
adversely
affect
the
liquidity
or
value,
or
both,
of
such
securities.
Accordingly,
securities
issued
by
such
companies
carry
a
higher
risk
of
default
and
should
be
considered
speculative.
Restricted
Securities
The
fund
invests
in
securities
that
are
subject
to
legal
or
contractual
restrictions
on
resale.
Prompt
sale
of
such
securities
at
an
acceptable
price
may
be
difficult
and
may
involve
substantial
delays
and
additional
costs.
Collateralized
Loan
Obligations
The
fund
invests
in
collateralized
loan
obligations
(CLOs)
which
are
entities
backed
by
a
diversified
pool
of
syndicated
bank
loans.
The
cash
flows
of
the
CLO
can
be
split
into
multiple
segments,
called
“tranches”
or
“classes”,
which
will
vary
in
risk
profile
and
yield.
The
riskiest
segments,
which
are
the
subordinate
or
“equity”
tranches,
bear
the
greatest
risk
of
loss
from
defaults
in
the
underlying
assets
of
the
CLO
and
serve
to
protect
the
other,
more
senior,
tranches.
Senior
tranches
will
typically
have
higher
credit
ratings
and
lower
yields
than
the
securities
underlying
the
CLO.
Despite
the
protection
from
the
more
junior
tranches,
senior
tranches
can
experience
substantial
losses.
Mortgage-Backed
Securities
The
fund
invests
in
mortgage-backed
securities
(MBS
or
pass-through
certificates)
that
represent
an
interest
in
a
pool
of
specific
underlying
mortgage
loans
and
entitle
the
fund
to
the
periodic
payments
of
principal
and
interest
from
those
mortgages.
MBS
may
be
issued
by
government
agencies
or
corporations,
or
private
issuers.
Most
MBS
issued
by
government
agencies
are
guaranteed;
however,
the
degree
of
protection
differs
based
on
the
issuer.
The
fund
also
invests
in
stripped
MBS,
created
when
a
traditional
MBS
is
split
into
an
interest-only
(IO)
and
a
principal-only
(PO)
strip.
MBS,
including
IOs
and
POs, are
sensitive
to
changes
in
economic
conditions
that
affect
the
rate
of
prepayments
and
defaults
on
the
underlying
mortgages;
T.
ROWE
PRICE
Dynamic
Credit
Fund
accordingly,
the
value,
income,
and
related
cash
flows
from
MBS
may
be
more
volatile
than
other
debt
instruments.
IOs
also
risk
loss
of
invested
principal
from
faster-than-anticipated
prepayments.
Bank
Loans
The
fund
invests
in
bank
loans,
which
represent
an
interest
in
amounts
owed
by
a
borrower
to
a
syndicate
of
lenders.
Bank
loans
are
generally
noninvestment
grade
and
often
involve
borrowers
whose
financial
condition
is
highly
leveraged.
The
fund
may
invest
in
fixed
and
floating
rate
loans,
which
may
include
senior
floating
rate
loans;
secured
and
unsecured
loans,
second
lien
or
more
junior
loans;
and
bridge
loans
or
bridge
facilities.
Certain
bank
loans
may
be
revolvers
which
are
a
form
of
senior
bank
debt,
where
the
borrower
can
draw
down
the
credit
of
the
revolver
when
it
needs
cash
and
repays
the
credit
when
the
borrower
has
excess
cash.
Certain
loans
may
be
“covenant-lite”
loans,
which
means
the
loans
contain
fewer
maintenance
covenants
than
other
loans
(in
some
cases,
none)
and
do
not
include
terms
which
allow
the
lender
to
monitor
the
performance
of
the
borrower
and
declare
a
default
if
certain
criteria
are
breached.
As
a
result
of
these
risks,
the
fund’s
exposure
to
losses
may
be
increased.
Bank
loans
may
be
in
the
form
of
either
assignments
or
participations.
A
loan
assignment
transfers
all
legal,
beneficial,
and
economic
rights
to
the
buyer,
and
transfer
typically
requires
consent
of
both
the
borrower
and
agent.
In
contrast,
a
loan
participation
generally
entitles
the
buyer
to
receive
the
cash
flows
from
principal,
interest,
and
any
fee
payments
on
a
portion
of
a
loan;
however,
the
seller
continues
to
hold
legal
title
to
that
portion
of
the
loan.
As
a
result,
the
buyer
of
a
loan
participation
generally
has
no
direct
recourse
against
the
borrower
and
is
exposed
to
credit
risk
of
both
the
borrower
and
seller
of
the
participation.
Bank
loans
often
have
extended
settlement
periods,
generally
may
be
repaid
at
any
time
at
the
option
of
the
borrower,
and
may
require
additional
principal
to
be
funded
at
the
borrowers’
discretion
at
a
later
date
(e.g.
unfunded
commitments
and
revolving
debt
instruments).
Until
settlement,
the
fund
maintains
liquid
assets
sufficient
to
settle
its
unfunded
loan
commitments.
The
fund
reflects
both
the
funded
portion
of
a
bank
loan
as
well
as
its
unfunded
commitment
in
the
Portfolio
of
Investments.
However,
if
a
credit
agreement
provides
no
initial
funding
of
a
tranche,
and
funding
of
the
full
commitment
at
a
future
date(s)
is
at
the
borrower’s
discretion
and
considered
uncertain,
a
loan
is
reflected
in
the
Portfolio
of
Investments
only
if,
and
only
to
the
extent
that,
the
fund
has
actually
settled
a
funding
commitment.
T.
ROWE
PRICE
Dynamic
Credit
Fund
Securities
Lending
The fund
may
lend
its
securities
to
approved
borrowers
to
earn
additional
income.
Its
securities
lending
activities
are
administered
by
a
lending
agent
in
accordance
with
a
securities
lending
agreement.
Security
loans
generally
do
not
have
stated
maturity
dates,
and
the
fund
may
recall
a
security
at
any
time.
The
fund
receives
collateral
in
the
form
of
cash
or
U.S.
government
securities.
Collateral
is
maintained
over
the
life
of
the
loan
in
an
amount
not
less
than
the
value
of
loaned
securities;
any
additional
collateral
required
due
to
changes
in
security
values
is
delivered
to
the
fund
the
next
business
day.
Cash
collateral
is
invested
in
accordance
with
investment
guidelines
approved
by
fund
management.
Additionally,
the
lending
agent
indemnifies
the
fund
against
losses
resulting
from
borrower
default.
Although
risk
is
mitigated
by
the
collateral
and
indemnification,
the
fund
could
experience
a
delay
in
recovering
its
securities
and
a
possible
loss
of
income
or
value
if
the
borrower
fails
to
return
the
securities,
collateral
investments
decline
in
value,
and
the
lending
agent
fails
to
perform.
Securities
lending
revenue
consists
of
earnings
on
invested
collateral
and
borrowing
fees,
net
of
any
rebates
to
the
borrower,
compensation
to
the
lending
agent,
and
other
administrative
costs.
In
accordance
with
GAAP,
investments
made
with
cash
collateral
are
reflected
in
the
accompanying
financial
statements,
but
collateral
received
in
the
form
of
securities
is
not.
At
December
31,
2024,
the
value
of
loaned
securities
was
$20,244,000;
the
value
of
cash
collateral
and
related
investments
was
$21,693,000.
Other
Purchases
and
sales
of
portfolio
securities
other
than
in-kind
transactions,
if
any, short-term
and
U.S.
government securities
aggregated $1,663,346,000 and
$1,439,381,000,
respectively,
for
the
year ended
December
31,
2024.
NOTE
5
-
FEDERAL
INCOME
TAXES
Generally,
no
provision
for
federal
income
taxes
is
required
since
the
fund
intends
to continue
to
qualify
as
a
regulated
investment
company
under
Subchapter
M
of
the
Internal
Revenue
Code
and
distribute
to
shareholders
all
of
its taxable
income
and
gains.
Distributions
determined
in
accordance
with
federal
income
tax
regulations
may
differ
in
amount
or
character
from
net
investment
income
and
realized
gains
for
financial
reporting
purposes.
The
fund
files
U.S.
federal,
state,
and
local
tax
returns
as
required.
The
fund’s
tax
returns
are
subject
to
examination
by
the
relevant
tax
authorities
until
expiration
of
the
applicable
statute
of
limitations,
which
is
generally
three
years
T.
ROWE
PRICE
Dynamic
Credit
Fund
after
the
filing
of
the
tax
return
but
which
can
be
extended
to
six
years
in
certain
circumstances.
Tax
returns
for
open
years
have
incorporated
no
uncertain
tax
positions
that
require
a
provision
for
income
taxes.
Capital
accounts
within
the
financial
reporting
records
are
adjusted
for
permanent
book/tax
differences
to
reflect
tax
character
but
are
not
adjusted
for
temporary
differences.
The
permanent
book/tax
adjustments,
if
any,
have
no
impact
on
results
of
operations
or
net
assets.
The
permanent
book/tax
adjustments
relate
primarily
to
the
character
of
net
currency
gains
or
losses,
the
character
of
income
on
swaps,
the
recharacterization
of
distributions
and
the
character
of
income
on
certain
derivative
contracts.
The
tax
character
of
distributions
paid
for
the
periods
presented
was
as
follows:
At
December
31,
2024,
the
tax-basis
cost
of
investments
(including
derivatives,
if
any)
and
gross
unrealized
appreciation
and
depreciation
were as
follows:
At
December
31,
2024,
the
tax-basis
components
of
accumulated
net
earnings
(loss)
were
as
follows:
($000s)
December
31,
2024
December
31,
2023
Ordinary
income
(including
short-term
capital
gains,
if
any)
$
71,779
$
13,845
($000s)
Cost
of
investments
$
1,023,134
Unrealized
appreciation
$
25,452
Unrealized
depreciation
(27,960)
Net
unrealized
appreciation
(depreciation)
$
(2,508)
($000s)
Undistributed
ordinary
income
$
1,388
Net
unrealized
appreciation
(depreciation)
(2,508)
Loss
carryforwards
and
deferrals
(3,440)
Total
distributable
earnings
(loss)
$
(4,560)
T.
ROWE
PRICE
Dynamic
Credit
Fund
Temporary
differences
between
book-basis
and
tax-basis
components
of
total
distributable
earnings
(loss)
arise
when
certain
items
of
income,
gain,
or
loss
are
recognized
in
different
periods
for
financial
statement
purposes
versus
for
tax
purposes;
these
differences
will
reverse
in
a
subsequent
reporting
period.
The
temporary
differences
relate
primarily
to
the
deferral
of
losses
from
wash
sales,
the
realization
of
gains/losses
on
certain
open
derivative
contracts
and
the
character
of
income
on
certain
derivatives
contracts.
The
loss
carryforwards
and
deferrals
primarily
relate
to
straddle
deferrals.
During
the
year
ended
December
31,
2024,
the
fund
utilized
$16,493,000
of
capital
loss
carryforwards.
NOTE
6
-
FOREIGN TAXES
The
fund
is
subject
to
foreign
income
taxes
imposed
by
certain
countries
in
which
it
invests.
Additionally,
capital
gains
realized
upon
disposition
of
securities
issued
in
or
by
certain
foreign
countries
are
subject
to
capital
gains
tax
imposed
by
those
countries.
All
taxes
are
computed
in
accordance
with
the
applicable
foreign
tax
law,
and,
to
the
extent
permitted,
capital
losses
are
used
to
offset
capital
gains.
Taxes
attributable
to
income
are
accrued
by
the
fund
as
a
reduction
of
income.
Current
and
deferred
tax
expense
attributable
to
capital
gains
is
reflected
as
a
component
of
realized
or
change
in
unrealized
gain/
loss
on
securities
in
the
accompanying
financial
statements.
To
the
extent
that
the
fund
has
country
specific
capital
loss
carryforwards,
such
carryforwards
are
applied
against
net
unrealized
gains
when
determining
the
deferred
tax
liability.
Any
deferred
tax
liability
incurred
by
the
fund
is
included
in
either
Other
liabilities
or
Deferred
tax
liability
on
the
accompanying
Statement
of
Assets
and
Liabilities.
NOTE
7
-
RELATED
PARTY
TRANSACTIONS
The
fund
is
managed
by
T.
Rowe
Price
Associates,
Inc.
(Price
Associates),
a
wholly
owned
subsidiary
of
T.
Rowe
Price
Group,
Inc.
(Price
Group).
The
investment
management
agreement
between
the
fund
and
Price
Associates
provides
for
an
annual
investment
management
fee,
which
is
computed
daily
and
paid
monthly. The
fee
consists
of
an
individual
fund
fee,
equal
to
0.22%
of
the
fund’s
average
daily
net
assets,
and
a
group
fee.
The
group
fee
rate
is
calculated
based
on
the
combined
net
assets
of
certain
mutual
funds
sponsored
by
Price
Associates
(the
group)
applied
to
a
graduated
fee
schedule,
with
rates
ranging
from
0.48%
for
the
first
$1
billion
of
assets
to
0.260%
for
assets
in
T.
ROWE
PRICE
Dynamic
Credit
Fund
excess
of
$845
billion.
The
fund’s
group
fee
is
determined
by
applying
the
group
fee
rate
to
the
fund’s
average
daily
net
assets. At
December
31,
2024,
the
effective
annual
group
fee
rate
was
0.28%.
The Investor
Class is
subject
to
a
contractual
expense
limitation
through
the
expense
limitation
date
indicated
in
the
table
below.
This
agreement
will
continue
through
the
expense
limitation
date
indicated
in
the
table
below,
and
may
be
renewed,
revised,
or
revoked
only
with
approval
of
the
fund’s
Board.
During
the
limitation
period,
Price
Associates
is required
to
waive
or
pay
any
expenses
(excluding
interest;
expenses
related
to
borrowings,
taxes,
and
brokerage;
non-recurring,
extraordinary
expenses;
and
acquired
fund
fees
and
expenses)
that
would
otherwise
cause
the class’s ratio
of
annualized
total
expenses
to
average
net
assets
(net
expense
ratio)
to
exceed
its
expense
limitation.
The
class
is
required
to
repay
Price
Associates
for
expenses
previously
waived/paid
to
the
extent
the
class’s net
assets
grow
or
expenses
decline
sufficiently
to
allow
repayment
without
causing
the class’s net
expense
ratio
(after
the
repayment
is
taken
into
account)
to
exceed
the
lesser
of:
(1)
the
expense
limitation
in
place
at
the
time
such
amounts
were
waived;
or
(2)
the class’s
current
expense
limitation.
However,
no
repayment
will
be
made
more
than
three
years
after
the
date
of
a
payment
or
waiver.
The
I
Class
is
also
subject
to
an
operating
expense
limitation
(I
Class
Limit)
pursuant
to
which
Price
Associates
is
contractually
required
to
pay
all
operating
expenses
of
the
I
Class,
excluding
management
fees;
interest;
expenses
related
to
borrowings,
taxes,
and
brokerage; non-recurring,
extraordinary expenses; and
acquired
fund
fees
and
expenses, to
the
extent
such
operating
expenses,
on
an
annualized
basis,
exceed
the
I
Class
Limit. This
agreement
will
continue
through
the
expense
limitation
date
indicated
in
the
table
below,
and
may
be
renewed,
revised,
or
revoked
only
with
approval
of
the
fund’s
Board.
The
I
Class
is
required
to
repay
Price
Associates
for
expenses
previously
paid
to
the
extent
the
class’s
net
assets
grow
or
expenses
decline
sufficiently
to
allow
repayment
without
causing
the
class’s
operating
expenses
(after
the
repayment
is
taken
into
account)
to
exceed
the
lesser
of:
(1)
the
I
Class
Limit
in
place
at
the
time
such
amounts
were
paid;
or
(2)
the
current
I
Class
Limit.
However,
no
repayment
will
be
made
more
than
three
years
after
the
date
of
a
payment
or
waiver.
The
Z
Class
is
also
subject
to
a
contractual
expense
limitation
agreement
whereby
Price
Associates
has
agreed
to
waive
and/or
bear
all
of
the
Z
Class’
expenses
(excluding
interest;
expenses
related
to
borrowings,
taxes,
and
brokerage;
non-recurring,
extraordinary
expenses;
and
acquired
fund
fees
and
T.
ROWE
PRICE
Dynamic
Credit
Fund
expenses)
in
their
entirety.
This
fee
waiver
and/or
expense
reimbursement
arrangement
is
expected
to
remain
in
place
indefinitely,
and
the
agreement
may
only
be
amended
or
terminated
with
approval
by
the
fund’s
Board.
Expenses
of
the
fund
waived/paid
by
the
manager
are
not
subject
to
later
repayment
by
the
fund.
Pursuant
to
these
agreements,
expenses
were waived/paid
by
and/or
repaid
to
Price
Associates
during
the year
ended December
31,
2024 as
indicated
in
the
table
below.
Including
these
amounts,
expenses
previously
waived/paid
by
Price
Associates
in
the
amount
of $595,000 remain
subject
to
repayment
by
the
fund
at
December
31,
2024. Any
repayment
of
expenses
previously
waived/paid
by
Price
Associates
during
the
period
would
be
included
in
the
net
investment
income
and
expense
ratios
presented
on
the
accompanying
Financial
Highlights.
In
addition,
the
fund
has
entered
into
service
agreements
with
Price
Associates
and
a
wholly
owned
subsidiary
of
Price
Associates,
each
an
affiliate
of
the
fund
(collectively,
Price).
Price
Associates
provides
certain
accounting
and
administrative
services
to
the
fund.
T.
Rowe
Price
Services,
Inc.
provides
shareholder
and
administrative
services
in
its
capacity
as
the
fund’s
transfer
and
dividend-disbursing
agent.
For
the
year
ended
December
31,
2024,
expenses
incurred
pursuant
to
these
service
agreements
were
$125,000
for
Price
Associates
and
$33,000
for
T.
Rowe
Price
Services,
Inc.
All
amounts
due
to
and
due
from
Price,
exclusive
of
investment
management
fees
payable,
are
presented
net
on
the
accompanying
Statement
of
Assets
and
Liabilities.
T.
Rowe
Price
Investment
Services,
Inc.
(Investment
Services)
serves
as
distributor
to
the
fund.
Pursuant
to
an
underwriting
agreement,
no
compensation
for
any
distribution
services
provided
is
paid
to
Investment
Services
by
the
fund
(except
for
12b-1
fees
under
a
Board-approved
Rule
12b-1
plan).
Investor
Class
I
Class
Z
Class
Expense
limitation/I
Class
Limit
0.63%
0.05%
0.00%
Expense
limitation
date
02/28/27
02/28/27
N/A
(Waived)/repaid
during
the
period
($000s)
$(41)
$(5)
$(4,955)
T.
ROWE
PRICE
Dynamic
Credit
Fund
Mutual
funds,
trusts,
and
other
accounts
managed
by
Price
Associates
or
its
affiliates
(collectively,
Price
Funds
and
accounts)
may
invest
in
the
fund.
No
Price
fund
or
account
may
invest
for
the
purpose
of
exercising
management
or
control
over
the
fund.
At
December
31,
2024, 100%
of
the
Z
Class's
outstanding
shares
were
held
by
Price
Funds
and
accounts.
The fund
may
invest
its
cash
reserves
in
certain
open-end
management
investment
companies
managed
by
Price
Associates
and
considered
affiliates
of
the
fund:
the
T.
Rowe
Price
Government
Reserve
Fund
or
the
T.
Rowe
Price
Treasury
Reserve
Fund,
organized
as
money
market
funds
(together,
the
Price
Reserve
Funds).
The
Price
Reserve
Funds
are
offered
as
short-term
investment
options
to
mutual
funds,
trusts,
and
other
accounts
managed
by
Price
Associates
or
its
affiliates
and
are
not
available
for
direct
purchase
by
members
of
the
public.
Cash
collateral
from
securities
lending,
if
any,
is
invested
in
the
T.
Rowe
Price
Government
Reserve Fund. The
Price
Reserve
Funds
pay
no
investment
management
fees.
The fund may
participate
in
securities
purchase
and
sale
transactions
with
other
funds
or
accounts
advised
by
Price
Associates
(cross
trades),
in
accordance
with
procedures
adopted
by the
fund’s
Board
and
Securities
and
Exchange
Commission
rules,
which
require,
among
other
things,
that
such
purchase
and
sale
cross
trades
be
effected
at
the
independent
current
market
price
of
the
security.
During
the
year
ended
December
31,
2024,
the
fund
had
no
purchases
or
sales
cross
trades
with
other
funds
or
accounts
advised
by
Price
Associates.
NOTE
8
-
SEGMENT
REPORTING
Operating
segments
are
defined
as
components
of
a
company
that
engage
in
business
activities
and
for
which
discrete
financial
information
is
available
and
regularly
reviewed
by
the
chief
operating
decision
maker
(CODM)
in
deciding
how
to
allocate
resources
and
assess
performance.
The
Management
Committee
of
Price
Associates
acts
as
the
fund’s
CODM.
The
fund
makes
investments
in
accordance
with
its
investment
objective
as
outlined
in
the
Prospectus
and
is
considered
one
reportable
segment
because
the
CODM
allocates
resources
and
assesses
the
operating
results
of
the
fund
on
the
whole.
The
fund’s
revenue
is
derived
from
investments
in
portfolio
of
securities.
The
CODM
allocates
resources
and
assesses
performance
based
on
the
operating
results
of
the
fund,
which
is
consistent
with
the
results
presented
in
the
statement
of
operations,
statement
of
changes
in
net
assets
and
financial
T.
ROWE
PRICE
Dynamic
Credit
Fund
highlights.
The
CODM
compares
the
fund’s
performance
to
its
benchmark
index
and
evaluates
the
positioning
of
the
fund
in
relation
to
its
investment
objective.
The
measure
of
segment
assets
is
net
assets
of
the
fund
which
is
disclosed
in
the
statement
of
assets
and
liabilities.
The
accounting
policies
of
the
segment
are
the
same
as
those
described
in
the
summary
of
significant
accounting
policies.
The
financial
statements
include
all
details
of
the
segment
assets,
segment
revenue
and
expenses;
and
reflect
the
financial
results
of
the
segment.
NOTE
9
-
OTHER
MATTERS
Unpredictable environmental,
political,
social
and
economic
events,
including
but
not
limited
to,
environmental
or
natural
disasters,
war
and
conflict
(including
Russia’s
military
invasion
of
Ukraine
and
the
conflict
in
Israel,
Gaza
and
surrounding
areas),
terrorism,
geopolitical
developments
(including
trading
and
tariff
arrangements,
sanctions
and
cybersecurity
attacks),
and
public
health
epidemics
(including
the
global
outbreak
of
COVID-19)
and
similar
public
health
threats,
may
significantly
affect
the
economy
and
the
markets
and
issuers
in
which
a
fund
invests.
The
extent
and
duration
of
such
events
and
resulting
market
disruptions
cannot
be
predicted.
These
and
other
similar
events
may
cause
instability
across
global
markets,
including
reduced
liquidity
and
disruptions
in
trading
markets,
while
some
events
may
affect
certain
geographic
regions,
countries,
sectors,
and
industries
more
significantly
than
others,
and
exacerbate
other
pre-existing
political,
social,
and
economic
risks.
The
fund’s
performance
could
be
negatively
impacted
if
the
value
of
a
portfolio
holding
were
harmed
by
these
or
such
events.
Management
actively
monitors
the
risks
and
financial
impacts
arising
from
such
events.
T.
ROWE
PRICE
Dynamic
Credit
Fund
REPORT
OF
INDEPENDENT
REGISTERED
PUBLIC
ACCOUNTING
FIRM
To
the
Board
of
Directors
of
T.
Rowe
Price
International
Funds,
Inc.
and
Shareholders
of
T.
Rowe
Price
Dynamic
Credit
Fund
Opinion
on
the
Financial
Statements
We
have
audited
the
accompanying
statement
of
assets
and
liabilities,
including
the
portfolio
of
investments,
of
T.
Rowe
Price
Dynamic
Credit
Fund
(one
of
the
funds
constituting
T.
Rowe
Price
International
Funds,
Inc.,
referred
to
hereafter
as
the
"Fund")
as
of
December
31,
2024,
the
related
statement
of
operations
for
the
year
ended
December
31,
2024,
the
statement
of
changes
in
net
assets
for
each
of
the
two
years
in
the
period
ended
December
31,
2024,
including
the
related
notes,
and
the
financial
highlights
for
each
of
the
periods
indicated
therein
(collectively
referred
to
as
the
“financial
statements”).
In
our
opinion,
the
financial
statements
present
fairly,
in
all
material
respects,
the
financial
position
of
the
Fund
as
of
December
31,
2024,
the
results
of
its
operations
for
the
year
then
ended,
the
changes
in
its
net
assets
for
each
of
the
two
years
in
the
period
ended
December
31,
2024
and
the
financial
highlights
for
each
of
the
periods
indicated
therein,
in
conformity
with
accounting
principles
generally
accepted
in
the
United
States
of
America.
Basis
for
Opinion
These
financial
statements
are
the
responsibility
of
the
Fund’s
management.
Our
responsibility
is
to
express
an
opinion
on
the
Fund’s
financial
statements
based
on
our
audits.
We
are
a
public
accounting
firm
registered
with
the
Public
Company
Accounting
Oversight
Board
(United
States)
(PCAOB)
and
are
required
to
be
independent
with
respect
to
the
Fund
in
accordance
with
the
U.S.
federal
securities
laws
and
the
applicable
rules
and
regulations
of
the
Securities
and
Exchange
Commission
and
the
PCAOB.
We
conducted
our
audits
of
these
financial
statements
in
accordance
with
the
standards
of
the
PCAOB.
Those
standards
require
that
we
plan
and
perform
the
audit
to
obtain
reasonable
assurance
about
whether
the
financial
statements
are
free
of
material
misstatement,
whether
due
to
error
or
fraud.
T.
ROWE
PRICE
Dynamic
Credit
Fund
Our
audits
included
performing
procedures
to
assess
the
risks
of
material
misstatement
of
the
financial
statements,
whether
due
to
error
or
fraud,
and
performing
procedures
that
respond
to
those
risks.
Such
procedures
included
examining,
on
a
test
basis,
evidence
regarding
the
amounts
and
disclosures
in
the
financial
statements.
Our
audits
also
included
evaluating
the
accounting
principles
used
and
significant
estimates
made
by
management,
as
well
as
evaluating
the
overall
presentation
of
the
financial
statements.
Our
procedures
included
confirmation
of
securities
owned
as
of
December
31,
2024
by
correspondence
with
the
custodians,
transfer
agent
and
brokers;
when
replies
were
not
received
from
brokers,
we
performed
other
auditing
procedures.
We
believe
that
our
audits
provide
a
reasonable
basis
for
our
opinion.
/s/
PricewaterhouseCoopers
LLP
Baltimore,
Maryland
February
18,
2025
We
have
served
as
the
auditor
of
one
or
more
investment
companies
in
the
T.
Rowe
Price
group
of
investment
companies
since
1973.
REPORT
OF
INDEPENDENT
REGISTERED
PUBLIC
ACCOUNTING
FIRM
(continued)
T.
ROWE
PRICE
Dynamic
Credit
Fund
TAX
INFORMATION
(UNAUDITED)
FOR
THE
TAX
YEAR
ENDED 12/31/24
We
are
providing
this
information
as
required
by
the
Internal
Revenue
Code.
The
amounts
shown
may
differ
from
those
elsewhere
in
this
report
because
of
differences
between
tax
and
financial
reporting
requirements.
For
taxable
non-corporate
shareholders,
$297,000
of
the
fund's
income
represents
qualified
dividend
income
subject
to
a
long-term
capital
gains
tax
rate
of
not
greater
than
20%.
For
corporate
shareholders,
$329,000
of
the
fund's
income
qualifies
for
the
dividends-received
deduction.
For
shareholders
subject
to
interest
expense
deduction
limitation
under
Section
163(j),
$70,588,000
of
the
fund’s
income
qualifies
as
a
Section
163(j)
interest
dividend
and
can
be
treated
as
interest
income
for
purposes
of
Section
163(j),
subject
to
holding
period
requirements
and
other
limitations.
T.
ROWE
PRICE
Dynamic
Credit
Fund
APPROVAL
OF
SUBADVISORY
AGREEMENT
At
a
meeting
held
on
August
5,
2024
(Meeting),
the
fund’s
Board
of
Directors
(Board)
considered
the
initial
approval
of
an
investment
subadvisory
agreement
(Subadvisory
Contract)
that
T.
Rowe
Price
Associates,
Inc.
(Adviser),
entered
into
with
T.
Rowe
Price
International
Ltd
(Subadviser)
on
behalf
of
the
fund.
The
Subadvisory
Contract
authorizes
the
Subadviser
to
have
investment
discretion
with
respect
to
all
or
a
portion
of
the
fund’s
portfolio.
The
Board
noted
that
the
Subadvisory
Contract
will
be
substantially
similar
to
other
subadvisory
agreements
that
are
in
place
for
other
T.
Rowe
Price
funds
that
delegate
investment
management
responsibilities
to
affiliated
investment
advisers
and
that
the
Adviser
will
retain
oversight
responsibilities
with
respect
to
the
fund.
The
Board
also
noted
that
the
new
subadvisory
arrangement
will
not
change
the
total
advisory
fees
paid
by
the
fund.
However,
under
the
Subadvisory
Contract,
the
Adviser
may
pay
the
Subadviser
up
to
60%
of
the
advisory
fees
that
the
Adviser
receives
from
the
fund.
At
the
Meeting,
the
Board
reviewed
materials
relevant
to
its
consideration
of
the
proposed
Subadvisory
Contract.
Each
year,
the
Board
considers
the
continuation
of
the
investment
management
agreement
(Advisory
Contract)
between
the
fund
and
the
Adviser.
The
fund’s
Advisory
Contract
was
most
recently
approved
by
the
Board
at
a
meeting
held
on
March
6–7,
2023
(March
Meeting).
A
discussion
of
the
basis
for
the
Board’s
approval
of
the
Advisory
Contract
is
included
in
the
fund’s
annual
shareholder
report
for
the
period
ended
May
31,
2024.
The
factors
considered
by
the
Board
at
the
Meeting
in
connection
with
approval
of
the
proposed
Subadvisory
Contract
were
substantially
similar
to
the
factors
considered
at
the
March
Meeting
in
connection
with
the
approval
to
continue
the
Advisory
Contract.
The
independent
directors
were
assisted
in
their
evaluation
of
the
Subadvisory
Contract
by
independent
legal
counsel
from
whom
they
received
separate
legal
advice
and
with
whom
they
met
separately.
Following
discussion
at
the
Meeting,
the
Board,
including
all
of
the
fund’s
independent
directors,
approved
the
Subadvisory
Contract
between
the
Adviser
and
Subadviser
on
behalf
of
the
fund.
No
single
factor
was
considered
in
isolation
or
to
be
determinative
to
the
decision.
Rather,
the
Board
concluded,
in
light
of
a
weighting
and
balancing
of
all
factors
considered,
that
it
was
in
the
best
interests
of
the
fund
and
its
shareholders
for
the
Board
to
approve
the
Subadvisory
Contract
effective
August
6,
2024.
100
East
Pratt
Street
Baltimore,
MD
21202
T.
Rowe
Price
Investment
Services,
Inc.
Call
1-800-225-5132
to
request
a
prospectus
or
summary
prospectus;
each
includes
investment
objectives,
risks,
fees,
expenses,
and
other
information
that
you
should
read
and
consider
carefully
before
investing.
F1175-050
2/25
Item 8. Changes in and Disagreements with Accountants for Open-End Management Investment Companies.
Not applicable.
Item 9. Proxy Disclosures for Open-End Management Investment Companies.
Not applicable.
Item 10. Remuneration Paid to Directors, Officers, and Others of Open-End Management Investment Companies.
Remuneration paid to Directors is included in Item 7 of this Form N-CSR.
Item 11. Statement Regarding Basis for Approval of Investment Advisory Contract.
If applicable, see Item 7.
Item 12. Disclosure of Proxy Voting Policies and Procedures for Closed-End Management Investment Companies.
Not applicable.
Item 13. Portfolio Managers of Closed-End Management Investment Companies.
Not applicable.
Item 14. Purchases of Equity Securities by Closed-End Management Investment Company and Affiliated Purchasers.
Not applicable.
Item 15. Submission of Matters to a Vote of Security Holders.
There has been no change to the procedures by which shareholders may recommend nominees to the registrant’s board of directors.
Item 16. Controls and Procedures.
(a) The registrant’s principal executive officer and principal financial officer have evaluated the registrant’s disclosure controls and procedures within 90 days of this filing and have concluded that the registrant’s disclosure controls and procedures were effective, as of that date, in ensuring that information required to be disclosed by the registrant in this Form N-CSR was recorded, processed, summarized, and reported timely.
(b) The registrant’s principal executive officer and principal financial officer are aware of no change in the registrant’s internal control over financial reporting that occurred during the period covered by this report that has materially affected, or is reasonably likely to materially affect, the registrant’s internal control over financial reporting.
Item 17. Disclosure of Securities Lending Activities for Closed-End Management Investment Companies.
Not applicable.
Item 18. Recovery of Erroneously Awarded Compensation.
Not applicable.
Item 19. Exhibits.
SIGNATURES
Pursuant to the requirements of the Securities Exchange Act of 1934 and the Investment Company Act of 1940, the registrant has duly caused this report to be signed on its behalf by the undersigned, thereunto duly authorized.
| | | | |
| T. Rowe Price International Funds, Inc. |
| | |
| By | | /s/ David Oestreicher | | |
| | David Oestreicher | | |
| | Principal Executive Officer | | |
| | |
| Date | | February 18, 2025 | | |
Pursuant to the requirements of the Securities Exchange Act of 1934 and the Investment Company Act of 1940, this report has been signed below by the following persons on behalf of the registrant and in the capacities and on the dates indicated.
| | | | |
| By | | /s/ David Oestreicher | | |
| | David Oestreicher | | |
| | Principal Executive Officer | | |
| | |
| Date | | February 18, 2025 | | |
| | | | |
| By | | /s/ Alan S. Dupski | | |
| | Alan S. Dupski | | |
| | Principal Financial Officer | | |
| | |
| Date | | February 18, 2025 | | |