UNITED STATES
SECURITIES AND EXCHANGE COMMISSION
Washington, D.C. 20549
FORM N-CSR
CERTIFIED SHAREHOLDER REPORT OF REGISTERED
MANAGEMENT INVESTMENT COMPANIES
Investment Company Act File Number: 811-02958
T. Rowe Price International Funds, Inc.
(Exact name of registrant as specified in charter)
100 East Pratt Street, Baltimore, MD 21202
(Address of principal executive offices)
David Oestreicher
100 East Pratt Street, Baltimore, MD 21202
(Name and address of agent for service)
Registrant’s telephone number, including area code: (410) 345-2000
Date of fiscal year end: December 31
Date of reporting period: December 31, 2024
Item 1. Reports to Shareholders
(a) Report pursuant to Rule 30e-1
Annual Shareholder Report
December 31, 2024
Global High Income Bond Fund
This annual shareholder report contains important information about Global High Income Bond Fund (the "fund") for the period of January 1, 2024 to December 31, 2024. You can find the fund’s prospectus, financial information on Form N‑CSR (which includes required tax information for dividends), holdings, proxy voting information, and other information atwww.troweprice.com/prospectus. You can also request this information without charge by contacting T. Rowe Price at 1‑800‑638‑5660 or info@troweprice.com or contacting your intermediary. This report describes changes to the fund that occurred during the reporting period.
What were the fund costs for the last year? (based on a hypothetical $10,000 investment)
| | Costs of a $10,000 investment | Costs paid as a percentage of a $10,000 investment |
|---|
| Global High Income Bond Fund - Investor Class | $78 | 0.75% |
|---|
What drove fund performance during the past 12 months?
Global high yield bonds produced positive returns in 2024, helped by monetary policy easing by major central banks. However, rising geopolitical tensions and uncertainty about economic growth, future interest rate cuts, and the incoming Trump administration’s tariff plans tempered fourth-quarter gains.
Compared with the style-specific ICE BofA Global High Yield Index (hedged to USD), the fund’s off-benchmark allocation to bank loans—which outpaced high yield bonds over the past year—was a leading contributor to relative results, driven by holdings in Ascend Learning and LTI Boyd. Credit selection in the health care segment added value, partly due to Community Health Systems.
Selection among cable operators detracted, largely due to Altice France. In March, the company aggressively moved pending asset sales to an unrestricted subsidiary and threatened to withhold them from creditors unless they agreed to receive less in their claims. Within the media segment, iHeartMedia, which we eliminated from the portfolio in June, held back relative gains.
The fund seeks high income and some capital appreciation. We reduced our holdings in European high yield, as valuations became less attractive following recent outperformance. Additionally, we have decreased exposure to the automotive industry, a significant portion of which is based in Europe.
The portfolio maintained allocations to select types of derivatives for hedging purposes. The fund had a material exposure to currency forward contracts during the reporting period, which had a positive impact on performance.
How has the fund performed?
Cumulative Returns of a Hypothetical $10,000 Investment as of December 31, 2024
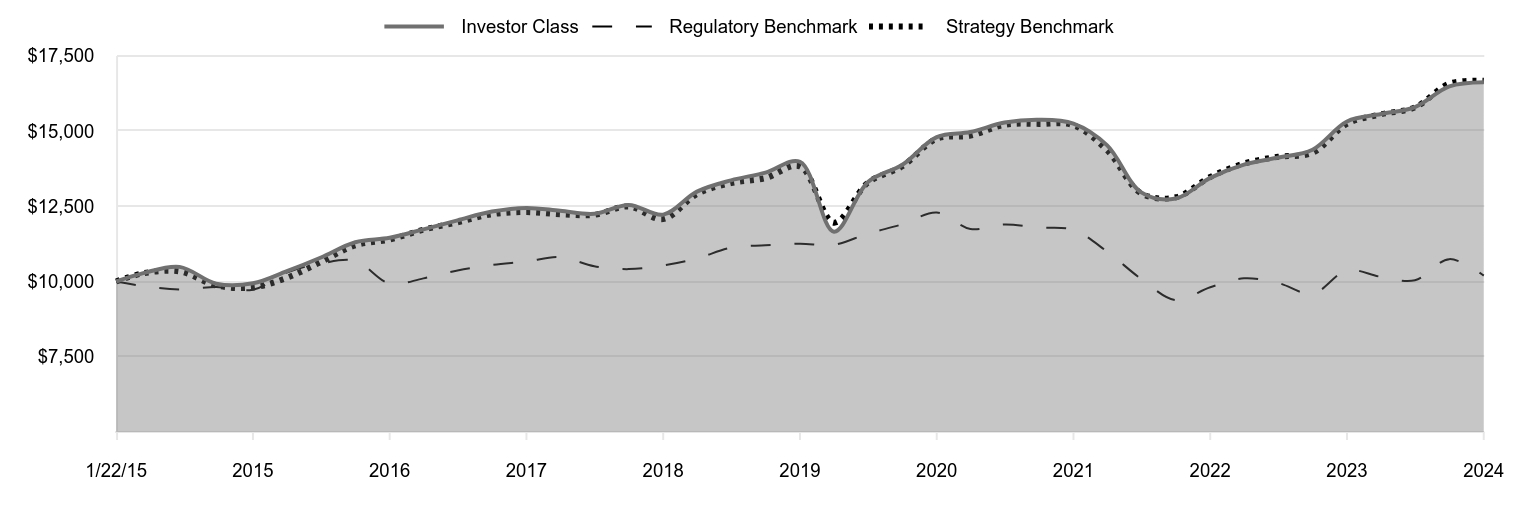
| Investor Class | Regulatory Benchmark | Strategy Benchmark |
|---|
| 1/22/15 | 10,000 | 10,000 | 10,000 |
|---|
| 3/31/15 | 10,277 | 9,850 | 10,272 |
|---|
| 6/30/15 | 10,486 | 9,734 | 10,333 |
|---|
| 9/30/15 | 9,927 | 9,817 | 9,868 |
|---|
| 12/31/15 | 9,939 | 9,726 | 9,803 |
|---|
| 3/31/16 | 10,343 | 10,300 | 10,121 |
|---|
| 6/30/16 | 10,797 | 10,598 | 10,647 |
|---|
| 9/30/16 | 11,305 | 10,684 | 11,202 |
|---|
| 12/31/16 | 11,451 | 9,929 | 11,393 |
|---|
| 3/31/17 | 11,733 | 10,104 | 11,721 |
|---|
| 6/30/17 | 12,032 | 10,367 | 11,964 |
|---|
| 9/30/17 | 12,323 | 10,550 | 12,234 |
|---|
| 12/31/17 | 12,445 | 10,664 | 12,306 |
|---|
| 3/31/18 | 12,349 | 10,809 | 12,233 |
|---|
| 6/30/18 | 12,247 | 10,508 | 12,216 |
|---|
| 9/30/18 | 12,545 | 10,411 | 12,492 |
|---|
| 12/31/18 | 12,222 | 10,536 | 12,071 |
|---|
| 3/31/19 | 12,986 | 10,768 | 12,903 |
|---|
| 6/30/19 | 13,361 | 11,122 | 13,269 |
|---|
| 9/30/19 | 13,615 | 11,202 | 13,437 |
|---|
| 12/31/19 | 13,977 | 11,256 | 13,826 |
|---|
| 3/31/20 | 11,656 | 11,219 | 11,955 |
|---|
| 6/30/20 | 13,303 | 11,592 | 13,283 |
|---|
| 9/30/20 | 13,877 | 11,900 | 13,828 |
|---|
| 12/31/20 | 14,795 | 12,291 | 14,740 |
|---|
| 3/31/21 | 14,964 | 11,743 | 14,845 |
|---|
| 6/30/21 | 15,279 | 11,897 | 15,204 |
|---|
| 9/30/21 | 15,376 | 11,792 | 15,236 |
|---|
| 12/31/21 | 15,247 | 11,713 | 15,188 |
|---|
| 3/31/22 | 14,522 | 10,991 | 14,354 |
|---|
| 6/30/22 | 12,961 | 10,083 | 12,925 |
|---|
| 9/30/22 | 12,757 | 9,383 | 12,797 |
|---|
| 12/31/22 | 13,443 | 9,810 | 13,471 |
|---|
| 3/31/23 | 13,882 | 10,105 | 13,918 |
|---|
| 6/30/23 | 14,117 | 9,950 | 14,143 |
|---|
| 9/30/23 | 14,379 | 9,593 | 14,274 |
|---|
| 12/31/23 | 15,316 | 10,370 | 15,237 |
|---|
| 3/31/24 | 15,564 | 10,154 | 15,554 |
|---|
| 6/30/24 | 15,795 | 10,042 | 15,785 |
|---|
| 9/30/24 | 16,482 | 10,743 | 16,574 |
|---|
| 12/31/24 | 16,618 | 10,195 | 16,665 |
|---|
202501-4140694, 202502-4108537
Average Annual Total Returns
| | 1 Year | 5 Years | Since Inception 1/22/15 |
|---|
| Global High Income Bond Fund (Investor Class) | 8.51% | 3.52% | 5.24% |
|---|
| Bloomberg Global Aggregate Bond Index (Regulatory Benchmark) | -1.69 | -1.96 | 0.19 |
|---|
| ICE BofA Global High Yield Index Hedged to USD (Strategy Benchmark) | 9.37 | 3.81 | 5.27 |
|---|
The preceding line graph shows the value of a hypothetical $10,000 investment in the fund over the past 10 fiscal year periods or since inception (for funds lacking 10-year records). The fund’s performance information included in the line graph and table above is compared with a regulatory required index that represents an overall securities market (Regulatory Benchmark). In addition, the line graph and table may also include one or more indexes that more closely aligns to the fund's investment strategy (Strategy Benchmark(s)). Due to new SEC Rules on shareholder reporting the fund adopted a new broad-based securities market index, referred to as the Regulatory Benchmark. Market index returns do not include expenses, which are deducted from fund returns. The fund's total return figures reflect the reinvestment of dividends and capital gains, if any.Neither the fund’s returns nor the index returns reflect the deduction of taxes that a shareholder would pay on fund distributions or redemptions of fund shares.The fund’s past performance is not a good predictor of the fund’s future performance.Updated performance information can be found at www.troweprice.com.
What are some fund statistics?
- Total Net Assets (000s)$579,855
- Number of Portfolio Holdings310
- Investment Advisory Fees Paid (000s)$2,062
- Portfolio Turnover Rate45.6%
What did the fund invest in?
Security Allocation (as a % of Net Assets)
| Corporate Bonds | 86.1% |
| Bank Loans | 9.4 |
| Municipal Securities | 0.6 |
| Preferred Stocks | 0.4 |
| Common Stocks | 0.2 |
| Convertible Preferred Stocks | 0.2 |
| Asset-Backed Securities | 0.1 |
| Convertible Bonds | 0.0 |
| Short-Term and Other | 3.0 |
Top Ten Holdings (as a % of Net Assets)
| Petroleos Mexicanos | 2.4% |
| Venture Global LNG | 1.5 |
| CSC Holdings | 1.2 |
| Gruenenthal | 1.1 |
| Hilcorp Energy I | 1.1 |
| Cirsa Finance International | 1.0 |
| CVS Health | 1.0 |
| Cloud Software Group | 1.0 |
| Iliad Holding | 1.0 |
| Ziggo Bond | 1.0 |
How has the fund changed?
This is a summary of certain material changes to Global High Income Bond Fund. Effective March 1, 2025, the fund will normally invest at least 80% of its net assets (plus any borrowings for investment purposes) in bonds that are rated below investment grade. The fund’s March 1, 2025 prospectus contains more information.
If you invest directly with T. Rowe Price, you can elect to receive future shareholder reports or other important documents through electronic delivery by enrolling at www.troweprice.com/paperless. If you invest through a financial intermediary such as an investment advisor, a bank, retirement plan sponsor or a brokerage firm, please contact that organization and ask if it can provide electronic delivery.
Bloomberg and ICE do not accept any liability for any errors or omissions in the indexes or data, and hereby expressly disclaim all warranties of originality, accuracy, completeness, timeliness, merchantability and fitness for a particular purpose. No party may rely on any indexes or data contained in this communication. Visit www.troweprice.com/en/us/market-data-disclosures for additional legal notices & disclaimers.
Global High Income Bond Fund
Investor Class (RPIHX)
T. Rowe Price Investment Services, Inc.
100 East Pratt Street
Baltimore, MD 21202
Annual Shareholder Report
December 31, 2024
Global High Income Bond Fund
This annual shareholder report contains important information about Global High Income Bond Fund (the "fund") for the period of January 1, 2024 to December 31, 2024. You can find the fund’s prospectus, financial information on Form N‑CSR (which includes required tax information for dividends), holdings, proxy voting information, and other information atwww.troweprice.com/prospectus. You can also request this information without charge by contacting T. Rowe Price at 1‑800‑638‑5660 or info@troweprice.com or contacting your intermediary. This report describes changes to the fund that occurred during the reporting period.
What were the fund costs for the last year? (based on a hypothetical $10,000 investment)
| | Costs of a $10,000 investment | Costs paid as a percentage of a $10,000 investment |
|---|
| Global High Income Bond Fund - Advisor Class | $100 | 0.96% |
|---|
What drove fund performance during the past 12 months?
Global high yield bonds produced positive returns in 2024, helped by monetary policy easing by major central banks. However, rising geopolitical tensions and uncertainty about economic growth, future interest rate cuts, and the incoming Trump administration’s tariff plans tempered fourth-quarter gains.
Compared with the style-specific ICE BofA Global High Yield Index (hedged to USD), the fund’s off-benchmark allocation to bank loans—which outpaced high yield bonds over the past year—was a leading contributor to relative results, driven by holdings in Ascend Learning and LTI Boyd. Credit selection in the health care segment added value, partly due to Community Health Systems.
Selection among cable operators detracted, largely due to Altice France. In March, the company aggressively moved pending asset sales to an unrestricted subsidiary and threatened to withhold them from creditors unless they agreed to receive less in their claims. Within the media segment, iHeartMedia, which we eliminated from the portfolio in June, held back relative gains.
The fund seeks high income and some capital appreciation. We reduced our holdings in European high yield, as valuations became less attractive following recent outperformance. Additionally, we have decreased exposure to the automotive industry, a significant portion of which is based in Europe.
The portfolio maintained allocations to select types of derivatives for hedging purposes. The fund had a material exposure to currency forward contracts during the reporting period, which had a positive impact on performance.
How has the fund performed?
Cumulative Returns of a Hypothetical $10,000 Investment as of December 31, 2024
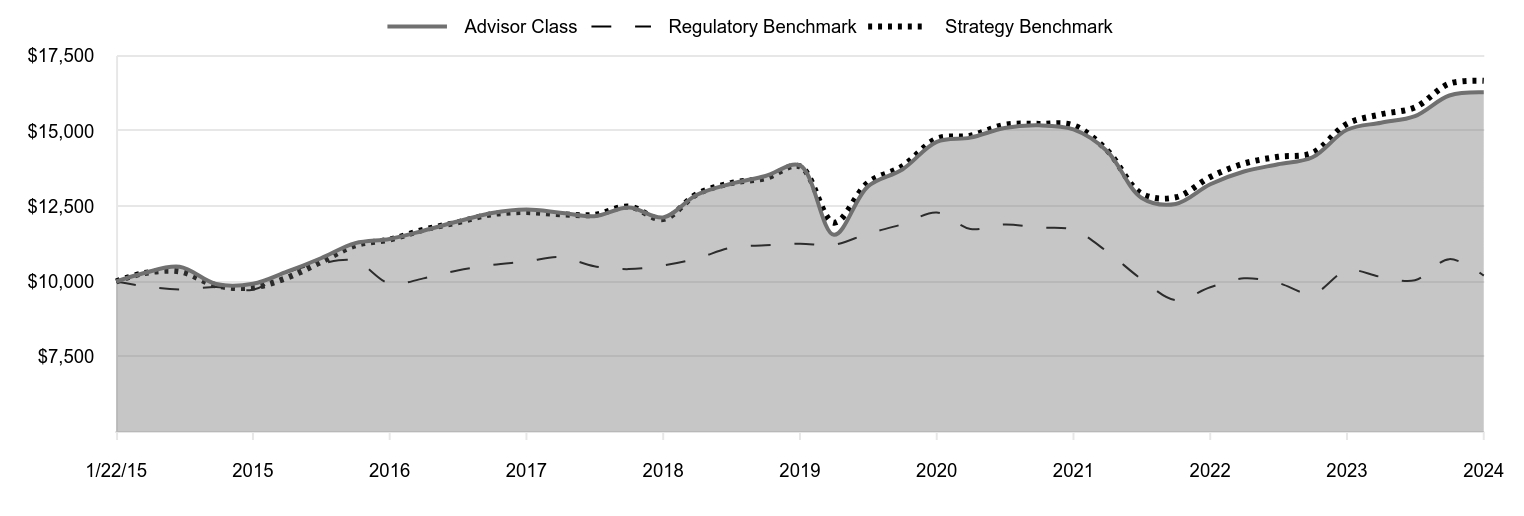
| Advisor Class | Regulatory Benchmark | Strategy Benchmark |
|---|
| 1/22/15 | 10,000 | 10,000 | 10,000 |
|---|
| 3/31/15 | 10,274 | 9,850 | 10,272 |
|---|
| 6/30/15 | 10,489 | 9,734 | 10,333 |
|---|
| 9/30/15 | 9,916 | 9,817 | 9,868 |
|---|
| 12/31/15 | 9,924 | 9,726 | 9,803 |
|---|
| 3/31/16 | 10,324 | 10,300 | 10,121 |
|---|
| 6/30/16 | 10,773 | 10,598 | 10,647 |
|---|
| 9/30/16 | 11,273 | 10,684 | 11,202 |
|---|
| 12/31/16 | 11,413 | 9,929 | 11,393 |
|---|
| 3/31/17 | 11,687 | 10,104 | 11,721 |
|---|
| 6/30/17 | 11,993 | 10,367 | 11,964 |
|---|
| 9/30/17 | 12,276 | 10,550 | 12,234 |
|---|
| 12/31/17 | 12,388 | 10,664 | 12,306 |
|---|
| 3/31/18 | 12,287 | 10,809 | 12,233 |
|---|
| 6/30/18 | 12,167 | 10,508 | 12,216 |
|---|
| 9/30/18 | 12,456 | 10,411 | 12,492 |
|---|
| 12/31/18 | 12,129 | 10,536 | 12,071 |
|---|
| 3/31/19 | 12,881 | 10,768 | 12,903 |
|---|
| 6/30/19 | 13,246 | 11,122 | 13,269 |
|---|
| 9/30/19 | 13,503 | 11,202 | 13,437 |
|---|
| 12/31/19 | 13,855 | 11,256 | 13,826 |
|---|
| 3/31/20 | 11,550 | 11,219 | 11,955 |
|---|
| 6/30/20 | 13,160 | 11,592 | 13,283 |
|---|
| 9/30/20 | 13,721 | 11,900 | 13,828 |
|---|
| 12/31/20 | 14,636 | 12,291 | 14,740 |
|---|
| 3/31/21 | 14,780 | 11,743 | 14,845 |
|---|
| 6/30/21 | 15,098 | 11,897 | 15,204 |
|---|
| 9/30/21 | 15,187 | 11,792 | 15,236 |
|---|
| 12/31/21 | 15,051 | 11,713 | 15,188 |
|---|
| 3/31/22 | 14,329 | 10,991 | 14,354 |
|---|
| 6/30/22 | 12,784 | 10,083 | 12,925 |
|---|
| 9/30/22 | 12,577 | 9,383 | 12,797 |
|---|
| 12/31/22 | 13,229 | 9,810 | 13,471 |
|---|
| 3/31/23 | 13,653 | 10,105 | 13,918 |
|---|
| 6/30/23 | 13,894 | 9,950 | 14,143 |
|---|
| 9/30/23 | 14,128 | 9,593 | 14,274 |
|---|
| 12/31/23 | 15,040 | 10,370 | 15,237 |
|---|
| 3/31/24 | 15,276 | 10,154 | 15,554 |
|---|
| 6/30/24 | 15,495 | 10,042 | 15,785 |
|---|
| 9/30/24 | 16,179 | 10,743 | 16,574 |
|---|
| 12/31/24 | 16,285 | 10,195 | 16,665 |
|---|
202501-4140694, 202502-4108537
Average Annual Total Returns
| | 1 Year | 5 Years | Since Inception 1/22/15 |
|---|
| Global High Income Bond Fund (Advisor Class) | 8.28% | 3.29% | 5.03% |
|---|
| Bloomberg Global Aggregate Bond Index (Regulatory Benchmark) | -1.69 | -1.96 | 0.19 |
|---|
| ICE BofA Global High Yield Index Hedged to USD (Strategy Benchmark) | 9.37 | 3.81 | 5.27 |
|---|
The preceding line graph shows the value of a hypothetical $10,000 investment in the fund over the past 10 fiscal year periods or since inception (for funds lacking 10-year records). The fund’s performance information included in the line graph and table above is compared with a regulatory required index that represents an overall securities market (Regulatory Benchmark). In addition, the line graph and table may also include one or more indexes that more closely aligns to the fund's investment strategy (Strategy Benchmark(s)). Due to new SEC Rules on shareholder reporting the fund adopted a new broad-based securities market index, referred to as the Regulatory Benchmark. Market index returns do not include expenses, which are deducted from fund returns. The fund's total return figures reflect the reinvestment of dividends and capital gains, if any.Neither the fund’s returns nor the index returns reflect the deduction of taxes that a shareholder would pay on fund distributions or redemptions of fund shares.The fund’s past performance is not a good predictor of the fund’s future performance.Updated performance information can be found at www.troweprice.com.
What are some fund statistics?
- Total Net Assets (000s)$579,855
- Number of Portfolio Holdings310
- Investment Advisory Fees Paid (000s)$2,062
- Portfolio Turnover Rate45.6%
What did the fund invest in?
Security Allocation (as a % of Net Assets)
| Corporate Bonds | 86.1% |
| Bank Loans | 9.4 |
| Municipal Securities | 0.6 |
| Preferred Stocks | 0.4 |
| Common Stocks | 0.2 |
| Convertible Preferred Stocks | 0.2 |
| Asset-Backed Securities | 0.1 |
| Convertible Bonds | 0.0 |
| Short-Term and Other | 3.0 |
Top Ten Holdings (as a % of Net Assets)
| Petroleos Mexicanos | 2.4% |
| Venture Global LNG | 1.5 |
| CSC Holdings | 1.2 |
| Gruenenthal | 1.1 |
| Hilcorp Energy I | 1.1 |
| Cirsa Finance International | 1.0 |
| CVS Health | 1.0 |
| Cloud Software Group | 1.0 |
| Iliad Holding | 1.0 |
| Ziggo Bond | 1.0 |
How has the fund changed?
This is a summary of certain material changes to Global High Income Bond Fund. Effective March 1, 2025, the fund will normally invest at least 80% of its net assets (plus any borrowings for investment purposes) in bonds that are rated below investment grade. The fund’s March 1, 2025 prospectus contains more information.
If you invest directly with T. Rowe Price, you can elect to receive future shareholder reports or other important documents through electronic delivery by enrolling at www.troweprice.com/paperless. If you invest through a financial intermediary such as an investment advisor, a bank, retirement plan sponsor or a brokerage firm, please contact that organization and ask if it can provide electronic delivery.
Bloomberg and ICE do not accept any liability for any errors or omissions in the indexes or data, and hereby expressly disclaim all warranties of originality, accuracy, completeness, timeliness, merchantability and fitness for a particular purpose. No party may rely on any indexes or data contained in this communication. Visit www.troweprice.com/en/us/market-data-disclosures for additional legal notices & disclaimers.
Global High Income Bond Fund
Advisor Class (PAIHX)
T. Rowe Price Investment Services, Inc.
100 East Pratt Street
Baltimore, MD 21202
Annual Shareholder Report
December 31, 2024
Global High Income Bond Fund
This annual shareholder report contains important information about Global High Income Bond Fund (the "fund") for the period of January 1, 2024 to December 31, 2024. You can find the fund’s prospectus, financial information on Form N‑CSR (which includes required tax information for dividends), holdings, proxy voting information, and other information atwww.troweprice.com/prospectus. You can also request this information without charge by contacting T. Rowe Price at 1‑800‑638‑5660 or info@troweprice.com or contacting your intermediary. This report describes changes to the fund that occurred during the reporting period.
What were the fund costs for the last year? (based on a hypothetical $10,000 investment)
| | Costs of a $10,000 investment | Costs paid as a percentage of a $10,000 investment |
|---|
| Global High Income Bond Fund - I Class | $64 | 0.61% |
|---|
What drove fund performance during the past 12 months?
Global high yield bonds produced positive returns in 2024, helped by monetary policy easing by major central banks. However, rising geopolitical tensions and uncertainty about economic growth, future interest rate cuts, and the incoming Trump administration’s tariff plans tempered fourth-quarter gains.
Compared with the style-specific ICE BofA Global High Yield Index (hedged to USD), the fund’s off-benchmark allocation to bank loans—which outpaced high yield bonds over the past year—was a leading contributor to relative results, driven by holdings in Ascend Learning and LTI Boyd. Credit selection in the health care segment added value, partly due to Community Health Systems.
Selection among cable operators detracted, largely due to Altice France. In March, the company aggressively moved pending asset sales to an unrestricted subsidiary and threatened to withhold them from creditors unless they agreed to receive less in their claims. Within the media segment, iHeartMedia, which we eliminated from the portfolio in June, held back relative gains.
The fund seeks high income and some capital appreciation. We reduced our holdings in European high yield, as valuations became less attractive following recent outperformance. Additionally, we have decreased exposure to the automotive industry, a significant portion of which is based in Europe.
The portfolio maintained allocations to select types of derivatives for hedging purposes. The fund had a material exposure to currency forward contracts during the reporting period, which had a positive impact on performance.
How has the fund performed?
Cumulative Returns of a Hypothetical $500,000 Investment as of December 31, 2024
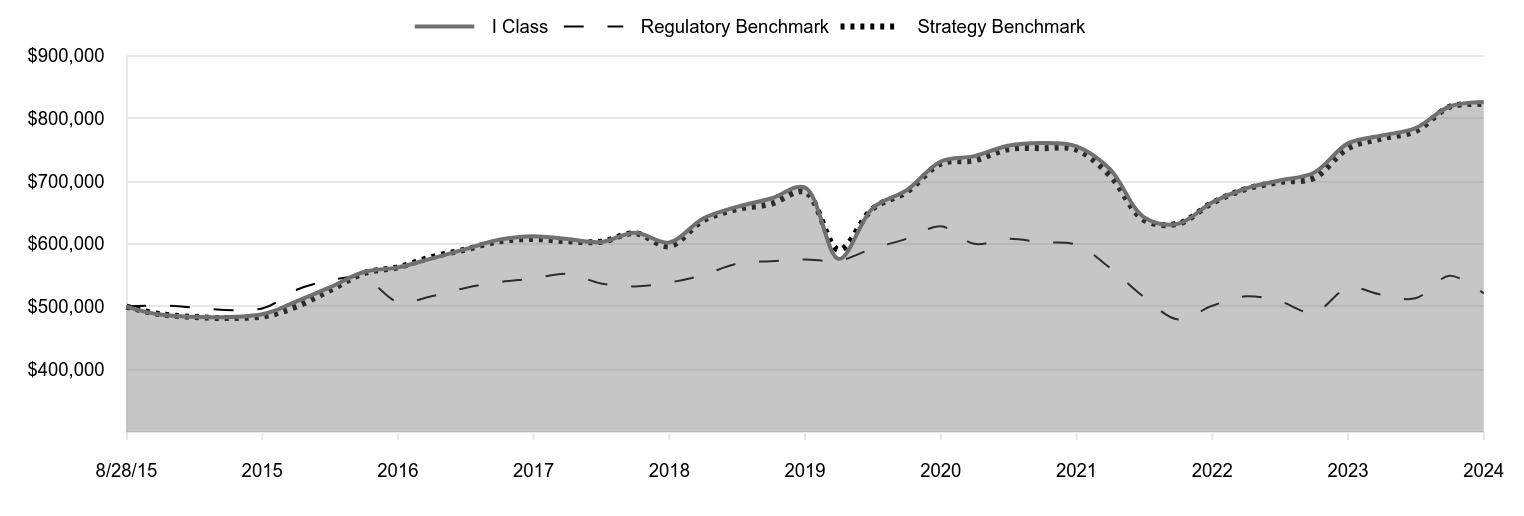
| I Class | Regulatory Benchmark | Strategy Benchmark |
|---|
| 8/28/15 | 500,000 | 500,000 | 500,000 |
|---|
| 9/30/15 | 487,030 | 501,660 | 487,372 |
|---|
| 12/31/15 | 487,877 | 497,024 | 484,164 |
|---|
| 3/31/16 | 507,971 | 526,344 | 499,863 |
|---|
| 6/30/16 | 530,556 | 541,556 | 525,813 |
|---|
| 9/30/16 | 555,143 | 545,978 | 553,235 |
|---|
| 12/31/16 | 562,520 | 507,392 | 562,644 |
|---|
| 3/31/17 | 576,555 | 516,329 | 578,872 |
|---|
| 6/30/17 | 591,656 | 529,764 | 590,885 |
|---|
| 9/30/17 | 606,742 | 539,107 | 604,210 |
|---|
| 12/31/17 | 612,275 | 544,913 | 607,751 |
|---|
| 3/31/18 | 607,792 | 552,331 | 604,145 |
|---|
| 6/30/18 | 602,984 | 536,964 | 603,297 |
|---|
| 9/30/18 | 617,906 | 532,004 | 616,950 |
|---|
| 12/31/18 | 602,211 | 538,375 | 596,176 |
|---|
| 3/31/19 | 640,126 | 550,229 | 637,220 |
|---|
| 6/30/19 | 658,882 | 568,357 | 655,306 |
|---|
| 9/30/19 | 672,284 | 572,420 | 663,611 |
|---|
| 12/31/19 | 689,759 | 575,198 | 682,845 |
|---|
| 3/31/20 | 576,015 | 573,318 | 590,422 |
|---|
| 6/30/20 | 656,945 | 592,355 | 656,014 |
|---|
| 9/30/20 | 685,598 | 608,120 | 682,948 |
|---|
| 12/31/20 | 731,312 | 628,094 | 727,953 |
|---|
| 3/31/21 | 739,918 | 600,076 | 733,147 |
|---|
| 6/30/21 | 756,538 | 607,952 | 750,872 |
|---|
| 9/30/21 | 760,918 | 602,582 | 752,468 |
|---|
| 12/31/21 | 755,561 | 598,530 | 750,081 |
|---|
| 3/31/22 | 719,113 | 561,655 | 708,885 |
|---|
| 6/30/22 | 642,740 | 515,250 | 638,328 |
|---|
| 9/30/22 | 632,072 | 479,470 | 632,029 |
|---|
| 12/31/22 | 666,296 | 501,278 | 665,285 |
|---|
| 3/31/23 | 688,296 | 516,350 | 687,388 |
|---|
| 6/30/23 | 701,044 | 508,450 | 698,489 |
|---|
| 9/30/23 | 713,460 | 490,216 | 704,935 |
|---|
| 12/31/23 | 760,234 | 529,926 | 752,511 |
|---|
| 3/31/24 | 772,841 | 518,887 | 768,143 |
|---|
| 6/30/24 | 784,615 | 513,157 | 779,570 |
|---|
| 9/30/24 | 819,058 | 548,990 | 818,551 |
|---|
| 12/31/24 | 826,128 | 520,975 | 823,046 |
|---|
202501-4140694, 202502-4108537
Average Annual Total Returns
| | 1 Year | 5 Years | Since Inception 8/28/15 |
|---|
| Global High Income Bond Fund (I Class) | 8.67% | 3.67% | 5.52% |
|---|
| Bloomberg Global Aggregate Bond Index (Regulatory Benchmark) | -1.69 | -1.96 | 0.44 |
|---|
| ICE BofA Global High Yield Index Hedged to USD (Strategy Benchmark) | 9.37 | 3.81 | 5.48 |
|---|
The preceding line graph shows the value of a hypothetical $500,000 investment in the fund over the past 10 fiscal year periods or since inception (for funds lacking 10-year records). The fund’s performance information included in the line graph and table above is compared with a regulatory required index that represents an overall securities market (Regulatory Benchmark). In addition, the line graph and table may also include one or more indexes that more closely aligns to the fund's investment strategy (Strategy Benchmark(s)). Due to new SEC Rules on shareholder reporting the fund adopted a new broad-based securities market index, referred to as the Regulatory Benchmark. Market index returns do not include expenses, which are deducted from fund returns. The fund's total return figures reflect the reinvestment of dividends and capital gains, if any.Neither the fund’s returns nor the index returns reflect the deduction of taxes that a shareholder would pay on fund distributions or redemptions of fund shares.The fund’s past performance is not a good predictor of the fund’s future performance.Updated performance information can be found at www.troweprice.com.
What are some fund statistics?
- Total Net Assets (000s)$579,855
- Number of Portfolio Holdings310
- Investment Advisory Fees Paid (000s)$2,062
- Portfolio Turnover Rate45.6%
What did the fund invest in?
Security Allocation (as a % of Net Assets)
| Corporate Bonds | 86.1% |
| Bank Loans | 9.4 |
| Municipal Securities | 0.6 |
| Preferred Stocks | 0.4 |
| Common Stocks | 0.2 |
| Convertible Preferred Stocks | 0.2 |
| Asset-Backed Securities | 0.1 |
| Convertible Bonds | 0.0 |
| Short-Term and Other | 3.0 |
Top Ten Holdings (as a % of Net Assets)
| Petroleos Mexicanos | 2.4% |
| Venture Global LNG | 1.5 |
| CSC Holdings | 1.2 |
| Gruenenthal | 1.1 |
| Hilcorp Energy I | 1.1 |
| Cirsa Finance International | 1.0 |
| CVS Health | 1.0 |
| Cloud Software Group | 1.0 |
| Iliad Holding | 1.0 |
| Ziggo Bond | 1.0 |
How has the fund changed?
This is a summary of certain material changes to Global High Income Bond Fund. Effective March 1, 2025, the fund will normally invest at least 80% of its net assets (plus any borrowings for investment purposes) in bonds that are rated below investment grade. The fund’s March 1, 2025 prospectus contains more information.
If you invest directly with T. Rowe Price, you can elect to receive future shareholder reports or other important documents through electronic delivery by enrolling at www.troweprice.com/paperless. If you invest through a financial intermediary such as an investment advisor, a bank, retirement plan sponsor or a brokerage firm, please contact that organization and ask if it can provide electronic delivery.
Bloomberg and ICE do not accept any liability for any errors or omissions in the indexes or data, and hereby expressly disclaim all warranties of originality, accuracy, completeness, timeliness, merchantability and fitness for a particular purpose. No party may rely on any indexes or data contained in this communication. Visit www.troweprice.com/en/us/market-data-disclosures for additional legal notices & disclaimers.
Global High Income Bond Fund
I Class (RPOIX)
T. Rowe Price Investment Services, Inc.
100 East Pratt Street
Baltimore, MD 21202
Item 1. (b) Notice pursuant to Rule 30e-3.
Not applicable.
Item 2. Code of Ethics.
The registrant has adopted a code of ethics, as defined in Item 2 of Form N-CSR, applicable to its principal executive officer, principal financial officer, principal accounting officer or controller, or persons performing similar functions. A copy of this code of ethics is filed as an exhibit to this Form N-CSR. No substantive amendments were approved or waivers were granted to this code of ethics during the period covered by this report.
Item 3. Audit Committee Financial Expert.
The registrant’s Board of Directors has determined that Mr. Paul F. McBride qualifies as an audit committee financial expert, as defined in Item 3 of Form N-CSR. Mr. McBride is considered independent for purposes of Item 3 of Form N-CSR.
Item 4. Principal Accountant Fees and Services.
(a) – (d) Aggregate fees billed for the last two fiscal years for professional services rendered to, or on behalf of, the registrant by the registrant’s principal accountant were as follows:
| | | | | | | | | | | | | | |
| | | | 2024 | | | | | | 2023 | |
| | Audit Fees | | $ | 39,999 | | | | | | | $ | 39,183 | |
| | Audit-Related Fees | | | - | | | | | | | | - | |
| | Tax Fees | | | - | | | | | | | | - | |
| | All Other Fees | | | - | | | | | | | | - | |
Audit fees include amounts related to the audit of the registrant’s annual financial statements and services normally provided by the accountant in connection with statutory and regulatory filings. Audit-related fees include amounts reasonably related to the performance of the audit of the registrant’s financial statements and specifically include the issuance of a report on internal controls and, if applicable, agreed-upon procedures related to fund acquisitions. Tax fees include amounts related to services for tax compliance, tax planning, and tax advice. The nature of these services specifically includes the review of distribution calculations and the preparation of Federal, state, and excise tax returns. All other fees include the registrant’s pro-rata share of amounts for agreed-upon procedures in conjunction with service contract approvals by the registrant’s Board of Directors/Trustees.
(e)(1) The registrant’s audit committee has adopted a policy whereby audit and non-audit services performed by the registrant’s principal accountant for the registrant, its investment adviser, and any entity controlling, controlled by, or under common control with the investment adviser that provides ongoing services to the registrant require pre-approval in advance at regularly scheduled audit committee meetings. If such a service is required between regularly scheduled audit committee meetings, pre-approval may be authorized by one audit committee member with ratification at the next scheduled audit committee meeting. Waiver of pre-approval for audit or non-audit services requiring fees of a de minimis amount is not permitted.
(2) No services included in (b) – (d) above were approved pursuant to paragraph (c)(7)(i)(C) of Rule 2-01 of Regulation S-X.
(f) Less than 50 percent of the hours expended on the principal accountant’s engagement to audit the registrant’s financial statements for the most recent fiscal year were attributed to work performed by persons other than the principal accountant’s full-time, permanent employees.
(g) The aggregate fees billed for the most recent fiscal year and the preceding fiscal year by the registrant’s principal accountant for non-audit services rendered to the registrant, its investment adviser, and any entity controlling, controlled by, or under common control with the investment adviser that provides ongoing services to the registrant were $1,262,000 and $1,524,000, respectively.
(h) All non-audit services rendered in (g) above were pre-approved by the registrant’s audit committee. Accordingly, these services were considered by the registrant’s audit committee in maintaining the principal accountant’s independence.
(i) Not applicable.
(j) Not applicable.
Item 5. Audit Committee of Listed Registrants.
Not applicable.
Item 6. Investments.
(a) Not applicable. The complete schedule of investments is included in Item 7 of this Form N-CSR.
(b) Not applicable.
Item 7. Financial Statements and Financial Highlights for Open-End Management Investment Companies.
(a – b) Report pursuant to Regulation S-X.
Financial
Highlights
Portfolio
of
Investments
Financial
Statements
and
Notes
Additional
Fund
Information
Financial
Statements
and
Other
Information
For
more
insights
from
T.
Rowe
Price
investment
professionals,
go
to
troweprice.com
.
T.
ROWE
PRICE
RPIHX
Global
High
Income
Bond
Fund
PAIHX
Global
High
Income
Bond
Fund–
.
Advisor Class
RPOIX
Global
High
Income
Bond
Fund–
.
I Class
T.
ROWE
PRICE
Global
High
Income
Bond
Fund
For
a
share
outstanding
throughout
each
period
Investor
Class
..
Year
..
..
Ended
.
12/31/24
12/31/23
12/31/22
12/31/21
12/31/20
NET
ASSET
VALUE
Beginning
of
period
$
8
.49
$
7
.97
$
9
.94
$
10
.17
$
10
.17
Investment
activities
Net
investment
income
(1)(2)
0
.57
0
.55
0
.48
0
.47
0
.54
Net
realized
and
unrealized
gain/loss
0
.13
0
.52
(
1
.64
)
(
0
.16
)
0
.01
(3)
Total
from
investment
activities
0
.70
1
.07
(
1
.16
)
0
.31
0
.55
Distributions
Net
investment
income
(
0
.57
)
(
0
.44
)
(
0
.49
)
(
0
.46
)
(
0
.55
)
Net
realized
gain
—
—
(
0
.32
)
(
0
.08
)
—
Tax
return
of
capital
—
(
0
.11
)
—
—
—
Total
distributions
(
0
.57
)
(
0
.55
)
(
0
.81
)
(
0
.54
)
(
0
.55
)
NET
ASSET
VALUE
End
of
period
$
8
.62
$
8
.49
$
7
.97
$
9
.94
$
10
.17
T.
ROWE
PRICE
Global
High
Income
Bond
Fund
For
a
share
outstanding
throughout
each
period
The
accompanying
notes
are
an
integral
part
of
these
financial
statements.
Investor
Class
..
Year
..
..
Ended
.
12/31/24
12/31/23
12/31/22
12/31/21
12/31/20
Ratios/Supplemental
Data
Total
return
(2)(4)
8
.51
%
13
.93
%
(
11
.83
)
%
3
.05
%
5
.86
%
Ratios
to
average
net
assets:
(2)
Gross
expenses
before
waivers/payments
by
Price
Associates
0
.86
%
0
.94
%
0
.96
%
0
.90
%
0
.94
%
Net
expenses
after
waivers/payments
by
Price
Associates
0
.75
%
0
.76
%
0
.75
%
0
.78
%
0
.79
%
Net
investment
income
6
.67
%
6
.76
%
5
.46
%
4
.61
%
5
.62
%
Portfolio
turnover
rate
45
.6
%
51
.7
%
45
.2
%
63
.2
%
81
.8
%
Net
assets,
end
of
period
(in
thousands)
$124,932
$57,997
$56,170
$122,550
$116,743
0
%
0
%
0
%
0
%
0
%
(1)
Per
share
amounts
calculated
using
average
shares
outstanding
method.
(2)
Includes
the
impact
of
expense-related
arrangements
with
Price
Associates.
(3)
The
amount
presented
is
inconsistent
with
the
fund's
aggregate
gains
and
losses
because
of
the
timing
of
sales
and
redemptions
of
fund
shares
in
relation
to
fluctuating
market
values
for
the
investment
portfolio.
(4)
Total
return
reflects
the
rate
that
an
investor
would
have
earned
on
an
investment
in
the
fund
during
each
period,
assuming
reinvestment
of
all
distributions,
and
payment
of
no
redemption
or
account
fees,
if
applicable.
T.
ROWE
PRICE
Global
High
Income
Bond
Fund
For
a
share
outstanding
throughout
each
period
Advisor
Class
..
Year
..
..
Ended
.
12/31/24
12/31/23
12/31/22
12/31/21
12/31/20
NET
ASSET
VALUE
Beginning
of
period
$
8
.49
$
7
.97
$
9
.95
$
10
.18
$
10
.18
Investment
activities
Net
investment
income
(1)(2)
0
.55
0
.53
0
.46
0
.45
0
.52
Net
realized
and
unrealized
gain/loss
0
.13
0
.52
(
1
.65
)
(
0
.16
)
0
.01
(3)
Total
from
investment
activities
0
.68
1
.05
(
1
.19
)
0
.29
0
.53
Distributions
Net
investment
income
(
0
.55
)
(
0
.43
)
(
0
.47
)
(
0
.44
)
(
0
.53
)
Net
realized
gain
—
—
(
0
.32
)
(
0
.08
)
—
Tax
return
of
capital
—
(
0
.10
)
—
—
—
Total
distributions
(
0
.55
)
(
0
.53
)
(
0
.79
)
(
0
.52
)
(
0
.53
)
NET
ASSET
VALUE
End
of
period
$
8
.62
$
8
.49
$
7
.97
$
9
.95
$
10
.18
T.
ROWE
PRICE
Global
High
Income
Bond
Fund
For
a
share
outstanding
throughout
each
period
The
accompanying
notes
are
an
integral
part
of
these
financial
statements.
Advisor
Class
..
Year
..
..
Ended
.
12/31/24
12/31/23
12/31/22
12/31/21
12/31/20
Ratios/Supplemental
Data
Total
return
(2)(4)
8
.28
%
13
.69
%
(
12
.11
)
%
2
.84
%
5
.64
%
Ratios
to
average
net
assets:
(2)
Gross
expenses
before
waivers/payments
by
Price
Associates
1
.59
%
1
.28
%
1
.25
%
1
.24
%
1
.25
%
Net
expenses
after
waivers/payments
by
Price
Associates
0
.96
%
0
.97
%
0
.96
%
0
.99
%
1
.00
%
Net
investment
income
6
.47
%
6
.54
%
5
.26
%
4
.41
%
5
.42
%
Portfolio
turnover
rate
45
.6
%
51
.7
%
45
.2
%
63
.2
%
81
.8
%
Net
assets,
end
of
period
(in
thousands)
$272
$321
$331
$614
$831
0
%
0
%
0
%
0
%
0
%
(1)
Per
share
amounts
calculated
using
average
shares
outstanding
method.
(2)
Includes
the
impact
of
expense-related
arrangements
with
Price
Associates.
(3)
The
amount
presented
is
inconsistent
with
the
fund's
aggregate
gains
and
losses
because
of
the
timing
of
sales
and
redemptions
of
fund
shares
in
relation
to
fluctuating
market
values
for
the
investment
portfolio.
(4)
Total
return
reflects
the
rate
that
an
investor
would
have
earned
on
an
investment
in
the
fund
during
each
period,
assuming
reinvestment
of
all
distributions,
and
payment
of
no
redemption
or
account
fees,
if
applicable.
T.
ROWE
PRICE
Global
High
Income
Bond
Fund
For
a
share
outstanding
throughout
each
period
I
Class
..
Year
..
..
Ended
.
12/31/24
12/31/23
12/31/22
12/31/21
12/31/20
NET
ASSET
VALUE
Beginning
of
period
$
8
.48
$
7
.96
$
9
.94
$
10
.16
$
10
.16
Investment
activities
Net
investment
income
(1)(2)
0
.58
0
.56
0
.50
0
.48
0
.55
Net
realized
and
unrealized
gain/loss
0
.13
0
.52
(
1
.66
)
(
0
.14
)
0
.01
(3)
Total
from
investment
activities
0
.71
1
.08
(
1
.16
)
0
.34
0
.56
Distributions
Net
investment
income
(
0
.58
)
(
0
.45
)
(
0
.50
)
(
0
.48
)
(
0
.56
)
Net
realized
gain
—
—
(
0
.32
)
(
0
.08
)
—
Tax
return
of
capital
—
(
0
.11
)
—
—
—
Total
distributions
(
0
.58
)
(
0
.56
)
(
0
.82
)
(
0
.56
)
(
0
.56
)
NET
ASSET
VALUE
End
of
period
$
8
.61
$
8
.48
$
7
.96
$
9
.94
$
10
.16
T.
ROWE
PRICE
Global
High
Income
Bond
Fund
For
a
share
outstanding
throughout
each
period
The
accompanying
notes
are
an
integral
part
of
these
financial
statements.
I
Class
..
Year
..
..
Ended
.
12/31/24
12/31/23
12/31/22
12/31/21
12/31/20
Ratios/Supplemental
Data
Total
return
(2)(4)
8
.67
%
14
.10
%
(
11
.81
)
%
3
.32
%
6
.02
%
Ratios
to
average
net
assets:
(2)
Gross
expenses
before
waivers/payments
by
Price
Associates
0
.65
%
0
.69
%
0
.69
%
0
.72
%
0
.77
%
Net
expenses
after
waivers/payments
by
Price
Associates
0
.61
%
0
.61
%
0
.61
%
0
.62
%
0
.64
%
Net
investment
income
6
.79
%
6
.92
%
5
.72
%
4
.74
%
5
.74
%
Portfolio
turnover
rate
45
.6
%
51
.7
%
45
.2
%
63
.2
%
81
.8
%
Net
assets,
end
of
period
(in
thousands)
$454,651
$242,717
$203,565
$167,274
$87,283
0
%
0
%
0
%
0
%
0
%
(1)
Per
share
amounts
calculated
using
average
shares
outstanding
method.
(2)
Includes
the
impact
of
expense-related
arrangements
with
Price
Associates.
(3)
The
amount
presented
is
inconsistent
with
the
fund's
aggregate
gains
and
losses
because
of
the
timing
of
sales
and
redemptions
of
fund
shares
in
relation
to
fluctuating
market
values
for
the
investment
portfolio.
(4)
Total
return
reflects
the
rate
that
an
investor
would
have
earned
on
an
investment
in
the
fund
during
each
period,
assuming
reinvestment
of
all
distributions,
and
payment
of
no
redemption
or
account
fees,
if
applicable.
T.
ROWE
PRICE
Global
High
Income
Bond
Fund
December
31,
2024
Par/Shares
$
Value
(
Cost
and
value
in
$000s)
‡
BRAZIL 3.2%
Corporate
Bonds 3.2%
Aegea
Finance,
9.00%,
1/20/31
(USD) (1)
2,580,000
2,635
Braskem
Netherlands
Finance,
8.50%,
1/12/31
(USD) (1)
2,710,000
2,719
CSN
Resources,
8.875%,
12/5/30
(USD) (1)
2,750,000
2,741
Globo
Comunicacao
e
Participacoes
,
4.875%,
1/22/30
(USD) (1)
1,315,000
1,182
Globo
Comunicacao
e
Participacoes
,
4.875%,
1/22/30
(USD)
1,085,000
976
Globo
Comunicacao
e
Participacoes
,
5.50%,
1/14/32
(USD) (1)
2,515,000
2,245
Klabin
Austria,
3.20%,
1/12/31
(USD)
4,265,000
3,588
Suzano
Austria,
3.75%,
1/15/31
(USD)
2,875,000
2,539
Total
Brazil
(Cost
$19,424)
18,625
CANADA 2.6%
Common
Stocks 0.2%
Bausch
+
Lomb
(USD) (2)
46,000
831
831
Corporate
Bonds 2.4%
Husky
Injection
Molding
Systems,
9.00%,
2/15/29
(USD) (1)
2,830,000
2,957
Jones
Deslauriers
Insurance
Management,
8.50%,
3/15/30
(USD) (1)
3,275,000
3,439
Jones
Deslauriers
Insurance
Management,
10.50%,
12/15/30
(USD) (1)
730,000
786
South
Bow
Canadian
Infrastructure
Holdings,
VR,
7.50%,
3/1/55
(USD) (1)(3)
195,000
201
South
Bow
Canadian
Infrastructure
Holdings,
VR,
7.625%,
3/1/55
(USD) (1)(3)
2,555,000
2,616
Vermilion
Energy,
6.875%,
5/1/30
(USD) (1)
4,200,000
4,147
14,146
Total
Canada
(Cost
$14,954)
14,977
CHILE 2.2%
Corporate
Bonds 2.2%
AES
Andes,
VR,
6.35%,
10/7/79
(USD) (3)
1,016,000
1,012
AES
Andes,
VR,
8.15%,
6/10/55
(USD) (1)(3)
3,100,000
3,142
Agrosuper
,
4.60%,
1/20/32
(USD) (1)
2,505,000
2,243
Banco
de
Credito
e
Inversiones
,
VR,
7.50%
(USD) (1)(3)(4)
1,780,000
1,738
T.
ROWE
PRICE
Global
High
Income
Bond
Fund
Par/Shares
$
Value
(Cost
and
value
in
$000s)
Banco
de
Credito
e
Inversiones
,
VR,
8.75%
(USD) (1)(3)(4)
3,420,000
3,580
Mercury
Chile
Holdco,
6.50%,
1/24/27
(USD) (1)
1,030,000
1,025
Total
Chile
(Cost
$12,898)
12,740
COLOMBIA 1.6%
Corporate
Bonds 1.6%
Aris
Mining,
8.00%,
10/31/29
(USD) (1)
3,240,000
3,210
Bancolombia
,
VR,
8.625%,
12/24/34
(USD) (3)
2,945,000
3,086
Ecopetrol
,
4.625%,
11/2/31
(USD)
1,315,000
1,092
Ecopetrol
,
5.875%,
5/28/45
(USD)
875,000
604
Ecopetrol
,
8.375%,
1/19/36
(USD)
255,000
246
Ecopetrol
,
8.875%,
1/13/33
(USD)
1,205,000
1,229
Total
Colombia
(Cost
$9,569)
9,467
FRANCE 3.8%
Corporate
Bonds 3.8%
Altice
France,
4.25%,
10/15/29 (1)
885,000
690
Altice
France,
5.875%,
2/1/27
1,460,000
1,208
Banijay
Entertainment,
7.00%,
5/1/29 (1)
1,340,000
1,460
Banijay
Entertainment,
7.00%,
5/1/29
2,127,000
2,318
Banijay
Entertainment,
8.125%,
5/1/29
(USD) (1)
1,020,000
1,056
Forvia
,
5.50%,
6/15/31
1,050,000
1,082
Iliad
Holding,
5.375%,
4/15/30 (1)
2,690,000
2,858
Iliad
Holding,
8.50%,
4/15/31
(USD) (1)
2,895,000
3,065
IPD
3,
8.00%,
6/15/28 (1)
1,715,000
1,872
IPD
3,
8.00%,
6/15/28
650,000
710
IPD
3,
FRN,
3M
EURIBOR
+
3.375%,
6.224%,
6/15/31 (1)
853,000
883
IPD
3,
FRN,
3M
EURIBOR
+
3.375%,
6.261%,
6/15/31
1,695,000
1,757
Picard
Groupe
,
6.375%,
7/1/29 (1)
1,470,000
1,583
Picard
Groupe
,
6.375%,
7/1/29
1,375,000
1,480
Total
France
(Cost
$22,894)
22,022
GERMANY 3.3%
Corporate
Bonds 3.3%
Gruenenthal
,
4.625%,
11/15/31 (1)
5,980,000
6,246
ProGroup
,
5.375%,
4/15/31 (1)
2,515,000
2,537
ProGroup
,
5.375%,
4/15/31
950,000
958
TK
Elevator
Holdco,
6.625%,
7/15/28 (1)
724,500
751
TK
Elevator
Holdco,
6.625%,
7/15/28
247,500
256
TK
Elevator
U.S.
Newco
,
5.25%,
7/15/27
(USD) (1)
1,985,000
1,940
T.
ROWE
PRICE
Global
High
Income
Bond
Fund
Par/Shares
$
Value
(Cost
and
value
in
$000s)
TUI
Cruises,
5.00%,
5/15/30 (1)
2,970,000
3,120
TUI
Cruises,
6.25%,
4/15/29
1,245,000
1,360
ZF
North
America
Capital,
6.875%,
4/14/28
(USD) (1)
1,735,000
1,724
Total
Germany
(Cost
$19,361)
18,892
GHANA 0.7%
Corporate
Bonds 0.7%
Kosmos
Energy,
7.75%,
5/1/27
(USD) (1)
740,000
718
Kosmos
Energy,
8.75%,
10/1/31
(USD) (1)
3,315,000
3,127
Total
Ghana
(Cost
$4,049)
3,845
GUATEMALA 0.6%
Corporate
Bonds 0.6%
CT
Trust,
5.125%,
2/3/32
(USD) (1)
1,210,000
1,084
CT
Trust,
5.125%,
2/3/32
(USD)
905,000
811
Millicom
International
Cellular,
7.375%,
4/2/32
(USD) (1)
1,520,000
1,523
Total
Guatemala
(Cost
$3,567)
3,418
HONG
KONG 0.1%
Bank
Loans 0.1% (5)
Fugue
Finance,
FRN,
1M
TSFR
+
3.25%,
12/5/31
(USD) (6)
630,000
635
Total
Hong
Kong
(Cost
$630)
635
INDIA 0.7%
Corporate
Bonds 0.7%
Greenko
Power
II,
4.30%,
12/13/28
(USD)
4,204,225
3,963
Total
India
(Cost
$3,815)
3,963
ISRAEL 0.9%
Corporate
Bonds 0.9%
Teva
Pharmaceutical
Finance
Netherlands
II,
4.375%,
5/9/30
(EUR)
735,000
778
Teva
Pharmaceutical
Finance
Netherlands
II,
7.375%,
9/15/29
(EUR)
965,000
1,148
Teva
Pharmaceutical
Finance
Netherlands
II,
7.875%,
9/15/31
(EUR)
2,525,000
3,174
Total
Israel
(Cost
$5,020)
5,100
T.
ROWE
PRICE
Global
High
Income
Bond
Fund
Par/Shares
$
Value
(Cost
and
value
in
$000s)
ITALY 1.7%
Corporate
Bonds 1.7%
Golden
Goose,
FRN,
3M
EURIBOR
+
4.875%,
7.898%,
5/14/27
1,665,000
1,746
IMA
Industria
Macchine
Automatiche
,
3.75%,
1/15/28
2,265,000
2,302
IMA
Industria
Macchine
Automatiche
,
FRN,
3M
EURIBOR
+
3.75%,
6.929%,
4/15/29 (1)
2,050,000
2,133
IMA
Industria
Macchine
Automatiche
,
FRN,
3M
EURIBOR
+
3.75%,
6.929%,
4/15/29
730,000
760
Itelyum
Regeneration,
4.625%,
10/1/26 (1)
840,000
867
Itelyum
Regeneration,
4.625%,
10/1/26
2,060,000
2,126
Total
Italy
(Cost
$10,512)
9,934
LUXEMBOURG 0.3%
Bank
Loans 0.1% (5)
Albion
Financing
3,
FRN,
3M
TSFR
+
4.51%,
8.80%,
8/16/29
(USD)
422,875
427
427
Corporate
Bonds 0.2%
Altice
Financing,
5.00%,
1/15/28
(USD) (1)
1,995,000
1,551
1,551
Total
Luxembourg
(Cost
$2,179)
1,978
MAURITIUS 1.0%
Corporate
Bonds 1.0%
Axian
Telecom,
7.375%,
2/16/27
(USD) (1)
2,710,000
2,718
Axian
Telecom,
7.375%,
2/16/27
(USD)
3,000,000
3,008
Total
Mauritius
(Cost
$5,659)
5,726
MEXICO 4.1%
Corporate
Bonds 4.1%
Banco
Mercantil
del
Norte,
VR,
8.375%
(USD) (3)(4)
4,540,000
4,571
BBVA
Bancomer
,
VR,
5.875%,
9/13/34
(USD) (3)
1,785,000
1,695
BBVA
Bancomer
,
VR,
8.125%,
1/8/39
(USD) (1)(3)
2,850,000
2,910
BBVA
Bancomer
,
VR,
8.45%,
6/29/38
(USD) (1)(3)
730,000
757
Petroleos
Mexicanos
,
4.50%,
1/23/26
(USD)
635,000
613
Petroleos
Mexicanos
,
6.50%,
3/13/27
(USD)
2,475,000
2,395
T.
ROWE
PRICE
Global
High
Income
Bond
Fund
Par/Shares
$
Value
(Cost
and
value
in
$000s)
Petroleos
Mexicanos
,
6.50%,
1/23/29
(USD)
4,185,000
3,893
Petroleos
Mexicanos
,
6.75%,
9/21/47
(USD)
3,030,000
2,085
Petroleos
Mexicanos
,
7.69%,
1/23/50
(USD)
6,475,000
4,890
Total
Mexico
(Cost
$24,862)
23,809
MOROCCO 0.4%
Corporate
Bonds 0.4%
Vivo
Energy
Investments,
5.125%,
9/24/27
(USD)
2,425,000
2,352
Total
Morocco
(Cost
$2,337)
2,352
NETHERLANDS 1.3%
Corporate
Bonds 1.3%
UPCB
Finance
VII,
3.625%,
6/15/29
1,770,000
1,815
Ziggo
Bond,
3.375%,
2/28/30 (1)
710,000
668
Ziggo
Bond,
3.375%,
2/28/30
5,580,000
5,249
Total
Netherlands
(Cost
$8,142)
7,732
PANAMA 0.2%
Corporate
Bonds 0.2%
C&W
Senior
Finance,
6.875%,
9/15/27
(USD) (1)
1,090,000
1,081
Total
Panama
(Cost
$1,093)
1,081
PERU 0.7%
Corporate
Bonds 0.7%
Banco
Internacional
del
Peru
Interbank,
VR,
7.625%,
1/16/34
(USD) (1)(3)
2,615,000
2,786
Minsur
,
4.50%,
10/28/31
(USD) (1)
1,545,000
1,372
Total
Peru
(Cost
$4,216)
4,158
POLAND 0.2%
Corporate
Bonds 0.2%
InPost
,
2.25%,
7/15/27
(EUR)
955,000
967
Total
Poland
(Cost
$954)
967
ROMANIA 1.1%
Corporate
Bonds 1.1%
Banca
Transilvania
,
VR,
8.875%,
4/27/27
(EUR) (3)
2,770,000
3,039
T.
ROWE
PRICE
Global
High
Income
Bond
Fund
Par/Shares
$
Value
(Cost
and
value
in
$000s)
RCS
&
RDS,
3.25%,
2/5/28
(EUR) (1)
800,000
802
RCS
&
RDS,
3.25%,
2/5/28
(EUR)
2,500,000
2,508
Total
Romania
(Cost
$6,508)
6,349
SERBIA 0.3%
Corporate
Bonds 0.3%
United
Group,
3.625%,
2/15/28
(EUR)
1,940,000
1,968
Total
Serbia
(Cost
$2,200)
1,968
SLOVENIA 1.6%
Corporate
Bonds 1.6%
Nova
Ljubljanska
Banka,
VR,
6.875%,
1/24/34 (3)
3,100,000
3,450
OTP
Banka,
VR,
7.375%,
6/29/26 (3)
2,100,000
2,218
Summer
BidCo
,
10.00%,
2/15/29,
(10.00%
Cash
or
10.75%
PIK) (1)(7)
803,060
851
Summer
BidCo
,
10.00%,
2/15/29,
(10.00%
Cash
or
10.75%
PIK) (7)
2,676,141
2,838
Total
Slovenia
(Cost
$9,734)
9,357
SPAIN 1.5%
Corporate
Bonds 1.5%
California
Buyer,
5.625%,
2/15/32 (1)
2,080,000
2,243
Cirsa
Finance
International,
4.50%,
3/15/27
685,000
705
Cirsa
Finance
International,
6.50%,
3/15/29 (1)
875,000
955
Cirsa
Finance
International,
6.50%,
3/15/29
2,395,000
2,614
Cirsa
Finance
International,
7.875%,
7/31/28 (1)
1,250,000
1,368
Cirsa
Finance
International,
10.375%,
11/30/27 (1)
315,000
344
Lorca
Telecom
Bondco
,
4.00%,
9/18/27
565,000
585
Total
Spain
(Cost
$8,878)
8,814
SWEDEN 0.9%
Corporate
Bonds 0.9%
Verisure
Holding,
3.25%,
2/15/27
(EUR)
1,810,000
1,846
Verisure
Holding,
7.125%,
2/1/28
(EUR) (1)
235,000
252
Verisure
Holding,
7.125%,
2/1/28
(EUR)
520,000
558
Verisure
Midholding
,
5.25%,
2/15/29
(EUR)
2,485,000
2,578
Total
Sweden
(Cost
$5,333)
5,234
T.
ROWE
PRICE
Global
High
Income
Bond
Fund
Par/Shares
$
Value
(Cost
and
value
in
$000s)
TANZANIA 0.7%
Convertible
Bonds 0.0%
HTA
Group,
2.875%,
3/18/27
(USD)
200,000
182
182
Corporate
Bonds 0.7%
HTA
Group,
7.50%,
6/4/29
(USD) (1)
3,710,000
3,781
3,781
Total
Tanzania
(Cost
$3,923)
3,963
TÜRKIYE 0.2%
Corporate
Bonds 0.2%
Ford
Otomotiv
Sanayi
,
7.125%,
4/25/29
(USD) (1)
1,335,000
1,340
Total
Türkiye
(Cost
$1,337)
1,340
UNITED
KINGDOM 10.6%
Corporate
Bonds 10.6%
Belron
U.K.
Finance,
4.625%,
10/15/29
(EUR) (1)
3,370,000
3,580
Bracken
MidCo1,
6.75%,
11/1/27,
(6.75%
Cash
or
7.5%
PIK) (7)
3,975,000
4,865
Constellation
Automotive
Financing,
4.875%,
7/15/27
1,550,000
1,834
Deuce
Finco
,
5.50%,
6/15/27 (1)
1,185,000
1,448
Deuce
Finco
,
5.50%,
6/15/27
2,960,000
3,618
eG
Global
Finance,
12.00%,
11/30/28
(USD) (1)
2,350,000
2,624
Flutter
Treasury
DAC,
6.375%,
4/29/29
(USD) (1)
5,500,000
5,557
Iceland
Bondco
,
10.875%,
12/15/27 (1)
410,000
548
Iceland
Bondco
,
10.875%,
12/15/27
2,845,000
3,802
Iceland
Bondco
,
FRN,
3M
EURIBOR
+
5.50%,
8.523%,
12/15/27
(EUR) (1)
465,000
485
INEOS
Finance,
6.375%,
4/15/29
(EUR) (1)
1,915,000
2,078
INEOS
Finance,
6.375%,
4/15/29
(EUR)
725,000
787
Jerrold
Finco
,
5.25%,
1/15/27
2,005,000
2,471
Kane
Bidco
,
5.00%,
2/15/27
(EUR)
5,695,000
5,889
Miller
Homes
Group
Finco
,
FRN,
3M
EURIBOR
+
5.25%,
8.273%,
5/15/28
(EUR)
2,845,000
2,958
Motion
Finco
,
7.375%,
6/15/30
(EUR)
2,270,000
2,389
Odeon
Finco
,
12.75%,
11/1/27
(USD) (1)
1,410,000
1,477
Pinewood
Finco
,
3.625%,
11/15/27 (1)
1,075,000
1,273
Pinnacle
Bidco
,
8.25%,
10/11/28
(EUR) (1)
650,000
713
T.
ROWE
PRICE
Global
High
Income
Bond
Fund
Par/Shares
$
Value
(Cost
and
value
in
$000s)
Pinnacle
Bidco
,
8.25%,
10/11/28
(EUR)
2,685,000
2,947
Pinnacle
Bidco
,
10.00%,
10/11/28 (1)
655,000
869
RAC
Bond,
5.25%,
11/4/27 (1)
1,690,000
2,050
RAC
Bond,
5.25%,
11/4/27
1,015,000
1,231
Virgin
Media
Secured
Finance,
4.125%,
8/15/30
1,380,000
1,479
Vmed
O2
U.K.
Financing
I,
4.50%,
7/15/31 (1)
1,200,000
1,281
Vmed
O2
U.K.
Financing
I,
4.50%,
7/15/31
790,000
843
Zegona
Finance,
6.75%,
7/15/29
(EUR) (1)
1,350,000
1,486
Zegona
Finance,
6.75%,
7/15/29
(EUR)
750,000
826
Total
United
Kingdom
(Cost
$64,397)
61,408
UNITED
STATES 50.5%
Asset-Backed
Securities 0.1%
Frontier
Issuer,
Series
2023-1,
Class
C,
11.50%,
8/20/53 (1)
181,554
194
Frontier
Issuer,
Series
2024-1,
Class
C,
11.16%,
6/20/54 (1)
109,166
122
316
Bank
Loans 9.2% (5)
1440
Foods
Topco,
FRN,
1M
TSFR
+
5.00%,
9.357%,
11/26/31
1,420,000
1,351
AMC
Entertainment
Holdings,
FRN,
1M
TSFR
+
7.00%,
1/4/29 (6)
1,461,328
1,483
Ascend
Learning,
FRN,
1M
TSFR
+
5.75%,
10.207%,
12/10/29 (6)
4,520,000
4,475
AssuredPartners
,
FRN,
1M
TSFR
+
3.50%,
7.857%,
2/14/31
3,162,384
3,167
Asurion
,
FRN,
1M
TSFR
+
5.25%,
9.721%,
1/31/28
785,424
765
Asurion
,
FRN,
1M
TSFR
+
5.25%,
9.721%,
1/20/29
3,792,352
3,651
AthenaHealth
Group,
FRN,
1M
TSFR
+
3.25%,
7.607%,
2/15/29
2,374,620
2,377
Bausch
+
Lomb,
FRN,
1M
TSFR
+
3.25%,
7.689%,
5/10/27 (6)
1,865,304
1,871
Central
Parent,
FRN,
3M
TSFR
+
3.25%,
7.579%,
7/6/29
2,962,575
2,918
Chobani
,
FRN,
1M
TSFR
+
3.75%,
8.107%,
10/25/27
643,184
648
CMG
Media,
FRN,
1M
TSFR
+
3.50%,
7.929%,
6/18/29
1,127,996
1,008
CSC
Holdings,
FRN,
1M
TSFR
+
2.50%,
7.173%,
4/15/27
1,750,000
1,612
Engineered
Machinery
Holdings,
FRN,
3M
TSFR
+
6.00%,
10.59%,
5/21/29
3,882,726
3,877
Hightower
Holding,
FRN,
3M
TSFR
+
3.50%,
8.071%,
4/21/28
1,845,725
1,853
LTI
Holdings,
FRN,
1M
TSFR
+
4.75%,
9.107%,
7/29/29 (6)
4,209,450
4,212
Medline
Borrower,
FRN,
1M
TSFR
+
2.25%,
6.607%,
10/23/28
1,396,500
1,400
T.
ROWE
PRICE
Global
High
Income
Bond
Fund
Par/Shares
$
Value
(Cost
and
value
in
$000s)
OneDigital
Borrower,
FRN,
1M
TSFR
+
3.25%,
7.607%,
7/2/31
820,875
822
OneDigital
Borrower,
FRN,
1M
TSFR
+
5.25%,
9.607%,
7/2/32
2,725,000
2,710
Pro
Mach
Group,
FRN,
1M
TSFR
+
3.50%,
7.857%,
8/31/28
493,763
497
Proampac
PG
Borrower,
FRN,
3M
TSFR
+
4.00%,
8.389%,
9/15/28
644,058
645
Project
Alpha
Intermediate
Holding,
FRN,
1M
TSFR
+
3.25%,
10/28/30 (6)
1,069,189
1,075
Project
Alpha
Intermediate
Holding,
FRN,
1M
TSFR
+
5.00%,
11/21/32 (6)
2,688,109
2,720
Radiology
Partners,
FRN,
3M
TSFR
+
3.50%,
1/31/29 (6)
2,094,771
2,065
RealPage
,
FRN,
1M
TSFR
+
3.75%,
8.079%,
4/24/28
1,695,000
1,699
Talen
Energy
Supply,
FRN,
1M
TSFR
+
2.50%,
7.023%,
12/11/31
1,495,000
1,499
Tegra118
Wealth
Solutions,
FRN,
3M
TSFR
+
4.00%,
8.521%,
2/18/27
2,443,603
2,337
TIH
Insurance
Holdings,
FRN,
1M
TSFR
+
2.75%,
7.079%,
5/6/31
361,060
362
Triton
Water
Holdings,
FRN,
3M
TSFR
+
4.00%,
8.329%,
3/31/28
514,800
519
53,618
Convertible
Preferred
Stocks 0.2%
Boeing,
6.00%,
10/15/27
23,666
1,441
1,441
Corporate
Bonds 40.0%
Aethon
United
BR,
7.50%,
10/1/29 (1)
1,936,000
1,975
Alliant
Holdings
Intermediate,
5.875%,
11/1/29 (1)
1,410,000
1,347
Alliant
Holdings
Intermediate,
6.75%,
10/15/27 (1)
830,000
822
Alliant
Holdings
Intermediate,
7.00%,
1/15/31 (1)
1,190,000
1,194
Allied
Universal
Holdco,
3.625%,
6/1/28
(EUR)
2,945,000
2,927
Alpha
Generation,
6.75%,
10/15/32 (1)
1,860,000
1,834
American
Finance
Trust,
4.50%,
9/30/28 (1)
1,280,000
1,170
AmeriGas
Partners,
9.375%,
6/1/28 (1)
4,165,000
3,998
Apollo
Commercial
Real
Estate
Finance,
4.625%,
6/15/29 (1)
5,015,000
4,338
Aretec
Group,
10.00%,
8/15/30 (1)
850,000
925
Arsenal
AIC
Parent,
11.50%,
10/1/31 (1)
2,205,000
2,459
AthenaHealth
Group,
6.50%,
2/15/30 (1)
1,730,000
1,644
Avis
Budget
Car
Rental,
8.25%,
1/15/30 (1)
2,395,000
2,449
Avis
Budget
Finance,
7.25%,
7/31/30
(EUR)
1,655,000
1,795
Bausch
+
Lomb,
8.375%,
10/1/28 (1)
1,860,000
1,934
T.
ROWE
PRICE
Global
High
Income
Bond
Fund
Par/Shares
$
Value
(Cost
and
value
in
$000s)
Carvana
,
14.00%,
6/1/31,
(14.00%
PIK) (1)(7)
3,764,000
4,503
CCO
Holdings,
4.25%,
2/1/31 (1)
2,470,000
2,152
CCO
Holdings,
4.50%,
8/15/30 (1)
2,410,000
2,157
CCO
Holdings,
6.375%,
9/1/29 (1)
280,000
277
Chobani
Holdco
II,
8.75%,
10/1/29,
(8.75%
Cash
or
9.5%
PIK) (1)(7)
930,000
983
CHS,
5.25%,
5/15/30 (1)
1,585,000
1,300
CHS,
6.875%,
4/1/28 (1)
1,430,000
1,037
CHS,
6.875%,
4/15/29 (1)
2,200,000
1,650
CHS,
10.875%,
1/15/32 (1)
1,475,000
1,517
Clear
Channel
Outdoor
Holdings,
5.125%,
8/15/27 (1)
990,000
954
Clear
Channel
Outdoor
Holdings,
7.50%,
6/1/29 (1)
900,000
785
Clear
Channel
Outdoor
Holdings,
9.00%,
9/15/28 (1)
475,000
498
Cloud
Software
Group,
6.50%,
3/31/29 (1)
858,000
841
Cloud
Software
Group,
8.25%,
6/30/32 (1)
3,270,000
3,372
Cloud
Software
Group,
9.00%,
9/30/29 (1)
1,710,000
1,734
Clydesdale
Acquisition
Holdings,
8.75%,
4/15/30 (1)
2,455,000
2,480
CMG
Media,
8.875%,
6/18/29 (1)
2,750,000
2,063
Comstock
Resources,
6.75%,
3/1/29 (1)
3,420,000
3,330
Constellium
,
3.125%,
7/15/29
(EUR)
995,000
977
Constellium
,
5.375%,
8/15/32
(EUR) (1)
1,435,000
1,505
Crescent
Energy
Finance,
7.375%,
1/15/33 (1)
2,445,000
2,378
Crescent
Energy
Finance,
7.625%,
4/1/32 (1)
2,345,000
2,330
CSC
Holdings,
5.50%,
4/15/27 (1)
1,790,000
1,600
CSC
Holdings,
6.50%,
2/1/29 (1)
690,000
578
CSC
Holdings,
7.50%,
4/1/28 (1)
1,350,000
921
CSC
Holdings,
11.25%,
5/15/28 (1)
770,000
757
CSC
Holdings,
11.75%,
1/31/29 (1)
1,230,000
1,213
CVR
Partners,
6.125%,
6/15/28 (1)
4,115,000
3,966
CVS
Health,
VR,
6.75%,
12/10/54 (3)
4,555,000
4,439
CVS
Health,
VR,
7.00%,
3/10/55 (3)
1,550,000
1,546
Dana
Financing
Luxembourg,
8.50%,
7/15/31
(EUR) (1)
1,559,000
1,764
Diamond
Foreign
Asset,
8.50%,
10/1/30 (1)
3,185,000
3,293
DISH
DBS,
5.75%,
12/1/28 (1)
3,013,000
2,576
DISH
Network,
11.75%,
11/15/27 (1)
780,000
824
EchoStar,
10.75%,
11/30/29
585,000
628
Frontier
Communications
Holdings,
6.00%,
1/15/30 (1)
2,085,000
2,072
Global
Net
Lease,
3.75%,
12/15/27 (1)
2,470,000
2,254
Graphic
Packaging
International,
2.625%,
2/1/29
(EUR) (1)
1,085,000
1,067
Graphic
Packaging
International,
3.75%,
2/1/30 (1)
2,945,000
2,651
Hightower
Holding,
9.125%,
1/31/30 (1)
1,860,000
1,953
Hilcorp
Energy
I,
6.00%,
4/15/30 (1)
1,435,000
1,345
Hilcorp
Energy
I,
6.00%,
2/1/31 (1)
285,000
264
T.
ROWE
PRICE
Global
High
Income
Bond
Fund
Par/Shares
$
Value
(Cost
and
value
in
$000s)
Hilcorp
Energy
I,
6.25%,
4/15/32 (1)
1,145,000
1,052
Hilcorp
Energy
I,
6.875%,
5/15/34 (1)
745,000
693
Hilcorp
Energy
I,
7.25%,
2/15/35 (1)
2,900,000
2,719
HUB
International,
7.375%,
1/31/32 (1)
665,000
675
Jane
Street
Group,
6.125%,
11/1/32 (1)
1,550,000
1,531
Jane
Street
Group,
7.125%,
4/30/31 (1)
2,320,000
2,378
Kobe
U.S.
Midco
2,
9.25%,
11/1/26,
(9.25%
Cash
or
10.00%
PIK) (1)(7)
1,732,250
1,464
LCPR
Senior
Secured
Financing,
5.125%,
7/15/29 (1)
990,000
788
LCPR
Senior
Secured
Financing,
6.75%,
10/15/27 (1)
2,402,000
2,165
Level
3
Financing,
4.875%,
6/15/29 (1)
675,000
587
Level
3
Financing,
10.75%,
12/15/30 (1)
3,198,684
3,575
Level
3
Financing,
11.00%,
11/15/29 (1)
279,732
314
LifePoint
Health,
4.375%,
2/15/27 (1)
370,000
353
LifePoint
Health,
5.375%,
1/15/29 (1)
1,405,000
1,224
LifePoint
Health,
9.875%,
8/15/30 (1)
1,395,000
1,501
LifePoint
Health,
10.00%,
6/1/32 (1)
540,000
548
LifePoint
Health,
11.00%,
10/15/30 (1)
1,390,000
1,526
Madison
IAQ,
5.875%,
6/30/29 (1)
1,135,000
1,070
McAfee,
7.375%,
2/15/30 (1)
4,195,000
4,069
Midcap
Financial
Issuer
Trust,
5.625%,
1/15/30 (1)
4,075,000
3,718
Midcontinent
Communications,
8.00%,
8/15/32 (1)
2,715,000
2,773
MPT
Operating
Partnership,
0.993%,
10/15/26
(EUR)
900,000
784
MPT
Operating
Partnership,
2.50%,
3/24/26
(GBP)
1,695,000
1,875
MPT
Operating
Partnership,
5.00%,
10/15/27
1,540,000
1,296
Navient
,
4.875%,
3/15/28
330,000
314
Navient
,
5.50%,
3/15/29
400,000
378
Navient
,
5.625%,
8/1/33
1,870,000
1,613
Navient
,
9.375%,
7/25/30
2,715,000
2,885
Neptune
Bidco
U.S.,
9.29%,
4/15/29 (1)
3,945,000
3,659
New
Albertsons,
7.45%,
8/1/29
4,000
4
NGL
Energy
Operating,
8.125%,
2/15/29 (1)
845,000
853
NGL
Energy
Operating,
8.375%,
2/15/32 (1)
3,055,000
3,078
NRG
Energy,
VR,
10.25% (1)(3)(4)
2,950,000
3,256
OneMain
Finance,
7.125%,
11/15/31
1,680,000
1,712
OneMain
Finance,
7.875%,
3/15/30
575,000
598
Organon
,
2.875%,
4/30/28
(EUR) (1)
205,000
206
Organon
,
5.125%,
4/30/31 (1)
3,020,000
2,710
Perrigo
Finance
Unlimited,
5.375%,
9/30/32
(EUR)
2,110,000
2,261
PG&E,
VR,
7.375%,
3/15/55 (3)
4,701,000
4,824
Rivian
Holdings,
FRN,
6M
TSFR
+
6.053%,
10.502%,
10/15/26 (1)
1,815,000
1,815
Royal
Caribbean
Cruises,
5.625%,
9/30/31 (1)
1,315,000
1,294
Royal
Caribbean
Cruises,
6.00%,
2/1/33 (1)
2,255,000
2,249
T.
ROWE
PRICE
Global
High
Income
Bond
Fund
Par/Shares
$
Value
(Cost
and
value
in
$000s)
Royal
Caribbean
Cruises,
6.25%,
3/15/32 (1)
1,735,000
1,752
Seadrill
Finance,
8.375%,
8/1/30 (1)
3,770,000
3,827
Service
Properties
Trust,
4.75%,
10/1/26
1,253,000
1,190
Service
Properties
Trust,
5.50%,
12/15/27
1,865,000
1,746
Service
Properties
Trust,
8.875%,
6/15/32
1,520,000
1,402
Stagwell
Global,
5.625%,
8/15/29 (1)
3,360,000
3,192
Sunoco,
7.25%,
5/1/32 (1)
1,581,000
1,634
Tallgrass
Energy
Partners,
6.00%,
12/31/30 (1)
1,135,000
1,071
Tallgrass
Energy
Partners,
6.00%,
9/1/31 (1)
1,785,000
1,682
Tallgrass
Energy
Partners,
7.375%,
2/15/29 (1)
785,000
787
Tenneco,
8.00%,
11/17/28 (1)
2,580,000
2,399
Transocean,
8.50%,
5/15/31 (1)
2,390,000
2,342
Transocean
Aquila,
8.00%,
9/30/28 (1)
1,910,692
1,954
Trident
TPI
Holdings,
12.75%,
12/31/28 (1)
1,550,000
1,701
Univision
Communications,
7.375%,
6/30/30 (1)
3,650,000
3,495
Univision
Communications,
8.00%,
8/15/28 (1)
500,000
508
UWM
Holdings,
6.625%,
2/1/30 (1)
4,455,000
4,410
Venture
Global
Calcasieu
Pass,
3.875%,
8/15/29 (1)
495,000
453
Venture
Global
Calcasieu
Pass,
4.125%,
8/15/31 (1)
620,000
556
Venture
Global
Calcasieu
Pass,
6.25%,
1/15/30 (1)
430,000
433
Venture
Global
LNG,
8.375%,
6/1/31 (1)
2,860,000
2,978
Venture
Global
LNG,
9.50%,
2/1/29 (1)
555,000
613
Venture
Global
LNG,
9.875%,
2/1/32 (1)
455,000
498
Venture
Global
LNG,
VR,
9.00% (1)(3)(4)
4,285,000
4,472
Vistra
,
VR,
8.00% (1)(3)(4)
845,000
861
Vistra
,
Series
C,
VR,
8.875% (1)(3)(4)
4,030,000
4,312
WR
Grace
Holdings,
4.875%,
6/15/27 (1)
980,000
948
WR
Grace
Holdings,
5.625%,
8/15/29 (1)
3,275,000
3,005
231,953
Municipal
Securities 0.6%
Puerto
Rico
Commonwealth,
GO,
VR,
11/1/43 (8)
5,590,418
3,424
3,424
Preferred
Stocks 0.4%
AH
Parent,
Series
A,
Acquisition
Date:
9/27/24,
Cost $2,054 (2)(9)(10)
2,085
2,044
2,044
Total
United
States
(Cost
$294,730)
292,796
T.
ROWE
PRICE
Global
High
Income
Bond
Fund
Par/Shares
$
Value
(Cost
and
value
in
$000s)
SHORT-TERM
INVESTMENTS 3.0%
Money
Market
Funds 3.0%
T.
Rowe
Price
Government
Reserve
Fund,
4.53% (11)(12)
17,123,791
17,124
Total
Short-Term
Investments
(Cost
$17,124)
17,124
Total
Investments
in
Securities
100.0%
of
Net
Assets
(Cost
$590,299)
$
579,774
‡
Country
classifications
are
generally
based
on
MSCI
categories
or
another
unaffiliated
third
party
data
provider;
Par/Shares
are
denominated
in
the
currency
of
the
country
presented
unless
otherwise
noted.
(1)
Security
was
purchased
pursuant
to
Rule
144A
under
the
Securities
Act
of
1933
and
may
be
resold
in
transactions
exempt
from
registration
only
to
qualified
institutional
buyers.
Total
value
of
such
securities
at
period-end
amounts
to
$328,166
and
represents
56.6%
of
net
assets.
(2)
Non-income
producing
(3)
Security
is
a
fix-to-float
security,
which
carries
a
fixed
coupon
until
a
certain
date,
upon
which
it
switches
to
a
floating
rate.
Reference
rate
and
spread
are
provided
if
the
rate
is
currently
floating.
(4)
Perpetual
security
with
no
stated
maturity
date.
(5)
Bank
loan
positions
may
involve
multiple
underlying
tranches.
In
those
instances,
the
position
presented
reflects
the
aggregate
of
those
respective
underlying
tranches
and
the
rate
presented
reflects
the
weighted
average
rate
of
the
settled
positions.
(6)
All
or
a
portion
of
this
loan
is
unsettled
as
of
December
31,
2024.
The
interest
rate
for
unsettled
loans
will
be
determined
upon
settlement
after
period
end.
(7)
Security
has
the
ability
to
pay
in-kind
or
pay
in
cash.
When
applicable,
separate
rates
of
such
payments
are
disclosed.
(8)
Contingent
value
instrument
that
only
pays
out
if
a
portion
of
the
territory's
Sales
and
Use
Tax
outperforms
the
projections
in
the
Oversight
Board’s
Certified
Fiscal
Plan.
(9)
See
Note
2.
Level
3
in
fair
value
hierarchy.
(10)
Security
cannot
be
offered
for
public
resale
without
first
being
registered
under
the
Securities
Act
of
1933
and
related
rules
("restricted
security").
Acquisition
date
represents
the
day
on
which
an
enforceable
right
to
acquire
such
security
is
obtained
and
is
presented
along
with
related
cost
in
the
security
description.
The
fund
may
have
registration
rights
for
certain
restricted
securities.
Any
costs
related
to
such
registration
are
generally
borne
by
the
issuer.
The
aggregate
value
of
restricted
securities
(excluding
144A
holdings)
at
period
end
amounts
to
$2,044
and
represents
0.4%
of
net
assets.
(11)
Seven-day
yield
T.
ROWE
PRICE
Global
High
Income
Bond
Fund
.
.
.
.
.
.
.
.
.
.
(12)
Affiliated
Companies
1M
TSFR
One
month
term
SOFR
(Secured
overnight
financing
rate)
3M
EURIBOR
Three
month
EURIBOR
(Euro
interbank
offered
rate)
3M
TSFR
Three
month
term
SOFR
(Secured
overnight
financing
rate)
6M
TSFR
Six
month
term
SOFR
(Secured
overnight
financing
rate)
EUR
Euro
FRN
Floating
Rate
Note
GBP
British
Pound
GO
General
Obligation
PIK
Payment-in-kind
USD
U.S.
Dollar
VR
Variable
Rate;
rate
shown
is
effective
rate
at
period-end.
The
rates
for
certain
variable
rate
securities
are
not
based
on
a
published
reference
rate
and
spread
but
are
determined
by
the
issuer
or
agent
and
based
on
current
market
conditions.
T.
ROWE
PRICE
Global
High
Income
Bond
Fund
(Amounts
in
000s)
FORWARD
CURRENCY
EXCHANGE
CONTRACTS
Counterparty
Settlement
Receive
Deliver
Unrealized
Gain/(Loss)
BNY
Mellon
1/3/25
USD
6,013
EUR
5,719
$
88
Canadian
Imperial
Bank
of
Commerce
2/4/25
USD
1,798
GBP
1,420
21
HSBC
Bank
2/4/25
USD
27,622
GBP
21,774
371
JPMorgan
Chase
1/3/25
EUR
4,805
USD
5,039
(61)
JPMorgan
Chase
1/3/25
USD
4,249
EUR
4,062
41
RBC
Dominion
Securities
1/3/25
EUR
123,297
USD
127,674
58
RBC
Dominion
Securities
1/3/25
USD
137,055
EUR
129,586
2,808
RBC
Dominion
Securities
2/4/25
USD
127,836
EUR
123,297
(62)
Societe
Generale
1/3/25
EUR
10,910
USD
11,345
(42)
State
Street
1/3/25
EUR
1,064
USD
1,123
(21)
State
Street
1/3/25
USD
745
EUR
709
10
Net
unrealized
gain
(loss)
on
open
forward
currency
exchange
contracts
$
3,211
T.
ROWE
PRICE
Global
High
Income
Bond
Fund
The
accompanying
notes
are
an
integral
part
of
these
financial
statements.
AFFILIATED
COMPANIES
($000s)
The
fund
may
invest
in
certain
securities
that
are
considered
affiliated
companies.
As
defined
by
the
1940
Act,
an
affiliated
company
is
one
in
which
the
fund
owns
5%
or
more
of
the
outstanding
voting
securities,
or
a
company
that
is
under
common
ownership
or
control.
The
following
securities
were
considered
affiliated
companies
for
all
or
some
portion
of
the
year
ended
December
31,
2024.
Net
realized
gain
(loss),
investment
income,
change
in
net
unrealized
gain/loss,
and
purchase
and
sales
cost
reflect
all
activity
for
the
period
then
ended.
Affiliate
Net
Realized
Gain
(Loss)
Change
in
Net
Unrealized
Gain/Loss
Investment
Income
T.
Rowe
Price
Government
Reserve
Fund,
4.53%
$
—#
$
—
$
772+
Supplementary
Investment
Schedule
Affiliate
Value
12/31/23
Purchase
Cost
Sales
Cost
Value
12/31/24
T.
Rowe
Price
Government
Reserve
Fund,
4.53%
$
5,239
¤
¤
$
17,124^
#
Capital
gain
distributions
from
underlying
Price
funds
represented
$0
of
the
net
realized
gain
(loss).
+
Investment
income
comprised
$772
of
dividend
income
and
$0
of
interest
income.
¤
Purchase
and
sale
information
not
shown
for
cash
management
funds.
^
The
cost
basis
of
investments
in
affiliated
companies
was
$17,124.
T.
ROWE
PRICE
Global
High
Income
Bond
Fund
December
31,
2024
Statement
of
Assets
and
Liabilities
($000s,
except
shares
and
per
share
amounts)
Assets
Investments
in
securities,
at
value
(cost
$590,299)
$
579,774
Interest
and
dividends
receivable
9,569
Unrealized
gain
on
forward
currency
exchange
contracts
3,397
Receivable
for
shares
sold
58
Receivable
for
investment
securities
sold
11
Foreign
currency
(cost
$1)
1
Other
assets
52
Total
assets
592,862
Liabilities
Payable
for
investment
securities
purchased
10,777
Payable
for
shares
redeemed
1,636
Investment
management
fees
payable
277
Unrealized
loss
on
forward
currency
exchange
contracts
186
Due
to
affiliates
17
Other
liabilities
114
Total
liabilities
13,007
Commitments
and
Contingent
Liabilities
(note
6
)
NET
ASSETS
$
579,855
T.
ROWE
PRICE
Global
High
Income
Bond
Fund
December
31,
2024
Statement
of
Assets
and
Liabilities
($000s,
except
shares
and
per
share
amounts)
The
accompanying
notes
are
an
integral
part
of
these
financial
statements.
Net
Assets
Consist
of:
Total
distributable
earnings
(loss)
$
(45,195)
Paid-in
capital
applicable
to
67,326,529
shares
of
$0.01
par
value
capital
stock
outstanding;
18,000,000,000
shares
of
the
Corporation
authorized
625,050
NET
ASSETS
$
579,855
NET
ASSET
VALUE
PER
SHARE
Investor
Class
(Net
assets:
$124,932;
Shares
outstanding:
14,496,111)
$
8.62
Advisor
Class
(Net
assets:
$272;
Shares
outstanding:
31,581)
$
8.62
I
Class
(Net
assets:
$454,651;
Shares
outstanding:
52,798,837)
$
8.61
T.
ROWE
PRICE
Global
High
Income
Bond
Fund
Year
Ended
12/31/24
Investment
Income
(Loss)
Income
.
Interest
$
30,196
Dividend
846
Total
income
31,042
Expenses
Investment
management
2,319
Shareholder
servicing
Investor
Class
$
221
Advisor
Class
2
I
Class
24
247
Prospectus
and
shareholder
reports
Investor
Class
8
I
Class
7
15
Custody
and
accounting
237
Registration
63
Legal
and
audit
45
Directors
1
Miscellaneous
24
Waived
/
paid
by
Price
Associates
(257)
Total
expenses
2,694
Net
investment
income
28,348
T.
ROWE
PRICE
Global
High
Income
Bond
Fund
The
accompanying
notes
are
an
integral
part
of
these
financial
statements.
Year
Ended
12/31/24
Realized
and
Unrealized
Gain
/
Loss
–
Net
realized
gain
(loss)
Securities
(7,296)
Swaps
72
Forward
currency
exchange
contracts
7,566
Foreign
currency
transactions
161
Net
realized
gain
503
Change
in
net
unrealized
gain
/
loss
Securities
(449)
Forward
currency
exchange
contracts
4,153
Other
assets
and
liabilities
denominated
in
foreign
currencies
(60)
Change
in
net
unrealized
gain
/
loss
3,644
Net
realized
and
unrealized
gain
/
loss
4,147
INCREASE
IN
NET
ASSETS
FROM
OPERATIONS
$
32,495
T.
ROWE
PRICE
Global
High
Income
Bond
Fund
Statement
of
Changes
in
Net
Assets
Year
.
.
.
.
.
.
.
.
.
.
.
.
.
.
Ended
.
.
.
.
.
.
.
.
.
.
.
.
.
.
12/31/24
12/31/23
Increase
(Decrease)
in
Net
Assets
Operations
Net
investment
income
$
28,348
$
19,376
Net
realized
gain
(loss)
503
(11,664)
Change
in
net
unrealized
gain
/
loss
3,644
29,728
Increase
in
net
assets
from
operations
32,495
37,440
Distributions
to
shareholders
Net
earnings
Investor
Class
(7,027)
(3,086)
Advisor
Class
(19)
(17)
I
Class
(21,242)
(12,834)
Tax
return
of
capital
–
–
Investor
Class
–
(670)
Advisor
Class
–
(4)
I
Class
–
(2,775)
Decrease
in
net
assets
from
distributions
(28,288)
(19,386)
Capital
share
transactions
*
Shares
sold
Investor
Class
87,279
13,238
Advisor
Class
1
15
I
Class
241,121
85,890
Distributions
reinvested
Investor
Class
6,718
3,408
Advisor
Class
19
21
I
Class
19,591
13,235
Shares
redeemed
Investor
Class
(28,691)
(18,292)
Advisor
Class
(72)
(66)
I
Class
(51,353)
(74,534)
Increase
in
net
assets
from
capital
share
transactions
274,613
22,915
T.
ROWE
PRICE
Global
High
Income
Bond
Fund
Statement
of
Changes
in
Net
Assets
The
accompanying
notes
are
an
integral
part
of
these
financial
statements.
Year
.
.
.
.
.
.
.
.
.
.
.
.
.
.
Ended
.
.
.
.
.
.
.
.
.
.
.
.
.
.
12/31/24
12/31/23
Net
Assets
Increase
during
period
278,820
40,969
Beginning
of
period
301,035
260,066
End
of
period
$
579,855
$
301,035
*Share
information
(000s)
Shares
sold
Investor
Class
10,243
1,617
Advisor
Class
–
(1)
2
I
Class
27,887
10,585
Distributions
reinvested
Investor
Class
785
418
Advisor
Class
2
3
I
Class
2,290
1,624
Shares
redeemed
Investor
Class
(3,366)
(2,251)
Advisor
Class
(8)
(8)
I
Class
(5,998)
(9,156)
Increase
in
shares
outstanding
31,835
2,834
(1)
Amount
rounds
to
less
than
1,000
shares
T.
ROWE
PRICE
Global
High
Income
Bond
Fund
NOTES
TO
FINANCIAL
STATEMENTS
T.
Rowe
Price
International
Funds,
Inc. (the
corporation) is
registered
under
the
Investment
Company
Act
of
1940
(the
1940
Act).
The
Global
High
Income
Bond
Fund
(the
fund)
is a
diversified, open-end
management
investment
company
established
by
the
corporation. The
fund
seeks high
income
and,
secondarily,
capital
appreciation.
The
fund
has three classes
of
shares:
the
Global
High
Income
Bond
Fund
(Investor
Class),
the
Global
High
Income
Bond
Fund–
Advisor
Class
(Advisor
Class)
and
the
Global
High
Income
Bond
Fund–I
Class
(I
Class).
Advisor
Class
shares
are
sold
only
through
various
brokers
and
other
financial
intermediaries.
I
Class
shares
require
a
$500,000
initial
investment
minimum,
although
the
minimum
generally
is
waived
or
reduced
for
financial
intermediaries,
eligible
retirement
plans,
and
certain
other
accounts.
The
Advisor
Class
operates
under
a
Board-approved
Rule
12b-1
plan
pursuant
to
which
the
class
compensates
financial
intermediaries
for
distribution,
shareholder
servicing,
and/or
certain
administrative
services;
the
Investor
and
I
Classes
do
not
pay
Rule
12b-1
fees. Each
class
has
exclusive
voting
rights
on
matters
related
solely
to
that
class;
separate
voting
rights
on
matters
that
relate
to
all
classes;
and,
in
all
other
respects,
the
same
rights
and
obligations
as
the
other
classes.
NOTE
1
-
SIGNIFICANT
ACCOUNTING
POLICIES
Basis
of
Preparation
The fund
is
an
investment
company
and
follows
accounting
and
reporting
guidance
in
the
Financial
Accounting
Standards
Board
(FASB)
Accounting
Standards
Codification
Topic
946
(ASC
946).
The
accompanying
financial
statements
were
prepared
in
accordance
with
accounting
principles
generally
accepted
in
the
United
States
of
America
(GAAP),
including,
but
not
limited
to,
ASC
946.
GAAP
requires
the
use
of
estimates
made
by
management.
Management
believes
that
estimates
and
valuations
are
appropriate;
however,
actual
results
may
differ
from
those
estimates,
and
the
valuations
reflected
in
the
accompanying
financial
statements
may
differ
from
the
value
ultimately
realized
upon
sale
or
maturity.
Investment
Transactions,
Investment
Income,
and
Distributions
Investment
transactions
are
accounted
for
on
the
trade
date
basis.
Income
and
expenses
are
recorded
on
the
accrual
basis.
Realized
gains
and
losses
are
reported
on
the
identified
cost
basis. Premiums
and
discounts
on
debt
securities
are
amortized
for
financial
reporting
purposes. Paydown
gains
and
losses
are
recorded
as
an
adjustment
to
interest
income. Income
tax-related
interest
and
T.
ROWE
PRICE
Global
High
Income
Bond
Fund
penalties,
if
incurred,
are
recorded
as
income
tax
expense. Dividends
received
from other
investment
companies are
reflected
as
dividend income;
capital
gain
distributions
are
reflected
as
realized
gain/loss. Dividend
income and
capital
gain
distributions
are
recorded
on
the
ex-dividend
date. Earnings
on
investments
recognized
as
partnerships
for
federal
income
tax
purposes
reflect
the
tax
character
of
such
earnings. Non-cash
dividends,
if
any,
are
recorded
at
the
fair
market
value
of
the
asset
received. Proceeds
from
litigation
payments,
if
any,
are
included
in
either
net
realized
gain
(loss)
or
change
in
net
unrealized
gain/loss
from
securities. Distributions
to
shareholders
are
recorded
on
the
ex-dividend
date. Income
distributions,
if
any, are
declared
by
each
class daily
and
paid
monthly. A
capital
gain
distribution,
if
any, may
also
be
declared
and
paid
by
the
fund
annually.
Currency
Translation
Assets,
including
investments,
and
liabilities
denominated
in
foreign
currencies
are
translated
into
U.S.
dollar
values
each
day
at
the
prevailing
exchange
rate,
using
the
mean
of
the
bid
and
asked
prices
of
such
currencies
against
U.S.
dollars
as
provided
by
an
outside
pricing
service.
Purchases
and
sales
of
securities,
income,
and
expenses
are
translated
into
U.S.
dollars
at
the
prevailing
exchange
rate
on
the
respective
date
of
such
transaction.
The
effect
of
changes
in
foreign
currency
exchange
rates
on
realized
and
unrealized
security
gains
and
losses
is
not
bifurcated
from
the
portion
attributable
to
changes
in
market
prices.
Class
Accounting
Shareholder
servicing,
prospectus,
and
shareholder
report
expenses
incurred
by
each
class
are
charged
directly
to
the
class
to
which
they
relate.
Expenses
common
to
all
classes
and
investment
income
are
allocated
to
the
classes
based
upon
the
relative
daily
net
assets
of
each
class’s
settled
shares;
realized
and
unrealized
gains
and
losses
are
allocated
based
upon
the
relative
daily
net
assets
of
each
class’s
outstanding
shares.
The
Advisor
Class
pays
Rule
12b-1
fees,
in
an
amount
not
exceeding
0.25%
of
the
class’s
average
daily
net
assets.
Capital
Transactions
Each
investor’s
interest
in
the
net
assets
of the
fund
is
represented
by
fund
shares. The
fund’s
net
asset
value
(NAV)
per
share
is
computed
at
the
close
of
the
New
York
Stock
Exchange
(NYSE),
normally
4
p.m.
Eastern
time,
each
day
the
NYSE
is
open
for
business.
However,
the
NAV
per
share
may
be
calculated
at
a
time
other
than
the
normal
close
of
the
NYSE
if
trading
on
the
NYSE
is
restricted,
if
the
NYSE
closes
earlier,
or
as
may
be
permitted
by
the
SEC.
Purchases
and
redemptions
of
fund
shares
are
transacted
at
the
next-computed
NAV
per
share,
after
receipt
of
the
transaction
order
by
T.
Rowe
Price
Associates,
Inc.,
or
its
agents.
T.
ROWE
PRICE
Global
High
Income
Bond
Fund
New
Accounting
Guidance
In December
2023,
the
FASB
issued
Accounting
Standards
Update
(ASU),
ASU
2023-09,
Income
Taxes
(Topic
740)
–
Improvements
to
Income
Taxes
Disclosures,
which
enhances
the
transparency
of
income
tax
disclosures.
The
ASU
requires
public
entities,
on
an
annual
basis,
to
provide
disclosure
of
specific
categories
in
the
rate
reconciliation,
as
well
as
disclosure
of
income
taxes
paid
disaggregated
by
jurisdiction.
The
amendments
under
this
ASU
are
required
to
be
applied
prospectively
and
are
effective
for
fiscal
years
beginning
after
December
15,
2024.
Management
expects
that
adoption
of
the
guidance
will
not
have
a
material
impact
on
the
fund’s
financial
statements.
Indemnification
In
the
normal
course
of
business, the
fund
may
provide
indemnification
in
connection
with
its
officers
and
directors,
service
providers,
and/or
private
company
investments. The
fund’s
maximum
exposure
under
these
arrangements
is
unknown;
however,
the
risk
of
material
loss
is
currently
considered
to
be
remote.
NOTE
2
-
VALUATION
Fair
Value
The
fund’s
financial
instruments
are
valued
at
the
close
of
the
NYSE
and
are
reported
at
fair
value,
which
GAAP
defines
as
the
price
that
would
be
received
to
sell
an
asset
or
paid
to
transfer
a
liability
in
an
orderly
transaction
between
market
participants
at
the
measurement
date. The fund’s
Board
of
Directors
(the
Board)
has
designated
T.
Rowe
Price
Associates,
Inc.
as
the
fund’s
valuation
designee
(Valuation
Designee).
Subject
to
oversight
by
the
Board,
the
Valuation
Designee
performs
the
following
functions
in
performing
fair
value
determinations:
assesses
and
manages
valuation
risks;
establishes
and
applies
fair
value
methodologies;
tests
fair
value
methodologies;
and
evaluates
pricing
vendors
and
pricing
agents.
The
duties
and
responsibilities
of
the
Valuation
Designee
are
performed
by
its
Valuation
Committee. The
Valuation
Designee provides
periodic
reporting
to
the
Board
on
valuation
matters.
Various
valuation
techniques
and
inputs
are
used
to
determine
the
fair
value
of
financial
instruments.
GAAP
establishes
the
following
fair
value
hierarchy
that
categorizes
the
inputs
used
to
measure
fair
value:
Level
1
–
quoted
prices
(unadjusted)
in
active
markets
for
identical
financial
instruments
that
the
fund
can
access
at
the
reporting
date
T.
ROWE
PRICE
Global
High
Income
Bond
Fund
Level
2
–
inputs
other
than
Level
1
quoted
prices
that
are
observable,
either
directly
or
indirectly
(including,
but
not
limited
to,
quoted
prices
for
similar
financial
instruments
in
active
markets,
quoted
prices
for
identical
or
similar
financial
instruments
in
inactive
markets,
interest
rates
and
yield
curves,
implied
volatilities,
and
credit
spreads)
Level
3
–
unobservable
inputs
(including
the Valuation
Designee’s assumptions
in
determining
fair
value)
Observable
inputs
are
developed
using
market
data,
such
as
publicly
available
information
about
actual
events
or
transactions,
and
reflect
the
assumptions
that
market
participants
would
use
to
price
the
financial
instrument.
Unobservable
inputs
are
those
for
which
market
data
are
not
available
and
are
developed
using
the
best
information
available
about
the
assumptions
that
market
participants
would
use
to
price
the
financial
instrument.
GAAP
requires
valuation
techniques
to
maximize
the
use
of
relevant
observable
inputs
and
minimize
the
use
of
unobservable
inputs.
When
multiple
inputs
are
used
to
derive
fair
value,
the
financial
instrument
is
assigned
to
the
level
within
the
fair
value
hierarchy
based
on
the
lowest-level
input
that
is
significant
to
the
fair
value
of
the
financial
instrument.
Input
levels
are
not
necessarily
an
indication
of
the
risk
or
liquidity
associated
with
financial
instruments
at
that
level
but
rather
the
degree
of
judgment
used
in
determining
those
values.
Valuation
Techniques
Debt
securities
generally
are
traded
in
the over-the-
counter
(OTC)
market
and
are
valued
at
prices
furnished
by
independent
pricing
services
or
by
broker
dealers
who
make
markets
in
such
securities.
When
valuing
securities,
the
independent
pricing
services
consider
factors
such
as,
but
not
limited
to,
the
yield
or
price
of
bonds
of
comparable
quality,
coupon,
maturity,
and
type,
as
well
as
prices
quoted
by
dealers
who
make
markets
in
such
securities.
Equity
securities,
including
exchange-traded
funds, listed
or
regularly
traded
on
a
securities
exchange
or
in
the
over-the-counter
(OTC)
market
are
valued
at
the
last
quoted
sale
price
or,
for
certain
markets,
the
official
closing
price
at
the
time
the
valuations
are
made.
OTC
Bulletin
Board
securities
are
valued
at
the
mean
of
the
closing
bid
and
asked
prices.
A
security
that
is
listed
or
traded
on
more
than
one
exchange
is
valued
at
the
quotation
on
the
exchange
determined
to
be
the
primary
market
for
such
security.
Listed
securities
not
traded
on
a
particular
day
are
valued
at
the
mean
of
the
closing
bid
and
asked
prices
for
domestic
securities
and
the
last
quoted
sale
or
closing
price
for
international
securities.
T.
ROWE
PRICE
Global
High
Income
Bond
Fund
The
last
quoted
prices
of
non-U.S.
equity
securities
may
be
adjusted
to
reflect
the
fair
value
of
such
securities
at
the
close
of
the
NYSE,
if
the Valuation
Designee
determines
that
developments
between
the
close
of
a
foreign
market
and
the
close
of
the
NYSE
will
affect
the
value
of
some
or
all
of
the
fund’s portfolio
securities.
Each
business
day,
the
Valuation
Designee uses
information
from
outside
pricing
services
to
evaluate
the
quoted
prices
of
portfolio
securities
and,
if
appropriate,
decide whether
it
is
necessary
to
adjust
quoted
prices
to
reflect
fair
value
by
reviewing
a
variety
of
factors,
including
developments
in
foreign
markets,
the
performance
of
U.S.
securities
markets,
and
the
performance
of
instruments
trading
in
U.S.
markets
that
represent
foreign
securities
and
baskets
of
foreign
securities. The Valuation
Designee
uses
outside
pricing
services
to
provide
it
with
quoted
prices
and
information
to
evaluate
or
adjust
those
prices.
The Valuation
Designee
cannot
predict
how
often
it
will
use
quoted
prices
and
how
often
it
will
determine
it
necessary
to
adjust
those
prices
to
reflect
fair
value.
Investments
in
mutual
funds
are
valued
at
the
mutual
fund’s
closing
NAV
per
share
on
the
day
of
valuation.
Forward
currency
exchange
contracts
are
valued
using
the
prevailing
forward
exchange
rate.
Assets
and
liabilities
other
than
financial
instruments,
including
short-term
receivables
and
payables,
are
carried
at
cost,
or
estimated
realizable
value,
if
less,
which
approximates
fair
value.
Investments
for
which
market
quotations are
not
readily
available
or
deemed
unreliable
are
valued
at
fair
value
as
determined
in
good
faith
by
the
Valuation
Designee.
The
Valuation
Designee
has
adopted
methodologies
for
determining
the
fair
value
of
investments
for
which
market
quotations
are
not
readily
available
or
deemed
unreliable,
including
the
use
of
other
pricing
sources.
Factors
used
in
determining
fair
value
vary
by
type
of
investment
and
may
include
market
or
investment
specific
considerations.
The
Valuation
Designee typically
will
afford
greatest
weight
to
actual
prices
in
arm’s
length
transactions,
to
the
extent
they
represent
orderly
transactions
between
market
participants,
transaction
information
can
be
reliably
obtained,
and
prices
are
deemed
representative
of
fair
value.
However,
the
Valuation
Designee may
also
consider
other
valuation
methods
such
as
market-based
valuation
multiples;
a
discount
or
premium
from
market
value
of
a
similar,
freely
traded
security
of
the
same
issuer;
discounted
cash
flows;
yield
to
maturity;
or
some
combination.
Fair
value
determinations
are
reviewed
on
a
regular
basis.
Because
any
fair
value
determination
involves
a
significant
amount
of
judgment,
there
is
a
degree
of
subjectivity
inherent
in
such
pricing
decisions. Fair
value
prices
determined
T.
ROWE
PRICE
Global
High
Income
Bond
Fund
by
the
Valuation
Designee could
differ
from
those
of
other
market
participants,
and
it
is
possible
that
the
fair
value
determined
for
a
security
may
be
materially
different
from
the
value
that
could
be
realized
upon
the
sale
of
that
security.
Valuation
Inputs
The
following
table
summarizes
the
fund’s
financial
instruments,
based
on
the
inputs
used
to
determine
their
fair
values
on
December
31,
2024
(for
further
detail
by
category,
please
refer
to
the
accompanying
Portfolio
of
Investments):
NOTE
3
-
DERIVATIVE
INSTRUMENTS
During
the
year ended
December
31,
2024,
the
fund
invested
in
derivative
instruments.
As
defined
by
GAAP,
a
derivative
is
a
financial
instrument
whose
value
is
derived
from
an
underlying
security
price,
foreign
exchange
rate,
interest
rate,
index
of
prices
or
rates,
or
other
variable;
it
requires
little
or
no
initial
investment
and
permits
or
requires
net
settlement
or
delivery
of
cash
or
other
assets.
The
fund
invests
in
derivatives
only
if
the
expected
risks
and
($000s)
Level
1
Level
2
Level
3
Total
Value
Assets
Fixed
Income
Securities
1
$
—
$
558,334
$
—
$
558,334
Common
Stocks
831
—
—
831
Convertible
Preferred
Stocks
1,441
—
—
1,441
Preferred
Stocks
—
—
2,044
2,044
Short-Term
Investments
17,124
—
—
17,124
Total
Securities
19,396
558,334
2,044
579,774
Forward
Currency
Exchange
Contracts
—
3,397
—
3,397
Total
$
19,396
$
561,731
$
2,044
$
583,171
Liabilities
Forward
Currency
Exchange
Contracts
$
—
$
186
$
—
$
186
1
Includes
Asset-Backed
Securities,
Bank
Loans,
Convertible
Bonds,
Corporate
Bonds
and
Municipal
Securities.
T.
ROWE
PRICE
Global
High
Income
Bond
Fund
rewards
are
consistent
with
its
investment
objectives,
policies,
and
overall
risk
profile,
as
described
in
its
prospectus
and
Statement
of
Additional
Information.
The
fund
may
use
derivatives
for
a
variety
of
purposes
and
may
use
them
to
establish
both
long
and
short
positions
within
the
fund’s
portfolio.
Potential
uses
include
to
hedge
against
declines
in
principal
value,
increase
yield,
invest
in
an
asset
with
greater
efficiency
and
at
a
lower
cost
than
is
possible
through
direct
investment,
to
enhance
return,
or
to
adjust
portfolio
duration
and
credit
exposure.
The
risks
associated
with
the
use
of
derivatives
are
different
from,
and
potentially
much
greater
than,
the
risks
associated
with
investing
directly
in
the
instruments
on
which
the
derivatives
are
based.
The
fund
values
its
derivatives
at
fair
value
and
recognizes
changes
in
fair
value
currently
in
its
results
of
operations.
Accordingly,
the
fund
does
not
follow
hedge
accounting,
even
for
derivatives
employed
as
economic
hedges.
Generally,
the
fund
accounts
for
its
derivatives
on
a
gross
basis.
It
does
not
offset
the
fair
value
of
derivative
liabilities
against
the
fair
value
of
derivative
assets
on
its
financial
statements,
nor
does
it
offset
the
fair
value
of
derivative
instruments
against
the
right
to
reclaim
or
obligation
to
return
collateral.
The
following
table
summarizes
the
fair
value
of
the
fund’s
derivative
instruments
held
as
of
December
31,
2024,
and
the
related
location
on
the
accompanying
Statement
of
Assets
and
Liabilities,
presented
by
primary
underlying
risk
exposure:
($000s)
Location
on
Statement
of
Assets
and
Liabilities
Fair
Value
Assets
Foreign
exchange
derivatives
Forwards
$
3,397
Total
$
3,397
Liabilities
Foreign
exchange
derivatives
Forwards
$
186
Total
$
186
T.
ROWE
PRICE
Global
High
Income
Bond
Fund
Additionally,
the
amount
of
gains
and
losses
on
derivative
instruments
recognized
in
fund
earnings
during
the
year ended
December
31,
2024,
and
the
related
location
on
the
accompanying
Statement
of
Operations
is
summarized
in
the
following
table
by
primary
underlying
risk
exposure:
Counterparty
Risk
and
Collateral
The
fund
invests
in
derivatives,
such
as
non-cleared
bilateral
swaps,
forward
currency
exchange
contracts,
and/or
OTC
options,
that
are
transacted
and
settle
directly
with
a
counterparty
(bilateral
derivatives),
and
thereby
may
expose
the
fund
to
counterparty
risk.
To
mitigate
this
risk,
the
fund
has
entered
into
master
netting
arrangements
(MNAs)
with
certain
counterparties
that
permit
net
settlement
under
specified
conditions
and,
for
certain
counterparties,
also
require
the
exchange
of
collateral
to
cover
mark-to-market
exposure.
MNAs
may
be
in
the
form
of
International
Swaps
and
Derivatives
Association
master
agreements
(ISDAs)
or
foreign
exchange
letter
agreements
(FX
letters).
MNAs
govern
the
ability
to
offset
amounts
the
fund
owes
a
counterparty
against
amounts
the
counterparty
owes
the
fund
(net
settlement).
Both
ISDAs
and
FX
letters
generally
allow
termination
of
transactions
and
net
settlement
upon
the
occurrence
of
contractually
specified
events,
such
as
failure
to
pay
or
bankruptcy.
In
addition,
ISDAs
specify
other
events,
the
occurrence
of
which
would
allow
one
of
the
parties
to
terminate.
For
example,
a
downgrade
in
credit
rating
of
a
counterparty
below
a
specified
rating
would
allow
the
fund
($000s)
Location
of
Gain
(Loss)
on
Statement
of
Operations
Forward
Currency
Exchange
Contracts
Swaps
Total
Realized
Gain
(Loss)
Foreign
exchange
derivatives
$
7,566
$
—
$
7,566
Credit
derivatives
—
72
72
Total
$
7,566
$
72
$
7,638
Change
in
Unrealized
Gain
(Loss)
Foreign
exchange
derivatives
$
4,153
$
—
$
4,153
Total
$
4,153
$
—
$
4,153
T.
ROWE
PRICE
Global
High
Income
Bond
Fund
to
terminate,
while
a
decline
in
the
fund’s
net
assets
of
more
than
a
specified
percentage
would
allow
the
counterparty
to
terminate.
Upon
termination,
all
transactions
with
that
counterparty
would
be
liquidated
and
a
net
termination
amount
determined.
ISDAs
typically
include
collateral
agreements
whereas
FX
letters
do
not.
Collateral
requirements
are
determined
daily
based
on
the
net
aggregate
unrealized
gain
or
loss
on
all
bilateral
derivatives
with
each
counterparty,
subject
to
minimum
transfer
amounts
that
typically
range
from
$100,000
to
$250,000.
Any
additional
collateral
required
due
to
changes
in
security
values
is
typically
transferred
the
next
business
day.
Collateral may
be
in
the
form
of
cash
or
debt
securities
issued
by
the
U.S.
government
or
related
agencies,
although
other
securities
may
be
used
depending
on
the
terms
outlined
in
the
applicable
MNA.
Cash
posted
by
the
fund
is
reflected
as
cash
deposits
in
the
accompanying
financial
statements
and
generally
is
restricted
from
withdrawal
by
the
fund;
securities
posted
by
the
fund
are
so
noted
in
the
accompanying
Portfolio
of
Investments;
both
remain
in
the
fund’s
assets.
Collateral
pledged
by
counterparties
is
not
included
in
the
fund’s
assets
because
the
fund
does
not
obtain
effective
control
over
those
assets.
For
bilateral
derivatives,
collateral
posted
or
received
by
the
fund
is
held
in
a
segregated
account
at
the
fund’s
custodian.
While
typically
not
sold
in
the
same
manner
as
equity
or
fixed
income
securities,
OTC
and
bilateral
derivatives
may
be
unwound
with
counterparties
or
transactions
assigned
to
other
counterparties
to
allow
the
fund
to
exit
the
transaction.
This
ability
is
subject
to
the
liquidity
of
underlying
positions. As
of
December
31,
2024,
no
collateral
had
been
posted
by
the
fund
to
counterparties
for
bilateral
derivatives. As
of
December
31,
2024,
collateral
pledged
by
counterparties
to
the
fund
for
bilateral
derivatives
consisted
of
securities
valued
at
$2,795,000.
Forward
Currency
Exchange
Contracts
The
fund
is
subject
to
foreign
currency
exchange
rate
risk
in
the
normal
course
of
pursuing
its
investment
objectives.
It may use
forward
currency
exchange
contracts
(forwards)
primarily
to
protect
its
non-U.S.
dollar-denominated
securities
from
adverse
currency
movements
or
to
increase
exposure
to
a
particular
foreign
currency,
to
shift
the
fund’s
foreign
currency
exposure
from
one
country
to
another,
or
to
enhance
the
fund’s
return.
A
forward
involves
an
obligation
to
purchase
or
sell
a
fixed
amount
of
a
specific
currency
on
a
future
date
at
a
price
set
at
the
time
of
the
contract.
Although
certain
forwards
may
be
settled
by
exchanging
only
the
net
gain
or
loss
on
the
contract,
most
forwards
are
settled
with
the
exchange
of
the
underlying
currencies
in
accordance
with
the
specified
terms.
Forwards
are
valued
at
the
unrealized
gain
or
loss
on
the
contract,
which
reflects
the
net
amount
the
fund
either
is
entitled
to
receive
or
obligated
to
deliver,
as
measured
T.
ROWE
PRICE
Global
High
Income
Bond
Fund
by
the
difference
between
the
forward
exchange
rates
at
the
date
of
entry
into
the
contract
and
the
forward
rates
at
the
reporting
date.
Appreciated
forwards
are
reflected
as
assets
and
depreciated
forwards
are
reflected
as
liabilities
on
the
accompanying
Statement
of
Assets
and
Liabilities.
When
a
contract
is
closed,
a
realized
gain
or
loss
is
recorded
on
the
accompanying
Statement
of
Operations.
Risks
related
to
the
use
of
forwards
include
the
possible
failure
of
counterparties
to
meet
the
terms
of
the
agreements;
that
anticipated
currency
movements
will
not
occur,
thereby
reducing
the
fund’s
total
return;
and
the
potential
for
losses
in
excess
of
the
fund’s
initial
investment.
During
the
year ended
December
31,
2024,
the
volume
of
the
fund’s
activity
in
forwards,
based
on
underlying
notional
amounts,
was
generally
between
27%
and
32%
of
net
assets.
Swaps
The
fund
is
subject
to
credit
risk in
the
normal
course
of
pursuing
its
investment
objectives
and
uses
swap
contracts
to
help
manage
such
risk.
The
fund
may
use
swaps
in
an
effort
to
manage
both
long
and
short
exposure
to
changes
in
interest
rates,
inflation
rates,
and
credit
quality;
to
adjust
overall
exposure
to
certain
markets;
to
enhance
total
return
or
protect
the
value
of
portfolio
securities;
to
serve
as
a
cash
management
tool;
or
to
adjust
portfolio
duration
and
credit
exposure.
Swap
agreements
can
be
settled
either
directly
with
the
counterparty
(bilateral
swap)
or
through
a
central
clearinghouse
(centrally
cleared
swap).
Fluctuations
in
the
fair
value
of
a
contract
are
reflected
in
unrealized
gain
or
loss
and
are
reclassified
to
realized
gain
or
loss
on
the
accompanying
Statement
of
Operations upon
contract
termination
or
cash
settlement.
Net
periodic
receipts
or
payments
required
by
a
contract
increase
or
decrease,
respectively,
the
value
of
the
contract
until
the
contractual
payment
date,
at
which
time
such
amounts
are
reclassified
from
unrealized
to
realized
gain
or
loss
on
the
accompanying
Statement
of
Operations.
For
bilateral
swaps,
cash
payments
are
made
or
received
by
the
fund
on
a
periodic
basis
in
accordance
with
contract
terms;
unrealized
gain
on
contracts
and
premiums
paid
are
reflected
as
assets
and
unrealized
loss
on
contracts
and
premiums
received
are
reflected
as
liabilities
on
the
accompanying
Statement
of
Assets
and
Liabilities.
For
bilateral
swaps,
premiums
paid
or
received
are
amortized
over
the
life
of
the
swap
and
are
recognized
as
realized
gain
or
loss
on
the
accompanying
Statement
of
Operations.
For
centrally
cleared
swaps,
payments
are
made
or
received
by
the
fund
each
day
to
settle
the
daily
fluctuation
in
the
value
of
the
contract
(variation
margin).
Accordingly,
the
value
of
a
centrally
cleared
swap
included
in
net
assets
is
the
unsettled
variation
margin;
net
T.
ROWE
PRICE
Global
High
Income
Bond
Fund
variation
margin
receivable
is
reflected
as
an
asset
and
net
variation
margin
payable
is
reflected
as
a
liability
on
the
accompanying
Statement
of
Assets
and
Liabilities.
Credit
default
swaps
are
agreements
where
one
party
(the
protection
buyer)
agrees
to
make
periodic
payments
to
another
party
(the
protection
seller)
in
exchange
for
protection
against
specified
credit
events,
such
as
certain
defaults
and
bankruptcies
related
to
an
underlying
credit
instrument,
or
issuer
or
index
of
such
instruments.
Upon
occurrence
of
a
specified
credit
event,
the
protection
seller
is
required
to
pay
the
buyer
the
difference
between
the
notional
amount
of
the
swap
and
the
value
of
the
underlying
credit,
either
in
the
form
of
a
net
cash
settlement
or
by
paying
the
gross
notional
amount
and
accepting
delivery
of
the
relevant
underlying
credit.
For
credit
default
swaps
where
the
underlying
credit
is
an
index,
a
specified
credit
event
may
affect
all
or
individual
underlying
securities
included
in
the
index
and
will
be
settled
based
upon
the
relative
weighting
of
the
affected
underlying
security(ies)
within
the
index. Risks
related
to
the
use
of
credit
default
swaps
include
the
possible
inability
of
the
fund
to
accurately
assess
the
current
and
future
creditworthiness
of
underlying
issuers,
the
possible
failure
of
a
counterparty
to
perform
in
accordance
with
the
terms
of
the
swap
agreements,
potential
government
regulation
that
could
adversely
affect
the
fund’s
swap
investments,
and
potential
losses
in
excess
of
the
fund’s
initial
investment.
During
the
year ended
December
31,
2024,
the
volume
of
the
fund’s
activity
in
swaps,
based
on
underlying
notional
amounts,
was
generally
less
than
1%
of
net
assets.
NOTE
4
-
OTHER
INVESTMENT
TRANSACTIONS
Consistent
with
its
investment
objective, the
fund
engages
in
the
following
practices
to
manage
exposure
to
certain
risks
and/or
to
enhance
performance.
The
investment
objective,
policies,
program,
and
risk
factors
of the
fund
are
described
more
fully
in the
fund’s prospectus
and
Statement
of
Additional
Information.
Emerging
and
Frontier
Markets
The fund
invests,
either
directly
or
through
investments
in
other
T.
Rowe
Price
funds,
in
securities
of
companies
located
in,
issued
by
governments
of,
or
denominated
in
or
linked
to
the
currencies
of
emerging
and
frontier
market
countries.
Emerging
markets,
and
to
a
greater
extent
frontier
markets, tend
to
have
economic
structures
that
are
less
diverse
and
mature,
less
developed
legal
and
regulatory
regimes,
and
political
systems
T.
ROWE
PRICE
Global
High
Income
Bond
Fund
that
are
less
stable,
than
those
of
developed
countries.
These
markets
may
be
subject
to
greater
political,
economic,
and
social
uncertainty
and
differing
accounting
standards
and
regulatory
environments
that
may
potentially
impact
the
fund’s
ability
to
buy
or
sell
certain
securities
or
repatriate
proceeds
to
U.S.
dollars.
Emerging
markets
securities
exchanges
are
more
likely
to
experience
delays
with
the
clearing
and
settling
of
trades,
as
well
as
the
custody
of
holdings
by
local
banks,
agents,
and
depositories.
Such
securities
are
often
subject
to
greater
price
volatility,
less
liquidity,
and
higher
rates
of
inflation
than
U.S.
securities.
Investing
in
frontier
markets
is
typically
significantly
riskier
than
investing
in
other
countries,
including
emerging
markets.
Noninvestment-Grade
Debt
The
fund
invests,
either
directly
or
through
its
investment
in
other
T.
Rowe
Price
funds,
in
noninvestment-grade
debt,
including
“high
yield”
or
“junk”
bonds
or
leveraged
loans.
Noninvestment-grade
debt
issuers
are
more
likely
to
suffer
an
adverse
change
in
financial
condition
that
would
result
in
the
inability
to
meet
a
financial
obligation.
The
noninvestment-
grade
debt
market
may
experience
sudden
and
sharp
price
swings
due
to
a
variety
of
factors
that
may
decrease
the
ability
of
issuers
to
make
principal
and
interest
payments
and
adversely
affect
the
liquidity
or
value,
or
both,
of
such
securities.
Accordingly,
securities
issued
by
such
companies
carry
a
higher
risk
of
default
and
should
be
considered
speculative.
Restricted
Securities
The
fund
invests
in
securities
that
are
subject
to
legal
or
contractual
restrictions
on
resale.
Prompt
sale
of
such
securities
at
an
acceptable
price
may
be
difficult
and
may
involve
substantial
delays
and
additional
costs.
Bank
Loans
The
fund
invests
in
bank
loans,
which
represent
an
interest
in
amounts
owed
by
a
borrower
to
a
syndicate
of
lenders.
Bank
loans
are
generally
noninvestment
grade
and
often
involve
borrowers
whose
financial
condition
is
highly
leveraged.
The
fund
may
invest
in
fixed
and
floating
rate
loans,
which
may
include
senior
floating
rate
loans;
secured
and
unsecured
loans,
second
lien
or
more
junior
loans;
and
bridge
loans
or
bridge
facilities.
Certain
bank
loans
may
be
revolvers
which
are
a
form
of
senior
bank
debt,
where
the
borrower
can
draw
down
the
credit
of
the
revolver
when
it
needs
cash
and
repays
the
credit
when
the
borrower
has
excess
cash.
Certain
loans
may
be
“covenant-lite”
loans,
which
means
the
loans
contain
fewer
maintenance
covenants
than
other
loans
(in
some
cases,
none)
and
do
not
include
terms
which
allow
the
lender
to
monitor
the
performance
of
the
borrower
and
declare
a
default
if
certain
criteria
are
breached.
As
a
result
of
these
risks,
the
fund’s
exposure
to
losses
may
be
increased.
T.
ROWE
PRICE
Global
High
Income
Bond
Fund
Bank
loans
may
be
in
the
form
of
either
assignments
or
participations.
A
loan
assignment
transfers
all
legal,
beneficial,
and
economic
rights
to
the
buyer,
and
transfer
typically
requires
consent
of
both
the
borrower
and
agent.
In
contrast,
a
loan
participation
generally
entitles
the
buyer
to
receive
the
cash
flows
from
principal,
interest,
and
any
fee
payments
on
a
portion
of
a
loan;
however,
the
seller
continues
to
hold
legal
title
to
that
portion
of
the
loan.
As
a
result,
the
buyer
of
a
loan
participation
generally
has
no
direct
recourse
against
the
borrower
and
is
exposed
to
credit
risk
of
both
the
borrower
and
seller
of
the
participation.
Bank
loans
often
have
extended
settlement
periods,
generally
may
be
repaid
at
any
time
at
the
option
of
the
borrower,
and
may
require
additional
principal
to
be
funded
at
the
borrowers’
discretion
at
a
later
date
(e.g.
unfunded
commitments
and
revolving
debt
instruments).
Until
settlement,
the
fund
maintains
liquid
assets
sufficient
to
settle
its
unfunded
loan
commitments.
The
fund
reflects
both
the
funded
portion
of
a
bank
loan
as
well
as
its
unfunded
commitment
in
the
Portfolio
of
Investments.
However,
if
a
credit
agreement
provides
no
initial
funding
of
a
tranche,
and
funding
of
the
full
commitment
at
a
future
date(s)
is
at
the
borrower’s
discretion
and
considered
uncertain,
a
loan
is
reflected
in
the
Portfolio
of
Investments
only
if,
and
only
to
the
extent
that,
the
fund
has
actually
settled
a
funding
commitment.
Other
Purchases
and
sales
of
portfolio
securities
other
than
in-kind
transactions,
if
any,
and short-term securities
aggregated $462,595,000 and
$185,755,000,
respectively,
for
the
year ended
December
31,
2024.
NOTE
5
-
FEDERAL
INCOME
TAXES
Generally,
no
provision
for
federal
income
taxes
is
required
since
the
fund
intends
to continue
to
qualify
as
a
regulated
investment
company
under
Subchapter
M
of
the
Internal
Revenue
Code
and
distribute
to
shareholders
all
of
its taxable
income
and
gains.
Distributions
determined
in
accordance
with
federal
income
tax
regulations
may
differ
in
amount
or
character
from
net
investment
income
and
realized
gains
for
financial
reporting
purposes.
The
fund
files
U.S.
federal,
state,
and
local
tax
returns
as
required.
The
fund’s
tax
returns
are
subject
to
examination
by
the
relevant
tax
authorities
until
expiration
of
the
applicable
statute
of
limitations,
which
is
generally
three
years
after
the
filing
of
the
tax
return
but
which
can
be
extended
to
six
years
in
certain
circumstances.
Tax
returns
for
open
years
have
incorporated
no
uncertain
tax
positions
that
require
a
provision
for
income
taxes.
T.
ROWE
PRICE
Global
High
Income
Bond
Fund
Capital
accounts
within
the
financial
reporting
records
are
adjusted
for
permanent
book/tax
differences
to
reflect
tax
character
but
are
not
adjusted
for
temporary
differences.
The
permanent
book/tax
adjustments,
if
any,
have
no
impact
on
results
of
operations
or
net
assets.
The
permanent
book/tax
adjustments
relate
primarily
to
the
character
of
market
discount
at
time
of
sale,
the
character
of
net
currency
gains
or
losses
and
differences
between
book/tax
amortization
policies.
The
tax
character
of
distributions
paid
for
the
periods
presented
was
as
follows:
At
December
31,
2024,
the
tax-basis
cost
of
investments
(including
derivatives,
if
any)
and
gross
unrealized
appreciation
and
depreciation
were as
follows:
At
December
31,
2024,
the
tax-basis
components
of
accumulated
net
earnings
(loss)
were
as
follows:
Temporary
differences
between
book-basis
and
tax-basis
components
of
total
distributable
earnings
(loss)
arise
when
certain
items
of
income,
gain,
or
loss
are
recognized
in
different
periods
for
financial
statement
purposes
versus
for
($000s)
December
31,
2024
December
31,
2023
Ordinary
income
(including
short-term
capital
gains,
if
any)
$
28,288
$
15,937
Return
of
capital
—
3,449
Total
distributions
$
28,288
$
19,386
($000s)
Cost
of
investments
$
586,993
Unrealized
appreciation
$
7,799
Unrealized
depreciation
(14,986)
Net
unrealized
appreciation
(depreciation)
$
(7,187)
($000s)
Undistributed
ordinary
income
$
4,760
Net
unrealized
appreciation
(depreciation)
(7,187)
Loss
carryforwards
and
deferrals
(42,768)
Total
distributable
earnings
(loss)
$
(45,195)
T.
ROWE
PRICE
Global
High
Income
Bond
Fund
tax
purposes;
these
differences
will
reverse
in
a
subsequent
reporting
period.
The
temporary
differences
relate
primarily
to
the
deferral
of
losses
from
wash
sales,
the
realization
of
gains/losses
on
certain
open
derivative
contracts,
the
recognition
of
market
discount
and
premium
amortization
and
the
character
of
income
on
certain
derivatives
contracts.
The
loss
carryforwards
and
deferrals
primarily
relate
to
capital
loss
carryforwards
and
straddle
deferrals.
Capital
loss
carryforwards
are
available
indefinitely
to
offset
future
realized
capital
gains.
Further,
a
portion
of
the
fund’s
available
capital
loss
carryforwards
are
subject
to
certain
limitations
on
amount
or
timing
of
use
related
to
an
ownership
change.
NOTE
6
-
RELATED
PARTY
TRANSACTIONS
The
fund
is
managed
by
T.
Rowe
Price
Associates,
Inc.
(Price
Associates),
a
wholly
owned
subsidiary
of
T.
Rowe
Price
Group,
Inc.
(Price
Group). Price
Associates
has
entered
into
a
sub-advisory
agreement(s)
with
one
or
more
of
its
wholly
owned
subsidiaries,
to
provide
investment
advisory
services
to
the
fund.
The
investment
management
agreement
between
the
fund
and
Price
Associates
provides
for
an
annual
investment
management
fee,
which
is
computed
daily
and
paid
monthly. The
fee
consists
of
an
individual
fund
fee,
equal
to
0.27%
of
the
fund’s
average
daily
net
assets,
and
a
group
fee.
The
group
fee
rate
is
calculated
based
on
the
combined
net
assets
of
certain
mutual
funds
sponsored
by
Price
Associates
(the
group)
applied
to
a
graduated
fee
schedule,
with
rates
ranging
from
0.48%
for
the
first
$1
billion
of
assets
to
0.260%
for
assets
in
excess
of
$845
billion.
The
fund’s
group
fee
is
determined
by
applying
the
group
fee
rate
to
the
fund’s
average
daily
net
assets. At
December
31,
2024,
the
effective
annual
group
fee
rate
was
0.28%.
The Investor
Class and Advisor
Class are
each
subject
to
a
contractual
expense
limitation
through
the
expense
limitation
dates
indicated
in
the
table
below.
This
agreement
will
continue
through
the
expense
limitation
dates
indicated
in
the
table
below,
and
may
be
renewed,
revised,
or
revoked
only
with
approval
of
the
fund’s
Board.
During
the
limitation
period,
Price
Associates
is required
to
waive
or
pay
any
expenses
(excluding
interest;
expenses
related
to
borrowings,
taxes,
and
brokerage;
non-recurring,
extraordinary
expenses;
and
acquired
fund
fees
and
expenses)
that
would
otherwise
cause
the class’s ratio
of
annualized
total
expenses
to
average
net
assets
(net
expense
ratio)
to
exceed
its
expense
limitation.
Each
class
is
required
to
repay
Price
Associates
for
expenses
previously
waived/paid
to
the
extent
the
class’s net
assets
grow
or
expenses
decline
sufficiently
to
allow
repayment
without
causing
the class’s net
expense
ratio
(after
the
repayment
is
taken
into
account)
to
exceed
the
lesser
of:
(1)
T.
ROWE
PRICE
Global
High
Income
Bond
Fund
the
expense
limitation
in
place
at
the
time
such
amounts
were
waived;
or
(2)
the class’s
current
expense
limitation.
However,
no
repayment
will
be
made
more
than
three
years
after
the
date
of
a
payment
or
waiver.
The
I
Class
is
also
subject
to
an
operating
expense
limitation
(I
Class
Limit)
pursuant
to
which
Price
Associates
is
contractually
required
to
pay
all
operating
expenses
of
the
I
Class,
excluding
management
fees;
interest;
expenses
related
to
borrowings,
taxes,
and
brokerage; non-recurring,
extraordinary expenses; and
acquired
fund
fees
and
expenses, to
the
extent
such
operating
expenses,
on
an
annualized
basis,
exceed
the
I
Class
Limit. This
agreement
will
continue
through
the
expense
limitation
date
indicated
in
the
table
below,
and
may
be
renewed,
revised,
or
revoked
only
with
approval
of
the
fund’s
Board.
The
I
Class
is
required
to
repay
Price
Associates
for
expenses
previously
paid
to
the
extent
the
class’s
net
assets
grow
or
expenses
decline
sufficiently
to
allow
repayment
without
causing
the
class’s
operating
expenses
(after
the
repayment
is
taken
into
account)
to
exceed
the
lesser
of:
(1)
the
I
Class
Limit
in
place
at
the
time
such
amounts
were
paid;
or
(2)
the
current
I
Class
Limit.
However,
no
repayment
will
be
made
more
than
three
years
after
the
date
of
a
payment
or
waiver.
Pursuant
to
these
agreements,
expenses
were waived/paid
by
and/or
repaid
to
Price
Associates
during
the year
ended December
31,
2024 as
indicated
in
the
table
below.
Including
these
amounts,
expenses
previously
waived/paid
by
Price
Associates
in
the
amount
of $848,000 remain
subject
to
repayment
by
the
fund
at
December
31,
2024. Any
repayment
of
expenses
previously
waived/paid
by
Price
Associates
during
the
period
would
be
included
in
the
net
investment
income
and
expense
ratios
presented
on
the
accompanying
Financial
Highlights.
In
addition,
the
fund
has
entered
into
service
agreements
with
Price
Associates
and
a
wholly
owned
subsidiary
of
Price
Associates,
each
an
affiliate
of
the
fund
(collectively,
Price).
Price
Associates
provides
certain
accounting
and
administrative
services
to
the
fund.
T.
Rowe
Price
Services,
Inc.
provides
shareholder
and
administrative
services
in
its
capacity
as
the
fund’s
transfer
and
dividend-disbursing
agent.
For
the
year
ended
December
31,
2024,
expenses
Investor
Class
Advisor
Class
I
Class
Expense
limitation/I
Class
Limit
0.75%
0.96%
0.05%
Expense
limitation
date
04/30/26
04/30/26
04/30/26
(Waived)/repaid
during
the
period
($000s)
$(113)
$(2)
$(142)
T.
ROWE
PRICE
Global
High
Income
Bond
Fund
incurred
pursuant
to
these
service
agreements
were
$130,000
for
Price
Associates
and
$120,000
for
T.
Rowe
Price
Services,
Inc.
All
amounts
due
to
and
due
from
Price,
exclusive
of
investment
management
fees
payable,
are
presented
net
on
the
accompanying
Statement
of
Assets
and
Liabilities.
T.
Rowe
Price
Investment
Services,
Inc.
(Investment
Services)
serves
as
distributor
to
the
fund.
Pursuant
to
an
underwriting
agreement,
no
compensation
for
any
distribution
services
provided
is
paid
to
Investment
Services
by
the
fund
(except
for
12b-1
fees
under
a
Board-approved
Rule
12b-1
plan).
The fund
may
invest
its
cash
reserves
in
certain
open-end
management
investment
companies
managed
by
Price
Associates
and
considered
affiliates
of
the
fund:
the
T.
Rowe
Price
Government
Reserve
Fund
or
the
T.
Rowe
Price
Treasury
Reserve
Fund,
organized
as
money
market
funds
(together,
the
Price
Reserve
Funds).
The
Price
Reserve
Funds
are
offered
as
short-term
investment
options
to
mutual
funds,
trusts,
and
other
accounts
managed
by
Price
Associates
or
its
affiliates
and
are
not
available
for
direct
purchase
by
members
of
the
public.
Cash
collateral
from
securities
lending,
if
any,
is
invested
in
the
T.
Rowe
Price
Government
Reserve Fund. The
Price
Reserve
Funds
pay
no
investment
management
fees.
The fund may
participate
in
securities
purchase
and
sale
transactions
with
other
funds
or
accounts
advised
by
Price
Associates
(cross
trades),
in
accordance
with
procedures
adopted
by the
fund’s
Board
and
Securities
and
Exchange
Commission
rules,
which
require,
among
other
things,
that
such
purchase
and
sale
cross
trades
be
effected
at
the
independent
current
market
price
of
the
security.
During
the
year
ended
December
31,
2024,
the
fund
had
no
purchases
or
sales
cross
trades
with
other
funds
or
accounts
advised
by
Price
Associates.
NOTE
7
-
SEGMENT
REPORTING
Operating
segments
are
defined
as
components
of
a
company
that
engage
in
business
activities
and
for
which
discrete
financial
information
is
available
and
regularly
reviewed
by
the
chief
operating
decision
maker
(CODM)
in
deciding
how
to
allocate
resources
and
assess
performance.
The
Management
Committee
of
Price
Associates
acts
as
the
fund’s
CODM.
The
fund
makes
investments
in
accordance
with
its
investment
objective
as
outlined
in
the
Prospectus
and
is
considered
one
reportable
segment
because
the
CODM
allocates
resources
and
assesses
the
operating
results
of
the
fund
on
the
whole.
T.
ROWE
PRICE
Global
High
Income
Bond
Fund
The
fund’s
revenue
is
derived
from
investments
in
portfolio
of
securities.
The
CODM
allocates
resources
and
assesses
performance
based
on
the
operating
results
of
the
fund,
which
is
consistent
with
the
results
presented
in
the
statement
of
operations,
statement
of
changes
in
net
assets
and
financial
highlights.
The
CODM
compares
the
fund’s
performance
to
its
benchmark
index
and
evaluates
the
positioning
of
the
fund
in
relation
to
its
investment
objective.
The
measure
of
segment
assets
is
net
assets
of
the
fund
which
is
disclosed
in
the
statement
of
assets
and
liabilities.
The
accounting
policies
of
the
segment
are
the
same
as
those
described
in
the
summary
of
significant
accounting
policies.
The
financial
statements
include
all
details
of
the
segment
assets,
segment
revenue
and
expenses;
and
reflect
the
financial
results
of
the
segment.
NOTE
8
-
OTHER
MATTERS
Unpredictable environmental,
political,
social
and
economic
events,
including
but
not
limited
to,
environmental
or
natural
disasters,
war
and
conflict
(including
Russia’s
military
invasion
of
Ukraine
and
the
conflict
in
Israel,
Gaza
and
surrounding
areas),
terrorism,
geopolitical
developments
(including
trading
and
tariff
arrangements,
sanctions
and
cybersecurity
attacks),
and
public
health
epidemics
(including
the
global
outbreak
of
COVID-19)
and
similar
public
health
threats,
may
significantly
affect
the
economy
and
the
markets
and
issuers
in
which
a
fund
invests.
The
extent
and
duration
of
such
events
and
resulting
market
disruptions
cannot
be
predicted.
These
and
other
similar
events
may
cause
instability
across
global
markets,
including
reduced
liquidity
and
disruptions
in
trading
markets,
while
some
events
may
affect
certain
geographic
regions,
countries,
sectors,
and
industries
more
significantly
than
others,
and
exacerbate
other
pre-existing
political,
social,
and
economic
risks.
The
fund’s
performance
could
be
negatively
impacted
if
the
value
of
a
portfolio
holding
were
harmed
by
these
or
such
events.
Management
actively
monitors
the
risks
and
financial
impacts
arising
from
such
events.
T.
ROWE
PRICE
Global
High
Income
Bond
Fund
REPORT
OF
INDEPENDENT
REGISTERED
PUBLIC
ACCOUNTING
FIRM
To
the
Board
of
Directors
of
T.
Rowe
Price
International
Funds,
Inc.
and
Shareholders
of
T.
Rowe
Price
Global
High
Income
Bond
Fund
Opinion
on
the
Financial
Statements
We
have
audited
the
accompanying
statement
of
assets
and
liabilities,
including
the
portfolio
of
investments,
of
T.
Rowe
Price
Global
High
Income
Bond
Fund
(one
of
the
funds
constituting
T.
Rowe
Price
International
Funds,
Inc.,
referred
to
hereafter
as
the
"Fund")
as
of
December
31,
2024,
the
related
statement
of
operations
for
the
year
ended
December
31,
2024,
the
statement
of
changes
in
net
assets
for
each
of
the
two
years
in
the
period
ended
December
31,
2024,
including
the
related
notes,
and
the
financial
highlights
for
each
of
the
five
years
in
the
period
ended
December
31,
2024
(collectively
referred
to
as
the
“financial
statements”).
In
our
opinion,
the
financial
statements
present
fairly,
in
all
material
respects,
the
financial
position
of
the
Fund
as
of
December
31,
2024,
the
results
of
its
operations
for
the
year
then
ended,
the
changes
in
its
net
assets
for
each
of
the
two
years
in
the
period
ended
December
31,
2024
and
the
financial
highlights
for
each
of
the
five
years
in
the
period
ended
December
31,
2024
in
conformity
with
accounting
principles
generally
accepted
in
the
United
States
of
America.
Basis
for
Opinion
These
financial
statements
are
the
responsibility
of
the
Fund’s
management.
Our
responsibility
is
to
express
an
opinion
on
the
Fund’s
financial
statements
based
on
our
audits.
We
are
a
public
accounting
firm
registered
with
the
Public
Company
Accounting
Oversight
Board
(United
States)
(PCAOB)
and
are
required
to
be
independent
with
respect
to
the
Fund
in
accordance
with
the
U.S.
federal
securities
laws
and
the
applicable
rules
and
regulations
of
the
Securities
and
Exchange
Commission
and
the
PCAOB.
We
conducted
our
audits
of
these
financial
statements
in
accordance
with
the
standards
of
the
PCAOB.
Those
standards
require
that
we
plan
and
perform
the
audit
to
obtain
reasonable
assurance
about
whether
the
financial
statements
are
free
of
material
misstatement,
whether
due
to
error
or
fraud.
T.
ROWE
PRICE
Global
High
Income
Bond
Fund
Our
audits
included
performing
procedures
to
assess
the
risks
of
material
misstatement
of
the
financial
statements,
whether
due
to
error
or
fraud,
and
performing
procedures
that
respond
to
those
risks.
Such
procedures
included
examining,
on
a
test
basis,
evidence
regarding
the
amounts
and
disclosures
in
the
financial
statements.
Our
audits
also
included
evaluating
the
accounting
principles
used
and
significant
estimates
made
by
management,
as
well
as
evaluating
the
overall
presentation
of
the
financial
statements.
Our
procedures
included
confirmation
of
securities
owned
as
of
December
31,
2024
by
correspondence
with
the
custodians,
transfer
agent
and
brokers;
when
replies
were
not
received
from
brokers,
we
performed
other
auditing
procedures.
We
believe
that
our
audits
provide
a
reasonable
basis
for
our
opinion.
/s/
PricewaterhouseCoopers
LLP
Baltimore,
Maryland
February
18,
2025
We
have
served
as
the
auditor
of
one
or
more
investment
companies
in
the
T.
Rowe
Price
group
of
investment
companies
since
1973.
REPORT
OF
INDEPENDENT
REGISTERED
PUBLIC
ACCOUNTING
FIRM
(continued)
T.
ROWE
PRICE
Global
High
Income
Bond
Fund
TAX
INFORMATION
(UNAUDITED)
FOR
THE
TAX
YEAR
ENDED 12/31/24
We
are
providing
this
information
as
required
by
the
Internal
Revenue
Code.
The
amounts
shown
may
differ
from
those
elsewhere
in
this
report
because
of
differences
between
tax
and
financial
reporting
requirements.
For
taxable
non-corporate
shareholders,
$73,000
of
the
fund's
income
represents
qualified
dividend
income
subject
to
a
long-term
capital
gains
tax
rate
of
not
greater
than
20%.
For
corporate
shareholders,
$73,000
of
the
fund's
income
qualifies
for
the
dividends-received
deduction.
For
shareholders
subject
to
interest
expense
deduction
limitation
under
Section
163(j),
$24,583,000
of
the
fund’s
income
qualifies
as
a
Section
163(j)
interest
dividend
and
can
be
treated
as
interest
income
for
purposes
of
Section
163(j),
subject
to
holding
period
requirements
and
other
limitations.
100
East
Pratt
Street
Baltimore,
MD
21202
T.
Rowe
Price
Investment
Services,
Inc.
Call
1-800-225-5132
to
request
a
prospectus
or
summary
prospectus;
each
includes
investment
objectives,
risks,
fees,
expenses,
and
other
information
that
you
should
read
and
consider
carefully
before
investing.
F36-050
2/25
Item 8. Changes in and Disagreements with Accountants for Open-End Management Investment Companies.
Not applicable.
Item 9. Proxy Disclosures for Open-End Management Investment Companies.
Not applicable.
Item 10. Remuneration Paid to Directors, Officers, and Others of Open-End Management Investment Companies.
Remuneration paid to Directors is included in Item 7 of this Form N-CSR.
Item 11. Statement Regarding Basis for Approval of Investment Advisory Contract.
If applicable, see Item 7.
Item 12. Disclosure of Proxy Voting Policies and Procedures for Closed-End Management Investment Companies.
Not applicable.
Item 13. Portfolio Managers of Closed-End Management Investment Companies.
Not applicable.
Item 14. Purchases of Equity Securities by Closed-End Management Investment Company and Affiliated Purchasers.
Not applicable.
Item 15. Submission of Matters to a Vote of Security Holders.
There has been no change to the procedures by which shareholders may recommend nominees to the registrant’s board of directors.
Item 16. Controls and Procedures.
(a) The registrant’s principal executive officer and principal financial officer have evaluated the registrant’s disclosure controls and procedures within 90 days of this filing and have concluded that the registrant’s disclosure controls and procedures were effective, as of that date, in ensuring that information required to be disclosed by the registrant in this Form N-CSR was recorded, processed, summarized, and reported timely.
(b) The registrant’s principal executive officer and principal financial officer are aware of no change in the registrant’s internal control over financial reporting that occurred during the period covered by this report that has materially affected, or is reasonably likely to materially affect, the registrant’s internal control over financial reporting.
Item 17. Disclosure of Securities Lending Activities for Closed-End Management Investment Companies.
Not applicable.
Item 18. Recovery of Erroneously Awarded Compensation.
Not applicable.
Item 19. Exhibits.
SIGNATURES
Pursuant to the requirements of the Securities Exchange Act of 1934 and the Investment Company Act of 1940, the registrant has duly caused this report to be signed on its behalf by the undersigned, thereunto duly authorized.
| | | | |
| T. Rowe Price International Funds, Inc. |
| | |
| By | | /s/ David Oestreicher | | |
| | David Oestreicher | | |
| | Principal Executive Officer | | |
| | |
| Date | | February 18, 2025 | | |
Pursuant to the requirements of the Securities Exchange Act of 1934 and the Investment Company Act of 1940, this report has been signed below by the following persons on behalf of the registrant and in the capacities and on the dates indicated.
| | | | |
| By | | /s/ David Oestreicher | | |
| | David Oestreicher | | |
| | Principal Executive Officer | | |
| | |
| Date | | February 18, 2025 | | |
| | |
| By | | /s/ Alan S. Dupski | | |
| | Alan S. Dupski | | |
| | Principal Financial Officer | | |
| | |
| Date | | February 18, 2025 | | |