UNITED STATES
SECURITIES AND EXCHANGE COMMISSION
Washington, D.C. 20549
FORM N-CSR
CERTIFIED SHAREHOLDER REPORT OF REGISTERED
MANAGEMENT INVESTMENT COMPANIES
Investment Company Act File Number: 811-02958
T. Rowe Price International Funds, Inc.
(Exact name of registrant as specified in charter)
100 East Pratt Street, Baltimore, MD 21202
(Address of principal executive offices)
David Oestreicher
100 East Pratt Street, Baltimore, MD 21202
(Name and address of agent for service)
Registrant’s telephone number, including area code: (410) 345-2000
Date of fiscal year end: December 31
Date of reporting period: December 31, 2024
Item 1. Reports to Shareholders
(a) Report pursuant to Rule 30e-1
Annual Shareholder Report
December 31, 2024
This annual shareholder report contains important information about Global Industrials Fund (the "fund") for the period of January 1, 2024 to December 31, 2024. You can find the fund’s prospectus, financial information on Form N‑CSR (which includes required tax information for dividends), holdings, proxy voting information, and other information atwww.troweprice.com/prospectus. You can also request this information without charge by contacting T. Rowe Price at 1‑800‑638‑5660 or info@troweprice.com or contacting your intermediary. This report describes changes to the fund that occurred during the reporting period.
What were the fund costs for the last year? (based on a hypothetical $10,000 investment)
| | Costs of a $10,000 investment | Costs paid as a percentage of a $10,000 investment |
|---|
| Global Industrials Fund - Investor Class | $108 | 1.05% |
|---|
What drove fund performance during the past 12 months?
Global industrials stocks produced generally positive results for the 12-month reporting period, led by strong performance in the U.S. At the sector level, companies in the automobiles, aerospace and defense, and electrical equipment segments performed well.
Versus the MSCI All Country World Index Industrials Plus Automobiles and Auto Components Net, stock selection and an underweight allocation in the air freight and logistics segment was a significant contributor to the fund’s relative performance. The portfolio benefited from exposure to delivery firm FedEx, which received support from an improving macroeconomic backdrop. Stock selection in the auto components segment also aided relative returns.
Stock selection in the industrial information technology (IT) and aerospace and defense segments detracted from relative results versus the benchmark. In IT, our position in Uber Technologies was a drag on performance as concerns grew about the ride-hailing company’s access to autonomous vehicle technology. Meanwhile, in aerospace, airplane manufacturer Boeing’s stock was weighed down by a labor strike, quality concerns, and executive turnover.
The fund seeks to provide long-term growth of capital by investing in companies in the industrials sector that we believe are growing market share, benefiting from high barriers to entry, pursuing continuous operational improvement, and allocating capital well. At the end of the period, our largest allocations were to the industrial machinery, industrial conglomerates, and aerospace and defense segments.
How has the fund performed?
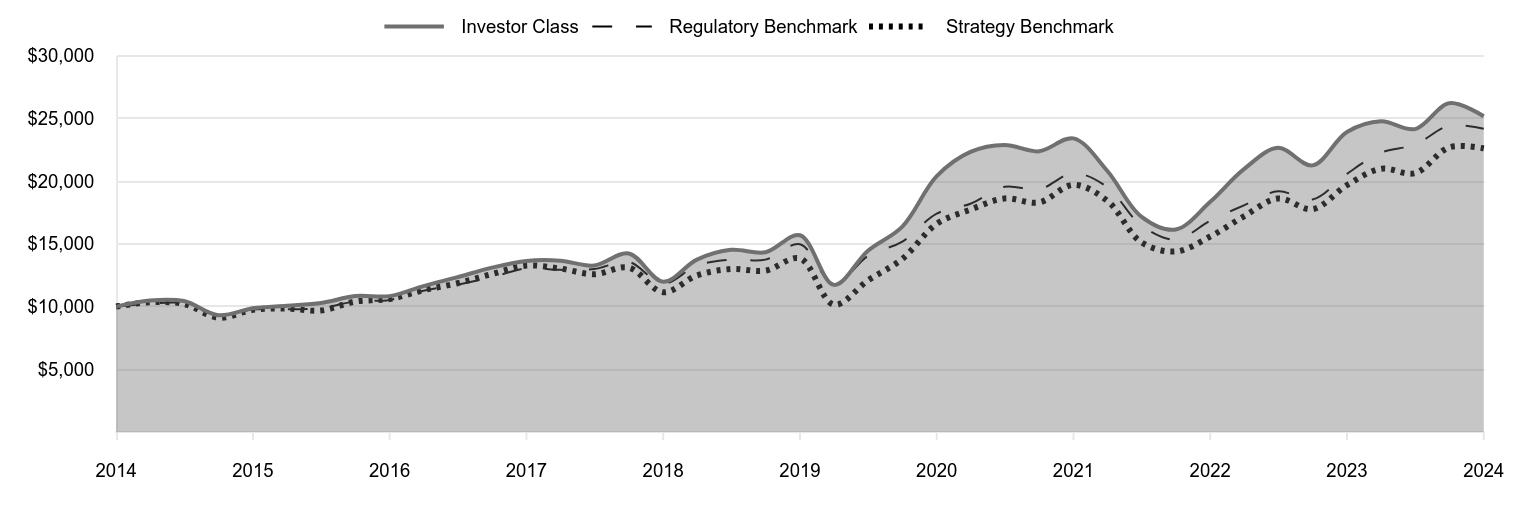
Cumulative Returns of a Hypothetical $10,000 Investment as of December 31, 2024
| Investor Class | Regulatory Benchmark | Strategy Benchmark |
|---|
| 2014 | 10,000 | 10,000 | 10,000 |
|---|
| 2015 | 10,490 | 10,231 | 10,344 |
|---|
| 2015 | 10,441 | 10,266 | 10,209 |
|---|
| 2015 | 9,314 | 9,296 | 9,113 |
|---|
| 2015 | 9,863 | 9,764 | 9,742 |
|---|
| 2016 | 10,069 | 9,787 | 9,840 |
|---|
| 2016 | 10,286 | 9,884 | 9,683 |
|---|
| 2016 | 10,837 | 10,408 | 10,403 |
|---|
| 2016 | 10,832 | 10,531 | 10,601 |
|---|
| 2017 | 11,635 | 11,259 | 11,308 |
|---|
| 2017 | 12,348 | 11,740 | 11,861 |
|---|
| 2017 | 13,102 | 12,348 | 12,593 |
|---|
| 2017 | 13,639 | 13,056 | 13,268 |
|---|
| 2018 | 13,660 | 12,931 | 13,032 |
|---|
| 2018 | 13,274 | 13,000 | 12,578 |
|---|
| 2018 | 14,235 | 13,555 | 13,108 |
|---|
| 2018 | 11,979 | 11,827 | 11,141 |
|---|
| 2019 | 13,746 | 13,267 | 12,480 |
|---|
| 2019 | 14,526 | 13,746 | 12,996 |
|---|
| 2019 | 14,331 | 13,742 | 12,867 |
|---|
| 2019 | 15,685 | 14,973 | 13,841 |
|---|
| 2020 | 11,731 | 11,774 | 10,148 |
|---|
| 2020 | 14,458 | 14,036 | 12,086 |
|---|
| 2020 | 16,381 | 15,178 | 13,806 |
|---|
| 2020 | 20,401 | 17,406 | 16,593 |
|---|
| 2021 | 22,331 | 18,202 | 17,733 |
|---|
| 2021 | 22,886 | 19,548 | 18,621 |
|---|
| 2021 | 22,379 | 19,342 | 18,301 |
|---|
| 2021 | 23,409 | 20,633 | 19,704 |
|---|
| 2022 | 20,832 | 19,527 | 18,444 |
|---|
| 2022 | 17,176 | 16,469 | 15,132 |
|---|
| 2022 | 16,146 | 15,346 | 14,392 |
|---|
| 2022 | 18,354 | 16,844 | 15,584 |
|---|
| 2023 | 20,956 | 18,075 | 17,194 |
|---|
| 2023 | 22,658 | 19,191 | 18,616 |
|---|
| 2023 | 21,257 | 18,538 | 17,765 |
|---|
| 2023 | 23,924 | 20,584 | 19,681 |
|---|
| 2024 | 24,777 | 22,271 | 20,991 |
|---|
| 2024 | 24,150 | 22,910 | 20,631 |
|---|
| 2024 | 26,220 | 24,425 | 22,702 |
|---|
| 2024 | 25,171 | 24,183 | 22,607 |
|---|
202501-4140694, 202502-4108542
Average Annual Total Returns
| | 1 Year | 5 Years | 10 Years |
|---|
| Global Industrials Fund (Investor Class) | 5.21% | 9.92% | 9.67% |
|---|
| MSCI All Country World Index Net (Regulatory Benchmark) | 17.49 | 10.06 | 9.23 |
|---|
| MSCI All Country World Index Industrials Plus Automobiles and Auto Components Net (Strategy Benchmark) | 14.86 | 10.31 | 8.50 |
|---|
The preceding line graph shows the value of a hypothetical $10,000 investment in the fund over the past 10 fiscal year periods or since inception (for funds lacking 10-year records). The fund’s performance information included in the line graph and table above is compared with a regulatory required index that represents an overall securities market (Regulatory Benchmark). In addition, the line graph and table may also include one or more indexes that more closely aligns to the fund's investment strategy (Strategy Benchmark(s)). Due to new SEC Rules on shareholder reporting the fund adopted a new broad-based securities market index, referred to as the Regulatory Benchmark. Market index returns do not include expenses, which are deducted from fund returns. The fund's total return figures reflect the reinvestment of dividends and capital gains, if any.Neither the fund’s returns nor the index returns reflect the deduction of taxes that a shareholder would pay on fund distributions or redemptions of fund shares.The fund’s past performance is not a good predictor of the fund’s future performance.Updated performance information can be found at www.troweprice.com.
What are some fund statistics?
- Total Net Assets (000s)$145,815
- Number of Portfolio Holdings97
- Investment Advisory Fees Paid (000s)$1,006
- Portfolio Turnover Rate60.9%
What did the fund invest in?
Industry Allocation (as a % of Net Assets)
| Industrial Conglomerates | 16.2% |
| Industrial Machinery | 14.7 |
| Aerospace & Defense | 12.7 |
| Automobiles | 10.7 |
| Business Services | 8.8 |
| Road & Rail | 8.0 |
| Information Technology | 7.8 |
| Electrical Equipment | 7.6 |
| Construction & Farm Equipment | 4.4 |
| Other | 9.1 |
Top Ten Holdings (as a % of Net Assets)
| Tesla | 10.6% |
| Siemens | 3.3 |
| Airbus | 3.2 |
| CSX | 2.8 |
| Fortive | 2.8 |
| General Electric | 2.7 |
| Norfolk Southern | 2.4 |
| Rolls-Royce Holdings | 2.3 |
| Parker-Hannifin | 2.2 |
| Recruit Holdings | 2.0 |
How has the fund changed?
This is a summary of certain material changes to Global Industrials Fund. Effective March 1, 2025, the fund will typically invest in at least five countries, including the U.S., and the fund will typically invest at least 25% of its net assets in securities of foreign issuers. The fund’s March 1, 2025 prospectus contains more information.
If you invest directly with T. Rowe Price, you can elect to receive future shareholder reports or other important documents through electronic delivery by enrolling at www.troweprice.com/paperless. If you invest through a financial intermediary such as an investment advisor, a bank, retirement plan sponsor or a brokerage firm, please contact that organization and ask if it can provide electronic delivery.
MSCI does not accept any liability for any errors or omissions in the indexes or data, and hereby expressly disclaim all warranties of originality, accuracy, completeness, timeliness, merchantability and fitness for a particular purpose. No party may rely on any indexes or data contained in this communication. Visit www.troweprice.com/en/us/market-data-disclosures for additional legal notices & disclaimers.
Global Industrials Fund
Investor Class (RPGIX)
T. Rowe Price Investment Services, Inc.
100 East Pratt Street
Baltimore, MD 21202
Annual Shareholder Report
December 31, 2024
This annual shareholder report contains important information about Global Industrials Fund (the "fund") for the period of January 1, 2024 to December 31, 2024. You can find the fund’s prospectus, financial information on Form N‑CSR (which includes required tax information for dividends), holdings, proxy voting information, and other information atwww.troweprice.com/prospectus. You can also request this information without charge by contacting T. Rowe Price at 1‑800‑638‑5660 or info@troweprice.com or contacting your intermediary. This report describes changes to the fund that occurred during the reporting period.
What were the fund costs for the last year? (based on a hypothetical $10,000 investment)
| | Costs of a $10,000 investment | Costs paid as a percentage of a $10,000 investment |
|---|
| Global Industrials Fund - I Class | $76 | 0.74% |
|---|
What drove fund performance during the past 12 months?
Global industrials stocks produced generally positive results for the 12-month reporting period, led by strong performance in the U.S. At the sector level, companies in the automobiles, aerospace and defense, and electrical equipment segments performed well.
Versus the MSCI All Country World Index Industrials Plus Automobiles and Auto Components Net, stock selection and an underweight allocation in the air freight and logistics segment was a significant contributor to the fund’s relative performance. The portfolio benefited from exposure to delivery firm FedEx, which received support from an improving macroeconomic backdrop. Stock selection in the auto components segment also aided relative returns.
Stock selection in the industrial information technology (IT) and aerospace and defense segments detracted from relative results versus the benchmark. In IT, our position in Uber Technologies was a drag on performance as concerns grew about the ride-hailing company’s access to autonomous vehicle technology. Meanwhile, in aerospace, airplane manufacturer Boeing’s stock was weighed down by a labor strike, quality concerns, and executive turnover.
The fund seeks to provide long-term growth of capital by investing in companies in the industrials sector that we believe are growing market share, benefiting from high barriers to entry, pursuing continuous operational improvement, and allocating capital well. At the end of the period, our largest allocations were to the industrial machinery, industrial conglomerates, and aerospace and defense segments.
How has the fund performed?
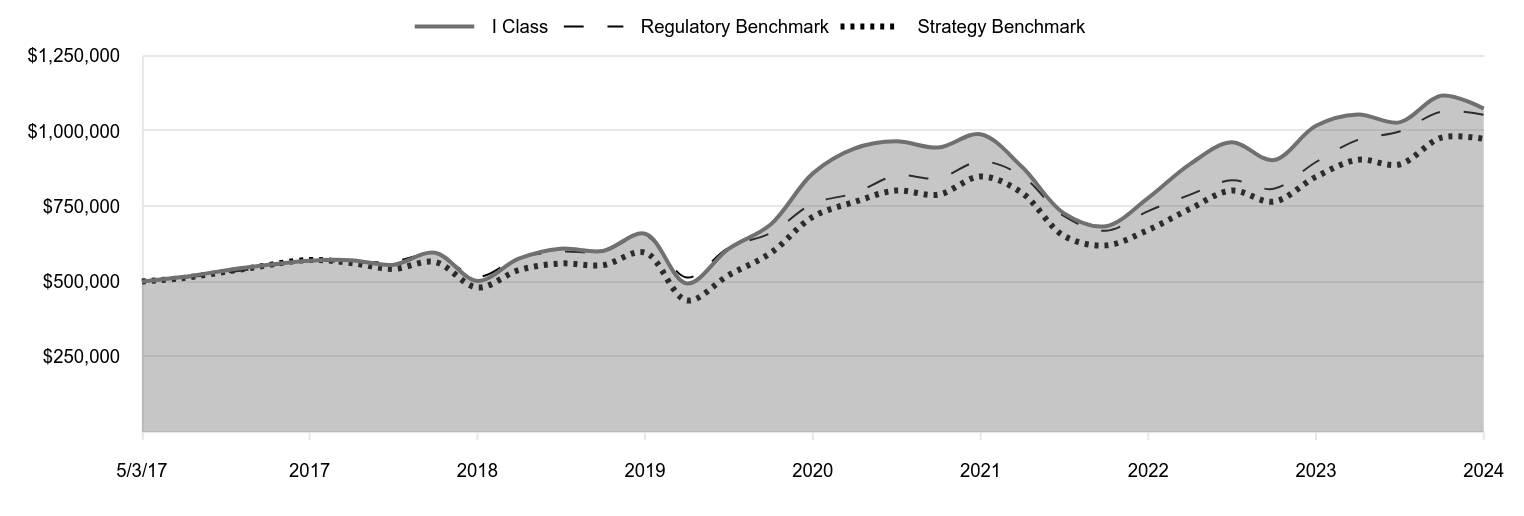
Cumulative Returns of a Hypothetical $500,000 Investment as of December 31, 2024
| I Class | Regulatory Benchmark | Strategy Benchmark |
|---|
| 5/3/17 | 500,000 | 500,000 | 500,000 |
|---|
| 6/30/17 | 514,864 | 511,592 | 510,965 |
|---|
| 9/30/17 | 546,243 | 538,103 | 542,467 |
|---|
| 12/31/17 | 569,067 | 568,937 | 571,542 |
|---|
| 3/31/18 | 570,811 | 563,466 | 561,370 |
|---|
| 6/30/18 | 555,113 | 566,473 | 541,851 |
|---|
| 9/30/18 | 595,667 | 590,700 | 564,671 |
|---|
| 12/31/18 | 501,521 | 515,375 | 479,950 |
|---|
| 3/31/19 | 575,981 | 578,122 | 537,604 |
|---|
| 6/30/19 | 609,127 | 599,003 | 559,858 |
|---|
| 9/30/19 | 601,441 | 598,848 | 554,271 |
|---|
| 12/31/19 | 658,621 | 652,451 | 596,250 |
|---|
| 3/31/20 | 493,471 | 513,054 | 437,136 |
|---|
| 6/30/20 | 608,186 | 611,657 | 520,658 |
|---|
| 9/30/20 | 689,277 | 661,387 | 594,721 |
|---|
| 12/31/20 | 859,150 | 758,506 | 714,796 |
|---|
| 3/31/21 | 941,528 | 793,181 | 763,884 |
|---|
| 6/30/21 | 965,786 | 851,823 | 802,137 |
|---|
| 9/30/21 | 945,065 | 842,842 | 788,382 |
|---|
| 12/31/21 | 989,072 | 899,113 | 848,821 |
|---|
| 3/31/22 | 881,127 | 850,914 | 794,529 |
|---|
| 6/30/22 | 727,214 | 717,656 | 651,837 |
|---|
| 9/30/22 | 683,829 | 668,714 | 619,992 |
|---|
| 12/31/22 | 777,860 | 734,000 | 671,333 |
|---|
| 3/31/23 | 889,134 | 787,625 | 740,694 |
|---|
| 6/30/23 | 962,257 | 836,279 | 801,917 |
|---|
| 9/30/23 | 903,441 | 807,824 | 765,282 |
|---|
| 12/31/23 | 1,017,338 | 896,962 | 847,819 |
|---|
| 3/31/24 | 1,054,642 | 970,480 | 904,260 |
|---|
| 6/30/24 | 1,028,530 | 998,326 | 888,745 |
|---|
| 9/30/24 | 1,117,527 | 1,064,354 | 977,957 |
|---|
| 12/31/24 | 1,074,287 | 1,053,829 | 973,841 |
|---|
202501-4140694, 202502-4108542
Average Annual Total Returns
| | 1 Year | 5 Years | Since Inception 5/3/17 |
|---|
| Global Industrials Fund (I Class) | 5.60% | 10.28% | 10.49% |
|---|
| MSCI All Country World Index Net (Regulatory Benchmark) | 17.49 | 10.06 | 10.22 |
|---|
| MSCI All Country World Index Industrials Plus Automobiles and Auto Components Net (Strategy Benchmark) | 14.86 | 10.31 | 9.09 |
|---|
The preceding line graph shows the value of a hypothetical $500,000 investment in the fund over the past 10 fiscal year periods or since inception (for funds lacking 10-year records). The fund’s performance information included in the line graph and table above is compared with a regulatory required index that represents an overall securities market (Regulatory Benchmark). In addition, the line graph and table may also include one or more indexes that more closely aligns to the fund's investment strategy (Strategy Benchmark(s)). Due to new SEC Rules on shareholder reporting the fund adopted a new broad-based securities market index, referred to as the Regulatory Benchmark. Market index returns do not include expenses, which are deducted from fund returns. The fund's total return figures reflect the reinvestment of dividends and capital gains, if any.Neither the fund’s returns nor the index returns reflect the deduction of taxes that a shareholder would pay on fund distributions or redemptions of fund shares.The fund’s past performance is not a good predictor of the fund’s future performance.Updated performance information can be found at www.troweprice.com.
What are some fund statistics?
- Total Net Assets (000s)$145,815
- Number of Portfolio Holdings97
- Investment Advisory Fees Paid (000s)$1,006
- Portfolio Turnover Rate60.9%
What did the fund invest in?
Industry Allocation (as a % of Net Assets)
| Industrial Conglomerates | 16.2% |
| Industrial Machinery | 14.7 |
| Aerospace & Defense | 12.7 |
| Automobiles | 10.7 |
| Business Services | 8.8 |
| Road & Rail | 8.0 |
| Information Technology | 7.8 |
| Electrical Equipment | 7.6 |
| Construction & Farm Equipment | 4.4 |
| Other | 9.1 |
Top Ten Holdings (as a % of Net Assets)
| Tesla | 10.6% |
| Siemens | 3.3 |
| Airbus | 3.2 |
| CSX | 2.8 |
| Fortive | 2.8 |
| General Electric | 2.7 |
| Norfolk Southern | 2.4 |
| Rolls-Royce Holdings | 2.3 |
| Parker-Hannifin | 2.2 |
| Recruit Holdings | 2.0 |
How has the fund changed?
This is a summary of certain material changes to Global Industrials Fund. Effective March 1, 2025, the fund will typically invest in at least five countries, including the U.S., and the fund will typically invest at least 25% of its net assets in securities of foreign issuers. The fund’s March 1, 2025 prospectus contains more information.
If you invest directly with T. Rowe Price, you can elect to receive future shareholder reports or other important documents through electronic delivery by enrolling at www.troweprice.com/paperless. If you invest through a financial intermediary such as an investment advisor, a bank, retirement plan sponsor or a brokerage firm, please contact that organization and ask if it can provide electronic delivery.
MSCI does not accept any liability for any errors or omissions in the indexes or data, and hereby expressly disclaim all warranties of originality, accuracy, completeness, timeliness, merchantability and fitness for a particular purpose. No party may rely on any indexes or data contained in this communication. Visit www.troweprice.com/en/us/market-data-disclosures for additional legal notices & disclaimers.
Global Industrials Fund
I Class (TRGAX)
T. Rowe Price Investment Services, Inc.
100 East Pratt Street
Baltimore, MD 21202
Item 1. (b) Notice pursuant to Rule 30e-3.
Not applicable.
Item 2. Code of Ethics.
The registrant has adopted a code of ethics, as defined in Item 2 of Form N-CSR, applicable to its principal executive officer, principal financial officer, principal accounting officer or controller, or persons performing similar functions. A copy of this code of ethics is filed as an exhibit to this Form N-CSR. No substantive amendments were approved or waivers were granted to this code of ethics during the period covered by this report.
Item 3. Audit Committee Financial Expert.
The registrant’s Board of Directors has determined that Mr. Paul F. McBride qualifies as an audit committee financial expert, as defined in Item 3 of Form N-CSR. Mr. McBride is considered independent for purposes of Item 3 of Form N-CSR.
Item 4. Principal Accountant Fees and Services.
(a) – (d) Aggregate fees billed for the last two fiscal years for professional services rendered to, or on behalf of, the registrant by the registrant’s principal accountant were as follows:
| | | | | | | | | | | | | | |
| | | 2024 | | | | | | 2023 | | | |
Audit Fees | | $ | 26,450 | | | | | | | $ | 27,575 | |
Audit-Related Fees | | | - | | | | | | | | - | |
Tax Fees | | | - | | | | | | | | - | |
All Other Fees | | | - | | | | | | | | - | |
Audit fees include amounts related to the audit of the registrant’s annual financial statements and services normally provided by the accountant in connection with statutory and regulatory filings. Audit-related fees include amounts reasonably related to the performance of the audit of the registrant’s financial statements and specifically include the issuance of a report on internal controls and, if applicable, agreed-upon procedures related to fund acquisitions. Tax fees include amounts related to services for tax compliance, tax planning, and tax advice. The nature of these services specifically includes the review of distribution calculations and the preparation of Federal, state, and excise tax returns. All other fees include the registrant’s pro-rata share of amounts for agreed-upon procedures in conjunction with service contract approvals by the registrant’s Board of Directors/Trustees.
(e)(1) The registrant’s audit committee has adopted a policy whereby audit and non-audit services performed by the registrant’s principal accountant for the registrant, its investment adviser, and any entity controlling, controlled by, or under common control with the investment adviser that provides ongoing services to the registrant require pre-approval in advance at regularly scheduled audit committee meetings. If such a service is required between regularly scheduled audit committee meetings, pre-approval may be authorized by one audit committee member with ratification at the next scheduled audit committee meeting. Waiver of pre-approval for audit or non-audit services requiring fees of a de minimis amount is not permitted.
(2) No services included in (b) – (d) above were approved pursuant to paragraph (c)(7)(i)(C) of Rule 2-01 of Regulation S-X.
(f) Less than 50 percent of the hours expended on the principal accountant’s engagement to audit the registrant’s financial statements for the most recent fiscal year were attributed to work performed by persons other than the principal accountant’s full-time, permanent employees.
(g) The aggregate fees billed for the most recent fiscal year and the preceding fiscal year by the registrant’s principal accountant for non-audit services rendered to the registrant, its investment adviser, and any entity controlling, controlled by, or under common control with the investment adviser that provides ongoing services to the registrant were $1,262,000 and $1,524,000, respectively.
(h) All non-audit services rendered in (g) above were pre-approved by the registrant’s audit committee. Accordingly, these services were considered by the registrant’s audit committee in maintaining the principal accountant’s independence.
(i) Not applicable.
(j) Not applicable.
Item 5. Audit Committee of Listed Registrants.
Not applicable.
Item 6. Investments.
(a) Not applicable. The complete schedule of investments is included in Item 7 of this Form N-CSR.
(b) Not applicable.
Item 7. Financial Statements and Financial Highlights for Open-End Management Investment Companies.
(a – b) Report pursuant to Regulation S-X.
Financial
Highlights
Portfolio
of
Investments
Financial
Statements
and
Notes
Additional
Fund
Information
Financial
Statements
and
Other
Information
For
more
insights
from
T.
Rowe
Price
investment
professionals,
go
to
troweprice.com
.
T.
ROWE
PRICE
RPGIX
Global
Industrials
Fund
TRGAX
Global
Industrials
Fund–
.
I Class
T.
ROWE
PRICE
Global
Industrials
Fund
For
a
share
outstanding
throughout
each
period
The
accompanying
notes
are
an
integral
part
of
these
financial
statements.
Investor
Class
..
Year
..
..
Ended
.
12/31/24
12/3
1/23
12/31/22
12/31/21
12/31/20
NET
ASSET
VALUE
Beginning
of
period
$
19.07
$
14.67
$
19.08
$
16.91
$
13.29
Investment
activities
Net
investment
income
(1)(2)
0.06
0.06
0.04
0.03
0.06
Net
realized
and
unrealized
gain/loss
0.94
4.39
(4.16)
2.46
3.93
Total
from
investment
activities
1.00
4.45
(4.12)
2.49
3.99
Distributions
Net
investment
income
(0.08)
(0.05)
(0.02)
(0.01)
(0.03)
Net
realized
gain
—
—
(0.27)
(0.31)
(0.34)
Total
distributions
(0.08)
(0.05)
(0.29)
(0.32)
(0.37)
NET
ASSET
VALUE
End
of
period
$
19.99
$
19.07
$
14.67
$
19.08
$
16.91
Ratios/Supplemental
Data
Total
return
(2)(3)
5.21%
30.35%
(21.59)%
14.74%
30.06%
Ratios
to
average
net
assets:
(2)
Gross
expenses
before
waivers/payments
by
Price
Associates
1.15%
1.08%
1.14%
1.05%
1.66%
Net
expenses
after
waivers/
payments
by
Price
Associates
1.05%
1.05%
1.05%
1.05%
1.05%
Net
investment
income
0.31%
0.34%
0.25%
0.14%
0.46%
Portfolio
turnover
rate
60.9%
56.1%
47.6%
39.7%
58.4%
Net
assets,
end
of
period
(in
thousands)
$68,663
$102,813
$62,071
$184,811
$85,861
0%
0%
0%
0%
0%
(1)
Per
share
amounts
calculated
using
average
shares
outstanding
method.
(2)
Includes
the
impact
of
expense-related
arrangements
with
Price
Associates.
(3)
Total
return
reflects
the
rate
that
an
investor
would
have
earned
on
an
investment
in
the
fund
during
each
period,
assuming
reinvestment
of
all
distributions,
and
payment
of
no
redemption
or
account
fees,
if
applicable.
T.
ROWE
PRICE
Global
Industrials
Fund
For
a
share
outstanding
throughout
each
period
The
accompanying
notes
are
an
integral
part
of
these
financial
statements.
I
Class
..
Year
..
..
Ended
.
12/31/24
12/31/23
12/31/22
12/31/21
12/31/20
NET
ASSET
VALUE
Beginning
of
period
$
19.09
$
14.68
$
19.15
$
17.00
$
13.32
Investment
activities
Net
investment
income
(1)(2)
0.12
0.11
0.09
0.09
0.09
Net
realized
and
unrealized
gain/loss
0.95
4.41
(4.17)
2.47
3.96
Total
from
investment
activities
1.07
4.52
(4.08)
2.56
4.05
Distributions
Net
investment
income
(0.13)
(0.11)
(0.12)
(0.10)
(0.03)
Net
realized
gain
—
—
(0.27)
(0.31)
(0.34)
Total
distributions
(0.13)
(0.11)
(0.39)
(0.41)
(0.37)
NET
ASSET
VALUE
End
of
period
$
20.03
$
19.09
$
14.68
$
19.15
$
17.00
Ratios/Supplemental
Data
Total
return
(2)(3)
5.60%
30.79%
(21.35)%
15.12%
30.45%
Ratios
to
average
net
assets:
(2)
Gross
expenses
before
waivers/payments
by
Price
Associates
0.91%
0.87%
0.90%
0.82%
1.42%
Net
expenses
after
waivers/payments
by
Price
Associates
0.74%
0.74%
0.74%
0.73%
0.73%
Net
investment
income
0.62%
0.67%
0.60%
0.49%
0.63%
Portfolio
turnover
rate
60.9%
56.1%
47.6%
39.7%
58.4%
Net
assets,
end
of
period
(in
thousands)
$77,152
$104,259
$74,851
$90,065
$14,238
0%
0%
0%
0%
0%
(1)
Per
share
amounts
calculated
using
average
shares
outstanding
method.
(2)
Includes
the
impact
of
expense-related
arrangements
with
Price
Associates.
(3)
Total
return
reflects
the
rate
that
an
investor
would
have
earned
on
an
investment
in
the
fund
during
each
period,
assuming
reinvestment
of
all
distributions,
and
payment
of
no
redemption
or
account
fees,
if
applicable.
T.
ROWE
PRICE
Global
Industrials
Fund
December
31,
2024
Shares
$
Value
(Cost
and
value
in
$000s)
‡
COMMON
STOCKS
98.4%
INDUSTRIALS
&
BUSINESS
SERVICES
97.3%
Aerospace
&
Defense
12.5%
Airbus
(EUR)
29,019
4,647
Boeing (1)
13,804
2,443
Booz
Allen
Hamilton
Holding
3,998
515
Honeywell
International
9,398
2,123
L3Harris
Technologies
6,854
1,441
Montana
Aerospace
(CHF) (1)
75,707
1,196
Rolls-Royce
Holdings
(GBP) (1)
463,726
3,288
Spirit
AeroSystems
Holdings,
Class
A (1)
10,049
342
Standardaero (1)
8,652
214
TransDigm
Group
1,608
2,038
18,247
Air
Freight
&
Logistics
0.3%
FedEx
1,449
408
408
Auto
Components
2.6%
Aptiv (1)
21,850
1,321
Atmus
Filtration
Technologies
37,027
1,451
BOE
Varitronix
(HKD) (2)
1,246,000
1,080
3,852
Automobiles
10.6%
Tesla (1)
38,084
15,380
15,380
Building
Products
3.0%
Fortune
Brands
Innovations
17,497
1,195
Steel
Dynamics
21,492
2,452
WillScot
Holdings (1)
21,320
713
4,360
Business
Services
7.8%
API
Group (1)
27,496
989
Compass
Group
(GBP)
71,918
2,393
Eurofins
Scientific
(EUR)
16,502
842
GE
HealthCare
Technologies
17,963
1,404
Keysight
Technologies (1)
8,877
1,426
Persol
Holdings
(JPY)
423,000
634
Recruit
Holdings
(JPY)
41,900
2,912
Visional
(JPY) (1)
15,000
757
11,357
T.
ROWE
PRICE
Global
Industrials
Fund
Shares
$
Value
(Cost
and
value
in
$000s)
‡
Construction
&
Engineering
2.1%
Larsen
&
Toubro
(INR)
33,373
1,403
SPIE
(EUR)
55,300
1,720
3,123
Construction
&
Farm
Equipment
4.4%
AGCO (2)
7,911
739
CRRC,
A
Shares
(CNH)
816,000
937
Cummins
4,468
1,558
Deere
1,118
474
HD
Korea
Shipbuilding
&
Offshore
Engineering
(KRW) (1)
7,923
1,218
Toro
19,961
1,599
6,525
Electrical
Equipment
7.6%
BE
Semiconductor
Industries
(EUR)
9,182
1,258
Belden (2)
6,755
761
GE
Vernova
6,468
2,127
Idec
(JPY)
32,300
506
Omron
(JPY)
41,600
1,401
Rockwell
Automation
2,999
857
Roper
Technologies
3,981
2,069
Schneider
Electric
(EUR)
3,590
894
Sensata
Technologies
Holding
19,553
536
Shenzhen
Inovance
Technology,
A
Shares
(CNH)
81,000
651
11,060
Industrial
Conglomerates
15.6%
3M
19,891
2,568
Corning
33,619
1,598
Fortive
54,680
4,101
General
Electric
23,959
3,996
GVS
(EUR) (1)
62,458
318
Linde
4,975
2,083
Nippon
Sanso
Holdings
(JPY)
28,800
799
Schlumberger
45,920
1,760
Siemens
(EUR)
24,605
4,798
TKH
Group,
CVA
(EUR) (2)
18,832
650
22,671
Industrial
Machinery
14.7%
Airtac
International
Group
(TWD)
9,000
231
Daimler
Truck
Holding
(EUR)
27,023
1,035
Dover
11,930
2,238
Harmonic
Drive
Systems
(JPY) (2)
32,900
689
T.
ROWE
PRICE
Global
Industrials
Fund
Shares
$
Value
(Cost
and
value
in
$000s)
‡
Hoshizaki
(JPY) (2)
19,000
747
Ingersoll
Rand
26,593
2,405
KION
Group
(EUR)
51,037
1,685
Middleby (1)
3,211
435
Miura
(JPY)
100,800
2,507
Parker-Hannifin
5,070
3,225
Quaker
Chemical (2)
8,111
1,142
Stanley
Black
&
Decker
28,148
2,260
TE
Connectivity
9,487
1,356
TechnipFMC
50,819
1,471
21,426
Information
Technology
7.6%
ATS
(CAD) (1)(2)
11,796
360
Keyence
(JPY)
5,200
2,114
NARI
Technology,
A
Shares
(CNH)
389,346
1,346
Renesas
Electronics
(JPY)
164,500
2,082
Silergy
(TWD)
49,000
601
Uber
Technologies (1)
23,095
1,393
Verra
Mobility (1)
48,466
1,172
Vertiv
Holdings,
Class
A
5,355
608
Zebra
Technologies,
Class
A (1)
3,635
1,404
11,080
Road
&
Rail
8.0%
Canadian
Pacific
Kansas
City
20,197
1,462
Container
Corp.
of
India
(INR)
54,006
496
CSX
128,313
4,141
Descartes
Systems
Group (1)
2,596
295
Kyushu
Railway
(JPY)
21,700
529
Norfolk
Southern
14,642
3,436
Old
Dominion
Freight
Line
7,626
1,345
11,704
Utilities
0.5%
JSW
Energy
(INR)
93,535
700
700
Total
Industrials
&
Business
Services
141,893
T.
ROWE
PRICE
Global
Industrials
Fund
Shares
$
Value
(Cost
and
value
in
$000s)
‡
NON-INDUSTRIALS
0.3%
Non-Industrials
0.3%
Open
House
Group
(JPY)
13,500
456
Total
Non-Industrials
456
Total
Miscellaneous
Common
Stocks
0.8% (3)
1,258
Total
Common
Stocks
(Cost
$115,362)
143,607
CONVERTIBLE
PREFERRED
STOCKS
1.3%
INDUSTRIALS
&
BUSINESS
SERVICES
1.3%
Aerospace
&
Defense
0.2%
ABL
Space
Systems,
Series
A-8,
Acquisition
Date:
3/24/21,
Cost $656 (1)(4)(5)
16,521
12
ABL
Space
Systems,
Series
A-9,
Acquisition
Date:
10/22/21,
Cost $1,034 (1)(4)(5)
17,010
12
Epirus,
Series
C-2,
Acquisition
Date:
1/28/22,
Cost $429 (1)(4)
(5)
76,918
212
236
Automobiles
0.1%
Sila
Nano,
Series
F,
Acquisition
Date:
1/7/21,
Cost $149 (1)(4)
(5)
3,598
70
70
Business
Services
1.0%
Redwood
Materials,
Series
C,
Acquisition
Date:
5/28/21,
Cost $1,011 (1)(4)(5)
21,331
1,264
Redwood
Materials,
Series
D,
Acquisition
Date:
6/2/23,
Cost $193 (1)(4)(5)
4,046
240
1,504
Information
Technology
0.0%
CELLINK,
Series
D,
Acquisition
Date:
1/20/22,
Cost $375 (1)
(4)(5)
18,014
36
36
Total
Industrials
&
Business
Services
1,846
Total
Convertible
Preferred
Stocks
(Cost
$3,847)
1,846
SHORT-TERM
INVESTMENTS
0.2%
Money
Market
Funds
0.2%
T.
Rowe
Price
Government
Reserve
Fund,
4.53% (6)(7)
257,199
257
Total
Short-Term
Investments
(Cost
$257)
257
T.
ROWE
PRICE
Global
Industrials
Fund
Shares
$
Value
(Cost
and
value
in
$000s)
‡
SECURITIES
LENDING
COLLATERAL
3.4%
INVESTMENTS
IN
A
POOLED
ACCOUNT
THROUGH
SECURITIES
LENDING
PROGRAM
WITH
JPMORGAN
CHASE
BANK 3.4%
Money
Market
Funds 3.4%
T.
Rowe
Price
Government
Reserve
Fund,
4.53% (6)(7)
4,981,655
4,982
Total
Investments
in
a
Pooled
Account
through
Securities
Lending
Program
with
JPMorgan
Chase
Bank
4,982
Total
Securities
Lending
Collateral
(Cost
$4,982)
4,982
Total
Investments
in
Securities
103.3%
of
Net
Assets
(Cost
$124,448)
$
150,692
‡
Shares
are
denominated
in
U.S.
dollars
unless
otherwise
noted.
(1)
Non-income
producing
(2)
See
Note
3.
All
or
a
portion
of
this
security
is
on
loan
at
December
31,
2024.
(3)
The
identity
of
certain
securities
has
been
concealed
to
protect
the
fund
while
it
completes
a
purchase
or
selling
program
for
the
securities.
(4)
See
Note
2.
Level
3
in
fair
value
hierarchy.
(5)
Security
cannot
be
offered
for
public
resale
without
first
being
registered
under
the
Securities
Act
of
1933
and
related
rules
("restricted
security").
Acquisition
date
represents
the
day
on
which
an
enforceable
right
to
acquire
such
security
is
obtained
and
is
presented
along
with
related
cost
in
the
security
description.
The
fund
may
have
registration
rights
for
certain
restricted
securities.
Any
costs
related
to
such
registration
are
generally
borne
by
the
issuer.
The
aggregate
value
of
restricted
securities
(excluding
144A
holdings)
at
period
end
amounts
to
$1,846
and
represents
1.3%
of
net
assets.
(6)
Seven-day
yield
(7)
Affiliated
Companies
CAD
Canadian
Dollar
CHF
Swiss
Franc
CNH
Offshore
China
Renminbi
CVA
Dutch
Certificate
(Certificaten
Van
Aandelen)
EUR
Euro
GBP
British
Pound
HKD
Hong
Kong
Dollar
INR
Indian
Rupee
JPY
Japanese
Yen
KRW
South
Korean
Won
TWD
Taiwan
Dollar
T.
ROWE
PRICE
Global
Industrials
Fund
The
accompanying
notes
are
an
integral
part
of
these
financial
statements.
AFFILIATED
COMPANIES
($000s)
The
fund
may
invest
in
certain
securities
that
are
considered
affiliated
companies.
As
defined
by
the
1940
Act,
an
affiliated
company
is
one
in
which
the
fund
owns
5%
or
more
of
the
outstanding
voting
securities,
or
a
company
that
is
under
common
ownership
or
control.
The
following
securities
were
considered
affiliated
companies
for
all
or
some
portion
of
the
year
ended
December
31,
2024.
Net
realized
gain
(loss),
investment
income,
change
in
net
unrealized
gain/loss,
and
purchase
and
sales
cost
reflect
all
activity
for
the
period
then
ended.
Affiliate
Net
Realized
Gain
(Loss)
Change
in
Net
Unrealized
Gain/Loss
Investment
Income
T.
Rowe
Price
Government
Reserve
Fund,
4.53%
$
—
$
—
$
52++
Totals
$
—#
$
—
$
52+
Supplementary
Investment
Schedule
Affiliate
Value
12/31/23
Purchase
Cost
Sales
Cost
Value
12/31/24
T.
Rowe
Price
Government
Reserve
Fund,
4.53%
$
10,618
¤
¤
$
5,239
Total
$
5,239^
#
Capital
gain
distributions
from
underlying
Price
funds
represented
$0
of
the
net
realized
gain
(loss).
++
Excludes
earnings
on
securities
lending
collateral,
which
are
subject
to
rebates
and
fees
as
described
in
Note
3.
+
Investment
income
comprised
$52
of
dividend
income
and
$0
of
interest
income.
¤
Purchase
and
sale
information
not
shown
for
cash
management
funds.
^
The
cost
basis
of
investments
in
affiliated
companies
was
$5,239.
T.
ROWE
PRICE
Global
Industrials
Fund
December
31,
2024
Statement
of
Assets
and
Liabilities
($000s,
except
shares
and
per
share
amounts)
Assets
Investments
in
securities,
at
value
(cost
$124,448)
$
150,692
Receivable
for
investment
securities
sold
467
Dividends
receivable
84
Foreign
currency
(cost
$38)
38
Receivable
for
shares
sold
24
Other
assets
193
Total
assets
151,498
Liabilities
Obligation
to
return
securities
lending
collateral
4,982
Payable
for
investment
securities
purchased
367
Payable
for
shares
redeemed
113
Investment
management
fees
payable
87
Due
to
affiliates
10
Other
liabilities
124
Total
liabilities
5,683
Commitments
and
Contingent
Liabilities
(note
6
)
NET
ASSETS
$
145,815
T.
ROWE
PRICE
Global
Industrials
Fund
December
31,
2024
Statement
of
Assets
and
Liabilities
($000s,
except
shares
and
per
share
amounts)
The
accompanying
notes
are
an
integral
part
of
these
financial
statements.
Net
Assets
Consist
of:
Total
distributable
earnings
(loss)
$
23,715
Paid-in
capital
applicable
to
7,286,472
shares
of
$0.01
par
value
capital
stock
outstanding;
18,000,000,000
shares
of
the
Corporation
authorized
122,100
NET
ASSETS
$
145,815
NET
ASSET
VALUE
PER
SHARE
Investor
Class
(Net
assets:
$68,663;
Shares
outstanding:
3,434,337)
$
19.99
I
Class
(Net
assets:
$77,152;
Shares
outstanding:
3,852,135)
$
20.03
T.
ROWE
PRICE
Global
Industrials
Fund
Year
Ended
12/31/24
Investment
Income
(Loss)
Income
Dividend
(net
of
foreign
taxes
of
$160)
$
2,440
Securities
lending
54
Total
income
2,494
Expenses
Investment
management
1,257
Shareholder
servicing
Investor
Class
$
204
I
Class
16
220
Prospectus
and
shareholder
reports
Investor
Class
18
I
Class
5
23
Custody
and
accounting
219
Legal
and
audit
81
Registration
47
Directors
1
Miscellaneous
19
Waived
/
paid
by
Price
Associates
(251)
Total
expenses
1,616
Net
investment
income
878
T.
ROWE
PRICE
Global
Industrials
Fund
The
accompanying
notes
are
an
integral
part
of
these
financial
statements.
Year
Ended
12/31/24
Realized
and
Unrealized
Gain
/
Loss
–
Net
realized
gain
(loss)
Securities
(net
of
foreign
taxes
of
$128)
20,231
Foreign
currency
transactions
23
Net
realized
gain
20,254
Change
in
net
unrealized
gain
/
loss
Securities
(net
of
decrease
in
deferred
foreign
taxes
of
$(155))
(11,387)
Other
assets
and
liabilities
denominated
in
foreign
currencies
(11)
Change
in
net
unrealized
gain
/
loss
(11,398)
Net
realized
and
unrealized
gain
/
loss
8,856
INCREASE
IN
NET
ASSETS
FROM
OPERATIONS
$
9,734
T.
ROWE
PRICE
Global
Industrials
Fund
Statement
of
Changes
in
Net
Assets
The
accompanying
notes
are
an
integral
part
of
these
financial
statements.
Year
.
.
.
.
.
.
.
.
.
.
.
.
.
.
Ended
.
.
.
.
.
.
.
.
.
.
.
.
.
.
12/31/24
12/31/23
Increase
(Decrease)
in
Net
Assets
Operations
Net
investment
income
$
878
$
949
Net
realized
gain
20,254
1,608
Change
in
net
unrealized
gain
/
loss
(11,398)
41,571
Increase
in
net
assets
from
operations
9,734
44,128
Distributions
to
shareholders
Net
earnings
Investor
Class
(266)
(270)
I
Class
(510)
(577)
Decrease
in
net
assets
from
distributions
(776)
(847)
Capital
share
transactions
*
Shares
sold
Investor
Class
17,840
80,666
I
Class
14,353
26,888
Distributions
reinvested
Investor
Class
263
267
I
Class
498
571
Shares
redeemed
Investor
Class
(56,118)
(60,419)
I
Class
(47,051)
(21,104)
Increase
(decrease)
in
net
assets
from
capital
share
transactions
(70,215)
26,869
Net
Assets
Increase
(decrease)
during
period
(61,257)
70,150
Beginning
of
period
207,072
136,922
End
of
period
$
145,815
$
207,072
*Share
information
(000s)
Shares
sold
Investor
Class
921
4,699
I
Class
737
1,562
Distributions
reinvested
Investor
Class
12
14
I
Class
24
30
Shares
redeemed
Investor
Class
(2,891)
(3,554)
I
Class
(2,369)
(1,230)
Increase
(decrease)
in
shares
outstanding
(3,566)
1,521
T.
ROWE
PRICE
Global
Industrials
Fund
NOTES
TO
FINANCIAL
STATEMENTS
T.
Rowe
Price
International
Funds,
Inc. (the
corporation) is
registered
under
the
Investment
Company
Act
of
1940
(the
1940
Act).
The
Global
Industrials
Fund
(the
fund)
is a
diversified, open-end
management
investment
company
established
by
the
corporation. The
fund
seeks to
provide
long-term
growth
of
capital.
The
fund
has two classes
of
shares:
the
Global
Industrials
Fund
(Investor
Class)
and
the
Global
Industrials
Fund–I
Class
(I
Class).
I
Class
shares
require
a
$500,000
initial
investment
minimum,
although
the
minimum
generally
is
waived
or
reduced
for
financial
intermediaries,
eligible
retirement
plans,
and
certain
other
accounts. Each
class
has
exclusive
voting
rights
on
matters
related
solely
to
that
class;
separate
voting
rights
on
matters
that
relate
to
both
classes;
and,
in
all
other
respects,
the
same
rights
and
obligations
as
the
other
class.
NOTE
1
-
SIGNIFICANT
ACCOUNTING
POLICIES
Basis
of
Preparation
The fund
is
an
investment
company
and
follows
accounting
and
reporting
guidance
in
the
Financial
Accounting
Standards
Board
(FASB)
Accounting
Standards
Codification
Topic
946
(ASC
946).
The
accompanying
financial
statements
were
prepared
in
accordance
with
accounting
principles
generally
accepted
in
the
United
States
of
America
(GAAP),
including,
but
not
limited
to,
ASC
946.
GAAP
requires
the
use
of
estimates
made
by
management.
Management
believes
that
estimates
and
valuations
are
appropriate;
however,
actual
results
may
differ
from
those
estimates,
and
the
valuations
reflected
in
the
accompanying
financial
statements
may
differ
from
the
value
ultimately
realized
upon
sale
or
maturity.
Investment
Transactions,
Investment
Income,
and
Distributions
Investment
transactions
are
accounted
for
on
the
trade
date
basis.
Income
and
expenses
are
recorded
on
the
accrual
basis.
Realized
gains
and
losses
are
reported
on
the
identified
cost
basis. Income
tax-related
interest
and
penalties,
if
incurred,
are
recorded
as
income
tax
expense. Dividends
received
from other
investment
companies are
reflected
as
dividend income;
capital
gain
distributions
are
reflected
as
realized
gain/loss. Dividend
income and
capital
gain
distributions
are
recorded
on
the
ex-dividend
date. Non-cash
dividends,
if
any,
are
recorded
at
the
fair
market
value
of
the
asset
received. Proceeds
from
litigation
payments,
if
any,
are
included
in
either
net
realized
gain
(loss)
or
change
in
net
unrealized
gain/loss
from
securities. Distributions
to
shareholders
are
recorded
T.
ROWE
PRICE
Global
Industrials
Fund
on
the
ex-dividend
date. Income
distributions,
if
any,
are
declared
and
paid
by
each
class annually. A
capital
gain
distribution,
if
any, may
also
be
declared
and
paid
by
the
fund
annually.
Currency
Translation
Assets,
including
investments,
and
liabilities
denominated
in
foreign
currencies
are
translated
into
U.S.
dollar
values
each
day
at
the
prevailing
exchange
rate,
using
the
mean
of
the
bid
and
asked
prices
of
such
currencies
against
U.S.
dollars
as
provided
by
an
outside
pricing
service.
Purchases
and
sales
of
securities,
income,
and
expenses
are
translated
into
U.S.
dollars
at
the
prevailing
exchange
rate
on
the
respective
date
of
such
transaction.
The
effect
of
changes
in
foreign
currency
exchange
rates
on
realized
and
unrealized
security
gains
and
losses
is
not
bifurcated
from
the
portion
attributable
to
changes
in
market
prices.
Class
Accounting
Shareholder
servicing,
prospectus,
and
shareholder
report
expenses
incurred
by
each
class
are
charged
directly
to
the
class
to
which
they
relate.
Expenses
common
to
all
classes,
investment
income,
and
realized
and
unrealized
gains
and
losses
are
allocated
to
the
classes
based
upon
the
relative
daily
net
assets
of
each
class.
Capital
Transactions
Each
investor’s
interest
in
the
net
assets
of the
fund
is
represented
by
fund
shares. The
fund’s
net
asset
value
(NAV)
per
share
is
computed
at
the
close
of
the
New
York
Stock
Exchange
(NYSE),
normally
4
p.m.
Eastern
time,
each
day
the
NYSE
is
open
for
business.
However,
the
NAV
per
share
may
be
calculated
at
a
time
other
than
the
normal
close
of
the
NYSE
if
trading
on
the
NYSE
is
restricted,
if
the
NYSE
closes
earlier,
or
as
may
be
permitted
by
the
SEC.
Purchases
and
redemptions
of
fund
shares
are
transacted
at
the
next-computed
NAV
per
share,
after
receipt
of
the
transaction
order
by
T.
Rowe
Price
Associates,
Inc.,
or
its
agents.
New
Accounting
Guidance
In December
2023,
the
FASB
issued
Accounting
Standards
Update
(ASU),
ASU
2023-09,
Income
Taxes
(Topic
740)
–
Improvements
to
Income
Taxes
Disclosures,
which
enhances
the
transparency
of
income
tax
disclosures.
The
ASU
requires
public
entities,
on
an
annual
basis,
to
provide
disclosure
of
specific
categories
in
the
rate
reconciliation,
as
well
as
disclosure
of
income
taxes
paid
disaggregated
by
jurisdiction.
The
amendments
under
this
ASU
are
required
to
be
applied
prospectively
and
are
effective
for
fiscal
years
beginning
after
December
15,
2024.
Management
expects
that
adoption
of
the
guidance
will
not
have
a
material
impact
on
the
fund’s
financial
statements.
T.
ROWE
PRICE
Global
Industrials
Fund
Indemnification
In
the
normal
course
of
business, the
fund
may
provide
indemnification
in
connection
with
its
officers
and
directors,
service
providers,
and/or
private
company
investments. The
fund’s
maximum
exposure
under
these
arrangements
is
unknown;
however,
the
risk
of
material
loss
is
currently
considered
to
be
remote.
NOTE
2
-
VALUATION
Fair
Value
The
fund’s
financial
instruments
are
valued
at
the
close
of
the
NYSE
and
are
reported
at
fair
value,
which
GAAP
defines
as
the
price
that
would
be
received
to
sell
an
asset
or
paid
to
transfer
a
liability
in
an
orderly
transaction
between
market
participants
at
the
measurement
date. The fund’s
Board
of
Directors
(the
Board)
has
designated
T.
Rowe
Price
Associates,
Inc.
as
the
fund’s
valuation
designee
(Valuation
Designee).
Subject
to
oversight
by
the
Board,
the
Valuation
Designee
performs
the
following
functions
in
performing
fair
value
determinations:
assesses
and
manages
valuation
risks;
establishes
and
applies
fair
value
methodologies;
tests
fair
value
methodologies;
and
evaluates
pricing
vendors
and
pricing
agents.
The
duties
and
responsibilities
of
the
Valuation
Designee
are
performed
by
its
Valuation
Committee. The
Valuation
Designee provides
periodic
reporting
to
the
Board
on
valuation
matters.
Various
valuation
techniques
and
inputs
are
used
to
determine
the
fair
value
of
financial
instruments.
GAAP
establishes
the
following
fair
value
hierarchy
that
categorizes
the
inputs
used
to
measure
fair
value:
Level
1
–
quoted
prices
(unadjusted)
in
active
markets
for
identical
financial
instruments
that
the
fund
can
access
at
the
reporting
date
Level
2
–
inputs
other
than
Level
1
quoted
prices
that
are
observable,
either
directly
or
indirectly
(including,
but
not
limited
to,
quoted
prices
for
similar
financial
instruments
in
active
markets,
quoted
prices
for
identical
or
similar
financial
instruments
in
inactive
markets,
interest
rates
and
yield
curves,
implied
volatilities,
and
credit
spreads)
Level
3
–
unobservable
inputs
(including
the Valuation
Designee’s assumptions
in
determining
fair
value)
Observable
inputs
are
developed
using
market
data,
such
as
publicly
available
information
about
actual
events
or
transactions,
and
reflect
the
assumptions
that
market
participants
would
use
to
price
the
financial
instrument.
Unobservable
inputs
are
those
for
which
market
data
are
not
available
and
are
developed
T.
ROWE
PRICE
Global
Industrials
Fund
using
the
best
information
available
about
the
assumptions
that
market
participants
would
use
to
price
the
financial
instrument.
GAAP
requires
valuation
techniques
to
maximize
the
use
of
relevant
observable
inputs
and
minimize
the
use
of
unobservable
inputs.
When
multiple
inputs
are
used
to
derive
fair
value,
the
financial
instrument
is
assigned
to
the
level
within
the
fair
value
hierarchy
based
on
the
lowest-level
input
that
is
significant
to
the
fair
value
of
the
financial
instrument.
Input
levels
are
not
necessarily
an
indication
of
the
risk
or
liquidity
associated
with
financial
instruments
at
that
level
but
rather
the
degree
of
judgment
used
in
determining
those
values.
Valuation
Techniques
Equity
securities,
including
exchange-traded
funds, listed
or
regularly
traded
on
a
securities
exchange
or
in
the
over-the-
counter
(OTC)
market
are
valued
at
the
last
quoted
sale
price
or,
for
certain
markets,
the
official
closing
price
at
the
time
the
valuations
are
made.
OTC
Bulletin
Board
securities
are
valued
at
the
mean
of
the
closing
bid
and
asked
prices.
A
security
that
is
listed
or
traded
on
more
than
one
exchange
is
valued
at
the
quotation
on
the
exchange
determined
to
be
the
primary
market
for
such
security.
Listed
securities
not
traded
on
a
particular
day
are
valued
at
the
mean
of
the
closing
bid
and
asked
prices
for
domestic
securities
and
the
last
quoted
sale
or
closing
price
for
international
securities.
The
last
quoted
prices
of
non-U.S.
equity
securities
may
be
adjusted
to
reflect
the
fair
value
of
such
securities
at
the
close
of
the
NYSE,
if
the Valuation
Designee
determines
that
developments
between
the
close
of
a
foreign
market
and
the
close
of
the
NYSE
will
affect
the
value
of
some
or
all
of
the
fund’s portfolio
securities.
Each
business
day,
the
Valuation
Designee uses
information
from
outside
pricing
services
to
evaluate
the
quoted
prices
of
portfolio
securities
and,
if
appropriate,
decide whether
it
is
necessary
to
adjust
quoted
prices
to
reflect
fair
value
by
reviewing
a
variety
of
factors,
including
developments
in
foreign
markets,
the
performance
of
U.S.
securities
markets,
and
the
performance
of
instruments
trading
in
U.S.
markets
that
represent
foreign
securities
and
baskets
of
foreign
securities. The Valuation
Designee
uses
outside
pricing
services
to
provide
it
with
quoted
prices
and
information
to
evaluate
or
adjust
those
prices.
The Valuation
Designee
cannot
predict
how
often
it
will
use
quoted
prices
and
how
often
it
will
determine
it
necessary
to
adjust
those
prices
to
reflect
fair
value.
Investments
in
mutual
funds
are
valued
at
the
mutual
fund’s
closing
NAV
per
share
on
the
day
of
valuation.
Assets
and
liabilities
other
than
financial
instruments,
including
short-term
receivables
and
payables,
are
carried
at
cost,
or
estimated
realizable
value,
if
less,
which
approximates
fair
value.
T.
ROWE
PRICE
Global
Industrials
Fund
Investments
for
which
market
quotations are
not
readily
available
or
deemed
unreliable
are
valued
at
fair
value
as
determined
in
good
faith
by
the
Valuation
Designee.
The
Valuation
Designee
has
adopted
methodologies
for
determining
the
fair
value
of
investments
for
which
market
quotations
are
not
readily
available
or
deemed
unreliable,
including
the
use
of
other
pricing
sources.
Factors
used
in
determining
fair
value
vary
by
type
of
investment
and
may
include
market
or
investment
specific
considerations.
The
Valuation
Designee typically
will
afford
greatest
weight
to
actual
prices
in
arm’s
length
transactions,
to
the
extent
they
represent
orderly
transactions
between
market
participants,
transaction
information
can
be
reliably
obtained,
and
prices
are
deemed
representative
of
fair
value.
However,
the
Valuation
Designee may
also
consider
other
valuation
methods
such
as
market-based
valuation
multiples;
a
discount
or
premium
from
market
value
of
a
similar,
freely
traded
security
of
the
same
issuer;
discounted
cash
flows;
yield
to
maturity;
or
some
combination.
Fair
value
determinations
are
reviewed
on
a
regular
basis.
Because
any
fair
value
determination
involves
a
significant
amount
of
judgment,
there
is
a
degree
of
subjectivity
inherent
in
such
pricing
decisions. Fair
value
prices
determined
by
the
Valuation
Designee could
differ
from
those
of
other
market
participants,
and
it
is
possible
that
the
fair
value
determined
for
a
security
may
be
materially
different
from
the
value
that
could
be
realized
upon
the
sale
of
that
security.
Valuation
Inputs
The
following
table
summarizes
the
fund’s
financial
instruments,
based
on
the
inputs
used
to
determine
their
fair
values
on
December
31,
2024
(for
further
detail
by
category,
please
refer
to
the
accompanying
Portfolio
of
Investments):
Following
is
a
reconciliation
of
the
fund’s
Level
3
holdings
for
the
year ended
December
31,
2024.
Gain
(loss)
reflects
both
realized
and
change
in
unrealized
gain/loss
on
Level
3
holdings
during
the
period,
if
any,
and
is
included
on
the
($000s)
Level
1
Level
2
Level
3
Total
Value
Assets
Common
Stocks
$
93,727
$
49,880
$
—
$
143,607
Convertible
Preferred
Stocks
—
—
1,846
1,846
Short-Term
Investments
257
—
—
257
Securities
Lending
Collateral
4,982
—
—
4,982
Total
$
98,966
$
49,880
$
1,846
$
150,692
T.
ROWE
PRICE
Global
Industrials
Fund
accompanying
Statement
of
Operations.
The
change
in
unrealized
gain/loss
on
Level
3
instruments
held
at
December
31,
2024,
totaled $(1,554,000) for
the
year ended
December
31,
2024.
Additionally,
during
the
period,
transfers
into
and/or
out
of
Level
3
include
securities
acquired
or
exchanged
as
a
result
of
a
corporate
action.
NOTE
3
-
OTHER
INVESTMENT
TRANSACTIONS
Consistent
with
its
investment
objective, the
fund
engages
in
the
following
practices
to
manage
exposure
to
certain
risks
and/or
to
enhance
performance.
The
investment
objective,
policies,
program,
and
risk
factors
of the
fund
are
described
more
fully
in the
fund’s prospectus
and
Statement
of
Additional
Information.
Restricted
Securities
The
fund
invests
in
securities
that
are
subject
to
legal
or
contractual
restrictions
on
resale.
Prompt
sale
of
such
securities
at
an
acceptable
price
may
be
difficult
and
may
involve
substantial
delays
and
additional
costs.
Securities
Lending
The fund
may
lend
its
securities
to
approved
borrowers
to
earn
additional
income.
Its
securities
lending
activities
are
administered
by
a
lending
agent
in
accordance
with
a
securities
lending
agreement.
Security
loans
generally
do
not
have
stated
maturity
dates,
and
the
fund
may
recall
a
security
at
any
time.
The
fund
receives
collateral
in
the
form
of
cash
or
U.S.
government
securities.
Collateral
is
maintained
over
the
life
of
the
loan
in
an
amount
not
less
than
the
value
of
loaned
securities;
any
additional
collateral
required
due
to
changes
in
security
values
is
delivered
to
the
fund
the
next
business
day.
Cash
collateral
is
invested
in
accordance
with
investment
guidelines
approved
by
fund
management.
Additionally,
the
lending
agent
indemnifies
the
fund
against
losses
resulting
from
borrower
default.
Although
risk
is
mitigated
by
the
collateral
and
indemnification,
the
fund
could
experience
a
delay
in
recovering
its
securities
and
a
possible
loss
of
income
or
value
if
the
borrower
fails
to
return
($000s)
Beginning
Balance
12/31/23
Gain
(Loss)
During
Period
Transfer
Into
Level 3
Transfer
Out
of
Level
3
Ending
Balance
12/31/24
Investment
in
Securities
Convertible
Preferred
Stocks
$
2,746
$
(900)
$
1,690
$
(1,690)
$
1,846
T.
ROWE
PRICE
Global
Industrials
Fund
the
securities,
collateral
investments
decline
in
value,
and
the
lending
agent
fails
to
perform.
Securities
lending
revenue
consists
of
earnings
on
invested
collateral
and
borrowing
fees,
net
of
any
rebates
to
the
borrower,
compensation
to
the
lending
agent,
and
other
administrative
costs.
In
accordance
with
GAAP,
investments
made
with
cash
collateral
are
reflected
in
the
accompanying
financial
statements,
but
collateral
received
in
the
form
of
securities
is
not.
At
December
31,
2024,
the
value
of
loaned
securities
was
$4,751,000;
the
value
of
cash
collateral
and
related
investments
was
$4,982,000.
Other
Purchases
and
sales
of
portfolio
securities
other
than
in-kind
transactions,
if
any,
and short-term securities
aggregated $110,618,000 and
$177,742,000,
respectively,
for
the
year ended
December
31,
2024.
NOTE
4
-
FEDERAL
INCOME
TAXES
Generally,
no
provision
for
federal
income
taxes
is
required
since
the
fund
intends
to continue
to
qualify
as
a
regulated
investment
company
under
Subchapter
M
of
the
Internal
Revenue
Code
and
distribute
to
shareholders
all
of
its taxable
income
and
gains.
Distributions
determined
in
accordance
with
federal
income
tax
regulations
may
differ
in
amount
or
character
from
net
investment
income
and
realized
gains
for
financial
reporting
purposes.
The
fund
files
U.S.
federal,
state,
and
local
tax
returns
as
required.
The
fund’s
tax
returns
are
subject
to
examination
by
the
relevant
tax
authorities
until
expiration
of
the
applicable
statute
of
limitations,
which
is
generally
three
years
after
the
filing
of
the
tax
return
but
which
can
be
extended
to
six
years
in
certain
circumstances.
Tax
returns
for
open
years
have
incorporated
no
uncertain
tax
positions
that
require
a
provision
for
income
taxes.
Capital
accounts
within
the
financial
reporting
records
are
adjusted
for
permanent
book/tax
differences
to
reflect
tax
character
but
are
not
adjusted
for
temporary
differences.
The
permanent
book/tax
adjustments,
if
any,
have
no
impact
on
results
of
operations
or
net
assets.
The
permanent
book/tax
adjustments
relate
primarily
to
the
character
of
foreign
capital
gains
taxes.
T.
ROWE
PRICE
Global
Industrials
Fund
The
tax
character
of
distributions
paid
for
the
periods
presented
was
as
follows:
At
December
31,
2024,
the
tax-basis
cost
of
investments
(including
derivatives,
if
any)
and
gross
unrealized
appreciation
and
depreciation
were as
follows:
At
December
31,
2024,
the
tax-basis
components
of
accumulated
net
earnings
(loss)
were
as
follows:
Temporary
differences
between
book-basis
and
tax-basis
components
of
total
distributable
earnings
(loss)
arise
when
certain
items
of
income,
gain,
or
loss
are
recognized
in
different
periods
for
financial
statement
purposes
versus
for
tax
purposes;
these
differences
will
reverse
in
a
subsequent
reporting
period.
The
temporary
differences
relate
primarily
to
the
deferral
of
losses
from
wash
sales.
The
loss
carryforwards
and
deferrals
primarily
relate
to
capital
loss
carryforwards.
Capital
loss
carryforwards
are
available
indefinitely
to
offset
future
realized
capital
gains.
During
the
year
ended
December
31,
2024,
the
fund
utilized
$17,235,000
of
capital
loss
carryforwards.
($000s)
December
31,
2024
December
31,
2023
Ordinary
income
(including
short-term
capital
gains,
if
any)
$
776
$
847
($000s)
Cost
of
investments
$
125,351
Unrealized
appreciation
$
36,165
Unrealized
depreciation
(10,902)
Net
unrealized
appreciation
(depreciation)
$
25,263
($000s)
Undistributed
ordinary
income
$
147
Net
unrealized
appreciation
(depreciation)
25,263
Loss
carryforwards
and
deferrals
(1,695)
Total
distributable
earnings
(loss)
$
23,715
T.
ROWE
PRICE
Global
Industrials
Fund
NOTE
5
-
FOREIGN TAXES
The
fund
is
subject
to
foreign
income
taxes
imposed
by
certain
countries
in
which
it
invests.
Additionally,
capital
gains
realized
upon
disposition
of
securities
issued
in
or
by
certain
foreign
countries
are
subject
to
capital
gains
tax
imposed
by
those
countries.
All
taxes
are
computed
in
accordance
with
the
applicable
foreign
tax
law,
and,
to
the
extent
permitted,
capital
losses
are
used
to
offset
capital
gains.
Taxes
attributable
to
income
are
accrued
by
the
fund
as
a
reduction
of
income.
Current
and
deferred
tax
expense
attributable
to
capital
gains
is
reflected
as
a
component
of
realized
or
change
in
unrealized
gain/
loss
on
securities
in
the
accompanying
financial
statements.
To
the
extent
that
the
fund
has
country
specific
capital
loss
carryforwards,
such
carryforwards
are
applied
against
net
unrealized
gains
when
determining
the
deferred
tax
liability.
Any
deferred
tax
liability
incurred
by
the
fund
is
included
in
either
Other
liabilities
or
Deferred
tax
liability
on
the
accompanying
Statement
of
Assets
and
Liabilities.
NOTE
6
-
RELATED
PARTY
TRANSACTIONS
The
fund
is
managed
by
T.
Rowe
Price
Associates,
Inc.
(Price
Associates),
a
wholly
owned
subsidiary
of
T.
Rowe
Price
Group,
Inc.
(Price
Group).
The
investment
management
agreement
between
the
fund
and
Price
Associates
provides
for
an
annual
investment
management
fee,
which
is
computed
daily
and
paid
monthly. The
fee
consists
of
an
individual
fund
fee,
equal
to
0.40%
of
the
fund’s
average
daily
net
assets,
and
a
group
fee.
The
group
fee
rate
is
calculated
based
on
the
combined
net
assets
of
certain
mutual
funds
sponsored
by
Price
Associates
(the
group)
applied
to
a
graduated
fee
schedule,
with
rates
ranging
from
0.48%
for
the
first
$1
billion
of
assets
to
0.260%
for
assets
in
excess
of
$845
billion.
The
fund’s
group
fee
is
determined
by
applying
the
group
fee
rate
to
the
fund’s
average
daily
net
assets. At
December
31,
2024,
the
effective
annual
group
fee
rate
was
0.28%.
The Investor
Class is
subject
to
a
contractual
expense
limitation
through
the
expense
limitation
date
indicated
in
the
table
below.
This
agreement
will
continue
through
the
expense
limitation
date
indicated
in
the
table
below,
and
may
be
renewed,
revised,
or
revoked
only
with
approval
of
the
fund’s
Board.
During
the
limitation
period,
Price
Associates
is required
to
waive
or
pay
any
expenses
(excluding
interest;
expenses
related
to
borrowings,
taxes,
and
brokerage;
non-recurring,
extraordinary
expenses;
and
acquired
fund
fees
and
expenses)
that
would
otherwise
cause
the class’s ratio
of
annualized
total
T.
ROWE
PRICE
Global
Industrials
Fund
expenses
to
average
net
assets
(net
expense
ratio)
to
exceed
its
expense
limitation.
The
class
is
required
to
repay
Price
Associates
for
expenses
previously
waived/paid
to
the
extent
the
class’s net
assets
grow
or
expenses
decline
sufficiently
to
allow
repayment
without
causing
the class’s net
expense
ratio
(after
the
repayment
is
taken
into
account)
to
exceed
the
lesser
of:
(1)
the
expense
limitation
in
place
at
the
time
such
amounts
were
waived;
or
(2)
the class’s
current
expense
limitation.
However,
no
repayment
will
be
made
more
than
three
years
after
the
date
of
a
payment
or
waiver.
The
I
Class
is
also
subject
to
an
operating
expense
limitation
(I
Class
Limit)
pursuant
to
which
Price
Associates
is
contractually
required
to
pay
all
operating
expenses
of
the
I
Class,
excluding
management
fees;
interest;
expenses
related
to
borrowings,
taxes,
and
brokerage; non-recurring,
extraordinary expenses; and
acquired
fund
fees
and
expenses, to
the
extent
such
operating
expenses,
on
an
annualized
basis,
exceed
the
I
Class
Limit. This
agreement
will
continue
through
the
expense
limitation
date
indicated
in
the
table
below,
and
may
be
renewed,
revised,
or
revoked
only
with
approval
of
the
fund’s
Board.
The
I
Class
is
required
to
repay
Price
Associates
for
expenses
previously
paid
to
the
extent
the
class’s
net
assets
grow
or
expenses
decline
sufficiently
to
allow
repayment
without
causing
the
class’s
operating
expenses
(after
the
repayment
is
taken
into
account)
to
exceed
the
lesser
of:
(1)
the
I
Class
Limit
in
place
at
the
time
such
amounts
were
paid;
or
(2)
the
current
I
Class
Limit.
However,
no
repayment
will
be
made
more
than
three
years
after
the
date
of
a
payment
or
waiver.
Pursuant
to
these
agreements,
expenses
were waived/paid
by
and/or
repaid
to
Price
Associates
during
the year
ended December
31,
2024 as
indicated
in
the
table
below.
Including
these
amounts,
expenses
previously
waived/paid
by
Price
Associates
in
the
amount
of $618,000 remain
subject
to
repayment
by
the
fund
at
December
31,
2024. Any
repayment
of
expenses
previously
waived/paid
by
Price
Associates
during
the
period
would
be
included
in
the
net
investment
income
and
expense
ratios
presented
on
the
accompanying
Financial
Highlights.
Investor
Class
I
Class
Expense
limitation/I
Class
Limit
1.05%
0.05%
Expense
limitation
date
02/28/27
02/28/27
(Waived)/repaid
during
the
period
($000s)
$(81)
$(170)
T.
ROWE
PRICE
Global
Industrials
Fund
In
addition,
the
fund
has
entered
into
service
agreements
with
Price
Associates
and
two
wholly
owned
subsidiaries
of
Price
Associates,
each
an
affiliate
of
the
fund
(collectively,
Price).
Price
Associates
provides
certain
accounting
and
administrative
services
to
the
fund.
T.
Rowe
Price
Services,
Inc.
provides
shareholder
and
administrative
services
in
its
capacity
as
the
fund’s
transfer
and
dividend-disbursing
agent.
T.
Rowe
Price
Retirement
Plan
Services,
Inc.
provides
subaccounting
and
recordkeeping
services
for
certain
retirement
accounts
invested
in
the
Investor
Class.
For
the
year
ended
December
31,
2024,
expenses
incurred
pursuant
to
these
service
agreements
were
$118,000
for
Price
Associates;
$120,000
for
T.
Rowe
Price
Services,
Inc.;
and
less
than
$1,000
for
T.
Rowe
Price
Retirement
Plan
Services,
Inc.
All
amounts
due
to
and
due
from
Price,
exclusive
of
investment
management
fees
payable,
are
presented
net
on
the
accompanying
Statement
of
Assets
and
Liabilities.
T.
Rowe
Price
Investment
Services,
Inc.
(Investment
Services)
serves
as
distributor
to
the
fund.
Pursuant
to
an
underwriting
agreement,
no
compensation
for
any
distribution
services
provided
is
paid
to
Investment
Services
by
the
fund
(except
for
12b-1
fees
under
a
Board-approved
Rule
12b-1
plan).
The fund
may
invest
its
cash
reserves
in
certain
open-end
management
investment
companies
managed
by
Price
Associates
and
considered
affiliates
of
the
fund:
the
T.
Rowe
Price
Government
Reserve
Fund
or
the
T.
Rowe
Price
Treasury
Reserve
Fund,
organized
as
money
market
funds
(together,
the
Price
Reserve
Funds).
The
Price
Reserve
Funds
are
offered
as
short-term
investment
options
to
mutual
funds,
trusts,
and
other
accounts
managed
by
Price
Associates
or
its
affiliates
and
are
not
available
for
direct
purchase
by
members
of
the
public.
Cash
collateral
from
securities
lending,
if
any,
is
invested
in
the
T.
Rowe
Price
Government
Reserve Fund. The
Price
Reserve
Funds
pay
no
investment
management
fees.
The fund may
participate
in
securities
purchase
and
sale
transactions
with
other
funds
or
accounts
advised
by
Price
Associates
(cross
trades),
in
accordance
with
procedures
adopted
by the
fund’s
Board
and
Securities
and
Exchange
Commission
rules,
which
require,
among
other
things,
that
such
purchase
and
sale
cross
trades
be
effected
at
the
independent
current
market
price
of
the
security.
During
the
year
ended
December
31,
2024,
the
fund
had
no
purchases
or
sales
cross
trades
with
other
funds
or
accounts
advised
by
Price
Associates.
T.
ROWE
PRICE
Global
Industrials
Fund
NOTE
7
-
SEGMENT
REPORTING
Operating
segments
are
defined
as
components
of
a
company
that
engage
in
business
activities
and
for
which
discrete
financial
information
is
available
and
regularly
reviewed
by
the
chief
operating
decision
maker
(CODM)
in
deciding
how
to
allocate
resources
and
assess
performance.
The
Management
Committee
of
Price
Associates
acts
as
the
fund’s
CODM.
The
fund
makes
investments
in
accordance
with
its
investment
objective
as
outlined
in
the
Prospectus
and
is
considered
one
reportable
segment
because
the
CODM
allocates
resources
and
assesses
the
operating
results
of
the
fund
on
the
whole.
The
fund’s
revenue
is
derived
from
investments
in
portfolio
of
securities.
The
CODM
allocates
resources
and
assesses
performance
based
on
the
operating
results
of
the
fund,
which
is
consistent
with
the
results
presented
in
the
statement
of
operations,
statement
of
changes
in
net
assets
and
financial
highlights.
The
CODM
compares
the
fund’s
performance
to
its
benchmark
index
and
evaluates
the
positioning
of
the
fund
in
relation
to
its
investment
objective.
The
measure
of
segment
assets
is
net
assets
of
the
fund
which
is
disclosed
in
the
statement
of
assets
and
liabilities.
The
accounting
policies
of
the
segment
are
the
same
as
those
described
in
the
summary
of
significant
accounting
policies.
The
financial
statements
include
all
details
of
the
segment
assets,
segment
revenue
and
expenses;
and
reflect
the
financial
results
of
the
segment.
NOTE
8
-
BORROWING
To
provide
temporary
liquidity,
the
fund
may
borrow
from
other
T.
Rowe
Price-
sponsored
mutual
funds
under
an
interfund
borrowing
program
developed
and
managed
by
Price
Associates.
The
program
permits
the
borrowing
and
lending
of
cash
at
rates
beneficial
to
both
the
borrowing
and
lending
funds.
Pursuant
to
program
guidelines,
loans
totaling
10%
or
more
of
a
borrowing
fund’s
total
assets
require
collateralization
at
102%
of
the
value
of
the
loan;
loans
of
less
than
10%
are
unsecured.
During
the
year ended
December
31,
2024,
the
fund
incurred
$1,000
in
interest
expense
related
to
outstanding
borrowings
on
one
day
in
the
average
amount
of
$7,400,000
and
at
an
average
annual
rate
of
6.17%.
At
December
31,
2024,
there
were
no
borrowings
outstanding.
T.
ROWE
PRICE
Global
Industrials
Fund
NOTE
9
-
OTHER
MATTERS
Unpredictable environmental,
political,
social
and
economic
events,
including
but
not
limited
to,
environmental
or
natural
disasters,
war
and
conflict
(including
Russia’s
military
invasion
of
Ukraine
and
the
conflict
in
Israel,
Gaza
and
surrounding
areas),
terrorism,
geopolitical
developments
(including
trading
and
tariff
arrangements,
sanctions
and
cybersecurity
attacks),
and
public
health
epidemics
(including
the
global
outbreak
of
COVID-19)
and
similar
public
health
threats,
may
significantly
affect
the
economy
and
the
markets
and
issuers
in
which
a
fund
invests.
The
extent
and
duration
of
such
events
and
resulting
market
disruptions
cannot
be
predicted.
These
and
other
similar
events
may
cause
instability
across
global
markets,
including
reduced
liquidity
and
disruptions
in
trading
markets,
while
some
events
may
affect
certain
geographic
regions,
countries,
sectors,
and
industries
more
significantly
than
others,
and
exacerbate
other
pre-existing
political,
social,
and
economic
risks.
The
fund’s
performance
could
be
negatively
impacted
if
the
value
of
a
portfolio
holding
were
harmed
by
these
or
such
events.
Management
actively
monitors
the
risks
and
financial
impacts
arising
from
such
events.
T.
ROWE
PRICE
Global
Industrials
Fund
REPORT
OF
INDEPENDENT
REGISTERED
PUBLIC
ACCOUNTING
FIRM
To
the
Board
of
Directors
of
T.
Rowe
Price
International
Funds,
Inc.
and
Shareholders
of
T.
Rowe
Price
Global
Industrials
Fund
Opinion
on
the
Financial
Statements
We
have
audited
the
accompanying
statement
of
assets
and
liabilities,
including
the
portfolio
of
investments,
of
T.
Rowe
Price
Global
Industrials
Fund
(one
of
the
funds
constituting
T.
Rowe
Price
International
Funds,
Inc.,
referred
to
hereafter
as
the
"Fund")
as
of
December
31,
2024,
the
related
statement
of
operations
for
the
year
ended
December
31,
2024,
the
statement
of
changes
in
net
assets
for
each
of
the
two
years
in
the
period
ended
December
31,
2024,
including
the
related
notes,
and
the
financial
highlights
for
each
of
the
five
years
in
the
period
ended
December
31,
2024
(collectively
referred
to
as
the
“financial
statements”).
In
our
opinion,
the
financial
statements
present
fairly,
in
all
material
respects,
the
financial
position
of
the
Fund
as
of
December
31,
2024,
the
results
of
its
operations
for
the
year
then
ended,
the
changes
in
its
net
assets
for
each
of
the
two
years
in
the
period
ended
December
31,
2024
and
the
financial
highlights
for
each
of
the
five
years
in
the
period
ended
December
31,
2024
in
conformity
with
accounting
principles
generally
accepted
in
the
United
States
of
America.
Basis
for
Opinion
These
financial
statements
are
the
responsibility
of
the
Fund’s
management.
Our
responsibility
is
to
express
an
opinion
on
the
Fund’s
financial
statements
based
on
our
audits.
We
are
a
public
accounting
firm
registered
with
the
Public
Company
Accounting
Oversight
Board
(United
States)
(PCAOB)
and
are
required
to
be
independent
with
respect
to
the
Fund
in
accordance
with
the
U.S.
federal
securities
laws
and
the
applicable
rules
and
regulations
of
the
Securities
and
Exchange
Commission
and
the
PCAOB.
We
conducted
our
audits
of
these
financial
statements
in
accordance
with
the
standards
of
the
PCAOB.
Those
standards
require
that
we
plan
and
perform
the
audit
to
obtain
reasonable
assurance
about
whether
the
financial
statements
are
free
of
material
misstatement,
whether
due
to
error
or
fraud.
T.
ROWE
PRICE
Global
Industrials
Fund
Our
audits
included
performing
procedures
to
assess
the
risks
of
material
misstatement
of
the
financial
statements,
whether
due
to
error
or
fraud,
and
performing
procedures
that
respond
to
those
risks.
Such
procedures
included
examining,
on
a
test
basis,
evidence
regarding
the
amounts
and
disclosures
in
the
financial
statements.
Our
audits
also
included
evaluating
the
accounting
principles
used
and
significant
estimates
made
by
management,
as
well
as
evaluating
the
overall
presentation
of
the
financial
statements.
Our
procedures
included
confirmation
of
securities
owned
as
of
December
31,
2024
by
correspondence
with
the
custodians,
transfer
agent
and
brokers;
when
replies
were
not
received
from
brokers,
we
performed
other
auditing
procedures.
We
believe
that
our
audits
provide
a
reasonable
basis
for
our
opinion.
/s/
PricewaterhouseCoopers
LLP
Baltimore,
Maryland
February
18,
2025
We
have
served
as
the
auditor
of
one
or
more
investment
companies
in
the
T.
Rowe
Price
group
of
investment
companies
since
1973.
REPORT
OF
INDEPENDENT
REGISTERED
PUBLIC
ACCOUNTING
FIRM
(continued)
T.
ROWE
PRICE
Global
Industrials
Fund
TAX
INFORMATION
(UNAUDITED)
FOR
THE
TAX
YEAR
ENDED 12/31/24
We
are
providing
this
information
as
required
by
the
Internal
Revenue
Code.
The
amounts
shown
may
differ
from
those
elsewhere
in
this
report
because
of
differences
between
tax
and
financial
reporting
requirements.
For
taxable
non-corporate
shareholders,
$2,217,000
of
the
fund's
income
represents
qualified
dividend
income
subject
to
a
long-term
capital
gains
tax
rate
of
not
greater
than
20%.
For
corporate
shareholders,
$864,000
of
the
fund's
income
qualifies
for
the
dividends-received
deduction.
100
East
Pratt
Street
Baltimore,
MD
21202
T.
Rowe
Price
Investment
Services,
Inc.
Call
1-800-225-5132
to
request
a
prospectus
or
summary
prospectus;
each
includes
investment
objectives,
risks,
fees,
expenses,
and
other
information
that
you
should
read
and
consider
carefully
before
investing.
F153-050
2/25
Item 8. Changes in and Disagreements with Accountants for Open-End Management Investment Companies.
Not applicable.
Item 9. Proxy Disclosures for Open-End Management Investment Companies.
Not applicable.
Item 10. Remuneration Paid to Directors, Officers, and Others of Open-End Management Investment Companies.
Remuneration paid to Directors is included in Item 7 of this Form N-CSR.
Item 11. Statement Regarding Basis for Approval of Investment Advisory Contract.
If applicable, see Item 7.
Item 12. Disclosure of Proxy Voting Policies and Procedures for Closed-End Management Investment Companies.
Not applicable.
Item 13. Portfolio Managers of Closed-End Management Investment Companies.
Not applicable.
Item 14. Purchases of Equity Securities by Closed-End Management Investment Company and Affiliated Purchasers.
Not applicable.
Item 15. Submission of Matters to a Vote of Security Holders.
There has been no change to the procedures by which shareholders may recommend nominees to the registrant’s board of directors.
Item 16. Controls and Procedures.
(a) The registrant’s principal executive officer and principal financial officer have evaluated the registrant’s disclosure controls and procedures within 90 days of this filing and have concluded that the registrant’s disclosure controls and procedures were effective, as of that date, in ensuring that information required to be disclosed by the registrant in this Form N-CSR was recorded, processed, summarized, and reported timely.
(b) The registrant’s principal executive officer and principal financial officer are aware of no change in the registrant’s internal control over financial reporting that occurred during the period covered by this report that has materially affected, or is reasonably likely to materially affect, the registrant’s internal control over financial reporting.
Item 17. Disclosure of Securities Lending Activities for Closed-End Management Investment Companies.
Not applicable.
Item 18. Recovery of Erroneously Awarded Compensation.
Not applicable.
Item 19. Exhibits.
SIGNATURES
Pursuant to the requirements of the Securities Exchange Act of 1934 and the Investment Company Act of 1940, the registrant has duly caused this report to be signed on its behalf by the undersigned, thereunto duly authorized.
| | | | |
| T. Rowe Price International Funds, Inc. |
| | |
| By | | /s/ David Oestreicher | | |
| | David Oestreicher | | |
| | Principal Executive Officer | | |
| | |
| Date | | February 18, 2025 | | |
Pursuant to the requirements of the Securities Exchange Act of 1934 and the Investment Company Act of 1940, this report has been signed below by the following persons on behalf of the registrant and in the capacities and on the dates indicated.
| | | | |
| By | | /s/ David Oestreicher | | |
| | David Oestreicher | | |
| | Principal Executive Officer | | |
| | |
| Date | | February 18, 2025 | | |
| | | | |
| By | | /s/ Alan S. Dupski | | |
| | Alan S. Dupski | | |
| | Principal Financial Officer | | |
| | |
| Date | | February 18, 2025 | | |