EXHIBIT 99.1
The Exploration Company:
A Profile
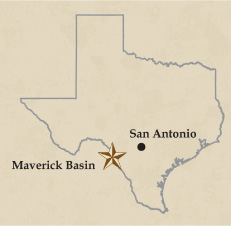
The Exploration Company explores for, develops and produces crude oil and natural gas. Based in San Antonio, TXCO has emerged as the largest operator in the Maverick Basin of Southwest Texas, where it holds a 727,000-acre lease block with multiple-pay opportunities. The Company also operates a 90-mile natural gas pipeline serving the Maverick Basin and has interests in 84,000 acres of the Williston Basin in the Dakotas and Montana. TXCO’s long-term business strategy is to build shareholder value by acquiring undeveloped mineral interests and internally developing a multi-year drilling program through use of advanced technology, such as 3-D seismic and horizontal drilling. The Company accounts for its oil and gas operations using the successful efforts method of accounting. Its common stock trades on Nasdaq under the ticker symbol TXCO.
INDEX
| Performance Highlights | Inside Front Cover | |
| Maverick Basin Map | Page 1 | |
| Letter to Shareholders | Page 2 | |
| Questions & Answers About TXCO | Page 5 | |
| Operations Review | Page 6 | |
| Directors and Management | Page 8 | |
| Shareholder Information and Glossary | Inside Back Cover |
Performance Highlights for The Exploration Company
| U.S. dollars in thousands except per share amounts | 2004 | 2003 | 2002 | 2001 | 2000 | |||||||||||||||||
Financial Highlights | ||||||||||||||||||||||
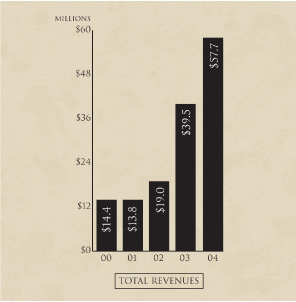
| Total revenues | $ | 57,735 | $ | 39,545 | $ | 18,958 | $ | 13,759 | $ | 14,361 | ||||||||||||
| Net income (loss) | $ | 2,797 | $ | 41 | $ | (311 | ) | $ | (50 | ) | $ | 6,762 | ||||||||||
| Income (loss) from operations | $ | 5,887 | $ | 1,446 | $ | (61 | ) | $ | 72 | $ | 1,817 | |||||||||||
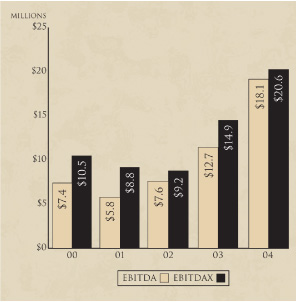
| EBITDA* | $ | 18,128 | $ | 12,672 | $ | 7,602 | $ | 5,820 | $ | 7,418 | ||||||||||||
| EBITDAX* | $ | 20,577 | $ | 14,859 | $ | 9,169 | $ | 8,806 | $ | 10,474 | ||||||||||||
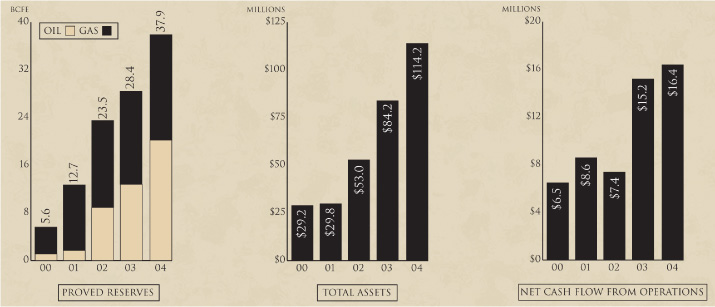
| Net cash provided in operating activities | $ | 16,447 | $ | 15,158 | $ | 7,389 | $ | 8,564 | $ | 6,530 | ||||||||||||
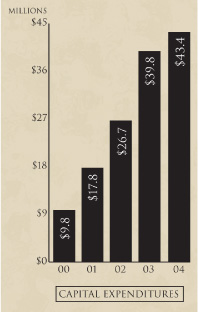
| Property development and exploration costs | $ | 32,289 | $ | 28,023 | $ | 20,814 | $ | 16,143 | $ | 7,468 | ||||||||||||
| Basic income (loss) per share | $ | 0.11 | $ | 0.00 | $ | (0.02 | ) | $ | 0.00 | $ | 0.39 | |||||||||||
| Diluted income (loss) per share | $ | 0.10 | $ | 0.00 | $ | (0.02 | ) | $ | 0.00 | $ | 0.39 | |||||||||||
| Weighted average number of common shares outstanding: — Basic | 26,066 | 20,781 | 19,081 | 17,441 | 17,242 | |||||||||||||||||
| — Diluted | 26,971 | 21,295 | 19,081 | 17,441 | 17,344 | |||||||||||||||||
| Current assets | $ | 13,038 | $ | 11,737 | $ | 7,955 | $ | 4,235 | $ | 11,019 | ||||||||||||
| Oil and gas properties | $ | 94,836 | $ | 66,156 | $ | 39,328 | $ | 19,894 | $ | 14,084 | ||||||||||||
| Total assets | $ | 114,237 | $ | 84,206 | $ | 53,036 | $ | 29,843 | $ | 29,206 | ||||||||||||
| Long-term debt, net of current portion | $ | 17,099 | $ | 15,426 | $ | 6,143 | $ | 564 | $ | 779 | ||||||||||||
| Redeemable preferred stock, Series B (redemption value — $16 million) | $ | 10,991 | $ | 10,135 | $ | — | $ | — | $ | — | ||||||||||||
| Total stockholders’ equity | $ | 65,682 | $ | 42,792 | $ | 36,970 | $ | 23,057 | $ | 23,322 | ||||||||||||
Reserve Highlights | ||||||||||||||||||||||
| Oil, MBbls | 3,374 | 2,129 | 1,479 | 294 | 183 | |||||||||||||||||
| Natural gas, MMcf | 17,701 | 15,624 | 14,675 | 10,976 | 4,532 | |||||||||||||||||
| Natural gas equivalent, MMcfe | 37,945 | 28,398 | 23,549 | 12,740 | 5,630 | |||||||||||||||||
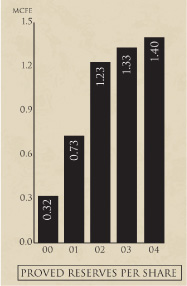
| Reserves per share, Mcfe | 1.40 | 1.33 | 1.23 | 0.73 | 0.32 | |||||||||||||||||
| SEC PV-10 value | $ | 80,768 | $ | 56,793 | $ | 45,382 | $ | 13,983 | $ | 37,035 | ||||||||||||
Sales Highlights | ||||||||||||||||||||||
| Oil, MBbls | 321 | 454 | 314 | 50 | 60 | |||||||||||||||||
| Natural gas, MMcf | 2,975 | 2,108 | 2,487 | 2,673 | 2,965 | |||||||||||||||||
| Natural gas equivalent, MMcfe | 4,901 | 4,832 | 4,371 | 2,973 | 3,325 | |||||||||||||||||
| Average sales price, $/Bbl | $ | 38.72 | $ | 28.30 | $ | 24.56 | $ | 23.55 | $ | 27.85 | ||||||||||||
| Average sales price, $/Mcf | $ | 5.96 | $ | 5.48 | $ | 3.35 | $ | 4.56 | $ | 4.10 | ||||||||||||
| Average sales price, $/Mcfe | $ | 6.16 | $ | 5.05 | $ | 3.67 | $ | 4.49 | $ | 4.16 | ||||||||||||
| Average cost of sales, $/Mcfe | $ | 1.44 | $ | 1.22 | $ | 1.16 | $ | 1.13 | $ | 0.65 | ||||||||||||
| Depletion cost, $/Mcfe | $ | 1.97 | $ | 1.71 | $ | 1.44 | $ | 1.02 | $ | 0.79 | ||||||||||||
*See the Investor Relations section of the Company’s Web site at www.txco.com for a reconciliation of non-GAAP financial measures.
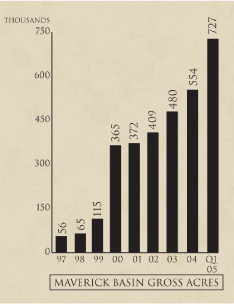
The Exploration Company
Maverick Basin Acreage Block
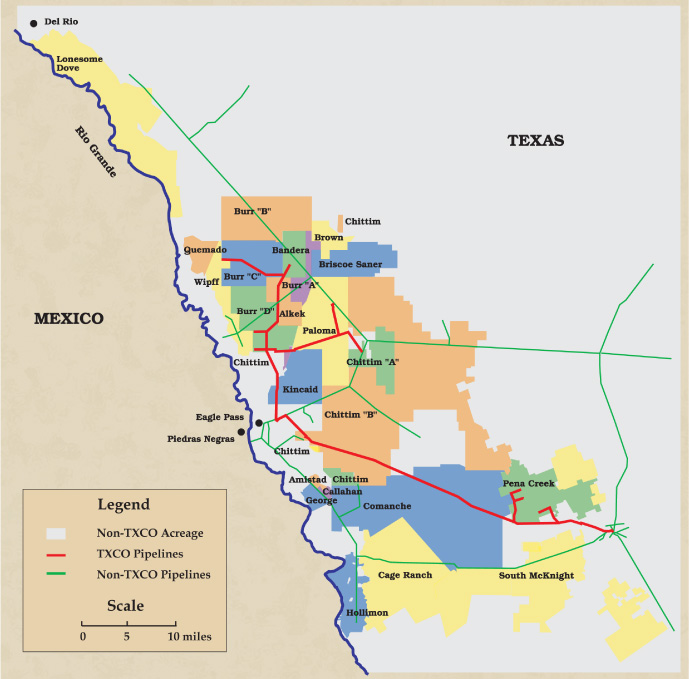
The Exploration Company controls 727,000
gross acres in the Maverick Basin, including
665,900 leased acres and 61,100 acres under
seismic option. This represents more than
1,100 square miles of contiguous acreage,
nearly 100 miles across.
| 1 | Annual Report 2004 |
Letter To Shareholders
We can measure 2004 in several ways and still have the same result: Successful Growth. The Exploration Company’s proved reserves increased, as did net income, cash flow, revenues, assets and shareholder equity.

The year did offer some challenges as we continued along the road to growth. Our core Maverick Basin operating area endured one of its wettest years ever, leaving field operations literally stuck in the mud at times. Rig availability became a problem as the industry’s drilling pace quickened. A key partner’s restructuring meant waiting until August before we could spud the year’s first well in one of our most promising plays. But there are bumps along any road and the positive momentum our focused strategy has given us created one of our best years ever.
Reserves, Sales Volumes Rise
Perhaps the best measure of any oil and gas company’s growth is its proved reserve number. Our results are excellent. Year-end proved reserves rose by a third in 2004 to 37.9 Bcfe, up from 28.4 Bcfe for 2003, even after 12 months in which we had record sales, 4.9 Bcfe.
To keep those numbers in perspective, let’s look in the rearview mirror to see where we’ve been. Since year-end 2000, TXCO’s reserves have increased by 574 percent — mostly via the drillbit. Just four years ago TXCO booked only 5.6 Bcfe in proved reserves. Let me point out that these numbers, based on outside engineering estimates, are for total proved reserves and do not take into account probable and possible reserves, which we believe are very substantial.
The Company achieved a 295 percent all-source reserve replacement rate in 2004, again almost all of that was through drilling. Our reserve life index rose to 7.7 years from 5.9 years at year-end 2003 with a reserve mix of 53 percent crude oil and 47 percent natural gas.
Rising gas sales volumes, particularly in our Georgetown play, more than offset an oil sales decline. Our year-end sales mix was 40 percent oil and 60 percent gas. TXCO’s daily sales rate at Dec. 31, 2004, was 10.7 MMcfd of natural gas and 1,285 BOPD, giving us a combined 18.4 MMcfed.
I’m particularly pleased with our rising reserve and sales numbers because they compare favorably with firms in our business that struggle to maintain existing reserves and production. The Exploration Company is growing — and that makes your investment worth more.
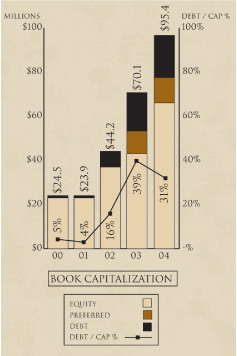
Improved Financial Performance
TXCO’s net income for 2004 rose to $2.8 million, or $0.10 per diluted share, up sharply from the $40,877, or $0.002 per share, reported in 2003. Income from operations climbed more than 300 percent from 2003 to $5.9 million, an all-time high. Revenues were a record $57.7 million, nearly 50 percent above the $39.5 million for the prior year.
We also enjoyed strong cash flow. Net cash provided by TXCO’s operating activities set a Company record, $16.4 million, up from $15.2 million in 2003. Ebitda — earnings before income taxes, interest expense, depreciation, depletion, amortization, impairment and abandonment expense — was $18.1 million, or $0.67 per share, a 43 percent increase from $12.7 million, or $0.60 per share in the prior year. Ebitdax — Ebitda plus exploration expense — was $20.6 million, or $0.76 per share, up 38 percent from $14.9 million, or $0.70 per share for 2003. Our Web site, www.txco.com, provides a reconciliation for these nonstandard financial measures.
Assets also rose to a record $114.2 million, a 36 percent increase from $84.2 million a year earlier while shareholder equity reached $65.7 million, rising from $42.8 million in 2003.
We enjoyed the benefits of sharply higher commodity prices in 2004 and took action to preserve these higher prices. In October, we announced a timely hedging agreement for a portion of our Maverick Basin output. These hedges, in the form of ratio swaps for 15,000 barrels of oil per month and 140,000 MMBtu per month of natural gas, have attractive price floors and allow us to participate in 75 percent of any potential upside price movements above the floor levels. They extend through October 2005. This creates important downside price protection while allowing the Company to enjoy the bulk of potential price upticks. In early March 2005, we extended our hedge position through October 2006 at very attractive prices.
In June 2004, we entered into a new banking relationship with Guaranty Bank. As we began the relationship, we were able to increase the master note amount to $50 million from a previous $25 million. We began the relationship with an initial commitment of $14.6 million. Since then, we have been able to increase the commitment two additional times so that today, our commitment from Guaranty now stands at $26.5 million. Conservative use of financial leverage will help us fuel our growth plans for 2005.
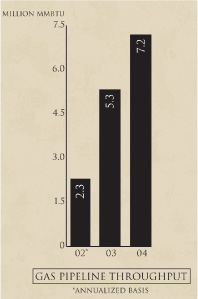
Our gas pipeline proved an important part of our financial success last year as it transported 7.2 million MMBtu, a 36 percent increase from the prior year. Gas gathering and processing revenues were $27.5 million, more than an 80 percent increase from $15.1 million in 2003.
| The Exploration Company | 2 |
Our Maverick-Dimmit Pipeline Ltd. unit provides an important link to markets in both the United States and Mexico. It allows us to serve other Maverick Basin producers as the area’s overall gas production grows. Purchasing this system in 2002 was timely and we have since expanded it to more than 90 miles, including eight miles of additional pipeline purchased or leased in 2004. The system’s value can only grow as the industry’s attention on the basin grows and drilling on tracts adjacent to our well-placed acreage increases.
Operations Remain Brisk
I want to briefly discuss operations. I invite you to read the separate operations section contained in this report. We continued to accelerate drilling across our growing acreage block. TXCO participated in 69 wells in 2004, including 60 new wells and nine re-entries or recompletions. This activity level comes just behind our record 80 wells in 2003. Let’s look back again to keep those numbers in perspective: TXCO drilled only 27 wells four years ago.
We made the Georgetown formation the focus of our 2004 drilling program, building on a 3-D seismic interpretation concept first employed in late 2003. The application of coherency processing has allowed us to turn this iffy, hit-or-miss play into a consistent producer with a success rate approaching 90 percent. TXCO spudded 25 new Georgetown wells and re-entered one well last year. In addition, three wells originally targeting Glen Rose reefs were completed in the Georgetown.
Those who have been on this journey with us for several years have heard us talk about the Glen Rose formation. It’s special because it offers three distinct plays-reefs, shoals and the porosity. During 2004, TXCO spudded 19 of 28 planned new Glen Rose wells plus three re-entries. We continued the highly successful horizontal Glen Rose shoal drilling program, drilling 10 successful gas wells in a row.
We had hoped to accelerate our active program drilling the oil-saturated porosity in 2004. However, the key operating partner on this play, CMR Energy LP, went through a major corporate restructuring that delayed drilling until August. Results were impressive — two for two — when drilling finally commenced. Both wells have been excellent oil producers. They were drilled employing a new concept in which the horizontal wellbore parallels formation faults, enhancing oil recovery and hopefully lessening water intrusion from below the oil-bearing zone. Two additional Glen Rose porosity re-entries started late last year are now being completed. Since the porosity’s discovery in early 2002, we have produced more than 1.8 million barrels of oil from it but we’ve hardly scratched the surface of this 20-square-mile, oil-filled geologic feature.
The Glen Rose reef illustrates the advantage we enjoy from the Maverick Basin’s Multi-Play/Multi-Pay nature. The reefs had been consistent gas producers in the past. Interpretation of 3-D seismic data on a new area on the northern portion of our acreage found more than a dozen new reefs. We spudded seven vertical wells in this area during 2004, resulting in two successful gas producers. The other wells found water-bearing reefs with no hydrocarbons because they had been broken by tectonic events. However, we still successfully completed three of these wells horizontally in the Georgetown formation while the other two remain under evaluation for potential completion to alternate formations.
The Company drilled 13 San Miguel oil wells in 2004, including 10 wells budgeted for our Pena Creek waterflood, plus one re-entry. We spudded three wells on our Comanche lease to test a new area in the San Miguel formation, which did not prove economic.
TXCO’s partner in the deep Jurassic, Blue Star Oil & Gas Ltd., finished testing its Taylor wildcat in early 2004. This well was the first to penetrate the Jurassic in the Maverick Basin. The well found high-Btu gas in uncommercial quantities. We assumed its operation in March 2004 and currently produce gas from the overlying Cretaceous Pearsall formation. TXCO remains in close communication with Blue Star about future drilling plans.
Looking Ahead
The solid gains in 2004 make our future brighter than ever. We start 2005 on a positive note, with growing gas production rates and an ambitious CAPEX budget that I expect to further increase reserves, production and revenues. We have four drilling rigs working on our acreage with a fifth on the way, compared to only two a year ago.
We’ve set our 2005 capital budget in the range of $26 million to $33 million. These numbers may expand or contract depending on drilling results, commodity prices and rig availability. We’re staying true to our desire to grow with the drillbit: More than 90 percent of that budget has been earmarked for drilling. For 2005, the Georgetown will get the largest share of our drilling dollars. Our budget currently projects 34 Georgetown wells as we continue developing this exciting play.
The Glen Rose will receive the second-largest slice of the CAPEX pie. Our initial budget calls for six new wells plus three re-entries. We’ve earmarked $2.8 million for 10 wells in the San Miguel play and $1.5 million for other projects, including a new seismic acquisition program.
| 3 | Annual Report 2004 |
I see our journey on the road to growth continuing for many years to come. We have conservatively estimated 1,500 prospective drilling locations on our Maverick Basin acreage. Based on ongoing geophysical work, we believe this number may continue to increase as we assimilate additional acreage and new seismic acquisitions.
In February 2005, we announced an expansion of our Maverick Basin acreage position to some 727,000 acres, including 61,000 acres under option — a tremendous block for a company of any size. We acquired rights to more than 174,000 additional acres in an asset exchange agreement with partners to leases located south and east of our existing block. This acreage strongly complements what we’re doing now and appears very promising for all our potentially productive formations, including the Georgetown, Glen Rose, San Miguel, Olmos coalbed methane project and the deep Jurassic. Our Multi-Play/Multi-Pay strategy has, if anything, become stronger.
As TXCO continues to grow, we’re mindful management’s first priority must be increasing the value of our shareholders’ investment. I believe the numbers I cite above prove we’ve done well in meeting that objective. But we want to consider courses that could help us do better. In December, we retained the investment firm of Raymond James & Associates to assist in reviewing strategic alternatives. We’ve jointly looked at several alternatives, including access to additional lower-cost capital, teaming up with better-capitalized partners, selling down our interest in selected formations of our block (as we did in our February acreage expansion), or a sale or merger. To date, we’ve held preliminary discussions with several well-qualified industry participants but we have nothing definitive to announce.
TXCO’s strategic alternative review and our new acreage acquisition are examples of the corporate strategies I’ve outlined here before:
| • | Focused exploration and strategic acquisitions in the Maverick Basin. | |||
| • | Internally developing a multi-year drilling inventory through use of 3-D seismic. | |||
| • | Maintaining a strong balance sheet with a conservative debt profile. | |||
| • | Maximizing value-creation by evaluating multi-pay zones in every well drilled. | |||
| • | Accelerating drilling programs through internal cash flow, our reserve-based credit facility and key industry alliances. | |||
These strategies are the roadmap we use as we go forward. They’re working, and I believe they will continue to guide us in the promising years ahead.
Allow me to look briefly at corporate governance and TXCO’s internal accounting and operating procedures. As I’ve said before, we view accountability to our investors as a priority. The attached Form 10-K contains our first report reviewing internal controls as required by the Sarbanes-Oxley Act. We’ve always strived to adopt and adhere to best practices in administering our business. We have committed considerable time and money in the past year to assure TXCO meets or exceeds standards set by this law. Overall I’m pleased to report that the controls we have had in place work well.
That review effort came on top of the regular duties of our 47 talented employees. Their continued hard work creates our synergy of profitability — applying advanced technology to develop mineral assets. They keep us on the road to growth. Thanks to their talents and your trust in this Company, I believe TXCO will continue to thrive in a rewarding and profitable future.
Warmest regards to each of you,

James E. Sigmon
President and CEO
March 24, 2005
| The Exploration Company | 4 |
Questions & Answers About The Exploration Company
What should I look for in TXCO going forward? What will be the signal that you’re successful?
The signs of success for The Exploration Company are the same as with other exploration and production companies. Two key measures come to mind: Growing reserves and growing cash flow. TXCO has had success by both of these measures. Growing reserves indicate operational success and show that a firm can successfully convert its ideas and theories into shareholder value. Growing cash flow shows a development program works. Accelerating cash flow provides the capital needed to further grow the program.
Why did you begin your strategic alternatives review? Does this mean the Company is for sale?
TXCO has demonstrated it can grow shareholder value. However, we recognize there are alternatives that merit consideration at this point in our development cycle and the energy industry’s business cycle. In December 2004, we announced the engagement of Raymond James & Associates to assist in reviewing potential strategic alternatives.
Although TXCO has an abundance of attractive prospects, it does not have an abundance of capital. This review will help us identify possible ways to increase capital access, such as partnerships, joint ventures, assets trades, etc. Our February 2005 asset exchange, in which we added 174,000 gross acres to our Maverick Basin block, is an example of one such alternative. A merger or sale of the Company are just two of many options. No decision has been made at this time regarding the best method to speed up development of the Company’s properties.
While the review is under way, TXCO continues to actively pursue its ongoing growth plans. Our 2005 capital expenditure budget is ambitious, calling for TXCO to drill 67 wells — a high number by historic standards. We continue to identify new drilling locations in numerous geologic formations and expand our 3-D seismic database.
You say you want to grow through drilling, but is TXCO interested in acquisitions?
Only if they create synergy with what we do now and enhance shareholder value. We know the Maverick Basin well and we believe our greatest chance for profitable growth lies there. A good example of the sort of acquisition we will consider is our Maverick-Dimmit Pipeline system, acquired in 2002. It created important synergies with our existing gas production operations, increasing the value of our Maverick Basin reserves. The pipeline allows us to achieve a better netback on natural gas prices. And as other operators increase drilling and production in the basin, the pipeline provides a growing income stream for the Company.
We continue to acquire acreage in the Maverick Basin, including tracts in early 2004 and early 2005, that play to our strengths. These acreage acquisitions will allow us to further develop the potential of many plays. Currently, have some 727,000 gross acres in the basin where we can explore and develop more than a dozen oil and gas plays — with additional plays awaiting the drillbit.
Your focus is on the Maverick Basin yet you retain a sizeable acreage position in the Williston Basin. What are your plans for this area?
TXCO currently holds interests in approximately 84,000 gross acres of the Williston Basin, located in the western Dakotas and eastern Montana. We participated in one new well and two re-entries there in 2004. Although the Williston Basin offers development potential, TXCO believes its greatest prospects for growth and profitability lie in the Maverick Basin. We continue to evaluate our Williston Basin leases and may pursue a transaction with operators that have a focus on this region.
We have not designated any of our 2005 CAPEX to the Williston Basin. Instead, we are farming out TXCO’s interests to operators active in the area.
Why should I buy TXCO rather than some other energy company?
We believe The Exploration Company has attributes that make us an attractive addition to any portfolio. We are the dominant player in a focus area with large development potential that we know very well. Our track record of employing advanced technology, such as 3-D seismic and horizontal drilling, to unlock oil and gas from the basin’s multiple pay zones indicates we’re on a road of continuing growth.
We hold a multi-year project inventory that will keep us busy for years to come even if we don’t acquire additional acreage. And, one of our strengths is an experienced exploratory and operations team. We’re focused, we know our area well and we believe we have great potential to significantly increase shareholder value as The Exploration Company goes forward.
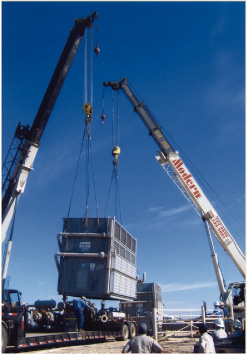 |
| The Exploration Company improved the efficiency of its pipeline system by moving this compressor from the Paloma station on the northern portion of TXCO’s acreage block to its Mangus compressor station, located east of Eagle Pass, Texas. The pipeline had growing sales during 2004, supplying gas to customers in both the United States and Mexico. |
| 5 | Annual Report 2004 |
TXCO Marked a Busy Operating Year in the Maverick Basin
The drillbit powers The Exploration Company’s journey on the road to growth. Unlike many of its peers, TXCO believes its most outstanding growth will be organic — coming from within — rather than through outside acquisitions of new assets. That makes the Company’s drilling and production operations crucial to its future success. Overall, TXCO continued to have success in employing such important technologies as horizontal drilling and 3-D seismic to unlock the reserves of the Maverick Basin.
TXCO continued the brisk operation pace it has set in recent years. For 2004, it participated in 69 wells, including 60 new wells and nine re-entries or recompletions — the Company’s second-busiest annual drilling program ever. Of the 60 new wells for 2004, there were 44 completed and 16 remained in progress at the end of December, including two that were still drilling, with no dry holes for the year. TXCO participated in eight wells during fourth-quarter 2004 despite heavy rains that impaired field operations, in addition to an annual hunting season drilling moratorium that limits work on numerous leases.
The Company’s net oil and gas sales volumes in 2004 were a record 4.9 Bcfe. Natural gas sales volumes were 41 percent higher than in 2003, more than offsetting a 29 percent decline in oil sales as a partner’s restructuring delayed drilling in the Glen Rose porosity oil play for most of 2004. The Company’s sales mix at year end was 40 percent crude oil and 60 percent natural gas from wells tapping 13 different productive formations.
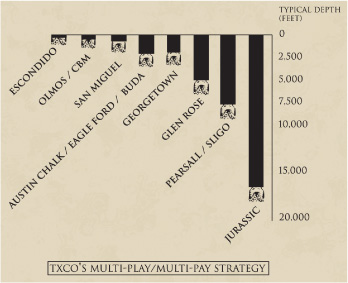
In all, the Maverick Basin has produced oil and gas from more than 20 different geological zones since the 1920s, illustrating the Multi-Play/Multi-Pay potential of the Company’s acreage.
Here’s a look at TXCO’s Maverick Basin operations during 2004 by play:
Georgetown
TXCO enjoyed continuing success in the Georgetown during the year with the 3-D seismic coherency processing method first employed successfully in late 2003. TXCO spudded 25 new Georgetown wells and re-entered one well in 2004, in addition to three Georgetown completions in wells that originally targeted Glen Rose reefs. Net Georgetown field production exit rate at Dec. 31 stood at 5.7 MMcfd and 435 BOPD.
The gas-bearing portion of TXCO’s acreage block, particularly the Comanche Ranch and Pena Creek acreage block, had noteworthy Georgetown success. Seventeen Georgetown wells were drilled on the southern portion of TXCO’s acreage block. Of these, 10 were placed on production, five are in progress or awaiting completion, one was drilling at year end while one had a mechanical failure. On the northern portion of the Company’s acreage block, which is more oil prone, eight Georgetown wells were drilled and one well re-entered during the year. Four were producing and five were shut in pending further evaluation for recompletion attempts.
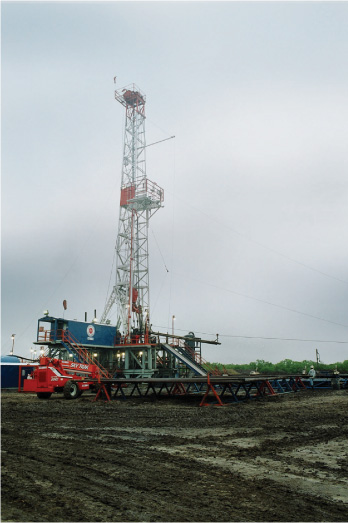
Rain pours from storm clouds gathered above a rig as it drills ahead on the Chittim 1-160H, one of the Company’s successful Glen Rose shoal gas wells in 2004. Record rains and flooding interfered with field operations throughout the Maverick Basin during the year.
| The Exploration Company | 6 |
 |
| The Kothman 1-675H on the Pena Creek lease went on production in early 2004, flowing gas from the Georgetown formation. Company explorationists use an advanced seismic coherency processing technique to pinpoint the Georgetown’s extensive faults and fractures. Drilling horizontal wells, such as the Kothman, through these faults and fractures greatly increases production rates. |
| 7 | Annual Report 2004 |
Board of Directors
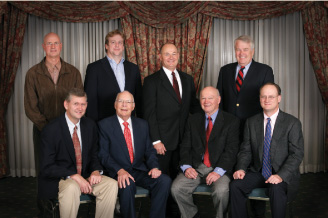
Front row, from left:
Michael Heinz,
Robert L. Foree Jr.,
Stephen M. Gose Jr.,
Thomas H. Gose.
Back row, from left:
Alan L. Edgar,
Charles W. Yates,
James E. Sigmon,
Michael J. Pint.
Stephen M. Gose, Jr. | James E. Sigmon | Thomas H. Gose | ||
| President | President and Chief Executive Officer | President | ||
| Retamco Operating, Inc. | The Exploration Company | NEOgas Ltd. | ||
| Roberts, Montana | San Antonio, Texas | Houston, Texas | ||
Chairman of the Board | Member, Nominations Committee | |||
Chairman, Compensation Committee | Robert L. Foree, Jr. | Member, Audit Committee | ||
Member, Nominations Committee | Chairman and President | |||
| Foree Oil Company | Alan L. Edgar | |||
Michael J. Pint | Dallas, Texas | President | ||
| Investments and Banking | Chairman, Nominations Committee | Cochise Capital, Inc. | ||
| Minneapolis, Minnesota | Member, Audit Committee | Dallas, Texas | ||
Chairman, Audit Committee | Member, Compensation Committee | Member, Compensation Committee | ||
Member, Compensation Committee | Member, Nominations Committee | |||
Member, Nominations Committee | Michael Heinz | |||
| Reservoir Engineer | ||||
Charles W. Yates III | Kayne Anderson Capital Advisors | |||
| Managing Director | Houston, Texas | |||
| Kayne Anderson Capital Advisors | Board Observer | |||
| Houston, Texas |
Executive Officers and Key Employees
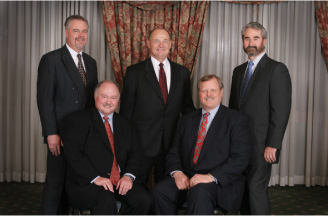
From left:
James J. Bookout,
P. Mark Stark,
James E. Sigmon,
Richard A. Sartor,
Roberto R. Thomae.
James E. Sigmon | P. Mark Stark | James J. Bookout | Roberto R. Thomae | |||
| President and | Vice President, Treasurer and | Vice President, | Corporate Secretary | |||
| Chief Executive Officer | Chief Financial Officer | Chief Operating Officer | Vice President, Capital Markets | |||
Richard A. Sartor | Robert J. Scott | Robert E. Lee, Jr. | Sherry L. Fletcher | |||
| Controller | Chief Geologist | Land Manager | Reservoir Manager | |||
Paul D. Hart | Stephen P. Carter | Gregory W. Wood | E. Scott Graef | |||
| Communications | Drilling Engineer | Marketing-Pipeline | Senior Production Engineer | |||
| Manager | Manager |
| The Exploration Company | 8 |
CORPORATE OFFICES | ||||
| The Exploration Company of Delaware, Inc. | ||||
| 500 North Loop 1604 East, Suite 250 | Phone: (210) 496-5300 | E-mail: txco@txco.com | ||
| San Antonio, Texas 78232 | Fax: (210) 496-3232 | Web site: www.txco.com |
AUDITORS | TRANSFER AGENT | OUTSTANDING SHARES | ||
| Akin, Doherty, Klein & Feuge, P.C. | American Stock Transfer & Trust Co. | At March 4, 2005, the Company had | ||
| San Antonio, Texas | 59 Maiden Lane | 28,165,563 shares of common stock | ||
| New York, New York 10038 | outstanding held by approximately | |||
INDEPENDENT | Investor Relations: (800) 937-5449 | 1,144 shareholders of record and 6,200 | ||
RESERVOIR ENGINEERS | Outside U.S. : (718) 921-8124 | shareholders whose stock was held in | ||
| DeGolyer and MacNaughton | Web site: http://www.amstock.com | street name. | ||
| Dallas, Texas | Please contact the Company's | |||
transfer agent directly for | ||||
| Netherland Sewell & Associates, Inc. | information regarding changes | |||
| Dallas, Texas | of address, registration of shares, | |||
transfers or lost certificates, or | ||||
CUSIP NUMBER | for information about your | |||
| 302133202 | shareholder account. |
SHAREHOLDER RELATIONS
The Exploration Company incorporates herein its 2004 Annual Report on Form 10-K as filed with the Securities and Exchange Commission. A copy of the Form 10-K, quarterly reports, or other Company financial communications will be furnished, without charge, to any owner of Company stock, upon written request to the Corporate Secretary. Copies also are available on the Company’s Web site at www.txco.com.
2005 ANNUAL MEETING
Shareholders in The Exploration Company are cordially invited to attend TXCO’s annual meeting, which will be held at 10 a.m., Central Daylight Time, Friday, May 13, at the San Antonio Petroleum Club, 8620 North New Braunfels Ave., Suite 700, San Antonio, Texas 78217.
| 2004 STOCK PERFORMANCE | ||||||||||||||||
| Average | ||||||||||||||||
| Daily | ||||||||||||||||
| High | Low | Close | Volume | |||||||||||||
| 1st Quarter | $ | 7.19 | $ | 3.89 | $ | 4.18 | 175,257 | |||||||||
| 2nd Quarter | $ | 4.38 | $ | 3.44 | $ | 3.79 | 58,574 | |||||||||
| 3rd Quarter | $ | 4.61 | $ | 3.68 | $ | 4.55 | 94,936 | |||||||||
| 4th Quarter | $ | 6.60 | $ | 3.98 | $ | 6.32 | 171,169 | |||||||||
STOCK EXCHANGE LISTING
The Exploration Company’s common
stock trades on the Nasdaq SmallCap
market tier under the symbol TXCO.
ABBREVIATIONS & GLOSSARY OF TERMS
| Bbls | Barrels, equal to 42 U.S. gallons | MMBtu | Million British thermal units | |||
| Bcf | Billion cubic feet of natural gas | MMcf/MMcfd | Million cubic feet/Million cubic feet per day | |||
| Bcfe | Billion cubic feet equivalent | MMcfe/MMcfed | Million cubic feet equivalent/MMcfed | |||
| BO | Barrel of Oil | per day | ||||
| BOPD | Barrels of oil per day | PV-10 | A standard estimate of the value of proved | |||
| Btu | British thermal unit, a measure of | oil and gas reserves and future net revenues | ||||
| heat energy | they may generate, based on constant year- | |||||
| BWPD | Barrels of water per day | end commodity prices and discounted at 10 | ||||
| CBM | Coalbed Methane | percent. | ||||
| MBbls | Thousand barrels | WI | Working Interest | |||
| Mcf | Thousand cubic feet |
CAPEX- Capital expenditures.
Computer-Assisted Exploration (CAEX)- The use of advanced computer technology to compile and assemble seismic and geologic data into a visualization of underground formations. This technology greatly increases the ability for exploration companies to pinpoint and tap hydrocarbons while minimizing the number of dry holes.
Farmout- Assignment of a lease to a third party with requirements, such as drilling one or more wells. The third party earns an interest in the lease by performing the work stipulated.
Gas Equivalent- One barrel of oil is approximately the energy equivalent of 6,000 cubic feet of natural gas.
Reserves- Estimated quantities of crude oil and natural gas in the ground that geological and engineering analysis indicate are recoverable. Proved reserves are oil and gas that can be produced commercially with reasonable certainty. Probable reserves are oil and gas with at least a 50 percent chance of being commercially recoverable. Possible reserves are unproved quantities of oil and gas that may or may not be commercially recoverable.
2-D/3-D Seismic- Electronic images created by bouncing sound waves off underground rock formations. Technicians use this data to create computer-generated images in either two or three dimensions to locate formations favorable to finding oil or natural gas accumulations.
