UNITED STATES
SECURITIES AND EXCHANGE COMMISSION
Washington, D.C. 20549
FORM 10-K
(Mark One)
|
| |
| ý | ANNUAL REPORT PURSUANT TO SECTION 13 OR 15(d) OF THE SECURITIES EXCHANGE ACT OF 1934 |
For the fiscal year ended December 31, 2016
or
|
| |
| o | TRANSITION REPORT PURSUANT TO SECTION 13 OR 15(d) OF THE SECURITIES EXCHANGE ACT OF 1934 |
For the transition period from to
Commission File Number: 000-15760
Hardinge Inc.
(Exact name of registrant as specified in its charter)
|
| | |
| New York | | 16-0470200 |
| (State or other jurisdiction of incorporation or organization) | | (I.R.S. Employer Identification No.) |
| | | |
One Hardinge Drive Elmira, NY | | 14902 |
| (Address of principal executive offices) | | (Zip Code) |
(607) 734-2281
(Registrant’s telephone number, including area code)
Securities registered pursuant to Section 12(b) of the Act: NONE
Securities registered pursuant to Section 12(g) of the Act:
|
| | |
| Title of each class | | Name of each exchange on which registered |
| Common Stock, $0.01 par value per share | | NASDAQ Global Select Market |
Indicate by check mark if the registrant is a well-known seasoned issuer, as defined in Rule 405 of the Securities Act. oYes ýNo
Indicate by check mark if the registrant is not required to file reports pursuant to Section 13 or Section 15(d) of the Act. oYes ýNo
Indicate by check mark whether the registrant (1) has filed all reports required to be filed by Section 13 or 15(d) of the Securities Exchange Act of 1934 during the preceding 12 months (or for such shorter period that the registrant was required to file such reports), and (2) has been subject to such filing requirements for the past 90 days. ýYes oNo
Indicate by check mark whether the registrant has submitted electronically and posted on its corporate Web site, if any, every Interactive Data File required to be submitted and posted pursuant to Rule 405 of Regulation S-T (§232.405 of this chapter) during the preceding 12 months (or for such shorter period that the registrant was required to submit and post such files). ýYes oNo
Indicate by check mark if disclosure of delinquent filers pursuant to Item 405 of Regulation S-K (§229.405 of this chapter) is not contained herein, and will not be contained, to the best of registrant’s knowledge, in definitive proxy or information statements incorporated by reference in Part III of this Form 10-K or any amendment to this Form 10-K. o
Indicate by check mark whether the registrant is a large accelerated filer, an accelerated filer, a non-accelerated filer, or a smaller reporting company. See definitions of “large accelerated filer,” “accelerated filer” and “smaller reporting company” in Rule 12b-2 of the Exchange Act.
|
| | |
Large accelerated filer o | | Accelerated filer x |
Non-accelerated filer o (Do not check if a smaller reporting company) | | Smaller reporting company o |
Indicate by check mark whether the registrant is a shell company (as defined in Rule 12b-2 of the Exchange Act). oYes ýNo
The aggregate market value of the voting stock held by non-affiliates of the registrant as of June 30, 2016 was $103.4 million, based on the closing price of common stock on the NASDAQ Global Select Market on June 30, 2016.
As of February 28, 2017 there were 12,902,366 shares of common stock of the registrant outstanding.
DOCUMENTS INCORPORATED BY REFERENCE
Portions of Hardinge Inc.’s Proxy Statement for its 2017 Annual Meeting of Shareholders to be filed with the Commission are incorporated by reference to Part III of this Form 10-K.
HARDINGE INC. AND SUBSIDIARIES
TABLE OF CONTENTS
PART I
Item 1. Business.
General
Hardinge Inc.'s principal executive office is located within Chemung County at One Hardinge Drive, Elmira, New York 14902-1507. Unless otherwise mentioned or unless the context requires otherwise, all references to "Hardinge," "we," "us," "our," "the Company" or similar references mean Hardinge Inc. and its subsidiaries.
Our website, www.hardinge.com, provides links to all of the Company's filings with the Securities and Exchange Commission. A copy of this annual report on Form 10-K and our other annual, quarterly, current reports, and amendments thereto filed with SEC are available on the website or can be obtained free of charge by contacting the Investor Relations Department at our principal executive office. Alternatively, such reports may be accessed at the Internet address of the SEC, which is www.sec.gov, or at the SEC's Public Reference Room at 100 F Street, NE, Washington, DC 20549. Information about the operation of the SEC's Public Reference Room may be obtained by calling the SEC at 1-800-SEC-0330.
We are a global designer, manufacturer and distributor of machine tools, specializing in precision computer numerically controlled metalcutting machines and workholding technology solutions. The Company has the following direct and indirect wholly owned subsidiaries:
|
| | |
| North America: | | |
| Canadian Hardinge Machine Tools, Ltd. | | Toronto, Canada |
| Forkardt Inc. | | Traverse City, Michigan |
| Hardinge Technology Systems, Inc. | | Elmira, New York |
| Hardinge Grinding Group | | Elgin, Illinois |
| Europe: | | |
| Forkardt Deutschland GmbH | | Reutlingen, Germany |
| Forkardt SAS | | Noisy le Sec, France |
| Hardinge GmbH | | Krefeld, Germany |
| Hardinge Holdings GmbH | | St. Gallen, Switzerland |
| Hardinge Holdings B.V. | | Amsterdam, Netherlands |
| Hardinge Machine Tools B.V. | | Raamsdonksveer, Netherlands |
| Jones & Shipman Hardinge Limited | | Leicester, England |
| Jones & Shipman SARL | | Bron, France |
| L. Kellenberger & Co., AG | | St. Gallen, Switzerland |
| Asia and Other: | | |
| Forkardt India LLP | | Hyderabad, India |
| Forkardt Precision Machinery (Shanghai) Co., Ltd. | | Shanghai, People's Republic of China |
| Hardinge China Limited | | Hong Kong, People's Republic of China |
| Hardinge Machine (Shanghai) Co., Ltd. | | Shanghai, People's Republic of China |
| Hardinge Machine Tools B.V., Taiwan Branch | | Nan Tou City, Taiwan, Republic of China |
| Hardinge Precision Machinery (Jiaxing) Company, Limited | | Jiaxing, People's Republic of China |
| Hardinge Taiwan Precision Machinery Limited | | Nan Tou City, Taiwan, Republic of China |
We have manufacturing facilities located in China, Switzerland, Taiwan, Germany, France, India, the United Kingdom ("U.K.") and the United States ("U.S."). We manufacture the majority of the products we sell.
Products
We supply high precision computer controlled metalcutting turning machines, grinding machines, machining centers, and repair parts related to those machines. The Company also engineers and supplies high precision, standard and specialty workholding devices, and other machine tool accessories. We believe our products are known for accuracy, reliability, durability and value.
Segments
The Company has two unique business segments: Metalcutting Machine Solutions ("MMS") and Aftermarket Tooling and Accessories ("ATA").
Metalcutting Machine Solutions (MMS)
This segment includes operations related to grinding, turning, and milling, as discussed below, and related repair parts. The products are considered to be capital goods with sales prices ranging from approximately forty thousand dollars for some standard products to approximately two million dollars for specialized grinding machines or other specialty built turnkey systems of multiple machines. Sales are subject to economic cycles and, because they are most often purchased to add manufacturing capacity, the cycles can be severe with customers delaying purchases during down cycles and then aggressively requiring machine deliveries during up cycles. Machines are purchased to a lesser extent during down cycles, as customers are looking for productivity improvements or they have new products that require new machining capabilities.
We have been a manufacturer of industrial-use high precision and general precision turning machine tools since 1890. Turning machines, or lathes, are power-driven machines used to remove material from either bar stock or a rough-formed part by moving multiple cutting tools against the surface of a part rotating at very high speeds in a spindle mechanism. The multi-directional movement of the cutting tools allows the part to be shaped to the desired dimensions. On parts produced by our machines, those dimensions are often measured in millionths of an inch. We consider Hardinge to be a leader in the field of producing machines capable of consistently and cost-effectively producing parts to very close dimensions.
Grinding is a machining process in which a part's surface is shaped to closer tolerances with a rotating abrasive wheel or tool. Grinding machines can be used to finish parts of various shapes and sizes. The grinding machines of our Kellenberger subsidiary are used to grind the inside and outside diameters of cylindrical parts. Such grinding machines are typically used to provide a more exact finish on a part that has been partially completed on a lathe. The Kellenberger grinding machines are generally purchased by the same type of customers as other Hardinge equipment and further our ability to be a primary source for our customers.
Our Kellenberger precision grinding technology is complemented by our Hauser, Tschudin, Usach, and Voumard grinding brands. Hauser machines are jig grinders used to make demanding contour components, primarily for tool and mold-making applications. Tschudin product technology is focused on the specialized grinding of cylindrical parts when the customer requires high volume production. Our Tschudin machines are generally equipped with automatic loading and unloading mechanisms for the part being machined. These loading and unloading mechanisms significantly reduce machine operator involvement in the production process. Usach and Voumard machines are high quality internal diameter cylindrical grinding systems used in production and job shop environments.
Machining centers are designed to remove material from stationary, prismatic, or box-like parts of various shapes with rotating tools that are capable of milling, drilling, tapping, reaming and routing. Machining centers have mechanisms that automatically change tools based on commands from an integrated computer control without the assistance of an operator. Machining centers are generally purchased by the same customers who purchase other Hardinge equipment. We supply a broad line of machining centers under our Bridgeport brand name addressing a range of sizes, speeds, and powers.
Our machines generally use commands from an integrated computer to control the movement of cutting tools, grinding wheels, part positioning, and in the case of turning and grinding machines, the rotation speeds of the part being shaped. The computer control enables the operator to program operations such as part rotation, tooling selection, and tooling movement for a specific part and then stores that program in memory for future use. The machines are able to produce parts while left unattended when connected to automatic bar-feeding, robotics equipment, or other material handling devices designed to supply raw materials and remove machined parts from the machine.
New products are critical to our growth plans. We gain access to new products through internal product development, acquisitions, joint ventures, license agreements, and partnerships. Products are introduced each year to broaden our product
offering, to take advantage of new technologies available to us, and to replace older models nearing the end of their respective product life cycles. These technologies generally allow our machines to run at higher speeds and with more power, thus increasing their efficiency. Customers routinely replace old machines with newer machines that can produce parts faster and with less time to set up the machine when converting from one type of part to another. Generally, our machines can be used to produce parts from all of the standard ferrous and non-ferrous metals, as well as plastics, composites, and exotic materials.
We focus on products and solutions for companies making parts from hard to machine materials with hard to sustain close tolerances and hard to achieve surface finishes that may be hard to hold in the machine. We believe that with our high precision and super precision lathes, our grinding machines, and our rugged machining centers, combined with our accessory products and our technical expertise, we are uniquely qualified to be the supplier of choice for customers manufacturing to demanding specifications.
Multiple options are available on many of our machines, which allows customers to customize their machines to their specific operating performance and cost objectives. We produce machines for stock with popular option combinations for immediate delivery, as well as design and produce machines to specific customer requirements. In addition to our machines, we provide the necessary tooling, accessories, and support services to assist customers in maximizing their return on investment.
The sale of repair parts is important to our business. Certain parts on machines wear out, fail, or need to be replaced due to misuse over time. Customers will buy parts from us throughout the life of the machine, which typically extends over many years. There are thousands of machines in operation in the world for which we provide those repair parts and in many cases the parts are available exclusively from us.
We offer various warranties on our equipment and consider post-sale support to be a critical element of our business. Warranties on machines typically extend for twelve months after purchase. Services provided include operation and maintenance training, in-field maintenance, and in-field repair. We offer these post sales support services on a paid basis throughout the life of the machine. In territories covered by distributors, this support and service is offered through the distributor.
Aftermarket Tooling and Accessories (ATA)
This segment includes products that are purchased by manufacturers throughout the lives of their machines. The selling prices of these units are relatively low per piece with prices ranging from forty dollars on high volume collets to two hundred thousand dollars or more for specialty chucks. While considered to be consumable, these products are more durable in nature, with replacement due to wear over time. Our products are used on all types and brands of machine tools, not limited to our own. Sales levels are affected by manufacturing cycles, but not as severely as capital goods lines. While customers may not purchase high cost machines during a down cycle, their factories are operating with their existing equipment and therefore accessories are still needed as they wear out or they are needed for a change in production requirements.
The two primary product groups in ATA are collets and chucks. Collets are cone-shaped metal sleeves used for holding circular or rod-like pieces in a lathe or other machine that provide effective part holding and accurate part location during machining operations. Chucks are a specialized clamping device used to hold an object with radial symmetry, especially a cylindrical object. It is most commonly used to hold a rotating work piece. Some of our specialty chucks can also hold irregularly shaped objects that lack radial symmetry. While our products are known for accuracy and durability, they are consumable in nature.
We offer an extensive line of workholding and toolholding solutions that are available in tens of thousands of shapes and sizes to meet unique customer application needs. These solutions can be used on virtually all types and brands of metalcutting machines, as well as non-traditional uses in many industrial applications. The Company continues to explore opportunities to expand this business organically and through acquisitions.
Sales, Markets and Distribution
We sell our products in most of the industrialized countries of the world through a combination of distributors, agents, and manufacturers' representatives. In certain areas of China, France, Germany, India, North America, and the United Kingdom, we have also used a direct sales force for portions of our product lines. Generally, our distributors have an exclusive right to sell our products in a defined geographic area. Our distributors operate as independent businesses and purchase products from us at discounted prices for their customers, while agents and representatives sell products on our behalf and receive commissions on sales. Our discount schedule is adjusted to reflect the level of pre and post sales support offered by our distributors. Our direct sales personnel earn a fixed salary plus commission. Sales through distributors are made only on standard commercial open account terms or through letters of credit. Distributors generally take title to products upon shipment from our facilities and do not have any special return privileges.
Our standard ATA products are sold through direct telephone orders and via our web site at www.shophardinge.com. Custom or special solutions are sold through direct sales and agents. In most cases, we are able to package and ship in-stock tooling, accessories, and repair parts within 24 hours of receiving orders. We can package and ship items with heavy demand within a few hours. In other parts of the world, these products are sold on either a direct sales basis or through distributor arrangements.
We promote our products through advertising in trade publications, web presences, email newsletters, and participation in industry trade shows. In addition, we market our non-machine products and capabilities through the publication of general catalogs and other targeted catalogs, which we distribute to existing and prospective customers. We have a considerable presence on the internet at www.hardinge.com and www.forkardt.com, where customers can obtain information about our products and place orders for accessories, tooling, knee mill products and repair parts.
A substantial portion of our end use customers are small and medium-sized independent job shops, which in turn sell machined parts to their industrial customers. Industries directly and indirectly served by us include aerospace, automotive, computer, communications, consumer-electronics, construction equipment, defense, energy, farm equipment, medical equipment, recreational equipment, and transportation.
No single customer or related group of customers accounted for more than 5% of our consolidated sales in 2016 or 2015. While valuing our relationship with each customer, we do not believe that the loss of any single customer, or any few customers, would have an adverse material effect on our business.
Competitive Conditions
In our industry, the barriers to entry for competition vary based on the level of product performance required. For the products with the highest performance in terms of accuracy and productivity, the barriers are generally technical in nature. For basic products, often the barriers are not technical; they are tied to product availability, competitive price position, and an effective distribution model that offers the pre and post sales support required by customers. Another significant barrier in the global machine tool industry is the high level of working capital that is required to operate the business.
We compete in various sectors of the machine tool market within the products of turning, milling, grinding, tooling and accessories. We compete with multiple companies in each market sector we serve. The primary competitive factors in the marketplace for our machine tools are reliability, price, delivery time, service, and technological characteristics. Our management considers our segment of the industry to be extremely competitive. There are many manufacturers of machine tools in the world. They can be categorized by the size of material their products can machine and the precision level their products can achieve. For our high precision, multi-tasking turning and milling equipment, competition comes primarily from companies such as DMG Mori Seiki, Mazak, and Okuma. Competition in our more standard turning and milling equipment comes, in part, from those companies as well as Doosan, which is based in South Korea, and Haas, which is based in the U.S., as well as many Taiwanese companies. Our internal and outer diameter (ID/OD) cylindrical grinding machines compete primarily with products manufactured by Studer, a Swiss company, as well as Toyoda and Shigiya, which are based in Japan. Our Hauser jig grinding machines compete primarily with products manufactured by Moore Tool, which is based in the U.S., and some Japanese suppliers. Our surface grinding machines compete with products manufactured by Okamoto in Japan and Chevalier in Taiwan. Our ATA products compete with many products manufactured by smaller companies.
The overall number of our competitors providing product solutions serving our target markets may increase. Also, the overall composition of companies with which we compete may change as we broaden our product offerings and the geographic markets we serve. As we expand into new market areas, we will face competition not only from our existing competitors but from other competitors as well, including existing companies with strong technological, marketing and sales positions in those markets. In addition, several of our competitors may have greater resources, including financial, technical, and engineering resources, than we do.
Sources and Availability of Components
Our machines within the MMS segment are produced around the world. We produce certain of our lathes, knee mills, and related products at our Elmira, New York plant. The Kellenberger and Voumard grinding machines and related products are manufactured at our St. Gallen, Switzerland plant and Hauser and Tschudin products are produced at our Biel, Switzerland facility. The Jones & Shipman grinding machines are manufactured at our Leicester, England plant. The Usach grinding machines are manufactured at our Elgin, Illinois plant. We produce machining centers and lathes at our Hardinge Taiwan facility in Nan Tou, Taiwan and our Hardinge Precision Machinery (Jiaxing) Company, Ltd. facility in Jiaxing, China. The Company's Forkardt and Hardinge branded ATA segment products and solutions are engineered and produced in our plants located in Traverse City, Michigan, Elmira, New York, Reutlingen, Germany, Noisy le Sec, France, Hyderabad, India and Shanghai, China. We manufacture products from various raw materials, including cast iron, sheet metal, and bar steel. We purchase a number of components, sub-assemblies and assemblies from outside suppliers, including the computer and electronic components for our computer controlled lathes, grinding machines, and machining centers. There are multiple suppliers for virtually all of our raw material, components, sub-assemblies and assemblies and historically, we have not experienced a serious supply interruption. However, in 2011, because of the increase in demand driven by early 2011 worldwide order activity, producers of bearings, ball screws, and linear guides had difficulty meeting the rise in demand. Similar demand increase in the future could impact our production schedules.
A major component of our computer controlled machines is the computer and related electronics package. We purchase these components from Fanuc Limited, a Japanese electronics company, Heidenhain, a German control supplier, Mitsubishi Electric, a Japanese electronics company, or from Siemens, another German control manufacturer. While we believe that design changes could be made to our machines to allow sourcing from several other existing suppliers, and we occasionally do so for special orders, a disruption in the supply of the computer controls from one of our suppliers could cause us to experience a substantial disruption of our operations, depending on the circumstances at the time. We purchase parts from these suppliers under normal trade terms. There are no agreements with these suppliers to purchase minimum volumes per year.
Research and Development
Our ongoing research and development program involves creating new products, modifying existing products to meet market demands, and redesigning existing products, both to add new functionality and to reduce the cost of manufacturing. Our research and development departments throughout the world are staffed with experienced design engineers with varying levels of education, ranging from technical to doctoral degrees.
The worldwide cost of research and development, all of which has been charged to operating expense, amounted to $13.5 million, $14.1 million and $13.9 million, in 2016, 2015 and 2014, respectively.
Patents
Although we hold several patents with respect to certain of our products, we do not believe that our business is dependent to any material extent upon any single patent or group of patents.
Seasonal Trends and Working Capital Requirements
Hardinge's business and that of the machine tool industry in general, is cyclical. It is not subject to significant seasonal trends. However, our quarterly results are subject to fluctuation based on the timing of our shipments of machine tools, which are largely dependent upon customer delivery requirements. Given that a large percentage of our sales are from Asia, the impact of plant shutdowns in that region by us and our customers due to the celebration of the Lunar New Year holiday may impact the first quarter sales, income from operations, and net income, and result in the first quarter being the lowest quarter of the year.
The ability to deliver products within a short period of time is an important competitive criterion. We must have inventory on hand to meet customers' delivery expectations, which for standard machines typically range from immediate to eight weeks delivery. Meeting this requirement is especially difficult with some of our products, where delivery is extended due to time associated with shipping on ocean-going vessels, depending on the location of the customer. This creates a need to have inventory of finished machines available in our major markets to serve our customers in a timely manner.
We deliver many of our machine products within one to two months after the order. Some orders, especially multiple machine orders, are delivered on a turnkey basis with the machine or group of machines configured to make certain parts for the customer. This type of order often includes the addition of material handling equipment, tooling and specific programming. In those cases, the customer usually observes and inspects the parts being made on the machine at our facility before shipment so the timing of the sale is dependent upon the customer's schedule and acceptance. Lead time for these types of orders, especially grinding machines, can range from six to eight months. Therefore, sales from quarter-to-quarter can vary depending upon the timing of customers' acceptances and the significance of those orders.
We feel it is important, where practical, to provide readily available accessories and replacement parts for the machines we sell and we carry inventory at levels sufficient to meet these customer requirements.
Governmental Regulations
We believe that our current operations and our current uses of property, plant and equipment conform in all material respects to applicable laws and regulations in the various countries in which we conduct business.
Governmental Contracts
No material portion of our business is subject to government contracts.
Environmental Matters
Our operations are subject to extensive federal, state, local and foreign laws and regulations relating to environmental matters. Certain environmental laws can impose joint and several liability for releases or threatened releases of hazardous substances upon certain statutorily defined parties regardless of fault or the lawfulness of the original activity or disposal. Hazardous substances and adverse environmental effects have been identified with respect to real property we own and on adjacent parcels of real property.
In particular, our Elmira, NY manufacturing facility is located within the Kentucky Avenue Wellfield on the National Priorities List of hazardous waste sites designated for cleanup by the United States Environmental Protection Agency ("EPA") because of groundwater contamination. The Kentucky Avenue Wellfield Site (the "Site") encompasses an area which includes sections of the Town of Horseheads and the Village of Elmira Heights in Chemung County, NY. In February 2006, the Company received a Special Notice Concerning a Remedial Investigation/Feasibility Study ("RI/FS") for the Koppers Pond (the "Pond") portion of the Site. The EPA documented the release and threatened release of hazardous substances into the environment at the Site, including releases into and in the vicinity of the Pond. The hazardous substances, including metals and polychlorinated biphenyls, have been detected in sediments in the Pond.
Until receipt of this Special Notice in February 2006, the Company had never been named as a potentially responsible party ("PRP") at the Site nor had the Company received any requests for information from the EPA concerning the Site. Environmental sampling on our property within this Site under supervision of regulatory authorities had identified off-site sources for such groundwater contamination and sediment contamination in the Pond, and found no evidence that our operations or property have contributed or are contributing to the contamination. We have notified all appropriate insurance carriers and are actively cooperating with them, but whether coverage will be available has not yet been determined and possible insurance recovery cannot be estimated with any degree of certainty at this time.
A substantial portion of the Pond is located on our property. The Company, along with Beazer East, Inc., the Village of Horseheads, the Town of Horseheads, the County of Chemung, CBS Corporation and Toshiba America, Inc., (collectively, the "PRP's"), agreed to voluntarily participate in the RI/FS by signing an Administrative Settlement Agreement and Order of Consent on September 29, 2006. On September 29, 2006, the Director of Emergency and Remedial Response Division of the EPA, Region II, approved and executed the Agreement on behalf of the EPA. The PRP's also signed a PRP Member Agreement, agreeing to share the costs associated with the RI/FS study on a per capita basis.
The EPA approved the RI/FS Work Plan in May of 2008. In July of 2012 the PRP's submitted a Remedial Investigation (RI) to respond to EPA issues raised in the initial draft RI. In January 2016, the PRP's submitted a draft Feasibility Study (FS), also to respond to issues raised by the EPA about previous drafts of the FS. In July 2016, the EPA announced its proposed remediation plan based on an alternative put forth in a July 2016 Woodruff & Curran FS with an estimated total clean-up phase cost of $1.9 million. The preferred remedy consists of the placement of a continuous six-inch thick soil and sand cap, including a geotextile membrane to act as a demarcation layer, over Koppers Pond. The preferred remedy includes long-term monitoring and institutional controls. After a public comment period the EPA concluded this RI phase of its process documented in a letter in December 2016.
The Company has recorded a reserve of $0.3 million for its estimated related liability, assuming all of the PRP's would continue to share costs equally in the clean-up phase of the project. Based on our understanding including discussions with our experts, it is possible that the PRP's may change and/or the relative split of costs may be different for this final phase of the project. However, this will not be known for quite some time, and this ongoing estimate of “7 split equally” is viewed as the best possible estimate at the moment. This reserve is reported in Accrued expenses on the Consolidated Balance Sheets.
We believe, based upon information currently available that, except as described in the preceding paragraphs, we will not have material liabilities for environmental remediation. Though the foregoing reflects the Company's current assessment as it relates to environmental remediation obligations, it is possible that future remedial requirements or changes in the enforcement of existing laws and regulations, which are subject to extensive regulatory discretion, will result in material liabilities to the Company.
Employees
As of December 31, 2016, Hardinge Inc. employed 1,451 persons, 463 of whom were located in the United States. Management believes that relations with our employees are good.
Foreign Operations and Export Sales
Information related to foreign and domestic operations and sales is included in Note 18. "Segment Information" to the Consolidated Financial Statements contained in this Annual Report. Our strategy has been to diversify our sales and operations geographically so that the impact of economic trends in different regions can be balanced.
The risks associated with conducting business on an international basis are discussed further in Item 1A. "Risk Factors".
Item 1A. Risk Factors.
Risk Factors That May Impact Future Results
Current and potential shareholders should carefully consider the risks described below. These are the risks and uncertainties we believe are most important for shareholders to consider. Additional risks and uncertainties not presently known to us, which we currently deem immaterial or which are similar to those faced by other companies in our industry or business in general, may also impair our business operations. Any of these factors, many of which are beyond our control, could materially adversely affect our business, financial condition, operating results, cash flow, and stock price.
Risks Relating to Our Industry
Changes in general economic conditions and the cyclical nature of our business could harm our operating results.
Our business is cyclical in nature, following the strength and weakness of the manufacturing economies in the geographic markets we serve. As a result of this cyclicality, we have experienced, and in the future we can be expected to experience, significant fluctuations in sales and operating income, which may affect our business, operating results, financial condition and the market price of our common shares.
The following factors, among others, significantly influence demand for our products:
| |
| • | Fluctuations in capacity at both original equipment manufacturers and job shops; |
| |
| • | The availability of skilled machinists; |
| |
| • | The need to replace machines that have reached the end of their useful life; |
| |
| • | The need to replace older machines with new technology that increases productivity, reduces general manufacturing costs, and machines parts in a new way; |
| |
| • | The evolution of end-use products requiring machining to more specific tolerances; |
| |
| • | Our customers' use of new materials requiring machining by different processes; |
| |
| • | General economic and manufacturing industry expansions and contractions; and |
| |
| • | Changes in manufacturing capabilities in developing regions. |
Our business is highly competitive, and increased competition could reduce our sales, earnings and profitability.
The markets in which our machines and other products are sold are extremely competitive and highly fragmented. In marketing our products, we compete primarily with other businesses on quality, reliability, price, value, delivery time, service, and technological characteristics. We compete with a number of U.S., European, and Asian competitors, many of which are larger, have greater financial and other resources, and are supported by governmental or financial institution subsidies. Increased competition could force us to lower our prices or to offer additional product features or services at a higher cost to us, which could reduce our earnings.
The greater financial resources or the lower amount of debt of certain of our competitors may enable them to commit larger amounts of capital in response to changing market conditions. Certain competitors may also have the ability to develop product innovations that could put us at a disadvantage. If we are unable to compete successfully against other manufacturers in our marketplace, we could lose customers, and our sales may decline. There can also be no assurance that customers will continue to regard our products favorably, that we will be able to develop new products that appeal to customers, that we will be able to improve or maintain our profit margins on sales to our customers, or that we will be able to continue to compete successfully in our core markets. While we believe our product lines compete effectively in their markets, we may not continue to do so.
Our competitive position and prospects for growth may be diminished if we are unable to develop and introduce new and enhanced products on a timely basis that are accepted in the market.
The machine tool industry is subject to technological change, rapidly evolving industry standards, changing customer requirements, and improvements in and expansion of product offerings, especially with respect to computer-controlled products. Our ability to anticipate changes in technology, industry standards, customer requirements and product offerings by competitors, and to develop and introduce new and enhanced products on a timely basis that are accepted in the market, will be significant factors in our ability to compete and grow. Moreover, if technologies or standards used in our products become obsolete or fail to gain widespread commercial acceptance, our business would be materially adversely affected. Developments by our competitors or others may render our products or technologies obsolete or noncompetitive. Failure to effectively introduce new products or product enhancements on a timely basis could materially adversely affect our business, operating results, and financial condition.
Risks Relating to Our Operations
Our business, financial condition, and results of operations could be adversely affected by the political and economic conditions of the countries in which we conduct business and other factors related to our international operations.
We manufacture a substantial portion of our products overseas and sell our products throughout the world. In 2016, approximately 71% of our products were manufactured in countries outside of North America and approximately 68% of our products were sold in countries outside of North America. In addition, a majority of our employees are located outside of the United States. Multiple factors relating to our international operations and to particular countries in which we operate could have a material adverse effect on our business, financial condition, results of operations, and cash flows. These factors include:
| |
| • | A prolonged world-wide economic downturn or economic uncertainty in our principal international markets including Asia and Europe; |
| |
| • | Changes in political, regulatory, legal, or economic conditions; |
| |
| • | Restrictive governmental actions, such as restrictions on the transfer or repatriation of funds and foreign investments and trade protection measures, including export duties and quotas, customs duties and tariffs, or trade barriers erected by either the United States or other countries where we do business; |
| |
| • | Disruptions of capital and trading markets; |
| |
| • | Changes in import or export licensing requirements; |
| |
| • | Civil disturbances or political instability; |
| |
| • | Geopolitical turmoil, including terrorism or war; |
| |
| • | Currency restrictions and exchange rate fluctuations; |
| |
| • | Changes in labor standards; |
| |
| • | Limitations on our ability under local laws to protect our intellectual property; |
| |
| • | Nationalization and expropriation; and |
| |
| • | Changes in domestic and foreign tax laws. |
Prices of some raw materials, especially steel and iron, fluctuate, which can adversely affect our sales, costs, and profitability.
We manufacture products with a relatively high iron casting or steel content, commodities for which worldwide prices fluctuate. The availability of, and prices for, these and other raw materials are subject to volatility due to worldwide supply and demand forces, speculative actions, inventory levels, exchange rates, production costs, and anticipated or perceived shortages. In some cases, raw material cost increases can be passed on to customers in the form of price increases; in other cases, they cannot. If raw material prices increase and we are not able to charge our customers higher prices to compensate, it would adversely affect our business, results of operations and financial condition.
We rely on a limited number of suppliers to obtain certain components, sub-assemblies, assemblies and products. Delays in deliveries from or the loss of any of these suppliers may cause us to incur additional costs, result in delays in manufacturing and delivering our products or cause us to carry excess or obsolete inventory.
Some components, sub-assemblies, or assemblies we use in the manufacturing of our products are purchased from a limited number of suppliers. Our purchases from these suppliers are generally not made pursuant to long-term contracts and are subject to additional risks associated with purchasing products internationally, including risks associated with potential import restrictions and exchange rate fluctuations, as well as changes in tax laws, tariffs, and freight rates. Although we believe that our relationships with these suppliers are good, there can be no assurance that we will be able to obtain these products from these suppliers on satisfactory terms indefinitely.
We believe that design changes could be made to our machines to allow sourcing of components, sub-assemblies, assemblies or products from several other suppliers; however, a disruption in the supply from any of our suppliers could cause us to experience a material adverse effect on our operations.
We rely in part on independent distributors and the loss of these distributors could adversely affect our business.
In addition to our direct sales force, we depend on the services of independent distributors and agents to sell our products and provide service and aftermarket support to our customers. We maintain an extensive distributor and agent network worldwide. In 2016, approximately 30% of our sales were through distributors. No distributor accounted for more than 5% of our consolidated sales in 2016. Rather than serving as passive conduits for delivery of product, many of our distributors are active participants in the sale and support of our products. Many of the distributors with whom we transact business offer competitive products and services to our customers. In addition, the distribution agreements we have are typically cancelable by the distributor after a relatively short notice period. The loss of a substantial number of our distributors or an increase in the distributors' sales of our competitors' products to our customers could reduce our sales and profits.
If we are unable to attract and retain skilled employees to work at our manufacturing facilities our operations and growth prospects would be adversely impacted.
We conduct substantially all of our manufacturing operations in less densely populated urban areas which, in many cases, may represent a relatively small market for skilled labor force. Our continued success depends on our ability to attract and retain a skilled labor force at these locations. If we are not able to attract and retain the personnel we require, we may be unable to develop, manufacture, and market our products, or to expand our operations in a manner that best exploits market opportunities and capitalizes on our investment in our business. Failure to achieve these objectives would materially adversely affect our business, operating results and financial condition.
We could face potential product liability claims relating to products we manufacture, which could result in commitments of significant time and expense to defend these claims and to pay material amounts in damages or settlement.
We face a business risk of exposure to product liability claims in the event that the use of our products is alleged to have resulted in injury or other adverse effects. We currently maintain product liability insurance coverage; however, such insurance does not cover all types of damages that could be assessed against us in a product liability claim and the coverage
amounts are subject to certain limitations under the applicable policies. We may not be able to obtain product liability insurance on acceptable terms in the future. Product liability claims can be expensive to defend and can divert the attention of management and other personnel for long periods of time, regardless of the ultimate outcome. An unsuccessful product liability defense could have a material adverse effect on our business, financial condition, results of operations or prospects. In addition, we believe our business depends on the strong brand reputation we have developed. In the event that our reputation is damaged, we may face difficulty in maintaining our pricing positions with respect to some of our products, which would reduce our sales and profitability.
We are subject to environmental laws that could impose significant costs on us and the failure to comply with such laws could subject us to sanctions and material fines and expenses.
Our operations are subject to extensive federal, state, local and foreign laws and regulations relating to environmental matters. Certain environmental laws can impose joint and several liability for releases or threatened releases of hazardous substances upon certain statutorily defined parties regardless of fault or the lawfulness of the original activity or disposal. Hazardous substances and adverse environmental effects have been identified with respect to real property we own and on adjacent parcels of real property.
We believe, based upon information currently available that, except with respect to the environmental matter concerning the Kentucky Avenue Wellfield Site as described in Part I Item 1. "Business - Environmental Matters", we will not have material liabilities for environmental remediation. Though the foregoing reflects the Company's current assessment as it relates to environmental remediation obligations, it is possible that future remedial requirements or changes in the enforcement of existing laws and regulations, which are subject to extensive regulatory discretion, will result in material liabilities to the Company.
We may be adversely affected by attacks on information technology systems as well as other cybersecurity risks and business disruptions.
Our business may be impacted by disruptions to our own or third party information technology systems, which may result from attacks on or failures of such infrastructure. Cybersecurity risks are evolving and include, but are not limited to, attacks on our information technology systems and attacks on the information technology systems of third parties in attempts to gain unauthorized access to our confidential or other proprietary information or information relating to our employees, customers and other third parties. Cybersecurity risks may also include attacks targeting the security, integrity and/or reliability of the hardware, software and information installed, stored or transmitted in our products, including after the purchase of those products and when they are incorporated into our customers’ facilities and/or infrastructure. Such attacks could potentially result in disruptions to systems, unauthorized release of confidential or otherwise protected information and corruption of data. We believe that we have adopted appropriate measures to mitigate potential risks to our technology, products, services and operations from these potential attacks. However, given the unpredictability of the timing, nature and scope of such attacks or other disruptions, we could potentially be subject to production downtimes, operational delays, other damaging effects on our operations or our ability to provide products and services to our customers, the unintended release of confidential or otherwise protected information, misappropriation, destruction or corruption of data, security breaches, other improper use of our or third party systems, networks or products, financial losses from remedial actions, loss of business or potential liability, and/or damage to our reputation, any of which could have a material adverse effect on our operating results.
Risks Relating to Our Customers
Our customers' activity levels and spending for our products and services have been impacted by global economic conditions, especially deterioration in the credit markets.
For many of our customers, the purchase of our machines represents a significant capital expenditure. For others, the purchase of our machines is a part of a larger improvement or expansion of manufacturing capability. For all, the purchase represents a long term commitment of capital raised by incurrence of debt, issuance of equity or use of cash flow from operations.
We rely on estimated forecasts of our customers' needs and inaccuracies in such forecasts could adversely affect our business.
We generally sell our products pursuant to individual purchase orders instead of long-term purchase commitments. Therefore, we rely on estimated demand forecasts, based upon input from our customers and the general economic environment, to determine how much material to purchase and product to manufacture. Because our sales are based on purchase orders, our customers may cancel, delay, or otherwise modify their purchase commitments with little or no consequence to them and with little or no notice to us. For these reasons, we generally have limited visibility regarding our customers' actual product needs. The quantities or timing required by our customers for our products could vary significantly. Whether in response to changes affecting the industry or a customer's specific business pressures, any cancellation, delay, or other modification in our customers' orders could significantly reduce our revenue, causing our operating results to fluctuate from period to period and make it more difficult for us to predict our revenue. In the event of a cancellation or reduction of a customer order, we may not have enough time to reduce inventory purchases or our workforce to minimize the effect of the lost revenue on our business. Order cancellations typically average approximately 2% of sales. Cancellations could vary significantly during times of global economic uncertainty.
Major changes in the economic situation of our customer base could require us to write off significant portion of our receivables from customers.
In difficult economic periods, our customers lose work and find it difficult if not impossible to pay for products purchased from us. Although appropriate credit reviews are done at the time of sale, rapidly changing economic conditions can have sudden impacts on customers' ability to pay. We run the risk of bad debt with customers on open account. If we write off significant parts of our customer accounts receivable because of unforeseen changes in their business condition, it would adversely affect our results of operations, financial condition, and cash flows.
Risks Relating to Our Securities
Anti-takeover provisions in our charter documents and under New York law may discourage a third party from acquiring us.
Certain provisions of our certificate of incorporation and bylaws may have the effect of discouraging a third party from making a proposal to acquire us and, as a result, may inhibit a change in control of the Company under circumstances that could give the shareholders the opportunity to realize a premium over the then-prevailing market price of our common shares. These include:
Staggered Board of Directors. Our certificate of incorporation and bylaws provide that our Board of Directors, currently consisting of nine members, is divided into three classes of directors, with each class consisting of three directors, and with the classes serving staggered three-year terms. This classification of the directors has the effect of making it more difficult for shareholders, including those holding a majority of our outstanding shares, to force an immediate change in the composition of our Board of Directors.
Removal of Directors and Filling of Vacancies. Our certificate of incorporation provides that a member of our Board of Directors may be removed only for cause and upon the affirmative vote of the holders of 75% of the securities entitled to vote at an election of directors. Newly created directorships and Board of Director vacancies resulting from retirement, death, removal or other causes may be filled only by a majority vote of the then remaining directors. Accordingly, it is more difficult for shareholders, including those holding a majority of our outstanding shares, to force an immediate change in the composition of our Board of Directors.
Supermajority Voting Provisions for Certain Business Combinations. Our certificate of incorporation requires the affirmative vote of at least 75% of all of the securities entitled to vote and at least 75% of shareholders who are not Major Shareholders (defined as 10% beneficial holders) in order to effect certain mergers, sales of assets or other business combinations involving the Company. These provisions could have the effect of delaying, deferring or preventing a change of control of the Company.
In addition, as a New York corporation we are subject to provisions of the New York Business Corporation Law which may make it more difficult for a third party to acquire and exercise control over us pursuant to a tender offer or request or invitation for tenders. These provisions could have the effect of deterring or delaying changes in incumbent management, proxy contests or changes in control.
Our certificate of incorporation authorizes the issuance of shares of blank check preferred stock.
Our certificate of incorporation provides that our Board of Directors is authorized to issue from time to time, without further stockholder approval, up to 2,000,000 shares of preferred stock (the Board of Directors has already designated 250,000 of such shares of preferred stock as Series A Preferred Stock) in one or more series and to fix and designate the rights, preferences, privileges and restrictions of the preferred stock, including dividend rights, conversion rights, voting rights, redemption rights and terms of redemption and liquidation preferences. Such shares of preferred stock could have preferences over our common stock with respect to dividends and liquidation rights. Our issuance of preferred stock may have the effect of delaying or preventing a change in control. Our issuance of preferred stock could decrease the amount of earnings and assets available for distribution to the holders of common stock or could adversely affect the rights and powers, including voting rights, of the holders of common stock. The issuance of preferred stock could have the effect of decreasing the market price of our common stock.
Our shareholders may experience further dilution as a result of future equity offerings or issuances.
In order to raise additional capital or pursue strategic transactions, we may in the future offer, issue or sell additional shares of our common stock or other equity securities. Our shareholders may experience significant dilution as a result of future equity offerings or issuances. Investors purchasing shares or other securities in the future could have rights superior to existing shareholders.
Item 1B. Unresolved Staff Comments.
None.
Item 2. Properties.
Pertinent information concerning the principal properties of the Company and its subsidiaries is as follows:
Owned Properties:
|
| | | | |
| Location | | Type of Facility | | Acreage (Land) Square Footage (Building) |
| Horseheads, New York | | Manufacturing, Engineering, Turnkey Systems, Marketing, Sales, Demonstration, Service, and Administration | | 80 acres 515,000 sq. ft. |
| Jiaxing, China | | Manufacturing, Engineering, Demonstration, and Administration (Buildings and improvements are owned by the Company; land is under 50-year lease expiring in November 2060) | | 7 acres 223,179 sq. ft |
| St. Gallen, Switzerland | | Manufacturing, Engineering, Turnkey Systems, Marketing, Sales, Demonstration, Service, and Administration | | 8 acres 162,924 sq. ft. |
| Nan Tou City, Taiwan | | Manufacturing, Engineering, Marketing, Sales, Demonstration, Service, and Administration | | 3 acres 123,204 sq. ft. |
| Romanshorn, Switzerland | | Manufacturing | | 2 acres 42,324 sq. ft. |
| Biel, Switzerland | | Manufacturing, Engineering, Service, and Turnkey Systems | | 4 acres 41,500 sq. ft. |
| Traverse City, Michigan | | Manufacturing, Engineering, Marketing, Sales, Service, and Administration | | 2.4 acres 38,800 sq. ft. |
Leased Properties:
|
| | | | | | |
| Location | | Type of Facility | | Square Footage | | Lease Expiration Date |
| Leicester, England | | Manufacturing, Sales, Marketing, Engineering, Turnkey Systems, Demonstration, Service, and Administration | | 55,000 sq. ft. | | 3/31/19 |
| Reutlingen, Germany | | Manufacturing, Engineering, Marketing, Sales, Service, and Administration | | 39,547 sq. ft. | | 8/31/19 |
| Shanghai, China | | Marketing, Engineering, Turnkey Systems, Sales, Service, Demonstration, and Administration | | 38,820 sq. ft. | | 5/31/18 |
| Elgin, Illinois | | Manufacturing, Sales, Marketing, Engineering, Turnkey Systems, Demonstration, Service, and Administration | | 34,000 sq. ft. | | 12/31/17 |
| Krefeld, Germany | | Sales, Turnkey Systems, Service, Demonstration, and Administration | | 14,402 sq. ft. | | 3/31/20 |
| Hyderabad, India | | Manufacturing, Engineering, Marketing, Sales, Service, and Administration | | 10,000 sq. ft. | | 9/30/18 |
| Biel, Switzerland | | Manufacturing, Sales, Engineering, Turnkey Systems, Service, and Administration | | 7,995 sq. ft. | | 6/30/17 |
| Noisy le Sec, France | | Manufacturing, Engineering, Marketing, Sales, Administration, and Service | | 7,320 sq. ft. | | 12/31/19 |
| St. Gallen, Switzerland | | Manufacturing | | 7,136 sq. ft. | | 12/31/19 |
| Shanghai, China | | Sales, Service, Engineering, and Administration | | 6,949 sq. ft. | | 10/31/17 |
| Bron, France | | Marketing, Sales, Administration, and Service | | 2,680 sq. ft. | | 4/1/23 |
Item 3. Legal Proceedings.
The Company is from time to time involved in routine litigation incidental to its operations. None of the litigation in which we are currently involved, individually or in the aggregate, is anticipated to be material to our financial condition, results of operations, or cash flows.
Item 4. Mine Safety Disclosures.
Not Applicable.
PART II
Item 5. Market for Registrant's Common Equity, Related Stockholder Matters and Issuer Purchases of Equity Securities.
The following table reflects the highest and lowest values at which our common stock traded in each quarter of the last two years. Our common stock trades on the NASDAQ Global Select Market under the symbol "HDNG". The table also includes dividends per share, by quarter:
|
| | | | | | | | | | | | | | | | | | | | | | | |
| | 2016 | | 2015 |
| | High | | Low | | Dividends | | High | | Low | | Dividends |
| Quarter Ended | |
| | |
| | |
| | |
| | |
| | |
|
| March 31, | $ | 12.60 |
| | $ | 12.45 |
| | $ | 0.02 |
| | $ | 12.05 |
| | $ | 10.78 |
| | $ | 0.02 |
|
| June 30, | 10.21 |
| | 9.96 |
| | 0.02 |
| | 11.69 |
| | 9.38 |
| | 0.02 |
|
| September 30, | 11.23 |
| | 10.53 |
| | 0.02 |
| | 10.83 |
| | 8.13 |
| | 0.02 |
|
| December 31, | 11.24 |
| | 10.85 |
| | 0.02 |
| | 10.15 |
| | 7.97 |
| | 0.02 |
|
At February 28, 2017, there were 218 shareholders of record of our common stock.
Issuer Purchases of Equity Securities
None.
Performance Graph
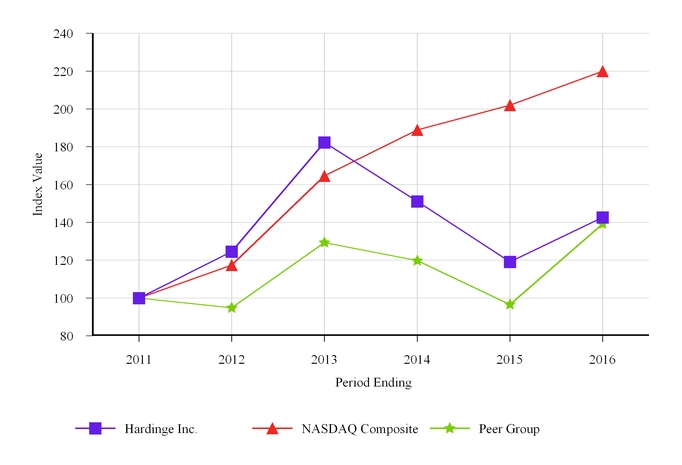
The graph below compares the five-year cumulative total return for Hardinge Inc. common stock with the comparable returns for the NASDAQ Stock Market (U.S.) Index and a group of 14 peer issuers. The companies included in our peer group were selected based on comparability to Hardinge with respect to market capitalization, sales, manufactured products and international presence. Our peer group includes Altra Holding, Inc., Cohu, Inc., Columbus McKinnon Corporation, Dynamic Materials Corporation, Electro Scientific Industries Inc., Global Power Equipment Group Inc., Hurco Companies Inc., Kadant Inc., Nanometrics Inc., NN, Inc., Rudolph Technologies, Inc., Sifco Industries Inc., Transcat Inc., and Twin Disc Inc. We removed Newport Corp. from the peer group as it is no longer a publicly traded company. Cumulative total return represents the change in stock price and the amount of dividends received during the indicated period, assuming reinvestment of dividends. The graph assumes an investment of $100 on December 31, 2011. The stock performance shown in the graph is included in response to SEC requirements and is not intended to forecast or to be indicative of future performance.
COMPARISON OF 5 YEAR CUMULATIVE TOTAL RETURN*
Among Hardinge Inc., the NASDAQ Composite Index,
and a Peer Group
____________________
*$100 invested on 12/31/11 in stock or index, including reinvestment of dividends.
|
| | | | | | | | | | | | | | | | | | | | | | | |
| Fiscal year ended December 31, | 2011 | | 2012 | | 2013 | | 2014 | | 2015 | | 2016 |
| Hardinge Inc. | $ | 100.00 |
| | $ | 124.52 |
| | $ | 182.32 |
| | $ | 151.15 |
| | $ | 119.09 |
| | $ | 142.69 |
|
| NASDAQ Composite | 100.00 |
| | 117.45 |
| | 164.57 |
| | 188.84 |
| | 201.98 |
| | 219.89 |
|
| Peer Group | 100.00 |
| | 94.78 |
| | 129.30 |
| | 119.72 |
| | 96.57 |
| | 139.25 |
|
Item 6. Selected Financial Data.
The following selected financial data is derived from the audited consolidated financial statements of the Company. The data should be read in conjunction with the audited consolidated financial statements, related notes and other information included herein (amounts in thousands except per share data):
|
| | | | | | | | | | | | | | | | | | | |
| | 2016 | | 2015 | | 2014 | | 2013 | | 2012 |
| STATEMENT OF OPERATIONS DATA: | |
| | |
| | |
| | |
| | |
|
| Sales | $ | 292,013 |
| | $ | 315,249 |
| | $ | 311,633 |
| | $ | 329,459 |
| | $ | 334,413 |
|
| Cost of sales | 194,486 |
| | 210,711 |
| | 210,851 |
| | 223,760 |
| | 225,286 |
|
| Gross profit | 97,527 |
| | 104,538 |
| | 100,782 |
| | 105,699 |
| | 109,127 |
|
| Selling, general and administrative expenses | 79,647 |
| | 81,271 |
| | 81,045 |
| | 79,533 |
| | 76,196 |
|
Research & development(1) | 13,514 |
| | 14,140 |
| | 13,904 |
| | 12,460 |
| | 12,290 |
|
Restructuring charges(2) | 661 |
| | 3,558 |
| | — |
| | — |
| | — |
|
Impairment charges(3) | — |
| | — |
| | 5,766 |
| | 6,239 |
| | — |
|
| Other expense, net | 310 |
| | 632 |
| | 514 |
| | 471 |
| | 559 |
|
| Operating income (loss) | 3,395 |
| | 4,937 |
| | (447 | ) | | 6,996 |
| | 20,082 |
|
| Interest expense, net | 328 |
| | 499 |
| | 678 |
| | 1,064 |
| | 741 |
|
Income (loss) from continuing operations before income taxes | 3,067 |
| | 4,438 |
| | (1,125 | ) | | 5,932 |
| | 19,341 |
|
| Income taxes | 1,843 |
| | 1,828 |
| | 1,233 |
| | 1,537 |
| | 1,486 |
|
| Income (loss) from continuing operations | 1,224 |
| | 2,610 |
| | (2,358 | ) | | 4,395 |
| | 17,855 |
|
Gain from disposal of discontinued operation, and income from discontinued operations, net of tax(4) | — |
| | — |
| | 218 |
| | 5,532 |
| | — |
|
| Net income (loss) | $ | 1,224 |
| | $ | 2,610 |
| | $ | (2,140 | ) | | $ | 9,927 |
| | $ | 17,855 |
|
| PER SHARE DATA: | |
| | |
| | |
| | |
| | |
|
| Basic earnings (loss) per share: | | | | | | | | | |
| Continuing operations | $ | 0.10 |
| | $ | 0.20 |
| | $ | (0.19 | ) | | $ | 0.37 |
| | $ | 1.53 |
|
| Discontinued operations | — |
| | — |
| | 0.02 |
| | 0.47 |
| | — |
|
| Basic earnings (loss) per share | $ | 0.10 |
| | $ | 0.20 |
| | $ | (0.17 | ) |
| $ | 0.84 |
| | $ | 1.53 |
|
| Weighted average basic shares outstanding | 12,824 |
| | 12,776 |
| | 12,661 |
| | 11,801 |
| | 11,557 |
|
| | | | | | | | | | |
| Diluted earnings (loss) per share: | | | | | | | | | |
| Continuing operations | $ | 0.09 |
| | $ | 0.20 |
| | $ | (0.19 | ) | | $ | 0.37 |
| | $ | 1.53 |
|
| Discontinued operations | — |
| | — |
| | 0.02 |
| | 0.46 |
| | — |
|
| Diluted earnings (loss) per share | $ | 0.09 |
| | $ | 0.20 |
| | $ | (0.17 | ) | | $ | 0.83 |
| | $ | 1.53 |
|
| Weighted average diluted shares outstanding | 12,909 |
| | 12,872 |
| | 12,661 |
| | 11,891 |
| | 11,596 |
|
| | |
| | |
| | |
| | |
| | |
|
| Cash dividends declared per share | $ | 0.08 |
| | $ | 0.08 |
| | $ | 0.08 |
| | $ | 0.08 |
| | $ | 0.08 |
|
| BALANCE SHEET DATA: | |
| | |
| | |
| | |
| | |
|
| Working capital | $ | 127,848 |
| | $ | 129,310 |
| | $ | 134,338 |
| | $ | 136,931 |
| | $ | 128,069 |
|
| Total assets | 297,550 |
| | 310,938 |
| | 311,084 |
| | 343,861 |
| | 325,628 |
|
| Total debt | 6,596 |
| | 11,606 |
| | 15,989 |
| | 26,314 |
| | 19,963 |
|
| Shareholders' equity | 155,941 |
| | 161,105 |
| | 169,596 |
| | 203,788 |
| | 161,207 |
|
____________________
| |
(1) | In 2016, we reclassified Research & development expenses from Cost of sales to Operating expenses for all years presented. |
| |
(2) | On August 4, 2015, the Company's Board of Directors approved a strategic restructuring program with the goals of streamlining the Company's cost structure, increasing operational efficiencies and improving shareholder returns, which was completed in 2016. |
| |
(3) | 2014 and 2013 results include non-cash charges of $5.8 million and $6.2 million, respectively, for impairment of goodwill and other intangible assets. $5.8 million and $5.1 million in 2014 and 2013, respectively, was related to the impairment in the value of goodwill and the trade name associated with the purchase of Usach, and $1.1 million in 2013 was related to the impairment of the Forkardt trade name as a result of the Forkardt Swiss business divestiture. |
| |
(4) | On December 31, 2013, the Company divested its Forkardt Operations in Switzerland for CHF 5.6 million, net of cash sold ($6.3 million equivalent), resulting in a gain of $4.9 million. In March 2014, the Company recognized $0.2 million of additional consideration as a result of final working capital adjustments. |
Item 7. Management's Discussion and Analysis of Financial Condition and Results of Operations.
Overview. We supply high precision computer controlled metalcutting turning machines, grinding machines, vertical machining centers, and repair parts related to those machines. The Company also engineers and supplies high precision, standard and specialty workholding devices, and other machine tool accessories. We believe our products are known for accuracy, reliability, durability and value. We are geographically diversified with manufacturing facilities in China, France, Germany, India, Switzerland, Taiwan, the United States (“U.S.”), and the United Kingdom (“U.K.”), with sales to most industrialized countries. Approximately 68% of our 2016 sales were to customers outside of North America, 71% of our 2016 products sold were manufactured outside of North America, and 68% of our employees in 2016 were employed outside of North America.
Metrics on machine tool market activity monitored by our management include world machine tool shipments, as reported annually by Gardner Publications in the Metalworking Insiders Report, and metal-cutting machine orders, as reported by the Association of Manufacturing Technology, the primary industry group for U.S. machine tool manufacturers. Other closely followed U.S. market indicators are tracked to determine activity levels in U.S. manufacturing plants that are prospective customers for our products. One such measurement is the Purchasing Managers Index, as reported by the Institute for Supply Management. Another measurement is capacity utilization of U.S. manufacturing plants, as reported by the Federal Reserve Board. Similar information regarding machine tool shipments and economic indicators in foreign countries is published by trade associations, government agencies, and economic services in those countries.
Non-machine sales, which include collets, chucks, accessories, repair parts and service revenue, accounted for approximately 33% of overall sales in 2016 and are an important part of our business due to an installed base of thousands of machines, and the growing needs demanded by specialty workholding applications. In the past, sales of these products and services have not fluctuated on a year-to-year basis as significantly as the sales of our machines have from time to time, but demand for these products and services typically track the direction of the related machine metrics.
Other key performance indicators are geographic distribution of net sales (“sales”), gross profit as a percent of sales, income from operations, working capital changes, and debt level trends. In an industry where constant product technology development has led to an average model life of three to five years, effectiveness of technological innovation and development of new products are also key performance indicators.
We are exposed to financial market risk resulting from changes in interest and foreign currency rates. Global economic conditions and related disruptions within the financial markets have also increased our exposure to the possible liquidity and credit risks of our counterparties. We believe we have sufficient liquidity to fund our foreseeable business needs, including cash and cash equivalents, cash flows from operations, our bank financing arrangements, and equity financing arrangements.
We monitor the third-party depository institutions that hold our cash and cash equivalents. Our emphasis is primarily on safety of principal. Our cash and cash equivalents are diversified among counterparties to minimize exposure to any one of these entities.
We are subject to credit risks relating to the ability of counterparties of hedging transactions to meet their contractual payment obligations. The risks related to creditworthiness and non-performance has been considered in the fair value measurements of our foreign currency forward exchange contracts.
We expect that some of our customers and vendors may experience difficulty in maintaining the liquidity required to buy inventory or raw materials. We continue to monitor our customers’ financial condition in order to mitigate the risk associated with our ability to collect on our accounts receivable.
Foreign currency exchange rate changes can be significant to reported results for several reasons. Our primary competitors, particularly for the most technologically advanced products, are now largely manufacturers in Japan, Germany, Switzerland, Korea, and Taiwan, which causes the worldwide valuation of their respective currencies to be central to
competitive pricing in all of our markets. The major functional currencies of our subsidiaries are the British Pound Sterling (“GBP”), Chinese Renminbi (“CNY”), Euro (“EUR”), New Taiwanese Dollar (“TWD”), and Swiss Franc (“CHF”). Under US GAAP, results of foreign subsidiaries are translated into U.S. Dollars (“USD”) at the average exchange rate during the periods presented. Period-to-period changes in the exchange rate between their local currency and the USD may affect comparative data significantly. We also purchase computer controls and other components from suppliers throughout the world, with purchase costs reflecting currency changes.
Results of Operations
Presented below is summarized selected financial data for the years ended December 31, 2016 and 2015 (in thousands):
|
| | | | | | | | | | | | | | | | | | | | |
| | 2016 | | % of Sales | | 2015 | | % of Sales | | $
Change | | %
Change |
| Sales | $ | 292,013 |
| |
|
| | $ | 315,249 |
| | | | $ | (23,236 | ) | | (7.4 | )% |
| Gross profit | 97,527 |
| | 33.4 | % | | 104,538 |
| | 33.2 | % | | (7,011 | ) | | (6.7 | )% |
| Selling, general and administrative expenses | 79,647 |
| | 27.3 | % | | 81,271 |
| | 25.8 | % | | (1,624 | ) | | (2.0 | )% |
| Research & Development | 13,514 |
| | 4.6 | % | | 14,140 |
| | 4.5 | % | | (626 | ) | | (4.4 | )% |
| Restructuring Charges | 661 |
| | 0.2 | % | | 3,558 |
| | 1.1 | % | | (2,897 | ) | | (81.4 | )% |
| Other expense, net | 310 |
| | 0.1 | % | | 632 |
| | 0.2 | % | | (322 | ) | | (50.9 | )% |
| Operating Income | 3,395 |
| | 1.2 | % | | 4,937 |
| | 1.6 | % | | (1,542 | ) | | (31.2 | )% |
| Interest expense, net | 328 |
| |
|
| | 499 |
| |
|
| | (171 | ) | |
|
|
| Income before income taxes | 3,067 |
| | 1.1 | % | | 4,438 |
| | 1.4 | % | | (1,371 | ) | | (30.9 | )% |
| Income taxes | 1,843 |
| |
|
| | 1,828 |
| |
|
| | 15 |
| |
|
|
| Net income | $ | 1,224 |
| | 0.4 | % | | $ | 2,610 |
| | 0.8 | % | | $ | (1,386 | ) | | (53.1 | )% |
Sales. The table below summarizes sales by each corresponding geographical region for the year ended December 31, 2016 compared to the year ended December 31, 2015 (in thousands):
|
| | | | | | | | | | | | | | | | | | | | |
| | 2016 | | 2015 | | Change |
| | $ | | % | | $ | | % | | $ | | % |
| Sales to customers in: |
| North America | $ | 92,668 |
| | 31.7 | % | | $ | 108,470 |
| | 34.4 | % | | $ | (15,802 | ) | | (14.6 | )% |
| Europe | 91,382 |
| | 31.3 | % | | 97,269 |
| | 30.9 | % | | (5,887 | ) | | (6.1 | )% |
| Asia | 107,963 |
| | 37.0 | % | | 109,510 |
| | 34.7 | % | | (1,547 | ) | | (1.4 | )% |
| Total | $ | 292,013 |
| | 100.0 | % | | $ | 315,249 |
| | 100.0 | % | | $ | (23,236 | ) | | (7.4 | )% |
Sales for the year ended December 31, 2016 were $292.0 million, a decrease of $23.2 million, or 7.4% when compared to the prior year. Global demand for machine tools and accessories continued to be weak in 2016, especially in North America and Europe, which drove the year over year decline. In Asia, we have been able to maintain stable sales volume levels in the primary customer segments that we serve. Unfavorable foreign currency translation had an impact of approximately $6.9 million, primarily in Asia. Excluding the impact of foreign currency translation, sales would have decreased $16.3 million or 5.2% over the prior year.
North America sales were $92.7 million and $108.5 million, respectively, for the years ended December 31, 2016 and 2015, a decrease of $15.8 million, or 14.6%. The current year decrease reflects industrial market weakness with MMS down 22.4%, and ATA down 3.6% from respective prior year sales in the region.
Europe sales were $91.4 million and $97.3 million for the years ended December 31, 2016 and 2015, respectively, a decrease of $5.9 million, or 6.1%. This decline reflects industrial market weakness with MMS down 4.3%, and ATA down 15.3% from respective prior year sales in the region. The ATA decline is primarily attributed to the restructuring of our operations in this region. Unfavorable foreign currency translation impacted sales by approximately $2.0 million. Excluding the impact of foreign currency translation, sales would have decreased $3.9 million, or 4.0% versus the prior year.
Asia sales were $108.0 million and $109.5 million for the years ended December 31, 2016 and 2015, respectively, a decrease of $1.5 million, or 1.4%. Unfavorable foreign currency translation impacted sales by approximately $4.9 million. Excluding the translation effect, sales grew by $3.4 million or 3.1%. Demand from customers in China is the key driver of the performance of the machine tool industry, and Hardinge has been able to maintain stable sales volume levels in the primary customer segments that it serves.
Sales of machines accounted for approximately 67% of the consolidated sales for the years ended December 31, 2016 and 2015. Sales of non-machine products and services, primarily consisting of collets, chucks, accessories, repair parts, and service revenue, accounted for 33% of the consolidated sales for the years ended December 31, 2016 and 2015.
Gross Profit. Gross profit was $97.5 million, or 33.4% of sales for the year ended December 31, 2016, compared to $104.5 million, or 33.2% of sales in 2015. The decrease in gross profit was related to the decrease in sales volume, and the unfavorable impact of foreign currency translation of approximately $2.4 million.
Selling, General and Administrative Expenses. Selling, general and administrative (“SG&A”) expenses were $79.6 million, or 27.3% of net sales for the year ended December 31, 2016, a decrease of $1.6 million or 2.0%, compared to $81.3 million, or 25.8% of net sales for the year ended December 31, 2015. We had $1.7 million of additional charges in the year ended December 31, 2016 as compared to the year ended December 31, 2015, including severance of $0.7 million, pension settlement of $0.6 million and strategic consulting expenses of $0.4 million. Foreign currency translation had a favorable impact of approximately $2.1 million. Adjusting for the impacts in severance, pension settlement, strategic review related charges, and foreign currency translation, SG&A would have decreased $1.2 million in the current year as compared to the prior year period. The decrease was due mainly to savings generated as a result of the restructuring initiatives announced in 2015 and completed in 2016.
Research & Development. Research & Development expenses were $13.5 million, or 4.6% of net sales for the year ended December 31, 2016, compared to $14.1 million, or 4.5% of net sales for the year ended December 31, 2015.
Restructuring. In 2016, we completed a restructuring plan initiated in 2015 with charges related to severance payments, a voluntary retirement plan, the closure plan for a facility in Germany and factory overhead reduction initiative in the Elmira, New York facility. A total of $0.7 million and $3.6 million were recorded for the years ended December 31, 2016 and 2015, respectively.
Operating Income. As a result of the foregoing, operating income was $3.4 million for the year ended December 31, 2016, compared to $4.9 million in 2015.
Income Taxes. The provision for income taxes was $1.8 million for both years ended December 31, 2016 and 2015. The effective tax rates were 60.1% for the year ended December 31, 2016, compared to 41.2% in 2015, which differ from the U.S. statutory rate primarily due to the mix of earnings by country and by the non-recognition of tax benefits for certain entities in a loss position for which a full valuation allowance has been recorded.
We continually assess all available positive and negative evidence in accordance with ASC Topic 740 to evaluate whether deferred tax assets are realizable. To the extent that it is more likely than not that all or a portion of our deferred tax assets in a particular jurisdiction will not be realized, a valuation allowance is recorded. We currently maintain a valuation allowance against all or a portion of our deferred tax assets in the U.S., Canada, U.K., Germany, and the Netherlands.
Net Income. As a result of the foregoing, net income for the year ended December 31, 2016 was $1.2 million, or 0.4% of net sales, compared to net income of $2.6 million, or 0.8% of net sales in 2015. Basic and diluted income per share for the year ended December 31, 2016 were $0.10 and $0.09, respectively, compared to basic and diluted earnings per share of $0.20 for the year ended December 31, 2015.
Business Segment Information — Comparison of the years ended December 31, 2016 and 2015
Metalcutting Machine Solutions Segment (MMS) (in thousands):
|
| | | | | | | | | | | | | | |
| | Year Ended
December 31, | | | | |
| | 2016 | | 2015 | | $ Change | | % Change |
| Sales | $ | 230,705 |
| | $ | 250,854 |
| | $ | (20,149 | ) | | (8.0 | )% |
| Segment income | 3,060 |
| | 7,365 |
| | (4,305 | ) | | (58.5 | )% |
MMS sales decreased by $20.1 million, or 8.0% in the year ended December 31, 2016 when compared with 2015. We experienced decreased demand across product lines and regions with the exception of grinding sales in Asia, which were up 13% over the prior year. This overall segment decrease includes unfavorable foreign currency translation of approximately $6.7 million.
Segment income was $3.1 million for the year ended December 31, 2016, or $4.3 million below 2015 segment income. The decrease in segment income was due to the impact of lower sales volumes, partially offset by a $1.8 million reduction in operating expenses due in part to restructuring initiatives completed in 2016.
Aftermarket Tooling and Accessories Segment (ATA) (in thousands):
|
| | | | | | | | | | | | | | |
| | Year Ended
December 31, | | | | |
| | 2016 | | 2015 | | $ Change | | % Change |
| Sales | $ | 61,647 |
| | $ | 65,128 |
| | $ | (3,481 | ) | | (5.3 | )% |
| Segment income | 6,910 |
| | 3,372 |
| | 3,538 |
| | 104.9 | % |
ATA sales for the year ended December 31, 2016 were $61.6 million, a decrease of $3.5 million when compared to 2015. ATA sales decreases in Europe of 15% and North America of 4% were partially offset by increases in Asia of 12%. The decrease in Europe was primarily attributed to our restructuring efforts in that region.
Segment income for the year ended December 31, 2016 was $6.9 million, or $3.5 million above 2015 segment income. We had $3.2 million of additional restructuring expenses, an inventory valuation adjustment, and charges related to the Company's strategic review initiative in the year ended December 31, 2015 as compared to the year ended December 31, 2016. The remaining increase in segment income was due to a $1.5 million reduction in operating expenses due primarily to restructuring initiatives completed in 2016, offset in part by the impact of lower sales volumes.
Segment Summary For the Year Ended December 31, 2016 (in thousands):
|
| | | | | | | | | | | | | | | |
| | Year Ended December 31, 2016 |
| | MMS | | ATA | | Inter-Segment Eliminations | | Total |
| Sales | $ | 230,705 |
| | $ | 61,647 |
| | $ | (339 | ) | | $ | 292,013 |
|
| Segment income | 3,060 |
| | 6,910 |
| | |
| | 9,970 |
|
| Unallocated corporate expense | |
| | |
| | |
| | (6,575 | ) |
| Interest expense, net | |
| | |
| | |
| | (328 | ) |
| Income from continuing operations, before income taxes | | | | | | | $ | 3,067 |
|
Comparison of the years ended December 31, 2015 and 2014
Presented below is summarized selected financial data for the years ended December 31, 2015 and 2014 (in thousands):
|
| | | | | | | | | | | | | | | | | | | | |
| | 2015 | | % of Sales | | 2014 | | % of Sales | | $
Change | | %
Change |
| Sales | $ | 315,249 |
| | | | $ | 311,633 |
| | | | $ | 3,616 |
| | 1.2 | % |
| Gross profit | 104,538 |
| | 33.2 | % | | 100,782 |
| | 32.3 | % | | $ | 3,756 |
| | 3.7 | % |
| Selling, general and administrative expenses | 81,271 |
| | 25.8 | % | | 81,045 |
| | 26.0 | % | | $ | 226 |
| | 0.3 | % |
| Research & development | 14,140 |
| | 4.5 | % | | 13,904 |
| | 4.5 | % | | $ | 236 |
| | 1.7 | % |
| Restructuring | 3,558 |
| | 1.1 | % | | — |
| | — | % | | $ | 3,558 |
| | 100.0 | % |
| Impairment charges | — |
| | — | % | | 5,766 |
| | 1.9 | % | | $ | (5,766 | ) | | (100.0 | )% |
| Other expense, net | 632 |
| | 0.2 | % | | 514 |
| | 0.2 | % | | $ | 118 |
| | 23.0 | % |
| Income (loss) from operations | 4,937 |
| | 1.6 | % | | (447 | ) | | (0.1 | )% | | $ | 5,384 |
| | (1,204.5 | )% |
| Interest expense, net | 499 |
| |
|
| | 678 |
| |
|
| | $ | (179 | ) | |
|
|
Income (loss) from continuing operations before income taxes | 4,438 |
| | 1.4 | % | | (1,125 | ) | | (0.4 | )% | | $ | 5,563 |
| | (494.5 | )% |
| Income taxes | 1,828 |
| |
|
| | 1,233 |
| |
|
| | $ | 595 |
| |
|
|
| Net income (loss) from continuing operations | 2,610 |
| | 0.8 | % | | (2,358 | ) | | (0.8 | )% | | $ | 4,968 |
| | (210.7 | )% |
Gain from disposal of discontinued operation and income from discontinued operations, net of tax | — |
| |
|
| | 218 |
| |
|
| | $ | (218 | ) | |
|
|
| Net income (loss) | $ | 2,610 |
| | 0.8 | % | | $ | (2,140 | ) | | (0.7 | )% | | $ | 4,750 |
| | (222.0 | )% |
Sales. The table below summarizes sales by each corresponding geographical region for the year ended December 31, 2015 compared to the year ended December 31, 2014 (in thousands):
|
| | | | | | | | | | | | | | | | | | | | |
| | 2015 | | 2014 | | Change |
| | $ | | % | | $ | | % | | $ | | % |
| Sales to customers in: |
| North America | $ | 108,470 |
| | 34.4 | % | | $ | 100,894 |
| | 32.3 | % | | $ | 7,576 |
| | 7.5 | % |
| Europe | 97,269 |
| | 30.9 | % | | 103,063 |
| | 33.1 | % | | $ | (5,794 | ) | | (5.6 | )% |
| Asia | 109,510 |
| | 34.7 | % | | 107,676 |
| | 34.6 | % | | $ | 1,834 |
| | 1.7 | % |
| Total | $ | 315,249 |
| | 100.0 | % | | $ | 311,633 |
| | 100.0 | % | | $ | 3,616 |
| | 1.2 | % |
Sales for the year ended December 31, 2015 were $315.2 million, an increase of $3.6 million, or 1.2% when compared to the prior year. Unfavorable foreign currency translation had an impact of $11.4 million. Excluding the impact of foreign currency translation, sales would have increased $15.0 million or 5% over the prior year. The leading cause of the increase was improved demand for grinding machines and new product introductions.
North America sales were $108.5 million and $100.9 million, respectively, for the years ended December 31, 2015 and 2014, an increase of $7.6 million, or 7.5%. The current year increase is driven by higher levels of grinding sales driven by order backlog from the beginning of 2015 and new product introductions.
Europe sales were $97.3 million and $103.1 million for the years ended December 31, 2015 and 2014, respectively, a decrease of $5.8 million, or 5.6%. This decline was influenced by the impact of $9.3 million of unfavorable foreign currency translation, excluding that effect, sales would have grown by $3.5 million, or 3%. This increase was driven by higher demand for grinding machines.
Asia sales were $109.5 million and $107.7 million for the years ended December 31, 2015 and 2014, respectively, an increase of $1.8 million, or 1.7%. Foreign currency translation had an unfavorable impact of $2.1 million, which was more than offset by strong grinding sales in the region. Excluding the translation effect, sales grew by $3.9 million or 4%. Demand from customers in China is the key driver of the performance of the machine tool industry, and while recent machine tool industry data from China is reporting a current year decline in demand, Hardinge has been able to maintain sales volume levels in the primary customer segments that it serves.
Sales of machines accounted for approximately 68% of the consolidated sales for the year ended December 31, 2015, compared to 66% in 2014. Sales of non-machine products and services, primarily consisting of collets, chucks, accessories, repair parts, and service revenue, accounted for 32% of the consolidated sales for the year ended December 31, 2015, compared to 34% in 2014.
Gross Profit. Gross profit was $104.5 million, or 33.2% of sales for the year ended December 31, 2015, compared to $100.8 million, or 32.3% of sales in 2014. The increase in gross margin was primarily a result of higher production levels in the Company’s grinding facilities, which resulted in higher factory absorption, as well as an improved mix of grinding machines. This was partially offset by $0.8 million for the integration of the Voumard product lines, which was acquired in September 2014, and a first quarter inventory valuation adjustment of approximately $0.7 million
Selling, General and Administrative Expenses. Selling, general and administrative (“SG&A”) expenses were $81.3 million, or 25.8% of net sales for the year ended December 31, 2015, an increase of $0.2 million or 0.3%, compared to $81.0 million, or 26.0% of net sales for the year ended December 31, 2014. SG&A for the year ended December 31, 2015 included $0.8 million of incremental professional fees associated with the Company's previously announced strategic review process, $0.8 million of additional SG&A from our Voumard acquisition and $0.4 million for the expansion of the Company’s Forkardt businesses in India and China, which was partially offset by $3.8 million from the favorable impact of foreign currency translation.
Research & Development. Research & Development expenses were $14.1 million, or 4.5% of net sales for the year ended December 31, 2015, compared to $13.9 million, or 4.5% of net sales for the year ended December 31, 2014.
Restructuring. The Company recorded $3.6 million in charges related to severance payments and a voluntary retirement plan associated with the announcement of a closure plan for a facility in Germany and a factory overhead reduction initiative in the Elmira, New York facility.
Impairment Charges. The Company did not record any impairment charges in 2015. In 2014, the Company recorded a non-cash impairment charge of $5.8 million to reduce the value of goodwill and the trade name associated with the purchase of Usach. As a result of the charges in 2014, all of the goodwill related to the Usach acquisition has been written off.
Income (loss) from Continuing Operations Before Income Taxes. As a result of the foregoing, net income from continuing operations was $4.4 million for the year ended December 31, 2015, compared to net loss from continuing operations of $1.1 million in 2014.
Income Taxes. The provision for income taxes was $1.8 million for the year ended December 31, 2015, compared to $1.2 million in 2014. The effective tax rates were 41.2% for the year ended December 31, 2015, compared to (109.6)% in 2014, which differ from the U.S. statutory rate primarily due to the mix of earnings by country and by the non-recognition of tax benefits for certain entities in a loss position for which a full valuation allowance has been recorded.
We continually assess all available positive and negative evidence in accordance with ASC Topic 740 to evaluate whether deferred tax assets are realizable. To the extent that it is more likely than not that all or a portion of our deferred tax assets in a particular jurisdiction will not be realized, a valuation allowance is recorded. We currently maintain a valuation allowance against all or a portion of our deferred tax assets in the U.S., Canada, U.K., Germany, and the Netherlands.
Gain from Disposal of Discontinued Operation and Income from Discontinued Operations, net of tax. The Company did not record any gains or losses in 2015 related to Discontinued Operations. In March 2014, the Company recognized $0.2 million of additional consideration as a result of final working capital adjustments associated with the sale of our Forkardt Swiss business in December 2013. Net income associated with the Forkardt Swiss business was $0.2 million, net of tax, for the year ended December 31, 2014.
Net Income (loss). As a result of the foregoing, net income for the year ended December 31, 2015 was $2.6 million, or 0.8% of net sales, compared to net loss of $2.1 million, or (0.7)% of net sales in 2014. Both basic and diluted income per share for the year ended December 31, 2015 were $0.20, compared to basic and diluted loss per share of $0.17 in 2014.
Business Segment Information — Comparison of the years ended December 31, 2015 and 2014
Metalcutting Machine Solutions Segment (MMS) (in thousands):
|
| | | | | | | | | | | | | | |
| | Year Ended
December 31, | | | | |
| | 2015 | | 2014 | | $ Change | | % Change |
| Sales | $ | 250,854 |
| | $ | 243,199 |
| | $ | 7,655 |
| | 3.1 | % |
| Segment income | 7,365 |
| | 3,950 |
| | 3,415 |
| | 86.5 | % |
MMS sales increased by $7.7 million, or 3.1% in the year ended December 31, 2015 when compared with 2014. The primary driver was strong grinding sales in all markets, partially offset by approximately $8.4 million of unfavorable foreign currency translation.
Segment income was $7.4 million for the year ended December 31, 2015, or $3.4 million above 2014 performance. The main factor contributing to the increase in segment income was the impact of higher sales volumes, combined with higher production levels due to increased machine demand that resulted in higher absorption of factory costs. This increase was partially offset by $0.3 million of restructuring charges related to overhead reductions in the Elmira, New York operations.
Aftermarket Tooling and Accessories Segment (ATA) (in thousands):
|
| | | | | | | | | | | | | | |
| | Year Ended
December 31, | | | | |
| | 2015 | | 2014 | | $ Change | | % Change |
| Sales | $ | 65,128 |
| | $ | 68,788 |
| | $ | (3,660 | ) | | (5.3 | )% |
| Segment income | 3,372 |
| | 6,708 |
| | (3,336 | ) | | (49.7 | )% |
ATA sales for the year ended December 31, 2015 were $65.1 million, a decrease of $3.7 million when compared to 2014. The primary driver in the decline in sales was foreign currency translation which had an unfavorable impact of $3.0 million, combined with market softness in North America and Europe.
Segment income for the year ended December 31, 2015 was $3.4 million, a 49.7% decrease from 2014. The decline in income was driven by restructuring charges of $3.3 million related to overhead reduction in the Elimra, New York operations and closure of a facility in Germany which was completed in 2016. In addition, the business recorded a $0.7 million unfavorable inventory valuation adjustment in one of its European facilities. Excluding the restructuring charges and inventory adjustment, segment income in 2015 would have been $7.4 million or 10% higher than in 2014.
Segment Summary For the Year Ended December 31, 2015 (in thousands):
|
| | | | | | | | | | | | | | | |
| | Year Ended December 31, 2015 |
| | MMS | | ATA | | Inter-Segment Eliminations | | Total |
| Sales | $ | 250,854 |
| | $ | 65,128 |
| | $ | (733 | ) | | $ | 315,249 |
|
| Segment income | 7,365 |
| | 3,372 |
| | |
| | 10,737 |
|
| Unallocated corporate expense | |
| | |
| | |
| | (5,800 | ) |
| Interest expense, net | |
| | |
| | |
| | (499 | ) |
| Loss from continuing operations, before income taxes | | | | | | | $ | 4,438 |
|
Liquidity and Capital Resources
The Company's principal capital requirements are to fund its operations, including working capital, to purchase and fund improvements to its facilities, machines and equipment, and to fund acquisitions.
At December 31, 2016, cash and cash equivalents were $28.3 million, compared to $32.8 million at December 31, 2015. The current ratio at December 31, 2016 was 2.76:1 compared to 2.62:1 at December 31, 2015.
At December 31, 2016 and 2015, total debt outstanding, including notes payable, was $6.6 million and $11.6 million, respectively.
Summary of Cash Flows for the Year Ended December 31, 2016, 2015 and 2014
Summary of cash flow data (in thousands):
|
| | | | | | | | | | | | |
| | | Year Ended December 31, |
| | | 2016 | | 2015 | | 2014 |
| Net cash provided by operating activities | | $ | 5,297 |
| | $ | 26,727 |
| | $ | 3,179 |
|
| Net cash used in investing activities | | $ | (2,361 | ) | | $ | (4,141 | ) | | $ | (8,500 | ) |
| Net cash used in financing activities | | $ | (6,475 | ) | | $ | (5,702 | ) | | $ | (12,130 | ) |
Cash Flows from Operating Activities:
During the year ended December 31, 2016, we generated $5.3 million net cash from operating activities. The net cash generated was driven by a net income of $1.2 million (as adjusted for non-cash depreciation and amortization expense of $8.8 million), partially offset by a decrease in accrued expenses of $4.0 million related to the completion of our restructuring program.
During the year ended December 31, 2015, we generated $26.7 million net cash from operating activities. The net cash generated was driven by a net income of $2.6 million (as adjusted for non-cash depreciation and amortization expense of $8.8 million), an increase in customer deposits $7.8 million, a decrease in customer receivables $3.9 million, and an increase in accrued expenses $3.3 million due to third party commissions payable and restructuring expenses.
During the year ended December 31, 2014, we generated $3.2 million net cash in operating activities. The net cash generated was driven by a net loss of $2.1 million (as adjusted for non-cash depreciation and amortization expense of $10.2 million and impairment loss of $5.8 million), partially offset by an increase in accounts receivables of $7.9 million and a decrease in accrued expenses of $3.3 million.
Cash Used in Investing Activities:
Net cash used in investing activities was $2.4 million for the year ended December 31, 2016. The primary uses of cash was for capital expenditures and general maintenance during the year.
Net cash used in investing activities was $4.1 million for the year ended December 31, 2015. The primary uses of cash were for capital expenditures, general maintenance and replacement capital during the year.
Net cash used in investing activities was $8.5 million for the year ended December 31, 2014. The primary uses of cash was for the acquisitions of Forkardt India and Voumard totaling $5.7 million, combined with capital expenditures during the year of $3.2 million.
Cash Used in Financing Activities:
Net cash flow used by financing activities was $6.5 million for the year ended December 31, 2016. Cash used was primarily attributable to $5.8 million of scheduled payments on long-term debt and $1.1 million of dividends paid to shareholders.
Net cash flow used by financing activities was $5.7 million for the year ended December 31, 2015. Cash used was primarily attributable to $4.5 million of scheduled payments on long-term debt and $1.0 million of dividends paid to shareholders.
During the year ended December 31, 2014, net cash used by financing activities was $12.1 million. Cash used was primarily attributable to $9.3 million of payments on long-term debt combined with a $7.5 million payment of contingent consideration in connection with the Usach acquisition, and dividends paid of $1.0 million, partially offset by $5.7 million of proceeds from sale of common stock in connection with the at-the-market stock offering.
Credit Facilities and Financing Arrangements
Financing arrangements are maintained with several financial institutions. These financing arrangements are in the form of long term loans, credit facilities, and lines of credit. The credit facilities allow the Company to borrow up to $74.7 million at December 31, 2016, of which $53.0 million can be borrowed for working capital needs. As of December 31, 2016, $67.1 million was available for borrowing under these arrangements of which $51.9 million was available for working capital needs. Total consolidated term borrowings outstanding, net of unamortized debt issuance fees were $5.9 million at December 31, 2016 and $11.6 million at December 31, 2015. Additionally, the Company had borrowings under revolving credit facilities of $0.7 million at December 31, 2016. Details of these financing arrangements are discussed in Note 8: "Financing Arrangements"to the Consolidated Financial Statements set forth in Item 8 of this Form 10-K.
Other Commitments
We lease space for some of our manufacturing, sales and service operations with lease terms up to 7 years and use certain office equipment and automobiles under lease agreements expiring at various dates. Rent expense under these leases totaled $3.0 million, $3.3 million and $3.2 million during the years ended December 31, 2016, 2015, and 2014, respectively.
The following table shows our future commitments in effect as of December 31, 2016 (in thousands):
|
| | | | | | | | | | | | | | | | | | | | | | | | | | | |
| | 2017 | | 2018 | | 2019 | | 2020 | | 2021 | | Thereafter | | Total |
| Long-term debt | $ | 2,993 |
| | $ | 2,993 |
| | $ | — |
| | $ | — |
| | $ | — |
| | $ | — |
| | $ | 5,986 |
|
| Operating lease obligations | 1,924 |
| | 1,245 |
| | 709 |
| | 85 |
| | 34 |
| | 33 |
| | 4,030 |
|
| Purchase commitments | 23,546 |
| | — |
| | — |
| | — |
| | — |
| | — |
| | 23,546 |
|
| Standby letters of credit | 6,459 |
| | 279 |
| | 83 |
| | — |
| | — |
| | — |
| | 6,821 |
|
| Total | $ | 34,922 |
| | $ | 4,517 |
| | $ | 792 |
| | $ | 85 |
| | $ | 34 |
| | $ | 33 |
| | $ | 40,383 |
|
We have not included the liabilities for uncertain tax positions in the above table as we cannot make a reliable estimate of the period of cash settlement. We have not included pension obligations in the above table as we cannot make a reliable estimate of the timing of employer contributions. For the year ended December 31, 2017, the expected Company contributions to be paid to the qualified defined benefit domestic plan are $2.0 million and the expected Company contributions to the foreign defined benefit pension plans are $2.3 million.
We believe that the current available funds and credit facilities, along with internally generated funds from operations, will provide sufficient financial resources for ongoing operations throughout 2017.
Off Balance Sheet Arrangements
We do not have any off balance sheet arrangements.
Change in Accounting Policy
There were no significant changes to accounting policies in 2016.
Discussion of Critical Accounting Policies
The preparation of our financial statements requires the application of a number of accounting policies, which are described in the notes to the financial statements. These policies require the use of assumptions or estimates, which, if interpreted differently under different conditions or circumstances, could result in material changes to the reported results. Following is a discussion of those accounting policies that were reviewed with our audit committee, and which we feel are most susceptible to such interpretation.
Accounts Receivable. We assess the collectability of our trade accounts receivable using a combination of methods. We review large individual accounts for evidence of circumstances that suggest a collection problem might exist. Such situations include, but are not limited to, the customer's past history of payments, its current financial condition as evidenced by credit ratings, financial statements or other sources, and recent collection activities. We provide a reserve for losses based on current payment trends in the economies where we hold concentrations of receivables and provide a reserve for what we believe to be the most likely risk of collectability. In order to make these allowances, we rely on assumptions regarding economic conditions, equipment resale values, and the likelihood that previous performance will be indicative of future results.
Inventories. We use a number of assumptions and estimates in determining the value of our inventory. An allowance is provided for the value of inventory quantities of specific items that are deemed to be excessive based on an annual review of past usage and anticipated future usage. While we feel this is the most appropriate methodology for determining excess quantities, the possibility exists that customers will change their buying habits in the future should their own requirements change. Changes in metalcutting technology can render certain products obsolete or reduce their market value. We continually evaluate changes in technology and adjust our products and inventory carrying values accordingly, either by write-off or by price reductions. Changes in market conditions and realizable selling prices for our machines could reduce the value of our inventory. We continually evaluate the carrying value of our machine inventory against the estimated selling price, less related costs to sell and adjust our inventory carrying values accordingly. However, the possibility exists that a future technological development, currently unanticipated, might affect the marketability of specific products produced by the Company.
We include in the cost of our inventories a component to cover the estimated cost of manufacturing overhead activities associated with production of our products.
We believe that being able to offer immediate delivery on many of our products is critical to our competitive success. Likewise, we believe that maintaining an inventory of service parts, with a particular emphasis on purchased parts, is especially important to support our policy of maintaining serviceability of our products. Consequently, we maintain significant inventories of repair parts on many of our machine models, some of which are no longer in production. Our ability to accurately determine which parts are needed to maintain this serviceability is critical to our success in managing this element of our business.
Goodwill Impairment Testing. We review goodwill for impairment at least annually or when indicators of impairment are present. These events or circumstances could include a significant long-term adverse change in the business climate, poor indicators of operating performance, or a sale or disposition of a significant portion of a reporting unit.
We test goodwill at the reporting unit level, which is one level below our operating segments. We identify our reporting units by assessing whether the components of our operating segments constitute businesses for which discrete financial information is available and segment management regularly reviews the operating results of those components. We also aggregate components that have similar economic characteristics into single reporting units (for example, similar products and/or services, similar long-term financial results, product processes, classes of customers, etc.). We have three reporting units, only one of which currently has goodwill. Our ATA reporting unit had goodwill totaling $6.6 million as of December 31, 2016.
When we evaluate the potential for goodwill impairment, we assess a range of qualitative factors including, but not limited to, macroeconomic conditions, industry conditions, the competitive environment, changes in the market for our products and services, regulatory and political developments, entity specific factors such as strategy and changes in key
personnel and overall financial performance. If, after completing this assessment, it is determined that it is more likely than not that the fair value of a reporting unit is less than its carrying value, we proceed to a two-step impairment test.
Our annual goodwill impairment review was performed as of October 1, 2016. As a result of this assessment we determined that the fair value of our reporting units that have goodwill exceeded the carrying value.
Net Deferred Tax Assets. We regularly review the recent results and projected future results of our operations, as well as other relevant factors, to reconfirm the likelihood that existing deferred tax assets in each tax jurisdiction would be fully recoverable.
A valuation allowance is established when it is more likely than not that all or a portion of deferred tax assets are not expected to be realized. The Company assesses all available positive and negative evidence to determine whether a valuation allowance is needed. Positive and negative evidence to be considered includes scheduled reversals of deferred tax liabilities, projected future taxable income, tax-planning strategies, and results of recent operations. Supporting a conclusion that a valuation allowance is not necessary is difficult when there is negative evidence such as cumulative losses in recent years.
A full valuation allowance is maintained on the tax benefits of the U.S. net deferred tax assets and it is expected that a full valuation allowance on future tax benefits will be recorded until an appropriate level of profitability in the U.S. is sustained. A valuation allowance is also maintained on the U.K., German, Dutch, and Canadian deferred tax assets related to tax loss carryforwards in those jurisdictions, as well as all other deferred tax assets of those entities.
The calculation of the tax liabilities requires significant judgment, the use of estimates and the interpretation and application of complex tax laws. The provision for income taxes reflects a combination of income earned and taxed in the U.S. and the various states, as well as federal and provincial jurisdictions in Switzerland, U.K., Canada, Germany, France, the Netherlands, China, Taiwan, and India. Jurisdictional tax law changes, increases or decreases in permanent differences between book and tax items, accruals or adjustments of accruals for tax contingencies or valuation allowances, and the change in the mix of earnings from these taxing jurisdictions all affect the overall effective tax rate.
Retirement Plans. We sponsor various defined benefit pension plans, defined contribution plans, and two postretirement benefit plans, all as described in Note 14. "Employee Benefits" to the Consolidated Financial Statements set forth in Item 8 of this Form 10-K. The calculation of our plan expenses and liabilities require the use of a number of critical accounting estimates. Changes in the assumptions can result in different plan expense and liability amounts, and actual experience can differ from the assumptions. We believe that the most critical assumptions are the discount rate and the expected rate of return on plan assets.
We annually review the discount rate to be used for retirement plan liabilities. In the U.S., we use bond pricing models based on high grade U.S. corporate bonds constructed to match the projected liability benefit payments. We discounted our future plan liabilities for our U.S. plan using rates of 4.39% and 4.75% at our plan measurement dates of December 31, 2016 and 2015, respectively. We discounted our future plan liabilities for our foreign plans using rates appropriate for each country, which resulted in blended rates of 0.89% and 1.21% at their measurement dates of December 31, 2016 and 2015, respectively. A change in the discount rate can have a significant effect on retirement plan obligations. For example, a decrease of one percent would increase U.S. pension obligations by approximately $13.5 million. Conversely, an increase of one percent would decrease U.S. pension obligations by approximately $11.2 million. A decrease of one percent in the discount rate would increase the Swiss pension obligations by approximately $19.4 million. Conversely, an increase of one percent would decrease the Swiss pension obligations by approximately $15.9 million.
A change in the discount rate can also have an effect on retirement plan expense. For example, a decrease of one percent would increase U.S. 2017 pension expense by approximately $0.09 million. Conversely, an increase of one percent would decrease U.S. 2017 pension expense by approximately $0.03 million. A decrease of one percent would increase the Swiss pension expense by approximately $1.5 million. Conversely, an increase of one percent would decrease the Swiss pension expense by approximately $1.8 million.
The expected rate of return on plan assets varies based on the investment mix of each particular plan and reflects the long-term average rate of return expected on funds invested or to be invested in each pension plan to provide for the benefits included in the pension liability. We review our expected rate of return annually based upon information available to us at that time, including the current level of expected returns on risk free investments (primarily government bonds in each market), the historical level of the risk premium associated with the other asset classes in which the portfolio is invested, and the expectations for future returns of each asset class. The expected return for each asset class is then weighted based on the asset allocation to develop the expected long-term rate of return on assets assumption. For our domestic plans, the expected rate of
return during fiscal 2017 is 7.50%, which is the same rate used for fiscal 2016. For our foreign plans, we used rates of return appropriate for each country which resulted in a blended expected rate of return of 3.14% for fiscal 2017, compared to 3.91% for fiscal 2016. A change in the expected return on plan assets can also have a significant effect on retirement plan expense. For example, a decrease of one percent would increase U.S. pension expense by approximately $0.8 million. Conversely, an increase of one percent would decrease U.S. pension expense by approximately $0.8 million. A decrease of one percent would increase the Swiss pension expense by approximately $0.9 million. Conversely, an increase of one percent would decrease the Swiss pension expense by approximately $0.9 million.
Accounting Guidance Not Yet Adopted
We are currently assessing the financial impact to our consolidated financial statements of accounting guidance not yet adopted. For further information on accounting guidance not yet adopted, refer to Note 20. "New Accounting Standards" to the Consolidated Financial Statements set forth in Item 8 of this Form 10-K.
Certain statements in this report, other than purely historical information, including estimates, projections, statements relating to our business plans, objectives and expected operating results, and the assumptions upon which those statements are based, are “forward-looking statements” within the meaning of the Private Securities Litigation Reform Act of 1995, Section 27A of the Securities Act of 1933 and Section 21E of the Securities Exchange Act of 1934. These forward-looking statements generally are identified by the words “believes,” “project,” “expects,” “anticipates,” “estimates,” “intends,” “strategy,” “plan,” “may,” “will,” “would,” “will be,” “will continue,” “will likely result,” and similar expressions. Forward-looking statements are based on current expectations and assumptions that are subject to risks and uncertainties which may cause actual results to differ materially from the forward-looking statements. Accordingly, there can be no assurance that our expectations will be realized. Such statements are based upon information known to management at this time. The Company cautions that such statements necessarily involve uncertainties and risk and deal with matters beyond the Company’s ability to control, and in many cases the Company cannot predict what factors would cause actual results to differ materially from those indicated. Among the many factors that could cause actual results to differ from those set forth in the forward-looking statements are fluctuations in the machine tool business cycles, changes in general economic conditions in the U.S. or internationally, the mix of products sold and the profit margins thereon, the relative success of the Company’s entry into new product and geographic markets, the Company’s ability to manage its operating costs, actions taken by customers such as order cancellations or reduced bookings by customers or distributors, competitors’ actions such as price discounting or new product introductions, governmental regulations and environmental matters, changes in the availability and cost of materials and supplies, the implementation of new technologies and currency fluctuations. Any forward-looking statement should be considered in light of these factors. The Company undertakes no obligation to revise its forward-looking statements if unanticipated events alter their accuracy.
Item 7A. Quantitative and Qualitative Disclosures About Market Risk.
The information required by this item is incorporated herein by reference to the section entitled "Overview" in Item 7. "Management's Discussion and Analysis of Financial Condition and Results of Operations", of this Form 10-K.
Item 8. Financial Statements and Supplementary Data.
Report of Independent Registered Public Accounting Firm
The Board of Directors and Shareholders of
Hardinge Inc. and Subsidiaries
We have audited the accompanying consolidated balance sheets of Hardinge Inc. and Subsidiaries as of December 31, 2016 and 2015, and the related consolidated statements of operations, comprehensive (loss) income, shareholders' equity, and cash flows for each of the three years in the period ended December 31, 2016. Our audits also included the financial statement schedule listed in the Index at Item 15(a). These financial statements and schedule are the responsibility of the Company’s management. Our responsibility is to express an opinion on these financial statements and schedule based on our audits.
We conducted our audits in accordance with the standards of the Public Company Accounting Oversight Board (United States). Those standards require that we plan and perform the audit to obtain reasonable assurance about whether the financial statements are free of material misstatement. An audit includes examining, on a test basis, evidence supporting the amounts and disclosures in the financial statements. An audit also includes assessing the accounting principles used and significant estimates made by management, as well as evaluating the overall financial statement presentation. We believe that our audits provide a reasonable basis for our opinion.
In our opinion, the financial statements referred to above present fairly, in all material respects, the consolidated financial position of Hardinge Inc. and Subsidiaries at December 31, 2016 and 2015, and the consolidated results of their operations and their cash flows for each of the three years in the period ended December 31, 2016, in conformity with U.S. generally accepted accounting principles. Also, in our opinion, the related financial statement schedule, when considered in relation to the basic financial statements taken as a whole, presents fairly in all material respects the information set forth therein.
As discussed in Note 11 to the consolidated financial statements, the Company retrospectively adjusted the presentation of deferred tax assets and liabilities in the consolidated balance sheet as a result of the adoption of the amendments to the FASB Accounting Standards Codification resulting from Accounting Standards Update No. 2015-17, “Balance Sheet Classification of Deferred Taxes,” effective December 31, 2016.
We also have audited, in accordance with the standards of the Public Company Accounting Oversight Board (United States), Hardinge Inc. and Subsidiaries' internal control over financial reporting as of December 31, 2016, based on criteria established in Internal Control-Integrated Framework issued by the Committee of Sponsoring Organizations of the Treadway Commission (2013 framework) and our report dated March 3, 2017 expressed an unqualified opinion thereon.
/s/ Ernst & Young LLP
Buffalo, New York
March 3, 2017
HARDINGE INC. AND SUBSIDIARIES
CONSOLIDATED BALANCE SHEETS
(in thousands, except share and per share data)
|
| | | | | | | |
| | December 31,
2016 | | December 31,
2015 |
| Assets | |
| | |
|
| Cash and cash equivalents | $ | 28,255 |
| | $ | 32,774 |
|
| Restricted cash | 2,923 |
| | 2,192 |
|
| Accounts receivable, net | 55,573 |
| | 56,945 |
|
| Inventories, net | 107,018 |
| | 110,232 |
|
| Other current assets | 6,926 |
| | 7,212 |
|
| Total current assets | 200,695 |
| | 209,355 |
|
| | | | |
| Property, plant and equipment, net | 56,961 |
| | 62,025 |
|
| Goodwill | 6,579 |
| | 6,620 |
|
| Other intangible assets, net | 26,730 |
| | 28,018 |
|
| Other non-current assets | 6,585 |
| | 4,920 |
|
| Total non-current assets | 96,855 |
| | 101,583 |
|
| Total assets | $ | 297,550 |
| | $ | 310,938 |
|
| | | | |
| Liabilities and shareholders’ equity | |
| | |
|
| Accounts payable | $ | 24,920 |
| | $ | 24,696 |
|
| Accrued expenses | 25,629 |
| | 27,964 |
|
| Customer deposits | 18,215 |
| | 19,845 |
|
| Accrued income taxes | 1,160 |
| | 1,919 |
|
| Current portion of long-term debt | 2,923 |
| | 5,621 |
|
| Total current liabilities | 72,847 |
| | 80,045 |
|
| | | | |
| Long-term debt | 2,970 |
| | 5,985 |
|
| Pension and postretirement liabilities | 58,840 |
| | 57,322 |
|
| Deferred income taxes | 3,800 |
| | 3,088 |
|
| Other liabilities | 3,152 |
| | 3,393 |
|
| Total non-current liabilities | 68,762 |
| | 69,788 |
|
| Commitments and contingencies (see Note 12) |
|
| |
|
|
| Common stock (par value $0.01 per share; shares authorized 20,000,000; Shares issued 12,903,037 and 12,856,716) | 129 |
| | 128 |
|
| Additional paid-in capital | 121,015 |
| | 120,524 |
|
| Retained earnings | 89,557 |
| | 89,368 |
|
| Treasury shares (at cost, 9,243 and 18,489) | (104 | ) | | (202 | ) |
| Accumulated other comprehensive loss | (54,656 | ) | | (48,713 | ) |
| Total shareholders’ equity | 155,941 |
| | 161,105 |
|
| Total liabilities and shareholders’ equity | $ | 297,550 |
| | $ | 310,938 |
|
See accompanying notes to the consolidated financial statements.
HARDINGE INC. AND SUBSIDIARIES
CONSOLIDATED STATEMENTS OF OPERATIONS
(in thousands, except per share data)
|
| | | | | | | | | | | |
| | Year Ended December 31, |
| | 2016 | | 2015 | | 2014 |
| Sales | $ | 292,013 |
| | $ | 315,249 |
| | $ | 311,633 |
|
| Cost of sales | 194,486 |
| | 210,711 |
| | 210,851 |
|
| Gross profit | 97,527 |
| | 104,538 |
| | 100,782 |
|
| | | | | | |
| Selling, general and administrative expenses | 79,647 |
| | 81,271 |
| | 81,045 |
|
| Research & development | 13,514 |
| | 14,140 |
| | 13,904 |
|
| Restructuring charges | 661 |
| | 3,558 |
| | — |
|
| Impairment charges | — |
| | — |
| | 5,766 |
|
| Other expense, net | 310 |
| | 632 |
| | 514 |
|
| Income (loss) from operations | 3,395 |
| | 4,937 |
| | (447 | ) |
| | | | | | |
| Interest expense | 555 |
| | 655 |
| | 737 |
|
| Interest income | (227 | ) | | (156 | ) | | (59 | ) |
Income (loss) from continuing operations before
income taxes | 3,067 |
| | 4,438 |
| | (1,125 | ) |
| Income taxes | 1,843 |
| | 1,828 |
| | 1,233 |
|
| Net income (loss) from continuing operations | 1,224 |
| | 2,610 |
| | (2,358 | ) |
| | | | | | |
| Gain from disposal of discontinued operation, net of tax | — |
| | — |
| | 218 |
|
| | | | | | |
| Net income (loss) | $ | 1,224 |
| | $ | 2,610 |
| | $ | (2,140 | ) |
| | | | | | |
| Per share data: | |
| | |
| | |
| | | | | | |
| Basic earnings (loss) per share: | |
| | |
| | |
| Continuing operations | $ | 0.10 |
| | $ | 0.20 |
| | $ | (0.19 | ) |
| Disposal of discontinued operation | — |
| | — |
| | 0.02 |
|
| Basic earnings (loss) per share | $ | 0.10 |
| | $ | 0.20 |
| | $ | (0.17 | ) |
| | | | | | |
| Diluted earnings (loss) per share: | |
| | |
| | |
| Continuing operations | $ | 0.09 |
| | $ | 0.20 |
| | $ | (0.19 | ) |
| Disposal of discontinued operation | — |
| | — |
| | 0.02 |
|
| Diluted earnings (loss) per share | $ | 0.09 |
| | $ | 0.20 |
| | $ | (0.17 | ) |
| | | | | | |
| Cash dividends declared per share: | $ | 0.08 |
| | $ | 0.08 |
| | $ | 0.08 |
|
See accompanying notes to the consolidated financial statements.
HARDINGE INC. AND SUBSIDIARIES
CONSOLIDATED STATEMENTS OF COMPREHENSIVE (LOSS) INCOME
(in thousands)
|
| | | | | | | | | | | |
| | Year Ended December 31, |
| | 2016 | | 2015 | | 2014 |
| Net income (loss) | $ | 1,224 |
| | $ | 2,610 |
| | $ | (2,140 | ) |
| Other comprehensive (loss) income: | |
| | |
| | |
| Foreign currency translation adjustments | (4,811 | ) | | (4,598 | ) | | (11,893 | ) |
| Retirement plans related adjustments | (899 | ) | | (5,945 | ) | | (26,163 | ) |
| Unrealized gain (loss) on cash flow hedges | 138 |
| | — |
| | (281 | ) |
| Other comprehensive loss before tax | (5,572 | ) | | (10,543 | ) | | (38,337 | ) |
| Income tax expense (benefit) | 371 |
| | (631 | ) | | (955 | ) |
| Other comprehensive loss, net of tax | (5,943 | ) | | (9,912 | ) | | (37,382 | ) |
| Total comprehensive loss | $ | (4,719 | ) | | $ | (7,302 | ) | | $ | (39,522 | ) |
See accompanying notes to the consolidated financial statements.
HARDINGE INC. AND SUBSIDIARIES
CONSOLIDATED STATEMENTS OF CASH FLOWS
(in thousands)
|
| | | | | | | | | | | |
| | Year Ended December 31, |
| | 2016 | | 2015 | | 2014 |
| Operating activities | |
| | | | |
| Net income (loss) | $ | 1,224 |
| | $ | 2,610 |
| | $ | (2,140 | ) |
| Adjustments to reconcile net income (loss) to net cash provided by operating activities: | |
| | |
| | |
| Impairment charge | — |
| | — |
| | 5,766 |
|
| Depreciation and amortization | 8,789 |
| | 8,824 |
| | 10,169 |
|
| Debt issuance costs amortization | 131 |
| | 134 |
| | 85 |
|
| Deferred income taxes | 689 |
| | (768 | ) | | 446 |
|
| Gain on sale of assets | (38 | ) | | (26 | ) | | (82 | ) |
| Gain on sale of business | — |
| | — |
| | (218 | ) |
| Gain on purchase of business | — |
| | — |
| | (462 | ) |
| Unrealized foreign currency transaction loss | 524 |
| | 404 |
| | 350 |
|
| Changes in operating assets and liabilities, net of businesses acquired: | |
| | |
| | |
|
| Accounts receivable | (284 | ) | | 3,942 |
| | (7,860 | ) |
| Restricted cash | (927 | ) | | 827 |
| | 973 |
|
| Inventories | 252 |
| | (1,442 | ) | | (1,303 | ) |
| Other assets | (372 | ) | | 834 |
| | 317 |
|
| Accounts payable | 141 |
| | 450 |
| | 2,211 |
|
| Customer deposits | (776 | ) | | 7,762 |
| | (1,783 | ) |
| Accrued expenses | (3,964 | ) | | 3,250 |
| | (3,281 | ) |
| Accrued pension and postretirement liabilities | (92 | ) | | (74 | ) | | (9 | ) |
| Net cash provided by operating activities | 5,297 |
| | 26,727 |
| | 3,179 |
|
| | | | | | |
| Investing activities | |
| | |
| | |
| Acquisition of businesses, net of cash acquired | — |
| | — |
| | (5,683 | ) |
| Capital expenditures | (2,479 | ) | | (4,210 | ) | | (3,186 | ) |
| Proceeds from disposal of business | — |
| | — |
| | 218 |
|
| Proceeds from sales of assets | 118 |
| | 69 |
| | 151 |
|
| Net cash used in investing activities | (2,361 | ) | | (4,141 | ) | | (8,500 | ) |
| | | | | | |
| Financing activities | |
| | |
| | |
| Payment of contingent consideration | — |
| | — |
| | (7,500 | ) |
| Proceeds from short-term notes payable to bank | 42,820 |
| | 32,502 |
| | 21,143 |
|
| Repayments of short-term notes payable to bank | (42,114 | ) | | (32,502 | ) | | (21,143 | ) |
| Repayments of long-term debt | (5,761 | ) | | (4,464 | ) | | (9,296 | ) |
| Dividends paid | (1,052 | ) | | (1,037 | ) | | (1,012 | ) |
| Net proceeds from sales of common stock | — |
| | — |
| | 5,678 |
|
| Purchases of treasury stock | (368 | ) | | (201 | ) | | — |
|
| Net cash used in financing activities | (6,475 | ) | | (5,702 | ) | | (12,130 | ) |
| Effect of exchange rate changes on cash | (980 | ) | | (403 | ) | | (978 | ) |
| Net (decrease) increase in cash | (4,519 | ) | | 16,481 |
| | (18,429 | ) |
| | | | | | |
| Cash and cash equivalents at beginning of period | 32,774 |
| | 16,293 |
| | 34,722 |
|
| | | | | | |
| Cash and cash equivalents at end of period | $ | 28,255 |
| | 32,774 |
| | $ | 16,293 |
|
See accompanying notes to the consolidated financial statements.
HARDINGE INC. AND SUBSIDIARIES
CONSOLIDATED STATEMENTS OF SHAREHOLDERS' EQUITY
(in thousands)
|
| | | | | | | | | | | | | | | | | | | | | | | |
| | Common Stock | | Additional Paid-in Capital | | Retained Earnings | | Treasury Stock | | Accumulated Other Comprehensive Loss | | Total Shareholders' Equity |
| Balance at December 31, 2013 | $ | 125 |
|
| $ | 114,951 |
|
| $ | 90,937 |
|
| $ | (806 | ) |
| $ | (1,419 | ) |
| $ | 203,788 |
|
| Net Loss | — |
|
| — |
|
| (2,140 | ) |
| — |
|
| — |
|
| (2,140 | ) |
Other comprehensive loss, net of
tax | — |
|
| — |
|
| — |
|
| — |
|
| (37,382 | ) |
| (37,382 | ) |
| Dividends declared | — |
|
| — |
|
| (1,020 | ) |
| — |
|
| — |
|
| (1,020 | ) |
| Common shares issued | 3 |
|
| 4,941 |
|
| — |
|
| 586 |
|
| — |
|
| 5,530 |
|
| Stock based compensation | — |
|
| 494 |
|
| — |
|
| 174 |
|
| — |
|
| 668 |
|
| Net issuance of treasury stock | — |
|
| 152 |
|
| — |
|
| — |
|
| — |
|
| 152 |
|
| Balance at December 31, 2014 | 128 |
| | 120,538 |
| | 87,777 |
| | (46 | ) | | (38,801 | ) | | 169,596 |
|
| Net Income | — |
|
| — |
|
| 2,610 |
|
| — |
|
| — |
|
| 2,610 |
|
Other comprehensive loss, net of
tax | — |
|
| — |
|
| — |
|
| — |
|
| (9,912 | ) |
| (9,912 | ) |
| Dividends declared | — |
|
| — |
|
| (1,019 | ) |
| — |
|
| — |
|
| (1,019 | ) |
| Common shares issued | — |
|
| 257 |
|
| — |
|
| — |
|
| — |
|
| 257 |
|
| Stock based compensation | — |
|
| (267 | ) |
| — |
|
| (18 | ) |
| — |
|
| (285 | ) |
| Net issuance of treasury stock | — |
|
| (4 | ) |
| — |
|
| (138 | ) |
| — |
|
| (142 | ) |
| Balance at December 31, 2015 | 128 |
| | 120,524 |
| | 89,368 |
| | (202 | ) | | (48,713 | ) | | 161,105 |
|
| Net Income | — |
|
| — |
|
| 1,224 |
|
| — |
|
| — |
|
| 1,224 |
|
Other comprehensive loss, net of
tax | — |
|
| — |
|
| — |
|
| — |
|
| (5,943 | ) |
| (5,943 | ) |
| Dividends declared | — |
|
| — |
|
| (1,035 | ) |
| — |
|
| — |
|
| (1,035 | ) |
| Common shares issued | 1 |
|
| 526 |
|
| — |
|
| — |
|
| — |
|
| 527 |
|
| Stock based compensation | — |
|
| 54 |
|
| — |
|
| (3 | ) |
| — |
|
| 51 |
|
| Net issuance of treasury stock | — |
|
| (89 | ) |
| — |
|
| 101 |
|
| — |
|
| 12 |
|
| Balance at December 31, 2016 | $ | 129 |
| | $ | 121,015 |
| | $ | 89,557 |
| | $ | (104 | ) | | $ | (54,656 | ) | | $ | 155,941 |
|
See accompanying notes to the consolidated financial statements.
HARDINGE INC. AND SUBSIDIARIES
NOTES TO CONSOLIDATED FINANCIAL STATEMENTS
DECEMBER 31, 2016
NOTE 1. SIGNIFICANT ACCOUNTING POLICIES AND BASIS OF PRESENTATION
Nature of Business
Hardinge Inc. ("Hardinge" or "the Company") is a machine tool manufacturer, which designs and manufactures computer-numerically controlled cutting lathes, machining centers, grinding machines, collets, chucks, index fixtures and other industrial products. Products are sold to customers in North America, Europe and Asia. A substantial portion of sales are to small and medium-sized independent job shops, which in turn sell machined parts to their industrial customers. Industries directly and indirectly served by the Company include: aerospace, automotive, communications, computer, construction equipment, defense, energy, farm equipment, medical equipment, recreational equipment and transportation.
The Company operates through two reportable segments, Metalcutting Machine Solutions (“MMS”) and Aftermarket Tooling and Accessories (“ATA”). The MMS segment includes high precision computer controlled metalcutting turning machines, vertical machining centers, horizontal machining centers, grinding machines, and repair parts related to those machines. The ATA segment includes products, primarily collets and chucks that are purchased by manufacturers throughout the lives of their Hardinge or other branded machines.
Principles of Consolidation
The consolidated financial statements include the accounts of the Company and its wholly owned subsidiaries. All significant intercompany accounts and transactions are eliminated in consolidation.
Reclassifications
Certain prior year amounts have been reclassified to conform to the current year presentation.
Use of Estimates
The accompanying consolidated financial statements have been prepared in accordance with accounting principles generally accepted in the Unites States of America ("US GAAP") which requires management to make estimates and assumptions that affect the reported amounts of assets and liabilities, disclosure of contingent assets and liabilities at the date of the financial statements, and the reported amounts of revenue and expenses during the reporting period. Actual results could differ from those estimates.
Cash Equivalents
Cash equivalents are highly liquid financial instruments with an original maturity of three months or less at the date of purchase.
Restricted Cash
Occasionally, the Company is required to maintain cash deposits with certain banks with respect to contractual obligations as collateral for customer deposits. Additionally, restricted cash includes amounts due under mandatory principal reduction provisions associated with certain term debt agreements. As of December 31, 2016 and 2015, the amount of restricted cash was approximately $2.9 million and $2.2 million, respectively.
Accounts Receivable
A review of the financial condition of the Company's customers is performed periodically through credit reviews. No collateral is required for sales made on open account terms. Letters of credit from major banks back the majority of sales in the Asian region. Concentrations of credit risk with respect to accounts receivable are generally limited due to the large number of customers comprising the customer base. Trade accounts receivable are considered to be past due when in excess of 30 days past terms, and charge off of uncollectible balances occurs when all collection efforts have been exhausted.
HARDINGE INC. AND SUBSIDIARIES
NOTES TO CONSOLIDATED FINANCIAL STATEMENTS (Continued)
DECEMBER 31, 2016
The Company maintains an allowance for doubtful accounts for estimated losses resulting from the inability of customers to make required payments. The allowance for doubtful accounts was $0.8 million and $0.9 million at December 31, 2016 and 2015, respectively. If the financial condition of customers were to deteriorate, resulting in an impairment of their ability to make payments, additional allowances would result in additional expense to the Company.
Other Current Assets
Other current assets consist of prepaid insurance, prepaid real estate taxes, prepaid software license agreements, prepaid income taxes and deposits on certain inventory purchases. When applicable, prepayments are expensed on a straight-line basis over the corresponding life of the underlying asset.
Inventories
Inventories are stated at the lower of cost (computed in accordance with the first-in, first-out method) or market. Elements of cost include raw materials, purchased components, labor and overhead.
The Company assesses the valuation of inventory balances, and reduce the carrying value of those inventories that are obsolete or in excess of forecasted usage to their estimated net realizable value. The net realizable value of such inventories is estimated based on analysis and assumptions including, but not limited to, historical usage, future demand and market requirements. The carrying value of inventory is also compared to the estimated selling price less costs to sell and inventory carrying value will be adjusted accordingly. Reductions to the carrying value of inventories are recorded in cost of goods sold. If future demand for products is less favorable than forecasts, inventories may need to be reduced, which would result in additional expense.
Property, Plant and Equipment
Property, plant and equipment are recorded at cost. Major additions, renewals or improvements that extend the useful lives of assets are capitalized. Maintenance and repairs are expensed to operations as incurred. Depreciation expense is computed using the straight-line and accelerated methods, generally over the following estimated useful lives of the assets (in years):
|
| |
| Buildings | 40 |
| Machinery | 12 |
| Patterns, tools, jigs and furniture and fixtures | 10 |
| Office and computer equipment | 3-5 |
Goodwill and Intangible Assets
In accordance with Financial Accounting Standards Board ("FASB") Accounting Standard Update ("ASU") Topic 350, Intangibles-Goodwill and Other ("ASC 350"), goodwill and intangible assets with indefinite lives are not amortized but are tested for impairment annually on the first day of the fourth quarter or when events indicate that an impairment could exist. Goodwill impairment is deemed to exist if the carrying value of a reporting unit exceeds its estimated fair value. The reporting units are determined based upon whether discrete financial information is available and reviewed regularly, whether those units constitute a business, and the extent of economic similarities between those reporting units for purposes of aggregation. The reporting units identified under ASC 350-20-35-33 are at the component level, or one level below the reporting segment level as defined under ASC 280-10-50-10 "Segment Reporting-Disclosure." The Company has three reporting units.
HARDINGE INC. AND SUBSIDIARIES
NOTES TO CONSOLIDATED FINANCIAL STATEMENTS (Continued)
DECEMBER 31, 2016
Goodwill is evaluated for potential impairment by assessing a range of qualitative factors including, but not limited to, macroeconomic conditions, industry conditions, the competitive environment, changes in the market for the Company's products and services, regulatory and political developments, entity specific factors such as strategy and changes in key personnel and overall financial performance. If it is determined after completing this assessment that it is more likely than not that the fair value of a reporting unit is less than its carrying value, a step-two impairment test is performed.
The measurement of impairment of goodwill consists of two steps. In the first step, the fair value of each reporting unit is compared to its carrying value. As part of the impairment analysis, the fair value of each of its reporting units with goodwill is determined using the income approach and market approach. If the carrying value of the reporting unit exceeds its fair value, the second step of the analysis is performed to determine the amount of the impairment.
The Company performed its qualitative assessment as of October 1, 2016 and determined that it was not more likely than not that the fair value of each of its reporting units with goodwill was less than that its applicable carrying value. Accordingly, the Company did not perform the two-step goodwill impairment test for any of its reporting units. See Note 7: "Goodwill and Intangible Assets" for more information.
Intangible assets with indefinite lives are not subject to amortization. They are reviewed for impairment at least annually or more frequently if an event occurs or circumstances change that would indicate the carrying amount may be impaired. Intangible assets that are determined to have a finite life are amortized over their estimated useful lives and are also subject to review for impairment, if indicators of impairment are identified.
Future impairment indicators, such as declines in forecasted cash flows, may cause additional significant impairment charges. Impairment charges could be based on such factors as the Company's stock price, forecasted cash flows, assumptions used, control premiums or other variables.
Impairment of Long-Lived Assets
Long-lived assets are reviewed for impairment whenever events or changes in circumstances indicate that the carrying amount of an asset may not be recoverable. To assess whether impairment exists, undiscounted cash flows are used to measure any impairment loss using discounted cash flows. Assets to be held for sale are reported at the lower of their carrying amount or fair value less costs to sell and are no longer depreciated.
Accrued Expenses
Accrued expenses include $8.0 million and $10.5 million in compensation related expenses at December 31, 2016 and 2015, respectively, as well as $7.2 million of commissions payable for both years.
Income Taxes
Deferred income tax assets and liabilities are recognized for the income tax consequences attributable to operating loss carryforwards, tax credit carryforwards, and differences between the financial statement carrying amounts of existing assets and liabilities and their respective tax bases. Deferred income tax assets and liabilities are measured using the enacted tax rates expected to apply to taxable income in the years in which temporary differences are expected to be reversed.
A valuation allowance is established when it is more likely than not that all or a portion of deferred tax assets are not expected to be realized. The Company assesses all available positive and negative evidence to determine whether a valuation allowance is needed. Positive and negative evidence to be considered includes scheduled reversals of deferred tax liabilities, projected future taxable income, tax-planning strategies, and results of recent operations. Supporting a conclusion that a valuation allowance is not necessary is difficult when there is negative evidence such as cumulative losses in recent years.
A full valuation allowance is maintained on the tax benefits of the U.S. net deferred tax assets and it is expected that a full valuation allowance on future tax benefits will be recorded until an appropriate level of profitability in the U.S. is sustained. A valuation allowance is also maintained on the U.K., German, Dutch, and Canadian deferred tax assets related to tax loss carryforwards in those jurisdictions, as well as all other deferred tax assets of those entities.
HARDINGE INC. AND SUBSIDIARIES
NOTES TO CONSOLIDATED FINANCIAL STATEMENTS (Continued)
DECEMBER 31, 2016
The calculation of the tax liabilities requires significant judgment, the use of estimates and the interpretation and application of complex tax laws. The provision for income taxes reflects a combination of income earned and taxed in the U.S. and the various states, as well as federal and provincial jurisdictions in Switzerland, U.K., Canada, Germany, France, the Netherlands, China, Taiwan, and India. Jurisdictional tax law changes, increases or decreases in permanent differences between book and tax items, accruals or adjustments of accruals for tax contingencies or valuation allowances, and the change in the mix of earnings from these taxing jurisdictions all affect the overall effective tax rate.
The Company accounts for uncertain tax positions using a more likely than not recognition threshold. The evaluation of uncertain tax positions is based on factors including, but not limited to, changes in tax law, the measurement of tax positions taken or expected to be taken in tax returns, the effective settlement of matters subject to audit, new audit activity and changes in facts or circumstances related to a tax position. Interest and penalties related to uncertain tax positions are included as a component of income tax expense.
Revenue Recognition
Revenue from product sales is generally recognized upon shipment, provided persuasive evidence of an arrangement exists, the sales price is fixed or determinable, collectability is reasonably assured, and the title and risk of loss have passed to the customer. Sales are recorded net of discounts, customer sales incentives and returns. Discounts and customer sales incentives are typically negotiated as part of the sales terms at the time of sale and are recorded as a reduction of revenue. The Company does not routinely permit customers to return machines. In the rare case that a machine return is permitted, a restocking fee is typically charged. Returns of spare parts and workholding products are limited to a period of 90 days subsequent to purchase, excluding special orders which are not eligible for return. An estimate of returns, which is not significant, is recorded as a reduction of revenue and is based on historical experience. Transfer of ownership and risk of loss are generally not contingent upon contractual customer acceptance. Prior to shipment, each machine is tested to ensure the machine's compliance with standard operating specifications as listed in the promotional literature. On an exception basis, where larger multiple machine installations are delivered which require run-offs and customer acceptance at their facility, revenue is recognized in the period of customer acceptance.
Sales Tax/VAT
Taxes assessed by different governmental authorities are collected and remitted that are both imposed on and concurrent with revenue producing transactions between the Company and its customers. These taxes may include sales, use and value-added taxes. The collection of these taxes is reported on a net basis (excluded from revenues).
Shipping and Handling Costs
Shipping and handling costs are recorded as part of cost of goods sold.
Warranties
The Company offers warranties for products sold. The specific terms and conditions of those warranties vary depending upon the product sold and the country in which the product was sold. A basic limited warranty is generally provided for a period of one to two years. The costs that may be incurred are estimated under the basic limited warranty, based largely upon actual warranty repair cost history and we record a liability for such costs when the related product revenue is recognized. The resulting accrual balance is reviewed during the year. Factors that affect the warranty liability include the number of installed units, historical and anticipated rates of warranty claims, and cost per claim.
Extended warranties for some of the Company's products are also sold. These extended warranties usually cover a one year to two year period that begins after the basic warranty expires. Revenue from extended warranties are deferred and recognized on a straight-line basis across the term of the warranty contract.
These liabilities are reported in "Accrued expenses" in the Consolidated Balance Sheets.
HARDINGE INC. AND SUBSIDIARIES
NOTES TO CONSOLIDATED FINANCIAL STATEMENTS (Continued)
DECEMBER 31, 2016
Research and Development Costs
The costs associated with research and development programs for new products and significant product improvements are expensed as incurred and reported in the Consolidated Statement of Operations.
Foreign Currency Translation and Re-measurement
The functional currency of the Company's foreign subsidiaries is their local currency. Net assets are translated at month end exchange rates while income, expense and cash flow items are translated at average exchange rates for the applicable period. Translation adjustments are recorded within accumulated other comprehensive income (loss). Gains and losses resulting from foreign currency denominated transactions are included as a component of "Other expense, net" in the Consolidated Statements of Operations.
Fair Value of Financial Instruments
Financial instruments consist primarily of cash and cash equivalents, accounts receivable, notes receivable, accounts payable, notes payable, long-term debt and foreign currency forwards. See Note 3. "Fair Value of Financial Instruments" for additional disclosure.
Derivative Financial Instruments
As a multinational company, the results of operations and financial condition are exposed to market risk from changes in foreign currency exchange rates. To manage this risk, derivative instruments are entered into, namely in the form of foreign currency forwards. These derivative instruments are held to hedge economic exposures, such as fluctuations in foreign currency exchange rates on balance sheet exposures of both trade and intercompany assets and liabilities. This exposure is hedged with contracts settling in less than one year. These derivatives do not qualify for hedge accounting treatment. Gains or losses resulting from the changes in the fair value of these hedging contracts are recognized immediately in earnings. There are some forward contracts to hedge certain customer orders and vendor firm commitments. These contracts are typically for less than one year, and have maturity dates in alignment with the recognition dates of the underlying financial transactions. These derivatives qualify for hedge accounting treatment and are designated as cash flow hedges. Unrealized gains or losses resulting from the changes in the fair value of these hedging contracts are charged to other comprehensive income (loss) until the underlying transaction is recognized through earnings. Gains or losses on any ineffective portion of the contracts are recognized in earnings.
Stock-Based Compensation
Stock-based compensation is accounted for based on the estimated fair value of the award as of the grant date and recognized as expense over the requisite service period.
Earnings Per Share
Basic earnings per common share is computed by dividing net income (loss) available to common shareholders by the weighted average number of common shares outstanding for the period. Diluted earnings per common share are calculated by adjusting the weighted average outstanding shares to assume conversion of all potentially dilutive shares.
HARDINGE INC. AND SUBSIDIARIES
NOTES TO CONSOLIDATED FINANCIAL STATEMENTS (Continued)
DECEMBER 31, 2016
NOTE 2. ACQUISITIONS
Acquisition of Voumard
On September 22, 2014, Hardinge Inc., along with its indirect wholly-owned subsidiaries Hardinge GmbH and L. Kellenberger & Co., AG acquired certain assets and assumed certain liabilities associated with a product line of grinding machine systems and applications marketed and sold under the Voumard brand from Peter Wolters GmbH. The purchase price was EUR 1.7 million (approximately $2.2 million), before taking into account customary purchase price adjustments. The acquisition of Voumard expands the Company's product offerings to include internal diameter ("ID") cylindrical grinding solutions, which are a complement to the existing grinding product lines offered by the Company. The acquisition was funded with cash and has been included in the MMS business segment. Voumard is a global leader in the ID grinding market with an installed base of over 9,000 machine solutions serving more than 2,500 customers around the world. The results of operations of Voumard have been included in the consolidated financial statements from the date of acquisition. Acquisition related costs of $0.1 million were incurred related to the acquisition of the Voumard business for the year ended December 31, 2014 and reported in "Selling, general and administrative expenses" in the Consolidated Statements of Operations.
In accordance with the acquisition method of accounting, the acquired net assets were recorded at fair value at the date of acquisition. The identifiable intangible assets acquired, which primarily consists of drawings of $0.1 million, were valued using a cost approach. The fair values of the acquired assets and liabilities exceeded the purchase price of Voumard, resulting in a gain on the purchase of $0.5 million. The values of assets acquired and liabilities assumed were finalized during the third quarter 2015, resulting in no valuation adjustments.
The following table summarizes the fair values of the assets acquired and liabilities assumed in the Voumard acquisition at the date of acquisition (in thousands):
|
| | | |
| | September 22, 2014 |
| Assets Acquired | |
| Inventories | $ | 2,984 |
|
| Property, plant and equipment | 259 |
|
| Drawings, customer lists, and other intangible assets | 131 |
|
| Total assets acquired | 3,374 |
|
| Liabilities Assumed | |
| Warranties | 600 |
|
| Deferred tax liability | 162 |
|
| Net assets acquired | 2,612 |
|
| Total purchase price | 2,150 |
|
| Bargain purchase gain | $ | (462 | ) |
HARDINGE INC. AND SUBSIDIARIES
NOTES TO CONSOLIDATED FINANCIAL STATEMENTS (Continued)
DECEMBER 31, 2016
Supplemental Pro Forma Information
The following table illustrates the unaudited pro forma effect on the Company’s consolidated operating results for the year ended December 31, 2014 as if the Voumard acquisition had occurred on January 1, 2014 (in thousands, except per share data):
|
| | | |
| | Year Ended
December 31, |
| | 2014 |
| Sales | $ | 318,061 |
|
Net (loss) income from continuing operations(1) | (7,827 | ) |
| Diluted (loss) earnings per share from continuing operations | $ | (0.62 | ) |
____________________
| |
(1) | The pro forma results above include abbreviated financial results for Voumard, consisting of revenues and direct expenses for that product line. During the year ended December 31, 2014, but prior to its acquisition by the Company, the Voumard business incurred $4.9 million in restructuring charges, which included inventory write-offs, headcount reductions and other related costs. These amounts are included in the pro forma information presented above. |
The above unaudited pro forma financial information is presented for informational purposes only and does not purport to represent what the results of operations would have been had the acquisition been completed on the date assumed, nor is it necessarily indicative of the results that may be expected in future periods. Pro forma adjustments exclude cost savings from any synergies resulting from the acquisition.
NOTE 3. FAIR VALUE OF FINANCIAL INSTRUMENTS
Fair value is defined as the price that would be received upon sale of an asset or paid to transfer a liability in an orderly transaction between market participants at the measurement date. Depending on the nature of the asset or liability, various techniques and assumptions can be used to estimate fair value. The following presents the fair value hierarchy definitions utilized by the Company:
|
| | |
| Level 1 | — | Quoted prices in active markets for identical assets and liabilities. |
| | | |
| Level 2 | — | Observable inputs other than quoted prices in active markets for similar assets and liabilities. |
| | | |
| Level 3 | — | Inputs for which significant valuation assumptions are unobservable in a market and therefore value is based on the best available data, some of which is internally developed and considers risk premiums that a market participant would require. |
HARDINGE INC. AND SUBSIDIARIES
NOTES TO CONSOLIDATED FINANCIAL STATEMENTS (Continued)
DECEMBER 31, 2016
The following table presents the carrying amount, fair values, and classification level within the fair value hierarchy of financial instruments measured or disclosed at fair value on a recurring basis (in thousands):
|
| | | | | | | | | | | | | | | | | |
| | December 31, 2016 | | December 31, 2015 | | Level of Fair Value Hierarchy |
| | Carrying Amount | | Fair Value | | Carrying Amount | | Fair Value | |
| Assets: | | | | | | | | | |
| Cash and cash equivalents | $ | 28,255 |
| | $ | 28,255 |
| | $ | 32,774 |
| | $ | 32,774 |
| | Level 1 |
| Restricted cash | 2,923 |
| | 2,923 |
| | 2,192 |
| | 2,192 |
| | Level 1 |
| Foreign currency forward contracts | 308 |
| | 308 |
| | 163 |
| | 163 |
| | Level 2 |
| Liabilities: | | | | | | | | | |
| Variable interest rate debt | 5,986 |
| | 5,986 |
| | 11,771 |
| | 11,771 |
| | Level 2 |
| Foreign currency forward contracts | 566 |
| | 566 |
| | 418 |
| | 418 |
| | Level 2 |
The fair value of cash and cash equivalents and restricted cash are based on the fair values of identical assets in active markets. Due to the short period to maturity or the nature of the underlying liability, the fair value of variable interest rate debt approximates their respective carrying amounts. The fair value of foreign currency forward contracts is measured based on observable market inputs such as spot and forward rates. Based on the Company’s continued ability to enter into forward contracts, the markets for the fair value instruments are considered to be active. As of December 31, 2016 and December 31, 2015, there were no significant transfers in and/or out of Level 1 and Level 2.
The following table presents the fair value on the Consolidated Balance Sheets of the foreign currency forward contracts (in thousands):
|
| | | | | | | |
| | December 31,
2016 | | December 31,
2015 |
| Foreign currency forwards designated as hedges: | |
| | |
|
| Other current assets | $ | 153 |
| | $ | 49 |
|
| Accrued expenses | (264 | ) | | (222 | ) |
| Foreign currency forwards not designated as hedges: | |
| | |
|
| Other current assets | 155 |
| | 114 |
|
| Accrued expenses | (302 | ) | | (196 | ) |
| Foreign currency forwards, net | $ | (258 | ) | | $ | (255 | ) |
The Company applied fair value principles during goodwill impairment tests. Step one of the goodwill impairment test consisted of determining a fair value for each of the Company's reporting units. The fair value for the Company's reporting units cannot be determined using readily available quoted Level 1 or Level 2 inputs that are observable or available from active markets. Therefore, the Company used valuation models to estimate the fair values of its reporting units, which use Level 3 inputs. To estimate the fair values of reporting units, the Company uses significant estimates and judgmental factors. The key estimates and factors used in the valuation models included revenue growth rates and profit margins based on internal forecasts, terminal value, WACC, and earnings multiples. As a result of the goodwill impairment test performed during 2014, the Company recognized goodwill impairment charges (See Note 7. "Goodwill and Intangible Assets" for more information regarding the Company's goodwill impairment tests).
During 2014, the Company recognized impairments to intangible assets associated with trade names. The impairment charges were calculated by determining the fair value of these assets. The fair value measurements were calculated using discounted cash flow analysis, which rely upon unobservable inputs classified as Level 3 inputs. The key estimates and factors used in the valuation models, for which the Company used significant estimates and judgmental factors, include revenue growth rates based on internal forecasts, royalty rates and discounts rates (See Note 7. "Goodwill and Intangible Assets" for more information regarding the impairment of intangible assets).
HARDINGE INC. AND SUBSIDIARIES
NOTES TO CONSOLIDATED FINANCIAL STATEMENTS (Continued)
DECEMBER 31, 2016
Pension Plan Assets
The fair values and classification of the defined benefit plan assets is as follows (in thousands):
|
| | | | | | | | | | | | | | | |
| | December 31, 2016 |
| | Total | | Level 1 | | Level 2 | | Level 3 |
Growth funds(1) | $ | 39,247 |
| | $ | 39,247 |
| | $ | — |
| | $ | — |
|
Income funds(2) | 25,276 |
| | 25,276 |
| | — |
| | — |
|
Growth and income funds(3) | 84,176 |
| | — |
| | 84,176 |
| | — |
|
Hedge funds(4) | 22,860 |
| | — |
| | — |
| | 22,860 |
|
| Real estate funds | 3,327 |
| | 761 |
| | 2,566 |
| | — |
|
| Other assets | 2,128 |
| | 618 |
| | 1,510 |
| | — |
|
| Cash and cash equivalents | 3,735 |
| | 3,735 |
| | — |
| | — |
|
| Total | $ | 180,749 |
| | $ | 69,637 |
| | $ | 88,252 |
| | $ | 22,860 |
|
|
| | | | | | | | | | | | | | | |
| | December 31, 2015 |
| | Total | | Level 1 | | Level 2 | | Level 3 |
Growth funds(1) | $ | 37,472 |
| | $ | 37,472 |
| | $ | — |
| | $ | — |
|
Income funds(2) | 23,401 |
| | 23,401 |
| | — |
| | — |
|
Growth and income funds(3) | 83,247 |
| | — |
| | 83,247 |
| | — |
|
Hedge funds(4) | 27,071 |
| | — |
| | — |
| | 27,071 |
|
| Real estate funds | 3,246 |
| | 769 |
| | 2,477 |
| | — |
|
| Other assets | 1,514 |
| | 582 |
| | 932 |
| | — |
|
| Cash and cash equivalents | 4,056 |
| | 4,056 |
| | — |
| | — |
|
| Total | $ | 180,007 |
| | $ | 66,280 |
| | $ | 86,656 |
| | $ | 27,071 |
|
____________________
(1) Growth funds represent a type of fund containing a diversified portfolio of domestic and international equities with a goal of capital appreciation.
(2) Income funds represent a type of fund with an emphasis on current income as opposed to capital appreciation. Such funds may contain a variety of domestic and international government and corporate debt obligations, preferred stock, money market instruments and dividend-paying stocks.
(3) Growth and income funds represent a type of fund containing a combination of growth and income securities.
(4) Hedge funds represent a managed portfolio of investments that use advanced investment strategies such as leveraged, long, short and derivative positions in both domestic and international markets with the goal of generating high returns. These funds are subject to quarterly redemptions and advanced notification requirements, as well as the right to delay redemption until sufficient fund liquidity exists.
HARDINGE INC. AND SUBSIDIARIES
NOTES TO CONSOLIDATED FINANCIAL STATEMENTS (Continued)
DECEMBER 31, 2016
A summary of the changes in the fair value of the defined benefit plans assets classified within Level 3 of the valuation hierarchy is as follows (in thousands):
|
| | | | | | | |
| | Year Ended
December 31, |
| | 2016 | | 2015 |
| Balance at beginning of year | $ | 27,071 |
| | $ | 27,820 |
|
| Purchases | 1,000 |
| | 1,750 |
|
| Sales and settlements | (5,335 | ) | | (2,300 | ) |
| Unrealized (losses) gains | 124 |
| | (199 | ) |
| Realized (losses) | — |
| | — |
|
| Balance at end of year | $ | 22,860 |
| | $ | 27,071 |
|
Most of the defined benefit pension plan's Level 1 assets are debt and equity investments that are traded in active markets, either domestically or internationally. They are measured at fair value using closing prices from active markets. The Level 2 assets are typically investments in pooled funds, which are measured based on the value of their underlying assets that are publicly traded with observable values. The fair value of the Level 3 plan assets are measured by compiling the portfolio holdings and independently valuing the securities in those portfolios.
NOTE 4. INVENTORIES
Net inventories consist of the following (in thousands):
|
| | | | | | | |
| | December 31,
2016 | | December 31,
2015 |
| Raw materials and purchased components | $ | 33,822 |
| | $ | 34,438 |
|
| Work-in-process | 31,799 |
| | 33,682 |
|
| Finished products | 41,397 |
| | 42,112 |
|
| Inventories, net | $ | 107,018 |
| | $ | 110,232 |
|
NOTE 5. DERIVATIVE INSTRUMENTS
Foreign currency forward contracts are utilized to mitigate the impact of currency fluctuations on assets and liabilities denominated in foreign currencies as well as on forecasted transactions denominated in foreign currencies. These contracts are considered derivative instruments and are recognized as either assets or liabilities and measured at fair value. Generally these contracts have a term of less than one year. The valuations of these derivatives are measured at fair value based on observable market inputs such as spot and forward rates. A group of highly rated domestic and international banks are used in order to mitigate counterparty risk on the forward contracts.
For contracts that are designated and qualify as cash flow hedges, the gain or loss on the contracts is reported as a component of other comprehensive income (“OCI”) and reclassified from accumulated other comprehensive income (“AOCI”) into the “Sales” or “Cost of sales” line item on the Consolidated Statements of Operations when the underlying hedged transaction affects earnings, or “Other expense, net” when the hedging relationship is deemed to be ineffective. As of December 31, 2016 and December 31, 2015, the notional amounts of the derivative financial instruments designated to qualify for cash flow hedges were $45.5 million and $27.4 million, respectively. The Company expects approximately $0.1 million of net losses, net of income tax effect, to be reclassified from AOCI to earnings within the next 12 months.
As of December 31, 2016 and December 31, 2015, the notional amounts of the derivative financial instruments not qualifying or otherwise designated as hedges were $35.4 million and $38.5 million, respectively. For the years ended December 31, 2016 and 2015, losses of $0.1 million and $0.8 million, respectively, were recorded related to this type of derivative financial instruments. For contracts that are not designated as hedges, the gain or loss on the contracts are recognized in current earnings in the “Other expense, net” line item in the Consolidated Statements of Operations.
HARDINGE INC. AND SUBSIDIARIES
NOTES TO CONSOLIDATED FINANCIAL STATEMENTS (Continued)
DECEMBER 31, 2016
NOTE 6. PROPERTY, PLANT AND EQUIPMENT
Property, plant and equipment consists of the following (in thousands):
|
| | | | | | | |
| | December 31,
2016 | | December 31,
2015 |
| Land, buildings and improvements | $ | 81,311 |
| | $ | 82,201 |
|
| Machinery, equipment and fixtures | 75,177 |
| | 79,176 |
|
| Office furniture, equipment and vehicles | 22,471 |
| | 22,689 |
|
| Construction in progress | 272 |
| | 238 |
|
| | 179,231 |
| | 184,304 |
|
| Accumulated depreciation | (122,270 | ) | | (122,279 | ) |
| Property, plant and equipment, net | $ | 56,961 |
| | $ | 62,025 |
|
Depreciation expense was $6.6 million, $7.0 million, and $7.7 million for the years ended December 31, 2016, 2015 and 2014, respectively.
NOTE 7. GOODWILL AND INTANGIBLE ASSETS
Detail and activity of goodwill by segment is presented below (in thousands):
|
| | | | | | | | | | | |
| | MMS | | ATA | | Total |
| Goodwill | $ | 32,434 |
| | $ | 6,698 |
| | $ | 39,132 |
|
| Accumulated impairment losses | (32,434 | ) | | — |
| | (32,434 | ) |
| Balance at December 31, 2014 | — |
| | 6,698 |
| | 6,698 |
|
| | | | | | |
| Currency translation adjustments | — |
| | (78 | ) | | (78 | ) |
| Goodwill | 32,434 |
| | 6,620 |
| | 39,054 |
|
| Accumulated impairment losses | (32,434 | ) | | — |
| | (32,434 | ) |
| Balance at December 31, 2015 | — |
| | 6,620 |
| | 6,620 |
|
| | | | | | |
| Currency translation adjustments | — |
| | (41 | ) | | (41 | ) |
| Goodwill | 32,434 |
| | 6,579 |
| | 39,013 |
|
| Accumulated impairment losses | (32,434 | ) | | — |
| | (32,434 | ) |
| Balance at December 31, 2016 | $ | — |
| | $ | 6,579 |
| | $ | 6,579 |
|
Goodwill is reviewed for possible impairment at least annually or more frequently upon the occurrence of an event or when circumstances indicate that a reporting unit's carrying amount is greater than its fair value. The Company performed a qualitative assessment during the fourth quarter of 2016 and determined that it was not more likely than not that the fair value of each of our reporting units with goodwill was less than that its applicable carrying value. Accordingly, the Company did not perform the two-step goodwill impairment test for any reporting unit in 2016.
In 2015, the Company performed a review and test of goodwill and determined that the fair value exceeded the carrying amount for all of our reporting units with goodwill.
Based on lower than expected performance in the Usach reporting unit during 2014, combined with a downward revision in the anticipated future results, the Company determined that there were indicators of an impairment of that reporting unit during the third quarter of 2014. Accordingly, a calculation of the fair value was performed using the expected present value of future cash flows, recent industry transaction multiples and using estimates, judgments and assumptions that management believed were appropriate in the circumstances, which resulted in the carrying amount of the Usach reporting unit
HARDINGE INC. AND SUBSIDIARIES
NOTES TO CONSOLIDATED FINANCIAL STATEMENTS (Continued)
DECEMBER 31, 2016
exceeding its fair value. Accordingly, a goodwill impairment charge of $4.8 million was recognized in the "Impairment charges" caption in the Consolidated Statements of Operations in that reporting unit during the third quarter of 2014, resulting in the entire MMS goodwill balance to be written off. Subsequently, the Company performed the annual impairment analysis for the ATA reporting unit, which resulted in the fair value exceeding the carrying value. The Company performed further analysis of the reporting units' long-lived assets and determined that impairment of these assets was not present. The estimates and judgments used in the assessment included multiples of EBITDA, the weighted average cost of capital and the terminal growth rate.
The major components of intangible assets other than goodwill are as follows (in thousands):
|
| | | | | | | |
| | December 31,
2016 | | December 31,
2015 |
| Gross amortizable intangible assets: | |
| | |
|
| Technical know-how | $ | 12,944 |
| | $ | 12,956 |
|
| Customer lists | 8,981 |
| | 9,011 |
|
| Land rights | 2,498 |
| | 2,672 |
|
| Patents, trade names, drawings, and other | 4,356 |
| | 4,393 |
|
| Total gross amortizable intangible assets | 28,779 |
| | 29,032 |
|
| | | | |
| Accumulated amortization: | |
| | |
|
| Technical know-how | (7,438 | ) | | (6,833 | ) |
| Customer lists | (1,744 | ) | | (1,315 | ) |
| Land rights | (304 | ) | | (271 | ) |
| Patents, trade names, drawings, and other | (3,490 | ) | | (3,406 | ) |
| Total accumulated amortization | (12,976 | ) | | (11,825 | ) |
| Amortizable intangible assets, net | 15,803 |
| | 17,207 |
|
| | | | |
| Indefinite lived intangible assets: | |
| | |
|
| Trade names | 10,927 |
| | 10,811 |
|
| |
|
|
|
|
|
| Intangible assets other than goodwill, net | $ | 26,730 |
| | $ | 28,018 |
|
Amortization expense related to the definite-lived intangible assets are as follows (in thousands):
|
| | | | | | | | | | | |
| | Year Ended December 31, |
| | 2016 | | 2015 | | 2014 |
| Amortization expense | $ | 1,282 |
| | $ | 1,804 |
| | $ | 1,810 |
|
Estimated amortization expense for each of the five succeeding fiscal years and thereafter is as follows (in thousands):
|
| | | | |
| Fiscal Year | | Future Estimated Amortization |
| 2017 | | $ | 1,247 |
|
| 2018 | | 1,091 |
|
| 2019 | | 1,073 |
|
| 2020 | | 1,031 |
|
| 2021 | | 1,013 |
|
| Thereafter | | 10,348 |
|
HARDINGE INC. AND SUBSIDIARIES
NOTES TO CONSOLIDATED FINANCIAL STATEMENTS (Continued)
DECEMBER 31, 2016
The Company performed a qualitative review of its indefinite lived intangible assets in the fourth quarter of 2016 and determined that there were no indicators of impairment.
In 2015, the Company performed a review and test for impairment of indefinite lived intangible assets. The fair value of the indefinite lived intangible assets were calculated using a discounted cash flow analysis, and resulted in the fair value exceeding the carrying value.
As a result of interim impairment indicators present in the third quarter of 2014, it was determined that the fair value of the Company's Usach trade name was less than the carrying value, resulting in an impairment charge of $0.9 million, which was recognized in the "Impairment charges" caption in the Consolidated Statements of Operations. Additionally, in the fourth quarter of 2014, the Company concluded that the Usach trade name no longer had an indefinite life based on management plans surrounding the future use of the Usach name. Accordingly, an analysis was performed to assess the remaining useful life of this trade name, and the remaining balance is being amortized on a straight-line basis over a period of 18.25 years.
See Note 3. "Fair Value of Financial Instruments" for a discussion of the fair value measures used in determining these impairment charges.
NOTE 8. FINANCING ARRANGEMENTS
Financing arrangements are maintained with several financial institutions. These financing arrangements are in the form of long term loans, credit facilities, and lines of credit. The credit facilities allow the Company to borrow up to $74.7 million at December 31, 2016, of which $53.0 million can be borrowed for working capital needs. As of December 31, 2016, $67.1 million was available for borrowing under these arrangements of which $51.9 million was available for working capital needs. Total consolidated term borrowings outstanding, net of unamortized debt issuance fees were $5.9 million at December 31, 2016 and $11.6 million at December 31, 2015. Additionally, the Company had borrowings under revolving credit facilities of $0.7 million at December 31, 2016. Details of these financing arrangements are discussed below.
Long-term Debt
Long-term debt consists of (in thousands):
|
| | | | | | | |
| | December 31, |
| | 2016 | | 2015 |
| Mortgage loans | $ | — |
| | $ | 2,070 |
|
| Term loans, net of unamortized debt issuance fees | 5,893 |
| | 9,536 |
|
| Total long-term debt | $ | 5,893 |
| | $ | 11,606 |
|
| Current portion, net of unamortized debt issuance fees | (2,923 | ) | | (5,621 | ) |
| Total long-term debt, less current portion | $ | 2,970 |
| | $ | 5,985 |
|
In January 2016 we adopted guidance which requires that debt issuance costs related to a recognized debt liability to be presented in the balance sheet as a direct deduction from the carrying amount of that debt liability, consistent with debt discounts. As a result, the Company reclassified $0.07 million and $0.09 million of debt issuance cost as of December 31, 2015 into "Current portion of long-term debt" and "Long-term debt", respectively, to reduce the carrying amount of debt liability, from "Other current assets" and "Other non-current assets" on the Consolidated Balance Sheets. Debt issuance costs associated with line of credit arrangements remained in the "Other current assets" and "Other non-current assets" on the Consolidated Balance Sheets. Unamortized debt issuance costs of $0.07 million and $0.02 million were recorded as "Current portion of long-term debt" and "Long-term debt" respectively to reduce the carrying amount of debt liability, on the Consolidated Balance Sheets at December 31, 2016. The Company's debt issuance cost amortization was not affected by the adoption of the new guidance.
HARDINGE INC. AND SUBSIDIARIES
NOTES TO CONSOLIDATED FINANCIAL STATEMENTS (Continued)
DECEMBER 31, 2016
The annual maturities of long-term debt for each of the years after December 31, 2016, are as follows (in thousands):
|
| | | | |
| Year | | Amount |
| 2017 | | $ | 2,993 |
|
| 2018 | | 2,993 |
|
| | | $ | 5,986 |
|
In May 2006, Hardinge Taiwan Precision Machinery Limited, an indirectly wholly-owned subsidiary in Taiwan, entered into a mortgage loan with a local bank. The principal amount of the loan was $180.0 million New Taiwanese Dollars ("TWD") ($5.6 million equivalent). The loan, which matured and was paid in full in June 2016, was secured by real property owned and required quarterly principal payment in the amount of TWD 4.5 million ($0.1 million equivalent). The loan interest rate, 1.75% at June 30, 2016 and December 31, 2015, was based on the bank's one year fixed savings rate plus 0.4%. The principal amount outstanding was TWD 9.0 million ($0.3 million equivalent) at December 31, 2015.
In May 2013, the Company and Hardinge Holdings GmbH, a direct wholly-owned subsidiary, entered into a term loan agreement with a bank pursuant to which the bank provided a $23.0 million secured term loan facility for the acquisition of Forkardt. The agreement, which was amended in October 2013 and matures in April 2018, calls for scheduled annual principal repayments of $2.1 million and $1.0 million in 2017 and 2018, respectively. The interest rate on the term loan is determined from a pricing grid with the London Interbank Offered Rate ("LIBOR") and base rate options based on the Company's leverage ratio and was 2.81% and 2.50% at December 31, 2016 and 2015 respectively. LIBOR is the average interest rate estimated by leading banks in London that they would be charged when borrowing from other banks. The principal amount outstanding at December 31, 2016 and 2015 was $3.1 million and $5.1 million, respectively.
In November 2013, the Company and Hardinge Holdings GmbH entered into a replacement term loan agreement with the same bank pursuant to which the bank converted $10.8 million of the then outstanding principal on the term loan to CHF 3.8 million ($3.7 million equivalent) and EUR 5.0 million ($5.3 million equivalent) borrowings. The agreement calls for scheduled annual principal repayments in CHF and EUR. The CHF principal balance outstanding at December 31, 2015 was CHF 0.6 million ($0.6 million historic equivalent) and was paid in full in November 2016. The scheduled annual principal repayments in EUR are EUR 0.9 million ($0.9 million equivalent) in 2017 and EUR 1.9 million ($2.0 million equivalent) in 2018. The interest rate on the EUR portion of the term loan is determined with a pricing grid with the Euro Interbank Offered Rate ("EURIBOR") and base rate options based on the Company's leverage ratio and was 1.88% and 2.18% at December 31, 2016 and December 31, 2015, respectively. The principal amounts outstanding were EUR $2.8 million ($2.9 million equivalent) and EUR $3.7 million ($4.0 million equivalent) at December 31, 2016 and 2015, respectively.
The term loan is secured by (i) liens on all of the Company's U.S. assets (exclusive of real property); (ii) a pledge of 65% of the Company's investment in Hardinge Holdings GmbH; (iii) a negative pledge on the Company's headquarters in Elmira, New York; (iv) liens on all of the personal property assets of Hardinge Grinding Group (formerly Usach), Forkardt Inc. (formerly Cherry Acquisition Corporation) and Hardinge Technology Systems Inc., a wholly-owned subsidiary and owner of the real property comprising the Company's world headquarters in Elmira, New York ("Technology"); and (v) negative pledges on the intellectual property of the Revolving Credit Borrowers and Technology.
The loan agreement contains financial covenants requiring a minimum fixed charge coverage ratio of not less than 1.15 to 1.00 (tested quarterly on a rolling four-quarter basis), a maximum consolidated total leverage ratio of 3.00 to 1.00 (tested quarterly on a rolling four-quarter basis), and maximum annual consolidated capital expenditures of $10.0 million. The loan agreement also contains such other representations, affirmative and negative covenants, prepayment provisions and events of default that are customary for these types of transactions. At December 31, 2016, the Company was in compliance with the covenants under the loan agreement.
In July 2013, Hardinge Holdings GmbH, a direct wholly-owned subsidiary, and Kellenberger & Co. AG, an indirect wholly-owned subsidiary of the Company, entered into a credit facility agreement with a bank whereby the bank made available a CHF 2.6 million ($2.6 million equivalent) mortgage loan facility. Interest on the facility accrued at a fixed rate of 2.50% per annum. The remaining outstanding balance of principal and accrued interest was paid in full at the final maturity in December 2016. The principal amount outstanding was CHF 1.8 million ($1.8 million equivalent) at December 31, 2015.
HARDINGE INC. AND SUBSIDIARIES
NOTES TO CONSOLIDATED FINANCIAL STATEMENTS (Continued)
DECEMBER 31, 2016
Foreign Credit Facilities
In December 2012, Hardinge Jiaxing entered into a secured credit facility with a local bank for working capital purposes, which was subsequently amended in December 2015. The total availability under the facility is CNY 20.0 million ($2.9 million equivalent) or its equivalent in other currencies. The facility renews annually and currently expires in December 2017. Borrowings under the credit facility are secured by real property owned by the subsidiary. The interest rate on the credit facility is based on the basic interest rate as published by the People's Bank of China, plus a 10% mark-up, amounting to 4.79% at December 31, 2016 and December 31, 2015. There was no principal amount outstanding under this facility at December 31, 2016 or December 31, 2015.
In July 2013, Hardinge Machine Tools B.V., Taiwan Branch, an indirectly wholly-owned subsidiary in Taiwan, entered into an unsecured credit facility subject to annual renewal. The facility, which expires in June 2017, provides up to $12.0 million, or its equivalent in other currencies, for working capital and export business purposes. This credit facility's interest rate is subject to change by the lender based on market conditions, and carries no commitment fees on unused funds. The facility's interest rate was 1.40% at December 31, 2016 and was a variable rate at December 31, 2015. The principal amount outstanding at December 31, 2016 was NTD 22.0 million ($0.7 million equivalent). There were no principal amounts outstanding under this facility at December 31, 2015.
In September 2014, Hardinge Machine (Shanghai) Co., Ltd., an indirectly wholly-owned subsidiary in China, entered into a credit facility with a bank, subject to annual renewal. The facility provides up to CNY 30.0 million ($4.3 million equivalent) for letters of guarantee, and expires in August 2017. Individual letters of guarantee issued under this facility require a cash deposit at the bank of 30% of the letter’s face value. The total issued letters of guarantee at both December 31, 2016 and December 31, 2015 had a face value of CNY 0.6 million (approximately $0.1 million).
In July 2013, Hardinge Holdings GmbH, a direct wholly-owned subsidiary, and Kellenberger, an indirect wholly-owned subsidiary, entered into a credit facility agreement with a bank whereby the bank made available a CHF 18.0 million ($17.7 million equivalent) multi-currency revolving working capital facility. This facility matures in July 2018.
The facility is to be used by Hardinge Holdings GmbH and its subsidiaries (collectively the "Holdings Group") for general corporate and working capital purposes, including standby letters of credit and standby letters of guarantee. Borrowings against the facility can be drawn upon in Swiss Francs, Euros, British Pounds Sterling and United States Dollars ("Optional Currencies"). Under the terms of the facility, the maximum amount of borrowings available to the Holdings Group on an aggregate basis for working capital purposes shall not exceed CHF 8.0 million ($7.8 million equivalent) or its equivalent in Optional Currencies, as applicable. The interest rate on the borrowings drawn in the form of fixed term advances (excluding Euro-based fixed term advances) is calculated based on the applicable LIBOR. With respect to fixed term advances in Euros, the interest rate on borrowings is calculated based on the applicable EURIBOR, plus an applicable margin, (initially set at 2.25% per annum) that is determined by the bank based on the financial performance of the Holdings Group. This facility also charges a commitment fee on the average unutilized amount of the facility of 30% of the applicable margin. At December 31, 2016 and 2015, there were no outstanding borrowings on this facility. The total issued letters of guarantee on this facility had a face value of $5.0 million and $5.4 million at December 31, 2016 and December 31, 2015, respectively. The letters were issued in various currencies.
The terms of the credit facility contains customary representations, affirmative, negative and financial covenants and events of default. The credit facility is secured by mortgage notes in an aggregate amount of CHF 9.2 million ($9.0 million equivalent) on two buildings owned by Kellenberger. In addition to the mortgage notes provided by Kellenberger, Holdings Group serves as a guarantor with respect to this facility. The facility is also subject to a minimum equity covenant requirement whereby the equity of both the Holdings Group and Kellenberger must be at least 35% of the subsidiary's balance sheet total assets. At December 31, 2016, the Company was in compliance with the covenants under the loan agreement.
Kellenberger also maintains a credit agreement with another bank. This agreement, which was originally entered into in October 2009 was most recently amended in May 2013 and is subject to annual renewal. This agreement provides a credit facility of up to CHF 7.0 million ($6.9 million equivalent) for guarantees, documentary credit and margin cover for foreign exchange trades, of which up to CHF 3.0 million ($2.9 million equivalent) is available for working capital purposes. The facility is secured by the subsidiary's certain real property up to CHF 3.0 million ($2.9 million equivalent). The interest rate,
HARDINGE INC. AND SUBSIDIARIES
NOTES TO CONSOLIDATED FINANCIAL STATEMENTS (Continued)
DECEMBER 31, 2016
currently at LIBOR plus 2.50% for a 90-day borrowing, is determined by the bank based on the prevailing money and capital market conditions and the bank's assessment of the subsidiary. This facility carries no commitment fees on unused funds. At December 31, 2016 and 2015, there were no working capital borrowings outstanding under this facility. The outstanding letters of guarantee on this facility at December 31, 2016 had a face value of CHF $0.2 million ($0.2 million equivalent). There were no issued letters of guarantee at December 31, 2015.
The above credit facility is subject to a minimum equity covenant requirement where the minimum equity for the subsidiary must be at least 35% of its balance sheet total assets. At December 31, 2016, the Company was in compliance with the required covenant.
In October 2015, Hardinge China Limited, an indirectly wholly-owned subsidiary in China, entered into a revised credit facility with a bank, subject to annual renewal. This facility, which provides up to $3.0 million for letters of guarantee, required Hardinge China Limited to maintain net worth of at least CNY 22.0 million ($3.2 million equivalent). The facility was amended in August 2016 to remove the net worth requirement for Hardinge China Limited, and expires in August 2017. The total issued letters of guarantee at December 31, 2016 and December 31, 2015 had a face value of CNY 4.2 million ($0.6 million equivalent) and CNY 6.0 million ($0.9 million equivalent), respectively.
Domestic Credit Facilities
In May 2013, the Company entered into an amended revolving credit facility for $25.0 million with a bank, which includes Hardinge Grinding Group and Forkardt as additional borrowers. The facility matures in April 2018. The interest rate is determined from a pricing grid with LIBOR and base rate options, based on the Company's leverage ratio and was 2.94% and 2.50% at December 31, 2016 and December 31, 2015 respectively.
This credit facility is secured by substantially all of the Company's U.S. assets (exclusive of real property), a negative pledge on its worldwide headquarters in Elmira, NY, and a pledge of 65% of our investment in Hardinge Holdings GmbH. The credit facility is guaranteed by Hardinge Technology Inc., one of the Company's wholly-owned subsidiaries, which is the owner of the real property comprising the Company's world headquarters. The credit facility charges a 0.25% commitment fee on unused funds and does not include any financial covenants. There were no borrowings outstanding under this facility at December 31, 2016 and 2015. Letters of guarantee outstanding under this facility had a face value of $1.1 million and $0.9 million at December 31, 2016 and December 31, 2015, respectively.
The Company has a $3.0 million unsecured short-term line of credit from a bank with an interest rate based on the prime rate with a floor of 5.0% and a ceiling of 16.0%. The agreement is negotiated annually, requires no commitment fee and is payable on demand. Outstanding borrowings on this line of credit were immaterial at December 31, 2016 and there were no outstanding borrowings on this line of credit at December 31, 2015.
The Company maintains a standby letter of credit for potential liabilities pertaining to self-insured workers compensation exposure, which is renewed annually. The amount of the letter of credit was $0.7 million at December 31, 2016 and December 31, 2015. The letter of credit expires in March 2017.
Interest paid in 2016, 2015 and 2014 totaled $0.4 million, $0.3 million and $0.8 million respectively.
NOTE 9. RESTRUCTURING CHARGES
On August 4, 2015, the Company's Board of Directors approved a strategic restructuring program (the "Program") with the goals of streamlining the Company's cost structure, increasing operational efficiencies and improving shareholder returns. This Program consisted of the consolidation of certain facilities and restructuring of certain business units and is expected to generate annual pre-tax savings in the range of approximately $4.5 million. The Program was completed during 2016, with the exception of severance and pension payments which have been fully reserved.
Restructuring charges are included in the "Restructuring charges" line item in the Consolidated Statements of Operations. The table below presents the total costs incurred in connection with the Program, the amount of costs that have
HARDINGE INC. AND SUBSIDIARIES
NOTES TO CONSOLIDATED FINANCIAL STATEMENTS (Continued)
DECEMBER 31, 2016
been recognized during the twelve months ended December 31, 2016 and 2015 and the cumulative costs recognized by the Program (in thousands): |
| | | | | | | | | | | |
| | Cost Recognized for the Year Ended December 31, 2015 | | Cost Recognized for the Year Ended December 31, 2016 | | Total Cumulative Costs |
| MMS Segment: | | | | | |
| Employee termination costs | $ | 255 |
| | $ | — |
| | $ | 255 |
|
| Total MMS Segment | 255 |
| | — |
| | 255 |
|
| ATA Segment: | | | | | |
| Employee termination costs | 3,045 |
| | 269 |
| | 3,314 |
|
| Facility exit costs | — |
| | 134 |
| | 134 |
|
| Other related costs | 258 |
| | 258 |
| | 516 |
|
| Total ATA Segment | 3,303 |
| | 661 |
| | 3,964 |
|
| Total: | | | | | |
| Employee termination costs | 3,300 |
| | 269 |
| | 3,569 |
|
| Facility exit costs | — |
| | 134 |
| | 134 |
|
| Other related costs | 258 |
| | 258 |
| | 516 |
|
| Total Company | $ | 3,558 |
| | $ | 661 |
| | $ | 4,219 |
|
HARDINGE INC. AND SUBSIDIARIES
NOTES TO CONSOLIDATED FINANCIAL STATEMENTS (Continued)
DECEMBER 31, 2016
The amounts accrued associated with the Program are included in "Accrued expenses" and "Pension and postretirement liabilities" in the Consolidated Balance Sheets. A rollforward of the accrued restructuring costs is presented below (in thousands):
|
| | | | | | | | | | | |
| | Segment | | Total |
| | MMS | | ATA | |
| Balance at December 31, 2014 | $ | — |
| | $ | — |
| | $ | — |
|
| Restructuring charges: | | | | | |
| Employee termination costs | 255 |
| | 3,045 |
| | 3,300 |
|
| Other related costs | — |
| | 258 |
| | 258 |
|
| Total restructuring charges | 255 |
| | 3,303 |
| | 3,558 |
|
| | | | | | |
| Cash expenditures | (85 | ) | | (2,036 | ) | | (2,121 | ) |
| Other adjustments to accrual | (3 | ) | | (5 | ) | | (8 | ) |
| Foreign currency translation adjustment | — |
| | (20 | ) | | (20 | ) |
| Balance at December 31, 2015 | $ | 167 |
| | $ | 1,242 |
| | $ | 1,409 |
|
| | | | | | |
| Balance at December 31, 2015 | $ | 167 |
| | $ | 1,242 |
| | $ | 1,409 |
|
| Restructuring charges: | | | | | |
| Employee termination costs | — |
| | 269 |
| | 269 |
|
| Facility exit costs | — |
| | 134 |
| | 134 |
|
| Other related costs | — |
| | 258 |
| | 258 |
|
| Total restructuring charges | $ | — |
| | $ | 661 |
| | $ | 661 |
|
| | | | | | |
| Cash expenditures | (43 | ) | | (1,694 | ) | | (1,737 | ) |
| Other adjustments to accrual | 8 |
| | 7 |
| | 15 |
|
| Foreign currency translation adjustment | — |
| | 38 |
| | 38 |
|
| Balance at December 31, 2016 | $ | 132 |
| | $ | 254 |
| | $ | 386 |
|
| | | | | | |
NOTE 10. WARRANTIES
A reconciliation of the changes in the product warranty accrual, which is included in accrued expenses, is as follows (in thousands):
|
| | | | | | | |
| | December 31, |
| | 2016 | | 2015 |
| Balance at beginning of year | $ | 3,802 |
| | $ | 3,891 |
|
| Warranties issued | 2,117 |
| | 2,863 |
|
| Warranty settlement costs | (2,329 | ) | | (2,741 | ) |
| Changes in accruals for pre-existing warranties | 68 |
| | (157 | ) |
| Currency translation adjustments | (102 | ) | | (54 | ) |
| Balance at end of year | $ | 3,556 |
| | $ | 3,802 |
|
HARDINGE INC. AND SUBSIDIARIES
NOTES TO CONSOLIDATED FINANCIAL STATEMENTS (Continued)
DECEMBER 31, 2016
NOTE 11. INCOME TAXES
The Company's pre-tax income (loss) from continuing operations for domestic and foreign sources is as follows (in thousands):
|
| | | | | | | | | | | |
| | Year Ended December 31, |
| | 2016 | | 2015 | | 2014 |
| Domestic | $ | (359 | ) | | $ | 1,675 |
| | $ | (7,230 | ) |
| Foreign | 3,426 |
| | 2,763 |
| | 6,105 |
|
| Total | $ | 3,067 |
| | $ | 4,438 |
| | $ | (1,125 | ) |
Significant components of income tax expense attributable to continuing operations are as follows (in thousands):
|
| | | | | | | | | | | |
| | Year Ended December 31, |
| | 2016 | | 2015 | | 2014 |
| Current: | |
| | |
| | |
|
| State | $ | (16 | ) | | $ | 9 |
| | $ | 47 |
|
| Foreign | 1,678 |
| | 1,851 |
| | 740 |
|
| Total current | 1,662 |
| | 1,860 |
| | 787 |
|
| Deferred: | |
| | |
| | |
|
| Federal | 158 |
| | 155 |
| | (386 | ) |
| Foreign | 23 |
| | (187 | ) | | 832 |
|
| Total deferred | 181 |
| | (32 | ) | | 446 |
|
| Total income tax expense | $ | 1,843 |
| | $ | 1,828 |
| | $ | 1,233 |
|
The following is a reconciliation of income tax expense computed at the United States statutory rate to amounts shown in the Consolidated Statements of Operations:
|
| | | | | | | | |
| | 2016 | | 2015 | | 2014 |
| Federal income taxes at statutory rate | 35.0 | % | | 35.0 | % | | 35.0 | % |
| Taxes on foreign income which differ from the U.S. statutory rate | (22.1 | ) | | (1.8 | ) | | 13.9 |
|
| Effect of change in the enacted rate | (1.3 | ) | | (2.6 | ) | | — |
|
| Change in valuation allowance | (3.9 | ) | | (2.3 | ) | | 158.4 |
|
| U.S. taxation of international operations | 32.3 |
| | 6.2 |
| | (170.1 | ) |
| Change in estimated liabilities | 9.5 |
| | 1.8 |
| | 26.8 |
|
| Non-deductible items | 10.8 |
| | 4.8 |
| | (170.9 | ) |
| State and local income taxes | (0.1 | ) | | 0.1 |
| | (2.7 | ) |
| | 60.2 | % | | 41.2 | % | | (109.6 | )% |
HARDINGE INC. AND SUBSIDIARIES
NOTES TO CONSOLIDATED FINANCIAL STATEMENTS (Continued)
DECEMBER 31, 2016
Significant components of the Company's deferred tax assets and liabilities are as follows (in thousands):
|
| | | | | | | |
| | December 31, |
| | 2016 | | 2015 |
| Deferred tax assets: | |
| | |
|
| Federal, state, and foreign net operating losses | $ | 20,372 |
| | $ | 18,713 |
|
| Postretirement benefits | 631 |
| | 608 |
|
| Deferred employee benefits | 1,688 |
| | 1,924 |
|
| Accrued pension | 16,410 |
| | 15,738 |
|
| Inventory valuation | 2,766 |
| | 3,067 |
|
| Foreign tax credit carryforwards | 7,693 |
| | 7,847 |
|
| Other | 2,030 |
| | 2,804 |
|
| | $ | 51,590 |
| | $ | 50,701 |
|
| Less valuation allowance | (45,012 | ) | | (43,663 | ) |
| Total deferred tax assets | $ | 6,578 |
| | $ | 7,038 |
|
| | | | |
| Deferred tax liabilities: | |
| | |
|
| Tax over book depreciation | $ | (3,509 | ) | | $ | (3,662 | ) |
| Inventory valuation | (1,995 | ) | | (2,006 | ) |
| Intangible assets | (1,600 | ) | | (1,637 | ) |
| Other | (303 | ) | | (391 | ) |
| Total deferred tax liabilities | (7,407 | ) | | (7,696 | ) |
| Net deferred tax liabilities | $ | (829 | ) | | $ | (658 | ) |
In November 2015, the Financial Accounting Standards Board (“FASB”) issued an accounting standards update with new guidance on simplifying the presentation of deferred income taxes that requires deferred tax assets and liabilities, along with any related valuation allowance, to be classified as non-current on the balance sheet. We adopted the standards update effective December 31, 2016, electing to apply it retrospectively to all periods presented. The below table summarizes the adjustments made to conform prior period classification with the new guidance (in thousands):
|
| | | | | | | | | | | |
| | December 31, 2015 |
| | As Filed | | Reclass | | As Adjusted |
| Deferred tax assets | | | | | |
| Current deferred income tax assets | $ | 2,102 |
| | (2,102 | ) | | — |
|
| Non-current deferred income tax assets | 525 |
| | 1,905 |
| | 2,430 |
|
| Total deferred income tax assets | $ | 2,627 |
| | $ | (197 | ) | | $ | 2,430 |
|
| Deferred tax liabilities | | | | | |
| Current deferred income tax liabilities | (2,164 | ) | | 2,164 |
| | — |
|
| Non-current deferred income tax liabilities | (1,121 | ) | | (1,967 | ) | | (3,088 | ) |
| Total deferred income tax liabilities | $ | (3,285 | ) | | $ | 197 |
| | $ | (3,088 | ) |
| | | | | | |
| Net deferred tax assets and liabilities | $ | (658 | ) | | $ | — |
| | $ | (658 | ) |
Non-current deferred tax assets of $3.0 million and $2.4 million for 2016 and 2015, respectively, are reported in "Other non-current assets" in the Consolidated Balance Sheets.
HARDINGE INC. AND SUBSIDIARIES
NOTES TO CONSOLIDATED FINANCIAL STATEMENTS (Continued)
DECEMBER 31, 2016
In 2016, the valuation allowance increased by $1.3 million, of which $0.4 million was due to operational results and $0.9 million of valuation allowance was recorded in other comprehensive income (loss).
In 2015, the valuation allowance decreased by $1.1 million, of which $1.0 million was due to operational results and $0.1 million of valuation allowance was recorded in other comprehensive income (loss).
At December 31, 2016, there were U.S. federal and state net operating loss carryforwards of $23.9 million and $21.6 million, respectively, which expire from 2028 through 2031. If certain substantial changes in the Company's ownership occur, there would be an annual limitation on the amount of the carryforwards that can be utilized. The U.S. net operating loss includes approximately $2.2 million of the net operating loss carryforwards for which a benefit will be recorded in "Additional paid-in capital" in the Consolidated Balance Sheets when realized. There are Foreign Tax Credit Carryforwards of $7.7 million which expire between 2020 and 2025. There also are foreign net operating loss carryforwards of $47.8 million, of which $11.1 million will expire between 2020 through 2036, and of which $36.7 million have no expiration date.
At the end of 2016, the undistributed earnings of the Company's foreign subsidiaries, which amounted to approximately $52.4 million, are considered to be indefinitely reinvested and, accordingly, no provision for taxes has been provided thereon. Given the complexities of the foreign tax credit calculations, it is not practicable to compute the tax liability that would be due upon distribution of those earnings in the form of dividends or liquidation or sale of the foreign subsidiaries.
A reconciliation of the beginning and ending amount of uncertain tax positions is as follows (in thousands):
|
| | | | | | | | | | | |
| | December 31, |
| | 2016 | | 2015 | | 2014 |
| Balance at beginning of year | $ | 2,305 |
| | $ | 2,342 |
| | $ | 2,743 |
|
| Additions for tax positions related to the current year | 302 |
| | 282 |
| | 182 |
|
| Additions for tax positions of prior years | 72 |
| | 263 |
| | 430 |
|
| Reductions for tax positions of prior years | (832 | ) | | — |
| | (393 | ) |
| Reductions due to lapse of applicable statutes of limitation | — |
| | (582 | ) | | (620 | ) |
| Balance at end of year | $ | 1,847 |
| | $ | 2,305 |
| | $ | 2,342 |
|
If recognized, essentially all of the uncertain tax positions and related interest at December 31, 2016 would be recorded as a benefit to income tax expense on the Consolidated Statements of Operations. It is reasonably possible that certain of the uncertain tax positions pertaining to the foreign operations may change within the next 12 months due to audit settlements and statute of limitations expirations. The estimated change in uncertain tax positions for these items is estimated to be up to $1.0 million.
Interest and penalties related to uncertain tax positions are recorded as income tax expense in the Consolidated Statements of Operations. Accrued interest related to the uncertain tax positions was $0.1 million at December 31, 2016 and 2015. There were no accrued penalties related to uncertain tax positions in 2016 and 2015. The accrued interest is reported in other liabilities on the Consolidated Balance Sheets.
The tax years 2013, 2014, 2015 and 2016 remain open to examination by the U.S. federal taxing authorities. The tax years 2011 through 2016 remain open to examination by the U.S. state taxing authorities. For other major jurisdictions (Switzerland, U.K., Taiwan, India, Germany, Netherlands and China); the tax years between 2008 and 2016 generally remain open to routine examination by foreign taxing authorities, depending on the jurisdiction.
Net taxes paid in 2016, 2015 and 2014 totaled $1.7 million, $1.5 million and $1.9 million, respectively.
HARDINGE INC. AND SUBSIDIARIES
NOTES TO CONSOLIDATED FINANCIAL STATEMENTS (Continued)
DECEMBER 31, 2016
NOTE 12. COMMITMENTS AND CONTINGENCIES
The Company is a defendant in various lawsuits as a result of normal operations and in the ordinary course of business. Management believes the outcome of these lawsuits will not have a material effect on the financial position or results of operations.
The Company’s operations are subject to extensive federal, state, local and foreign laws and regulations relating to environmental matters. Certain environmental laws can impose joint and several liability for releases or threatened releases of hazardous substances upon certain statutorily defined parties regardless of fault or the lawfulness of the original activity or disposal. Hazardous substances and adverse environmental effects have been identified with respect to real property owned by the Company, and on adjacent parcels of real property.
In particular, the Elmira, NY manufacturing facility is located within the Kentucky Avenue Wellfield on the National Priorities List of hazardous waste sites designated for cleanup by the United States Environmental Protection Agency (“EPA”) because of groundwater contamination. The Kentucky Avenue Wellfield Site (the “Site”) encompasses an area which includes sections of the Town of Horseheads and the Village of Elmira Heights in Chemung County, NY. In February 2006, the Company received a Special Notice Concerning a Remedial Investigation/Feasibility Study (“RI/FS”) for the Koppers Pond (the “Pond”) portion of the Site. The EPA documented the release and threatened release of hazardous substances into the environment at the Site, including releases into and in the vicinity of the Pond. The hazardous substances, including metals and polychlorinated biphenyls, have been detected in sediments in the Pond.
Until receipt of this Special Notice in February 2006, the Company had never been named as a potentially responsible party (“PRP”) at the Site nor had the Company received any requests for information from the EPA concerning the Site. Environmental sampling on the Company’s property within this Site under supervision of regulatory authorities had identified off-site sources for such groundwater contamination and sediment contamination in the Pond, and found no evidence that the Company’s operations or property have contributed or are contributing to the contamination. All appropriate insurance carriers have been notified, and the Company is actively cooperating with them, but whether coverage will be available has not yet been determined and possible insurance recovery cannot be estimated with any degree of certainty at this time.
A substantial portion of the Pond is located on the Company’s property. The Company, along with Beazer East, Inc., the Village of Horseheads, the Town of Horseheads, the County of Chemung, CBS Corporation and Toshiba America, Inc., (collectively, the "PRP's"), agreed to voluntarily participate in the RI/FS by signing an Administrative Settlement Agreement and Order of Consent on September 29, 2006. On September 29, 2006, the Director of Emergency and Remedial Response Division of the EPA, Region II, approved and executed the Agreement on behalf of the EPA. The PRP's also signed a PRP Member Agreement, agreeing to share the costs associated with the RI/FS study on a per capita basis.
The EPA approved the RI/FS Work Plan in May of 2008. In July of 2012 the PRP's submitted a Remedial Investigation (RI) to respond to EPA issues raised in the initial draft RI. In January 2016, the PRP's submitted a draft Feasibility Study (FS), also to respond to issues raised by the EPA about previous drafts of the FS. In July 2016, the EPA announce its proposed remediation plan based on an alternative put forth in a July 2016 Woodruff & Curran FS with an estimated total clean-up phase cost of $1.9 million. The preferred remedy consists of the placement of a continuous six-inch thick soil and sand cap, including a geotextile membrane to act as a demarcation layer, over Koppers Pond. The preferred remedy includes long-term monitoring and institutional controls. After a public comment period the EPA concluded this RI phase of its process documented in a letter in December 2016.
The company has $0.3 million as of December 31, 2016 as a reserve for its estimated related liability, assuming all of the PRP's would continue to share costs equally in the clean-up phase of the project. Based on our understanding including discussions with our experts, it is possible that the PRP's may change and/or the relative split of costs may be different for this final phase of the project. However, this will not be known for quite some time, and this ongoing estimate of “7 split equally” is viewed as the best possible estimate at the moment. This reserve is reported in Accrued expenses in the Consolidated Balance Sheets.
Based upon information currently available, except as described in the preceding paragraphs, the Company does not have material liabilities for environmental remediation. Though the foregoing reflects the Company’s current assessment as it
HARDINGE INC. AND SUBSIDIARIES
NOTES TO CONSOLIDATED FINANCIAL STATEMENTS (Continued)
DECEMBER 31, 2016
relates to environmental remediation obligations, it is possible that future remedial requirements or changes in the enforcement of existing laws and regulations, which are subject to extensive regulatory discretion, will result in material liabilities to the Company.
The Company had purchase commitments of $23.5 million as of December 31, 2016.
The Company leases space for some of the manufacturing, sales and service operations with remaining lease terms of up to 7 years and use certain office equipment and automobiles under lease agreements expiring at various dates. Rent expense under these leases totaled $3.0 million, $3.3 million and $3.2 million, during the years ended December 31, 2016, 2015, and 2014, respectively.
At December 31, 2016, future minimum payments under non-cancelable operating leases are as follows (in thousands):
|
| | | | |
| Year | | Amount |
| 2017 | | $ | 1,924 |
|
| 2018 | | 1,245 |
|
| 2019 | | 709 |
|
| 2020 | | 85 |
|
| 2021 | | 34 |
|
| Thereafter | | 33 |
|
| Total | | $ | 4,030 |
|
The Company has entered into written employment contracts with its executive officers. The current effective term of the employment agreements is one year and the agreements contain an automatic, successive one year extension unless either party provides the other with two months prior notice of termination. In the case of a change in control, as defined in the employment contracts, the term of each officer's employment will be automatically extended for a period of two years following the date of the change in control. These employment contracts also provide for severance payments in the event of specified termination of employment, the amount of which is increased upon certain termination events to the extent such events occur within twelve months following a change in control.
NOTE 13. SHAREHOLDERS' EQUITY
The Company's common stock has a par value of $0.01 per share. The common stock outstanding activity for each of the years ended December 31, 2016, 2015, and 2014 was as follows (in shares):
|
| | | | | | | | |
| | Common Stock |
| | 2016 | | 2015 | | 2014 |
| Balance at beginning of year | 12,838,227 |
| | 12,821,768 |
| | 12,397,867 |
|
| Shares issued under stock offering program | — |
| | — |
| | 403,863 |
|
| Shares distributed/exercised | 101,759 |
| | 36,464 |
| | 23,738 |
|
| Shares purchased | (45,776 | ) | | (18,605 | ) | | — |
|
| Shares forfeited | (416 | ) | | (1,400 | ) | | (3,700 | ) |
| Balance at end of year | 12,893,794 |
| | 12,838,227 |
| | 12,821,768 |
|
On August 9, 2013, the Company entered into a sales agreement (the “Agreement”) with an independent sales agent (“Agent”), under which the Company could sell shares of its common stock, par value $0.01 per share (the “Shares”), having an aggregate offering price of up to $25.0 million through the Agent. Under the Agreement, the Agent could sell the Shares by methods deemed to be an “at-the-market” offering as defined in Rule 415 promulgated under the Securities Act of 1933, as amended. The Company's Board of Directors authorized this program for a period of one year ending August 8, 2014. As of December 31, 2014, 1,014,252 shares had been sold under the Agreement for aggregated net proceeds of $14.6 million, of
HARDINGE INC. AND SUBSIDIARIES
NOTES TO CONSOLIDATED FINANCIAL STATEMENTS (Continued)
DECEMBER 31, 2016
which 663,276 of the shares sold were issued from treasury. The Registration Statement under which the shares were being offered expired in April 2016.
NOTE 14. EMPLOYEE BENEFITS
Pension and Postretirement Plans
The Company provides a qualified defined benefit pension plan covering all eligible domestic employees hired before March 1, 2004. The plan bases benefits upon both years of service and earnings through June 15, 2009. The policy is to fund at least an amount necessary to satisfy the minimum funding requirements of ERISA. For the foreign plans, contributions are made on a monthly basis and are governed by their governmental regulations. Each foreign plan requires employer contributions. Additionally, one of the Swiss plans requires employee contributions. In 2010, the accrual of benefits under the domestic plan and one of the foreign plans were permanently frozen.
Domestic employees hired on or after March 1, 2004 have retirement benefits under the 401(k) defined contribution plan. After the completion of one year of service, the Company will contribute 4% of an employee's pay and will further match 25% of the first 4% that the employee contributes. For employees participating in the domestic 401(k) plan, the Company made contributions of $1.7 million, $2.0 million, and $1.8 million in 2016, 2015, and 2014, respectively. In conjunction with the permanent freeze of benefit accruals under the domestic defined benefit pension plan, employees that were actively participating in the domestic defined benefit pension plan became eligible to receive company contributions in the 401(k) plan. Additionally, upon reaching age 50, employees who were age 40 or older as of January 1, 2011 and were participants in the domestic defined benefit pension plan are provided enhanced employer contributions in the 401(k) plan to compensate for the loss of future benefit accruals under the defined benefit pension plan. The Company recognized $1.6 million, $2.0 million, and $2.0 million of expense for the domestic defined contribution plan in 2016, 2015, and 2014, respectively. Employees may contribute additional funds to the plan for which there is no required company match. All employer and employee contributions are invested at the direction of the employees in a number of investment alternatives, one being Hardinge Inc. common stock.
In 2016, as a result of a significant lump sum benefit paid out of the Switzerland Kellenberger Stiftung Plan, a $0.6 million settlement charge was recognized as of January 31, 2016 in the 2016 net periodic benefit cost. The annual 2016 net periodic benefit cost for this plan has been re-measured as a result of the settlement. In 2015, as a result of a voluntary early retirement program that provided a temporary enhancement under the qualified domestic pension plan, a $0.2 million special termination benefit was recognized in the net period benefit cost. In 2014, as a result of significant lump sum benefits paid out of the Switzerland Pensionskasse L. Kellenberger Plan, a $0.8 million settlement charge was recognized in the net periodic benefit cost. This was offset by a $0.4 million curtailment gain, which was recognized as a result of a significant portion of the active population terminating employment.
As a result of the acquisition of the Forkardt operations from Illinois Tool Works in May 2013, the benefit obligations of the Forkardt defined benefit and postretirement medical plans were assumed. These obligations included a Termination Indemnity Plan in France and a Postretirement Medical Plan in the U.S.
The Company provides a contributory retiree health plan covering all eligible domestic employees who retire on or after age 65 with at least 10 years of service (the years of service requirement does not apply to individuals hired before 1993). Employees who elect early retirement on or after reaching age 55 are eligible for the medical coverage if they have 15 years of service at retirement. Benefit obligations and funding policies are at the discretion of management. Increases in the cost of the retiree health plan are paid by the participants. The Company also provides a non-contributory life insurance plan to individuals who retire on or after age 65 (or on or after age 55 if they have 15 years of service at retirement). Because the amount of liability relative to this plan is insignificant, it is combined with the health plan for purposes of this disclosure.
The discount rate for determining benefit obligations in the postretirement benefits plans was 4.38% and 4.69% at December 31, 2016 and 2015, respectively. The change in the discount rate increased the accumulated postretirement benefit obligation as of December 31, 2016 by $0.1 million.
A summary of the pension and postretirement benefits plans' funded status and amounts recognized in the Consolidated Balance Sheets is as follows (in thousands):
HARDINGE INC. AND SUBSIDIARIES
NOTES TO CONSOLIDATED FINANCIAL STATEMENTS (Continued)
DECEMBER 31, 2016
|
| | | | | | | | | | | | | | | |
| | Pension Benefits | | Postretirement Benefits |
| | December 31, | | December 31, |
| | 2016 | | 2015 | | 2016 | | 2015 |
Change in benefit obligation : | |
| | |
| | |
| | |
|
| Benefit obligation at beginning of year | $ | 234,350 |
| | $ | 235,433 |
| | $ | 1,683 |
| | $ | 1,806 |
|
| Service cost | 2,178 |
| | 1,953 |
| | 11 |
| | 12 |
|
| Interest cost | 6,624 |
| | 6,676 |
| | 76 |
| | 74 |
|
| Plan participants' contributions | 1,516 |
| | 1,516 |
| | 292 |
| | 338 |
|
| Actuarial loss (gain) | 7,117 |
| | (610 | ) | | 67 |
| | (100 | ) |
| Foreign currency impact | (4,686 | ) | | (2,197 | ) | | — |
| | — |
|
| Benefits and administrative expenses paid | (8,579 | ) | | (8,619 | ) | | (400 | ) | | (447 | ) |
| Settlements | (2,694 | ) | | (37 | ) | | — |
| | — |
|
| Special termination benefits | — |
| | 235 |
| | — |
| | — |
|
| Benefit obligation at end of year | 235,826 |
| | 234,350 |
| | 1,729 |
| | 1,683 |
|
| | | | | | | | |
| Change in plan assets: | |
| | |
| | |
| | |
|
| Fair value of plan assets at beginning of year | 180,007 |
| | 185,981 |
| | — |
| | — |
|
| Actual return on plan assets | 10,347 |
| | (597 | ) | | — |
| | — |
|
| Employer contributions | 4,214 |
| | 3,362 |
| | 108 |
| | 109 |
|
| Plan participants' contributions | 1,516 |
| | 1,516 |
| | 292 |
| | 338 |
|
| Foreign currency impact | (4,063 | ) | | (1,599 | ) | | — |
| | — |
|
| Benefits and administrative expenses paid | (8,579 | ) | | (8,619 | ) | | (400 | ) | | (447 | ) |
| Settlements | (2,694 | ) | | (37 | ) | | — |
| | — |
|
| Fair value of plan assets at end of year | 180,748 |
| | 180,007 |
| | — |
| | — |
|
| Funded status of plans | $ | (55,078 | ) | | $ | (54,343 | ) | | $ | (1,729 | ) | | $ | (1,683 | ) |
| | | | | | | | |
| Amounts recognized in the Consolidated Balance Sheets consist of: | |
| | |
| | |
| | |
|
| Non-current assets | $ | 2,387 |
| | $ | 1,638 |
| | $ | — |
| | $ | — |
|
| Current liabilities | (260 | ) | | (264 | ) | | (126 | ) | | (112 | ) |
| Non-current liabilities | (57,205 | ) | | (55,717 | ) | | (1,603 | ) | | (1,571 | ) |
| Net amount recognized | $ | (55,078 | ) | | $ | (54,343 | ) | | $ | (1,729 | ) | | $ | (1,683 | ) |
| | | | | | | | |
Amounts recognized in Accumulated Other Comprehensive (Loss) consists of: | |
| | |
| | |
| | |
|
| Net actuarial (loss) gain | $ | (80,837 | ) | | $ | (80,641 | ) | | $ | 581 |
| | $ | 706 |
|
| Transition asset | — |
| | 249 |
| | — |
| | — |
|
| Prior service credit | 1,474 |
| | 1,804 |
| | — |
| | — |
|
| Accumulated other comprehensive (loss) income | (79,363 | ) | | (78,588 | ) | | 581 |
| | 706 |
|
| Accumulated contributions in excess (deficit) of net periodic benefit cost | 24,285 |
| | 24,245 |
| | (2,310 | ) | | (2,389 | ) |
| Net deficit recognized in Consolidated Balance Sheets | $ | (55,078 | ) | | $ | (54,343 | ) | | $ | (1,729 | ) | | $ | (1,683 | ) |
HARDINGE INC. AND SUBSIDIARIES
NOTES TO CONSOLIDATED FINANCIAL STATEMENTS (Continued)
DECEMBER 31, 2016
The projected benefit obligations for the foreign pension plans included in the amounts above were $120.2 million and $120.3 million at December 31, 2016 and 2015, respectively. The plan assets for the foreign pension plans included above were $105.1 million and $104.1 million at December 31, 2016 and 2015, respectively.
The accumulated benefit obligations for the foreign and domestic pension plans were $232.5 million and $230.2 million at December 31, 2016 and 2015, respectively.
The following information is presented for pension plans where the projected benefit obligations exceeded the fair value of plan assets (in thousands):
|
| | | | | | | |
| | Pension Benefits |
| | December 31, |
| | 2016 | | 2015 |
| Projected benefit obligations | $ | 230,724 |
| | $ | 226,012 |
|
| Fair value of plan assets | 173,259 |
| | 170,032 |
|
| Excess of projected benefit obligations over plan assets | $ | 57,465 |
| | $ | 55,980 |
|
The following information is presented for pension plans where the accumulated benefit obligations exceeded the fair value of plan assets (in thousands):
|
| | | | | | | |
| | Pension Benefits |
| | December 31, |
| | 2016 | | 2015 |
| Accumulated benefit obligations | $ | 227,145 |
| | $ | 222,173 |
|
| Fair value of plan assets | 172,641 |
| | 170,032 |
|
| Excess of accumulated benefit obligations over plan assets | $ | 54,504 |
| | $ | 52,141 |
|
A summary of the components of net periodic benefit cost for the Company, which includes an executive supplemental pension plan, is presented below (in thousands):
|
| | | | | | | | | | | | | | | | | | | | | | | |
| | Pension Benefits | | Postretirement Benefits |
| | Year Ended December 31, | | Year Ended December 31, |
| | 2016 | | 2015 | | 2014 | | 2016 | | 2015 | | 2014 |
| Service cost | $ | 2,178 |
| | $ | 1,953 |
| | $ | 1,421 |
| | $ | 11 |
| | $ | 12 |
| | $ | 11 |
|
| Interest cost | 6,624 |
| | 6,676 |
| | 8,426 |
| | 76 |
| | 74 |
| | 87 |
|
| Expected return on plan assets | (9,025 | ) | | (9,555 | ) | | (9,892 | ) | | — |
| | — |
| | — |
|
| Amortization of prior service credit | (311 | ) | | (318 | ) | | (399 | ) | | — |
| | — |
| | — |
|
| Amortization of transition asset | (214 | ) | | (258 | ) | | (276 | ) | | — |
| | — |
| | — |
|
| Settlement loss | 633 |
| | 16 |
| | 810 |
| | — |
| | — |
| | — |
|
| Special termination benefits | — |
| | 235 |
| | — |
| | — |
| | — |
| | — |
|
| Curtailment gain | — |
| | — |
| | (409 | ) | | — |
| | — |
| | — |
|
| Amortization of loss (gain) | 3,645 |
| | 3,273 |
| | 1,719 |
| | (58 | ) | | (51 | ) | | (57 | ) |
| Net periodic benefit cost (income) | $ | 3,530 |
| | $ | 2,022 |
| | $ | 1,400 |
| | $ | 29 |
| | $ | 35 |
| | $ | 41 |
|
HARDINGE INC. AND SUBSIDIARIES
NOTES TO CONSOLIDATED FINANCIAL STATEMENTS (Continued)
DECEMBER 31, 2016
A summary of the changes in pension and postretirement benefits recognized in other comprehensive (income) loss is presented below (in thousands):
|
| | | | | | | | | | | | | | | | | | | | | | | |
| | Pension Benefits | | Postretirement Benefits |
| | Year Ended December 31, | | Year Ended December 31, |
| | 2016 | | 2015 | | 2014 | | 2016 | | 2015 | | 2014 |
| Net loss (gain) arising during year | $ | 5,794 |
| | $ | 9,543 |
| | $ | 30,044 |
| | $ | 67 |
| | $ | (100 | ) | | $ | 10 |
|
| Amortization of transition asset | 253 |
| | 258 |
| | 286 |
| | — |
| | — |
| | — |
|
| Amortization of prior service credit | 311 |
| | 318 |
| | 808 |
| | — |
| | — |
| | — |
|
| Other gain | — |
| | — |
| | — |
| | — |
| | — |
| | — |
|
| Amortization of (gain) loss | (4,317 | ) | | (3,289 | ) | | (2,539 | ) | | 58 |
| | 51 |
| | 57 |
|
| Foreign currency exchange impact | (1,267 | ) | | (835 | ) | | (2,503 | ) | | — |
| | — |
| | — |
|
Total recognized in other comprehensive (income) loss | 774 |
| | 5,995 |
| | 26,096 |
| | 125 |
| | (49 | ) | | 67 |
|
Net recognized in net periodic benefit cost and other comprehensive (income) loss | $ | 4,304 |
| | $ | 8,017 |
| | $ | 27,496 |
| | $ | 154 |
| | $ | (14 | ) | | $ | 108 |
|
The net periodic benefit cost for the foreign pension plans included in the amounts above was $2.1 million, $0.6 million, and $0.7 million, for the years ended December 31, 2016, 2015, and 2014, respectively.
The Company expects to recognize $3.7 million of net loss, $0.0 million of net transition assets and $0.3 million of net prior service credit as components of net periodic benefit cost in 2017 for the defined benefit pension plans. The Company expects to recognize $0.04 million of net gain as a component of net periodic benefit cost for the postretirement benefits plans in 2017.
Actuarial assumptions used to determine pension costs and other postretirement benefit costs include:
|
| | | | | | | | | | | | | | | | | |
| | Pension Benefits | | Postretirement Benefits |
| | 2016 | | 2015 | | 2014 | | 2016 | | 2015 | | 2014 |
| Assumptions at January 1 | | | | | | | | | |
| | |
|
| For the domestic plans: | | | | | | | | | |
| | |
|
| Discount rate | 4.75 | % | | 4.28 | % | | 5.24 | % | | 4.69 | % | | 4.23 | % | | 5.13 | % |
| Expected return on plan assets | 7.50 | % | | 7.50 | % | | 7.50 | % | | N/A |
| | N/A |
| | N/A |
|
| For the foreign plans: | |
| | |
| | |
| | |
| | |
| | |
|
| Weighted average discount rate | 1.21 | % | | 1.43 | % | | 2.75 | % | | |
| | |
| | |
|
| Weighted average expected return on plan assets | 3.91 | % | | 3.95 | % | | 3.91 | % | | |
| | |
| | |
|
| Weighted average rate of compensation increase | 1.52 | % | | 1.76 | % | | 1.76 | % | | |
| | |
| | |
|
Actuarial assumptions used to determine pension obligations and other postretirement benefit obligations include:
|
| | | | | | | | | | | |
| | Pension Benefits | | Postretirement Benefits |
| | 2016 | | 2015 | | 2016 | | 2015 |
| Assumptions at December 31 | | | | | | | |
| For the domestic plans: | | | | | | | |
| Discount rate | 4.39 | % | | 4.75 | % | | 4.38 | % | | 4.69 | % |
| For the foreign pension plans: | |
| | |
| | |
| | |
|
| Weighted average discount rate | 0.89 | % | | 1.21 | % | | |
| | |
|
| Weighted average rate of compensation increase | 1.52 | % | | 1.52 | % | | |
| | |
|
HARDINGE INC. AND SUBSIDIARIES
NOTES TO CONSOLIDATED FINANCIAL STATEMENTS (Continued)
DECEMBER 31, 2016
For the domestic and foreign plans (except for the Taiwan plan), discount rates used to determine the benefit obligations are based on the yields on high grade corporate bonds in each market with maturities matching the projected benefit payments. The discount rate for the Taiwan plan is based on the yield on long-dated government bonds plus a spread. To develop the expected long-term rate of return on assets assumption, for the domestic and foreign plans, management considers the current level of expected returns on least risk investments (primarily government bonds) in each market, the historical level of the risk premium associated with the other asset classes in which the portfolio is invested, and the expectations for future returns of each asset class. The expected return for each asset class was then weighted based on the asset allocation to develop the expected long-term rate of return on assets assumption. The market-related value of assets for the U.S. qualified defined benefit pension plan recognizes asset losses and gains over a five-year period, which the Company believes is consistent with the long-term nature of the pension obligations.
Investment Policies and Strategies
For the qualified domestic defined benefit pension plan, the plan targets an asset allocation of approximately 55% equity securities, 36% debt securities and 9% other. For the foreign defined benefit pension plans, the plans target blended asset allocation of 38% equity securities, 44% debt securities and 18% other.
Given the relatively long horizon of the aggregate obligation, the investment strategy is to improve and maintain the funded status of the domestic and foreign plans over time without exposure to excessive asset value volatility. This risk is managed primarily by maintaining actual asset allocations between equity and fixed income securities for the plans within a specified range of its target asset allocation. In addition, the Company ensures that diversification across various investment subcategories within each plan are also maintained within specified ranges.
The domestic and foreign pension assets are managed by outside investment managers and held in trust by third-party custodians. The selection and oversight of these outside service providers is the responsibility of management, investment committees, plan trustees and their advisors. The selection of specific securities is at the discretion of the investment manager and is subject to the provisions set forth by written investment management agreements, related policy guidelines and applicable governmental regulations regarding permissible investments and risk control practices.
Contributions
The Company's funding policy is to contribute to the defined benefit pension plans when pension laws and economics either require or encourage funding. The Company contributions expected to be paid during the year ended December 31, 2017 to the qualified domestic plan are $2.0 million. The Company contributions expected to be paid during the year ending December 31, 2017 to the foreign defined benefit pension plans are $2.3 million. Additionally, one of the Switzerland plans requires employee contributions.
Estimated Future Benefit Payments
The following benefit payments, which reflect expected future service, as appropriate, are expected to be paid (in thousands):
|
| | | | | | | | |
| Year | | Pension Benefits | | Postretirement Benefits |
| 2017 | | $ | 10,349 |
| | $ | 126 |
|
| 2018 | | 10,195 |
| | 127 |
|
| 2019 | | 11,120 |
| | 130 |
|
| 2020 | | 10,892 |
| | 128 |
|
| 2021 | | 11,417 |
| | 128 |
|
| Thereafter | | 59,463 |
| | 529 |
|
HARDINGE INC. AND SUBSIDIARIES
NOTES TO CONSOLIDATED FINANCIAL STATEMENTS (Continued)
DECEMBER 31, 2016
Foreign Operations
The Company has employees in certain foreign countries that are covered by defined contribution retirement plans and other employee benefit plans. Related obligations and costs charged to operations for these plans are not material. The foreign entities with defined benefit pension plans are included in the consolidated pension plans described earlier within this footnote.
NOTE 15. STOCK-BASED COMPENSATION
On May 3, 2011, the Company's shareholders approved the 2011 Incentive Stock Plan (the "Plan"), which was amended on May 6, 2014. The Plan's purpose is to enhance the profitability and value of the Company for the benefit of its shareholders by attracting, retaining, and motivating officers and other key employees who make important contributions to the success of the Company. The Plan initially reserved 750,000 shares of the Company's common stock (as such amount may be adjusted in accordance with the terms of the Plan, the "Authorized Plan Amount") to be issued for grants of several different types of incentives including incentive stock options, non-qualified stock options, stock appreciation rights, restricted stock incentives, and performance share incentives. Any shares of common stock granted under options or stock appreciation rights prior to May 6, 2014 shall be counted against the Authorized Plan Amount on a one-for-one basis and any shares of common stock granted as awards other than options or stock appreciation rights shall be counted against the Authorized Plan Amount as two (2) shares of common stock for every one (1) share of common stock subject to such award. On May 6, 2014, the Company's Board of Directors approved an amendment to the plan to (a) increase the number of shares available for the plan to 1,500,000, and (b) change the ratio of shares of common stock granted as awards other than options or stock appreciation rights to be counted against the Authorized Plan Amount as 1.75 shares of common stock for every one (1) share of common stock subject to such award. Authorized and issued shares of common stock or previously issued shares of common stock purchased by the Company for purposes of the Plan may be issued under the Plan.
Stock-based compensation to employees is recorded in "Selling, general and administrative expenses" in the Consolidated Statements of Operations based on the fair value at the grant date of the award. These non-cash compensation costs were included in the "Depreciation and amortization" amounts in the Consolidated Statements of Cash Flows.
A summary of stock-based compensation expense is as follows (in thousands):
|
| | | | | | | | | | | |
| | Year Ended December 31, |
| | 2016 | | 2015 | | 2014 |
| Restricted stock/unit awards | $ | 244 |
| | $ | 322 |
| | $ | 409 |
|
| Performance share incentives | — |
| | (608 | ) | | (80 | ) |
| Total stock-based compensation expense | $ | 244 |
| | $ | (286 | ) | | $ | 329 |
|
Restricted stock/unit awards, performance share incentives and stock options are the only award types currently outstanding. Restricted stock/unit awards and performance share incentives are discussed below. Stock option activity is not significant.
Restricted Stock/Unit Awards
Restricted stock/units (the "RSA") are awarded to employees. RSAs vest at the end of the service period and are subject to forfeiture as well as transfer restrictions. During the vesting period, the RSAs are held by the Company and the recipients are entitled to exercise rights pertaining to such shares, including the right to vote such shares. The RSAs are valued based on the closing market price of the Company's common stock on the date of the grant. The deferred compensation is being amortized on a straight-line basis over four years for all outstanding RSAs.
HARDINGE INC. AND SUBSIDIARIES
NOTES TO CONSOLIDATED FINANCIAL STATEMENTS (Continued)
DECEMBER 31, 2016
All outstanding RSAs are unvested. A summary of the RSA activity is as follows (in shares):
|
| | | | | | | | | | | |
| | Year Ended December 31, |
| | 2016 | | 2015 | | 2014 |
| RSAs outstanding at beginning of year | 105,875 |
| | 160,175 |
| | 165,875 |
|
| Awarded | — |
| | — |
| | — |
|
| Vested | (65,052 | ) | | (50,000 | ) | | — |
|
| Canceled or forfeited | (3,323 | ) | | (4,300 | ) | | (5,700 | ) |
| RSAs outstanding at end of year | 37,500 |
| | 105,875 |
| | 160,175 |
|
| | | | | | |
| Unamortized deferred compensation cost (in millions) | $ | 0.1 |
| | $ | 0.3 |
| | $ | 0.7 |
|
Expected weighted-average recognition period for unrecognized compensation cost (in years) | 0.92 |
| | 1.20 |
| | 1.64 |
|
Performance Share Incentives
Performance share incentives ("PSI") are awarded to certain employees. PSIs are expressed as shares of the Company's common stock. They are earned only if the Company meets specific performance targets over the specified performance period. During this period, PSI recipients have no voting rights. When dividends are declared, such dividends are deemed to be paid to the recipients. The Company withholds and accumulates the deemed dividends until such point that the PSIs are earned. If the PSIs are not earned, the accrued dividends are forfeited. The payment of PSIs can be in cash, or in the Company's common stock, or a combination of the two, at the discretion of the Company. The PSIs were first awarded to employees in 2011. The PSIs are valued based on the closing market price of the Company's common stock on the date of the grant. The deferred compensation is being recognized into earnings based on the passage of time and achievement of performance targets.
A summary of the PSI activity is as follows (in shares):
|
| | | | | | | | | | | |
| | Year Ended December 31, |
| | 2016 | | 2015 | | 2014 |
| PSIs outstanding at beginning of year | 105,875 |
| | 105,875 |
| | 105,875 |
|
| Awarded | — |
| | — |
| | — |
|
| Canceled or forfeited | (54,066 | ) | | — |
| | — |
|
| PSIs outstanding at end of year | 51,809 |
| | 105,875 |
| | 105,875 |
|
| | | | | | |
| Unamortized deferred compensation cost (in millions) | $ | 0.6 |
| | $ | 1.2 |
| | $ | 0.6 |
|
Expected weighted-average recognition period for unrecognized compensation cost (in years) | 0.97 |
| | 1.16 |
| | 2.16 |
|
HARDINGE INC. AND SUBSIDIARIES
NOTES TO CONSOLIDATED FINANCIAL STATEMENTS (Continued)
DECEMBER 31, 2016
NOTE 16. CHANGES IN ACCUMULATED OTHER COMPREHENSIVE LOSS
Changes in AOCI by component for 2016, 2015 and 2014 are as follows (in thousands):
|
| | | | | | | | | | | | | | | |
| | Year Ended December 31, 2016 |
| | Foreign
currency
translation
adjustments | | Retirement
plans related
adjustments | | Unrealized gain (loss) on cash flow hedges | | Accumulated other comprehensive loss |
| Beginning balance, net of tax | $ | 20,529 |
| | $ | (69,100 | ) | | $ | (142 | ) | | $ | (48,713 | ) |
| Other comprehensive loss before reclassifications | (4,811 | ) | | (4,594 | ) | | 63 |
| | (9,342 | ) |
| Less loss reclassified from AOCI | — |
| | (3,695 | ) | | (75 | ) | | (3,770 | ) |
| Net other comprehensive loss | (4,811 | ) | | (899 | ) | | 138 |
| | (5,572 | ) |
| Income tax expense (benefit) | 235 |
| | 103 |
| | 33 |
| | 371 |
|
| Ending balance, net of tax | $ | 15,483 |
| | $ | (70,102 | ) | | $ | (37 | ) | | $ | (54,656 | ) |
|
| | | | | | | | | | | | | | | |
| | Year Ended December 31, 2015 |
| | Foreign currency translation adjustments | | Retirement plans related adjustments | | Unrealized gain (loss) on cash flow hedges | | Accumulated other comprehensive loss |
| Beginning balance, net of tax | $ | 25,913 |
| | $ | (64,570 | ) | | $ | (144 | ) | | $ | (38,801 | ) |
| Other comprehensive loss before reclassifications | (4,598 | ) | | (8,607 | ) | | (212 | ) | | (13,417 | ) |
| Less (loss) income reclassified from AOCI | — |
| | (2,662 | ) | | (212 | ) | | (2,874 | ) |
| Net other comprehensive loss | (4,598 | ) | | (5,945 | ) | | — |
| | (10,543 | ) |
| Income tax expense (benefit) | 786 |
| | (1,415 | ) | | (2 | ) | | (631 | ) |
| Ending balance, net of tax | $ | 20,529 |
| | $ | (69,100 | ) | | $ | (142 | ) | | $ | (48,713 | ) |
|
| | | | | | | | | | | | | | | |
| | Year Ended December 31, 2014 |
| | Foreign
currency
translation
adjustments | | Retirement
plans related
adjustments | | Unrealized gain (loss) on cash flow hedges | | Accumulated other comprehensive loss |
| Beginning balance, net of tax | $ | 38,663 |
| | $ | (40,213 | ) | | $ | 131 |
| | $ | (1,419 | ) |
Other comprehensive income before
reclassifications | (11,893 | ) | | (27,551 | ) | | (132 | ) | | (39,576 | ) |
| Less (loss) income reclassified from AOCI | — |
| | (1,388 | ) | | 149 |
| | (1,239 | ) |
| Net other comprehensive income | (11,893 | ) | | (26,163 | ) | | (281 | ) | | (38,337 | ) |
| Income tax expense (benefit) | 857 |
| | (1,806 | ) | | (6 | ) | | (955 | ) |
| Ending balance, net of tax | $ | 25,913 |
| | $ | (64,570 | ) | | $ | (144 | ) | | $ | (38,801 | ) |
HARDINGE INC. AND SUBSIDIARIES
NOTES TO CONSOLIDATED FINANCIAL STATEMENTS (Continued)
DECEMBER 31, 2016
Details about reclassification out of AOCI for the 2016, 2015, and 2014 are as follows (in thousands):
|
| | | | | | | | | | | | | | |
| | | Year Ended December 31, | | Affected line item on the Consolidated Statements of Operations |
| Details of AOCI components | | 2016 | | 2015 | | 2014 | |
| Unrealized (loss) gain on cash flow hedges: | | | | | | | | |
| | | $ | 27 |
| | $ | (120 | ) | | $ | 43 |
| | Sales |
| | | (102 | ) | | (92 | ) | | 106 |
| | Other expense, net |
| | | (75 | ) | | (212 | ) | | 149 |
| | Total before tax |
| | | (16 | ) | | 36 |
| | (8 | ) | | Tax (expense) benefit |
| | | $ | (91 | ) | | $ | (176 | ) | | $ | 141 |
| | Net of tax |
| Retirement plans related adjustments: | | | | | | | | |
| Amortization of prior service credit | | $ | 311 |
| | $ | 318 |
| | $ | 399 |
| | (a) |
| Amortization of transition asset | | 253 |
| | 258 |
| | 276 |
| | (a) |
| Amortization of actuarial loss | | (4,259 | ) | | (3,238 | ) | | (2,063 | ) | | (a) |
| | | (3,695 | ) | | (2,662 | ) | | (1,388 | ) | | Total before tax |
| | | 426 |
| | 187 |
| | 65 |
| | Tax benefit |
| | | $ | (3,269 | ) | | $ | (2,475 | ) | | $ | (1,323 | ) | | Net of tax |
____________________
(a) These AOCI components are included in the computation of net period pension and post retirement costs. See Note 14. "Employee Benefits" for details.
NOTE 17. EARNINGS (LOSS) PER SHARE
Basic earnings (loss) per share is computed using the weighted average number of shares of common stock outstanding during the period. For diluted earnings (loss) per share, the weighted average number of shares includes common stock equivalents related to stock options and restricted stock. The following table presents the basis of the earnings (loss) per share computation (in thousands):
|
| | | | | | | | | | | |
| | Year Ended December 31, |
| | 2016 | | 2015 | | 2014 |
| Numerator for basic and diluted earnings (loss) per share: | | | | | |
| Income (loss) from continuing operations | $ | 1,224 |
| | $ | 2,610 |
| | $ | (2,358 | ) |
| Gain from disposal of discontinued operation, net of tax | — |
| | — |
| | 218 |
|
| Net Income (loss) applicable to common shareholders | $ | 1,224 |
| | $ | 2,610 |
| | $ | (2,140 | ) |
| | | | | | |
| Denominator: | | | | | |
Denominator for basic earnings (loss) per share — weighted average shares | 12,824 |
| | 12,776 |
| | 12,661 |
|
| Assumed exercise of stock options | 20 |
| | 21 |
| | — |
|
| Assumed satisfaction of restricted stock conditions | 65 |
| | 75 |
| | — |
|
Denominator for diluted earnings (loss) per share — adjusted weighted average shares | 12,909 |
| | 12,872 |
| | 12,661 |
|
For the year ended December 31, 2016 there were no shares excluded from the calculation of diluted earnings per share. For the years ended December 31, 2015 and December 31, 2014, there were15,995 and 39,752 shares of certain stock-based compensation awards excluded from the calculation of diluted earnings per share, as they were anti-dilutive.
HARDINGE INC. AND SUBSIDIARIES
NOTES TO CONSOLIDATED FINANCIAL STATEMENTS (Continued)
DECEMBER 31, 2016
NOTE 18. SEGMENT INFORMATION
The Company operates through segments for which separate financial information is available, and for which operating results are evaluated regularly by the Company's chief operating decision maker in determining resource allocation and assessing performance. The two reportable business segments are Metalcutting Machine Solutions ("MMS") and Aftermarket Tooling and Accessories ("ATA").
Metalcutting Machine Solutions (MMS)
This segment includes operations related to grinding, turning, and milling, as discussed below, and related repair parts. The products are considered to be capital goods with sales prices ranging from approximately forty thousand dollars for some high volume products to around two million dollars for some lower volume grinding machines or other specialty built turnkey systems of multiple machines. Sales are subject to economic cycles and, because they are most often purchased to add manufacturing capacity, the cycles can be severe with customers delaying purchases during down cycles and then aggressively requiring machine deliveries during up cycles. Machines are purchased to a lesser extent during down cycles as customers seek productivity improvements or they have new products that require new machining capabilities.
The Company engineers and sells high precision computer controlled metalcutting turning machines, vertical machining centers, horizontal machining centers, grinding machines, and repair parts related to those machines.
Turning Machines or lathes are power-driven machines used to remove material from either bar stock or a rough-formed part by moving multiple cutting tools against the surface of a part rotating at very high speeds in a spindle mechanism. The multi-directional movement of the cutting tools allows the part to be shaped to the desired dimensions. On parts produced by Hardinge machines, those dimensions are often measured in millionths of an inch. Management considers Hardinge to be a leader in the field of producing machines capable of consistently and cost-effectively producing parts to very close dimensions.
Machining centers are designed to remove material from stationary, prismatic or box-like parts of various shapes with rotating tools that are capable of milling, drilling, tapping, reaming and routing. Machining centers have mechanisms that automatically change tools based on commands from an integrated computer control without operator assistance. Machining centers are generally purchased by the same customers who purchase other Hardinge equipment. The Company supplies a broad line of machining centers under the Bridgeport brand name addressing a range of sizes, speeds, and powers.
Grinding machines are used in a machining process in which a part's surface is shaped to closer tolerances with a rotating abrasive wheel or tool. Grinding machines can be used to finish parts of various shapes and sizes. The Kellenberger and Usach grinding machines are used to grind the inside and outside diameters of cylindrical parts. Such grinding machines are typically used to provide a more exact finish on a part that has been partially completed on a lathe. The Hauser jig grinding machines are used to make demanding contour components, primarily for tool and mold-making applications. The Jones & Shipman brand is a line of high quality grinder (surface, creepfeed, and cylindrical) machines used by a wide range of industries. Voumard machines are high quality internal diameter cylindrical grinding systems.
Aftermarket Tooling and Accessories (ATA)
This segment includes products that are purchased by manufacturers throughout the lives of their machines. The prices of units are relatively low per piece with prices ranging from forty dollars on high volume collets to two hundred thousand dollars or more for specialty chucks, and they typically are considered to be a fairly consumable, but durable, product. The Company's products are used on all types and brands of machine tools, not limited to Hardinge Brand machines. Sales levels are affected by manufacturing cycles, but not as severely as capital goods lines. While customers may not purchase large dollar machines during a down cycle, their factories are operating with their existing equipment and accessories are still needed as they wear out or they are needed for a change in production requirements.
HARDINGE INC. AND SUBSIDIARIES
NOTES TO CONSOLIDATED FINANCIAL STATEMENTS (Continued)
DECEMBER 31, 2016
The two primary product groups are collets and chucks. Collets are cone-shaped metal sleeves used for holding circular or rod like pieces in a lathe or other machine that provide effective part holding and accurate part location during machining operations. Chucks are a specialized clamping device used to hold an object with radial symmetry, especially a cylindrical object. A chuck is most commonly used to hold a rotating tool or a rotating work piece. Some of the specialty chucks can also hold irregularly shaped objects that lack radial symmetry. While the Company's products are known for accuracy and durability, they are consumable in nature.
Segment income is measured for internal reporting purposes by excluding corporate expenses, acquisition related charges, impairment charges, interest income, interest expense, and income taxes. Corporate expenses consist primarily of executive employment costs, certain professional fees, and costs associated with the Company’s global headquarters. Financial results for each reportable segment are as follows (in thousands):
|
| | | | | | | | | | | | | | | |
| | Year Ended December 31, 2016 |
| | MMS | | ATA | | Inter-Segment Eliminations | | Total |
| Sales | $ | 230,705 |
| | $ | 61,647 |
| | $ | (339 | ) | | $ | 292,013 |
|
| Depreciation and amortization | 5,764 |
| | 2,055 |
| | |
| | 7,819 |
|
| Segment income | 3,060 |
| | 6,910 |
| | |
| | 9,970 |
|
| Capital expenditures | 1,943 |
| | 536 |
| | |
| | 2,479 |
|
Segment assets(1) | 219,503 |
| | 45,776 |
| | |
| | 265,279 |
|
|
| | | | | | | | | | | | | | | |
| | Year Ended December 31, 2015 |
| | MMS | | ATA | | Inter-Segment Eliminations | | Total |
| Sales | $ | 250,854 |
| | $ | 65,128 |
| | $ | (733 | ) | | $ | 315,249 |
|
| Depreciation and amortization | 6,497 |
| | 2,285 |
| | |
| | 8,782 |
|
| Segment income | 7,365 |
| | 3,372 |
| | |
| | 10,737 |
|
| Capital expenditures | 3,186 |
| | 1,009 |
| | |
| | 4,195 |
|
Segment assets(1) | 226,265 |
| | 48,069 |
| | |
| | 274,334 |
|
|
| | | | | | | | | | | | | | | |
| | Year Ended December 31, 2014 |
| | MMS | | ATA | | Inter-Segment Eliminations | | Total |
| Sales | $ | 243,199 |
| | $ | 68,788 |
| | $ | (354 | ) | | $ | 311,633 |
|
| Depreciation and amortization | 6,952 |
| | 2,545 |
| | |
| | 9,497 |
|
| Segment income | 3,950 |
| | 6,708 |
| | |
| | 10,658 |
|
| Capital expenditures | 2,088 |
| | 1,098 |
| | |
| | 3,186 |
|
Segment assets(1) | 241,340 |
| | 49,476 |
| | |
| | 290,816 |
|
____________________
| |
(1) | Segment assets primarily consist of restricted cash, accounts receivable, inventories, prepaid and other assets, property, plant and equipment, and intangible assets. Unallocated assets primarily include, cash and cash equivalents, corporate property, plant and equipment, deferred income taxes, and other non-current assets. |
HARDINGE INC. AND SUBSIDIARIES
NOTES TO CONSOLIDATED FINANCIAL STATEMENTS (Continued)
DECEMBER 31, 2016
A reconciliation of segment income to consolidated income (loss) from continuing operations before income taxes for the years ended December 31, 2016, 2015, and 2014 are as follows (in thousands):
|
| | | | | | | | | | | |
| | Year Ended December 31, |
| | 2016 | | 2015 | | 2014 |
| Segment income | $ | 9,970 |
| | $ | 10,737 |
| | $ | 10,658 |
|
| Unallocated corporate expense | (6,575 | ) | | (5,800 | ) | | (5,540 | ) |
| Acquisition related inventory step-up charge | — |
| | — |
| | (86 | ) |
| Acquisition related expenses | — |
| | — |
| | (178 | ) |
| Impairment charges | — |
| | — |
| | (5,766 | ) |
| Interest expense, net | (328 | ) | | (499 | ) | | (678 | ) |
| Other unallocated income | — |
| | — |
| | 465 |
|
| Income (loss) from continuing operations before income taxes | $ | 3,067 |
| | $ | 4,438 |
| | $ | (1,125 | ) |
A reconciliation of segment assets to consolidated total assets follows (in thousands):
|
| | | | | | | | | | | |
| | December 31,
2016 | | December 31,
2015 | | December 31,
2014 |
| Total segment assets | $ | 265,279 |
| | $ | 274,334 |
| | $ | 290,816 |
|
| Unallocated assets | 32,271 |
| | 36,604 |
| | 20,268 |
|
| Total assets | $ | 297,550 |
| | $ | 310,938 |
| | $ | 311,084 |
|
Unallocated assets include cash of $28.3 million, $32.8 million and $16.3 million at December 31, 2016, 2015 and 2014, respectively.
No single customer accounted for more than 5% of the consolidated sales in 2016, 2015 or 2014. Products are sold throughout the world and sales are attributed to countries based on the country where the products are shipped. Information concerning the principal geographic areas is follows (in thousands):
|
| | | | | | | | | | | | | | | | | | | | | | | |
| | 2016 | | 2015 | | 2014 |
| | Sales | | Long-lived Assets (1) | | Sales | | Long-lived Assets (1) | | Sales | | Long-lived Assets (1) |
| North America | |
| | |
| | |
| | |
| | |
| | |
|
| United States | $ | 87,122 |
| | $ | 35,166 |
| | $ | 103,650 |
| | $ | 37,607 |
| | $ | 94,420 |
| | $ | 39,656 |
|
| Other | 5,546 |
| | — |
| | 4,820 |
| | — |
| | 6,474 |
| | — |
|
| Total North America | 92,668 |
| | 35,166 |
| | 108,470 |
| | 37,607 |
| | 100,894 |
| | 39,656 |
|
| Europe | |
| | |
| | |
| | |
| | |
| | |
|
| England | 7,925 |
| | 340 |
| | 12,780 |
| | 555 |
| | 13,848 |
| | 604 |
|
| Germany | 38,573 |
| | 1,333 |
| | 34,830 |
| | 1,388 |
| | 46,543 |
| | 1,741 |
|
| Switzerland | 5,210 |
| | 28,025 |
| | 7,613 |
| | 30,322 |
| | 6,834 |
| | 31,524 |
|
| Other | 39,674 |
| | 79 |
| | 42,046 |
| | 74 |
| | 35,838 |
| | 107 |
|
| Total Europe | 91,382 |
| | 29,777 |
| | 97,269 |
| | 32,339 |
| | 103,063 |
| | 33,976 |
|
| Asia | |
| | |
| | |
| | |
| | |
| | |
|
| China | 94,816 |
| | 9,242 |
| | 92,727 |
| | 10,515 |
| | 88,933 |
| | 11,543 |
|
| Taiwan | 2,957 |
| | 13,534 |
| | 3,772 |
| | 13,453 |
| | 4,296 |
| | 14,603 |
|
| Other | 10,190 |
| | 2,551 |
| | 13,011 |
| | 2,749 |
| | 14,447 |
| | 3,011 |
|
| Total Asia | 107,963 |
| | 25,327 |
| | 109,510 |
| | 26,717 |
| | 107,676 |
| | 29,157 |
|
| Consolidated Total | $ | 292,013 |
| | $ | 90,270 |
| | $ | 315,249 |
| | $ | 96,663 |
| | $ | 311,633 |
| | $ | 102,789 |
|
____________________
| |
(1) | Long-lived assets consist of property, plant and equipment, goodwill, and other intangible assets. |
HARDINGE INC. AND SUBSIDIARIES
NOTES TO CONSOLIDATED FINANCIAL STATEMENTS (Continued)
DECEMBER 31, 2016
NOTE 19. SELECTED QUARTERLY FINANCIAL INFORMATION (UNAUDITED)
Summarized quarterly financial information for 2016 and 2015 is as follows (in thousands, except per share data):
|
| | | | | | | | | | | | | | | |
| | Quarter |
| | First | | Second | | Third | | Fourth |
| 2016 | |
| | |
| | |
| | |
|
| Sales | $ | 67,822 |
| | $ | 70,186 |
| | $ | 67,211 |
| | $ | 86,794 |
|
| Gross profit | 22,744 |
| | 23,553 |
| | 23,151 |
| | 28,079 |
|
| Net (loss) income | (1,245 | ) | | 145 |
| | (1,383 | ) | | 3,707 |
|
| | | | | | | | |
| Per share data: | |
| | |
| | |
| | |
|
Basic (loss) earnings per share (1) | $ | (0.10 | ) | | $ | 0.01 |
| | $ | (0.11 | ) | | $ | 0.29 |
|
Diluted (loss) earnings per share (1) | $ | (0.10 | ) | | $ | 0.01 |
| | $ | (0.11 | ) | | $ | 0.29 |
|
| | | | | | | | |
| Basic weighted average shares outstanding | 12,797 |
|
| 12,812 |
|
| 12,835 |
|
| 12,854 |
|
| Diluted weighted average shares outstanding | 12,797 |
|
| 12,898 |
|
| 12,835 |
|
| 12,922 |
|
|
| | | | | | | | | | | | | | | |
| | Quarter |
| | First | | Second | | Third | | Fourth |
| 2015 | |
| | |
| | |
| | |
|
| Sales | $ | 69,128 |
| | $ | 82,356 |
| | $ | 76,805 |
| | $ | 86,960 |
|
| Gross profit | 21,855 |
| | 26,962 |
| | 25,369 |
| | 30,352 |
|
| Net (loss) income | (1,408 | ) | | 1,586 |
| | (327 | ) | | 2,759 |
|
| | | | | | | | |
| Per share data: | |
| | |
| | |
| | |
|
Basic (loss) earnings per share (1) | $ | (0.11 | ) | | $ | 0.12 |
| | $ | (0.03 | ) | | $ | 0.22 |
|
Diluted (loss) earnings per share (1) | $ | (0.11 | ) | | $ | 0.12 |
| | $ | (0.03 | ) | | $ | 0.21 |
|
| | | | | | | | |
| Basic weighted average shares outstanding | 12,742 |
| | 12,776 |
| | 12,793 |
| | 12,793 |
|
| Diluted weighted average shares outstanding | 12,742 |
| | 12,857 |
| | 12,793 |
| | 12,886 |
|
____________________
| |
(1) | Due to the changes in outstanding shares from quarter to quarter, the total earnings per share of the four quarters may not necessarily equal the earnings per share for the year. |
NOTE 20. NEW ACCOUNTING STANDARDS
In January 2017 the FASB issued Accounting Standards Update ("ASU") No. 2017-01 Business Combinations: Clarifying the Definition of a Business. This guidance revises the definition of a business and may affect acquisitions, disposals, goodwill impairment and consolidation. The new guidance specifies that when substantially all of the fair value of gross assets acquired is concentrated in a single asset (or a group of similar assets), the assets acquired would not represent a business. The changes to the definition of a business in this guidance will likely result in more acquisitions being accounted for as asset acquisitions and would also affect the accounting for disposal transactions. The new guidance is effective in 2018. Early adoption is permitted. The Company is evaluating the impact that this guidance will have on the financial statements.
HARDINGE INC. AND SUBSIDIARIES
NOTES TO CONSOLIDATED FINANCIAL STATEMENTS (Continued)
DECEMBER 31, 2016
In January 2017 the FASB issued ASU No: 2017-04, Intangibles - Goodwill and Other: Simplifying the Accounting for Goodwill Impairment. This guidance simplifies the accounting for goodwill impairment by eliminating the need to determine the fair value of individual assets and liabilities of a reporting unit to measure the goodwill impairment. The revised guidance is effective for calendar year end 2020. The Company is evaluating the impact that this guidance will have on the financial statements.
In October 2016, the FASB issued ASU No. 2016-16, Accounting for Income Taxes: Intra-Entity Asset Transfers of Assets Other than Inventory, which removes the prohibition against the immediate recognition of the current and deferred income tax effects of intra-entity transfers of assets other than inventory. The new guidance is effective in fiscal years beginning after December 15, 2017, including interim periods within those years. The Company is evaluating the impact that this guidance will have on the financial statements.
In August 2016, the FASB issued ASU No. 2016-15, Statement of Cash Flows - a Consensus of the FASB’s Emerging Issues Task Force, which provides guidance intended to reduce diversity in practice in how certain transactions are classified in the statement of cash flows. In November 2016, the FASB issued ASU No. 2016-18, Statement of Cash Flows: Restricted Cash, which specifies that amounts generally described as restricted cash and restricted cash equivalents should be included with cash and cash equivalents when reconciling the beginning of period and end of period total amounts shown on the statement of cash flows. These standards are effective for fiscal years beginning after December 15, 2017, and interim periods within those fiscal years. Early adoption is permitted. The Company is evaluating the impact that this guidance will have on the financial statements.
In March 2016, the FASB issued ASU No. 2016-09, Compensation - Stock Compensation. The guidance simplifies several areas of accounting for share based compensation arrangements, including income tax consequences, classification of awards as either equity or liabilities, and classification on the statement of cash flows. This guidance is expected to impact net income, EPS, and the statement of cash flows. In particular, the tax effects of all stock compensation awards will be included in income. The guidance is effective for public companies in annual periods beginning after December 15, 2016, and interim periods within those years. The Company is evaluating the impact that this guidance will have on the financial statements.
In March 2016 the FASB ASU No. 2016-05, Effect of Derivative Contract Novations on Existing Hedge Accounting Relationships. The new guidance clarifies that a change in counterparty to a derivative contract (i.e. a novation), in and of itself, does not require the dedesignation of a hedging relationship provided that all other hedging criteria continue to be met. This guidance is effective for fiscal years beginning after December 15, 2017 and interim periods within fiscal years beginning after December 15, 2018. The Company does not expect that the adoption of this guidance will have a material impact on the financial statements.
In February 2016, the FASB issued ASU No. 2016-02, Leases, which establishes a comprehensive new lease accounting model. ASU 2016-02 clarifies the definition of a lease, requires a dual approach to lease classification similar to current lease classifications, and requires lessees to recognize leases on the balance sheet as a lease liability with a corresponding right-of-use asset for leases with a lease-term of more than twelve months. This guidance is effective for fiscal years beginning after December 15, 2018, including interim periods within the fiscal year, and requires modified retrospective application. Early adoption is permitted. The Company is evaluating the impact that this guidance will have on the financial statements.
In January 2016, the FASB issued ASU No. 2016-01, Financial Instruments - Overall: Recognition and Measurement of Financial Assets and Financial Liabilities, which amends the guidance on the classification and measurement of financial instruments under the fair value option, as well as the presentation and disclosure requirements for financial instruments. Among other things, the new guidance requires equity investments (except those accounted for under the equity method of accounting, or those that result in consolidation of the investee) to be measured at fair value with changes in fair value recognized in net income. In addition, the guidance requires public companies to use the exit price notion when measuring the fair value of financial instruments for disclosure purposes, to separate presentation of financial assets and financial liabilities by measurement category and form of financial asset, and to eliminate the requirement to disclose the method(s) and significant assumptions used to estimate the fair value of financial instruments measured at amortized cost. The guidance is effective in fiscal years beginning after December 15, 2017, including interim periods within those fiscal years. The Company is evaluating the method to adopt this guidance and its impact on the financial statements and related disclosures.
HARDINGE INC. AND SUBSIDIARIES
NOTES TO CONSOLIDATED FINANCIAL STATEMENTS (Continued)
DECEMBER 31, 2016
In November 2015, the FASB issued ASU No. 2015-17, Balance Sheet Classification of Deferred Taxes. The guidance requires that deferred tax liabilities and assets be classified as noncurrent in a classified statement of financial position. For public business entities, the guidance is effective for financial statements issued for annual periods beginning after December 15, 2016, and interim periods within those annual periods. Earlier application is permitted. The guidance may be applied either prospectively to all deferred tax liabilities and assets or retrospectively to all periods presented. We adopted this guidance in December 2016, electing to apply it retrospectively to all periods presented. As a result, the Company reclassified $2.1 million and $2.2 million from current deferred tax assets and liabilities, respectively, reducing Other current assets and Deferred tax liabilities on the Consolidated Balance Sheets as of December 31, 2015. Non-current deferred tax assets and liabilities increased by $1.9 million and $2.0 million, respectively, resulting in an increase to Other non-current assets and Deferred income taxes on the Consolidate Balance Sheets, as of December 31, 2015.
In July 2015, the FASB issued ASU No. 2015-11, Simplifying the Measurement of Inventory. authoritative guidance on the valuation of inventory. This guidance directs an entity to measure inventory at lower of cost or net realizable value, versus lower of cost or market. This guidance is effective for financial statements issued for fiscal years beginning after December 15, 2016, and all annual and interim periods thereafter. The Company uses estimated net realizable value as an approximation of fair value and therefore does not anticipate any changes to our financial statements as a result of this guidance.
In April 2015, the FASB issued ASU No. 2015-03, Simplifying the Presentation of Debt Issuance Costs. This guidance requires that debt issuance costs related to a recognized debt liability be presented in the balance sheet as a direct deduction from the carrying amount of that debt liability, consistent with debt discounts. In January 2016, the Company adopted the guidance. As a result, the Company reclassified $0.07 million and $0.09 million of debt issuance cost as of December 31, 2015 into Current portion of long-term debt and Long-term debt respectively to reduce the carrying amount of debt liability, from Other current assets and Other non-current assets on the Consolidated Balance Sheets. Unamortized debt issuance costs of $0.07 million and $0.02 million were recorded as Current portion of long-term debt and Long-term debt respectively to reduce the carrying amount of debt liability, on the Consolidated Balance Sheet at December 31, 2016. The Company's debt issuance cost amortization was not affected by the adoption of the new guidance.
In August 2014, the FASB issued ASU No. 2014-15, Disclosure of Uncertainties about an Entity’s Ability to Continue as a Going Concern, which requires management to assess a company’s ability to continue as a going concern and to provide related footnote disclosures in certain circumstances. Under the new standard, disclosures are required when conditions give rise to substantial doubt about a company’s ability to continue as a going concern within one year from the financial statement issuance date. The new standard is effective for annual periods ending after December 15, 2016, and all annual and interim periods thereafter. The adoption of this guidance did not have a material impact on the Company's financial statements.
In May 2014, the FASB issued ASU No. 2014-09, Revenue from Contracts with Customers. establishing a single comprehensive model for entities to use in accounting for revenue arising from contracts with customers. This update provides a five-step analysis in determining when and how revenue is recognized. The new model will require revenue recognition to depict the transfer of promised goods or services to customers in an amount that reflects the consideration a company expects to receive in exchange for those goods or services and will supersede most of the existing revenue recognition guidance, including industry-specific guidance. We have the option of using either a full retrospective or modified approach to adopt this guidance. Between August 2015 and May 2016, the FASB issued four additional updates to 1) ASU No. 2015-14, Deferral of the Effective Date, 2) ASU No. 2016-08, Principal versus Agent Considerations (Reporting Revenue Gross versus Net), 3) ASU No. 2016-10, Identifying Performance Obligations and Licensing, and 4) ASU No. 2016-12, Narrow-Scope Improvements and Practical Expedients to provide further guidance and clarification in accounting for revenue arising from contracts with customers. The new guidance is effective for annual reporting periods beginning after December 15, 2017, and all annual and interim periods thereafter. The Company has not determined the impact this standard may have on the financial statements, nor decided upon the method of adoption. The Company expects to complete a diagnostic assessment and begin developing solutions in the first half of 2017. In the second half of 2017, the Company expects to implement and test any changes in policy, processes, systems and internal controls and compute required transition adjustments and disclosures.
Item 9. Changes in and Disagreements With Accountants on Accounting and Financial Disclosure.
None
Item 9A. Controls and Procedures.
Management's Evaluation of Disclosure Controls and Procedures
Management of the Company, under the supervision and with the participation of the Chief Executive Officer and Chief Financial Officer, carried out an evaluation of the effectiveness of the design and operation of the Company’s disclosure controls and procedures as of December 31, 2016, as defined in Rule 13a-15(e) and 15d-15(e) under the Securities Exchange Act of 1934.
Based upon this evaluation, the Company's Chief Executive Officer and Chief Financial Officer concluded that the Company's disclosure controls and procedures were effective as of December 31, 2016.
Management's Report on Internal Control over Financial Reporting
The management of Hardinge Inc. is responsible for establishing and maintaining adequate internal control over financial reporting, as such term is defined in Exchange Act Rules 13a-15(f) and 15d-15(f). Under the supervision of our Chief Executive Officer and Chief Financial Officer, management conducted an evaluation of the effectiveness of our internal control over financial reporting as of December 31, 2016 based on the framework in Internal Control-Integrated Framework (2013 Framework) issued by the Committee of Sponsoring Organizations of the Treadway Commission (COSO). Based on that evaluation, management has concluded that the Company maintained effective internal control over financial reporting as of December 31, 2016.
Ernst & Young LLP, an independent registered public accounting firm, has audited our consolidated financial statements included in this Annual Report on Form 10-K and, as part of their audit, has issued their attestation report, included herein, on the effectiveness of our internal control over financial reporting as of December 31, 2016.
Changes in Internal Control
There have been no changes in the Company's internal control over financial reporting during the most recent fiscal quarter that have materially affected, or are reasonably likely to materially affect, the Company's internal control over financial reporting.
Report of Independent Registered Public Accounting Firm
The Board of Directors and Shareholders of
Hardinge Inc. and Subsidiaries
We have audited Hardinge Inc. and Subsidiaries' internal control over financial reporting as of December 31, 2016, based on criteria established in Internal Control-Integrated Framework issued by the Committee of Sponsoring Organizations of the Treadway Commission (2013 framework) (the COSO criteria). Hardinge Inc. and Subsidiaries’ management is responsible for maintaining effective internal control over financial reporting, and for its assessment of the effectiveness of internal control over financial reporting included in the accompanying Management’s Report on Internal Control over Financial Reporting. Our responsibility is to express an opinion on the company’s internal control over financial reporting based on our audit.
We conducted our audit in accordance with the standards of the Public Company Accounting Oversight Board (United States). Those standards require that we plan and perform the audit to obtain reasonable assurance about whether effective internal control over financial reporting was maintained in all material respects. Our audit included obtaining an understanding of internal control over financial reporting, assessing the risk that a material weakness exists, testing and evaluating the design and operating effectiveness of internal control based on the assessed risk, and performing such other procedures as we considered necessary in the circumstances. We believe that our audit provides a reasonable basis for our opinion.
A company’s internal control over financial reporting is a process designed to provide reasonable assurance regarding the reliability of financial reporting and the preparation of financial statements for external purposes in accordance with generally accepted accounting principles. A company’s internal control over financial reporting includes those policies and procedures that (1) pertain to the maintenance of records that, in reasonable detail, accurately and fairly reflect the transactions and dispositions of the assets of the company; (2) provide reasonable assurance that transactions are recorded as necessary to permit preparation of financial statements in accordance with generally accepted accounting principles, and that receipts and expenditures of the company are being made only in accordance with authorizations of management and directors of the company; and (3) provide reasonable assurance regarding prevention or timely detection of unauthorized acquisition, use or disposition of the company’s assets that could have a material effect on the financial statements.
Because of its inherent limitations, internal control over financial reporting may not prevent or detect misstatements. Also, projections of any evaluation of effectiveness to future periods are subject to the risk that controls may become inadequate because of changes in conditions, or that the degree of compliance with the policies or procedures may deteriorate.
In our opinion, Hardinge Inc. and Subsidiaries maintained, in all material respects, effective internal control over financial reporting as of December 31, 2016, based on the COSO criteria.
We also have audited, in accordance with the standards of the Public Company Accounting Oversight Board (United States), the consolidated balance sheets of Hardinge Inc. and Subsidiaries as of December 31, 2016 and 2015 and the related consolidated statements of operations, comprehensive (loss) income, shareholders' equity, and cash flows for each of the three years in the period ended December 31, 2016 of Hardinge Inc. and Subsidiaries and our report dated March 3, 2017 expressed an unqualified opinion thereon.
/s/ Ernst & Young LLP
Buffalo, New York
March 3, 2017
Item 9B. Other Information.
On February 27, 2017, the Board of Directors (the “Board”) of Hardinge Inc. (“Hardinge” or the “Company”) approved amendments to certain provisions in three different sections of the Company’s By-Laws: (i) Article II, Section 14, (ii) Article III, Section 4 and (iii) Article III, Section 6 (collectively, the “By-Laws Amendments”). The summary of the By-Laws Amendments set forth below is qualified in its entirety by reference to the full text of the Company’s By-Laws (which is marked to reflect the corresponding additions and deletions associated with each of the By-Law Amendments), attached as Exhibit 3.3, and is incorporated by reference into this Item 9B.
Article II, Section 14
Prior to the approval of the By-Law Amendments, this section provided that in order for a shareholder to be entitled to submit a proposal to a meeting of shareholders, the shareholder must be a record or beneficial holder of at least 1% or $1,000 in market value of the shares entitled to be voted at the meeting, and shall have held such shares for at least one year and shall continue to own such shares through the date on which the meeting is held.
Following the approval of the By-Law Amendments, this section was amended to increase the record or beneficial ownership threshold requirement (as measured in terms of market value of the shares entitled to be voted at the meeting) from $1,000 to $2,000.
Article III, Section 4
Article III, Section 4 of the Company’s By-Laws provides that the directors are classified into three classes as nearly equal in the number as possible, with each class holding office for a period expiring at the third annual meeting of shareholders following the first annual meeting of shareholders at which the directors of such class have been elected.
As part of the By-Law Amendments, the Board conditionally approved an amendment to this section which provides that at or after the Company’s 2017 Annual Meeting of Shareholders, (i) each director elected by the shareholders shall be elected to hold office until the next annual meeting of shareholders and until his or her successor has been elected and qualified and (ii) each director elected by the shareholders prior to the Company’s 2017 Annual Meeting of Shareholders shall serve the term for which he or she was elected.
Article III, Section 6
Article III, Section 6 of the Company’s By-Laws provides certain rules associated with assigning directors to the various classes of directors in the case of an increase or decrease in the number of directors. As part of the By-Laws Amendments, the Board conditionally approved an amendment which would eliminate these rules relating to the apportioning directors amongst the various director classes in the case of an increase or decrease in the number of directors.
Conditional Approval of Certain By-Law Amendments
The Board’s approval of the amendments to Article III, Section 4 and Article III, Section 6 of the Company’s By-Laws is conditioned upon the approval by the Company’s shareholders of Proposal 1 at the Company’s 2017 Annual Meeting of Shareholders (which involves the amendment of the Company’s Restated Certificate of Incorporation, as amended, as such proposal is described in the Preliminary Proxy Statement filed by the Company with the Securities and Exchange Commission on February 27, 2017 on Schedule 14A). Accordingly, these amendments to Article III, Section 4 and Article III, Section 6 of the Company’s By-Laws shall not become effective unless and until Proposal 1 is approved by the Company’s shareholders at the Company’s 2017 Annual Meeting of Shareholders.
PART III
Item 10. Directors, Executive Officers and Corporate Governance.
Certain information required by this item such as: the identity of the Board of Directors and those directors determined by the Board to be independent; the members of the Audit Committee, all of whom have been determined by the Board to be independent; the Audit Committee member determined by the Board to be the financial expert; and the Shareholders Nominating Procedures are all incorporated by reference from the Registrant's proxy statement to be filed with the Commission. Additional information required to be furnished by Item 401 of Regulation S-K is as follows:
List of Executive Officers of the Registrant
|
| | | | | | |
| Name | | Age | | Executive Officer Since | | Positions and Offices Held |
| Richard L. Simons | | 61 | | 2008 | | President and Chief Executive Officer since May 2015; Chairman of the Board, President and Chief Executive Officer February 2012 - May 2015; President and Chief Executive Officer May 2008 - January 2012; Senior Vice President and Chief Operating Officer March 2008 - May 2008; Vice President, Controller and Chief Accounting Officer of Carpenter Technology Corporation, July 2005 - February 2008; Executive Vice President of Hardinge Inc., April 2000 - July 2005. Member of the Board of Directors of Hardinge from 2001 - July 2005 and from May 2008 to present. Various other Company positions, 1983 - 2000. |
| Douglas J. Malone | | 52 | | 2013 | | Vice President and Chief Financial Officer since December 2013; Controller and Chief Accounting Officer August 2008 - December 2013; Senior Vice President-Financial Planning and Analysis for Five Star Bank, a subsidiary of Financial Institutions, Inc., 2005 - 2008; Senior Vice President-Finance and Operations for Bath National Bank, a subsidiary of Financial Institutions, Inc., 2002 - 2005. Mr. Malone also served as a Senior Audit Manager and various other positions at KPMG LLP for a period of seven years. |
| James P. Langa | | 58 | | 2009 | | Senior Vice President - Machine Solutions since February 2014; Senior Vice President-Asia Operations May 2011 - February 2014; Vice President-Global Engineering, Quality and Strategic Sourcing September 2008 - April 2011; Vice President/General Manager-North American Operations January, 2008 - September 2008; Vice President/General Manager North American Machine Operations, June 2007 - January 2008; Director, Original Equipment Sales & Marketing for Wellman Products Group (Division of Hawk Corporation) 2006-2007 and Focus Factory Manager for Wellman Products Group, 2005-2006. |
| Urs Baumgartner | | 54 | | 2016 | | Vice President - Grinding since October 2016; CEO, L. Kellenberger & Co. AG Switzerland since August 2015; Director Sales & Marketing, L. Kellenberger & Co. AG August 2007 - July 2015; Sales Director, Schmid AG Switzerland (a producer of wood combustion systems for industrial applications) from November 2004 - July 2007; Area Sales & Product Manager, Müller Martini Bookbinding-Systems AG Switzerland (a producer of print finishing system/installations) from January 1998 - October 2004; Sales Engineer & Project Manager, Siemens Switzerland (travel control & information systems for local public transportation) from May 1995 - December 1997; Project Manager, Support of Mgmt. R&D and Quality Mgmt., Leica AG Switzerland (geodetic measuring, optical systems and special projects) from November 1986 - April 1995.
|
| William Sepanik | | 50 | | 2015 | | Vice President of Workholding since May 2015; Vice President of Forkardt Operations May 2013 - May 2015; Group General Manager of Forkardt International from January 2011 - May 2013 for ITW; General Manager of ITW Workholding, North American Operations, April 2007 - January 2011; Various other positions in ITW Workholding from July 1996 - April 2007; Engineering Manager and various other positions for Hayes Lemmerz and Motor Wheel Corporation from April 1989 - June 1996. |
Code of Ethics
Our Board of Directors adopted the Code of Ethics for the Chief Executive and the Senior Financial Officers and the Code of Conduct for Directors and Executive Officers which supplement the Code of Conduct governing all employees and directors. A copy of all said Codes is available on our website at www.hardinge.com. We will also provide a copy of the said Codes to shareholders upon request. To obtain a copy of one or more of the Codes, please write to Assistant Treasurer, Hardinge Inc., One Hardinge Drive, Elmira, New York 14902. We will disclose future amendments to, or waivers from, the said
Code of Ethics for the Chief Executive and Senior Financial Officers on our website within four business days following the date of such amendment or waiver.
Item 11. Executive Compensation.
The information required by this item is incorporated by reference from the Registrant’s proxy statement that will be filed with the Commission.
Item 12. Security Ownership of Certain Beneficial Owners and Management and Related Stockholder Matters.
The information required by this item is incorporated by reference from the Registrant’s proxy statement that will be filed with the Commission.
Item 13. Certain Relationships and Related Transactions, and Director Independence.
The information required by this item is incorporated by reference from the Registrant’s proxy statement that will be filed with the Commission.
Item 14. Principal Accounting Fees and Services.
The information required by this item is incorporated by reference from the Registrant’s proxy statement that will be filed with the Commission.
PART IV
Item 15. Exhibits, Financial Statement Schedules.
|
| | | | |
| (a) | | (1) | | Financial Statements: The financial statements of the Registrant provided in Item 8. "Financial Statements and Supplementary Data" of this Report are incorporated herein by reference. |
| | | (2) | | Financial Statement Schedules: The financial statement schedules of the Registrant provided in Item 8. "Financial Statements and Supplementary Data" of Form 10-K as filed on March 3, 2017 are incorporated herein by reference. The financial statement schedule required by Regulation S-X (17 CFR 210) is filed as part of this report: |
| | | | | Schedule II-Valuation and Qualifying Accounts |
| | | | | All other schedules are omitted because the conditions requiring their filing do not exist, or because the required information is provided in the Consolidated Financial Statements, including notes thereto. |
| | | (3) | | Exhibits: Exhibits filed as part of this Report: See (b) below. |
| (b) | | | | Exhibits required by Item 601 of Regulation S-K filed as a part of this Report on Form 10-K or incorporated by reference as indicated. |
|
| | | | | | | | |
| | | | | Incorporated by Reference |
| Exhibit No. | | Exhibit Description | | Form | | Exhibit | | Filing Date/ Period End Due |
| 3.1 | | Restated Certificate of Incorporation of Hardinge Inc. | | 10-Q | | 3.1 | | May 8, 2015 |
| 3.2 | | Certificate of Amendment of the Restated Certificate of Incorporation of Hardinge Inc. | | 10-Q | | 3.2 | | May 8, 2015 |
| 3.3 | | Amended and Restated By-laws of Hardinge Inc. | | | | | | |
| 4.1 | | Specimen of certificate for shares of Common Stock, par value $.01 per share of Hardinge Inc. | | 8-A | | 3 | | May 19, 1995 |
| 10.1 | | Amended and Restated Credit Agreement, dated May 9, 2013, by and among M&T Bank, Hardinge Inc., Cherry Acquisition Corporation (n/k/a Forkardt Inc.) and Usach Technologies, Inc. (n/k/a Hardinge Grinding Group) | | 10-Q | | 10.1 | | June 30, 2013 |
| 10.2 | | Replacement Standard LIBOR Grid Note, dated May 9, 2013, issued by Hardinge Inc., Cherry Acquisition Corporation (n/k/a Forkardt Inc.) and Usach Technologies Inc. (n/k/a Hardinge Grinding Group) for the benefit of M&T Bank | | 10-Q | | 10.2 | | June 30, 2013 |
| 10.3 | | General Security Agreement, dated May 9, 2013, by and between Hardinge Inc. and M&T Bank | | 10-Q | | 10.3 | | June 30, 2013 |
| 10.4 | | Schedule Required by Instruction 2 to Item 601 of Regulation S-K | | 10-Q | | 10.4 | | June 30, 2013 |
| 10.5 | | Credit Agreement, dated May 9, 2013, by and between Hardinge Inc., Hardinge Holdings GmbH and M&T Bank | | 10-Q | | 10.5 | | June 30, 2013 |
| 10.6 | | General Security Agreement, dated May 9, 2013, by and between Hardinge Inc. and M&T Bank | | 10-Q | | 10.7 | | June 30, 2013 |
| 10.7 | | Schedule Required by Instruction 2 to Item 601 of Regulation S-K | | 10-Q | | 10.8 | | June 30, 2013 |
| 10.8 | | Agreement between Hardinge Inc. and M&T Bank, dated October 31, 2013 | | 10-K | | 10.9 | | December 31, 2013 |
| 10.9 | | Replacement Term Note, dated November 6, 2013, issued by Hardinge Inc. and Hardinge Holdings GmbH for the benefit of M&T Bank | | 10-K | | 10.10 | | December 31, 2013 |
| 10.10 | | Rate Rider (for Actual Balance Promissory Notes), dated November 6, 2013, issued by Hardinge Inc. and Hardinge Holdings GmbH for the benefit of M&T Bank | | 10-K | | 10.11 | | December 31, 2013 |
| 10.11 | | Credit Facilities Agreement dated July 12, 2013 between Hardinge Holdings GmbH L. Kellenberger & Co. AG and Credit Suisse AG | | 8-K | | 10.1 | | July 18, 2013 |
|
| | | | | | | | |
| | | | | Incorporated by Reference |
| Exhibit No. | | Exhibit Description | | Form | | Exhibit | | Filing Date/ Period End Due |
| 10.12 | | Collateral Agreement dated July 12, 2013 between L. Kellenberger & Co. AG and Credit Suisse AG | | 8-K | | 10.2 | | July 18, 2013 |
| 10.13 | | Collateral Agreement dated July 12, 2013 between L. Kellenberger & Co. AG and Credit Suisse AG | | 8-K | | 10.3 | | July 18, 2013 |
| 10.14 | | Master Credit Agreement dated October 30, 2009 between L. Kellenberger & Co. AG and UBS AG | | 10-K | | 10.14 | | December 31, 2015 |
| 10.15 | | Supplement 2 dated May 3, 2013 to Master Credit Agreement dated October 30, 2009 between L. Kellenberger & Co. AG and UBS AG | | 10-K | | 10.15 | | December 31, 2015 |
| 10.16 | | Credit Agreement dated December 20, 2011 between L. Kellenberger & Co. AG and Credit Suisse AG | | | | | | |
| 10.17 | | General Credit Facility Agreement dated June 12, 2015 between Harding Machine Tools B.V., Taiwan Branch and Mega International Commercial Bank Co. Ltd. | | 10-K | | 10.17 | | December 31, 2015 |
| 10.18 | | Bank Credit Facility dated December 13, 2016 between Hardinge Precision Machinery (Jiaxing) Co. Ltd. and China Construction Bank | | | | | | |
| 10.20 | | Stock Purchase Agreement, dated December 20, 2012, by and among Hardinge Inc., Giacomo Antonini and Bere Antonini | | 10-K | | 2.1 | | December 31, 2012 |
| 10.22 | | Share Purchase Agreement, dated as of December 19, 2013, by and between Hardinge Holdings GmbH and SwissChuck Holding AG | | 8-K | | 2.1 | | December 26, 2013 |
| 10.23 | | Purchase Agreement, dated as of May 9, 2013, by and between Illinois Tool Works, Inc. and Cherry Acquisition Corporation (n/k/a Forkardt Inc.) | | 8-K | | 2.1 | | May 15, 2013 |
| 10.24 | | Asset Purchase Agreement, dated as of September 5, 2014, by and among Peter Wolters GmbH, Lam Research Corporation, Hardinge GmbH, L. Kellenberger & Co., AG and Hardinge Inc. | | 8-K | | 2.1 | | September 26, 2014 |
| 10.25 | | Agreement by and among Hardinge Inc., Privet Fund LP and Privet Fund Management, LLC, dated as of October 14, 2015 | | 8-K | | 10.1 | | October 16, 2015 |
| 10.26 | * | The Hardinge Inc. 2002 Incentive Stock Plan | | 10-K | | 10.24 | | December 31, 2013 |
| 10.27 | * | The Hardinge Inc. Amended Restated 2011 Incentive Stock Plan | | SCH14A | | App. A | | March 28, 2014 |
| 10.28 | * | Hardinge Inc. Amended Cash Incentive Plan | | | | | | |
| 10.29 | * | Employment Agreement between Hardinge Inc. and Richard Simons, dated as of March 7, 2011 | | | | | | |
| 10.30 | * | Amendment No. 1 to Employment Agreement between Hardinge Inc. and Richard Simons, dated as of February 14, 2012 | | | | | | |
| 10.31 | * | Amended and Restated Employment Agreement between Hardinge Inc. and Douglas J. Malone, dated as of December 16, 2013 | | 8-K | | 10.2 | | December 20, 2013 |
| 10.33 | * | Employment Agreement between Hardinge Inc. and James P. Langa, dated as of March 7, 2011 | | | | | | |
| 10.34 | * | Amendment No. 1 to Employment Agreement between Hardinge Inc. and James P. Langa, dated as of February 14, 2012 | | | | | | |
| 10.35 | * | Employment Agreement between Hardinge Inc. and Douglas C. Tifft, dated as of March 7, 2011 | | | | | | |
| 10.36 | * | Amendment No. 1 to Employment Agreement between Hardinge Inc. and Douglas C. Tifft, dated as of February 14, 2012 | | | | | | |
| 10.37 | * | Employment Agreement between Forkardt Inc. and William B. Sepanik, dated as of May 31, 2013 | | 10-K | | 10.34 | | December 31, 2014 |
| 10.39 | * | Hardinge Inc. Amended and Restated Executive Supplemental Pension Plan, effective August 9, 2005 | | 10-K | | 10.31 | | December 31, 2011 |
|
| | | | | | | | |
| | | | | Incorporated by Reference |
| Exhibit No. | | Exhibit Description | | Form | | Exhibit | | Filing Date/ Period End Due |
| 10.40 | * | Hardinge Deferred Compensation Plan for Directors | | 10-K | | 10.4 | | December 31, 2015 |
| 10.41 | * | Employment Agreement between Hardinge Inc. and Urs Baumgartner, dated October 28, 2016 | | 10-Q | | 10.1 | | September 30, 2016 |
| 10.42 | * | Hardinge Inc Non-Qualified Deferred Compensation Plan | | | | | | |
| 21 | | Subsidiaries of the Company | | | | | | |
| 23 | | Consent of Ernst & Young LLP, Independent Registered Accounting Firm | | | | | | |
| 31.1 | | Chief Executive Officer Certification pursuant to Rule 13a-15(e) and 15d-15(e), as adopted pursuant to Section 302 of the Sarbanes-Oxley Act of 2002 | | | | | | |
| 31.2 | | Chief Financial Officer Certification pursuant to Rule 13a-15(e) and 15d-15(e), as adopted pursuant to Section 302 of the Sarbanes-Oxley Act of 2002 | | | | | | |
| 32 | | Certification of Chief Executive Officer and Chief Financial Officer pursuant to 18 U.S.C. Section 1350, as adopted pursuant to Section 906 of the Sarbanes-Oxley Act of 2002. | | | | | | |
| 101 | | XBRL Documents: | | | | | | |
| 101.INS | | XBRL Instance Document | | | | | | |
| 101.SCH | | XBRL Taxonomy Schema Document | | | | | | |
| 101.CAL | | XBRL Taxonomy Extension Calculation Linkbase Document | | | | | | |
| 101.LAB | | XBRL Taxonomy Extension Label Linkbase Document | | | | | | |
| 101.PRE | | XBRL Taxonomy Extension Presentation Linkbase Document | | | | | | |
| 101.DEF | | XBRL Taxonomy Extension Definition Linkbase Document | | | | | | |
| | | | | | | | | |
| * | | Management contract or compensatory plan or arrangement | | | | | | |
HARDINGE INC. AND SUBSIDIARIES
Item 15(a) Schedule II-Valuation and Qualifying Accounts
(in thousands)
|
| | | | | | | | | | | | | | | | | | | | | | | | |
| | Balance at Beginning of Year | | Additions Charged to: | | | | | Currency Translation Adjustments | | Balance at End of Year |
| | | Costs & Expenses | | Other Accounts | | Deductions | | | |
| Year Ended December 31, 2016 | |
| | |
| | |
| | |
| | | | | |
|
| Allowance for bad debts | $ | 873 |
| | $ | 215 |
| | $ | 41 |
| | $ | 280 |
| (1) | | $ | (53 | ) | | $ | 796 |
|
Allowance for excess and obsolete inventory | 22,704 |
| | 3,612 |
| | — |
| | 2,829 |
| | | (531 | ) | | 22,956 |
|
Valuation allowance for deferred taxes | 43,663 |
| | 1,920 |
| | 922 |
| | 562 |
| | | (931 | ) | | 45,012 |
|
| Total | $ | 67,240 |
| | $ | 5,747 |
| | $ | 963 |
| | $ | 3,671 |
| | | $ | (1,515 | ) | | $ | 68,764 |
|
| | | | | | | | | | | | | |
| Year Ended December 31, 2015 | |
| | |
| | |
| | |
| | | | | |
|
| Allowance for bad debts | $ | 1,062 |
| | $ | 135 |
| | $ | — |
| | $ | 271 |
| (1) | | $ | (53 | ) | | $ | 873 |
|
Allowance for excess and obsolete inventory | 21,307 |
| | 3,995 |
| | 314 |
| | 2,521 |
| | | (391 | ) | | 22,704 |
|
Valuation allowance for deferred taxes | 44,789 |
| | 1,711 |
| | — |
| | 2,154 |
| | | (683 | ) | | 43,663 |
|
| Total | $ | 67,158 |
| | $ | 5,841 |
| | $ | 314 |
| | $ | 4,946 |
| | | $ | (1,127 | ) | | $ | 67,240 |
|
| | | | | | | | | | | | | |
| Year Ended December 31, 2014 | |
| | |
| | |
| | |
| | | | | |
|
| Allowance for bad debts | $ | 1,139 |
| | $ | 400 |
| | $ | 4 |
| | $ | 401 |
| (1) | | $ | (80 | ) | | $ | 1,062 |
|
Allowance for excess and obsolete inventory | 22,032 |
| | 3,451 |
| | 16 |
| | 2,533 |
| | | (1,659 | ) | | 21,307 |
|
Valuation allowance for deferred taxes | 49,297 |
| | 609 |
| | 5,626 |
| | 9,923 |
| | | (820 | ) | | 44,789 |
|
| Total | $ | 72,468 |
| | $ | 4,460 |
| | $ | 5,646 |
| | $ | 12,857 |
| | | $ | (2,559 | ) | | $ | 67,158 |
|
____________________
(1) Uncollectable accounts written off, net of recoveries.
SIGNATURES
Pursuant to the requirements of the Section 13 or 15(d) of the Securities Exchange Act of 1934, the registrant has duly caused this report to be signed on its behalf by the undersigned thereunto duly authorized.
|
| | | |
| | | HARDINGE INC. |
| | | Registrant |
| | |
| 3/3/2017 | | By: | /s/ Richard L. Simons |
| Date | | | Richard L. Simons |
| | | | President and Chief Executive Officer |
Pursuant to the requirements of the Securities Exchange Act of 1934, this report has been signed below by the following persons on behalf of the registrant and in the capacities and on the dates indicated.
|
| | | |
| | | HARDINGE INC. |
| | | Registrant |
| | |
| 3/3/2017 | | By: | /s/ Richard L. Simons |
| Date | | | Richard L. Simons |
| | | | President and Chief Executive Officer |
| | | | (Principal Executive Officer) |
| | | | |
| 3/3/2017 | | By: | /s/ Douglas J. Malone |
| Date | | | Douglas J. Malone |
| | | | Vice President and Chief Financial Officer |
| | | | (Principal Financial Officer) |
| | | | |
| 3/3/2017 | | By: | /s/ Robert R. Rogowski |
| Date | | | Robert R. Rogowski |
| | | | Corporate Controller |
| | | | (Principal Accounting Officer) |
| | | | |
| 3/3/2017 | | By: | /s/ Richard R. Burkhart |
| Date | | | Richard R. Burkhart |
| | | | Director |
| | | | |
| 3/3/2017 | | By: | /s/ B. Christopher DiSantis |
| Date | | | B. Christopher DiSantis |
| | | | Director |
| | | | |
| 3/3/2017 | | By: | /s/ J. Philip Hunter |
| Date | | | J. Philip Hunter |
| | | | Director and Secretary |
| | | | |
| 3/3/2017 | | By: | /s/ Ryan Levenson |
| Date | | | Ryan Levenson |
| | | | Director |
| | | | |
|
| | | |
| 3/3/2017 | | By: | /s/ Mitchell I. Quain |
| Date | | | Mitchell I. Quain |
| | | | Director |
| | | | |
| 3/3/2017 | | By: | /s/ Benjamin Rosenzweig |
| | | | Benjamin Rosenzweig |
| | | | Director |
| | | | |
| 3/3/2017 | | By: | /s/ James Silver |
| Date | | | James Silver |
| | | | Director |
| | | | |
| 3/3/2017 | | By: | /s/ R. Tony Tripeny |
| Date | | | R. Tony Tripeny |
| | | | Director |