UNITED STATES
SECURITIES AND EXCHANGE COMMISSION
Washington, D.C. 20549
FORM N-CSR
CERTIFIED SHAREHOLDER REPORT
OF
REGISTERED MANAGEMENT INVESTMENT COMPANIES
Investment Company Act file number: 811-02968-99
| Name of Registrant: | Vanguard Trustees’ Equity Fund |
| Address of Registrant: | P.O. Box 2600 |
| Valley Forge, PA 19482 |
| Name and address of agent for service: | John E. Schadl, Esquire |
| P.O. Box 876 | |
| Valley Forge, PA 19482 |
Registrant’s telephone number, including area code: (610) 669-1000
Date of fiscal year end: October 31
Date of reporting period: November 1, 2023—October 31, 2024
Item 1: Reports to Shareholders.
Emerging Markets Select Stock Fund | |
Commodity Strategy Fund | |
Global Environmental Opportunities Stock Fund | |
Global Environmental Opportunities Stock Fund | |

Vanguard Emerging Markets Select Stock Fund
Investor Shares (VMMSX)
Annual Shareholder Report | October 31, 2024
This annual shareholder report contains important information about Vanguard Emerging Markets Select Stock Fund (the "Fund") for the period of November 1, 2023, to October 31, 2024. You can find additional information about the Fund at https://personal1.vanguard.com/ngf-next-gen-form-webapp/fund-literature. You can also request this information by contacting us at 800-662-7447. The report describes changes to the Fund that occurred during the reporting period.
What were the Fund costs for the last year?
(based on a hypothetical $10,000 investment)
| Share Class Name | Costs of a $10,000 investment | Costs paid as a percentage of a $10,000 investment |
|---|---|---|
| Investor Shares | $83 | 0.75% |
How did the Fund perform during the reporting period?
For the 12 months ended October 31, 2024, the Fund underperformed its benchmark, the FTSE Emerging Index.
Global economic growth appeared relatively stable at around 3% during the period, and U.S. recession fears faded. With inflation continuing to moderate across much of the world, major central banks including the European Central Bank, the Bank of England, and the U.S. Federal Reserve began lowering policy rates. Stocks worldwide posted strong returns.
Emerging stock markets lagged the U.S. market but outpaced developed non-U.S. markets.
On a geographic basis, much of the Fund’s shortfall relative to the benchmark came from above- or out-of-benchmark allocations to stocks in Hong Kong, South Korea, and Brazil, markets that trailed the overall index. On a sector basis, the Fund’s holdings in information technology, energy, and consumer discretionary companies weighed most heavily on relative performance.
In a bull market for stocks, the Fund’s average allocation to cash of almost 5% also hindered relative performance.
How did the Fund perform over the past 10 years?
Keep in mind that the Fund's past performance does not indicate how the Fund will perform in the future. Updated performance information is available on our website at vanguard.com/performance or by calling Vanguard toll-free at 800-662-7447. The graph and returns shown do not reflect taxes that a shareholder would pay on fund distributions or on the sale of fund shares.
Cumulative Performance: October 31, 2014, Through October 31, 2024
Initial investment of $10,000
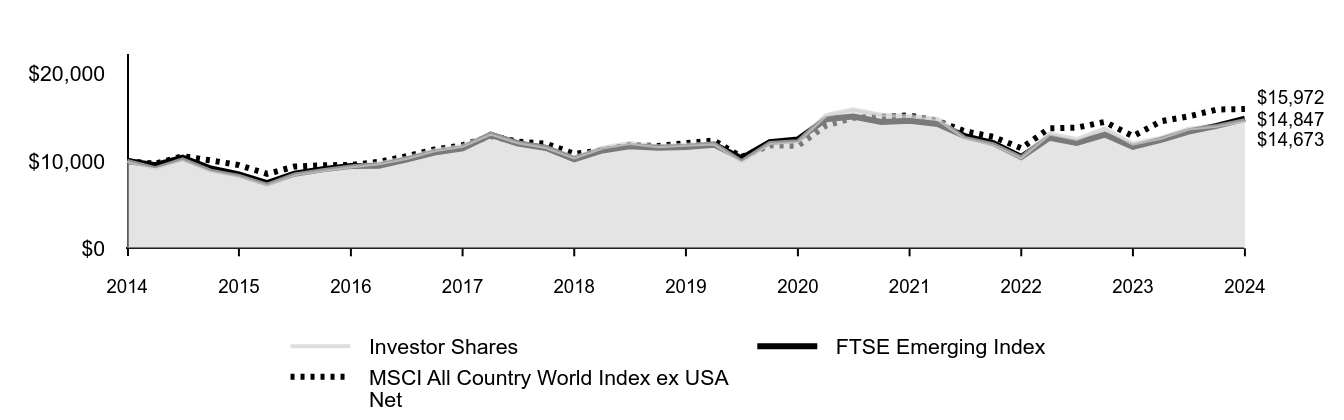
| Investor Shares | FTSE Emerging Index | MSCI All Country World Index ex USA Net | |
|---|---|---|---|
| 2014 | $10,000 | $10,000 | $10,000 |
| 2015 | $9,187 | $9,528 | $9,695 |
| 2015 | $10,185 | $10,398 | $10,556 |
| 2015 | $8,895 | $9,142 | $10,073 |
| 2015 | $8,301 | $8,480 | $9,532 |
| 2016 | $7,303 | $7,470 | $8,536 |
| 2016 | $8,473 | $8,554 | $9,365 |
| 2016 | $8,960 | $9,052 | $9,515 |
| 2016 | $9,376 | $9,435 | $9,553 |
| 2017 | $9,747 | $9,464 | $9,910 |
| 2017 | $10,346 | $10,157 | $10,544 |
| 2017 | $11,241 | $10,967 | $11,323 |
| 2017 | $11,747 | $11,457 | $11,812 |
| 2018 | $13,153 | $13,011 | $12,852 |
| 2018 | $12,143 | $12,015 | $12,222 |
| 2018 | $11,609 | $11,495 | $11,995 |
| 2018 | $10,408 | $10,210 | $10,838 |
| 2019 | $11,541 | $11,213 | $11,235 |
| 2019 | $12,056 | $11,703 | $11,827 |
| 2019 | $11,704 | $11,515 | $11,723 |
| 2019 | $11,861 | $11,605 | $12,059 |
| 2020 | $12,011 | $11,881 | $12,352 |
| 2020 | $9,985 | $10,307 | $10,465 |
| 2020 | $12,072 | $12,166 | $11,800 |
| 2020 | $12,277 | $12,483 | $11,745 |
| 2021 | $15,261 | $14,804 | $14,075 |
| 2021 | $15,938 | $15,112 | $14,963 |
| 2021 | $15,294 | $14,473 | $15,079 |
| 2021 | $15,154 | $14,618 | $15,228 |
| 2022 | $14,822 | $14,251 | $14,585 |
| 2022 | $12,660 | $12,847 | $13,420 |
| 2022 | $11,936 | $12,063 | $12,777 |
| 2022 | $10,433 | $10,473 | $11,463 |
| 2023 | $13,145 | $12,671 | $13,752 |
| 2023 | $12,524 | $12,071 | $13,830 |
| 2023 | $13,735 | $13,033 | $14,491 |
| 2023 | $12,008 | $11,621 | $12,846 |
| 2024 | $12,674 | $12,416 | $14,560 |
| 2024 | $13,718 | $13,384 | $15,119 |
| 2024 | $14,032 | $14,029 | $15,903 |
| 2024 | $14,673 | $14,847 | $15,972 |
Average Annual Total Returns
| 1 Year | 5 Years | 10 Years | |
|---|---|---|---|
| Investor Shares | 22.19% | 4.35% | 3.91% |
| FTSE Emerging Index | 27.76% | 5.05% | 4.03% |
| MSCI All Country World Index ex USA Net | 24.33% | 5.78% | 4.79% |
This table reflects the Fund's investments, including short-term investments, derivatives and other assets and liabilities.
Portfolio Composition % of Net Assets
(as of October 31, 2024)
| Africa | 2.1% |
| Asia | 72.5% |
| Europe | 3.7% |
| North America | 8.6% |
| South America | 9.0% |
| Other Assets and Liabilities—Net | 4.1% |
Fund Statistics
(as of October 31, 2024)
| Fund Net Assets (in millions) | $793 |
| Number of Portfolio Holdings | 243 |
| Portfolio Turnover Rate | 68% |
| Total Investment Advisory Fees (in thousands) | $3,415 |
How has the Fund changed?
During the reporting period, Oaktree Fund Advisors, LLC was removed as an investment advisor to the Fund. Additionally, the Fund added as a principal risk special risks of investing in China.
This is a summary of certain changes to the Fund since October 31, 2023. For more complete information, you may review the Fund’s next prospectus, which we expect to be available by February 28, 2025 at https://personal1.vanguard.com/ngf-next-gen-form-webapp/fund-literature or upon request at 800-662-7447.
Where can I find additional information about the Fund?
Additional information about the Fund, including its prospectus, financial information, holdings, and proxy voting information is available at https://personal1.vanguard.com/ngf-next-gen-form-webapp/fund-literature.

Connect with Vanguard® • vanguard.com
Fund Information • 800-662-7447
Direct Investor Account Services • 800-662-2739
Text Telephone for People Who Are Deaf or Hard of Hearing •
800-749-7273
© 2024 The Vanguard Group, Inc.
All rights reserved.
Vanguard Marketing Corporation, Distributor.
AR752

Vanguard Commodity Strategy Fund
Admiral™ Shares (VCMDX)
Annual Shareholder Report | October 31, 2024
This annual shareholder report contains important information about Vanguard Commodity Strategy Fund (the "Fund") for the period of November 1, 2023, to October 31, 2024. You can find additional information about the Fund at https://personal1.vanguard.com/ngf-next-gen-form-webapp/fund-literature. You can also request this information by contacting us at 800-662-7447.
What were the Fund costs for the last year?
(based on a hypothetical $10,000 investment)
| Share Class Name | Costs of a $10,000 investment | Costs paid as a percentage of a $10,000 investment |
|---|---|---|
| Admiral Shares | $21 | 0.21% |
How did the Fund perform during the reporting period?
For the 12 months ended October 31, 2024, the Fund outperformed its benchmark, the Bloomberg Commodity Index Total Return.
U.S. economic growth hovered around 3% on a year-over-year basis during the period, quelling recession fears. The Federal Reserve embarked on a rate-cutting cycle toward the end of the period, and the year-over-year rate of consumer price inflation eased to around 2.5%. U.S. stocks and bonds posted strong returns.
The Bloomberg Commodity Index posted a slightly negative return for the period with mixed results across commodity groups. Strong performances in precious and industrial metals were offset by negative returns in energy and grains.
The Fund outperformed partly because of its exposure to short-term Treasury Inflation-Protected Securities, which benefited from the Fed beginning to cut interest rates.
The Fund uses derivatives to obtain its exposure to commodities. Its holdings of commodity index swaps also helped returns.
How did the Fund perform since inception?
Keep in mind that the Fund's past performance does not indicate how the Fund will perform in the future. Updated performance information is available on our website at vanguard.com/performance or by calling Vanguard toll-free at 800-662-7447. The graph and returns shown do not reflect taxes that a shareholder would pay on fund distributions or on the sale of fund shares.
Cumulative Performance: June 25, 2019, Through October 31, 2024
Initial investment of $50,000
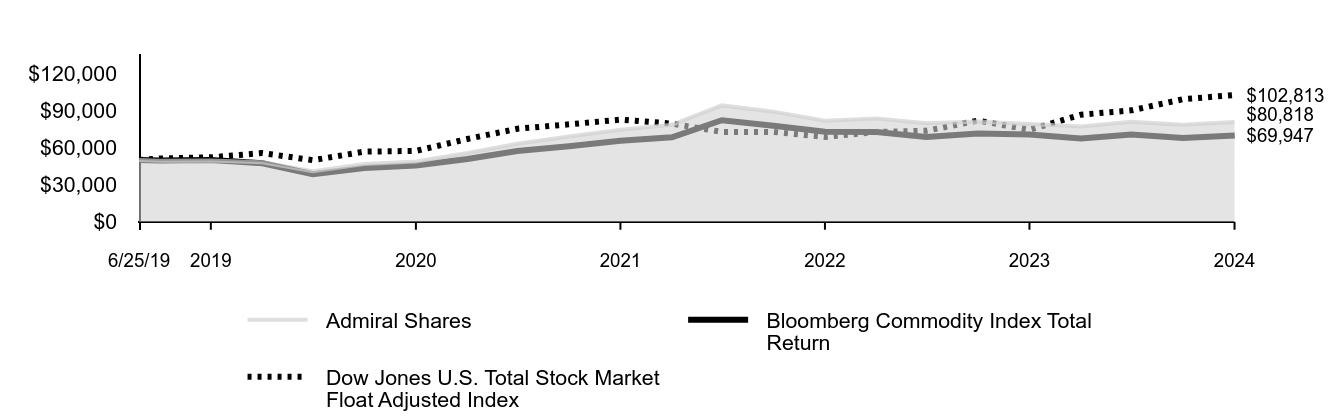
| Admiral Shares | Bloomberg Commodity Index Total Return | Dow Jones U.S. Total Stock Market Float Adjusted Index | |
|---|---|---|---|
| 6/25/19 | $50,000 | $50,000 | $50,000 |
| 7/31/19 | $49,480 | $49,557 | $51,308 |
| 10/31/19 | $49,660 | $49,966 | $52,226 |
| 1/31/20 | $48,173 | $47,379 | $55,694 |
| 4/30/20 | $40,989 | $38,625 | $49,917 |
| 7/31/20 | $46,865 | $43,574 | $56,850 |
| 10/31/20 | $48,937 | $45,595 | $57,442 |
| 1/31/21 | $55,681 | $50,845 | $67,137 |
| 4/30/21 | $63,245 | $57,364 | $75,381 |
| 7/31/21 | $69,151 | $61,124 | $78,978 |
| 10/31/21 | $74,531 | $65,628 | $82,758 |
| 1/31/22 | $78,552 | $68,503 | $79,555 |
| 4/30/22 | $94,337 | $82,337 | $72,846 |
| 7/31/22 | $89,271 | $77,765 | $72,832 |
| 10/31/22 | $81,832 | $72,947 | $68,736 |
| 1/31/23 | $83,774 | $72,751 | $72,858 |
| 4/30/23 | $79,779 | $68,670 | $73,775 |
| 7/31/23 | $81,213 | $71,635 | $82,024 |
| 10/31/23 | $79,352 | $70,780 | $74,505 |
| 1/31/24 | $77,287 | $67,593 | $86,806 |
| 4/30/24 | $80,974 | $70,653 | $90,317 |
| 7/31/24 | $78,662 | $67,930 | $99,335 |
| 10/31/24 | $80,818 | $69,947 | $102,813 |
Average Annual Total Returns
| 1 Year | 5 Years | Since Inception 6/25/19 | |
|---|---|---|---|
| Admiral Shares | 1.85% | 10.23% | 9.39% |
| Bloomberg Commodity Index Total Return | -1.18% | 6.96% | 6.47% |
Dow Jones U.S. Total Stock Market Float Adjusted IndexFootnote Reference* | 37.99% | 14.51% | 14.42% |
| Footnote | Description |
Footnote* | The Fund added a broad-based benchmark to reflect new regulatory requirements. The broad-based benchmark is considered broadly representative of the overall securities market applicable to the Fund. |
This table reflects the Fund's investments, including short-term investments, derivatives and other assets and liabilities.
Portfolio Composition % of Net Assets
(as of October 31, 2024)
| U.S. Government Securities | 97.0% |
Other Assets and Liabilities—NetFootnote Reference | 3.0% |
Fund Statistics
(as of October 31, 2024)
| Fund Net Assets (in millions) | $1,673 |
| Number of Portfolio Holdings | 61 |
| Portfolio Turnover Rate | 52% |
| Total Investment Advisory Fees (in thousands) | $201 |
Where can I find additional information about the Fund?
Additional information about the Fund, including its prospectus, financial information, holdings, and proxy voting information is available at https://personal1.vanguard.com/ngf-next-gen-form-webapp/fund-literature.

Connect with Vanguard® • vanguard.com
Fund Information • 800-662-7447
Direct Investor Account Services • 800-662-2739
Text Telephone for People Who Are Deaf or Hard of Hearing •
800-749-7273
© 2024 The Vanguard Group, Inc.
All rights reserved.
Vanguard Marketing Corporation, Distributor.
AR517

Vanguard Global Environmental Opportunities Stock Fund
Admiral™ Shares (VEOAX)
Annual Shareholder Report | October 31, 2024
This annual shareholder report contains important information about Vanguard Global Environmental Opportunities Stock Fund (the "Fund") for the period of November 1, 2023, to October 31, 2024. You can find additional information about the Fund at https://personal1.vanguard.com/ngf-next-gen-form-webapp/fund-literature. You can also request this information by contacting us at 800-662-7447.
What were the Fund costs for the last year?
(based on a hypothetical $10,000 investment)
| Share Class Name | Costs of a $10,000 investment | Costs paid as a percentage of a $10,000 investment |
|---|---|---|
| Admiral Shares | $65 | 0.58% |
How did the Fund perform during the reporting period?
For the 12 months ended October 31, 2024, the Fund underperformed its benchmark.
Global economic growth appeared relatively stable at around 3% during the period, and U.S. recession fears faded. With inflation continuing to moderate across much of the world, major central banks including the European Central Bank, the Bank of England, and the U.S. Federal Reserve began lowering policy rates. Global stocks posted very strong returns.
An underweight to the U.S. and an overweight to China detracted most from relative performance. An underweight to the Pacific region boosted relative results.
Five of the Fund’s 11 industry sectors detracted, with selection in information technology, industrials, and consumer discretionary holding back results most. On the other side of the ledger, selection in utilities and a lack of exposure to health care, consumer staples, and energy contributed most.
How did the Fund perform since inception?
Keep in mind that the Fund's past performance does not indicate how the Fund will perform in the future. Updated performance information is available on our website at vanguard.com/performance or by calling Vanguard toll-free at 800-662-7447. The graph and returns shown do not reflect taxes that a shareholder would pay on fund distributions or on the sale of fund shares.
Cumulative Performance: November 16, 2022, Through October 31, 2024
Initial investment of $50,000
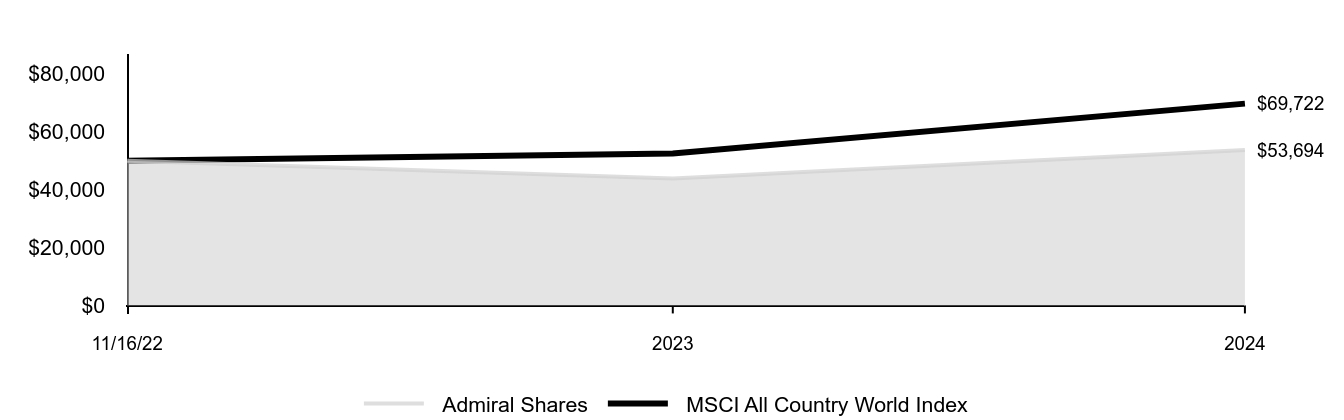
| Admiral Shares | MSCI All Country World Index | |
|---|---|---|
| 11/16/22 | $50,000 | $50,000 |
| 2023 | $43,860 | $52,505 |
| 2024 | $53,694 | $69,722 |
Average Annual Total Returns
| 1 Year | Since Inception 11/16/22 | |
|---|---|---|
| Admiral Shares | 22.42% | 3.71% |
| MSCI All Country World Index | 32.79% | 18.52% |
This table reflects the Fund's investments, including short-term investments and other assets and liabilities.
Portfolio Composition % of Net Assets
(as of October 31, 2024)
| Asia | 23.2% |
| Europe | 33.0% |
| North America | 40.8% |
| Other Assets and Liabilities—Net | 3.0% |
Fund Statistics
(as of October 31, 2024)
| Fund Net Assets (in millions) | $79 |
| Number of Portfolio Holdings | 28 |
| Portfolio Turnover Rate | 38% |
| Total Investment Advisory Fees (in thousands) | $230 |
Where can I find additional information about the Fund?
Additional information about the Fund, including its prospectus, financial information, holdings, and proxy voting information is available at https://personal1.vanguard.com/ngf-next-gen-form-webapp/fund-literature.

Connect with Vanguard® • vanguard.com
Fund Information • 800-662-7447
Direct Investor Account Services • 800-662-2739
Text Telephone for People Who Are Deaf or Hard of Hearing •
800-749-7273
© 2024 The Vanguard Group, Inc.
All rights reserved.
Vanguard Marketing Corporation, Distributor.
ARV013

Vanguard Global Environmental Opportunities Stock Fund
Investor Shares (VEOIX)
Annual Shareholder Report | October 31, 2024
This annual shareholder report contains important information about Vanguard Global Environmental Opportunities Stock Fund (the "Fund") for the period of November 1, 2023, to October 31, 2024. You can find additional information about the Fund at https://personal1.vanguard.com/ngf-next-gen-form-webapp/fund-literature. You can also request this information by contacting us at 800-662-7447.
What were the Fund costs for the last year?
(based on a hypothetical $10,000 investment)
| Share Class Name | Costs of a $10,000 investment | Costs paid as a percentage of a $10,000 investment |
|---|---|---|
| Investor Shares | $81 | 0.73% |
How did the Fund perform during the reporting period?
For the 12 months ended October 31, 2024, the Fund underperformed its benchmark.
Global economic growth appeared relatively stable at around 3% during the period, and U.S. recession fears faded. With inflation continuing to moderate across much of the world, major central banks including the European Central Bank, the Bank of England, and the U.S. Federal Reserve began lowering policy rates. Global stocks posted very strong returns.
An underweight to the U.S. and an overweight to China detracted most from relative performance. An underweight to the Pacific region boosted relative results.
Five of the Fund’s 11 industry sectors detracted, with selection in information technology, industrials, and consumer discretionary holding back results most. On the other side of the ledger, selection in utilities and a lack of exposure to health care, consumer staples, and energy contributed most.
How did the Fund perform since inception?
Keep in mind that the Fund's past performance does not indicate how the Fund will perform in the future. Updated performance information is available on our website at vanguard.com/performance or by calling Vanguard toll-free at 800-662-7447. The graph and returns shown do not reflect taxes that a shareholder would pay on fund distributions or on the sale of fund shares.
Cumulative Performance: November 16, 2022, Through October 31, 2024
Initial investment of $10,000
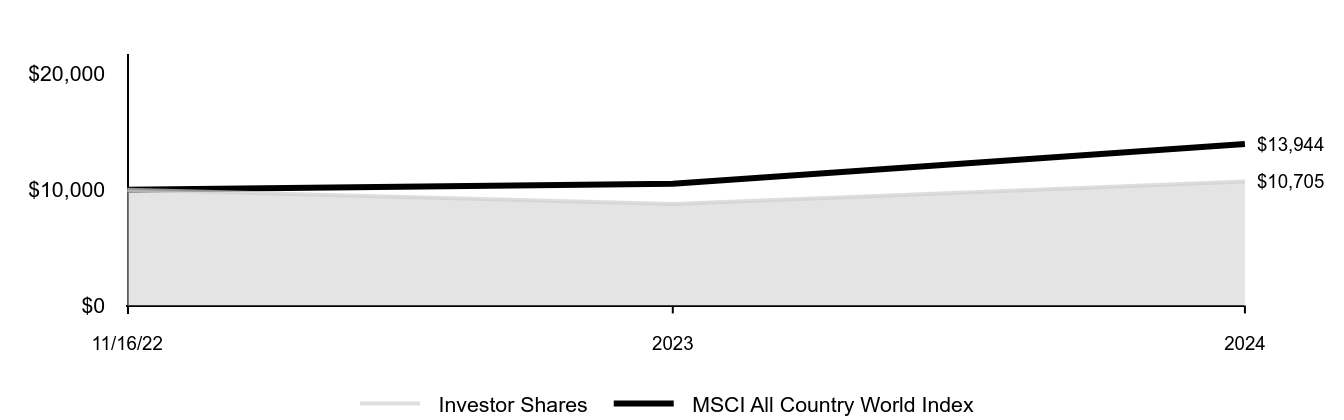
| Investor Shares | MSCI All Country World Index | |
|---|---|---|
| 11/16/22 | $10,000 | $10,000 |
| 2023 | $8,760 | $10,501 |
| 2024 | $10,705 | $13,944 |
Average Annual Total Returns
| 1 Year | Since Inception 11/16/22 | |
|---|---|---|
| Investor Shares | 22.20% | 3.54% |
| MSCI All Country World Index | 32.79% | 18.52% |
This table reflects the Fund's investments, including short-term investments and other assets and liabilities.
Portfolio Composition % of Net Assets
(as of October 31, 2024)
| Asia | 23.2% |
| Europe | 33.0% |
| North America | 40.8% |
| Other Assets and Liabilities—Net | 3.0% |
Fund Statistics
(as of October 31, 2024)
| Fund Net Assets (in millions) | $79 |
| Number of Portfolio Holdings | 28 |
| Portfolio Turnover Rate | 38% |
| Total Investment Advisory Fees (in thousands) | $230 |
Where can I find additional information about the Fund?
Additional information about the Fund, including its prospectus, financial information, holdings, and proxy voting information is available at https://personal1.vanguard.com/ngf-next-gen-form-webapp/fund-literature.

Connect with Vanguard® • vanguard.com
Fund Information • 800-662-7447
Direct Investor Account Services • 800-662-2739
Text Telephone for People Who Are Deaf or Hard of Hearing •
800-749-7273
© 2024 The Vanguard Group, Inc.
All rights reserved.
Vanguard Marketing Corporation, Distributor.
ARV012
Item 2: Code of Ethics.
The Registrant has adopted a code of ethics that applies to the Registrant’s principal executive officer, principal financial officer, principal accounting officer or controller or persons performing similar functions. The Code of Ethics was amended during the reporting period covered by this report to make certain technical, non-material changes.
Item 3: Audit Committee Financial Expert.
All members of the Audit Committee have been determined by the Registrant’s Board of Trustees to be Audit Committee Financial Experts and to be independent: F. Joseph Loughrey, Mark Loughridge, Sarah Bloom Raskin, and Peter F. Volanakis.
Item 4: Principal Accountant Fees and Services.
Includes fees billed in connection with services to the Registrant only.
| Fiscal Year Ended October 31, 2024 | Fiscal Year Ended October 31, 2023 | |||||||
| (a) Audit Fees. | $ | 173,000 | $ | 135,000 | ||||
| (b) Audit-Related Fees. | 0 | 0 | ||||||
| (c) Tax Fees. | 0 | 0 | ||||||
| (d) All Other Fees. | 0 | 0 | ||||||
| Total. | $ | 173,000 | $ | 135,000 | ||||
| (e) | (1) Pre-Approval Policies. The audit committee is responsible for pre-approving all audit and non-audit services provided by PwC to: (i) the Vanguard funds; and (ii) Vanguard, or any entity controlled by Vanguard that provides ongoing services to the Vanguard funds. All services provided to Vanguard entities by the independent auditor, whether or not they are subject to preapproval, must be disclosed to the audit committee. The audit committee chair may preapprove any permissible audit and non-audit services as long as any preapproval is brought to the attention of the full audit committee at the next scheduled meeting. (2) No percentage of the principal accountant’s fees or services were approved pursuant to the waiver provision of paragraph (c)(7)(i)(C) of Rule 2-01 of Regulation S-X. | |
| (f) | For the most recent fiscal year, over 50% of the hours worked under the principal accountant’s engagement were not performed by persons other than full-time, permanent employees of the principal accountant. | |
| (g) | Aggregate Non-Audit Fees. |
Includes fees billed for non-audit services provided to the Registrant, other registered investment companies in the Vanguard complex, The Vanguard Group, Inc., and Vanguard Marketing Corporation.
| Fiscal Year Ended October 31, 2024 | Fiscal Year Ended October 31, 2023 | |||||||
| Non-audit fees to the Registrant only, listed as (b) through (d) above. | $ | 0 | $ | 0 | ||||
| Non-audit Fees to other registered investment companies in the Vanguard complex, The Vanguard Group, Inc., and Vanguard Marketing Corporation. | ||||||||
| Audit-Related Fees. | $ | 1,517,669 | $ | 3,295,934 | ||||
| Tax Fees. | $ | 1,916,879 | $ | 1,678,928 | ||||
| All Other Fees. | $ | 268,000 | $ | 25,000 | ||||
| Total. | $ | 3,702,548 | $ | 4,999,862 | ||||
| (h) | For the most recent fiscal year, the Audit Committee has determined that the provision of all non-audit services was consistent with maintaining the principal accountant’s independence. |
Item 5: Audit Committee of Listed Registrants.
The Registrant is a listed issuer as defined in rule 10A-3 under the Securities Exchange Act of 1934 (“Exchange Act”). The Registrant has a separately-designated standing audit committee established in accordance with Section 3(a)(58)(A) of the Exchange Act. The Registrant’s audit committee members are: F. Joseph Loughrey, Mark Loughridge, Sarah Bloom Raskin, and Peter F. Volanakis.
Item 6: Investments.
Not applicable. The complete schedule of investments is included in the financial statements filed under Item 7 of this Form.
Item 7: Financial Statements and Financial Highlights for Open-End Management Investment Companies.

Financial Statements | 1 |
Report of Independent Registered Public Accounting Firm | 16 |
Tax information | 17 |
| Shares | Market Value• ($000) | ||
| Common Stocks (93.2%) | |||
| Brazil (6.6%) | |||
| Ambev SA | 3,876,066 | 8,475 | |
| Petroleo Brasileiro SA ADR (XNYS) | 563,399 | 7,578 | |
| Natura & Co. Holding SA | 2,769,600 | 6,568 | |
| Vale SA | 563,100 | 6,045 | |
| Banco Do Brasil SA | 880,700 | 4,011 | |
| Neoenergia SA | 876,600 | 2,896 | |
| Cia de Saneamento Basico do Estado de Sao Paulo | 161,706 | 2,576 | |
| B3 SA - Brasil Bolsa Balcao | 1,276,000 | 2,344 | |
| TIM SA | 794,665 | 2,279 | |
| Petroleo Brasileiro SA ADR | 177,064 | 2,190 | |
| Banco Santander Brasil SA | 372,476 | 1,753 | |
| Banco Bradesco SA ADR | 657,374 | 1,624 | |
| Rumo SA | 378,263 | 1,302 | |
| Petroleo Brasileiro SA | 143,177 | 967 | |
| BB Seguridade Participacoes SA | 130,722 | 775 | |
| Raia Drogasil SA | 90,926 | 383 | |
| *,1 | Hapvida Participacoes e Investimentos SA | 549,238 | 335 |
| 1 | Rede D'Or Sao Luiz SA | 45,259 | 230 |
| 52,331 | |||
| Canada (1.2%) | |||
| * | First Quantum Minerals Ltd. | 346,142 | 4,472 |
| Lundin Mining Corp. | 315,431 | 3,068 | |
| *,2 | Valeura Energy Inc. | 274,248 | 890 |
| Parex Resources Inc. | 83,681 | 777 | |
| 9,207 | |||
| Chile (0.2%) | |||
| Banco De Chile | 12,153,902 | 1,412 | |
| China (27.2%) | |||
| Tencent Holdings Ltd. | 667,148 | 34,787 | |
| Alibaba Group Holding Ltd. | 1,860,519 | 22,759 | |
| China Merchants Bank Co. Ltd. Class H | 2,697,742 | 13,202 | |
| Haier Smart Home Co. Ltd. Class H | 3,092,000 | 11,222 | |
| *,1 | Meituan Class B | 458,523 | 10,835 |
| China Overseas Land & Investment Ltd. | 5,160,885 | 9,862 | |
| * | Baidu Inc. Class A | 787,750 | 8,989 |
| Ping An Insurance Group Co. of China Ltd. Class H | 1,225,000 | 7,590 | |
| Weichai Power Co. Ltd. Class H | 4,650,000 | 7,026 | |
| Kweichow Moutai Co. Ltd. Class A | 30,439 | 6,538 | |
| ZTO Express Cayman Inc. ADR | 217,785 | 5,033 | |
| Zhongsheng Group Holdings Ltd. | 2,687,500 | 4,133 | |
| Contemporary Amperex Technology Co. Ltd. Class A (XSHE) | 115,102 | 3,995 | |
| Midea Group Co. Ltd. Class A | 396,386 | 3,974 | |
| KE Holdings Inc. ADR | 153,324 | 3,362 | |
| GF Securities Co. Ltd. Class H | 2,338,600 | 3,322 | |
| China Pacific Insurance Group Co. Ltd. Class H | 949,734 | 3,298 | |
| ENN Energy Holdings Ltd. | 409,693 | 2,886 | |
| Anker Innovations Technology Co. Ltd. Class A | 249,730 | 2,815 | |
| JD.com Inc. Class A | 137,701 | 2,793 | |
| Zhejiang Longsheng Group Co. Ltd. Class A | 1,933,100 | 2,734 | |
| Beijing Oriental Yuhong Waterproof Technology Co. Ltd. Class A | 1,281,800 | 2,632 | |
| * | Luckin Coffee Inc. ADR | 96,545 | 2,619 |
| Shandong Weigao Group Medical Polymer Co. Ltd. Class H | 4,196,048 | 2,611 | |
| * | Trip.com Group Ltd. | 38,817 | 2,498 |
| KE Holdings Inc. Class A | 310,270 | 2,281 | |
| Tencent Music Entertainment Group ADR | 162,120 | 1,804 | |
| Zijin Mining Group Co. Ltd. Class H | 840,000 | 1,789 | |
| Anhui Conch Cement Co. Ltd. Class H | 596,456 | 1,733 | |
| ANTA Sports Products Ltd. | 157,599 | 1,682 | |
| Shares | Market Value• ($000) | ||
| BYD Co. Ltd. Class H | 44,881 | 1,621 | |
| China National Building Material Co. Ltd. Class H | 3,547,580 | 1,509 | |
| Bank of Ningbo Co. Ltd. Class A | 410,012 | 1,474 | |
| 1 | Haidilao International Holding Ltd. | 662,000 | 1,335 |
| * | BeiGene Ltd. | 78,250 | 1,232 |
| Foxconn Industrial Internet Co. Ltd. Class A | 362,900 | 1,217 | |
| Zoomlion Heavy Industry Science and Technology Co. Ltd. Class A | 1,196,948 | 1,170 | |
| *,1 | Kuaishou Technology | 197,100 | 1,162 |
| Proya Cosmetics Co. Ltd. Class A | 81,214 | 1,095 | |
| PetroChina Co. Ltd. Class H | 1,316,005 | 988 | |
| CIMC Enric Holdings Ltd. | 1,120,000 | 945 | |
| Ping An Insurance Group Co. of China Ltd. Class A | 117,700 | 926 | |
| Li Ning Co. Ltd. | 452,000 | 922 | |
| * | PDD Holdings Inc. ADR | 7,499 | 904 |
| Yum China Holdings Inc. | 18,602 | 836 | |
| 1 | China Resources Mixc Lifestyle Services Ltd. | 197,522 | 815 |
| * | Baidu Inc. ADR | 8,144 | 743 |
| Brilliance China Automotive Holdings Ltd. | 2,290,000 | 739 | |
| Kanzhun Ltd. ADR | 43,142 | 628 | |
| * | Minth Group Ltd. | 307,666 | 562 |
| Jiangsu Hengrui Medicine Co. Ltd. Class A | 82,472 | 541 | |
| Alibaba Group Holding Ltd. ADR | 5,328 | 522 | |
| Sinopharm Group Co. Ltd. Class H | 184,416 | 459 | |
| * | Zai Lab Ltd. ADR | 14,929 | 451 |
| Sino Biopharmaceutical Ltd. | 958,294 | 435 | |
| China Railway Group Ltd. Class H | 592,765 | 296 | |
| 1 | Yadea Group Holdings Ltd. | 143,179 | 247 |
| Shenzhen Mindray Bio-Medical Electronics Co. Ltd. Class A (XSHE) | 6,400 | 240 | |
| *,1 | Wuxi Biologics Cayman Inc. | 82,395 | 175 |
| 1 | WuXi AppTec Co. Ltd. Class H | 25,939 | 173 |
| Lufax Holding Ltd. ADR | 61,296 | 164 | |
| * | Sichuan Kelun-Biotech Biopharmaceutical Co. Ltd. | 3,659 | 81 |
| 215,411 | |||
| Greece (0.1%) | |||
| National Bank of Greece SA | 150,666 | 1,180 | |
| Hong Kong (3.9%) | |||
| 1 | WH Group Ltd. | 10,293,500 | 8,012 |
| Galaxy Entertainment Group Ltd. | 1,312,000 | 5,839 | |
| Pacific Basin Shipping Ltd. | 16,637,139 | 4,582 | |
| Yue Yuen Industrial Holdings Ltd. | 1,793,000 | 3,769 | |
| Man Wah Holdings Ltd. | 4,936,804 | 3,587 | |
| AIA Group Ltd. | 303,493 | 2,395 | |
| Shenzhou International Group Holdings Ltd. | 251,500 | 1,942 | |
| 1 | BOC Aviation Ltd. | 90,141 | 699 |
| 30,825 | |||
| Hungary (1.6%) | |||
| OTP Bank Nyrt | 109,597 | 5,457 | |
| Richter Gedeon Nyrt | 158,009 | 4,567 | |
| MOL Hungarian Oil & Gas plc | 388,553 | 2,696 | |
| 12,720 | |||
| India (11.9%) | |||
| HDFC Bank Ltd. | 466,941 | 9,598 | |
| Axis Bank Ltd. | 561,718 | 7,716 | |
| * | Reliance Industries Ltd. | 455,563 | 7,217 |
| Reliance Industries Ltd. (XNSE) | 455,563 | 7,203 | |
| Tata Consultancy Services Ltd. | 106,335 | 5,002 | |
| * | Jio Financial Services Ltd. | 1,034,081 | 3,955 |
| Tech Mahindra Ltd. | 182,896 | 3,481 | |
| Adani Ports & Special Economic Zone Ltd. | 201,375 | 3,286 | |
| Bharti Airtel Ltd. (XNSE) | 151,967 | 2,909 | |
| 1 | HDFC Life Insurance Co. Ltd. | 332,140 | 2,837 |
| UltraTech Cement Ltd. | 21,142 | 2,776 | |
| Shriram Finance Ltd. | 72,129 | 2,678 | |
| Kotak Mahindra Bank Ltd. | 128,092 | 2,630 | |
| HDFC Bank Ltd. ADR | 36,931 | 2,328 | |
| * | Delhivery Ltd. | 463,557 | 1,958 |
| * | PB Fintech Ltd. | 91,787 | 1,855 |
| Infosys Ltd. ADR | 78,822 | 1,648 | |
| Shares | Market Value• ($000) | ||
| Godrej Consumer Products Ltd. | 106,544 | 1,623 | |
| Varun Beverages Ltd. | 225,084 | 1,600 | |
| IndusInd Bank Ltd. | 120,695 | 1,510 | |
| UPL Ltd. | 213,936 | 1,406 | |
| 1 | SBI Life Insurance Co. Ltd. | 71,928 | 1,385 |
| Ambuja Cements Ltd. | 191,049 | 1,317 | |
| * | Amber Enterprises India Ltd. | 18,260 | 1,306 |
| Mahindra & Mahindra Ltd. | 40,229 | 1,299 | |
| Infosys Ltd. | 52,922 | 1,104 | |
| Larsen & Toubro Ltd. | 25,485 | 1,095 | |
| KEC International Ltd. | 83,969 | 982 | |
| Jubilant Foodworks Ltd. | 138,120 | 944 | |
| Hindustan Unilever Ltd. | 30,616 | 919 | |
| Eicher Motors Ltd. | 14,504 | 842 | |
| Bajaj Auto Ltd. | 6,882 | 804 | |
| Patanjali Foods Ltd. | 35,199 | 750 | |
| Colgate-Palmolive India Ltd. | 20,579 | 748 | |
| * | GMR Airports Infrastructure Ltd. | 794,642 | 746 |
| Ashok Leyland Ltd. | 301,783 | 745 | |
| Apollo Hospitals Enterprise Ltd. | 8,485 | 707 | |
| * | Hyundai Motor India Ltd. | 32,346 | 701 |
| Oil & Natural Gas Corp. Ltd. | 207,571 | 655 | |
| DLF Ltd. | 55,034 | 535 | |
| * | Honasa Consumer Ltd. | 108,551 | 508 |
| Tata Steel Ltd. | 288,026 | 506 | |
| Fortis Healthcare Ltd. | 50,920 | 378 | |
| Torrent Pharmaceuticals Ltd. | 9,417 | 358 | |
| Rainbow Children's Medicare Ltd. | 13,213 | 253 | |
| 94,803 | |||
| Indonesia (1.6%) | |||
| Bank Rakyat Indonesia Persero Tbk PT | 34,287,393 | 10,453 | |
| Bank Central Asia Tbk PT | 2,171,448 | 1,416 | |
| Mitra Adiperkasa Tbk PT | 5,275,235 | 530 | |
| Unilever Indonesia Tbk PT | 3,730,335 | 467 | |
| Map Aktif Adiperkasa PT | 4,089,169 | 282 | |
| 13,148 | |||
| Kazakhstan (0.6%) | |||
| Kaspi.KZ JSC ADR (Registered) | 47,175 | 5,196 | |
| Mexico (1.4%) | |||
| Grupo Financiero Banorte SAB de CV Class O | 462,681 | 3,222 | |
| Wal-Mart de Mexico SAB de CV | 1,080,766 | 2,972 | |
| Fomento Economico Mexicano SAB de CV ADR | 29,566 | 2,864 | |
| Cemex SAB de CV ADR | 180,460 | 942 | |
| Grupo Mexico SAB de CV Series B | 154,999 | 811 | |
| 10,811 | |||
| Other (0.2%) | |||
| 3 | Vanguard FTSE Emerging Markets ETF | 38,060 | 1,773 |
| Philippines (0.4%) | |||
| Bdo Unibank Inc. | 1,009,058 | 2,641 | |
| Ayala Land Inc. | 737,498 | 414 | |
| 3,055 | |||
| Poland (0.5%) | |||
| *,1 | Allegro.eu SA | 293,685 | 2,584 |
| KGHM Polska Miedz SA | 40,397 | 1,512 | |
| 4,096 | |||
| Romania (0.2%) | |||
| Banca Transilvania SA | 216,679 | 1,338 | |
| Russia (0.0%) | |||
| *,4 | MMC Norilsk Nickel PJSC ADR | 200,203 | — |
| *,4 | Sberbank of Russia PJSC | 1,473,153 | — |
| *,4 | Mobile TeleSystems PJSC ADR | 93,946 | — |
| *,4 | Moscow Exchange MICEX-RTS PJSC | 536,630 | — |
| *,4 | GMK Norilskiy Nickel PAO | 124,700 | — |
| *,4 | Sberbank of Russia PJSC ADR | 476,234 | — |
| *,4 | LUKOIL PJSC ADR | 35,630 | — |
| Shares | Market Value• ($000) | ||
| *,4 | Novatek PJSC GDR (Registered) | 422 | — |
| *,2,4 | Ozon Holdings plc ADR | 35,000 | — |
| *,4 | Gazprom PJSC | 926,846 | — |
| — | |||
| Saudi Arabia (0.7%) | |||
| Saudi Tadawul Group Holding Co. | 35,320 | 2,236 | |
| Saudi Awwal Bank | 244,154 | 2,198 | |
| 1 | Saudi Arabian Oil Co. | 97,548 | 701 |
| Mouwasat Medical Services Co. | 9,390 | 234 | |
| 5,369 | |||
| Singapore (0.9%) | |||
| Wilmar International Ltd. | 2,828,700 | 6,828 | |
| South Africa (2.1%) | |||
| Sasol Ltd. | 762,408 | 4,285 | |
| FirstRand Ltd. | 900,244 | 3,955 | |
| * | Impala Platinum Holdings Ltd. | 526,324 | 3,474 |
| Harmony Gold Mining Co. Ltd. | 183,637 | 1,992 | |
| Discovery Ltd. | 115,569 | 1,185 | |
| Naspers Ltd. Class N | 3,772 | 892 | |
| Clicks Group Ltd. | 17,076 | 366 | |
| Harmony Gold Mining Co. Ltd. (XNYS) | 24,232 | 263 | |
| 16,412 | |||
| South Korea (6.7%) | |||
| Samsung Electronics Co. Ltd. (XKRX) | 417,439 | 17,725 | |
| SK Hynix Inc. | 48,477 | 6,346 | |
| Hyundai Mobis Co. Ltd. | 30,133 | 5,416 | |
| Hankook Tire & Technology Co. Ltd. | 192,082 | 4,892 | |
| Hyundai Motor Co. | 27,701 | 4,267 | |
| KB Financial Group Inc. | 58,170 | 3,785 | |
| DB Insurance Co. Ltd. | 41,724 | 3,289 | |
| Shinhan Financial Group Co. Ltd. | 85,140 | 3,171 | |
| * | WONIK IPS Co. Ltd. | 92,746 | 1,839 |
| Orion Corp.Republic of Korea | 23,798 | 1,715 | |
| NAVER Corp. | 6,089 | 745 | |
| 53,190 | |||
| Taiwan (13.4%) | |||
| Taiwan Semiconductor Manufacturing Co. Ltd. (XTAI) | 2,215,852 | 69,488 | |
| MediaTek Inc. | 200,435 | 7,803 | |
| Accton Technology Corp. | 281,091 | 4,723 | |
| United Integrated Services Co. Ltd. | 438,000 | 4,549 | |
| Hon Hai Precision Industry Co. Ltd. | 606,726 | 3,889 | |
| Silergy Corp. | 209,000 | 3,243 | |
| Nien Made Enterprise Co. Ltd. | 196,000 | 2,921 | |
| Chroma ATE Inc. | 182,834 | 2,311 | |
| E Ink Holdings Inc. | 226,000 | 2,115 | |
| Compal Electronics Inc. | 1,911,000 | 2,098 | |
| ASPEED Technology Inc. | 16,498 | 2,092 | |
| Uni-President Enterprises Corp. | 497,884 | 1,394 | |
| 106,626 | |||
| Thailand (2.9%) | |||
| SCB X PCL | 2,166,400 | 7,286 | |
| Indorama Ventures PCL NVDR | 5,776,500 | 4,432 | |
| Bangkok Bank PCL NVDR | 802,000 | 3,490 | |
| PTT Exploration & Production PCL | 741,449 | 2,785 | |
| * | True Corp. PCL NVDR | 7,485,051 | 2,726 |
| Bangkok Bank PCL (Registered) | 524,400 | 2,282 | |
| Bangkok Dusit Medical Services PCL Class F | 194,059 | 158 | |
| 23,159 | |||
| Turkey (0.4%) | |||
| Akbank TAS | 2,139,795 | 3,163 | |
| United Arab Emirates (0.9%) | |||
| Abu Dhabi Commercial Bank PJSC | 1,812,643 | 4,406 | |
| Emirates NBD Bank PJSC | 349,969 | 1,809 | |
| Emaar Properties PJSC | 258,674 | 612 | |
| Shares | Market Value• ($000) | ||
| Burjeel Holdings plc | 371,924 | 230 | |
| 7,057 | |||
| United Kingdom (0.6%) | |||
| Anglo American plc | 99,010 | 3,069 | |
| 1 | Airtel Africa plc | 1,461,756 | 1,921 |
| 4,990 | |||
| United States (6.0%) | |||
| * | MercadoLibre Inc. | 5,850 | 11,918 |
| Credicorp Ltd. | 46,544 | 8,570 | |
| Cognizant Technology Solutions Corp. Class A | 82,134 | 6,126 | |
| * | Coupang Inc. | 145,561 | 3,754 |
| * | Grab Holdings Ltd. Class A | 886,767 | 3,618 |
| * | Sea Ltd. ADR | 38,292 | 3,601 |
| * | NU Holdings Ltd. Class A | 229,559 | 3,464 |
| * | Fabrinet | 10,099 | 2,434 |
| Copa Holdings SA Class A | 21,512 | 2,093 | |
| * | WNS Holdings Ltd. | 18,202 | 874 |
| * | MakeMyTrip Ltd. | 6,675 | 677 |
| * | Legend Biotech Corp. ADR | 4,783 | 215 |
| 47,344 | |||
| Vietnam (1.0%) | |||
| Vietnam Dairy Products JSC | 1,915,970 | 5,008 | |
| Mobile World Investment Corp. | 843,200 | 2,211 | |
| * | Hoa Phat Group JSC | 551,916 | 586 |
| 7,805 | |||
| Total Common Stocks (Cost $649,088) | 739,249 | ||
| Preferred Stocks (2.7%) | |||
| Cia Energetica de Minas Gerais Preference Shares | 2,842,485 | 5,591 | |
| Petroleo Brasileiro SA Preference Shares | 727,900 | 4,521 | |
| Itau Unibanco Holding SA Preference Shares | 696,900 | 4,222 | |
| Samsung Electronics Co. Ltd. Preference Shares | 83,435 | 2,870 | |
| Banco Bradesco SA Preference Shares | 1,124,500 | 2,795 | |
| Raizen SA Preference Shares | 2,547,300 | 1,234 | |
| Total Preferred Stocks (Cost $21,449) | 21,233 | ||
| Temporary Cash Investments (4.3%) | |||
| Money Market Fund (4.3%) | |||
| 5,6 | Vanguard Market Liquidity Fund, 4.834% (Cost $34,434) | 344,359 | 34,432 |
| Total Investments (100.2%) (Cost $704,971) | 794,914 | ||
| Other Assets and Liabilities—Net (-0.2%) | (1,855) | ||
| Net Assets (100%) | 793,059 | ||
| Cost is in $000. | |||
| • | See Note A in Notes to Financial Statements. |
| * | Non-income-producing security. |
| 1 | Security exempt from registration under Rule 144A of the Securities Act of 1933. Such securities may be sold in transactions exempt from registration, normally to qualified institutional buyers. At October 31, 2024, the aggregate value was $33,446,000, representing 4.2% of net assets. |
| 2 | Includes partial security positions on loan to broker-dealers. The total value of securities on loan is $57,000. |
| 3 | Considered an affiliated company of the fund as the issuer is another member of The Vanguard Group. |
| 4 | Security value determined using significant unobservable inputs. |
| 5 | Affiliated money market fund available only to Vanguard funds and certain trusts and accounts managed by Vanguard. Rate shown is the 7-day yield. |
| 6 | Collateral of $719,000 was received for securities on loan. |
| ADR—American Depositary Receipt. | |
| GDR—Global Depositary Receipt. | |
| NVDR—Non-Voting Depository Receipt. |
| Futures Contracts | ||||
| ($000) | ||||
| Expiration | Number of Long (Short) Contracts | Notional Amount | Value and Unrealized Appreciation (Depreciation) | |
| Long Futures Contracts | ||||
| MSCI Emerging Markets Index | December 2024 | 435 | 24,501 | 527 |
| ($000s, except shares, footnotes, and per-share amounts) | Amount |
| Assets | |
| Investments in Securities, at Value1 | |
| Unaffiliated Issuers (Cost $668,834) | 758,709 |
| Affiliated Issuers (Cost $36,137) | 36,205 |
| Total Investments in Securities | 794,914 |
| Investment in Vanguard | 23 |
| Cash | 267 |
| Cash Collateral Pledged—Futures Contracts | 797 |
| Foreign Currency, at Value (Cost $554) | 585 |
| Receivables for Investment Securities Sold | 1,334 |
| Receivables for Accrued Income | 1,868 |
| Receivables for Capital Shares Issued | 396 |
| Total Assets | 800,184 |
| Liabilities | |
| Payables for Investment Securities Purchased | 2,706 |
| Collateral for Securities on Loan | 719 |
| Payables to Investment Advisor | 895 |
| Payables for Capital Shares Redeemed | 251 |
| Payables to Vanguard | 104 |
| Variation Margin Payable—Futures Contracts | 113 |
| Foreign Capital Gain Taxes Payable | 5 |
| Deferred Foreign Capital Gains Taxes | 2,332 |
| Total Liabilities | 7,125 |
| Net Assets | 793,059 |
| 1 Includes $57,000 of securities on loan. | |
| At October 31, 2024, net assets consisted of: | |
| Paid-in Capital | 755,448 |
| Total Distributable Earnings (Loss) | 37,611 |
| Net Assets | 793,059 |
| Net Assets | |
| Applicable to 34,624,606 outstanding $.001 par value shares of beneficial interest (unlimited authorization) | 793,059 |
| Net Asset Value Per Share | $22.90 |
| Year Ended October 31, 2024 | |
| ($000) | |
| Investment Income | |
| Income | |
| Dividends—Unaffiliated Issuers1 | 26,436 |
| Dividends—Affiliated Issuers | 97 |
| Interest—Unaffiliated Issuers | 144 |
| Interest—Affiliated Issuers | 1,940 |
| Securities Lending—Net | 41 |
| Total Income | 28,658 |
| Expenses | |
| Investment Advisory Fees—Note B | |
| Basic Fee | 3,934 |
| Performance Adjustment | (519) |
| The Vanguard Group—Note C | |
| Management and Administrative | 1,989 |
| Marketing and Distribution | 42 |
| Custodian Fees | 254 |
| Auditing Fees | 38 |
| Shareholders’ Reports | 37 |
| Trustees’ Fees and Expenses | — |
| Other Expenses | 25 |
| Total Expenses | 5,800 |
| Expenses Paid Indirectly | (78) |
| Net Expenses | 5,722 |
| Net Investment Income | 22,936 |
| Realized Net Gain (Loss) | |
| Capital Gains Distributions Received – Affiliated Issuers | — |
| Investment Securities Sold—Unaffiliated Issuers2 | 3,523 |
| Investment Securities Sold—Affiliated Issuers | 178 |
| Futures Contracts | 3,084 |
| Forward Currency Contracts | (7) |
| Foreign Currencies | (535) |
| Realized Net Gain (Loss) | 6,243 |
| Change in Unrealized Appreciation (Depreciation) | |
| Investment Securities—Unaffiliated Issuers3 | 119,920 |
| Investment Securities—Affiliated Issuers | 113 |
| Futures Contracts | 2,296 |
| Foreign Currencies | (88) |
| Change in Unrealized Appreciation (Depreciation) | 122,241 |
| Net Increase (Decrease) in Net Assets Resulting from Operations | 151,420 |
| 1 | Dividends are net of foreign withholding taxes of $2,161,000. |
| 2 | Realized gain (loss) is net of foreign capital gain taxes of $3,003,000. |
| 3 | The change in unrealized appreciation (depreciation) is net of the change in deferred foreign capital gains taxes of $723,000. |
| Year Ended October 31, | ||
| 2024 ($000) | 2023 ($000) | |
| Increase (Decrease) in Net Assets | ||
| Operations | ||
| Net Investment Income | 22,936 | 22,523 |
| Realized Net Gain (Loss) | 6,243 | (12,270) |
| Change in Unrealized Appreciation (Depreciation) | 122,241 | 83,803 |
| Net Increase (Decrease) in Net Assets Resulting from Operations | 151,420 | 94,056 |
| Distributions | ||
| Total Distributions | (22,705) | (25,482) |
| Capital Share Transactions | ||
| Issued | 117,880 | 141,225 |
| Issued in Lieu of Cash Distributions | 19,402 | 21,665 |
| Redeemed | (181,510) | (152,294) |
| Net Increase (Decrease) from Capital Share Transactions | (44,228) | 10,596 |
| Total Increase (Decrease) | 84,487 | 79,170 |
| Net Assets | ||
| Beginning of Period | 708,572 | 629,402 |
| End of Period | 793,059 | 708,572 |
| For a Share Outstanding Throughout Each Period | Year Ended October 31, | ||||
| 2024 | 2023 | 2022 | 2021 | 2020 | |
| Net Asset Value, Beginning of Period | $19.33 | $17.42 | $27.09 | $22.18 | $21.87 |
| Investment Operations | |||||
| Net Investment Income1 | .640 | .606 | .715 | .457 | .298 |
| Net Realized and Unrealized Gain (Loss) on Investments | 3.559 | 2.019 | (8.724) | 4.729 | .483 |
| Total from Investment Operations | 4.199 | 2.625 | (8.009) | 5.186 | .781 |
| Distributions | |||||
| Dividends from Net Investment Income | (.629) | (.715) | (.486) | (.276) | (.471) |
| Distributions from Realized Capital Gains | — | — | (1.175) | — | — |
| Total Distributions | (.629) | (.715) | (1.661) | (.276) | (.471) |
| Net Asset Value, End of Period | $22.90 | $19.33 | $17.42 | $27.09 | $22.18 |
| Total Return2 | 22.19% | 15.10% | -31.16% | 23.44% | 3.51% |
| Ratios/Supplemental Data | |||||
| Net Assets, End of Period (Millions) | $793 | $709 | $629 | $974 | $670 |
| Ratio of Total Expenses to Average Net Assets3 | 0.75%4 | 0.80%4 | 0.78% | 0.84% | 0.85% |
| Ratio of Net Investment Income to Average Net Assets | 2.98% | 2.99% | 3.26% | 1.65% | 1.43% |
| Portfolio Turnover Rate | 68% | 43% | 41% | 48% | 52% |
| 1 | Calculated based on average shares outstanding. |
| 2 | Total returns do not include account service fees that may have applied in the periods shown. Fund prospectuses provide information about any applicable account service fees. |
| 3 | Includes performance-based investment advisory fee increases (decreases) of (0.07%), (0.01%), (0.04%), 0.02%, and (0.01%). |
| 4 | The ratio of expenses to average net assets for the period net of reduction from custody fee offset arrangements was 0.74% and 0.80%, respectively. |
| A. | The following significant accounting policies conform to generally accepted accounting principles for U.S. investment companies. The fund consistently follows such policies in preparing its financial statements. |
| B. | The investment advisory firms Pzena Investment Management, LLC, Baillie Gifford Overseas Ltd., and Wellington Management Company llp, each provide investment advisory services to a portion of the fund for a fee calculated at an annual percentage rate of average net assets managed by the advisor. The basic fees of Pzena Investment Management, LLC, Baillie Gifford Overseas Ltd., and Wellington Management Company llp, are subject to quarterly adjustments based on performance relative to the FTSE Emerging Index for the preceding three years. Until August 2024, a portion of the fund was managed by Oaktree Fund Advisors, LLC. The basic fee paid to Oaktree Fund Advisors, LLC was subject to quarterly adjustments based on performance relative to the FTSE Emerging Index for the preceding three years. |
| C. | In accordance with the terms of a Funds' Service Agreement (the “FSA”) between Vanguard and the fund, Vanguard furnishes to the fund corporate management, administrative, marketing, distribution and cash management services at Vanguard’s cost of operations (as defined by the FSA). These costs of operations are allocated to the fund based on methods and guidelines approved by the board of trustees and are generally settled twice a month. |
| D. | The fund’s custodian bank has agreed to reduce its fees when the fund maintains cash on deposit in the non-interest-bearing custody account. For the year ended October 31, 2024, custodian fee offset arrangements reduced the fund’s expenses by $78,000 (an annual rate of 0.01% of average net assets). |
| E. | Various inputs may be used to determine the value of the fund’s investments and derivatives. These inputs are summarized in three broad levels for financial statement purposes. The inputs or methodologies used to value securities are not necessarily an indication of the risk associated with investing in those securities. |
| Level 1 ($000) | Level 2 ($000) | Level 3 ($000) | Total ($000) | |
| Investments | ||||
| Assets | ||||
| Common Stocks—North and South America | 119,693 | 1,412 | — | 121,105 |
| Common Stocks—Other | 29,739 | 588,405 | — | 618,144 |
| Preferred Stocks | 18,363 | 2,870 | — | 21,233 |
| Temporary Cash Investments | 34,432 | — | — | 34,432 |
| Total | 202,227 | 592,687 | — | 794,914 |
| Derivative Financial Instruments | ||||
| Assets | ||||
| Futures Contracts1 | 527 | — | — | 527 |
| 1 | Includes cumulative appreciation (depreciation) on futures contracts and centrally cleared swaps, if any, as reported in the Schedule of Investments. Only current day’s variation margin is reported within the Statement of Assets and Liabilities. |
| F. | At October 31, 2024, the fair values of derivatives were reflected in the Statement of Assets and Liabilities as follows: |
| Statement of Assets and Liabilities | Equity Contracts ($000) | Foreign Exchange Contracts ($000) | Total ($000) |
| Unrealized Appreciation—Futures Contracts1 | 527 | — | 527 |
| 1 | Includes cumulative appreciation (depreciation) on futures contracts and centrally cleared swaps, if any, as reported in the Schedule of Investments. Only current day’s variation margin is reported within the Statement of Assets and Liabilities. |
| Realized Net Gain (Loss) on Derivatives | Equity Contracts ($000) | Foreign Exchange Contracts ($000) | Total ($000) |
| Futures Contracts | 3,084 | — | 3,084 |
| Forward Currency Contracts | — | (7) | (7) |
| Realized Net Gain (Loss) on Derivatives | 3,084 | (7) | 3,077 |
| Change in Unrealized Appreciation (Depreciation) on Derivatives | |||
| Futures Contracts | 2,296 | — | 2,296 |
| G. | Permanent differences between book-basis and tax-basis components of net assets are reclassified among capital accounts in the financial statements to reflect their tax character. These reclassifications have no effect on net assets or net asset value per share. As of period end, permanent differences primarily attributable to the accounting for foreign currency transactions, passive foreign investment companies, and tax expense on capital gains were reclassified between the individual components of total distributable earnings (loss). |
| Amount ($000) | |
| Undistributed Ordinary Income | 21,504 |
| Undistributed Long-Term Gains | — |
| Net Unrealized Gains (Losses) | 77,449 |
| Capital Loss Carryforwards | (61,342) |
| Qualified Late-Year Losses | — |
| Other Temporary Differences | — |
| Total | 37,611 |
| Year Ended October 31, | ||
| 2024 Amount ($000) | 2023 Amount ($000) | |
| Ordinary Income* | 22,705 | 25,482 |
| Long-Term Capital Gains | — | — |
| Total | 22,705 | 25,482 |
| * | Includes short-term capital gains, if any. |
| Amount ($000) | |
| Tax Cost | 715,082 |
| Gross Unrealized Appreciation | 166,068 |
| Gross Unrealized Depreciation | (86,234) |
| Net Unrealized Appreciation (Depreciation) | 79,834 |
| H. | During the year ended October 31, 2024, the fund purchased $491,339,000 of investment securities and sold $530,252,000 of investment securities, other than temporary cash investments. |
| I. | Capital shares issued and redeemed were: |
| Year Ended October 31, | ||
| 2024 Shares (000) | 2023 Shares (000) | |
| Issued | 5,490 | 6,947 |
| Issued in Lieu of Cash Distributions | 968 | 1,130 |
| Redeemed | (8,488) | (7,545) |
| Net Increase (Decrease) in Shares Outstanding | (2,030) | 532 |
| J. | Transactions during the period in investments where the issuer is another member of The Vanguard Group were as follows: |
| Current Period Transactions | ||||||||
| Oct. 31, 2023 Market Value ($000) | Purchases at Cost ($000) | Proceeds from Securities Sold ($000) | Realized Net Gain (Loss) ($000) | Change in Unrealized App. (Dep.) ($000) | Income ($000) | Capital Gain Distributions Received ($000) | Oct. 31, 2024 Market Value ($000) | |
| Vanguard FTSE Emerging Markets ETF | 2,626 | 12,195 | 13,342 | 173 | 121 | 97 | — | 1,773 |
| Vanguard Market Liquidity Fund | 40,943 | NA1 | NA1 | 5 | (8) | 1,940 | — | 34,432 |
| Total | 43,569 | 12,195 | 13,342 | 178 | 113 | 2,037 | — | 36,205 |
| 1 | Not applicable—purchases and sales are for temporary cash investment purposes. |
| K. | Significant market disruptions, such as those caused by pandemics, natural or environmental disasters, war, acts of terrorism, or other events, can adversely affect local and global markets and normal market operations. Any such disruptions could have an adverse impact on the value of the fund’s investments and fund performance. |
| L. | Management has determined that no events or transactions occurred subsequent to October 31, 2024, that would require recognition or disclosure in these financial statements. |
Philadelphia, Pennsylvania
December 20, 2024

Consolidated Financial Statements | 1 |
Report of Independent Registered Public Accounting Firm | 11 |
Tax information | 12 |
| Coupon | Maturity Date | Face Amount ($000) | Market Value• ($000) | |||
| U.S. Government and Agency Obligations (76.0%) | ||||||
| U.S. Government Securities (76.0%) | ||||||
| United States Treasury Inflation Indexed Bonds | 0.250% | 1/15/25 | 58,989 | 58,546 | ||
| United States Treasury Inflation Indexed Bonds | 2.375% | 1/15/25 | 40,130 | 39,998 | ||
| United States Treasury Inflation Indexed Bonds | 0.125% | 4/15/25 | 47,115 | 46,460 | ||
| United States Treasury Inflation Indexed Bonds | 0.375% | 7/15/25 | 64,585 | 63,788 | ||
| United States Treasury Inflation Indexed Bonds | 0.125% | 10/15/25 | 57,448 | 56,398 | ||
| United States Treasury Inflation Indexed Bonds | 0.625% | 1/15/26 | 53,949 | 52,912 | ||
| United States Treasury Inflation Indexed Bonds | 2.000% | 1/15/26 | 25,836 | 25,755 | ||
| United States Treasury Inflation Indexed Bonds | 0.125% | 4/15/26 | 44,369 | 43,087 | ||
| United States Treasury Inflation Indexed Bonds | 0.125% | 7/15/26 | 54,379 | 52,901 | ||
| United States Treasury Inflation Indexed Bonds | 0.125% | 10/15/26 | 61,405 | 59,505 | ||
| United States Treasury Inflation Indexed Bonds | 0.375% | 1/15/27 | 50,465 | 48,809 | ||
| United States Treasury Inflation Indexed Bonds | 2.375% | 1/15/27 | 24,996 | 25,254 | ||
| United States Treasury Inflation Indexed Bonds | 0.125% | 4/15/27 | 62,729 | 60,063 | ||
| United States Treasury Inflation Indexed Bonds | 0.375% | 7/15/27 | 55,762 | 53,845 | ||
| United States Treasury Inflation Indexed Bonds | 1.625% | 10/15/27 | 62,902 | 62,755 | ||
| United States Treasury Inflation Indexed Bonds | 0.500% | 1/15/28 | 56,973 | 54,641 | ||
| United States Treasury Inflation Indexed Bonds | 1.750% | 1/15/28 | 23,629 | 23,573 | ||
| United States Treasury Inflation Indexed Bonds | 1.250% | 4/15/28 | 62,073 | 60,783 | ||
| United States Treasury Inflation Indexed Bonds | 3.625% | 4/15/28 | 24,156 | 25,548 | ||
| United States Treasury Inflation Indexed Bonds | 0.750% | 7/15/28 | 49,464 | 47,795 | ||
| United States Treasury Inflation Indexed Bonds | 2.375% | 10/15/28 | 63,919 | 65,457 | ||
| United States Treasury Inflation Indexed Bonds | 0.875% | 1/15/29 | 42,567 | 40,951 | ||
| United States Treasury Inflation Indexed Bonds | 2.500% | 1/15/29 | 21,798 | 22,384 | ||
| United States Treasury Inflation Indexed Bonds | 2.125% | 4/15/29 | 66,297 | 67,011 | ||
| United States Treasury Inflation Indexed Bonds | 3.875% | 4/15/29 | 27,674 | 30,013 | ||
| United States Treasury Inflation Indexed Bonds | 0.250% | 7/15/29 | 50,293 | 46,946 | ||
| United States Treasury Inflation Indexed Bonds | 1.625% | 10/15/29 | 35,516 | 35,271 | ||
| Total U.S. Government and Agency Obligations (Cost $1,287,318) | 1,270,449 | |||||
| Shares | ||||||
| Temporary Cash Investments (30.0%) | ||||||
| Money Market Fund (9.0%) | ||||||
| 1 | Vanguard Market Liquidity Fund | 4.834% | 1,501,496 | 150,135 | ||
| Maturity Date | Face Amount ($000) | |||||
| U.S. Government and Agency Obligations (21.0%) | ||||||
| 2 | United States Treasury Bill | 4.964% | 11/5/24 | 20,150 | 20,139 | |
| 2 | United States Treasury Bill | 4.938% | 11/12/24 | 13,600 | 13,580 | |
| 2 | United States Treasury Bill | 5.141% | 11/14/24 | 4,375 | 4,368 | |
| 2,3 | United States Treasury Bill | 5.073% | 11/21/24 | 3,700 | 3,690 | |
| 2,3 | United States Treasury Bill | 5.024% | 12/5/24 | 27,600 | 27,480 | |
| 2 | United States Treasury Bill | 4.996% | 12/10/24 | 6,200 | 6,169 | |
| 2,3 | United States Treasury Bill | 4.547%–4.875% | 12/19/24 | 15,200 | 15,108 | |
| 2 | United States Treasury Bill | 4.503%–4.541% | 12/24/24 | 70,700 | 70,223 | |
| 2 | United States Treasury Bill | 4.541% | 1/2/25 | 40,474 | 40,159 | |
| 2,3 | United States Treasury Bill | 4.602% | 1/9/25 | 31,325 | 31,056 | |
| 2,3 | United States Treasury Bill | 4.536%–4.554% | 1/14/25 | 22,630 | 22,423 | |
| 2,3 | United States Treasury Bill | 4.538%–4.545% | 1/16/25 | 22,220 | 22,011 | |
| 2,3 | United States Treasury Bill | 4.566% | 1/23/25 | 33,870 | 33,524 | |
| 2 | United States Treasury Bill | 4.553% | 1/30/25 | 20,235 | 20,010 | |
| Coupon | Maturity Date | Face Amount ($000) | Market Value• ($000) | |||
| 2 | United States Treasury Bill | 4.567% | 2/4/25 | 21,940 | 21,683 | |
| 351,623 | ||||||
| Total Temporary Cash Investments (Cost $501,715) | 501,758 | |||||
| Total Investments (106.0%) (Cost $1,789,033) | 1,772,207 | |||||
| Other Assets and Liabilities—Net (-6.0%) | (99,684) | |||||
| Net Assets (100%) | 1,672,523 | |||||
| Cost is in $000. | ||||||
| • | See Note A in Notes to Consolidated Financial Statements. |
| 1 | Affiliated money market fund available only to Vanguard funds and certain trusts and accounts managed by Vanguard. Rate shown is the 7-day yield. |
| 2 | Security is owned by the Vanguard CSF Portfolio, which is a wholly owned subsidiary of the Commodity Strategy Fund. |
| 3 | Securities with a value of $26,802,000 have been segregated as collateral for open over-the-counter swap contracts. |
| Over-the-Counter Total Return Swaps | ||||||
| Reference Entity | Termination Date | Counterparty | Notional Amount ($000) | Fixed Interest Rate Received (Paid)1 (%) | Value and Unrealized Appreciation ($000) | Value and Unrealized (Depreciation) ($000) |
| Bloomberg Commodity Index2 | 11/5/24 | BANA | 80,000 | (0.060) | — | (2,718) |
| Bloomberg Commodity Index2 | 11/12/24 | BARC | 10,000 | (0.100) | — | (133) |
| Bloomberg Commodity Index 2 Month Forward2 | 11/12/24 | BARC | 175,000 | (0.110) | — | (2,280) |
| Bloomberg Commodity Index 3 Month Forward2 | 11/20/24 | GSI | 70,000 | (0.120) | — | (1,264) |
| BofA Merrill Lynch Commodity MLBXAKSV Excess Return Strategy2,3 | 11/5/24 | BANA | 50,000 | (0.170) | — | (652) |
| BofA Merrill Lynch Commodity MLBXAKSV Excess Return Strategy2,3 | 11/5/24 | BANA | 30,000 | (0.170) | — | (655) |
| BofA Merrill Lynch Commodity MLBXSTGV Excess Return Strategy2,3 | 11/5/24 | BANA | 195,000 | (0.110) | — | (5,989) |
| BofA Merrill Lynch Commodity MLBXSTGV Excess Return Strategy2,3 | 11/5/24 | BANA | 55,000 | (0.110) | — | (2,043) |
| BofA Merrill Lynch Commodity MLCILP3E Excess Return Strategy2,3 | 11/5/24 | BANA | 135,000 | (0.140) | — | (4,067) |
| CIBC Commodity CIBZC51EC Excess Return Strategy2,3 | 11/5/24 | CIBC | 160,000 | (0.160) | — | (4,241) |
| CIBC Commodity CIBZC51EC Excess Return Strategy2,3 | 11/5/24 | CIBC | 20,000 | (0.160) | — | (644) |
| Goldman Sachs Commodity i-Select Strategy 11292,3 | 11/20/24 | GSI | 175,000 | (0.120) | — | (3,088) |
| Macquarie Commodity MQCP170E Excess Return Strategy2,3 | 11/12/24 | MACQ | 170,000 | (0.150) | — | (2,192) |
| Modified Strategy DBS18 on the Bloomberg Commodity Index2,3 | 11/20/24 | GSI | 30,000 | (0.120) | — | (541) |
| RBC Commodity RBCACB23 Excess Return Strategy2,3 | 11/12/24 | RBC | 155,000 | (0.130) | — | (1,903) |
| RBC Commodity RBCSVBW1 Excess Return Strategy2,3 | 11/12/24 | RBC | 30,000 | (0.160) | — | (138) |
| Societe Generale Commodity SGIXCSB1 Excess Return Strategy2,3 | 11/5/24 | SOCG | 140,000 | (0.170) | — | (4,673) |
| Societe Generale Commodity SGIXCSB1 Excess Return Strategy2,3 | 11/5/24 | SOCG | 30,000 | (0.170) | — | (1,223) |
| — | (38,444) | |||||
| 1 | Fixed interest payment received/paid monthly. |
| 2 | Security is owned by the subsidiary. |
| 3 | Information on the components of the reference entity is available on www.vanguard.com. |
| BANA—Bank of America, N.A. | |
| BARC—Barclays Bank plc. | |
| CIBC—Canadian Imperial Bank of Commerce. | |
| GSI—Goldman Sachs International. | |
| MACQ—Macquarie Bank Ltd. | |
| RBC—Royal Bank of Canada. | |
| SOCG—Société Generale. |
| ($000s, except shares, footnotes, and per-share amounts) | Amount |
| Assets | |
| Investments in Securities, at Value | |
| Unaffiliated Issuers (Cost $1,638,909) | 1,622,072 |
| Affiliated Issuers (Cost $150,124) | 150,135 |
| Total Investments in Securities | 1,772,207 |
| Investment in Vanguard | 40 |
| Cash | 11 |
| Receivables for Accrued Income | 2,546 |
| Receivables for Capital Shares Issued | 1,028 |
| Total Assets | 1,775,832 |
| Liabilities | |
| Payables for Investment Securities Purchased | 59,984 |
| Payables for Capital Shares Redeemed | 4,717 |
| Payables to Vanguard | 164 |
| Unrealized Depreciation—Over-the-Counter Swap Contracts | 38,444 |
| Total Liabilities | 103,309 |
| Net Assets | 1,672,523 |
| At October 31, 2024, net assets consisted of: | |
| Paid-in Capital | 1,731,902 |
| Total Distributable Earnings (Loss) | (59,379) |
| Net Assets | 1,672,523 |
| Net Assets | |
| Applicable to 64,686,218 outstanding $.001 par value shares of beneficial interest (unlimited authorization) | 1,672,523 |
| Net Asset Value Per Share | $25.86 |
| Year Ended October 31, 2024 | |
| ($000) | |
| Investment Income | |
| Income | |
| Interest1 | 49,246 |
| Total Income | 49,246 |
| Expenses | |
| The Vanguard Group—Note B | |
| Investment Advisory Services | 201 |
| Management and Administrative | 2,539 |
| Marketing and Distribution | 73 |
| Custodian Fees | 69 |
| Auditing Fees | 51 |
| Shareholders’ Reports | 56 |
| Trustees’ Fees and Expenses—Note B | 23 |
| Other Expenses | 17 |
| Total Expenses | 3,029 |
| Expenses Paid Indirectly | (57) |
| Net Expenses | 2,972 |
| Net Investment Income | 46,274 |
| Realized Net Gain (Loss) | |
| Investment Securities Sold1 | (15,828) |
| Swap Contracts | (9,191) |
| Realized Net Gain (Loss) | (25,019) |
| Change in Unrealized Appreciation (Depreciation) | |
| Investment Securities1 | 55,475 |
| Swap Contracts | (60,755) |
| Change in Unrealized Appreciation (Depreciation) | (5,280) |
| Net Increase (Decrease) in Net Assets Resulting from Operations | 15,975 |
| 1 | Interest income, realized net gain (loss), capital gain distributions received, and change in unrealized appreciation (depreciation) from an affiliated company of the fund were $4,695,000, ($6,000), less than $1,000, and ($8,000), respectively. Purchases and sales are for temporary cash investment purposes. |
| Year Ended October 31, | ||
| 2024 ($000) | 2023 ($000) | |
| Increase (Decrease) in Net Assets | ||
| Operations | ||
| Net Investment Income | 46,274 | 54,980 |
| Realized Net Gain (Loss) | (25,019) | (192,924) |
| Change in Unrealized Appreciation (Depreciation) | (5,280) | 78,393 |
| Net Increase (Decrease) in Net Assets Resulting from Operations | 15,975 | (59,551) |
| Distributions | ||
| Total Distributions | (36,432) | (244,178) |
| Capital Share Transactions | ||
| Issued | 798,800 | 780,178 |
| Issued in Lieu of Cash Distributions | 25,590 | 186,091 |
| Redeemed | (715,306) | (1,072,899) |
| Net Increase (Decrease) from Capital Share Transactions | 109,084 | (106,630) |
| Total Increase (Decrease) | 88,627 | (410,359) |
| Net Assets | ||
| Beginning of Period | 1,583,896 | 1,994,255 |
| End of Period | 1,672,523 | 1,583,896 |
| For a Share Outstanding Throughout Each Period | Year Ended October 31, | ||||
| 2024 | 2023 | 2022 | 2021 | 2020 | |
| Net Asset Value, Beginning of Period | $26.02 | $30.69 | $36.85 | $24.32 | $24.83 |
| Investment Operations | |||||
| Net Investment Income1 | .816 | .826 | 1.474 | .890 | .265 |
| Net Realized and Unrealized Gain (Loss) on Investments | (.359) | (1.612) | .751 | 11.774 | (.620) |
| Total from Investment Operations | .457 | (.786) | 2.225 | 12.664 | (.355) |
| Distributions | |||||
| Dividends from Net Investment Income | (.617) | (3.884) | (8.385) | (.134) | (.155) |
| Distributions from Realized Capital Gains | — | — | — | — | — |
| Total Distributions | (.617) | (3.884) | (8.385) | (.134) | (.155) |
| Net Asset Value, End of Period | $25.86 | $26.02 | $30.69 | $36.85 | $24.32 |
| Total Return2 | 1.85% | -3.03% | 9.80% | 52.30% | -1.45% |
| Ratios/Supplemental Data | |||||
| Net Assets, End of Period (Millions) | $1,673 | $1,584 | $1,994 | $1,686 | $373 |
| Ratio of Total Expenses to Average Net Assets | 0.21%3 | 0.21%3 | 0.21%3 | 0.20% | 0.20% |
| Ratio of Net Investment Income to Average Net Assets | 3.20% | 3.08% | 4.47% | 2.79% | 1.15% |
| Portfolio Turnover Rate | 52% | 30% | 47% | 15% | 38% |
| 1 | Calculated based on average shares outstanding. |
| 2 | Total returns do not include account service fees that may have applied in the periods shown. Fund prospectuses provide information about any applicable account service fees. |
| 3 | The ratio of expenses to average net assets for the period net of reduction from custody fee offset arrangements was 0.21%. |
| A. | The following significant accounting policies conform to generally accepted accounting principles for U.S. investment companies. The fund consistently follows such policies in preparing its financial statements. |
| Assets Reflected in Consolidated Statement of Assets and Liabilities1 ($000) | Liabilities Reflected in Consolidated Statement of Assets and Liabilities1 ($000) | Net Amount Receivable (Payable) ($000) | Amounts Not Offset in the Consolidated Statement of Assets and Liabilities | Net Exposure3 (Not Less Than $0) ($000) | ||
| Collateral Pledged2 ($000) | Collateral Received2 ($000) | |||||
| Derivatives Subject to Offsetting Arrangements, by Counterparty | ||||||
| Bank of America, N.A. | — | (16,124) | (16,124) | 12,603 | — | — |
| Barclays Bank plc | — | (2,413) | (2,413) | 1,074 | — | — |
| Canadian Imperial Bank of Commerce | — | (4,885) | (4,885) | 3,687 | — | — |
| Goldman Sachs International | — | (4,893) | (4,893) | 2,982 | — | — |
| Macquarie Bank Ltd. | — | (2,192) | (2,192) | 966 | — | — |
| Royal Bank of Canada | — | (2,041) | (2,041) | 849 | — | — |
| Société Generale | — | (5,896) | (5,896) | 4,641 | — | — |
| Total | — | (38,444) | (38,444) | 26,802 | — | — |
| B. | In accordance with the terms of a Funds' Service Agreement (the “FSA”) between Vanguard and the fund, Vanguard furnishes to the fund investment advisory, corporate management, administrative, marketing, and distribution services at Vanguard’s cost of operations (as defined by the FSA). These costs of operations are allocated to the fund based on methods and guidelines approved by the board of trustees and are generally settled twice a month. |
| C. | The fund’s custodian bank has agreed to reduce its fees when the fund maintains cash on deposit in the non-interest-bearing custody account. For the year ended October 31, 2024, custodian fee offset arrangements reduced the fund’s expenses by $57,000 (an annual rate of less than 0.01% of average net assets). |
| D. | Various inputs may be used to determine the value of the fund’s investments and derivatives. These inputs are summarized in three broad levels for financial statement purposes. The inputs or methodologies used to value securities are not necessarily an indication of the risk associated with investing in those securities. |
| Level 1 ($000) | Level 2 ($000) | Level 3 ($000) | Total ($000) | |
| Investments | ||||
| Assets | ||||
| U.S. Government and Agency Obligations | — | 1,270,449 | — | 1,270,449 |
| Temporary Cash Investments | 150,135 | 351,623 | — | 501,758 |
| Total | 150,135 | 1,622,072 | — | 1,772,207 |
| Derivative Financial Instruments | ||||
| Liabilities | ||||
| Swap Contracts | — | (38,444) | — | (38,444) |
| E. | Permanent differences between book-basis and tax-basis components of net assets are reclassified among capital accounts in the financial statements to reflect their tax character. These reclassifications have no effect on net assets or net asset value per share. As of period end, permanent differences primarily attributable to the accounting for operations of the subsidiary were reclassified between the following accounts: |
| Amount ($000) | |
| Paid-in Capital | (55,631) |
| Total Distributable Earnings (Loss) | 55,631 |
| Amount ($000) | |
| Undistributed Ordinary Income | 29,684 |
| Undistributed Long-Term Gains | — |
| Net Unrealized Gains (Losses) | (17,803) |
| Capital Loss Carryforwards | (71,260) |
| Qualified Late-Year Losses | — |
| Other Temporary Differences | — |
| Total | (59,379) |
| Year Ended October 31, | ||
| 2024 Amount ($000) | 2023 Amount ($000) | |
| Ordinary Income* | 36,432 | 244,178 |
| Long-Term Capital Gains | — | — |
| Total | 36,432 | 244,178 |
| * | Includes short-term capital gains, if any. |
| Amount ($000) | |
| Tax Cost | 1,790,010 |
| Gross Unrealized Appreciation | 38,492 |
| Gross Unrealized Depreciation | (56,295) |
| Net Unrealized Appreciation (Depreciation) | (17,803) |
| F. | During the year ended October 31, 2024, the fund purchased $556,780,000 of investment securities and sold $574,169,000 of investment securities, other than temporary cash investments. |
| G. | Capital shares issued and redeemed were: |
| Year Ended October 31, | ||
| 2024 Shares (000) | 2023 Shares (000) | |
| Issued | 30,972 | 28,765 |
| Issued in Lieu of Cash Distributions | 1,028 | 6,887 |
| Redeemed | (28,190) | (39,756) |
| Net Increase (Decrease) in Shares Outstanding | 3,810 | (4,104) |
| H. | Significant market disruptions, such as those caused by pandemics, natural or environmental disasters, war, acts of terrorism, or other events, can adversely affect local and global markets and normal market operations. Any such disruptions could have an adverse impact on the value of the fund’s investments and fund performance. |
| I. | Management has determined that no events or transactions occurred subsequent to October 31, 2024, that would require recognition or disclosure in these financial statements. |
Philadelphia, Pennsylvania
December 20, 2024

Financial Statements | 1 |
Report of Independent Registered Public Accounting Firm | 11 |
Tax information | 12 |
| Shares | Market Value• ($000) | ||
| Common Stocks (97.0%) | |||
| China (12.2%) | |||
| Contemporary Amperex Technology Co. Ltd. Class A | 106,837 | 3,705 | |
| Zhejiang Sanhua Intelligent Controls Co. Ltd. Class A | 911,395 | 2,789 | |
| 1 | Yadea Group Holdings Ltd. | 936,000 | 1,617 |
| Sungrow Power Supply Co. Ltd. Class A | 121,711 | 1,550 | |
| 9,661 | |||
| Denmark (12.7%) | |||
| *,1 | Orsted A/S | 68,530 | 4,033 |
| Novonesis (Novozymes) B Class B | 57,525 | 3,615 | |
| * | Vestas Wind Systems A/S | 128,090 | 2,441 |
| 10,089 | |||
| France (4.7%) | |||
| Schneider Electric SE | 14,287 | 3,701 | |
| Germany (3.9%) | |||
| Infineon Technologies AG | 97,695 | 3,089 | |
| India (3.3%) | |||
| Power Grid Corp. of India Ltd. | 690,954 | 2,628 | |
| Italy (0.4%) | |||
| Industrie De Nora SpA | 38,003 | 358 | |
| Japan (2.6%) | |||
| Shimadzu Corp. | 69,800 | 2,059 | |
| Spain (6.7%) | |||
| Iberdrola SA (XMAD) | 357,321 | 5,308 | |
| Taiwan (5.1%) | |||
| Delta Electronics Inc. | 208,000 | 2,569 | |
| Voltronic Power Technology Corp. | 22,000 | 1,447 | |
| 4,016 | |||
| United Kingdom (4.6%) | |||
| Croda International plc | 31,751 | 1,524 | |
| Spectris plc | 41,984 | 1,367 | |
| Spirax Group plc | 9,251 | 772 | |
| 3,663 | |||
| United States (40.8%) | |||
| NextEra Energy Inc. | 65,034 | 5,154 | |
| Waste Management Inc. | 22,846 | 4,931 | |
| * | ANSYS Inc. | 12,901 | 4,134 |
| * | Autodesk Inc. | 13,793 | 3,914 |
| TE Connectivity plc | 24,446 | 3,604 | |
| Tetra Tech Inc. | 63,888 | 3,123 | |
| AECOM | 25,306 | 2,703 | |
| * | Aptiv plc | 44,525 | 2,530 |
| Rockwell Automation Inc. | 8,256 | 2,202 | |
| 32,295 | |||
| Total Common Stocks (Cost $70,858) | 76,867 | ||
| Shares | Market Value• ($000) | ||
| Temporary Cash Investments (3.2%) | |||
| Money Market Fund (3.2%) | |||
| 2 | Vanguard Market Liquidity Fund, 4.834% (Cost $2,521) | 25,211 | 2,521 |
| Total Investments (100.2%) (Cost $73,379) | 79,388 | ||
| Other Assets and Liabilities—Net (-0.2%) | (140) | ||
| Net Assets (100%) | 79,248 | ||
| Cost is in $000. | |||
| • | See Note A in Notes to Financial Statements. |
| * | Non-income-producing security. |
| 1 | Security exempt from registration under Rule 144A of the Securities Act of 1933. Such securities may be sold in transactions exempt from registration, normally to qualified institutional buyers. At October 31, 2024, the aggregate value was $5,650,000, representing 7.1% of net assets. |
| 2 | Affiliated money market fund available only to Vanguard funds and certain trusts and accounts managed by Vanguard. Rate shown is the 7-day yield. |
| ($000s, except shares, footnotes, and per-share amounts) | Amount |
| Assets | |
| Investments in Securities, at Value | |
| Unaffiliated Issuers (Cost $70,858) | 76,867 |
| Affiliated Issuers (Cost $2,521) | 2,521 |
| Total Investments in Securities | 79,388 |
| Investment in Vanguard | 2 |
| Cash | 384 |
| Foreign Currency, at Value (Cost $25) | 16 |
| Receivables for Accrued Income | 47 |
| Receivables for Capital Shares Issued | 61 |
| Total Assets | 79,898 |
| Liabilities | |
| Payables for Investment Securities Purchased | 379 |
| Payables to Investment Advisor | 62 |
| Payables for Capital Shares Redeemed | 14 |
| Payables to Vanguard | 11 |
| Deferred Foreign Capital Gains Taxes | 184 |
| Total Liabilities | 650 |
| Net Assets | 79,248 |
| At October 31, 2024, net assets consisted of: | |
| Paid-in Capital | 75,720 |
| Total Distributable Earnings (Loss) | 3,528 |
| Net Assets | 79,248 |
| Investor Shares—Net Assets | |
| Applicable to 1,069,233 outstanding $.001 par value shares of beneficial interest (unlimited authorization) | 22,543 |
| Net Asset Value Per Share—Investor Shares | $21.08 |
| Admiral™ Shares—Net Assets | |
| Applicable to 2,148,081 outstanding $.001 par value shares of beneficial interest (unlimited authorization) | 56,705 |
| Net Asset Value Per Share—Admiral Shares | $26.40 |
| Year Ended October 31, 2024 | |
| ($000) | |
| Investment Income | |
| Income | |
| Dividends1 | 933 |
| Non-Cash Dividends | 217 |
| Interest2 | 77 |
| Total Income | 1,227 |
| Expenses | |
| Investment Advisory Fees—Note B | |
| Basic Fee | 248 |
| Performance Adjustment | (18) |
| The Vanguard Group—Note C | |
| Management and Administrative—Investor Shares | 40 |
| Management and Administrative—Admiral Shares | 66 |
| Custodian Fees | 12 |
| Auditing Fees | 38 |
| Shareholders’ Reports and Proxy Fees—Investor Shares | 22 |
| Shareholders’ Reports and Proxy Fees—Admiral Shares | 5 |
| Trustees’ Fees and Expenses | — |
| Professional Services | 30 |
| Other Expenses | 1 |
| Total Expenses | 444 |
| Expenses Paid Indirectly | (4) |
| Net Expenses | 440 |
| Net Investment Income | 787 |
| Realized Net Gain (Loss) | |
| Investment Securities Sold2,3 | (2,326) |
| Foreign Currencies | (32) |
| Realized Net Gain (Loss) | (2,358) |
| Change in Unrealized Appreciation (Depreciation) | |
| Investment Securities2,4 | 13,005 |
| Foreign Currencies | (8) |
| Change in Unrealized Appreciation (Depreciation) | 12,997 |
| Net Increase (Decrease) in Net Assets Resulting from Operations | 11,426 |
| 1 | Dividends are net of foreign withholding taxes of $65,000. |
| 2 | Interest income, realized net gain (loss), capital gain distributions received, and change in unrealized appreciation (depreciation) from an affiliated company of the fund were $71,000, ($1,000), less than $1,000, and ($1,000), respectively. Purchases and sales are for temporary cash investment purposes. |
| 3 | Realized gain (loss) is net of foreign capital gain taxes of $19,000. |
| 4 | The change in unrealized appreciation (depreciation) is net of the change in deferred foreign capital gains taxes of $153,000. |
| Year Ended October 31, 2024 | November 2, 20221 to October 31, 2023 | ||
| ($000) | ($000) | ||
| Increase (Decrease) in Net Assets | |||
| Operations | |||
| Net Investment Income | 787 | 421 | |
| Realized Net Gain (Loss) | (2,358) | (261) | |
| Change in Unrealized Appreciation (Depreciation) | 12,997 | (7,182) | |
| Net Increase (Decrease) in Net Assets Resulting from Operations | 11,426 | (7,022) | |
| Distributions | |||
| Investor Shares | (296) | — | |
| Admiral Shares | (508) | — | |
| Total Distributions | (804) | — | |
| Capital Share Transactions | |||
| Investor Shares | 1,434 | 20,111 | |
| Admiral Shares | 23,478 | 30,625 | |
| Net Increase (Decrease) from Capital Share Transactions | 24,912 | 50,736 | |
| Total Increase (Decrease) | 35,534 | 43,714 | |
| Net Assets | |||
| Beginning of Period | 43,714 | — | |
| End of Period | 79,248 | 43,714 | |
| 1 | Commencement of subscription period for the fund. |
| Investor Shares | ||
| For a Share Outstanding Throughout Each Period | Year Ended October 31, 2024 | November 2, 20221 to October 31, 2023 |
| Net Asset Value, Beginning of Period | $17.52 | $20.00 |
| Investment Operations | ||
| Net Investment Income2 | .199 | .188 |
| Net Realized and Unrealized Gain (Loss) on Investments | 3.664 | (2.668) |
| Total from Investment Operations | 3.863 | (2.480) |
| Distributions | ||
| Dividends from Net Investment Income | (.159) | — |
| Distributions from Realized Capital Gains | (.144) | — |
| Total Distributions | (.303) | — |
| Net Asset Value, End of Period | $21.08 | $17.52 |
| Total Return3 | 22.20% | -12.40% |
| Ratios/Supplemental Data | ||
| Net Assets, End of Period (Millions) | $23 | $17 |
| Ratio of Total Expenses to Average Net Assets | 0.73%4,5 | 0.77%4,6 |
| Ratio of Net Investment Income to Average Net Assets | 0.99% | 0.98%6 |
| Portfolio Turnover Rate | 38% | 35% |
| 1 | The subscription period for the fund was November 2, 2022, to November 15, 2022, during which time all assets were held in cash. Performance measurement began November 16, 2022, the first business day after the subscription period, at a net asset value of $20.00. |
| 2 | Calculated based on average shares outstanding. |
| 3 | Total returns do not include account service fees that may have applied in the periods shown. Fund prospectuses provide information about any applicable account service fees. |
| 4 | The ratio of expenses to average net assets for the period net of reduction from custody fee offset arrangements was 0.73% and 0.75%, respectively. |
| 5 | Includes performance-based investment advisory fee increases (decreases) of (0.02%). |
| 6 | Annualized. |
| Admiral Shares | ||
| For a Share Outstanding Throughout Each Period | Year Ended October 31, 2024 | November 2, 20221 to October 31, 2023 |
| Net Asset Value, Beginning of Period | $21.93 | $25.00 |
| Investment Operations | ||
| Net Investment Income2 | .294 | .279 |
| Net Realized and Unrealized Gain (Loss) on Investments | 4.585 | (3.349) |
| Total from Investment Operations | 4.879 | (3.070) |
| Distributions | ||
| Dividends from Net Investment Income | (.229) | — |
| Distributions from Realized Capital Gains | (.180) | — |
| Total Distributions | (.409) | — |
| Net Asset Value, End of Period | $26.40 | $21.93 |
| Total Return3 | 22.42% | -12.28% |
| Ratios/Supplemental Data | ||
| Net Assets, End of Period (Millions) | $57 | $26 |
| Ratio of Total Expenses to Average Net Assets | 0.58%4,5 | 0.62%4,6 |
| Ratio of Net Investment Income to Average Net Assets | 1.16% | 1.16%6 |
| Portfolio Turnover Rate | 38% | 35% |
| 1 | The subscription period for the fund was November 2, 2022, to November 15, 2022, during which time all assets were held in cash. Performance measurement began November 16, 2022, the first business day after the subscription period, at a net asset value of $25.00. |
| 2 | Calculated based on average shares outstanding. |
| 3 | Total returns do not include account service fees that may have applied in the periods shown. Fund prospectuses provide information about any applicable account service fees. |
| 4 | The ratio of expenses to average net assets for the period net of reduction from custody fee offset arrangements was 0.58% and 0.60%, respectively. |
| 5 | Includes performance-based investment advisory fee increases (decreases) of (0.02%). |
| 6 | Annualized. |
| A. | The following significant accounting policies conform to generally accepted accounting principles for U.S. investment companies. The fund consistently follows such policies in preparing its financial statements. |
| B. | Ninety One North America, Inc. provides investment advisory services to the fund for a fee calculated at an annual percentage rate of average net assets. The basic fee is subject to quarterly adjustments based on the fund’s performance relative to the MSCI All Country World Index since January 31, 2023. For the year ended October 31, 2024, the investment advisory fee represented an effective annual basic rate of 0.35% of the fund’s average net assets, before a net decrease of $18,000 (0.02%) based on performance. |
| C. | In accordance with the terms of a Funds' Service Agreement (the “FSA”) between Vanguard and the fund, Vanguard furnishes to the fund corporate management, administrative, marketing, distribution and cash management services at Vanguard’s cost of operations (as defined by the FSA). These costs of operations are allocated to the fund based on methods and guidelines approved by the board of trustees and are generally settled twice a month. |
| D. | The fund’s custodian bank has agreed to reduce its fees when the fund maintains cash on deposit in the non-interest-bearing custody account. For the year ended October 31, 2024, custodian fee offset arrangements reduced the fund’s expenses by $4,000 (an annual rate of less than 0.01% of average net assets). |
| E. | Various inputs may be used to determine the value of the fund’s investments. These inputs are summarized in three broad levels for financial statement purposes. The inputs or methodologies used to value securities are not necessarily an indication of the risk associated with investing in those securities. |
| Level 1 ($000) | Level 2 ($000) | Level 3 ($000) | Total ($000) | |
| Investments | ||||
| Assets | ||||
| Common Stocks—North and South America | 32,295 | — | — | 32,295 |
| Common Stocks—Other | — | 44,572 | — | 44,572 |
| Temporary Cash Investments | 2,521 | — | — | 2,521 |
| Total | 34,816 | 44,572 | — | 79,388 |
| F. | Permanent differences between book-basis and tax-basis components of net assets are reclassified among capital accounts in the financial statements to reflect their tax character. These reclassifications have no effect on net assets or net asset value per share. As of period end, permanent differences primarily attributable to the accounting for foreign currency transactions, distributions in connection with fund share redemptions, and tax expense on capital gains were reclassified between the following accounts: |
| Amount ($000) | |
| Paid-in Capital | 1 |
| Total Distributable Earnings (Loss) | (1) |
| Amount ($000) | |
| Undistributed Ordinary Income | 665 |
| Undistributed Long-Term Gains | — |
| Net Unrealized Gains (Losses) | 5,311 |
| Capital Loss Carryforwards | (2,454) |
| Qualified Late-Year Losses | — |
| Other Temporary Differences | 6 |
| Total | 3,528 |
| Year Ended October 31, | ||
| 2024 Amount ($000) | 2023 Amount ($000) | |
| Ordinary Income* | 804 | — |
| Long-Term Capital Gains | — | — |
| Total | 804 | — |
| * | Includes short-term capital gains, if any. |
| Amount ($000) | |
| Tax Cost | 73,883 |
| Gross Unrealized Appreciation | 11,051 |
| Gross Unrealized Depreciation | (5,546) |
| Net Unrealized Appreciation (Depreciation) | 5,505 |
| G. | During the year ended October 31, 2024, the fund purchased $48,547,000 of investment securities and sold $26,133,000 of investment securities, other than temporary cash investments. |
| H. | Capital share transactions for each class of shares were: |
| Year Ended October 31, 2024 | November 2, 20221 to October 31, 2023 | ||||
| Amount ($000) | Shares (000) | Amount ($000) | Shares (000) | ||
| Investor Shares | |||||
| Issued | 9,124 | 458 | 26,143 | 1,298 | |
| Issued in Lieu of Cash Distributions | 254 | 13 | — | — | |
| Redeemed | (7,944) | (400) | (6,032) | (300) | |
| Net Increase (Decrease)—Investor Shares | 1,434 | 71 | 20,111 | 998 | |
| Admiral Shares | |||||
| Issued | 31,528 | 1,273 | 37,053 | 1,468 | |
| Issued in Lieu of Cash Distributions | 378 | 16 | — | — | |
| Redeemed | (8,428) | (337) | (6,428) | (272) | |
| Net Increase (Decrease)—Admiral Shares | 23,478 | 952 | 30,625 | 1,196 | |
| 1 | Commencement of subscription period for the fund. |
| I. | Significant market disruptions, such as those caused by pandemics, natural or environmental disasters, war, acts of terrorism, or other events, can adversely affect local and global markets and normal market operations. Any such disruptions could have an adverse impact on the value of the fund’s investments and fund performance. |
| J. | Management has determined that no events or transactions occurred subsequent to October 31, 2024, that would require recognition or disclosure in these financial statements. |
Philadelphia, Pennsylvania
December 20, 2024
Item 8: Changes in and Disagreements with Accountants for Open-End Management Investment Companies.
Not applicable.
Item 9: Proxy Disclosures for Open-End Management Investment Companies.
Not applicable.
Item 10: Remuneration Paid to Directors, Officers, and Others of Open-End Management Investment Companies.
Not applicable. The Trustees’ Fees and Expenses are included in the financial statements filed under Item 7 of this Form.
Item 11: Statement Regarding Basis for Approval of Investment Advisory Contracts.
Not applicable.
Item 12: Disclosure of Proxy Voting Policies and Procedures for Closed-End Management Investment Companies.
Not applicable.
Item 13: Portfolio Managers of Closed-End Management Investment Companies.
Not applicable.
Item 14: Purchase of Equity Securities by Closed-End Management Investment Company and Affiliated Purchasers.
Not applicable.
Item 15: Submission of Matters to a Vote of Security Holders.
Not applicable.
Item 16: Controls and Procedures.
(a) Disclosure Controls and Procedures. The Principal Executive and Financial Officers concluded that the Registrant’s disclosure controls and procedures are effective based on their evaluation of the disclosure controls and procedures as of a date within 90 days of the filing date of this report.
(b) Internal Control Over Financial Reporting. In February 2024, a third-party service provider began performing security pricing services for the Registrant. There were no other changes in the Registrant’s internal control over financial reporting or in other factors that could significantly affect this control during the period covered by this report, including any corrective actions with regard to significant deficiencies and material weaknesses.
Item 17: Disclosure of Securities Lending Activities for Closed-End Management Investment Companies.
Not applicable.
Item 18: Recovery of Erroneously Awarded Compensation.
Not applicable.
Item 19: Exhibits.
| (a)(1) | Code of Ethics filed herewith. |
| (a)(2) | Certifications filed herewith. |
| (a)(2) | Certifications filed herewith. |
Pursuant to the requirements of the Securities Exchange Act of 1934 and the Investment Company Act of 1940, the registrant has duly caused this report to be signed on its behalf by the undersigned, thereunto duly authorized.
| VANGUARD TRUSTEES’ EQUITY FUND | ||
| BY: | /s/ SALIM RAMJI* | |
| SALIM RAMJI | ||
| CHIEF EXECUTIVE OFFICER |
Date: December 23, 2024
Pursuant to the requirements of the Securities Exchange Act of 1934 and the Investment Company Act of 1940, this report has been signed below by the following persons on behalf of the registrant and in the capacities and on the dates indicated.
| VANGUARD TRUSTEES’ EQUITY FUND | ||
| BY: | /s/ SALIM RAMJI* | |
| SALIM RAMJI | ||
| CHIEF EXECUTIVE OFFICER |
Date: December 23, 2024
| VANGUARD TRUSTEES’ EQUITY FUND | ||
| BY: | /s/ CHRISTINE BUCHANAN* | |
| CHRISTINE BUCHANAN | ||
| CHIEF FINANCIAL OFFICER |
Date: December 23, 2024
| * By: | /s/ John E. Schadl |
John E. Schadl, pursuant to a Power of Attorney filed on December 20, 2024 (see File Number 33-49023) and a Power of Attorney filed on July 25, 2024 (see File Number 33-48863), each Incorporated by Reference.