UNITED STATES
SECURITIES AND EXCHANGE COMMISSION
Washington, D.C. 20549
FORM N-CSR
CERTIFIED SHAREHOLDER REPORT
OF
REGISTERED MANAGEMENT INVESTMENT COMPANIES
Investment Company Act file number: 811-02968-99
| Name of Registrant: | Vanguard Trustees’ Equity Fund |
| Address of Registrant: | P.O. Box 2600 |
| Valley Forge, PA 19482 |
| Name and address of agent for service: | Anne E. Robinson, Esquire |
| P.O. Box 876 | |
| Valley Forge, PA 19482 |
Registrant’s telephone number, including area code: (610) 669-1000
Date of fiscal year end: October 31
Date of reporting period: November 1, 2021—October 31, 2022
Item 1: Reports to Shareholders

| 1 | |
| 2 | |
| 7 | |
| 9 | |
| 11 |
| • | The 12 months ended October 31, 2022, were a volatile, challenging period for financial markets. Vanguard International Value Fund returned –21.28%, which, was ahead of the –24.73% return of its benchmark. |
| • | The global economic backdrop deteriorated as inflation reached multidecade highs, notably in energy and food prices after Russia invaded Ukraine. Price increases then broadened to other goods and services, adding to concerns that inflation would remain stubbornly high. Many central banks tightened aggressively to try to rein in inflation, which increased fears of a recession. |
| • | All sectors except energy declined for both the fund and its benchmark. The advisors’ selections in energy and financial stocks helped performance relative to the benchmark, as did an underweight to information technology. The health care, utilities, and consumer staples sectors all detracted slightly. |
| • | Declines prevailed in most regions, but emerging markets aided relative performance primarily through an underweight to China, an overweight to Brazil, and security selection in Indonesia. European stocks were strong contributors, notably through stock selection in France and the Netherlands. Pacific markets, particularly Japan, Australia, and Hong Kong, hurt relative performance the most. |
| • | For the decade ended October 31, 2022, the fund’s average annualized return was 3.93%, outpacing the 3.27% return of its benchmark. |
| Average Annual Total Returns Periods Ended October 31, 2022 | |||
| One Year | Three Years | Five Years | |
| Stocks | |||
| Russell 1000 Index (Large-caps) | -16.38% | 9.99% | 10.19% |
| Russell 2000 Index (Small-caps) | -18.54 | 7.05 | 5.56 |
| Russell 3000 Index (Broad U.S. market) | -16.52 | 9.79 | 9.87 |
| FTSE All-World ex US Index (International) | -24.20 | -1.16 | -0.18 |
| Bonds | |||
| Bloomberg U.S. Aggregate Float Adjusted Index (Broad taxable market) | -15.69% | -3.73% | -0.50% |
| Bloomberg Municipal Bond Index (Broad tax-exempt market) | -11.98 | -2.18 | 0.37 |
| FTSE Three-Month U.S. Treasury Bill Index | 0.88 | 0.59 | 1.15 |
| CPI | |||
| Consumer Price Index | 7.75% | 5.01% | 3.85% |
Chief Investment Officer
| Fund Assets Managed | |||
| Investment Advisor | % | $ Million | Investment Strategy |
| Lazard Asset Management LLC | 39 | 4,594 | The advisor uses a research-driven, bottom-up, relative-value approach in selecting stocks. The goal is to identify individual stocks that offer an appropriate trade-off between low relative valuation and high financial productivity. |
| Sprucegrove Investment Management Ltd. | 35 | 4,090 | The advisor employs a concentrated, low-turnover, value-oriented investment approach that results in a portfolio of companies with good long-term prospects and below-market price/earnings ratios. In-depth fundamental research on industries and companies is central to this investment process. |
| ARGA Investment Management, LP | 24 | 2,767 | The advisor invests in deeply undervalued securities with long-term upside. Its valuation discipline is based on fundamental research and present value, with full integration of ESG risks and opportunities. |
| Cash Investments | 2 | 281 | These short-term reserves are invested by Vanguard in equity index products to simulate investments in stocks. Each advisor may also maintain a modest cash position. |
| • | Based on actual fund return. This section helps you to estimate the actual expenses that you paid over the period. The ”Ending Account Value“ shown is derived from the fund’s actual return, and the third column shows the dollar amount that would have been paid by an investor who started with $1,000 in the fund. You may use the information here, together with the amount you invested, to estimate the expenses that you paid over the period. |
| • | Based on hypothetical 5% yearly return. This section is intended to help you compare your fund‘s costs with those of other mutual funds. It assumes that the fund had a yearly return of 5% before expenses, but that the expense ratio is unchanged. In this case—because the return used is not the fund’s actual return—the results do not apply to your investment. The example is useful in making comparisons because the Securities and Exchange Commission requires all mutual funds to calculate expenses based on a 5% return. You can assess your fund’s costs by comparing this hypothetical example with the hypothetical examples that appear in shareholder reports of other funds. |
| Six Months Ended October 31, 2022 | |||
| International Value Fund | Beginning Account Value 4/30/2022 | Ending Account Value 10/31/2022 | Expenses Paid During Period |
| Based on Actual Fund Return | $1,000.00 | $884.60 | $1.85 |
| Based on Hypothetical 5% Yearly Return | 1,000.00 | 1,023.24 | 1.99 |
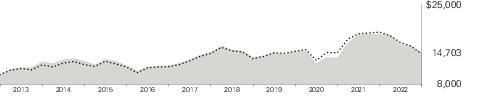
| Average Annual Total Returns Periods Ended October 31, 2022 | |||||
| One Year | Five Years | Ten Years | Final Value of a $10,000 Investment | ||
 | International Value Fund | -21.28% | -0.13% | 3.93% | $14,703 |
 | MSCI All Country World Index ex USA | -24.73 | -0.60 | 3.27 | 13,796 |
| United Kingdom | 13.9% |
| Japan | 11.3 |
| Germany | 9.3 |
| France | 8.9 |
| Switzerland | 6.9 |
| China | 6.3 |
| India | 5.4 |
| Hong Kong | 4.7 |
| Netherlands | 4.4 |
| Brazil | 3.9 |
| South Korea | 3.4 |
| United States | 3.4 |
| Singapore | 2.6 |
| Canada | 2.5 |
| Indonesia | 2.4 |
| Ireland | 2.2 |
| Finland | 1.2 |
| Other | 7.3 |
| Shares | Market Value• ($000) | |||||
| Common Stocks (94.6%) | ||||||
| Australia (0.8%) | ||||||
| National Australia Bank Ltd. | 2,155,160 | 44,767 | ||||
| QBE Insurance Group Ltd. | 4,298,322 | 33,677 | ||||
| Adbri Ltd. | 9,598,354 | 9,677 | ||||
| 88,121 | ||||||
| Brazil (3.7%) | ||||||
| 1 | Banco Bradesco SA ADR | 42,762,052 | 162,068 | |||
| Ambev SA ADR | 33,935,500 | 103,164 | ||||
| Gerdau SA Preference Shares | 12,126,300 | 60,450 | ||||
| Petroleo Brasileiro SA Preference Shares | 10,417,600 | 60,120 | ||||
| Petroleo Brasileiro SA ADR | 3,893,780 | 49,918 | ||||
| 435,720 | ||||||
| Canada (2.3%) | ||||||
| Suncor Energy Inc. | 3,256,143 | 112,000 | ||||
| Saputo Inc. | 2,201,749 | 53,591 | ||||
| Bank of Nova Scotia | 761,351 | 36,801 | ||||
| Alimentation Couche-Tard Inc. | 693,700 | 31,061 | ||||
| Stella-Jones Inc. | 915,400 | 27,569 | ||||
| North West Co. Inc. | 435,500 | 11,332 | ||||
| 272,354 | ||||||
| China (5.9%) | ||||||
| * | Alibaba Group Holding Ltd. | 21,140,600 | 164,366 | |||
| * | Baidu Inc. ADR | 1,152,791 | 88,269 | |||
| Tencent Holdings Ltd. | 3,113,800 | 81,821 | ||||
| ENN Energy Holdings Ltd. | 4,943,400 | 49,148 | ||||
| China Longyuan Power Group Corp. Ltd. Class H | 39,737,000 | 45,406 | ||||
| Shandong Weigao Group Medical Polymer Co. Ltd. Class H | 32,448,000 | 44,706 | ||||
| Sungrow Power Supply Co. Ltd. Class A | 2,380,460 | 42,769 | ||||
| Shares | Market Value• ($000) | |||||
| * | Alibaba Group Holding Ltd. ADR | 620,407 | 39,445 | |||
| Wuxi Lead Intelligent Equipment Co. Ltd. Class A | 4,502,616 | 30,957 | ||||
| Autohome Inc. ADR | 1,112,003 | 29,046 | ||||
| Hengan International Group Co. Ltd. | 7,215,500 | 27,976 | ||||
| Ping An Insurance Group Co. of China Ltd. Class H | 5,304,000 | 21,234 | ||||
| * | Weibo Corp. ADR | 1,429,981 | 16,187 | |||
| * | Trip.com Group Ltd. ADR | 641,343 | 14,514 | |||
| 695,844 | ||||||
| Denmark (0.8%) | ||||||
| Carlsberg A/S Class B | 498,698 | 58,720 | ||||
| Vestas Wind Systems A/S | 1,969,298 | 38,822 | ||||
| 97,542 | ||||||
| Egypt (0.3%) | ||||||
| Commercial International Bank Egypt SAE (Registered) GDR | 25,685,548 | 32,597 | ||||
| Finland (1.2%) | ||||||
| Sampo OYJ Class A | 1,571,237 | 71,849 | ||||
| Nokian Renkaat OYJ | 2,855,350 | 32,199 | ||||
| Nokia OYJ | 6,980,867 | 31,023 | ||||
| 135,071 | ||||||
| France (8.4%) | ||||||
| Airbus SE | 1,637,523 | 177,186 | ||||
| TotalEnergies SE | 3,033,640 | 165,495 | ||||
| Air Liquide SA | 902,385 | 118,044 | ||||
| Engie SA | 8,409,958 | 109,274 | ||||
| Bureau Veritas SA | 2,962,936 | 73,304 | ||||
| Pernod Ricard SA | 416,762 | 73,147 | ||||
| Thales SA | 567,781 | 72,210 | ||||
| Legrand SA | 842,306 | 64,188 | ||||
| Societe Generale SA | 1,854,645 | 42,540 | ||||
| Teleperformance | 158,348 | 42,426 | ||||
| * | Accor SA | 1,309,358 | 31,374 | |||
| Shares | Market Value• ($000) | |||||
| Publicis Groupe SA | 247,452 | 13,859 | ||||
| Safran SA | 41,270 | 4,596 | ||||
| 987,643 | ||||||
| Germany (8.8%) | ||||||
| MTU Aero Engines AG | 628,158 | 112,414 | ||||
| Henkel AG & Co. KGaA Preference Shares | 1,561,313 | 98,361 | ||||
| Merck KGaA | 531,717 | 86,651 | ||||
| Fresenius SE & Co. KGaA | 3,519,031 | 80,984 | ||||
| Bayerische Motoren Werke AG | 919,000 | 72,134 | ||||
| Porsche Automobil Holding SE Preference Shares | 1,209,821 | 67,596 | ||||
| BASF SE | 1,476,590 | 66,256 | ||||
| Infineon Technologies AG | 2,451,511 | 59,487 | ||||
| Henkel AG & Co. KGaA | 975,920 | 57,292 | ||||
| 2 | Covestro AG | 1,681,860 | 57,093 | |||
| SAP SE | 478,150 | 46,023 | ||||
| Fresenius Medical Care AG & Co. KGaA | 1,585,910 | 43,867 | ||||
| Continental AG | 830,599 | 43,021 | ||||
| Jungheinrich AG Preference Shares | 1,566,012 | 38,917 | ||||
| 2 | Siemens Healthineers AG | 790,012 | 36,193 | |||
| FUCHS PETROLUB SE Preference Shares | 1,257,070 | 36,001 | ||||
| Vonovia SE | 1,612,640 | 35,656 | ||||
| 1,037,946 | ||||||
| Hong Kong (4.4%) | ||||||
| AIA Group Ltd. | 18,921,000 | 143,323 | ||||
| * | Sands China Ltd. | 47,010,000 | 82,184 | |||
| * | Melco Resorts & Entertainment Ltd. ADR | 10,563,690 | 57,783 | |||
| Jardine Matheson Holdings Ltd. | 1,173,100 | 54,042 | ||||
| Galaxy Entertainment Group Ltd. | 9,079,000 | 41,479 | ||||
| 2 | ESR Group Ltd. | 19,250,600 | 32,829 | |||
| Xinyi Glass Holdings Ltd. | 20,644,000 | 26,531 | ||||
| Hongkong Land Holdings Ltd. | 5,380,000 | 20,712 | ||||
| 2 | WH Group Ltd. | 40,747,243 | 20,578 | |||
| CK Asset Holdings Ltd. | 3,466,500 | 19,165 | ||||
| Yue Yuen Industrial Holdings Ltd. | 18,050,500 | 18,351 | ||||
| 516,977 | ||||||
| India (5.1%) | ||||||
| ICICI Bank Ltd. ADR | 6,094,587 | 134,325 | ||||
| Zee Entertainment Enterprises Ltd. Class B | 31,279,583 | 99,370 | ||||
| Housing Development Finance Corp. Ltd. | 3,133,250 | 93,680 | ||||
| Reliance Industries Ltd. | 2,790,471 | 86,105 | ||||
| Adani Ports & Special Economic Zone Ltd. | 7,612,517 | 75,799 | ||||
| Shares | Market Value• ($000) | |||||
| UPL Ltd. | 5,608,124 | 49,509 | ||||
| GAIL India Ltd. | 30,736,329 | 33,881 | ||||
| Ambuja Cements Ltd. | 4,670,849 | 30,099 | ||||
| 602,768 | ||||||
| Indonesia (2.2%) | ||||||
| Astra International Tbk. PT | 212,997,700 | 91,020 | ||||
| Bank Mandiri Persero Tbk. PT | 133,290,200 | 90,045 | ||||
| Telkom Indonesia Persero Tbk. PT ADR | 1,567,073 | 43,596 | ||||
| Telkom Indonesia Persero Tbk. PT | 77,847,500 | 21,863 | ||||
| Selamat Sempurna Tbk. PT | 164,317,700 | 15,797 | ||||
| 262,321 | ||||||
| Ireland (2.1%) | ||||||
| * | Ryanair Holdings plc ADR | 1,534,725 | 105,727 | |||
| * | ICON plc | 379,267 | 75,034 | |||
| CRH plc | 1,732,400 | 62,398 | ||||
| 243,159 | ||||||
| Israel (0.1%) | ||||||
| * | Check Point Software Technologies Ltd. | 94,500 | 12,212 | |||
| Italy (0.8%) | ||||||
| Brembo SpA | 5,290,233 | 55,306 | ||||
| UniCredit SpA | 2,776,866 | 34,437 | ||||
| 89,743 | ||||||
| Japan (10.7%) | ||||||
| Olympus Corp. | 4,512,800 | 95,150 | ||||
| Mitsubishi Electric Corp. | 9,260,100 | 81,476 | ||||
| Toyota Motor Corp. | 5,410,100 | 75,063 | ||||
| Disco Corp. | 285,100 | 68,190 | ||||
| Bandai Namco Holdings Inc. | 1,022,700 | 67,603 | ||||
| Daikin Industries Ltd. | 431,600 | 64,648 | ||||
| Denso Corp. | 1,268,100 | 62,918 | ||||
| Nidec Corp. | 1,066,800 | 58,657 | ||||
| Hoya Corp. | 561,100 | 52,161 | ||||
| Nomura Research Institute Ltd. | 2,304,800 | 51,006 | ||||
| Nitto Denko Corp. | 953,000 | 50,210 | ||||
| Nihon Kohden Corp. | 2,226,200 | 49,849 | ||||
| ITOCHU Corp. | 1,803,300 | 46,605 | ||||
| Daiwa Securities Group Inc. | 11,814,800 | 46,097 | ||||
| Kubota Corp. | 3,035,300 | 42,341 | ||||
| Daito Trust Construction Co. Ltd. | 400,000 | 39,610 | ||||
| Ain Holdings Inc. | 939,600 | 39,473 | ||||
| Koito Manufacturing Co. Ltd. | 2,623,200 | 37,241 | ||||
| Suzuki Motor Corp. | 1,063,800 | 35,967 | ||||
| Shimano Inc. | 227,500 | 35,204 | ||||
| Subaru Corp. | 1,996,600 | 31,209 | ||||
| Shares | Market Value• ($000) | |||||
| Kansai Electric Power Co. Inc. | 4,020,200 | 30,454 | ||||
| Komatsu Ltd. | 1,453,900 | 28,482 | ||||
| Nomura Holdings Inc. | 7,414,800 | 23,994 | ||||
| Seria Co. Ltd. | 1,123,400 | 18,352 | ||||
| FANUC Corp. | 82,900 | 10,848 | ||||
| Omron Corp. | 163,100 | 7,607 | ||||
| Taiheiyo Cement Corp. | 222,600 | 3,025 | ||||
| 1,253,440 | ||||||
| Mexico (0.8%) | ||||||
| Grupo Financiero Banorte SAB de CV | 11,158,700 | 90,703 | ||||
| Netherlands (4.1%) | ||||||
| Wolters Kluwer NV | 729,476 | 77,513 | ||||
| Koninklijke DSM NV | 561,313 | 66,028 | ||||
| Aegon NV | 13,585,908 | 62,891 | ||||
| Universal Music Group NV | 2,940,057 | 57,729 | ||||
| Akzo Nobel NV | 749,534 | 46,273 | ||||
| SBM Offshore NV | 3,001,810 | 40,625 | ||||
| * | AerCap Holdings NV | 563,815 | 30,113 | |||
| 2 | ABN AMRO Bank NV | 2,835,943 | 27,879 | |||
| * | Prosus NV | 621,904 | 26,892 | |||
| Koninklijke Vopak NV | 1,229,500 | 25,121 | ||||
| IMCD NV | 176,025 | 22,830 | ||||
| 483,894 | ||||||
| Norway (0.5%) | ||||||
| Equinor ASA | 1,014,614 | 36,966 | ||||
| Bakkafrost P/F | 481,190 | 24,068 | ||||
| 61,034 | ||||||
| Panama (0.7%) | ||||||
| * | Copa Holdings SA Class A | 1,114,653 | 83,855 | |||
| Philippines (0.2%) | ||||||
| Puregold Price Club Inc. | 43,303,300 | 22,468 | ||||
| Singapore (2.5%) | ||||||
| United Overseas Bank Ltd. | 4,032,700 | 79,117 | ||||
| DBS Group Holdings Ltd. | 2,860,400 | 69,154 | ||||
| Singapore Telecommunications Ltd. | 28,890,600 | 50,869 | ||||
| Venture Corp. Ltd. | 3,731,000 | 41,986 | ||||
| Sembcorp Industries Ltd. | 20,083,100 | 41,284 | ||||
| *,1 | SATS Ltd. | 6,163,700 | 11,897 | |||
| 294,307 | ||||||
| South Africa (0.3%) | ||||||
| Mr Price Group Ltd. | 3,450,376 | 33,209 | ||||
| South Korea (3.3%) | ||||||
| Samsung Electronics Co. Ltd. | 2,498,844 | 104,002 | ||||
| POSCO Holdings Inc. | 568,173 | 99,027 | ||||
| Shares | Market Value• ($000) | |||||
| 2 | Samsung Electronics Co. Ltd. GDR | 91,980 | 94,997 | |||
| SK Hynix Inc. | 1,303,719 | 75,474 | ||||
| * | SK Square Co. Ltd. | 309,162 | 7,994 | |||
| 381,494 | ||||||
| Spain (0.3%) | ||||||
| 1 | Industria de Diseno Textil SA | 1,577,858 | 35,815 | |||
| Sweden (0.3%) | ||||||
| Assa Abloy AB Class B | 1,845,802 | 37,271 | ||||
| Switzerland (6.5%) | ||||||
| * | Holcim AG | 3,855,713 | 175,174 | |||
| Novartis AG (Registered) | 1,526,264 | 123,461 | ||||
| Roche Holding AG | 332,866 | 110,444 | ||||
| Cie Financiere Richemont SA (Registered) | 974,903 | 95,281 | ||||
| ABB Ltd. (Registered) | 3,243,410 | 90,070 | ||||
| Adecco Group AG (Registered) | 2,048,922 | 64,123 | ||||
| Credit Suisse Group AG (Registered) | 9,768,204 | 40,464 | ||||
| Swatch Group AG | 154,510 | 34,720 | ||||
| UBS Group AG (Registered) | 1,811,608 | 28,722 | ||||
| 762,459 | ||||||
| Taiwan (0.6%) | ||||||
| Taiwan Semiconductor Manufacturing Co. Ltd. | 5,694,000 | 68,454 | ||||
| United Kingdom (13.2%) | ||||||
| BP plc | 32,156,484 | 177,909 | ||||
| RELX plc | 5,282,048 | 141,878 | ||||
| Shell plc | 4,693,650 | 130,022 | ||||
| Unilever plc | 2,049,036 | 93,138 | ||||
| Compass Group plc | 4,213,789 | 88,750 | ||||
| Anglo American plc | 2,858,401 | 85,621 | ||||
| Smiths Group plc | 4,720,940 | 84,564 | ||||
| HSBC Holdings plc (XHKG) | 14,812,400 | 76,022 | ||||
| HSBC Holdings plc | 14,415,035 | 73,979 | ||||
| Berkeley Group Holdings plc | 1,592,176 | 63,349 | ||||
| IMI plc | 4,136,690 | 58,273 | ||||
| Victrex plc | 2,598,116 | 49,345 | ||||
| Weir Group plc | 2,721,260 | 47,415 | ||||
| Travis Perkins plc | 4,999,053 | 47,116 | ||||
| Ferguson plc | 428,260 | 46,706 | ||||
| Spectris plc | 1,176,470 | 40,775 | ||||
| Smith & Nephew plc | 3,445,023 | 40,710 | ||||
| Barclays plc | 22,953,206 | 39,003 | ||||
| RS Group plc | 2,786,400 | 30,660 | ||||
| Prudential plc | 2,736,608 | 25,422 | ||||
| *,1 | easyJet plc | 6,237,379 | 24,835 | |||
| Taylor Wimpey plc | 20,793,159 | 22,355 | ||||
| Renishaw plc | 530,507 | 21,288 | ||||
| Shares | Market Value• ($000) | |||||
| Whitbread plc | 653,543 | 19,235 | ||||
| Lloyds Banking Group plc | 31,286,248 | 15,026 | ||||
| Direct Line Insurance Group plc | 220,462 | 509 | ||||
| 1,543,905 | ||||||
| United States (3.2%) | ||||||
| Aon plc Class A | 416,187 | 117,152 | ||||
| Accenture plc Class A | 237,551 | 67,441 | ||||
| RenaissanceRe Holdings Ltd. | 407,363 | 63,011 | ||||
| ��* | TechnipFMC plc | 4,627,975 | 49,010 | |||
| 1 | Linde plc | 130,895 | 39,083 | |||
| NXP Semiconductors NV | 201,591 | 29,448 | ||||
| * | Capri Holdings Ltd. | 317,426 | 14,500 | |||
| 379,645 | ||||||
| Vietnam (0.5%) | ||||||
| Vietnam Dairy Products JSC | 16,775,900 | 52,952 | ||||
| Phu Nhuan Jewelry JSC | 2,229,200 | 9,251 | ||||
| 62,203 | ||||||
| Total Common Stocks (Cost $12,065,534) | 11,104,174 | |||||
| Temporary Cash Investments (5.9%) | ||||||
| Money Market Fund (5.9%) | ||||||
| 3,4 | Vanguard Market Liquidity Fund, 3.117% (Cost $685,572) | 6,858,440 | 685,707 | |||
| Total Investments (100.5%) (Cost $12,751,106) | 11,789,881 | |||||
| Other Assets and Liabilities—Net (-0.5%) | (57,350) | |||||
| Net Assets (100%) | 11,732,531 | |||||
| Cost is in $000. |
| • | See Note A in Notes to Financial Statements. |
| * | Non-income-producing security. |
| 1 | Includes partial security positions on loan to broker-dealers. The total value of securities on loan is $106,341,000. |
| 2 | Security exempt from registration under Rule 144A of the Securities Act of 1933. Such securities may be sold in transactions exempt from registration, normally to qualified institutional buyers. At October 31, 2022, the aggregate value was $269,569,000, representing 2.3% of net assets. |
| 3 | Affiliated money market fund available only to Vanguard funds and certain trusts and accounts managed by Vanguard. Rate shown is the 7-day yield. |
| 4 | Collateral of $113,548,000 was received for securities on loan. |
| ADR—American Depositary Receipt. | |
| GDR—Global Depositary Receipt. |
| Futures Contracts | ||||
| ($000) | ||||
| Expiration | Number of Long (Short) Contracts | Notional Amount | Value and Unrealized Appreciation (Depreciation) | |
| Long Futures Contracts | ||||
| MSCI EAFE Index | December 2022 | 2,328 | 204,387 | (6,775) |
| MSCI Emerging Market Index | December 2022 | 1,997 | 85,232 | (9,844) |
| (16,619) | ||||
| ($000s, except shares and per-share amounts) | Amount |
| Assets | |
| Investments in Securities, at Value1 | |
| Unaffiliated Issuers (Cost $12,065,534) | 11,104,174 |
| Affiliated Issuers (Cost $685,572) | 685,707 |
| Total Investments in Securities | 11,789,881 |
| Investment in Vanguard | 452 |
| Foreign Currency, at Value (Cost $18,195) | 18,096 |
| Cash Collateral Pledged—Futures Contracts | 14,752 |
| Receivables for Investment Securities Sold | 27,765 |
| Receivables for Accrued Income | 42,841 |
| Receivables for Capital Shares Issued | 7,815 |
| Total Assets | 11,901,602 |
| Liabilities | |
| Due to Custodian | 860 |
| Payables for Investment Securities Purchased | 20,329 |
| Collateral for Securities on Loan | 113,548 |
| Payables for Capital Shares Redeemed | 11,894 |
| Payables to Investment Advisor | 5,305 |
| Payables to Vanguard | 1,496 |
| Variation Margin Payable—Futures Contracts | 2,122 |
| Deferred Foreign Capital Gains Taxes | 13,517 |
| Total Liabilities | 169,071 |
| Net Assets | 11,732,531 |
| 1 Includes $106,341 of securities on loan. | |
| At October 31, 2022, net assets consisted of: | |
| Paid-in Capital | 12,745,069 |
| Total Distributable Earnings (Loss) | (1,012,538) |
| Net Assets | 11,732,531 |
| Net Assets | |
| Applicable to 355,915,884 outstanding $.001 par value shares of beneficial interest (unlimited authorization) | 11,732,531 |
| Net Asset Value Per Share | $32.96 |
| Year Ended October 31, 2022 | |
| ($000) | |
| Investment Income | |
| Income | |
| Dividends1 | 410,933 |
| Interest2 | 5,917 |
| Securities Lending—Net | 822 |
| Total Income | 417,672 |
| Expenses | |
| Investment Advisory Fees—Note B | |
| Basic Fee | 22,279 |
| Performance Adjustment | 492 |
| The Vanguard Group—Note C | |
| Management and Administrative | 26,339 |
| Marketing and Distribution | 1,181 |
| Custodian Fees | 737 |
| Auditing Fees | 42 |
| Shareholders’ Reports | 223 |
| Trustees’ Fees and Expenses | 5 |
| Other Expenses | 545 |
| Total Expenses | 51,843 |
| Net Investment Income | 365,829 |
| Realized Net Gain (Loss) | |
| Investment Securities Sold2,3 | (230,362) |
| Futures Contracts | (74,220) |
| Forward Currency Contracts | 95 |
| Foreign Currencies | (9,992) |
| Realized Net Gain (Loss) | (314,479) |
| Change in Unrealized Appreciation (Depreciation) | |
| Investment Securities2,4 | (3,243,240) |
| Futures Contracts | (13,965) |
| Foreign Currencies | (2,315) |
| Change in Unrealized Appreciation (Depreciation) | (3,259,520) |
| Net Increase (Decrease) in Net Assets Resulting from Operations | (3,208,170) |
| 1 | Dividends are net of foreign withholding taxes of $28,171,000. |
| 2 | Interest income, realized net gain (loss), capital gain distributions received, and change in unrealized appreciation (depreciation) from an affiliated company of the fund were $5,917,000, ($263,000), $19,000, and $82,000, respectively. Purchases and sales are for temporary cash investment purposes. |
| 3 | Realized Gain (Loss) is net of foreign capital gains taxes of $4,497,000. |
| 4 | The change in unrealized appreciation (depreciation) is net of the change in deferred foreign capital gains taxes of ($7,973,000). |
| Year Ended October 31, | ||
| 2022 ($000) | 2021 ($000) | |
| Increase (Decrease) in Net Assets | ||
| Operations | ||
| Net Investment Income | 365,829 | 351,127 |
| Realized Net Gain (Loss) | (314,479) | 897,431 |
| Change in Unrealized Appreciation (Depreciation) | (3,259,520) | 2,275,436 |
| Net Increase (Decrease) in Net Assets Resulting from Operations | (3,208,170) | 3,523,994 |
| Distributions | ||
| Total Distributions | (633,591) | (189,189) |
| Capital Share Transactions | ||
| Issued | 2,352,101 | 4,442,988 |
| Issued in Lieu of Cash Distributions | 576,930 | 173,403 |
| Redeemed | (2,573,910) | (2,140,447) |
| Net Increase (Decrease) from Capital Share Transactions | 355,121 | 2,475,944 |
| Total Increase (Decrease) | (3,486,640) | 5,810,749 |
| Net Assets | ||
| Beginning of Period | 15,219,171 | 9,408,422 |
| End of Period | 11,732,531 | 15,219,171 |
| For a Share Outstanding Throughout Each Period | Year Ended October 31, | ||||
| 2022 | 2021 | 2020 | 2019 | 2018 | |
| Net Asset Value, Beginning of Period | $43.76 | $32.48 | $36.63 | $35.86 | $39.26 |
| Investment Operations | |||||
| Net Investment Income1 | 1.019 | 1.091 | .684 | 1.104 | .950 |
| Net Realized and Unrealized Gain (Loss) on Investments | (10.011) | 10.824 | (3.723) | 1.669 | (3.607) |
| Total from Investment Operations | (8.992) | 11.915 | (3.039) | 2.773 | (2.657) |
| Distributions | |||||
| Dividends from Net Investment Income | (1.087) | (.635) | (1.111) | (.943) | (.743) |
| Distributions from Realized Capital Gains | (.721) | — | — | (1.060) | — |
| Total Distributions | (1.808) | (.635) | (1.111) | (2.003) | (.743) |
| Net Asset Value, End of Period | $32.96 | $43.76 | $32.48 | $36.63 | $35.86 |
| Total Return2 | -21.28% | 36.91% | -8.69% | 8.48% | -6.95% |
| Ratios/Supplemental Data | |||||
| Net Assets, End of Period (Millions) | $11,733 | $15,219 | $9,408 | $10,360 | $9,524 |
| Ratio of Total Expenses to Average Net Assets3 | 0.38% | 0.36% | 0.35% | 0.37% | 0.38% |
| Ratio of Net Investment Income to Average Net Assets | 2.68% | 2.56% | 2.05% | 3.15% | 2.41% |
| Portfolio Turnover Rate | 37% | 33% | 72% | 38% | 28% |
| 1 | Calculated based on average shares outstanding. |
| 2 | Total returns do not include account service fees that may have applied in the periods shown. Fund prospectuses provide information about any applicable account service fees. |
| 3 | Includes performance-based investment advisory fee increases (decreases) of 0.00%, (0.01%), (0.02%), (0.01%), and (0.01%). |
| Level 1 ($000) | Level 2 ($000) | Level 3 ($000) | Total ($000) | |
| Investments | ||||
| Assets | ||||
| Common Stocks—North and South America | 1,223,194 | 39,083 | — | 1,262,277 |
| Common Stocks—Other | 741,248 | 9,100,649 | — | 9,841,897 |
| Temporary Cash Investments | 685,707 | — | — | 685,707 |
| Total | 2,650,149 | 9,139,732 | — | 11,789,881 |
| Derivative Financial Instruments | ||||
| Liabilities | ||||
| Futures Contracts1 | 16,619 | — | — | 16,619 |
| 1 | Includes cumulative appreciation (depreciation) on futures contracts and centrally cleared swaps, if any, as reported in the Schedule of Investments. Only current day’s variation margin is reported within the Statement of Assets and Liabilities. |
| Realized Net Gain (Loss) on Derivatives | Equity Contracts ($000) | Foreign Exchange Contracts ($000) | Total ($000) |
| Futures Contracts | (74,220) | — | (74,220) |
| Forward Currency Contracts | — | 95 | 95 |
| Realized Net Gain (Loss) on Derivatives | (74,220) | 95 | (74,125) |
| Change in Unrealized Appreciation (Depreciation) on Derivatives | |||
| Futures Contracts | (13,965) | — | (13,965) |
| Amount ($000) | |
| Undistributed Ordinary Income | 303,807 |
| Undistributed Long-Term Gains | — |
| Capital Loss Carryforwards | (290,452) |
| Qualified Late-Year Losses | — |
| Net Unrealized Gains (Losses) | (1,029,753) |
| Year Ended October 31, | ||
| 2022 Amount ($000) | 2021 Amount ($000) | |
| Ordinary Income* | 633,591 | 189,189 |
| Long-Term Capital Gains | — | — |
| Total | 633,591 | 189,189 |
| * | Includes short-term capital gains, if any. |
| Amount ($000) | |
| Tax Cost | 12,804,237 |
| Gross Unrealized Appreciation | 1,279,290 |
| Gross Unrealized Depreciation | (2,293,646) |
| Net Unrealized Appreciation (Depreciation) | (1,014,356) |
| Year Ended October 31, | ||||
| 2022 Shares (000) | 2021 Shares (000) | |||
| Issued | 61,320 | 104,505 | ||
| Issued in Lieu of Cash Distributions | 14,416 | 4,428 | ||
| Redeemed | (67,638) | (50,767) | ||
| Net Increase (Decrease) in Shares Outstanding | 8,098 | 58,166 | ||
Philadelphia, Pennsylvania
December 16, 2022
| Matthew Benchener | Thomas M. Rampulla |
| Joseph Brennan | Karin A. Risi |
| Mortimer J. Buckley | Anne E. Robinson |
| Gregory Davis | Michael Rollings |
| John James | Nitin Tandon |
| Chris D. McIsaac | Lauren Valente |

Who Are Deaf or Hard of Hearing > 800-749-7273
All rights reserved.
Vanguard Marketing Corporation, Distributor.

| 1 | |
| 2 | |
| 4 | |
| 6 |
| • | The 12 months ended October 31, 2022, were a volatile, challenging period for financial markets. Vanguard Diversified Equity Fund returned –21.42%, lagging the –16.50% return of its benchmark, the MSCI US Broad Market Index. |
| • | The economic backdrop deteriorated as inflation soared to multidecade highs, fueled in part by higher energy and food prices in the wake of Russia’s invasion of Ukraine. Then price increases broadened to other categories of goods and services, adding to concerns that inflation would remain stubbornly high. That prompted aggressive tightening by the Federal Reserve to bring inflation back in check and increased fears of a recession. |
| • | The Diversified Equity Fund invests in six actively managed Vanguard funds selected to provide broad exposure to all segments of the U.S. equity market. Together, these funds cover the style and capitalization spectrum. |
| • | Returns of the underlying funds ranged from about –39% for Vanguard U.S. Growth Fund to roughly –3% for Vanguard Windsor Fund. Value-oriented stocks generally held up better than growth stocks. |
| Average Annual Total Returns Periods Ended October 31, 2022 | |||
| One Year | Three Years | Five Years | |
| Stocks | |||
| Russell 1000 Index (Large-caps) | -16.38% | 9.99% | 10.19% |
| Russell 2000 Index (Small-caps) | -18.54 | 7.05 | 5.56 |
| Russell 3000 Index (Broad U.S. market) | -16.52 | 9.79 | 9.87 |
| FTSE All-World ex US Index (International) | -24.20 | -1.16 | -0.18 |
| Bonds | |||
| Bloomberg U.S. Aggregate Float Adjusted Index (Broad taxable market) | -15.69% | -3.73% | -0.50% |
| Bloomberg Municipal Bond Index (Broad tax-exempt market) | -11.98 | -2.18 | 0.37 |
| FTSE Three-Month U.S. Treasury Bill Index | 0.88 | 0.59 | 1.15 |
| CPI | |||
| Consumer Price Index | 7.75% | 5.01% | 3.85% |
| • | Based on actual fund return. This section helps you to estimate the actual expenses that you paid over the period. The ”Ending Account Value“ shown is derived from the fund’s actual return, and the third column shows the dollar amount that would have been paid by an investor who started with $1,000 in the fund. You may use the information here, together with the amount you invested, to estimate the expenses that you paid over the period. |
| • | Based on hypothetical 5% yearly return. This section is intended to help you compare your fund‘s costs with those of other mutual funds. It assumes that the fund had a yearly return of 5% before expenses, but that the expense ratio is unchanged. In this case—because the return used is not the fund’s actual return—the results do not apply to your investment. The example is useful in making comparisons because the Securities and Exchange Commission requires all mutual funds to calculate expenses based on a 5% return. You can assess your fund’s costs by comparing this hypothetical example with the hypothetical examples that appear in shareholder reports of other funds. |
| Six Months Ended October 31, 2022 | |||
| Diversified Equity Fund | Beginning Account Value 4/30/2022 | Ending Account Value 10/31/2022 | Expenses Paid During Period |
| Based on Actual Fund Return | $1,000.00 | $ 939.40 | $1.71 |
| Based on Hypothetical 5% Yearly Return | 1,000.00 | 1,023.44 | 1.79 |
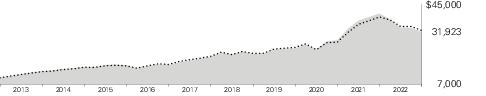
| Average Annual Total Returns Periods Ended October 31, 2022 | |||||
| One Year | Five Years | Ten Years | Final Value of a $10,000 Investment | ||
 | Diversified Equity Fund | -21.42% | 9.75% | 12.31% | $31,923 |
 | MSCI US Broad Market Index | -16.50 | 9.96 | 12.53 | 32,563 |
| Vanguard U.S. Growth Fund Investor Shares | 29.3% |
| Vanguard WindsorTM Fund Investor Shares | 20.3 |
| Vanguard Growth and Income Fund Investor Shares | 20.2 |
| Vanguard Windsor II Fund Investor Shares | 15.2 |
| Vanguard ExplorerTM Fund Investor Shares | 10.1 |
| Vanguard Mid-Cap Growth Fund | 4.9 |
| Shares | Market Value• ($000) | |||||
| Investment Companies (100.0%) | ||||||
| U.S. Stock Funds (100.0%) | ||||||
| Vanguard U.S. Growth Fund Investor Shares | 15,410,935 | 638,320 | ||||
| Vanguard Windsor Fund Investor Shares | 19,507,240 | 443,595 | ||||
| Vanguard Growth and Income Fund Investor Shares | 8,285,085 | 440,104 | ||||
| Vanguard Windsor II Fund Investor Shares | 8,409,928 | 331,267 | ||||
| Vanguard Explorer Fund Investor Shares | 2,205,770 | 219,915 | ||||
| Vanguard Mid-Cap Growth Fund | 5,589,451 | 107,541 | ||||
| Total Investment Companies (Cost $1,670,038) | 2,180,742 | |||||
| Temporary Cash Investments (0.0%) | ||||||
| Money Market Fund (0.0%) | ||||||
| 1 | Vanguard Market Liquidity Fund, 3.117% (Cost $—) | 1 | — | |||
| Total Investments (100.0%) (Cost $1,670,038) | 2,180,742 | |||||
| Other Assets and Liabilities—Net (0.0%) | (441) | |||||
| Net Assets (100%) | 2,180,301 | |||||
| Cost is in $000. |
| • | See Note A in Notes to Financial Statements. |
| 1 | Affiliated money market fund available only to Vanguard funds and certain trusts and accounts managed by Vanguard. Rate shown is the 7-day yield. |
| ($000s, except shares and per-share amounts) | Amount |
| Assets | |
| Investments in Securities, at Value—Affiliated Funds (Cost $1,670,038) | 2,180,742 |
| Receivables for Investment Securities Sold | 155 |
| Receivables for Accrued Income | 1 |
| Receivables for Capital Shares Issued | 674 |
| Total Assets | 2,181,572 |
| Liabilities | |
| Due to Custodian | 199 |
| Payables for Capital Shares Redeemed | 1,072 |
| Total Liabilities | 1,271 |
| Net Assets | 2,180,301 |
| At October 31, 2022, net assets consisted of: | |
| Paid-in Capital | 1,443,943 |
| Total Distributable Earnings (Loss) | 736,358 |
| Net Assets | 2,180,301 |
| Net Assets | |
| Applicable to 52,691,895 outstanding $.001 par value shares of beneficial interest (unlimited authorization) | 2,180,301 |
| Net Asset Value Per Share | $41.38 |
| Year Ended October 31, 2022 | |
| ($000) | |
| Investment Income | |
| Income | |
| Income Distributions Received from Affiliated Funds | 19,185 |
| Net Investment Income—Note B | 19,185 |
| Realized Net Gain (Loss) | |
| Capital Gain Distributions Received from Affiliated Funds | 331,854 |
| Affiliated Funds Sold | (4,196) |
| Realized Net Gain (Loss) | 327,658 |
| Change in Unrealized Appreciation (Depreciation) from Affiliated Funds | (967,703) |
| Net Increase (Decrease) in Net Assets Resulting from Operations | (620,860) |
| Year Ended October 31, | ||
| 2022 ($000) | 2021 ($000) | |
| Increase (Decrease) in Net Assets | ||
| Operations | ||
| Net Investment Income | 19,185 | 19,851 |
| Realized Net Gain (Loss) | 327,658 | 126,784 |
| Change in Unrealized Appreciation (Depreciation) | (967,703) | 757,953 |
| Net Increase (Decrease) in Net Assets Resulting from Operations | (620,860) | 904,588 |
| Distributions | ||
| Total Distributions | (196,729) | (129,748) |
| Capital Share Transactions | ||
| Issued | 293,317 | 591,473 |
| Issued in Lieu of Cash Distributions | 182,595 | 121,380 |
| Redeemed | (443,391) | (441,166) |
| Net Increase (Decrease) from Capital Share Transactions | 32,521 | 271,687 |
| Total Increase (Decrease) | (785,068) | 1,046,527 |
| Net Assets | ||
| Beginning of Period | 2,965,369 | 1,918,842 |
| End of Period | 2,180,301 | 2,965,369 |
| For a Share Outstanding Throughout Each Period | Year Ended October 31, | ||||
| 2022 | 2021 | 2020 | 2019 | 2018 | |
| Net Asset Value, Beginning of Period | $56.40 | $40.98 | $37.95 | $35.88 | $35.57 |
| Investment Operations | |||||
| Net Investment Income1 | .356 | .385 | .452 | .455 | .395 |
| Capital Gain Distributions Received1 | 6.162 | 2.294 | 1.866 | 3.087 | 1.686 |
| Net Realized and Unrealized Gain (Loss) on Investments | (17.785) | 15.438 | 3.447 | .575 | .206 |
| Total from Investment Operations | (11.267) | 18.117 | 5.765 | 4.117 | 2.287 |
| Distributions | |||||
| Dividends from Net Investment Income | (.317) | (.346) | (.369) | (.383) | (.358) |
| Distributions from Realized Capital Gains | (3.436) | (2.351) | (2.366) | (1.664) | (1.619) |
| Total Distributions | (3.753) | (2.697) | (2.735) | (2.047) | (1.977) |
| Net Asset Value, End of Period | $41.38 | $56.40 | $40.98 | $37.95 | $35.88 |
| Total Return2 | -21.42% | 45.67% | 15.73% | 12.82% | 6.55% |
| Ratios/Supplemental Data | |||||
| Net Assets, End of Period (Millions) | $2,180 | $2,965 | $1,919 | $1,789 | $1,709 |
| Ratio of Total Expenses to Average Net Assets | — | — | — | — | — |
| Acquired Fund Fees and Expenses | 0.35% | 0.35% | 0.35% | 0.35% | 0.36% |
| Ratio of Net Investment Income to Average Net Assets | 0.77% | 0.76% | 1.19% | 1.27% | 1.07% |
| Portfolio Turnover Rate | 12% | 6% | 14% | 9% | 8% |
| 1 | Calculated based on average shares outstanding. |
| 2 | Total returns do not include account service fees that may have applied in the periods shown. Fund prospectuses provide information about any applicable account service fees. |
| Amount ($000) | |
| Paid-in Capital | 32,107 |
| Total Distributable Earnings (Loss) | (32,107) |
| Amount ($000) | |
| Undistributed Ordinary Income | — |
| Undistributed Long-Term Gains | 229,192 |
| Capital Loss Carryforwards | — |
| Qualified Late-Year Losses | — |
| Net Unrealized Gains (Losses) | 507,166 |
| Year Ended October 31, | ||
| 2022 Amount ($000) | 2021 Amount ($000) | |
| Ordinary Income* | 100,746 | 31,671 |
| Long-Term Capital Gains | 95,983 | 98,077 |
| Total | 196,729 | 129,748 |
| * | Includes short-term capital gains, if any. |
| Amount ($000) | |
| Tax Cost | 1,673,576 |
| Gross Unrealized Appreciation | 641,596 |
| Gross Unrealized Depreciation | (134,430) |
| Net Unrealized Appreciation (Depreciation) | 507,166 |
| Year Ended October 31, | ||||
| 2022 Shares (000) | 2021 Shares (000) | |||
| Issued | 6,163 | 11,844 | ||
| Issued in Lieu of Cash Distributions | 3,454 | 2,628 | ||
| Redeemed | (9,499) | (8,723) | ||
| Net Increase (Decrease) in Shares Outstanding | 118 | 5,749 | ||
| Current Period Transactions | ||||||||
| Oct. 31, 2021 Market Value ($000) | Purchases at Cost ($000) | Proceeds from Securities Sold ($000) | Realized Net Gain (Loss) ($000) | Change in Unrealized App. (Dep.) ($000) | Income ($000) | Capital Gain Distributions Received ($000) | Oct. 31, 2022 Market Value ($000) | |
| Vanguard Explorer Fund | 295,430 | 39,796 | 7,604 | (2,898) | (104,809) | 540 | 39,256 | 219,915 |
| Vanguard Growth and Income Fund | 596,559 | 80,459 | 87,379 | (2,132) | (147,403) | 6,506 | 73,955 | 440,104 |
| Vanguard Market Liquidity Fund | 145 | NA 1 | NA 1 | — | — | 2 | — | — |
| Vanguard Mid-Cap Growth Fund | 147,655 | 44,241 | — | — | (84,355) | 18 | 35,761 | 107,541 |
| Vanguard U.S. Growth Fund | 893,949 | 229,764 | 12,213 | (4,119) | (469,061) | 15 | 100,709 | 638,320 |
| Vanguard Windsor Fund | 587,802 | 71,116 | 140,887 | 4,770 | (79,206) | 7,056 | 54,102 | 443,595 |
| Vanguard Windsor II Fund | 442,795 | 33,637 | 62,479 | 183 | (82,869) | 5,048 | 28,071 | 331,267 |
| Total | 2,964,335 | 499,013 | 310,562 | (4,196) | (967,703) | 19,185 | 331,854 | 2,180,742 |
| 1 | Not applicable—purchases and sales are for temporary cash investment purposes. |
Philadelphia, Pennsylvania
December 15, 2022
| Matthew Benchener | Thomas M. Rampulla |
| Joseph Brennan | Karin A. Risi |
| Mortimer J. Buckley | Anne E. Robinson |
| Gregory Davis | Michael Rollings |
| John James | Nitin Tandon |
| Chris D. McIsaac | Lauren Valente |

Who Are Deaf or Hard of Hearing > 800-749-7273
All rights reserved.
Vanguard Marketing Corporation, Distributor.

Your Fund’s Performance at a Glance | 1 |
Advisors’ Report | 2 |
About Your Fund’s Expenses | 7 |
Performance Summary | 9 |
Financial Statements | 11 |
| • | The 12 months ended October 31, 2022, were a volatile, challenging period for financial markets. Vanguard Emerging Markets Select Stock Fund returned –31.16%, lagging the –28.35% return of its benchmark, the FTSE Emerging Index. |
| • | The economic backdrop deteriorated as inflation soared to multidecade highs, fueled in part by higher energy and food prices in the wake of Russia’s invasion of Ukraine. Then price increases broadened to other categories of goods and services, adding to concerns that inflation would remain stubbornly high. That prompted aggressive tightening by many central banks to bring inflation back in check and increased fears of a recession. |
| • | Most countries posted negative returns for the period, but declines were much steeper in places such as Russia and Hong Kong. The fund’s modest weightings in those two markets were a drag on both absolute and relative performance. However, the fund’s superior stock selection in Hong Kong offset some of the gap in underperformance relative to the index. (The fund’s weighting in Russia was 6.4% at the start of the period and near zero at the end.) |
| • | With the sole exception of utilities, declines were universal across sectors in both the fund and the benchmark. The fund’s stocks in materials and financials substantially trailed their benchmark counterparts, contributing the most to underperformance. |
| Average Annual Total Returns Periods Ended October 31, 2022 | |||
| One Year | Three Years | Five Years | |
| Stocks | |||
| Russell 1000 Index (Large-caps) | -16.38% | 9.99% | 10.19% |
| Russell 2000 Index (Small-caps) | -18.54 | 7.05 | 5.56 |
| Russell 3000 Index (Broad U.S. market) | -16.52 | 9.79 | 9.87 |
| FTSE All-World ex US Index (International) | -24.20 | -1.16 | -0.18 |
| Bonds | |||
| Bloomberg U.S. Aggregate Float Adjusted Index (Broad taxable market) | -15.69% | -3.73% | -0.50% |
| Bloomberg Municipal Bond Index (Broad tax-exempt market) | -11.98 | -2.18 | 0.37 |
| FTSE Three-Month U.S. Treasury Bill Index | 0.88 | 0.59 | 1.15 |
| CPI | |||
| Consumer Price Index | 7.75% | 5.01% | 3.85% |
| Fund Assets Managed | |||
| Investment Advisor | % | $ Million | Investment Strategy |
| Pzena Investment Management, LLC | 25 | 156 | Uses a deep-value approach that focuses on the most undervalued companies based on price-to-normalized earnings. The firm believes that this value philosophy works well globally and is especially effective in emerging markets because of generally wider valuation spreads. |
| Oaktree Fund Advisors, LLC | 24 | 153 | Seeks securities that have been undervalued by investors. Oaktree’s investment process is driven by bottom-up research, which includes extensive travel to meet company management and maintaining in-house models focused on deriving reliable cash-flow projections. |
| Baillie Gifford Overseas Ltd. | 24 | 152 | Believes that companies that can sustainably grow their business and increase earnings faster than market average will perform best. Stock selection is driven by bottom-up, fundamental analysis, focusing on a company’s potential over a meaningful time period, typically three to five years and beyond. |
| Wellington Management Company LLP | 24 | 148 | Allocates the assets in its portion of the fund to a team of global analysts who seek to add value through in-depth fundamental research and understanding of their industries. By covering the same companies over a period of many years, these investment professionals gain comprehensive insight to guide decisions for their subportfolios. |
| Cash Investments | 3 | 20 | These short-term reserves are invested by Vanguard in equity index products to simulate investment in stocks. Each advisor may also maintain a modest cash position. |
| • | Based on actual fund return. This section helps you to estimate the actual expenses that you paid over the period. The ”Ending Account Value“ shown is derived from the fund‘s actual return, and the third column shows the dollar amount that would have been paid by an investor who started with $1,000 in the fund. You may use the information here, together with the amount you invested, to estimate the expenses that you paid over the period. |
| • | Based on hypothetical 5% yearly return. This section is intended to help you compare your fund‘s costs with those of other mutual funds. It assumes that the fund had a yearly return of 5% before expenses, but that the expense ratio is unchanged. In this case—because the return used is not the fund’s actual return—the results do not apply to your investment. The example is useful in making comparisons because the Securities and Exchange Commission requires all mutual funds to calculate expenses based on a 5% return. You can assess your fund’s costs by comparing this hypothetical example with the hypothetical examples that appear in shareholder reports of other funds. |
| Six Months Ended October 31, 2022 | |||
| Emerging Markets Select Stock Fund | Beginning Account Value 4/30/2022 | Ending Account Value 10/31/2022 | Expenses Paid During Period |
| Based on Actual Fund Return | $1,000.00 | $824.00 | $3.49 |
| Based on Hypothetical 5% Yearly Return | 1,000.00 | 1,021.37 | 3.87 |

| Average Annual Total Returns Periods Ended October 31, 2022 | |||||
| One Year | Five Years | Ten Years | Final Value of a $10,000 Investment | ||
 | Emerging Markets Select Stock Fund | -31.16% | -2.34% | 1.41% | $11,498 |
 | FTSE Emerging Index | -28.35 | -1.78 | 1.35 | 11,434 |
 | MSCI All Country World Index ex USA | -24.73 | -0.60 | 3.27 | 13,796 |
| China | 24.9% |
| India | 13.1 |
| Brazil | 11.9 |
| Taiwan | 10.8 |
| South Korea | 7.9 |
| United States | 5.5 |
| Hong Kong | 4.6 |
| Indonesia | 3.8 |
| Thailand | 3.5 |
| South Africa | 2.4 |
| Mexico | 2.2 |
| United Kingdom | 1.7 |
| Canada | 1.1 |
| Hungary | 1.0 |
| Other | 5.6 |
| Shares | Market Value• ($000) | ||
| Common Stocks (95.3%) | |||
| Brazil (11.4%) | |||
| Petroleo Brasileiro SA ADR (XNYS) | 904,674 | 11,598 | |
| Vale SA Class B ADR | 563,073 | 7,286 | |
| Ambev SA | 2,121,666 | 6,572 | |
| Cia Energetica de Minas Gerais Preference Shares | 2,746,665 | 6,046 | |
| Banco Bradesco SA ADR | 1,411,609 | 5,350 | |
| Itau Unibanco Holding SA Preference Shares | 698,900 | 4,113 | |
| B3 SA - Brasil Bolsa Balcao | 1,332,100 | 3,879 | |
| Centrais Eletricas Brasileiras SA | 379,218 | 3,657 | |
| Itau Unibanco Holding SA ADR | 593,658 | 3,455 | |
| Raizen SA Preference Shares | 4,023,535 | 3,342 | |
| Banco Bradesco SA Preference Shares | 798,600 | 3,070 | |
| Petroleo Brasileiro SA ADR | 183,700 | 2,114 | |
| Neoenergia SA | 570,300 | 1,832 | |
| Cia de Saneamento Basico do Estado de Sao Paulo | 146,947 | 1,710 | |
| Petroleo Brasileiro SA | 264,473 | 1,703 | |
| * | Azul SA ADR | 160,531 | 1,507 |
| TIM SA | 478,100 | 1,222 | |
| Banco Do Brasil SA | 162,600 | 1,165 | |
| * | Magazine Luiza SA | 621,020 | 537 |
| 1 | Hapvida Participacoes e Investimentos SA | 324,862 | 491 |
| Raia Drogasil SA | 94,470 | 481 | |
| Hypera SA | 18,424 | 181 | |
| Totvs SA | 21,400 | 137 | |
| Caixa Seguridade Participacoes SA | 68,870 | 118 | |
| 71,566 | |||
| Canada (1.0%) | |||
| First Quantum Minerals Ltd. | 160,978 | 2,839 | |
| Lundin Mining Corp. | 372,945 | 1,955 | |
| Parex Resources Inc. | 102,230 | 1,559 | |
| * | Valeura Energy Inc. | 264,800 | 132 |
| 6,485 | |||
| Shares | Market Value• ($000) | ||
| China (23.7%) | |||
| * | Alibaba Group Holding Ltd. | 2,134,340 | 16,594 |
| Tencent Holdings Ltd. | 528,550 | 13,889 | |
| *,1 | Meituan Class B | 359,392 | 5,754 |
| * | Trip.com Group Ltd. ADR | 247,376 | 5,598 |
| Ping An Insurance Group Co. of China Ltd. Class H | 990,527 | 3,965 | |
| China Merchants Bank Co. Ltd. Class H | 1,099,289 | 3,599 | |
| China Overseas Land & Investment Ltd. | 1,740,805 | 3,327 | |
| Zijin Mining Group Co. Ltd. Class H | 3,426,446 | 3,268 | |
| JD.com Inc. Class A | 169,070 | 3,079 | |
| 1 | Ganfeng Lithium Co. Ltd. Class H | 450,517 | 3,047 |
| * | Shanghai International Airport Co. Ltd. Class A | 407,510 | 2,981 |
| * | Baidu Inc. Class A | 296,686 | 2,844 |
| Contemporary Amperex Technology Co. Ltd. Class A (XSHE) | 54,273 | 2,785 | |
| China Construction Bank Corp. Class H | 5,188,694 | 2,754 | |
| China Tourism Group Duty Free Corp. Ltd. Class A | 123,549 | 2,715 | |
| Anhui Conch Cement Co. Ltd. Class H | 1,006,625 | 2,591 | |
| Aluminum Corp. of China Ltd. Class H | 8,785,233 | 2,505 | |
| Midea Group Co. Ltd. Class A | 424,086 | 2,336 | |
| Geely Automobile Holdings Ltd. | 2,157,301 | 2,322 | |
| * | Air China Ltd. Class H | 3,156,872 | 2,197 |
| 1 | WuXi AppTec Co. Ltd. Class H | 267,524 | 2,147 |
| * | Baidu Inc. ADR | 27,944 | 2,140 |
| China Longyuan Power Group Corp. Ltd. Class H | 1,786,350 | 2,041 | |
| GF Securities Co. Ltd. Class H | 1,948,400 | 1,982 | |
| * | China Tourism Group Duty Free Corp. Ltd. Class A (XHKG) | 94,746 | 1,687 |
| ANTA Sports Products Ltd. | 188,013 | 1,653 | |
| Shares | Market Value• ($000) | ||
| Muyuan Foods Co. Ltd.Class A | 245,170 | 1,579 | |
| Haier Smart Home Co. Ltd. Class H | 625,800 | 1,566 | |
| * | Brilliance China Automotive Holdings Ltd. | 3,486,000 | 1,501 |
| * | KE Holdings Inc. ADR | 147,459 | 1,501 |
| Nine Dragons Paper Holdings Ltd. | 2,388,888 | 1,416 | |
| Contemporary Amperex Technology Co. Ltd. Class A | 27,500 | 1,411 | |
| CITIC Securities Co. Ltd. Class H | 903,554 | 1,350 | |
| Riyue Heavy Industry Co. Ltd. Class A (XSHG) | 439,054 | 1,332 | |
| Weichai Power Co. Ltd. Class H | 1,387,349 | 1,329 | |
| ENN Energy Holdings Ltd. | 132,041 | 1,313 | |
| Li Ning Co. Ltd. | 251,768 | 1,302 | |
| Dongfeng Motor Group Co. Ltd. Class H | 2,838,000 | 1,284 | |
| Midea Group Co. Ltd. Class A (XSEC) | 205,194 | 1,130 | |
| Ping An Bank Co. Ltd. Class A | 768,940 | 1,092 | |
| Xtep International Holdings Ltd. | 1,119,891 | 1,026 | |
| China Oilfield Services Ltd. Class H | 904,508 | 1,018 | |
| Industrial & Commercial Bank of China Ltd. Class H | 2,267,666 | 985 | |
| 1 | Pharmaron Beijing Co. Ltd. Class H | 283,084 | 955 |
| Minth Group Ltd. | 474,000 | 935 | |
| Sinoma Science & Technology Co. Ltd. Class A | 353,800 | 869 | |
| * | BeiGene Ltd. | 66,950 | 863 |
| Yunnan Energy New Material Co. Ltd. Class A | 42,200 | 856 | |
| 1 | CSC Financial Co. Ltd. Class H | 1,047,657 | 760 |
| Yihai International Holding Ltd. | 452,690 | 746 | |
| Guangzhou Tinci Materials Technology Co. Ltd. Class A | 126,300 | 736 | |
| Shenzhou International Group Holdings Ltd. | 105,500 | 732 | |
| * | Trip.com Group Ltd. | 31,278 | 703 |
| Suofeiya Home Collection Co. Ltd. Class A | 354,790 | 680 | |
| China Resources Beer Holdings Co. Ltd. | 131,800 | 622 | |
| * | Zai Lab Ltd. | 266,900 | 614 |
| China Yangtze Power Co. Ltd. Class A | 217,600 | 606 | |
| Anker Innovations Technology Co. Ltd. Class A | 80,600 | 598 | |
| Bank of Ningbo Co. Ltd. Class A | 160,000 | 522 |
| Shares | Market Value• ($000) | ||
| China National Building Material Co. Ltd. Class H | 884,093 | 513 | |
| * | Kingdee International Software Group Co. Ltd. | 304,575 | 499 |
| *,1 | Haidilao International Holding Ltd. | 326,000 | 484 |
| * | Tencent Music Entertainment Group ADR | 132,550 | 479 |
| * | XPeng Inc. Class A | 148,952 | 477 |
| China Railway Group Ltd. Class A | 683,200 | 467 | |
| CSPC Pharmaceutical Group Ltd. | 443,199 | 455 | |
| China Pacific Insurance Group Co. Ltd. Class H | 281,922 | 454 | |
| Shanghai Putailai New Energy Technology Co. Ltd. Class A | 65,720 | 450 | |
| Zoomlion Heavy Industry Science and Technology Co. Ltd. Class A | 591,100 | 434 | |
| JD.com Inc. ADR | 11,146 | 416 | |
| Baoshan Iron & Steel Co. Ltd. Class A | 630,300 | 416 | |
| Shandong Weigao Group Medical Polymer Co. Ltd. Class H | 294,318 | 406 | |
| * | KE Holdings Inc. Class A | 121,500 | 403 |
| Suofeiya Home Collection Co. Ltd. Class A (XSHE) | 207,345 | 397 | |
| Glodon Co. Ltd. Class A (XSHE) | 58,400 | 396 | |
| *,1 | Kuaishou Technology | 95,900 | 396 |
| Lufax Holding Ltd. ADR | 245,187 | 390 | |
| Hangzhou Tigermed Consulting Co. Ltd. Class A | 32,600 | 373 | |
| * | Yatsen Holding Ltd. ADR | 326,250 | 369 |
| Shenzhen Mindray Bio-Medical Electronics Co. Ltd. Class A | 8,100 | 362 | |
| Zhejiang HangKe Technology Inc. Co Class A | 47,879 | 328 | |
| WuXi AppTec Co. Ltd. Class A | 30,200 | 316 | |
| * | Grand Baoxin Auto Group Ltd. | 6,482,000 | 313 |
| China Vanke Co. Ltd. Class H | 243,700 | 313 | |
| Sany Heavy Industry Co. Ltd. Class A | 168,200 | 312 | |
| NetEase Inc. | 26,901 | 298 | |
| Wuxi Lead Intelligent Equipment Co. Ltd. Class A | 41,400 | 285 | |
| Metallurgical Corp of China Ltd. Class A | 652,600 | 258 | |
| Zhongsheng Group Holdings Ltd. | 66,311 | 252 | |
| * | Qinghai Salt Lake Industry Co. Ltd. Class A | 79,800 | 236 |
| *,1 | Remegen Co. Ltd. Class H | 37,359 | 235 |
| Shares | Market Value• ($000) | ||
| CIMC Enric Holdings Ltd. | 240,000 | 234 | |
| * | New Oriental Educatio Sp ADR | 9,612 | 228 |
| SAIC Motor Corp. Ltd. Class A | 114,500 | 216 | |
| Yifeng Pharmacy Chain Co. Ltd. Class A (XSHG) | 27,170 | 209 | |
| Angang Steel Co. Ltd.Class A | 560,600 | 189 | |
| * | Alibaba Group Holding Ltd. ADR | 2,826 | 180 |
| Great Wall Motor Co. Ltd. Class H | 146,500 | 160 | |
| Yifeng Pharmacy Chain Co. Ltd. Class A | 19,300 | 149 | |
| 1 | Asymchem Laboratories Tianjin Co. Ltd. Class H | 11,491 | 123 |
| * | Microport Scientific Corp. | 56,946 | 120 |
| Amoy Diagnostics Co. Ltd. Class A | 37,094 | 119 | |
| NetEase Inc. ADR | 2,103 | 117 | |
| * | Vnet Group Inc. ADR | 27,521 | 115 |
| Shanghai Fosun Pharmaceutical Group Co. Ltd. Class H | 44,000 | 111 | |
| Vinda International Holdings Ltd. | 57,000 | 107 | |
| 1 | Hangzhou Tigermed Consulting Co. Ltd. Class H | 15,616 | 106 |
| Shenzhen Mindray Bio-Medical Electronics Co. Ltd. Class A (XSHE) | 2,300 | 103 | |
| Asymchem Laboratories Tianjin Co. Ltd. Class A | 5,160 | 101 | |
| Jinyu Bio-Technology Co. Ltd. Class A | 73,900 | 84 | |
| * | Onewo Inc. Class H | 21,415 | 81 |
| H World Group Ltd. AD | 2,393 | 65 | |
| Poly Developments and Holdings Group Co. Ltd. Class A | 34,300 | 65 | |
| Proya Cosmetics Co. Ltd. Class A | 2,800 | 64 | |
| *,1 | Venus MedTech Hangzhou Inc. Class H | 48,977 | 60 |
| * | GDS Holdings Ltd. ADR | 6,127 | 53 |
| Country Garden Services Holdings Co. Ltd. | 40,440 | 35 | |
| Angang Steel Co. Ltd. Class H | 73,662 | 15 | |
| Amoy Diagnostics Co. Ltd. Class A (XSHE) | 3,080 | 10 | |
| *,2 | Tianhe Chemicals Group Ltd. | 4,142,000 | — |
| 149,133 | |||
| Cyprus (0.0%) | |||
| * | Galaxy Cosmos Mezz plc | 110,618 | 18 |
| Czech Republic (0.4%) | |||
| Komercni banka A/S | 73,436 | 2,103 | |
| CEZ A/S | 8,341 | 273 | |
| 2,376 | |||
| Shares | Market Value• ($000) | ||
| Egypt (0.0%) | |||
| Commercial International Bank Egypt SAE GDR (Registered) | 2 | — | |
| Greece (0.6%) | |||
| * | Alpha Services and Holdings SA | 2,986,676 | 2,766 |
| Hellenic Telecommunications Organization SA | 75,316 | 1,183 | |
| 3,949 | |||
| Hong Kong (4.4%) | |||
| Galaxy Entertainment Group Ltd. | 1,952,070 | 8,918 | |
| Pacific Basin Shipping Ltd. | 14,975,140 | 3,625 | |
| * | Sands China Ltd. | 1,847,505 | 3,230 |
| Lenovo Group Ltd. | 3,878,000 | 3,099 | |
| Yue Yuen Industrial Holdings Ltd. | 2,572,000 | 2,615 | |
| AIA Group Ltd. | 274,437 | 2,079 | |
| VTech Holdings Ltd. | 289,500 | 1,541 | |
| Orient Overseas International Ltd. | 104,814 | 1,532 | |
| * | Melco Resorts & Entertainment Ltd. ADR | 130,301 | 713 |
| Kerry Properties Ltd. | 99,000 | 156 | |
| 1 | ESR Cayman Ltd. | 45,606 | 78 |
| 27,586 | |||
| Hungary (0.9%) | |||
| OTP Bank Nyrt | 241,310 | 5,264 | |
| MOL Hungarian Oil & Gas plc | 98,379 | 591 | |
| 5,855 | |||
| India (12.5%) | |||
| Reliance Industries Ltd. | 612,122 | 18,888 | |
| Housing Development Finance Corp. Ltd. | 172,975 | 5,172 | |
| Axis Bank Ltd. | 469,483 | 5,149 | |
| Larsen & Toubro Ltd. | 200,033 | 4,897 | |
| Shriram Transport Finance Co. Ltd. | 317,842 | 4,727 | |
| ICICI Bank Ltd. ADR | 192,267 | 4,238 | |
| Bharti Airtel Ltd (XNSE) | 413,482 | 4,158 | |
| UltraTech Cement Ltd. | 47,059 | 3,823 | |
| Aurobindo Pharma Ltd. | 524,778 | 3,412 | |
| Tata Consultancy Services Ltd. | 86,478 | 3,337 | |
| Tech Mahindra Ltd. | 204,449 | 2,629 | |
| State Bank of India | 377,274 | 2,620 | |
| 1 | HDFC Life Insurance Co. Ltd. | 376,278 | 2,459 |
| Kotak Mahindra Bank Ltd. | 92,184 | 2,123 | |
| Infosys Ltd. ADR | 82,214 | 1,540 | |
| Mahindra & Mahindra Ltd. | 86,547 | 1,412 | |
| ICICI Bank Ltd. | 114,287 | 1,257 | |
| Power Grid Corp. of India Ltd. | 386,533 | 1,066 | |
| 1 | SBI Life Insurance Co. Ltd. | 60,556 | 928 |
| Piramal Enterprises Ltd. | 66,542 | 684 | |
| Bharat Electronics Ltd. | 508,827 | 657 | |
| UPL Ltd. | 73,290 | 647 | |
| Shares | Market Value• ($000) | ||
| * | Piramal Pharma Ltd. | 266,168 | 530 |
| Apollo Hospitals Enterprise Ltd. | 8,998 | 491 | |
| * | Zomato Ltd. | 502,368 | 383 |
| * | Fortis Healthcare Ltd. | 96,586 | 324 |
| Tata Steel Ltd. | 240,069 | 294 | |
| Dabur India Ltd. | 41,301 | 277 | |
| PI Industries Ltd. | 4,819 | 189 | |
| Bharti Airtel Ltd. | 31,225 | 166 | |
| 78,477 | |||
| Indonesia (3.6%) | |||
| Bank Rakyat Indonesia Persero Tbk PT | 39,396,025 | 11,753 | |
| Bank Mandiri Persero Tbk PT | 7,321,200 | 4,946 | |
| Semen Indonesia Persero Tbk PT | 4,429,400 | 2,260 | |
| Telkom Indonesia Persero Tbk PT | 7,196,637 | 2,021 | |
| Bank Central Asia Tbk PT | 2,712,155 | 1,533 | |
| Aneka Tambang Tbk | 1,641,300 | 194 | |
| 22,707 | |||
| Japan (0.1%) | |||
| * | Universal Entertainment Corp. | 41,000 | 553 |
| Kenya (0.2%) | |||
| Equity Group Holdings plc | 2,758,414 | 1,062 | |
| Mexico (2.1%) | |||
| Grupo Financiero Banorte SAB de CV Class O | 1,028,915 | 8,363 | |
| Wal-Mart de Mexico SAB de CV | 540,268 | 2,087 | |
| * | Cemex SAB de CV ADR | 308,447 | 1,191 |
| Qualitas Controladora SAB de CV | 143,044 | 562 | |
| Grupo Mexico SAB de CV Series B | 111,163 | 403 | |
| Corp. Inmobiliaria Vesta SAB de CV | 108,500 | 236 | |
| Orbia Advance Corp. SAB de CV | 132,500 | 224 | |
| 13,066 | |||
| Netherlands (0.1%) | |||
| ASML Holding NV | 1,329 | 623 | |
| Other (0.8%) | |||
| 3 | Vanguard FTSE Emerging Markets ETF | 150,681 | 5,342 |
| Philippines (0.4%) | |||
| Bdo Unibank Inc. | 1,037,747 | 2,294 | |
| Ayala Land Inc. | 484,700 | 215 | |
| 2,509 | |||
| Poland (0.2%) | |||
| *,1 | Allegro.eu SA | 147,294 | 714 |
| KGHM Polska Miedz SA | 34,440 | 689 | |
| 1,403 | |||
| Romania (0.2%) | |||
| Banca Transilvania SA | 441,537 | 1,512 | |
| Russia (0.0%) | |||
| 2 | MMC Norilsk Nickel PJSC ADR | 200,203 | — |
| *,2 | Sberbank of Russia PJSC | 1,473,153 | — |
| Shares | Market Value• ($000) | ||
| *,2 | Mobile TeleSystems PJSC ADR | 93,946 | — |
| *,2 | Moscow Exchange MICEX-RTS PJSC | 536,630 | — |
| 2 | Magnit PJSC GDR (Registered) | 2 | — |
| 2 | MMC Norilsk Nickel PJSC | 1,247 | — |
| *,2 | Sberbank of Russia PJSC ADR | 476,234 | — |
| 2 | LUKOIL PJSC ADR | 102,385 | — |
| 2 | Novatek PJSC GDR (Registered) | 6,724 | — |
| *,2,4 | Ozon Holdings plc ADR | 37,493 | — |
| 2 | Magnit PJSC | 12,527 | — |
| 2 | Gazprom PJSC | 926,846 | — |
| — | |||
| Saudi Arabia (0.6%) | |||
| Saudi British Bank | 180,813 | 2,095 | |
| 1 | Saudi Arabian Oil Co. | 163,398 | 1,516 |
| 3,611 | |||
| Singapore (0.7%) | |||
| Wilmar International Ltd. | 1,612,000 | 4,416 | |
| South Africa (2.3%) | |||
| Sasol Ltd. | 210,194 | 3,533 | |
| AngloGold Ashanti Ltd. ADR | 267,213 | 3,487 | |
| Impala Platinum Holdings Ltd. | 224,903 | 2,303 | |
| FirstRand Ltd. | 315,005 | 1,101 | |
| Thungela Resources Ltd. | 51,383 | 784 | |
| Gold Fields Ltd. | 85,598 | 686 | |
| Naspers Ltd. Class N | 6,400 | 660 | |
| Reunert Ltd. | 262,523 | 660 | |
| * | Discovery Ltd. | 80,486 | 527 |
| Sibanye Stillwater Ltd. | 193,046 | 452 | |
| Harmony Gold Mining Co. Ltd. | 81,675 | 226 | |
| Old Mutual Ltd. (XZIM) | 365,405 | 207 | |
| 14,626 | |||
| South Korea (7.5%) | |||
| Samsung Electronics Co. Ltd. | 305,176 | 12,701 | |
| LG Chem Ltd. | 12,491 | 5,482 | |
| SK Hynix Inc. | 80,367 | 4,653 | |
| Samsung SDI Co. Ltd. | 6,880 | 3,550 | |
| Hankook Tire & Technology Co. Ltd. | 136,687 | 3,501 | |
| POSCO Holdings Inc. | 18,626 | 3,246 | |
| Hyundai Motor Co. | 23,863 | 2,750 | |
| Samsung Electronics Co. Ltd. Preference Shares | 71,045 | 2,655 | |
| DB Insurance Co. Ltd. | 61,070 | 2,410 | |
| Hana Financial Group Inc. | 60,283 | 1,743 | |
| Shinhan Financial Group Co. Ltd. | 53,870 | 1,369 | |
| * | Korea Shipbuilding & Offshore Engineering Co. Ltd. | 21,091 | 1,074 |
| KB Financial Group Inc. | 26,800 | 902 | |
| Doosan Bobcat Inc. | 36,396 | 854 | |
| NAVER Corp. | 4,531 | 538 | |
| 47,428 | |||
| Shares | Market Value• ($000) | ||
| Taiwan (10.3%) | |||
| Taiwan Semiconductor Manufacturing Co. Ltd. | 2,854,656 | 34,319 | |
| Hon Hai Precision Industry Co. Ltd. | 2,323,685 | 7,380 | |
| MediaTek Inc. | 281,014 | 5,122 | |
| Compal Electronics Inc. | 6,334,000 | 4,143 | |
| Lite-On Technology Corp. | 1,878,000 | 3,719 | |
| Elite Material Co. Ltd. | 504,000 | 2,280 | |
| United Microelectronics Corp. | 1,455,926 | 1,751 | |
| United Integrated Services Co. Ltd. | 328,000 | 1,472 | |
| E Ink Holdings Inc. | 221,000 | 1,404 | |
| Chroma ATE Inc. | 160,000 | 874 | |
| ASPEED Technology Inc. | 11,553 | 599 | |
| Airtac International Group | 25,783 | 590 | |
| Nanya Technology Corp. | 199,000 | 335 | |
| Realtek Semiconductor Corp. | 33,738 | 266 | |
| Unimicron Technology Corp. | 60,800 | 234 | |
| Globalwafers Co. Ltd. | 14,456 | 160 | |
| Parade Technologies Ltd. | 3,058 | 58 | |
| 64,706 | |||
| Thailand (3.3%) | |||
| PTT Exploration & Production PCL | 912,100 | 4,361 | |
| Charoen Pokphand Foods PCL | 5,818,600 | 3,869 | |
| SCB X PCL NVDR | 1,316,300 | 3,678 | |
| Kasikornbank PCL | 644,207 | 2,479 | |
| Kasikornbank PCL NVDR | 499,579 | 1,922 | |
| Bangkok Bank PCL NVDR | 469,100 | 1,796 | |
| Bangkok Bank PCL (Registered) | 215,800 | 827 | |
| * | Thai Life Insurance PCL | 1,897,897 | 774 |
| Bangkok Dusit Medical Services PCL Class F | 469,300 | 364 | |
| CP ALL PCL | 181,500 | 286 | |
| PTT Exploration & Production PCL (XBKK) | 39,800 | 190 | |
| Central Pattana PCL | 92,270 | 167 | |
| 20,713 | |||
| Turkey (0.4%) | |||
| Akbank TAS | 2,890,926 | 2,273 | |
| United Arab Emirates (0.7%) | |||
| Abu Dhabi Commercial Bank PJSC | 1,508,969 | 3,884 | |
| Emaar Properties PJSC | 182,311 | 301 | |
| Borouge plc | 351,373 | 260 | |
| 4,445 | |||
| United Kingdom (1.6%) | |||
| Standard Chartered plc | 762,825 | 4,558 | |
| Fresnillo plc | 241,232 | 2,017 | |
| Antofagasta plc | 88,926 | 1,198 | |
| *,1 | Network International Holdings plc | 285,409 | 1,069 |
| Anglo American plc | 29,712 | 890 | |
| Polymetal International plc | 121,016 | 286 | |
| Hikma Pharmaceuticals plc | 16,009 | 230 | |
| 10,248 | |||
| Shares | Market Value• ($000) | ||
| United States (5.3%) | |||
| Credicorp Ltd. | 52,800 | 7,728 | |
| * | Flex Ltd. | 241,216 | 4,723 |
| * | MercadoLibre Inc. | 4,814 | 4,340 |
| Freeport-McMoRan Inc. | 126,596 | 4,012 | |
| Cognizant Technology Solutions Corp. Class A | 51,280 | 3,192 | |
| * | Coupang Inc. | 128,048 | 2,211 |
| * | Copa Holdings SA Class A | 25,130 | 1,890 |
| * | Afya Ltd. Class A | 87,070 | 1,283 |
| * | PagSeguro Digital Ltd. Class A | 87,254 | 1,194 |
| Ternium SA ADR | 25,307 | 729 | |
| Patria Investments Ltd. Class A | 44,816 | 637 | |
| * | Sea Ltd. ADR | 12,438 | 618 |
| Yum China Holdings Inc. | 5,513 | 228 | |
| * | StoneCo. Ltd. Class A | 18,159 | 191 |
| * | MakeMyTrip Ltd. | 3,118 | 87 |
| *,2 | Yandex NV Class A | 11,746 | — |
| 33,063 | |||
| Vietnam (0.0%) | |||
| 1 | Vinhomes JSC | 107,002 | 194 |
| Total Common Stocks (Cost $714,406) | 599,945 | ||
| Temporary Cash Investments (4.3%) | |||
| Money Market Fund (4.3%) | |||
| 5,6 | Vanguard Market Liquidity Fund, 3.117% (Cost $27,135) | 271,459 | 27,141 |
| Total Investments (99.6%) (Cost $741,541) | 627,086 | ||
| Other Assets and Liabilities—Net (0.4%) | 2,316 | ||
| Net Assets (100%) | 629,402 | ||
| Cost is in $000. | |||
| • | See Note A in Notes to Financial Statements. |
| * | Non-income-producing security. |
| 1 | Security exempt from registration under Rule 144A of the Securities Act of 1933. Such securities may be sold in transactions exempt from registration, normally to qualified institutional buyers. At October 31, 2022, the aggregate value was $21,516,000, representing 3.4% of net assets. |
| 2 | Security value determined using significant unobservable inputs. |
| 3 | Considered an affiliated company of the fund as the issuer is another member of The Vanguard Group. |
| 4 | Includes partial security positions on loan to broker-dealers. The total value of securities on loan is $0. |
| 5 | Affiliated money market fund available only to Vanguard funds and certain trusts and accounts managed by Vanguard. Rate shown is the 7-day yield. |
| 6 | Collateral of $630,000 was received for securities on loan. |
| ADR—American Depositary Receipt. | |
| GDR—Global Depositary Receipt. | |
| NVDR—Non-Voting Depository Receipt. |
| Futures Contracts | ||||
| ($000) | ||||
| Expiration | Number of Long (Short) Contracts | Notional Amount | Value and Unrealized Appreciation (Depreciation) | |
| Long Futures Contracts | ||||
| MSCI Emerging Markets Index | December 2022 | 519 | 22,151 | (2,014) |
| ($000s, except shares and per-share amounts) | Amount |
| Assets | |
| Investments in Securities, at Value1 | |
| Unaffiliated Issuers (Cost $707,872) | 594,603 |
| Affiliated Issuers (Cost $33,669) | 32,483 |
| Total Investments in Securities | 627,086 |
| Investment in Vanguard | 26 |
| Cash | 1,530 |
| Cash Collateral Pledged—Futures Contracts | 1,137 |
| Foreign Currency, at Value (Cost $1,406) | 1,432 |
| Receivables for Investment Securities Sold | 1,866 |
| Receivables for Accrued Income | 1,287 |
| Receivables for Capital Shares Issued | 252 |
| Total Assets | 634,616 |
| Liabilities | |
| Payables for Investment Securities Purchased | 1,622 |
| Collateral for Securities on Loan | 630 |
| Payables to Investment Advisor | 803 |
| Payables for Capital Shares Redeemed | 501 |
| Payables to Vanguard | 87 |
| Variation Margin Payable—Futures Contracts | 67 |
| Deferred Foreign Capital Gains Taxes | 1,504 |
| Total Liabilities | 5,214 |
| Net Assets | 629,402 |
| 1 Includes $0 of securities on loan. | |
| At October 31, 2022, net assets consisted of: | |
| Paid-in Capital | 789,080 |
| Total Distributable Earnings (Loss) | (159,678) |
| Net Assets | 629,402 |
| Net Assets | |
| Applicable to 36,122,580 outstanding $.001 par value shares of beneficial interest (unlimited authorization) | 629,402 |
| Net Asset Value Per Share | $17.42 |
| Year Ended October 31, 2022 | |
| ($000) | |
| Investment Income | |
| Income | |
| Dividends—Unaffiliated Issuers1 | 32,105 |
| Dividends—Affiliated Issuers | 169 |
| Interest—Unaffiliated Issuers | 10 |
| Interest—Affiliated Issuers | 384 |
| Securities Lending—Net | 30 |
| Total Income | 32,698 |
| Expenses | |
| Investment Advisory Fees—Note B | |
| Basic Fee | 4,203 |
| Performance Adjustment | (315) |
| The Vanguard Group—Note C | |
| Management and Administrative | 2,110 |
| Marketing and Distribution | 72 |
| Custodian Fees | 158 |
| Auditing Fees | 35 |
| Shareholders’ Reports | 41 |
| Trustees’ Fees and Expenses | — |
| Other Expenses | 16 |
| Total Expenses | 6,320 |
| Net Investment Income | 26,378 |
| Realized Net Gain (Loss) | |
| Capital Gains Distributions Received – Affiliated Issuers | 1 |
| Investment Securities Sold—Unaffiliated Issuers2 | (47,847) |
| Investment Securities Sold—Affiliated Issuers | (548) |
| Futures Contracts | (10,831) |
| Forward Currency Contracts | (18) |
| Foreign Currencies | (624) |
| Realized Net Gain (Loss) | (59,867) |
| Change in Unrealized Appreciation (Depreciation) | |
| Investment Securities—Unaffiliated Issuers3 | (258,668) |
| Investment Securities—Affiliated Issuers | (1,205) |
| Futures Contracts | (1,775) |
| Foreign Currencies | 36 |
| Change in Unrealized Appreciation (Depreciation) | (261,612) |
| Net Increase (Decrease) in Net Assets Resulting from Operations | (295,101) |
| 1 | Dividends are net of foreign withholding taxes of $2,401,000. |
| 2 | Realized gain (loss) is net of foreign capital gain taxes of $644,000. |
| 3 | The change in unrealized appreciation (depreciation) is net of the change in deferred foreign capital gains taxes of ($1,654,000). |
| Year Ended October 31, | ||
| 2022 ($000) | 2021 ($000) | |
| Increase (Decrease) in Net Assets | ||
| Operations | ||
| Net Investment Income | 26,378 | 15,932 |
| Realized Net Gain (Loss) | (59,867) | 57,460 |
| Change in Unrealized Appreciation (Depreciation) | (261,612) | 77,997 |
| Net Increase (Decrease) in Net Assets Resulting from Operations | (295,101) | 151,389 |
| Distributions | ||
| Total Distributions | (59,107) | (8,567) |
| Capital Share Transactions | ||
| Issued | 179,568 | 384,600 |
| Issued in Lieu of Cash Distributions | 50,609 | 7,584 |
| Redeemed | (220,976) | (230,893) |
| Net Increase (Decrease) from Capital Share Transactions | 9,201 | 161,291 |
| Total Increase (Decrease) | (345,007) | 304,113 |
| Net Assets | ||
| Beginning of Period | 974,409 | 670,296 |
| End of Period | 629,402 | 974,409 |
| For a Share Outstanding Throughout Each Period | Year Ended October 31, | ||||
| 2022 | 2021 | 2020 | 2019 | 2018 | |
| Net Asset Value, Beginning of Period | $27.09 | $22.18 | $21.87 | $19.68 | $22.56 |
| Investment Operations | |||||
| Net Investment Income1 | .715 | .457 | .298 | .4742 | .414 |
| Net Realized and Unrealized Gain (Loss) on Investments | (8.724) | 4.729 | .483 | 2.208 | (2.943) |
| Total from Investment Operations | (8.009) | 5.186 | .781 | 2.682 | (2.529) |
| Distributions | |||||
| Dividends from Net Investment Income | (.486) | (.276) | (.471) | (.492) | (.351) |
| Distributions from Realized Capital Gains | (1.175) | — | — | — | — |
| Total Distributions | (1.661) | (.276) | (.471) | (.492) | (.351) |
| Net Asset Value, End of Period | $17.42 | $27.09 | $22.18 | $21.87 | $19.68 |
| Total Return3 | -31.16% | 23.44% | 3.51% | 13.96% | -11.39% |
| Ratios/Supplemental Data | |||||
| Net Assets, End of Period (Millions) | $629 | $974 | $670 | $702 | $564 |
| Ratio of Total Expenses to Average Net Assets4 | 0.78% | 0.84% | 0.85% | 0.93% | 0.94% |
| Ratio of Net Investment Income to Average Net Assets | 3.26% | 1.65% | 1.43% | 2.25%2 | 1.85% |
| Portfolio Turnover Rate | 41% | 48% | 52% | 46% | 76% |
| 1 | Calculated based on average shares outstanding. |
| 2 | Net investment income per share and the ratio of net investment income to average net assets include $0.071 and 0.34%, respectively, resulting from a special dividend from Naspers Ltd. in September 2019. |
| 3 | Total returns do not include account service fees that may have applied in the periods shown. Fund prospectuses provide information about any applicable account service fees. |
| 4 | Includes performance-based investment advisory fee increases (decreases) of (0.04%), 0.02%, (0.01%), 0.07%, and 0.05%. |
| A. | The following significant accounting policies conform to generally accepted accounting principles for U.S. investment companies. The fund consistently follows such policies in preparing its financial statements. |
| B. | The investment advisory firms Wellington Management Company llp, Baillie Gifford Overseas Ltd., Oaktree Fund Advisors, LLC, and Pzena Investment Management, LLC, each provide investment advisory services to a portion of the fund for a fee calculated at an annual percentage rate of average net assets managed by the advisor. The basic fees of Wellington Management Company llp, Baillie Gifford Overseas Ltd., Oaktree Fund Advisors, LLC, and Pzena Investment Management, LLC are subject to quarterly adjustments based on performance relative to the FTSE Emerging Index for the preceding three years. |
| C. | In accordance with the terms of a Funds' Service Agreement (the “FSA”) between Vanguard and the fund, Vanguard furnishes to the fund corporate management, administrative, marketing, distribution and cash management services at Vanguard’s cost of operations (as defined by the FSA). These costs of operations are allocated to the fund based on methods and guidelines approved by the board of trustees and are generally settled twice a month. |
| D. | Various inputs may be used to determine the value of the fund’s investments and derivatives. These inputs are summarized in three broad levels for financial statement purposes. The inputs or methodologies used to value securities are not necessarily an indication of the risk associated with investing in those securities. |
| Level 1 ($000) | Level 2 ($000) | Level 3 ($000) | Total ($000) | |
| Investments | ||||
| Assets | ||||
| Common Stocks—North and South America | 124,180 | — | — | 124,180 |
| Common Stocks—Other | 26,971 | 448,794 | — | 475,765 |
| Temporary Cash Investments | 27,141 | — | — | 27,141 |
| Total | 178,292 | 448,794 | — | 627,086 |
| Derivative Financial Instruments | ||||
| Liabilities | ||||
| Futures Contracts1 | 2,014 | — | — | 2,014 |
| 1 | Includes cumulative appreciation (depreciation) on futures contracts and centrally cleared swaps, if any, as reported in the Schedule of Investments. Only current day’s variation margin is reported within the Statement of Assets and Liabilities. |
| E. | At October 31, 2022, the fair values of derivatives were reflected in the Statement of Assets and Liabilities as follows: |
| Statement of Assets and Liabilities | Equity Contracts ($000) | Foreign Exchange Contracts ($000) | Total ($000) |
| Unrealized Depreciation—Futures Contracts1 | 2,014 | — | 2,014 |
| 1 | Includes cumulative appreciation (depreciation) on futures contracts and centrally cleared swaps, if any, as reported in the Schedule of Investments. Only current day’s variation margin is reported within the Statement of Assets and Liabilities. |
| Realized Net Gain (Loss) on Derivatives | Equity Contracts ($000) | Foreign Exchange Contracts ($000) | Total ($000) |
| Futures Contracts | (10,831) | — | (10,831) |
| Forward Currency Contracts | — | (18) | (18) |
| Realized Net Gain (Loss) on Derivatives | (10,831) | (18) | (10,849) |
| Equity Contracts ($000) | Foreign Exchange Contracts ($000) | Total ($000) | |
| Change in Unrealized Appreciation (Depreciation) on Derivatives | |||
| Futures Contracts | (1,775) | — | (1,775) |
| F. | Permanent differences between book-basis and tax-basis components of net assets are reclassified among capital accounts in the financial statements to reflect their tax character. These reclassifications have no effect on net assets or net asset value per share. As of period end, permanent differences primarily attributable to the accounting for applicable foreign currency transactions, passive foreign investment companies, and tax expense on capital gains were reclassified between the individual components of total distributable earnings (loss). |
| Amount ($000) | |
| Undistributed Ordinary Income | 21,737 |
| Undistributed Long-Term Gains | — |
| Capital Loss Carryforwards | (52,483) |
| Qualified Late-Year Losses | — |
| Net Unrealized Gains (Losses) | (128,932) |
| Year Ended October 31, | ||
| 2022 Amount ($000) | 2021 Amount ($000) | |
| Ordinary Income* | 32,782 | 8,567 |
| Long-Term Capital Gains | 26,325 | — |
| Total | 59,107 | 8,567 |
| * | Includes short-term capital gains, if any. |
| Amount ($000) | |
| Tax Cost | 754,528 |
| Gross Unrealized Appreciation | 82,789 |
| Gross Unrealized Depreciation | (210,232) |
| Net Unrealized Appreciation (Depreciation) | (127,443) |
| G. | During the year ended October 31, 2022, the fund purchased $307,393,000 of investment securities and sold $317,198,000 of investment securities, other than temporary cash investments. |
| H. | Capital shares issued and redeemed were: |
| Year Ended October 31, | ||
| 2022 Shares (000) | 2021 Shares (000) | |
| Issued | 8,139 | 13,807 |
| Issued in Lieu of Cash Distributions | 2,150 | 294 |
| Redeemed | (10,131) | (8,359) |
| Net Increase (Decrease) in Shares Outstanding | 158 | 5,742 |
| I. | Transactions during the period in investments where the issuer is another member of The Vanguard Group were as follows: |
| Current Period Transactions | ||||||||
| Oct. 31, 2021 Market Value ($000) | Purchases at Cost ($000) | Proceeds from Securities Sold ($000) | Realized Net Gain (Loss) ($000) | Change in Unrealized App. (Dep.) ($000) | Income ($000) | Capital Gain Distributions Received ($000) | Oct. 31, 2022 Market Value ($000) | |
| Vanguard FTSE Emerging Markets ETF | 1,764 | 15,842 | 10,522 | (536) | (1,206) | 169 | — | 5,342 |
| Vanguard Market Liquidity Fund | 59,595 | NA1 | NA1 | (12) | 1 | 384 | 1 | 27,141 |
| Total | 61,359 | 15,842 | 10,522 | (548) | (1,205) | 553 | 1 | 32,483 |
| 1 | Not applicable—purchases and sales are for temporary cash investment purposes. |
| J. | Management has determined that no events or transactions occurred subsequent to October 31, 2022, that would require recognition or disclosure in these financial statements. |
Philadelphia, Pennsylvania
December 16, 2022
| Matthew Benchener | Thomas M. Rampulla |
| Joseph Brennan | Karin A. Risi |
| Mortimer J. Buckley | Anne E. Robinson |
| Gregory Davis | Michael Rollings |
| John James | Nitin Tandon |
| Chris D. Mclsaac | Lauren Valente |

All rights reserved.
Vanguard Marketing Corporation, Distributor.

Your Fund’s Performance at a Glance | 1 |
Advisor's Report | 2 |
About Your Fund’s Expenses | 5 |
Performance Summary | 7 |
Consolidated Financial Statements | 9 |
| • | Vanguard Alternative Strategies Fund returned 2.38% for the 12 months ended October 31, 2022. Its benchmark, the FTSE 3-Month Treasury Bill Index, returned 0.88%. |
| • | The fund seeks to generate returns using a combination of alternative strategies that collectively are expected to have low correlation with traditional capital markets. These strategies are long/short equity, event-driven, fixed income relative value, currencies, equity futures, and commodity-linked investments. |
| • | Five of the six strategies contributed to returns for the 12-month period. Fixed income relative value was the sole detractor, hurt by a focus on longer-duration issues, which suffered during a rising interest rate environment. |
| • | The diversification resulting from the fund’s variety of exposures helped reduce overall volatility compared with the broad U.S. stock market. |
| • | The fund regularly uses derivatives to hedge portfolio risks. Its holdings in forward foreign currencies and futures contributed to total returns. |
| Average Annual Total Returns Periods Ended October 31, 2022 | |||
| One Year | Three Years | Five Years | |
| Stocks | |||
| Russell 1000 Index (Large-caps) | -16.38% | 9.99% | 10.19% |
| Russell 2000 Index (Small-caps) | -18.54 | 7.05 | 5.56 |
| Russell 3000 Index (Broad U.S. market) | -16.52 | 9.79 | 9.87 |
| FTSE All-World ex US Index (International) | -24.20 | -1.16 | -0.18 |
| Bonds | |||
| Bloomberg U.S. Aggregate Float Adjusted Index (Broad taxable market) | -15.69% | -3.73% | -0.50% |
| Bloomberg Municipal Bond Index (Broad tax-exempt market) | -11.98 | -2.18 | 0.37 |
| FTSE Three-Month U.S. Treasury Bill Index | 0.88 | 0.59 | 1.15 |
| CPI | |||
| Consumer Price Index | 7.75% | 5.01% | 3.85% |
| • | Long/short equity. This approach focuses on building a long/short portfolio of equity securities based on their volatility characteristics by executing long positions in low-volatility stocks and short positions in high-volatility stocks. It seeks to capture a risk-adjusted spread by constructing positions to reduce the net market exposure of the overall portfolio to general market movements (beta). |
| • | Event-driven. This strategy seeks to profit from the expectation that a specific event or catalyst (such as a merger/acquisition deal closure) will affect the stock price of a U.S. or foreign company. |
| • | Fixed income relative value. This approach seeks to exploit the steepness of the U.S. Treasury yield curve that is created by investors’ desire to hold shorter-maturity bonds because they tend to be more liquid (easily traded) and less sensitive to growth and inflation risk. We try to capture this premium by investing in Treasury futures with longer times to maturity and borrowing those with short maturities. |
| • | Currencies. The fund seeks to benefit from expected currency movements by using long and short foreign currency exchange forward contracts. It does this by selling currencies of countries with poor fundamental characteristics and buying those of countries with strong ones. |
| • | Commodity-linked investments. This strategy seeks to capture the risk premium associated with inventory levels of commodities, which are reflected in the prices of their futures contracts. We take long positions in commodities whose prices are expected to rise because of limited inventory and short positions in those whose prices are expected to fall. |
| • | Equity futures. The fund uses long and short positions in global equity index futures to capture excess return opportunities. The strategy seeks to benefit from global differences in market and fundamental characteristics by buying equity index futures with strong characteristics and selling those with poor characteristics. |
| • | Based on actual fund return. This section helps you to estimate the actual expenses that you paid over the period. The ”Ending Account Value“ shown is derived from the fund‘s actual return, and the third column shows the dollar amount that would have been paid by an investor who started with $1,000 in the fund. You may use the information here, together with the amount you invested, to estimate the expenses that you paid over the period. |
| • | Based on hypothetical 5% yearly return. This section is intended to help you compare your fund‘s costs with those of other mutual funds. It assumes that the fund had a yearly return of 5% before expenses, but that the expense ratio is unchanged. In this case—because the return used is not the fund’s actual return—the results do not apply to your investment. The example is useful in making comparisons because the Securities and Exchange Commission requires all mutual funds to calculate expenses based on a 5% return. You can assess your fund’s costs by comparing this hypothetical example with the hypothetical examples that appear in shareholder reports of other funds. |
| Six Months Ended October 31, 2022 | |||
| Alternative Strategies Fund | Beginning Account Value 4/30/2022 | Ending Account Value 10/31/2022 | Expenses Paid During Period |
| Based on Actual Fund Return | $1,000.00 | $1,007.70 | $1.32 |
| Based on Hypothetical 5% Yearly Return | 1,000.00 | 1,023.90 | 1.33 |

| Average Annual Total Returns Periods Ended October 31, 2022 | |||||
| One Year | Five Years | Since Inception (8/11/2015) | Final Value of a $50,000 Investment | ||
 | Alternative Strategies Fund | 2.38% | -1.53% | -0.13% | $49,523 |
 | Spliced Alternative Strategies Index | 0.88 | 2.79 | 3.33 | 63,349 |
| FTSE Three-Month Treasury Bill Index | 0.88 | 1.16 | 0.93 | 53,460 | |
| Long Portfolio1 | Short Portfolio2 | |
| Communication Services | 4.8% | 8.0% |
| Consumer Discretionary | 12.2 | 16.0 |
| Consumer Staples | 6.4 | 1.1 |
| Energy | — | 8.3 |
| Financials | 7.0 | — |
| Health Care | 12.3 | 13.7 |
| Industrials | 12.8 | 11.7 |
| Information Technology | 26.0 | 34.8 |
| Materials | 5.1 | 2.8 |
| Real Estate | 7.7 | 1.8 |
| Utilities | 5.7 | 1.8 |
| 1 | Percentage of investments in long portfolio. |
| 2 | Percentage of investments in short portfolio. |
| Shares | Market Value• ($000) | ||
| Common Stocks—Long Positions (32.3%) | |||
| Communication Services (1.5%) | |||
| TEGNA Inc. | 35,000 | 731 | |
| 1 | Electronic Arts Inc. | 906 | 114 |
| 1 | Madison Square Garden Sports Corp. | 668 | 105 |
| Sirius XM Holdings Inc. | 17,354 | 105 | |
| * | Liberty Media Corp.-Liberty Formula One Class C | 1,757 | 101 |
| 1 | Verizon Communications Inc. | 2,446 | 91 |
| 1 | Comcast Corp. Class A | 2,631 | 84 |
| * | Alphabet Inc. Class A | 860 | 81 |
| *,1 | Charter Communications Inc. Class A | 183 | 67 |
| *,1 | Liberty Broadband Corp. Class C | 777 | 66 |
| 1,545 | |||
| Consumer Discretionary (3.9%) | |||
| * | iRobot Corp. | 20,500 | 1,158 |
| * | Tenneco Inc. Class A | 51,000 | 1,005 |
| *,1 | O'Reilly Automotive Inc. | 151 | 126 |
| 1 | Genuine Parts Co. | 689 | 123 |
| 1 | McDonald's Corp. | 452 | 123 |
| *,1 | AutoZone Inc. | 48 | 122 |
| Advance Auto Parts Inc. | 615 | 117 | |
| Darden Restaurants Inc. | 810 | 116 | |
| 1 | Dollar General Corp. | 442 | 113 |
| 1 | Yum! Brands Inc. | 929 | 110 |
| Lowe's Cos. Inc. | 560 | 109 | |
| 1 | Starbucks Corp. | 1,265 | 109 |
| 1 | Wendy's Co. | 5,108 | 106 |
| 1 | Gentex Corp. | 3,825 | 101 |
| 1 | Service Corp. International | 1,656 | 100 |
| 1 | Home Depot Inc. | 326 | 97 |
| Leggett & Platt Inc. | 2,865 | 97 | |
| 1 | Columbia Sportswear Co. | 1,200 | 89 |
| 3,921 | |||
| Consumer Staples (2.1%) | |||
| 1 | Flowers Foods Inc. | 4,154 | 119 |
| 1 | J M Smucker Co. | 776 | 117 |
| 1 | Mondelez International Inc. Class A | 1,883 | 116 |
| Hershey Co. | 483 | 115 | |
| Kellogg Co. | 1,491 | 115 | |
| 1 | PepsiCo Inc. | 633 | 115 |
| Casey's General Stores Inc. | 490 | 114 | |
| General Mills Inc. | 1,391 | 114 | |
| Shares | Market Value• ($000) | ||
| Reynolds Consumer Products Inc. | 3,730 | 114 | |
| Keurig Dr Pepper Inc. | 2,749 | 107 | |
| 1 | Coca-Cola Co. | 1,762 | 105 |
| 1 | Colgate-Palmolive Co. | 1,400 | 103 |
| 1 | Kimberly-Clark Corp. | 823 | 102 |
| 1 | Brown-Forman Corp. Class B | 1,484 | 101 |
| 1 | Altria Group Inc. | 2,162 | 100 |
| 1 | McCormick & Co. Inc. | 1,269 | 100 |
| 1 | Procter & Gamble Co. | 726 | 98 |
| 1 | Philip Morris International Inc. | 982 | 90 |
| 1 | Church & Dwight Co. Inc. | 1,072 | 79 |
| 1 | Archer-Daniels-Midland Co. | 313 | 30 |
| Campbell Soup Co. | 185 | 10 | |
| 2,064 | |||
| Financials (2.3%) | |||
| First Horizon Corp. | 13,918 | 341 | |
| Travelers Cos. Inc. | 635 | 117 | |
| Aflac Inc. | 1,802 | 117 | |
| 1 | W R Berkley Corp. | 1,548 | 115 |
| *,1 | Berkshire Hathaway Inc. Class B | 390 | 115 |
| 1 | Arthur J Gallagher & Co. | 606 | 113 |
| 1 | Hanover Insurance Group Inc. | 764 | 112 |
| 1 | White Mountains Insurance Group Ltd. | 79 | 112 |
| 1 | Marsh & McLennan Cos. Inc. | 672 | 109 |
| Cboe Global Markets Inc. | 870 | 108 | |
| Nasdaq Inc. | 1,739 | 108 | |
| Starwood Property Trust Inc. | 5,092 | 105 | |
| 1 | CNA Financial Corp. | 2,472 | 103 |
| 1 | TFS Financial Corp. | 6,660 | 94 |
| Moody's Corp. | 327 | 87 | |
| Assurant Inc. | 615 | 84 | |
| 1 | Intercontinental Exchange Inc. | 836 | 80 |
| Chubb Ltd. | 349 | 75 | |
| 1 | Annaly Capital Management Inc. | 3,828 | 71 |
| 1 | AGNC Investment Corp. | 7,713 | 63 |
| * | Markel Corp. | 10 | 12 |
| 1 | Allstate Corp. | 83 | 11 |
| Willis Towers Watson plc | 45 | 10 | |
| 2,262 | |||
| Health Care (4.0%) | |||
| * | Meridian Bioscience Inc. | 34,400 | 1,100 |
| Gilead Sciences Inc. | 1,602 | 126 | |
| Cigna Corp. | 382 | 123 | |
| 1 | Merck & Co. Inc. | 1,208 | 122 |
| Shares | Market Value• ($000) | ||
| 1 | Amgen Inc. | 447 | 121 |
| McKesson Corp. | 312 | 121 | |
| 1 | Quest Diagnostics Inc. | 798 | 115 |
| 1 | AmerisourceBergen Corp. Class A | 720 | 113 |
| 1 | UnitedHealth Group Inc. | 200 | 111 |
| 1 | Johnson & Johnson | 623 | 108 |
| 1 | Bristol-Myers Squibb Co. | 1,385 | 107 |
| Stryker Corp. | 467 | 107 | |
| AbbVie Inc. | 712 | 104 | |
| 1 | Becton Dickinson and Co. | 436 | 103 |
| 1 | Medtronic plc | 1,185 | 103 |
| 1 | CVS Health Corp. | 1,076 | 102 |
| Premier Inc. Class A | 2,925 | 102 | |
| 1 | Danaher Corp. | 395 | 99 |
| * | Hologic Inc. | 1,454 | 99 |
| * | Integra LifeSciences Holdings Corp. | 1,969 | 99 |
| Laboratory Corp. of America Holdings | 444 | 99 | |
| *,1 | QIAGEN NV | 2,272 | 99 |
| 1 | Abbott Laboratories | 918 | 91 |
| 1 | Baxter International Inc. | 1,656 | 90 |
| *,1 | Henry Schein Inc. | 1,310 | 90 |
| 1 | STERIS plc | 471 | 81 |
| * | Enovis Corp. | 1,613 | 80 |
| 1 | Zoetis Inc. | 525 | 79 |
| 1 | Thermo Fisher Scientific Inc. | 42 | 22 |
| * | Boston Scientific Corp. | 407 | 18 |
| Elevance Health Inc. | 20 | 11 | |
| 3,945 | |||
| Industrials (4.1%) | |||
| * | Atlas Air Worldwide Holdings Inc. | 10,000 | 1,011 |
| 1 | General Dynamics Corp. | 493 | 123 |
| Eaton Corp. plc | 790 | 119 | |
| 1 | Cummins Inc. | 481 | 118 |
| 1 | Honeywell International Inc. | 578 | 118 |
| MSC Industrial Direct Co. Inc. Class A | 1,416 | 117 | |
| 1 | AMETEK Inc. | 896 | 116 |
| 1 | Illinois Tool Works Inc. | 544 | 116 |
| MSA Safety Inc. | 867 | 116 | |
| 1 | PACCAR Inc. | 1,189 | 115 |
| 1 | Hubbell Inc. Class B | 478 | 114 |
| 1 | Ingersoll Rand Inc. | 2,250 | 114 |
| 1 | IDEX Corp. | 508 | 113 |
| Lincoln Electric Holdings Inc. | 797 | 113 | |
| Nordson Corp. | 502 | 113 | |
| 1 | Lockheed Martin Corp. | 224 | 109 |
| 1 | Expeditors International of Washington Inc. | 1,104 | 108 |
| Otis Worldwide Corp. | 1,505 | 106 | |
| 1 | Waste Management Inc. | 664 | 105 |
| MDU Resources Group Inc. | 3,641 | 104 | |
| 1 | AMERCO | 179 | 103 |
| 3M Co. | 822 | 103 | |
| 1 | Republic Services Inc. Class A | 772 | 102 |
| 1 | Fastenal Co. | 2,040 | 99 |
| 1 | Norfolk Southern Corp. | 425 | 97 |
| 1 | Verisk Analytics Inc. Class A | 523 | 96 |
| * | FTI Consulting Inc. | 588 | 91 |
| Union Pacific Corp. | 419 | 83 | |
| Pentair plc | 1,879 | 81 | |
| Johnson Controls International plc | 898 | 52 | |
| Shares | Market Value• ($000) | ||
| Donaldson Co. Inc. | 696 | 40 | |
| 1 | Allegion plc | 178 | 19 |
| 4,134 | |||
| Information Technology (8.4%) | |||
| Computer Services Inc. | 16,500 | 953 | |
| * | Sierra Wireless Inc. | 27,500 | 816 |
| * | ChannelAdvisor Corp. | 29,700 | 684 |
| * | Evo Payments Inc. Class A | 18,902 | 637 |
| * | CyberOptics Corp. | 9,500 | 513 |
| * | Zendesk Inc. | 5,000 | 383 |
| * | MoneyGram International Inc. | 30,000 | 318 |
| * | BTRS Holdings Inc. Class 1 | 31,947 | 302 |
| Switch Inc. Class A | 8,000 | 272 | |
| * | ForgeRock Inc. Class A | 10,000 | 226 |
| 1 | International Business Machines Corp. | 856 | 118 |
| *,1 | VeriSign Inc. | 585 | 117 |
| Genpact Ltd. | 2,404 | 117 | |
| 1 | Amphenol Corp. Class A | 1,531 | 116 |
| 1 | Automatic Data Processing Inc. | 471 | 114 |
| 1 | Motorola Solutions Inc. | 449 | 112 |
| 1 | Amdocs Ltd. | 1,292 | 112 |
| *,1 | Keysight Technologies Inc. | 639 | 111 |
| Cisco Systems Inc. | 2,429 | 110 | |
| 1 | Jack Henry & Associates Inc. | 545 | 109 |
| *,1 | Fiserv Inc. | 1,053 | 108 |
| * | Teledyne Technologies Inc. | 270 | 108 |
| 1 | Visa Inc. Class A | 518 | 107 |
| 1 | CDW Corp. | 613 | 106 |
| 1 | Apple Inc. | 683 | 105 |
| 1 | Broadridge Financial Solutions Inc. | 698 | 105 |
| NetApp Inc. | 1,521 | 105 | |
| 1 | Roper Technologies Inc. | 252 | 105 |
| 1 | Texas Instruments Inc. | 656 | 105 |
| 1 | Juniper Networks Inc. | 3,344 | 102 |
| Cognizant Technology Solutions Corp. Class A | 1,619 | 101 | |
| National Instruments Corp. | 2,647 | 101 | |
| 1 | Accenture plc Class A | 357 | 101 |
| 1 | Paychex Inc. | 843 | 100 |
| 1 | Analog Devices Inc. | 689 | 98 |
| 1 | Microsoft Corp. | 414 | 96 |
| 1 | Dolby Laboratories Inc. Class A | 1,398 | 93 |
| 1 | Broadcom Inc. | 195 | 92 |
| *,1 | Akamai Technologies Inc. | 1,004 | 89 |
| 1 | SS&C Technologies Holdings Inc. | 1,710 | 88 |
| 1 | Western Union Co. | 6,459 | 87 |
| Skyworks Solutions Inc. | 132 | 11 | |
| 8,353 | |||
| Materials (1.6%) | |||
| 1 | RPM International Inc. | 1,252 | 118 |
| Silgan Holdings Inc. | 2,498 | 118 | |
| 1 | Sonoco Products Co. | 1,862 | 116 |
| Amcor plc | 9,649 | 112 | |
| Linde plc | 370 | 110 | |
| 1 | Ecolab Inc. | 692 | 109 |
| 1 | Air Products and Chemicals Inc. | 431 | 108 |
| Ashland Inc. | 1,022 | 107 | |
| 1 | Avery Dennison Corp. | 611 | 104 |
| AptarGroup Inc. | 1,022 | 101 | |
| 1 | Sherwin-Williams Co. | 432 | 97 |
| Shares | Market Value• ($000) | ||
| PPG Industries Inc. | 817 | 93 | |
| 1 | Packaging Corp. of America | 755 | 91 |
| International Flavors & Fragrances Inc. | 893 | 87 | |
| International Paper Co. | 2,536 | 85 | |
| Sealed Air Corp. | 1,760 | 84 | |
| 1,640 | |||
| Real Estate (2.5%) | |||
| STORE Capital Corp. | 18,000 | 572 | |
| Gaming and Leisure Properties Inc. | 2,233 | 112 | |
| WP Carey Inc. REIT | 1,436 | 110 | |
| National Retail Properties Inc. | 2,474 | 104 | |
| 1 | Prologis Inc. | 934 | 103 |
| 1 | AvalonBay Communities Inc. | 526 | 92 |
| 1 | CubeSmart | 2,172 | 91 |
| 1 | Invitation Homes Inc. | 2,826 | 90 |
| 1 | Public Storage | 291 | 90 |
| 1 | Life Storage Inc. | 807 | 89 |
| Spirit Realty Capital Inc. | 2,297 | 89 | |
| 1 | Mid-America Apartment Communities Inc. | 558 | 88 |
| Realty Income Corp. | 1,420 | 88 | |
| 1 | American Homes 4 Rent Class A | 2,726 | 87 |
| Healthpeak Properties Inc. | 3,686 | 87 | |
| First Industrial Realty Trust Inc. | 1,808 | 86 | |
| 1 | Extra Space Storage Inc. | 472 | 84 |
| 1 | Equity Residential | 1,317 | 83 |
| 1 | Sun Communities Inc. | 616 | 83 |
| 1 | Camden Property Trust | 697 | 81 |
| 1 | UDR Inc. | 1,979 | 79 |
| 1 | Equinix Inc. | 75 | 43 |
| Healthcare Realty Trust Inc. Class A | 1,511 | 31 | |
| Essex Property Trust Inc. | 60 | 13 | |
| Apartment Income REIT Corp. | 301 | 12 | |
| 2,487 | |||
| Utilities (1.9%) | |||
| 1 | Consolidated Edison Inc. | 1,220 | 107 |
| 1 | OGE Energy Corp. | 2,886 | 106 |
| PPL Corp. | 3,994 | 106 | |
| 1 | IDACORP Inc. | 1,006 | 105 |
| 1 | NextEra Energy Inc. | 1,326 | 103 |
| 1 | Atmos Energy Corp. | 954 | 102 |
| 1 | Ameren Corp. | 1,237 | 101 |
| 1 | American Electric Power Co. Inc. | 1,118 | 98 |
| 1 | DTE Energy Co. | 876 | 98 |
| Xcel Energy Inc. | 1,503 | 98 | |
| 1 | Southern Co. | 1,486 | 97 |
| 1 | Alliant Energy Corp. | 1,811 | 95 |
| 1 | CMS Energy Corp. | 1,671 | 95 |
| 1 | Dominion Energy Inc. | 1,352 | 95 |
| 1 | Duke Energy Corp. | 1,020 | 95 |
| 1 | Avangrid Inc. | 2,317 | 94 |
| 1 | Exelon Corp. | 2,367 | 91 |
| Public Service Enterprise Group Inc. | 1,631 | 91 | |
| Hawaiian Electric Industries Inc. | 1,853 | 71 | |
| 1,848 | |||
| Total Common Stocks—Long Positions (Cost $28,521) | 32,199 | ||
| Shares | Market Value• ($000) | ||
| Temporary Cash Investments (39.3%) | |||
| Money Market Fund (39.3%) | |||
| 2 | Vanguard Market Liquidity Fund, 3.117% (Cost $39,087) | 390,991 | 39,091 |
| Common Stocks Sold Short (-8.8%) | |||
| Communication Services (-0.7%) | |||
| * | Roblox Corp. Class A | (2,615) | (117) |
| * | Netflix Inc. | (388) | (113) |
| * | Pinterest Inc. Class A | (4,575) | (113) |
| * | ZoomInfo Technologies Inc. Class A | (2,529) | (113) |
| * | DISH Network Corp. Class A | (5,933) | (88) |
| * | Roku Inc. | (1,504) | (83) |
| * | Playtika Holding Corp. | (8,035) | (76) |
| (703) | |||
| Consumer Discretionary (-1.4%) | |||
| Macy's Inc. | (5,807) | (121) | |
| * | Carnival Corp. | (12,298) | (111) |
| * | Victoria's Secret & Co. | (2,953) | (111) |
| * | Capri Holdings Ltd. | (2,403) | (110) |
| * | Penn National Gaming Inc. | (3,229) | (107) |
| * | DraftKings Inc. Class A | (6,530) | (103) |
| * | Etsy Inc. | (1,048) | (98) |
| * | Peloton Interactive Inc. Class A | (11,588) | (97) |
| * | Under Armour Inc. Class A | (12,771) | (95) |
| * | Norwegian Cruise Line Holdings Ltd. | (5,354) | (91) |
| * | Kohl's Corp. | (2,981) | (89) |
| * | Nordstrom Inc. | (3,931) | (80) |
| * | Wayfair Inc. Class A | (1,843) | (70) |
| * | DoorDash Inc. Class A | (1,503) | (66) |
| * | Royal Caribbean Cruises Ltd. | (1,007) | (54) |
| (1,403) | |||
| Consumer Staples (-0.1%) | |||
| * | Freshpet Inc. | (1,685) | (99) |
| Energy (-0.7%) | |||
| New Fortress Energy Inc. Class A | (2,084) | (115) | |
| APA Corp. | (2,463) | (112) | |
| * | Antero Resources Corp. | (2,916) | (107) |
| EQT Corp. | (2,529) | (106) | |
| Range Resources Corp. | (3,388) | (96) | |
| * | Southwestern Energy Co. | (13,656) | (95) |
| Ovintiv Inc. (XNYS) | (1,837) | (93) | |
| (724) | |||
| Health Care (-1.2%) | |||
| * | Moderna Inc. | (773) | (116) |
| * | Sarepta Therapeutics Inc. | (964) | (110) |
| * | Natera Inc. | (2,325) | (109) |
| * | QuidelOrtho Corp. | (1,152) | (103) |
| * | Mirati Therapeutics Inc. | (1,464) | (99) |
| * | Guardant Health Inc. | (1,980) | (98) |
| * | Teladoc Health Inc. | (3,203) | (95) |
| * | Novocure Ltd. | (1,310) | (93) |
| * | agilon health Inc. | (4,442) | (88) |
| * | Oak Street Health Inc. | (3,863) | (78) |
| * | Definitive Healthcare Corp. Class A | (4,170) | (66) |
| * | Maravai LifeSciences Holdings Inc. Class A | (3,744) | (62) |
| * | 10X Genomics Inc. Class A | (2,190) | (60) |
| Shares | Market Value• ($000) | ||
| * | Novavax Inc. | (917) | (20) |
| (1,197) | |||
| Industrials (-1.0%) | |||
| * | Avis Budget Group Inc. | (490) | (116) |
| Ingersoll Rand Inc. | (2,250) | (114) | |
| Vertiv Holdings Co. Class A | (7,986) | (114) | |
| * | AZEK Co. Inc. Class A | (5,894) | (103) |
| * | Hertz Global Holdings Inc. | (5,541) | (102) |
| * | Lyft Inc. Class A | (6,849) | (100) |
| * | Uber Technologies Inc. | (3,404) | (91) |
| Spirit AeroSystems Holdings Inc. Class A | (3,631) | (84) | |
| * | Sunrun Inc. | (3,639) | (82) |
| * | Plug Power Inc. | (4,311) | (69) |
| * | Generac Holdings Inc. | (466) | (54) |
| (1,029) | |||
| Information Technology (-3.1%) | |||
| * | Toast Inc. Class A | (5,403) | (119) |
| * | Enphase Energy Inc. | (383) | (118) |
| * | Wix.com Ltd. | (1,363) | (115) |
| * | New Relic Inc. | (1,840) | (109) |
| * | Smartsheet Inc. Class A | (3,102) | (108) |
| * | Kyndryl Holdings Inc. | (10,877) | (105) |
| * | Crowdstrike Holdings Inc. Class A | (634) | (102) |
| * | Shift4 Payments Inc. Class A | (2,213) | (102) |
| * | Jamf Holding Corp. | (4,295) | (102) |
| * | Zscaler Inc. | (649) | (100) |
| * | Confluent Inc. Class A | (3,720) | (100) |
| * | Cloudflare Inc. Class A | (1,758) | (99) |
| * | Snowflake Inc. Class A | (607) | (97) |
| * | Informatica Inc. Class A | (4,973) | (96) |
| * | ON Semiconductor Corp. | (1,539) | (95) |
| * | EPAM Systems Inc. | (272) | (95) |
| * | Bill.com Holdings Inc. | (710) | (95) |
| * | Palantir Technologies Inc. Class A | (10,804) | (95) |
| * | ViaSat Inc. | (2,296) | (94) |
| * | Trade Desk Inc. Class A | (1,716) | (91) |
| * | Elastic NV | (1,409) | (90) |
| * | SentinelOne Inc. Class A | (3,899) | (89) |
| * | nCino Inc. | (2,790) | (88) |
| * | Coupa Software Inc. | (1,616) | (86) |
| * | DocuSign Inc. Class A | (1,718) | (83) |
| Shares | Market Value• ($000) | ||
| * | Datadog Inc. Class A | (1,032) | (83) |
| * | Block Inc. (XNYS) | (1,363) | (82) |
| * | Wolfspeed Inc. | (999) | (79) |
| * | NCR Corp. | (3,419) | (73) |
| * | RingCentral Inc. Class A | (2,036) | (72) |
| * | UiPath Inc. Class A | (5,406) | (68) |
| * | Okta Inc. | (1,087) | (61) |
| * | MongoDB Inc. Class A | (333) | (61) |
| (3,052) | |||
| Materials (-0.2%) | |||
| US Steel Corp. | (5,010) | (102) | |
| * | Cleveland-Cliffs Inc. | (6,397) | (83) |
| Alcoa Corp. | (1,543) | (60) | |
| (245) | |||
| Real Estate (-0.2%) | |||
| * | Zillow Group Inc. Class A | (2,156) | (67) |
| * | Opendoor Technologies Inc. | (23,622) | (61) |
| * | Zillow Group Inc. Class C | (940) | (29) |
| (157) | |||
| Utilities (-0.2%) | |||
| Constellation Energy Corp. | (1,281) | (121) | |
| NRG Energy Inc. | (906) | (40) | |
| (161) | |||
| Total Common Stocks Sold Short (Proceeds $11,093) | (8,770) | ||
| Other Assets and Other Liabilities—Net (37.2%) | 37,039 | ||
| Net Assets (100%) | 99,559 | ||
| Cost is in $000. | |||
| • | See Note A in Notes to Consolidated Financial Statements. |
| * | Non-income-producing security. |
| 1 | Long security positions with a value of $13,414,000 are held in a segregated account at the fund's custodian bank and pledged to a broker-dealer as collateral for the fund's obligation to return borrowed securities. For so long as such obligations continue, the fund’s access to these assets is subject to authorization from the broker-dealer. |
| 2 | Affiliated money market fund available only to Vanguard funds and certain trusts and accounts managed by Vanguard. Rate shown is the 7-day yield. |
| REIT—Real Estate Investment Trust. |
| Futures Contracts | ||||
| ($000) | ||||
| Expiration | Number of Long (Short) Contracts | Notional Amount | Value and Unrealized Appreciation (Depreciation) | |
| Long Futures Contracts | ||||
| 2-Year U.S. Treasury Note | December 2022 | 237 | 48,439 | (1,070) |
| 5-Year U.S. Treasury Note | December 2022 | 107 | 11,406 | (518) |
| 10-Year U.S. Treasury Note | December 2022 | 66 | 7,299 | (470) |
| AEX Index | November 2022 | 31 | 4,098 | 169 |
| Coffee1 | December 2022 | 18 | 1,199 | (212) |
| Cotton No. 21 | December 2022 | 7 | 252 | (67) |
| FTSE MIB Index | December 2022 | 38 | 4,233 | 338 |
| FTSE Taiwan Index | November 2022 | 89 | 4,074 | 30 |
| IBEX 35 Index | November 2022 | 54 | 4,243 | 219 |
| Lean Hogs1 | December 2022 | 17 | 577 | 6 |
| LME Aluminum1 | November 2022 | 17 | 944 | (44) |
| LME Lead1 | November 2022 | 13 | 642 | (29) |
| LME Nickel1 | November 2022 | 12 | 1,564 | (28) |
| LME Tin1 | November 2022 | 6 | 530 | (75) |
| Low Sulphur Gasoil1 | December 2022 | 13 | 1,326 | (25) |
| NY Harbor ULSD1 | November 2022 | 9 | 1,389 | 2 |
| S&P ASX 200 Index | December 2022 | 38 | 4,166 | (84) |
| S&P TSX 60 Index | December 2022 | 24 | 4,149 | (61) |
| Soybean1 | January 2023 | 12 | 852 | 9 |
| Soybean Meal1 | December 2022 | 33 | 1,413 | 16 |
| Soybean Oil1 | December 2022 | 34 | 1,493 | 176 |
| Sugar #111 | February 2023 | 64 | 1,288 | 5 |
| (1,713) | ||||
| Futures Contracts (continued) | ||||
| ($000) | ||||
| Expiration | Number of Long (Short) Contracts | Notional Amount | Value and Unrealized Appreciation (Depreciation) | |
| Short Futures Contracts | ||||
| CAC40 Index | November 2022 | (67) | (4,151) | (139) |
| Cattle Feeder1 | January 2023 | (9) | (808) | (16) |
| Cocoa1 | December 2022 | (11) | (257) | 9 |
| Copper1 | December 2022 | (16) | (1,350) | 75 |
| DAX Index | December 2022 | (13) | (4,268) | 50 |
| E-Mini S&P 500 Index | December 2022 | (21) | (4,077) | 190 |
| FTSE 100 Index | December 2022 | (51) | (4,157) | 217 |
| KC HRW Wheat1 | December 2022 | (17) | (832) | (71) |
| KOSPI 200 Index | December 2022 | (79) | (4,169) | (168) |
| Live Cattle1 | December 2022 | (14) | (854) | (12) |
| LME Aluminum1 | November 2022 | (17) | (944) | 31 |
| LME Aluminum1 | December 2022 | (23) | (1,280) | 61 |
| LME Lead1 | November 2022 | (13) | (642) | (11) |
| LME Lead1 | December 2022 | (10) | (494) | 20 |
| LME Nickel1 | November 2022 | (12) | (1,564) | 126 |
| LME Nickel1 | December 2022 | (10) | (1,305) | 18 |
| LME Tin1 | November 2022 | (6) | (530) | 92 |
| LME Tin1 | December 2022 | (5) | (442) | 62 |
| MSCI Singapore Index | November 2022 | (216) | (4,242) | (204) |
| Natural Gas1 | November 2022 | (8) | (508) | 43 |
| Wheat1 | December 2022 | (31) | (1,367) | (87) |
| 286 | ||||
| (1,427) | ||||
| 1 | Security is owned by the Vanguard ASF Portfolio, which is a wholly owned subsidiary of the Alternative Strategies Fund. |
| Forward Currency Contracts | |||||||
| Contract Settlement Date | Contract Amount (000) | Unrealized Appreciation ($000) | Unrealized Depreciation ($000) | ||||
| Counterparty | Receive | Deliver | |||||
| Morgan Stanley Capital Services Inc. | 11/10/22 | AUD | 9,023 | USD | 5,846 | — | (73) |
| Morgan Stanley Capital Services Inc. | 11/10/22 | BRL | 12,551 | USD | 2,382 | 42 | — |
| Royal Bank of Canada | 11/10/22 | CAD | 7,971 | USD | 5,821 | 30 | — |
| Morgan Stanley Capital Services Inc. | 11/10/22 | CLP | 2,222,876 | USD | 2,309 | 44 | — |
| Standard Chartered Bank | 11/10/22 | HUF | 1,002,134 | USD | 2,283 | 128 | — |
| Morgan Stanley Capital Services Inc. | 11/10/22 | MXN | 46,659 | USD | 2,311 | 40 | — |
| Bank of America, N.A. | 11/10/22 | NOK | 63,217 | USD | 5,856 | 226 | — |
| Morgan Stanley Capital Services Inc. | 11/10/22 | PLN | 11,461 | USD | 2,308 | 90 | — |
| Morgan Stanley Capital Services Inc. | 11/10/22 | USD | 5,781 | CHF | 5,710 | 73 | — |
| Standard Chartered Bank | 11/10/22 | USD | 5,798 | EUR | 5,922 | — | (58) |
| Forward Currency Contracts (continued) | |||||||
| Contract Settlement Date | Contract Amount (000) | Unrealized Appreciation ($000) | Unrealized Depreciation ($000) | ||||
| Counterparty | Receive | Deliver | |||||
| Bank of America, N.A. | 11/10/22 | USD | 2,312 | ILS | 8,254 | — | (25) |
| Morgan Stanley Capital Services Inc. | 11/10/22 | USD | 5,813 | JPY | 839,698 | 159 | — |
| BNP Paribas | 11/10/22 | USD | 2,306 | KRW | 3,319,922 | — | (24) |
| Royal Bank of Canada | 11/10/22 | USD | 2,322 | SGD | 3,330 | — | (30) |
| Bank of America, N.A. | 11/10/22 | USD | 2,306 | THB | 87,529 | 5 | — |
| Royal Bank of Canada | 11/10/22 | USD | 2,310 | TWD | 73,673 | 22 | — |
| 859 | (210) | ||||||
| AUD—Australian dollar. |
| BRL—Brazilian real. |
| CAD—Canadian dollar. |
| CHF—Swiss franc. |
| CLP—Chilean peso. |
| EUR—euro. |
| HUF—Hungarian forint. |
| ILS—Israeli shekel. |
| JPY—Japanese yen. |
| KRW—Korean won. |
| MXN—Mexican peso. |
| NOK—Norwegian krone. |
| PLN—Polish zloty. |
| SGD—Singapore dollar. |
| THB—Thai baht. |
| TWD—Taiwanese dollar. |
| USD—U.S. dollar. |
| ($000s, except shares and per-share amounts) | Amount |
| Assets | |
| Investments in Securities, at Value | |
| Unaffiliated Issuers (Cost $28,521) | 32,199 |
| Affiliated Issuers (Cost $39,087) | 39,091 |
| Total Investments in Securities | 71,290 |
| Investment in Vanguard | 6 |
| Cash | 16,307 |
| Cash Segregated for Short Positions | 14,540 |
| Cash Collateral Pledged—Futures Contracts | 5,154 |
| Cash Collateral Pledged—Forward Currency Contracts | 110 |
| Receivables for Accrued Income | 133 |
| Receivables for Capital Shares Issued | 3 |
| Unrealized Appreciation—Forward Currency Contracts | 859 |
| Receivables from Broker-Dealer | 393 |
| Other Assets | 2,493 |
| Total Assets | 111,288 |
| Liabilities | |
| Securities Sold Short, at Value (Proceeds $11,093) | 8,770 |
| Payables for Investment Securities Purchased | 103 |
| Payables for Capital Shares Redeemed | 121 |
| Payables to Vanguard | 52 |
| Variation Margin Payable—Futures Contracts | 2,472 |
| Unrealized Depreciation—Forward Currency Contracts | 210 |
| Accrued Dividend Expense on Securities Sold Short | 1 |
| Total Liabilities | 11,729 |
| Net Assets | 99,559 |
| At October 31, 2022, net assets consisted of: | |
| Paid-in Capital | 133,627 |
| Total Distributable Earnings (Loss) | (34,068) |
| Net Assets | 99,559 |
| Net Assets | |
| Applicable to 5,816,801 outstanding $.001 par value shares of beneficial interest (unlimited authorization) | 99,559 |
| Net Asset Value Per Share | $17.12 |
| Year Ended October 31, 2022 | |
| ($000) | |
| Investment Income | |
| Income | |
| Dividends1 | 500 |
| Interest2 | 471 |
| Total Income | 971 |
| Expenses | |
| The Vanguard Group—Note B | |
| Investment Advisory Services | 28 |
| Management and Administrative | 242 |
| Marketing and Distribution | 11 |
| Custodian Fees | 27 |
| Auditing Fees | 56 |
| Shareholders’ Reports | 25 |
| Trustees’ Fees and Expenses—Note B | 15 |
| Dividend Expense on Securities Sold Short | 55 |
| Borrowing Expense on Securities Sold Short | 111 |
| Other Expenses | 24 |
| Total Expenses | 594 |
| Expenses Paid Indirectly | (1) |
| Net Expenses | 593 |
| Net Investment Income | 378 |
| Payment from Affiliate - Note B | 637 |
| Realized Net Gain (Loss) | |
| Investment Securities Sold—Long Positions2 | 3,831 |
| Investment Securities Sold—Short Positions | 1,286 |
| Futures Contracts | (2,408) |
| Forward Currency Contracts | (61) |
| Foreign Currencies | 18 |
| Realized Net Gain (Loss) | 2,666 |
| Change in Unrealized Appreciation (Depreciation) | |
| Investment Securities—Long Positions2 | (5,100) |
| Investment Securities—Short Positions | 4,442 |
| Futures Contracts | (929) |
| Forward Currency Contracts | 903 |
| Foreign Currencies | (464) |
| Change in Unrealized Appreciation (Depreciation) | (1,148) |
| Net Increase (Decrease) in Net Assets Resulting from Operations | 2,533 |
| 1 | Dividends are net of foreign withholding taxes of $5,000. |
| 2 | Interest income, realized net gain (loss), capital gain distributions received, and change in unrealized appreciation (depreciation) from an affiliated company of the fund were $457,000, ($1,000), $2,000, and ($2,000), respectively. Purchases and sales are for temporary cash investment purposes. |
| Year Ended October 31, | ||
| 2022 ($000) | 2021 ($000) | |
| Increase (Decrease) in Net Assets | ||
| Operations | ||
| Net Investment Income | 378 | (439) |
| Payment from Affiliate - Note B | 637 | — |
| Realized Net Gain (Loss) | 2,666 | 7,084 |
| Change in Unrealized Appreciation (Depreciation) | (1,148) | (8,835) |
| Net Increase (Decrease) in Net Assets Resulting from Operations | 2,533 | (2,190) |
| Distributions | ||
| Total Distributions | (2,262) | (2,074) |
| Capital Share Transactions | ||
| Issued | 21,574 | 31,827 |
| Issued in Lieu of Cash Distributions | 2,197 | 2,047 |
| Redeemed | (61,620) | (198,840) |
| Net Increase (Decrease) from Capital Share Transactions | (37,849) | (164,966) |
| Total Increase (Decrease) | (37,578) | (169,230) |
| Net Assets | ||
| Beginning of Period | 137,137 | 306,367 |
| End of Period | 99,559 | 137,137 |
| For a Share Outstanding Throughout Each Period | Year Ended October 31, | ||||
| 2022 | 2021 | 2020 | 2019 | 2018 | |
| Net Asset Value, Beginning of Period | $17.00 | $17.15 | $22.23 | $20.41 | $20.46 |
| Investment Operations | |||||
| Net Investment Income (Loss)1 | .055 | (.042) | .023 | .252 | .197 |
| Payment from Affiliate | .092 | — | — | — | — |
| Net Realized and Unrealized Gain (Loss) on Investments | .251 | .020 | (3.835) | 1.828 | (.143) |
| Total from Investment Operations | .398 | (.022) | (3.812) | 2.080 | .054 |
| Distributions | |||||
| Dividends from Net Investment Income | (.278) | (.128) | (.385) | (.260) | (.104) |
| Distributions from Realized Capital Gains | — | — | (.883) | — | — |
| Total Distributions | (.278) | (.128) | (1.268) | (.260) | (.104) |
| Net Asset Value, End of Period | $17.12 | $17.00 | $17.15 | $22.23 | $20.41 |
| Total Return2 | 2.38%3 | -0.12% | -18.17% | 10.30% | 0.27% |
| Ratios/Supplemental Data | |||||
| Net Assets, End of Period (Millions) | $100 | $137 | $306 | $297 | $320 |
| Ratio of Total Expenses to Average Net Assets | |||||
| Based on Total Expenses4,5 | 0.51%6 | 1.28% | 0.78% | 0.79%6 | 0.66%6 |
| Net of Dividend and Borrowing Expense on Securities Sold Short | 0.37%6 | 0.35% | 0.34% | 0.38%6 | 0.33%6 |
| Ratio of Net Investment Income (Loss) to Average Net Assets | 0.32% | (0.25)% | 0.12% | 1.18% | 0.93% |
| Portfolio Turnover Rate | 112% | 166% | 173% | 157% | 131% |
| 1 | Calculated based on average shares outstanding. |
| 2 | Total returns do not include account service fees that may have applied in the periods shown. Fund prospectuses provide information about any applicable account service fees. |
| 3 | Payment received from an affiliate increased the fund's total return by 0.68%. See Note B in the Notes to Financial Statements. |
| 4 | Includes dividend expense on securities sold short of 0.05%, 0.37%, 0.44%, 0.41% and 0.33%, respectively. |
| 5 | Includes borrowing expense on securities sold short of 0.09%, 0.56%, 0.00%, 0.00%, and 0.00%, respectively. |
| 6 | The ratio of total expenses to average net assets for the periods ended 2022, 2019, and 2018, net of reduction from custody fee offset arrangement for total expenses and net of dividend and borrowing expense on securities sold short, was 0.51% and 0.37%, 0.74% and 0.33%, and 0.65% and 0.32%, respectively. |
| A. | The following significant accounting policies conform to generally accepted accounting principles for U.S. investment companies. The fund consistently follows such policies in preparing its financial statements. |
| Assets Reflected in Consolidated Statement of Assets and Liabilities1 ($000) | Liabilities Reflected in Consolidated Statement of Assets and Liabilities1 ($000) | Net Amount Receivable (Payable) ($000) | Amounts Not Offset in the Consolidated Statement of Assets and Liabilities | Net Exposure3 (Not Less Than $0) ($000) | ||
| Collateral Pledged2 ($000) | Collateral Received2 ($000) | |||||
| Derivatives Subject to Offsetting Arrangements, by Counterparty | ||||||
| Bank of America, N.A. | 231 | (25) | 206 | — | — | 206 |
| BNP Paribas | — | (24) | (24) | — | — | — |
| Morgan Stanley Capital Services Inc. | 448 | (73) | 375 | 110 | — | 375 |
| Royal Bank of Canada | 52 | (30) | 22 | — | — | 22 |
| Standard Chartered Bank | 128 | (58) | 70 | — | — | 70 |
| Exchange-Traded Futures Contracts | — | (2,472) | (2,472) | 5,154 | — | — |
| Total | 859 | (2,682) | (1,823) | 5,264 | — | 673 |
| B. | In accordance with the terms of a Funds' Service Agreement (the “FSA”) between Vanguard and the fund, Vanguard furnishes to the fund investment advisory, corporate management, administrative, marketing, and distribution services at Vanguard’s cost of operations (as defined by the FSA). These costs of operations are allocated to the fund based on methods and guidelines approved by the board of trustees and are generally settled twice a month. |
| C. | The fund’s custodian bank has agreed to reduce its fees when the fund maintains cash on deposit in the non-interest-bearing custody account. For the year ended October 31, 2022, custodian fee offset arrangements reduced the fund’s expenses by $1,000 (an annual rate of less than 0.01% of average net assets). |
| D. | Various inputs may be used to determine the value of the fund’s investments and derivatives. These inputs are summarized in three broad levels for financial statement purposes. The inputs or methodologies used to value securities are not necessarily an indication of the risk associated with investing in those securities. |
| Level 1 ($000) | Level 2 ($000) | Level 3 ($000) | Total ($000) | |
| Investments | ||||
| Assets | ||||
| Common Stocks | 32,199 | — | — | 32,199 |
| Temporary Cash Investments | 39,091 | — | — | 39,091 |
| Total | 71,290 | — | — | 71,290 |
| Liabilities | ||||
| Common Stocks | 8,770 | — | — | 8,770 |
| Derivative Financial Instruments | ||||
| Assets | ||||
| Futures Contracts1 | 1,964 | — | — | 1,964 |
| Forward Currency Contracts | — | 859 | — | 859 |
| Total | 1,964 | 859 | — | 2,823 |
| Liabilities | ||||
| Futures Contracts1 | 3,391 | — | — | 3,391 |
| Forward Currency Contracts | — | 210 | — | 210 |
| Total | 3,391 | 210 | — | 3,601 |
| 1 | Includes cumulative appreciation (depreciation) on futures contracts and centrally cleared swaps, if any, as reported in the Consolidated Schedule of Investments. Only current day’s variation margin is reported within the Consolidated Statement of Assets and Liabilities. |
| E. | At October 31, 2022, the fair values of derivatives were reflected in the Consolidated Schedule of Investments and Consolidated Statement of Assets and Liabilities as follows: |
| Consolidated Statement of Assets and Liabilities Caption | Equity Contracts ($000) | Commodity Contracts ($000) | Interest Rate Contracts ($000) | Foreign Exchange Contracts ($000) | Total ($000) |
| Unrealized Appreciation—Futures Contracts1 | 1,213 | 751 | — | — | 1,964 |
| Unrealized Appreciation—Forward Currency Contracts | — | — | — | 859 | 859 |
| Total Assets | 1,213 | 751 | — | 859 | 2,823 |
| Unrealized Depreciation—Futures Contracts1 | 656 | 677 | 2,058 | — | 3,391 |
| Unrealized Depreciation—Forward Currency Contracts | — | — | — | 210 | 210 |
| Total Liabilities | 656 | 677 | 2,058 | 210 | 3,601 |
| 1 | Includes cumulative appreciation (depreciation) on futures contracts and centrally cleared swaps, if any, as reported in the Consolidated Schedule of Investments. Only current day’s variation margin is reported within the Consolidated Statement of Assets and Liabilities. |
| Realized Net Gain (Loss) on Derivatives | Equity Contracts ($000) | Commodity Contracts ($000) | Interest Rate Contracts ($000) | Foreign Exchange Contracts ($000) | Total ($000) |
| Futures Contracts | 4,197 | 1,729 | (8,334) | — | (2,408) |
| Forward Currency Contracts | — | — | — | (61) | (61) |
| Realized Net Gain (Loss) on Derivatives | 4,197 | 1,729 | (8,334) | (61) | (2,469) |
| Change in Unrealized Appreciation (Depreciation) on Derivatives | |||||
| Futures Contracts | (210) | 106 | (825) | — | (929) |
| Forward Currency Contracts | — | — | — | 903 | 903 |
| Change in Unrealized Appreciation (Depreciation) on Derivatives | (210) | 106 | (825) | 903 | (26) |
| F. | Permanent differences between book-basis and tax-basis components of net assets are reclassified among capital accounts in the financial statements to reflect their tax character. These reclassifications have no effect on net assets or net asset value per share. As of period end, permanent differences primarily attributable to the accounting for applicable foreign currency transactions, passive foreign investment companies, and operations of the subsidiary were reclassified between the following accounts: |
| Amount ($000) | |
| Paid-in Capital | 23 |
| Total Distributable Earnings (Loss) | (23) |
| Amount ($000) | |
| Undistributed Ordinary Income | 2,674 |
| Undistributed Long-Term Gains | — |
| Capital Loss Carryforwards | (42,375) |
| Qualified Late-Year Losses | — |
| Net Unrealized Gains (Losses) | 5,633 |
| Year Ended October 31, | ||
| 2022 Amount ($000) | 2021 Amount ($000) | |
| Ordinary Income* | 2,262 | 2,074 |
| Long-Term Capital Gains | — | — |
| Total | 2,262 | 2,074 |
| * | Includes short-term capital gains, if any. |
| Amount ($000) | |
| Tax Cost | 67,773 |
| Gross Unrealized Appreciation | 15,211 |
| Gross Unrealized Depreciation | (9,051) |
| Net Unrealized Appreciation (Depreciation) | 6,160 |
| G. | During the year ended October 31, 2022, the fund purchased $44,128,000 of investment securities and sold $72,004,000 of investment securities, other than temporary cash investments. The proceeds of short sales and the cost of purchases to cover short sales were $13,338,000 and $12,352,000, respectively. |
| H. | Capital shares issued and redeemed were: |
| Year Ended October 31, | ||
| 2022 Shares (000) | 2021 Shares (000) | |
| Issued | 1,266 | 1,865 |
| Issued in Lieu of Cash Distributions | 132 | 122 |
| Redeemed | (3,647) | (11,786) |
| Net Increase (Decrease) in Shares Outstanding | (2,249) | (9,799) |
| I. | Management has determined that no material events or transactions occurred subsequent to October 31, 2022, that would require recognition or disclosure in these financial statements. |
Philadelphia, Pennsylvania
December 16, 2022
| Matthew Benchener | Thomas M. Rampulla |
| Joseph Brennan | Karin A. Risi |
| Mortimer J. Buckley | Anne E. Robinson |
| Gregory Davis | Michael Rollings |
| John James | Nitin Tandon |
| Chris D. Mclsaac | Lauren Valente |

All rights reserved.
Vanguard Marketing Corporation, Distributor.

Your Fund’s Performance at a Glance | 1 |
Advisors' Report | 2 |
About Your Fund’s Expenses | 4 |
Performance Summary | 6 |
Consolidated Financial Statements | 8 |
| • | For the 12 months ended October 31, 2022, Vanguard Commodity Strategy Fund returned 9.80%, falling short of its benchmark, the Bloomberg Commodity Total Return Index, which returned 11.15%. |
| • | The economic backdrop deteriorated as inflation soared to multidecade highs, fueled in part by higher energy and food prices in the wake of Russia’s invasion of Ukraine. Then price increases broadened to other categories of goods and services, adding to concerns that inflation would remain stubbornly high. That prompted aggressive tightening by the Federal Reserve to bring inflation back in check, which increased fears of recession. |
| • | Commodities generally performed well due to limited supply and increased demand. West Texas Intermediate Crude rose and grain prices soared. Gold and other precious metals fell. |
| • | The fund benefited from its positions in commodities but fell short of its benchmark, largely because of its exposure to short-term U.S.Treasury Inflation-Protected Securities (TIPS) as the market began to price in higher inflation and real yields soared. |
| • | The fund uses derivatives to obtain its exposure to commodities. Its holdings of commodity index swaps contributed to total returns. |
| Average Annual Total Returns Periods Ended October 31, 2022 | |||
| One Year | Three Years | Five Years | |
| Stocks | |||
| Russell 1000 Index (Large-caps) | -16.38% | 9.99% | 10.19% |
| Russell 2000 Index (Small-caps) | -18.54 | 7.05 | 5.56 |
| Russell 3000 Index (Broad U.S. market) | -16.52 | 9.79 | 9.87 |
| FTSE All-World ex US Index (International) | -24.20 | -1.16 | -0.18 |
| Bonds | |||
| Bloomberg U.S. Aggregate Float Adjusted Index (Broad taxable market) | -15.69% | -3.73% | -0.50% |
| Bloomberg Municipal Bond Index (Broad tax-exempt market) | -11.98 | -2.18 | 0.37 |
| FTSE Three-Month U.S. Treasury Bill Index | 0.88 | 0.59 | 1.15 |
| CPI | |||
| Consumer Price Index | 7.75% | 5.01% | 3.85% |
| • | Based on actual fund return. This section helps you to estimate the actual expenses that you paid over the period. The ”Ending Account Value“ shown is derived from the fund‘s actual return, and the third column shows the dollar amount that would have been paid by an investor who started with $1,000 in the fund. You may use the information here, together with the amount you invested, to estimate the expenses that you paid over the period. |
| • | Based on hypothetical 5% yearly return. This section is intended to help you compare your fund‘s costs with those of other mutual funds. It assumes that the fund had a yearly return of 5% before expenses, but that the expense ratio is unchanged. In this case—because the return used is not the fund’s actual return—the results do not apply to your investment. The example is useful in making comparisons because the Securities and Exchange Commission requires all mutual funds to calculate expenses based on a 5% return. You can assess your fund’s costs by comparing this hypothetical example with the hypothetical examples that appear in shareholder reports of other funds. |
| Six Months Ended October 31, 2022 | |||
| Commodity Strategy Fund | Beginning Account Value 4/30/2022 | Ending Account Value 10/31/2022 | Expenses Paid During Period |
| Based on Actual Fund Return | $1,000.00 | $867.40 | $0.99 |
| Based on Hypothetical 5% Yearly Return | 1,000.00 | 1,024.15 | 1.07 |

| Average Annual Total Returns Periods Ended October 31, 2022 | ||||
| One Year | Since Inception (6/25/2019) | Final Value of a $50,000 Investment | ||
 | Commodity Strategy Fund | 9.80% | 15.84% | $81,832 |
 | Bloomberg Commodity Index Total Return | 11.15 | 11.93 | 72,947 |
| U.S. Government Securities | 100.0% |
| Coupon | Maturity Date | Face Amount ($000) | Market Value• ($000) | |||
| U.S. Government and Agency Obligations (77.9%) | ||||||
| U.S. Government Securities (77.9%) | ||||||
| United States Treasury Inflation Indexed Bonds | 0.125% | 1/15/23 | 104,744 | 104,499 | ||
| United States Treasury Inflation Indexed Bonds | 0.625% | 4/15/23 | 89,406 | 88,819 | ||
| United States Treasury Inflation Indexed Bonds | 0.375% | 7/15/23 | 100,557 | 99,724 | ||
| United States Treasury Inflation Indexed Bonds | 0.625% | 1/15/24 | 95,737 | 94,166 | ||
| United States Treasury Inflation Indexed Bonds | 0.500% | 4/15/24 | 53,759 | 52,625 | ||
| United States Treasury Inflation Indexed Bonds | 0.125% | 7/15/24 | 86,924 | 84,669 | ||
| United States Treasury Inflation Indexed Bonds | 0.125% | 10/15/24 | 77,537 | 75,223 | ||
| United States Treasury Inflation Indexed Bonds | 0.250% | 1/15/25 | 79,492 | 76,772 | ||
| United States Treasury Inflation Indexed Bonds | 2.375% | 1/15/25 | 54,180 | 54,756 | ||
| United States Treasury Inflation Indexed Bonds | 0.125% | 4/15/25 | 63,516 | 60,906 | ||
| United States Treasury Inflation Indexed Bonds | 0.375% | 7/15/25 | 87,168 | 84,212 | ||
| United States Treasury Inflation Indexed Bonds | 0.125% | 10/15/25 | 77,276 | 73,883 | ||
| United States Treasury Inflation Indexed Bonds | 0.625% | 1/15/26 | 73,389 | 70,740 | ||
| United States Treasury Inflation Indexed Bonds | 2.000% | 1/15/26 | 34,969 | 35,155 | ||
| United States Treasury Inflation Indexed Bonds | 0.125% | 4/15/26 | 59,708 | 56,331 | ||
| United States Treasury Inflation Indexed Bonds | 0.125% | 7/15/26 | 73,147 | 69,136 | ||
| United States Treasury Inflation Indexed Bonds | 0.125% | 10/15/26 | 82,599 | 77,733 | ||
| United States Treasury Inflation Indexed Bonds | 0.375% | 1/15/27 | 68,117 | 64,381 | ||
| United States Treasury Inflation Indexed Bonds | 2.375% | 1/15/27 | 33,809 | 34,644 | ||
| United States Treasury Inflation Indexed Bonds | 0.125% | 4/15/27 | 84,379 | 78,737 | ||
| United States Treasury Inflation Indexed Bonds | 0.375% | 7/15/27 | 75,099 | 70,922 | ||
| United States Treasury Inflation Indexed Bonds | 1.625% | 10/15/27 | 43,992 | 44,067 | ||
| Total U.S. Government and Agency Obligations (Cost $1,657,236) | 1,552,100 | |||||
| Shares | ||||||
| Temporary Cash Investments (22.8%) | ||||||
| Money Market Fund (3.3%) | ||||||
| 1 | Vanguard Market Liquidity Fund | 3.117% | 657,830 | 65,770 | ||
| Maturity Date | Face Amount ($000) | |||||
| U.S. Government and Agency Obligations (19.5%) | ||||||
| 2 | United States Cash Management Bill | 3.949% | 1/24/23 | 25,900 | 25,659 | |
| 2 | United States Cash Management Bill | 4.082%–4.094% | 2/7/23 | 36,300 | 35,899 | |
| Coupon | Maturity Date | Face Amount ($000) | Market Value• ($000) | |||
| 2,3 | United States Treasury Bill | 1.998% | 11/3/22 | 23,700 | 23,697 | |
| 2,3 | United States Treasury Bill | 2.058% | 11/10/22 | 40,300 | 40,273 | |
| 2,3 | United States Treasury Bill | 2.897% | 1/19/23 | 52,400 | 51,943 | |
| 2,3 | United States Treasury Bill | 2.842%–2.885% | 1/26/23 | 49,300 | 48,829 | |
| 2 | United States Treasury Bill | 3.023%–3.050% | 2/9/23 | 84,500 | 83,539 | |
| 2,3 | United States Treasury Bill | 3.722%–3.755% | 3/9/23 | 56,800 | 55,948 | |
| 2,3 | United States Treasury Bill | 3.784% | 3/16/23 | 24,000 | 23,618 | |
| 389,405 | ||||||
| Total Temporary Cash Investments (Cost $455,874) | 455,175 | |||||
| Total Investments (100.7%) (Cost $2,113,110) | 2,007,275 | |||||
| Other Assets and Liabilities—Net (-0.7%) | (13,020) | |||||
| Net Assets (100%) | 1,994,255 | |||||
| Cost is in $000. | ||||||
| • | See Note A in Notes to Consolidated Financial Statements. |
| 1 | Affiliated money market fund available only to Vanguard funds and certain trusts and accounts managed by Vanguard. Rate shown is the 7-day yield. |
| 2 | Security is owned by the Vanguard CSF Portfolio, which is a wholly owned subsidiary of the Commodity Strategy Fund. |
| 3 | Securities with a value of $34,816,000 have been segregated as collateral for open over-the-counter swap contracts. |
| Over-the-Counter Total Return Swaps | ||||||
| Reference Entity | Termination Date | Counterparty | Notional Amount ($000) | Fixed Interest Rate Received (Paid)1 (%) | Value and Unrealized Appreciation ($000) | Value and Unrealized (Depreciation) ($000) |
| Bloomberg Commodity Index2 | 11/9/22 | MLI | 220,000 | (0.060) | — | (3,999) |
| Bloomberg Commodity Index2 | 11/22/22 | BARC | 20,000 | (0.100) | 92 | — |
| Bloomberg Commodity Index 2 Month Forward2 | 11/22/22 | BARC | 215,000 | (0.110) | 364 | — |
| Bloomberg Commodity Index 3 Month Forward2 | 11/22/22 | GSI | 30,000 | (0.120) | 63 | — |
| BofA Merrill Lynch Commodity MLBXAKSV Excess Return Strategy2,3 | 11/9/22 | MLI | 130,000 | (0.170) | — | (1,072) |
| BofA Merrill Lynch Commodity MLBXSTGV Excess Return Strategy2,3 | 11/9/22 | MLI | 320,000 | (0.110) | — | (6,444) |
| BofA Merrill Lynch Commodity MLCILP3E Excess Return Strategy2,3 | 11/9/22 | MLI | 230,000 | (0.140) | — | (5,244) |
| CIBC Commodity CIBZC51EC Excess Return Strategy2,3 | 11/9/22 | CIBC | 200,000 | (0.160) | — | (3,433) |
| Goldman Sachs Commodity i-Select Strategy 11292,3 | 11/22/22 | GSI | 450,000 | (0.120) | 582 | — |
| Over-the-Counter Total Return Swaps (continued) | ||||||
| Reference Entity | Termination Date | Counterparty | Notional Amount ($000) | Fixed Interest Rate Received (Paid)1 (%) | Value and Unrealized Appreciation ($000) | Value and Unrealized (Depreciation) ($000) |
| Modified Strategy DBS18 on the Bloomberg Commodity Index2,3 | 11/22/22 | GSI | 30,000 | (0.120) | 50 | — |
| Societe Generale Commodity SGIXCSB1 Excess Return Strategy2,3 | 11/9/22 | SOCG | 150,000 | (0.180) | — | (3,507) |
| 1,151 | (23,699) | |||||
| 1 | Fixed interest payment received/paid monthly. |
| 2 | Security is owned by the subsidiary. |
| 3 | Information on the components of the reference entity is available on www.vanguard.com. |
| BARC—Barclays Bank plc. | |
| CIBC—Canadian Imperial Bank of Commerce. | |
| GSI—Goldman Sachs International. | |
| MLI—Merrill Lynch International. | |
| SOCG—Société Generale. |
| ($000s, except shares and per-share amounts) | Amount |
| Assets | |
| Investments in Securities, at Value | |
| Unaffiliated Issuers (Cost $2,047,352) | 1,941,505 |
| Affiliated Issuers (Cost $65,758) | 65,770 |
| Total Investments in Securities | 2,007,275 |
| Investment in Vanguard | 80 |
| Cash | 118 |
| Receivables for Investment Securities Sold | 54,107 |
| Receivables for Accrued Income | 1,937 |
| Receivables for Capital Shares Issued | 4,624 |
| Unrealized Appreciation—Over-the-Counter Swap Contracts | 1,151 |
| Receivables from Broker-Dealer | 235 |
| Total Assets | 2,069,527 |
| Liabilities | |
| Payables for Investment Securities Purchased | 44,292 |
| Payables for Capital Shares Redeemed | 7,086 |
| Payables to Vanguard | 195 |
| Unrealized Depreciation—Over-the-Counter Swap Contracts | 23,699 |
| Total Liabilities | 75,272 |
| Net Assets | 1,994,255 |
| At October 31, 2022, net assets consisted of: | |
| Paid-in Capital | 1,885,044 |
| Total Distributable Earnings (Loss) | 109,211 |
| Net Assets | 1,994,255 |
| Net Assets | |
| Applicable to 64,979,653 outstanding $.001 par value shares of beneficial interest (unlimited authorization) | 1,994,255 |
| Net Asset Value Per Share | $30.69 |
| Year Ended October 31, 2022 | |
| ($000) | |
| Investment Income | |
| Income | |
| Interest1 | 98,752 |
| Total Income | 98,752 |
| Expenses | |
| The Vanguard Group—Note B | |
| Investment Advisory Services | 283 |
| Management and Administrative | 3,755 |
| Marketing and Distribution | 114 |
| Custodian Fees | 24 |
| Auditing Fees | 96 |
| Shareholders’ Reports | 48 |
| Trustees’ Fees and Expenses—Note B | 15 |
| Other Expenses | 16 |
| Total Expenses | 4,351 |
| Expenses Paid Indirectly | (13) |
| Net Expenses | 4,338 |
| Net Investment Income | 94,414 |
| Realized Net Gain (Loss) | |
| Investment Securities Sold1 | (22,628) |
| Swap Contracts | 154,601 |
| Realized Net Gain (Loss) | 131,973 |
| Change in Unrealized Appreciation (Depreciation) | |
| Investment Securities1 | (120,812) |
| Swap Contracts | (2,731) |
| Change in Unrealized Appreciation (Depreciation) | (123,543) |
| Net Increase (Decrease) in Net Assets Resulting from Operations | 102,844 |
| 1 | Interest income, realized net gain (loss), capital gain distributions received, and change in unrealized appreciation (depreciation) from an affiliated company of the fund were $1,427,000, ($71,000), $4,000, and $2,000, respectively. Purchases and sales are for temporary cash investment purposes. |
| Year Ended October 31, | ||
| 2022 ($000) | 2021 ($000) | |
| Increase (Decrease) in Net Assets | ||
| Operations | ||
| Net Investment Income | 94,414 | 28,926 |
| Realized Net Gain (Loss) | 131,973 | 364,225 |
| Change in Unrealized Appreciation (Depreciation) | (123,543) | (672) |
| Net Increase (Decrease) in Net Assets Resulting from Operations | 102,844 | 392,479 |
| Distributions | ||
| Total Distributions | (390,043) | (2,526) |
| Capital Share Transactions | ||
| Issued | 1,800,077 | 1,233,852 |
| Issued in Lieu of Cash Distributions | 271,967 | 2,099 |
| Redeemed | (1,476,116) | (313,092) |
| Net Increase (Decrease) from Capital Share Transactions | 595,928 | 922,859 |
| Total Increase (Decrease) | 308,729 | 1,312,812 |
| Net Assets | ||
| Beginning of Period | 1,685,526 | 372,714 |
| End of Period | 1,994,255 | 1,685,526 |
| For a Share Outstanding Throughout Each Period | Year Ended October 31, | June 25, 20191 to October 31, 2019 | ||
| 2022 | 2021 | 2020 | ||
| Net Asset Value, Beginning of Period | $36.85 | $24.32 | $24.83 | $25.00 |
| Investment Operations | ||||
| Net Investment Income2 | 1.474 | .890 | .265 | .143 |
| Net Realized and Unrealized Gain (Loss) on Investments | .751 | 11.774 | (.620) | (.313) |
| Total from Investment Operations | 2.225 | 12.664 | (.355) | (.170) |
| Distributions | ||||
| Dividends from Net Investment Income | (8.385) | (.134) | (.155) | — |
| Distributions from Realized Capital Gains | — | — | — | — |
| Total Distributions | (8.385) | (.134) | (.155) | — |
| Net Asset Value, End of Period | $30.69 | $36.85 | $24.32 | $24.83 |
| Total Return3 | 9.80% | 52.30% | -1.45% | -0.68% |
| Ratios/Supplemental Data | ||||
| Net Assets, End of Period (Millions) | $1,994 | $1,686 | $373 | $207 |
| Ratio of Total Expenses to Average Net Assets | 0.21%4 | 0.20% | 0.20% | 0.20%5 |
| Ratio of Net Investment Income to Average Net Assets | 4.47% | 2.79% | 1.15% | 1.65%5 |
| Portfolio Turnover Rate | 47% | 15% | 38% | 7% |
| 1 | Inception. |
| 2 | Calculated based on average shares outstanding. |
| 3 | Total returns do not include account service fees that may have applied in the periods shown. Fund prospectuses provide information about any applicable account service fees. |
| 4 | The ratio of expenses to average net assets for the period net of reduction from custody fee offset arrangements was 0.21%. |
| 5 | Annualized. |
| A. | The following significant accounting policies conform to generally accepted accounting principles for U.S. investment companies. The fund consistently follows such policies in preparing its financial statements. |
| Assets Reflected in Consolidated Statement of Assets and Liabilities1 ($000) | Liabilities Reflected in Consolidated Statement of Assets and Liabilities1 ($000) | Net Amount Receivable (Payable) ($000) | Amounts Not Offset in the Consolidated Statement of Assets and Liabilities | Net Exposure3 (Not Less Than $0) ($000) | ||
| Collateral Pledged2 ($000) | Collateral Received2 ($000) | |||||
| Derivatives Subject to Offsetting Arrangements, by Counterparty | ||||||
| Barclays Bank plc | 456 | — | 456 | 2,070 | — | 456 |
| Canadian Imperial Bank of Commerce | — | (3,433) | (3,433) | 1,679 | — | — |
| Goldman Sachs International | 695 | — | 695 | — | 4,827 | — |
| Merrill Lynch International | — | (16,759) | (16,759) | 25,931 | — | — |
| Société Generale | — | (3,507) | (3,507) | 5,136 | — | — |
| Total | 1,151 | (23,699) | (22,548) | 34,816 | 4,827 | 456 |
| B. | In accordance with the terms of a Funds' Service Agreement (the “FSA”) between Vanguard and the fund, Vanguard furnishes to the fund investment advisory, corporate management, administrative, marketing, and distribution services at Vanguard’s cost of operations (as defined by the FSA). These costs of operations are allocated to the fund based on methods and guidelines approved by the board of trustees and are generally settled twice a month. |
| C. | The fund’s custodian bank has agreed to reduce its fees when the fund maintains cash on deposit in the non-interest-bearing custody account. For the year ended October 31, 2022, custodian fee offset arrangements reduced the fund’s expenses by $13,000 (an annual rate of less than 0.01% of average net assets). |
| D. | Various inputs may be used to determine the value of the fund’s investments and derivatives. These inputs are summarized in three broad levels for financial statement purposes. The inputs or methodologies used to value securities are not necessarily an indication of the risk associated with investing in those securities. |
| Level 1 ($000) | Level 2 ($000) | Level 3 ($000) | Total ($000) | |
| Investments | ||||
| Assets | ||||
| U.S. Government and Agency Obligations | — | 1,552,100 | — | 1,552,100 |
| Temporary Cash Investments | 65,770 | 389,405 | — | 455,175 |
| Total | 65,770 | 1,941,505 | — | 2,007,275 |
| Derivative Financial Instruments | ||||
| Assets | ||||
| Swap Contracts | — | 1,151 | — | 1,151 |
| Liabilities | ||||
| Swap Contracts | — | 23,699 | — | 23,699 |
| E. | Permanent differences between book-basis and tax-basis components of net assets are reclassified among capital accounts in the financial statements to reflect their tax character. These reclassifications have no effect on net assets or net asset value per share. As of period end, permanent differences primarily attributable to the accounting for applicable operations of the subsidiary were reclassified between the individual components of total distributable earnings (loss). |
| Amount ($000) | |
| Undistributed Ordinary Income | 237,921 |
| Undistributed Long-Term Gains | — |
| Capital Loss Carryforwards | (18,622) |
| Qualified Late-Year Losses | — |
| Net Unrealized Gains (Losses) | (110,088) |
| Year Ended October 31, | ||
| 2022 Amount ($000) | 2021 Amount ($000) | |
| Ordinary Income* | 390,043 | 2,526 |
| Long-Term Capital Gains | — | — |
| Total | 390,043 | 2,526 |
| * | Includes short-term capital gains, if any. |
| Amount ($000) | |
| Tax Cost | 2,117,363 |
| Gross Unrealized Appreciation | 3,351 |
| Gross Unrealized Depreciation | (113,439) |
| Net Unrealized Appreciation (Depreciation) | (110,088) |
| F. | During the year ended October 31, 2022, the fund purchased $1,150,565,000 of investment securities and sold $661,128,000 of investment securities, other than temporary cash investments. |
| G. | Capital shares issued and redeemed were: |
| Year Ended October 31, | ||
| 2022 Shares (000) | 2021 Shares (000) | |
| Issued | 54,611 | 40,091 |
| Issued in Lieu of Cash Distributions | 10,325 | 81 |
| Redeemed | (45,700) | (9,752) |
| Net Increase (Decrease) in Shares Outstanding | 19,236 | 30,420 |
| H. | Management has determined that no events or transactions occurred subsequent to October 31, 2022, that would require recognition or disclosure in these financial statements. |
Philadelphia, Pennsylvania
December 16, 2022
| Matthew Benchener | Thomas M. Rampulla |
| Joseph Brennan | Karin A. Risi |
| Mortimer J. Buckley | Anne E. Robinson |
| Gregory Davis | Michael Rollings |
| John James | Nitin Tandon |
| Chris D. Mclsaac | Lauren Valente |

All rights reserved.
Vanguard Marketing Corporation, Distributor.
Item 2: Code of Ethics.
The Registrant has adopted a code of ethics that applies to the Registrant’s principal executive officer, principal financial officer, principal accounting officer or controller or persons performing similar functions. The Code of Ethics was amended during the reporting period covered by this report to make certain technical, non-material changes.
Item 3: Audit Committee Financial Expert.
All members of the Audit Committee have been determined by the Registrant’s Board of Trustees to be Audit Committee Financial Experts and to be independent: F. Joseph Loughrey, Mark Loughridge, Sarah Bloom Raskin, and Peter F. Volanakis.
Item 4: Principal Accountant Fees and Services.
(a) Audit Fees.
Audit Fees of the Registrant.
Fiscal Year Ended October 31, 2022: $182,000
Fiscal Year Ended October 31, 2021: $192,000
Aggregate Audit Fees of Registered Investment Companies in the Vanguard Group.
Fiscal Year Ended October 31, 2022: $10,494,508
Fiscal Year Ended October 31, 2021: $11,244,694
Includes fees billed in connection with audits of the Registrant, other registered investment companies in the Vanguard complex, The Vanguard Group, Inc., and Vanguard Marketing Corporation.
(b) Audit-Related Fees.
Fiscal Year Ended October 31, 2022: $2,757,764
Fiscal Year Ended October 31, 2021: $2,955,181
Includes fees billed in connection with assurance and related services provided to the Registrant, other registered investment companies in the Vanguard complex, The Vanguard Group, Inc., and Vanguard Marketing Corporation.
(c) Tax Fees.
Fiscal Year Ended October 31, 2022: $5,202,689
Fiscal Year Ended October 31, 2021: $2,047,574
Includes fees billed in connection with tax compliance, planning, and advice services provided to the Registrant, other registered investment companies in the Vanguard complex, The Vanguard Group, Inc., and Vanguard Marketing Corporation.
(d) All Other Fees.
Fiscal Year Ended October 31, 2022: $298,000
Fiscal Year Ended October 31, 2021: $280,000
Includes fees billed for services related to tax reported information provided to the Registrant, other registered investment companies in the Vanguard complex, The Vanguard Group, Inc., and Vanguard Marketing Corporation.
(e) (1) Pre-Approval Policies. The policy of the Registrant’s Audit Committee is to consider, and, if appropriate, approve before the principal accountant is engaged for such services, all specific audit and non-audit services provided to: the Registrant, other registered investment companies in the Vanguard complex, The Vanguard Group, Inc., and entities controlled by The Vanguard Group, Inc. that provide ongoing services to the Registrant. In making a determination, the Audit Committee considers whether the services are consistent with maintaining the principal accountant’s independence.
In the event of a contingency situation in which the principal accountant is needed to provide services in between scheduled Audit Committee meetings, the Chairman of the Audit Committee would be called on to consider and, if appropriate, pre-approve audit or permitted non-audit services in an amount sufficient to complete services through the next Audit Committee meeting, and to determine if such services would be consistent with maintaining the accountant’s independence. At the next scheduled Audit Committee meeting, services and fees would be presented to the Audit Committee for formal consideration, and, if appropriate, approval by the entire Audit Committee. The Audit Committee would again consider whether such services and fees are consistent with maintaining the principal accountant’s independence.
The Registrant’s Audit Committee is informed at least annually of all audit and non-audit services provided by the principal accountant to the Vanguard complex, whether such services are provided to: the Registrant, other registered investment companies in the Vanguard complex, The Vanguard Group, Inc., or other entities controlled by The Vanguard Group, Inc. that provide ongoing services to the Registrant.
(2) No percentage of the principal accountant’s fees or services were approved pursuant to the waiver provision of paragraph (c)(7)(i)(C) of Rule 2-01 of Regulation S-X.
(f) For the most recent fiscal year, over 50% of the hours worked under the principal accountant’s engagement were not performed by persons other than full-time, permanent employees of the principal accountant.
(g) Aggregate Non-Audit Fees.
Fiscal Year Ended October 31, 2022: $5,500,689
Fiscal Year Ended October 31, 2021: $2,327,574
Includes fees billed for non-audit services provided to the Registrant, other registered investment companies in the Vanguard complex, The Vanguard Group, Inc., and Vanguard Marketing Corporation.
(h) For the most recent fiscal year, the Audit Committee has determined that the provision of all non-audit services was consistent with maintaining the principal accountant’s independence.
Item 5: Audit Committee of Listed Registrants.
The Registrant is a listed issuer as defined in rule 10A-3 under the Securities Exchange Act of 1934 (“Exchange Act”). The Registrant has a separately-designated standing audit committee established in accordance with Section 3(a)(58)(A) of the Exchange Act. The Registrant’s audit committee members are: F. Joseph Loughrey, Mark Loughridge, Sarah Bloom Raskin, and Peter F. Volanakis.
Item 6: Investments.
Not applicable. The complete schedule of investments is included as part of the report to shareholders filed under Item 1 of this Form.
Item 7: Disclosure of Proxy Voting Policies and Procedures for Closed-End Management Investment Companies.
Not applicable.
Item 8: Portfolio Managers of Closed-End Management Investment Companies.
Not applicable.
Item 9: Purchase of Equity Securities by Closed-End Management Investment Company and Affiliated Purchasers.
Not applicable.
Item 10: Submission of Matters to a Vote of Security Holders.
Not applicable.
Item 11: Controls and Procedures.
(a) Disclosure Controls and Procedures. The Principal Executive and Financial Officers concluded that the Registrant’s Disclosure Controls and Procedures are effective based on their evaluation of the Disclosure Controls and Procedures as of a date within 90 days of the filing date of this report.
(b) Internal Control Over Financial Reporting. There were no significant changes in the Registrant’s Internal Control Over Financial Reporting or in other factors that could significantly affect this control subsequent to the date of the evaluation, including any corrective actions with regard to significant deficiencies and material weaknesses.
Item 12: Disclosure of Securities Lending Activities for Closed-End Management Investment Companies.
Not applicable.
Item 13: Exhibits.
| (a)(1) | Code of Ethics filed herewith. |
| (a)(2) | Certifications filed herewith. |
| (b) | Certifications filed herewith. |
Pursuant to the requirements of the Securities Exchange Act of 1934 and the Investment Company Act of 1940, the registrant has duly caused this report to be signed on its behalf by the undersigned, thereunto duly authorized.
| VANGUARD TRUSTEES’ EQUITY fund | ||
| BY: | /s/ MORTIMER J. BUCKLEY* | |
| MORTIMER J. BUCKLEY | ||
| CHIEF EXECUTIVE OFFICER | ||
Date: December 19, 2022
Pursuant to the requirements of the Securities Exchange Act of 1934 and the Investment Company Act of 1940, this report has been signed below by the following persons on behalf of the registrant and in the capacities and on the dates indicated.
| VANGUARD trustees’ equity fund | ||
| BY: | /s/ MORTIMER J. BUCKLEY* | |
| MORTIMER J. BUCKLEY | ||
| CHIEF EXECUTIVE OFFICER | ||
Date: December 19, 2022
| VANGUARD trustees’ equity fund | ||
| BY: | /s/ CHRISTINE BUCHANAN* | |
| CHRISTINE BUCHANAN | ||
| CHIEF FINANCIAL OFFICER | ||
Date: December 19, 2022
| * By: | /s/ Anne E. Robinson |
Anne E. Robinson, pursuant to a Power of Attorney filed on October 11, 2022 (see File Number 333-11763), Incorporated by Reference.