UNITED STATES
SECURITIES AND EXCHANGE COMMISSION
Washington, D.C. 20549
FORM N-CSR
CERTIFIED SHAREHOLDER REPORT
OF
REGISTERED MANAGEMENT INVESTMENT COMPANIES
Investment Company Act file number: 811-02968-99
| Name of Registrant: | Vanguard Trustees’ Equity Fund |
| Address of Registrant: | P.O. Box 2600 |
| | Valley Forge, PA 19482 |
| Name and address of agent for service: | Anne E. Robinson, Esquire |
| | P.O. Box 876 |
| | Valley Forge, PA 19482 |
Registrant’s telephone number, including area code: (610) 669-1000
Date of fiscal year end: October 31
Date of reporting period: November 1, 2020—October 31, 2021
Item 1: Reports to Shareholders
Annual Report | October 31, 2021
Vanguard International Value Fund
Contents
Please note: The opinions expressed in this report are just that—informed opinions. They should not be considered promises or advice. Also, please keep in mind that the information and opinions cover the period through the date on the front of this report. Of course, the risks of investing in your fund are spelled out in the prospectus.
Your Fund’s Performance at a Glance
| • | For the 12 months ended October 31, 2021, Vanguard International Value Fund returned 36.91%, ahead of the 29.66% return of its benchmark. |
| • | During the period, the global economy continued to recover from the sharp pandemic-induced contraction of spring 2020. Countries that were more successful in containing the coronavirus, whether through vaccinations, lockdowns, or both, generally fared better economically. Swift and extensive fiscal and monetary support from policymakers was also key to the rebound. Even amid concerns late in the fiscal year about inflation and the prospect of less accommodative monetary policy, stock returns for the period were excellent. |
| • | The broad U.S. stock market, as measured by the Russell 3000 Index, climbed 43.90%. Value stocks outperformed growth, and mid- and -small-capitalization stocks outperformed large-caps. |
| • | Of the fund’s 11 sectors, the advisors’ selections in consumer discretionary, industrial, and communication services stocks helped relative performance the most. Holdings in information technology detracted. |
| • | Emerging markets, led by China, added most to relative performance. Holdings in European stocks, especially companies based in the U.K. (the fund’s largest market), generally turned in strong results, although France and Germany detracted from performance. Pacific stocks were broadly positive; Hong Kong and Australia detracted slightly. |
Market Barometer
| | Average Annual Total Returns
Periods Ended October 31, 2021 |
| | One Year | Three Years | Five Years |
| Stocks | | | |
| Russell 1000 Index (Large-caps) | 43.51% | 22.01% | 19.16% |
| Russell 2000 Index (Small-caps) | 50.80 | 16.47 | 15.52 |
| Russell 3000 Index (Broad U.S. market) | 43.90 | 21.62 | 18.91 |
| FTSE All-World ex US Index (International) | 30.23 | 12.42 | 10.05 |
| Bonds | | | |
Bloomberg U.S. Aggregate Bond Index
(Broad taxable market) | -0.48% | 5.63% | 3.10% |
Bloomberg Municipal Bond Index
(Broad tax-exempt market) | 2.64 | 5.17 | 3.41 |
| FTSE Three-Month U.S. Treasury Bill Index | 0.05 | 1.08 | 1.12 |
| CPI | | | |
| Consumer Price Index | 6.22% | 3.03% | 2.73% |
For the 12 months ended October 31, 2021, Vanguard International Value Fund returned 36.91%. It outperformed its benchmark, the MSCI ACWI ex USA Index, which returned 29.66%.
Your fund is managed by three independent advisors, a strategy that enhances its diversification by providing exposure to distinct yet complementary investment approaches. It’s not uncommon for different advisors to have different views about individual securities or the broader investment environment.
The accompanying table lists the advisors, the amount and percentage of fund assets each manages, and brief descriptions of their investment strategies.
The advisors have provided the following assessment of the investment environment during the past 12 months and the notable successes and shortfalls in their portfolios. These comments were prepared on November 15, 2021.
Lazard Asset Management LLC
Portfolio Managers:
Michael G. Fry, Managing Director
Michael A. Bennett, CPA,
Managing Director
Low-quality value stocks spiked after the November 2020 Pfizer announcement of a coronavirus vaccine. While value and quality stocks did well in March as extreme headwinds faded briefly, growth
headwinds returned in the second quarter of 2021 as recovery hopes were delayed. The two extremes, neither of which favor our relative value philosophy, canceled each other out. Style influence has been significant since the fourth quarter of 2020.
Our strategy tends to perform best when markets are broad rather than dominated by a single theme. As stock pickers who look at the relative value of the companies we invest in, we face a particular challenge when the market has a strong preference for either expensive growth stocks or cheap stocks with low returns on equity.
Stock selection within communication services hurt relative returns, as did an overweight allocation to the underperforming sector. Shares of Autohome, an online retail destination for auto consumers in China, initially declined on fears of increasing competition amid continued increasing regulatory oversight of the Chinese government. We took advantage of the initial weakness in the stock and the company’s inexpensive valuation to add to our position. We maintain our conviction that Autohome can structurally grow and that the firm will maintain its 40% profit margin and high return on invested capital.
Our selection in the utilities sector, by contrast, helped returns. One of the few stocks in China left unaffected by concerns about economic growth and the government’s increasing regulatory oversight, China Longyuan outperformed on a better-than-expected earnings report.
The company designs, constructs, and manages wind farms and controls approximately 8% of the wind market in China. It is targeting aggressive capacity expansion as it aims to hit China’s new 2060 net-zero carbon emissions targets.
We believe a relative value phase is trying to emerge as extremes fade and market leadership broadens, similar to what we experienced for several years after the global financial crisis. As we head toward late 2021, we feel our portfolio is positioned to take advantage of a reopening in the global economy and a return to a more discerning market environment, one where the actual performance of a company drives its share price.
Sprucegrove Investment Management Ltd.
Portfolio Managers:
Arjun Kumar, CFA,
Managing Director
Co-Lead of International Equities
Shirley Woo, CFA, Managing Director
Co-Lead of International Equities
The first eight months of the fiscal year were marked by optimism for an eventual “return to normal” across economies, thanks to the successful development of COVID vaccines announced in the fourth quarter of 2020.
Since May 2021, however, the underlying dynamics have shifted amid concern that economic growth may be losing
momentum while the rise in inflation could be longer lasting. Several factors weighed on the market, including the reemergence of COVID-19 concerns, an increase in corporate profit warnings driven by supply chain bottlenecks and rising input costs, fears of waning fiscal stimulus, China’s regulatory crackdown, and the potential for financial contagion risk associated with troubled property developer Evergrande.
Consumer discretionary and industrial holdings drove our portfolio’s outperformance, as these sectors benefited from the broader reopening of economies. These gains were partially offset by our underweight position in financials, one of the best-performing sectors. From a regional perspective, emerging markets was a meaningful contributor, mainly because of our underweight position to China and the strong performance of several of our Indian holdings.
Our bottom-up, fundamentals-driven approach has been consistently applied over the decades, as we continue to focus on constructing portfolios of quality companies at attractive valuations. Over the past year, we have added new names to the portfolio and augmented several positions as opportunities presented themselves.
At the end of the period, the portfolio held higher-quality, lower-risk (as gauged by financial leverage) securities compared with the benchmark, and was attractively valued. These characteristics are critical to
our quest to achieve superior investment returns through a full market cycle.
ARGA Investment Management, LP
Portfolio Managers:
A. Rama Krishna, CFA, Founder and
Chief Investment Officer
Steven Morrow, CFA, Director of Research
International equites rose sharply during the 12 months as markets recovered from 2020 pandemic lows. Fear and uncertainty eased on improving global economies and company fundamentals. Equity valuations rebounded, especially for many companies where temporary stress hid longer-term prospects. These rebounds led to a reversal of the value-versus-growth dynamic, with value stocks strongly outperforming their growth counterparts.
Our valuation discipline took advantage of the stock-price anomalies that crises often create, and consistent adherence to our valuation process boosted the portfolio’s results.
Key to that process was research, including integration of environmental, social, and governance (ESG) factors. In the depths of the crisis, our research uncovered many severely discounted stocks of companies with strong franchises and solid balance sheets. Fundamental research provided conviction in the long-term earning power of many of
these companies, allowing us to initiate positions at attractive prices. Research also provided confidence to hold positions we deemed significantly undervalued relative to long-term prospects. This process created a diverse investment set that resulted in positive performance contributions by 10 out of 11 sectors.
The current portfolio embeds opportunities that have emerged at various stages of the pandemic—all displaying significant equity undervaluation relative to long-term potential. Opportunities are often company-specific, spanning sectors and geographies. Areas of concentrated undervaluation include: (1) aerospace, airline, and other travel holdings, poised to benefit from travel recovery; (2) Chinese internet companies, reeling from investor overreaction to regulatory risk but evidencing sustainably strong cash flows; (3) Macau gaming companies, where profits should rebound as visitations recover for leaders in the growing mass segment; and (4) European banks, which should benefit from an improving macro environment, cost cuts, rationalization, consolidation, and rate normalization.
Outside the U.S., valuation spreads between value and growth stocks remain wide. Historically, high spreads signal subsequent value outperformance. Fundamental research underscores this opportunity, suggesting value stocks in the portfolio are poised to generate strong returns.
Vanguard International Value Fund Investment Advisors
| | Fund Assets Managed | |
| Investment Advisor | % | $ Million | Investment Strategy |
| Lazard Asset Management LLC | 39 | 5,926 | The advisor uses a research-driven, bottom-up, relative-value approach in selecting stocks. The goal is to identify individual stocks that offer an appropriate trade-off between low relative valuation and high financial productivity. |
| Sprucegrove Investment Management Ltd. | 34 | 5,129 | The advisor employs a concentrated, low-turnover, value-oriented investment approach that results in a portfolio of companies with good long-term prospects and below-market price/earnings ratios. In-depth fundamental research on industries and companies is central to this investment process. |
| ARGA Investment Management, LP | 25 | 3,777 | The advisor invests in deeply undervalued securities with long-term upside. Its valuation discipline is based on fundamental research and present value, with full integration of ESG risks and opportunities. |
| Cash Investments | 2 | 387 | These short-term reserves are invested by Vanguard in equity index products to simulate investments in stocks. Each advisor may also maintain a modest cash position. |
About Your Fund’s Expenses
As a shareholder of the fund, you incur ongoing costs, which include costs for portfolio management, administrative services, and shareholder reports (like this one), among others. Operating expenses, which are deducted from a fund’s gross income, directly reduce the investment return of the fund.
A fund‘s expenses are expressed as a percentage of its average net assets. This figure is known as the expense ratio. The following examples are intended to help you understand the ongoing costs (in dollars) of investing in your fund and to compare these costs with those of other mutual funds. The examples are based on an investment of $1,000 made at the beginning of the period shown and held for the entire period.
The accompanying table illustrates your fund’s costs in two ways:
| • | Based on actual fund return. This section helps you to estimate the actual expenses that you paid over the period. The ”Ending Account Value“ shown is derived from the fund’s actual return, and the third column shows the dollar amount that would have been paid by an investor who started with $1,000 in the fund. You may use the information here, together with the amount you invested, to estimate the expenses that you paid over the period. |
To do so, simply divide your account value by $1,000 (for example, an $8,600 account value divided by $1,000 = 8.6), then multiply the result by the number given for your fund under the heading ”Expenses Paid During Period.“
| • | Based on hypothetical 5% yearly return. This section is intended to help you compare your fund‘s costs with those of other mutual funds. It assumes that the fund had a yearly return of 5% before expenses, but that the expense ratio is unchanged. In this case—because the return used is not the fund’s actual return—the results do not apply to your investment. The example is useful in making comparisons because the Securities and Exchange Commission requires all mutual funds to calculate expenses based on a 5% return. You can assess your fund’s costs by comparing this hypothetical example with the hypothetical examples that appear in shareholder reports of other funds. |
Note that the expenses shown in the table are meant to highlight and help you compare ongoing costs only and do not reflect transaction costs incurred by the fund for buying and selling securities. Further, the expenses do not include any purchase, redemption, or account service fees described in the fund prospectus. If such fees were applied to your account, your costs would be higher. Your fund does not carry a “sales load.”
The calculations assume no shares were bought or sold during the period. Your actual costs may have been higher or lower, depending on the amount of your investment and the timing of any purchases or redemptions.
You can find more information about the fund’s expenses, including annual expense ratios, in the Financial Statements section of this report. For additional information on operating expenses and other shareholder costs, please refer to your fund’s current prospectus.
| Six Months Ended October 31, 2021 | | | |
| International Value Fund | Beginning
Account Value
4/30/2021 | Ending
Account Value
10/31/2021 | Expenses
Paid During
Period |
| Based on Actual Fund Return | $1,000.00 | $1,004.40 | $1.82 |
| Based on Hypothetical 5% Yearly Return | 1,000.00 | 1,023.39 | 1.84 |
The calculations are based on expenses incurred in the most recent six-month period. The fund's annualized six-month expense ratio for that period is 0.36%. The dollar amounts shown as ”Expenses Paid” are equal to the annualized expense ratio multiplied by the average account value over the period, multiplied by the number of days in the most recent six-month period, then divided by the number of days in the most recent 12-month period (184/365).
All of the returns in this report represent past performance, which is not a guarantee of future results that may be achieved by the fund. (Current performance may be lower or higher than the performance data cited. For performance data current to the most recent month-end, visit our website at vanguard.com/performance.) Note, too, that both investment returns and principal value can fluctuate widely, so an investor’s shares, when sold, could be worth more or less than their original cost. The returns shown do not reflect taxes that a shareholder would pay on fund distributions or on the sale of fund shares.
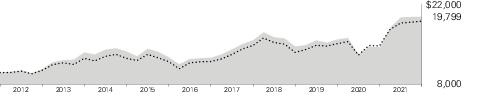
Cumulative Performance: October 31, 2011, Through October 31, 2021
Initial Investment of $10,000
| | | | Average Annual Total Returns
Periods Ended October 31, 2021 |
| | | One
Year | Five
Years | Ten
Years | Final Value
of a $10,000
Investment |
 | International Value Fund | 36.91% | 9.42% | 7.07% | $19,799 |
 | MSCI All Country World Index ex USA | 29.66 | 9.77 | 6.66 | 19,057 |
See Financial Highlights for dividend and capital gains information.
| |
| United Kingdom | 17.0% |
| Japan | 10.9 |
| France | 8.9 |
| Switzerland | 6.3 |
| China | 6.2 |
| Germany | 6.1 |
| India | 5.1 |
| Netherlands | 4.8 |
| South Korea | 4.7 |
| United States | 4.5 |
| Hong Kong | 3.5 |
| Canada | 3.1 |
| Brazil | 2.5 |
| Indonesia | 2.1 |
| Singapore | 1.9 |
| Italy | 1.7 |
| Norway | 1.6 |
| Finland | 1.4 |
| Denmark | 1.3 |
| Australia | 1.2 |
| Ireland | 1.2 |
| Other | 4.0 |
The table reflects the fund’s investments, except for short-term investments and derivatives.
The fund files its complete schedule of portfolio holdings with the Securities and Exchange Commission (SEC) for the first and third quarters of each fiscal year as an exhibit to its reports on Form N-PORT. The fund’s Form N-PORT reports are available on the SEC’s website at www.sec.gov.
| | | | | | Shares | Market
Value•
($000) |
| Common Stocks (93.8%) |
| Australia (1.2%) |
| | BHP Group Ltd. | 2,304,657 | 63,302 |
| | National Australia Bank Ltd. | 2,401,660 | 52,217 |
| | QBE Insurance Group Ltd. | 4,298,322 | 38,485 |
| | Adbri Ltd. | 9,391,834 | 21,140 |
| | | | | | | 175,144 |
| Brazil (2.4%) |
| * | Banco Bradesco SA ADR | 39,987,874 | 139,958 |
| | Ambev SA ADR | 37,817,100 | 111,939 |
| | Lojas Renner SA | 8,598,502 | 49,103 |
| | Banco do Brasil SA | 5,775,000 | 29,162 |
| * | Cia de Saneamento Basico do Estado de Sao Paulo | 4,513,900 | 28,153 |
| | | | | | | 358,315 |
| Canada (2.9%) |
| | Suncor Energy Inc. | 4,630,214 | 121,779 |
| | Canadian Natural Resources Ltd. | 2,689,606 | 114,313 |
| | Bank of Nova Scotia | 819,693 | 53,741 |
| | Nutrien Ltd. | 696,155 | 48,656 |
| | Saputo Inc. | 1,845,849 | 44,088 |
| | Stella-Jones Inc. | 895,700 | 32,156 |
| | Alimentation Couche-Tard Inc. Class B | 851,900 | 31,953 |
| | | | | | | 446,686 |
| China (5.8%) |
| * | Alibaba Group Holding Ltd. | 12,650,900 | 260,136 |
| | Tencent Holdings Ltd. | 2,093,500 | 127,347 |
| * | Baidu Inc. ADR | 713,636 | 115,780 |
| | China Longyuan Power Group Corp. Ltd. Class H | 39,790,000 | 93,070 |
| | ENN Energy Holdings Ltd. | 4,949,900 | 85,279 |
| | | | | | Shares | Market
Value•
($000) |
| | Ping An Insurance Group Co. of China Ltd. Class H | 9,490,000 | 67,975 |
| *,1 | ESR Cayman Ltd. | 19,276,200 | 62,375 |
| | Autohome Inc. ADR | 1,113,449 | 43,814 |
| | Hengan International Group Co. Ltd. | 4,912,000 | 25,670 |
| * | Weibo Corp. ADR | 7,012 | 316 |
| | | | | | | 881,762 |
| Denmark (1.2%) |
| | Vestas Wind Systems A/S | 2,437,919 | 105,390 |
| | Carlsberg A/S Class B | 499,347 | 82,450 |
| | | | | | | 187,840 |
| Egypt (0.3%) |
| * | Commercial International Bank Egypt SAE (Registered) GDR | 14,185,150 | 43,979 |
| Finland (1.3%) |
| | Sampo OYJ Class A | 1,573,281 | 83,638 |
| | Nokian Renkaat OYJ | 2,097,700 | 78,773 |
| * | Nokia OYJ | 6,980,867 | 40,067 |
| | | | | | | 202,478 |
| France (8.4%) |
| | Air Liquide SA | 829,877 | 138,554 |
| * | Airbus SE | 1,067,483 | 136,939 |
| | Sanofi | 1,329,467 | 133,537 |
| | Engie SA | 8,420,891 | 119,788 |
| | Vinci SA | 1,026,137 | 109,705 |
| | TotalEnergies SE | 2,029,452 | 101,625 |
| | Safran SA | 735,893 | 99,044 |
| | Societe Generale SA | 2,459,895 | 82,170 |
| | Atos SE | 1,542,318 | 80,467 |
| | Pernod Ricard SA | 307,226 | 70,681 |
| | Legrand SA | 547,919 | 59,773 |
| * | Accor SA | 1,309,358 | 46,857 |
| | Publicis Groupe SA | 472,470 | 31,719 |
| | Alstom SA | 721,998 | 25,730 |
| | | | | | Shares | Market
Value•
($000) |
| | Thales SA | 233,464 | 21,544 |
| * | Technip Energies NV | 1,188,167 | 18,286 |
| | | | | | | 1,276,419 |
| Germany (5.7%) |
| | Fresenius Medical Care AG & Co. KGaA | 1,538,086 | 102,174 |
| | Volkswagen AG Preference Shares | 438,773 | 98,474 |
| | Bayerische Motoren Werke AG | 960,200 | 97,015 |
| | BASF SE | 1,280,860 | 92,188 |
| | Henkel AG & Co. KGaA | 1,047,180 | 87,452 |
| | Merck KGaA | 365,525 | 86,383 |
| * | Continental AG | 633,519 | 74,484 |
| | adidas AG | 170,396 | 55,771 |
| | Infineon Technologies AG | 1,022,955 | 47,906 |
| | Jungheinrich AG Preference Shares | 773,252 | 39,214 |
| | MTU Aero Engines AG | 145,066 | 32,312 |
| | SAP SE | 173,020 | 25,055 |
| | FUCHS PETROLUB SE Preference Shares | 436,208 | 20,921 |
| | Fresenius SE & Co. KGaA | 182,788 | 8,308 |
| | | | | | | 867,657 |
| Hong Kong (3.2%) |
| * | Sands China Ltd. | 45,162,000 | 102,932 |
| * | Melco Resorts & Entertainment Ltd. ADR | 8,881,364 | 96,185 |
| | AIA Group Ltd. | 7,167,400 | 80,325 |
| | Jardine Matheson Holdings Ltd. | 1,102,100 | 64,013 |
| * | Galaxy Entertainment Group Ltd. | 6,785,000 | 36,508 |
| * | Yue Yuen Industrial Holdings Ltd. | 16,359,500 | 34,727 |
| | Hongkong Land Holdings Ltd. | 5,995,400 | 33,108 |
| | CK Asset Holdings Ltd. | 3,466,500 | 21,413 |
| 1 | WH Group Ltd. | 16,951,243 | 11,883 |
| | Xinyi Glass Holdings Ltd. | 4,106,000 | 11,571 |
| | | | | | | 492,665 |
| India (4.8%) |
| | Zee Entertainment Enterprises Ltd. | 34,857,393 | 140,467 |
| | ICICI Bank Ltd. ADR | 6,102,511 | 129,068 |
| | Housing Development Finance Corp. Ltd. | 2,771,240 | 105,658 |
| | Reliance Industries Ltd. | 2,794,101 | 94,818 |
| | Adani Ports & Special Economic Zone Ltd. | 9,949,697 | 92,293 |
| | Ambuja Cements Ltd. | 11,248,619 | 60,959 |
| | UPL Ltd. | 5,487,454 | 54,402 |
| | | | | | Shares | Market
Value•
($000) |
| | GAIL India Ltd. | 18,495,776 | 36,803 |
| | Maruti Suzuki India Ltd. | 181,100 | 18,133 |
| | | | | | | 732,601 |
| Indonesia (2.0%) |
| | Bank Mandiri Persero Tbk. PT | 228,226,600 | 115,385 |
| | Astra International Tbk. PT | 237,360,700 | 101,095 |
| | Telkom Indonesia Persero Tbk. PT ADR | 1,569,111 | 41,252 |
| | Telkom Indonesia Persero Tbk. PT | 79,051,800 | 21,129 |
| | Selamat Sempurna Tbk. PT | 164,317,700 | 18,443 |
| | | | | | | 297,304 |
| Ireland (1.1%) |
| * | Ryanair Holdings plc ADR | 820,077 | 93,087 |
| | CRH plc | 1,695,125 | 81,118 |
| | | | | | | 174,205 |
| Israel (0.1%) |
| * | Check Point Software Technologies Ltd. | 92,500 | 11,063 |
| Italy (1.6%) |
| | UniCredit SpA | 7,615,187 | 100,668 |
| | Enel SpA | 10,658,385 | 89,230 |
| | Brembo SpA | 4,513,767 | 59,287 |
| | | | | | | 249,185 |
| Japan (10.2%) |
| | Hitachi Ltd. | 2,208,800 | 127,281 |
| | Denso Corp. | 1,543,400 | 111,889 |
| | Toyota Motor Corp. | 6,161,500 | 108,715 |
| | Shimano Inc. | 346,900 | 96,790 |
| | Nitto Denko Corp. | 1,061,900 | 82,977 |
| | Mitsubishi Electric Corp. | 5,823,700 | 78,209 |
| | Makita Corp. | 1,678,300 | 77,893 |
| | Subaru Corp. | 3,941,300 | 77,308 |
| | ITOCHU Corp. | 2,644,600 | 75,426 |
| | Kubota Corp. | 3,364,800 | 71,680 |
| | Fujitsu Ltd. | 367,300 | 63,480 |
| | Daiwa House Industry Co. Ltd. | 1,831,600 | 60,425 |
| | Ryohin Keikaku Co. Ltd. | 2,975,400 | 58,634 |
| | Daito Trust Construction Co. Ltd. | 400,000 | 49,594 |
| | Suzuki Motor Corp. | 1,065,200 | 47,505 |
| | Komatsu Ltd. | 1,620,200 | 42,435 |
| | Ain Holdings Inc. | 695,900 | 41,075 |
| | Nihon Kohden Corp. | 1,270,300 | 40,420 |
| | Koito Manufacturing Co. Ltd. | 679,400 | 38,548 |
| | Seven & i Holdings Co. Ltd. | 913,600 | 38,357 |
| | | | | | Shares | Market
Value•
($000) |
| | Daiwa Securities Group Inc. | 6,729,700 | 37,809 |
| | Nomura Holdings Inc. | 7,414,800 | 35,313 |
| | Taiheiyo Cement Corp. | 1,542,500 | 32,772 |
| | Omron Corp. | 295,500 | 28,260 |
| | FANUC Corp. | 84,200 | 16,640 |
| * | Japan Airlines Co. Ltd. | 570,600 | 12,280 |
| | | | | | | 1,551,715 |
| Mexico (0.6%) |
| | Grupo Financiero Banorte SAB de CV | 13,722,800 | 86,884 |
| Netherlands (4.5%) |
| | Koninklijke DSM NV | 475,908 | 103,976 |
| * | AerCap Holdings NV | 1,599,553 | 94,438 |
| | Akzo Nobel NV | 800,185 | 91,955 |
| | Universal Music Group NV | 2,943,881 | 85,469 |
| | Wolters Kluwer NV | 730,425 | 76,489 |
| 1 | ABN AMRO Bank NV | 4,225,815 | 62,152 |
| 2 | Aegon NV | 11,416,922 | 57,910 |
| | SBM Offshore NV | 3,345,160 | 52,814 |
| | Boskalis Westminster | 1,215,456 | 36,250 |
| | Koninklijke Vopak NV | 672,450 | 26,762 |
| | | | | | | 688,215 |
| Norway (1.5%) |
| | Telenor ASA | 3,748,383 | 59,226 |
| | Yara International ASA | 1,098,600 | 57,416 |
| | Equinor ASA | 2,136,989 | 54,148 |
| | Bakkafrost P/F | 347,230 | 32,120 |
| | TGS ASA | 2,341,400 | 21,594 |
| | | | | | | 224,504 |
| Philippines (0.1%) |
| | Puregold Price Club Inc. | 24,445,700 | 20,482 |
| Singapore (1.8%) |
| | United Overseas Bank Ltd. | 4,494,100 | 89,335 |
| | DBS Group Holdings Ltd. | 2,864,300 | 66,933 |
| | Singapore Telecommunications Ltd. | 32,195,000 | 59,729 |
| | Sembcorp Industries Ltd. | 21,565,100 | 32,185 |
| * | SATS Ltd. | 7,461,600 | 23,207 |
| | | | | | | 271,389 |
| South Africa (0.6%) |
| | Tiger Brands Ltd. | 4,147,134 | 52,499 |
| | Mr Price Group Ltd. | 3,454,864 | 45,088 |
| | | | | | | 97,587 |
| South Korea (4.4%) |
| | POSCO | 654,918 | 166,108 |
| 1 | Samsung Electronics Co. Ltd. GDR | 88,460 | 132,454 |
| | | | | | Shares | Market
Value•
($000) |
| | Samsung Electronics Co. Ltd. | 1,783,926 | 106,809 |
| | SK Hynix Inc. | 901,002 | 79,424 |
| | KB Financial Group Inc. | 926,366 | 44,840 |
| | LG Household & Health Care Ltd. | 42,621 | 42,659 |
| 3 | SK Telecom Co. Ltd. | 157,480 | 41,699 |
| | Hana Financial Group Inc. | 984,207 | 37,951 |
| | Samsung SDS Co. Ltd. | 98,576 | 12,957 |
| | | | | | | 664,901 |
| Spain (0.5%) |
| 2 | Industria de Diseno Textil SA | 2,114,877 | 76,610 |
| Sweden (0.8%) |
| | Sandvik AB | 3,097,556 | 78,550 |
| | Boliden AB | 1,078,938 | 38,037 |
| | | | | | | 116,587 |
| Switzerland (5.9%) |
| | Novartis AG (Registered) | 2,089,393 | 172,819 |
| * | Holcim Ltd. | 3,050,795 | 152,182 |
| | Cie Financiere Richemont SA (Registered) | 1,213,774 | 150,205 |
| | ABB Ltd. (Registered) | 4,359,923 | 144,240 |
| | UBS Group AG (Registered) | 4,743,711 | 86,348 |
| * | ams AG | 3,610,895 | 71,490 |
| | Swatch Group AG | 172,170 | 47,389 |
| | Credit Suisse Group AG (Registered) | 3,708,173 | 38,571 |
| | Adecco Group AG (Registered) | 563,472 | 28,388 |
| | | | | | | 891,632 |
| Taiwan (0.8%) |
| | Taiwan Semiconductor Manufacturing Co. Ltd. | 5,702,000 | 120,998 |
| United Kingdom (15.9%) |
| | RELX plc | 5,288,916 | 163,996 |
| | BP plc | 32,198,290 | 154,259 |
| | Anglo American plc | 3,590,551 | 136,595 |
| * | Compass Group plc | 5,174,728 | 109,811 |
| | Lloyds Banking Group plc | 131,900,474 | 90,270 |
| | IMI plc | 3,952,110 | 88,258 |
| | Ferguson plc | 580,278 | 87,311 |
| | HSBC Holdings plc | 14,415,035 | 86,853 |
| | Smiths Group plc | 4,491,600 | 83,400 |
| | Berkeley Group Holdings plc | 1,391,306 | 82,989 |
| | Tesco plc | 22,333,913 | 82,463 |
| | Royal Dutch Shell plc Class B | 3,513,100 | 80,621 |
| | | | | | Shares | Market
Value•
($000) |
| | Unilever plc | 1,490,191 | 79,788 |
| | Prudential plc | 3,799,635 | 77,543 |
| | NatWest Group plc | 25,598,209 | 77,183 |
| | Travis Perkins plc | 3,605,173 | 76,216 |
| | HSBC Holdings plc (XHKG) | 12,610,800 | 75,917 |
| | Weir Group plc | 2,919,970 | 69,264 |
| | Spectris plc | 1,311,030 | 67,455 |
| | Taylor Wimpey plc | 31,590,164 | 66,839 |
| | Barclays plc | 22,983,048 | 63,421 |
| | Johnson Matthey plc | 1,649,930 | 61,667 |
| | Victrex plc | 1,919,086 | 60,011 |
| | BHP Group plc | 2,099,850 | 55,460 |
| * | easyJet plc | 6,237,379 | 53,168 |
| | abrdn plc | 14,767,485 | 51,333 |
| * | Carnival plc | 1,920,530 | 38,767 |
| | Imperial Brands plc | 1,818,229 | 38,367 |
| | British American Tobacco plc | 1,002,868 | 34,884 |
| | Electrocomponents plc | 1,917,650 | 29,504 |
| * | Whitbread plc | 653,543 | 29,238 |
| | Diageo plc | 509,580 | 25,353 |
| | Direct Line Insurance Group plc | 5,893,481 | 23,556 |
| | Pearson plc | 1,547,379 | 12,733 |
| | Wickes Group plc | 3,666,180 | 10,789 |
| | | | | | | 2,425,282 |
| United States (4.2%) |
| | Aon plc Class A | 416,728 | 133,319 |
| | Accenture plc Class A | 333,713 | 119,733 |
| | Medtronic plc | 937,926 | 112,420 |
| * | Copa Holdings SA Class A | 1,107,600 | 81,918 |
| * | Capri Holdings Ltd. | 1,282,834 | 68,298 |
| * | TechnipFMC plc | 5,940,838 | 43,784 |
| | JBS SA | 6,226,700 | 43,083 |
| | RenaissanceRe Holdings Ltd. | 260,654 | 36,961 |
| | | | | | | 639,516 |
Total Common Stocks
(Cost $11,983,670) | 14,273,605 |
| | | | | | Shares | Market
Value•
($000) |
| Temporary Cash Investments (6.3%) |
| Money Market Fund (6.3%) |
| 4,5 | Vanguard Market Liquidity Fund, 0.070%(Cost $961,591) | 9,616,444 | 961,644 |
Total Investments (100.1%)
(Cost $12,945,261) | | 15,235,249 |
| Other Assets and Liabilities—Net (-0.1%) | | (16,078) |
| Net Assets (100%) | | 15,219,171 |
| Cost is in $000. |
| • | See Note A in Notes to Financial Statements. |
| * | Non-income-producing security. |
| 1 | Security exempt from registration under Rule 144A of the Securities Act of 1933. Such securities may be sold in transactions exempt from registration, normally to qualified institutional buyers. At October 31, 2021, the aggregate value was $268,864,000, representing 1.8% of net assets. |
| 2 | Includes partial security positions on loan to broker-dealers. The total value of securities on loan is $32,226,000. |
| 3 | Security value determined using significant unobservable inputs. |
| 4 | Affiliated money market fund available only to Vanguard funds and certain trusts and accounts managed by Vanguard. Rate shown is the 7-day yield. |
| 5 | Collateral of $78,038,000 was received for securities on loan. |
| | ADR—American Depositary Receipt. |
| | GDR—Global Depositary Receipt. |
Derivative Financial Instruments Outstanding as of Period End
| Futures Contracts |
| | | | ($000) |
| | Expiration | Number of
Long (Short)
Contracts | Notional
Amount | Value and
Unrealized
Appreciation
(Depreciation) |
| Long Futures Contracts |
| MSCI EAFE Index | December 2021 | 2,488 | 291,046 | (561) |
| MSCI Emerging Market Index | December 2021 | 1,969 | 124,244 | (2,093) |
| | | | | (2,654) |
See accompanying Notes, which are an integral part of the Financial Statements.
Statement of Assets and Liabilities
|
| ($000s, except shares and per-share amounts) | Amount |
| Assets | |
| Investments in Securities, at Value | |
| Unaffiliated Issuers (Cost $11,983,670) | 14,273,605 |
| Affiliated Issuers (Cost $961,591) | 961,644 |
| Total Investments in Securities | 15,235,249 |
| Investment in Vanguard | 500 |
| Cash | 4,687 |
| Foreign Currency, at Value (Cost $3,657) | 3,559 |
| Cash Collateral Pledged—Futures Contracts | 21,752 |
| Receivables for Investment Securities Sold | 26,776 |
| Receivables for Accrued Income | 51,513 |
| Receivables for Capital Shares Issued | 23,866 |
| Total Assets | 15,367,902 |
| Liabilities | |
| Payables for Investment Securities Purchased | 31,297 |
| Collateral for Securities on Loan | 78,038 |
| Payables for Capital Shares Redeemed | 7,388 |
| Payables to Investment Advisor | 5,685 |
| Payables to Vanguard | 1,404 |
| Variation Margin Payable—Futures Contracts | 3,429 |
| Deferred Foreign Capital Gains Taxes | 21,490 |
| Total Liabilities | 148,731 |
| Net Assets | 15,219,171 |
At October 31, 2021, net assets consisted of: |
|
| | |
| Paid-in Capital | 12,389,948 |
| Total Distributable Earnings (Loss) | 2,829,223 |
| Net Assets | 15,219,171 |
| | |
| Net Assets | |
Applicable to 347,818,409 outstanding $.001 par value shares of
beneficial interest (unlimited authorization) | 15,219,171 |
| Net Asset Value Per Share | $43.76 |
See accompanying Notes, which are an integral part of the Financial Statements.
|
| | Year Ended
October 31, 2021 |
| | ($000) |
| Investment Income | |
| Income | |
| Dividends1 | 390,731 |
| Interest2 | 609 |
| Securities Lending—Net | 8,529 |
| Total Income | 399,869 |
| Expenses | |
| Investment Advisory Fees—Note B | |
| Basic Fee | 22,029 |
| Performance Adjustment | (2,057) |
| The Vanguard Group—Note C | |
| Management and Administrative | 27,170 |
| Marketing and Distribution | 781 |
| Custodian Fees | 592 |
| Auditing Fees | 48 |
| Shareholders’ Reports | 171 |
| Trustees’ Fees and Expenses | 8 |
| Total Expenses | 48,742 |
| Net Investment Income | 351,127 |
| Realized Net Gain (Loss) | |
| Investment Securities Sold2,3 | 853,889 |
| Futures Contracts | 46,859 |
| Forward Currency Contracts | (42) |
| Foreign Currencies | (3,275) |
| Realized Net Gain (Loss) | 897,431 |
| Change in Unrealized Appreciation (Depreciation) | |
| Investment Securities2,4 | 2,271,975 |
| Futures Contracts | 4,152 |
| Foreign Currencies | (691) |
| Change in Unrealized Appreciation (Depreciation) | 2,275,436 |
| Net Increase (Decrease) in Net Assets Resulting from Operations | 3,523,994 |
| 1 | Dividends are net of foreign withholding taxes of $41,973,000. |
| 2 | Interest income, realized net gain (loss), and change in unrealized appreciation (depreciation) from an affiliated company of the fund were $599,000, $9,000, and ($8,000), respectively. Purchases and sales are for temporary cash investment purposes. |
| 3 | Realized Gain (Loss) is net of foreign capital gains taxes of $5,361,000. |
| 4 | The change in unrealized appreciation (depreciation) is net of the change in deferred foreign capital gains taxes of $21,490,000. |
See accompanying Notes, which are an integral part of the Financial Statements.
Statement of Changes in Net Assets
|
| | Year Ended October 31, |
| | 2021
($000) | 2020
($000) |
| Increase (Decrease) in Net Assets | | |
| Operations | | |
| Net Investment Income | 351,127 | 197,302 |
| Realized Net Gain (Loss) | 897,431 | (495,757) |
| Change in Unrealized Appreciation (Depreciation) | 2,275,436 | (550,940) |
| Net Increase (Decrease) in Net Assets Resulting from Operations | 3,523,994 | (849,395) |
| Distributions | | |
| Total Distributions | (189,189) | (308,988) |
| Capital Share Transactions | | |
| Issued | 4,442,988 | 2,047,882 |
| Issued in Lieu of Cash Distributions | 173,403 | 283,820 |
| Redeemed | (2,140,447) | (2,125,218) |
| Net Increase (Decrease) from Capital Share Transactions | 2,475,944 | 206,484 |
| Total Increase (Decrease) | 5,810,749 | (951,899) |
| Net Assets | | |
| Beginning of Period | 9,408,422 | 10,360,321 |
| End of Period | 15,219,171 | 9,408,422 |
See accompanying Notes, which are an integral part of the Financial Statements.
For a Share Outstanding
Throughout Each Period | Year Ended October 31, |
| 2021 | 2020 | 2019 | 2018 | 2017 |
| Net Asset Value, Beginning of Period | $32.48 | $36.63 | $35.86 | $39.26 | $32.30 |
| Investment Operations | | | | | |
| Net Investment Income1 | 1.091 | .684 | 1.104 | .950 | .781 |
| Net Realized and Unrealized Gain (Loss) on Investments | 10.824 | (3.723) | 1.669 | (3.607) | 6.905 |
| Total from Investment Operations | 11.915 | (3.039) | 2.773 | (2.657) | 7.686 |
| Distributions | | | | | |
| Dividends from Net Investment Income | (.635) | (1.111) | (.943) | (.743) | (.726) |
| Distributions from Realized Capital Gains | — | — | (1.060) | — | — |
| Total Distributions | (.635) | (1.111) | (2.003) | (.743) | (.726) |
| Net Asset Value, End of Period | $43.76 | $32.48 | $36.63 | $35.86 | $39.26 |
| Total Return2 | 36.91% | -8.69% | 8.48% | -6.95% | 24.33% |
| Ratios/Supplemental Data | | | | | |
| Net Assets, End of Period (Millions) | $15,219 | $9,408 | $10,360 | $9,524 | $9,964 |
| Ratio of Total Expenses to Average Net Assets3 | 0.36% | 0.35% | 0.37% | 0.38% | 0.40% |
| Ratio of Net Investment Income to Average Net Assets | 2.56% | 2.05% | 3.15% | 2.41% | 2.21% |
| Portfolio Turnover Rate | 33% | 72% | 38% | 28% | 34% |
| 1 | Calculated based on average shares outstanding. |
| 2 | Total returns do not include account service fees that may have applied in the periods shown. Fund prospectuses provide information about any applicable account service fees. |
| 3 | Includes performance-based investment advisory fee increases (decreases) of (0.01%), (0.02%), (0.01%), (0.01%), and 0.00%. |
See accompanying Notes, which are an integral part of the Financial Statements.
Notes to Financial Statements
Vanguard International Value Fund is registered under the Investment Company Act of 1940 as an open-end investment company, or mutual fund. The fund invests in securities of foreign issuers, which may subject it to investment risks not normally associated with investing in securities of U.S. corporations. Market disruptions associated with the COVID-19 pandemic have had a global impact, and uncertainty exists as to the long-term implications. Such disruptions can adversely affect assets of the fund and thus fund performance.
A. The following significant accounting policies conform to generally accepted accounting principles for U.S. investment companies. The fund consistently follows such policies in preparing its financial statements.
1. Security Valuation: Securities are valued as of the close of trading on the New York Stock Exchange (generally 4 p.m., Eastern time) on the valuation date. Equity securities are valued at the latest quoted sales prices or official closing prices taken from the primary market in which each security trades; such securities not traded on the valuation date are valued at the mean of the latest quoted bid and asked prices. Securities for which market quotations are not readily available, or whose values have been affected by events occurring before the fund’s pricing time but after the close of the securities’ primary markets, are valued at their fair values calculated according to procedures adopted by the board of trustees. These procedures include obtaining quotations from an independent pricing service, monitoring news to identify significant market- or security-specific events, and evaluating changes in the values of foreign market proxies (for example, ADRs, futures contracts, or exchange-traded funds), between the time the foreign markets close and the fund’s pricing time. When fair-value pricing is employed, the prices of securities used by a fund to calculate its net asset value may differ from quoted or published prices for the same securities.
Investments in Vanguard Market Liquidity Fund are valued at that fund's net asset value.
Temporary cash investments are valued using the latest bid prices or using valuations based on a matrix system (which considers such factors as security prices, yields, maturities, and ratings), both as furnished by independent pricing services.
2. Foreign Currency: Securities and other assets and liabilities denominated in foreign currencies are translated into U.S. dollars using exchange rates obtained from an independent third party as of the fund’s pricing time on the valuation date. Realized gains (losses) and unrealized appreciation (depreciation) on investment securities include the effects of changes in exchange rates since the securities were purchased, combined with the effects of changes in security prices. Fluctuations in the value of other assets and liabilities resulting from changes in exchange rates are recorded as unrealized foreign currency gains (losses) until the assets or liabilities are settled in cash, at which time they are recorded as realized foreign currency gains (losses).
3. Futures Contracts: The fund uses index futures contracts to a limited extent, with the objective of maintaining full exposure to the stock market while maintaining liquidity. The fund may purchase or sell futures contracts to achieve a desired level of investment, whether to accommodate portfolio turnover or cash flows from capital share transactions. The primary risks associated with the use of futures contracts are imperfect correlation between changes in market values of stocks held by the fund and the prices of futures contracts, and the possibility of an illiquid market. Counterparty risk involving futures is mitigated because a regulated clearinghouse is the counterparty instead of the clearing broker. To further mitigate counterparty risk, the fund trades futures contracts on an exchange, monitors the financial strength of its clearing brokers and clearinghouse, and has entered into clearing agreements with its clearing brokers. The
clearinghouse imposes initial margin requirements to secure the fund’s performance and requires daily settlement of variation margin representing changes in the market value of each contract. Any securities pledged as initial margin for open contracts are noted in the Schedule of Investments.
Futures contracts are valued at their quoted daily settlement prices. The notional amounts of the contracts are not recorded in the Statement of Assets and Liabilities. Fluctuations in the value of the contracts are recorded in the Statement of Assets and Liabilities as an asset (liability) and in the Statement of Operations as unrealized appreciation (depreciation) until the contracts are closed, when they are recorded as realized gains (losses) on futures contracts.
During the year ended October 31, 2021, the fund’s average investments in long and short futures contracts represented 2% and 0% of net assets, respectively, based on the average of the notional amounts at each quarter-end during the period.
4. Forward Currency Contracts: The fund enters into forward currency contracts to protect the value of securities and related receivables and payables against changes in future foreign exchange rates. The fund’s risks in using these contracts include movement in the values of the foreign currencies relative to the U.S. dollar and the ability of the counterparties to fulfill their obligations under the contracts. The fund mitigates its counterparty risk by entering into forward currency contracts only with a diverse group of prequalified counterparties, monitoring their financial strength, entering into master netting arrangements with its counterparties, and requiring its counterparties to transfer collateral as security for their performance. In the absence of a default, the collateral pledged or received by the fund cannot be repledged, resold, or rehypothecated. The master netting arrangements provide that, in the event of a counterparty’s default (including bankruptcy), the fund may terminate the forward currency contracts, determine the net amount owed by either party in accordance with its master netting arrangements, and sell or retain any collateral held up to the net amount owed to the fund under the master netting arrangements. The forward currency contracts contain provisions whereby a counterparty may terminate open contracts if the fund’s net assets decline below a certain level, triggering a payment by the fund if the fund is in a net liability position at the time of the termination. The payment amount would be reduced by any collateral the fund has pledged. Any securities pledged as collateral for open contracts are noted in the Schedule of Investments. The value of collateral received or pledged is compared daily to the value of the forward currency contracts exposure with each counterparty, and any difference, if in excess of a specified minimum transfer amount, is adjusted and settled within two business days.
Forward currency contracts are valued at their quoted daily prices obtained from an independent third party, adjusted for currency risk based on the expiration date of each contract. The notional amounts of the contracts are not recorded in the Statement of Assets and Liabilities. Fluctuations in the value of the contracts are recorded in the Statement of Assets and Liabilities as an asset (liability) and in the Statement of Operations as unrealized appreciation (depreciation) until the contracts are closed, when they are recorded as realized gains (losses) on forward currency contracts.
During the year ended October 31, 2021, the fund’s average investment in forward currency contracts represented less than 1% of net assets, based on the average of the notional amounts at each quarter-end during the period. The fund had no open forward currency contracts at October 31, 2021.
5. Federal Income Taxes: The fund intends to continue to qualify as a regulated investment company and distribute all of its taxable income. The fund’s tax returns are open to examination by the relevant tax authorities until expiration of the applicable statute of limitations, which is generally three years after the filing of the tax return. Management has analyzed the fund’s tax positions taken for all open federal and state income tax years, and has concluded that no provision for income tax is required in the fund’s financial statements.
6. Distributions: Distributions to shareholders are recorded on the ex-dividend date. Distributions are determined on a tax basis at the fiscal year-end and may differ from net investment income and realized capital gains for financial reporting purposes.
7. Securities Lending: To earn additional income, the fund lends its securities to qualified institutional borrowers. Security loans are subject to termination by the fund at any time, and are required to be secured at all times by collateral in an amount at least equal to the market value of securities loaned. Daily market fluctuations could cause the value of loaned securities to be more or less than the value of the collateral received. When this occurs, the collateral is adjusted and settled before the opening of the market on the next business day. The fund further mitigates its counterparty risk by entering into securities lending transactions only with a diverse group of prequalified counterparties, monitoring their financial strength, and entering into master securities lending agreements with its counterparties. The master securities lending agreements provide that, in the event of a counterparty’s default (including bankruptcy), the fund may terminate any loans with that borrower, determine the net amount owed, and sell or retain the collateral up to the net amount owed to the fund; however, such actions may be subject to legal proceedings. While collateral mitigates counterparty risk, in the event of a default, the fund may experience delays and costs in recovering the securities loaned. The fund invests cash collateral received in Vanguard Market Liquidity Fund, and records a liability in the Statement of Assets and Liabilities for the return of the collateral, during the period the securities are on loan. Collateral investments in Vanguard Market Liquidity Fund are subject to market appreciation or depreciation. Securities lending income represents fees charged to borrowers plus income earned on invested cash collateral, less expenses associated with the loan. During the term of the loan, the fund is entitled to all distributions made on or in respect of the loaned securities.
8. Credit Facilities and Interfund Lending Program: The fund and certain other funds managed by The Vanguard Group ("Vanguard") participate in a $4.3 billion committed credit facility provided by a syndicate of lenders pursuant to a credit agreement and an uncommitted credit facility provided by Vanguard. Both facilities may be renewed annually. Each fund is individually liable for its borrowings, if any, under the credit facilities. Borrowings may be utilized for temporary or emergency purposes, subject to the fund’s regulatory and contractual borrowing restrictions. With respect to the committed credit facility, the participating funds are charged administrative fees and an annual commitment fee of 0.10% of the undrawn committed amount of the facility; these fees are allocated to the funds based on a method approved by the fund’s board of trustees and included in Management and Administrative expenses on the fund’s Statement of Operations. Any borrowings under either facility bear interest at a rate based upon the higher of the one-month London Interbank Offered Rate (or an acceptable alternate rate, if necessary), federal funds effective rate, or overnight bank funding rate plus an agreed-upon spread, except that borrowings under the uncommitted credit facility may bear interest based upon an alternative rate agreed to by the fund and Vanguard.
In accordance with an exemptive order (the “Order”) from the SEC, the fund may participate in a joint lending and borrowing program that allows registered open-end Vanguard funds to borrow
money from and lend money to each other for temporary or emergency purposes (the “Interfund Lending Program”), subject to compliance with the terms and conditions of the Order, and to the extent permitted by the fund’s investment objective and investment policies. Interfund loans and borrowings normally extend overnight, but can have a maximum duration of seven days. Loans may be called on one business day’s notice. The interest rate to be charged is governed by the conditions of the Order and internal procedures adopted by the board of trustees. The board of trustees is responsible for overseeing the Interfund Lending Program.
For the year ended October 31, 2021, the fund did not utilize the credit facilities or the Interfund Lending Program.
9. Other: Dividend income is recorded on the ex-dividend date. Non-cash dividends included in income, if any, are recorded at the fair value of the securities received. Interest income includes income distributions received from Vanguard Market Liquidity Fund and is accrued daily. Premiums and discounts on debt securities are amortized and accreted, respectively, to interest income over the lives of the respective securities, except for premiums on certain callable debt securities that are amortized to the earliest call date. Security transactions are accounted for on the date securities are bought or sold. Costs used to determine realized gains (losses) on the sale of investment securities are those of the specific securities sold.
Taxes on foreign dividends and capital gains have been provided for in accordance with the fund’s understanding of the applicable countries’ tax rules and rates. Deferred foreign capital gains tax, if any, is accrued daily based upon applicable net unrealized gains. The fund has filed tax reclaims for previously withheld taxes on dividends earned in certain European Union countries. These filings are subject to various administrative and judicial proceedings within these countries. Such tax reclaims received during the year, if any, are included in dividend income. No other amounts for additional tax reclaims are reflected in the financial statements due to the uncertainty as to the ultimate resolution of proceedings, the likelihood of receipt of these reclaims, and the potential timing of payment.
B. The investment advisory firms Lazard Asset Management LLC, ARGA Investment Management, LP, and Sprucegrove Investment Management Ltd. each provide investment advisory services to a portion of the fund for a fee calculated at an annual percentage rate of average net assets managed by the advisor. The basic fees of Lazard Asset Management LLC and ARGA Investment Management, LP, are subject to quarterly adjustments based on performance relative to the MSCI All Country World Index ex US for the preceding five years. In accordance with the advisory contract entered into with Sprucegrove Investment Management Ltd., beginning November 1, 2021, the investment advisory fee will be subject to quarterly adjustments based on performance relative to the MSCI All Country World Index ex US.
Vanguard manages the cash reserves of the fund as described below.
For the year ended October 31, 2021, the aggregate investment advisory fee represented an effective annual basic rate of 0.16% of the fund’s average net assets, before a decrease of $2,057,000 (0.01%) based on performance.
C. In accordance with the terms of a Funds’ Service Agreement (the “FSA”) between Vanguard and the fund, Vanguard furnishes to the fund corporate management, administrative, marketing, distribution, and cash management services at Vanguard’s cost of operations (as defined by the FSA). These costs of operations are allocated to the fund based on methods and guidelines approved by the board of trustees and are generally settled twice a month.
Upon the request of Vanguard, the fund may invest up to 0.40% of its net assets as capital in Vanguard. At October 31, 2021, the fund had contributed to Vanguard capital in the amount of $500,000, representing less than 0.01% of the fund’s net assets and 0.20% of Vanguard’s capital received pursuant to the FSA. The fund’s trustees and officers are also directors and employees, respectively, of Vanguard.
D. Various inputs may be used to determine the value of the fund’s investments and derivatives. These inputs are summarized in three broad levels for financial statement purposes. The inputs or methodologies used to value securities are not necessarily an indication of the risk associated with investing in those securities.
Level 1—Quoted prices in active markets for identical securities.
Level 2—Other significant observable inputs (including quoted prices for similar securities, interest rates, prepayment speeds, credit risk, etc.).
Level 3—Significant unobservable inputs (including the fund’s own assumptions used to determine the fair value of investments). Any investments and derivatives valued with significant unobservable inputs are noted on the Schedule of Investments.
The following table summarizes the market value of the fund's investments and derivatives as of October 31, 2021, based on the inputs used to value them:
| | Level 1
($000) | Level 2
($000) | Level 3
($000) | Total
($000) |
| Investments | | | | |
| Assets | | | | |
| Common Stocks—North and South America | 1,531,401 | — | — | 1,531,401 |
| Common Stocks—Other | 625,003 | 12,075,502 | 41,699 | 12,742,204 |
| Temporary Cash Investments | 961,644 | — | — | 961,644 |
| Total | 3,118,048 | 12,075,502 | 41,699 | 15,235,249 |
| | | | |
| Derivative Financial Instruments | | | | |
| Liabilities | | | | |
| Futures Contracts1 | 2,654 | — | — | 2,654 |
| 1 | Includes cumulative appreciation (depreciation) on futures contracts and centrally cleared swaps, if any, as reported in the Schedule of Investments. Only current day’s variation margin is reported within the Statement of Assets and Liabilities. |
E. Realized net gain (loss) and the change in unrealized appreciation (depreciation) on derivatives for the year ended October 31, 2021, were:
| Realized Net Gain (Loss) on Derivatives | Equity
Contracts
($000) | Foreign
Exchange
Contracts
($000) | Total
($000) |
| Futures Contracts | 46,859 | — | 46,859 |
| Forward Currency Contracts | — | (42) | (42) |
| Realized Net Gain (Loss) on Derivatives | 46,859 | (42) | 46,817 |
| |
| Change in Unrealized Appreciation (Depreciation) on Derivatives |
| Futures Contracts | 4,152 | — | 4,152 |
| Forward Currency Contracts | — | — | — |
| Change in Unrealized Appreciation (Depreciation) on Derivatives | 4,152 | — | 4,152 |
F. Permanent differences between book-basis and tax-basis components of net assets are reclassified among capital accounts in the financial statements to reflect their tax character. These reclassifications have no effect on net assets or net asset value per share. As of period end, permanent differences primarily attributable to the accounting for foreign currency transactions, distributions in connection with fund share redemptions, corporate actions and tax expense on capital gains were reclassified between the following accounts:
| | Amount
($000) |
| Paid-in Capital | 14,191 |
| Total Distributable Earnings (Loss) | (14,191) |
Temporary differences between book-basis and tax-basis components of total distributable earnings (loss) arise when certain items of income, gain, or loss are recognized in different periods for financial statement and tax purposes; these differences will reverse at some time in the future. The differences are primarily related to the deferral of losses from wash sales; and the recognition of unrealized gains or losses from certain derivative contracts. As of period end, the tax-basis components of total distributable earnings (loss) are detailed in the table as follows:
| | Amount
($000) |
| Undistributed Ordinary Income | 579,569 |
| Undistributed Long-Term Gains | — |
| Capital Loss Carryforwards | — |
| Qualified Late-Year Losses | — |
| Net Unrealized Gains (Losses) | 2,249,654 |
The tax character of distributions paid was as follows:
| | Year Ended October 31, |
| | 2021
Amount
($000) | 2020
Amount
($000) |
| Ordinary Income* | 189,189 | 308,988 |
| Long-Term Capital Gains | — | — |
| Total | 189,189 | 308,988 |
| * | Includes short-term capital gains, if any. |
As of October 31, 2021, gross unrealized appreciation and depreciation for investments and derivatives based on cost for U.S. federal income tax purposes were as follows:
| | Amount
($000) |
| Tax Cost | 12,964,540 |
| Gross Unrealized Appreciation | 2,904,499 |
| Gross Unrealized Depreciation | (633,790) |
| Net Unrealized Appreciation (Depreciation) | 2,270,709 |
G. During the year ended October 31, 2021, the fund purchased $6,550,285,000 of investment securities and sold $4,236,262,000 of investment securities, other than temporary cash investments.
H. Capital shares issued and redeemed were:
| | Year Ended October 31, | |
| | 2021
Shares
(000) | | 2020
Shares
(000) | |
| | | |
| Issued | 104,505 | | 64,897 | |
| Issued in Lieu of Cash Distributions | 4,428 | | 7,593 | |
| Redeemed | (50,767) | | (65,710) | |
| Net Increase (Decrease) in Shares Outstanding | 58,166 | | 6,780 | |
I. Management has determined that no events or transactions occurred subsequent to October 31, 2021, that would require recognition or disclosure in these financial statements.
Report of Independent Registered
Public Accounting Firm
To the Board of Trustees of Vanguard Trustees' Equity Fund and Shareholders of Vanguard International Value Fund
Opinions on the Financial Statements
We have audited the accompanying statement of assets and liabilities, including the schedule of investments, of Vanguard International Value Fund (one of the funds constituting Vanguard Trustees' Equity Fund, referred to hereafter as the "Fund") as of October 31, 2021, the related statement of operations for the year ended October 31, 2021, the statement of changes in net assets for each of the two years in the period ended October 31, 2021, including the related notes, and the financial highlights for each of the five years in the period ended October 31, 2021 (collectively referred to as the "financial statements"). In our opinion, the financial statements present fairly, in all material respects, the financial position of the Fund as of October 31, 2021, the results of its operations for the year then ended, the changes in its net assets for each of the two years in the period ended October 31, 2021 and the financial highlights for each of the five years in the period ended October 31, 2021 in conformity with accounting principles generally accepted in the United States of America.
Basis for Opinion
These financial statements are the responsibility of the Fund’s management. Our responsibility is to express an opinion on the Fund’s financial statements based on our audits. We are a public accounting firm registered with the Public Company Accounting Oversight Board (United States) (PCAOB) and are required to be independent with respect to the Fund in accordance with the U.S. federal securities laws and the applicable rules and regulations of the Securities and Exchange Commission and the PCAOB.
We conducted our audits of these financial statements in accordance with the standards of the PCAOB. Those standards require that we plan and perform the audit to obtain reasonable assurance about whether the financial statements are free of material misstatement, whether due to error or fraud.
Our audits included performing procedures to assess the risks of material misstatement of the financial statements, whether due to error or fraud, and performing procedures that respond to those risks. Such procedures included examining, on a test basis, evidence regarding the amounts and disclosures in the financial statements. Our audits also included evaluating the accounting principles used and significant estimates made by management, as well as evaluating the overall presentation of the financial statements. Our procedures included confirmation of securities owned as of October 31, 2021 by correspondence with the custodian, transfer agent and brokers; when replies were not received from the transfer agent or brokers, we performed other auditing procedures. We believe that our audits provide a reasonable basis for our opinion.
/s/PricewaterhouseCoopers LLP
Philadelphia, Pennsylvania
December 17, 2021
We have served as the auditor of one or more investment companies in The Vanguard Group of Funds since 1975.
Special 2021 tax information (unaudited) for Vanguard International Value Fund
This information for the fiscal year ended October 31, 2021, is included pursuant to provisions of the Internal Revenue Code.
For nonresident alien shareholders, 100% of short-term capital gain dividends distributed by the fund are qualified short-term capital gains.
The fund distributed $159,903,000 of qualified dividend income to shareholders during the fiscal year.
The fund designates to shareholders foreign source income of $450,078,000 and foreign taxes paid of $44,316,000. Shareholders will receive more detailed information with their Form 1099-DIV in January 2022 to determine the calendar-year amounts to be included on their 2021 tax returns.
This page intentionally left blank.
The People Who Govern Your Fund
The trustees of your mutual fund are there to see that the fund is operated and managed in your best interests since, as a shareholder, you are a part owner of the fund. Your fund’s trustees also serve on the board of directors of The Vanguard Group, Inc., which is owned by the Vanguard funds and provides services to them.
A majority of Vanguard’s board members are independent, meaning that they have no affiliation with Vanguard or the funds they oversee, apart from the sizable personal investments they have made as private individuals. The independent board members have distinguished backgrounds in business, academia, and public service. Each of the trustees and executive officers oversees 214 Vanguard funds.
Information for each trustee and executive officer of the fund appears below. That information, as well as the Vanguard fund count, is as of the date on the cover of this fund report. The mailing address of the trustees and officers is P.O. Box 876, Valley Forge, PA 19482. More information about the trustees is in the Statement of Additional Information, which can be obtained, without charge, by contacting Vanguard at 800-662-7447, or online at vanguard.com.
Interested Trustee1
Mortimer J. Buckley
Born in 1969. Trustee since January 2018. Principal occupation(s) during the past five years and other experience: chairman of the board (2019–present) of Vanguard and of each of the investment companies served by Vanguard; chief executive officer (2018–present) of Vanguard; chief executive officer, president, and trustee (2018–present) of each of the investment companies served by Vanguard; president and director (2017–present) of Vanguard; and president (2018–present) of Vanguard Marketing Corporation. Chief investment officer (2013–2017), managing director (2002–2017), head of the Retail Investor Group (2006–2012), and chief information officer (2001–2006) of Vanguard. Chairman of the board (2011–2017) and trustee (2009–2017) of the Children’s Hospital of Philadelphia; and trustee (2018–present) and vice chair (2019–present) of The Shipley School.
Independent Trustees
Emerson U. Fullwood
Born in 1948. Trustee since January 2008. Principal occupation(s) during the past five years and other experience: executive chief staff and marketing officer for North America and corporate vice president (retired 2008) of Xerox Corporation (document management products and services). Former president of the Worldwide Channels Group, Latin America, and Worldwide Customer Service and executive chief staff officer of Developing Markets of Xerox. Executive in residence and 2009–2010 Distinguished Minett Professor at the Rochester Institute of Technology. Director of SPX FLOW, Inc. (multi-industry manufacturing). Director of the University of Rochester Medical Center, the Monroe Community College Foundation, the United Way of Rochester, North Carolina A&T University, and Roberts Wesleyan College. Trustee of the University of Rochester.
Amy Gutmann
Born in 1949. Trustee since June 2006. Principal occupation(s) during the past five years and other experience: president (2004–present) of the University of Pennsylvania. Christopher H. Browne Distinguished Professor of Political Science, School of Arts and Sciences, and professor of communication, Annenberg School for Communication, with secondary faculty appointments in the Department of Philosophy, School of Arts and Sciences, and at the Graduate School of Education, University of Pennsylvania.
1 Mr. Buckley is considered an “interested person,” as defined in the Investment Company Act of 1940, because he is an officer of the Vanguard funds.
F. Joseph Loughrey
Born in 1949. Trustee since October 2009. Principal occupation(s) during the past five years and other experience: president and chief operating officer (retired 2009) and vice chairman of the board (2008–2009) of Cummins Inc. (industrial machinery). Chairman of the board of Hillenbrand, Inc. (specialized consumer services). Director of the V Foundation. Member of the advisory council for the College of Arts and Letters and chair of the advisory board to the Kellogg Institute for International Studies, both at the University of Notre Dame. Chairman of the board of Saint Anselm College.
Mark Loughridge
Born in 1953. Trustee since March 2012. Principal occupation(s) during the past five years and other experience: senior vice president and chief financial officer (retired 2013) of IBM (information technology services). Fiduciary member of IBM’s Retirement Plan Committee (2004–2013), senior vice president and general manager (2002–2004) of IBM Global Financing, vice president and controller (1998–2002) of IBM, and a variety of other prior management roles at IBM. Member of the Council on Chicago Booth.
Scott C. Malpass
Born in 1962. Trustee since March 2012. Principal occupation(s) during the past five years and other experience: chief investment officer (retired June 2020) and vice president (retired June 2020) of the University of Notre Dame. Assistant professor (retired June 2020) of finance at the Mendoza College of Business, University of Notre Dame, and member of the Notre Dame 403(b) Investment Committee. Member of the board of Catholic Investment Services, Inc. (investment advisors) and the board of superintendence of the Institute for the Works of Religion.
Deanna Mulligan
Born in 1963. Trustee since January 2018. Principal occupation(s) during the past five years and other experience: board chair (2020), chief executive officer (2011–2020), and president (2010–2019) of The Guardian Life Insurance Company of America. Chief operating officer (2010–2011) and executive vice president (2008–2010) of Individual Life and Disability of the Guardian Life Insurance Company of America. Member of the board of the Economic Club of New York. Trustee of the Partnership for New York City (business leadership), Chief Executives for Corporate Purpose, NewYork-Presbyterian Hospital, and the Bruce Museum (arts and science). Member of the Advisory Council for the Stanford Graduate School of Business.
André F. Perold
Born in 1952. Trustee since December 2004. Principal occupation(s) during the past five years and other experience: George Gund Professor of Finance and Banking, Emeritus at the Harvard Business School (retired 2011). Chief investment officer and co-managing partner of HighVista Strategies (private investment firm). Member of the board (2018–present) of RIT Capital Partners (investment firm). Member of the investment committee of Partners Health Care System.
Sarah Bloom Raskin
Born in 1961. Trustee since January 2018. Principal occupation(s) during the past five years and other experience: deputy secretary (2014–2017) of the United States Department of the Treasury. Governor (2010–2014) of the Federal Reserve Board. Commissioner (2007–2010) of financial regulation for the State of Maryland. Professor (2020–present), Distinguished Fellow of the Global Financial Markets Center (2020–present), and Rubenstein Fellow (2017–2020) at Duke University. Trustee (2017–present) of Amherst College and member of Amherst College Investment Committee (2019–present). Member of the Regenerative Crisis Response Committee (2020–present).
David A. Thomas
Born in 1956. Trustee since July 2021. Principal occupation(s) during the past five years and other experience: president of Morehouse College (2018–present). Professor of business administration, emeritus at Harvard University (2017–2018). Dean (2011–2016) and professor of management (2016–2017) at the Georgetown University McDonough School of Business. Director of DTE Energy Company (2013–present). Trustee of Common Fund (2019–present).
Peter F. Volanakis
Born in 1955. Trustee since July 2009. Principal occupation(s) during the past five years and other experience: president and chief operating officer (retired 2010) of Corning Incorporated (communications equipment) and director of Corning Incorporated (2000–2010) and Dow Corning (2001–2010). Director (2012) of SPX Corporation (multi-industry manufacturing). Overseer of the Amos Tuck School of Business Administration, Dartmouth College (2001–2013). Chairman of the board of trustees of Colby-Sawyer College. Member of the BMW Group Mobility Council.
Executive Officers
Christine M. Buchanan
Born in 1970. Principal occupation(s) during the past five years and other experience: principal of Vanguard. Chief financial officer (2021–present) and treasurer (2017–present) of each of the investment companies served by Vanguard. Partner (2005–2017) at KPMG (audit, tax, and advisory services).
David Cermak
Born in 1960. Principal occupation(s) during the past five years and other experience: principal of Vanguard. Finance director (2019–present) of each of the investment companies served by Vanguard. Managing director and head (2017–present) of Vanguard Investments Singapore. Managing director and head (2017–2019) of Vanguard Investments Hong Kong. Representative director and head (2014–2017) of Vanguard Investments Japan.
John Galloway
Born in 1973. Principal occupation(s) during the past five years and other experience: principal of Vanguard. Investment stewardship officer (September 2020–present) of each of the investment companies served by Vanguard. Head of Investor Advocacy (February 2020–present) and head of Marketing Strategy and Planning (2017–2020) at Vanguard. Deputy assistant to the President of the United States (2015).
Peter Mahoney
Born in 1974. Principal occupation(s) during the past five years and other experience: principal of Vanguard. Controller (2015–present) of each of the investment companies served by Vanguard. Head of International Fund Services (2008–2014) at Vanguard.
Anne E. Robinson
Born in 1970. Principal occupation(s) during the past five years and other experience: general counsel (2016–present) of Vanguard. Secretary (2016–present) of Vanguard and of each of the investment companies served by Vanguard. Managing director (2016–present) of Vanguard. Managing director and general counsel of Global Cards and Consumer Services (2014–2016) at Citigroup. Counsel (2003–2014) at American Express.
Michael Rollings
Born in 1963. Principal occupation(s) during the past five years and other experience: finance director (2017–present) and treasurer (2017) of each of the investment companies served by Vanguard. Managing director (2016–present) of Vanguard. Chief financial officer (2016–present) of Vanguard. Director (2016–present) of Vanguard Marketing Corporation. Executive vice president and chief financial officer (2006–2016) of MassMutual Financial Group.
John E. Schadl
Born in 1972. Principal occupation(s) during the past five years and other experience: principal of Vanguard. Chief compliance officer (2019–present) of Vanguard and of each of the investment companies served by Vanguard. Assistant vice president (2019–present) of Vanguard Marketing Corporation.
Vanguard Senior Management Team
| Matthew Benchener | Thomas M. Rampulla |
| Joseph Brennan | Karin A. Risi |
| Mortimer J. Buckley | Anne E. Robinson |
| Gregory Davis | Michael Rollings |
| John James | Nitin Tandon |
| John T. Marcante | Lauren Valente |
| Chris D. McIsaac | |
Connect with Vanguard®>vanguard.com
Fund Information > 800-662-7447
Direct Investor Account Services > 800-662-2739
Institutional Investor Services > 800-523-1036
Text Telephone for People
Who Are Deaf or Hard of Hearing > 800-749-7273
This material may be used in conjunction with the offering of shares of any Vanguard fund only if preceded or accompanied by the fund’s current prospectus.
All comparative mutual fund data are from Morningstar, Inc., unless otherwise noted.
You can obtain a free copy of Vanguard’s proxy voting guidelines by visiting vanguard.com/proxyreporting or by calling Vanguard at 800-662-2739. The guidelines are also available from the SEC’s website, www.sec.gov. In addition, you may obtain a free report on how your fund voted the proxies for securities it owned during the 12 months ended June 30. To get the report, visit either vanguard.com/proxyreporting or www.sec.gov.
You can review information about your fund on the SEC’s website, and you can receive copies of this information, for a fee, by sending a request via email addressed to publicinfo@sec.gov.
Source for Bloomberg indexes: Bloomberg Index Services Limited. Copyright 2021, Bloomberg. All rights reserved.
CFA® is a registered trademark owned by CFA Institute.
© 2021 The Vanguard Group, Inc.
All rights reserved.
Vanguard Marketing Corporation, Distributor.
Q460 122021
Annual Report | October 31, 2021
Vanguard Diversified Equity Fund
Contents
Please note: The opinions expressed in this report are just that—informed opinions. They should not be considered promises or advice. Also, please keep in mind that the information and opinions cover the period through the date on the front of this report. Of course, the risks of investing in your fund are spelled out in the prospectus.
Your Fund’s Performance at a Glance
| • | For the 12 months ended October 31, 2021, Vanguard Diversified Equity Fund returned 45.67%, ahead of the 44.32% return of its benchmark, the MSCI US Broad Market Index. |
| • | The global economy continued to recover from the sharp pandemic-induced contraction in the spring of 2020. Swift and extensive fiscal and monetary support from policymakers has been a key to the rebound. Despite concerns toward the end of the fiscal year about inflation and the prospect of less accommodative monetary policy, stock returns for the period were excellent. |
| • | The Diversified Equity Fund invests in six actively managed Vanguard funds selected to provide broad exposure to all segments of the U.S. equity market. Together, these funds cover the style and capitalization spectrum. |
| • | Results from the underlying funds ranged from about 38% for the Mid-Cap Growth Fund to about 54% for Vanguard Windsor Fund. |
| • | For the 10 years ended October 31, 2021, the fund’s average annual return of 16.46% was slightly ahead of the 16.17% result of its benchmark. |
Market Barometer
| | Average Annual Total Returns
Periods Ended October 31, 2021 |
| | One Year | Three Years | Five Years |
| Stocks | | | |
| Russell 1000 Index (Large-caps) | 43.51% | 22.01% | 19.16% |
| Russell 2000 Index (Small-caps) | 50.80 | 16.47 | 15.52 |
| Russell 3000 Index (Broad U.S. market) | 43.90 | 21.62 | 18.91 |
| FTSE All-World ex US Index (International) | 30.23 | 12.42 | 10.05 |
| Bonds | | | |
Bloomberg U.S. Aggregate Bond Index
(Broad taxable market) | -0.48% | 5.63% | 3.10% |
Bloomberg Municipal Bond Index
(Broad tax-exempt market) | 2.64 | 5.17 | 3.41 |
| FTSE Three-Month U.S. Treasury Bill Index | 0.05 | 1.08 | 1.12 |
| CPI | | | |
| Consumer Price Index | 6.22% | 3.03% | 2.73% |
About Your Fund’s Expenses
As a shareholder of the fund, you incur ongoing costs, which include costs for portfolio management, administrative services, and shareholder reports (like this one), among others. Operating expenses, which are deducted from a fund’s gross income, directly reduce the investment return of the fund.
A fund’s expenses are expressed as a percentage of its average net assets. The Diversified Equity Fund has no direct expenses, but bears its proportionate share of the costs for the underlying funds in which it invests. These indirect expenses make up the acquired fund fees and expenses, also expressed as a percentage of average net assets. The following examples are intended to help you understand the ongoing cost (in dollars) of investing in your fund and to compare these costs with those of other mutual funds. The examples are based on an investment of $1,000 made at the beginning of the period shown and held for the entire period. The costs were calculated using the acquired fund fees and expenses for the Diversified Equity Fund.
The accompanying table illustrates your fund’s costs in two ways:
| • | Based on actual fund return. This section helps you to estimate the actual expenses that you paid over the period. The ”Ending Account Value“ shown is derived from the fund’s actual return, and the third column shows the dollar amount that would have been paid by an investor who started with $1,000 in the fund. You may use the information here, together with the amount you invested, to estimate the expenses that you paid over the period. |
To do so, simply divide your account value by $1,000 (for example, an $8,600 account value divided by $1,000 = 8.6), then multiply the result by the number given for your fund under the heading ”Expenses Paid During Period.“
| • | Based on hypothetical 5% yearly return. This section is intended to help you compare your fund‘s costs with those of other mutual funds. It assumes that the fund had a yearly return of 5% before expenses, but that the expense ratio is unchanged. In this case—because the return used is not the fund’s actual return—the results do not apply to your investment. The example is useful in making comparisons because the Securities and Exchange Commission requires all mutual funds to calculate expenses based on a 5% return. You can assess your fund’s costs by comparing this hypothetical example with the hypothetical examples that appear in shareholder reports of other funds. |
Note that the expenses shown in the table are meant to highlight and help you compare ongoing costs only and do not reflect transaction costs incurred by the fund for buying and selling securities. Further, the expenses do not include any purchase, redemption, or account service fees described in the fund prospectus. If such fees were applied to your account, your costs would be higher. Your fund does not carry a “sales load.”
The calculations assume no shares were bought or sold during the period. Your actual costs may have been higher or lower, depending on the amount of your investment and the timing of any purchases or redemptions.
You can find more information about the fund’s expenses, including annual expense ratios, in the Financial Statements section of this report. For additional information on operating expenses and other shareholder costs, please refer to your fund’s current prospectus.
| Six Months Ended October 31, 2021 | | | |
| Diversified Equity Fund | Beginning
Account Value
4/30/2021 | Ending
Account Value
10/31/2021 | Expenses
Paid During
Period |
| Based on Actual Fund Return | $1,000.00 | $1,089.90 | $1.84 |
| Based on Hypothetical 5% Yearly Return | 1,000.00 | 1,023.44 | 1.79 |
The calculations are based on acquired fund fees and expenses for the most recent six-month period. The underlying fund's annualized expense figure for that period is 0.35%. The dollar amounts shown as ”Expenses Paid” are equal to the annualized average weighted expense ratio for the underlying funds multiplied by the average account value over the period, multiplied by the number of days in the most recent six-month period, then divided by the number of days in the most recent 12-month period (184/365).
All of the returns in this report represent past performance, which is not a guarantee of future results that may be achieved by the fund. (Current performance may be lower or higher than the performance data cited. For performance data current to the most recent month-end, visit our website at vanguard.com/performance.) Note, too, that both investment returns and principal value can fluctuate widely, so an investor’s shares, when sold, could be worth more or less than their original cost. The returns shown do not reflect taxes that a shareholder would pay on fund distributions or on the sale of fund shares.
Cumulative Performance: October 31, 2011, Through October 31, 2021
Initial Investment of $10,000
| | | | Average Annual Total Returns
Periods Ended October 31, 2021 |
| | | One
Year | Five
Years | Ten
Years | Final Value
of a $10,000
Investment |
 | Diversified Equity Fund | 45.67% | 20.33% | 16.46% | $45,897 |
 | MSCI US Broad Market Index | 44.32 | 19.00 | 16.17 | 44,758 |
See Financial Highlights for dividend and capital gains information.
Underlying Vanguard Funds
| Vanguard U.S. Growth Fund Investor Shares | 30.2% |
| Vanguard Growth and Income Fund Investor Shares | 20.1 |
| Vanguard WindsorTM Fund Investor Shares | 19.8 |
| Vanguard Windsor II Fund Investor Shares | 14.9 |
| Vanguard ExplorerTM Fund Investor Shares | 10.0 |
| Vanguard Mid-Cap Growth Fund | 5.0 |
The table reflects the fund's investments, except for short-term investments.
The fund files its complete schedule of portfolio holdings with the Securities and Exchange Commission (SEC) for the first and third quarters of each fiscal year as an exhibit to its reports on Form N-PORT. The fund’s Form N-PORT reports are available on the SEC’s website at www.sec.gov.
| | | | | | Shares | Market
Value•
($000) |
| Investment Companies (100.0%) |
| U.S. Stock Funds (100.0%) |
| | Vanguard U.S. Growth Fund Investor Shares | 11,567,664 | 893,949 |
| | Vanguard Growth and Income Fund Investor Shares | 8,431,925 | 596,559 |
| | Vanguard Windsor Fund Investor Shares | 22,401,001 | 587,802 |
| | Vanguard Windsor II Fund Investor Shares | 9,133,554 | 442,795 |
| | Vanguard Explorer Fund Investor Shares | 1,950,419 | 295,430 |
| | Vanguard Mid-Cap Growth Fund | 3,813,407 | 147,655 |
| Total Investment Companies (Cost $1,485,783) | 2,964,190 |
| Temporary Cash Investments (0.0%) |
| Money Market Fund (0.0%) |
| 1 | Vanguard Market Liquidity Fund, 0.070% (Cost $145) | 1,450 | 145 |
| Total Investments (100.0%) (Cost $1,485,928) | | 2,964,335 |
| Other Assets and Liabilities—Net (0.0%) | | 1,034 |
| Net Assets (100%) | | 2,965,369 |
| • | See Note A in Notes to Financial Statements. |
| 1 | Affiliated money market fund available only to Vanguard funds and certain trusts and accounts managed by Vanguard. Rate shown is the 7-day yield. |
See accompanying Notes, which are an integral part of the Financial Statements.
Statement of Assets and Liabilities
|
| ($000s, except shares and per-share amounts) | Amount |
| Assets | |
| Investments in Securities, at Value—Affiliated Funds (Cost $1,485,928) | 2,964,335 |
| Receivables for Capital Shares Issued | 3,129 |
| Total Assets | 2,967,464 |
| Liabilities | |
| Payables for Investment Securities Purchased | 1,465 |
| Payables for Capital Shares Redeemed | 630 |
| Total Liabilities | 2,095 |
| Net Assets | 2,965,369 |
At October 31, 2021, net assets consisted of: |
|
| | |
| Paid-in Capital | 1,379,315 |
| Total Distributable Earnings (Loss) | 1,586,054 |
| Net Assets | 2,965,369 |
| | |
| Net Assets | |
Applicable to 52,574,272 outstanding $.001 par value shares of
beneficial interest (unlimited authorization) | 2,965,369 |
| Net Asset Value Per Share | $56.40 |
See accompanying Notes, which are an integral part of the Financial Statements.
|
| | Year Ended
October 31, 2021 |
| | ($000) |
| Investment Income | |
| Income | |
| Income Distributions Received from Affiliated Funds | 19,851 |
| Net Investment Income—Note B | 19,851 |
| Realized Net Gain (Loss) | |
| Capital Gain Distributions Received from Affiliated Funds | 118,184 |
| Affiliated Funds Sold | 8,600 |
| Realized Net Gain (Loss) | 126,784 |
| Change in Unrealized Appreciation (Depreciation) from Affiliated Funds | 757,953 |
| Net Increase (Decrease) in Net Assets Resulting from Operations | 904,588 |
See accompanying Notes, which are an integral part of the Financial Statements.
Statement of Changes in Net Assets
|
| | Year Ended October 31, |
| | 2021
($000) | 2020
($000) |
| Increase (Decrease) in Net Assets | | |
| Operations | | |
| Net Investment Income | 19,851 | 21,628 |
| Realized Net Gain (Loss) | 126,784 | 114,940 |
| Change in Unrealized Appreciation (Depreciation) | 757,953 | 122,165 |
| Net Increase (Decrease) in Net Assets Resulting from Operations | 904,588 | 258,733 |
| Distributions | | |
| Total Distributions | (129,748) | (128,412) |
| Capital Share Transactions | | |
| Issued | 591,473 | 285,583 |
| Issued in Lieu of Cash Distributions | 121,380 | 121,112 |
| Redeemed | (441,166) | (406,693) |
| Net Increase (Decrease) from Capital Share Transactions | 271,687 | 2 |
| Total Increase (Decrease) | 1,046,527 | 130,323 |
| Net Assets | | |
| Beginning of Period | 1,918,842 | 1,788,519 |
| End of Period | 2,965,369 | 1,918,842 |
See accompanying Notes, which are an integral part of the Financial Statements.
For a Share Outstanding
Throughout Each Period | Year Ended October 31, |
| 2021 | 2020 | 2019 | 2018 | 2017 |
| Net Asset Value, Beginning of Period | $40.98 | $37.95 | $35.88 | $35.57 | $30.76 |
| Investment Operations | | | | | |
| Net Investment Income1 | .385 | .452 | .455 | .395 | .428 |
| Capital Gain Distributions Received1 | 2.294 | 1.866 | 3.087 | 1.686 | 1.064 |
| Net Realized and Unrealized Gain (Loss) on Investments | 15.438 | 3.447 | .575 | .206 | 5.627 |
| Total from Investment Operations | 18.117 | 5.765 | 4.117 | 2.287 | 7.119 |
| Distributions | | | | | |
| Dividends from Net Investment Income | (.346) | (.369) | (.383) | (.358) | (.414) |
| Distributions from Realized Capital Gains | (2.351) | (2.366) | (1.664) | (1.619) | (1.895) |
| Total Distributions | (2.697) | (2.735) | (2.047) | (1.977) | (2.309) |
| Net Asset Value, End of Period | $56.40 | $40.98 | $37.95 | $35.88 | $35.57 |
| Total Return2 | 45.67% | 15.73% | 12.82% | 6.55% | 24.47% |
| Ratios/Supplemental Data | | | | | |
| Net Assets, End of Period (Millions) | $2,965 | $1,919 | $1,789 | $1,709 | $1,439 |
| Ratio of Total Expenses to Average Net Assets | — | — | — | — | — |
| Acquired Fund Fees and Expenses | 0.35% | 0.35% | 0.35% | 0.36% | 0.36% |
| Ratio of Net Investment Income to Average Net Assets | 0.76% | 1.19% | 1.27% | 1.07% | 1.31% |
| Portfolio Turnover Rate | 6% | 14% | 9% | 8% | 5% |
| 1 | Calculated based on average shares outstanding. |
| 2 | Total returns do not include account service fees that may have applied in the periods shown. Fund prospectuses provide information about any applicable account service fees. |
See accompanying Notes, which are an integral part of the Financial Statements.
Notes to Financial Statements
Vanguard Diversified Equity Fund is registered under the Investment Company Act of 1940 as an open-end investment company, or mutual fund. The fund invests in selected Vanguard actively managed U.S. Stock Funds. Financial Statements and other information about each underlying fund are available on www.vanguard.com.
Market disruptions associated with the COVID-19 pandemic have had a global impact, and uncertainty exists as to the long-term implications. Such disruptions can adversely affect assets of the fund and thus fund performance.
A. The following significant accounting policies conform to generally accepted accounting principles for U.S. investment companies. The fund consistently follows such policies in preparing its financial statements.
1. Security Valuation: Investments are valued at the net asset value of each underlying Vanguard fund determined as of the close of the New York Stock Exchange (generally 4 p.m., Eastern time) on the valuation date.
2. Federal Income Taxes: The fund intends to continue to qualify as a regulated investment company and distribute all of its taxable income. The fund’s tax returns are open to examination by the relevant tax authorities until expiration of the applicable statute of limitations, which is generally three years after the filing of the tax return. Management has analyzed the fund’s tax positions taken for all open federal and state income tax years, and has concluded that no provision for income tax is required in the fund’s financial statements.
3. Distributions: Distributions to shareholders are recorded on the ex-dividend date. Distributions are determined on a tax basis at the fiscal year-end and may differ from net investment income and realized capital gains for financial reporting purposes.
4. Credit Facilities and Interfund Lending Program: The fund and certain other funds managed by The Vanguard Group ("Vanguard") participate in a $4.3 billion committed credit facility provided by a syndicate of lenders pursuant to a credit agreement and an uncommitted credit facility provided by Vanguard. Both facilities may be renewed annually. Each fund is individually liable for its borrowings, if any, under the credit facilities. Borrowings may be utilized for temporary or emergency purposes, subject to the fund’s regulatory and contractual borrowing restrictions. With respect to the committed credit facility, the participating funds are charged administrative fees and an annual commitment fee of 0.10% of the undrawn committed amount of the facility; these fees are allocated to the funds based on a method approved by the fund’s board of trustees and borne by the funds in which the fund invests (see Note B). Any borrowings under either facility bear interest at a rate based upon the higher of the one-month London Interbank Offered Rate (or an acceptable alternate rate, if necessary), federal funds effective rate, or overnight bank funding rate plus an agreed-upon spread, except that borrowings under the uncommitted credit facility may bear interest based upon an alternative rate agreed to by the fund and Vanguard.
In accordance with an exemptive order (the “Order”) from the SEC, the fund may participate in a joint lending and borrowing program that allows registered open-end Vanguard funds to borrow money from and lend money to each other for temporary or emergency purposes (the “Interfund Lending Program”), subject to compliance with the terms and conditions of the Order, and to the extent permitted by the fund’s investment objective and investment policies. Interfund loans and borrowings normally extend overnight, but can have a maximum duration of seven days. Loans may be called on one business day’s notice. The interest rate to be charged is governed by the
conditions of the Order and internal procedures adopted by the board of trustees. The board of trustees is responsible for overseeing the Interfund Lending Program.
For the year ended October 31, 2021, the fund did not utilize the credit facilities or the Interfund Lending Program.
5. Other: Income and capital gain distributions received are recorded on the ex-dividend date.
Security transactions are accounted for on the date securities are bought or sold. Costs used to determine realized gains (losses) on the sale of investment securities are those of the specific securities sold.
B. In accordance with the terms of a Funds’ Service Agreement (the “FSA”) between Vanguard and the fund, Vanguard furnishes to the fund investment advisory, corporate management, administrative, marketing, and distribution services at Vanguard’s cost of operations (as defined by the FSA). These costs of operations are allocated to the fund based on methods and guidelines approved by the board of trustees. The FSA provides that expenses otherwise allocable to Vanguard funds-of-funds may be reduced or eliminated to the extent of savings realized by the underlying Vanguard funds by virtue of being part of a fund-of-funds. Accordingly, all expenses for services provided by Vanguard to the fund and all other expenses incurred by the fund during the period ended October 31, 2021, were borne by the underlying Vanguard funds in which the fund invests. The fund's trustees and officers are also trustees and officers, respectively, of the underlying Vanguard funds, as well as directors and employees, respectively, of Vanguard.
C. Various inputs may be used to determine the value of the fund’s investments. These inputs are summarized in three broad levels for financial statement purposes. The inputs or methodologies used to value securities are not necessarily an indication of the risk associated with investing in those securities.
Level 1—Quoted prices in active markets for identical securities.
Level 2—Other significant observable inputs (including quoted prices for similar securities, interest rates, prepayment speeds, credit risk, etc.).
Level 3—Significant unobservable inputs (including the fund’s own assumptions used to determine the fair value of investments). Any investments valued with significant unobservable inputs are noted on the Schedule of Investments.
At October 31, 2021, 100% of the market value of the fund's investments was determined based on Level 1 inputs.
D. Permanent differences between book-basis and tax-basis components of net assets are reclassified among capital accounts in the financial statements to reflect their tax character. These reclassifications have no effect on net assets or net asset value per share. As of period end, permanent differences primarily attributable to the accounting for distributions in connection with fund share redemptions were reclassified between the following accounts:
| | Amount
($000) |
| Paid-in Capital | 12,905 |
| Total Distributable Earnings (Loss) | (12,905) |
Temporary differences between book-basis and tax-basis components of total distributable earnings (loss) arise when certain items of income, gain, or loss are recognized in different periods for financial statement and tax purposes; these differences will reverse at some time in the future. The differences are primarily related to the deferral of losses from wash sales. As of period end, the tax-basis components of total distributable earnings (loss) are detailed in the table as follows:
| | Amount
($000) |
| Undistributed Ordinary Income | 11,693 |
| Undistributed Long-Term Gains | 95,983 |
| Capital Loss Carryforwards | — |
| Qualified Late-Year Losses | — |
| Net Unrealized Gains (Losses) | 1,478,378 |
The tax character of distributions paid was as follows:
| | Year Ended October 31, |
| | 2021
Amount
($000) | 2020
Amount
($000) |
| Ordinary Income* | 31,671 | 19,336 |
| Long-Term Capital Gains | 98,077 | 109,076 |
| Total | 129,748 | 128,412 |
| * | Includes short-term capital gains, if any. |
As of October 31, 2021, gross unrealized appreciation and depreciation for investments based on cost for U.S. federal income tax purposes were as follows:
| | Amount
($000) |
| Tax Cost | 1,485,957 |
| Gross Unrealized Appreciation | 1,478,407 |
| Gross Unrealized Depreciation | (29) |
| Net Unrealized Appreciation (Depreciation) | 1,478,378 |
E. Capital shares issued and redeemed were:
| | Year Ended October 31, | |
| | 2021
Shares
(000) | | 2020
Shares
(000) | |
| | | |
| Issued | 11,844 | | 7,639 | |
| Issued in Lieu of Cash Distributions | 2,628 | | 3,175 | |
| Redeemed | (8,723) | | (11,117) | |
| Net Increase (Decrease) in Shares Outstanding | 5,749 | | (303) | |
F. Transactions during the period in affiliated underlying Vanguard funds were as follows:
| | | Current Period Transactions | |
| | Oct. 31, 2020
Market Value
($000) | Purchases
at Cost
($000) | Proceeds
from
Securities
Sold
($000) | Realized
Net Gain
(Loss)
($000) | Change in
Unrealized
App. (Dep.)
($000) | Income
($000) | Capital Gain
Distributions
Received
($000) | Oct. 31, 2021
Market Value
($000) |
| Vanguard Explorer Fund | 194,568 | 33,024 | 6,882 | 261 | 74,459 | 277 | 14,718 | 295,430 |
| Vanguard Growth and Income Fund | 383,146 | 77,501 | 10,610 | 694 | 145,828 | 6,136 | 22,749 | 596,559 |
| Vanguard Market Liquidity Fund | — | NA1 | NA1 | — | — | — | — | 145 |
| Vanguard Mid-Cap Growth Fund | 97,287 | 19,451 | — | — | 30,917 | 166 | 6,731 | 147,655 |
| Vanguard U.S. Growth Fund | 565,646 | 157,314 | 52,205 | 3,731 | 219,463 | 200 | 26,318 | 893,949 |
| Vanguard Windsor Fund | 388,336 | 94,065 | 63,946 | 2,880 | 166,467 | 8,577 | 28,059 | 587,802 |
| Vanguard Windsor II Fund | 289,801 | 40,606 | 9,465 | 1,034 | 120,819 | 4,495 | 19,609 | 442,795 |
| Total | 1,918,784 | 421,961 | 143,108 | 8,600 | 757,953 | 19,851 | 118,184 | 2,964,335 |
| 1 | Not applicable—purchases and sales are for temporary cash investment purposes. |
G. Management has determined that no events or transactions occurred subsequent to October 31, 2021, that would require recognition or disclosure in these financial statements.
Report of Independent Registered
Public Accounting Firm
To the Board of Trustees of Vanguard Trustees’ Equity Fund and Shareholders of Vanguard Diversified Equity Fund
Opinion on the Financial Statements
We have audited the accompanying statement of assets and liabilities, including the schedule of investments, of Vanguard Diversified Equity Fund (one of the funds constituting Vanguard Trustees' Equity Fund, referred to hereafter as the "Fund") as of October 31, 2021, the related statement of operations for the year ended October 31, 2021, the statement of changes in net assets for each of the two years in the period ended October 31, 2021, including the related notes, and the financial highlights for each of the five years in the period ended October 31, 2021 (collectively referred to as the "financial statements"). In our opinion, the financial statements present fairly, in all material respects, the financial position of the Fund as of October 31, 2021, the results of its operations for the year then ended, the changes in its net assets for each of the two years in the period ended October 31, 2021 and the financial highlights for each of the five years in the period ended October 31, 2021 in conformity with accounting principles generally accepted in the United States of America.
Basis for Opinion
These financial statements are the responsibility of the Fund’s management. Our responsibility is to express an opinion on the Fund’s financial statements based on our audits. We are a public accounting firm registered with the Public Company Accounting Oversight Board (United States) (PCAOB) and are required to be independent with respect to the Fund in accordance with the U.S. federal securities laws and the applicable rules and regulations of the Securities and Exchange Commission and the PCAOB.
We conducted our audits of these financial statements in accordance with the standards of the PCAOB. Those standards require that we plan and perform the audit to obtain reasonable assurance about whether the financial statements are free of material misstatement, whether due to error or fraud.
Our audits included performing procedures to assess the risks of material misstatement of the financial statements, whether due to error or fraud, and performing procedures that respond to those risks. Such procedures included examining, on a test basis, evidence regarding the amounts and disclosures in the financial statements. Our audits also included evaluating the accounting principles used and significant estimates made by management, as well as evaluating the overall presentation of the financial statements. Our procedures included confirmation of securities owned as of October 31, 2021 by correspondence with the transfer agent. We believe that our audits provide a reasonable basis for our opinion.
/s/PricewaterhouseCoopers LLP
Philadelphia, Pennsylvania
December 16, 2021
We have served as the auditor of one or more investment companies in The Vanguard Group of Funds since 1975.
Special 2021 tax information (unaudited) for Vanguard Diversified Equity Fund
This information for the fiscal year ended October 31, 2021, is included pursuant to provisions of the Internal Revenue Code.
The fund distributed $107,339,000 as capital gain dividend (20% rate gain distributions) to shareholders during the fiscal year.
For nonresident alien shareholders, 100% of short-term capital gain dividends distributed by the fund are qualified short-term capital gains.
The fund distributed $20,036,000 of qualified dividend income to shareholders during the fiscal year.
For corporate shareholders, 27.0% of investment income (dividend income plus short-term gains, if any) qualifies for the dividends-received deduction.
This page intentionally left blank.
The People Who Govern Your Fund
The trustees of your mutual fund are there to see that the fund is operated and managed in your best interests since, as a shareholder, you are a part owner of the fund. Your fund’s trustees also serve on the board of directors of The Vanguard Group, Inc., which is owned by the Vanguard funds and provides services to them.
A majority of Vanguard’s board members are independent, meaning that they have no affiliation with Vanguard or the funds they oversee, apart from the sizable personal investments they have made as private individuals. The independent board members have distinguished backgrounds in business, academia, and public service. Each of the trustees and executive officers oversees 214 Vanguard funds.
Information for each trustee and executive officer of the fund appears below. That information, as well as the Vanguard fund count, is as of the date on the cover of this fund report. The mailing address of the trustees and officers is P.O. Box 876, Valley Forge, PA 19482. More information about the trustees is in the Statement of Additional Information, which can be obtained, without charge, by contacting Vanguard at 800-662-7447, or online at vanguard.com.
Interested Trustee1
Mortimer J. Buckley
Born in 1969. Trustee since January 2018. Principal occupation(s) during the past five years and other experience: chairman of the board (2019–present) of Vanguard and of each of the investment companies served by Vanguard; chief executive officer (2018–present) of Vanguard; chief executive officer, president, and trustee (2018–present) of each of the investment companies served by Vanguard; president and director (2017–present) of Vanguard; and president (2018–present) of Vanguard Marketing Corporation. Chief investment officer (2013–2017), managing director (2002–2017), head of the Retail Investor Group (2006–2012), and chief information officer (2001–2006) of Vanguard. Chairman of the board (2011–2017) and trustee (2009–2017) of the Children’s Hospital of Philadelphia; and trustee (2018–present) and vice chair (2019–present) of The Shipley School.
Independent Trustees
Emerson U. Fullwood
Born in 1948. Trustee since January 2008. Principal occupation(s) during the past five years and other experience: executive chief staff and marketing officer for North America and corporate vice president (retired 2008) of Xerox Corporation (document management products and services). Former president of the Worldwide Channels Group, Latin America, and Worldwide Customer Service and executive chief staff officer of Developing Markets of Xerox. Executive in residence and 2009–2010 Distinguished Minett Professor at the Rochester Institute of Technology. Director of SPX FLOW, Inc. (multi-industry manufacturing). Director of the University of Rochester Medical Center, the Monroe Community College Foundation, the United Way of Rochester, North Carolina A&T University, and Roberts Wesleyan College. Trustee of the University of Rochester.
Amy Gutmann
Born in 1949. Trustee since June 2006. Principal occupation(s) during the past five years and other experience: president (2004–present) of the University of Pennsylvania. Christopher H. Browne Distinguished Professor of Political Science, School of Arts and Sciences, and professor of communication, Annenberg School for Communication, with secondary faculty appointments in the Department of Philosophy, School of Arts and Sciences, and at the Graduate School of Education, University of Pennsylvania.
1 Mr. Buckley is considered an “interested person,” as defined in the Investment Company Act of 1940, because he is an officer of the Vanguard funds.
F. Joseph Loughrey
Born in 1949. Trustee since October 2009. Principal occupation(s) during the past five years and other experience: president and chief operating officer (retired 2009) and vice chairman of the board (2008–2009) of Cummins Inc. (industrial machinery). Chairman of the board of Hillenbrand, Inc. (specialized consumer services). Director of the V Foundation. Member of the advisory council for the College of Arts and Letters and chair of the advisory board to the Kellogg Institute for International Studies, both at the University of Notre Dame. Chairman of the board of Saint Anselm College.
Mark Loughridge
Born in 1953. Trustee since March 2012. Principal occupation(s) during the past five years and other experience: senior vice president and chief financial officer (retired 2013) of IBM (information technology services). Fiduciary member of IBM’s Retirement Plan Committee (2004–2013), senior vice president and general manager (2002–2004) of IBM Global Financing, vice president and controller (1998–2002) of IBM, and a variety of other prior management roles at IBM. Member of the Council on Chicago Booth.
Scott C. Malpass
Born in 1962. Trustee since March 2012. Principal occupation(s) during the past five years and other experience: chief investment officer (retired June 2020) and vice president (retired June 2020) of the University of Notre Dame. Assistant professor (retired June 2020) of finance at the Mendoza College of Business, University of Notre Dame, and member of the Notre Dame 403(b) Investment Committee. Member of the board of Catholic Investment Services, Inc. (investment advisors) and the board of superintendence of the Institute for the Works of Religion.
Deanna Mulligan
Born in 1963. Trustee since January 2018. Principal occupation(s) during the past five years and other experience: board chair (2020), chief executive officer (2011–2020), and president (2010–2019) of The Guardian Life Insurance Company of America. Chief operating officer (2010–2011) and executive vice president (2008–2010) of Individual Life and Disability of the Guardian Life Insurance Company of America. Member of the board of the Economic Club of New York. Trustee of the Partnership for New York City (business leadership), Chief Executives for Corporate Purpose, NewYork-Presbyterian Hospital, and the Bruce Museum (arts and science). Member of the Advisory Council for the Stanford Graduate School of Business.
André F. Perold
Born in 1952. Trustee since December 2004. Principal occupation(s) during the past five years and other experience: George Gund Professor of Finance and Banking, Emeritus at the Harvard Business School (retired 2011). Chief investment officer and co-managing partner of HighVista Strategies (private investment firm). Member of the board (2018–present) of RIT Capital Partners (investment firm). Member of the investment committee of Partners Health Care System.
Sarah Bloom Raskin
Born in 1961. Trustee since January 2018. Principal occupation(s) during the past five years and other experience: deputy secretary (2014–2017) of the United States Department of the Treasury. Governor (2010–2014) of the Federal Reserve Board. Commissioner (2007–2010) of financial regulation for the State of Maryland. Professor (2020–present), Distinguished Fellow of the Global Financial Markets Center (2020–present), and Rubenstein Fellow (2017–2020) at Duke University. Trustee (2017–present) of Amherst College and member of Amherst College Investment Committee (2019–present). Member of the Regenerative Crisis Response Committee (2020–present).
David A. Thomas
Born in 1956. Trustee since July 2021. Principal occupation(s) during the past five years and other experience: president of Morehouse College (2018–present). Professor of business administration, emeritus at Harvard University (2017–2018). Dean (2011–2016) and professor of management (2016–2017) at the Georgetown University McDonough School of Business. Director of DTE Energy Company (2013–present). Trustee of Common Fund (2019–present).
Peter F. Volanakis
Born in 1955. Trustee since July 2009. Principal occupation(s) during the past five years and other experience: president and chief operating officer (retired 2010) of Corning Incorporated (communications equipment) and director of Corning Incorporated (2000–2010) and Dow Corning (2001–2010). Director (2012) of SPX Corporation (multi-industry manufacturing). Overseer of the Amos Tuck School of Business Administration, Dartmouth College (2001–2013). Chairman of the board of trustees of Colby-Sawyer College. Member of the BMW Group Mobility Council.
Executive Officers
Christine M. Buchanan
Born in 1970. Principal occupation(s) during the past five years and other experience: principal of Vanguard. Chief financial officer (2021–present) and treasurer (2017–present) of each of the investment companies served by Vanguard. Partner (2005–2017) at KPMG (audit, tax, and advisory services).
David Cermak
Born in 1960. Principal occupation(s) during the past five years and other experience: principal of Vanguard. Finance director (2019–present) of each of the investment companies served by Vanguard. Managing director and head (2017–present) of Vanguard Investments Singapore. Managing director and head (2017–2019) of Vanguard Investments Hong Kong. Representative director and head (2014–2017) of Vanguard Investments Japan.
John Galloway
Born in 1973. Principal occupation(s) during the past five years and other experience: principal of Vanguard. Investment stewardship officer (September 2020–present) of each of the investment companies served by Vanguard. Head of Investor Advocacy (February 2020–present) and head of Marketing Strategy and Planning (2017–2020) at Vanguard. Deputy assistant to the President of the United States (2015).
Peter Mahoney
Born in 1974. Principal occupation(s) during the past five years and other experience: principal of Vanguard. Controller (2015–present) of each of the investment companies served by Vanguard. Head of International Fund Services (2008–2014) at Vanguard.
Anne E. Robinson
Born in 1970. Principal occupation(s) during the past five years and other experience: general counsel (2016–present) of Vanguard. Secretary (2016–present) of Vanguard and of each of the investment companies served by Vanguard. Managing director (2016–present) of Vanguard. Managing director and general counsel of Global Cards and Consumer Services (2014–2016) at Citigroup. Counsel (2003–2014) at American Express.
Michael Rollings
Born in 1963. Principal occupation(s) during the past five years and other experience: finance director (2017–present) and treasurer (2017) of each of the investment companies served by Vanguard. Managing director (2016–present) of Vanguard. Chief financial officer (2016–present) of Vanguard. Director (2016–present) of Vanguard Marketing Corporation. Executive vice president and chief financial officer (2006–2016) of MassMutual Financial Group.
John E. Schadl
Born in 1972. Principal occupation(s) during the past five years and other experience: principal of Vanguard. Chief compliance officer (2019–present) of Vanguard and of each of the investment companies served by Vanguard. Assistant vice president (2019–present) of Vanguard Marketing Corporation.
Vanguard Senior Management Team
| Matthew Benchener | Thomas M. Rampulla |
| Joseph Brennan | Karin A. Risi |
| Mortimer J. Buckley | Anne E. Robinson |
| Gregory Davis | Michael Rollings |
| John James | Nitin Tandon |
| John T. Marcante | Lauren Valente |
| Chris D. McIsaac | |
Connect with Vanguard®>vanguard.com
Fund Information > 800-662-7447
Direct Investor Account Services > 800-662-2739
Institutional Investor Services > 800-523-1036
Text Telephone for People
Who Are Deaf or Hard of Hearing > 800-749-7273
This material may be used in conjunction with the offering of shares of any Vanguard fund only if preceded or accompanied by the fund’s current prospectus.
All comparative mutual fund data are from Lipper, a Thomson Reuters Company, or Morningstar, Inc., unless otherwise noted.
You can obtain a free copy of Vanguard’s proxy voting guidelines by visiting vanguard.com/proxyreporting or by calling Vanguard at 800-662-2739. The guidelines are also available from the SEC’s website, www.sec.gov. In addition, you may obtain a free report on how your fund voted the proxies for securities it owned during the 12 months ended June 30. To get the report, visit either vanguard.com/proxyreporting or www.sec.gov.
You can review information about your fund on the SEC’s website, and you can receive copies of this information, for a fee, by sending a request via email addressed to publicinfo@sec.gov.
Source for Bloomberg indexes: Bloomberg Index Services Limited. Copyright 2021, Bloomberg. All rights reserved.
© 2021 The Vanguard Group, Inc.
All rights reserved.
Vanguard Marketing Corporation, Distributor.
Q6080 122021
Annual Report | October 31, 2021
Vanguard Emerging Markets Select Stock Fund
Contents
Your Fund’s Performance at a Glance
| 1 |
Advisors’ Report
| 2 |
About Your Fund’s Expenses
| 7 |
Performance Summary
| 9 |
Financial Statements
| 11 |
Please note: The opinions expressed in this report are just that—informed opinions. They should not be considered promises or advice. Also, please keep in mind that the information and opinions cover the period through the date on the front of this report. Of course, the risks of investing in your fund are spelled out in the prospectus.
Your Fund’s Performance at a Glance
| • | For the 12 months ended October 31, 2021, Vanguard Emerging Markets Select Stock Fund returned 23.44%, outpacing the 17.11% return of its benchmark, the FTSE Emerging Index. |
| • | The global economy continued to recover from the sharp pandemic-induced contraction in the spring of 2020. Countries that were more successful in containing COVID-19—whether through vaccinations, lockdowns, or both—generally fared better economically. Swift and extensive fiscal and monetary support from policymakers was also key to the rebound. Even amid concerns toward the end of the fiscal year about inflation and the prospect of less accommodative monetary policy, stock returns for the period were excellent. |
| • | At the sector level, the fund’s holdings in financial companies (primarily banks) and information technology (particularly semiconductors) contributed to the excess returns. Stock selection in consumer discretionary bolstered the fund’s relative return despite underwhelming absolute returns. |
| • | At the country level, the fund’s underweight stake in China helped relative performance, as Chinese stocks returned –3% compared with –8% for the benchmark. Shares from Russia and Brazil also contributed to relative returns, but underweight allocations to strong performers Taiwan and India detracted. |
Market Barometer
| | Average Annual Total Returns
Periods Ended October 31, 2021 |
| | One Year | Three Years | Five Years |
| Stocks | | | |
| Russell 1000 Index (Large-caps) | 43.51% | 22.01% | 19.16% |
| Russell 2000 Index (Small-caps) | 50.80 | 16.47 | 15.52 |
| Russell 3000 Index (Broad U.S. market) | 43.90 | 21.62 | 18.91 |
| FTSE All-World ex US Index (International) | 30.23 | 12.42 | 10.05 |
| Bonds | | | |
Bloomberg U.S. Aggregate Bond Index
(Broad taxable market) | -0.48% | 5.63% | 3.10% |
Bloomberg Municipal Bond Index
(Broad tax-exempt market) | 2.64 | 5.17 | 3.41 |
| FTSE Three-Month U.S. Treasury Bill Index | 0.05 | 1.08 | 1.12 |
| CPI | | | |
| Consumer Price Index | 6.22% | 3.03% | 2.73% |
For the 12 months ended October 31, 2021, Vanguard Emerging Markets Select Stock Fund returned 23.44%. Your fund is managed by four independent advisors, a strategy that enhances the fund’s diversification by providing exposure to distinct yet complementary investment approaches. It’s not uncommon for different advisors to have different views about individual securities or the broader investment environment.
The advisors, the percentage of fund assets each manages, and brief descriptions of their investment strategies are presented in the accompanying table. The advisors have also prepared a discussion of the investment environment that existed during the fiscal year and of how portfolio positioning reflects this assessment.
These comments were prepared on November 12, 2021.
Wellington Management Company LLP
Portfolio Manager:
Mary Pryshlak, CFA,
Senior Managing Director and
Head of Investment Research
Emerging-market equities rose in U.S. dollar terms over the 12 months, as measured by the FTSE Emerging Index. Eight of the 11 index sectors posted positive returns, led by energy, materials, and information technology. Consumer discretionary, real estate, and communication services were the only sectors to decline.
Our portion of the fund outperformed the index over the period. Strong security selection in IT, industrials, and utilities contributed most to relative results. This was only partly offset by weaker selection in consumer staples. By region, selection in China primarily drove the outperformance, while selection in South Africa and Russia detracted.
Overweight allocations to China Longyuan Power, China’s largest renewable power producer, and Contemporary Amperex, a leading battery manufacturer for electric vehicles and energy storage systems, were the largest relative contributors for the period. An overweighting of Alibaba, a leading e-commerce provider, and an out-of-benchmark position in Yatsen, a China-based provider of beauty products, were key relative detractors.
An eventful summer set the table for a fourth quarter rife with uncertainty as allocators seek to navigate a market with plausible bull and bear cases. Inflation remains elevated, in some areas seemingly more sustainable than expected. Labor shortages across industries are straining supply chains, with potential for further short-term disruption. Businesses that can pass on inflation to customers or support the reestablishment of efficient production lines are likely to benefit as consumer health and market demand remain strong.
Our investors remain keenly focused on the impacts of increased regulatory scrutiny from China as it tries to foster common prosperity within the country. Regulations in the education, internet, and
gaming industries delivered a shock to investors, while the ongoing Evergrande situation provides insight into how China will handle failing companies. As these situations evolve, our analysts monitor the degree of market discount that investors apply to China-domiciled companies across industries going forward.
The global proliferation of COVID-19’s Delta variant has again fueled anxiety about the pace of the economic recovery and forced governments to reinstate targeted lockdowns in many countries, particularly in Asia. Emerging markets are lagging their developed-market peers in returning to normalization, given slow access to vaccines and binding constraints on policy support. This remains a key area of focus for our global industry analysts.
Baillie Gifford Overseas Ltd.
Portfolio Managers:
Mike Gush
Andrew Stobart
Despite recent volatility, particularly in China, it has been a strong year for absolute returns in emerging markets in U.S. dollar terms. The asset class has also delivered for investors over meaningful time horizons, with five- and 10-year returns of the FTSE Emerging Index looking much more respectable than they did one or two years ago. Hopefully, emerging markets are starting to shake off the reputation of a “lost decade.”
We have been struck by the shift in sentiment toward China, which at the extreme seems to label it uninvestable. Although we certainly don’t concur, we are cognizant of the risks. We have successfully invested in China by staying on the right side of government policy, which clearly in recent months has shifted in a number of areas. As with any change, some companies will see their prospects dimmed, but new opportunities will also emerge. China’s desire to promote “common prosperity” and greater self-sufficiency will no doubt support innovative new companies in exciting areas such as semiconductors, advanced materials, and alternative energy. Despite the changes, China remains a great opportunity set for thoughtful, long-term investors.
Beyond China, our debates have been wide-ranging, and the portfolio has added an encouraging array of new businesses. These cover themes such as Brazilian energy, Indian financials, and Korean e-commerce, to name a few.
As we emerge from the pandemic, it strikes us that much of the emerging world is in a relatively healthier state than much of the developed world. We are excited by the prospects for a wide range of ideas across emerging markets, so we conclude the year with a very optimistic mindset.
Oaktree Capital Management, L.P.
Portfolio Manager:
Frank J. Carroll III,
Managing Director and Co-Head
of Emerging Markets Equities
Emerging-market equities performed well over the 12 months ended October 31, 2021. The asset class benefited from the global rollout of COVID-19 vaccines, continued fiscal support, and a more optimistic economic outlook, despite the Delta variant’s spread, regulatory pressure, and rising inflation. Russia was the strongest large market given high oil prices. China performed poorly because of the Evergrande debt crisis and stricter regulations against internet and technology companies.
Positive stock selection primarily drove the fund’s outperformance. Selection in Brazil also helped, while selection in South Africa, Thailand, and Russia detracted. Our overweight allocations to Russia, Hungary, and Indonesia had a positive effect, as did our underweight exposure to China and out-of-benchmark exposure to South Korea. Our underweight allocations to Saudi Arabia, Taiwan, and India and overweighting of Brazil hurt results.
By sector, selection in health care, information technology, financials, and industrials drove relative results, while selection among materials, consumer staples, consumer discretionary, communication services, real estate, and energy detracted. Our underweight exposures to consumer discretionary and
communication services and overweighting of materials, financials, energy, and industrials all boosted relative performance. Our underweight exposure to utilities had a negative effect.
Over the last several months, we’ve seen increased uncertainty in our markets due to various political and macroeconomic trends. The recent surge in energy prices has heightened the risk that inflation will remain elevated for a significant period, but we remain bullish on the cyclical sectors, including materials, financials, and energy. We’ve added to some of our positions in value equities, as valuations remain cheap and companies are boosting returns with dividends. We’ll continue to follow our disciplined investment process, and we’re excited about a number of company-specific opportunities.
Pzena Investment Management, LLC
Portfolio Managers:
Rakesh Bordia, Principal
Caroline Cai, CFA, Managing Principal
Allison Fisch, Principal
John Goetz, Managing Principal and
Co-Chief Investment Officer
Value stocks dominated throughout most of the last 12 months, outperforming initially as investors gained a line of sight to normalcy following COVID-19 vaccine successes, and later as economic growth expectations improved and on the sell-off in high-growth Chinese companies.
The largest portfolio contributor was Russian oil giant Lukoil, which improved on the rising price of oil and its strong shareholder return policy. The company now looks likely to expand production to its pre-pandemic level by the end of 2022’s first quarter. Hong Kong-based dry bulk shipper Pacific Basin saw its shares benefit from rising shipping rates and further absorption of industry oversupply. South Africa’s Sasol benefited from rising oil prices in its energy and chemicals businesses. The market is also pleased with Sasol’s decarbonization plan, free-cash-flow expectations, and capital return plan. A new holding this year, automaker Brilliance China, was the largest portfolio detractor. Trading of its shares was halted after the company delayed publishing its 2020 financials because of unauthorized guarantees and legal proceedings involving a subsidiary. Given the lack of clarity about residual market value once trading resumes, we marked the position at 0.01 HKD.
Shares of casino operator Galaxy Entertainment Group were weak, along with other reopening stocks, as the timeline for when Macau would fully reopen to visitors remained uncertain and on concerns about increased industry regulation. Utility Light shares fell on general macroeconomic weakness in
Brazil, exacerbated by increased political risk after Brazil’s president mentioned his intent to reduce regulated power prices. We believe that these potential systemic risks are overblown, and we expect the company’s management to continue pursuing self-help initiatives to improve profitability.
The portfolio’s largest new positions include China’s Alibaba; Shriram Transport, the industry leader in used commercial vehicle financing in India; China Overseas Land & Investment, a large, partly state-owned home builder; Banca Transilvania, one of the largest banks in Romania; and United Integrated Services, a Taiwan-based engineering and construction company specializing in integrated cleanroom construction.
We exited Rosneft Oil (Russian oil producer); China Resources Power (independent power producer); Catcher Technology (Taiwanese metal casing); NTPC (Indian utility); Man Wah (Chinese sofa manufacturer); and China Mobile (telecom).
Although we applaud the value equity rotation, valuation spreads remain extremely wide by historical standards, which is to say that we believe the current value cycle has legs.
Vanguard Emerging Markets Select Stock Fund Investment Advisors
| |
| | Fund Assets Managed | |
| Investment Advisor | % | $ Million | Investment Strategy |
| Wellington Management Company LLP | 24 | 237 | Allocates the assets in its portion of the fund to a team of global analysts who seek to add value through in-depth fundamental research and understanding of their industries. By covering the same companies over a period of many years, these investment professionals gain comprehensive insight to guide decisions for their subportfolios. |
| Baillie Gifford Overseas Ltd. | 24 | 234 | Believes that companies that can sustainably grow their business and increase earnings faster than market average will perform best. Stock selection is driven by bottom-up, fundamental analysis, focusing on a company’s potential over a meaningful time period, typically three to five years and beyond. |
| Oaktree Capital Management, L.P. | 24 | 232 | Seeks securities that have been undervalued by investors. Oaktree’s investment process is driven by bottom-up research, which includes extensive travel to meet company management and maintaining in-house models focused on deriving reliable cash-flow projections. |
| Pzena Investment Management, LLC | 24 | 231 | Uses a deep-value approach that focuses on the most undervalued companies based on price-to-normalized earnings. The firm believes that this value philosophy works well globally and is especially effective in emerging markets because of generally wider valuation spreads. |
| Cash Investments | 4 | 40 | These short-term reserves are invested by Vanguard in equity index products to simulate investment in stocks. Each advisor may also maintain a modest cash position. |
About Your Fund’s Expenses
As a shareholder of the fund, you incur ongoing costs, which include costs for portfolio management, administrative services, and shareholder reports (like this one), among others. Operating expenses, which are deducted from a fund’s gross income, directly reduce the investment return of the fund.
A fund’s expenses are expressed as a percentage of its average net assets. This figure is known as the expense ratio. The following examples are intended to help you understand the ongoing costs (in dollars) of investing in your fund and to compare these costs with those of other mutual funds. The examples are based on an investment of $1,000 made at the beginning of the period shown and held for the entire period.
The accompanying table illustrates your fund’s costs in two ways:
| • | Based on actual fund return. This section helps you to estimate the actual expenses that you paid over the period. The ”Ending Account Value“ shown is derived from the fund‘s actual return, and the third column shows the dollar amount that would have been paid by an investor who started with $1,000 in the fund. You may use the information here, together with the amount you invested, to estimate the expenses that you paid over the period. |
To do so, simply divide your account value by $1,000 (for example, an $8,600 account value divided by $1,000 = 8.6), then multiply the result by the number given for your fund under the heading ”Expenses Paid During Period.“
| • | Based on hypothetical 5% yearly return. This section is intended to help you compare your fund‘s costs with those of other mutual funds. It assumes that the fund had a yearly return of 5% before expenses, but that the expense ratio is unchanged. In this case—because the return used is not the fund’s actual return—the results do not apply to your investment. The example is useful in making comparisons because the Securities and Exchange Commission requires all mutual funds to calculate expenses based on a 5% return. You can assess your fund’s costs by comparing this hypothetical example with the hypothetical examples that appear in shareholder reports of other funds. |
Note that the expenses shown in the table are meant to highlight and help you compare ongoing costs only and do not reflect transaction costs incurred by the fund for buying and selling securities. Further, the expenses do not include any purchase, redemption, or account service fees described in the fund prospectus. If such fees were applied to your account, your costs would be higher. Your fund does not carry a “sales load.”
The calculations assume no shares were bought or sold during the period. Your actual costs may have been higher or lower, depending on the amount of your investment and the timing of any purchases or redemptions.
You can find more information about the fund’s expenses, including annual expense ratios, in the Financial Statements section of this report. For additional information on operating expenses and other shareholder costs, please refer to your fund’s current prospectus.
| Six Months Ended October 31, 2021 | | | |
| Emerging Markets Select Stock Fund | Beginning
Account Value
4/30/2021 | Ending
Account Value
10/31/2021 | Expenses
Paid During
Period |
| Based on Actual Fund Return | $1,000.00 | $950.90 | $3.98 |
| Based on Hypothetical 5% Yearly Return | 1,000.00 | 1,021.12 | 4.13 |
The calculations are based on expenses incurred in the most recent six-month period. The fund’s annualized six-month expense ratio for that period is 0.81%. The dollar amounts shown as “Expenses Paid” are equal to the annualized expense ratio multiplied by the average account value over the period, multiplied by the number of days in the most recent six-month period, then divided by the number of days in the most recent 12-month period (184/365).
Emerging Markets Select Stock Fund
All of the returns in this report represent past performance, which is not a guarantee of future results that may be achieved by the fund. (Current performance may be lower or higher than the performance data cited. For performance data current to the most recent month-end, visit our website at vanguard.com/performance.) Note, too, that both investment returns and principal value can fluctuate widely, so an investor’s shares, when sold, could be worth more or less than their original cost. The returns shown do not reflect taxes that a shareholder would pay on fund distributions or on the sale of fund shares.
Cumulative Performance: October 31, 2011, Through October 31, 2021
Initial Investment of $10,000
| | | Average Annual Total Returns
Periods Ended October 31, 2021 | |
| | | One
Year | Five
Years | Ten
Years | Final Value
of a $10,000
Investment |
 | Emerging Markets Select Stock Fund | 23.44% | 10.08% | 5.88% | $17,711 |
 | FTSE Emerging Index | 17.11 | 9.15 | 5.05 | 16,370 |
 | MSCI All Country World Index ex USA | 29.66 | 9.77 | 6.66 | 19,057 |
See Financial Highlights for dividend and capital gains information.
Emerging Markets Select Stock Fund
| China | 29.1% |
| Taiwan | 12.6 |
| India | 11.0 |
| Brazil | 7.8 |
| South Korea | 7.1 |
| Russia | 6.4 |
| Hong Kong | 5.0 |
| United States | 3.5 |
| South Africa | 2.6 |
| Indonesia | 2.2 |
| Thailand | 2.0 |
| United Kingdom | 1.7 |
| Mexico | 1.6 |
| Hungary | 1.0 |
| Canada | 1.0 |
| Turkey | 1.0 |
| Other | 4.4 |
The table reflects the fund’s investments, except for short-term investments and derivatives.
Emerging Markets Select Stock Fund
The fund files its complete schedule of portfolio holdings with the Securities and Exchange Commission (SEC) for the first and third quarters of each fiscal year as an exhibit to its reports on Form N-PORT. The fund’s Form N-PORT reports are available on the SEC’s website at www.sec.gov.
| | | Shares | Market
Value•
($000) |
| Common Stocks (93.8%) |
| Brazil (7.3%) |
| | Petroleo Brasileiro SA ADR (XNYS) | 1,283,142 | 12,600 |
| | Vale SA Class B ADR | 785,411 | 9,998 |
| | Ambev SA | 3,019,766 | 9,091 |
| | Cia Energetica de Minas Gerais Preference Shares | 3,241,081 | 7,397 |
| * | Banco Bradesco SA ADR | 1,698,332 | 5,944 |
| | Raizen SA Preference Shares | 3,551,606 | 4,267 |
| | Itau Unibanco Holding SA Preference Shares | 921,200 | 3,805 |
| | Itau Unibanco Holding SA ADR | 877,589 | 3,572 |
| * | Petroleo Brasileiro SA | 443,017 | 2,172 |
| * | Azul SA ADR | 159,631 | 2,112 |
| | Petroleo Brasileiro SA ADR | 215,354 | 2,070 |
| | B3 SA - Brasil Bolsa Balcao | 848,900 | 1,791 |
| | Light SA | 887,000 | 1,521 |
| | Banco Bradesco SA Preference Shares | 389,600 | 1,374 |
| * | Caixa Seguridade Participacoes SA | 508,939 | 789 |
| | Cia de Saneamento Basico do Estado de Sao Paulo | 113,700 | 709 |
| | Raia Drogasil SA | 116,244 | 479 |
| | Gerdau SA Preference Shares | 98,700 | 470 |
| | Magazine Luiza SA | 171,132 | 328 |
| | Hypera SA | 58,800 | 292 |
| | Localiza Rent a Car SA | 36,200 | 291 |
| | Notre Dame Intermedica Participacoes SA | 25,100 | 285 |
| | Lojas Renner SA | 42,507 | 243 |
| | | | 71,600 |
| Canada (0.9%) |
| | First Quantum Minerals Ltd. | 207,494 | 4,912 |
| | Lundin Mining Corp. | 300,667 | 2,617 |
| | Parex Resources Inc. | 56,982 | 1,107 |
| * | Valeura Energy Inc. | 264,800 | 111 |
| | | | 8,747 |
| China (27.3%) |
| | Tencent Holdings Ltd. | 489,034 | 29,748 |
| * | Alibaba Group Holding Ltd. | 1,114,407 | 22,915 |
| | | Shares | Market
Value•
($000) |
| | China Merchants Bank Co. Ltd. Class H | 1,261,286 | 10,570 |
| | China Construction Bank Corp. Class H | 14,919,466 | 10,154 |
| | Ping An Insurance Group Co. of China Ltd. Class H | 1,323,442 | 9,479 |
| *,1 | Meituan Class B | 240,703 | 8,191 |
| * | Trip.com Group Ltd. ADR | 282,612 | 8,071 |
| * | Alibaba Group Holding Ltd. ADR | 47,129 | 7,773 |
| | Contemporary Amperex Technology Co. Ltd. Class A (XSHE) | 65,400 | 6,551 |
| | Geely Automobile Holdings Ltd. | 1,743,002 | 6,049 |
| | Contemporary Amperex Technology Co. Ltd. Class A | 53,400 | 5,349 |
| | China Overseas Land & Investment Ltd. | 2,262,000 | 4,989 |
| | Li Ning Co. Ltd. | 438,130 | 4,835 |
| * | Baidu Inc. ADR | 27,944 | 4,534 |
| *,1 | JD Logistics Inc. | 1,146,131 | 4,504 |
| | Ping An Bank Co. Ltd. Class A | 1,438,474 | 4,382 |
| 1 | WuXi AppTec Co. Ltd. Class H | 203,910 | 4,354 |
| * | XPeng Inc. Class A ADR | 93,187 | 4,345 |
| * | Aluminum Corp. of China Ltd. Class H | 6,361,121 | 3,828 |
| | Zijin Mining Group Co. Ltd. Class H | 2,719,305 | 3,782 |
| * | Shanghai International Airport Co. Ltd. Class A | 443,807 | 3,670 |
| | China Longyuan Power Group Corp. Ltd. Class H | 1,480,384 | 3,463 |
| | Baoshan Iron & Steel Co. Ltd. Class A | 2,929,994 | 3,261 |
| | Anhui Conch Cement Co. Ltd. Class H | 623,224 | 3,082 |
| | Country Garden Services Holdings Co. Ltd. | 390,701 | 3,008 |
| * | JD.com Inc. Class A | 74,156 | 2,903 |
| | Nine Dragons Paper Holdings Ltd. | 2,240,832 | 2,818 |
| | Shimao Group Holdings Ltd. | 1,760,990 | 2,762 |
| | Riyue Heavy Industry Co. Ltd. Class A (XSHG) | 436,754 | 2,668 |
Emerging Markets Select Stock Fund
| | | Shares | Market
Value•
($000) |
| | Dongfeng Motor Group Co. Ltd. Class H | 2,838,000 | 2,643 |
| | Yihai International Holding Ltd. | 448,690 | 2,628 |
| * | Zai Lab Ltd. ADR | 21,149 | 2,208 |
| 1 | Pharmaron Beijing Co. Ltd. Class H | 101,546 | 2,197 |
| | Weichai Power Co. Ltd. Class H | 1,225,408 | 2,193 |
| | Industrial & Commercial Bank of China Ltd. Class H | 3,914,843 | 2,146 |
| | Haier Smart Home Co. Ltd. Class H | 527,400 | 1,964 |
| | Sun Art Retail Group Ltd. | 3,313,371 | 1,943 |
| 1 | Shimao Services Holdings Ltd. | 1,026,044 | 1,934 |
| | Shenzhou International Group Holdings Ltd. | 89,500 | 1,928 |
| * | Brilliance China Automotive Holdings Ltd. | 3,486,000 | 1,906 |
| | BYD Co. Ltd. Class H | 48,150 | 1,842 |
| * | Baidu Inc. Class A | 87,650 | 1,791 |
| | Yunnan Energy New Material Co. Ltd. Class A | 34,900 | 1,592 |
| 1 | CSC Financial Co. Ltd. Class H | 1,425,052 | 1,506 |
| | Zhongsheng Group Holdings Ltd. | 164,000 | 1,479 |
| 1 | Ganfeng Lithium Co. Ltd. Class H | 78,429 | 1,469 |
| * | Lufax Holding Ltd. ADR | 227,315 | 1,434 |
| 1 | Longfor Group Holdings Ltd. | 285,000 | 1,379 |
| | China Tourism Group Duty Free Corp. Ltd. Class A | 32,696 | 1,369 |
| | China Gas Holdings Ltd. | 544,517 | 1,359 |
| * | ENN Energy Holdings Ltd. | 69,942 | 1,205 |
| | ANTA Sports Products Ltd. | 75,069 | 1,163 |
| | China Pacific Insurance Group Co. Ltd. Class H | 375,818 | 1,149 |
| *,1 | Kuaishou Technology | 87,700 | 1,147 |
| | Midea Group Co. Ltd. Class A | 105,386 | 1,130 |
| *,1 | 3SBio Inc. | 1,204,842 | 1,102 |
| | Guangzhou Tinci Materials Technology Co. Ltd. Class A | 41,300 | 1,063 |
| | Shanghai Putailai New Energy Technology Co. Ltd. Class A | 37,360 | 1,039 |
| * | Yatsen Holding Ltd. ADR | 364,800 | 1,021 |
| * | KE Holdings Inc. ADR | 54,867 | 1,000 |
| | China National Building Material Co. Ltd. Class H | 770,000 | 965 |
| * | Kingsoft Cloud Holdings Ltd. ADR | 41,732 | 959 |
| * | Tencent Music Entertainment Group ADR | 120,430 | 947 |
| | Suofeiya Home Collection Co. Ltd. Class A | 354,790 | 936 |
| | Centre Testing International Group Co. Ltd. Class A | 210,400 | 907 |
| | | Shares | Market
Value•
($000) |
| * | Grand Baoxin Auto Group Ltd. | 7,813,500 | 877 |
| 1 | China Yangtze Power Co. Ltd. GDR | 25,768 | 856 |
| | CIFI Holdings Group Co. Ltd. | 1,526,696 | 847 |
| *,1 | China Youran Dairy Group Ltd. | 1,457,041 | 843 |
| * | Dada Nexus Ltd. ADR | 39,391 | 800 |
| | Shandong Sinocera Functional Material Co. Ltd. Class A | 112,958 | 753 |
| | Sinoma Science & Technology Co. Ltd. Class A | 124,000 | 733 |
| | Glodon Co. Ltd. Class A (XSHE) | 62,300 | 723 |
| | Venustech Group Inc. Class A | 179,900 | 717 |
| * | Trip.com Group Ltd. | 24,750 | 711 |
| | China Oilfield Services Ltd. Class H | 712,857 | 682 |
| * | Kingdee International Software Group Co. Ltd. | 204,354 | 672 |
| | Proya Cosmetics Co. Ltd. Class A | 20,820 | 653 |
| * | Burning Rock Biotech Ltd. ADR | 44,762 | 631 |
| | Shandong Weigao Group Medical Polymer Co. Ltd. Class H | 367,495 | 626 |
| | Zhejiang Huayou Cobalt Co. Ltd. Class A | 34,600 | 600 |
| | Midea Group Co. Ltd. Class A (XSEC) | 54,600 | 586 |
| * | XPeng Inc. Class A | 24,100 | 559 |
| | Shenzhen Mindray Bio-Medical Electronics Co. Ltd. Class A | 9,500 | 557 |
| * | HUYA Inc. ADR | 66,568 | 547 |
| | Suofeiya Home Collection Co. Ltd. Class A (XSHE) | 189,730 | 500 |
| | Ping An Bank Co. Ltd. Class A (XSHE) | 157,400 | 479 |
| | CSPC Pharmaceutical Group Ltd. | 448,156 | 468 |
| | Kweichow Moutai Co. Ltd. Class A | 1,609 | 459 |
| | Yifeng Pharmacy Chain Co. Ltd. Class A | 56,100 | 419 |
| | Hualan Biological Engineering Inc. Class A | 87,300 | 406 |
| 1 | Hangzhou Tigermed Consulting Co. Ltd. Class H | 20,100 | 392 |
| | Amoy Diagnostics Co. Ltd. Class A | 28,908 | 365 |
| * | Zai Lab Ltd. | 2,815 | 292 |
| *,1 | Venus MedTech Hangzhou Inc. Class H | 46,740 | 216 |
| | Yifeng Pharmacy Chain Co. Ltd. Class A (XSHG) | 27,170 | 203 |
| | Jinyu Bio-Technology Co. Ltd. Class A | 79,100 | 197 |
| | China Yangtze Power Co. Ltd. Class A | 52,500 | 175 |
| *,1 | Wuxi Biologics Cayman Inc. | 10,963 | 166 |
| | Sunac China Holdings Ltd. | 77,000 | 165 |
Emerging Markets Select Stock Fund
| | | Shares | Market
Value•
($000) |
| * | New Oriental Education & Technology Group Inc. ADR | 62,160 | 127 |
| | Shanghai Jinjiang International Hotels Co. Ltd. | 13,600 | 114 |
| * | TAL Education Group ADR | 16,334 | 67 |
| | Amoy Diagnostics Co. Ltd. Class A (XSHE) | 5,200 | 66 |
| | Shenzhen Mindray Bio-Medical Electronics Co. Ltd. Class A (XSHE) | 300 | 18 |
| *,1 | New Horizon Health Ltd. | 4,000 | 15 |
| *,2 | Tianhe Chemicals Group Ltd. | 4,142,000 | �� |
| | | | 265,963 |
| Czech Republic (0.8%) |
| | CEZ A/S | 167,088 | 5,518 |
| * | Komercni banka A/S | 56,379 | 2,187 |
| | | | 7,705 |
| Egypt (0.0%) |
| * | Commercial International Bank Egypt SAE GDR (Registered) | 1 | — |
| Greece (0.6%) |
| * | Alpha Services and Holdings SA | 3,018,010 | 3,848 |
| | Hellenic Telecommunications Organization SA | 65,012 | 1,154 |
| * | Bank of Cyprus Holdings plc | 491,391 | 578 |
| | | | 5,580 |
| Hong Kong (4.7%) |
| * | Galaxy Entertainment Group Ltd. | 1,571,528 | 8,456 |
| * | Yue Yuen Industrial Holdings Ltd. | 2,572,000 | 5,460 |
| | Pacific Basin Shipping Ltd. | 11,078,963 | 5,113 |
| | Orient Overseas International Ltd. | 261,925 | 4,816 |
| | Lenovo Group Ltd. | 4,226,000 | 4,589 |
| | AIA Group Ltd. | 276,229 | 3,096 |
| * | Cathay Pacific Airways Ltd. | 2,856,192 | 2,635 |
| * | Sands China Ltd. | 1,126,000 | 2,566 |
| | VTech Holdings Ltd. | 289,500 | 2,229 |
| * | MMG Ltd. | 4,503,021 | 2,080 |
| * | BeiGene Ltd. ADR | 5,661 | 2,025 |
| | Minth Group Ltd. | 366,000 | 1,455 |
| *,1 | JW Cayman Therapeutics Co. Ltd. (XHKG) | 379,574 | 694 |
| *,1 | Everest Medicines Ltd. | 52,200 | 300 |
| *,1 | ESR Cayman Ltd. | 70,806 | 229 |
| | | | 45,743 |
| Hungary (1.0%) |
| * | OTP Bank Nyrt | 155,204 | 9,326 |
| India (10.3%) |
| | Reliance Industries Ltd. | 637,676 | 21,640 |
| | Housing Development Finance Corp. Ltd. | 201,549 | 7,684 |
| | Larsen & Toubro Ltd. | 273,313 | 6,474 |
| * | Shriram Transport Finance Co. Ltd. | 327,200 | 6,303 |
| | ICICI Bank Ltd. ADR | 276,285 | 5,843 |
| | | Shares | Market
Value•
($000) |
| | UltraTech Cement Ltd. | 50,772 | 5,185 |
| * | Axis Bank Ltd. | 512,171 | 5,097 |
| | ICICI Bank Ltd. | 417,014 | 4,490 |
| * | Bharti Airtel Ltd (XNSE) | 442,134 | 4,056 |
| | Aurobindo Pharma Ltd. | 431,526 | 3,979 |
| | Mahindra & Mahindra Ltd. | 317,793 | 3,765 |
| | Tech Mahindra Ltd. | 165,680 | 3,279 |
| | Tata Consultancy Services Ltd. | 70,318 | 3,196 |
| 1 | HDFC Life Insurance Co. Ltd. | 301,838 | 2,745 |
| | State Bank of India | 403,611 | 2,716 |
| | Piramal Enterprises Ltd. | 58,911 | 2,053 |
| | Kotak Mahindra Bank Ltd. | 68,947 | 1,875 |
| * | IDFC First Bank Ltd. | 2,389,128 | 1,586 |
| | Hindustan Unilever Ltd. | 43,913 | 1,406 |
| | Maruti Suzuki India Ltd. | 13,742 | 1,376 |
| 1 | ICICI Lombard General Insurance Co. Ltd. | 52,443 | 1,039 |
| | Infosys Ltd. ADR | 44,455 | 990 |
| | Power Grid Corp. of India Ltd. | 393,032 | 974 |
| | Dabur India Ltd. | 111,878 | 876 |
| * | Glenmark Life Sciences Ltd. | 69,460 | 587 |
| | Apollo Hospitals Enterprise Ltd. | 9,723 | 555 |
| | Tata Steel Ltd. | 29,722 | 524 |
| * | Bharti Airtel Ltd. | 32,267 | 122 |
| | | | 100,415 |
| Indonesia (2.0%) |
| | Bank Rakyat Indonesia Persero Tbk PT | 34,095,325 | 10,235 |
| | Bank Mandiri Persero Tbk PT | 6,701,000 | 3,388 |
| | Semen Indonesia Persero Tbk PT | 4,406,000 | 2,831 |
| | Bank Central Asia Tbk PT | 3,860,945 | 2,042 |
| * | Mitra Adiperkasa Tbk PT | 11,215,496 | 697 |
| | Astra International Tbk PT | 1,450,097 | 618 |
| | Unilever Indonesia Tbk PT | 404,702 | 126 |
| | | | 19,937 |
| Japan (0.3%) |
| | Murata Manufacturing Co. Ltd. | 31,739 | 2,354 |
| * | Universal Entertainment Corp. | 28,400 | 675 |
| | | | 3,029 |
| Kazakhstan (0.0%) |
| | NAC Kazatomprom JSC GDR | 7,059 | 307 |
| Kenya (0.1%) |
| * | Equity Group Holdings plc | 2,544,143 | 1,138 |
| Mexico (1.5%) |
| * | Cemex SAB de CV ADR | 891,509 | 5,732 |
| | Grupo Financiero Banorte SAB de CV Class O | 825,108 | 5,224 |
| | America Movil SAB de CV Series L | 1,971,559 | 1,757 |
| | Wal-Mart de Mexico SAB de CV | 363,867 | 1,269 |
| | Grupo Mexico SAB de CV Series B | 128,445 | 564 |
| | | | 14,546 |
Emerging Markets Select Stock Fund
| | | Shares | Market
Value•
($000) |
| Netherlands (0.2%) |
| | ASML Holding NV | 2,502 | 2,034 |
| Other (0.2%) |
| 3 | Vanguard FTSE Emerging Markets ETF | 34,827 | 1,764 |
| Philippines (0.3%) |
| | Bdo Unibank Inc. | 789,385 | 1,943 |
| | Ayala Land Inc. | 1,631,632 | 1,136 |
| | | | 3,079 |
| Poland (0.3%) |
| *,1 | Allegro.eu SA | 133,365 | 1,510 |
| | KGHM Polska Miedz SA | 30,774 | 1,183 |
| | | | 2,693 |
| Romania (0.3%) |
| | Banca Transilvania SA | 4,352,156 | 2,554 |
| Russia (6.0%) |
| | LUKOIL PJSC ADR | 200,906 | 20,479 |
| | Sberbank of Russia PJSC ADR | 793,971 | 15,923 |
| | MMC Norilsk Nickel PJSC ADR | 194,907 | 6,091 |
| | Gazprom PJSC ADR | 529,853 | 5,199 |
| | Sberbank of Russia PJSC | 743,493 | 3,740 |
| | Moscow Exchange MICEX-RTS PJSC | 536,630 | 1,317 |
| | Novatek PJSC GDR (Registered) | 4,741 | 1,204 |
| * | Ozon Holdings plc ADR | 26,735 | 1,203 |
| | Magnit PJSC GDR (Registered) | 64,761 | 1,200 |
| | Mobile TeleSystems PJSC ADR | 114,321 | 1,051 |
| | Magnit PJSC | 6,203 | 566 |
| | MMC Norilsk Nickel PJSC | 1,273 | 397 |
| | | | 58,370 |
| Singapore (0.5%) |
| | Wilmar International Ltd. | 1,612,000 | 5,154 |
| * | Ezion Holdings Ltd. Warrants Exp. 4/16/23 | 2,242,476 | — |
| | | | 5,154 |
| South Africa (2.4%) |
| * | Sasol Ltd. | 366,233 | 6,151 |
| | AngloGold Ashanti Ltd. ADR | 265,713 | 4,910 |
| | FirstRand Ltd. | 664,964 | 2,526 |
| | Impala Platinum Holdings Ltd. | 145,991 | 1,889 |
| | Reunert Ltd. | 567,917 | 1,876 |
| | Gold Fields Ltd. | 148,673 | 1,382 |
| | Rand Merchant Investment Holdings Ltd. | 440,192 | 1,178 |
| | Old Mutual Ltd. (XZIM) | 987,529 | 1,009 |
| | Naspers Ltd. Class N | 4,519 | 765 |
| | Sibanye Stillwater Ltd. | 213,997 | 749 |
| | Ninety One plc | 164,817 | 585 |
| | Harmony Gold Mining Co. Ltd. | 112,180 | 403 |
| | | | 23,423 |
| South Korea (6.6%) |
| | Samsung Electronics Co. Ltd. | 244,217 | 14,622 |
| | SK Hynix Inc. | 74,887 | 6,601 |
| | LG Chem Ltd. | 8,979 | 6,443 |
| | | Shares | Market
Value•
($000) |
| | Hyundai Motor Co. | 30,513 | 5,457 |
| | POSCO | 16,576 | 4,204 |
| | Samsung SDI Co. Ltd. | 6,267 | 3,954 |
| | Samsung Electronics Co. Ltd. Preference Shares | 65,033 | 3,573 |
| | DB Insurance Co. Ltd. | 67,580 | 3,434 |
| | Hankook Tire & Technology Co. Ltd. | 86,762 | 3,074 |
| | Hana Financial Group Inc. | 57,145 | 2,203 |
| | Shinhan Financial Group Co. Ltd. | 66,550 | 2,173 |
| * | Korea Shipbuilding & Offshore Engineering Co. Ltd. | 21,091 | 1,865 |
| * | Krafton Inc. | 4,295 | 1,726 |
| | KB Financial Group Inc. | 32,680 | 1,582 |
| | NAVER Corp. | 4,167 | 1,449 |
| * | Coupang Inc. | 37,524 | 1,117 |
| | Doosan Bobcat Inc. | 31,315 | 1,023 |
| | | | 64,500 |
| Taiwan (11.8%) |
| | Taiwan Semiconductor Manufacturing Co. Ltd. | 2,963,659 | 62,890 |
| | MediaTek Inc. | 396,742 | 13,058 |
| | Hon Hai Precision Industry Co. Ltd. | 3,295,552 | 12,722 |
| | Lite-On Technology Corp. | 2,578,000 | 5,689 |
| | Compal Electronics Inc. | 5,081,000 | 4,471 |
| | ASE Technology Holding Co. Ltd. | 1,164,270 | 4,165 |
| | United Integrated Services Co. Ltd. | 388,000 | 2,565 |
| | Realtek Semiconductor Corp. | 111,585 | 2,007 |
| | Parade Technologies Ltd. | 27,703 | 1,785 |
| | E.Sun Financial Holding Co. Ltd. | 1,351,005 | 1,291 |
| | Globalwafers Co. Ltd. | 32,000 | 878 |
| | ASPEED Technology Inc. | 8,343 | 837 |
| | Airtac International Group | 23,369 | 699 |
| | China Steel Corp. | 501,000 | 604 |
| | Yageo Corp. | 38,000 | 595 |
| | ASMedia Technology Inc. | 8,649 | 507 |
| | Elite Material Co. Ltd. | 33,000 | 286 |
| | | | 115,049 |
| Thailand (1.9%) |
| | Siam Commercial Bank PCL NVDR | 1,466,800 | 5,577 |
| | Charoen Pokphand Foods PCL | 5,788,000 | 4,407 |
| | Kasikornbank PCL NVDR | 758,535 | 3,234 |
| | Bangkok Bank PCL NVDR | 469,100 | 1,736 |
| | CP ALL PCL | 725,800 | 1,402 |
| | Kasikornbank PCL | 195,000 | 831 |
| | Bangkok Bank PCL (Registered) | 215,800 | 799 |
| | Central Pattana PCL | 313,544 | 561 |
| | | | 18,547 |
| Turkey (0.9%) |
| | Akbank TAS | 4,650,486 | 2,815 |
| | Ford Otomotiv Sanayi A/S | 106,391 | 2,049 |
| | Tofas Turk Otomobil Fabrikasi A/S | 326,482 | 1,996 |
| | Eregli Demir ve Celik Fabrikalari TAS | 895,133 | 1,869 |
| | | | 8,729 |
Emerging Markets Select Stock Fund
| | | Shares | Market
Value•
($000) |
| United Arab Emirates (0.6%) |
| | Abu Dhabi Commercial Bank PJSC | 2,389,934 | 5,405 |
| * | Fertiglobe plc | 249,035 | 201 |
| | | | 5,606 |
| United Kingdom (1.6%) |
| | Standard Chartered plc | 914,940 | 6,188 |
| | Fresnillo plc | 239,962 | 2,824 |
| | Antofagasta plc | 122,965 | 2,399 |
| | Polymetal International plc | 122,113 | 2,257 |
| | Anglo American plc | 21,791 | 829 |
| | Ferrexpo plc | 74,388 | 317 |
| | Hikma Pharmaceuticals plc | 9,318 | 307 |
| | | | 15,121 |
| United States (3.3%) |
| * | Sea Ltd. ADR | 15,968 | 5,486 |
| | Cognizant Technology Solutions Corp. Class A | 63,989 | 4,997 |
| * | MercadoLibre Inc. | 3,245 | 4,806 |
| * | Flex Ltd. | 241,216 | 4,076 |
| | Freeport-McMoRan Inc. | 105,168 | 3,967 |
| | Credicorp Ltd. | 16,334 | 2,118 |
| * | Yandex NV Class A | 23,102 | 1,914 |
| * | Copa Holdings SA Class A | 22,139 | 1,637 |
| * | Afya Ltd. Class A | 90,236 | 1,575 |
| * | StoneCo. Ltd. Class A | 18,159 | 615 |
| * | XP Inc. Class A | 17,639 | 579 |
| *,4 | New Frontier Health Corp. | 29,293 | 329 |
| * | D-MARKET Elektronik Hizmetler ve Ticaret AS ADR | 48,821 | 222 |
| | | | 32,321 |
| Vietnam (0.1%) |
| 1 | Vinhomes JSC | 185,202 | 696 |
Total Common Stocks
(Cost $766,609) | 913,676 |
| | | Shares | Market
Value•
($000) |
| Temporary Cash Investments (6.1%) |
| Money Market Fund (6.1%) |
| 5,6 | Vanguard Market Liquidity Fund, 0.070% (Cost $59,590) | 595,944 | 59,595 |
| Total Investments (99.9%) (Cost $826,199) | 973,271 |
| Other Assets and Liabilities—Net (0.1%) | 1,138 |
| Net Assets (100%) | 974,409 |
| Cost is in $000. |
| • | See Note A in Notes to Financial Statements. |
| * | Non-income-producing security. |
| 1 | Security exempt from registration under Rule 144A of the Securities Act of 1933. Such securities may be sold in transactions exempt from registration, normally to qualified institutional buyers. At October 31, 2021, the aggregate value was $37,484,000, representing 3.8% of net assets. |
| 2 | Security value determined using significant unobservable inputs. |
| 3 | Considered an affiliated company of the fund as the issuer is another member of The Vanguard Group. |
| 4 | Includes partial security positions on loan to broker-dealers. The total value of securities on loan is $313,000. |
| 5 | Affiliated money market fund available only to Vanguard funds and certain trusts and accounts managed by Vanguard. Rate shown is the 7-day yield. |
| 6 | Collateral of $334,000 was received for securities on loan. |
| | ADR—American Depositary Receipt. |
| | GDR—Global Depositary Receipt. |
| | NVDR—Non-Voting Depository Receipt. |
Derivative Financial Instruments Outstanding as of Period End
| Futures Contracts |
| | | | ($000) |
| | Expiration | Number of
Long (Short)
Contracts | Notional
Amount | Value and
Unrealized
Appreciation
(Depreciation) |
| Long Futures Contracts | | | | |
| MSCI Emerging Markets Index | December 2021 | 677 | 42,719 | (239) |
| Forward Currency Contracts |
| | Contract
Settlement
Date | Contract Amount (000) | Unrealized
Appreciation
($000) | Unrealized
Depreciation
($000) |
| Counterparty | Receive | Deliver |
| State Street Bank & Trust Co. | 11/4/21 | ZAR | 2,361 | USD | 155 | — | — |
| USD—U.S. dollar. |
| ZAR—South African rand. |
See accompanying Notes, which are an integral part of the Financial Statements.
Emerging Markets Select Stock Fund
Statement of Assets and Liabilities
|
| ($000s, except shares and per-share amounts) | Amount |
| Assets | |
| Investments in Securities, at Value | |
| Unaffiliated Issuers (Cost $764,859) | 911,912 |
| Affiliated Issuers (Cost $61,340) | 61,359 |
| Total Investments in Securities | 973,271 |
| Investment in Vanguard | 33 |
| Cash | 3,090 |
| Cash Collateral Pledged—Futures Contracts | 2,547 |
| Foreign Currency, at Value (Cost $811) | 815 |
| Receivables for Investment Securities Sold | 1,747 |
| Receivables for Accrued Income | 1,228 |
| Receivables for Capital Shares Issued | 359 |
| Total Assets | 983,090 |
| Liabilities | |
| Payables for Investment Securities Purchased | 2,149 |
| Collateral for Securities on Loan | 334 |
| Payables to Investment Advisor | 1,333 |
| Payables for Capital Shares Redeemed | 997 |
| Payables to Vanguard | 81 |
| Variation Margin Payable—Futures Contracts | 629 |
| Deferred Foreign Capital Gains Taxes | 3,158 |
| Total Liabilities | 8,681 |
| Net Assets | 974,409 |
| At October 31, 2021, net assets consisted of: | |
| | |
| Paid-in Capital | 779,879 |
| Total Distributable Earnings (Loss) | 194,530 |
| Net Assets | 974,409 |
| |
| Net Assets | |
Applicable to 35,964,736 outstanding $.001 par value shares of
beneficial interest (unlimited authorization) | 974,409 |
| Net Asset Value Per Share | $27.09 |
See accompanying Notes, which are an integral part of the Financial Statements.
Emerging Markets Select Stock Fund
|
| | Year Ended
October 31, 2021 |
| | ($000) |
| Investment Income | |
| Income | |
| Dividends—Unaffiliated Issuers1 | 23,850 |
| Dividends—Affiliated Issuers | 56 |
| Interest—Unaffiliated Issuers | 2 |
| Interest—Affiliated Issuers | 45 |
| Securities Lending—Net | 68 |
| Total Income | 24,021 |
| Expenses | |
| Investment Advisory Fees—Note B | |
| Basic Fee | 4,946 |
| Performance Adjustment | 235 |
| The Vanguard Group—Note C | |
| Management and Administrative | 2,580 |
| Marketing and Distribution | 58 |
| Custodian Fees | 218 |
| Auditing Fees | 38 |
| Shareholders’ Reports | 13 |
| Trustees’ Fees and Expenses | 1 |
| Total Expenses | 8,089 |
| Net Investment Income | 15,932 |
| Realized Net Gain (Loss) | |
| Investment Securities Sold—Unaffiliated Issuers2 | 51,484 |
| Investment Securities Sold—Affiliated Issuers | 57 |
| Futures Contracts | 6,292 |
| Forward Currency Contracts | 12 |
| Foreign Currencies | (385) |
| Realized Net Gain (Loss) | 57,460 |
| Change in Unrealized Appreciation (Depreciation) | |
| Investment Securities—Unaffiliated Issuers3 | 78,532 |
| Investment Securities—Affiliated Issuers | 11 |
| Futures Contracts | (546) |
| Forward Currency Contracts | — |
| Change in Unrealized Appreciation (Depreciation) | 77,997 |
| Net Increase (Decrease) in Net Assets Resulting from Operations | 151,389 |
| 1 | Dividends are net of foreign withholding taxes of $2,399,000. |
| 2 | Realized gain (loss) is net of foreign capital gain taxes of $463,000. |
| 3 | The change in unrealized appreciation (depreciation) is net of the change in deferred foreign capital gains taxes of $2,901,000. |
See accompanying Notes, which are an integral part of the Financial Statements.
Emerging Markets Select Stock Fund
Statement of Changes in Net Assets
|
| | Year Ended October 31, |
| | 2021
($000) | 2020
($000) |
| | | |
| Increase (Decrease) in Net Assets | | |
| Operations | | |
| Net Investment Income | 15,932 | 9,363 |
| Realized Net Gain (Loss) | 57,460 | (15,205) |
| Change in Unrealized Appreciation (Depreciation) | 77,997 | 16,970 |
| Net Increase (Decrease) in Net Assets Resulting from Operations | 151,389 | 11,128 |
| Distributions | | |
| Total Distributions | (8,567) | (15,169) |
| Capital Share Transactions | | |
| Issued | 384,600 | 197,586 |
| Issued in Lieu of Cash Distributions | 7,584 | 13,238 |
| Redeemed | (230,893) | (238,050) |
| Net Increase (Decrease) from Capital Share Transactions | 161,291 | (27,226) |
| Total Increase (Decrease) | 304,113 | (31,267) |
| Net Assets | | |
| Beginning of Period | 670,296 | 701,563 |
| End of Period | 974,409 | 670,296 |
See accompanying Notes, which are an integral part of the Financial Statements.
Emerging Markets Select Stock Fund
For a Share Outstanding
Throughout Each Period | Year Ended October 31, |
| 2021 | 2020 | 2019 | 2018 | 2017 |
| Net Asset Value, Beginning of Period | $22.18 | $21.87 | $19.68 | $22.56 | $18.27 |
| Investment Operations | | | | | |
| Net Investment Income1 | .457 | .298 | .4742 | .414 | .413 |
| Net Realized and Unrealized Gain (Loss) on Investments | 4.729 | .483 | 2.208 | (2.943) | 4.129 |
| Total from Investment Operations | 5.186 | .781 | 2.682 | (2.529) | 4.542 |
| Distributions | | | | | |
| Dividends from Net Investment Income | (.276) | (.471) | (.492) | (.351) | (.252) |
| Distributions from Realized Capital Gains | — | — | — | — | — |
| Total Distributions | (.276) | (.471) | (.492) | (.351) | (.252) |
| Net Asset Value, End of Period | $27.09 | $22.18 | $21.87 | $19.68 | $22.56 |
| Total Return3 | 23.44% | 3.51% | 13.96% | -11.39% | 25.28% |
| Ratios/Supplemental Data | | | | | |
| Net Assets, End of Period (Millions) | $974 | $670 | $702 | $564 | $646 |
| Ratio of Total Expenses to Average Net Assets4 | 0.84% | 0.85% | 0.93% | 0.94% | 0.92% |
| Ratio of Net Investment Income to Average Net Assets | 1.65% | 1.43% | 2.25%2 | 1.85% | 2.04% |
| Portfolio Turnover Rate | 48% | 52% | 46% | 76% | 44% |
| 1 | Calculated based on average shares outstanding. |
| 2 | Net investment income per share and the ratio of net investment income to average net assets include $0.071 and 0.34%, respectively, resulting from a special dividend from Naspers Ltd. in September 2019. |
| 3 | Total returns do not include account service fees that may have applied in the periods shown. Fund prospectuses provide information about any applicable account service fees. |
| 4 | Includes performance-based investment advisory fee increases (decreases) of 0.02%, (0.01%), 0.07%, 0.05%, and (0.01%). |
See accompanying Notes, which are an integral part of the Financial Statements.
Emerging Markets Select Stock Fund
Notes to Financial Statements
Vanguard Emerging Markets Select Stock Fund is registered under the Investment Company Act of 1940 as an open-end investment company, or mutual fund.
The fund invests in securities of foreign issuers, which may subject it to investment risks not normally associated with investing in securities of U.S. corporations. Further, at October 31, 2021, the fund had a concentration of its investments in securities issued in China, and the performance of such investments may be impacted by the country's social, political, and economic conditions.
Market disruptions associated with the COVID-19 pandemic have had a global impact, and uncertainty exists as to the long-term implications. Such disruptions can adversely affect assets of the fund and thus fund performance.
| A. | The following significant accounting policies conform to generally accepted accounting principles for U.S. investment companies. The fund consistently follows such policies in preparing its financial statements. |
1. Security Valuation: Securities are valued as of the close of trading on the New York Stock Exchange (generally 4 p.m., Eastern time) on the valuation date. Equity securities are valued at the latest quoted sales prices or official closing prices taken from the primary market in which each security trades; such securities not traded on the valuation date are valued at the mean of the latest quoted bid and asked prices. Securities for which market quotations are not readily available, or whose values have been affected by events occurring before the fund’s pricing time but after the close of the securities’ primary markets, are valued at their fair values calculated according to procedures adopted by the board of trustees. These procedures include obtaining quotations from an independent pricing service, monitoring news to identify significant market- or security-specific events, and evaluating changes in the values of foreign market proxies (for example, ADRs, futures contracts, or exchange-traded funds), between the time the foreign markets close and the fund’s pricing time. When fair-value pricing is employed, the prices of securities used by a fund to calculate its net asset value may differ from quoted or published prices for the same securities.
Investments in Vanguard Market Liquidity Fund are valued at that fund's net asset value.
Temporary cash investments are valued using the latest bid prices or using valuations based on a matrix system (which considers such factors as security prices, yields, maturities, and ratings), both as furnished by independent pricing services.
2. Foreign Currency: Securities and other assets and liabilities denominated in foreign currencies are translated into U.S. dollars using exchange rates obtained from an independent third party as of the fund’s pricing time on the valuation date. Realized gains (losses) and unrealized appreciation (depreciation) on investment securities include the effects of changes in exchange rates since the securities were purchased, combined with the effects of changes in security prices. Fluctuations in the value of other assets and liabilities resulting from changes in exchange rates are recorded as unrealized foreign currency gains (losses) until the assets or liabilities are settled in cash, at which time they are recorded as realized foreign currency gains (losses).
3. Futures Contracts: The fund uses index futures contracts to a limited extent, with the objective of maintaining full exposure to the stock market while maintaining liquidity. The fund may purchase or sell futures contracts to achieve a desired level of investment, whether to accommodate portfolio turnover or cash flows from capital share transactions. The primary risks associated with the use of futures contracts are imperfect correlation between changes in market values of stocks held by the fund and the prices of futures contracts, and the possibility of an illiquid market. Counterparty risk involving futures is mitigated because a regulated clearinghouse is the counterparty instead of the clearing broker. To further mitigate counterparty risk, the fund trades
Emerging Markets Select Stock Fund
futures contracts on an exchange, monitors the financial strength of its clearing brokers and clearinghouse, and has entered into clearing agreements with its clearing brokers. The clearinghouse imposes initial margin requirements to secure the fund’s performance and requires daily settlement of variation margin representing changes in the market value of each contract. Any securities pledged as initial margin for open contracts are noted in the Schedule of Investments.
Futures contracts are valued at their quoted daily settlement prices. The notional amounts of the contracts are not recorded in the Statement of Assets and Liabilities. Fluctuations in the value of the contracts are recorded in the Statement of Assets and Liabilities as an asset (liability) and in the Statement of Operations as unrealized appreciation (depreciation) until the contracts are closed, when they are recorded as realized gains (losses) on futures contracts.
During the year ended October 31, 2021, the fund’s average investments in long and short futures contracts represented 5% and 0% of net assets, respectively, based on the average of the notional amounts at each quarter-end during the period.
4. Forward Currency Contracts: The fund enters into forward currency contracts to protect the value of securities and related receivables and payables against changes in future foreign exchange rates. The fund’s risks in using these contracts include movement in the values of the foreign currencies relative to the U.S. dollar and the ability of the counterparties to fulfill their obligations under the contracts. The fund mitigates its counterparty risk by entering into forward currency contracts only with a diverse group of prequalified counterparties, monitoring their financial strength, entering into master netting arrangements with its counterparties, and requiring its counterparties to transfer collateral as security for their performance. In the absence of a default, the collateral pledged or received by the fund cannot be repledged, resold, or rehypothecated. The master netting arrangements provide that, in the event of a counterparty’s default (including bankruptcy), the fund may terminate the forward currency contracts, determine the net amount owed by either party in accordance with its master netting arrangements, and sell or retain any collateral held up to the net amount owed to the fund under the master netting arrangements. The forward currency contracts contain provisions whereby a counterparty may terminate open contracts if the fund’s net assets decline below a certain level, triggering a payment by the fund if the fund is in a net liability position at the time of the termination. The payment amount would be reduced by any collateral the fund has pledged. Any securities pledged as collateral for open contracts are noted in the Schedule of Investments. The value of collateral received or pledged is compared daily to the value of the forward currency contracts exposure with each counterparty, and any difference, if in excess of a specified minimum transfer amount, is adjusted and settled within two business days.
Forward currency contracts are valued at their quoted daily prices obtained from an independent third party, adjusted for currency risk based on the expiration date of each contract. The notional amounts of the contracts are not recorded in the Statement of Assets and Liabilities. Fluctuations in the value of the contracts are recorded in the Statement of Assets and Liabilities as an asset (liability) and in the Statement of Operations as unrealized appreciation (depreciation) until the contracts are closed, when they are recorded as realized gains (losses) on forward currency contracts.
During the year ended October 31, 2021, the fund’s average investment in forward currency contracts represented less than 1% of net assets, based on the average of the notional amounts at each quarter-end during the period.
Emerging Markets Select Stock Fund
5. Federal Income Taxes: The fund intends to continue to qualify as a regulated investment company and distribute all of its taxable income. The fund’s tax returns are open to examination by the relevant tax authorities until expiration of the applicable statute of limitations, which is generally three years after the filing of the tax return. Management has analyzed the fund’s tax positions taken for all open federal and state income tax years, and has concluded that no provision for income tax is required in the fund’s financial statements.
6. Distributions: Distributions to shareholders are recorded on the ex-dividend date. Distributions are determined on a tax basis at the fiscal year-end and may differ from net investment income and realized capital gains for financial reporting purposes.
7. Securities Lending: To earn additional income, the fund lends its securities to qualified institutional borrowers. Security loans are subject to termination by the fund at any time, and are required to be secured at all times by collateral in an amount at least equal to the market value of securities loaned. Daily market fluctuations could cause the value of loaned securities to be more or less than the value of the collateral received. When this occurs, the collateral is adjusted and settled before the opening of the market on the next business day. The fund further mitigates its counterparty risk by entering into securities lending transactions only with a diverse group of prequalified counterparties, monitoring their financial strength, and entering into master securities lending agreements with its counterparties. The master securities lending agreements provide that, in the event of a counterparty’s default (including bankruptcy), the fund may terminate any loans with that borrower, determine the net amount owed, and sell or retain the collateral up to the net amount owed to the fund; however, such actions may be subject to legal proceedings. While collateral mitigates counterparty risk, in the event of a default, the fund may experience delays and costs in recovering the securities loaned. The fund invests cash collateral received in Vanguard Market Liquidity Fund, and records a liability in the Statement of Assets and Liabilities for the return of the collateral, during the period the securities are on loan. Collateral investments in Vanguard Market Liquidity Fund are subject to market appreciation or depreciation. Securities lending income represents fees charged to borrowers plus income earned on invested cash collateral, less expenses associated with the loan. During the term of the loan, the fund is entitled to all distributions made on or in respect of the loaned securities.
8. Credit Facilities and Interfund Lending Program: The fund and certain other funds managed by The Vanguard Group ("Vanguard") participate in a $4.3 billion committed credit facility provided by a syndicate of lenders pursuant to a credit agreement and an uncommitted credit facility provided by Vanguard. Both facilities may be renewed annually. Each fund is individually liable for its borrowings, if any, under the credit facilities. Borrowings may be utilized for temporary or emergency purposes, subject to the fund’s regulatory and contractual borrowing restrictions. With respect to the committed credit facility, the participating funds are charged administrative fees and an annual commitment fee of 0.10% of the undrawn committed amount of the facility; these fees are allocated to the funds based on a method approved by the fund’s board of trustees and included in Management and Administrative expenses on the fund’s Statement of Operations. Any borrowings under either facility bear interest at a rate based upon the higher of the one-month London Interbank Offered Rate (or an acceptable alternate rate, if necessary), federal funds effective rate, or overnight bank funding rate plus an agreed-upon spread, except that borrowings under the uncommitted credit facility may bear interest based upon an alternate rate agreed to by the fund and Vanguard.
In accordance with an exemptive order (the “Order”) from the SEC, the fund may participate in a joint lending and borrowing program that allows registered open-end Vanguard funds to borrow
Emerging Markets Select Stock Fund
money from and lend money to each other for temporary or emergency purposes (the “Interfund Lending Program”), subject to compliance with the terms and conditions of the Order, and to the extent permitted by the fund’s investment objective and investment policies. Interfund loans and borrowings normally extend overnight, but can have a maximum duration of seven days. Loans may be called on one business day’s notice. The interest rate to be charged is governed by the conditions of the Order and internal procedures adopted by the board of trustees. The board of trustees is responsible for overseeing the Interfund Lending Program.
For the year ended October 31, 2021, the fund did not utilize the credit facilities or the Interfund Lending Program.
9. Other: Dividend income is recorded on the ex-dividend date. Non-cash dividends included in income, if any, are recorded at the fair value of the securities received. Interest income includes income distributions received from Vanguard Market Liquidity Fund and is accrued daily. Premiums and discounts on debt securities are amortized and accreted, respectively, to interest income over the lives of the respective securities, except for premiums on certain callable debt securities that are amortized to the earliest call date. Security transactions are accounted for on the date securities are bought or sold. Costs used to determine realized gains (losses) on the sale of investment securities are those of the specific securities sold.
Taxes on foreign dividends and capital gains have been provided for in accordance with the fund’s understanding of the applicable countries’ tax rules and rates. Deferred foreign capital gains tax, if any, is accrued daily based upon net unrealized gains.
| B. | The investment advisory firms Wellington Management Company llp, Baillie Gifford Overseas Ltd., Oaktree Capital Management, L.P., and Pzena Investment Management, LLC, each provide investment advisory services to a portion of the fund for a fee calculated at an annual percentage rate of average net assets managed by the advisor. The basic fees of Wellington Management Company llp, Baillie Gifford Overseas Ltd., Oaktree Capital Management, L.P., and Pzena Investment Management, LLC are subject to quarterly adjustments based on performance relative to the FTSE Emerging Index for the preceding three years. |
Vanguard manages the cash reserves of the fund as described below.
For the year ended October 31, 2021, the aggregate investment advisory fee paid to all advisors represented an effective annual basic rate of 0.51% of the fund’s average net assets, before a net increase of $235,000 (0.02%) based on performance.
| C. | In accordance with the terms of a Funds' Service Agreement (the “FSA”) between Vanguard and the fund, Vanguard furnishes to the fund corporate management, administrative, marketing, distribution and cash management services at Vanguard’s cost of operations (as defined by the FSA). These costs of operations are allocated to the fund based on methods and guidelines approved by the board of trustees and are generally settled twice a month. |
Upon the request of Vanguard, the fund may invest up to 0.40% of its net assets as capital in Vanguard. At October 31, 2021, the fund had contributed to Vanguard capital in the amount of $33,000, representing less than 0.01% of the fund’s net assets and 0.01% of Vanguard’s capital received pursuant to the FSA. The fund’s trustees and officers are also directors and employees, respectively, of Vanguard.
Emerging Markets Select Stock Fund
| D. | Various inputs may be used to determine the value of the fund’s investments and derivatives. These inputs are summarized in three broad levels for financial statement purposes. The inputs or methodologies used to value securities are not necessarily an indication of the risk associated with investing in those securities. |
Level 1—Quoted prices in active markets for identical securities.
Level 2—Other significant observable inputs (including quoted prices for similar securities, interest rates, prepayment speeds, credit risk, etc.).
Level 3—Significant unobservable inputs (including the fund’s own assumptions used to determine the fair value of investments). Any investments and derivatives valued with significant unobservable inputs are noted on the Schedule of Investments.
The following table summarizes the market value of the fund’s investments and derivatives as of October 31, 2021, based on the inputs used to value them:
| | Level 1
($000) | Level 2
($000) | Level 3
($000) | Total
($000) |
| Investments | | | | |
| Assets | | | | |
| Common Stocks—North and South America | 127,214 | — | — | 127,214 |
| Common Stocks—Other | 54,185 | 732,277 | — | 786,462 |
| Temporary Cash Investments | 59,595 | — | — | 59,595 |
| Total | 240,994 | 732,277 | — | 973,271 |
| Derivative Financial Instruments | | | | |
| Liabilities | | | | |
| Futures Contracts1 | 239 | — | — | 239 |
| Forward Currency Contracts | — | — | — | — |
| Total | 239 | — | — | 239 |
| 1 | Includes cumulative appreciation (depreciation) on futures contracts and centrally cleared swaps, if any, as reported in the Schedule of Investments. Only current day’s variation margin is reported within the Statement of Assets and Liabilities. |
| E. | At October 31, 2021, the fair values of derivatives were reflected in the Statement of Assets and Liabilities as follows: |
| Statement of Assets and Liabilities | Equity
Contracts
($000) | Foreign
Exchange
Contracts
($000) | Total
($000) |
| Unrealized Depreciation—Futures Contracts1 | 239 | — | 239 |
| 1 | Includes cumulative appreciation (depreciation) on futures contracts and centrally cleared swaps, if any, as reported in the Schedule of Investments. Only current day’s variation margin is reported within the Statement of Assets and Liabilities. |
Realized net gain (loss) and the change in unrealized appreciation (depreciation) on derivatives for the year ended October 31, 2021, were:
| Realized Net Gain (Loss) on Derivatives | Equity
Contracts
($000) | Foreign
Exchange
Contracts
($000) | Total
($000) |
| Futures Contracts | 6,292 | — | 6,292 |
Emerging Markets Select Stock Fund
| | Equity
Contracts
($000) | Foreign
Exchange
Contracts
($000) | Total
($000) |
| Forward Currency Contracts | — | 12 | 12 |
| Realized Net Gain (Loss) on Derivatives | 6,292 | 12 | 6,304 |
| Change in Unrealized Appreciation (Depreciation) on Derivatives |
| Futures Contracts | (546) | — | (546) |
| Forward Currency Contracts | — | — | — |
| Change in Unrealized Appreciation (Depreciation) on Derivatives | (546) | — | (546) |
| F. | Permanent differences between book-basis and tax-basis components of net assets are reclassified among capital accounts in the financial statements to reflect their tax character. These reclassifications have no effect on net assets or net asset value per share. As of period end, permanent differences primarily attributable to the accounting for foreign currency transactions, passive foreign investment companies, distributions in connection with fund share redemptions, and tax expense on capital gains were reclassified between the following accounts: |
| | Amount
($000) |
| Paid-in Capital | 4,749 |
| Total Distributable Earnings (Loss) | (4,749) |
Temporary differences between book-basis and tax-basis components of total distributable earnings (loss) arise when certain items of income, gain, or loss are recognized in different periods for financial statement and tax purposes; these differences will reverse at some time in the future. The differences are primarily related to the deferral of losses from wash sales; the recognition of unrealized gains or losses from certain derivative contracts; and the recognition of unrealized gains from passive foreign investment companies. As of period end, the tax-basis components of total distributable earnings (loss) are detailed in the table as follows:
| | Amount
($000) |
| Undistributed Ordinary Income | 29,043 |
| Undistributed Long-Term Gains | 26,325 |
| Capital Loss Carryforwards | — |
| Qualified Late-Year Losses | — |
| Net Unrealized Gains (Losses) | 139,162 |
The tax character of distributions paid was as follows:
| | Year Ended October 31, |
| | 2021
Amount
($000) | 2020
Amount
($000) |
| Ordinary Income* | 8,567 | 15,169 |
| Long-Term Capital Gains | — | — |
| Total | 8,567 | 15,169 |
| * | Includes short-term capital gains, if any. |
Emerging Markets Select Stock Fund
As of October 31, 2021, gross unrealized appreciation and depreciation for investments and derivatives based on cost for U.S. federal income tax purposes were as follows:
| | Amount
($000) |
| Tax Cost | 830,930 |
| Gross Unrealized Appreciation | 228,715 |
| Gross Unrealized Depreciation | (86,374) |
| Net Unrealized Appreciation (Depreciation) | 142,341 |
| G. | During the year ended October 31, 2021, the fund purchased $570,937,000 of investment securities and sold $421,461,000 of investment securities, other than temporary cash investments. |
The fund purchased securities from and sold securities to other funds or accounts managed by its investment advisor(s) or their affiliates, in accordance with procedures adopted by the board of trustees in compliance with Rule 17a-7 of the Investment Company Act of 1940. For the year ended October 31, 2021, such purchases were $488,000 and sales were $0; these amounts, other than temporary cash investments, are included in the purchases and sales of investment securities noted above.
| H. | Capital shares issued and redeemed were: |
| | Year Ended October 31, |
| | 2021
Shares
(000) | 2020
Shares
(000) |
| | | |
| Issued | 13,807 | 9,613 |
| Issued in Lieu of Cash Distributions | 294 | 579 |
| Redeemed | (8,359) | (12,051) |
| Net Increase (Decrease) in Shares Outstanding | 5,742 | (1,859) |
| I. | Transactions during the period in investments where the issuer is another member of The Vanguard Group were as follows: |
| | | Current Period Transactions | |
| | Oct. 31,
2020
Market
Value
($000) | Purchases
at Cost
($000) | Proceeds
from
Securities
Sold
($000) | Realized
Net
Gain
(Loss)
($000) | Change in
Unrealized
App. (Dep.)
($000) | Income
($000) | Capital Gain
Distributions
Received
($000) | Oct. 31,
2021
Market
Value
($000) |
| Vanguard FTSE Emerging Markets ETF | 1,306 | 27,814 | 27,424 | 57 | 11 | 56 | — | 1,764 |
| Vanguard Market Liquidity Fund | 37,445 | NA1 | NA1 | — | — | 45 | — | 59,595 |
| Total | 38,751 | | | 57 | 11 | 101 | — | 61,359 |
| 1 | Not applicable—purchases and sales are for temporary cash investment purposes. |
| J. | Management has determined that no events or transactions occurred subsequent to October 31, 2021, that would require recognition or disclosure in these financial statements. |
Report of Independent Registered Public Accounting Firm
To the Board of Trustees of Vanguard Trustees' Equity Fund and Shareholders of Vanguard Emerging Markets Select Stock Fund
Opinion on the Financial Statements
We have audited the accompanying statement of assets and liabilities, including the schedule of investments, of Vanguard Emerging Markets Select Stock Fund (one of the funds constituting Vanguard Trustees' Equity Fund, referred to hereafter as the "Fund") as of October 31, 2021, the related statement of operations for the year ended October 31, 2021, the statement of changes in net assets for each of the two years in the period ended October 31, 2021, including the related notes, and the financial highlights for each of the five years in the period ended October 31, 2021 (collectively referred to as the "financial statements"). In our opinion, the financial statements present fairly, in all material respects, the financial position of the Fund as of October 31, 2021, the results of its operations for the year then ended, the changes in its net assets for each of the two years in the period ended October 31, 2021 and the financial highlights for each of the five years in the period ended October 31, 2021 in conformity with accounting principles generally accepted in the United States of America.
Basis for Opinion
These financial statements are the responsibility of the Fund’s management. Our responsibility is to express an opinion on the Fund’s financial statements based on our audits. We are a public accounting firm registered with the Public Company Accounting Oversight Board (United States) (PCAOB) and are required to be independent with respect to the Fund in accordance with the U.S. federal securities laws and the applicable rules and regulations of the Securities and Exchange Commission and the PCAOB.
We conducted our audits of these financial statements in accordance with the standards of the PCAOB. Those standards require that we plan and perform the audit to obtain reasonable assurance about whether the financial statements are free of material misstatement, whether due to error or fraud.
Our audits included performing procedures to assess the risks of material misstatement of the financial statements, whether due to error or fraud, and performing procedures that respond to those risks. Such procedures included examining, on a test basis, evidence regarding the amounts and disclosures in the financial statements. Our audits also included evaluating the accounting principles used and significant estimates made by management, as well as evaluating the overall presentation of the financial statements. Our procedures included confirmation of securities owned as of October 31, 2021 by correspondence with the custodian, transfer agent and brokers; when replies were not received from the transfer agent or brokers, we performed other auditing procedures. We believe that our audits provide a reasonable basis for our opinion.
/s/PricewaterhouseCoopers LLP
Philadelphia, Pennsylvania
December 17, 2021
We have served as the auditor of one or more investment companies in The Vanguard Group of Funds since 1975.
Special 2021 tax information (unaudited) for Vanguard Emerging Markets Select Stock Fund
This information for the fiscal year ended October 31, 2021, is included pursuant to provisions of the Internal Revenue Code.
The fund distributed $2,234,000 as capital gain dividends (20% rate gain distributions) to shareholders during the fiscal year.
For nonresident alien shareholders, 100% of short-term capital gain dividends distributed by the fund are qualified short-term capital gains.
The fund distributed $7,263,000 of qualified dividend income to shareholders during the fiscal year.
The fund designates to shareholders foreign source income of $26,146,000 and foreign taxes paid of $2,636,000. Shareholders will receive more detailed information with their Form 1099-DIV in January 2022 to determine the calendar-year amounts to be included on their 2021 tax returns.
This page intentionally left blank.
The People Who Govern Your Fund
The trustees of your mutual fund are there to see that the fund is operated and managed in your best interests since, as a shareholder, you are a part owner of the fund. Your fund’s trustees also serve on the board of directors of The Vanguard Group, Inc., which is owned by the Vanguard funds and provides services to them.
A majority of Vanguard’s board members are independent, meaning that they have no affiliation with Vanguard or the funds they oversee, apart from the sizable personal investments they have made as private individuals. The independent board members have distinguished backgrounds in business, academia, and public service. Each of the trustees and executive officers oversees 214 Vanguard funds.
Information for each trustee and executive officer of the fund appears below. That information, as well as the Vanguard fund count, is as of the date on the cover of this fund report. The mailing address of the trustees and officers is P.O. Box 876, Valley Forge, PA 19482. More information about the trustees is in the Statement of Additional Information, which can be obtained, without charge, by contacting Vanguard at 800-662-7447, or online at vanguard.com.
Interested Trustee1
Mortimer J. Buckley
Born in 1969. Trustee since January 2018. Principal occupation(s) during the past five years and other experience: chairman of the board (2019–present) of Vanguard and of each of the investment companies served by Vanguard; chief executive officer (2018–present) of Vanguard; chief executive officer, president, and trustee (2018–present) of each of the investment companies served by Vanguard; president and director (2017–present) of Vanguard; and president (2018–present) of Vanguard Marketing Corporation. Chief investment officer (2013–2017), managing director (2002–2017), head of the Retail Investor Group (2006–2012), and chief information officer (2001–2006) of Vanguard. Chairman of the board (2011–2017) and trustee (2009–2017) of the Children’s Hospital of Philadelphia; and trustee (2018–present) and vice chair (2019–present) of The Shipley School.
Independent Trustees
Emerson U. Fullwood
Born in 1948. Trustee since January 2008. Principal occupation(s) during the past five years and other experience: executive chief staff and marketing officer for North America and corporate vice president (retired 2008) of Xerox Corporation (document management products and services). Former president of the Worldwide Channels Group, Latin
America, and Worldwide Customer Service and executive chief staff officer of Developing Markets of Xerox. Executive in residence and 2009–2010 Distinguished Minett Professor at the Rochester Institute of Technology. Director of SPX FLOW, Inc. (multi-industry manufacturing). Director of the University of Rochester Medical Center, the Monroe Community College Foundation, the United Way of Rochester, North Carolina A&T University, and Roberts Wesleyan College. Trustee of the University of Rochester.
Amy Gutmann
Born in 1949. Trustee since June 2006. Principal occupation(s) during the past five years and other experience: president (2004–present) of the University of Pennsylvania. Christopher H. Browne Distinguished Professor of Political Science, School of Arts and Sciences, and professor of communication, Annenberg School for Communication, with secondary faculty appointments in the Department of Philosophy, School of Arts and Sciences, and at the Graduate School of Education, University of Pennsylvania.
F. Joseph Loughrey
Born in 1949. Trustee since October 2009. Principal occupation(s) during the past five years and other experience: president and chief operating officer (retired 2009) and vice chairman of the board (2008–2009) of Cummins Inc. (industrial machinery). Chairman of the board of Hillenbrand, Inc. (specialized consumer services). Director of the V Foundation.
1 Mr. Buckley is considered an “interested person,” as defined in the Investment Company Act of 1940, because he is an officer of the Vanguard funds.
Member of the advisory council for the College of Arts and Letters and chair of the advisory board to the Kellogg Institute for International Studies, both at the University of Notre Dame. Chairman of the board of Saint Anselm College.
Mark Loughridge
Born in 1953. Trustee since March 2012. Principal occupation(s) during the past five years and other experience: senior vice president and chief financial officer (retired 2013) of IBM (information technology services). Fiduciary member of IBM’s Retirement Plan Committee (2004–2013), senior vice president and general manager (2002–2004) of IBM Global Financing, vice president and controller (1998–2002) of IBM, and a variety of other prior management roles at IBM. Member of the Council on Chicago Booth.
Scott C. Malpass
Born in 1962. Trustee since March 2012. Principal occupation(s) during the past five years and other experience: chief investment officer (retired June 2020) and vice president (retired June 2020) of the University of Notre Dame. Assistant professor (retired June 2020) of finance at the Mendoza College of Business, University of Notre Dame, and member of the Notre Dame 403(b) Investment Committee. Member of the board of Catholic Investment Services, Inc. (investment advisors) and the board of superintendence of the Institute for the Works of Religion.
Deanna Mulligan
Born in 1963. Trustee since January 2018. Principal occupation(s) during the past five years and other experience: board chair (2020), chief executive officer (2011–2020), and president (2010–2019) of The Guardian Life Insurance Company of America. Chief operating officer (2010–2011) and executive vice president (2008–2010) of Individual Life and Disability of the Guardian Life Insurance Company of America. Member of the board of the Economic Club of New York. Trustee of the Partnership for New York City (business leadership), Chief Executives for Corporate Purpose, NewYork-Presbyterian Hospital, and the Bruce Museum (arts and science). Member of the Advisory Council for the Stanford Graduate School of Business.
André F. Perold
Born in 1952. Trustee since December 2004. Principal occupation(s) during the past five years and other experience: George Gund Professor of Finance and Banking, Emeritus at the Harvard Business School (retired 2011). Chief investment officer and co-managing partner of HighVista Strategies (private investment firm). Member of the board
(2018–present) of RIT Capital Partners (investment firm). Member of the investment committee of Partners Health Care System.
Sarah Bloom Raskin
Born in 1961. Trustee since January 2018. Principal occupation(s) during the past five years and other experience: deputy secretary (2014–2017) of the United States Department of the Treasury. Governor (2010–2014) of the Federal Reserve Board. Commissioner (2007–2010) of financial regulation for the State of Maryland. Professor (2020–present), Distinguished Fellow of the Global Financial Markets Center (2020–present), and Rubenstein Fellow (2017–2020) at Duke University. Trustee (2017–present) of Amherst College and member of Amherst College Investment Committee (2019–present). Member of the Regenerative Crisis Response Committee (2020–present).
David A. Thomas
Born in 1956. Trustee since July 2021. Principal occupation(s) during the past five years and other experience: president of Morehouse College (2018–present). Professor of business administration, emeritus at Harvard University (2017–2018). Dean (2011–2016) and professor of management (2016–2017) at the Georgetown University McDonough School of Business. Director of DTE Energy Company (2013–present). Trustee of Common Fund (2019–present).
Peter F. Volanakis
Born in 1955. Trustee since July 2009. Principal occupation(s) during the past five years and other experience: president and chief operating officer (retired 2010) of Corning Incorporated (communications equipment) and director of Corning Incorporated (2000–2010) and Dow Corning (2001–2010). Director (2012) of SPX Corporation (multi-industry manufacturing). Overseer of the Amos Tuck School of Business Administration, Dartmouth College (2001–2013). Chairman of the board of trustees of Colby-Sawyer College. Member of the BMW Group Mobility Council.
Executive Officers
Christine M. Buchanan
Born in 1970. Principal occupation(s) during the past five years and other experience: principal of Vanguard. Chief financial officer (2021–present) and treasurer (2017–present) of each of the investment companies served by Vanguard. Partner (2005–2017) at KPMG (audit, tax, and advisory services).
David Cermak
Born in 1960. Principal occupation(s) during the past five years and other experience: principal of Vanguard. Finance director (2019–present) of each of the investment companies served by Vanguard. Managing director and head (2017–present) of Vanguard Investments Singapore. Managing director and head (2017–2019) of Vanguard Investments Hong Kong. Representative director and head (2014–2017) of Vanguard Investments Japan.
John Galloway
Born in 1973. Principal occupation(s) during the past five years and other experience: principal of Vanguard. Investment stewardship officer (September 2020–present) of each of the investment companies served by Vanguard. Head of Investor Advocacy (February 2020–present) and head of Marketing Strategy and Planning (2017–2020) at Vanguard. Deputy assistant to the President of the United States (2015).
Peter Mahoney
Born in 1974. Principal occupation(s) during the past five years and other experience: principal of Vanguard. Controller (2015–present) of each of the investment companies served by Vanguard. Head of International Fund Services (2008–2014) at Vanguard.
Anne E. Robinson
Born in 1970. Principal occupation(s) during the past five years and other experience: general counsel (2016–present) of Vanguard. Secretary (2016–present) of Vanguard and of each of the investment companies served by Vanguard. Managing director (2016–present) of Vanguard. Managing director and general counsel of Global Cards and Consumer Services (2014–2016) at Citigroup. Counsel (2003–2014) at American Express.
Michael Rollings
Born in 1963. Principal occupation(s) during the past five years and other experience: finance director (2017–present) and treasurer (2017) of each of the investment companies served by Vanguard. Managing director (2016–present) of Vanguard. Chief financial officer (2016–present) of Vanguard. Director (2016–present) of Vanguard Marketing Corporation. Executive vice president and chief financial officer (2006–2016) of MassMutual Financial Group.
John E. Schadl
Born in 1972. Principal occupation(s) during the past five years and other experience: principal of Vanguard. Chief compliance officer (2019–present) of Vanguard and of each of the investment companies served by Vanguard. Assistant vice president (2019–present) of Vanguard Marketing Corporation.
Vanguard Senior Management Team
| Matthew Benchener | Thomas M. Rampulla |
| Joseph Brennan | Karin A. Risi |
| Mortimer J. Buckley | Anne E. Robinson |
| Gregory Davis | Michael Rollings |
| John James | Nitin Tandon |
| John T. Marcante | Lauren Valente |
| Chris D. Mclsaac | |
Connect with Vanguard®>vanguard.com
Fund Information > 800-662-7447
Direct Investor Account Services > 800-662-2739
Institutional Investor Services > 800-523-1036
Text Telephone for People Who Are Deaf or Hard of Hearing > 800-749-7273
This material may be used in conjunction with the offering of shares of any Vanguard fund only if preceded or accompanied by the fund’s current prospectus.
All comparative mutual fund data are from Morningstar, Inc., unless otherwise noted.
You can obtain a free copy of Vanguard’s proxy voting guidelines by visiting vanguard.com/proxyreporting or by calling Vanguard at 800-662-2739. The guidelines are also available from the SEC’s website, www.sec.gov. In addition, you may obtain a free report on how your fund voted the proxies for securities it owned during the 12 months ended June 30. To get the report, visit either vanguard.com/proxyreporting or www.sec.gov.
You can review information about your fund on the SEC’s website, and you can receive copies of this information, for a fee, by sending a request via email addressed to publicinfo@sec.gov.
Source for Bloomberg indexes: Bloomberg Index Services Limited. Copyright 2021, Bloomberg. All rights reserved.
CFA® is a registered trademark owned by CFA Institute.
© 2021 The Vanguard Group, Inc.
All rights reserved.
Vanguard Marketing Corporation, Distributor.
Q7520 122021
Annual Report | October 31, 2021
Vanguard Alternative Strategies Fund
Contents
Your Fund’s Performance at a Glance
| 1 |
Advisor’s Report
| 2 |
About Your Fund’s Expenses
| 5 |
Performance Summary
| 7 |
Consolidated Financial Statements
| 9 |
Please note: The opinions expressed in this report are just that—informed opinions. They should not be considered promises or advice. Also, please keep in mind that the information and opinions cover the period through the date on the front of this report. Of course, the risks of investing in your fund are spelled out in the prospectus.
Your Fund’s Performance at a Glance
| • | Vanguard Alternative Strategies Fund returned –0.12% for the 12 months ended October 31, 2021. Its benchmark, the FTSE 3-Month Treasury Bill Index, returned 0.05%. |
| • | The fund seeks to generate returns using a combination of alternative strategies that collectively are expected to have low correlation with traditional capital markets. These strategies are long/short equity, event-driven, fixed income relative value, currencies, equity futures, and commodity-linked investments. |
| • | Long/short equity and fixed income relative value produced the lowest returns during the period. Long/short equity was hurt by our focus on low-volatility names, which underperformed. Fixed income relative value was held back amid concerns about inflation and the prospect that some central banks might scale back their bond-buying programs or raise interest rates. |
| • | Currencies, event-driven strategies, and commodities were all in positive territory and were our strongest performers. |
| • | The diversification resulting from the fund’s variety of exposures helped reduce overall volatility compared with the broad U.S. stock market. |
| • | The fund regularly uses derivatives to hedge portfolio risks. Its holdings in forward foreign currencies and futures contributed to total returns. |
Market Barometer
| | Average Annual Total Returns
Periods Ended October 31, 2021 |
| | One Year | Three Years | Five Years |
| Stocks | | | |
| Russell 1000 Index (Large-caps) | 43.51% | 22.01% | 19.16% |
| Russell 2000 Index (Small-caps) | 50.80 | 16.47 | 15.52 |
| Russell 3000 Index (Broad U.S. market) | 43.90 | 21.62 | 18.91 |
| FTSE All-World ex US Index (International) | 30.23 | 12.42 | 10.05 |
| Bonds | | | |
Bloomberg U.S. Aggregate Bond Index
(Broad taxable market) | -0.48% | 5.63% | 3.10% |
Bloomberg Municipal Bond Index
(Broad tax-exempt market) | 2.64 | 5.17 | 3.41 |
| FTSE Three-Month U.S. Treasury Bill Index | 0.05 | 1.08 | 1.12 |
| CPI | | | |
| Consumer Price Index | 6.22% | 3.03% | 2.73% |
For the 12 months ended October 31, 2021, Vanguard Alternative Strategies Fund returned –0.12%. The fund fell short of its benchmark, the FTSE 3-Month Treasury Bill Index, which returned 0.05%.
Investment objective and strategy
The Alternative Strategies Fund seeks both capital appreciation and low correlations with the returns of stock and bond markets. We target a fixed range of volatility but still expect to produce a portfolio with lower volatility than the broader U.S. stock market. This fixed range of volatility may change from time to time. We consider the risk levels of the individual strategies, composition of the portfolio, and market conditions when determining the fixed volatility range.
To achieve these objectives, we combine six alternative investment strategies that span multiple asset classes: equities, fixed income, currencies, and commodities. Each strategy can use long and short positions to try to minimize market exposure while attempting to capture attractive risk premiums. Individually, the strategies are expected to have low long-term correlation with one another and with traditional capital markets.
In addition, the fund can use limited amounts of leverage as it seeks to match the expected risk profile for each strategy. The goal is to achieve a similar risk profile across the portfolio to maximize diversification and performance.
The strategies the fund currently employs are:
| • | Long/short equity. This approach focuses on building a long/short portfolio of equity securities based on their volatility characteristics by executing long positions in low-volatility stocks and short positions in high-volatility stocks. It seeks to capture a risk-adjusted spread by constructing positions to reduce the net market exposure of the overall portfolio to general market movements (beta). |
| • | Event-driven. This strategy seeks to profit from the expectation that a specific event or catalyst (such as a merger/acquisition deal closure) will affect the stock price of a U.S. or foreign company. |
| • | Fixed income relative value. This approach seeks to exploit the steepness of the U.S. Treasury yield curve that is created by investors’ desire to hold shorter-maturity bonds because they tend to be more liquid (easily traded) and less sensitive to growth and inflation risk. We try to capture this premium by investing in Treasury futures with longer times to maturity and borrowing those with short maturities. |
| • | Currencies. The fund seeks to benefit from expected currency movements across countries by using long and short foreign currency exchange forward contracts. It does this by selling currencies of countries with poor fundamental characteristics and buying those of countries with strong ones. |
| • | Commodity-linked investments. This strategy seeks to capture the risk premium associated with inventory levels of commodities, which are reflected in the prices of their futures contracts. We take long positions in commodities whose prices are expected to rise because of limited inventory and short positions in those whose prices are expected to fall. |
| • | Equity futures. The fund uses long and short positions in global equity index futures to capture excess return opportunities. The strategy seeks to benefit from global differences in market and fundamental characteristics by buying equity index futures with strong characteristics and selling equity index futures with poor characteristics. |
Investment environment
The world economy’s recovery from the 2020 pandemic-induced contraction was quicker than many had expected. Countries that have been better at containing the virus have generally been more successful economically. Swift, extensive fiscal and monetary support from policymakers was also key to the rebound.
Even amid concerns toward the end of the fiscal year about inflation and the prospect of less accommodative monetary policy, stock returns for the period were excellent. The FTSE All-World Index returned 37.59% for the period.
Bond yields moved higher across much of the developed world during the fiscal year amid concerns about inflation and the prospect that some developed-market
central banks might scale back their bond-buying programs or raise interest rates.
The environment for commodities was one of the most attractive in years because of limited supply and increased demand worldwide. West Texas Intermediate crude oil and natural gas, both of which were hit hard by a sharp drop in demand in 2020, recovered strongly over the past 12 months. Safe-haven commodities, such as gold, lagged.
Successes and shortfalls
Our long/short equity and fixed income relative value holdings were in negative territory. Our positions in long/short equity were hurt by our focus on low-volatility names, which underperformed. Fixed income relative value was held back amid concerns about inflation and the prospect that some central banks might scale back their bond-buying programs or raise interest rates. Equity futures also finished in negative territory. Our currencies, event-driven strategies, and commodities were in positive territory and were our strongest-performing strategies.
Despite heightened uncertainty, the diversification resulting from the fund’s variety of exposures helped reduce overall volatility compared with the broad stock market. The correlations of the fund’s daily returns with the equity markets fell to 0.14, compared with 0.65 over the previous 12 months, and were heavily influenced by equity markets’ sharp rebound during the period. Fixed income
markets were held back by the uncertain interest rate environment and, as a result, had a slightly higher correlation with the fund.
Although markets can be unpredictable, we are confident that our team of experienced managers and analysts can find opportunities to produce competitive returns over the long term at volatility levels lower than those of the market.
Portfolio Managers:
Anatoly Shtekhman, CFA
Fei Xu, CFA
Vanguard Quantitative Equity Group
November 15, 2021
About Your Fund’s Expenses
As a shareholder of the fund, you incur ongoing costs, which include costs for portfolio management, administrative services, and shareholder reports (like this one), among others. Operating expenses, which are deducted from a fund’s gross income, directly reduce the investment return of the fund.
A fund’s expenses are expressed as a percentage of its average net assets. This figure is known as the expense ratio. The following examples are intended to help you understand the ongoing costs (in dollars) of investing in your fund and to compare these costs with those of other mutual funds. The examples are based on an investment of $1,000 made at the beginning of the period shown and held for the entire period.
The accompanying table illustrates your fund’s costs in two ways:
| • | Based on actual fund return. This section helps you to estimate the actual expenses that you paid over the period. The ”Ending Account Value“ shown is derived from the fund‘s actual return, and the third column shows the dollar amount that would have been paid by an investor who started with $1,000 in the fund. You may use the information here, together with the amount you invested, to estimate the expenses that you paid over the period. |
To do so, simply divide your account value by $1,000 (for example, an $8,600 account value divided by $1,000 = 8.6), then multiply the result by the number given for your fund under the heading ”Expenses Paid During Period.“
| • | Based on hypothetical 5% yearly return. This section is intended to help you compare your fund‘s costs with those of other mutual funds. It assumes that the fund had a yearly return of 5% before expenses, but that the expense ratio is unchanged. In this case—because the return used is not the fund’s actual return—the results do not apply to your investment. The example is useful in making comparisons because the Securities and Exchange Commission requires all mutual funds to calculate expenses based on a 5% return. You can assess your fund’s costs by comparing this hypothetical example with the hypothetical examples that appear in shareholder reports of other funds. |
Note that the expenses shown in the table are meant to highlight and help you compare ongoing costs only and do not reflect transaction costs incurred by the fund for buying and selling securities. Further, the expenses do not include any purchase, redemption, or account service fees described in the fund prospectus. If such fees were applied to your account, your costs would be higher. Your fund does not carry a “sales load.”
The calculations assume no shares were bought or sold during the period. Your actual costs may have been higher or lower, depending on the amount of your investment and the timing of any purchases or redemptions.
You can find more information about the fund’s expenses, including annual expense ratios, in the Consolidated Financial Statements section of this report. For additional information on operating expenses and other shareholder costs, please refer to your fund’s current prospectus.
| Six Months Ended October 31, 2021 | | | |
| Alternative Strategies Fund | Beginning
Account Value
4/30/2021 | Ending
Account Value
10/31/2021 | Expenses
Paid During
Period |
| Based on Actual Fund Return | $1,000.00 | $995.30 | $7.69 |
| Based on Hypothetical 5% Yearly Return | 1,000.00 | 1,017.49 | 7.78 |
The calculations are based on expenses incurred in the most recent six-month period. The fund’s annualized six-month expense ratio for that period is 1.53%. The dollar amounts shown as “Expenses Paid” are equal to the annualized expense ratio multiplied by the average account value over the period, multiplied by the number of days in the most recent six-month period, then divided by the number of days in the most recent 12-month period (184/365).
Alternative Strategies Fund
All of the returns in this report represent past performance, which is not a guarantee of future results that may be achieved by the fund. (Current performance may be lower or higher than the performance data cited. For performance data current to the most recent month-end, visit our website at vanguard.com/performance.) Note, too, that both investment returns and principal value can fluctuate widely, so an investor’s shares, when sold, could be worth more or less than their original cost. The returns shown do not reflect taxes that a shareholder would pay on fund distributions or on the sale of fund shares.
Cumulative Performance: August 11, 2015, Through October 31, 2021
Initial Investment of $50,000
| | | Average Annual Total Returns
Periods Ended October 31, 2021 | |
| | | One
Year | Five
Years | Since
Inception
(8/11/2015) | Final Value
of a $50,000
Investment |
 | Alternative Strategies Fund | -0.12% | -1.98% | -0.53% | $48,371 |
 | Spliced Alternative Strategies Index | 0.05 | 3.59 | 3.73 | 62,797 |
| | FTSE Three-Month Treasury Bill Index | 0.05 | 1.12 | 0.94 | 53,083 |
Spliced Alternative Strategies Index: FTSE 3-Month U.S. T-Bill Index + 4% through October 31, 2019; FTSE 3-Month Treasury Bill Index thereafter.
"Since Inception" performance is calculated from the fund’s inception date for both the fund and its comparative standard(s).
See Financial Highlights for dividend and capital gains information.
Alternative Strategies Fund
| | Long
Portfolio1 | Short
Portfolio2 |
| Communication Services | 2.2% | 5.3% |
| Consumer Discretionary | 12.5 | 15.1 |
| Consumer Staples | 5.6 | 0.8 |
| Energy | 0.8 | 7.7 |
| Financials | 8.6 | 11.0 |
| Health Care | 29.1 | 13.0 |
| Industrials | 11.7 | 10.3 |
| Information Technology | 11.6 | 28.7 |
| Materials | 7.2 | 4.7 |
| Real Estate | 3.6 | 2.4 |
| Utilities | 7.1 | 1.0 |
| 1 | Percentage of investments in long portfolio. |
| 2 | Percentage of investments in short portfolio. |
The table reflects the fund’s investments, except for short-term investments and derivatives. Sector categories are based on the Global Industry Classification Standard (“GICS”), except for the “Other” category (if applicable), which includes securities that have not been provided a GICS classification as of the effective reporting period.
Global Industry Classification Standard (“GICS”) was developed by and is the exclusive property and a service mark of MSCI Inc. (“MSCI”) and Standard and Poor’s, a division of McGraw-Hill Companies, Inc. (“S&P”), and is licensed for use by Vanguard. Neither MSCI, S&P nor any third party involved in making or compiling the GICS or any GICS classification makes any express or implied warranties or representations with respect to such standard or classification (or the results to be obtained by the use thereof), and all such parties hereby expressly disclaim all warranties of originality, accuracy, completeness, merchantability or fitness for a particular purpose with respect to any such standard or classification. Without limiting any of the foregoing, in no event shall MSCI, S&P, any of its affiliates or any third party involved in making or compiling the GICS or any GICS classification have any liability for any direct, indirect, special, punitive, consequential or any other damages (including lost profits) even if notified of the possibility of such damages.
Alternative Strategies Fund
Consolidated Financial Statements
Consolidated Schedule of Investments
The fund files its complete schedule of portfolio holdings with the Securities and Exchange Commission (SEC) for the first and third quarters of each fiscal year as an exhibit to its reports on Form N-PORT. The fund’s Form N-PORT reports are available on the SEC’s website at www.sec.gov.
| | | Shares | Market
Value•
($000) |
| Common Stocks—Long Positions (45.1%) |
| Communication Services (1.0%) |
| *,1 | Alphabet Inc. Class A | 51 | 151 |
| 1 | Electronic Arts Inc. | 978 | 137 |
| *,1 | Walt Disney Co. | 786 | 133 |
| 1 | Verizon Communications Inc. | 2,517 | 133 |
| *,1 | Liberty Broadband Corp. Class C | 777 | 126 |
| *,1 | Charter Communications Inc. Class A | 183 | 124 |
| 1 | Sirius XM Holdings Inc. | 19,632 | 120 |
| 1 | Comcast Corp. Class A | 2,319 | 119 |
| 1 | AT&T Inc. | 4,660 | 118 |
| 1 | Activision Blizzard Inc. | 1,475 | 115 |
| *,1 | T-Mobile US Inc. | 507 | 58 |
| *,1 | Madison Square Garden Sports Corp. | 209 | 40 |
| | | | 1,374 |
| Consumer Discretionary (5.6%) |
| *,2 | GrandVision NV | 61,606 | 2,022 |
| * | Sportsman's Warehouse Holdings Inc. | 113,176 | 1,953 |
| * | Veoneer Inc. | 15,000 | 528 |
| 1 | Pool Corp. | 299 | 154 |
| 1 | Service Corp. International | 2,246 | 154 |
| 1 | Home Depot Inc. | 412 | 153 |
| 1 | Tractor Supply Co. | 694 | 151 |
| 1 | NIKE Inc. Class B | 891 | 149 |
| 1 | Columbia Sportswear Co. | 1,400 | 145 |
| 1 | Genuine Parts Co. | 1,095 | 144 |
| 1 | McDonald's Corp. | 584 | 143 |
| *,1 | Amazon.com Inc. | 42 | 142 |
| *,1 | O'Reilly Automotive Inc. | 225 | 140 |
| *,1 | AutoZone Inc. | 78 | 139 |
| 1 | Domino's Pizza Inc. | 284 | 139 |
| 1 | Dollar General Corp. | 623 | 138 |
| 1 | Gentex Corp. | 3,825 | 135 |
| 1 | Yum! Brands Inc. | 1,081 | 135 |
| 1 | Starbucks Corp. | 1,208 | 128 |
| 1 | VF Corp. | 1,750 | 128 |
| 1 | TJX Cos. Inc. | 1,928 | 126 |
| 1 | Wendy's Co. | 5,516 | 123 |
| 1 | Yum China Holdings Inc. | 2,154 | 123 |
| 1 | Garmin Ltd. | 855 | 123 |
| 1 | Newell Brands Inc. | 5,319 | 122 |
| *,1 | Chipotle Mexican Grill Inc. Class A | 62 | 110 |
| | | Shares | Market
Value•
($000) |
| *,1 | frontdoor Inc. | 1,564 | 58 |
| | | | 7,705 |
| Consumer Staples (2.5%) |
| | Sanderson Farms Inc. | 7,630 | 1,445 |
| 1 | Costco Wholesale Corp. | 303 | 149 |
| 1 | Archer-Daniels-Midland Co. | 2,274 | 146 |
| 1 | PepsiCo Inc. | 884 | 143 |
| 1 | Coca-Cola Co. | 2,527 | 142 |
| 1 | Flowers Foods Inc. | 5,518 | 136 |
| 1 | Kimberly-Clark Corp. | 1,043 | 135 |
| 1 | J M Smucker Co. | 1,099 | 135 |
| 1 | Mondelez International Inc. Class A | 2,205 | 134 |
| 1 | Procter & Gamble Co. | 914 | 131 |
| 1 | McCormick & Co. Inc. | 1,604 | 129 |
| 1 | Brown-Forman Corp. Class B | 1,880 | 128 |
| 1 | Colgate-Palmolive Co. | 1,635 | 124 |
| *,1 | Post Holdings Inc. | 1,200 | 122 |
| 1 | Altria Group Inc. | 2,743 | 121 |
| | Hershey Co. | 226 | 40 |
| 1 | Church & Dwight Co. Inc. | 447 | 39 |
| 1 | Philip Morris International Inc. | 366 | 35 |
| | | | 3,434 |
| Energy (0.4%) |
| 1 | Chevron Corp. | 1,283 | 147 |
| 1 | Williams Cos. Inc. | 4,949 | 139 |
| 1 | Kinder Morgan Inc. | 7,764 | 130 |
| 1 | Cheniere Energy Inc. | 641 | 66 |
| | | | 482 |
| Financials (3.9%) |
| | Marlin Business Services Corp. | 90,951 | 2,085 |
| * | Franklin BSP Realty Trust Inc. REIT | 64,072 | 1,051 |
| 1 | Intercontinental Exchange Inc. | 1,153 | 160 |
| 1 | Aon plc Class A (XNYS) | 497 | 159 |
| 1 | Ares Management Corp. Class A | 1,851 | 157 |
| *,1 | Markel Corp. | 115 | 151 |
| 1 | Arthur J Gallagher & Co. | 897 | 150 |
| 1 | W R Berkley Corp. | 1,876 | 149 |
| *,1 | Berkshire Hathaway Inc. Class B | 512 | 147 |
| 1 | Marsh & McLennan Cos. Inc. | 875 | 146 |
| 1 | Brown & Brown Inc. | 2,227 | 141 |
| 1 | CNA Financial Corp. | 3,018 | 135 |
| *,1 | Alleghany Corp. | 202 | 132 |
Alternative Strategies Fund
| | | Shares | Market
Value•
($000) |
| 1 | TFS Financial Corp. | 6,660 | 130 |
| 1 | Annaly Capital Management Inc. | 15,312 | 129 |
| 1 | Allstate Corp. | 1,037 | 128 |
| 1 | AGNC Investment Corp. | 7,713 | 123 |
| 1 | T Rowe Price Group Inc. | 149 | 32 |
| 1 | White Mountains Insurance Group Ltd. | 19 | 20 |
| 1 | Hanover Insurance Group Inc. | 100 | 13 |
| | | | 5,338 |
| Health Care (13.1%) |
| * | PPD Inc. | 50,000 | 2,358 |
| * | Kadmon Holdings Inc. | 230,000 | 2,173 |
| * | Trillium Therapeutics Inc. | 120,000 | 2,173 |
| * | Intersect ENT Inc. | 72,500 | 1,955 |
| * | Acceleron Pharma Inc. | 11,100 | 1,933 |
| * | Soliton Inc. | 93,130 | 1,918 |
| * | Itamar Medical Ltd. ADR | 52,634 | 1,605 |
| * | Change Healthcare Inc. | 14,000 | 301 |
| 1 | Merck & Co. Inc. | 1,779 | 157 |
| 1 | STERIS plc | 658 | 154 |
| 1 | UnitedHealth Group Inc. | 325 | 150 |
| 1 | Abbott Laboratories | 1,158 | 149 |
| 1 | Thermo Fisher Scientific Inc. | 233 | 148 |
| *,1 | QIAGEN NV | 2,655 | 148 |
| 1 | CVS Health Corp. | 1,598 | 143 |
| 1 | Danaher Corp. | 460 | 143 |
| 1 | West Pharmaceutical Services Inc. | 330 | 142 |
| *,1 | Mettler-Toledo International Inc. | 95 | 141 |
| 1 | Chemed Corp. | 288 | 139 |
| 1 | Cooper Cos. Inc. | 331 | 138 |
| 1 | Baxter International Inc. | 1,732 | 137 |
| 1 | Quest Diagnostics Inc. | 930 | 137 |
| 1 | AmerisourceBergen Corp. Class A | 1,104 | 135 |
| 1 | Cerner Corp. | 1,818 | 135 |
| 1 | Pfizer Inc. | 3,087 | 135 |
| 1 | Agilent Technologies Inc. | 850 | 134 |
| *,1 | Henry Schein Inc. | 1,728 | 132 |
| 1 | Becton Dickinson and Co. | 542 | 130 |
| 1 | Johnson & Johnson | 801 | 130 |
| 1 | Medtronic plc | 1,010 | 121 |
| *,1 | IDEXX Laboratories Inc. | 180 | 120 |
| 1 | Amgen Inc. | 564 | 117 |
| 1 | Zoetis Inc. | 525 | 113 |
| 1 | Bristol-Myers Squibb Co. | 1,749 | 102 |
| *,1 | DaVita Inc. | 326 | 34 |
| | | | 17,980 |
| Industrials (5.3%) |
| | Aerojet Rocketdyne Holdings Inc. | 43,500 | 1,915 |
| | IHS Markit Ltd. | 10,000 | 1,307 |
| * | Echo Global Logistics Inc. | 10,000 | 482 |
| * | PAE Inc. | 20,000 | 198 |
| 1 | Norfolk Southern Corp. | 533 | 156 |
| 1 | AMERCO | 209 | 154 |
| 1 | Republic Services Inc. Class A | 1,144 | 154 |
| 1 | Fastenal Co. | 2,670 | 153 |
| 1 | Carlisle Cos. Inc. | 670 | 149 |
| 1 | General Dynamics Corp. | 724 | 147 |
| 1 | Roper Technologies Inc. | 300 | 146 |
| 1 | Illinois Tool Works Inc. | 635 | 145 |
| 1 | Waste Management Inc. | 904 | 145 |
| | | Shares | Market
Value•
($000) |
| 1 | IDEX Corp. | 644 | 143 |
| 1 | Verisk Analytics Inc. Class A | 677 | 142 |
| 1 | AMETEK Inc. | 1,066 | 141 |
| 1 | Hubbell Inc. Class B | 700 | 140 |
| 1 | Northrop Grumman Corp. | 386 | 138 |
| 1 | Honeywell International Inc. | 625 | 137 |
| 1 | Expeditors International of Washington Inc. | 1,104 | 136 |
| 1 | Lockheed Martin Corp. | 391 | 130 |
| 1 | Allegion plc | 992 | 127 |
| 1 | PACCAR Inc. | 1,391 | 125 |
| 1 | Ingersoll Rand Inc. | 2,250 | 121 |
| 1 | Lennox International Inc. | 394 | 118 |
| *,1 | Dun & Bradstreet Holdings Inc. | 6,205 | 117 |
| 1 | Cummins Inc. | 481 | 115 |
| 1 | BWX Technologies Inc. | 1,854 | 105 |
| 1 | Schneider National Inc. Class B | 1,475 | 37 |
| | | | 7,223 |
| Information Technology (5.2%) |
| * | Nuance Communications Inc. | 51,000 | 2,808 |
| 1 | Intuit Inc. | 261 | 163 |
| 1 | Automatic Data Processing Inc. | 697 | 156 |
| 1 | Microsoft Corp. | 469 | 156 |
| 1 | Paychex Inc. | 1,241 | 153 |
| 1 | Juniper Networks Inc. | 5,135 | 152 |
| 1 | Motorola Solutions Inc. | 611 | 152 |
| 1 | SS&C Technologies Holdings Inc. | 1,905 | 151 |
| 1 | Accenture plc Class A | 417 | 150 |
| 1 | Broadcom Inc. | 277 | 147 |
| 1 | Oracle Corp. | 1,533 | 147 |
| 1 | Broadridge Financial Solutions Inc. | 813 | 145 |
| *,1 | Keysight Technologies Inc. | ��� 807 | 145 |
| *,1 | Synopsys Inc. | 436 | 145 |
| 1 | Amdocs Ltd. | 1,864 | 145 |
| *,1 | Adobe Inc. | 218 | 142 |
| 1 | Amphenol Corp. Class A | 1,851 | 142 |
| 1 | Analog Devices Inc. | 806 | 140 |
| 1 | Apple Inc. | 928 | 139 |
| 1 | CDW Corp. | 744 | 139 |
| *,1 | VeriSign Inc. | 618 | 138 |
| 1 | Texas Instruments Inc. | 722 | 135 |
| 1 | Jack Henry & Associates Inc. | 802 | 134 |
| 1 | Visa Inc. Class A | 619 | 131 |
| *,1 | Akamai Technologies Inc. | 1,207 | 127 |
| 1 | International Business Machines Corp. | 999 | 125 |
| 1 | Dolby Laboratories Inc. Class A | 1,398 | 124 |
| *,1 | Black Knight Inc. | 1,725 | 121 |
| *,1 | Fiserv Inc. | 1,233 | 121 |
| 1 | CDK Global Inc. | 2,652 | 115 |
| 1 | Fidelity National Information Services Inc. | 981 | 109 |
| 1 | Western Union Co. | 5,678 | 103 |
| 1 | Mastercard Inc. Class A | 183 | 61 |
| | | | 7,161 |
| Materials (3.3%) |
| * | Domtar Corp. | 35,005 | 1,911 |
| * | Ferro Corp. | 39,357 | 827 |
| * | Forterra Inc. | 26,284 | 626 |
| 1 | Air Products and Chemicals Inc. | 503 | 151 |
Alternative Strategies Fund
| | | Shares | Market
Value•
($000) |
| 1 | Sherwin-Williams Co. | 467 | 148 |
| 1 | RPM International Inc. | 1,580 | 138 |
| 1 | Ecolab Inc. | 618 | 137 |
| 1 | Packaging Corp. of America | 979 | 135 |
| 1 | Avery Dennison Corp. | 611 | 133 |
| 1 | Ball Corp. | 1,458 | 133 |
| 1 | Sonoco Products Co. | 1,465 | 85 |
| 1 | Reliance Steel & Aluminum Co. | 301 | 44 |
| | | | 4,468 |
| Real Estate (1.6%) |
| 1 | Life Storage Inc. | 1,192 | 160 |
| 1 | Camden Property Trust | 951 | 155 |
| 1 | Extra Space Storage Inc. | 778 | 154 |
| 1 | Duke Realty Corp. | 2,680 | 151 |
| 1 | Invitation Homes Inc. | 3,600 | 148 |
| 1 | Mid-America Apartment Communities Inc. | 717 | 146 |
| 1 | Equity Residential | 1,662 | 144 |
| 1 | CoreSite Realty Corp. | 1,005 | 143 |
| 1 | Public Storage | 429 | 143 |
| 1 | AvalonBay Communities Inc. | 600 | 142 |
| 1 | Sun Communities Inc. | 726 | 142 |
| 1 | Alexandria Real Estate Equities Inc. | 690 | 141 |
| 1 | American Homes 4 Rent Class A | 3,431 | 139 |
| 1 | UDR Inc. | 2,503 | 139 |
| 1 | CubeSmart | 2,352 | 129 |
| 1 | Equinix Inc. | 75 | 63 |
| | | | 2,239 |
| Utilities (3.2%) |
| | PNM Resources Inc. | 46,000 | 2,288 |
| 1 | Exelon Corp. | 2,767 | 147 |
| 1 | NextEra Energy Inc. | 1,726 | 147 |
| 1 | American Electric Power Co. Inc. | 1,661 | 141 |
| 1 | Duke Energy Corp. | 1,385 | 141 |
| 1 | Atmos Energy Corp. | 1,478 | 136 |
| 1 | OGE Energy Corp. | 3,982 | 136 |
| 1 | IDACORP Inc. | 1,281 | 134 |
| 1 | CMS Energy Corp. | 2,204 | 133 |
| 1 | Dominion Energy Inc. | 1,736 | 132 |
| 1 | Alliant Energy Corp. | 2,291 | 130 |
| 1 | Ameren Corp. | 1,549 | 130 |
| 1 | DTE Energy Co. | 1,108 | 126 |
| 1 | Southern Co. | 2,019 | 126 |
| 1 | Consolidated Edison Inc. | 1,657 | 125 |
| | PPL Corp. | 4,316 | 124 |
| 1 | Avangrid Inc. | 2,317 | 122 |
| | | | 4,418 |
| Total Common Stocks—Long Positions (Cost $53,046) | 61,822 |
| Temporary Cash Investments (44.2%) |
| Money Market Fund (44.2%) |
| 3 | Vanguard Market Liquidity Fund, 0.070% (Cost $60,604) | 606,098 | 60,610 |
| Common Stocks Sold Short (-10.7%) |
| Communication Services (-0.6%) |
| | Lumen Technologies Inc. | (10,425) | (124) |
| * | Roku Inc. | (384) | (117) |
| | ViacomCBS Inc. Class B | (3,176) | (115) |
| * | TripAdvisor Inc. | (3,320) | (109) |
| | | Shares | Market
Value•
($000) |
| * | Discovery Inc. Class C | (4,795) | (108) |
| * | Zillow Group Inc. Class A | (971) | (103) |
| * | Pinterest Inc. Class A | (2,207) | (99) |
| | | | (775) |
| Consumer Discretionary (-1.6%) |
| * | Tesla Inc. | (148) | (165) |
| * | Etsy Inc. | (644) | (161) |
| * | Capri Holdings Ltd. | (2,522) | (134) |
| * | Carvana Co. Class A | (443) | (134) |
| * | PVH Corp. | (1,223) | (134) |
| * | Royal Caribbean Cruises Ltd. | (1,548) | (131) |
| * | Norwegian Cruise Line Holdings Ltd. | (5,057) | (130) |
| * | DoorDash Inc. Class A | (665) | (129) |
| * | Nordstrom Inc. | (4,413) | (127) |
| * | Wayfair Inc. Class A | (504) | (126) |
| * | Peloton Interactive Inc. Class A | (1,382) | (126) |
| * | Penn National Gaming Inc. | (1,760) | (126) |
| * | Carnival Corp. | (5,626) | (125) |
| | Qurate Retail Inc. Series A | (11,309) | (118) |
| * | DraftKings Inc. Class A | (2,487) | (116) |
| * | Vroom Inc. | (5,452) | (104) |
| * | Wynn Resorts Ltd. | (1,109) | (100) |
| | MGM Resorts International | (472) | (22) |
| | | | (2,208) |
| Consumer Staples (-0.1%) |
| * | Coty Inc. Class A | (14,567) | (124) |
| Energy (-0.8%) |
| | Occidental Petroleum Corp. | (4,611) | (155) |
| | Targa Resources Corp. | (2,732) | (149) |
| | Marathon Oil Corp. | (8,757) | (143) |
| | Diamondback Energy Inc. | (1,330) | (142) |
| | APA Corp. | (5,296) | (139) |
| | Devon Energy Corp. | (3,388) | (136) |
| * | NOV Inc. | (9,413) | (132) |
| | New Fortress Energy Inc. Class A | (4,289) | (129) |
| | | | (1,125) |
| Financials (-1.2%) |
| | S&P Global Inc. | (2,838) | (1,346) |
| * | GoHealth Inc. Class A | (23,920) | (129) |
| * | Upstart Holdings Inc. | (391) | (126) |
| | | | (1,601) |
| Health Care (-1.4%) |
| * | Certara Inc. | (3,664) | (151) |
| * | 10X Genomics Inc. Class A | (827) | (134) |
| * | Iovance Biotherapeutics Inc. | (5,393) | (131) |
| * | Natera Inc. | (1,135) | (130) |
| * | Quidel Corp. | (965) | (128) |
| * | Ultragenyx Pharmaceutical Inc. | (1,510) | (127) |
| * | Exact Sciences Corp. | (1,261) | (120) |
| * | Sage Therapeutics Inc. | (2,973) | (120) |
| * | Sarepta Therapeutics Inc. | (1,505) | (119) |
| * | Adaptive Biotechnologies Corp. | (3,546) | (119) |
| * | Moderna Inc. | (328) | (113) |
| * | Guardant Health Inc. | (962) | (112) |
| * | Novocure Ltd. | (1,036) | (106) |
| * | Biogen Inc. | (391) | (104) |
| * | Maravai LifeSciences Holdings Inc. Class A | (2,451) | (104) |
Alternative Strategies Fund
| | | Shares | Market
Value•
($000) |
| * | Novavax Inc. | (592) | (88) |
| | | | (1,906) |
| Industrials (-1.1%) |
| * | Sunrun Inc. | (2,853) | (165) |
| * | Plug Power Inc. | (4,167) | (159) |
| * | Shoals Technologies Group Inc. Class A | (4,469) | (139) |
| * | Uber Technologies Inc. | (2,991) | (131) |
| | Spirit AeroSystems Holdings Inc. Class A | (3,149) | (130) |
| * | Copa Holdings SA Class A | (1,672) | (124) |
| | Ingersoll Rand Inc. | (2,250) | (121) |
| * | American Airlines Group Inc. | (6,088) | (117) |
| * | United Airlines Holdings Inc. | (2,472) | (114) |
| | ADT Inc. | (13,313) | (111) |
| * | Lyft Inc. Class A | (2,333) | (107) |
| * | Hexcel Corp. | (1,373) | (78) |
| * | JetBlue Airways Corp. | (890) | (12) |
| | | | (1,508) |
| Information Technology (-3.1%) |
| * | Wolfspeed Inc. | (1,490) | (179) |
| * | Enphase Energy Inc. | (710) | (164) |
| | Brooks Automation Inc. | (1,369) | (159) |
| * | Zscaler Inc. | (485) | (155) |
| * | Datadog Inc. Class A | (929) | (155) |
| * | Elastic NV | (874) | (152) |
| * | Cloudflare Inc. Class A | (767) | (149) |
| * | Bill.com Holdings Inc. | (503) | (148) |
| * | Crowdstrike Holdings Inc. Class A | (520) | (147) |
| * | Everbridge Inc. | (921) | (147) |
| * | Anaplan Inc. | (2,243) | (146) |
| * | Pure Storage Inc. Class A | (5,407) | (145) |
| * | MongoDB Inc. Class A | (279) | (145) |
| * | Dynatrace Inc. | (1,905) | (143) |
| * | Snowflake Inc. Class A | (398) | (141) |
| * | Teradata Corp. | (2,479) | (140) |
| * | Unity Software Inc. | (919) | (139) |
| * | Palantir Technologies Inc. Class A | (5,204) | (135) |
| | Ubiquiti Inc. | (438) | (134) |
| * | Trade Desk Inc. Class A | (1,758) | (132) |
| * | DXC Technology Co. | (3,807) | (124) |
| * | DocuSign Inc. Class A | (436) | (121) |
| * | Alteryx Inc. Class A | (1,617) | (118) |
| * | StoneCo Ltd. Class A | (3,465) | (117) |
| * | Sabre Corp. | (11,155) | (116) |
| * | Mandiant Inc. | (6,653) | (116) |
| * | Twilio Inc. Class A | (372) | (108) |
| | | Shares | Market
Value•
($000) |
| * | Zoom Video Communications Inc. Class A | (381) | (105) |
| | Alliance Data Systems Corp. | (1,206) | (103) |
| * | Shift4 Payments Inc. Class A | (1,552) | (98) |
| * | CommScope Holding Co. Inc. | (6,891) | (74) |
| * | Wix.com Ltd. | (94) | (17) |
| * | Square Inc. Class A | (61) | (16) |
| | | | (4,188) |
| Materials (-0.5%) |
| | Olin Corp. | (2,733) | (156) |
| * | Cleveland-Cliffs Inc. | (6,074) | (146) |
| | United States Steel Corp. | (5,241) | (138) |
| | Freeport-McMoRan Inc. | (3,444) | (130) |
| | Alcoa Corp. | (2,571) | (118) |
| | | | (688) |
| Real Estate (-0.2%) |
| | EPR Properties | (2,649) | (133) |
| * | Park Hotels & Resorts Inc. | (6,566) | (122) |
| | Kimco Realty Corp. | (4,112) | (93) |
| | | | (348) |
| Utilities (-0.1%) |
| | Vistra Corp. | (7,312) | (143) |
| Total Common Stocks Sold Short (Proceeds $12,495) | (14,614) |
| Other Assets and Other Liabilities—Net (21.4%) | 29,319 |
| Net Assets (100%) | 137,137 |
| Cost is in $000. |
| • | See Note A in Notes to Consolidated Financial Statements. |
| * | Non-income-producing security. |
| 1 | Long security positions with a value of $25,743,000 are held in a segregated account at the fund's custodian bank and pledged to a broker-dealer as collateral for the fund's obligation to return borrowed securities. For so long as such obligations continue, the fund’s access to these assets is subject to authorization from the broker-dealer. |
| 2 | Security exempt from registration under Rule 144A of the Securities Act of 1933. Such securities may be sold in transactions exempt from registration, normally to qualified institutional buyers. At October 31, 2021, the aggregate value was $2,022,000, representing 1.5% of net assets. |
| 3 | Affiliated money market fund available only to Vanguard funds and certain trusts and accounts managed by Vanguard. Rate shown is the 7-day yield. |
| | ADR—American Depositary Receipt. |
| | REIT—Real Estate Investment Trust. |
Alternative Strategies Fund
Derivative Financial Instruments Outstanding as of Period End
| Futures Contracts |
| | | | ($000) |
| | Expiration | Number of
Long (Short)
Contracts | Notional
Amount | Value and
Unrealized
Appreciation
(Depreciation) |
| Long Futures Contracts | | | | |
| 10-Year U.S. Treasury Note | December 2021 | 131 | 17,122 | (356) |
| 2-Year U.S. Treasury Note | December 2021 | 521 | 114,229 | (485) |
| 5-Year U.S. Treasury Note | December 2021 | 219 | 26,663 | (392) |
| AEX Index | November 2021 | 39 | 7,292 | 346 |
| Copper1 | December 2021 | 11 | 1,201 | (101) |
| Cotton1 | December 2021 | 57 | 3,273 | 348 |
| FTSE MIB Index | December 2021 | 47 | 7,266 | 326 |
| Gasoline1 | November 2021 | 19 | 1,891 | (29) |
| Lean Hogs1 | December 2021 | 20 | 609 | 28 |
| LME Aluminum1 | November 2021 | 8 | 543 | (95) |
| LME Copper1 | November 2021 | 5 | 1,216 | (71) |
| LME Lead1 | November 2021 | 23 | 1,393 | 108 |
| LME Lead1 | December 2021 | 21 | 1,263 | 23 |
| LME Tin1 | November 2021 | 18 | 3,468 | 390 |
| LME Tin1 | December 2021 | 17 | 3,208 | (8) |
| LME Zinc1 | November 2021 | 23 | 1,979 | (228) |
| LME Zinc1 | December 2021 | 13 | 1,109 | (133) |
| LOW SU Gasoil1 | December 2021 | 17 | 1,211 | (42) |
| MSCI Singapore Index | November 2021 | 264 | 7,204 | (9) |
| Natural Gas1 | November 2021 | 55 | 2,984 | (176) |
| OMX Stockholm 30 Index | November 2021 | 272 | 7,245 | 174 |
| S&P ASX 200 Index | December 2021 | 53 | 7,256 | (126) |
| S&P TSX 60 Index | December 2021 | 36 | 7,333 | 393 |
| Soybean1 | January 2022 | 10 | 625 | 17 |
| Sugar1 | February 2022 | 28 | 604 | (28) |
| WTI Crude Oil1 | December 2021 | 52 | 1,912 | 54 |
| | | | | (72) |
Alternative Strategies Fund
| Futures Contracts (continued) |
| | | | ($000) |
| | Expiration | Number of
Long (Short)
Contracts | Notional
Amount | Value and
Unrealized
Appreciation
(Depreciation) |
| Short Futures Contracts | | | | |
| CAC 40 Index | November 2021 | (92) | (7,260) | (315) |
| Cattle Feeder1 | January 2022 | (39) | (3,044) | 108 |
| Cocoa1 | March 2022 | (119) | (3,070) | 63 |
| Coffee1 | March 2022 | (8) | (620) | 15 |
| DAX 30 Index | December 2021 | (16) | (7,243) | (243) |
| FTSE 100 Index | December 2021 | (72) | (7,118) | (224) |
| IBEX 35 Index | November 2021 | (68) | (7,111) | (127) |
| KOSPI 200 Index | December 2021 | (83) | (6,892) | 504 |
| Live Cattle1 | December 2021 | (60) | (3,103) | 10 |
| LME Aluminum1 | December 2021 | (24) | (1,631) | 284 |
| LME Aluminum1 | November 2021 | (8) | (542) | 37 |
| LME Copper1 | November 2021 | (5) | (1,216) | (25) |
| LME Lead1 | November 2021 | (23) | (1,393) | (27) |
| LME Tin1 | November 2021 | (18) | (3,468) | (63) |
| LME Zinc1 | November 2021 | (23) | (1,979) | (216) |
| Soybean1 | December 2021 | (99) | (3,293) | (157) |
| TOPIX Index | December 2021 | (38) | (6,643) | 68 |
| Wheat1 | December 2021 | (86) | (3,323) | (32) |
| Wheat1 | December 2021 | (51) | (2,004) | (86) |
| | | | | (426) |
| | | | | (498) |
| 1 | Security is owned by the Vanguard ASF Portfolio, which is a wholly owned subsidiary of the Alternative Strategies Fund. |
| Forward Currency Contracts |
| | Contract
Settlement
Date | Contract Amount (000) | Unrealized
Appreciation
($000) | Unrealized
Depreciation
($000) |
| Counterparty | Receive | Deliver |
| Royal Bank of Canada | 11/10/21 | BRL | 19,050 | USD | 3,519 | — | (151) |
| BNP Paribas | 11/10/21 | BRL | 840 | USD | 155 | — | (7) |
| Standard Chartered Bank | 11/10/21 | CAD | 11,561 | USD | 9,141 | 200 | — |
| Morgan Stanley Capital Services Inc. | 11/10/21 | GBP | 6,759 | USD | 9,168 | 83 | — |
| Royal Bank of Canada | 11/10/21 | GBP | 9 | USD | 12 | — | — |
| Bank of America, N.A. | 11/10/21 | MXN | 74,567 | USD | 3,620 | — | (4) |
| State Street Bank & Trust Co. | 11/10/21 | MXN | 424 | USD | 21 | — | — |
| Morgan Stanley Capital Services Inc. | 11/10/21 | NOK | 79,658 | USD | 9,226 | 203 | — |
| Morgan Stanley Capital Services Inc. | 11/10/21 | RUB | 265,677 | USD | 3,626 | 114 | — |
| Standard Chartered Bank | 11/10/21 | TRY | 32,429 | USD | 3,597 | — | (240) |
| Morgan Stanley Capital Services Inc. | 11/10/21 | ZAR | 54,917 | USD | 3,670 | — | (78) |
| Morgan Stanley Capital Services Inc. | 11/10/21 | USD | 9,164 | CHF | 8,513 | — | (136) |
| State Street Bank & Trust Co. | 11/10/21 | USD | 11,170 | EUR | 9,624 | 43 | — |
| Morgan Stanley Capital Services Inc. | 11/10/21 | USD | 3,658 | ILS | 11,776 | — | (63) |
| BNP Paribas | 11/10/21 | USD | 3,603 | PLN | 14,247 | 32 | — |
| Morgan Stanley Capital Services Inc. | 11/10/21 | USD | 63 | PLN | 249 | 1 | — |
Alternative Strategies Fund
| Forward Currency Contracts (continued) |
| | Contract
Settlement
Date | Contract Amount (000) | Unrealized
Appreciation
($000) | Unrealized
Depreciation
($000) |
| Counterparty | Receive | Deliver |
| Morgan Stanley Capital Services Inc. | 11/10/21 | USD | 9,116 | SEK | 79,835 | — | (181) |
| State Street Bank & Trust Co. | 11/10/21 | USD | 3,656 | SGD | 4,955 | — | (18) |
| Standard Chartered Bank | 11/10/21 | USD | 3,665 | THB | 123,503 | — | (57) |
| Morgan Stanley Capital Services Inc. | 11/10/21 | USD | 3,662 | TWD | 101,695 | 5 | — |
| | | | | | | 681 | (935) |
| BRL—Brazilian real. |
| CAD—Canadian dollar. |
| CHF—Swiss franc. |
| EUR—euro. |
| GBP—British pound. |
| ILS—Israeli shekel. |
| MXN—Mexican peso. |
| NOK—Norwegian krone. |
| PLN—Polish zloty. |
| RUB—Russian ruble. |
| SEK—Swedish krona. |
| SGD—Singapore dollar. |
| THB—Thai baht. |
| TRY—Turkish lira. |
| TWD—Taiwanese dollar. |
| USD—U.S. dollar. |
| ZAR—South African rand. |
At October 31, 2021, the counterparties had deposited in segregated accounts cash of $60,000 in connection with open forward currency contracts.
See accompanying Notes, which are an integral part of the Financial Statements.
Alternative Strategies Fund
Consolidated Statement of Assets and Liabilities
|
| ($000s, except shares and per-share amounts) | Amount |
| Assets | |
| Investments in Securities, at Value | |
| Unaffiliated Issuers (Cost $53,046) | 61,822 |
| Affiliated Issuers (Cost $60,604) | 60,610 |
| Total Investments in Securities | 122,432 |
| Investment in Vanguard | 6 |
| Cash | 12,755 |
| Cash Segregated for Short Positions | 8,794 |
| Cash Collateral Pledged—Futures Contracts | 8,820 |
| Receivables for Accrued Income | 59 |
| Receivables for Capital Shares Issued | 57 |
| Unrealized Appreciation—Forward Currency Contracts | 681 |
| Other Assets | 1,975 |
| Total Assets | 155,579 |
| Liabilities | |
| Securities Sold Short, at Value (Proceeds $12,495) | 14,614 |
| Payables for Investment Securities Purchased | 555 |
| Payables to Vanguard | 57 |
| Variation Margin Payable—Futures Contracts | 2,227 |
| Unrealized Depreciation—Forward Currency Contracts | 935 |
| Accrued Dividend Expense on Securities Sold Short | 2 |
| Payables to Broker-Dealer | 52 |
| Total Liabilities | 18,442 |
| Net Assets | 137,137 |
| At October 31, 2021, net assets consisted of: | |
| | |
| Paid-in Capital | 171,453 |
| Total Distributable Earnings (Loss) | (34,316) |
| Net Assets | 137,137 |
| |
| Net Assets | |
Applicable to 8,066,408 outstanding $.001 par value shares of
beneficial interest (unlimited authorization) | 137,137 |
| Net Asset Value Per Share | $17.00 |
See accompanying Notes, which are an integral part of the Financial Statements.
Alternative Strategies Fund
Consolidated Statement of Operations
|
| | Year Ended
October 31, 2021 |
| | ($000) |
| Investment Income | |
| Income | |
| Dividends1 | 1,764 |
| Interest2 | 61 |
| Total Income | 1,825 |
| Expenses | |
| The Vanguard Group—Note B | |
| Investment Advisory Services | 162 |
| Management and Administrative | 306 |
| Marketing and Distribution | 28 |
| Custodian Fees | 53 |
| Auditing Fees | 59 |
| Shareholders’ Reports | 5 |
| Trustees’ Fees and Expenses—Note B | 15 |
| Dividend Expense on Securities Sold Short | 649 |
| Borrowing Expense on Securities Sold Short | 987 |
| Total Expenses | 2,264 |
| Net Investment Income (Loss) | (439) |
| Realized Net Gain (Loss) | |
| Investment Securities Sold—Long Positions2 | 19,456 |
| Investment Securities Sold—Short Positions | (18,273) |
| Futures Contracts | 677 |
| Forward Currency Contracts | 5,051 |
| Foreign Currencies | 173 |
| Realized Net Gain (Loss) | 7,084 |
| Change in Unrealized Appreciation (Depreciation) | |
| Investment Securities—Long Positions2 | (4,880) |
| Investment Securities—Short Positions | (1,792) |
| Futures Contracts | (2,442) |
| Forward Currency Contracts | 697 |
| Foreign Currencies | (418) |
| Change in Unrealized Appreciation (Depreciation) | (8,835) |
| Net Increase (Decrease) in Net Assets Resulting from Operations | (2,190) |
| 1 | Dividends are net of foreign withholding taxes of $24,000. |
| 2 | Interest income, realized net gain (loss), and change in unrealized appreciation (depreciation) from an affiliated company of the fund were $66,000, $12,000, and ($11,000), respectively. Purchases and sales are for temporary cash investment purposes. |
See accompanying Notes, which are an integral part of the Financial Statements.
Alternative Strategies Fund
Consolidated Statement of Changes in Net Assets
|
| | Year Ended October 31, |
| | 2021
($000) | 2020
($000) |
| | | |
| Increase (Decrease) in Net Assets | | |
| Operations | | |
| Net Investment Income | (439) | 433 |
| Realized Net Gain (Loss) | 7,084 | (72,780) |
| Change in Unrealized Appreciation (Depreciation) | (8,835) | (2,150) |
| Net Increase (Decrease) in Net Assets Resulting from Operations | (2,190) | (74,497) |
| Distributions | | |
| Total Distributions | (2,074) | (17,409) |
| Capital Share Transactions | | |
| Issued | 31,827 | 318,091 |
| Issued in Lieu of Cash Distributions | 2,047 | 17,310 |
| Redeemed | (198,840) | (234,534) |
| Net Increase (Decrease) from Capital Share Transactions | (164,966) | 100,867 |
| Total Increase (Decrease) | (169,230) | 8,961 |
| Net Assets | | |
| Beginning of Period | 306,367 | 297,406 |
| End of Period | 137,137 | 306,367 |
See accompanying Notes, which are an integral part of the Financial Statements.
Alternative Strategies Fund
Consolidated Financial Highlights
For a Share Outstanding
Throughout Each Period | Year Ended October 31, |
| 2021 | 2020 | 2019 | 2018 | 2017 |
| Net Asset Value, Beginning of Period | $17.15 | $22.23 | $20.41 | $20.46 | $21.28 |
| Investment Operations | | | | | |
| Net Investment Income (Loss)1 | (.042) | .023 | .252 | .197 | .153 |
| Net Realized and Unrealized Gain (Loss) on Investments | .020 | (3.835) | 1.828 | (.143) | (.139) |
| Total from Investment Operations | (.022) | (3.812) | 2.080 | .054 | .014 |
| Distributions | | | | | |
| Dividends from Net Investment Income | (.128) | (.385) | (.260) | (.104) | (.093) |
| Distributions from Realized Capital Gains | — | (.883) | — | — | (.741) |
| Total Distributions | (.128) | (1.268) | (.260) | (.104) | (.834) |
| Net Asset Value, End of Period | $17.00 | $17.15 | $22.23 | $20.41 | $20.46 |
| Total Return2 | -0.12% | -18.17% | 10.30% | 0.27% | 0.11% |
| Ratios/Supplemental Data | | | | | |
| Net Assets, End of Period (Millions) | $137 | $306 | $297 | $320 | $292 |
Ratio of Total Expenses
to Average Net Assets | | | | | |
| Based on Total Expenses3,4 | 1.28% | 0.78% | 0.79%5 | 0.66%5 | 0.79% |
| Net of Dividend and Borrowing Expense on Securities Sold Short | 0.35% | 0.34% | 0.38%5 | 0.33%5 | 0.35% |
| Ratio of Net Investment Income (Loss) to Average Net Assets | (0.25)% | 0.12% | 1.18% | 0.93% | 0.75% |
| Portfolio Turnover Rate | 166% | 173% | 157% | 131% | 125% |
| 1 | Calculated based on average shares outstanding. |
| 2 | Total returns do not include account service fees that may have applied in the periods shown. Fund prospectuses provide information about any applicable account service fees. |
| 3 | Includes dividend expense on securities sold short of 0.37%, 0.44%, 0.41%, 0.33% and 0.44%, respectively. |
| 4 | Includes borrowing expense on securities sold short of 0.56%, 0.00%, 0.00%, 0.00%, and 0.00%, respectively. |
| 5 | The ratio of total expenses to average net assets for the periods ended 2019 and 2018, net of reduction from custody fee offset arrangement for total expenses and net of dividend and borrowing expense on securities sold short, was 0.74% and 0.33%, and 0.65% and 0.32%, respectively. |
See accompanying Notes, which are an integral part of the Financial Statements.
Alternative Strategies Fund
Notes to Consolidated Financial Statements
Vanguard Alternative Strategies Fund is registered under the Investment Company Act of 1940 as an open-end investment company, or mutual fund. Market disruptions associated with the COVID-19 pandemic have had a global impact, and uncertainty exists as to the long-term implications. Such disruptions can adversely affect assets of the fund and thus fund performance.
The Consolidated Financial Statements include Vanguard ASF Portfolio ("the subsidiary"), which commenced operations on August 11, 2015. The subsidiary is wholly owned by the fund and is a unit trust established in the Cayman Islands under the Trusts Law (2011 Revision) of the Cayman Islands, which is organized to invest in certain commodity-linked investments on behalf of the fund, consistent with the fund's investment objectives and policies. The commodity-linked investments and other investments held by the subsidiary are subject to the same risks that apply to similar investments if held directly by the fund. As of October 31, 2021, the fund held $14,945,000 in the subsidiary, representing 11% of the fund's net assets. All inter-fund transactions and balances (including the fund's investment in the subsidiary) have been eliminated, and the Consolidated Financial Statements include all investments and other accounts of the subsidiary as if held directly by the fund.
| A. | The following significant accounting policies conform to generally accepted accounting principles for U.S. investment companies. The fund consistently follows such policies in preparing its financial statements. |
1. Security Valuation: Securities are valued as of the close of trading on the New York Stock Exchange (generally 4 p.m., Eastern time) on the valuation date. Equity securities are valued at the latest quoted sales prices or official closing prices taken from the primary market in which each security trades; such securities not traded on the valuation date are valued at the mean of the latest quoted bid and asked prices. Securities for which market quotations are not readily available, or whose values have been materially affected by events occurring before the fund’s pricing time but after the close of the securities’ primary markets, are valued by methods deemed by the board of trustees to represent fair value. Investments in Vanguard Market Liquidity Fund are valued at that fund's net asset value. Temporary cash investments are valued using the latest bid prices or using valuations based on a matrix system (which considers such factors as security prices, yields, maturities, and ratings), both as furnished by independent pricing services.
2. Foreign Currency: Securities and other assets and liabilities denominated in foreign currencies are translated into U.S. dollars using exchange rates obtained from an independent third party as of the fund’s pricing time on the valuation date. Realized gains (losses) and unrealized appreciation (depreciation) on investment securities include the effects of changes in exchange rates since the securities were purchased, combined with the effects of changes in security prices. Fluctuations in the value of other assets and liabilities resulting from changes in exchange rates are recorded as unrealized foreign currency gains (losses) until the assets or liabilities are settled in cash, at which time they are recorded as realized foreign currency gains (losses).
3. Futures Contracts: The fund gains exposure to commodities through the subsidiary’s investment in exchange-traded commodity futures contracts. The fund also uses interest rate futures contracts to invest in fixed income asset classes with greater efficiency and lower cost than is possible through direct investment, to add value when these instruments are attractively priced, or to adjust sensitivity to changes in interest rates. The fund uses global equity index futures contracts to capture excess return opportunities. The primary risk associated with the use of futures contracts are imperfect correlation between changes in market values of the underlying securities or commodities and the prices of futures contracts, and the possibility of an illiquid market. In
Alternative Strategies Fund
addition, commodity futures trading is volatile, and even a small movement in market prices could cause large losses. Counterparty risk involving futures is mitigated because a regulated clearinghouse is the counterparty instead of the clearing broker. To further mitigate counterparty risk, the fund trades futures contracts on an exchange, monitors the financial strength of its clearing brokers and clearinghouse, and has entered into clearing agreements with its clearing brokers. The clearinghouse imposes initial margin requirements to secure the fund’s performance and requires daily settlement of variation margin representing changes in the market value of each contract. Any assets pledged as initial margin for open contracts are noted in the Consolidated Schedule of Investments.
Futures contracts are valued at their quoted daily settlement prices. The notional amounts of the contracts are not recorded in the Consolidated Statement of Assets and Liabilities. Fluctuations in the value of the contracts are recorded in the Consolidated Statement of Assets and Liabilities as an asset (liability) and in the Consolidated Statement of Operations as unrealized appreciation (depreciation) until the contracts are closed, when they are recorded as realized gains (losses) on futures contracts.
During the year ended October 31, 2021, the fund average investments in long and short futures contracts represented 175% and 54% of net assets, respectively, based on the average of the notional amounts at each quarter-end during the period.
4. Forward Currency Contracts: The fund enters into forward currency contracts to protect the value of securities and related receivables and payables against changes in future foreign exchange rates. The fund’s risks in using these contracts include movement in the values of the foreign currencies relative to the U.S. dollar and the ability of the counterparties to fulfill their obligations under the contracts. The fund mitigates its counterparty risk by entering into forward currency contracts only with a diverse group of prequalified counterparties, monitoring their financial strength, entering into master netting arrangements with its counterparties, and requiring its counterparties to transfer collateral as security for their performance. In the absence of a default, the collateral pledged or received by the fund cannot be repledged, resold, or rehypothecated. The master netting arrangements provide that, in the event of a counterparty’s default (including bankruptcy), the fund may terminate the forward currency contracts, determine the net amount owed by either party in accordance with its master netting arrangements, and sell or retain any collateral held up to the net amount owed to the fund under the master netting arrangements. The forward currency contracts contain provisions whereby a counterparty may terminate open contracts if the fund’s net assets decline below a certain level, triggering a payment by the fund if the fund is in a net liability position at the time of the termination. The payment amount would be reduced by any collateral the fund has pledged. Any securities pledged as collateral for open contracts are noted in the Consolidated Schedule of Investments. The value of collateral received or pledged is compared daily to the value of the forward currency contracts exposure with each counterparty, and any difference, if in excess of a specified minimum transfer amount, is adjusted and settled within two business days.
Forward currency contracts are valued at their quoted daily prices obtained from an independent third party, adjusted for currency risk based on the expiration date of each contract. The notional amounts of the contracts are not recorded in the Consolidated Statement of Assets and Liabilities. Fluctuations in the value of the contracts are recorded in the Consolidated Statement of Assets and Liabilities as an asset (liability) and in the Consolidated Statement of Operations as unrealized appreciation (depreciation) until the contracts are closed, when they are recorded as realized gains (losses) on forward currency contracts.
Alternative Strategies Fund
During the year ended October 31, 2021, the fund’s average investment in forward currency contracts represented 84% of net assets, based on the average of the notional amounts at each quarter-end during the period.
The following table summarizes the fund’s derivative assets and liabilities by counterparty for derivatives subject to arrangements that provide for offsetting assets and liabilities. Exchange-traded and centrally cleared derivatives are listed separately.
| | Assets
Reflected in
Consolidated
Statement of
Assets and
Liabilities1
($000) | Liabilities
Reflected in
Consolidated
Statement of
Assets and
Liabilities1
($000) | Net Amount
Receivable
(Payable)
($000) | Amounts Not Offset in
the Consolidated
Statement of Assets
and Liabilities | Net
Exposure3
(Not Less
Than $0)
($000) |
| | Collateral
Pledged2
($000) | Collateral
Received2
($000) |
Derivatives Subject to
Offsetting Arrangements, by Counterparty | | | | | | |
| Bank of America, N.A. | — | (4) | (4) | — | — | — |
| BNP Paribas | 32 | (7) | 25 | — | — | 25 |
| Morgan Stanley Capital Services Inc. | 406 | (458) | (52) | — | 60 | — |
| Royal Bank of Canada | — | (151) | (151) | — | — | — |
| Standard Chartered Bank | 200 | (297) | (97) | — | — | — |
| State Street Bank & Trust Co. | 43 | (18) | 25 | — | — | 25 |
Exchange-Traded
Futures Contracts | — | (2,227) | (2,227) | 8,820 | — | — |
| Total | 681 | (3,162) | (2,481) | 8,820 | 60 | 50 |
1 Absent an event of default or early termination, derivative assets and liabilities are presented gross and not offset in the Consolidated Statement of Assets and Liabilities.
2 Securities or other assets pledged as collateral are noted in the Consolidated Schedule of Investments and Consolidated Statement of Assets and Liabilities. Securities or other assets received as collateral are held in a segregated account and not included in the fund’s security holdings in the Consolidated Schedule of Investments.
3 Net Exposure represents the net amount receivable from the counterparty in the event of default. Counterparties are not required to exchange collateral if amount is below a specified minimum transfer amount.
5. Short Sales: Short sales are the sales of securities that the fund does not own. The fund sells a security it does not own in anticipation of a decline in the value of that security. In order to deliver the security to the purchaser, the fund borrows the security from a broker-dealer. The fund must segregate, as collateral for its obligation to return the borrowed security, an amount of cash and long security positions at least equal to the market value of the security sold short. In the absence of a default, the collateral segregated by the fund cannot be repledged, resold or rehypothecated. This results in the fund holding a significant portion of its assets in cash. The fund later closes out the position by returning the security to the lender, typically by purchasing the security in the open market. A gain, limited to the price at which the fund sold the security short, or a loss, theoretically unlimited in size, is recognized upon the termination of the short sale. The fund may receive a portion of the income from the investment of collateral, or be charged a fee on borrowed securities, based on the market value of each borrowed security and a variable rate that is dependent upon the availability of such security. The net amounts of income or fees are recorded as interest income (for net income received) or borrowing expense on securities sold short (for net fees charged) on the Consolidated Statement of Operations. Dividends on securities sold short are
Alternative Strategies Fund
reported as an expense in the Consolidated Statement of Operations. Cash collateral segregated for securities sold short is recorded as an asset in the Consolidated Statement of Assets and Liabilities. Long security positions segregated as collateral are shown in the Consolidated Schedule of Investments.
6. Federal Income Taxes: The fund intends to continue to qualify as a regulated investment company and distribute all of its taxable income. The subsidiary is classified as a foreign corporation for U.S. tax purposes, and because it does not carry on a U.S. trade or business, is generally not subject to U.S. federal income tax. The subsidiary also complies with the Foreign Account Tax Compliance Act ("FATCA") and thus will not be subject to 30% withholding under FATCA on any income from U.S. investments. In addition, the subsidiary is not subject to Cayman Islands income tax. The subsidiary is not required to distribute any earnings and profits to the fund. The fund’s tax returns are open to examination by the relevant tax authorities until expiration of the applicable statute of limitations, which is generally three years after filing the tax return. Management has analyzed the fund’s tax positions taken for all open federal and state income tax years, and has concluded that no provision for income tax is required in the fund’s financial statements.
7. Distributions: Distributions to shareholders are recorded on the ex-dividend date. Distributions are determined on a tax basis at the fiscal year-end and may differ from net investment income and realized capital gains for financial reporting purposes.
8. Credit Facilities and Interfund Lending Program: The fund and certain other funds managed by The Vanguard Group ("Vanguard") participate in a $4.3 billion committed credit facility provided by a syndicate of lenders pursuant to a credit agreement and an uncommitted credit facility provided by Vanguard. Both facilities may be renewed annually. Each fund is individually liable for its borrowings, if any, under the credit facilities. Borrowings may be utilized for temporary or emergency purposes, subject to the fund’s regulatory and contractual borrowing restrictions. With respect to the committed credit facility, the participating funds are charged administrative fees and an annual commitment fee of 0.10% of the undrawn committed amount of the facility; these fees are allocated to the funds based on a method approved by the fund’s board of trustees and included in Management and Administrative expenses on the fund’s Consolidated Statement of Operations. Any borrowings under either facility bear interest at a rate based upon the higher of the one-month London Interbank Offered Rate (or an acceptable alternate rate, if necessary), federal funds effective rate, or overnight bank funding rate plus an agreed-upon spread, except that borrowings under the uncommitted credit facility may bear interest based upon an alternate rate agreed to by the fund and Vanguard.
In accordance with an exemptive order (the “Order”) from the SEC, the fund may participate in a joint lending and borrowing program that allows registered open-end Vanguard funds to borrow money from and lend money to each other for temporary or emergency purposes (the “Interfund Lending Program”), subject to compliance with the terms and conditions of the Order, and to the extent permitted by the fund’s investment objective and investment policies. Interfund loans and borrowings normally extend overnight, but can have a maximum duration of seven days. Loans may be called on one business day’s notice. The interest rate to be charged is governed by the conditions of the Order and internal procedures adopted by the board of trustees. The board of trustees is responsible for overseeing the Interfund Lending Program.
For the year ended October 31, 2021, the fund did not utilize the credit facilities or the Interfund Lending Program.
Alternative Strategies Fund
9. Other: Dividend income (or dividend expense on short positions) is recorded on the ex-dividend date. Non-cash dividends included in income, if any, are recorded at the fair value of the securities received. Interest income includes income distributions received from Vanguard Market Liquidity Fund and is accrued daily. Premiums and discounts on debt securities are amortized and accreted, respectively, to interest income over the lives of the respective securities, except for premiums on certain callable debt securities that are amortized to the earliest call date. Security transactions are accounted for on the date securities are bought or sold. Costs used to determine realized gains (losses) on the sale of investment securities are those of the specific securities sold.
| B. | In accordance with the terms of a Funds' Service Agreement (the “FSA”) between Vanguard and the fund, Vanguard furnishes to the fund investment advisory, corporate management, administrative, marketing, and distribution services at Vanguard’s cost of operations (as defined by the FSA). These costs of operations are allocated to the fund based on methods and guidelines approved by the board of trustees and are generally settled twice a month. |
Under a separate agreement, Vanguard provides corporate management and administrative services to the subsidiary for an annual fee of 0.40% of average net assets of the subsidiary, generally settled once a month. In addition, the subsidiary pays an unaffiliated third party, VGMF I (Cayman) Limited, an affiliate of Maples Trustee Services (Cayman) Limited, a fee plus reasonable additional expenses for trustee services. All of the subsidiary’s expenses are reflected in the Consolidated Statement of Operations and in the Ratio of Total Expenses to Average Net Assets in the Consolidated Financial Highlights.
Upon the request of Vanguard, the fund may invest up to 0.40% of its net assets as capital in Vanguard. At October 31, 2021, the fund had contributed to Vanguard capital in the amount of $6,000, representing less than 0.01% of the fund’s net assets and less than 0.01% of Vanguard’s capital received pursuant to the FSA. The fund’s trustees and officers are also directors and employees, respectively, of Vanguard.
| C. | Various inputs may be used to determine the value of the fund’s investments and derivatives. These inputs are summarized in three broad levels for financial statement purposes. The inputs or methodologies used to value securities are not necessarily an indication of the risk associated with investing in those securities. |
Level 1—Quoted prices in active markets for identical securities.
Level 2—Other significant observable inputs (including quoted prices for similar securities, interest rates, prepayment speeds, credit risk, etc.).
Level 3—Significant unobservable inputs (including the fund’s own assumptions used to determine the fair value of investments). Any investments and derivatives valued with significant unobservable inputs are noted on the Consolidated Schedule of Investments.
Alternative Strategies Fund
The following table summarizes the market value of the fund’s investments and derivatives as of October 31, 2021, based on the inputs used to value them:
| | Level 1
($000) | Level 2
($000) | Level 3
($000) | Total
($000) |
| Investments | | | | |
| Assets | | | | |
| Common Stocks | 59,800 | 2,022 | — | 61,822 |
| Temporary Cash Investments | 60,610 | — | — | 60,610 |
| Total | 120,410 | 2,022 | — | 122,432 |
| Liabilities | | | | |
| Common Stocks | 14,614 | — | — | 14,614 |
| Derivative Financial Instruments | | | | |
| Assets | | | | |
| Futures Contracts1 | 3,296 | — | — | 3,296 |
| Forward Currency Contracts | — | 681 | — | 681 |
| Total | 3,296 | 681 | — | 3,977 |
| Liabilities | | | | |
| Futures Contracts1 | 3,794 | — | — | 3,794 |
| Forward Currency Contracts | — | 935 | — | 935 |
| Total | 3,794 | 935 | — | 4,729 |
| 1 | Includes cumulative appreciation (depreciation) on futures contracts and centrally cleared swaps, if any, as reported in the Consolidated Schedule of Investments. Only current day’s variation margin is reported within the Consolidated Statement of Assets and Liabilities. |
| D. | At October 31, 2021, the fair values of derivatives were reflected in the Consolidated Schedule of Investments and Consolidated Statement of Assets and Liabilities as follows: |
| Consolidated Statement of Assets and Liabilities Caption | Equity
Contracts
($000) | Commodity
Contracts
($000) | Interest Rate
Contracts
($000) | Foreign
Exchange
Contracts
($000) | Total
($000) |
| Unrealized Appreciation—Futures Contracts1 | 1,811 | 1,485 | — | — | 3,296 |
| Unrealized Appreciation—Forward Currency Contracts | — | — | — | 681 | 681 |
| Total Assets | 1,811 | 1,485 | — | 681 | 3,977 |
| | | | | | |
| Unrealized Depreciation—Futures Contracts1 | 1,044 | 1,517 | 1,233 | — | 3,794 |
| Unrealized Depreciation—Forward Currency Contracts | — | — | — | 935 | 935 |
| Total Liabilities | 1,044 | 1,517 | 1,233 | 935 | 4,729 |
| 1 | Includes cumulative appreciation (depreciation) on futures contracts and centrally cleared swaps, if any, as reported in the Consolidated Schedule of Investments. Only current day’s variation margin is reported within the Consolidated Statement of Assets and Liabilities. |
Alternative Strategies Fund
Realized net gain (loss) and the change in unrealized appreciation (depreciation) on derivatives for the year ended October 31, 2021, were:
| Realized Net Gain (Loss) on Derivatives | Equity
Contracts
($000) | Commodity
Contracts
($000) | Interest Rate
Contracts
($000) | Foreign
Exchange
Contracts
($000) | Total
($000) |
| Futures Contracts | (1,905) | 3,970 | (1,388) | — | 677 |
| Forward Currency Contracts | — | — | — | 5,051 | 5,051 |
| Realized Net Gain (Loss) on Derivatives | (1,905) | 3,970 | (1,388) | 5,051 | 5,728 |
| Change in Unrealized Appreciation (Depreciation) on Derivatives |
| Futures Contracts | (820) | (922) | (700) | — | (2,442) |
| Forward Currency Contracts | — | — | — | 697 | 697 |
| Change in Unrealized Appreciation (Depreciation) on Derivatives | (820) | (922) | (700) | 697 | (1,745) |
| E. | Permanent differences between book-basis and tax-basis components of net assets are reclassified among capital accounts in the financial statements to reflect their tax character. These reclassifications have no effect on net assets or net asset value per share. As of period end, permanent differences primarily attributable to the accounting for foreign currency transactions, passive foreign investment companies, and operations of the subsidiary were reclassified between the individual components of total distributable earnings (loss). |
Temporary differences between book-basis and tax-basis components of total distributable earnings (loss) arise when certain items of income, gain, or loss are recognized in different periods for financial statement and tax purposes; these differences will reverse at some time in the future. The differences are primarily related to the deferral of losses from wash sales; the recognition of unrealized gains or losses from certain derivative contracts; the recognition of unrealized gains from passive foreign investment companies; and the recognition of unrealized gain from constructive sales. As of period end, the tax-basis components of total distributable earnings (loss) are detailed in the table as follows:
| | Amount
($000) |
| Undistributed Ordinary Income | 2,291 |
| Undistributed Long-Term Gains | — |
| Capital Loss Carryforwards | (44,036) |
| Qualified Late-Year Losses | — |
| Net Unrealized Gains (Losses) | 7,429 |
Alternative Strategies Fund
The tax character of distributions paid was as follows:
| | Year Ended October 31, |
| | 2021
Amount
($000) | 2020
Amount
($000) |
| Ordinary Income* | 2,074 | 13,349 |
| Long-Term Capital Gains | — | 4,060 |
| Total | 2,074 | 17,409 |
| * | Includes short-term capital gains, if any. |
As of October 31, 2021, gross unrealized appreciation and depreciation for investments and derivatives based on cost for U.S. federal income tax purposes were as follows:
| | Amount
($000) |
| Tax Cost | 113,961 |
| Gross Unrealized Appreciation | 24,597 |
| Gross Unrealized Depreciation | (17,105) |
| Net Unrealized Appreciation (Depreciation) | 7,492 |
| F. | During the year ended October 31, 2021, the fund purchased $129,068,000 of investment securities and sold $215,186,000 of investment securities, other than temporary cash investments. The proceeds of short sales and the cost of purchases to cover short sales were $36,733,000 and $75,570,000, respectively. |
| G. | Capital shares issued and redeemed were: |
| | Year Ended October 31, |
| | 2021
Shares
(000) | 2020
Shares
(000) |
| | | |
| Issued | 1,865 | 16,660 |
| Issued in Lieu of Cash Distributions | 122 | 829 |
| Redeemed | (11,786) | (13,003) |
| Net Increase (Decrease) in Shares Outstanding | (9,799) | 4,486 |
At October 31, 2021, Vanguard Managed Allocation Fund, was the record or beneficial owner of 80% of the fund’s net assets. If this shareholder were to redeem its investment in the fund, the redemption might result in an increase in the fund’s expense ratio, cause the fund to incur higher transaction costs, or lead to the realization of taxable capital gains.
| H. | Management has determined that no material events or transactions occurred subsequent to October 31, 2021, that would require recognition or disclosure in these financial statements. |
Report of Independent Registered Public Accounting Firm
To the Board of Trustees of Vanguard Trustees' Equity Fund and Shareholders of Vanguard Alternative Strategies Fund
Opinion on the Financial Statements
We have audited the accompanying consolidated statement of assets and liabilities, including the consolidated schedule of investments, of Vanguard Alternative Strategies Fund and its subsidiary (one of the funds constituting Vanguard Trustees' Equity Fund, referred to hereafter as the "Fund") as of October 31, 2021, the related consolidated statement of operations for the year ended October 31, 2021, the consolidated statement of changes in net assets for each of the two years in the period ended October 31, 2021, including the related notes, and the consolidated financial highlights for each of the five years in the period ended October 31, 2021 (collectively referred to as the "consolidated financial statements"). In our opinion, the consolidated financial statements present fairly, in all material respects, the financial position of the Fund as of October 31, 2021, the results of its operations for the year then ended, the changes in its net assets for each of the two years in the period ended October 31, 2021 and the financial highlights for each of the five years in the period ended October 31, 2021 in conformity with accounting principles generally accepted in the United States of America.
Basis for Opinion
These consolidated financial statements are the responsibility of the Fund’s management. Our responsibility is to express an opinion on the Fund’s consolidated financial statements based on our audits. We are a public accounting firm registered with the Public Company Accounting Oversight Board (United States) (PCAOB) and are required to be independent with respect to the Fund in accordance with the U.S. federal securities laws and the applicable rules and regulations of the Securities and Exchange Commission and the PCAOB.
We conducted our audits of these consolidated financial statements in accordance with the standards of the PCAOB. Those standards require that we plan and perform the audit to obtain reasonable assurance about whether the consolidated financial statements are free of material misstatement, whether due to error or fraud.
Our audits included performing procedures to assess the risks of material misstatement of the consolidated financial statements, whether due to error or fraud, and performing procedures that respond to those risks. Such procedures included examining, on a test basis, evidence regarding the amounts and disclosures in the consolidated financial statements. Our audits also included evaluating the accounting principles used and significant estimates made by management, as well as evaluating the overall presentation of the consolidated financial statements. Our procedures included confirmation of securities owned as of October 31, 2021 by correspondence with the custodian, transfer agent and brokers; when replies were not received from the brokers, we performed other auditing procedures. We believe that our audits provide a reasonable basis for our opinion.
/s/PricewaterhouseCoopers LLP
Philadelphia, Pennsylvania
December 17, 2021
We have served as the auditor of one or more investment companies in The Vanguard Group of Funds since 1975.
Special 2021 tax information (unaudited) for Vanguard Alternative Strategies Fund
This information for the fiscal year ended October 31, 2021, is included pursuant to provisions of the Internal Revenue Code.
The fund distributed $2,074,000 of qualified dividend income to shareholders during the fiscal year.
For corporate shareholders, 55.6% of investment income (dividend income plus short-term gains, if any) qualifies for the dividends-received deduction.
This page intentionally left blank.
The People Who Govern Your Fund
The trustees of your mutual fund are there to see that the fund is operated and managed in your best interests since, as a shareholder, you are a part owner of the fund. Your fund’s trustees also serve on the board of directors of The Vanguard Group, Inc., which is owned by the Vanguard funds and provides services to them.
A majority of Vanguard’s board members are independent, meaning that they have no affiliation with Vanguard or the funds they oversee, apart from the sizable personal investments they have made as private individuals. The independent board members have distinguished backgrounds in business, academia, and public service. Each of the trustees and executive officers oversees 214 Vanguard funds.
Information for each trustee and executive officer of the fund appears below. That information, as well as the Vanguard fund count, is as of the date on the cover of this fund report. The mailing address of the trustees and officers is P.O. Box 876, Valley Forge, PA 19482. More information about the trustees is in the Statement of Additional Information, which can be obtained, without charge, by contacting Vanguard at 800-662-7447, or online at vanguard.com.
Interested Trustee1
Mortimer J. Buckley
Born in 1969. Trustee since January 2018. Principal occupation(s) during the past five years and other experience: chairman of the board (2019–present) of Vanguard and of each of the investment companies served by Vanguard; chief executive officer (2018–present) of Vanguard; chief executive officer, president, and trustee (2018–present) of each of the investment companies served by Vanguard; president and director (2017–present) of Vanguard; and president (2018–present) of Vanguard Marketing Corporation. Chief investment officer (2013–2017), managing director (2002–2017), head of the Retail Investor Group (2006–2012), and chief information officer (2001–2006) of Vanguard. Chairman of the board (2011–2017) and trustee (2009–2017) of the Children’s Hospital of Philadelphia; and trustee (2018–present) and vice chair (2019–present) of The Shipley School.
Independent Trustees
Emerson U. Fullwood
Born in 1948. Trustee since January 2008. Principal occupation(s) during the past five years and other experience: executive chief staff and marketing officer for North America and corporate vice president (retired 2008) of Xerox Corporation (document management products and services). Former president of the Worldwide Channels Group, Latin
America, and Worldwide Customer Service and executive chief staff officer of Developing Markets of Xerox. Executive in residence and 2009–2010 Distinguished Minett Professor at the Rochester Institute of Technology. Director of SPX FLOW, Inc. (multi-industry manufacturing). Director of the University of Rochester Medical Center, the Monroe Community College Foundation, the United Way of Rochester, North Carolina A&T University, and Roberts Wesleyan College. Trustee of the University of Rochester.
Amy Gutmann
Born in 1949. Trustee since June 2006. Principal occupation(s) during the past five years and other experience: president (2004–present) of the University of Pennsylvania. Christopher H. Browne Distinguished Professor of Political Science, School of Arts and Sciences, and professor of communication, Annenberg School for Communication, with secondary faculty appointments in the Department of Philosophy, School of Arts and Sciences, and at the Graduate School of Education, University of Pennsylvania.
F. Joseph Loughrey
Born in 1949. Trustee since October 2009. Principal occupation(s) during the past five years and other experience: president and chief operating officer (retired 2009) and vice chairman of the board (2008–2009) of Cummins Inc. (industrial machinery). Chairman of the board of Hillenbrand, Inc. (specialized consumer services). Director of the V Foundation.
1 Mr. Buckley is considered an “interested person,” as defined in the Investment Company Act of 1940, because he is an officer of the Vanguard funds.
Member of the advisory council for the College of Arts and Letters and chair of the advisory board to the Kellogg Institute for International Studies, both at the University of Notre Dame. Chairman of the board of Saint Anselm College.
Mark Loughridge
Born in 1953. Trustee since March 2012. Principal occupation(s) during the past five years and other experience: senior vice president and chief financial officer (retired 2013) of IBM (information technology services). Fiduciary member of IBM’s Retirement Plan Committee (2004–2013), senior vice president and general manager (2002–2004) of IBM Global Financing, vice president and controller (1998–2002) of IBM, and a variety of other prior management roles at IBM. Member of the Council on Chicago Booth.
Scott C. Malpass
Born in 1962. Trustee since March 2012. Principal occupation(s) during the past five years and other experience: chief investment officer (retired June 2020) and vice president (retired June 2020) of the University of Notre Dame. Assistant professor (retired June 2020) of finance at the Mendoza College of Business, University of Notre Dame, and member of the Notre Dame 403(b) Investment Committee. Member of the board of Catholic Investment Services, Inc. (investment advisors) and the board of superintendence of the Institute for the Works of Religion.
Deanna Mulligan
Born in 1963. Trustee since January 2018. Principal occupation(s) during the past five years and other experience: board chair (2020), chief executive officer (2011–2020), and president (2010–2019) of The Guardian Life Insurance Company of America. Chief operating officer (2010–2011) and executive vice president (2008–2010) of Individual Life and Disability of the Guardian Life Insurance Company of America. Member of the board of the Economic Club of New York. Trustee of the Partnership for New York City (business leadership), Chief Executives for Corporate Purpose, NewYork-Presbyterian Hospital, and the Bruce Museum (arts and science). Member of the Advisory Council for the Stanford Graduate School of Business.
André F. Perold
Born in 1952. Trustee since December 2004. Principal occupation(s) during the past five years and other experience: George Gund Professor of Finance and Banking, Emeritus at the Harvard Business School (retired 2011). Chief investment officer and co-managing partner of HighVista Strategies (private investment firm). Member of the board
(2018–present) of RIT Capital Partners (investment firm). Member of the investment committee of Partners Health Care System.
Sarah Bloom Raskin
Born in 1961. Trustee since January 2018. Principal occupation(s) during the past five years and other experience: deputy secretary (2014–2017) of the United States Department of the Treasury. Governor (2010–2014) of the Federal Reserve Board. Commissioner (2007–2010) of financial regulation for the State of Maryland. Professor (2020–present), Distinguished Fellow of the Global Financial Markets Center (2020–present), and Rubenstein Fellow (2017–2020) at Duke University. Trustee (2017–present) of Amherst College and member of Amherst College Investment Committee (2019–present). Member of the Regenerative Crisis Response Committee (2020–present).
David A. Thomas
Born in 1956. Trustee since July 2021. Principal occupation(s) during the past five years and other experience: president of Morehouse College (2018–present). Professor of business administration, emeritus at Harvard University (2017–2018). Dean (2011–2016) and professor of management (2016–2017) at the Georgetown University McDonough School of Business. Director of DTE Energy Company (2013–present). Trustee of Common Fund (2019–present).
Peter F. Volanakis
Born in 1955. Trustee since July 2009. Principal occupation(s) during the past five years and other experience: president and chief operating officer (retired 2010) of Corning Incorporated (communications equipment) and director of Corning Incorporated (2000–2010) and Dow Corning (2001–2010). Director (2012) of SPX Corporation (multi-industry manufacturing). Overseer of the Amos Tuck School of Business Administration, Dartmouth College (2001–2013). Chairman of the board of trustees of Colby-Sawyer College. Member of the BMW Group Mobility Council.
Executive Officers
Christine M. Buchanan
Born in 1970. Principal occupation(s) during the past five years and other experience: principal of Vanguard. Chief financial officer (2021–present) and treasurer (2017–present) of each of the investment companies served by Vanguard. Partner (2005–2017) at KPMG (audit, tax, and advisory services).
David Cermak
Born in 1960. Principal occupation(s) during the past five years and other experience: principal of Vanguard. Finance director (2019–present) of each of the investment companies served by Vanguard. Managing director and head (2017–present) of Vanguard Investments Singapore. Managing director and head (2017–2019) of Vanguard Investments Hong Kong. Representative director and head (2014–2017) of Vanguard Investments Japan.
John Galloway
Born in 1973. Principal occupation(s) during the past five years and other experience: principal of Vanguard. Investment stewardship officer (September 2020–present) of each of the investment companies served by Vanguard. Head of Investor Advocacy (February 2020–present) and head of Marketing Strategy and Planning (2017–2020) at Vanguard. Deputy assistant to the President of the United States (2015).
Peter Mahoney
Born in 1974. Principal occupation(s) during the past five years and other experience: principal of Vanguard. Controller (2015–present) of each of the investment companies served by Vanguard. Head of International Fund Services (2008–2014) at Vanguard.
Anne E. Robinson
Born in 1970. Principal occupation(s) during the past five years and other experience: general counsel (2016–present) of Vanguard. Secretary (2016–present) of Vanguard and of each of the investment companies served by Vanguard. Managing director (2016–present) of Vanguard. Managing director and general counsel of Global Cards and Consumer Services (2014–2016) at Citigroup. Counsel (2003–2014) at American Express.
Michael Rollings
Born in 1963. Principal occupation(s) during the past five years and other experience: finance director (2017–present) and treasurer (2017) of each of the investment companies served by Vanguard. Managing director (2016–present) of Vanguard. Chief financial officer (2016–present) of Vanguard. Director (2016–present) of Vanguard Marketing Corporation. Executive vice president and chief financial officer (2006–2016) of MassMutual Financial Group.
John E. Schadl
Born in 1972. Principal occupation(s) during the past five years and other experience: principal of Vanguard. Chief compliance officer (2019–present) of Vanguard and of each of the investment companies served by Vanguard. Assistant vice president (2019–present) of Vanguard Marketing Corporation.
Vanguard Senior Management Team
| Matthew Benchener | Thomas M. Rampulla |
| Joseph Brennan | Karin A. Risi |
| Mortimer J. Buckley | Anne E. Robinson |
| Gregory Davis | Michael Rollings |
| John James | Nitin Tandon |
| John T. Marcante | Lauren Valente |
| Chris D. Mclsaac | |
Connect with Vanguard®>vanguard.com
Fund Information > 800-662-7447
Direct Investor Account Services > 800-662-2739
Institutional Investor Services > 800-523-1036
Text Telephone for People Who Are Deaf or Hard of Hearing > 800-749-7273
This material may be used in conjunction with the offering of shares of any Vanguard fund only if preceded or accompanied by the fund’s current prospectus.
All comparative mutual fund data are from Lipper, a Thomson Reuters Company, or Morningstar, Inc., unless otherwise noted.
You can obtain a free copy of Vanguard’s proxy voting guidelines by visiting vanguard.com/proxyreporting or by calling Vanguard at 800-662-2739. The guidelines are also available from the SEC’s website, www.sec.gov. In addition, you may obtain a free report on how your fund voted the proxies for securities it owned during the 12 months ended June 30. To get the report, visit either vanguard.com/proxyreporting or www.sec.gov.
You can review information about your fund on the SEC’s website, and you can receive copies of this information, for a fee, by sending a request via email addressed to publicinfo@sec.gov.
Source for Bloomberg indexes: Bloomberg Index Services Limited. Copyright 2021, Bloomberg. All rights reserved.
CFA® is a registered trademark owned by CFA Institute.
© 2021 The Vanguard Group, Inc.
All rights reserved.
Vanguard Marketing Corporation, Distributor.
Q12980 122021
Annual Report | October 31, 2021
Vanguard Commodity Strategy Fund
Contents
Your Fund’s Performance at a Glance
| 1 |
Advisors’ Report
| 2 |
About Your Fund’s Expenses
| 4 |
Performance Summary
| 6 |
Consolidated Financial Statements
| 8 |
Please note: The opinions expressed in this report are just that—informed opinions. They should not be considered promises or advice. Also, please keep in mind that the information and opinions cover the period through the date on the front of this report. Of course, the risks of investing in your fund are spelled out in the prospectus.
Your Fund’s Performance at a Glance
| • | For the 12 months ended October 31, 2021, Vanguard Commodity Strategy Fund returned 52.30%, besting its benchmark, the Bloomberg Commodity Total Return Index, which returned 43.94%. |
| • | The global economy continued to recover from the sharp pandemic-induced contraction in the spring of 2020. Swift and extensive fiscal and monetary support from policymakers was key to the rebound. |
| • | The environment for commodities was one of the most attractive in years because of limited supply and increased demand worldwide. West Texas Intermediate Crude and natural gas, both of which were hit hard by a sharp drop in demand in 2020, recovered strongly over the past 12 months. Safe-haven commodities, such as gold, lagged. |
| • | The fund outpaced its benchmark largely because of its collateral positions. It has a significant portion of short-term U.S. Treasury Inflation-Protected Securities, which outperformed Treasury bills. Positions in natural gas, soybeans, and live cattle also added value. |
| • | The fund uses derivatives to obtain its exposure to commodities. Its holdings of commodity index swaps contributed to total returns. |
Market Barometer
| | Average Annual Total Returns
Periods Ended October 31, 2021 |
| | One Year | Three Years | Five Years |
| Stocks | | | |
| Russell 1000 Index (Large-caps) | 43.51% | 22.01% | 19.16% |
| Russell 2000 Index (Small-caps) | 50.80 | 16.47 | 15.52 |
| Russell 3000 Index (Broad U.S. market) | 43.90 | 21.62 | 18.91 |
| FTSE All-World ex US Index (International) | 30.23 | 12.42 | 10.05 |
| Bonds | | | |
Bloomberg U.S. Aggregate Bond Index
(Broad taxable market) | -0.48% | 5.63% | 3.10% |
Bloomberg Municipal Bond Index
(Broad tax-exempt market) | 2.64 | 5.17 | 3.41 |
| FTSE Three-Month U.S. Treasury Bill Index | 0.05 | 1.08 | 1.12 |
| CPI | | | |
| Consumer Price Index | 6.22% | 3.03% | 2.73% |
For the 12 months ended October 31, 2021, Vanguard Commodity Strategy Fund returned 52.30%. It outpaced its benchmark, the Bloomberg Commodity Total Return Index, which returned 43.94%.
Investment objective and strategy
The Commodity Strategy Fund is designed to serve investors as a potential hedge against inflation risk and as further diversification for a traditional stock/bond portfolio. It invests in commodity-linked derivative investments, such as commodity futures and swaps, collateralized by a mix of short-term U.S. Treasury Inflation-Protected Securities (TIPS) and U.S. Treasury bills. This blend of investments is expected to offer a controlled approach with the potential to enhance returns over time without taking on excessive risk.
The fund uses multiple strategies to enhance commodity returns, such as commodity curve positioning and over- and underweighting securities. It also takes advantage of roll schedules, a practice that involves rolling over commodity futures before or after the Bloomberg Commodity Total Return Index rolls shorter-term futures contracts into longer-term contracts.
Investment environment
The world economy’s recovery from the 2020 pandemic-induced contraction was quicker than many had expected. Countries that have been better at containing the virus have generally been more successful economically. Swift and extensive fiscal and monetary support from policymakers was also key to the rebound.
Even amid concerns toward the end of the fiscal year about inflation and less accommodative monetary policy, stock returns were excellent. The FTSE All-World Index returned 37.59% for the period.
Bond yields moved higher in much of the developed world despite the worries about inflation and the prospect that some developed-market central banks might scale back their bond-buying programs or raise interest rates.
The environment for commodities was one of the most attractive in years because of limited supply and increased demand worldwide. West Texas Intermediate Crude and natural gas, both of which were hit hard by a sharp drop in demand in 2020, recovered strongly over the past 12 months. Safe-haven commodities such as gold lagged.
Successes and shortfalls
The fund benefited primarily from our collateral management. Well over half of our collateral is in short-term TIPS, which outperformed Treasuries and helped mitigate the rise in inflation near the end of the period. Our positions in natural gas, soybeans, and live cattle also added value. Our holdings in West Texas Intermediate Crude, Brent Crude, and copper detracted.
Although markets can be unpredictable, we are confident that our team of experienced managers and analysts can find opportunities to produce competitive returns without taking excessive risks.
Portfolio Managers:
Anatoly Shtekhman, CFA
Fei Xu, CFA
Vanguard Quantitative Equity Group
Joshua C. Barrickman, CFA, Principal
Vanguard Fixed Income Group
November 15, 2021
About Your Fund’s Expenses
As a shareholder of the fund, you incur ongoing costs, which include costs for portfolio management, administrative services, and shareholder reports (like this one), among others. Operating expenses, which are deducted from a fund’s gross income, directly reduce the investment return of the fund.
A fund’s expenses are expressed as a percentage of its average net assets. This figure is known as the expense ratio. The following examples are intended to help you understand the ongoing costs (in dollars) of investing in your fund and to compare these costs with those of other mutual funds. The examples are based on an investment of $1,000 made at the beginning of the period shown and held for the entire period.
The accompanying table illustrates your fund’s costs in two ways:
| • | Based on actual fund return. This section helps you to estimate the actual expenses that you paid over the period. The ”Ending Account Value“ shown is derived from the fund‘s actual return, and the third column shows the dollar amount that would have been paid by an investor who started with $1,000 in the fund. You may use the information here, together with the amount you invested, to estimate the expenses that you paid over the period. |
To do so, simply divide your account value by $1,000 (for example, an $8,600 account value divided by $1,000 = 8.6), then multiply the result by the number given for your fund under the heading ”Expenses Paid During Period.“
| • | Based on hypothetical 5% yearly return. This section is intended to help you compare your fund‘s costs with those of other mutual funds. It assumes that the fund had a yearly return of 5% before expenses, but that the expense ratio is unchanged. In this case—because the return used is not the fund’s actual return—the results do not apply to your investment. The example is useful in making comparisons because the Securities and Exchange Commission requires all mutual funds to calculate expenses based on a 5% return. You can assess your fund’s costs by comparing this hypothetical example with the hypothetical examples that appear in shareholder reports of other funds. |
Note that the expenses shown in the table are meant to highlight and help you compare ongoing costs only and do not reflect transaction costs incurred by the fund for buying and selling securities. Further, the expenses do not include any purchase, redemption, or account service fees described in the fund prospectus. If such fees were applied to your account, your costs would be higher. Your fund does not carry a “sales load.”
The calculations assume no shares were bought or sold during the period. Your actual costs may have been higher or lower, depending on the amount of your investment and the timing of any purchases or redemptions.
You can find more information about the fund’s expenses, including annual expense ratios, in the Consolidated Financial Statements section of this report. For additional information on operating expenses and other shareholder costs, please refer to your fund’s current prospectus.
| Six Months Ended October 31, 2021 | | | |
| Commodity Strategy Fund | Beginning
Account Value
4/30/2021 | Ending
Account Value
10/31/2021 | Expenses
Paid During
Period |
| Based on Actual Fund Return | $1,000.00 | $1,178.40 | $1.10 |
| Based on Hypothetical 5% Yearly Return | 1,000.00 | 1,024.20 | 1.02 |
The calculations are based on expenses incurred in the most recent six-month period. The fund’s annualized six-month expense ratio for that period is 0.20%. The dollar amounts shown as “Expenses Paid” are equal to the annualized expense ratio multiplied by the average account value over the period, multiplied by the number of days in the most recent six-month period, then divided by the number of days in the most recent 12-month period (184/365).
All of the returns in this report represent past performance, which is not a guarantee of future results that may be achieved by the fund. (Current performance may be lower or higher than the performance data cited. For performance data current to the most recent month-end, visit our website at vanguard.com/performance.) Note, too, that both investment returns and principal value can fluctuate widely, so an investor’s shares, when sold, could be worth more or less than their original cost. The returns shown do not reflect taxes that a shareholder would pay on fund distributions or on the sale of fund shares.
Cumulative Performance: June 25, 2019, Through October 31, 2021
Initial Investment of $50,000
| | | Average Annual Total Returns
Periods Ended October 31, 2021 | |
| | | One
Year | Since
Inception
(6/25/2019) | Final Value
of a $50,000
Investment |
 | Commodity Strategy Fund | 52.30% | 18.51% | $74,531 |
 | Bloomberg Commodity Index Total Return | 43.94 | 12.27 | 65,628 |
"Since Inception" performance is calculated from the fund’s inception date for both the fund and its comparative standard(s).
See Financial Highlights for dividend and capital gains information.
| U.S. Government Securities | 100.0% |
The table reflects the fund’s investments, except for short-term investments and derivatives. The agency and mortgage-backed securities may include issues from government-sponsored enterprises; such issues are generally not backed by the full faith and credit of the U.S. government.
Consolidated Financial Statements
Consolidated Schedule of Investments
The fund files its complete schedule of portfolio holdings with the Securities and Exchange Commission (SEC) for the first and third quarters of each fiscal year as an exhibit to its reports on Form N-PORT. The fund’s Form N-PORT reports are available on the SEC’s website at www.sec.gov.
| | | | Coupon | Maturity
Date | Face
Amount
($000) | Market
Value•
($000) |
| U.S. Government and Agency Obligations (67.9%) |
| U.S. Government Securities (67.9%) |
| | United States Treasury Inflation Indexed Bonds | 0.125% | 1/15/22 | 62,845 | 63,404 |
| | United States Treasury Inflation Indexed Bonds | 0.125% | 4/15/22 | 61,380 | 62,541 |
| | United States Treasury Inflation Indexed Bonds | 0.125% | 7/15/22 | 59,112 | 60,774 |
| | United States Treasury Inflation Indexed Bonds | 0.125% | 1/15/23 | 72,590 | 75,358 |
| | United States Treasury Inflation Indexed Bonds | 0.625% | 4/15/23 | 61,775 | 64,931 |
| | United States Treasury Inflation Indexed Bonds | 0.375% | 7/15/23 | 70,197 | 74,277 |
| | United States Treasury Inflation Indexed Bonds | 0.625% | 1/15/24 | 66,969 | 71,678 |
| | United States Treasury Inflation Indexed Bonds | 0.500% | 4/15/24 | 37,379 | 40,077 |
| | United States Treasury Inflation Indexed Bonds | 0.125% | 7/15/24 | 61,476 | 65,914 |
| | United States Treasury Inflation Indexed Bonds | 0.125% | 10/15/24 | 53,576 | 57,569 |
| | United States Treasury Inflation Indexed Bonds | 0.250% | 1/15/25 | 58,004 | 62,581 |
| | United States Treasury Inflation Indexed Bonds | 2.375% | 1/15/25 | 39,209 | 45,108 |
| | United States Treasury Inflation Indexed Bonds | 0.125% | 4/15/25 | 44,184 | 47,609 |
| | United States Treasury Inflation Indexed Bonds | 0.375% | 7/15/25 | 61,398 | 67,260 |
| | United States Treasury Inflation Indexed Bonds | 0.125% | 10/15/25 | 53,428 | 58,061 |
| | United States Treasury Inflation Indexed Bonds | 0.625% | 1/15/26 | 52,220 | 57,850 |
| | United States Treasury Inflation Indexed Bonds | 2.000% | 1/15/26 | 27,534 | 32,189 |
| | United States Treasury Inflation Indexed Bonds | 0.125% | 4/15/26 | 45,029 | 49,040 |
| | United States Treasury Inflation Indexed Bonds | 0.125% | 7/15/26 | 51,120 | 56,033 |
| | United States Treasury Inflation Indexed Bonds | 0.125% | 10/15/26 | 30,129 | 33,024 |
| Total U.S. Government and Agency Obligations (Cost $1,130,304) | 1,145,278 |
| | | | | | Shares | |
| Temporary Cash Investments (33.2%) |
| Money Market Fund (12.4%) |
| 1 | Vanguard Market Liquidity Fund | 0.070% | | 2,090,636 | 209,064 |
| | | | | Maturity
Date | Face
Amount
($000) | |
| U.S. Government and Agency Obligations (20.8%) |
| 2 | United States Cash Management Bill | 0.045% | 1/25/22 | 21,000 | 20,997 |
| 2,3 | United States Treasury Bill | 0.044% | 11/12/21 | 25,000 | 25,000 |
| 2 | United States Treasury Bill | 0.005% | 11/16/21 | 50,000 | 49,999 |
| 2 | United States Treasury Bill | 0.010% | 11/18/21 | 30,000 | 29,999 |
| | | | Coupon | Maturity
Date | Face
Amount
($000) | Market
Value•
($000) |
| 2 | United States Treasury Bill | 0.020% | 11/23/21 | 30,000 | 29,999 |
| 2,3 | United States Treasury Bill | 0.020% | 11/26/21 | 50,000 | 49,998 |
| 2 | United States Treasury Bill | 0.054% | 11/30/21 | 25,000 | 24,999 |
| 2,3 | United States Treasury Bill | 0.019%–0.044% | 12/2/21 | 46,000 | 45,998 |
| 2 | United States Treasury Bill | 0.043% | 1/20/22 | 30,000 | 29,996 |
| 2 | United States Treasury Bill | 0.041% | 1/27/22 | 30,000 | 29,996 |
| 2 | United States Treasury Bill | 0.047% | 2/3/22 | 12,900 | 12,898 |
| | | | | | | 349,879 |
| Total Temporary Cash Investments (Cost $558,940) | 558,943 |
| Total Investments (101.1%) (Cost $1,689,244) | 1,704,221 |
| Other Assets and Liabilities—Net (-1.1%) | (18,695) |
| Net Assets (100%) | 1,685,526 |
| Cost is in $000. | | | |
| • | See Note A in Notes to Consolidated Financial Statements. |
| 1 | Affiliated money market fund available only to Vanguard funds and certain trusts and accounts managed by Vanguard. Rate shown is the 7-day yield. |
| 2 | Security is owned by the Vanguard CSF Portfolio, which is a wholly owned subsidiary of the Commodity Strategy Fund. |
| 3 | Securities with a value of $11,765,000 have been segregated as collateral for open over-the-counter swap contracts. |
Derivative Financial Instruments Outstanding as of Period End
| Over-the-Counter Total Return Swaps |
| Reference Entity | Termination
Date | Counterparty | Notional
Amount
($000) | Floating
Interest Rate
Received
(Paid)1
(%) | Value and
Unrealized
Appreciation
($000) | Value and
Unrealized
(Depreciation)
($000) |
| Bloomberg Commodity Index2 | 11/12/21 | MLI | 230,000 | (0.060) | 1,374 | (164) |
| Bloomberg Commodity Index2 | 11/22/21 | BARC | 55,000 | (0.100) | — | (1,291) |
| Bloomberg Commodity Index 2 Month Forward2 | 11/22/21 | BARC | 160,000 | (0.110) | — | (3,707) |
| Bloomberg Commodity Index 3 Month Forward2 | 11/22/21 | GSI | 15,000 | (0.120) | — | (350) |
| BofA Merrill Lynch Commodity MLBXSTGV Excess Return Strategy2,3 | 11/12/21 | MLI | 295,000 | (0.110) | 934 | (745) |
| BofA Merrill Lynch Commodity MLCILP3E Excess Return Strategy2,3 | 11/12/21 | MLI | 15,000 | (0.140) | 59 | — |
| BofA Merrill Lynch MLBXAKSV Excess Return Index2,3 | 11/12/21 | MLI | 120,000 | (0.170) | 1,300 | — |
| Credit Suisse Custom 34 - 01E Forward Excess Return2,3 | 11/22/21 | CSFBI | 395,000 | (0.160) | — | (8,390) |
| Over-the-Counter Total Return Swaps (continued) |
| Reference Entity | Termination
Date | Counterparty | Notional
Amount
($000) | Floating
Interest Rate
Received
(Paid)1
(%) | Value and
Unrealized
Appreciation
($000) | Value and
Unrealized
(Depreciation)
($000) |
| Goldman Sachs Commodity i-Select Strategy 11292,3 | 11/22/21 | GSI | 395,000 | (0.120) | — | (8,082) |
| Modified Strategy DBS18 on the Bloomberg Commodity Index2,3 | 11/22/21 | GSI | 45,000 | (0.120) | — | (755) |
| | | | | | 3,667 | (23,484) |
| 1 | Based on 1M USD London Interbank Offered Rate (LIBOR) as of the most recent payment date. Floating interest payment received/paid monthly. |
| 2 | Security is owned by the subsidiary. |
| 3 | Information on the components of the reference entity is available on www.vanguard.com |
| | 1M—1-month. |
| | BARC—Barclays Bank plc. |
| | CSFBI—Credit Suisse. |
| | GSI—Goldman Sachs International. |
| | MLI—Merrill Lynch International. |
At October 31, 2021, the counterparties had deposited in segregated accounts cash of $7,670,000 in connection with open over-the-counter swap contracts.
See accompanying Notes, which are an integral part of the Financial Statements.
Consolidated Statement of Assets and Liabilities
|
| ($000s, except shares and per-share amounts) | Amount |
| Assets | |
| Investments in Securities, at Value | |
| Unaffiliated Issuers (Cost $1,480,190) | 1,495,157 |
| Affiliated Issuers (Cost $209,054) | 209,064 |
| Total Investments in Securities | 1,704,221 |
| Investment in Vanguard | 53 |
| Cash Collateral Pledged—Over-the-Counter Swap Contracts | 3,110 |
| Receivables for Investment Securities Sold | 32,806 |
| Receivables for Accrued Income | 1,018 |
| Receivables for Capital Shares Issued | 3,100 |
| Unrealized Appreciation—Over-the-Counter Swap Contracts | 3,667 |
| Total Assets | 1,747,975 |
| Liabilities | |
| Due to Custodian | 2,929 |
| Payables for Investment Securities Purchased | 33,066 |
| Payables for Capital Shares Redeemed | 2,803 |
| Payables to Vanguard | 167 |
| Unrealized Depreciation—Over-the-Counter Swap Contracts | 23,484 |
| Total Liabilities | 62,449 |
| Net Assets | 1,685,526 |
| At October 31, 2021, net assets consisted of: | |
| | |
| Paid-in Capital | 1,289,116 |
| Total Distributable Earnings (Loss) | 396,410 |
| Net Assets | 1,685,526 |
| |
| Net Assets | |
Applicable to 45,744,402 outstanding $.001 par value shares of
beneficial interest (unlimited authorization) | 1,685,526 |
| Net Asset Value Per Share | $36.85 |
See accompanying Notes, which are an integral part of the Financial Statements.
Consolidated Statement of Operations
|
| | Year Ended
October 31, 2021 |
| | ($000) |
| Investment Income | |
| Income | |
| Interest1 | 31,046 |
| Total Income | 31,046 |
| Expenses | |
| The Vanguard Group—Note B | |
| Investment Advisory Services | 188 |
| Management and Administrative | 1,822 |
| Marketing and Distribution | 35 |
| Custodian Fees | 10 |
| Auditing Fees | 47 |
| Shareholders’ Reports | 9 |
| Trustees’ Fees and Expenses—Note B | 9 |
| Total Expenses | 2,120 |
| Net Investment Income | 28,926 |
| Realized Net Gain (Loss) | |
| Investment Securities Sold1 | (191) |
| Swap Contracts | 364,416 |
| Realized Net Gain (Loss) | 364,225 |
| Change in Unrealized Appreciation (Depreciation) | |
| Investment Securities1 | 10,197 |
| Swap Contracts | (10,869) |
| Change in Unrealized Appreciation (Depreciation) | (672) |
| Net Increase (Decrease) in Net Assets Resulting from Operations | 392,479 |
| 1 | Interest income, realized net gain (loss), and change in unrealized appreciation (depreciation) from an affiliated company of the fund were $87,000, less than $1,000, and less than $1,000, respectively. Purchases and sales are for temporary cash investment purposes. |
See accompanying Notes, which are an integral part of the Financial Statements.
Consolidated Statement of Changes in Net Assets
|
| | Year Ended October 31, |
| | 2021
($000) | 2020
($000) |
| | | |
| Increase (Decrease) in Net Assets | | |
| Operations | | |
| Net Investment Income | 28,926 | 3,256 |
| Realized Net Gain (Loss) | 364,225 | 2,360 |
| Change in Unrealized Appreciation (Depreciation) | (672) | (3,292) |
| Net Increase (Decrease) in Net Assets Resulting from Operations | 392,479 | 2,324 |
| Distributions | | |
| Total Distributions | (2,526) | (1,458) |
| Capital Share Transactions | | |
| Issued | 1,233,852 | 310,858 |
| Issued in Lieu of Cash Distributions | 2,099 | 1,346 |
| Redeemed | (313,092) | (147,645) |
| Net Increase (Decrease) from Capital Share Transactions | 922,859 | 164,559 |
| Total Increase (Decrease) | 1,312,812 | 165,425 |
| Net Assets | | |
| Beginning of Period | 372,714 | 207,289 |
| End of Period | 1,685,526 | 372,714 |
See accompanying Notes, which are an integral part of the Financial Statements.
Consolidated Financial Highlights
For a Share Outstanding
Throughout Each Period | Year Ended October 31, | June 25,
20191 to
October 31,
2019 |
| 2021 | 2020 | |
| Net Asset Value, Beginning of Period | $24.32 | $24.83 | $25.00 |
| Investment Operations | | | |
| Net Investment Income2 | .890 | .265 | .143 |
| Net Realized and Unrealized Gain (Loss) on Investments | 11.774 | (.620) | (.313) |
| Total from Investment Operations | 12.664 | (.355) | (.170) |
| Distributions | | | |
| Dividends from Net Investment Income | (.134) | (.155) | — |
| Distributions from Realized Capital Gains | — | — | — |
| Total Distributions | (.134) | (.155) | — |
| Net Asset Value, End of Period | $36.85 | $24.32 | $24.83 |
| Total Return3 | 52.30% | -1.45% | -0.68% |
| Ratios/Supplemental Data | | | |
| Net Assets, End of Period (Millions) | $1,686 | $373 | $207 |
| Ratio of Total Expenses to Average Net Assets | 0.20% | 0.20% | 0.20%4 |
| Ratio of Net Investment Income to Average Net Assets | 2.79% | 1.15% | 1.65%4 |
| Portfolio Turnover Rate | 15% | 38% | 7% |
| 1 | Inception. |
| 2 | Calculated based on average shares outstanding. |
| 3 | Total returns do not include account service fees that may have applied in the periods shown. Fund prospectuses provide information about any applicable account service fees. |
| 4 | Annualized. |
See accompanying Notes, which are an integral part of the Financial Statements.
Notes to Consolidated Financial Statements
Vanguard Commodity Strategy Fund is registered under the Investment Company Act of 1940 as an open-end investment company, or mutual fund. Market disruptions associated with the COVID-19 pandemic have had a global impact, and uncertainty exists as to the long-term implications. Such disruptions can adversely affect assets of the fund and thus fund performance.
The Consolidated Financial Statements include Vanguard CSF Portfolio (“the subsidiary”), which commenced operations on June 25, 2019. The subsidiary is wholly owned by the fund and is a unit trust established in the Cayman Islands under the Trusts Law (2011 Revision) of the Cayman Islands, which is organized to invest in certain commodity-linked investments on behalf of the fund, consistent with the fund’s investment objectives and policies. The commodity-linked investments and other investments held by the subsidiary are subject to the same risks that apply to similar investments if held directly by the fund. As of October 31, 2021, the fund held $330,226,000 in the subsidiary, representing 20% of the fund’s net assets. All inter-fund transactions and balances (including the fund’s investment in the subsidiary) have been eliminated, and the Consolidated Financial Statements include all investments and other accounts of the subsidiary as if held directly by the fund.
| A. | The following significant accounting policies conform to generally accepted accounting principles for U.S. investment companies. The fund consistently follows such policies in preparing its financial statements. |
1. Security Valuation: Securities are valued as of the close of trading on the New York Stock Exchange (generally 4 p.m., Eastern time) on the valuation date. Bonds and temporary cash investments are valued using the latest bid prices or using valuations based on a matrix system (which considers such factors as security prices, yields, maturities, and ratings), both as furnished by independent pricing services. Investments in Vanguard Market Liquidity Fund are valued at that fund's net asset value. Securities for which market quotations are not readily available, or whose values have been affected by events occurring before the fund’s pricing time but after the close of the securities’ primary markets, are valued by methods deemed by the board of trustees to represent fair value.
2. Swap Contracts: The fund gains exposure to commodities through the subsidiary's investment in swaps that earn the total return on a specified commodity index. Under the terms of the swaps, the subsidiary receives the total return on the specified index (receiving the increase or paying the decrease in the value of the specified index), applied to a notional amount. The subsidiary also pays a floating rate that is based on short-term interest rates, applied to the notional amount. At the same time, the subsidiary invests an amount approximating the notional amount of the swap in high-quality temporary cash investments.
A risk associated with all types of swaps is the possibility that a counterparty may default on its obligation to pay net amounts due to the subsidiary. The subsidiary’s maximum amount subject to counterparty risk is the unrealized appreciation on the swap contract. The subsidiary mitigates its counterparty risk by entering into swaps only with a diverse group of prequalified counterparties, monitoring their financial strength, entering into master netting arrangements with its counterparties, and requiring its counterparties to transfer collateral as security for their performance. In the absence of a default, the collateral pledged or received by the subsidiary cannot be repledged, resold, or rehypothecated. In the event of a counterparty’s default (including bankruptcy), the subsidiary may terminate any swap contracts with that counterparty, determine the net amount owed by either party in accordance with its master netting arrangements, and sell or retain any collateral held up to the net amount owed to the subsidiary under the master netting
arrangements. The swap contracts contain provisions whereby a counterparty may terminate open contracts if the subsidiary net assets decline below a certain level, triggering a payment by the subsidiary if the subsidiary is in a net liability position at the time of the termination. The payment amount would be reduced by any collateral the subsidiary has pledged. Any securities pledged as collateral for open contracts are noted in the Consolidated Schedule of Investments. The value of collateral received or pledged is compared daily to the value of the swap contracts exposure with each counterparty, and any difference, if in excess of a specified minimum transfer amount, is adjusted and settled within two business days.
The notional amounts of swap contracts are not recorded in the Consolidated Statement of Assets and Liabilities. Swaps are valued daily based on market quotations received from independent pricing services or recognized dealers and the change in value is recorded in the Consolidated Statement of Assets and Liabilities as an asset (liability) and in the Consolidated Statement of Operations as unrealized appreciation (depreciation) until periodic payments are made or the termination of the swap, at which time realized gain (loss) is recorded.
During the year ended October 31, 2021, the fund’s average amounts of investments in total return swaps represented 101% of net assets, based on the average of notional amounts at each quarter-end during the period.
The following table summarizes the fund’s derivative assets and liabilities by counterparty for derivatives subject to arrangements that provide for offsetting assets and liabilities.
| | Assets
Reflected in
Consolidated
Statement of
Assets and
Liabilities1
($000) | Liabilities
Reflected in
Consolidated
Statement of
Assets and
Liabilities1
($000) | Net Amount
Receivable
(Payable)
($000) | Amounts Not Offset in
the Consolidated
Statement of Assets
and Liabilities | Net
Exposure3
(Not Less
Than $0)
($000) |
| | Collateral
Pledged2
($000) | Collateral
Received2
($000) |
Derivatives Subject to
Offsetting Arrangements, by Counterparty | | | | | | |
| Barclays Bank plc | — | (4,998) | (4,998) | 3,110 | — | — |
| Credit Suisse | — | (8,390) | (8,390) | 5,775 | — | — |
| Goldman Sachs International | — | (9,187) | (9,187) | 5,990 | — | — |
| Merrill Lynch International | 3,667 | (909) | 2,758 | — | 7,670 | — |
| Total | 3,667 | (23,484) | (19,817) | 14,875 | 7,670 | — |
1 Absent an event of default or early termination, derivative assets and liabilities are presented gross and not offset in the Consolidated Statement of Assets and Liabilities.
2 Securities or other assets pledged as collateral are noted in the Consolidated Schedule of Investments and Consolidated Statement of Assets and Liabilities. Securities or other assets received as collateral are held in a segregated account and not included in the fund’s security holdings in the Consolidated Schedule of Investments.
3 Net Exposure represents the net amount receivable from the counterparty in the event of default. Counterparties are not required to exchange collateral if amount is below a specified minimum transfer amount.
3. Federal Income Taxes: The fund intends to continue to qualify as a regulated investment company and distribute all of its taxable income. The subsidiary is classified as a foreign corporation for U.S. tax purposes, and because it does not carry on a U.S. trade or business, is generally not subject to U.S. federal income tax. The subsidiary also complies with the Foreign Account Tax Compliance Act ("FATCA") and thus will not be subject to 30% withholding under
FATCA on any income from U.S. investments. In addition, the subsidiary is not subject to Cayman Islands income tax. The subsidiary is not required to distribute any earnings and profits to the fund. The fund’s tax returns are open to examination by the relevant tax authorities until expiration of the applicable statute of limitations, which is generally three years after filing the tax return. Management has analyzed the fund’s tax positions taken for all open federal and state income tax years, and has concluded that no provision for income tax is required in the fund’s financial statements.
4. Distributions: Distributions to shareholders are recorded on the ex-dividend date. Distributions are determined on a tax basis at the fiscal year-end and may differ from net investment income and realized capital gains for financial reporting purposes.
5. Credit Facilities and Interfund Lending Program: The fund and certain other funds managed by The Vanguard Group ("Vanguard") participate in a $4.3 billion committed credit facility provided by a syndicate of lenders pursuant to a credit agreement and an uncommitted credit facility provided by Vanguard. Both facilities may be renewed annually. Each fund is individually liable for its borrowings, if any, under the credit facilities. Borrowings may be utilized for temporary or emergency purposes, subject to the fund’s regulatory and contractual borrowing restrictions. With respect to the committed credit facility, the participating funds are charged administrative fees and an annual commitment fee of 0.10% of the undrawn committed amount of the facility; these fees are allocated to the funds based on a method approved by the fund’s board of trustees and included in Management and Administrative expenses on the fund’s Consolidated Statement of Operations. Any borrowings under either facility bear interest at a rate based upon the higher of the one-month London Interbank Offered Rate (or an acceptable alternate rate, if necessary), federal funds effective rate, or overnight bank funding rate plus an agreed-upon spread, except that borrowings under the uncommitted credit facility may bear interest based upon an alternate rate agreed to by the fund and Vanguard.
In accordance with an exemptive order (the “Order”) from the SEC, the fund may participate in a joint lending and borrowing program that allows registered open-end Vanguard funds to borrow money from and lend money to each other for temporary or emergency purposes (the “Interfund Lending Program”), subject to compliance with the terms and conditions of the Order, and to the extent permitted by the fund’s investment objective and investment policies. Interfund loans and borrowings normally extend overnight, but can have a maximum duration of seven days. Loans may be called on one business day’s notice. The interest rate to be charged is governed by the conditions of the Order and internal procedures adopted by the board of trustees. The board of trustees is responsible for overseeing the Interfund Lending Program.
For the year ended October 31, 2021, the fund did not utilize the credit facilities or the Interfund Lending Program.
6. Other: Interest income includes income distributions received from Vanguard Market Liquidity Fund and is accrued daily. Premiums and discounts on debt securities are amortized and accreted, respectively, to interest income over the lives of the respective securities, except for premiums on certain callable debt securities that are amortized to the earliest call date. Inflation adjustments to the face amount of inflation-indexed securities are included in interest income. Security transactions are accounted for on the date securities are bought or sold. Costs used to determine realized gains (losses) on the sale of investment securities are those of the specific securities sold.
| B. | In accordance with the terms of a Funds' Service Agreement (the “FSA”) between Vanguard and the fund, Vanguard furnishes to the fund investment advisory, corporate management, administrative, marketing, and distribution services at Vanguard’s cost of operations (as defined by the FSA). These costs of operations are allocated to the fund based on methods and guidelines approved by the board of trustees and are generally settled twice a month. |
Under a separate agreement, Vanguard provides corporate management and administrative services to the subsidiary for an annual fee of 0.10% of average net assets of the subsidiary, generally settled once a month. In addition, the subsidiary pays an unaffiliated third party, VGMF I (Cayman) Limited, an affiliate of Maples Trustee Services (Cayman) Limited, a fee plus reasonable additional expenses for trustee services. All of the subsidiary’s expenses are reflected in the Consolidated Statement of Operations and in the Ratio of Total Expenses to Average Net Assets in the Consolidated Financial Highlights.
Upon the request of Vanguard, the fund may invest up to 0.40% of its net assets as capital in Vanguard. At October 31, 2021, the fund had contributed to Vanguard capital in the amount of $53,000, representing less than 0.01% of the fund’s net assets and 0.02% of Vanguard’s capital received pursuant to the FSA. The fund’s trustees and officers are also directors and employees, respectively, of Vanguard.
| C. | Various inputs may be used to determine the value of the fund’s investments and derivatives. These inputs are summarized in three broad levels for financial statement purposes. The inputs or methodologies used to value securities are not necessarily an indication of the risk associated with investing in those securities. |
Level 1—Quoted prices in active markets for identical securities.
Level 2—Other significant observable inputs (including quoted prices for similar securities, interest rates, prepayment speeds, credit risk, etc.).
Level 3—Significant unobservable inputs (including the fund’s own assumptions used to determine the fair value of investments). Any investments and derivatives valued with significant unobservable inputs are noted on the Consolidated Schedule of Investments.
The following table summarizes the market value of the fund’s investments and derivatives as of October 31, 2021, based on the inputs used to value them:
| | Level 1
($000) | Level 2
($000) | Level 3
($000) | Total
($000) |
| Investments | | | | |
| Assets | | | | |
| U.S. Government and Agency Obligations | — | 1,145,278 | — | 1,145,278 |
| Temporary Cash Investments | 209,064 | 349,879 | — | 558,943 |
| Total | 209,064 | 1,495,157 | — | 1,704,221 |
| Derivative Financial Instruments | | | | |
| Assets | | | | |
| Swap Contracts | — | 3,667 | — | 3,667 |
| Liabilities | | | | |
| Swap Contracts | — | 23,484 | — | 23,484 |
| D. | Permanent differences between book-basis and tax-basis components of net assets are reclassified among capital accounts in the financial statements to reflect their tax character. These reclassifications have no effect on net assets or net asset value per share. As of period end, permanent differences primarily attributable to the accounting for operations of the subsidiary were reclassified between the individual components of total distributable earnings (loss). |
Temporary differences between book-basis and tax-basis components of total distributable earnings (loss) arise when certain items of income, gain, or loss are recognized in different periods for financial statement and tax purposes; these differences will reverse at some time in the future. The differences are primarily related to the deferral of losses from wash sales; and the treatment of deflation and amortization adjustments from certain fixed income securities. As of period end, the tax-basis components of total distributable earnings (loss) are detailed in the table as follows:
| | Amount
($000) |
| Undistributed Ordinary Income | 382,251 |
| Undistributed Long-Term Gains | — |
| Capital Loss Carryforwards | (560) |
| Qualified Late-Year Losses | — |
| Net Unrealized Gains (Losses) | 14,719 |
The tax character of distributions paid was as follows:
| | Year Ended October 31, |
| | 2021
Amount
($000) | 2020
Amount
($000) |
| Ordinary Income* | 2,526 | 1,458 |
| Long-Term Capital Gains | — | — |
| Total | 2,526 | 1,458 |
| * | Includes short-term capital gains, if any. |
As of October 31, 2021, gross unrealized appreciation and depreciation for investments and derivatives based on cost for U.S. federal income tax purposes were as follows:
| | Amount
($000) |
| Tax Cost | 1,689,502 |
| Gross Unrealized Appreciation | 15,681 |
| Gross Unrealized Depreciation | (962) |
| Net Unrealized Appreciation (Depreciation) | 14,719 |
| E. | During the year ended October 31, 2021, the fund purchased $887,871,000 of investment securities and sold $102,093,000 of investment securities, other than temporary cash investments. |
| F. | Capital shares issued and redeemed were: |
| | Year Ended October 31, |
| | 2021
Shares
(000) | 2020
Shares
(000) |
| | | |
| Issued | 40,091 | 13,549 |
| Issued in Lieu of Cash Distributions | 81 | 53 |
| Redeemed | (9,752) | (6,625) |
| Net Increase (Decrease) in Shares Outstanding | 30,420 | 6,977 |
| G. | Management has determined that no events or transactions occurred subsequent to October 31, 2021, that would require recognition or disclosure in these financial statements. |
Report of Independent Registered Public Accounting Firm
To the Board of Trustees of Vanguard Trustees' Equity Fund and Shareholders of Vanguard Commodity Strategy Fund
Opinion on the Financial Statements
We have audited the accompanying consolidated statement of assets and liabilities, including the consolidated schedule of investments, of Vanguard Commodity Strategy Fund and its subsidiary (one of the funds constituting Vanguard Trustees' Equity Fund, referred to hereafter as the "Fund") as of October 31, 2021, the related consolidated statement of operations for the year ended October 31, 2021, the consolidated statement of changes in net assets for each of the two years in the period ended October 31, 2021, including the related notes, and the consolidated financial highlights for each of the two years in the period ended October 31, 2021 and for the period June 25, 2019 (inception) through October 31, 2019 (collectively referred to as the "consolidated financial statements"). In our opinion, the consolidated financial statements present fairly, in all material respects, the financial position of the Fund as of October 31, 2021, the results of its operations for the year then ended, the changes in its net assets for each of the two years in the period ended October 31, 2021 and the financial highlights for each of the two years in the period ended October 31, 2021 and for the period June 25, 2019 (inception) through October 31, 2019 in conformity with accounting principles generally accepted in the United States of America.
Basis for Opinion
These consolidated financial statements are the responsibility of the Fund’s management. Our responsibility is to express an opinion on the Fund’s consolidated financial statements based on our audits. We are a public accounting firm registered with the Public Company Accounting Oversight Board (United States) (PCAOB) and are required to be independent with respect to the Fund in accordance with the U.S. federal securities laws and the applicable rules and regulations of the Securities and Exchange Commission and the PCAOB.
We conducted our audits of these consolidated financial statements in accordance with the standards of the PCAOB. Those standards require that we plan and perform the audit to obtain reasonable assurance about whether the consolidated financial statements are free of material misstatement, whether due to error or fraud.
Our audits included performing procedures to assess the risks of material misstatement of the consolidated financial statements, whether due to error or fraud, and performing procedures that respond to those risks. Such procedures included examining, on a test basis, evidence regarding the amounts and disclosures in the consolidated financial statements. Our audits also included evaluating the accounting principles used and significant estimates made by management, as well as evaluating the overall presentation of the consolidated financial statements. Our procedures included confirmation of securities owned as of October 31, 2021 by correspondence with the custodian, transfer agent and brokers; when replies were not received from brokers, we performed other auditing procedures. We believe that our audits provide a reasonable basis for our opinion.
/s/PricewaterhouseCoopers LLP
Philadelphia, Pennsylvania
December 17, 2021
We have served as the auditor of one or more investment companies in The Vanguard Group of Funds since 1975.
Special 2021 tax information (unaudited) for Vanguard Commodity Strategy Fund
This information for the fiscal year ended October 31, 2021, is included pursuant to provisions of the Internal Revenue Code.
The percentage of the ordinary dividends reported by the fund that is treated as a Section 163(j) interest dividend and thus is eligible to be treated as interest income for purposes of Section 163(j) and the regulations thereunder is 100%.
This page intentionally left blank.
The People Who Govern Your Fund
The trustees of your mutual fund are there to see that the fund is operated and managed in your best interests since, as a shareholder, you are a part owner of the fund. Your fund’s trustees also serve on the board of directors of The Vanguard Group, Inc., which is owned by the Vanguard funds and provides services to them.
A majority of Vanguard’s board members are independent, meaning that they have no affiliation with Vanguard or the funds they oversee, apart from the sizable personal investments they have made as private individuals. The independent board members have distinguished backgrounds in business, academia, and public service. Each of the trustees and executive officers oversees 214 Vanguard funds.
Information for each trustee and executive officer of the fund appears below. That information, as well as the Vanguard fund count, is as of the date on the cover of this fund report. The mailing address of the trustees and officers is P.O. Box 876, Valley Forge, PA 19482. More information about the trustees is in the Statement of Additional Information, which can be obtained, without charge, by contacting Vanguard at 800-662-7447, or online at vanguard.com.
Interested Trustee1
Mortimer J. Buckley
Born in 1969. Trustee since January 2018. Principal occupation(s) during the past five years and other experience: chairman of the board (2019–present) of Vanguard and of each of the investment companies served by Vanguard; chief executive officer (2018–present) of Vanguard; chief executive officer, president, and trustee (2018–present) of each of the investment companies served by Vanguard; president and director (2017–present) of Vanguard; and president (2018–present) of Vanguard Marketing Corporation. Chief investment officer (2013–2017), managing director (2002–2017), head of the Retail Investor Group (2006–2012), and chief information officer (2001–2006) of Vanguard. Chairman of the board (2011–2017) and trustee (2009–2017) of the Children’s Hospital of Philadelphia; and trustee (2018–present) and vice chair (2019–present) of The Shipley School.
Independent Trustees
Emerson U. Fullwood
Born in 1948. Trustee since January 2008. Principal occupation(s) during the past five years and other experience: executive chief staff and marketing officer for North America and corporate vice president (retired 2008) of Xerox Corporation (document management products and services). Former president of the Worldwide Channels Group, Latin
America, and Worldwide Customer Service and executive chief staff officer of Developing Markets of Xerox. Executive in residence and 2009–2010 Distinguished Minett Professor at the Rochester Institute of Technology. Director of SPX FLOW, Inc. (multi-industry manufacturing). Director of the University of Rochester Medical Center, the Monroe Community College Foundation, the United Way of Rochester, North Carolina A&T University, and Roberts Wesleyan College. Trustee of the University of Rochester.
Amy Gutmann
Born in 1949. Trustee since June 2006. Principal occupation(s) during the past five years and other experience: president (2004–present) of the University of Pennsylvania. Christopher H. Browne Distinguished Professor of Political Science, School of Arts and Sciences, and professor of communication, Annenberg School for Communication, with secondary faculty appointments in the Department of Philosophy, School of Arts and Sciences, and at the Graduate School of Education, University of Pennsylvania.
F. Joseph Loughrey
Born in 1949. Trustee since October 2009. Principal occupation(s) during the past five years and other experience: president and chief operating officer (retired 2009) and vice chairman of the board (2008–2009) of Cummins Inc. (industrial machinery). Chairman of the board of Hillenbrand, Inc. (specialized consumer services). Director of the V Foundation.
1 Mr. Buckley is considered an “interested person,” as defined in the Investment Company Act of 1940, because he is an officer of the Vanguard funds.
Member of the advisory council for the College of Arts and Letters and chair of the advisory board to the Kellogg Institute for International Studies, both at the University of Notre Dame. Chairman of the board of Saint Anselm College.
Mark Loughridge
Born in 1953. Trustee since March 2012. Principal occupation(s) during the past five years and other experience: senior vice president and chief financial officer (retired 2013) of IBM (information technology services). Fiduciary member of IBM’s Retirement Plan Committee (2004–2013), senior vice president and general manager (2002–2004) of IBM Global Financing, vice president and controller (1998–2002) of IBM, and a variety of other prior management roles at IBM. Member of the Council on Chicago Booth.
Scott C. Malpass
Born in 1962. Trustee since March 2012. Principal occupation(s) during the past five years and other experience: chief investment officer (retired June 2020) and vice president (retired June 2020) of the University of Notre Dame. Assistant professor (retired June 2020) of finance at the Mendoza College of Business, University of Notre Dame, and member of the Notre Dame 403(b) Investment Committee. Member of the board of Catholic Investment Services, Inc. (investment advisors) and the board of superintendence of the Institute for the Works of Religion.
Deanna Mulligan
Born in 1963. Trustee since January 2018. Principal occupation(s) during the past five years and other experience: board chair (2020), chief executive officer (2011–2020), and president (2010–2019) of The Guardian Life Insurance Company of America. Chief operating officer (2010–2011) and executive vice president (2008–2010) of Individual Life and Disability of the Guardian Life Insurance Company of America. Member of the board of the Economic Club of New York. Trustee of the Partnership for New York City (business leadership), Chief Executives for Corporate Purpose, NewYork-Presbyterian Hospital, and the Bruce Museum (arts and science). Member of the Advisory Council for the Stanford Graduate School of Business.
André F. Perold
Born in 1952. Trustee since December 2004. Principal occupation(s) during the past five years and other experience: George Gund Professor of Finance and Banking, Emeritus at the Harvard Business School (retired 2011). Chief investment officer and co-managing partner of HighVista Strategies (private investment firm). Member of the board
(2018–present) of RIT Capital Partners (investment firm). Member of the investment committee of Partners Health Care System.
Sarah Bloom Raskin
Born in 1961. Trustee since January 2018. Principal occupation(s) during the past five years and other experience: deputy secretary (2014–2017) of the United States Department of the Treasury. Governor (2010–2014) of the Federal Reserve Board. Commissioner (2007–2010) of financial regulation for the State of Maryland. Professor (2020–present), Distinguished Fellow of the Global Financial Markets Center (2020–present), and Rubenstein Fellow (2017–2020) at Duke University. Trustee (2017–present) of Amherst College and member of Amherst College Investment Committee (2019–present). Member of the Regenerative Crisis Response Committee (2020–present).
David A. Thomas
Born in 1956. Trustee since July 2021. Principal occupation(s) during the past five years and other experience: president of Morehouse College (2018–present). Professor of business administration, emeritus at Harvard University (2017–2018). Dean (2011–2016) and professor of management (2016–2017) at the Georgetown University McDonough School of Business. Director of DTE Energy Company (2013–present). Trustee of Common Fund (2019–present).
Peter F. Volanakis
Born in 1955. Trustee since July 2009. Principal occupation(s) during the past five years and other experience: president and chief operating officer (retired 2010) of Corning Incorporated (communications equipment) and director of Corning Incorporated (2000–2010) and Dow Corning (2001–2010). Director (2012) of SPX Corporation (multi-industry manufacturing). Overseer of the Amos Tuck School of Business Administration, Dartmouth College (2001–2013). Chairman of the board of trustees of Colby-Sawyer College. Member of the BMW Group Mobility Council.
Executive Officers
Christine M. Buchanan
Born in 1970. Principal occupation(s) during the past five years and other experience: principal of Vanguard. Chief financial officer (2021–present) and treasurer (2017–present) of each of the investment companies served by Vanguard. Partner (2005–2017) at KPMG (audit, tax, and advisory services).
David Cermak
Born in 1960. Principal occupation(s) during the past five years and other experience: principal of Vanguard. Finance director (2019–present) of each of the investment companies served by Vanguard. Managing director and head (2017–present) of Vanguard Investments Singapore. Managing director and head (2017–2019) of Vanguard Investments Hong Kong. Representative director and head (2014–2017) of Vanguard Investments Japan.
John Galloway
Born in 1973. Principal occupation(s) during the past five years and other experience: principal of Vanguard. Investment stewardship officer (September 2020–present) of each of the investment companies served by Vanguard. Head of Investor Advocacy (February 2020–present) and head of Marketing Strategy and Planning (2017–2020) at Vanguard. Deputy assistant to the President of the United States (2015).
Peter Mahoney
Born in 1974. Principal occupation(s) during the past five years and other experience: principal of Vanguard. Controller (2015–present) of each of the investment companies served by Vanguard. Head of International Fund Services (2008–2014) at Vanguard.
Anne E. Robinson
Born in 1970. Principal occupation(s) during the past five years and other experience: general counsel (2016–present) of Vanguard. Secretary (2016–present) of Vanguard and of each of the investment companies served by Vanguard. Managing director (2016–present) of Vanguard. Managing director and general counsel of Global Cards and Consumer Services (2014–2016) at Citigroup. Counsel (2003–2014) at American Express.
Michael Rollings
Born in 1963. Principal occupation(s) during the past five years and other experience: finance director (2017–present) and treasurer (2017) of each of the investment companies served by Vanguard. Managing director (2016–present) of Vanguard. Chief financial officer (2016–present) of Vanguard. Director (2016–present) of Vanguard Marketing Corporation. Executive vice president and chief financial officer (2006–2016) of MassMutual Financial Group.
John E. Schadl
Born in 1972. Principal occupation(s) during the past five years and other experience: principal of Vanguard. Chief compliance officer (2019–present) of Vanguard and of each of the investment companies served by Vanguard. Assistant vice president (2019–present) of Vanguard Marketing Corporation.
Vanguard Senior Management Team
| Matthew Benchener | Thomas M. Rampulla |
| Joseph Brennan | Karin A. Risi |
| Mortimer J. Buckley | Anne E. Robinson |
| Gregory Davis | Michael Rollings |
| John James | Nitin Tandon |
| John T. Marcante | Lauren Valente |
| Chris D. Mclsaac | |
Connect with Vanguard®>vanguard.com
Fund Information > 800-662-7447
Direct Investor Account Services > 800-662-2739
Institutional Investor Services > 800-523-1036
Text Telephone for People Who Are Deaf or Hard of Hearing > 800-749-7273
This material may be used in conjunction with the offering of shares of any Vanguard fund only if preceded or accompanied by the fund’s current prospectus.
All comparative mutual fund data are from Morningstar, Inc., unless otherwise noted.
You can obtain a free copy of Vanguard’s proxy voting guidelines by visiting vanguard.com/proxyreporting or by calling Vanguard at 800-662-2739. The guidelines are also available from the SEC’s website, www.sec.gov. In addition, you may obtain a free report on how your fund voted the proxies for securities it owned during the 12 months ended June 30. To get the report, visit either vanguard.com/proxyreporting or www.sec.gov.
You can review information about your fund on the SEC’s website, and you can receive copies of this information, for a fee, by sending a request via email addressed to publicinfo@sec.gov.
Source for Bloomberg indexes: Bloomberg Index Services Limited. Copyright 2021, Bloomberg. All rights reserved.
CFA® is a registered trademark owned by CFA Institute.
© 2021 The Vanguard Group, Inc.
All rights reserved.
Vanguard Marketing Corporation, Distributor.
Q5170 122021
Item 2: Code of Ethics.
The Registrant has adopted a code of ethics that applies to the Registrant’s principal executive officer, principal financial officer, principal accounting officer or controller or persons performing similar functions. The Code of Ethics was amended during the reporting period covered by this report to make certain technical, non-material changes.
Item 3: Audit Committee Financial Expert.
All members of the Audit Committee have been determined by the Registrant’s Board of Trustees to be Audit Committee Financial Experts and to be independent: F. Joseph Loughrey, Mark Loughridge, Sarah Bloom Raskin, and Peter F. Volanakis.
Item 4: Principal Accountant Fees and Services.
(a) Audit Fees.
Audit Fees of the Registrant.
Fiscal Year Ended October 31, 2021: $192,000
Fiscal Year Ended October 31, 2020: $191,000
Aggregate Audit Fees of Registered Investment Companies in the Vanguard Group.
Fiscal Year Ended October 31, 2021: $11,244,694
Fiscal Year Ended October 31, 2020: $10,761,407
Includes fees billed in connection with audits of the Registrant, other registered investment companies in the Vanguard complex, The Vanguard Group, Inc., and Vanguard Marketing Corporation.
(b) Audit-Related Fees.
Fiscal Year Ended October 31, 2021: $2,955,181
Fiscal Year Ended October 31, 2020: $2,915,863
Includes fees billed in connection with assurance and related services provided to the Registrant, other registered investment companies in the Vanguard complex, The Vanguard Group, Inc., and Vanguard Marketing Corporation.
(c) Tax Fees.
Fiscal Year Ended October 31, 2021: $2,047,574
Fiscal Year Ended October 31, 2020: $247,168
Includes fees billed in connection with tax compliance, planning, and advice services provided to the Registrant, other registered investment companies in the Vanguard complex, The Vanguard Group, Inc., and Vanguard Marketing Corporation.
(d) All Other Fees.
Fiscal Year Ended October 31, 2021: $280,000
Fiscal Year Ended October 31, 2020: $115,000
Includes fees billed for services related to tax reported information provided to the Registrant, other registered investment companies in the Vanguard complex, The Vanguard Group, Inc., and Vanguard Marketing Corporation.
(e) (1) Pre-Approval Policies. The policy of the Registrant’s Audit Committee is to consider, and, if appropriate, approve before the principal accountant is engaged for such services, all specific audit and non-audit services provided to: the Registrant, other registered investment companies in the Vanguard complex, The Vanguard Group, Inc., and entities controlled by The Vanguard Group, Inc. that provide ongoing services to the Registrant. In making a determination, the Audit Committee considers whether the services are consistent with maintaining the principal accountant’s independence.
In the event of a contingency situation in which the principal accountant is needed to provide services in between scheduled Audit Committee meetings, the Chairman of the Audit Committee would be called on to consider and, if appropriate, pre-approve audit or permitted non-audit services in an amount sufficient to complete services through the next Audit Committee meeting, and to determine if such services would be consistent with maintaining the accountant’s independence. At the next scheduled Audit Committee meeting, services and fees would be presented to the Audit Committee for formal consideration, and, if appropriate, approval by the entire Audit Committee. The Audit Committee would again consider whether such services and fees are consistent with maintaining the principal accountant’s independence.
The Registrant’s Audit Committee is informed at least annually of all audit and non-audit services provided by the principal accountant to the Vanguard complex, whether such services are provided to: the Registrant, other registered investment companies in the Vanguard complex, The Vanguard Group, Inc., or other entities controlled by The Vanguard Group, Inc. that provide ongoing services to the Registrant.
(2) No percentage of the principal accountant’s fees or services were approved pursuant to the waiver provision of paragraph (c)(7)(i)(C) of Rule 2-01 of Regulation S-X.
(f) For the most recent fiscal year, over 50% of the hours worked under the principal accountant’s engagement were not performed by persons other than full-time, permanent employees of the principal accountant.
(g) Aggregate Non-Audit Fees.
Fiscal Year Ended October 31, 2021: $2,327,574
Fiscal Year Ended October 31, 2020: $362,168
Includes fees billed for non-audit services provided to the Registrant, other registered investment companies in the Vanguard complex, The Vanguard Group, Inc., and Vanguard Marketing Corporation.
(h) For the most recent fiscal year, the Audit Committee has determined that the provision of all non-audit services was consistent with maintaining the principal accountant’s independence.
Item 5: Audit Committee of Listed Registrants.
The Registrant is a listed issuer as defined in rule 10A-3 under the Securities Exchange Act of 1934 (“Exchange Act”). The Registrant has a separately-designated standing audit committee established in accordance with Section 3(a)(58)(A) of the Exchange Act. The Registrant’s audit committee members are: F. Joseph Loughrey, Mark Loughridge, Sarah Bloom Raskin, and Peter F. Volanakis.
Item 6: Investments.
Not applicable. The complete schedule of investments is included as part of the report to shareholders filed under Item 1 of this Form.
Item 7: Disclosure of Proxy Voting Policies and Procedures for Closed-End Management Investment Companies.
Not applicable.
Item 8: Portfolio Managers of Closed-End Management Investment Companies.
Not applicable.
Item 9: Purchase of Equity Securities by Closed-End Management Investment Company and Affiliated Purchasers.
Not applicable.
Item 10: Submission of Matters to a Vote of Security Holders.
Not applicable.
Item 11: Controls and Procedures.
(a) Disclosure Controls and Procedures. The Principal Executive and Financial Officers concluded that the Registrant’s Disclosure Controls and Procedures are effective based on their evaluation of the Disclosure Controls and Procedures as of a date within 90 days of the filing date of this report.
(b) Internal Control Over Financial Reporting. There were no significant changes in the Registrant’s Internal Control Over Financial Reporting or in other factors that could significantly affect this control subsequent to the date of the evaluation, including any corrective actions with regard to significant deficiencies and material weaknesses.
Item 12: Disclosure of Securities Lending Activities for Closed-End Management Investment Companies.
Not applicable.
Item 13: Exhibits.
Pursuant to the requirements of the Securities Exchange Act of 1934 and the Investment Company Act of 1940, the registrant has duly caused this report to be signed on its behalf by the undersigned, thereunto duly authorized.
| | VANGUARD TRUSTEES’ EQUITY FUND |
| | | |
| BY: | /s/ MORTIMER J. BUCKLEY* | |
| | MORTIMER J. BUCKLEY | |
| | CHIEF EXECUTIVE OFFICER | |
Date: December 20, 2021
Pursuant to the requirements of the Securities Exchange Act of 1934 and the Investment Company Act of 1940, this report has been signed below by the following persons on behalf of the registrant and in the capacities and on the dates indicated.
| | VANGUARD TRUSTEES’ EQUITY FUND |
| | | |
| BY: | /s/ MORTIMER J. BUCKLEY* | |
| | MORTIMER J. BUCKLEY | |
| | CHIEF EXECUTIVE OFFICER | |
Date: December 20, 2021
| | VANGUARD TRUSTEES’ EQUITY FUND |
| | | |
| BY: | /s/ CHRISTINE BUCHANAN* | |
| | CHRISTINE BUCHANAN | |
| | CHIEF FINANCIAL OFFICER | |
Date: December 20, 2021
* By: /s/ Anne E. Robinson
Anne E. Robinson, pursuant to a Power of Attorney filed on November 29, 2021 (see File Number 33-64845), a Power of Attorney filed on October 12, 2021 (see File Number 33-23444), and a Power of Attorney filed on August 26, 2021 (see file Number 811-02652), Incorporated by Reference.