Exhibit 99.1

Sprott Natural Resource Symposium July/August 2019 Gold / / Copper

Risk adverse? Forget about buying our shares. Past performance is unreliable in predicting the future. Unexpected events can happen and can change forecasts. Cautionary Statement MUX

GOLD Outlook for the Price of Gold and Silver
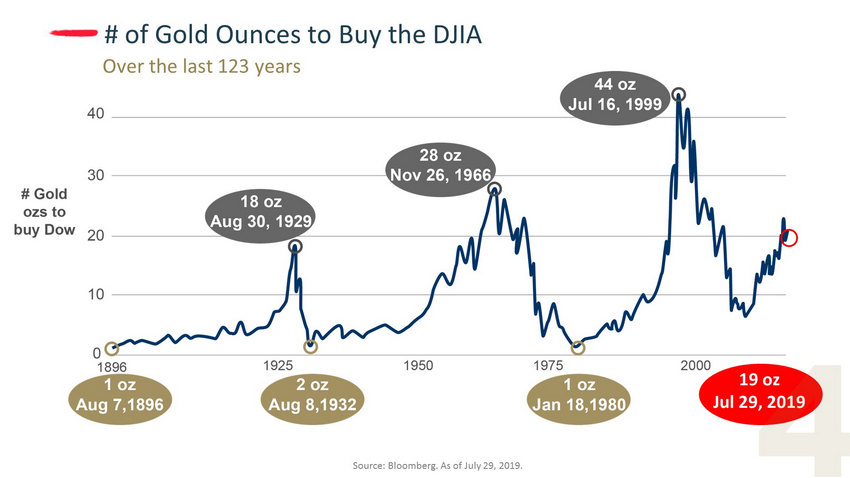
Source: Bloomberg. As of July 29, 2019. 19 oz Jul 29, 2019 # of Gold Ounces to Buy the DJIA Over the last 123 years

$0 $500 $1,000 $1,500 $2,000 1970 1975 1980 1985 1990 1995 2000 2005 2010 2015 2020 Source: Bloomberg. As of July 29, 2019 Gold US$ Gold Price 1970 - Present $40 +$800 $1,900 $250 $1,426 $1,050 20x 7.5x

0% 25% 50% 75% 100% 1 52 103 154 205 Mar 1939 - Apr 1942 Mar 1968 - Dec 1969 Aug 1974 - Aug 1976 Oct 1980 - Jun 1982 Jan 1983 - Nov 1986 Jan 1996 - Oct 2000 Feb 2008 - Nov 2008 Apr 08, 2011 - Jan 22, 2016 1 Credit: in gold we trust .report. Incrementum. June 1, 2017 by Ronald - Peter Stoeferle, Mark J. Valek Source: Nowandfutures, TheDailyGold.com, Barrons, Incrementum AG Duration in Weeks Longest and Deepest Bear Apr 2011 - Jan 2016 MUX 0 25% 50% 75% 100% 104 156 208 0 260 Bear Markets in Gold Equities 1 History is Talking - We Survived the Worst Bear in 77 years % Decline

100% 200% 300% 400% 500% 600% 700% 800% 1 52 103 154 205 256 307 358 Oct 1942 - Feb 1946 Jul 1960 - Mar 1968 Dec 1971 - Aug 1974 Aug 1976 - Oct 1980 Nov 2000 - Mar 2008 Oct 2008 - Apr 2011 Jan 2016 - Feb 2019 1 BGMI - Barron's Gold Mining Index. Credit: in gold we trust .report. Incrementum . June 1, 2017 by Ronald - Peter Stoeferle , Mark J. Valek Source: Nowandfutures , TheDailyGold.com , Barrons , Incrementum AG. Updated as of July 26 , 2019. 2 Last six gold bull markets. Duration in Weeks We are here! Up 117 % Avg Return 2 440% Jan 2016 - July 2019 MUX 100% 200% 300% 400% 500% 600% 700% 0 104 156 208 260 312 364 0 Gold Equities in Bull Markets Powerful & Profitable – Upside >4X % Gain

Source: Tom Fitzpatrick, Citibank/KWN, Bloomberg. As of July 29, 2019. S&P 500 MUX 0.15 0.3 0.6 1.2 2.4 0 500 1000 1500 2000 2500 3000 1998 2000 2002 2004 2006 2008 2010 2012 2014 2016 2018 2020 S&P 500 Gold / S&P 500 Ratio Gold / S&P 500 Ratio (log scale) Ratio hit a low 8 months before the peak on the S&P 500 Ratio hit a low 8 months before the peak on the S&P 500 Ratio hit a low 9 months ago ? Gold / S&P 500 Ratio vs S&P 500 The ratio turns before the stock market peaks

-20 -10 0 10 20 30 40 50 60 2016 2017 2018 2019 Source: Bloomberg. As of July 29, 2019. MUX Pound RMB AUD USD Euro CAD Yen Ruble Gold Moving Higher in Many Currencies % Change Jan 2016 – Present (Monthly)

Source: Bloomberg. marijuanaindex.com . North American Marijuana Index. From Jan 1, 2016 – Ju l 29 , 2019. GDX J + 105 % GDX + 102 % MUX Performance Since Jan 2016 Start of the New Gold Bull Market Gold + 35% Dow + 56 % S&P 500 + 48 %

Shared Commitment / Growing Production / Discovery Potential Gold / / Copper

McEwen Leadership Program McEwen School of Architecture MUX Mining Is Funding a Better Society

Pros Diversified Exploration Potential Ownership Good Trading Liquidity High Beta Cons Above Average Cost Short Life Mines High Beta What You Should Know About MUX

0 2 4 6 8 10 2000 2002 2004 2006 2008 2010 2012 2014 2016 2018 2020 $1.85 26x 22x $0.65 Rob McEwen Becomes CEO $ Source: Bloomberg. As Ju l 29 , 2019. Monthly chart. 1 Three year average. Share Price US$ High Beta 1 To Gold 3. 0 x MUX 7x Performs Well in Rising Gold Markets

Source: John Newell, Fieldhouse Capital Inc . As Ju l 25 , 2019. MUX Performs Well in Rising Gold Markets MUX $1.85 MA (50) 1.76 MA (200) 2.29 MA (10) 1.64 2145% 663% BIG WAVE $15.20 623% 2007 2009 2011 2013 2015 2017 2019 80 M 40 M 0 M $5.0 $10.0 0 1 $7.5 $2.5 0 90 RSI (14) 58.16 10 50 MACD (12,26,9) 0.011, - 0.049 , 0.061 MUX stays in Bull Market, as the shares stay well above 2016 lows Volume 14,266,489 $1.85 3 rd Target $6.95 2 nd Target $4.50 1 st Target $3.20 $9.15 $0.42
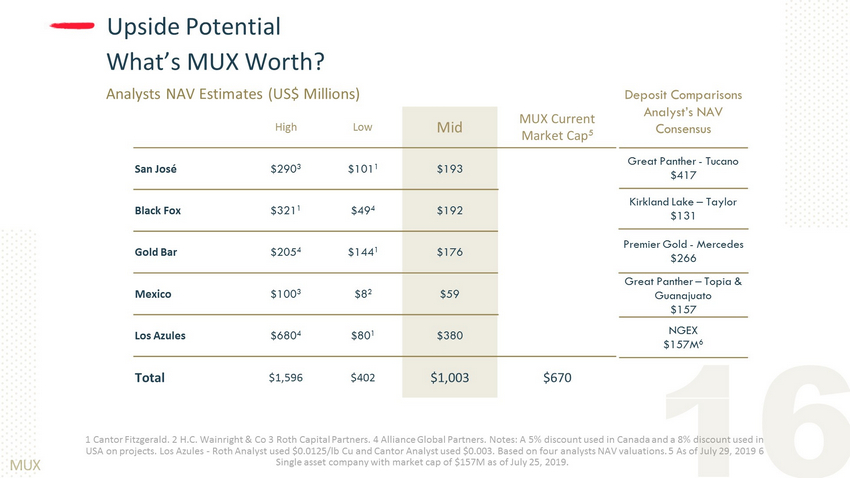
What’s MUX Worth? High Low Mid MUX Current Market Cap 5 San José $290 3 $101 1 $1 93 Black Fox $32 1 1 $ 49 4 $1 92 Gold Bar $20 5 4 $144 1 $1 76 Mexico $100 3 $ 8 2 $5 9 Los Azules $680 4 $80 1 $ 380 Total $1,59 6 $40 2 $ 1,003 $ 670 1 Cantor Fitzgerald. 2 H.C. Wainright & Co 3 Roth Capital Partners. 4 Alliance Global Partners. Notes: A 5% discount used in Canada and a 8% discount used in USA on projects. Los Azules - Roth Analyst used $0.0125/ lb Cu and Cantor Analyst used $0.003. Based on four analysts NAV valuations. 5 As of Ju ly 29 , 2019 6 Single asset company with market cap of $157M as of July 25, 2019. Analysts NAV Estimates (US$ Millions) MUX Upside Potential Deposit Comparisons Analyst’s NAV Consensus Great Panther - Tucano $417 Kirkland Lake – Taylor $131 Premier Gold - Mercedes $266 Great Panther – Topia & Guanajuato $157 NGEX $157M 6

$164M 22% 1 Rob McEwen’s: $139 M shares investment + $25 M loan investment, Aug 13, 2018 & March 29, 2019 press release. Share ownership percentage. Annual Salary. SEC filings. 2 CAGR - Compound annual growth rate 3 As of July 29, 2019. $1/ yr MUX With a Track Record 0 1000 2000 3000 1995 2000 2005 Goldcorp IBM Berkshire Hathaway Microsoft S&P 500 Dow % Change Goldcorp vs Market 13 Yr CAGR 2 31% Rob McEwen 22% Institutional 29% Retail 49% Stock Ownership 3 Investment Ownership Salary Insider Alignment 1
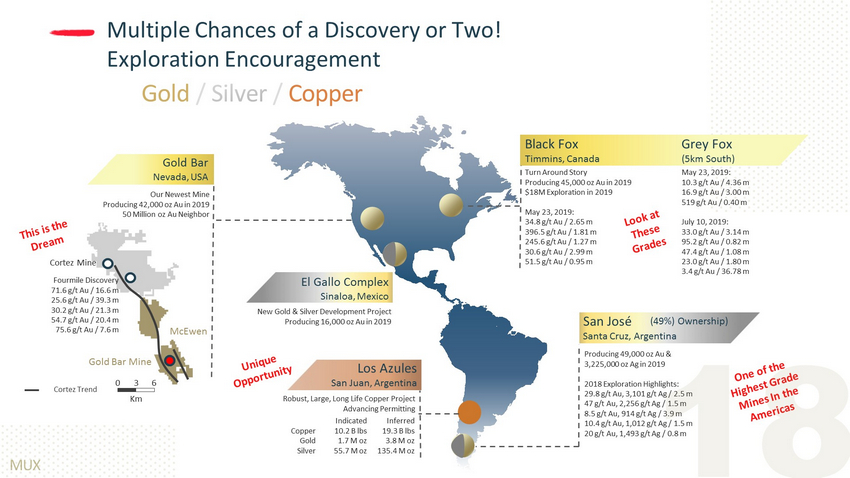
MUX Gold / / Copper Multiple Chances of a Discovery or Two! Exploration Encouragement Turn Around Story Producing 45,000 oz Au in 2019 $18M Exploration in 2019 May 23, 2019: 34.8 g/t Au / 2.65 m 396.5 g/t Au / 1.81 m 245.6 g/t Au / 1.27 m 30.6 g/t Au / 2.99 m 51.5 g/t Au / 0.95 m Black Fox Timmins, Canada Grey Fox (5km South) May 23, 2019: 10.3 g/t Au / 4.36 m 16.9 g/t Au / 3.00 m 519 g/t Au / 0.40 m July 10, 2019: 33.0 g/t Au / 3.14 m 95.2 g/t Au / 0.82 m 47.4 g/t Au / 1.08 m 23.0 g/t Au / 1.80 m 3.4 g/t Au / 36.78 m San José Santa Cruz, Argentina (49%) Ownership) Producing 49,000 oz Au & 3,225,000 oz Ag in 2019 2018 Exploration Highlights: 29.8 g/t Au, 3,101 g/t Ag / 2.5 m 47 g/t Au, 2,256 g/t Ag / 1.5 m 8.5 g/t Au, 914 g/t Ag / 3.9 m 10.4 g/t Au, 1,012 g/t Ag / 1.5 m 20 g/t Au, 1,493 g/t Ag / 0.8 m Los Azules San Juan, Argentina Robust, Large, Long Life Copper Project Advancing Permitting Indicated 10.2 B lbs 1.7 M oz 55.7 M oz Inferred 19.3 B lbs 3.8 M oz 135.4 M oz Copper Gold Silver El Gallo Complex Sinaloa, Mexico New Gold & Silver Development Project Producing 16,000 oz Au in 2019 Our Newest Mine Producing 42,000 oz Au in 2019 50 Million oz Au Neighbor Fourmile Discovery 71.6 g/t Au / 16.6 m 25.6 g/t Au / 39.3 m 30.2 g/t Au / 21.3 m 54.7 g/t Au / 20.4 m 75.6 g/t Au / 7.6 m 0 3 6 Km Gold Bar Nevada, USA Cortez Mine McEwen Gold Bar Mine Cortez Trend

2016 2017 2018 2019E MUX Costs/oz Cash cost and AISC in gold equivalent ounces. 2016 – 2018 g old / silver ratio 75:1 . 2019 gold / silver ratio 85:1. 2019 based on internal estimates. AISC Industry average World Gold Council. MUX Production and Costs 190,000 oz Production In Gold Eq. oz $- $200 $400 $600 $800 $1,000 $1,200 2017 2018 2019E Cash Cost AISC $877 $1,034 AISC Industry Average San José El Gallo Black Fox Complex Gold Bar 176,000 oz 152,000 oz 146,000 oz
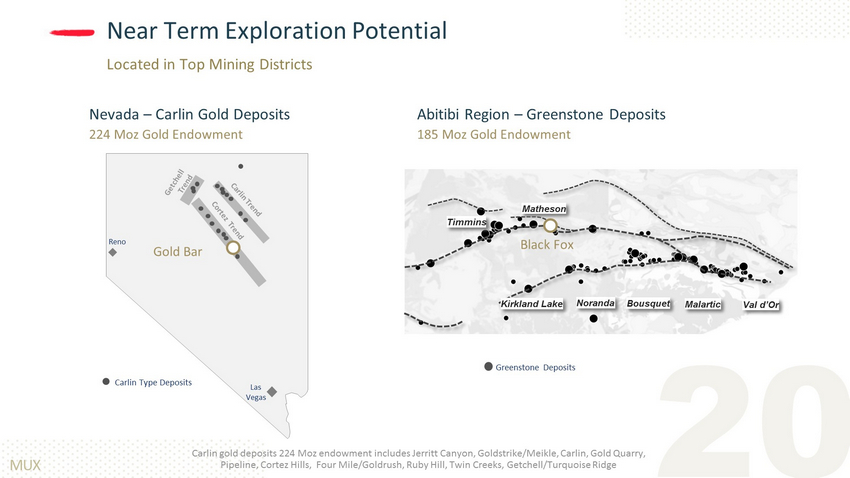
Timmins Matheson Kirkland Lake Noranda Val d’Or Malartic Bousquet MUX Carlin gold deposits 224 Moz endowment includes Jerritt Canyon, Goldstrike /Meikle, Carlin, Gold Quarry, Pipeline, Cortez Hills, Four Mile/Goldrush, Ruby Hill, Twin Creeks, Getchell/Turquoise Ridge Carlin Type Deposits Las Vegas Reno Nevada – Carlin Gold Deposits 224 Moz Gold Endowment Abitibi Region – Greenstone Deposits 185 Moz Gold Endowment Gold Bar Black Fox Greenstone Deposits Near Term Exploration Potential Located in Top Mining Districts

MUX Paid $35M for Acquisition in Oct 2017 $560M 1 Spent by Previous Owner – Significant Infrastructure in Place Underexplored Land Package Near - term Production Growth Opportunities Black Fox Ontario 1Primero’s 2014 purchase price of +$300 million plus ~$140 million in assumed liabilities plus capex & exploration of +$120M MUX Black Fox Mine Turnaround with Exploration Potential Black Fox Mill Access Road to Black Fox Underground Mine

25.5 g/t Au / 3.35m 83.9 g/t Au / 4.92m 187.8 g/t Au / 1.12m 161.9 g/t Au / 1.2m 34.8 g/t Au / 3m 6.68 g/t Au / 8m 27.3 g/t Au / 3.33m 27.8 g/t Au / 8.1m 44.1 g/t Au / 1.2m 12.7 g/t Au / 7m 25.0 g/t Au / 1.85m 8.40 g/t Au / 6.46m 19.1 g/t Au / 3m 30.6 g/t Au / 1.4m 24.0 g/t Au / 1m 48.0 g/t Au / 1.42m 44.4 g/t Au / 8.78m 141.2 g/t Au / 2.67m 43.5 g/t Au / 9m 47.9 g/t Au / 3.19m 14.8 g/t Au / 1.8m 9.8 g/t Au / 3m Black Fox - Highlights of Underground Drill Results Priority Targets 1 , 300 ft Depth Extension Level 1,050 m 396.5 g/t Au / 3m 32.6 g/t Au / 1.9m 16.5 g/t Au / 1m 12.6 g/t Au / 1.1m 23.3 g/t Au / 2.8m 23.4 g/t Au / 1m 17.1 g/t Au / 1m MUX High Grade and Targeting Opportunities Near Active Zones 245.5 g/t Au / 1.65m 48.4 g/t Au/ 0.6m 30.6 g/t Au / 8 m 37.2 g/t Au / 2m 12.9 g/t Au / 2.5m 38.7 g/t Au / 1m 51.5 g/t Au / 1m 6.61 g/t Au / 4m 55.1g/t Au/ 1.2m 400m Mine Workings

kt = kilo tonnes . Reserves and resources table, go to www.mcewenmining.com/Operations/Reserves - and - Resources/default.aspx Froome 1,104 kt. Black Fox 1,901kt. Grey Fox indicated 2,485 kt , inferred 678 kt. Tamarack 778kt. MUX Black Fox Mine Indicated: 472,000 oz @ 7.72 g/t Au Grey Fox Indicated : 567,000 oz @ 7.10g/ t Au Inferred : 135,000 oz @ 6.19g/ t Au Froome Deposit Indicated: 181,000 oz @ 5.09 g/t Au Tamarack Indicated Au: 46,000 oz @ 1.83 g/t Ag: 663,000 oz @ 26 g/t Pb: 8,000 t @ 1.08% Zn: 26,000 t @ 3.29% More Than Just One Mine 147 NE Exploration Highlights 33.0 g/t Au / 3.14 m 95.2 g/t Au / 0.82 m 47.4 g/t Au / 1.08 m 23.0 g/t Au / 1.80 m 3.4 g/t Au / 36.78 m

Stock East 150 koz Underexplored Along 2 Miles Trend and at Depth Stock Mine 137 koz historic production 4.82g/t Au / 16.3m Inc. 19.2g/t Au/ 2.9m - 500m - 1000m Stock East Infill & Extension 1,000 ft 5.58 g/t Au / 3.3m 7.01 g/t Au / 3.8m Incl. 30.1 g/t Au / 0.8m, 3.76 g/t Au / 4m Stock Mine Extension 3 km 2.83g/t Au / 20.8m Inc. 52.4g/t Au / 0.8m 5.76g/t Au / 12.3m Inc. 25.2g/t Au/ 2.65m 2.47g/t Au / 40m 5.99g/t Au / 13.26m Inc. 50.7g/t Au / 0.3m MUX Another Potential Source of Future Production Stock Property

Black Fox Stock Ore Bodies Headframe / Shaft MUX 30.1 g/t Au / 0.8 m @ 625 m 55.1 g/t Au / 1.2m @ 1,050 m Stock / Black Fox Kirkland Lake Timmins Red Lake 1,000m 2,000m Surface Black Fox - Is There More Gold at Depth? Other mines with similar geological settings go much deeper

MUX Gold Bar 2 M&I 0.82 Moz Au Inferred 0.20 Moz Au Cortez Barrick’s 50Moz Au cluster 1 Fourmile Discovery Goldrush Why we like it On Trend Similar Geology Widespread Mineralization Ex - Barrick Geologist Sees Similarities Gold Bar Nevada MUX Property Barrick Property Gold Bar 0 10 20 Km 1 Includes past and current production. 2 Gold Bar & Gold Bar South resource Feb 21, 2019 press release McEwen Mining Reports 2018 Full Year and Q4 Results. kt = kilo tonnes M&I 0.82 Moz : 27,555 kt @ 0.92 g/t, Inferred 0.20 Moz : 6,879 kt @ 0.91 g/t 0 5 10 Miles Surface & Depth Potential Near Surface Oxides Deep Sulphides? MUX Gold Bar – Next to Barrick Gold in Nevada 25 Miles South of Barrick’s Cluster of Large Carlin Style Discoveries

Gold Bar - Commercial Production Achieved in May AISC - All - in sustaining cost is calculated by dividing the Total Production Cost and the LOM sustaining capital cost by total o unces produced. 1 Mar 30, 2018 - “Form 43 - 101F1 Technical Report Feasibility Study Eureka County, Nevada”. 2 Gold Bar reserve estimate Feb 21, 2019 press release McEwen Mining Reports 2018 Full Year and Q4 Results. 60,000 oz Avg Annual Production 1 $770 / oz Cash Cost $843 / oz AISC Mine Life 2 7.4 Years Estimated Average Cost / Oz 1 Life of Mine MUX Just Started Production – Our 4 th Mine Process Plant Heap Leach Pad Open Pit
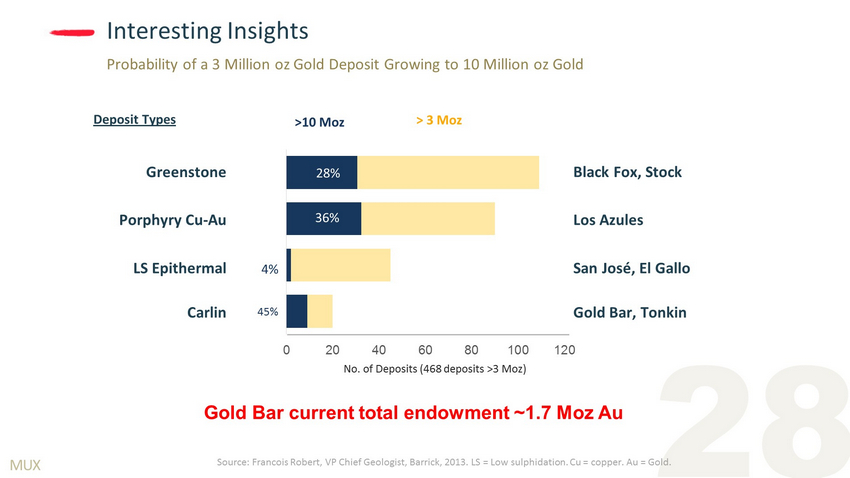
Gold Bar current total endowment ~1.7 Moz Au Source: Francois Robert, VP Chief Geologist, Barrick, 2013. LS = Low sulphidation . Cu = copper. Au = Gold. >10 Moz > 3 Moz 0 20 40 60 80 100 120 28% 36% 4% 45% No. of Deposits (468 deposits >3 Moz) MUX Greenstone Porphyry Cu - Au Carlin LS Epithermal Deposit Types Black Fox, Stock Los Azules Gold Bar, Tonkin San José, El Gallo Interesting Insights Probability of a 3 Million oz Gold Deposit Growing to 10 Million oz Gold
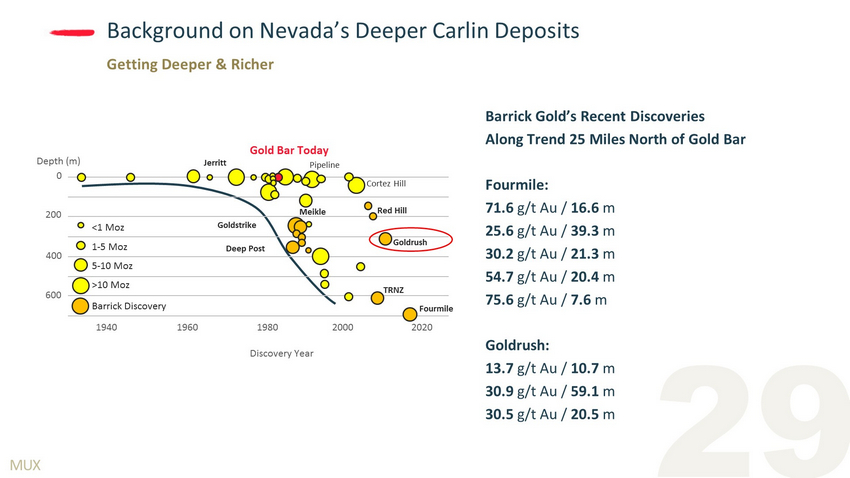
Barrick Gold’s Recent Discoveries Along Trend 25 Miles North of Gold Bar Fourmile: 71.6 g/t Au / 16.6 m 25.6 g/t Au / 39.3 m 30.2 g/t Au / 21.3 m 54.7 g/t Au / 20.4 m 75.6 g/t Au / 7.6 m Goldrush: 13.7 g/t Au / 10.7 m 30.9 g/t Au / 59.1 m 30.5 g/t Au / 20.5 m Depth (m) Fourmile Gold Bar Today Cortez Hill 1940 1960 1980 2000 2020 Pipeline TRNZ Goldrush Goldstrike Deep Post Meikle Red Hill Jerritt 600 400 200 0 Discovery Year <1 Moz 1 - 5 Moz 5 - 10 Moz >10 Moz Barrick Discovery MUX Background on Nevada’s Deeper Carlin Deposits Getting Deeper & Richer

Gold Bar 0 m 300 m 600 m 900 m 1 2 MUX 1. Near Surface Oxides 2. Deep Carlin Style Sulphides Goldstrike > 50 Million ozs Gold Cortez Hills > 15 Million ozs Gold Gold Bar Ore Bodies Potential Gold Bar 2019 Exploration Targeting 2 Types of Deposits:
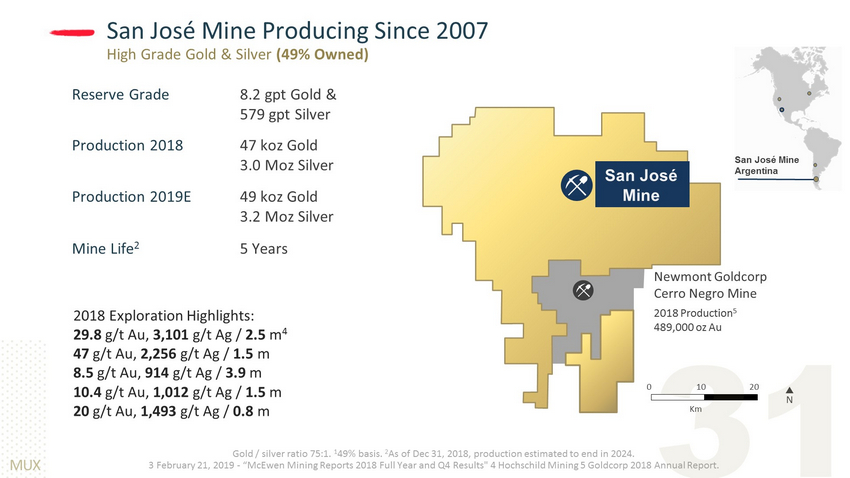
High Grade Gold & Silver (49% Owned) Gold / silver ratio 75:1. 1 49% basis. 2 As of Dec 31, 2018, production estimated to end in 2024. 3 February 21, 2019 - “McEwen Mining Reports 2018 Full Year and Q4 Results" 4 Hochschild Mining 5 Goldcorp 2018 Annual Report. San José Mine N 2018 Production 5 489 ,000 oz Au San José Mine Argentina 10 Km 0 20 2018 Exploration Highlights : 29.8 g/t Au, 3,101 g/t Ag / 2.5 m 4 47 g/t Au, 2,256 g/t Ag / 1.5 m 8.5 g/t Au, 914 g/t Ag / 3.9 m 10.4 g/t Au, 1,012 g/t Ag / 1.5 m 20 g/t Au, 1,493 g/t Ag / 0.8 m MUX Newmont Goldcorp Cerro Negro Mine Reserve Grade Production 2019E Mine Life 2 8.2 gpt Gold & 579 gpt Silver 49 koz Gold 3.2 Moz Silver 5 Years San José Mine Producing Since 2007 Production 2018 47 koz Gold 3.0 Moz Silver
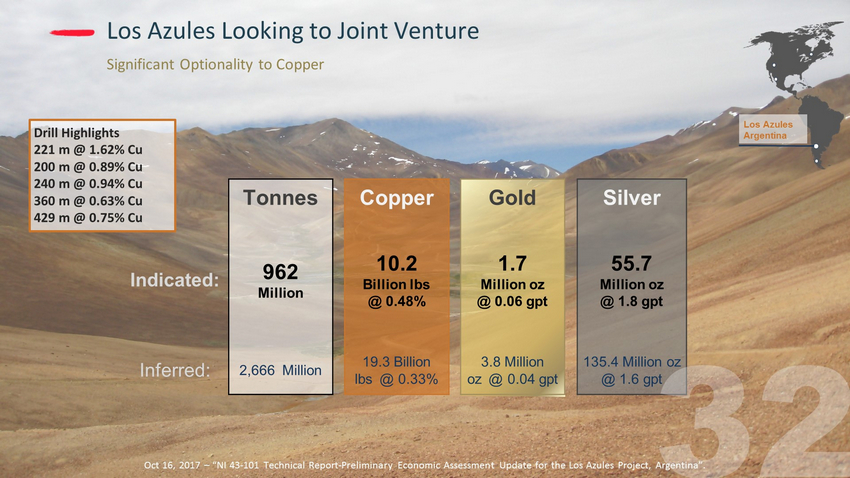
Oct 16, 2017 – “NI 43 - 101 Technical Report - Preliminary Economic Assessment Update for the Los Azules Project, Argentina”. Tonnes Copper Gold Silver Indicated: 962 Million 10.2 Billion lbs @ 0.48% 1.7 Million oz @ 0.06 gpt 55.7 Million oz @ 1.8 gpt Inferred: 2,666 Million 19.3 Billion lbs @ 0.33% 3.8 Million oz @ 0.04 gpt 135.4 Million oz @ 1.6 gpt Los Azules Argentina Drill Highlights 221 m @ 1.62% Cu 200 m @ 0.89% Cu 240 m @ 0.94% Cu 360 m @ 0.63% Cu 429 m @ 0.75% Cu Significant Optionality to Copper Los Azules Looking to Joint Venture

Oct 16, 2017 – “NI 43 - 101 Technical Report - Preliminary Economic Assessment Update for the Los Azules Project, Argentina”. Initial Capex: $2.4 Billion Payback: 3.6 Years Mine Life: 36 Year After - tax IRR: 20% After - tax NPV @ 8%: $2.2 B 1 st 13 years ' average annual production: 415 million lbs Cu @ cash cost $1.14/ lb (+Au & Ag credits) MUX Highlights PEA 2017 Los Azules - Robust at $3/lb Copper
Big Insider Ownership High Beta to Gold vs Peers Good Trading Liquidity Diversified Production Base Track Record of Building Mines and Turnaround Stories Investment Highlights

Au Resources Measured Indicated Measured + Indicated Inferred 43 - 101 Au Resources Ounces Ounces Ounces Ounces TOTAL 1,583,000 6 , 063 , 00 0 7, 644 , 0 00 5,8 77 ,000 Ag Resources Measured Indicated Measured + Indicated Inferred 43 - 101 Ag Resources Ounces Ounces Ounces Ounces TOTAL 28,576,000 82,486,000 111,060,000 150,713,000 Cu Resources Measured Indicated Measured + Indicated Inferred 43 - 101 Cu Resources Pounds (millions) Pounds (millions) Pounds (millions) Pounds (millions) TOTAL 10,200 10,200 19,300 Au Reserves Proven Probable Proven + Probable 43 - 101 Au Reserves Ounces Ounces Ounces TOTAL (included in resources) 184,000 556,000 740,000 Ag Reserves Proven Probable Proven + Probable 43 - 101 Ag Reserves Ounces Ounces Ounces TOTAL (included in resources) 6,713,000 2,254,000 8,967,000 * Numbers might not total due to rounding. MUX Appendix: Reserves & Resources

2018 2019E 2 Sustaining Capital $13 M $14 M Project Development $88 M $13 M Exploration 3 $29 M $27 M Corporate G&A $13 M $12 M Site G&A and Property Holding Costs $12 M $11 M Debt Service $2 M $7 M 1 Costs related to MSC JV (49%) are excluded unless otherwise specified. 2 Based on internal estimates. 3 Includes MSC (100%) $5M. MUX Appendix: Capital & Exploration Expenditures 1

Avg. Daily Vol. of Shares 1 : Shares Outstanding: Fully Diluted: Share Price: Market Cap: Beta 2 : 3.4 million 362 million 376 million US$1. 85 US$ 670 million 3. 0 x Source: Bloomberg. US$. As of Ju l 29 , 2019. 1 Share trading volume NYSE and TSX combined, 3 months average. 2 Three years, relative to gold. NYSE & TSX Rob McEwen 22% Institution al 29% Retail 49% Stock Ownership MUX
MUX Appendix: Cautionary Note Regarding NON - GAAP Measures In this presentation, we have provided information prepared or calculated according to U . S . GAAP, as well as provided some non - U . S . GAAP ("non - GAAP") performance measures . Because the non - GAAP performance measures do not have any standardized meaning prescribed by U . S . GAAP, they may not be comparable to similar measures presented by other companies . Total Cash Costs per GEO, and All - in Sustaxining Costs (“AISC”) per GEO . Total cash costs consist of mining, processing, on - site general and administrative costs, community and permitting costs related to current explorations, royalty costs, refining and treatment charges (for both doré and concentrate products), sales costs, export taxes and operational stripping costs . All - in sustaining cash costs consist of total cash costs (as described above), plus environmental rehabilitation costs, amortization of the asset retirement costs related to operating sites, sustaining exploration and development costs, and sustaining capital expenditures . In order to arrive at our consolidated all - in sustaining costs, we also include corporate general and administrative expenses . Depreciation is excluded from both total cash costs and all - in sustaining cash costs . For both total cash costs and all - in sustaining costs we include our attributable share of total cash costs from operations where we hold less than a 100 % economic share in the production, such as MSC, where we hold a 49 % interest . Total cash cost and all - in sustaining cash cost per GEO sold are calculated on a co - product basis by dividing the respective proportionate share of the total cash costs and all - in sustaining cash costs for the period attributable to each metal by the ounces of each respective metal sold . We use and report these measures to provide additional information regarding operational efficiencies both on a consolidated and an individual mine basis, and believe that these measures provide investors and analysts with useful information about our underlying costs of operations . A reconciliation to the nearest U . S . GAAP measure is provided in McEwen Mining's Annual Report on Form 10 - K for the year ended December 31 , 2018 and Quarterly Report on Form 10 - Q for the quarter ended March 31 , 2019 . Earnings from Mining Operations The term Earnings from Mining Operations used in this presentation is a non - GAAP financial measure . We use and report this measure because we believe it provides investors and analysts with a useful measure of the underlying earnings from our mining operations . We define Earnings from Mining Operations as Gold and Silver Revenues from our El Gallo Mine, Black Fox Mine, and our 49 % attributable share of the San José Mine's Net Sales, less their respective Production Costs Applicable to Sales . To the extent that Production Costs Applicable to Sales may include depreciation and amortization expense related to the fair value increments on historical business acquisitions (fair value paid in excess of the carrying value of the underlying assets and liabilities assumed on the date of acquisition), we deduct this expense in order to arrive at Production Costs Applicable to Sales that only include depreciation and amortization expense incurred at the mine - site level . The San José Mine Net Sales and Production Costs Applicable to Sales are presented, on a 100 % basis, in Note 5 of McEwen Mining's Annual Report on Form 10 - K for the year ended December 31 , 2018 and Quarterly Report on Form 10 - Q for the quarter ended March 31 , 2019 . Cash, Investments and Precious Metals The term cash, investments and precious metals used in this presentation is a non - GAAP financial measure . We report this measure to better understand our liquidity in each reporting period . Cash, investments and precious metals is calculated as the sum of cash, investments and ounces of doré held in inventory, valued at the London P . M . Fix spot price at the corresponding period . A reconciliation to the most directly comparable U . S . GAAP measure, Sales of Gold and Silver, is provided in McEwen Mining's Annual Report on Form 10 - K for the year ended December 31 , 2018 and Quarterly Report on Form 10 - Q for the quarter ended March 31 , 2019 .