UNITED STATES
SECURITIES AND EXCHANGE COMMISSION
Washington, D.C. 20549
FORM N-CSR
CERTIFIED SHAREHOLDER REPORT OF REGISTERED
MANAGEMENT INVESTMENT COMPANIES
Investment Company Act file number 811-3010
Fidelity Advisor Series VII
(Exact name of registrant as specified in charter)
82 Devonshire St., Boston, Massachusetts 02109
(Address of principal executive offices) (Zip code)
Scott C. Goebel, Secretary
82 Devonshire St.
Boston, Massachusetts 02109
(Name and address of agent for service)
Registrant's telephone number, including area code: 617-563-7000
Date of fiscal year end: | July 31 |
| |
Date of reporting period: | July 31, 2012 |
Item 1. Reports to Stockholders

Fidelity Advisor
Focus Funds®
Class A, Class T, Class B and Class C
Fidelity Advisor® Biotechnology Fund
Fidelity Advisor Communications Equipment Fund
Fidelity Advisor Consumer Discretionary Fund
Fidelity Advisor Electronics Fund
Fidelity Advisor Energy Fund
Fidelity Advisor Financial Services Fund
Fidelity Advisor Health Care Fund
Fidelity Advisor Industrials Fund
Fidelity Advisor Technology Fund
Fidelity Advisor Utilities Fund
Annual Report
July 31, 2012
(Fidelity Cover Art)
Contents
To view a fund's proxy voting guidelines and proxy voting record for the 12-month period ended June 30, visit http://www.fidelity.com/proxyvotingresults or visit the Securities and Exchange Commission's (SEC) web site at http://www.sec.gov. You may also call 1-877-208-0098 to request a free copy of the proxy voting guidelines.
Standard & Poor's, S&P and S&P 500 are registered service marks of The McGraw-Hill Companies, Inc. and have been licensed for use by Fidelity Distributors Corporation.
Other third party marks appearing herein are the property of their respective owners. © 2012 FMR LLC. All rights reserved.
All other marks appearing herein are registered or unregistered trademarks or service marks of FMR LLC or an affiliated company.
This report and the financial statements contained herein are submitted for the general information of the shareholders of the funds. This report is not authorized for distribution to prospective investors in the funds unless preceded or accompanied by an effective prospectus.
A fund files its complete schedule of portfolio holdings with the SEC for the first and third quarters of each fiscal year on Form N-Q. Forms N-Q are available on the SEC's web site at http://www.sec.gov. A fund's Forms N-Q may be reviewed and copied at the SEC's Public Reference Room in Washington, DC. Information regarding the operation of the SEC's Public Reference Room may be obtained by calling 1-800-SEC-0330. For a complete list of a fund's portfolio holdings, view the most recent holdings listing, semiannual report, or annual report on Fidelity's web site at http://www.fidelity.com, http://www.advisor.fidelity.com, or http://www.401k.com, as applicable.
NOT FDIC INSURED • MAY LOSE VALUE • NO BANK GUARANTEE
Neither the funds nor Fidelity Distributors Corporation is a bank.
Annual Report
Fidelity Advisor Biotechnology Fund - Class A, T, B, and C
Average annual total return reflects the change in the value of an investment, assuming reinvestment of the class' distributions from dividend income and capital gains (the profits earned upon the sale of securities that have grown in value, if any) and assuming a constant rate of performance each year. The $10,000 table and the fund's returns do not reflect the deduction of taxes that a shareholder would pay on fund distributions or the redemption of fund shares. During periods of reimbursement by Fidelity, a fund's total return will be greater than it would be had the reimbursement not occurred. How a fund did yesterday is no guarantee of how it will do tomorrow. Returns reflect the conversion of Class B shares to Class A shares after a maximum of seven years.
Average Annual Total Returns
Periods ended July 31, 2012 | Past 1
year | Past 5
years | Past 10 years |
Class A (incl. 5.75% sales charge) | 26.13% | 10.53% | 10.51% |
Class T (incl. 3.50% sales charge) | 28.74% | 10.75% | 10.48% |
Class B (incl. contingent deferred sales charge) A | 27.88% | 10.72% | 10.59% |
Class C (incl. contingent deferred sales charge) B | 31.84% | 11.00% | 10.35% |
A Class B shares' contingent deferred sales charges included in the past one year, past five years, and past ten years total return figures are 5%, 2%, and 0%, respectively.
B Class C shares' contingent deferred sales charges included in the past one year, past five years, and past ten years total return figures are 1%, 0%, and 0%, respectively.
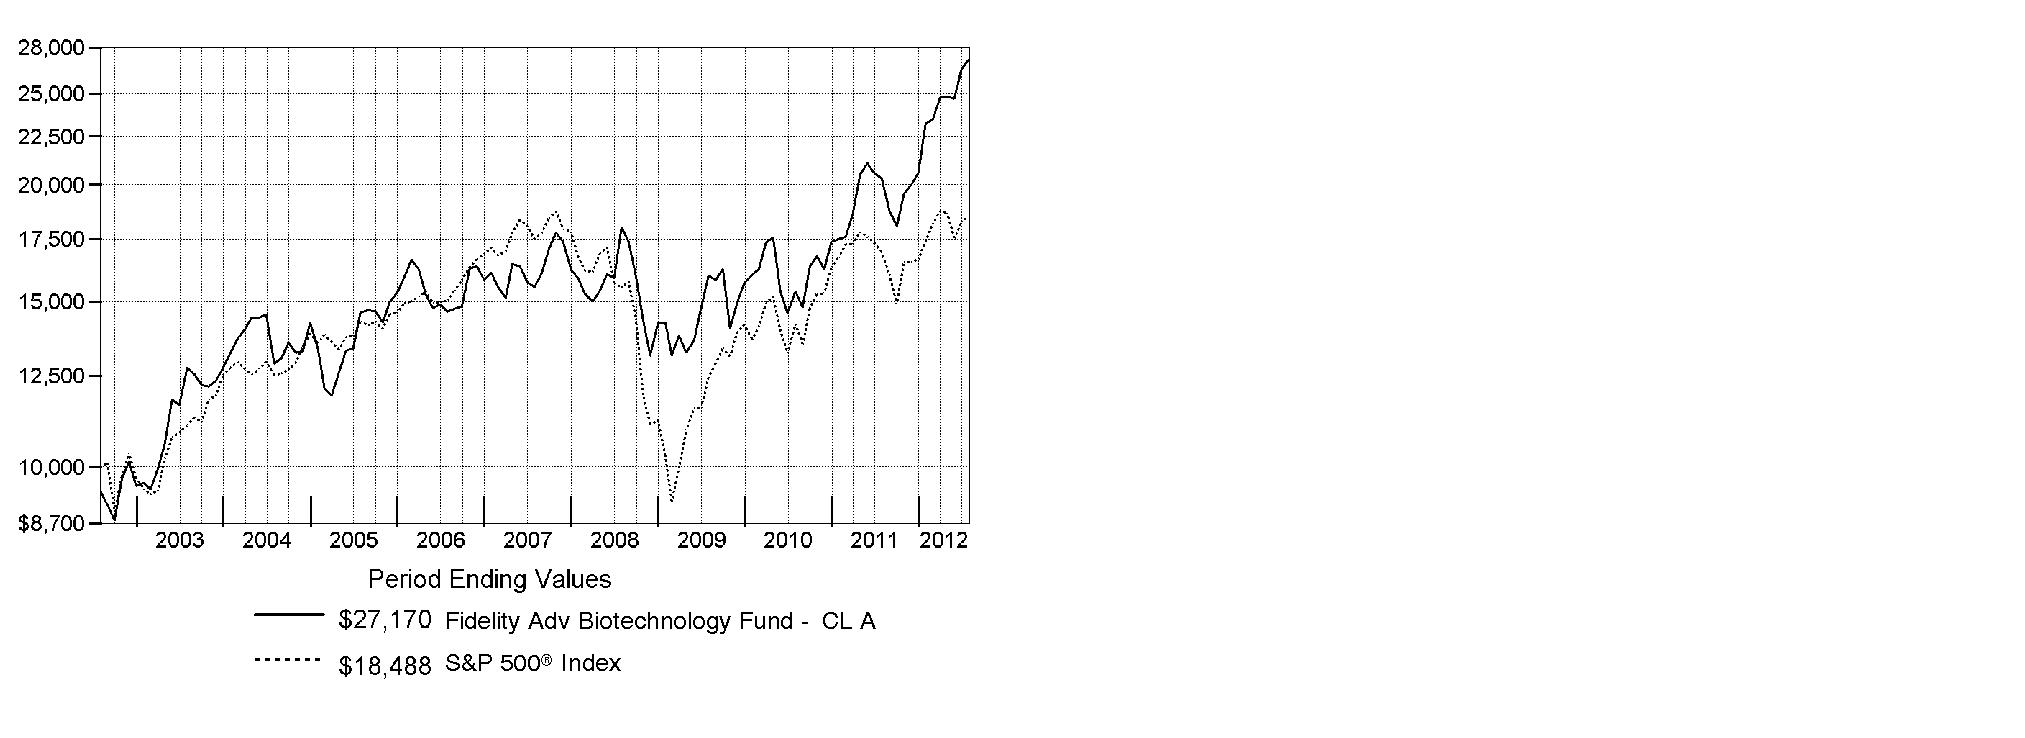
$10,000 Over 10 Years
Let's say hypothetically that $10,000 was invested in Fidelity Advisor® Biotechnology Fund - Class A on July 31, 2002, and the current 5.75% sales charge was paid. The chart shows how the value of your investment would have changed, and also shows how the S&P 500® Index performed over the same period.
Annual Report
Fidelity Advisor Biotechnology Fund
Market Recap: Major U.S. equity benchmarks posted solid gains for the year ending July 31, 2012, amid an uncertain investment environment. The broad-based S&P 500® Index returned 9.13%, while the blue-chip-laden Dow Jones Industrial AverageSM and technology-heavy Nasdaq Composite® Index gained 10.12% and 7.83%, respectively. Volatility spiked during the period's first half, as equities plummeted late last summer on Europe's debt woes, political wrangling over the U.S. debt ceiling and the sovereign credit-rating downgrade that followed. By October, a seemingly improved U.S. economy rejuvenated stocks, paving the way for major equity benchmarks to post their best first-quarter performance since 1998. However, more eurozone trouble, signs that the U.S. economy had turned sluggish and a slowdown in China caused stocks to slip in May, before a new wave of optimism took hold in June and July. Within the S&P 500®, more-defensive sectors such as telecommunication services (+30%) and consumer staples (+20%) fared best, while materials and energy significantly underperformed, returning -5%. Small- and mid-cap stocks trailed their less-volatile large-cap counterparts, with the Russell 2000® Index adding 0.19% and the Russell Midcap® Index rising 2.28%. Given turmoil and local currency weakness in Europe, foreign developed-markets stocks lost ground, with the MSCI® EAFE® Index returning -11.32%.
Comments from Rajiv Kaul, Portfolio Manager of Fidelity Advisor® Biotechnology Fund: For the year, the fund's Class A, Class T, Class B and Class C shares returned 33.83%, 33.41%, 32.88% and 32.84%, respectively (excluding sales charges), trailing the 36.18% advance of the MSCI® U.S. IM Biotechnology 25/50 Index but beating the S&P 500®. Versus the MSCI index, a sizable underweighting in strong-performing benchmark heavyweight Amgen - the fund's largest holding during the period - and a significant overweighting in small-cap biotech shares worked against relative performance. Exposure to some out-of-index pharmaceuticals stocks also curbed the fund's gain. An overweighting in InterMune detracted the most, as investors grew impatient with the pace of sales growth for the company's Esbriet® medication. An out-of-index stake in Vical and an overweighting in Progenics Pharmaceuticals also hurt. Conversely, the stock aiding relative performance the most was a sizable overweighting in Medivation, one of the fund's largest positions during the period. Positive clinical results for the company's prostate cancer treatment lifted its stock. Meanwhile, a small out-of-benchmark stake in pain medication maker Adolor soared in October after the company agreed to be acquired. I sold our position here to lock in profits. A modest underweighting in Gilead Sciences also helped.
The views expressed above reflect those of the portfolio manager(s) only through the end of the period as stated on the cover of this report and do not necessarily represent the views of Fidelity or any other person in the Fidelity organization. Any such views are subject to change at any time based upon market or other conditions and Fidelity disclaims any responsibility to update such views. These views may not be relied on as investment advice and, because investment decisions for a Fidelity fund are based on numerous factors, may not be relied on as an indication of trading intent on behalf of any Fidelity fund.
Annual Report
Fidelity Advisor Biotechnology Fund
As a shareholder of the Fund, you incur two types of costs: (1) transaction costs, including sales charges (loads) on purchase payments or redemption proceeds, redemption fees and (2) ongoing costs, including management fees, distribution and/or service (12b-1) fees and other Fund expenses. This Example is intended to help you understand your ongoing costs (in dollars) of investing in the Fund and to compare these costs with the ongoing costs of investing in other mutual funds.
The Example is based on an investment of $1,000 invested at the beginning of the period and held for the entire period (February 1, 2012 to July 31, 2012).
Actual Expenses
The first line of the accompanying table for each class of the Fund provides information about actual account values and actual expenses. You may use the information in this line, together with the amount you invested, to estimate the expenses that you paid over the period. Simply divide your account value by $1,000.00 (for example, an $8,600 account value divided by $1,000.00 = 8.6), then multiply the result by the number in the first line for a class of the Fund under the heading entitled "Expenses Paid During Period" to estimate the expenses you paid on your account during this period. In addition, the Fund, as a shareholder in the underlying Fidelity Central Funds, will indirectly bear its pro-rata share of the fees and expenses incurred by the underlying Fidelity Central Funds. These fees and expenses are not included in the Fund's annualized expense ratio used to calculate the expense estimate in the table below.
Hypothetical Example for Comparison Purposes
The second line of the accompanying table for each class of the Fund provides information about hypothetical account values and hypothetical expenses based on a Class' actual expense ratio and an assumed rate of return of 5% per year before expenses, which is not the Class' actual return. The hypothetical account values and expenses may not be used to estimate the actual ending account balance or expenses you paid for the period. You may use this information to compare the ongoing costs of investing in the Fund and other funds. To do so, compare this 5% hypothetical example with the 5% hypothetical examples that appear in the shareholder reports of the other funds. In addition, the Fund, as a shareholder in the underlying Fidelity Central Funds, will indirectly bear its pro-rata share of the fees and expenses incurred by the underlying Fidelity Central Funds. These fees and expenses are not included in the Fund's annualized expense ratio used to calculate the expense estimate in the table below.
Please note that the expenses shown in the table are meant to highlight your ongoing costs only and do not reflect any transaction costs. Therefore, the second line of the table is useful in comparing ongoing costs only, and will not help you determine the relative total costs of owning different funds. In addition, if these transactional costs were included, your costs would have been higher.
| Annualized
Expense Ratio | Beginning
Account Value
February 1, 2012 | Ending
Account Value
July 31, 2012 | Expenses Paid
During Period*
February 1, 2012
to July 31, 2012 |
Class A | 1.21% | | | |
Actual | | $ 1,000.00 | $ 1,170.80 | $ 6.53 |
Hypothetical A | | $ 1,000.00 | $ 1,018.85 | $ 6.07 |
Class T | 1.50% | | | |
Actual | | $ 1,000.00 | $ 1,168.90 | $ 8.09 |
Hypothetical A | | $ 1,000.00 | $ 1,017.40 | $ 7.52 |
Class B | 1.95% | | | |
Actual | | $ 1,000.00 | $ 1,165.90 | $ 10.50 |
Hypothetical A | | $ 1,000.00 | $ 1,015.17 | $ 9.77 |
Class C | 1.94% | | | |
Actual | | $ 1,000.00 | $ 1,167.00 | $ 10.45 |
Hypothetical A | | $ 1,000.00 | $ 1,015.22 | $ 9.72 |
Institutional Class | .90% | | | |
Actual | | $ 1,000.00 | $ 1,172.70 | $ 4.86 |
Hypothetical A | | $ 1,000.00 | $ 1,020.39 | $ 4.52 |
A 5% return per year before expenses
* Expenses are equal to each Class' annualized expense ratio, multiplied by the average account value over the period, multiplied by 182/366 (to reflect the one-half year period).
Annual Report
Fidelity Advisor Biotechnology Fund
Investment Changes (Unaudited)
Top Ten Stocks as of July 31, 2012 |
| % of fund's
net assets | % of fund's net assets
6 months ago |
Amgen, Inc. | 12.1 | 10.1 |
Gilead Sciences, Inc. | 10.1 | 10.6 |
Biogen Idec, Inc. | 7.8 | 6.1 |
Celgene Corp. | 4.4 | 4.2 |
Regeneron Pharmaceuticals, Inc. | 4.3 | 3.2 |
ONYX Pharmaceuticals, Inc. | 3.7 | 1.6 |
Vertex Pharmaceuticals, Inc. | 3.2 | 3.4 |
Alexion Pharmaceuticals, Inc. | 2.7 | 4.0 |
Medivation, Inc. | 2.7 | 2.3 |
BioMarin Pharmaceutical, Inc. | 1.7 | 2.6 |
| 52.7 | |
Top Industries (% of fund's net assets) |
As of July 31, 2012 |
 | Biotechnology | 91.8% | |
 | Pharmaceuticals | 4.6% | |
 | Life Sciences Tools & Services | 0.5% | |
 | Health Care Equipment & Supplies | 0.2% | |
 | Personal Products | 0.1% | |
 | All Others* | 2.8% | |

As of January 31, 2012 |
 | Biotechnology | 94.1% | |
 | Pharmaceuticals | 5.7% | |
 | Life Sciences Tools & Services | 0.4% | |
 | Health Care Equipment & Supplies | 0.0% | |
| All Others*† | (0.2)% | |

* Includes short-term investments and net other assets. |
† Short-Term Investments and Net Other Assets (Liabilities) are not included in the pie chart. |
Annual Report
Fidelity Advisor Biotechnology Fund
Investments July 31, 2012
Showing Percentage of Net Assets
Common Stocks - 97.1% |
| Shares | | Value |
BIOTECHNOLOGY - 91.8% |
Biotechnology - 91.8% |
A.P. Pharma, Inc. (e) | 949,565 | | $ 598,226 |
Acadia Pharmaceuticals, Inc. (a) | 157,447 | | 253,490 |
Achillion Pharmaceuticals, Inc. (a) | 47,601 | | 315,119 |
Acorda Therapeutics, Inc. (a) | 62,957 | | 1,515,375 |
Addex Pharmaceuticals Ltd. (a) | 60 | | 491 |
Aegerion Pharmaceuticals, Inc. (a) | 48,490 | | 736,078 |
Affymax, Inc. (a)(d) | 65,193 | | 1,058,082 |
Agenus, Inc. (a)(d) | 9,425 | | 45,523 |
Agenus, Inc. warrants 6/9/18 (a)(e) | 452,000 | | 93,550 |
Alexion Pharmaceuticals, Inc. (a) | 42,005 | | 4,404,224 |
Alkermes PLC (a) | 65,261 | | 1,213,202 |
Alnylam Pharmaceuticals, Inc. (a)(d) | 99,898 | | 1,867,094 |
AMAG Pharmaceuticals, Inc. (a) | 55,006 | | 851,493 |
Amarin Corp. PLC ADR (a)(d) | 95,879 | | 1,122,743 |
Amgen, Inc. | 237,814 | | 19,643,433 |
Amicus Therapeutics, Inc. (a) | 37,385 | | 184,308 |
Anacor Pharmaceuticals, Inc. (a) | 22,150 | | 130,685 |
Arena Pharmaceuticals, Inc. (a)(d) | 239,529 | | 2,002,462 |
ARIAD Pharmaceuticals, Inc. (a) | 128,106 | | 2,450,668 |
ArQule, Inc. (a) | 192,909 | | 1,167,099 |
AVEO Pharmaceuticals, Inc. (a)(d) | 23,752 | | 311,151 |
Biogen Idec, Inc. (a) | 86,357 | | 12,593,441 |
BioInvent International AB (a) | 35,090 | | 17,440 |
BioMarin Pharmaceutical, Inc. (a) | 71,556 | | 2,811,435 |
Bionovo, Inc. (a) | 46,000 | | 782 |
Bionovo, Inc. warrants 2/2/16 (a) | 56,850 | | 713 |
Biospecifics Technologies Corp. (a) | 1,244 | | 22,479 |
BioTime, Inc. (a)(d) | 32,817 | | 126,674 |
Catalyst Pharmaceutical Partners, Inc. (a) | 117,609 | | 149,363 |
Catalyst Pharmaceutical Partners, Inc.: | | | |
warrants 5/2/17 (a) | 8,557 | | 1,005 |
warrants 5/30/17 (a) | 17,900 | | 5,109 |
Celgene Corp. (a) | 104,660 | | 7,165,024 |
Cell Therapeutics, Inc. (a)(d) | 609,529 | | 314,517 |
Cell Therapeutics, Inc. warrants 7/6/16 (a) | 46,404 | | 5,312 |
Celldex Therapeutics, Inc. (a) | 121,557 | | 628,450 |
Cepheid, Inc. (a) | 35,400 | | 1,134,216 |
Clovis Oncology, Inc. (d) | 17,462 | | 308,903 |
Codexis, Inc. (a) | 47,542 | | 146,429 |
Cubist Pharmaceuticals, Inc. (a) | 36,792 | | 1,584,264 |
Cytokinetics, Inc. | 407,500 | | 282,805 |
Cytokinetics, Inc. warrants 6/25/17 (a) | 244,500 | | 2,490 |
Dendreon Corp. (a)(d) | 89,828 | | 427,581 |
Durata Therapeutics, Inc. | 13,800 | | 116,886 |
Dyax Corp. (a) | 209,795 | | 555,957 |
Dynavax Technologies Corp. (a) | 161,002 | | 621,468 |
Emergent BioSolutions, Inc. (a) | 17,500 | | 255,675 |
Enzon Pharmaceuticals, Inc. (a) | 29,534 | | 195,810 |
Exact Sciences Corp. (a) | 45,300 | | 464,325 |
Exelixis, Inc. (a)(d) | 67,145 | | 419,656 |
|
| Shares | | Value |
Genomic Health, Inc. (a) | 16,728 | | $ 561,559 |
Geron Corp. (a) | 8,061 | | 13,865 |
Gilead Sciences, Inc. (a) | 300,460 | | 16,323,992 |
Halozyme Therapeutics, Inc. (a)(d) | 84,958 | | 766,321 |
Horizon Pharma, Inc. (d) | 6,100 | | 34,831 |
Horizon Pharma, Inc. warrants 2/28/17 (a)(e) | 18,737 | | 29,510 |
Idenix Pharmaceuticals, Inc. (a)(d) | 74,406 | | 753,733 |
ImmunoGen, Inc. (a)(d) | 64,980 | | 1,048,777 |
Immunomedics, Inc. (a) | 36,350 | | 125,771 |
Incyte Corp. (a) | 74,938 | | 1,872,701 |
Infinity Pharmaceuticals, Inc. (a) | 26,533 | | 463,266 |
InterMune, Inc. (a) | 126,962 | | 1,121,074 |
Ironwood Pharmaceuticals, Inc.
Class A (a) | 108,728 | | 1,399,329 |
Isis Pharmaceuticals, Inc. (a)(d) | 59,810 | | 724,897 |
Keryx Biopharmaceuticals, Inc. (a) | 48,400 | | 88,088 |
Lexicon Pharmaceuticals, Inc. (a)(d) | 487,692 | | 1,180,215 |
Ligand Pharmaceuticals, Inc. Class B (a) | 30,154 | | 583,480 |
MannKind Corp. (a)(d) | 52,246 | | 124,345 |
Medivation, Inc. (a) | 44,013 | | 4,388,096 |
Merrimack Pharmaceuticals, Inc. | 2,800 | | 22,316 |
Metabolix, Inc. (a)(d) | 61,356 | | 113,509 |
Momenta Pharmaceuticals, Inc. (a)(d) | 31,866 | | 453,135 |
Myriad Genetics, Inc. (a) | 56,382 | | 1,401,093 |
Neurocrine Biosciences, Inc. (a) | 48,406 | | 367,886 |
NeurogesX, Inc. (a) | 37,202 | | 8,928 |
NeurogesX, Inc. (e) | 150,000 | | 36,000 |
NewLink Genetics Corp. (d) | 20,100 | | 238,788 |
Novavax, Inc. (a)(d) | 525,011 | | 1,170,775 |
Novelos Therapeutics, Inc. (a) | 137,600 | | 144,480 |
Novelos Therapeutics, Inc. warrants 12/6/16 (a) | 137,600 | | 64,346 |
NPS Pharmaceuticals, Inc. (a) | 97,378 | | 750,784 |
OncoGenex Pharmaceuticals, Inc. (a) | 8,605 | | 120,126 |
Oncothyreon, Inc. (a)(d) | 13,836 | | 58,526 |
Onyx Pharmaceuticals, Inc. (a) | 80,768 | | 6,055,177 |
Opko Health, Inc. (a)(d) | 129,700 | | 549,928 |
Oragenics, Inc. (e) | 108,608 | | 254,143 |
OREXIGEN Therapeutics, Inc. (a)(d) | 168,452 | | 830,468 |
Osiris Therapeutics, Inc. (a)(d) | 30,725 | | 267,922 |
PDL BioPharma, Inc. (d) | 81,188 | | 551,267 |
Pharmacyclics, Inc. (a)(d) | 46,849 | | 2,492,835 |
PolyMedix, Inc. (a) | 357,066 | | 117,832 |
PolyMedix, Inc. warrants 4/10/16 (a) | 163,833 | | 34,484 |
Progenics Pharmaceuticals, Inc. (a) | 180,835 | | 942,150 |
PROLOR Biotech, Inc. (a)(d) | 72,716 | | 357,763 |
Protalix BioTherapeutics, Inc. (a)(d) | 72,943 | | 424,528 |
Puma Biotechnology, Inc. | 32,887 | | 419,309 |
Raptor Pharmaceutical Corp. (a)(d) | 94,051 | | 468,374 |
Regeneron Pharmaceuticals, Inc. (a) | 52,104 | | 7,015,804 |
Rigel Pharmaceuticals, Inc. (a) | 75,572 | | 826,758 |
Sangamo Biosciences, Inc. (a) | 73,728 | | 387,809 |
Sarepta Therapeutics, Inc. (a) | 317 | | 2,875 |
Common Stocks - continued |
| Shares | | Value |
BIOTECHNOLOGY - CONTINUED |
Biotechnology - continued |
Savient Pharmaceuticals, Inc. (a)(d) | 81,455 | | $ 51,317 |
Seattle Genetics, Inc. (a)(d) | 56,734 | | 1,484,161 |
SIGA Technologies, Inc. (a)(d) | 101,286 | | 294,742 |
Sophiris Bio, Inc. | 138,000 | | 46,787 |
Sorrento Therapeutics, Inc. (e) | 720,000 | | 97,200 |
Spectrum Pharmaceuticals, Inc. (a) | 120,739 | | 1,689,139 |
Sunesis Pharmaceuticals, Inc. (a)(d) | 21,236 | | 63,071 |
Synageva BioPharma Corp. (a) | 16,000 | | 800,960 |
Synergy Pharmaceuticals, Inc. (a) | 41,200 | | 168,508 |
Synergy Pharmaceuticals, Inc. warrants 11/14/16 (a) | 20,600 | | 38,110 |
Synta Pharmaceuticals Corp. (a)(d) | 169,166 | | 1,243,370 |
Synthetic Biologics, Inc. (a) | 100 | | 224 |
Targacept, Inc. (a) | 37,697 | | 162,851 |
Theravance, Inc. (a)(d) | 85,858 | | 2,501,044 |
Threshold Pharmaceuticals, Inc. (a)(d) | 97,866 | | 679,190 |
Threshold Pharmaceuticals, Inc. warrants 3/16/16 (a) | 35,146 | | 188,731 |
Tranzyme, Inc. (a) | 50,400 | | 201,600 |
Trius Therapeutics, Inc. (a) | 57,653 | | 317,668 |
United Therapeutics Corp. (a) | 36,052 | | 1,974,929 |
Vanda Pharmaceuticals, Inc. (a) | 101,300 | | 408,239 |
Verastem, Inc. | 6,365 | | 59,449 |
Vertex Pharmaceuticals, Inc. (a) | 106,420 | | 5,162,434 |
Vical, Inc. (a)(d) | 266,077 | | 920,626 |
XOMA Corp. (a)(d) | 154,908 | | 562,316 |
ZIOPHARM Oncology, Inc. (a)(d) | 135,779 | | 764,436 |
| | 148,757,775 |
HEALTH CARE EQUIPMENT & SUPPLIES - 0.2% |
Health Care Equipment - 0.2% |
Alsius Corp. (a) | 14,200 | | 0 |
Aradigm Corp. (a) | 351,440 | | 40,416 |
InVivo Therapeutics Holdings Corp. (a) | 98,300 | | 242,801 |
| | 283,217 |
HEALTH CARE PROVIDERS & SERVICES - 0.0% |
Health Care Services - 0.0% |
OvaScience, Inc. (e) | 12,800 | | 70,400 |
LIFE SCIENCES TOOLS & SERVICES - 0.5% |
Life Sciences Tools & Services - 0.5% |
BG Medicine, Inc. (a) | 75,570 | | 504,808 |
ChromaDex, Inc. (a)(d) | 143,866 | | 89,197 |
Transgenomic, Inc. (a) | 33,100 | | 34,093 |
Transgenomic, Inc. (e) | 162,000 | | 166,860 |
Transgenomic, Inc. warrants 2/3/17 (a)(e) | 81,000 | | 2,469 |
| | 797,427 |
|
| Shares | | Value |
PERSONAL PRODUCTS - 0.1% |
Personal Products - 0.1% |
MYOS Corp. (e) | 333,300 | | $ 92,991 |
PHARMACEUTICALS - 4.5% |
Pharmaceuticals - 4.5% |
AcelRx Pharmaceuticals, Inc. (a) | 62,800 | | 184,632 |
Auxilium Pharmaceuticals, Inc. (a) | 22,858 | | 615,795 |
AVANIR Pharmaceuticals Class A (a)(d) | 295,541 | | 845,247 |
Corcept Therapeutics, Inc. (a)(d) | 34,013 | | 123,127 |
Elan Corp. PLC sponsored ADR (a) | 98,152 | | 1,133,656 |
Jazz Pharmaceuticals PLC (a) | 6,568 | | 315,724 |
Omeros Corp. (a) | 61,072 | | 577,130 |
Optimer Pharmaceuticals, Inc. (a)(d) | 24,917 | | 340,366 |
Pacira Pharmaceuticals, Inc. (a)(d) | 31,797 | | 486,812 |
Santarus, Inc. (a) | 45,025 | | 327,332 |
TherapeuticsMD, Inc. (a) | 90,100 | | 297,330 |
Transcept Pharmaceuticals, Inc. (a) | 6,000 | | 36,540 |
Ventrus Biosciences, Inc. (a) | 27,098 | | 99,179 |
ViroPharma, Inc. (a) | 21,074 | | 457,517 |
VIVUS, Inc. (a)(d) | 21,800 | | 458,454 |
XenoPort, Inc. (a) | 71,586 | | 564,098 |
Zogenix, Inc. (a) | 125,489 | | 276,076 |
Zogenix, Inc. unit (a) | 73,300 | | 163,022 |
| | 7,302,037 |
TOTAL COMMON STOCKS (Cost $125,259,337) |
157,303,847
|
Convertible Preferred Stocks - 0.1% |
| | | |
BIOTECHNOLOGY - 0.0% |
Biotechnology - 0.0% |
bluebird bio (e) | 35,360 | | 17,631 |
PHARMACEUTICALS - 0.1% |
Pharmaceuticals - 0.1% |
Agios Pharmaceuticals, Inc. Series C (e) | 13,990 | | 68,706 |
KaloBios Pharmaceuticals, Inc. Series E (a)(e) | 42,000 | | 142,800 |
| | 211,506 |
TOTAL CONVERTIBLE PREFERRED STOCKS (Cost $229,126) |
229,137
|
Money Market Funds - 18.8% |
| Shares | | Value |
Fidelity Cash Central Fund, 0.17% (b) | 10,111,771 | | $ 10,111,771 |
Fidelity Securities Lending Cash Central Fund, 0.18% (b)(c) | 20,291,175 | | 20,291,175 |
TOTAL MONEY MARKET FUNDS (Cost $30,402,946) |
30,402,946
|
TOTAL INVESTMENT PORTFOLIO - 116.0% (Cost $155,891,409) | | 187,935,930 |
NET OTHER ASSETS (LIABILITIES) - (16.0)% | | (25,957,339) |
NET ASSETS - 100% | $ 161,978,591 |
Legend |
(a) Non-income producing |
(b) Affiliated fund that is available only to investment companies and other accounts managed by Fidelity Investments. The rate quoted is the annualized seven-day yield of the fund at period end. A complete unaudited listing of the fund's holdings as of its most recent quarter end is available upon request. In addition, each Fidelity Central Fund's financial statements, which are not covered by the Fund's Report of Independent Registered Public Accounting Firm, are available on the SEC's website or upon request. |
(c) Investment made with cash collateral received from securities on loan. |
(d) Security or a portion of the security is on loan at period end. |
(e) Restricted securities - Investment in securities not registered under the Securities Act of 1933 (excluding 144A issues). At the end of the period, the value of restricted securities (excluding 144A issues) amounted to $1,670,486 or 1.0% of net assets. |
Additional information on each restricted holding is as follows: |
Security | Acquisition Date | Acquisition Cost |
A.P. Pharma, Inc. | 7/25/12 | $ 498,522 |
Agenus, Inc. warrants 6/9/18 | 1/9/08 | $ 563,722 |
Agios Pharmaceuticals, Inc. Series C | 11/16/11 | $ 68,706 |
bluebird bio | 7/23/12 | $ 17,620 |
Horizon Pharma, Inc. warrants 2/28/17 | 2/29/12 | $ 2,342 |
KaloBios Pharmaceuticals, Inc. Series E | 5/2/12 | $ 142,800 |
MYOS Corp. | 7/2/12 | $ 83,325 |
NeurogesX, Inc. | 2/1/12 | $ 151,500 |
Oragenics, Inc. | 7/31/12 | $ 162,912 |
OvaScience, Inc. | 3/29/12 | $ 70,400 |
Sorrento Therapeutics, Inc. | 5/15/12 | $ 115,200 |
Transgenomic, Inc. | 2/3/12 | $ 161,441 |
Transgenomic, Inc. warrants 2/3/17 | 2/3/12 | $ 559 |
Affiliated Central Funds |
Information regarding fiscal year to date income earned by the Fund from investments in Fidelity Central Funds is as follows: |
Fund | Income earned |
Fidelity Cash Central Fund | $ 2,923 |
Fidelity Securities Lending Cash Central Fund | 287,481 |
Total | $ 290,404 |
Other Information |
The following is a summary of the inputs used, as of July 31, 2012, involving the Fund's assets and liabilities carried at fair value. The inputs or methodology used for valuing securities may not be an indication of the risk associated with investing in those securities. For more information on valuation inputs, and their aggregation into the levels used in the table below, please refer to the Security Valuation section in the accompanying Notes to Financial Statements. |
Valuation Inputs at Reporting Date: |
Description | Total | Level 1 | Level 2 | Level 3 |
Investments in Securities: | | | | |
Common Stocks | $ 157,303,847 | $ 155,600,146 | $ 1,633,301 | $ 70,400 |
Convertible Preferred Stocks | 229,137 | - | - | 229,137 |
Money Market Funds | 30,402,946 | 30,402,946 | - | - |
Total Investments in Securities: | $ 187,935,930 | $ 186,003,092 | $ 1,633,301 | $ 299,537 |
See accompanying notes which are an integral part of the financial statements.
Annual Report
Fidelity Advisor Biotechnology Fund
Statement of Assets and Liabilities
| July 31, 2012 |
| | |
Assets | | |
Investment in securities, at value (including securities loaned of $18,695,107) - See accompanying schedule: Unaffiliated issuers (cost $125,488,463) | $ 157,532,984 | |
Fidelity Central Funds (cost $30,402,946 | 30,402,946 | |
Total Investments (cost $155,891,409) | | $ 187,935,930 |
Receivable for investments sold | | 2,869,141 |
Receivable for fund shares sold | | 2,085,272 |
Distributions receivable from Fidelity Central Funds | | 54,243 |
Other receivables | | 1,795 |
Total assets | | 192,946,381 |
| | |
Liabilities | | |
Payable to custodian bank | $ 129,543 | |
Payable for investments purchased | 10,000,077 | |
Payable for fund shares redeemed | 350,233 | |
Accrued management fee | 69,729 | |
Distribution and service plan fees payable | 56,003 | |
Other affiliated payables | 34,235 | |
Other payables and accrued expenses | 36,795 | |
Collateral on securities loaned, at value | 20,291,175 | |
Total liabilities | | 30,967,790 |
| | |
Net Assets | | $ 161,978,591 |
Net Assets consist of: | | |
Paid in capital | | $ 120,525,433 |
Accumulated undistributed net realized gain (loss) on investments and foreign currency transactions | | 9,408,637 |
Net unrealized appreciation (depreciation) on investments | | 32,044,521 |
Net Assets | | $ 161,978,591 |
Statement of Assets and Liabilities - continued
| July 31, 2012 |
| | |
Calculation of Maximum Offering Price Class A:
Net Asset Value and redemption price per share ($68,993,474 ÷ 5,851,707 shares) | | $ 11.79 |
| | |
Maximum offering price per share (100/94.25 of $11.79) | | $ 12.51 |
Class T:
Net Asset Value and redemption price per share ($28,153,833 ÷ 2,465,085 shares) | | $ 11.42 |
| | |
Maximum offering price per share (100/96.50 of $11.42) | | $ 11.83 |
Class B:
Net Asset Value and offering price per share ($6,349,281 ÷ 590,506 shares)A | | $ 10.75 |
| | |
Class C:
Net Asset Value and offering price per share ($31,709,620 ÷ 2,947,678 shares)A | | $ 10.76 |
| | |
Institutional Class:
Net Asset Value, offering price and redemption price per share ($26,772,383 ÷ 2,190,697 shares) | | $ 12.22 |
A Redemption price per share is equal to net asset value less any applicable contingent deferred sales charge.
See accompanying notes which are an integral part of the financial statements.
Annual Report
Fidelity Advisor Biotechnology Fund
Financial Statements - continued
Statement of Operations
| Year ended July 31, 2012 |
| | |
Investment Income | | |
Dividends | | $ 220,191 |
Income from Fidelity Central Funds (including $287,481 from security lending) | | 290,404 |
Total income | | 510,595 |
| | |
Expenses | | |
Management fee | $ 531,816 | |
Transfer agent fees | 278,414 | |
Distribution and service plan fees | 454,730 | |
Accounting and security lending fees | 38,888 | |
Custodian fees and expenses | 15,932 | |
Independent trustees' compensation | 586 | |
Registration fees | 60,261 | |
Audit | 43,371 | |
Legal | 275 | |
Miscellaneous | 691 | |
Total expenses before reductions | 1,424,964 | |
Expense reductions | (3,767) | 1,421,197 |
Net investment income (loss) | | (910,602) |
Realized and Unrealized Gain (Loss) Net realized gain (loss) on: | | |
Investment securities: | | |
Unaffiliated issuers | 13,076,175 | |
Foreign currency transactions | 26 | |
Total net realized gain (loss) | | 13,076,201 |
Change in net unrealized appreciation (depreciation) on investment securities | | 17,166,425 |
Net gain (loss) | | 30,242,626 |
Net increase (decrease) in net assets resulting from operations | | $ 29,332,024 |
Statement of Changes in Net Assets
| Year ended
July 31,
2012 | Year ended
July 31,
2011 |
Increase (Decrease) in Net Assets | | |
Operations | | |
Net investment income (loss) | $ (910,602) | $ (708,078) |
Net realized gain (loss) | 13,076,201 | 5,234,202 |
Change in net unrealized appreciation (depreciation) | 17,166,425 | 11,018,770 |
Net increase (decrease) in net assets resulting from operations | 29,332,024 | 15,544,894 |
Share transactions - net increase (decrease) | 58,002,416 | 6,522,296 |
Redemption fees | 11,011 | 3,193 |
Total increase (decrease) in net assets | 87,345,451 | 22,070,383 |
| | |
Net Assets | | |
Beginning of period | 74,633,140 | 52,562,757 |
End of period (including accumulated net investment loss of $0 and $755, respectively) | $ 161,978,591 | $ 74,633,140 |
See accompanying notes which are an integral part of the financial statements.
Annual Report
Financial Highlights - Class A
Years ended July 31, | 2012 | 2011 | 2010 | 2009 | 2008 |
Selected Per-Share Data | | | | | |
Net asset value, beginning of period | $ 8.81 | $ 6.67 | $ 6.94 | $ 7.81 | $ 7.23 |
Income from Investment Operations | | | | | |
Net investment income (loss) C | (.07) | (.07) F | (.08) G | (.08) | (.09) H |
Net realized and unrealized gain (loss) | 3.05 | 2.21 | (.19) | (.79) | 1.20 |
Total from investment operations | 2.98 | 2.14 | (.27) | (.87) | 1.11 |
Distributions from net realized gain | - | - | - | - | (.53) |
Redemption fees added to paid in capital C, J | - | - | - | - | - |
Net asset value, end of period | $ 11.79 | $ 8.81 | $ 6.67 | $ 6.94 | $ 7.81 |
Total Return A, B | 33.83% | 32.08% | (3.89)% | (11.14)% | 15.95% |
Ratios to Average Net Assets D, I | | | | | |
Expenses before reductions | 1.27% | 1.35% | 1.39% | 1.40% | 1.37% |
Expenses net of fee waivers, if any | 1.27% | 1.35% | 1.39% | 1.40% | 1.37% |
Expenses net of all reductions | 1.27% | 1.34% | 1.38% | 1.40% | 1.37% |
Net investment income (loss) | (.73)% | (.91)% F | (1.15)% G | (1.27)% | (1.24)% H |
Supplemental Data | | | | | |
Net assets, end of period (000 omitted) | $ 68,993 | $ 30,639 | $ 20,154 | $ 19,858 | $ 18,249 |
Portfolio turnover rate E | 82% | 99% | 130% | 73% | 132% |
A Total returns would have been lower if certain expenses had not been reduced during the applicable periods shown.
B Total returns do not include the effect of the sales charges.
C Calculated based on average shares outstanding during the period.
D Fees and expenses of any underlying Fidelity Central Funds are not included in the Fund's expense ratio. The Fund indirectly bears its proportionate share of the expenses of any underlying Fidelity Central Funds.
E Amount does not include the portfolio activity of any underlying Fidelity Central Funds.
F Investment income per share reflects a large, non-recurring dividend which amounted to $.01 per share. Excluding this non-recurring dividend, the ratio of net investment income (loss) to average net assets would have been (1.04)%.
G Investment income per share reflects a large, non-recurring dividend which amounted to $.01 per share. Excluding this non-recurring dividend, the ratio of net investment income (loss) to average net assets would have been (1.29)%.
H Investment income per share reflects a large, non-recurring dividend which amounted to $.01 per share. Excluding this non-recurring dividend, the ratio of net investment income (loss) to average net assets would have been (1.33)%.
I Expense ratios reflect operating expenses of the class. Expenses before reductions do not reflect amounts reimbursed by the investment adviser or reductions from brokerage service arrangements or reductions from other expense offset arrangements and do not represent the amount paid by the class during periods when reimbursements or reductions occur. Expenses net of fee waivers reflect expenses after reimbursement by the investment adviser but prior to reductions from brokerage service arrangements or other expense offset arrangements. Expenses net of all reductions represent the net expenses paid by the class.
J Amount represents less than $.01 per share.
Financial Highlights - Class T
Years ended July 31, | 2012 | 2011 | 2010 | 2009 | 2008 |
Selected Per-Share Data | | | | | |
Net asset value, beginning of period | $ 8.56 | $ 6.50 | $ 6.78 | $ 7.65 | $ 7.11 |
Income from Investment Operations | | | | | |
Net investment income (loss) C | (.10) | (.09) F | (.09) G | (.09) | (.11) H |
Net realized and unrealized gain (loss) | 2.96 | 2.15 | (.19) | (.78) | 1.18 |
Total from investment operations | 2.86 | 2.06 | (.28) | (.87) | 1.07 |
Distributions from net realized gain | - | - | - | - | (.53) |
Redemption fees added to paid in capital C, J | - | - | - | - | - |
Net asset value, end of period | $ 11.42 | $ 8.56 | $ 6.50 | $ 6.78 | $ 7.65 |
Total Return A, B | 33.41% | 31.69% | (4.13)% | (11.37)% | 15.64% |
Ratios to Average Net Assets D, I | | | | | |
Expenses before reductions | 1.56% | 1.64% | 1.69% | 1.71% | 1.69% |
Expenses net of fee waivers, if any | 1.56% | 1.64% | 1.65% | 1.65% | 1.65% |
Expenses net of all reductions | 1.56% | 1.64% | 1.64% | 1.65% | 1.65% |
Net investment income (loss) | (1.02)% | (1.21)% F | (1.41)% G | (1.52)% | (1.53)% H |
Supplemental Data | | | | | |
Net assets, end of period (000 omitted) | $ 28,154 | $ 16,454 | $ 11,684 | $ 13,356 | $ 15,123 |
Portfolio turnover rate E | 82% | 99% | 130% | 73% | 132% |
A Total returns would have been lower if certain expenses had not been reduced during the applicable periods shown.
B Total returns do not include the effect of the sales charges.
C Calculated based on average shares outstanding during the period.
D Fees and expenses of any underlying Fidelity Central Funds are not included in the Fund's expense ratio. The Fund indirectly bears its proportionate share of the expenses of any underlying Fidelity Central Funds.
E Amount does not include the portfolio activity of any underlying Fidelity Central Funds.
F Investment income per share reflects a large, non-recurring dividend which amounted to $.01 per share. Excluding this non-recurring dividend, the ratio of net investment income (loss) to average net assets would have been (1.34)%.
G Investment income per share reflects a large, non-recurring dividend which amounted to $.01 per share. Excluding this non-recurring dividend, the ratio of net investment income (loss) to average net assets would have been (1.55)%.
H Investment income per share reflects a large, non-recurring dividend which amounted to $.01 per share. Excluding this non-recurring dividend, the ratio of net investment income (loss) to average net assets would have been (1.61)%.
I Expense ratios reflect operating expenses of the class. Expenses before reductions do not reflect amounts reimbursed by the investment adviser or reductions from brokerage service arrangements or reductions from other expense offset arrangements and do not represent the amount paid by the class during periods when reimbursements or reductions occur. Expenses net of fee waivers reflect expenses after reimbursement by the investment adviser but prior to reductions from brokerage service arrangements or other expense offset arrangements. Expenses net of all reductions represent the net expenses paid by the class.
J Amount represents less than $.01 per share.
See accompanying notes which are an integral part of the financial statements.
Annual Report
Financial Highlights - Class B
Years ended July 31, | 2012 | 2011 | 2010 | 2009 | 2008 |
Selected Per-Share Data | | | | | |
Net asset value, beginning of period | $ 8.09 | $ 6.17 | $ 6.47 | $ 7.34 | $ 6.88 |
Income from Investment Operations | | | | | |
Net investment income (loss) C | (.13) | (.12) F | (.12) G | (.12) | (.14) H |
Net realized and unrealized gain (loss) | 2.79 | 2.04 | (.18) | (.75) | 1.13 |
Total from investment operations | 2.66 | 1.92 | (.30) | (.87) | .99 |
Distributions from net realized gain | - | - | - | - | (.53) |
Redemption fees added to paid in capital C, J | - | - | - | - | - |
Net asset value, end of period | $ 10.75 | $ 8.09 | $ 6.17 | $ 6.47 | $ 7.34 |
Total Return A, B | 32.88% | 31.12% | (4.64)% | (11.85)% | 14.96% |
Ratios to Average Net Assets D, I | | | | | |
Expenses before reductions | 2.03% | 2.10% | 2.14% | 2.15% | 2.12% |
Expenses net of fee waivers, if any | 2.03% | 2.10% | 2.14% | 2.15% | 2.12% |
Expenses net of all reductions | 2.02% | 2.09% | 2.13% | 2.15% | 2.12% |
Net investment income (loss) | (1.49)% | (1.66)% F | (1.90)% G | (2.02)% | (2.00)% H |
Supplemental Data | | | | | |
Net assets, end of period (000 omitted) | $ 6,349 | $ 5,849 | $ 6,297 | $ 7,377 | $ 11,044 |
Portfolio turnover rate E | 82% | 99% | 130% | 73% | 132% |
A Total returns would have been lower if certain expenses had not been reduced during the applicable periods shown.
B Total returns do not include the effect of the contingent deferred sales charge.
C Calculated based on average shares outstanding during the period.
D Fees and expenses of any underlying Fidelity Central Funds are not included in the Fund's expense ratio. The Fund indirectly bears its proportionate share of the expenses of any underlying Fidelity Central Funds.
E Amount does not include the portfolio activity of any underlying Fidelity Central Funds.
F Investment income per share reflects a large, non-recurring dividend which amounted to $.01 per share. Excluding this non-recurring dividend, the ratio of net investment income (loss) to average net assets would have been (1.79)%.
G Investment income per share reflects a large, non-recurring dividend which amounted to $.01 per share. Excluding this non-recurring dividend, the ratio of net investment income (loss) to average net assets would have been (2.04)%.
H Investment income per share reflects a large, non-recurring dividend which amounted to $.01 per share. Excluding this non-recurring dividend, the ratio of net investment income (loss) to average net assets would have been (2.08)%.
I Expense ratios reflect operating expenses of the class. Expenses before reductions do not reflect amounts reimbursed by the investment adviser or reductions from brokerage service arrangements or reductions from other expense offset arrangements and do not represent the amount paid by the class during periods when reimbursements or reductions occur. Expenses net of fee waivers reflect expenses after reimbursement by the investment adviser but prior to reductions from brokerage service arrangements or other expense offset arrangements. Expenses net of all reductions represent the net expenses paid by the class.
J Amount represents less than $.01 per share.
Financial Highlights - Class C
Years ended July 31, | 2012 | 2011 | 2010 | 2009 | 2008 |
Selected Per-Share Data | | | | | |
Net asset value, beginning of period | $ 8.10 | $ 6.18 | $ 6.47 | $ 7.34 | $ 6.88 |
Income from Investment Operations | | | | | |
Net investment income (loss) C | (.13) | (.12) F | (.12) G | (.12) | (.13) H |
Net realized and unrealized gain (loss) | 2.79 | 2.04 | (.17) | (.75) | 1.12 |
Total from investment operations | 2.66 | 1.92 | (.29) | (.87) | .99 |
Distributions from net realized gain | - | - | - | - | (.53) |
Redemption fees added to paid in capital C, J | - | - | - | - | - |
Net asset value, end of period | $ 10.76 | $ 8.10 | $ 6.18 | $ 6.47 | $ 7.34 |
Total Return A, B | 32.84% | 31.07% | (4.48)% | (11.85)% | 14.96% |
Ratios to Average Net Assets D, I | | | | | |
Expenses before reductions | 2.01% | 2.10% | 2.14% | 2.15% | 2.12% |
Expenses net of fee waivers, if any | 2.01% | 2.10% | 2.14% | 2.15% | 2.12% |
Expenses net of all reductions | 2.01% | 2.09% | 2.13% | 2.15% | 2.12% |
Net investment income (loss) | (1.47)% | (1.66)% F | (1.90)% G | (2.02)% | (2.00)% H |
Supplemental Data | | | | | |
Net assets, end of period (000 omitted) | $ 31,710 | $ 15,787 | $ 11,421 | $ 12,426 | $ 13,323 |
Portfolio turnover rate E | 82% | 99% | 130% | 73% | 132% |
A Total returns would have been lower if certain expenses had not been reduced during the applicable periods shown.
B Total returns do not include the effect of the contingent deferred sales charge.
C Calculated based on average shares outstanding during the period.
D Fees and expenses of any underlying Fidelity Central Funds are not included in the Fund's expense ratio. The Fund indirectly bears its proportionate share of the expenses of any underlying Fidelity Central Funds.
E Amount does not include the portfolio activity of any underlying Fidelity Central Funds.
F Investment income per share reflects a large, non-recurring dividend which amounted to $.01 per share. Excluding this non-recurring dividend, the ratio of net investment income (loss) to average net assets would have been (1.79)%.
G Investment income per share reflects a large, non-recurring dividend which amounted to $.01 per share. Excluding this non-recurring dividend, the ratio of net investment income (loss) to average net assets would have been (2.04)%.
H Investment income per share reflects a large, non-recurring dividend which amounted to $.01 per share. Excluding this non-recurring dividend, the ratio of net investment income (loss) to average net assets would have been (2.08)%.
I Expense ratios reflect operating expenses of the class. Expenses before reductions do not reflect amounts reimbursed by the investment adviser or reductions from brokerage service arrangements or reductions from other expense offset arrangements and do not represent the amount paid by the class during periods when reimbursements or reductions occur. Expenses net of fee waivers reflect expenses after reimbursement by the investment adviser but prior to reductions from brokerage service arrangements or other expense offset arrangements. Expenses net of all reductions represent the net expenses paid by the class.
J Amount represents less than $.01 per share.
See accompanying notes which are an integral part of the financial statements.
Annual Report
Financial Highlights - Institutional Class
Years ended July 31, | 2012 | 2011 | 2010 | 2009 | 2008 |
Selected Per-Share Data | | | | | |
Net asset value, beginning of period | $ 9.10 | $ 6.87 | $ 7.12 | $ 8.00 | $ 7.37 |
Income from Investment Operations | | | | | |
Net investment income (loss) B | (.04) | (.05) E | (.06) F | (.06) | (.07) G |
Net realized and unrealized gain (loss) | 3.16 | 2.28 | (.19) | (.82) | 1.23 |
Total from investment operations | 3.12 | 2.23 | (.25) | (.88) | 1.16 |
Distributions from net realized gain | - | - | - | - | (.53) |
Redemption fees added to paid in capital B, I | - | - | - | - | - |
Net asset value, end of period | $ 12.22 | $ 9.10 | $ 6.87 | $ 7.12 | $ 8.00 |
Total Return A | 34.29% | 32.46% | (3.51)% | (11.00)% | 16.35% |
Ratios to Average Net Assets C, H | | | | | |
Expenses before reductions | .95% | 1.04% | 1.07% | 1.11% | 1.06% |
Expenses net of fee waivers, if any | .95% | 1.04% | 1.07% | 1.11% | 1.06% |
Expenses net of all reductions | .94% | 1.03% | 1.06% | 1.11% | 1.06% |
Net investment income (loss) | (.40)% | (.60)% E | (.83)% F | (.98)% | (.94)% G |
Supplemental Data | | | | | |
Net assets, end of period (000 omitted) | $ 26,772 | $ 5,903 | $ 3,008 | $ 1,901 | $ 1,117 |
Portfolio turnover rate D | 82% | 99% | 130% | 73% | 132% |
A Total returns would have been lower if certain expenses had not been reduced during the applicable periods shown.
B Calculated based on average shares outstanding during the period.
C Fees and expenses of any underlying Fidelity Central Funds are not included in the Fund's expense ratio. The Fund indirectly bears its proportionate share of the expenses of any underlying Fidelity Central Funds.
D Amount does not include the portfolio activity of any underlying Fidelity Central Funds.
E Investment income per share reflects a large, non-recurring dividend which amounted to $.01 per share. Excluding this non-recurring dividend, the ratio of net investment income (loss) to average net assets would have been (.73)%.
F Investment income per share reflects a large, non-recurring dividend which amounted to $.01 per share. Excluding this non-recurring dividend, the ratio of net investment income (loss) to average net assets would have been (.97)%.
G Investment income per share reflects a large, non-recurring dividend which amounted to $.01 per share. Excluding this non-recurring dividend, the ratio of net investment income (loss) to average net assets would have been (1.02)%.
H Expense ratios reflect operating expenses of the class. Expenses before reductions do not reflect amounts reimbursed by the investment adviser or reductions from brokerage service arrangements or reductions from other expense offset arrangements and do not represent the amount paid by the class during periods when reimbursements or reductions occur. Expenses net of fee waivers reflect expenses after reimbursement by the investment adviser but prior to reductions from brokerage service arrangements or other expense offset arrangements. Expenses net of all reductions represent the net expenses paid by the class.
I Amount represents less than $.01 per share.
See accompanying notes which are an integral part of the financial statements.
Annual Report
Fidelity Advisor Biotechnology Fund
Notes to Financial Statements
For the period ended July 31, 2012
1. Organization.
Fidelity Advisor Biotechnology Fund (the Fund) is a non-diversified fund of Fidelity Advisor Series VII (the Trust) and is authorized to issue an unlimited number of shares. The Trust is registered under the Investment Company Act of 1940, as amended (the 1940 Act), as an open-end management investment company organized as a Massachusetts business trust. The Fund offers Class A, Class T, Class C and Institutional Class shares, each of which, along with Class B shares, has equal rights as to assets and voting privileges. Effective after the close of business on September 1, 2010, Class B shares were closed to new accounts and additional purchases, except for exchanges and reinvestments. Each class has exclusive voting rights with respect to matters that affect that class. Class B shares will automatically convert to Class A shares after a holding period of seven years from the initial date of purchase. Investment income, realized and unrealized capital gains and losses, the common expenses of the Fund, and certain fund-level expense reductions, if any, are allocated on a pro-rata basis to each class based on the relative net assets of each class to the total net assets of the Fund. Each class differs with respect to transfer agent and distribution and service plan fees incurred. Certain expense reductions may also differ by class.
2. Investments in Fidelity Central Funds.
The Fund invests in Fidelity Central Funds, which are open-end investment companies available only to other investment companies and accounts managed by Fidelity Management & Research Company (FMR) and its affiliates. The Fund's Schedule of Investments lists each of the Fidelity Central Funds held as of period end, if any, as an investment of the Fund, but does not include the underlying holdings of each Fidelity Central Fund. As an Investing Fund, the Fund indirectly bears its proportionate share of the expenses of the underlying Fidelity Central Funds.
The Money Market Central Funds seek preservation of capital and current income and are managed by Fidelity Investments Money Management, Inc. (FIMM), an affiliate of FMR.
A complete unaudited list of holdings for each Fidelity Central Fund is available upon request or at the Securities and Exchange Commission (the SEC) web site at www.sec.gov. In addition, the financial statements of the Fidelity Central Funds, which are not covered by the Fund's Report of Independent Registered Public Accounting Firm, are available on the SEC web site or upon request.
3. Significant Accounting Policies.
The financial statements have been prepared in conformity with accounting principles generally accepted in the United States of America (GAAP), which require management to make certain estimates and assumptions at the date of the financial statements. Actual results could differ from those estimates. Subsequent events, if any, through the date that the financial statements were issued have been evaluated in the preparation of the financial statements. The following summarizes the significant accounting policies of the Fund:
Security Valuation. Investments are valued as of 4:00 p.m. Eastern time on the last calendar day of the period. In accordance with valuation policies and procedures approved by the Board of Trustees (the Board), the Fund attempts to obtain prices from one or more third party pricing vendor or broker to value its investments. When current market prices, quotations or rates are not readily available or reliable, securities will be fair valued in good faith by the FMR Fair Value Committee (the Committee), in accordance with procedures adopted by the Fund's Board. Factors used in determining fair value vary by security type and may include market or security specific events. The frequency with which these procedures are used cannot be predicted and they may be utilized to a significant extent. The Committee oversees the Fund's valuation policies and procedures and is responsible for approving and reporting to the Board all fair value determinations.
The Fund categorizes the inputs to valuation techniques used to value its investments into a disclosure hierarchy consisting of three levels as shown below:
Level 1 - quoted prices in active markets for identical investments
Level 2 - other significant observable inputs (including quoted prices for similar investments, interest rates, prepayment speeds, etc.)
Level 3 - unobservable inputs (including the Fund's own assumptions based on the best information available)
Valuation techniques used to value the Fund's investments by major category are as follows:
Equity securities, including restricted securities, for which market quotations are readily available, are valued at the last reported sale price or official closing price as reported by a third party pricing vendor on the primary market or exchange on which they are traded and are categorized as Level 1 in the hierarchy. In the event there were no sales during the day or closing prices are not available, securities are valued at the last quoted bid price or may be valued using the last available price and are generally categorized as Level 2 in the hierarchy. For foreign equity securities, when significant market or security specific events arise, comparisons to the valuation of American Depositary Receipts (ADRs), futures contracts, Exchange-Traded Funds (ETFs) and certain indexes as well as quoted prices for similar securities are used and are categorized as Level 2 in the hierarchy. Utilizing these techniques may result in transfers between Level 1 and Level 2. Restricted equity securities and private placements for which observable inputs are not available are valued using alternate valuation approaches, including the market approach and the income approach and are categorized as
Annual Report
3. Significant Accounting Policies - continued
Security Valuation - continued
Level 3 in the hierarchy. The market approach generally consists of using comparable market transactions while the income approach generally consists of using the net present value of estimated future cash flows, adjusted as appropriate for liquidity, credit, market and/or other risk factors.
Investments in open-end mutual funds, including the Fidelity Central Funds, are valued at their closing net asset value each business day and are categorized as Level 1 in the hierarchy.
Changes in valuation techniques may result in transfers in or out of an assigned level within the disclosure hierarchy. The aggregate value of investments by input level, as of July 31, 2012, is included at the end of the Fund's Schedule of Investments.
Foreign Currency Translation. The Fund may use foreign currency contracts to facilitate transactions in foreign-denominated securities. Gains and losses from these transactions may arise from changes in the value of the foreign currency or if the counterparties do not perform under the contracts' terms.
Foreign-denominated assets, including investment securities, and liabilities are translated into U.S. dollars at the exchange rates at period end. Purchases and sales of investment securities, income and dividends received and expenses denominated in foreign currencies are translated into U.S. dollars at the exchange rate in effect on the transaction date.
The effects of exchange rate fluctuations on investments are included with the net realized and unrealized gain (loss) on investment securities. Other foreign currency transactions resulting in realized and unrealized gain (loss) are disclosed separately.
Investment Transactions and Income. For financial reporting purposes, the Fund's investment holdings and NAV include trades executed through the end of the last business day of the period. The NAV per share for processing shareholder transactions is calculated as of the close of business of the New York Stock Exchange (NYSE), normally 4:00 p.m. Eastern time and includes trades executed through the end of the prior business day. Gains and losses on securities sold are determined on the basis of identified cost and may include proceeds received from litigation. Dividend income is recorded on the ex-dividend date, except for certain dividends from foreign securities where the ex-dividend date may have passed, which are recorded as soon as the Fund is informed of the ex-dividend date. Non-cash dividends included in dividend income, if any, are recorded at the fair market value of the securities received. Interest income and distributions from the Fidelity Central Funds are accrued as earned. Interest income includes coupon interest and amortization of premium and accretion of discount on debt securities. Investment income is recorded net of foreign taxes withheld where recovery of such taxes is uncertain.
Expenses. Expenses directly attributable to a fund are charged to that fund. Expenses attributable to more than one fund are allocated among the respective funds on the basis of relative net assets or other appropriate methods. Expense estimates are accrued in the period to which they relate and adjustments are made when actual amounts are known.
Income Tax Information and Distributions to Shareholders. Each year, the Fund intends to qualify as a regulated investment company under Subchapter M of the Internal Revenue Code, including distributing substantially all of its taxable income and realized gains. As a result, no provision for income taxes is required. As of July 31, 2012, the Fund did not have any unrecognized tax benefits in the financial statements; nor is the Fund aware of any tax positions for which it is reasonably possible that the total amounts of unrecognized tax benefits will significantly change in the next twelve months. The Fund files a U.S. federal tax return, in addition to state and local tax returns as required. A fund's federal income tax returns are subject to examination by the Internal Revenue Service (IRS) for a period of three fiscal years after they are filed. State and local tax returns may be subject to examination for an additional fiscal year depending on the jurisdiction. Foreign taxes are provided for based on the Fund's understanding of the tax rules and rates that exist in the foreign markets in which it invests.
Distributions are declared and recorded on the ex-dividend date. Income dividends and capital gain distributions are declared separately for each class. Income and capital gain distributions are determined in accordance with income tax regulations, which may differ from GAAP. In addition, the Fund claimed a portion of the payment made to redeeming shareholders as a distribution for income tax purposes.
Capital accounts within the financial statements are adjusted for permanent book-tax differences. These adjustments have no impact on net assets or the results of operations. Temporary book-tax differences will reverse in a subsequent period.
Book-tax differences are primarily due to foreign currency transactions, net operating losses, capital loss carryforwards and losses deferred due to wash sales and excise tax regulations.
Annual Report
Fidelity Advisor Biotechnology Fund
Notes to Financial Statements - continued
3. Significant Accounting Policies - continued
Income Tax Information and Distributions to Shareholders - continued
The federal tax cost of investment securities and unrealized appreciation (depreciation) as of period end were as follows:
Gross unrealized appreciation | $ 39,867,950 |
Gross unrealized depreciation | (8,813,285) |
Net unrealized appreciation (depreciation) on securities and other investments | $ 31,054,665 |
| |
Tax Cost | $ 156,881,265 |
The tax-based components of distributable earnings as of period end were as follows:
Undistributed long-term capital gain | $ 10,398,494 |
Net unrealized appreciation (depreciation) | $ 31,054,665 |
Short-Term Trading (Redemption) Fees. Shares held by investors in the Fund less than 30 days are subject to a redemption fee equal to .75% of the net asset value of shares redeemed. All redemption fees, which reduce the proceeds of the shareholder redemption, are retained by the Fund and accounted for as an addition to paid in capital.
New Accounting Pronouncement. In December 2011, the Financial Accounting Standards Board issued Accounting Standard Update No. 2011-11, Disclosures about Offsetting Assets and Liabilities. The update creates new disclosure requirements requiring entities to disclose both gross and net information for derivatives and other financial instruments that are either offset in the Statement of Assets and Liabilities or subject to an enforceable master netting arrangement or similar agreement. The disclosure requirements are effective for interim and annual reporting periods beginning on or after January 1, 2013. Management is currently evaluating the impact of the update's adoption on the Fund's financial statement disclosures.
4. Operating Policies.
Restricted Securities. The Fund may invest in securities that are subject to legal or contractual restrictions on resale. These securities generally may be resold in transactions exempt from registration or to the public if the securities are registered. Disposal of these securities may involve time-consuming negotiations and expense, and prompt sale at an acceptable price may be difficult. Information regarding restricted securities is included at the end of the Fund's Schedule of Investments.
5. Purchases and Sales of Investments.
Purchases and sales of securities, other than short-term securities, aggregated $133,762,323 and $78,603,407, respectively.
6. Fees and Other Transactions with Affiliates.
Management Fee. FMR and its affiliates provide the Fund with investment management related services for which the Fund pays a monthly management fee. The management fee is the sum of an individual fund fee rate that is based on an annual rate of .30% of the Fund's average net assets and an annualized group fee rate that averaged .26% during the period. The group fee rate is based upon the average net assets of all the mutual funds advised by FMR. The group fee rate decreases as assets under management increase and increases as assets under management decrease. For the period, the total annual management fee rate was .56% of the Fund's average net assets.
Distribution and Service Plan Fees. In accordance with Rule 12b-1 of the 1940 Act, the Fund has adopted separate Distribution and Service Plans for each class of shares. Certain classes pay Fidelity Distributors Corporation (FDC), an affiliate of FMR, separate Distribution and Service Fees, each of which is based on an annual percentage of each class' average net assets. In addition, FDC may pay financial intermediaries for selling shares of the Fund and providing shareholder support services. For the period, the Distribution and Service Fee rates, total fees and amounts retained by FDC were as follows:
| Distribution
Fee | Service
Fee | Total Fees | Retained
by FDC |
Class A | -% | .25% | $ 99,575 | $ 1,513 |
Class T | .25% | .25% | 100,188 | 514 |
Class B | .75% | .25% | 56,537 | 42,419 |
Class C | .75% | .25% | 198,430 | 42,757 |
| | | $ 454,730 | $ 87,203 |
Annual Report
6. Fees and Other Transactions with Affiliates - continued
Sales Load. FDC may receive a front-end sales charge of up to 5.75% for selling Class A shares and 3.50% for selling Class T shares, some of which is paid to financial intermediaries for selling shares of the Fund. Depending on the holding period, FDC may receive contingent deferred sales charges levied on Class A, Class T, Class B, and Class C redemptions. The deferred sales charges range from 5.00% to 1.00% for Class B shares, 1.00% for Class C shares, 1.00% for certain purchases of Class A shares and .25% for certain purchases of Class T shares.
For the period, sales charge amounts retained by FDC were as follows:
| Retained
by FDC |
Class A | $ 69,588 |
Class T | 16,174 |
Class B* | 9,181 |
Class C* | 2,774 |
| $ 97,717 |
* When Class B and Class C shares are initially sold, FDC pays commissions from its own resources to financial intermediaries through which the sales are made.
Transfer Agent Fees. Fidelity Investments Institutional Operations Company, Inc. (FIIOC), an affiliate of FMR, is the transfer, dividend disbursing and shareholder servicing agent for each class of the Fund. FIIOC receives account fees and asset-based fees that vary according to the account size and type of account of the shareholders of the respective classes of the Fund. FIIOC pays for typesetting, printing and mailing of shareholder reports, except proxy statements. For the period, transfer agent fees for each class were as follows:
| Amount | % of
Average
Net Assets |
Class A | $ 117,729 | .30 |
Class T | 66,567 | .33 |
Class B | 17,003 | .30 |
Class C | 55,588 | .28 |
Institutional Class | 21,527 | .22 |
| $ 278,414 | |
Accounting and Security Lending Fees. Fidelity Service Company, Inc. (FSC), an affiliate of FMR, maintains the Fund's accounting records. The accounting fee is based on the level of average net assets for each month. Under a separate contract, FSC administers the security lending program. The security lending fee is based on the number and duration of lending transactions.
Brokerage Commissions. The Fund placed a portion of its portfolio transactions with brokerage firms which are affiliates of the investment adviser. The commissions paid to these affiliated firms were $1,712 for the period.
7. Committed Line of Credit.
The Fund participates with other funds managed by FMR or an affiliate in a $4.25 billion credit facility (the "line of credit") to be utilized for temporary or emergency purposes to fund shareholder redemptions or for other short-term liquidity purposes. The Fund has agreed to pay commitment fees on its pro-rata portion of the line of credit, which amounted to $248 and is reflected in Miscellaneous expenses on the Statement of Operations. During the period, there were no borrowings on this line of credit.
8. Security Lending.
The Fund lends portfolio securities through a lending agent from time to time in order to earn additional income. For equity securities, a lending agent is used and may loan securities to certain qualified borrowers, including Fidelity Capital Markets (FCM), a broker-dealer affiliated with the Fund. On the settlement date of the loan, the Fund receives collateral (in the form of U.S. Treasury obligations, letters of credit and/or cash) against the loaned securities and maintains collateral in an amount not less than 100% of the market value of the loaned securities during the period of the loan. The market value of the loaned securities is determined at the close of business of the Fund and any additional required collateral is delivered to the Fund on the next business day. If the borrower defaults on its obligation to return the securities loaned because of insolvency or other reasons, a fund could experience delays and costs in recovering the securities loaned or in gaining access to the collateral. Any cash collateral received is invested in the Fidelity Securities Lending Cash Central Fund. The value of loaned securities and cash collateral at period end are disclosed on the Fund's Statement of Assets and Liabilities. The value of securities loaned to FCM at period end was $244,641. Security lending income represents the income earned on investing cash collateral, less rebates paid to borrowers and any lending agent fees associated with the loan, plus any premium payments received for lending certain types of securities. Security lending income is presented in the Statement of Operations as a component of income from Fidelity Central Funds, and includes $5,763 from securities loaned to FCM.
Annual Report
Fidelity Advisor Biotechnology Fund
Notes to Financial Statements - continued
9. Expense Reductions.
Many of the brokers with whom FMR places trades on behalf of the Fund provided services to the Fund in addition to trade execution. These services included payments of certain expenses on behalf of the Fund totaling $3,767 for the period.
10. Share Transactions.
Transactions for each class of shares were as follows:
| Shares | Dollars |
Years ended July 31, | 2012 | 2011 | 2012 | 2011 |
Class A | | | | |
Shares sold | 4,301,187 | 1,294,694 | $ 43,628,166 | $ 10,912,748 |
Shares redeemed | (1,928,092) | (838,372) | (17,472,965) | (6,529,914) |
Net increase (decrease) | 2,373,095 | 456,322 | $ 26,155,201 | $ 4,382,834 |
Class T | | | | |
Shares sold | 976,676 | 489,230 | $ 9,361,129 | $ 3,897,385 |
Shares redeemed | (434,679) | (364,605) | (3,953,170) | (2,767,714) |
Net increase (decrease) | 541,997 | 124,625 | $ 5,407,959 | $ 1,129,671 |
Class B | | | | |
Shares sold | 165,361 | 84,075 | $ 1,482,467 | $ 609,091 |
Shares redeemed | (297,605) | (381,301) | (2,590,187) | (2,636,098) |
Net increase (decrease) | (132,244) | (297,226) | $ (1,107,720) | $ (2,027,007) |
Class C | | | | |
Shares sold | 1,520,333 | 539,125 | $ 14,380,183 | $ 4,217,149 |
Shares redeemed | (522,745) | (438,419) | (4,501,065) | (3,130,462) |
Net increase (decrease) | 997,588 | 100,706 | $ 9,879,118 | $ 1,086,687 |
Institutional Class | | | | |
Shares sold | 2,252,478 | 436,761 | $ 24,903,066 | $ 3,719,527 |
Shares redeemed | (710,454) | (225,982) | (7,235,208) | (1,769,416) |
Net increase (decrease) | 1,542,024 | 210,779 | $ 17,667,858 | $ 1,950,111 |
11. Other.
The Fund's organizational documents provide former and current trustees and officers with a limited indemnification against liabilities arising in connection with the performance of their duties to the Fund. In the normal course of business, the Fund may also enter into contracts that provide general indemnifications. The Fund's maximum exposure under these arrangements is unknown as this would be dependent on future claims that may be made against the Fund. The risk of material loss from such claims is considered remote.
Annual Report
Fidelity Advisor Communications Equipment Fund - Class A, T, B, and C
Performance: The Bottom Line
Average annual total return reflects the change in the value of an investment, assuming reinvestment of the class' distributions from dividend income and capital gains (the profits earned upon the sale of securities that have grown in value, if any) and assuming a constant rate of performance each year. The $10,000 table and the fund's returns do not reflect the deduction of taxes that a shareholder would pay on fund distributions or the redemption of fund shares. During periods of reimbursement by Fidelity, a fund's total return will be greater than it would be had the reimbursement not occurred. How a fund did yesterday is no guarantee of how it will do tomorrow. Returns reflect the conversion of Class B shares to Class A shares after a maximum of seven years.
Average Annual Total Returns
Periods ended July 31, 2012 | Past 1
year | Past 5
years | Past 10
years |
Class A (incl. 5.75% sales charge) C | -23.54% | -4.48% | 6.66% |
Class T (incl. 3.50% sales charge) C | -21.90% | -4.27% | 6.64% |
Class B (incl. contingent deferred sales charge)A,C | -23.48% | -4.43% | 6.72% |
Class C (incl. contingent deferred sales charge)B,C | -20.25% | -4.06% | 6.47% |
A Class B shares' contingent deferred sales charges included in the past one year, past five years, and past ten years total return figures are 5%, 2%, and 0%, respectively.
B Class C shares' contingent deferred sales charges included in the past one year, past five years, and past ten years total return figures are 1%, 0%, and 0%, respectively.
C Prior to October 1, 2006, Fidelity Advisor Communications Equipment Fund operated under certain different investment policies. The historical performance for the fund may not represent its current investment policies.
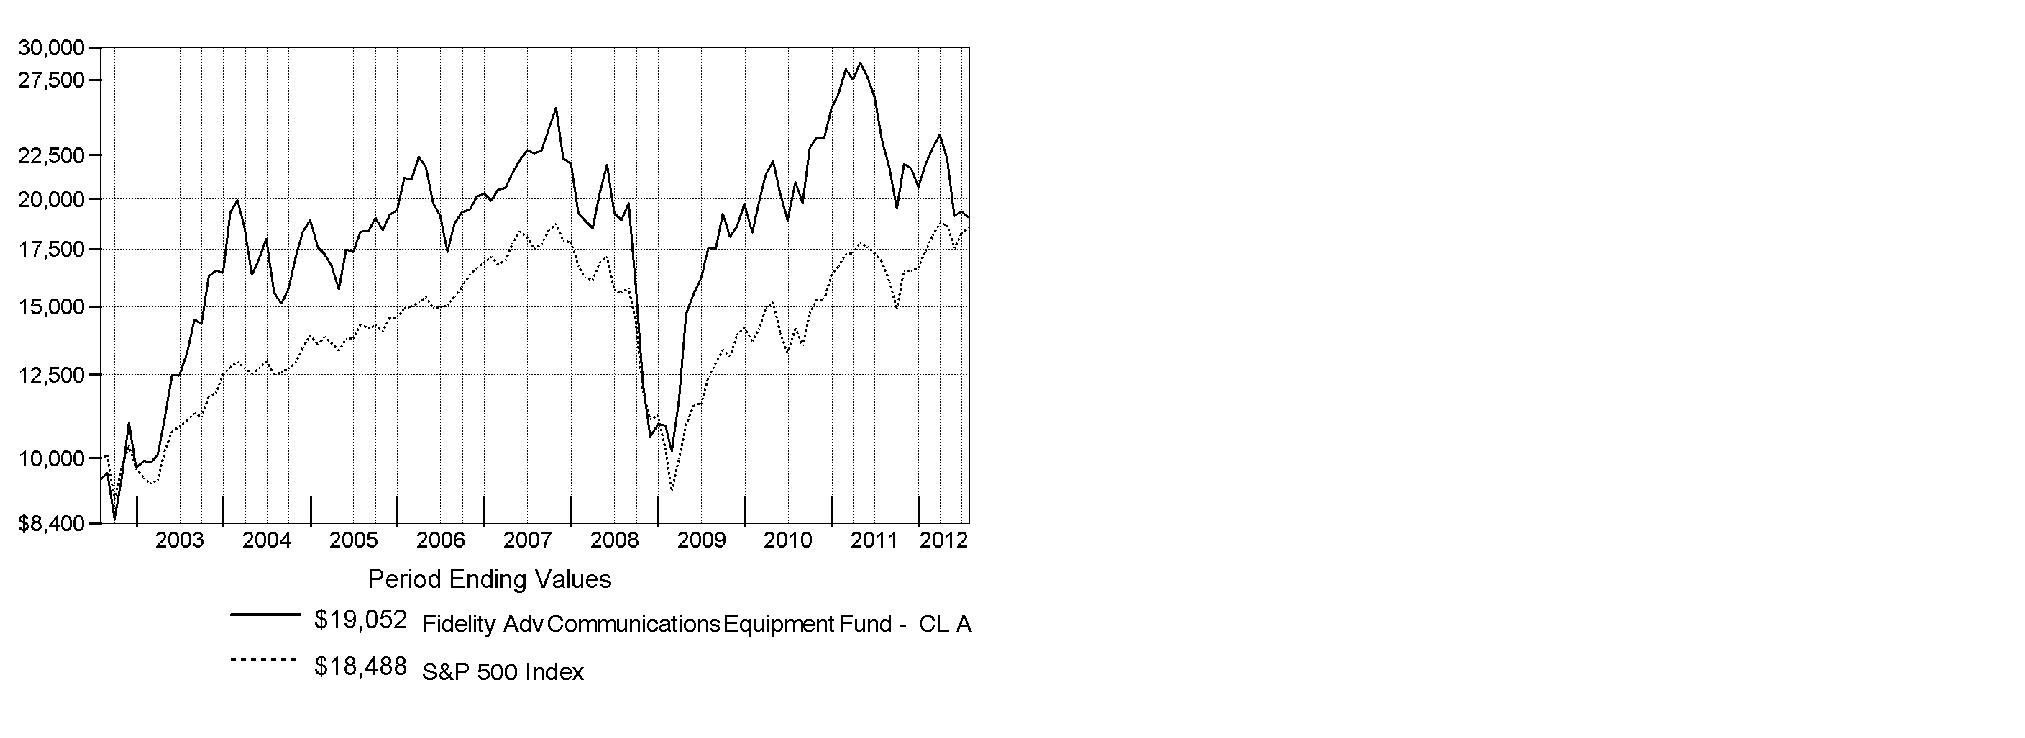
$10,000 Over 10 Years
Let's say hypothetically that $10,000 was invested in Fidelity Advisor Communications Equipment Fund - Class A on July 31, 2002, and the current 5.75% sales charge was paid. The chart shows how the value of your investment would have changed, and also shows how the S&P 500 Index performed over the same period.
Annual Report
Fidelity Advisor Communications Equipment Fund
Market Recap: Major U.S. equity benchmarks posted solid gains for the year ending July 31, 2012, amid an uncertain investment environment. The broad-based S&P 500® Index returned 9.13%, while the blue-chip-laden Dow Jones Industrial AverageSM and technology-heavy Nasdaq Composite® Index gained 10.12% and 7.83%, respectively. Volatility spiked during the period's first half, as equities plummeted late last summer on Europe's debt woes, political wrangling over the U.S. debt ceiling and the sovereign credit-rating downgrade that followed. By October, a seemingly improved U.S. economy rejuvenated stocks, paving the way for major equity benchmarks to post their best first-quarter performance since 1998. However, more eurozone trouble, signs that the U.S. economy had turned sluggish and a slowdown in China caused stocks to slip in May, before a new wave of optimism took hold in June and July. Within the S&P 500®, more-defensive sectors such as telecommunication services (+30%) and consumer staples (+20%) fared best, while materials and energy significantly underperformed, returning -5%. Small- and mid-cap stocks trailed their less-volatile large-cap counterparts, with the Russell 2000® Index adding 0.19% and the Russell Midcap® Index rising 2.28%. Given turmoil and local currency weakness in Europe, foreign developed-markets stocks lost ground, with the MSCI® EAFE® Index returning -11.32%.
Comments from Charlie Chai, Co-Portfolio Manager of Fidelity Advisor® Communications Equipment Fund, and Ali Khan, who became Co-Portfolio Manager on January 12, 2012: For the year, the fund's Class A, Class T, Class B and Class C shares returned -18.88%, -19.06%, -19.56% and -19.47%, respectively (excluding sales charges), considerably trailing the -14.98% return of the S&P® Custom Communications Equipment Index and also lagging the S&P 500®. Versus its industry benchmark, stock selection in communications equipment was responsible for most of the fund's underperformance, while several out-of-benchmark positions in application software also hurt. Noteworthy individual detractors included high-definition videoconferencing equipment provider Polycom. Downwardly revised financial guidance dinged the stock in October 2011 and April 2012. Also hampering results was a sizable out-of-index stake in AsiaInfo-Linkage, a Chinese provider of telecommunications software and technology security products. Here, too, our position was hurt by repeated disappointments in the company's quarterly financial results, and I sold this stock in January. The fund's early-period underweighting in handset maker and index component Motorola Mobility Holdings was counterproductive, given the stock's surge following Google's August 2011 offer to purchase the company. I sold the position to nail down profits. Conversely, out-of-benchmark representation in semiconductors and wireless telecommunication services helped curb the fund's loss. Sizable underexposure to Canadian smartphone maker Research In Motion paid off, as the company continued to lose market share to its competitors. Likewise, a minimal stake in Nokia was the right call, as this former market leader in the handset space struggled with staying competitive.
The views expressed above reflect those of the portfolio manager(s) only through the end of the period as stated on the cover of this report and do not necessarily represent the views of Fidelity or any other person in the Fidelity organization. Any such views are subject to change at any time based upon market or other conditions and Fidelity disclaims any responsibility to update such views. These views may not be relied on as investment advice and, because investment decisions for a Fidelity fund are based on numerous factors, may not be relied on as an indication of trading intent on behalf of any Fidelity fund.
Annual Report
Fidelity Advisor Communications Equipment Fund
As a shareholder of the Fund, you incur two types of costs: (1) transaction costs, including sales charges (loads) on purchase payments or redemption proceeds, redemption fees and (2) ongoing costs, including management fees, distribution and/or service (12b-1) fees and other Fund expenses. This Example is intended to help you understand your ongoing costs (in dollars) of investing in the Fund and to compare these costs with the ongoing costs of investing in other mutual funds.
The Example is based on an investment of $1,000 invested at the beginning of the period and held for the entire period (February 1, 2012 to July 31, 2012).
Actual Expenses
The first line of the accompanying table for each class of the Fund provides information about actual account values and actual expenses. You may use the information in this line, together with the amount you invested, to estimate the expenses that you paid over the period. Simply divide your account value by $1,000.00 (for example, an $8,600 account value divided by $1,000.00 = 8.6), then multiply the result by the number in the first line for a class of the Fund under the heading entitled "Expenses Paid During Period" to estimate the expenses you paid on your account during this period. In addition, the Fund, as a shareholder in the underlying Fidelity Central Funds, will indirectly bear its pro-rata share of the fees and expenses incurred by the underlying Fidelity Central Funds. These fees and expenses are not included in the Fund's annualized expense ratio used to calculate the expense estimate in the table below.
Hypothetical Example for Comparison Purposes
The second line of the accompanying table for each class of the Fund provides information about hypothetical account values and hypothetical expenses based on a Class' actual expense ratio and an assumed rate of return of 5% per year before expenses, which is not the Class' actual return. The hypothetical account values and expenses may not be used to estimate the actual ending account balance or expenses you paid for the period. You may use this information to compare the ongoing costs of investing in the Fund and other funds. To do so, compare this 5% hypothetical example with the 5% hypothetical examples that appear in the shareholder reports of the other funds. In addition, the Fund, as a shareholder in the underlying Fidelity Central Funds, will indirectly bear its pro-rata share of the fees and expenses incurred by the underlying Fidelity Central Funds. These fees and expenses are not included in the Fund's annualized expense ratio used to calculate the expense estimate in the table below.
Please note that the expenses shown in the table are meant to highlight your ongoing costs only and do not reflect any transaction costs. Therefore, the second line of the table is useful in comparing ongoing costs only, and will not help you determine the relative total costs of owning different funds. In addition, if these transactional costs were included, your costs would have been higher.
| Annualized
Expense Ratio | Beginning
Account Value
February 1, 2012 | Ending
Account Value
July 31, 2012 | Expenses Paid
During Period*
February 1, 2012
to July 31, 2012 |
Class A | 1.40% | | | |
Actual | | $ 1,000.00 | $ 867.30 | $ 6.50 |
HypotheticalA | | $ 1,000.00 | $ 1,017.90 | $ 7.02 |
Class T | 1.65% | | | |
Actual | | $ 1,000.00 | $ 866.90 | $ 7.66 |
HypotheticalA | | $ 1,000.00 | $ 1,016.66 | $ 8.27 |
Class B | 2.15% | | | |
Actual | | $ 1,000.00 | $ 864.00 | $ 9.96 |
HypotheticalA | | $ 1,000.00 | $ 1,014.17 | $ 10.77 |
Class C | 2.15% | | | |
Actual | | $ 1,000.00 | $ 865.00 | $ 9.97 |
HypotheticalA | | $ 1,000.00 | $ 1,014.17 | $ 10.77 |
Institutional Class | 1.15% | | | |
Actual | | $ 1,000.00 | $ 868.90 | $ 5.34 |
HypotheticalA | | $ 1,000.00 | $ 1,019.14 | $ 5.77 |
A 5% return per year before expenses
* Expenses are equal to each Class' annualized expense ratio, multiplied by the average account value over the period, multiplied by 182/366 (to reflect the one-half year period).
Annual Report
Fidelity Advisor Communications Equipment Fund
Investment Changes (Unaudited)
Top Ten Stocks as of July 31, 2012 |
| % of fund's
net assets | % of fund's net assets
6 months ago |
QUALCOMM, Inc. | 21.7 | 17.2 |
Cisco Systems, Inc. | 17.1 | 20.5 |
Telefonaktiebolaget LM Ericsson (B Shares) sponsored ADR | 5.5 | 4.9 |
Juniper Networks, Inc. | 4.8 | 4.4 |
Motorola Solutions, Inc. | 3.9 | 3.4 |
Brocade Communications Systems, Inc. | 3.5 | 3.1 |
Riverbed Technology, Inc. | 2.8 | 2.1 |
Polycom, Inc. | 2.6 | 4.1 |
Harris Corp. | 2.2 | 2.5 |
Analog Devices, Inc. | 2.1 | 1.5 |
| 66.2 | |
Top Industries (% of fund's net assets) |
As of July 31, 2012 |
| Communications Equipment | 86.0% | |
| Semiconductors & Semiconductor Equipment | 5.5% | |
| Electronic Equipment & Components | 4.6% | |
| Computers & Peripherals | 0.7% | |
| Software | 0.5% | |
| All Others* | 2.7% | |

As of January 31, 2012 |
| Communications Equipment | 83.7% | |
| Semiconductors & Semiconductor Equipment | 6.4% | |
| Electronic Equipment & Components | 2.5% | |
| Software | 2.4% | |
| Internet Software & Services | 2.2% | |
| All Others* | 2.8% | |

* Includes short-term investments and net other assets. |
Annual Report
Fidelity Advisor Communications Equipment Fund
Investments July 31, 2012
Showing Percentage of Net Assets
Common Stocks - 97.9% |
| Shares | | Value |
COMMUNICATIONS EQUIPMENT - 86.0% |
Communications Equipment - 86.0% |
Acme Packet, Inc. (a)(d) | 8,221 | | $ 130,303 |
ADTRAN, Inc. | 8,900 | | 192,062 |
Alcatel-Lucent SA sponsored ADR (a)(d) | 27,157 | | 29,873 |
Aruba Networks, Inc. (a)(d) | 11,840 | | 167,891 |
Brocade Communications Systems, Inc. (a) | 70,159 | | 348,690 |
Ciena Corp. (a) | 2,100 | | 33,663 |
Cisco Systems, Inc. | 105,824 | | 1,687,893 |
Comtech Telecommunications Corp. | 4,900 | | 133,868 |
Emulex Corp. (a) | 5,300 | | 34,291 |
F5 Networks, Inc. (a) | 1,665 | | 155,478 |
Finisar Corp. (a) | 13,859 | | 172,267 |
Harris Corp. | 5,300 | | 220,745 |
Infinera Corp. (a) | 18,200 | | 100,464 |
InterDigital, Inc. | 3,700 | | 101,010 |
JDS Uniphase Corp. (a) | 8,300 | | 81,672 |
Juniper Networks, Inc. (a) | 26,888 | | 471,347 |
Motorola Solutions, Inc. | 7,847 | | 379,324 |
NETGEAR, Inc. (a) | 5,300 | | 183,539 |
Nokia Corp. sponsored ADR (d) | 82,505 | | 198,837 |
Plantronics, Inc. | 2,600 | | 85,332 |
Polycom, Inc. (a) | 29,799 | | 260,443 |
QUALCOMM, Inc. | 35,781 | | 2,135,410 |
Research In Motion Ltd. (a)(d) | 6,400 | | 45,760 |
Riverbed Technology, Inc. (a) | 15,358 | | 270,915 |
Sycamore Networks, Inc. (a) | 5,400 | | 76,950 |
Telefonaktiebolaget LM Ericsson (B Shares) sponsored ADR (d) | 58,820 | | 544,085 |
ViaSat, Inc. (a) | 4,300 | | 164,690 |
Wi-Lan, Inc. | 12,400 | | 62,937 |
| | 8,469,739 |
COMPUTERS & PERIPHERALS - 0.7% |
Computer Hardware - 0.7% |
Apple, Inc. | 54 | | 32,981 |
Super Micro Computer, Inc. (a) | 2,500 | | 31,025 |
| | 64,006 |
ELECTRICAL EQUIPMENT - 0.3% |
Electrical Components & Equipment - 0.3% |
Prysmian SpA | 2,100 | | 33,771 |
ELECTRONIC EQUIPMENT & COMPONENTS - 4.6% |
Electronic Components - 0.6% |
Vishay Intertechnology, Inc. (a) | 5,900 | | 58,233 |
Electronic Manufacturing Services - 4.0% |
Fabrinet (a) | 3,700 | | 49,136 |
Flextronics International Ltd. (a) | 25,000 | | 160,250 |
TE Connectivity Ltd. | 5,500 | | 181,555 |
| | 390,941 |
TOTAL ELECTRONIC EQUIPMENT & COMPONENTS | | 449,174 |
|
| Shares | | Value |
MEDIA - 0.3% |
Advertising - 0.3% |
Digital Generation, Inc. (a) | 3,200 | | $ 34,112 |
SEMICONDUCTORS & SEMICONDUCTOR EQUIPMENT - 5.5% |
Semiconductor Equipment - 0.7% |
ASML Holding NV | 1,200 | | 69,000 |
Semiconductors - 4.8% |
Altera Corp. | 3,200 | | 113,440 |
Analog Devices, Inc. | 5,200 | | 203,216 |
GSI Technology, Inc. (a) | 14,600 | | 69,934 |
ON Semiconductor Corp. (a) | 5,200 | | 36,088 |
Texas Instruments, Inc. | 1,900 | | 51,756 |
| | 474,434 |
TOTAL SEMICONDUCTORS & SEMICONDUCTOR EQUIPMENT | | 543,434 |
SOFTWARE - 0.5% |
Application Software - 0.2% |
BroadSoft, Inc. (a)(d) | 900 | | 22,095 |
Systems Software - 0.3% |
Allot Communications Ltd. (a) | 1,000 | | 24,580 |
TOTAL SOFTWARE | | 46,675 |
TOTAL COMMON STOCKS (Cost $11,040,516) |
9,640,911
|
Money Market Funds - 9.6% |
| | | |
Fidelity Cash Central Fund, 0.17% (b) | 64,744 | | 64,744 |
Fidelity Securities Lending Cash Central Fund, 0.18% (b)(c) | 879,850 | | 879,850 |
TOTAL MONEY MARKET FUNDS (Cost $944,594) |
944,594
|
TOTAL INVESTMENT PORTFOLIO - 107.5% (Cost $11,985,110) | | 10,585,505 |
NET OTHER ASSETS (LIABILITIES) - (7.5)% | | (741,969) |
NET ASSETS - 100% | $ 9,843,536 |
Legend |
(a) Non-income producing |
(b) Affiliated fund that is available only to investment companies and other accounts managed by Fidelity Investments. The rate quoted is the annualized seven-day yield of the fund at period end. A complete unaudited listing of the fund's holdings as of its most recent quarter end is available upon request. In addition, each Fidelity Central Fund's financial statements, which are not covered by the Fund's Report of Independent Registered Public Accounting Firm, are available on the SEC's website or upon request. |
(c) Investment made with cash collateral received from securities on loan. |
(d) Security or a portion of the security is on loan at period end. |
Affiliated Central Funds |
Information regarding fiscal year to date income earned by the Fund from investments in Fidelity Central Funds is as follows: |
Fund | Income earned |
Fidelity Cash Central Fund | $ 332 |
Fidelity Securities Lending Cash Central Fund | 32,119 |
Total | $ 32,451 |
Other Information |
All investments are categorized as Level 1 under the Fair Value Hierarchy. The inputs or methodology used for valuing securities may not be an indication of the risk associated with investing in those securities. For more information on valuation inputs, please refer to the Security Valuation section in the accompanying Notes to Financial Statements. |
Distribution of investments by country or territory of incorporation, as a percentage of total net assets, is as follows. (Unaudited) |
United States of America | 85.8% |
Sweden | 5.5% |
Finland | 2.0% |
Switzerland | 1.9% |
Singapore | 1.6% |
Canada | 1.1% |
Others (Individually Less Than 1%) | 2.1% |
| 100.0% |
See accompanying notes which are an integral part of the financial statements.
Annual Report
Fidelity Advisor Communications Equipment Fund
Statement of Assets and Liabilities
| July 31, 2012 |
| | |
Assets | | |
Investment in securities, at value (including securities loaned of $873,114) - See accompanying schedule: Unaffiliated issuers (cost $11,040,516) | $ 9,640,911 | |
Fidelity Central Funds (cost $944,594) | 944,594 | |
Total Investments (cost $11,985,110) | | $ 10,585,505 |
Receivable for investments sold | | 148,965 |
Receivable for fund shares sold | | 1,572 |
Dividends receivable | | 2,472 |
Distributions receivable from Fidelity Central Funds | | 220 |
Receivable from investment adviser for expense reductions | | 2,418 |
Other receivables | | 53,295 |
Total assets | | 10,794,447 |
| | |
Liabilities | | |
Payable for investments purchased | $ 10,390 | |
Payable for fund shares redeemed | 13,746 | |
Accrued management fee | 4,556 | |
Distribution and service plan fees payable | 4,165 | |
Other affiliated payables | 2,938 | |
Other payables and accrued expenses | 35,266 | |
Collateral on securities loaned, at value | 879,850 | |
Total liabilities | | 950,911 |
| | |
Net Assets | | $ 9,843,536 |
Net Assets consist of: | | |
Paid in capital | | $ 13,003,035 |
Accumulated net investment loss | | (10,185) |
Accumulated undistributed net realized gain (loss) on investments and foreign currency transactions | | (1,749,709) |
Net unrealized appreciation (depreciation) on investments | | (1,399,605) |
Net Assets | | $ 9,843,536 |
Statement of Assets and Liabilities - continued
| July 31, 2012 |
| | |
Calculation of Maximum Offering Price Class A:
Net Asset Value and redemption price per share ($3,567,813 ÷ 462,689 shares) | | $ 7.71 |
| | |
Maximum offering price per share (100/94.25 of $7.71) | | $ 8.18 |
Class T:
Net Asset Value and redemption price per share ($2,842,784 ÷ 379,670 shares) | | $ 7.49 |
| | |
Maximum offering price per share (100/96.50 of $7.49) | | $ 7.76 |
Class B:
Net Asset Value and offering price per share ($569,752 ÷ 80,796 shares)A | | $ 7.05 |
| | |
Class C:
Net Asset Value and offering price per share ($2,142,039 ÷ 303,902 shares)A | | $ 7.05 |
| | |
Institutional Class:
Net Asset Value, offering price and redemption price per share ($721,148 ÷ 90,745 shares) | | $ 7.95 |
A Redemption price per share is equal to net asset value less any applicable contingent deferred sales charge.
See accompanying notes which are an integral part of the financial statements.
Annual Report
Statement of Operations
| Year ended July 31, 2012 |
| | |
Investment Income | | |
Dividends | | $ 134,337 |
Interest | | 22 |
Income from Fidelity Central Funds (including $32,119 from security lending) | | 32,451 |
Total income | | 166,810 |
| | |
Expenses | | |
Management fee | $ 75,608 | |
Transfer agent fees | 43,466 | |
Distribution and service plan fees | 69,611 | |
Accounting and security lending fees | 5,469 | |
Custodian fees and expenses | 8,977 | |
Independent trustees' compensation | 97 | |
Registration fees | 53,919 | |
Audit | 46,230 | |
Legal | 70 | |
Miscellaneous | 200 | |
Total expenses before reductions | 303,647 | |
Expense reductions | (79,648) | 223,999 |
Net investment income (loss) | | (57,189) |
Realized and Unrealized Gain (Loss) Net realized gain (loss) on: | | |
Investment securities: | | |
Unaffiliated issuers | (1,571,442) | |
Foreign currency transactions | (537) | |
Total net realized gain (loss) | | (1,571,979) |
Change in net unrealized appreciation (depreciation) on investment securities | | (2,005,379) |
Net gain (loss) | | (3,577,358) |
Net increase (decrease) in net assets resulting from operations | | $ (3,634,547) |
Statement of Changes in Net Assets
| Year ended
July 31,
2012 | Year ended
July 31,
2011 |
Increase (Decrease) in Net Assets | | |
Operations | | |
Net investment income (loss) | $ (57,189) | $ (190,541) |
Net realized gain (loss) | (1,571,979) | 1,590,280 |
Change in net unrealized appreciation (depreciation) | (2,005,379) | (1,230,510) |
Net increase (decrease) in net assets resulting from operations | (3,634,547) | 169,229 |
Distributions to shareholders from net realized gain | (401,208) | - |
Share transactions - net increase (decrease) | (9,551,912) | 8,972,466 |
Redemption fees | 639 | 1,851 |
Total increase (decrease) in net assets | (13,587,028) | 9,143,546 |
| | |
Net Assets | | |
Beginning of period | 23,430,564 | 14,287,018 |
End of period (including accumulated net investment loss of $10,185 and accumulated net investment loss of $2,793, respectively) | $ 9,843,536 | $ 23,430,564 |
See accompanying notes which are an integral part of the financial statements.
Annual Report
Financial Highlights - Class A
Years ended July 31, | 2012 | 2011 | 2010 | 2009 | 2008 |
Selected Per-Share Data | | | | | |
Net asset value, beginning of period | $ 9.73 | $ 8.67 | $ 7.28 | $ 7.82 | $ 9.49 |
Income from Investment Operations | | | | | |
Net investment income (loss) C | (.01) | (.06) | (.11) | .02 F | (.08) |
Net realized and unrealized gain (loss) | (1.81) | 1.12 | 1.50 | (.56) | (1.45) |
Total from investment operations | (1.82) | 1.06 | 1.39 | (.54) | (1.53) |
Distributions from net realized gain | (.20) | - | - | - | (.14) |
Redemption fees added to paid in capital C, H | - | - | - | - | - |
Net asset value, end of period | $ 7.71 | $ 9.73 | $ 8.67 | $ 7.28 | $ 7.82 |
Total Return A, B | (18.88)% | 12.23% | 19.09% | (6.91)% | (16.43)% |
Ratios to Average Net Assets D, G | | | | | |
Expenses before reductions | 1.96% | 1.64% | 1.90% | 3.15% | 2.25% |
Expenses net of fee waivers, if any | 1.40% | 1.40% | 1.40% | 1.40% | 1.40% |
Expenses net of all reductions | 1.39% | 1.39% | 1.38% | 1.40% | 1.39% |
Net investment income (loss) | (.16)% | (.60)% | (1.32)% | .26% F | (.91)% |
Supplemental Data | | | | | |
Net assets, end of period (000 omitted) | $ 3,568 | $ 8,787 | $ 4,860 | $ 3,476 | $ 2,459 |
Portfolio turnover rate E | 79% | 101% | 106% | 97% | 63% |
A Total returns would have been lower if certain expenses had not been reduced during the applicable periods shown.
B Total returns do not include the effect of the sales charges.
C Calculated based on average shares outstanding during the period.
D Fees and expenses of any underlying Fidelity Central Funds are not included in the Fund's expense ratio. The Fund indirectly bears its proportionate share of the expenses of any underlying Fidelity Central Funds.
E Amount does not include the portfolio activity of any underlying Fidelity Central Funds.
F Investment income per share reflects a large, non-recurring dividend which amounted to $.07 per share. Excluding this non-recurring dividend, the ratio of net investment income (loss) to average net assets would have been (.88)%.
G Expense ratios reflect operating expenses of the class. Expenses before reductions do not reflect amounts reimbursed by the investment adviser or reductions from brokerage service arrangements or reductions from other expense offset arrangements and do not represent the amount paid by the class during periods when reimbursements or reductions occur. Expenses net of fee waivers reflect expenses after reimbursement by the investment adviser but prior to reductions from brokerage service arrangements or other expense offset arrangements. Expenses net of all reductions represent the net expenses paid by the class.
H Amount represents less than $.01 per share.
Financial Highlights - Class T
Years ended July 31, | 2012 | 2011 | 2010 | 2009 | 2008 |
Selected Per-Share Data | | | | | |
Net asset value, beginning of period | $ 9.48 | $ 8.46 | $ 7.13 | $ 7.68 | $ 9.34 |
Income from Investment Operations | | | | | |
Net investment income (loss) C | (.03) | (.09) | (.13) | - F, H | (.10) |
Net realized and unrealized gain (loss) | (1.76) | 1.11 | 1.46 | (.55) | (1.42) |
Total from investment operations | (1.79) | 1.02 | 1.33 | (.55) | (1.52) |
Distributions from net realized gain | (.20) | - | - | - | (.14) |
Redemption fees added to paid in capital C, H | - | - | - | - | - |
Net asset value, end of period | $ 7.49 | $ 9.48 | $ 8.46 | $ 7.13 | $ 7.68 |
Total Return A, B | (19.06)% | 12.06% | 18.65% | (7.16)% | (16.59)% |
Ratios to Average Net Assets D, G | | | | | |
Expenses before reductions | 2.27% | 1.97% | 2.20% | 3.52% | 2.62% |
Expenses net of fee waivers, if any | 1.65% | 1.65% | 1.65% | 1.65% | 1.65% |
Expenses net of all reductions | 1.64% | 1.64% | 1.63% | 1.65% | 1.65% |
Net investment income (loss) | (.41)% | (.85)% | (1.57)% | .01% F | (1.16)% |
Supplemental Data | | | | | |
Net assets, end of period (000 omitted) | $ 2,843 | $ 4,607 | $ 3,273 | $ 2,396 | $ 2,138 |
Portfolio turnover rate E | 79% | 101% | 106% | 97% | 63% |
A Total returns would have been lower if certain expenses had not been reduced during the applicable periods shown.
B Total returns do not include the effect of the sales charges.
C Calculated based on average shares outstanding during the period.
D Fees and expenses of any underlying Fidelity Central Funds are not included in the Fund's expense ratio. The Fund indirectly bears its proportionate share of the expenses of any underlying Fidelity Central Funds.
E Amount does not include the portfolio activity of any underlying Fidelity Central Funds.
F Investment income per share reflects a large, non-recurring dividend which amounted to $.06 per share. Excluding this non-recurring dividend, the ratio of net investment income (loss) to average net assets would have been (1.13)%.
G Expense ratios reflect operating expenses of the class. Expenses before reductions do not reflect amounts reimbursed by the investment adviser or reductions from brokerage service arrangements or reductions from other expense offset arrangements and do not represent the amount paid by the class during periods when reimbursements or reductions occur. Expenses net of fee waivers reflect expenses after reimbursement by the investment adviser but prior to reductions from brokerage service arrangements or other expense offset arrangements. Expenses net of all reductions represent the net expenses paid by the class.
H Amount represents less than $.01 per share.
See accompanying notes which are an integral part of the financial statements.
Annual Report
Financial Highlights - Class B
Years ended July 31, | 2012 | 2011 | 2010 | 2009 | 2008 |
Selected Per-Share Data | | | | | |
Net asset value, beginning of period | $ 8.99 | $ 8.06 | $ 6.83 | $ 7.39 | $ 9.03 |
Income from Investment Operations | | | | | |
Net investment income (loss) C | (.07) | (.13) | (.16) | (.03) F | (.14) |
Net realized and unrealized gain (loss) | (1.67) | 1.06 | 1.39 | (.53) | (1.36) |
Total from investment operations | (1.74) | .93 | 1.23 | (.56) | (1.50) |
Distributions from net realized gain | (.20) | - | - | - | (.14) |
Redemption fees added to paid in capital C, H | - | - | - | - | - |
Net asset value, end of period | $ 7.05 | $ 8.99 | $ 8.06 | $ 6.83 | $ 7.39 |
Total Return A, B | (19.56)% | 11.54% | 18.01% | (7.58)% | (16.94)% |
Ratios to Average Net Assets D, G | | | | | |
Expenses before reductions | 2.71% | 2.47% | 2.68% | 3.98% | 3.03% |
Expenses net of fee waivers, if any | 2.15% | 2.15% | 2.15% | 2.15% | 2.15% |
Expenses net of all reductions | 2.13% | 2.14% | 2.13% | 2.15% | 2.15% |
Net investment income (loss) | (.91)% | (1.35)% | (2.07)% | (.49)% F | (1.67)% |
Supplemental Data | | | | | |
Net assets, end of period (000 omitted) | $ 570 | $ 1,316 | $ 1,408 | $ 1,281 | $ 1,219 |
Portfolio turnover rate E | 79% | 101% | 106% | 97% | 63% |
A Total returns would have been lower if certain expenses had not been reduced during the applicable periods shown.
B Total returns do not include the effect of the contingent deferred sales charge.
C Calculated based on average shares outstanding during the period.
D Fees and expenses of any underlying Fidelity Central Funds are not included in the Fund's expense ratio. The Fund indirectly bears its proportionate share of the expenses of any underlying Fidelity Central Funds.
E Amount does not include the portfolio activity of any underlying Fidelity Central Funds.
F Investment income per share reflects a large, non-recurring dividend which amounted to $.06 per share. Excluding this non-recurring dividend, the ratio of net investment income (loss) to average net assets would have been (1.63)%.
G Expense ratios reflect operating expenses of the class. Expenses before reductions do not reflect amounts reimbursed by the investment adviser or reductions from brokerage service arrangements or reductions from other expense offset arrangements and do not represent the amount paid by the class during periods when reimbursements or reductions occur. Expenses net of fee waivers reflect expenses after reimbursement by the investment adviser but prior to reductions from brokerage service arrangements or other expense offset arrangements. Expenses net of all reductions represent the net expenses paid by the class.
H Amount represents less than $.01 per share.
Financial Highlights - Class C
Years ended July 31, | 2012 | 2011 | 2010 | 2009 | 2008 |
Selected Per-Share Data | | | | | |
Net asset value, beginning of period | $ 8.98 | $ 8.06 | $ 6.82 | $ 7.38 | $ 9.03 |
Income from Investment Operations | | | | | |
Net investment income (loss) C | (.07) | (.13) | (.16) | (.03) F | (.14) |
Net realized and unrealized gain (loss) | (1.66) | 1.05 | 1.40 | (.53) | (1.37) |
Total from investment operations | (1.73) | .92 | 1.24 | (.56) | (1.51) |
Distributions from net realized gain | (.20) | - | - | - | (.14) |
Redemption fees added to paid in capital C, H | - | - | - | - | - |
Net asset value, end of period | $ 7.05 | $ 8.98 | $ 8.06 | $ 6.82 | $ 7.38 |
Total Return A, B | (19.47)% | 11.41% | 18.18% | (7.59)% | (17.06)% |
Ratios to Average Net Assets D, G | | | | | |
Expenses before reductions | 2.71% | 2.40% | 2.67% | 3.63% | 3.02% |
Expenses net of fee waivers, if any | 2.15% | 2.15% | 2.15% | 2.15% | 2.15% |
Expenses net of all reductions | 2.14% | 2.14% | 2.13% | 2.15% | 2.15% |
Net investment income (loss) | (.91)% | (1.35)% | (2.07)% | (.49)% F | (1.67)% |
Supplemental Data | | | | | |
Net assets, end of period (000 omitted) | $ 2,142 | $ 5,866 | $ 3,029 | $ 2,792 | $ 1,097 |
Portfolio turnover rate E | 79% | 101% | 106% | 97% | 63% |
A Total returns would have been lower if certain expenses had not been reduced during the applicable periods shown.
B Total returns do not include the effect of the contingent deferred sales charge.
C Calculated based on average shares outstanding during the period.
D Fees and expenses of any underlying Fidelity Central Funds are not included in the Fund's expense ratio. The Fund indirectly bears its proportionate share of the expenses of any underlying Fidelity Central Funds.
E Amount does not include the portfolio activity of any underlying Fidelity Central Funds.
F Investment income per share reflects a large, non-recurring dividend which amounted to $.06 per share. Excluding this non-recurring dividend, the ratio of net investment income (loss) to average net assets would have been (1.63)%.
G Expense ratios reflect operating expenses of the class. Expenses before reductions do not reflect amounts reimbursed by the investment adviser or reductions from brokerage service arrangements or reductions from other expense offset arrangements and do not represent the amount paid by the class during periods when reimbursements or reductions occur. Expenses net of fee waivers reflect expenses after reimbursement by the investment adviser but prior to reductions from brokerage service arrangements or other expense offset arrangements. Expenses net of all reductions represent the net expenses paid by the class.
H Amount represents less than $.01 per share.
See accompanying notes which are an integral part of the financial statements.
Annual Report
Financial Highlights - Institutional Class
Years ended July 31, | 2012 | 2011 | 2010 | 2009 | 2008 |
Selected Per-Share Data | | | | | |
Net asset value, beginning of period | $ 10.00 | $ 8.88 | $ 7.45 | $ 7.98 | $ 9.65 |
Income from Investment Operations | | | | | |
Net investment income (loss) B | .01 | (.04) | (.09) | .03 E | (.06) |
Net realized and unrealized gain (loss) | (1.86) | 1.16 | 1.52 | (.56) | (1.47) |
Total from investment operations | (1.85) | 1.12 | 1.43 | (.53) | (1.53) |
Distributions from net realized gain | (.20) | - | - | - | (.14) |
Redemption fees added to paid in capital B, G | - | - | - | - | - |
Net asset value, end of period | $ 7.95 | $ 10.00 | $ 8.88 | $ 7.45 | $ 7.98 |
Total Return A | (18.66)% | 12.61% | 19.19% | (6.64)% | (16.16)% |
Ratios to Average Net Assets C, F | | | | | |
Expenses before reductions | 1.66% | 1.22% | 1.54% | 2.44% | 1.94% |
Expenses net of fee waivers, if any | 1.15% | 1.15% | 1.15% | 1.15% | 1.15% |
Expenses net of all reductions | 1.13% | 1.14% | 1.13% | 1.15% | 1.14% |
Net investment income (loss) | .10% | (.35)% | (1.07)% | .51% E | (.66)% |
Supplemental Data | | | | | |
Net assets, end of period (000 omitted) | $ 721 | $ 2,855 | $ 1,717 | $ 957 | $ 229 |
Portfolio turnover rate D | 79% | 101% | 106% | 97% | 63% |
A Total returns would have been lower if certain expenses had not been reduced during the applicable periods shown.
B Calculated based on average shares outstanding during the period.
C Fees and expenses of any underlying Fidelity Central Funds are not included in the Fund's expense ratio. The Fund indirectly bears its proportionate share of the expenses of any underlying Fidelity Central Funds.
D Amount does not include the portfolio activity of any underlying Fidelity Central Funds.
E Investment income per share reflects a large, non-recurring dividend which amounted to $.07 per share. Excluding this non-recurring dividend, the ratio of net investment income (loss) to average net assets would have been (.63)%.
F Expense ratios reflect operating expenses of the class. Expenses before reductions do not reflect amounts reimbursed by the investment adviser or reductions from brokerage service arrangements or reductions from other expense offset arrangements and do not represent the amount paid by the class during periods when reimbursements or reductions occur. Expenses net of fee waivers reflect expenses after reimbursement by the investment adviser but prior to reductions from brokerage service arrangements or other expense offset arrangements. Expenses net of all reductions represent the net expenses paid by the class.
G Amount represents less than $.01 per share.
See accompanying notes which are an integral part of the financial statements.
Annual Report
Fidelity Advisor Communications Equipment Fund
Notes to Financial Statements
For the period ended July 31, 2012
1. Organization.
Fidelity Advisor Communications Equipment Fund (the Fund) is a non-diversified fund of Fidelity Advisor Series VII (the Trust) and is authorized to issue an unlimited number of shares. The Trust is registered under the Investment Company Act of 1940, as amended (the 1940 Act), as an open-end management investment company organized as a Massachusetts business trust. The Fund offers Class A, Class T, Class C and Institutional Class shares, each of which, along with Class B shares, has equal rights as to assets and voting privileges. Effective after the close of business on September 1, 2010, Class B shares were closed to new accounts and additional purchases, except for exchanges and reinvestments. Each class has exclusive voting rights with respect to matters that affect that class. Class B shares will automatically convert to Class A shares after a holding period of seven years from the initial date of purchase. Investment income, realized and unrealized capital gains and losses, the common expenses of the Fund, and certain fund-level expense reductions, if any, are allocated on a pro-rata basis to each class based on the relative net assets of each class to the total net assets of the Fund. Each class differs with respect to transfer agent and distribution and service plan fees incurred. Certain expense reductions may also differ by class.
2. Investments in Fidelity Central Funds.
The Fund invests in Fidelity Central Funds, which are open-end investment companies available only to other investment companies and accounts managed by Fidelity Management & Research Company (FMR) and its affiliates. The Fund's Schedule of Investments lists each of the Fidelity Central Funds held as of period end, if any, as an investment of the Fund, but does not include the underlying holdings of each Fidelity Central Fund. As an Investing Fund, the Fund indirectly bears its proportionate share of the expenses of the underlying Fidelity Central Funds.
The Money Market Central Funds seek preservation of capital and current income and are managed by Fidelity Investments Money Management, Inc. (FIMM), an affiliate of FMR.
A complete unaudited list of holdings for each Fidelity Central Fund is available upon request or at the Securities and Exchange Commission (the SEC) web site at www.sec.gov. In addition, the financial statements of the Fidelity Central Funds, which are not covered by the Fund's Report of Independent Registered Public Accounting Firm, are available on the SEC web site or upon request.
3. Significant Accounting Policies.
The financial statements have been prepared in conformity with accounting principles generally accepted in the United States of America (GAAP), which require management to make certain estimates and assumptions at the date of the financial statements. Actual results could differ from those estimates. Subsequent events, if any, through the date that the financial statements were issued have been evaluated in the preparation of the financial statements. The following summarizes the significant accounting policies of the Fund:
Security Valuation. Investments are valued as of 4:00 p.m. Eastern time on the last calendar day of the period. In accordance with valuation policies and procedures approved by the Board of Trustees (the Board), the Fund attempts to obtain prices from one or more third party pricing vendor or broker to value its investments. When current market prices, quotations or rates are not readily available or reliable, securities will be fair valued in good faith by the FMR Fair Value Committee (the Committee), in accordance with procedures adopted by the Fund's Board. Factors used in determining fair value vary by security type and may include market or security specific events. The frequency with which these procedures are used cannot be predicted and they may be utilized to a significant extent. The Committee oversees the Fund's valuation policies and procedures and is responsible for approving and reporting to the Board all fair value determinations.
The Fund categorizes the inputs to valuation techniques used to value its investments into a disclosure hierarchy consisting of three levels as shown below:
Level 1 - quoted prices in active markets for identical investments
Level 2 - other significant observable inputs (including quoted prices for similar investments, interest rates, prepayment speeds, etc.)
Level 3 - unobservable inputs (including the Fund's own assumptions based on the best information available)
Valuation techniques used to value the Fund's investments by major category are as follows:
Equity securities, including restricted securities, for which market quotations are readily available, are valued at the last reported sale price or official closing price as reported by a third party pricing vendor on the primary market or exchange on which they are traded and are categorized as Level 1 in the hierarchy. In the event there were no sales during the day or closing prices are not available, securities are valued at the last quoted bid price or may be valued using the last available price and are generally categorized as Level 2 in the hierarchy. For foreign equity securities, when significant market or security specific events arise, comparisons to the valuation of American Depositary Receipts (ADRs), futures contracts, Exchange-Traded Funds (ETFs) and certain indexes as well as quoted prices for similar securities are used and are categorized as Level 2 in the hierarchy. Utilizing these techniques may result in transfers between Level 1 and Level 2.
Annual Report
Fidelity Advisor Communications Equipment Fund
Notes to Financial Statements - continued
3. Significant Accounting Policies - continued
Security Valuation - continued
Investments in open-end mutual funds, including the Fidelity Central Funds, are valued at their closing net asset value each business day and are categorized as Level 1 in the hierarchy.
Changes in valuation techniques may result in transfers in or out of an assigned level within the disclosure hierarchy.
Foreign Currency Translation. The Fund may use foreign currency contracts to facilitate transactions in foreign-denominated securities. Gains and losses from these transactions may arise from changes in the value of the foreign currency or if the counterparties do not perform under the contracts' terms.
Foreign-denominated assets, including investment securities, and liabilities are translated into U.S. dollars at the exchange rates at period end. Purchases and sales of investment securities, income and dividends received and expenses denominated in foreign currencies are translated into U.S. dollars at the exchange rate in effect on the transaction date.
The effects of exchange rate fluctuations on investments are included with the net realized and unrealized gain (loss) on investment securities. Other foreign currency transactions resulting in realized and unrealized gain (loss) are disclosed separately.
Investment Transactions and Income. For financial reporting purposes, the Fund's investment holdings and NAV include trades executed through the end of the last business day of the period. The NAV per share for processing shareholder transactions is calculated as of the close of business of the New York Stock Exchange (NYSE), normally 4:00 p.m. Eastern time and includes trades executed through the end of the prior business day. Gains and losses on securities sold are determined on the basis of identified cost and may include proceeds received from litigation. Dividend income is recorded on the ex-dividend date, except for certain dividends from foreign securities where the ex-dividend date may have passed, which are recorded as soon as the Fund is informed of the ex-dividend date. Non-cash dividends included in dividend income, if any, are recorded at the fair market value of the securities received. Distributions received on securities that represent a return of capital or capital gain are recorded as a reduction of cost of investments and/or as a realized gain. The Fund estimates the components of distributions received that may be considered return of capital distributions or capital gain distributions. Interest income and distributions from the Fidelity Central Funds are accrued as earned. Interest income includes coupon interest and amortization of premium and accretion of discount on debt securities. Investment income is recorded net of foreign taxes withheld where recovery of such taxes is uncertain.
Expenses. Expenses directly attributable to a fund are charged to that fund. Expenses attributable to more than one fund are allocated among the respective funds on the basis of relative net assets or other appropriate methods. Expense estimates are accrued in the period to which they relate and adjustments are made when actual amounts are known.
Income Tax Information and Distributions to Shareholders. Each year, the Fund intends to qualify as a regulated investment company under Subchapter M of the Internal Revenue Code, including distributing substantially all of its taxable income and realized gains. As a result, no provision for income taxes is required. As of July 31, 2012, the Fund did not have any unrecognized tax benefits in the financial statements; nor is the Fund aware of any tax positions for which it is reasonably possible that the total amounts of unrecognized tax benefits will significantly change in the next twelve months. The Fund files a U.S. federal tax return, in addition to state and local tax returns as required. A fund's federal income tax returns are subject to examination by the Internal Revenue Service (IRS) for a period of three fiscal years after they are filed. State and local tax returns may be subject to examination for an additional fiscal year depending on the jurisdiction. Foreign taxes are provided for based on the Fund's understanding of the tax rules and rates that exist in the foreign markets in which it invests.
Distributions are declared and recorded on the ex-dividend date. Income dividends and capital gain distributions are declared separately for each class. Income and capital gain distributions are determined in accordance with income tax regulations, which may differ from GAAP.
Capital accounts within the financial statements are adjusted for permanent book-tax differences. These adjustments have no impact on net assets or the results of operations. Temporary book-tax differences will reverse in a subsequent period.
Book-tax differences are primarily due to foreign currency transactions, net operating losses, capital loss carryforwards and losses deferred due to wash sales and excise tax regulations.
The federal tax cost of investment securities and unrealized appreciation (depreciation) as of period end were as follows:
Gross unrealized appreciation | $ 578,798 |
Gross unrealized depreciation | (2,193,931) |
Net unrealized appreciation (depreciation) on securities and other investments | $ (1,615,133) |
| |
Tax Cost | $ 12,200,638 |
Annual Report
3. Significant Accounting Policies - continued
Income Tax Information and Distributions to Shareholders - continued
The tax-based components of distributable earnings as of period end were as follows:
Capital loss carryforward | $ (1,534,182) |
Net unrealized appreciation (depreciation) | $ (1,615,133) |
Capital loss carryforwards are only available to offset future capital gains of the Fund to the extent provided by regulations and may be limited. Under the Regulated Investment Company Modernization Act of 2010 (the Act), the Fund is permitted to carry forward capital losses incurred in taxable years beginning after December 22, 2010 for an unlimited period and such capital losses are required to be used prior to any losses that expire. Capital loss carryforwards were as follows:
No expiration | |
Short-term | $ (1,534,182) |
The tax character of distributions paid was as follows:
| July 31, 2012 | July 31, 2011 |
Long-term Capital Gains | $ 401,208 | $ - |
Short-Term Trading (Redemption) Fees. Shares held by investors in the Fund less than 30 days are subject to a redemption fee equal to .75% of the net asset value of shares redeemed. All redemption fees, which reduce the proceeds of the shareholder redemption, are retained by the Fund and accounted for as an addition to paid in capital.
New Accounting Pronouncement. In December 2011, the Financial Accounting Standards Board issued Accounting Standard Update No. 2011-11, Disclosures about Offsetting Assets and Liabilities. The update creates new disclosure requirements requiring entities to disclose both gross and net information for derivatives and other financial instruments that are either offset in the Statement of Assets and Liabilities or subject to an enforceable master netting arrangement or similar agreement. The disclosure requirements are effective for interim and annual reporting periods beginning on or after January 1, 2013. Management is currently evaluating the impact of the update's adoption on the Fund's financial statement disclosures.
4. Purchases and Sales of Investments.
Purchases and sales of securities, other than short-term securities, aggregated $10,794,252 and $20,314,263, respectively.
5. Fees and Other Transactions with Affiliates.
Management Fee. FMR and its affiliates provide the Fund with investment management related services for which the Fund pays a monthly management fee. The management fee is the sum of an individual fund fee rate that is based on an annual rate of .30% of the Fund's average net assets and an annualized group fee rate that averaged .26% during the period. The group fee rate is based upon the average net assets of all the mutual funds advised by FMR. The group fee rate decreases as assets under management increase and increases as assets under management decrease. For the period, the total annual management fee rate was .56% of the Fund's average net assets.
Distribution and Service Plan Fees. In accordance with Rule 12b-1 of the 1940 Act, the Fund has adopted separate Distribution and Service Plans for each class of shares. Certain classes pay Fidelity Distributors Corporation (FDC), an affiliate of FMR, separate Distribution and Service Fees, each of which is based on an annual percentage of each class' average net assets. In addition, FDC may pay financial intermediaries for selling shares of the Fund and providing shareholder support services. For the period, the Distribution and Service Fee rates, total fees and amounts retained by FDC were as follows:
| Distribution
Fee | Service
Fee | Total Fees | Retained
by FDC |
Class A | -% | .25% | $ 12,454 | $ 96 |
Class T | .25% | .25% | 18,072 | - |
Class B | .75% | .25% | 8,458 | 6,423 |
Class C | .75% | .25% | 30,627 | 7,539 |
| | | $ 69,611 | $ 14,058 |
Annual Report
Fidelity Advisor Communications Equipment Fund
Notes to Financial Statements - continued
5. Fees and Other Transactions with Affiliates - continued
Sales Load. FDC may receive a front-end sales charge of up to 5.75% for selling Class A shares and 3.50% for selling Class T shares, some of which is paid to financial intermediaries for selling shares of the Fund. Depending on the holding period, FDC may receive contingent deferred sales charges levied on Class A, Class T, Class B, and Class C redemptions. The deferred sales charges range from 5.00% to 1.00% for Class B shares, 1.00% for Class C shares, 1.00% for certain purchases of Class A shares and .25% for certain purchases of Class T shares.
For the period, sales charge amounts retained by FDC were as follows:
| Retained
by FDC |
Class A | $ 2,011 |
Class T | 2,152 |
Class B* | 3,030 |
Class C* | 1,783 |
| $ 8,976 |
* When Class B and Class C shares are initially sold, FDC pays commissions from its own resources to financial intermediaries through which the sales are made.
Transfer Agent Fees. Fidelity Investments Institutional Operations Company, Inc. (FIIOC), an affiliate of FMR, is the transfer, dividend disbursing and shareholder servicing agent for each class of the Fund. FIIOC receives account fees and asset-based fees that vary according to the account size and type of account of the shareholders of the respective classes of the Fund. FIIOC pays for typesetting, printing and mailing of shareholder reports, except proxy statements. For the period, transfer agent fees for each class were as follows:
| Amount | % of
Average
Net Assets |
Class A | $ 15,356 | .31 |
Class T | 13,120 | .36 |
Class B | 2,634 | .31 |
Class C | 9,658 | .31 |
Institutional Class | 2,698 | .26 |
| $ 43,466 | |
Accounting and Security Lending Fees. Fidelity Service Company, Inc. (FSC), an affiliate of FMR, maintains the Fund's accounting records. The accounting fee is based on the level of average net assets for each month. Under a separate contract, FSC administers the security lending program. The security lending fee is based on the number and duration of lending transactions.
Brokerage Commissions. The Fund placed a portion of its portfolio transactions with brokerage firms which are affiliates of the investment adviser. The commissions paid to these affiliated firms were $1,827 for the period.
6. Committed Line of Credit.
The Fund participates with other funds managed by FMR or an affiliate in a $4.25 billion credit facility (the "line of credit") to be utilized for temporary or emergency purposes to fund shareholder redemptions or for other short-term liquidity purposes. The Fund has agreed to pay commitment fees on its pro-rata portion of the line of credit, which amounted to $42 and is reflected in Miscellaneous expenses on the Statement of Operations. During the period, there were no borrowings on this line of credit.
7. Security Lending.
The Fund lends portfolio securities through a lending agent from time to time in order to earn additional income. For equity securities, a lending agent is used and may loan securities to certain qualified borrowers, including Fidelity Capital Markets (FCM), a broker-dealer affiliated with the Fund. On the settlement date of the loan, the Fund receives collateral (in the form of U.S. Treasury obligations, letters of credit and/or cash) against the loaned securities and maintains collateral in an amount not less than 100% of the market value of the loaned securities during the period of the loan. The market value of the loaned securities is determined at the close of business of the Fund and any additional required collateral is delivered to the Fund on the next business day. If the borrower defaults on its obligation to return the securities loaned because of insolvency or other reasons, a fund could experience delays and costs in recovering the securities loaned or in gaining access to the collateral. Any cash collateral received is invested in the Fidelity Securities Lending Cash Central Fund. The value of loaned securities and cash collateral at period end are disclosed on the Fund's Statement of Assets and Liabilities. Security lending income represents the income earned on investing cash collateral, less rebates paid to borrowers and any lending agent fees associated with the loan, plus any premium payments received for lending certain types of securities. Security lending income is presented in the Statement of Operations as a component of income from Fidelity Central Funds. During the period, there were no securities loaned to FCM.
Annual Report
8. Expense Reductions.
FMR voluntarily agreed to reimburse each class to the extent annual operating expenses exceeded certain levels of average net assets as noted in the table below. Some expenses, for example interest expense, including commitment fees, are excluded from this reimbursement.
The following classes were in reimbursement during the period:
| Expense
Limitations | Reimbursement
from adviser |
Class A | 1.40% | $ 27,873 |
Class T | 1.65% | 22,083 |
Class B | 2.15% | 4,729 |
Class C | 2.15% | 17,396 |
Institutional Class | 1.15% | 5,292 |
| | $ 77,373 |
Many of the brokers with whom FMR places trades on behalf of the Fund provided services to the Fund in addition to trade execution. These services included payments of certain expenses on behalf of the Fund totaling $2,275 for the period.
9. Distributions to Shareholders.
Distributions to shareholders of each class were as follows:
Years ended July 31, | 2012 | 2011 |
From net realized gain | | |
Class A | $ 136,672 | $ - |
Class T | 94,407 | - |
Class B | 23,930 | - |
Class C | 101,740 | - |
Institutional Class | 44,459 | - |
Total | $ 401,208 | $ - |
10. Share Transactions.
Transactions for each class of shares were as follows:
| Shares | Dollars |
Years ended July 31, | 2012 | 2011 | 2012 | 2011 |
Class A | | | | |
Shares sold | 95,217 | 848,465 | $ 825,716 | $ 9,277,193 |
Reinvestment of distributions | 15,026 | - | 125,915 | - |
Shares redeemed | (550,285) | (506,493) | (4,678,484) | (5,495,871) |
Net increase (decrease) | (440,042) | 341,972 | $ (3,726,853) | $ 3,781,322 |
Class T | | | | |
Shares sold | 99,348 | 222,009 | $ 845,573 | $ 2,346,633 |
Reinvestment of distributions | 11,468 | - | 93,466 | - |
Shares redeemed | (217,086) | (122,895) | (1,833,154) | (1,276,707) |
Net increase (decrease) | (106,270) | 99,114 | $ (894,115) | $ 1,069,926 |
Class B | | | | |
Shares sold | 1,631 | 48,553 | $ 14,069 | $ 469,014 |
Reinvestment of distributions | 3,015 | - | 23,244 | - |
Shares redeemed | (70,313) | (76,689) | (498,813) | (748,333) |
Net increase (decrease) | (65,667) | (28,136) | $ (461,500) | $ (279,319) |
Class C | | | | |
Shares sold | 45,249 | 468,878 | $ 356,072 | $ 4,767,947 |
Reinvestment of distributions | 10,744 | - | 82,834 | - |
Shares redeemed | (405,119) | (191,799) | (3,174,312) | (1,863,160) |
Net increase (decrease) | (349,126) | 277,079 | $ (2,735,406) | $ 2,904,787 |
Institutional Class | | | | |
Shares sold | 32,975 | 497,180 | $ 287,948 | $ 5,828,732 |
Reinvestment of distributions | 2,747 | - | 23,680 | - |
Shares redeemed | (230,453) | (405,041) | (2,045,666) | (4,332,982) |
Net increase (decrease) | (194,731) | 92,139 | $ (1,734,038) | $ 1,495,750 |
Annual Report
Fidelity Advisor Communications Equipment Fund
Notes to Financial Statements - continued
11. Other.
The Fund's organizational documents provide former and current trustees and officers with a limited indemnification against liabilities arising in connection with the performance of their duties to the Fund. In the normal course of business, the Fund may also enter into contracts that provide general indemnifications. The Fund's maximum exposure under these arrangements is unknown as this would be dependent on future claims that may be made against the Fund. The risk of material loss from such claims is considered remote.
Annual Report
Fidelity Advisor Consumer Discretionary Fund - Class A, T, B, and C
Performance: The Bottom Line
Average annual total return reflects the change in the value of an investment, assuming reinvestment of the class' distributions from dividend income and capital gains (the profits earned upon the sale of securities that have grown in value, if any) and assuming a constant rate of performance each year. The $10,000 table and the fund's returns do not reflect the deduction of taxes that a shareholder would pay on fund distributions or the redemption of fund shares. During periods of reimbursement by Fidelity, a fund's total return will be greater than it would be had the reimbursement not occurred. How a fund did yesterday is no guarantee of how it will do tomorrow. Returns reflect the conversion of Class B shares to Class A shares after a maximum of seven years.
Average Annual Total Returns
Periods ended July 31, 2012 | Past 1
year | Past 5
years | Past 10
years |
Class A (incl. 5.75% sales charge)C | 1.75% | 2.42% | 5.42% |
Class T (incl. 3.50% sales charge)C | 3.86% | 2.65% | 5.41% |
Class B (incl. contingent deferred sales charge) A, C | 2.11% | 2.51% | 5.50% |
Class C (incl. contingent deferred sales charge) B, C | 6.17% | 2.89% | 5.27% |
A Class B shares' contingent deferred sales charges included in the past one year, past five years, and past ten years total return figures are 5%, 2%, and 0%, respectively.
B Class C shares' contingent deferred sales charges included in the past one year, past five years, and past ten years total return figures are 1%, 0%, and 0%, respectively.
C Prior to October 1, 2006, Fidelity Advisor Consumer Discretionary Fund operated under certain different investment policies. The historical performance for the fund may not represent its current investment policies.
$10,000 Over 10 Years
Let's say hypothetically that $10,000 was invested in Fidelity Advisor Consumer Discretionary Fund - Class A on July 31, 2002, and the current 5.75% sales charge was paid. The chart shows how the value of your investment would have changed, and also shows how the S&P 500 Index performed over the same period.
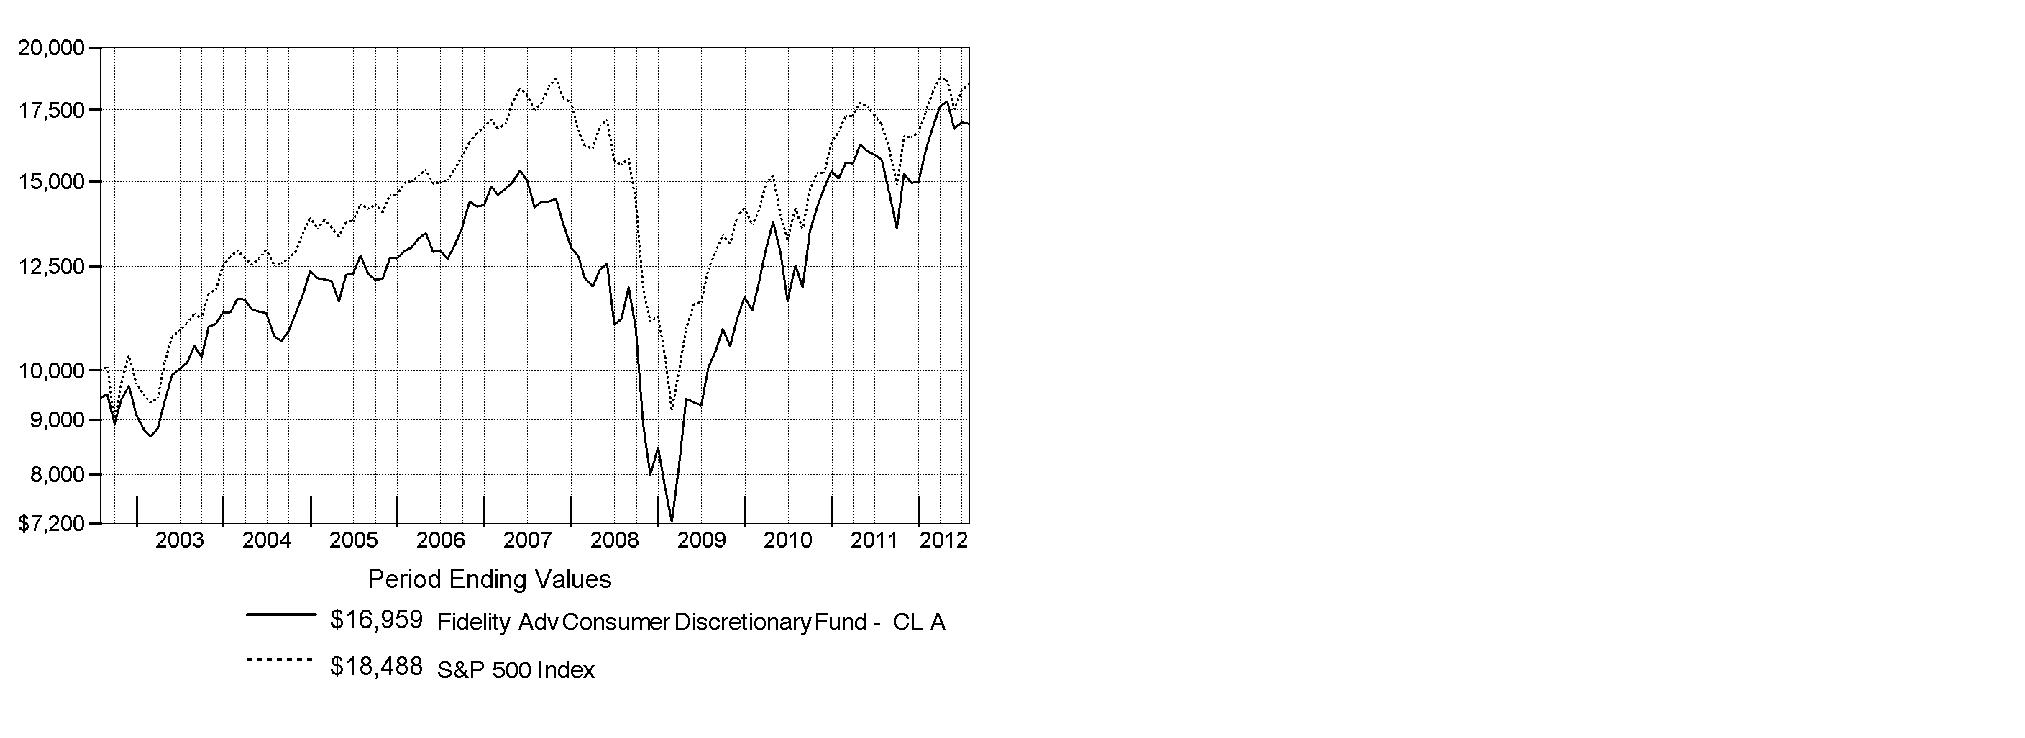
Annual Report
Fidelity Advisor Consumer Discretionary Fund
Market Recap: Major U.S. equity benchmarks posted solid gains for the year ending July 31, 2012, amid an uncertain investment environment. The broad-based S&P 500® Index returned 9.13%, while the blue-chip-laden Dow Jones Industrial AverageSM and technology-heavy Nasdaq Composite® Index gained 10.12% and 7.83%, respectively. Volatility spiked during the period's first half, as equities plummeted late last summer on Europe's debt woes, political wrangling over the U.S. debt ceiling and the sovereign credit-rating downgrade that followed. By October, a seemingly improved U.S. economy rejuvenated stocks, paving the way for major equity benchmarks to post their best first-quarter performance since 1998. However, more eurozone trouble, signs that the U.S. economy had turned sluggish and a slowdown in China caused stocks to slip in May, before a new wave of optimism took hold in June and July. Within the S&P 500®, more-defensive sectors such as telecommunication services (+30%) and consumer staples (+20%) fared best, while materials and energy significantly underperformed, returning -5%. Small- and mid-cap stocks trailed their less-volatile large-cap counterparts, with the Russell 2000® Index adding 0.19% and the Russell Midcap® Index rising 2.28%. Given turmoil and local currency weakness in Europe, foreign developed-markets stocks lost ground, with the MSCI® EAFE® Index returning -11.32%.
Comments from Gordon Scott, who became Portfolio Manager of Fidelity Advisor® Consumer Discretionary Fund on May 1, 2012: For the 12 months ending July 31, 2012, the fund's Class A, Class T, Class B and Class C shares returned 7.96%, 7.62%, 7.11% and 7.17%, respectively (excluding sales charges), lagging both the 9.53% advance of the MSCI® U.S. IM Consumer Discretionary 25/50 Index and the S&P 500®. The fund underperformed its sector benchmark as a result of security selection. The fund performed well on an absolute basis during the early months of 2012, when the global economy was in a cyclical rally, offsetting the fund's less robust results during the second half of 2011, which is when most of the underperformance occurred. In April 2012, as equity markets retreated on renewed worries about the eurozone, the fund took on a more-defensive bias and that shift in positioning helped narrow the fund's relative underperformance. Among the stocks that detracted from the fund's performance versus its sector benchmark were premium mattress maker Tempur-Pedic International; online discount coupon purveyor Groupon, an out-of-index position; and auto-parts retailer O'Reilly Automotive, in which the fund was underweighted. Stocks that contributed included auto-parts maker Johnson Controls, a poor-performing index component in which we held no position; diversified media and entertainment giant Walt Disney; and after-market automotive retailer Advance Auto Parts. Some of the stocks mentioned in this annual review were no longer held at period end.
The views expressed above reflect those of the portfolio manager(s) only through the end of the period as stated on the cover of this report and do not necessarily represent the views of Fidelity or any other person in the Fidelity organization. Any such views are subject to change at any time based upon market or other conditions and Fidelity disclaims any responsibility to update such views. These views may not be relied on as investment advice and, because investment decisions for a Fidelity fund are based on numerous factors, may not be relied on as an indication of trading intent on behalf of any Fidelity fund.
Annual Report
Fidelity Advisor Consumer Discretionary Fund
As a shareholder of the Fund, you incur two types of costs: (1) transaction costs, including sales charges (loads) on purchase payments or redemption proceeds, redemption fees and (2) ongoing costs, including management fees, distribution and/or service (12b-1) fees and other Fund expenses. This Example is intended to help you understand your ongoing costs (in dollars) of investing in the Fund and to compare these costs with the ongoing costs of investing in other mutual funds.
The Example is based on an investment of $1,000 invested at the beginning of the period and held for the entire period (February 1, 2012 to July 31, 2012).
Actual Expenses
The first line of the accompanying table for each class of the Fund provides information about actual account values and actual expenses. You may use the information in this line, together with the amount you invested, to estimate the expenses that you paid over the period. Simply divide your account value by $1,000.00 (for example, an $8,600 account value divided by $1,000.00 = 8.6), then multiply the result by the number in the first line for a class of the Fund under the heading entitled "Expenses Paid During Period" to estimate the expenses you paid on your account during this period. In addition, the Fund, as a shareholder in the underlying Fidelity Central Funds, will indirectly bear its pro-rata share of the fees and expenses incurred by the underlying Fidelity Central Funds. These fees and expenses are not included in the Fund's annualized expense ratio used to calculate the expense estimate in the table below.
Hypothetical Example for Comparison Purposes
The second line of the accompanying table for each class of the Fund provides information about hypothetical account values and hypothetical expenses based on a Class' actual expense ratio and an assumed rate of return of 5% per year before expenses, which is not the Class' actual return. The hypothetical account values and expenses may not be used to estimate the actual ending account balance or expenses you paid for the period. You may use this information to compare the ongoing costs of investing in the Fund and other funds. To do so, compare this 5% hypothetical example with the 5% hypothetical examples that appear in the shareholder reports of the other funds. In addition, the Fund, as a shareholder in the underlying Fidelity Central Funds, will indirectly bear its pro-rata share of the fees and expenses incurred by the underlying Fidelity Central Funds. These fees and expenses are not included in the Fund's annualized expense ratio used to calculate the expense estimate in the table below.
Please note that the expenses shown in the table are meant to highlight your ongoing costs only and do not reflect any transaction costs. Therefore, the second line of the table is useful in comparing ongoing costs only, and will not help you determine the relative total costs of owning different funds. In addition, if these transactional costs were included, your costs would have been higher.
| Annualized
Expense Ratio | Beginning
Account Value
February 1, 2012 | Ending
Account Value
July 31, 2012 | Expenses Paid
During Period*
February 1, 2012
to July 31, 2012 |
Class A | 1.35% | | | |
Actual | | $ 1,000.00 | $ 1,059.40 | $ 6.91 |
HypotheticalA | | $ 1,000.00 | $ 1,018.15 | $ 6.77 |
Class T | 1.64% | | | |
Actual | | $ 1,000.00 | $ 1,058.50 | $ 8.39 |
HypotheticalA | | $ 1,000.00 | $ 1,016.71 | $ 8.22 |
Class B | 2.11% | | | |
Actual | | $ 1,000.00 | $ 1,055.60 | $ 10.78 |
HypotheticalA | | $ 1,000.00 | $ 1,014.37 | $ 10.57 |
Class C | 2.05% | | | |
Actual | | $ 1,000.00 | $ 1,056.30 | $ 10.48 |
HypotheticalA | | $ 1,000.00 | $ 1,014.67 | $ 10.27 |
Institutional Class | .96% | | | |
Actual | | $ 1,000.00 | $ 1,062.30 | $ 4.92 |
HypotheticalA | | $ 1,000.00 | $ 1,020.09 | $ 4.82 |
A 5% return per year before expenses
* Expenses are equal to each Class' annualized expense ratio, multiplied by the average account value over the period, multiplied by 182/366 (to reflect the one-half year period).
Annual Report
Fidelity Advisor Consumer Discretionary Fund
Investment Changes (Unaudited)
Top Ten Stocks as of July 31, 2012 |
| % of fund's
net assets | % of fund's net assets
6 months ago |
Comcast Corp. Class A | 7.8 | 5.0 |
The Walt Disney Co. | 7.1 | 5.7 |
McDonald's Corp. | 6.1 | 6.6 |
Home Depot, Inc. | 5.8 | 3.8 |
Amazon.com, Inc. | 5.3 | 4.9 |
News Corp. Class A | 4.8 | 1.3 |
TJX Companies, Inc. | 3.2 | 2.4 |
Target Corp. | 2.9 | 2.9 |
Yum! Brands, Inc. | 2.7 | 0.0 |
NIKE, Inc. Class B | 2.6 | 3.2 |
| 48.3 | |
Top Industries (% of fund's net assets) |
As of July 31, 2012 |
| Specialty Retail | 30.0% | |
| Media | 23.8% | |
| Hotels, Restaurants & Leisure | 15.0% | |
| Multiline Retail | 8.1% | |
| Internet & Catalog Retail | 7.8% | |
| All Others* | 15.3% | |

As of January 31, 2012 |
| Specialty Retail | 25.5% | |
| Media | 23.1% | |
| Hotels, Restaurants & Leisure | 18.8% | |
| Textiles, Apparel & Luxury Goods | 8.3% | |
| Internet & Catalog Retail | 5.6% | |
| All Others* | 18.7% | |

* Includes short-term investments and net other assets. |
Annual Report
Fidelity Advisor Consumer Discretionary Fund
Investments July 31, 2012
Showing Percentage of Net Assets
Common Stocks - 98.4% |
| Shares | | Value |
AUTO COMPONENTS - 2.1% |
Auto Parts & Equipment - 2.1% |
BorgWarner, Inc. (a) | 9,900 | | $ 664,290 |
Delphi Automotive PLC | 23,500 | | 667,165 |
| | 1,331,455 |
AUTOMOBILES - 0.8% |
Motorcycle Manufacturers - 0.8% |
Harley-Davidson, Inc. | 12,398 | | 535,966 |
BUILDING PRODUCTS - 0.5% |
Building Products - 0.5% |
Owens Corning (a) | 12,046 | | 323,556 |
CHEMICALS - 0.5% |
Specialty Chemicals - 0.5% |
Sherwin-Williams Co. | 2,500 | | 335,875 |
COMMERCIAL SERVICES & SUPPLIES - 0.5% |
Office Services & Supplies - 0.5% |
Interface, Inc. | 21,700 | | 287,742 |
DISTRIBUTORS - 1.3% |
Distributors - 1.3% |
LKQ Corp. (a) | 22,800 | | 805,524 |
HOTELS, RESTAURANTS & LEISURE - 15.0% |
Restaurants - 15.0% |
BJ's Restaurants, Inc. (a) | 5,783 | | 228,891 |
Buffalo Wild Wings, Inc. (a) | 6,100 | | 442,799 |
Domino's Pizza, Inc. | 19,993 | | 682,561 |
McDonald's Corp. | 43,453 | | 3,882,960 |
Panera Bread Co. Class A (a) | 4,100 | | 645,709 |
Starbucks Corp. | 34,590 | | 1,566,235 |
Texas Roadhouse, Inc. Class A | 17,475 | | 302,492 |
Yum! Brands, Inc. | 26,066 | | 1,690,119 |
| | 9,441,766 |
HOUSEHOLD DURABLES - 3.3% |
Homebuilding - 1.2% |
Lennar Corp. Class A | 15,611 | | 455,997 |
Ryland Group, Inc. | 12,000 | | 286,560 |
| | 742,557 |
Housewares & Specialties - 2.1% |
Jarden Corp. | 22,000 | | 994,400 |
Tupperware Brands Corp. | 6,541 | | 342,879 |
| | 1,337,279 |
TOTAL HOUSEHOLD DURABLES | | 2,079,836 |
|
| Shares | | Value |
INTERNET & CATALOG RETAIL - 7.8% |
Internet Retail - 7.8% |
Amazon.com, Inc. (a) | 14,186 | | $ 3,309,594 |
Priceline.com, Inc. (a) | 2,390 | | 1,581,559 |
| | 4,891,153 |
LEISURE EQUIPMENT & PRODUCTS - 0.8% |
Leisure Products - 0.8% |
Brunswick Corp. | 23,900 | | 525,561 |
MEDIA - 23.8% |
Broadcasting - 2.9% |
CBS Corp. Class B | 31,863 | | 1,066,136 |
Discovery Communications, Inc. (a) | 15,400 | | 779,702 |
| | 1,845,838 |
Cable & Satellite - 9.0% |
Charter Communications, Inc. Class A (a) | 9,896 | | 761,200 |
Comcast Corp. Class A | 152,000 | | 4,947,600 |
| | 5,708,800 |
Movies & Entertainment - 11.9% |
News Corp. Class A | 130,421 | | 3,002,291 |
The Walt Disney Co. | 91,122 | | 4,477,735 |
| | 7,480,026 |
TOTAL MEDIA | | 15,034,664 |
MULTILINE RETAIL - 8.1% |
General Merchandise Stores - 8.1% |
Dollar General Corp. (a) | 32,190 | | 1,642,012 |
Dollar Tree, Inc. (a) | 32,504 | | 1,636,251 |
Target Corp. | 29,865 | | 1,811,312 |
| | 5,089,575 |
SPECIALTY RETAIL - 30.0% |
Apparel Retail - 7.6% |
Abercrombie & Fitch Co. Class A | 7,100 | | 239,980 |
Limited Brands, Inc. | 17,161 | | 816,006 |
Ross Stores, Inc. | 18,700 | | 1,242,428 |
TJX Companies, Inc. | 45,931 | | 2,033,825 |
Urban Outfitters, Inc. (a) | 14,900 | | 455,195 |
| | 4,787,434 |
Automotive Retail - 4.8% |
AutoZone, Inc. (a) | 2,700 | | 1,013,121 |
CarMax, Inc. (a) | 33,200 | | 923,956 |
O'Reilly Automotive, Inc. (a) | 12,900 | | 1,106,046 |
| | 3,043,123 |
Home Improvement Retail - 6.1% |
Home Depot, Inc. | 69,889 | | 3,646,808 |
Lowe's Companies, Inc. | 8,753 | | 222,064 |
| | 3,868,872 |
Homefurnishing Retail - 0.8% |
Williams-Sonoma, Inc. | 14,575 | | 506,481 |
Common Stocks - continued |
| Shares | | Value |
SPECIALTY RETAIL - CONTINUED |
Specialty Stores - 10.7% |
Dick's Sporting Goods, Inc. | 20,369 | | $ 1,000,525 |
GNC Holdings, Inc. | 14,939 | | 575,600 |
Hibbett Sports, Inc. (a) | 10,600 | | 644,162 |
PetSmart, Inc. | 15,100 | | 998,261 |
Sally Beauty Holdings, Inc. (a) | 34,000 | | 898,280 |
Tiffany & Co., Inc. | 10,317 | | 566,713 |
Tractor Supply Co. | 11,235 | | 1,020,924 |
Ulta Salon, Cosmetics & Fragrance, Inc. | 5,850 | | 496,548 |
Vitamin Shoppe, Inc. (a) | 9,500 | | 521,740 |
| | 6,722,753 |
TOTAL SPECIALTY RETAIL | | 18,928,663 |
TEXTILES, APPAREL & LUXURY GOODS - 3.9% |
Apparel, Accessories & Luxury Goods - 1.3% |
PVH Corp. | 9,933 | | 788,978 |
Footwear - 2.6% |
NIKE, Inc. Class B | 17,726 | | 1,654,722 |
TOTAL TEXTILES, APPAREL & LUXURY GOODS | | 2,443,700 |
TOTAL COMMON STOCKS (Cost $54,555,811) |
62,055,036
|
Nonconvertible Preferred Stocks - 0.5% |
| Shares | | Value |
AUTOMOBILES - 0.5% |
Automobile Manufacturers - 0.5% |
Volkswagen AG
(Cost $294,558) | 1,700 | | $ 290,744 |
Money Market Funds - 1.9% |
| | | |
Fidelity Cash Central Fund, 0.17% (b)
(Cost $1,220,375) | 1,220,375 | |
1,220,375
|
TOTAL INVESTMENT PORTFOLIO - 100.8% (Cost $56,070,744) | | 63,566,155 |
NET OTHER ASSETS (LIABILITIES) - (0.8)% | | (504,753) |
NET ASSETS - 100% | $ 63,061,402 |
Legend |
(a) Non-income producing |
(b) Affiliated fund that is available only to investment companies and other accounts managed by Fidelity Investments. The rate quoted is the annualized seven-day yield of the fund at period end. A complete unaudited listing of the fund's holdings as of its most recent quarter end is available upon request. In addition, each Fidelity Central Fund's financial statements, which are not covered by the Fund's Report of Independent Registered Public Accounting Firm, are available on the SEC's website or upon request. |
Affiliated Central Funds |
Information regarding fiscal year to date income earned by the Fund from investments in Fidelity Central Funds is as follows: |
Fund | Income earned |
Fidelity Cash Central Fund | $ 805 |
Fidelity Securities Lending Cash Central Fund | 50,595 |
Total | $ 51,400 |
Other Information |
All investments are categorized as Level 1 under the Fair Value Hierarchy. The inputs or methodology used for valuing securities may not be an indication of the risk associated with investing in those securities. For more information on valuation inputs, please refer to the Security Valuation section in the accompanying Notes to Financial Statements. |
See accompanying notes which are an integral part of the financial statements.
Annual Report
Fidelity Advisor Consumer Discretionary Fund
Statement of Assets and Liabilities
| July 31, 2012 |
| | |
Assets | | |
Investment in securities, at value - See accompanying schedule: Unaffiliated issuers (cost $54,850,369) | $ 62,345,780 | |
Fidelity Central Funds (cost $1,220,375) | 1,220,375 | |
Total Investments (cost $56,070,744) | | $ 63,566,155 |
Receivable for investments sold | | 2,738,324 |
Receivable for fund shares sold | | 109,411 |
Dividends receivable | | 19,847 |
Distributions receivable from Fidelity Central Funds | | 168 |
Other receivables | | 1,317 |
Total assets | | 66,435,222 |
| | |
Liabilities | | |
Payable for investments purchased | $ 3,213,900 | |
Payable for fund shares redeemed | 51,149 | |
Accrued management fee | 30,760 | |
Distribution and service plan fees payable | 23,345 | |
Other affiliated payables | 15,707 | |
Other payables and accrued expenses | 38,959 | |
Total liabilities | | 3,373,820 |
| | |
Net Assets | | $ 63,061,402 |
Net Assets consist of: | | |
Paid in capital | | $ 52,815,045 |
Accumulated net investment loss | | (149,267) |
Accumulated undistributed net realized gain (loss) on investments and foreign currency transactions | | 2,900,310 |
Net unrealized appreciation (depreciation) on investments and assets and liabilities in foreign currencies | | 7,495,314 |
Net Assets | | $ 63,061,402 |
Statement of Assets and Liabilities - continued
| July 31, 2012 |
| | |
Calculation of Maximum Offering Price Class A:
Net Asset Value and redemption price per share ($26,546,565 ÷ 1,636,800 shares) | | $ 16.22 |
| | |
Maximum offering price per share (100/94.25 of $16.22) | | $ 17.21 |
Class T:
Net Asset Value and redemption price per share ($10,447,481 ÷ 671,015 shares) | | $ 15.57 |
| | |
Maximum offering price per share (100/96.50 of $15.57) | | $ 16.13 |
Class B:
Net Asset Value and offering price per share ($2,576,745 ÷ 181,078 shares)A | | $ 14.23 |
| | |
Class C:
Net Asset Value and offering price per share ($13,506,974 ÷ 946,447 shares)A | | $ 14.27 |
| | |
Institutional Class:
Net Asset Value, offering price and redemption price per share ($9,983,637 ÷ 585,984 shares) | | $ 17.04 |
A Redemption price per share is equal to net asset value less any applicable contingent deferred sales charge.
See accompanying notes which are an integral part of the financial statements.
Annual Report
Fidelity Advisor Consumer Discretionary Fund
Financial Statements - continued
Statement of Operations
| Year ended July 31, 2012 |
| | |
Investment Income | | |
Dividends | | $ 767,042 |
Interest | | 1 |
Income from Fidelity Central Funds (including $50,595 from security lending) | | 51,400 |
Total income | | 818,443 |
| | |
Expenses | | |
Management fee | $ 326,030 | |
Transfer agent fees | 155,087 | |
Distribution and service plan fees | 230,531 | |
Accounting and security lending fees | 23,140 | |
Custodian fees and expenses | 18,195 | |
Independent trustees' compensation | 384 | |
Registration fees | 56,525 | |
Audit | 56,356 | |
Legal | 178 | |
Interest | 523 | |
Miscellaneous | 491 | |
Total expenses before reductions | 867,440 | |
Expense reductions | (4,472) | 862,968 |
Net investment income (loss) | | (44,525) |
Realized and Unrealized Gain (Loss) Net realized gain (loss) on: | | |
Investment securities: | | |
Unaffiliated issuers (net of foreign taxes of $4,920) | 3,550,922 | |
Foreign currency transactions | (8,518) | |
Total net realized gain (loss) | | 3,542,404 |
Change in net unrealized appreciation (depreciation) on: Investment securities (net of decrease in deferred foreign taxes of $6,492) | 761,905 | |
Assets and liabilities in foreign currencies | 467 | |
Total change in net unrealized appreciation (depreciation) | | 762,372 |
Net gain (loss) | | 4,304,776 |
Net increase (decrease) in net assets resulting from operations | | $ 4,260,251 |
Statement of Changes in Net Assets
| Year ended
July 31,
2012 | Year ended
July 31,
2011 |
Increase (Decrease) in Net Assets | | |
Operations | | |
Net investment income (loss) | $ (44,525) | $ (180,164) |
Net realized gain (loss) | 3,542,404 | 5,895,581 |
Change in net unrealized appreciation (depreciation) | 762,372 | 6,053,008 |
Net increase (decrease) in net assets resulting from operations | 4,260,251 | 11,768,425 |
Distributions to shareholders from net investment income | (82,290) | - |
Distributions to shareholders from net realized gain | (2,716,672) | - |
Total distributions | (2,798,962) | - |
Share transactions - net increase (decrease) | 8,335,613 | (7,894,650) |
Redemption fees | 3,533 | 1,559 |
Total increase (decrease) in net assets | 9,800,435 | 3,875,334 |
| | |
Net Assets | | |
Beginning of period | 53,260,967 | 49,385,633 |
End of period (including accumulated net investment loss of $149,267 and accumulated net investment loss of
$8,467, respectively) | $ 63,061,402 | $ 53,260,967 |
See accompanying notes which are an integral part of the financial statements.
Annual Report
Financial Highlights - Class A
Years ended July 31, | 2012 | 2011 | 2010 | 2009 | 2008 |
Selected Per-Share Data | | | | | |
Net asset value, beginning of period | $ 16.00 | $ 12.75 | $ 10.26 | $ 11.41 | $ 15.89 |
Income from Investment Operations | | | | | |
Net investment income (loss) C | .01 | (.02) | (.02) | .04 | .02 |
Net realized and unrealized gain (loss) | 1.07 | 3.27 | 2.51 | (1.16) | (3.09) |
Total from investment operations | 1.08 | 3.25 | 2.49 | (1.12) | (3.07) |
Distributions from net investment income | (.03) | - | - | (.03) | - |
Distributions from net realized gain | (.83) | - | - | - | (1.41) |
Total distributions | (.86) | - | - | (.03) | (1.41) |
Redemption fees added to paid in capital C, G | - | - | - | - | - |
Net asset value, end of period | $ 16.22 | $ 16.00 | $ 12.75 | $ 10.26 | $ 11.41 |
Total Return A, B | 7.96% | 25.49% | 24.27% | (9.81)% | (21.24)% |
Ratios to Average Net Assets D, F | | | | | |
Expenses before reductions | 1.38% | 1.39% | 1.44% | 1.62% | 1.40% |
Expenses net of fee waivers, if any | 1.38% | 1.39% | 1.40% | 1.40% | 1.40% |
Expenses net of all reductions | 1.37% | 1.38% | 1.39% | 1.40% | 1.40% |
Net investment income (loss) | .04% | (.15)% | (.15)% | .42% | .15% |
Supplemental Data | | | | | |
Net assets, end of period (000 omitted) | $ 26,547 | $ 23,447 | $ 19,423 | $ 13,010 | $ 11,899 |
Portfolio turnover rate E | 217% | 179% | 163% | 99% | 63% |
A Total returns would have been lower if certain expenses had not been reduced during the applicable periods shown.
B Total returns do not include the effect of the sales charges.
C Calculated based on average shares outstanding during the period.
D Fees and expenses of any underlying Fidelity Central Funds are not included in the Fund's expense ratio. The Fund indirectly bears its proportionate share of the expenses of any underlying Fidelity Central Funds.
E Amount does not include the portfolio activity of any underlying Fidelity Central Funds.
F Expense ratios reflect operating expenses of the class. Expenses before reductions do not reflect amounts reimbursed by the investment adviser or reductions from brokerage service arrangements or reductions from other expense offset arrangements and do not represent the amount paid by the class during periods when reimbursements or reductions occur. Expenses net of fee waivers reflect expenses after reimbursement by the investment adviser but prior to reductions from brokerage service arrangements or other expense offset arrangements. Expenses net of all reductions represent the net expenses paid by the class.
G Amount represents less than $.01 per share.
Financial Highlights - Class T
Years ended July 31, | 2012 | 2011 | 2010 | 2009 | 2008 |
Selected Per-Share Data | | | | | |
Net asset value, beginning of period | $ 15.43 | $ 12.32 | $ 9.94 | $ 11.07 | $ 15.47 |
Income from Investment Operations | | | | | |
Net investment income (loss) C | (.03) | (.06) | (.05) | .01 | (.01) |
Net realized and unrealized gain (loss) | 1.02 | 3.17 | 2.43 | (1.12) | (3.00) |
Total from investment operations | .99 | 3.11 | 2.38 | (1.11) | (3.01) |
Distributions from net investment income | (.02) | - | - | (.02) | - |
Distributions from net realized gain | (.83) | - | - | - | (1.39) |
Total distributions | (.85) | - | - | (.02) | (1.39) |
Redemption fees added to paid in capital C, G | - | - | - | - | - |
Net asset value, end of period | $ 15.57 | $ 15.43 | $ 12.32 | $ 9.94 | $ 11.07 |
Total Return A, B | 7.62% | 25.24% | 23.94% | (10.04)% | (21.41)% |
Ratios to Average Net Assets D, F | | | | | |
Expenses before reductions | 1.64% | 1.66% | 1.71% | 1.89% | 1.64% |
Expenses net of fee waivers, if any | 1.64% | 1.65% | 1.65% | 1.65% | 1.64% |
Expenses net of all reductions | 1.63% | 1.64% | 1.64% | 1.65% | 1.62% |
Net investment income (loss) | (.23)% | (.40)% | (.40)% | .17% | (.08)% |
Supplemental Data | | | | | |
Net assets, end of period (000 omitted) | $ 10,447 | $ 9,897 | $ 8,018 | $ 6,738 | $ 9,095 |
Portfolio turnover rate E | 217% | 179% | 163% | 99% | 63% |
A Total returns would have been lower if certain expenses had not been reduced during the applicable periods shown.
B Total returns do not include the effect of the sales charges.
C Calculated based on average shares outstanding during the period.
D Fees and expenses of any underlying Fidelity Central Funds are not included in the Fund's expense ratio. The Fund indirectly bears its proportionate share of the expenses of any underlying Fidelity Central Funds.
E Amount does not include the portfolio activity of any underlying Fidelity Central Funds.
F Expense ratios reflect operating expenses of the class. Expenses before reductions do not reflect amounts reimbursed by the investment adviser or reductions from brokerage service arrangements or reductions from other expense offset arrangements and do not represent the amount paid by the class during periods when reimbursements or reductions occur. Expenses net of fee waivers reflect expenses after reimbursement by the investment adviser but prior to reductions from brokerage service arrangements or other expense offset arrangements. Expenses net of all reductions represent the net expenses paid by the class.
G Amount represents less than $.01 per share.
See accompanying notes which are an integral part of the financial statements.
Annual Report
Financial Highlights - Class B
Years ended July 31, | 2012 | 2011 | 2010 | 2009 | 2008 |
Selected Per-Share Data | | | | | |
Net asset value, beginning of period | $ 14.23 | $ 11.42 | $ 9.26 | $ 10.35 | $ 14.56 |
Income from Investment Operations | | | | | |
Net investment income (loss) C | (.10) | (.12) | (.10) | (.03) | (.07) |
Net realized and unrealized gain (loss) | .93 | 2.93 | 2.26 | (1.06) | (2.81) |
Total from investment operations | .83 | 2.81 | 2.16 | (1.09) | (2.88) |
Distributions from net realized gain | (.83) | - | - | - | (1.33) |
Redemption fees added to paid in capital C, G | - | - | - | - | - |
Net asset value, end of period | $ 14.23 | $ 14.23 | $ 11.42 | $ 9.26 | $ 10.35 |
Total Return A, B | 7.11% | 24.61% | 23.33% | (10.53)% | (21.80)% |
Ratios to Average Net Assets D, F | | | | | |
Expenses before reductions | 2.13% | 2.15% | 2.21% | 2.38% | 2.14% |
Expenses net of fee waivers, if any | 2.13% | 2.15% | 2.15% | 2.15% | 2.14% |
Expenses net of all reductions | 2.12% | 2.13% | 2.14% | 2.15% | 2.14% |
Net investment income (loss) | (.72)% | (.90)% | (.90)% | (.33)% | (.60)% |
Supplemental Data | | | | | |
Net assets, end of period (000 omitted) | $ 2,577 | $ 3,170 | $ 3,643 | $ 3,550 | $ 5,090 |
Portfolio turnover rate E | 217% | 179% | 163% | 99% | 63% |
A Total returns would have been lower if certain expenses had not been reduced during the applicable periods shown.
B Total returns do not include the effect of the contingent deferred sales charge.
C Calculated based on average shares outstanding during the period.
D Fees and expenses of any underlying Fidelity Central Funds are not included in the Fund's expense ratio. The Fund indirectly bears its proportionate share of the expenses of any underlying Fidelity Central Funds.
E Amount does not include the portfolio activity of any underlying Fidelity Central Funds.
F Expense ratios reflect operating expenses of the class. Expenses before reductions do not reflect amounts reimbursed by the investment adviser or reductions from brokerage service arrangements or reductions from other expense offset arrangements and do not represent the amount paid by the class during periods when reimbursements or reductions occur. Expenses net of fee waivers reflect expenses after reimbursement by the investment adviser but prior to reductions from brokerage service arrangements or other expense offset arrangements. Expenses net of all reductions represent the net expenses paid by the class.
G Amount represents less than $.01 per share.
Financial Highlights - Class C
Years ended July 31, | 2012 | 2011 | 2010 | 2009 | 2008 |
Selected Per-Share Data | | | | | |
Net asset value, beginning of period | $ 14.26 | $ 11.44 | $ 9.27 | $ 10.37 | $ 14.59 |
Income from Investment Operations | | | | | |
Net investment income (loss) C | (.09) | (.12) | (.10) | (.03) | (.07) |
Net realized and unrealized gain (loss) | .93 | 2.94 | 2.27 | (1.07) | (2.81) |
Total from investment operations | .84 | 2.82 | 2.17 | (1.10) | (2.88) |
Distributions from net realized gain | (.83) | - | - | - | (1.34) |
Redemption fees added to paid in capital C, G | - | - | - | - | - |
Net asset value, end of period | $ 14.27 | $ 14.26 | $ 11.44 | $ 9.27 | $ 10.37 |
Total Return A, B | 7.17% | 24.65% | 23.41% | (10.61)% | (21.77)% |
Ratios to Average Net Assets D, F | | | | | |
Expenses before reductions | 2.09% | 2.11% | 2.12% | 2.38% | 2.15% |
Expenses net of fee waivers, if any | 2.09% | 2.11% | 2.12% | 2.15% | 2.15% |
Expenses net of all reductions | 2.08% | 2.09% | 2.11% | 2.15% | 2.14% |
Net investment income (loss) | (.68)% | (.86)% | (.87)% | (.33)% | (.60)% |
Supplemental Data | | | | | |
Net assets, end of period (000 omitted) | $ 13,507 | $ 7,341 | $ 9,288 | $ 2,955 | $ 3,430 |
Portfolio turnover rate E | 217% | 179% | 163% | 99% | 63% |
A Total returns would have been lower if certain expenses had not been reduced during the applicable periods shown.
B Total returns do not include the effect of the contingent deferred sales charge.
C Calculated based on average shares outstanding during the period.
D Fees and expenses of any underlying Fidelity Central Funds are not included in the Fund's expense ratio. The Fund indirectly bears its proportionate share of the expenses of any underlying Fidelity Central Funds.
E Amount does not include the portfolio activity of any underlying Fidelity Central Funds.
F Expense ratios reflect operating expenses of the class. Expenses before reductions do not reflect amounts reimbursed by the investment adviser or reductions from brokerage service arrangements or reductions from other expense offset arrangements and do not represent the amount paid by the class during periods when reimbursements or reductions occur. Expenses net of fee waivers reflect expenses after reimbursement by the investment adviser but prior to reductions from brokerage service arrangements or other expense offset arrangements. Expenses net of all reductions represent the net expenses paid by the class.
G Amount represents less than $.01 per share.
See accompanying notes which are an integral part of the financial statements.
Annual Report
Financial Highlights - Institutional Class
Years ended July 31, | 2012 | 2011 | 2010 | 2009 | 2008 |
Selected Per-Share Data | | | | | |
Net asset value, beginning of period | $ 16.72 | $ 13.27 | $ 10.66 | $ 11.84 | $ 16.41 |
Income from Investment Operations | | | | | |
Net investment income (loss) B | .07 | .03 | .02 | .06 | .06 |
Net realized and unrealized gain (loss) | 1.13 | 3.42 | 2.60 | (1.20) | (3.22) |
Total from investment operations | 1.20 | 3.45 | 2.62 | (1.14) | (3.16) |
Distributions from net investment income | (.05) | - | (.01) | (.04) | - |
Distributions from net realized gain | (.83) | - | - | - | (1.41) |
Total distributions | (.88) | - | (.01) | (.04) | (1.41) |
Redemption fees added to paid in capital B, F | - | - | - | - | - |
Net asset value, end of period | $ 17.04 | $ 16.72 | $ 13.27 | $ 10.66 | $ 11.84 |
Total Return A | 8.33% | 26.00% | 24.62% | (9.59)% | (21.09)% |
Ratios to Average Net Assets C, E | | | | | |
Expenses before reductions | 1.00% | 1.03% | 1.09% | 1.15% | 1.14% |
Expenses net of fee waivers, if any | 1.00% | 1.03% | 1.09% | 1.15% | 1.14% |
Expenses net of all reductions | .99% | 1.01% | 1.08% | 1.15% | 1.14% |
Net investment income (loss) | .41% | .22% | .16% | .67% | .40% |
Supplemental Data | | | | | |
Net assets, end of period (000 omitted) | $ 9,984 | $ 9,406 | $ 9,013 | $ 5,990 | $ 398 |
Portfolio turnover rate D | 217% | 179% | 163% | 99% | 63% |
A Total returns would have been lower if certain expenses had not been reduced during the applicable periods shown.
B Calculated based on average shares outstanding during the period.
C Fees and expenses of any underlying Fidelity Central Funds are not included in the Fund's expense ratio. The Fund indirectly bears its proportionate share of the expenses of any underlying Fidelity Central Funds.
D Amount does not include the portfolio activity of any underlying Fidelity Central Funds.
E Expense ratios reflect operating expenses of the class. Expenses before reductions do not reflect amounts reimbursed by the investment adviser or reductions from brokerage service arrangements or reductions from other expense offset arrangements and do not represent the amount paid by the class during periods when reimbursements or reductions occur. Expenses net of fee waivers reflect expenses after reimbursement by the investment adviser but prior to reductions from brokerage service arrangements or other expense offset arrangements. Expenses net of all reductions represent the net expenses paid by the class.
F Amount represents less than $.01 per share.
See accompanying notes which are an integral part of the financial statements.
Annual Report
Fidelity Advisor Consumer Discretionary Fund
Notes to Financial Statements
For the period ended July 31, 2012
1. Organization.
Fidelity Advisor Consumer Discretionary Fund (the Fund) is a non-diversified fund of Fidelity Advisor Series VII (the Trust) and is authorized to issue an unlimited number of shares. The Trust is registered under the Investment Company Act of 1940, as amended (the 1940 Act), as an open-end management investment company organized as a Massachusetts business trust. The Fund offers Class A, Class T, Class C and Institutional Class shares, each of which, along with Class B shares, has equal rights as to assets and voting privileges. Effective after the close of business on September 1, 2010, Class B shares were closed to new accounts and additional purchases, except for exchanges and reinvestments. Each class has exclusive voting rights with respect to matters that affect that class. Class B shares will automatically convert to Class A shares after a holding period of seven years from the initial date of purchase. Investment income, realized and unrealized capital gains and losses, the common expenses of the Fund, and certain fund-level expense reductions, if any, are allocated on a pro-rata basis to each class based on the relative net assets of each class to the total net assets of the Fund. Each class differs with respect to transfer agent and distribution and service plan fees incurred. Certain expense reductions may also differ by class.
2. Investments in Fidelity Central Funds.
The Fund invests in Fidelity Central Funds, which are open-end investment companies available only to other investment companies and accounts managed by Fidelity Management & Research Company (FMR) and its affiliates. The Fund's Schedule of Investments lists each of the Fidelity Central Funds held as of period end, if any, as an investment of the Fund, but does not include the underlying holdings of each Fidelity Central Fund. As an Investing Fund, the Fund indirectly bears its proportionate share of the expenses of the underlying Fidelity Central Funds.
The Money Market Central Funds seek preservation of capital and current income and are managed by Fidelity Investments Money Management, Inc. (FIMM), an affiliate of FMR.
A complete unaudited list of holdings for each Fidelity Central Fund is available upon request or at the Securities and Exchange Commission (the SEC) web site at www.sec.gov. In addition, the financial statements of the Fidelity Central Funds, which are not covered by the Fund's Report of Independent Registered Public Accounting Firm, are available on the SEC web site or upon request.
3. Significant Accounting Policies.
The financial statements have been prepared in conformity with accounting principles generally accepted in the United States of America (GAAP), which require management to make certain estimates and assumptions at the date of the financial statements. Actual results could differ from those estimates. Subsequent events, if any, through the date that the financial statements were issued have been evaluated in the preparation of the financial statements. The following summarizes the significant accounting policies of the Fund:
Security Valuation. Investments are valued as of 4:00 p.m. Eastern time on the last calendar day of the period. In accordance with valuation policies and procedures approved by the Board of Trustees (the Board), the Fund attempts to obtain prices from one or more third party pricing vendor or broker to value its investments. When current market prices, quotations or rates are not readily available or reliable, securities will be fair valued in good faith by the FMR Fair Value Committee (the Committee), in accordance with procedures adopted by the Fund's Board. Factors used in determining fair value vary by security type and may include market or security specific events. The frequency with which these procedures are used cannot be predicted and they may be utilized to a significant extent. The Committee oversees the Fund's valuation policies and procedures and is responsible for approving and reporting to the Board all fair value determinations.
The Fund categorizes the inputs to valuation techniques used to value its investments into a disclosure hierarchy consisting of three levels as shown below:
Level 1 - quoted prices in active markets for identical investments
Level 2 - other significant observable inputs (including quoted prices for similar investments, interest rates, prepayment speeds, etc.)
Level 3 - unobservable inputs (including the Fund's own assumptions based on the best information available)
Valuation techniques used to value the Fund's investments by major category are as follows:
Equity securities, including restricted securities, for which market quotations are readily available, are valued at the last reported sale price or official closing price as reported by a third party pricing vendor on the primary market or exchange on which they are traded and are categorized as Level 1 in the hierarchy. In the event there were no sales during the day or closing prices are not available, securities are valued at the last quoted bid price or may be valued using the last available price and are generally categorized as Level 2 in the hierarchy. For foreign equity securities, when significant market or security specific events arise, comparisons to the valuation of American Depositary Receipts (ADRs), futures contracts, Exchange-Traded Funds (ETFs) and certain indexes as well as quoted prices for similar securities are used and are categorized as Level 2 in the hierarchy. Utilizing these techniques may result in transfers between Level 1 and Level 2.
Annual Report
3. Significant Accounting Policies - continued
Security Valuation - continued
Investments in open-end mutual funds, including the Fidelity Central Funds, are valued at their closing net asset value each business day and are categorized as Level 1 in the hierarchy.
Changes in valuation techniques may result in transfers in or out of an assigned level within the disclosure hierarchy.
Foreign Currency Translation. The Fund may use foreign currency contracts to facilitate transactions in foreign-denominated securities. Gains and losses from these transactions may arise from changes in the value of the foreign currency or if the counterparties do not perform under the contracts' terms.
Foreign-denominated assets, including investment securities, and liabilities are translated into U.S. dollars at the exchange rates at period end. Purchases and sales of investment securities, income and dividends received and expenses denominated in foreign currencies are translated into U.S. dollars at the exchange rate in effect on the transaction date.
The effects of exchange rate fluctuations on investments are included with the net realized and unrealized gain (loss) on investment securities. Other foreign currency transactions resulting in realized and unrealized gain (loss) are disclosed separately.
Investment Transactions and Income. For financial reporting purposes, the Fund's investment holdings and NAV include trades executed through the end of the last business day of the period. The NAV per share for processing shareholder transactions is calculated as of the close of business of the New York Stock Exchange (NYSE), normally 4:00 p.m. Eastern time and includes trades executed through the end of the prior business day. Gains and losses on securities sold are determined on the basis of identified cost and may include proceeds received from litigation. Dividend income is recorded on the ex-dividend date, except for certain dividends from foreign securities where the ex-dividend date may have passed, which are recorded as soon as the Fund is informed of the ex-dividend date. Non-cash dividends included in dividend income, if any, are recorded at the fair market value of the securities received. Distributions received on securities that represent a return of capital or capital gain are recorded as a reduction of cost of investments and/or as a realized gain. The Fund estimates the components of distributions received that may be considered return of capital distributions or capital gain distributions. Interest income and distributions from the Fidelity Central Funds are accrued as earned. Interest income includes coupon interest and amortization of premium and accretion of discount on debt securities. Investment income is recorded net of foreign taxes withheld where recovery of such taxes is uncertain.
Expenses. Expenses directly attributable to a fund are charged to that fund. Expenses attributable to more than one fund are allocated among the respective funds on the basis of relative net assets or other appropriate methods. Expense estimates are accrued in the period to which they relate and adjustments are made when actual amounts are known.
Income Tax Information and Distributions to Shareholders. Each year, the Fund intends to qualify as a regulated investment company under Subchapter M of the Internal Revenue Code, including distributing substantially all of its taxable income and realized gains. As a result, no provision for income taxes is required. As of July 31, 2012, the Fund did not have any unrecognized tax benefits in the financial statements; nor is the Fund aware of any tax positions for which it is reasonably possible that the total amounts of unrecognized tax benefits will significantly change in the next twelve months. The Fund files a U.S. federal tax return, in addition to state and local tax returns as required. A fund's federal income tax returns are subject to examination by the Internal Revenue Service (IRS) for a period of three fiscal years after they are filed. State and local tax returns may be subject to examination for an additional fiscal year depending on the jurisdiction. Foreign taxes are provided for based on the Fund's understanding of the tax rules and rates that exist in the foreign markets in which it invests.
Distributions are declared and recorded on the ex-dividend date. Income dividends and capital gain distributions are declared separately for each class. Income and capital gain distributions are determined in accordance with income tax regulations, which may differ from GAAP. In addition, the Fund claimed a portion of the payment made to redeeming shareholders as a distribution for income tax purposes.
Capital accounts within the financial statements are adjusted for permanent book-tax differences. These adjustments have no impact on net assets or the results of operations. Temporary book-tax differences will reverse in a subsequent period.
Book-tax differences are primarily due to foreign currency transactions, certain foreign taxes, deferred trustees compensation and losses deferred due to wash sales and excise tax regulations.
The federal tax cost of investment securities and unrealized appreciation (depreciation) as of period end were as follows:
Gross unrealized appreciation | $ 8,537,826 |
Gross unrealized depreciation | (1,468,209) |
Net unrealized appreciation (depreciation) on securities and other investments | $ 7,069,617 |
| |
Tax Cost | $ 56,496,538 |
Annual Report
Fidelity Advisor Consumer Discretionary Fund
Notes to Financial Statements - continued
3. Significant Accounting Policies - continued
Income Tax Information and Distributions to Shareholders - continued
The tax-based components of distributable earnings as of period end were as follows:
Undistributed long-term capital gain | $ 3,326,104 |
Net unrealized appreciation (depreciation) | $ 7,069,520 |
The tax character of distributions paid was as follows:
| July 31, 2012 | July 31, 2011 |
Ordinary Income | $ 82,290 | $ - |
Long-term Capital Gains | 2,716,672 | - |
Total | $ 2,798,962 | $ - |
Short-Term Trading (Redemption) Fees. Shares held by investors in the Fund less than 30 days are subject to a redemption fee equal to .75% of the net asset value of shares redeemed. All redemption fees, which reduce the proceeds of the shareholder redemption, are retained by the Fund and accounted for as an addition to paid in capital.
New Accounting Pronouncement. In December 2011, the Financial Accounting Standards Board issued Accounting Standard Update No. 2011-11, Disclosures about Offsetting Assets and Liabilities. The update creates new disclosure requirements requiring entities to disclose both gross and net information for derivatives and other financial instruments that are either offset in the Statement of Assets and Liabilities or subject to an enforceable master netting arrangement or similar agreement. The disclosure requirements are effective for interim and annual reporting periods beginning on or after January 1, 2013. Management is currently evaluating the impact of the update's adoption on the Fund's financial statement disclosures.
4. Purchases and Sales of Investments.
Purchases and sales of securities, other than short-term securities, aggregated $132,408,875 and $127,632,717, respectively.
5. Fees and Other Transactions with Affiliates.
Management Fee. FMR and its affiliates provide the Fund with investment management related services for which the Fund pays a monthly management fee. The management fee is the sum of an individual fund fee rate that is based on an annual rate of .30% of the Fund's average net assets and an annualized group fee rate that averaged .26% during the period. The group fee rate is based upon the average net assets of all the mutual funds advised by FMR. The group fee rate decreases as assets under management increase and increases as assets under management decrease. For the period, the total annual management fee rate was .56% of the Fund's average net assets.
Distribution and Service Plan Fees. In accordance with Rule 12b-1 of the 1940 Act, the Fund has adopted separate Distribution and Service Plans for each class of shares. Certain classes pay Fidelity Distributors Corporation (FDC), an affiliate of FMR, separate Distribution and Service Fees, each of which is based on an annual percentage of each class' average net assets. In addition, FDC may pay financial intermediaries for selling shares of the Fund and providing shareholder support services. For the period, the Distribution and Service Fee rates, total fees and amounts retained by FDC were as follows:
| Distribution
Fee | Service
Fee | Total Fees | Retained
by FDC |
Class A | -% | .25% | $ 55,927 | $ 1,999 |
Class T | .25% | .25% | 48,616 | 36 |
Class B | .75% | .25% | 28,529 | 21,409 |
Class C | .75% | .25% | 97,459 | 17,622 |
| | | $ 230,531 | $ 41,066 |
Sales Load. FDC may receive a front-end sales charge of up to 5.75% for selling Class A shares and 3.50% for selling Class T shares, some of which is paid to financial intermediaries for selling shares of the Fund. Depending on the holding period, FDC may receive contingent deferred sales charges levied on Class A, Class T, Class B, and Class C redemptions. The deferred sales charges range from 5.00% to 1.00% for Class B shares, 1.00% for Class C shares, 1.00% for certain purchases of Class A shares and .25% for certain purchases of Class T shares.
Annual Report
5. Fees and Other Transactions with Affiliates - continued
Sales Load - continued
For the period, sales charge amounts retained by FDC were as follows:
| Retained
by FDC |
Class A | $ 22,837 |
Class T | 4,056 |
Class B* | 3,769 |
Class C* | 776 |
| $ 31,438 |
* When Class B and Class C shares are initially sold, FDC pays commissions from its own resources to financial intermediaries through which the sales are made.
Transfer Agent Fees. Fidelity Investments Institutional Operations Company, Inc. (FIIOC), an affiliate of FMR, is the transfer, dividend disbursing and shareholder servicing agent for each class of the Fund. FIIOC receives account fees and asset-based fees that vary according to the account size and type of account of the shareholders of the respective classes of the Fund. FIIOC pays for typesetting, printing and mailing of shareholder reports, except proxy statements. For the period, transfer agent fees for each class were as follows:
| Amount | % of
Average
Net Assets |
Class A | $ 66,861 | .30 |
Class T | 30,637 | .32 |
Class B | 8,681 | .30 |
Class C | 25,473 | .26 |
Institutional Class | 23,435 | .17 |
| $ 155,087 | |
Accounting and Security Lending Fees. Fidelity Service Company, Inc. (FSC), an affiliate of FMR, maintains the Fund's accounting records. The accounting fee is based on the level of average net assets for each month. Under a separate contract, FSC administers the security lending program. The security lending fee is based on the number and duration of lending transactions.
Brokerage Commissions. The Fund placed a portion of its portfolio transactions with brokerage firms which are affiliates of the investment adviser. The commissions paid to these affiliated firms were $4,616 for the period.
6. Committed Line of Credit.
The Fund participates with other funds managed by FMR or an affiliate in a $4.25 billion credit facility (the "line of credit") to be utilized for temporary or emergency purposes to fund shareholder redemptions or for other short-term liquidity purposes. The Fund has agreed to pay commitment fees on its pro-rata portion of the line of credit, which amounted to $162 and is reflected in Miscellaneous expenses on the Statement of Operations. During the period, there were no borrowings on this line of credit.
7. Security Lending.
The Fund lends portfolio securities through a lending agent from time to time in order to earn additional income. For equity securities, a lending agent is used and may loan securities to certain qualified borrowers, including Fidelity Capital Markets (FCM), a broker-dealer affiliated with the Fund. On the settlement date of the loan, the Fund receives collateral (in the form of U.S. Treasury obligations, letters of credit and/or cash) against the loaned securities and maintains collateral in an amount not less than 100% of the market value of the loaned securities during the period of the loan. The market value of the loaned securities is determined at the close of business of the Fund and any additional required collateral is delivered to the Fund on the next business day. If the borrower defaults on its obligation to return the securities loaned because of insolvency or other reasons, a fund could experience delays and costs in recovering the securities loaned or in gaining access to the collateral. Any cash collateral received is invested in the Fidelity Securities Lending Cash Central Fund. At period end, there were no security loans outstanding. Security lending income represents the income earned on investing cash collateral, less rebates paid to borrowers and any lending agent fees associated with the loan, plus any premium payments received for lending certain types of securities. Security lending income is presented in the Statement of Operations as a component of income from Fidelity Central Funds. During the period, there were no securities loaned to FCM.
Annual Report
Fidelity Advisor Consumer Discretionary Fund
Notes to Financial Statements - continued
8. Bank Borrowings.
The Fund is permitted to have bank borrowings for temporary or emergency purposes to fund shareholder redemptions or for other short-term liquidity requirements. The Fund has established borrowing arrangements with certain banks. The interest rate on the borrowings is the bank's base rate, as revised from time to time. The average loan balance during the period for which loans were outstanding amounted to $9,423,333. The weighted average interest rate was .67%. The interest expense amounted to $523 under the bank borrowing program. At period end, there were no bank borrowings outstanding.
9. Expense Reductions.
Many of the brokers with whom FMR places trades on behalf of the Fund provided services to the Fund in addition to trade execution. These services included payments of certain expenses on behalf of the Fund totaling $4,472 for the period.
10. Distributions to Shareholders.
Distributions to shareholders of each class were as follows:
Years ended July 31, | 2012 | 2011 |
From net investment income | | |
Class A | $ 44,402 | $ - |
Class T | 11,934 | - |
Institutional Class | 25,954 | - |
Total | $ 82,290 | $ - |
From net realized gain | | |
Class A | $ 1,117,697 | $ - |
Class T | 525,372 | - |
Class B | 185,641 | - |
Class C | 423,815 | - |
Institutional Class | 464,147 | - |
Total | $ 2,716,672 | $ - |
11. Share Transactions.
Transactions for each class of shares were as follows:
| Shares | Dollars |
Years ended July 31, | 2012 | 2011 | 2012 | 2011 |
Class A | | | | |
Shares sold | 717,075 | 665,093 | $ 11,323,395 | $ 10,095,802 |
Reinvestment of distributions | 76,740 | - | 1,020,698 | - |
Shares redeemed | (622,172) | (723,296) | (9,280,575) | (10,778,369) |
Net increase (decrease) | 171,643 | (58,203) | $ 3,063,518 | $ (682,567) |
Class T | | | | |
Shares sold | 117,936 | 187,572 | $ 1,759,305 | $ 2,764,268 |
Reinvestment of distributions | 40,961 | - | 523,233 | - |
Shares redeemed | (129,403) | (196,717) | (1,880,946) | (2,907,152) |
Net increase (decrease) | 29,494 | (9,145) | $ 401,592 | $ (142,884) |
Class B | | | | |
Shares sold | 21,180 | 40,939 | $ 276,635 | $ 519,870 |
Reinvestment of distributions | 13,190 | - | 154,193 | - |
Shares redeemed | (76,089) | (137,051) | (1,037,384) | (1,818,569) |
Net increase (decrease) | (41,719) | (96,112) | $ (606,556) | $ (1,298,699) |
Class C | | | | |
Shares sold | 581,986 | 588,992 | $ 8,055,378 | $ 8,103,013 |
Reinvestment of distributions | 33,472 | - | 392,295 | - |
Shares redeemed | (183,759) | (885,890) | (2,469,033) | (12,399,353) |
Net increase (decrease) | 431,699 | (296,898) | $ 5,978,640 | $ (4,296,340) |
Annual Report
11. Share Transactions - continued
| Shares | Dollars |
Years ended July 31, | 2012 | 2011 | 2012 | 2011 |
Institutional Class | | | | |
Shares sold | 1,043,471 | 346,649 | $ 16,050,433 | $ 5,583,185 |
Reinvestment of distributions | 13,483 | - | 188,283 | - |
Shares redeemed | (1,033,551) | (463,053) | (16,740,297) | (7,057,345) |
Net increase (decrease) | 23,403 | (116,404) | $ (501,581) | $ (1,474,160) |
12. Other.
The Fund's organizational documents provide former and current trustees and officers with a limited indemnification against liabilities arising in connection with the performance of their duties to the Fund. In the normal course of business, the Fund may also enter into contracts that provide general indemnifications. The Fund's maximum exposure under these arrangements is unknown as this would be dependent on future claims that may be made against the Fund. The risk of material loss from such claims is considered remote.
Annual Report
Fidelity Advisor Electronics Fund - Class A, T, B, and C
Average annual total return reflects the change in the value of an investment, assuming reinvestment of the class' distributions from dividend income and capital gains (the profits earned upon the sale of securities that have grown in value, if any) and assuming a constant rate of performance each year. The $10,000 table and the fund's returns do not reflect the deduction of taxes that a shareholder would pay on fund distributions or the redemption of fund shares. During periods of reimbursement by Fidelity, a fund's total return will be greater than it would be had the reimbursement not occurred. How a fund did yesterday is no guarantee of how it will do tomorrow. Returns reflect the conversion of Class B shares to Class A shares after a maximum of seven years.
Average Annual Total Returns
Periods ended July 31, 2012 | Past 1
year | Past 5
years | Past 10
years |
Class A (incl. 5.75% sales charge) | -10.82% | -2.58% | 3.68% |
Class T (incl. 3.50% sales charge) | -8.92% | -2.38% | 3.67% |
Class B (incl. contingent deferred
sales charge) A | -10.73% | -2.58% | 3.74% |
Class C (incl. contingent deferred
sales charge) B | -7.09% | -2.19% | 3.51% |
A Class B shares' contingent deferred sales charges included in the past one year, past five years, and past ten years total return figures are 5%, 2%, and 0%, respectively.
B Class C shares' contingent deferred sales charges included in the past one year, past five years, and past ten years total return figures are 1%, 0%, and 0%, respectively.
$10,000 Over 10 Years
Let's say hypothetically that $10,000 was invested in Fidelity Advisor Electronics Fund - Class A on July 31, 2002, and the current 5.75% sales charge was paid. The chart shows how the value of your investment would have changed, and also shows how the S&P 500 Index performed over the same period.
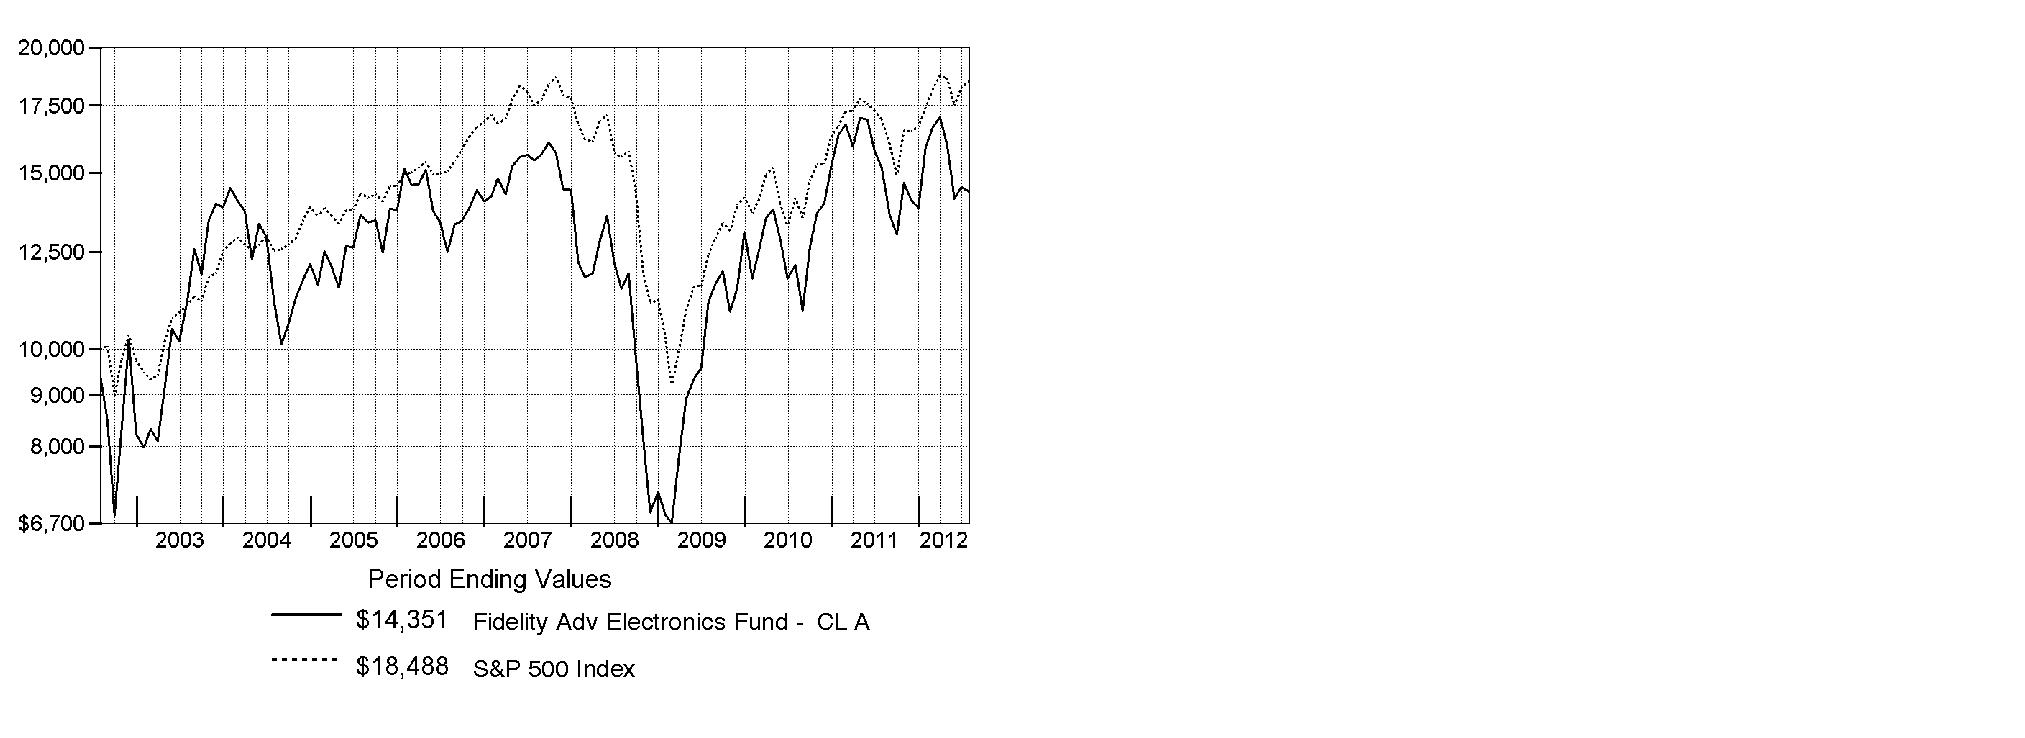
Annual Report
Fidelity Advisor Electronics Fund
Market Recap: Major U.S. equity benchmarks posted solid gains for the year ending July 31, 2012, amid an uncertain investment environment. The broad-based S&P 500® Index returned 9.13%, while the blue-chip-laden Dow Jones Industrial AverageSM and technology-heavy Nasdaq Composite® Index gained 10.12% and 7.83%, respectively. Volatility spiked during the period's first half, as equities plummeted late last summer on Europe's debt woes, political wrangling over the U.S. debt ceiling and the sovereign credit-rating downgrade that followed. By October, a seemingly improved U.S. economy rejuvenated stocks, paving the way for major equity benchmarks to post their best first-quarter performance since 1998. However, more eurozone trouble, signs that the U.S. economy had turned sluggish and a slowdown in China caused stocks to slip in May, before a new wave of optimism took hold in June and July. Within the S&P 500®, more-defensive sectors such as telecommunication services (+30%) and consumer staples (+20%) fared best, while materials and energy significantly underperformed, returning -5%. Small- and mid-cap stocks trailed their less-volatile large-cap counterparts, with the Russell 2000® Index adding 0.19% and the Russell Midcap® Index rising 2.28%. Given turmoil and local currency weakness in Europe, foreign developed-markets stocks lost ground, with the MSCI® EAFE® Index returning -11.32%.
Comments from Stephen Barwikowski and Christopher Lin, Co-Portfolio Managers of Fidelity Advisor® Electronics Fund: For the year, the fund's Class A, Class T, Class B and Class C shares returned -5.38%, -5.61%, -6.03% and -6.15%, respectively (excluding sales charges), trailing the -3.11% return of the MSCI® U.S. IM Semiconductors & Semiconductor Equipment 25/50 Index and also lagging the S&P 500®. Versus the MSCI index, weak stock selection in semiconductors - in large part due to a sizable underweighting in strong-performing benchmark heavyweight Intel - had by far the most negative impact on relative performance. That said, Intel was the fund's second-best absolute contributor. Substantial overweightings in Intel competitor Advanced Micro Devices and Freescale Semiconductor also hurt relative results. Conversely, stock selection in semiconductor equipment bolstered the fund's performance, as did out-of-index exposure to electronic manufacturing services. At the individual stock level, negligible exposure to weak-performing benchmark component First Solar was timely. Another notable contributor was Skyworks Solutions, a provider of radio frequency components in handsets. We took advantage of temporary weakness in the stock to benefit from its strong rebound beginning in December 2011. Later in the period, we sold some of the position to nail down profits.
The views expressed above reflect those of the portfolio manager(s) only through the end of the period as stated on the cover of this report and do not necessarily represent the views of Fidelity or any other person in the Fidelity organization. Any such views are subject to change at any time based upon market or other conditions and Fidelity disclaims any responsibility to update such views. These views may not be relied on as investment advice and, because investment decisions for a Fidelity fund are based on numerous factors, may not be relied on as an indication of trading intent on behalf of any Fidelity fund.
Annual Report
Fidelity Advisor Electronics Fund
As a shareholder of the Fund, you incur two types of costs: (1) transaction costs, including sales charges (loads) on purchase payments or redemption proceeds, redemption fees and (2) ongoing costs, including management fees, distribution and/or service (12b-1) fees and other Fund expenses. This Example is intended to help you understand your ongoing costs (in dollars) of investing in the Fund and to compare these costs with the ongoing costs of investing in other mutual funds.
The Example is based on an investment of $1,000 invested at the beginning of the period and held for the entire period (February 1, 2012 to July 31, 2012).
Actual Expenses
The first line of the accompanying table for each class of the Fund provides information about actual account values and actual expenses. You may use the information in this line, together with the amount you invested, to estimate the expenses that you paid over the period. Simply divide your account value by $1,000.00 (for example, an $8,600 account value divided by $1,000.00 = 8.6), then multiply the result by the number in the first line for a class of the Fund under the heading entitled "Expenses Paid During Period" to estimate the expenses you paid on your account during this period. In addition, the Fund, as a shareholder in the underlying Fidelity Central Funds, will indirectly bear its pro-rata share of the fees and expenses incurred by the underlying Fidelity Central Funds. These fees and expenses are not included in the Fund's annualized expense ratio used to calculate the expense estimate in the table below.
Hypothetical Example for Comparison Purposes
The second line of the accompanying table for each class of the Fund provides information about hypothetical account values and hypothetical expenses based on a Class' actual expense ratio and an assumed rate of return of 5% per year before expenses, which is not the Class' actual return. The hypothetical account values and expenses may not be used to estimate the actual ending account balance or expenses you paid for the period. You may use this information to compare the ongoing costs of investing in the Fund and other funds. To do so, compare this 5% hypothetical example with the 5% hypothetical examples that appear in the shareholder reports of the other funds. In addition, the Fund, as a shareholder in the underlying Fidelity Central Funds, will indirectly bear its pro-rata share of the fees and expenses incurred by the underlying Fidelity Central Funds. These fees and expenses are not included in the Fund's annualized expense ratio used to calculate the expense estimate in the table below.
Please note that the expenses shown in the table are meant to highlight your ongoing costs only and do not reflect any transaction costs. Therefore, the second line of the table is useful in comparing ongoing costs only, and will not help you determine the relative total costs of owning different funds. In addition, if these transactional costs were included, your costs would have been higher.
| Annualized
Expense Ratio | Beginning
Account Value
February 1, 2012 | Ending
Account Value
July 31, 2012 | Expenses Paid
During Period*
February 1, 2012
to July 31, 2012 |
Class A | 1.40% | | | |
Actual | | $ 1,000.00 | $ 903.70 | $ 6.63 |
HypotheticalA | | $ 1,000.00 | $ 1,017.90 | $ 7.02 |
Class T | 1.65% | | | |
Actual | | $ 1,000.00 | $ 902.50 | $ 7.80 |
HypotheticalA | | $ 1,000.00 | $ 1,016.66 | $ 8.27 |
Class B | 2.15% | | | |
Actual | | $ 1,000.00 | $ 900.60 | $ 10.16 |
HypotheticalA | | $ 1,000.00 | $ 1,014.17 | $ 10.77 |
Class C | 2.15% | | | |
Actual | | $ 1,000.00 | $ 899.40 | $ 10.15 |
HypotheticalA | | $ 1,000.00 | $ 1,014.17 | $ 10.77 |
Institutional Class | 1.15% | | | |
Actual | | $ 1,000.00 | $ 905.50 | $ 5.45 |
HypotheticalA | | $ 1,000.00 | $ 1,019.14 | $ 5.77 |
A 5% return per year before expenses
* Expenses are equal to each Class' annualized expense ratio, multiplied by the average account value over the period, multiplied by 182/366 (to reflect the one-half year period).
Annual Report
Fidelity Advisor Electronics Fund
Investment Changes (Unaudited)
Top Ten Stocks as of July 31, 2012 |
| % of fund's
net assets | % of fund's net assets
6 months ago |
Broadcom Corp. Class A | 9.7 | 8.3 |
Texas Instruments, Inc. | 9.2 | 8.6 |
Altera Corp. | 5.3 | 2.2 |
Freescale Semiconductor Holdings I Ltd. | 5.2 | 3.6 |
Marvell Technology Group Ltd. | 4.8 | 9.1 |
Intersil Corp. Class A | 4.4 | 3.6 |
QUALCOMM, Inc. | 4.2 | 1.9 |
NXP Semiconductors NV | 4.1 | 2.7 |
Avago Technologies Ltd. | 4.1 | 1.8 |
ON Semiconductor Corp. | 3.9 | 3.5 |
| 54.9 | |
Top Industries (% of fund's net assets) |
As of July 31, 2012 |
| Semiconductors & Semiconductor Equipment | 81.1% | |
| Electronic Equipment & Components | 9.2% | |
| Communications Equipment | 6.7% | |
| Computers & Peripherals | 1.3% | |
| Biotechnology | 0.0% | |
| All Others* | 1.7% | |

As of January 31, 2012 |
| Semiconductors & Semiconductor Equipment | 83.8% | |
| Electronic Equipment & Components | 5.4% | |
| Communications Equipment | 2.7% | |
| Computers & Peripherals | 2.4% | |
| Internet Software & Services | 0.7% | |
| All Others* | 5.0% | |

* Includes short-term investments and net other assets. |
Annual Report
Fidelity Advisor Electronics Fund
Investments July 31, 2012
Showing Percentage of Net Assets
Common Stocks - 98.3% |
| Shares | | Value |
BIOTECHNOLOGY - 0.0% |
Biotechnology - 0.0% |
Arrowhead Research Corp. warrants 5/21/17 (a)(e) | 64,879 | | $ 1 |
COMMUNICATIONS EQUIPMENT - 6.7% |
Communications Equipment - 6.7% |
Acme Packet, Inc. (a)(d) | 4,180 | | 66,253 |
Brocade Communications Systems, Inc. (a) | 18,703 | | 92,954 |
Finisar Corp. (a) | 3,872 | | 48,129 |
Polycom, Inc. (a) | 14,178 | | 123,916 |
QUALCOMM, Inc. | 12,107 | | 722,546 |
Riverbed Technology, Inc. (a) | 5,608 | | 98,925 |
| | 1,152,723 |
COMPUTERS & PERIPHERALS - 1.3% |
Computer Hardware - 0.4% |
Hewlett-Packard Co. | 4,070 | | 74,237 |
Computer Storage & Peripherals - 0.9% |
Fusion-io, Inc. (a) | 100 | | 1,912 |
QLogic Corp. (a) | 1,752 | | 20,218 |
SanDisk Corp. (a) | 3,192 | | 131,287 |
Synaptics, Inc. (a) | 70 | | 1,847 |
| | 155,264 |
TOTAL COMPUTERS & PERIPHERALS | | 229,501 |
ELECTRONIC EQUIPMENT & COMPONENTS - 9.2% |
Electronic Components - 1.8% |
Aeroflex Holding Corp. (a) | 32,536 | | 195,541 |
Amphenol Corp. Class A | 130 | | 7,654 |
Corning, Inc. | 4,855 | | 55,396 |
InvenSense, Inc. (d) | 4,216 | | 54,386 |
| | 312,977 |
Electronic Manufacturing Services - 7.4% |
Benchmark Electronics, Inc. (a) | 9,767 | | 153,928 |
Fabrinet (a) | 1,388 | | 18,433 |
Flextronics International Ltd. (a) | 59,219 | | 379,594 |
Jabil Circuit, Inc. | 20,137 | | 436,973 |
TE Connectivity Ltd. | 1,400 | | 46,214 |
TTM Technologies, Inc. (a) | 22,822 | | 249,673 |
Viasystems Group, Inc. (a) | 12 | | 185 |
| | 1,285,000 |
Technology Distributors - 0.0% |
Avnet, Inc. (a) | 180 | | 5,670 |
TOTAL ELECTRONIC EQUIPMENT & COMPONENTS | | 1,603,647 |
SEMICONDUCTORS & SEMICONDUCTOR EQUIPMENT - 81.1% |
Semiconductor Equipment - 4.5% |
Advanced Energy Industries, Inc. (a) | 15 | | 185 |
Amkor Technology, Inc. (a) | 45 | | 240 |
Applied Materials, Inc. | 3,214 | | 35,000 |
|
| Shares | | Value |
ASML Holding NV | 2,770 | | $ 159,275 |
Cabot Microelectronics Corp. | 60 | | 1,764 |
Cohu, Inc. | 20 | | 172 |
Cymer, Inc. (a) | 3,820 | | 218,542 |
Entegris, Inc. (a) | 10,591 | | 85,258 |
KLA-Tencor Corp. | 1,310 | | 66,692 |
Lam Research Corp. (a) | 5,967 | | 205,324 |
MEMC Electronic Materials, Inc. (a) | 82 | | 157 |
Nanometrics, Inc. (a) | 420 | | 6,380 |
Nova Measuring Instruments Ltd. (a) | 280 | | 2,285 |
Teradyne, Inc. (a) | 30 | | 441 |
| | 781,715 |
Semiconductors - 76.6% |
Advanced Micro Devices, Inc. (a) | 93,627 | | 380,126 |
Alpha & Omega Semiconductor Ltd. (a) | 8,434 | | 65,026 |
Altera Corp. | 26,113 | | 925,706 |
Analog Devices, Inc. | 3,240 | | 126,619 |
Applied Micro Circuits Corp. (a) | 6,883 | | 39,371 |
Atmel Corp. (a) | 22,067 | | 129,313 |
Avago Technologies Ltd. | 18,996 | | 702,852 |
BCD Semiconductor Manufacturing Ltd. ADR (a) | 22,195 | | 84,563 |
Broadcom Corp. Class A | 49,887 | | 1,690,163 |
Cirrus Logic, Inc. (a) | 6,580 | | 241,947 |
Cypress Semiconductor Corp. | 30,959 | | 330,952 |
Entropic Communications, Inc. (a)(d) | 13,182 | | 79,092 |
Exar Corp. (a) | 270 | | 1,998 |
Fairchild Semiconductor International, Inc. (a) | 3,503 | | 48,552 |
First Solar, Inc. (a)(d) | 2,398 | | 37,265 |
Freescale Semiconductor Holdings I Ltd. (a)(d) | 84,501 | | 901,626 |
Inphi Corp. (a) | 4,600 | | 50,600 |
Intel Corp. | 24,155 | | 620,784 |
Intermolecular, Inc. | 10,206 | | 67,972 |
International Rectifier Corp. (a) | 2,970 | | 50,609 |
Intersil Corp. Class A | 83,173 | | 766,023 |
Linear Technology Corp. | 40 | | 1,290 |
LSI Corp. (a) | 6,811 | | 46,996 |
MagnaChip Semiconductor Corp. (a) | 200 | | 2,036 |
Marvell Technology Group Ltd. | 73,583 | | 828,545 |
Maxim Integrated Products, Inc. | 2,690 | | 73,249 |
MediaTek, Inc. | 5,000 | | 42,585 |
Micron Technology, Inc. (a) | 72,204 | | 448,387 |
Motech Industries, Inc. | 1 | | 1 |
NVIDIA Corp. (a) | 45,151 | | 611,345 |
NXP Semiconductors NV (a) | 31,757 | | 717,391 |
O2Micro International Ltd. sponsored ADR (a) | 8,500 | | 32,980 |
ON Semiconductor Corp. (a) | 97,899 | | 679,419 |
PMC-Sierra, Inc. (a) | 40,533 | | 215,636 |
RDA Microelectronics, Inc. sponsored ADR (a) | 1,018 | | 10,160 |
Renesas Electronics Corp. (a)(d) | 9,900 | | 32,954 |
Common Stocks - continued |
| Shares | | Value |
SEMICONDUCTORS & SEMICONDUCTOR EQUIPMENT - CONTINUED |
Semiconductors - continued |
RF Micro Devices, Inc. (a) | 19,762 | | $ 76,677 |
Samsung Electronics Co. Ltd. | 34 | | 39,362 |
Skyworks Solutions, Inc. (a) | 12,344 | | 357,112 |
Spansion, Inc. Class A | 8,562 | | 87,761 |
STATS ChipPAC Ltd. (a) | 129,000 | | 38,356 |
Texas Instruments, Inc. | 58,832 | | 1,602,584 |
Trident Microsystems, Inc. (a) | 19 | | 7 |
Volterra Semiconductor Corp. (a) | 300 | | 6,894 |
Xilinx, Inc. | 90 | | 2,916 |
| | 13,295,802 |
TOTAL SEMICONDUCTORS & SEMICONDUCTOR EQUIPMENT | | 14,077,517 |
TOTAL COMMON STOCKS (Cost $21,595,874) |
17,063,389
|
Money Market Funds - 7.4% |
| | | |
Fidelity Cash Central Fund, 0.17% (b) | 202,302 | | 202,302 |
Fidelity Securities Lending Cash Central Fund, 0.18% (b)(c) | 1,081,614 | | 1,081,614 |
TOTAL MONEY MARKET FUNDS (Cost $1,283,916) |
1,283,916
|
TOTAL INVESTMENT PORTFOLIO - 105.7% (Cost $22,879,790) | | 18,347,305 |
NET OTHER ASSETS (LIABILITIES) - (5.7)% | | (987,559) |
NET ASSETS - 100% | $ 17,359,746 |
Legend |
(a) Non-income producing |
(b) Affiliated fund that is available only to investment companies and other accounts managed by Fidelity Investments. The rate quoted is the annualized seven-day yield of the fund at period end. A complete unaudited listing of the fund's holdings as of its most recent quarter end is available upon request. In addition, each Fidelity Central Fund's financial statements, which are not covered by the Fund's Report of Independent Registered Public Accounting Firm, are available on the SEC's website or upon request. |
(c) Investment made with cash collateral received from securities on loan. |
(d) Security or a portion of the security is on loan at period end. |
(e) Restricted securities - Investment in securities not registered under the Securities Act of 1933 (excluding 144A issues). At the end of the period, the value of restricted securities (excluding 144A issues) amounted to $1 or 0.0% of net assets. |
Additional information on each restricted holding is as follows: |
Security | Acquisition Date | Acquisition Cost |
Arrowhead Research Corp. warrants 5/21/17 | 5/18/07 | $ 234,942 |
Affiliated Central Funds |
Information regarding fiscal year to date income earned by the Fund from investments in Fidelity Central Funds is as follows: |
Fund | Income earned |
Fidelity Cash Central Fund | $ 476 |
Fidelity Securities Lending Cash Central Fund | 2,665 |
Total | $ 3,141 |
Other Information |
The following is a summary of the inputs used, as of July 31, 2012, involving the Fund's assets and liabilities carried at fair value. The inputs or methodology used for valuing securities may not be an indication of the risk associated with investing in those securities. For more information on valuation inputs, and their aggregation into the levels used in the table below, please refer to the Security Valuation section in the accompanying Notes to Financial Statements. |
Valuation Inputs at Reporting Date: |
Description | Total | Level 1 | Level 2 | Level 3 |
Investments in Securities: | | | | |
Common Stocks | $ 17,063,389 | $ 17,030,434 | $ 32,954 | $ 1 |
Money Market Funds | 1,283,916 | 1,283,916 | - | - |
Total Investments in Securities: | $ 18,347,305 | $ 18,314,350 | $ 32,954 | $ 1 |
Distribution of investments by country or territory of incorporation, as a percentage of total net assets, is as follows. (Unaudited) |
United States of America | 76.2% |
Bermuda | 10.4% |
Singapore | 6.5% |
Netherlands | 5.0% |
Others (Individually Less Than 1%) | 1.9% |
| 100.0% |
See accompanying notes which are an integral part of the financial statements.
Annual Report
Fidelity Advisor Electronics Fund
Statement of Assets and Liabilities
| July 31, 2012 |
| | |
Assets | | |
Investment in securities, at value (including securities loaned of $1,096,848) - See accompanying schedule: Unaffiliated issuers (cost $21,595,874) | $ 17,063,389 | |
Fidelity Central Funds (cost $1,283,916) | 1,283,916 | |
Total Investments (cost $22,879,790) | | $ 18,347,305 |
Cash | | 32,380 |
Receivable for investments sold | | 273,452 |
Receivable for fund shares sold | | 6,703 |
Dividends receivable | | 11,215 |
Distributions receivable from Fidelity Central Funds | | 463 |
Receivable from investment adviser for expense reductions | | 3,579 |
Other receivables | | 373 |
Total assets | | 18,675,470 |
| | |
Liabilities | | |
Payable for investments purchased | $ 140,381 | |
Payable for fund shares redeemed | 33,230 | |
Accrued management fee | 8,044 | |
Distribution and service plan fees payable | 6,609 | |
Other affiliated payables | 4,933 | |
Other payables and accrued expenses | 40,913 | |
Collateral on securities loaned, at value | 1,081,614 | |
Total liabilities | | 1,315,724 |
| | |
Net Assets | | $ 17,359,746 |
Net Assets consist of: | | |
Paid in capital | | $ 28,919,750 |
Accumulated net investment loss | | (91,150) |
Accumulated undistributed net realized gain (loss) on investments and foreign currency transactions | | (6,936,369) |
Net unrealized appreciation (depreciation) on investments | | (4,532,485) |
Net Assets | | $ 17,359,746 |
Statement of Assets and Liabilities - continued
| July 31, 2012 |
| | |
Calculation of Maximum Offering Price Class A:
Net Asset Value and redemption price per share ($6,000,387 ÷ 710,370 shares) | | $ 8.45 |
| | |
Maximum offering price per share (100/94.25 of $8.45) | | $ 8.97 |
Class T:
Net Asset Value and redemption price per share ($3,908,680 ÷ 474,362 shares) | | $ 8.24 |
| | |
Maximum offering price per share (100/96.50 of $8.24) | | $ 8.54 |
Class B:
Net Asset Value and offering price per share ($458,868 ÷ 58,898 shares)A | | $ 7.79 |
| | |
Class C:
Net Asset Value and offering price per share ($3,721,177 ÷ 478,158 shares)A | | $ 7.78 |
| | |
Institutional Class:
Net Asset Value, offering price and redemption price per share ($3,270,634 ÷ 375,271 shares) | | $ 8.72 |
A Redemption price per share is equal to net asset value less any applicable contingent deferred sales charge.
See accompanying notes which are an integral part of the financial statements.
Annual Report
Statement of Operations
| Year ended July 31, 2012 |
| | |
Investment Income | | |
Dividends | | $ 143,311 |
Interest | | 4,868 |
Income from Fidelity Central Funds | | 3,141 |
Total income | | 151,320 |
| | |
Expenses | | |
Management fee | $ 98,365 | |
Transfer agent fees | 54,932 | |
Distribution and service plan fees | 82,272 | |
Accounting and security lending fees | 7,078 | |
Custodian fees and expenses | 32,868 | |
Independent trustees' compensation | 117 | |
Registration fees | 53,842 | |
Audit | 43,499 | |
Legal | 107 | |
Miscellaneous | 165 | |
Total expenses before reductions | 373,245 | |
Expense reductions | (89,845) | 283,400 |
Net investment income (loss) | | (132,080) |
Realized and Unrealized Gain (Loss) Net realized gain (loss) on: | | |
Investment securities: | | |
Unaffiliated issuers | (811,255) | |
Foreign currency transactions | (435) | |
Total net realized gain (loss) | | (811,690) |
Change in net unrealized appreciation (depreciation) on: Investment securities | (927,868) | |
Assets and liabilities in foreign currencies | 4 | |
Total change in net unrealized appreciation (depreciation) | | (927,864) |
Net gain (loss) | | (1,739,554) |
Net increase (decrease) in net assets resulting from operations | | $ (1,871,634) |
Statement of Changes in Net Assets
| Year ended
July 31,
2012 | Year ended
July 31,
2011 |
Increase (Decrease) in Net Assets | | |
Operations | | |
Net investment income (loss) | $ (132,080) | $ (122,750) |
Net realized gain (loss) | (811,690) | 4,303,621 |
Change in net unrealized appreciation (depreciation) | (927,864) | (1,162,047) |
Net increase (decrease) in net assets resulting from operations | (1,871,634) | 3,018,824 |
Share transactions - net increase (decrease) | 925,003 | 1,054,457 |
Redemption fees | 775 | 1,863 |
Total increase (decrease) in net assets | (945,856) | 4,075,144 |
| | |
Net Assets | | |
Beginning of period | 18,305,602 | 14,230,458 |
End of period (including accumulated net investment loss of $91,150 and $0, respectively) | $ 17,359,746 | $ 18,305,602 |
See accompanying notes which are an integral part of the financial statements.
Annual Report
Financial Highlights - Class A
Years ended July 31, | 2012 | 2011 | 2010 | 2009 | 2008 |
Selected Per-Share Data | | | | | |
Net asset value, beginning of period | $ 8.93 | $ 7.14 | $ 6.59 | $ 6.79 | $ 9.11 |
Income from Investment Operations | | | | | |
Net investment income (loss) C | (.05) | (.04) | (.01) | .04 | - G |
Net realized and unrealized gain (loss) | (.43) | 1.83 | .59 | (.24) | (2.32) |
Total from investment operations | (.48) | 1.79 | .58 | (.20) | (2.32) |
Distributions from net investment income | - | - | (.03) | - | - |
Redemption fees added to paid in capital C, G | - | - | - | - | - |
Net asset value, end of period | $ 8.45 | $ 8.93 | $ 7.14 | $ 6.59 | $ 6.79 |
Total Return A, B | (5.38)% | 25.07% | 8.74% | (2.95)% | (25.47)% |
Ratios to Average Net Assets D, F | | | | | |
Expenses before reductions | 1.88% | 1.89% | 1.97% | 2.44% | 1.72% |
Expenses net of fee waivers, if any | 1.40% | 1.40% | 1.40% | 1.40% | 1.40% |
Expenses net of all reductions | 1.39% | 1.39% | 1.39% | 1.40% | 1.39% |
Net investment income (loss) | (.53)% | (.40)% | (.15)% | .69% | (.02)% |
Supplemental Data | | | | | |
Net assets, end of period (000 omitted) | $ 6,000 | $ 7,537 | $ 5,394 | $ 5,433 | $ 3,970 |
Portfolio turnover rate E | 140% | 166% | 87% | 92% | 93% |
A Total returns would have been lower if certain expenses had not been reduced during the applicable periods shown.
B Total returns do not include the effect of the sales charges.
C Calculated based on average shares outstanding during the period.
D Fees and expenses of any underlying Fidelity Central Funds are not included in the Fund's expense ratio. The Fund indirectly bears its proportionate share of the expenses of any underlying Fidelity Central Funds.
E Amount does not include the portfolio activity of any underlying Fidelity Central Funds.
F Expense ratios reflect operating expenses of the class. Expenses before reductions do not reflect amounts reimbursed by the investment adviser or reductions from brokerage service arrangements or reductions from other expense offset arrangements and do not represent the amount paid by the class during periods when reimbursements or reductions occur. Expenses net of fee waivers reflect expenses after reimbursement by the investment adviser but prior to reductions from brokerage service arrangements or other expense offset arrangements. Expenses net of all reductions represent the net expenses paid by the class.
G Amount represents less than $.01 per share.
Financial Highlights - Class T
Years ended July 31, | 2012 | 2011 | 2010 | 2009 | 2008 |
Selected Per-Share Data | | | | | |
Net asset value, beginning of period | $ 8.73 | $ 7.00 | $ 6.46 | $ 6.67 | $ 8.98 |
Income from Investment Operations | | | | | |
Net investment income (loss) C | (.07) | (.06) | (.03) | .02 | (.02) |
Net realized and unrealized gain (loss) | (.42) | 1.79 | .58 | (.23) | (2.29) |
Total from investment operations | (.49) | 1.73 | .55 | (.21) | (2.31) |
Distributions from net investment income | - | - | (.01) | - | - |
Redemption fees added to paid in capital C, G | - | - | - | - | - |
Net asset value, end of period | $ 8.24 | $ 8.73 | $ 7.00 | $ 6.46 | $ 6.67 |
Total Return A, B | (5.61)% | 24.71% | 8.50% | (3.15)% | (25.72)% |
Ratios to Average Net Assets D, F | | | | | |
Expenses before reductions | 2.23% | 2.25% | 2.26% | 2.77% | 2.02% |
Expenses net of fee waivers, if any | 1.65% | 1.65% | 1.65% | 1.65% | 1.65% |
Expenses net of all reductions | 1.64% | 1.64% | 1.64% | 1.65% | 1.64% |
Net investment income (loss) | (.78)% | (.65)% | (.40)% | .44% | (.27)% |
Supplemental Data | | | | | |
Net assets, end of period (000 omitted) | $ 3,909 | $ 4,476 | $ 3,862 | $ 4,195 | $ 4,635 |
Portfolio turnover rate E | 140% | 166% | 87% | 92% | 93% |
A Total returns would have been lower if certain expenses had not been reduced during the applicable periods shown.
B Total returns do not include the effect of the sales charges.
C Calculated based on average shares outstanding during the period.
D Fees and expenses of any underlying Fidelity Central Funds are not included in the Fund's expense ratio. The Fund indirectly bears its proportionate share of the expenses of any underlying Fidelity Central Funds.
E Amount does not include the portfolio activity of any underlying Fidelity Central Funds.
F Expense ratios reflect operating expenses of the class. Expenses before reductions do not reflect amounts reimbursed by the investment adviser or reductions from brokerage service arrangements or reductions from other expense offset arrangements and do not represent the amount paid by the class during periods when reimbursements or reductions occur. Expenses net of fee waivers reflect expenses after reimbursement by the investment adviser but prior to reductions from brokerage service arrangements or other expense offset arrangements. Expenses net of all reductions represent the net expenses paid by the class.
G Amount represents less than $.01 per share.
See accompanying notes which are an integral part of the financial statements.
Annual Report
Financial Highlights - Class B
Years ended July 31, | 2012 | 2011 | 2010 | 2009 | 2008 |
Selected Per-Share Data | | | | | |
Net asset value, beginning of period | $ 8.29 | $ 6.69 | $ 6.19 | $ 6.43 | $ 8.70 |
Income from Investment Operations | | | | | |
Net investment income (loss) C | (.10) | (.09) | (.06) | - G | (.06) |
Net realized and unrealized gain (loss) | (.40) | 1.69 | .56 | (.24) | (2.21) |
Total from investment operations | (.50) | 1.60 | .50 | (.24) | (2.27) |
Redemption fees added to paid in capital C, G | - | - | - | - | - |
Net asset value, end of period | $ 7.79 | $ 8.29 | $ 6.69 | $ 6.19 | $ 6.43 |
Total Return A, B | (6.03)% | 23.92% | 8.08% | (3.73)% | (26.09)% |
Ratios to Average Net Assets D, F | | | | | |
Expenses before reductions | 2.70% | 2.76% | 2.73% | 3.22% | 2.48% |
Expenses net of fee waivers, if any | 2.15% | 2.15% | 2.15% | 2.15% | 2.15% |
Expenses net of all reductions | 2.15% | 2.14% | 2.15% | 2.15% | 2.14% |
Net investment income (loss) | (1.29)% | (1.15)% | (.90)% | (.06)% | (.77)% |
Supplemental Data | | | | | |
Net assets, end of period (000 omitted) | $ 459 | $ 691 | $ 1,073 | $ 1,197 | $ 2,027 |
Portfolio turnover rate E | 140% | 166% | 87% | 92% | 93% |
A Total returns would have been lower if certain expenses had not been reduced during the applicable periods shown.
B Total returns do not include the effect of the contingent deferred sales charge.
C Calculated based on average shares outstanding during the period.
D Fees and expenses of any underlying Fidelity Central Funds are not included in the Fund's expense ratio. The Fund indirectly bears its proportionate share of the expenses of any underlying Fidelity Central Funds.
E Amount does not include the portfolio activity of any underlying Fidelity Central Funds.
F Expense ratios reflect operating expenses of the class. Expenses before reductions do not reflect amounts reimbursed by the investment adviser or reductions from brokerage service arrangements or reductions from other expense offset arrangements and do not represent the amount paid by the class during periods when reimbursements or reductions occur. Expenses net of fee waivers reflect expenses after reimbursement by the investment adviser but prior to reductions from brokerage service arrangements or other expense offset arrangements. Expenses net of all reductions represent the net expenses paid by the class.
G Amount represents less than $.01 per share.
Financial Highlights - Class C
Years ended July 31, | 2012 | 2011 | 2010 | 2009 | 2008 |
Selected Per-Share Data | | | | | |
Net asset value, beginning of period | $ 8.29 | $ 6.68 | $ 6.18 | $ 6.42 | $ 8.69 |
Income from Investment Operations | | | | | |
Net investment income (loss) C | (.10) | (.09) | (.06) | - G | (.06) |
Net realized and unrealized gain (loss) | (.41) | 1.70 | .56 | (.24) | (2.21) |
Total from investment operations | (.51) | 1.61 | .50 | (.24) | (2.27) |
Redemption fees added to paid in capital C, G | - | - | - | - | - |
Net asset value, end of period | $ 7.78 | $ 8.29 | $ 6.68 | $ 6.18 | $ 6.42 |
Total Return A, B | (6.15)% | 24.10% | 8.09% | (3.74)% | (26.12)% |
Ratios to Average Net Assets D, F | | | | | |
Expenses before reductions | 2.65% | 2.70% | 2.72% | 3.21% | 2.47% |
Expenses net of fee waivers, if any | 2.15% | 2.15% | 2.15% | 2.15% | 2.15% |
Expenses net of all reductions | 2.14% | 2.14% | 2.14% | 2.15% | 2.14% |
Net investment income (loss) | (1.28)% | (1.15)% | (.90)% | (.06)% | (.77)% |
Supplemental Data | | | | | |
Net assets, end of period (000 omitted) | $ 3,721 | $ 3,836 | $ 3,256 | $ 3,016 | $ 3,325 |
Portfolio turnover rate E | 140% | 166% | 87% | 92% | 93% |
A Total returns would have been lower if certain expenses had not been reduced during the applicable periods shown.
B Total returns do not include the effect of the contingent deferred sales charge.
C Calculated based on average shares outstanding during the period.
D Fees and expenses of any underlying Fidelity Central Funds are not included in the Fund's expense ratio. The Fund indirectly bears its proportionate share of the expenses of any underlying Fidelity Central Funds.
E Amount does not include the portfolio activity of any underlying Fidelity Central Funds.
F Expense ratios reflect operating expenses of the class. Expenses before reductions do not reflect amounts reimbursed by the investment adviser or reductions from brokerage service arrangements or reductions from other expense offset arrangements and do not represent the amount paid by the class during periods when reimbursements or reductions occur. Expenses net of fee waivers reflect expenses after reimbursement by the investment adviser but prior to reductions from brokerage service arrangements or other expense offset arrangements. Expenses net of all reductions represent the net expenses paid by the class.
G Amount represents less than $.01 per share.
See accompanying notes which are an integral part of the financial statements.
Annual Report
Financial Highlights - Institutional Class
Years ended July 31, | 2012 | 2011 | 2010 | 2009 | 2008 |
Selected Per-Share Data | | | | | |
Net asset value, beginning of period | $ 9.19 | $ 7.33 | $ 6.75 | $ 6.94 | $ 9.30 |
Income from Investment Operations | | | | | |
Net investment income (loss) B | (.02) | (.01) | .01 | .05 | .02 |
Net realized and unrealized gain (loss) | (.45) | 1.87 | .60 | (.24) | (2.38) |
Total from investment operations | (.47) | 1.86 | .61 | (.19) | (2.36) |
Distributions from net investment income | - | - | (.03) | - | - |
Redemption fees added to paid in capital B, F | - | - | - | - | - |
Net asset value, end of period | $ 8.72 | $ 9.19 | $ 7.33 | $ 6.75 | $ 6.94 |
Total Return A | (5.11)% | 25.38% | 9.10% | (2.74)% | (25.38)% |
Ratios to Average Net Assets C, E | | | | | |
Expenses before reductions | 1.55% | 1.42% | 1.64% | 2.16% | 1.47% |
Expenses net of fee waivers, if any | 1.15% | 1.15% | 1.15% | 1.15% | 1.15% |
Expenses net of all reductions | 1.14% | 1.14% | 1.14% | 1.15% | 1.14% |
Net investment income (loss) | (.28)% | (.15)% | .11% | .94% | .23% |
Supplemental Data | | | | | |
Net assets, end of period (000 omitted) | $ 3,271 | $ 1,765 | $ 645 | $ 367 | $ 353 |
Portfolio turnover rate D | 140% | 166% | 87% | 92% | 93% |
A Total returns would have been lower if certain expenses had not been reduced during the applicable periods shown.
B Calculated based on average shares outstanding during the period.
C Fees and expenses of any underlying Fidelity Central Funds are not included in the Fund's expense ratio. The Fund indirectly bears its proportionate share of the expenses of any underlying Fidelity Central Funds.
D Amount does not include the portfolio activity of any underlying Fidelity Central Funds.
E Expense ratios reflect operating expenses of the class. Expenses before reductions do not reflect amounts reimbursed by the investment adviser or reductions from brokerage service arrangements or reductions from other expense offset arrangements and do not represent the amount paid by the class during periods when reimbursements or reductions occur. Expenses net of fee waivers reflect expenses after reimbursement by the investment adviser but prior to reductions from brokerage service arrangements or other expense offset arrangements. Expenses net of all reductions represent the net expenses paid by the class.
F Amount represents less than $.01 per share.
See accompanying notes which are an integral part of the financial statements.
Annual Report
Fidelity Advisor Electronics Fund
Notes to Financial Statements
For the period ended July 31, 2012
1. Organization.
Fidelity Advisor Electronics Fund (the Fund) is a non-diversified fund of Fidelity Advisor Series VII (the Trust) and is authorized to issue an unlimited number of shares. The Trust is registered under the Investment Company Act of 1940, as amended (the 1940 Act), as an open-end management investment company organized as a Massachusetts business trust. The Fund offers Class A, Class T, Class C, and Institutional Class shares, each of which, along with Class B shares, has equal rights as to assets and voting privileges. Effective after the close of business on September 1, 2010, Class B shares were closed to new accounts and additional purchases, except for exchanges and reinvestments. Each class has exclusive voting rights with respect to matters that affect that class. Class B shares will automatically convert to Class A shares after a holding period of seven years from the initial date of purchase. Investment income, realized and unrealized capital gains and losses, the common expenses of the Fund, and certain fund-level expense reductions, if any, are allocated on a pro-rata basis to each class based on the relative net assets of each class to the total net assets of the Fund. Each class differs with respect to transfer agent and distribution and service plan fees incurred. Certain expense reductions may also differ by class. The Fund's investments in emerging markets can be subject to social, economic, regulatory, and political uncertainties and can be extremely volatile.
2. Investments in Fidelity Central Funds.
The Fund invests in Fidelity Central Funds, which are open-end investment companies available only to other investment companies and accounts managed by Fidelity Management & Research Company (FMR) and its affiliates. The Fund's Schedule of Investments lists each of the Fidelity Central Funds held as of period end, if any, as an investment of the Fund, but does not include the underlying holdings of each Fidelity Central Fund. As an Investing Fund, the Fund indirectly bears its proportionate share of the expenses of the underlying Fidelity Central Funds.
The Money Market Central Funds seek preservation of capital and current income and are managed by Fidelity Investments Money Management, Inc. (FIMM), an affiliate of FMR.
A complete unaudited list of holdings for each Fidelity Central Fund is available upon request or at the Securities and Exchange Commission (the SEC) web site at www.sec.gov. In addition, the financial statements of the Fidelity Central Funds, which are not covered by the Fund's Report of Independent Registered Public Accounting Firm, are available on the SEC web site or upon request.
3. Significant Accounting Policies.
The financial statements have been prepared in conformity with accounting principles generally accepted in the United States of America (GAAP), which require management to make certain estimates and assumptions at the date of the financial statements. Actual results could differ from those estimates. Subsequent events, if any, through the date that the financial statements were issued have been evaluated in the preparation of the financial statements. The following summarizes the significant accounting policies of the Fund:
Security Valuation. Investments are valued as of 4:00 p.m. Eastern time on the last calendar day of the period. In accordance with valuation policies and procedures approved by the Board of Trustees (the Board), the Fund attempts to obtain prices from one or more third party pricing vendor or broker to value its investments. When current market prices, quotations or rates are not readily available or reliable, securities will be fair valued in good faith by the FMR Fair Value Committee (the Committee), in accordance with procedures adopted by the Fund's Board. Factors used in determining fair value vary by security type and may include market or security specific events. The frequency with which these procedures are used cannot be predicted and they may be utilized to a significant extent. The Committee oversees the Fund's valuation policies and procedures and is responsible for approving and reporting to the Board all fair value determinations.
The Fund categorizes the inputs to valuation techniques used to value its investments into a disclosure hierarchy consisting of three levels as shown below:
Level 1 - quoted prices in active markets for identical investments
Level 2 - other significant observable inputs (including quoted prices for similar investments, interest rates, prepayment speeds, etc.)
Level 3 - unobservable inputs (including the Fund's own assumptions based on the best information available)
Valuation techniques used to value the Fund's investments by major category are as follows:
Equity securities, including restricted securities, for which market quotations are readily available, are valued at the last reported sale price or official closing price as reported by a third party pricing vendor on the primary market or exchange on which they are traded and are categorized as Level 1 in the hierarchy. In the event there were no sales during the day or closing prices are not available, securities are valued at the last quoted bid price or may be valued using the last available price and are generally categorized as Level 2 in the hierarchy. For foreign equity securities, when significant market or security specific events arise, comparisons to the valuation of American Depositary Receipts (ADRs), futures contracts, Exchange-Traded Funds (ETFs) and certain indexes as well as quoted prices for similar securities are used and are categorized as Level 2 in the hierarchy. Utilizing these techniques may result in transfers between Level 1 and Level 2. For restricted equity securities and private placements where observable inputs are limited, assumptions about market activity and risk are used and these securities are categorized as Level 3 in the hierarchy.
Annual Report
Fidelity Advisor Electronics Fund
Notes to Financial Statements - continued
3. Significant Accounting Policies - continued
Security Valuation - continued
Investments in open-end mutual funds, including the Fidelity Central Funds, are valued at their closing net asset value each business day and are categorized as Level 1 in the hierarchy.
Changes in valuation techniques may result in transfers in or out of an assigned level within the disclosure hierarchy. The aggregate value of investments by input level, as of July 31, 2012, is included at the end of the Fund's Schedule of Investments.
Foreign Currency Translation. The Fund may use foreign currency contracts to facilitate transactions in foreign-denominated securities. Gains and losses from these transactions may arise from changes in the value of the foreign currency or if the counterparties do not perform under the contracts' terms.
Foreign-denominated assets, including investment securities, and liabilities are translated into U.S. dollars at the exchange rates at period end. Purchases and sales of investment securities, income and dividends received and expenses denominated in foreign currencies are translated into U.S. dollars at the exchange rate in effect on the transaction date.
The effects of exchange rate fluctuations on investments are included with the net realized and unrealized gain (loss) on investment securities. Other foreign currency transactions resulting in realized and unrealized gain (loss) are disclosed separately.
Investment Transactions and Income. For financial reporting purposes, the Fund's investment holdings and NAV include trades executed through the end of the last business day of the period. The NAV per share for processing shareholder transactions is calculated as of the close of business of the New York Stock Exchange (NYSE), normally 4:00 p.m. Eastern time and includes trades executed through the end of the prior business day. Gains and losses on securities sold are determined on the basis of identified cost and may include proceeds received from litigation. Dividend income is recorded on the ex-dividend date, except for certain dividends from foreign securities where the ex-dividend date may have passed, which are recorded as soon as the Fund is informed of the ex-dividend date. Non-cash dividends included in dividend income, if any, are recorded at the fair market value of the securities received. Distributions received on securities that represent a return of capital or capital gain are recorded as a reduction of cost of investments and/or as a realized gain. The Fund estimates the components of distributions received that may be considered return of capital distributions or capital gain distributions. Interest income and distributions from the Fidelity Central Funds are accrued as earned. Interest income includes coupon interest and amortization of premium and accretion of discount on debt securities. Investment income is recorded net of foreign taxes withheld where recovery of such taxes is uncertain.
Expenses. Expenses directly attributable to a fund are charged to that fund. Expenses attributable to more than one fund are allocated among the respective funds on the basis of relative net assets or other appropriate methods. Expense estimates are accrued in the period to which they relate and adjustments are made when actual amounts are known.
Income Tax Information and Distributions to Shareholders. Each year, the Fund intends to qualify as a regulated investment company under Subchapter M of the Internal Revenue Code, including distributing substantially all of its taxable income and realized gains. As a result, no provision for income taxes is required. As of July 31, 2012, the Fund did not have any unrecognized tax benefits in the financial statements; nor is the Fund aware of any tax positions for which it is reasonably possible that the total amounts of unrecognized tax benefits will significantly change in the next twelve months. The Fund files a U.S. federal tax return, in addition to state and local tax returns as required. A fund's federal income tax returns are subject to examination by the Internal Revenue Service (IRS) for a period of three fiscal years after they are filed. State and local tax returns may be subject to examination for an additional fiscal year depending on the jurisdiction. Foreign taxes are provided for based on the Fund's understanding of the tax rules and rates that exist in the foreign markets in which it invests.
Distributions are declared and recorded on the ex-dividend date. Income dividends and capital gain distributions are declared separately for each class. Income and capital gain distributions are determined in accordance with income tax regulations, which may differ from GAAP.
Capital accounts within the financial statements are adjusted for permanent book-tax differences. These adjustments have no impact on net assets or the results of operations. Temporary book-tax differences will reverse in a subsequent period.
Book-tax differences are primarily due to foreign currency transactions, net operating losses, capital loss carryforwards and losses deferred due to wash sales and excise tax regulations.
The federal tax cost of investment securities and unrealized appreciation (depreciation) as of period end were as follows:
Gross unrealized appreciation | $ 390,290 |
Gross unrealized depreciation | (5,173,096) |
Net unrealized appreciation (depreciation) on securities and other investments | $ (4,782,806) |
| |
Tax Cost | $ 23,130,111 |
Annual Report
3. Significant Accounting Policies - continued
Income Tax Information and Distributions to Shareholders - continued
The tax-based components of distributable earnings as of period end were as follows:
Capital loss carryforward | $ (5,918,304) |
Net unrealized appreciation (depreciation) | $ (4,782,806) |
Capital loss carryforwards are only available to offset future capital gains of the Fund to the extent provided by regulations and may be limited. Under the Regulated Investment Company Modernization Act of 2010 (the Act), the Fund is permitted to carry forward capital losses incurred in taxable years beginning after December 22, 2010 for an unlimited period and such capital losses are required to be used prior to any losses that expire. Capital loss carryforwards were as follows:
Fiscal year of expiration | |
2013 | $ (279,201) |
2016 | (310,663) |
2017 | (5,202,838) |
Total with expiration | (5,792,702) |
No expiration | |
Long-term | (125,602) |
Total capital loss carryforward | $ (5,918,304) |
The Fund intends to elect to defer to its fiscal year ending July 31, 2013 approximately $767,744 of capital losses recognized during the period November 1, 2011 to July 31, 2012.
Short-Term Trading (Redemption) Fees. Shares held by investors in the Fund less than 30 days are subject to a redemption fee equal to .75% of the net asset value of shares redeemed. All redemption fees, which reduce the proceeds of the shareholder redemption, are retained by the Fund and accounted for as an addition to paid in capital.
New Accounting Pronouncement. In December 2011, the Financial Accounting Standards Board issued Accounting Standard Update No. 2011-11, Disclosures about Offsetting Assets and Liabilities. The update creates new disclosure requirements requiring entities to disclose both gross and net information for derivatives and other financial instruments that are either offset in the Statement of Assets and Liabilities or subject to an enforceable master netting arrangement or similar agreement. The disclosure requirements are effective for interim and annual reporting periods beginning on or after January 1, 2013. Management is currently evaluating the impact of the update's adoption on the Fund's financial statement disclosures.
4. Operating Policies.
Restricted Securities. The Fund may invest in securities that are subject to legal or contractual restrictions on resale. These securities generally may be resold in transactions exempt from registration or to the public if the securities are registered. Disposal of these securities may involve time-consuming negotiations and expense, and prompt sale at an acceptable price may be difficult. Information regarding restricted securities is included at the end of the Fund's Schedule of Investments.
5. Purchases and Sales of Investments.
Purchases and sales of securities, other than short-term securities, aggregated $25,098,152 and $24,332,670, respectively.
6. Fees and Other Transactions with Affiliates.
Management Fee. FMR and its affiliates provide the Fund with investment management related services for which the Fund pays a monthly management fee. The management fee is the sum of an individual fund fee rate that is based on an annual rate of .30% of the Fund's average net assets and an annualized group fee rate that averaged .26% during the period. The group fee rate is based upon the average net assets of all the mutual funds advised by FMR. The group fee rate decreases as assets under management increase and increases as assets under management decrease. For the period, the total annual management fee rate was .56% of the Fund's average net assets.
Annual Report
Fidelity Advisor Electronics Fund
Notes to Financial Statements - continued
6. Fees and Other Transactions with Affiliates - continued
Distribution and Service Plan Fees. In accordance with Rule 12b-1 of the 1940 Act, the Fund has adopted separate Distribution and Service Plans for each class of shares. Certain classes pay Fidelity Distributors Corporation (FDC), an affiliate of FMR, separate Distribution and Service Fees, each of which is based on an annual percentage of each class' average net assets. In addition, FDC may pay financial intermediaries for selling shares of the Fund and providing shareholder support services. For the period, the Distribution and Service Fee rates, total fees and amounts retained by FDC were as follows:
| Distribution
Fee | Service
Fee | Total Fees | Retained
by FDC |
Class A | -% | .25% | $ 19,191 | $ 783 |
Class T | .25% | .25% | 20,904 | 112 |
Class B | .75% | .25% | 5,680 | 4,265 |
Class C | .75% | .25% | 36,497 | 4,204 |
| | | $ 82,272 | $ 9,364 |
Sales Load. FDC may receive a front-end sales charge of up to 5.75% for selling Class A shares and 3.50% for selling Class T shares, some of which is paid to financial intermediaries for selling shares of the Fund. Depending on the holding period, FDC may receive contingent deferred sales charges levied on Class A, Class T, Class B, and Class C redemptions. The deferred sales charges range from 5.00% to 1.00% for Class B shares, 1.00% for Class C shares, 1.00% for certain purchases of Class A shares and .25% for certain purchases of Class T shares.
For the period, sales charge amounts retained by FDC were as follows:
| Retained
by FDC |
Class A | $ 2,775 |
Class T | 2,277 |
Class B* | 630 |
Class C* | 491 |
| $ 6,173 |
* When Class B and Class C shares are initially sold, FDC pays commissions from its own resources to financial intermediaries through which the sales are made.
Transfer Agent Fees. Fidelity Investments Institutional Operations Company, Inc. (FIIOC), an affiliate of FMR, is the transfer, dividend disbursing and shareholder servicing agent for each class of the Fund. FIIOC receives account fees and asset-based fees that vary according to the account size and type of account of the shareholders of the respective classes of the Fund. FIIOC pays for typesetting, printing and mailing of shareholder reports, except proxy statements. For the period, transfer agent fees for each class were as follows:
| Amount | % of
Average
Net Assets |
Class A | $ 23,737 | .31 |
Class T | 15,086 | .36 |
Class B | 1,759 | .31 |
Class C | 11,275 | .31 |
Institutional Class | 3,075 | .20 |
| $ 54,932 | |
Accounting and Security Lending Fees. Fidelity Service Company, Inc. (FSC), an affiliate of FMR, maintains the Fund's accounting records. The accounting fee is based on the level of average net assets for each month. Under a separate contract, FSC administers the security lending program. The security lending fee is based on the number and duration of lending transactions.
Brokerage Commissions. The Fund placed a portion of its portfolio transactions with brokerage firms which are affiliates of the investment adviser. The commissions paid to these affiliated firms were $2,373 for the period.
7. Committed Line of Credit.
The Fund participates with other funds managed by FMR or an affiliate in a $4.25 billion credit facility (the "line of credit") to be utilized for temporary or emergency purposes to fund shareholder redemptions or for other short-term liquidity purposes. The Fund has agreed to pay commitment fees on its pro-rata portion of the line of credit, which amounted to $50 and is reflected in Miscellaneous expenses on the Statement of Operations. During the period, there were no borrowings on this line of credit.
Annual Report
8. Security Lending.
The Fund lends portfolio securities through a lending agent from time to time in order to earn additional income. For equity securities, a lending agent is used and may loan securities to certain qualified borrowers, including Fidelity Capital Markets (FCM), a broker-dealer affiliated with the Fund. On the settlement date of the loan, the Fund receives collateral (in the form of U.S. Treasury obligations, letters of credit and/or cash) against the loaned securities and maintains collateral in an amount not less than 100% of the market value of the loaned securities during the period of the loan. The market value of the loaned securities is determined at the close of business of the Fund and any additional required collateral is delivered to the Fund on the next business day. If the borrower defaults on its obligation to return the securities loaned because of insolvency or other reasons, a fund could experience delays and costs in recovering the securities loaned or in gaining access to the collateral. Any cash collateral received is invested in the Fidelity Securities Lending Cash Central Fund. The value of loaned securities and cash collateral at period end are disclosed on the Fund's Statement of Assets and Liabilities. Security lending income represents the income earned on investing cash collateral, less rebates paid to borrowers and any lending agent fees associated with the loan, plus any premium payments received for lending certain types of securities. Security lending income is presented in the Statement of Operations as a component of income from Fidelity Central Funds. Total security lending income during the period amounted to $2,665. During the period, there were no securities loaned to FCM.
9. Expense Reductions.
FMR voluntarily agreed to reimburse each class to the extent annual operating expenses exceeded certain levels of average net assets as noted in the table below. Some expenses, for example interest expense, including commitment fees, are excluded from this reimbursement.
The following classes were in reimbursement during the period:
| Expense
Limitations | Reimbursement
from adviser |
Class A | 1.40% | $ 36,814 |
Class T | 1.65% | 24,072 |
Class B | 2.15% | 3,089 |
Class C | 2.15% | 18,181 |
Institutional Class | 1.15% | 6,337 |
| | $ 88,493 |
Many of the brokers with whom FMR places trades on behalf of the Fund provided services to the Fund in addition to trade execution. These services included payments of certain expenses on behalf of the Fund totaling $1,352 for the period.
10. Share Transactions.
Transactions for each class of shares were as follows:
| Shares | Dollars |
Years ended July 31, | 2012 | 2011 | 2012 | 2011 |
Class A | | | | |
Shares sold | 461,275 | 823,348 | $ 4,417,052 | $ 7,674,866 |
Shares redeemed | (595,271) | (734,519) | (4,948,629) | (6,789,005) |
Net increase (decrease) | (133,996) | 88,829 | $ (531,577) | $ 885,861 |
Class T | | | | |
Shares sold | 90,140 | 227,766 | $ 795,072 | $ 2,032,968 |
Shares redeemed | (128,587) | (266,704) | (1,079,505) | (2,292,080) |
Net increase (decrease) | (38,447) | (38,938) | $ (284,433) | $ (259,112) |
Class B | | | | |
Shares sold | 10,206 | 17,689 | $ 91,605 | $ 152,131 |
Shares redeemed | (34,653) | (94,901) | (276,903) | (767,577) |
Net increase (decrease) | (24,447) | (77,212) | $ (185,298) | $ (615,446) |
Class C | | | | |
Shares sold | 171,249 | 179,286 | $ 1,492,502 | $ 1,565,088 |
Shares redeemed | (156,060) | (203,889) | (1,218,105) | (1,673,259) |
Net increase (decrease) | 15,189 | (24,603) | $ 274,397 | $ (108,171) |
Institutional Class | | | | |
Shares sold | 380,436 | 302,052 | $ 3,355,122 | $ 3,051,352 |
Shares redeemed | (197,302) | (197,907) | (1,703,208) | (1,900,027) |
Net increase (decrease) | 183,134 | 104,145 | $ 1,651,914 | $ 1,151,325 |
Annual Report
Fidelity Advisor Electronics Fund
Notes to Financial Statements - continued
11. Other.
The Fund's organizational documents provide former and current trustees and officers with a limited indemnification against liabilities arising in connection with the performance of their duties to the Fund. In the normal course of business, the Fund may also enter into contracts that provide general indemnifications. The Fund's maximum exposure under these arrangements is unknown as this would be dependent on future claims that may be made against the Fund. The risk of material loss from such claims is considered remote.
Annual Report
Fidelity Advisor Energy Fund - Class A, T, B, and C
Performance: The Bottom Line
Average annual total return reflects the change in the value of an investment, assuming reinvestment of the class' distributions from dividend income and capital gains (the profits earned upon the sale of securities that have grown in value, if any) and assuming a constant rate of performance each year. The $10,000 table and the fund's returns do not reflect the deduction of taxes that a shareholder would pay on fund distributions or the redemption of fund shares. During periods of reimbursement by Fidelity, a fund's total return will be greater than it would be had the reimbursement not occurred. How a fund did yesterday is no guarantee of how it will do tomorrow. Returns reflect the conversion of Class B shares to Class A shares after a maximum of seven years.
Average Annual Total Returns
Periods ended July 31, 2012 | Past 1
year | Past 5
years | Past 10
years |
Class A (incl. 5.75% sales charge) C | -20.43% | -3.28% | 10.98% |
Class T (incl. 3.50% sales charge) C | -18.72% | -3.03% | 11.01% |
Class B (incl. contingent deferred sales charge) A,C | -20.39% | -3.17% | 11.06% |
Class C (incl. contingent deferred sales charge) B,C | -17.06% | -2.85% | 10.84% |
A Class B shares' contingent deferred sales charges included in the past one year, past five years, and past ten years total return figures are 5%, 2%, and 0%, respectively.
B Class C shares' contingent deferred sales charges included in the past one year, past five years, and past ten years total return figures are 1%, 0%, and 0%, respectively.
C Prior to October 1, 2006, Fidelity Advisor Energy Fund operated under certain different investment policies. The historical performance of the fund may not represent its current investment policies.
$10,000 Over 10 Years
Let's say hypothetically that $10,000 was invested in Fidelity Advisor Energy Fund - Class A on July 31, 2002, and the current 5.75% sales charge was paid. The chart shows how the value of your investment would have changed, and also shows how the S&P 500 Index performed over the same period.
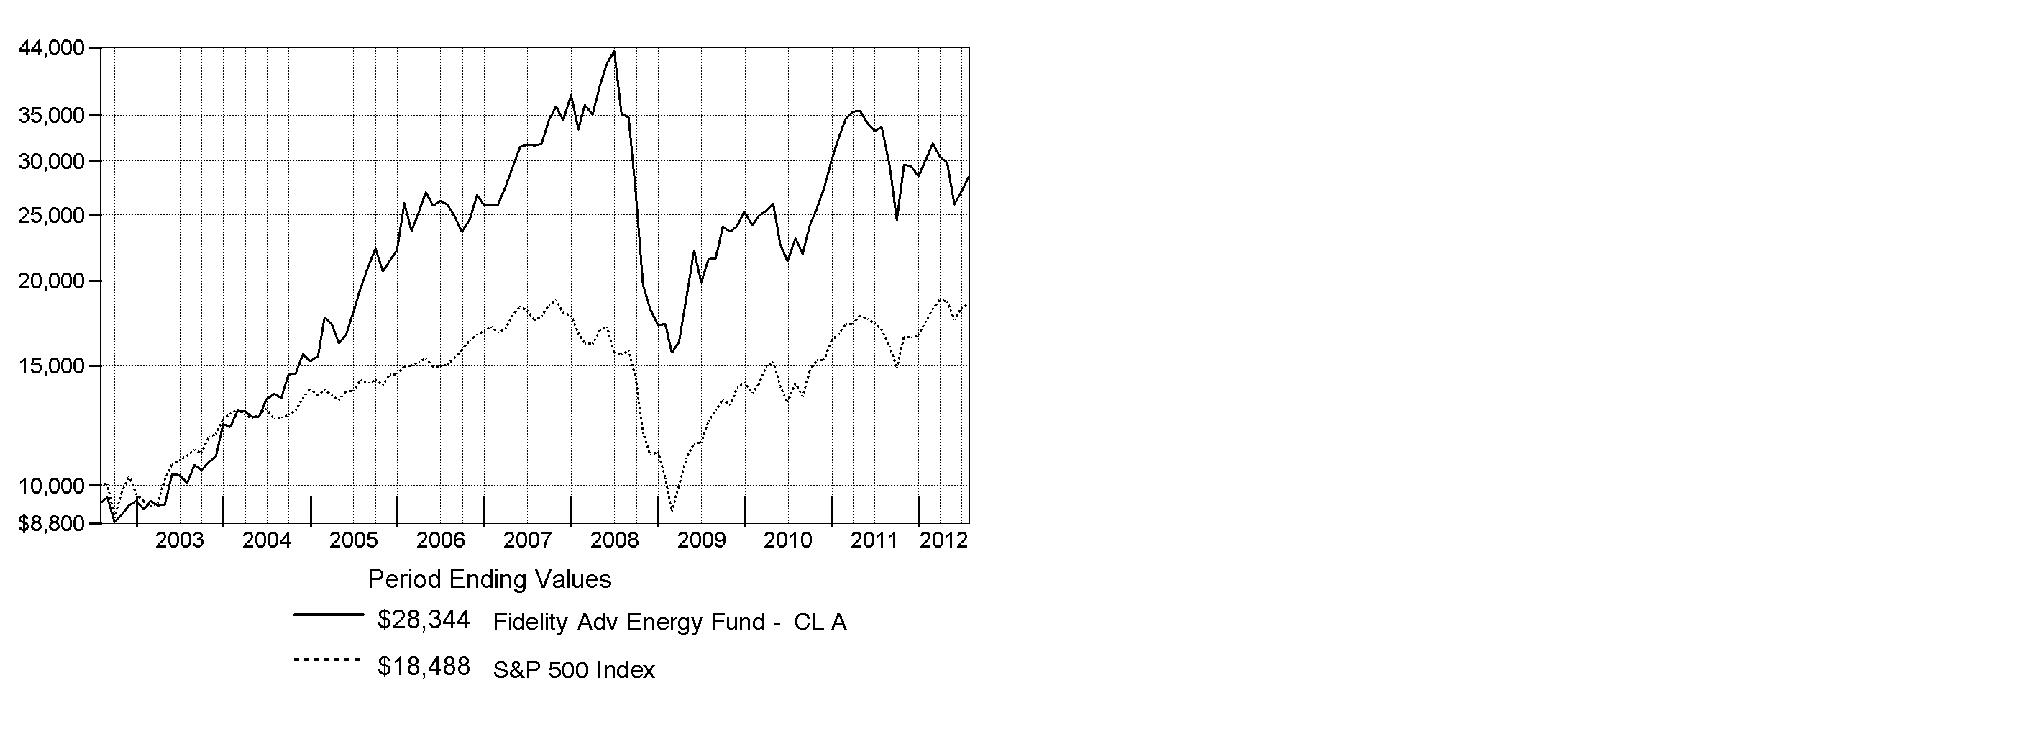
Annual Report
Fidelity Advisor Energy Fund
Market Recap: Major U.S. equity benchmarks posted solid gains for the year ending July 31, 2012, amid an uncertain investment environment. The broad-based S&P 500® Index returned 9.13%, while the blue-chip-laden Dow Jones Industrial AverageSM and technology-heavy Nasdaq Composite® Index gained 10.12% and 7.83%, respectively. Volatility spiked during the period's first half, as equities plummeted late last summer on Europe's debt woes, political wrangling over the U.S. debt ceiling and the sovereign credit-rating downgrade that followed. By October, a seemingly improved U.S. economy rejuvenated stocks, paving the way for major equity benchmarks to post their best first-quarter performance since 1998. However, more eurozone trouble, signs that the U.S. economy had turned sluggish and a slowdown in China caused stocks to slip in May, before a new wave of optimism took hold in June and July. Within the S&P 500®, more-defensive sectors such as telecommunication services (+30%) and consumer staples (+20%) fared best, while materials and energy significantly underperformed, returning -5%. Small- and mid-cap stocks trailed their less-volatile large-cap counterparts, with the Russell 2000® Index adding 0.19% and the Russell Midcap® Index rising 2.28%. Given turmoil and local currency weakness in Europe, foreign developed-markets stocks lost ground, with the MSCI® EAFE® Index returning -11.32%.
Comments from John Dowd, Portfolio Manager of Fidelity Advisor® Energy Fund: For the year, the fund's Class A, Class T, Class B and Class C shares returned -15.58%, -15.77%, -16.22% and -16.22%, respectively (excluding sales charges), significantly underperforming the broad-based S&P 500® and the -8.43% return of the MSCI® U.S. IM Energy 25/50 Index. Energy stocks struggled during the period, hurt by falling commodity prices and weak economic growth, particularly in emerging markets. Relative to its sector benchmark, the fund's positioning in integrated oil/gas firms hurt performance the most, including a significant underweighting in benchmark heavyweight Exxon Mobil, which outperformed. Stocks that were sensitive to falling crude prices also curbed results, including integrated oil/gas firm Hess and exploration and production firm SM Energy. A stake in coal producer Alpha Natural Resources stung, as the company struggled under slumping coal prices and a global economic slowdown. I sold Alpha from the fund by period end. Stock selection in oil/gas equipment and services detracted, led by Baker Hughes. Conversely, an out-of-index holding in specialty chemicals maker LyondellBasell Industries helped the most. Although an overweighting in oil/gas drilling hurt, my picks there, led by an out-of-index stake in British offshore drill fleet operator Ensco, helped. Underweighting and then selling natural gas firm Chesapeake Energy also contributed.
The views expressed above reflect those of the portfolio manager(s) only through the end of the period as stated on the cover of this report and do not necessarily represent the views of Fidelity or any other person in the Fidelity organization. Any such views are subject to change at any time based upon market or other conditions and Fidelity disclaims any responsibility to update such views. These views may not be relied on as investment advice and, because investment decisions for a Fidelity fund are based on numerous factors, may not be relied on as an indication of trading intent on behalf of any Fidelity fund.
Annual Report
Fidelity Advisor Energy Fund
As a shareholder of the Fund, you incur two types of costs: (1) transaction costs, including sales charges (loads) on purchase payments or redemption proceeds, redemption fees and (2) ongoing costs, including management fees, distribution and/or service (12b-1) fees and other Fund expenses. This Example is intended to help you understand your ongoing costs (in dollars) of investing in the Fund and to compare these costs with the ongoing costs of investing in other mutual funds.
The Example is based on an investment of $1,000 invested at the beginning of the period and held for the entire period (February 1, 2012 to July 31, 2012).
Actual Expenses
The first line of the accompanying table for each class of the Fund provides information about actual account values and actual expenses. You may use the information in this line, together with the amount you invested, to estimate the expenses that you paid over the period. Simply divide your account value by $1,000.00 (for example, an $8,600 account value divided by $1,000.00 = 8.6), then multiply the result by the number in the first line for a class of the Fund under the heading entitled "Expenses Paid During Period" to estimate the expenses you paid on your account during this period. In addition, the Fund, as a shareholder in the underlying Fidelity Central Funds, will indirectly bear its pro-rata share of the fees and expenses incurred by the underlying Fidelity Central Funds. These fees and expenses are not included in the Fund's annualized expense ratio used to calculate the expense estimate in the table below.
Hypothetical Example for Comparison Purposes
The second line of the accompanying table for each class of the Fund provides information about hypothetical account values and hypothetical expenses based on a Class' actual expense ratio and an assumed rate of return of 5% per year before expenses, which is not the Class' actual return. The hypothetical account values and expenses may not be used to estimate the actual ending account balance or expenses you paid for the period. You may use this information to compare the ongoing costs of investing in the Fund and other funds. To do so, compare this 5% hypothetical example with the 5% hypothetical examples that appear in the shareholder reports of the other funds. In addition, the Fund, as a shareholder in the underlying Fidelity Central Funds, will indirectly bear its pro-rata share of the fees and expenses incurred by the underlying Fidelity Central Funds. These fees and expenses are not included in the Fund's annualized expense ratio used to calculate the expense estimate in the table below.
Please note that the expenses shown in the table are meant to highlight your ongoing costs only and do not reflect any transaction costs. Therefore, the second line of the table is useful in comparing ongoing costs only, and will not help you determine the relative total costs of owning different funds. In addition, if these transactional costs were included, your costs would have been higher.
| Annualized Expense Ratio | Beginning
Account Value
February 1, 2012 | Ending
Account Value
July 31, 2012 | Expenses Paid
During Period*
February 1, 2012
to July 31, 2012 |
Class A | 1.17% | | | |
Actual | | $ 1,000.00 | $ 944.80 | $ 5.66 |
HypotheticalA | | $ 1,000.00 | $ 1,019.05 | $ 5.87 |
Class T | 1.38% | | | |
Actual | | $ 1,000.00 | $ 943.50 | $ 6.67 |
HypotheticalA | | $ 1,000.00 | $ 1,018.00 | $ 6.92 |
Class B | 1.92% | | | |
Actual | | $ 1,000.00 | $ 941.00 | $ 9.27 |
HypotheticalA | | $ 1,000.00 | $ 1,015.32 | $ 9.62 |
Class C | 1.91% | | | |
Actual | | $ 1,000.00 | $ 940.80 | $ 9.22 |
HypotheticalA | | $ 1,000.00 | $ 1,015.37 | $ 9.57 |
Institutional Class | .85% | | | |
Actual | | $ 1,000.00 | $ 946.10 | $ 4.11 |
HypotheticalA | | $ 1,000.00 | $ 1,020.64 | $ 4.27 |
A 5% return per year before expenses
* Expenses are equal to each Class' annualized expense ratio, multiplied by the average account value over the period, multiplied by 182/366 (to reflect the one-half year period).
Annual Report
Fidelity Advisor Energy Fund
Investment Changes (Unaudited)
Top Ten Stocks as of July 31, 2012 |
| % of fund's
net assets | % of fund's net assets
6 months ago |
Chevron Corp. | 12.4 | 15.0 |
Exxon Mobil Corp. | 10.3 | 7.3 |
Occidental Petroleum Corp. | 7.6 | 7.6 |
National Oilwell Varco, Inc. | 4.8 | 4.4 |
EQT Corp. | 3.5 | 0.0 |
Hess Corp. | 3.5 | 4.8 |
Cabot Oil & Gas Corp. | 3.3 | 0.0 |
Noble Corp. | 3.2 | 1.5 |
Schlumberger Ltd. | 3.1 | 5.6 |
Apache Corp. | 2.6 | 2.5 |
| 54.3 | |
Top Industries (% of fund's net assets) |
As of July 31, 2012 |
| Oil, Gas & Consumable Fuels | 73.8% | |
| Energy Equipment & Services | 23.3% | |
| Chemicals | 0.6% | |
| Construction & Engineering | 0.4% | |
 | Hotels, Restaurants & Leisure | 0.0% | |
| All Others* | 1.9% | |

As of January 31, 2012 |
| Oil, Gas & Consumable Fuels | 71.7% | |
 | Energy Equipment & Services | 26.1% | |
 | Chemicals | 1.5% | |
| Construction & Engineering | 0.5% | |
| All Others* | 0.2% | |

* Includes short-term investments and net other assets. |
Annual Report
Fidelity Advisor Energy Fund
Investments July 31, 2012
Showing Percentage of Net Assets
Common Stocks - 98.1% |
| Shares | | Value |
CHEMICALS - 0.6% |
Specialty Chemicals - 0.6% |
LyondellBasell Industries NV Class A | 83,610 | | $ 3,723,153 |
CONSTRUCTION & ENGINEERING - 0.4% |
Construction & Engineering - 0.4% |
Foster Wheeler AG (a) | 158,675 | | 2,862,497 |
ENERGY EQUIPMENT & SERVICES - 23.3% |
Oil & Gas Drilling - 7.2% |
Discovery Offshore S.A. (a)(e) | 748,490 | | 1,303,871 |
Ensco PLC Class A | 223,851 | | 12,161,825 |
Noble Corp. | 559,864 | | 20,714,968 |
Northern Offshore Ltd. | 335,687 | | 562,490 |
Ocean Rig UDW, Inc. (United States) | 163,500 | | 2,450,865 |
Rowan Companies PLC (a) | 213,866 | | 7,513,113 |
Tuscany International Drilling, Inc. (a) | 1,080,000 | | 350,003 |
Vantage Drilling Co. (a) | 945,900 | | 1,485,063 |
| | 46,542,198 |
Oil & Gas Equipment & Services - 16.1% |
Anton Oilfield Services Group | 438,000 | | 86,982 |
Baker Hughes, Inc. | 38,600 | | 1,787,952 |
Cameron International Corp. (a) | 36,000 | | 1,809,720 |
Compagnie Generale de Geophysique SA (a) | 126,178 | | 3,611,621 |
FMC Technologies, Inc. (a) | 97,300 | | 4,390,176 |
Fugro NV (Certificaten Van Aandelen) unit | 184,345 | | 12,078,063 |
Gulfmark Offshore, Inc. Class A (a) | 143,927 | | 5,174,176 |
Halliburton Co. | 240,615 | | 7,971,575 |
McDermott International, Inc. (a) | 167,806 | | 1,963,330 |
National Oilwell Varco, Inc. | 432,307 | | 31,255,796 |
Oil States International, Inc. (a) | 86,650 | | 6,299,455 |
Schlumberger Ltd. | 286,593 | | 20,422,617 |
Schoeller-Bleckmann Oilfield Equipment AG | 8,662 | | 729,095 |
Superior Energy Services, Inc. (a) | 89,484 | | 1,939,118 |
Total Energy Services, Inc. | 53,200 | | 753,293 |
Weatherford International Ltd. (a) | 328,867 | | 3,962,847 |
| | 104,235,816 |
TOTAL ENERGY EQUIPMENT & SERVICES | | 150,778,014 |
HOTELS, RESTAURANTS & LEISURE - 0.0% |
Casinos & Gaming - 0.0% |
Icahn Enterprises LP rights (a) | 66,553 | | 1 |
OIL, GAS & CONSUMABLE FUELS - 73.8% |
Coal & Consumable Fuels - 1.2% |
Cloud Peak Energy, Inc. (a) | 93,300 | | 1,544,115 |
Peabody Energy Corp. | 299,526 | | 6,254,103 |
| | 7,798,218 |
|
| Shares | | Value |
Integrated Oil & Gas - 39.2% |
Chevron Corp. | 730,491 | | $ 80,047,206 |
Exxon Mobil Corp. | 770,528 | | 66,920,357 |
Hess Corp. | 479,661 | | 22,620,813 |
InterOil Corp. (a)(d) | 60,200 | | 5,155,528 |
Murphy Oil Corp. | 120,406 | | 6,460,986 |
Occidental Petroleum Corp. | 567,477 | | 49,387,523 |
Royal Dutch Shell PLC Class A sponsored ADR | 163,300 | | 11,137,060 |
Suncor Energy, Inc. | 403,460 | | 12,334,929 |
| | 254,064,402 |
Oil & Gas Exploration & Production - 24.9% |
Anadarko Petroleum Corp. | 152,141 | | 10,564,671 |
Apache Corp. | 193,186 | | 16,637,178 |
Atlas Resource Partners LP | 1,391 | | 34,845 |
Bill Barrett Corp. (a) | 27,500 | | 579,150 |
BPZ Energy, Inc. (a) | 263,764 | | 601,382 |
C&C Energia Ltd. (a) | 122,600 | | 768,962 |
Cabot Oil & Gas Corp. | 498,790 | | 21,043,950 |
Carrizo Oil & Gas, Inc. (a) | 26,300 | | 663,023 |
Cobalt International Energy, Inc. (a) | 140,000 | | 3,514,000 |
Comstock Resources, Inc. (a) | 338,606 | | 5,478,645 |
Concho Resources, Inc. (a) | 28,703 | | 2,446,931 |
Energen Corp. | 26,388 | | 1,351,329 |
EOG Resources, Inc. | 114,179 | | 11,190,684 |
EQT Corp. | 405,700 | | 22,881,480 |
EV Energy Partners LP | 61,000 | | 3,345,850 |
Gran Tierra Energy, Inc. (Canada) (a) | 398,872 | | 1,825,619 |
Halcon Resources Corp. (f) | 300,000 | | 1,980,000 |
Harvest Natural Resources, Inc. (a)(d) | 130,481 | | 1,028,190 |
Kodiak Oil & Gas Corp. (a)(d) | 79,900 | | 667,165 |
Marathon Oil Corp. | 240,164 | | 6,357,141 |
Midstates Petroleum Co., Inc. | 61,400 | | 523,128 |
Noble Energy, Inc. | 143,054 | | 12,507,211 |
Northern Oil & Gas, Inc. (a) | 54,100 | | 852,616 |
Painted Pony Petroleum Ltd. (a)(e) | 5,000 | | 46,617 |
Pioneer Natural Resources Co. | 140,900 | | 12,487,967 |
Plains Exploration & Production Co. (a) | 115,700 | | 4,623,372 |
Rosetta Resources, Inc. (a) | 203,781 | | 8,501,743 |
SM Energy Co. | 138,493 | | 6,521,635 |
Southwestern Energy Co. (a) | 52,600 | | 1,748,950 |
TAG Oil Ltd. (a) | 74,600 | | 521,460 |
TAG Oil Ltd. (e) | 11,400 | | 79,687 |
| | 161,374,581 |
Oil & Gas Refining & Marketing - 5.9% |
Calumet Specialty Products Partners LP | 121,335 | | 3,100,109 |
Marathon Petroleum Corp. | 219,187 | | 10,367,545 |
Northern Tier Energy LP Class A | 203,406 | | 3,138,555 |
Tesoro Corp. | 497,065 | | 13,743,847 |
Valero Energy Corp. | 281,245 | | 7,734,238 |
| | 38,084,294 |
Oil & Gas Storage & Transport - 2.6% |
Atlas Energy LP | 32,035 | | 1,006,860 |
Common Stocks - continued |
| Shares | | Value |
OIL, GAS & CONSUMABLE FUELS - CONTINUED |
Oil & Gas Storage & Transport - continued |
Atlas Pipeline Partners, LP | 110,200 | | $ 3,664,150 |
Cheniere Energy, Inc. (a) | 73,955 | | 1,008,007 |
Markwest Energy Partners LP | 36,000 | | 1,892,520 |
Tesoro Logistics LP | 65,366 | | 2,385,205 |
Williams Companies, Inc. | 204,810 | | 6,510,910 |
| | 16,467,652 |
TOTAL OIL, GAS & CONSUMABLE FUELS | | 477,789,147 |
TOTAL COMMON STOCKS (Cost $601,233,054) |
635,152,812
|
Money Market Funds - 2.6% |
| | | |
Fidelity Cash Central Fund, 0.17% (b) | 11,938,490 | | 11,938,490 |
Fidelity Securities Lending Cash Central Fund, 0.18% (b)(c) | 5,169,750 | | 5,169,750 |
TOTAL MONEY MARKET FUNDS (Cost $17,108,240) |
17,108,240
|
TOTAL INVESTMENT PORTFOLIO - 100.7% (Cost $618,341,294) | | 652,261,052 |
NET OTHER ASSETS (LIABILITIES) - (0.7)% | | (4,687,740) |
NET ASSETS - 100% | $ 647,573,312 |
Legend |
(a) Non-income producing |
(b) Affiliated fund that is available only to investment companies and other accounts managed by Fidelity Investments. The rate quoted is the annualized seven-day yield of the fund at period end. A complete unaudited listing of the fund's holdings as of its most recent quarter end is available upon request. In addition, each Fidelity Central Fund's financial statements, which are not covered by the Fund's Report of Independent Registered Public Accounting Firm, are available on the SEC's website or upon request. |
(c) Investment made with cash collateral received from securities on loan. |
(d) Security or a portion of the security is on loan at period end. |
(e) Security exempt from registration under Rule 144A of the Securities Act of 1933. These securities may be resold in transactions exempt from registration, normally to qualified institutional buyers. At the end of the period, the value of these securities amounted to $1,430,175 or 0.2% of net assets. |
(f) Restricted securities - Investment in securities not registered under the Securities Act of 1933 (excluding 144A issues). At the end of the period, the value of restricted securities (excluding 144A issues) amounted to $1,980,000 or 0.3% of net assets. |
Additional information on each restricted holding is as follows: |
Security | Acquisition Date | Acquisition Cost |
Halcon Resources Corp. | 3/1/12 | $ 2,700,000 |
Affiliated Central Funds |
Information regarding fiscal year to date income earned by the Fund from investments in Fidelity Central Funds is as follows: |
Fund | Income earned |
Fidelity Cash Central Fund | $ 10,511 |
Fidelity Securities Lending Cash Central Fund | 120,606 |
Total | $ 131,117 |
Other Information |
The following is a summary of the inputs used, as of July 31, 2012, involving the Fund's assets and liabilities carried at fair value. The inputs or methodology used for valuing securities may not be an indication of the risk associated with investing in those securities. For more information on valuation inputs, and their aggregation into the levels used in the table below, please refer to the Security Valuation section in the accompanying Notes to Financial Statements. |
Valuation Inputs at Reporting Date: |
Description | Total | Level 1 | Level 2 | Level 3 |
Investments in Securities: | | | | |
Common Stocks | $ 635,152,812 | $ 631,541,190 | $ 3,611,621 | $ 1 |
Money Market Funds | 17,108,240 | 17,108,240 | - | - |
Total Investments in Securities: | $ 652,261,052 | $ 648,649,430 | $ 3,611,621 | $ 1 |
Distribution of investments by country or territory of incorporation, as a percentage of total net assets, is as follows. (Unaudited) |
United States of America | 80.4% |
United Kingdom | 4.8% |
Switzerland | 4.2% |
Canada | 3.1% |
Curacao | 3.1% |
Netherlands | 2.5% |
Others (Individually Less Than 1%) | 1.9% |
| 100.0% |
See accompanying notes which are an integral part of the financial statements.
Annual Report
Fidelity Advisor Energy Fund
Statement of Assets and Liabilities
| July 31, 2012 |
| | |
Assets | | |
Investment in securities, at value (including securities loaned of $4,970,802) - See accompanying schedule: Unaffiliated issuers (cost $601,233,054) | $ 635,152,812 | |
Fidelity Central Funds (cost $17,108,240) | 17,108,240 | |
Total Investments (cost $618,341,294) | | $ 652,261,052 |
Receivable for investments sold | | 6,668,144 |
Receivable for fund shares sold | | 513,460 |
Dividends receivable | | 61,871 |
Distributions receivable from Fidelity Central Funds | | 19,710 |
Other receivables | | 13,854 |
Total assets | | 659,538,091 |
| | |
Liabilities | | |
Payable for investments purchased | $ 4,668,492 | |
Payable for fund shares redeemed | 1,383,348 | |
Accrued management fee | 294,986 | |
Distribution and service plan fees payable | 239,420 | |
Other affiliated payables | 163,077 | |
Other payables and accrued expenses | 45,706 | |
Collateral on securities loaned, at value | 5,169,750 | |
Total liabilities | | 11,964,779 |
| | |
Net Assets | | $ 647,573,312 |
Net Assets consist of: | | |
Paid in capital | | $ 676,197,162 |
Accumulated net investment loss | | (503,083) |
Accumulated undistributed net realized gain (loss) on investments and foreign currency transactions | | (62,040,186) |
Net unrealized appreciation (depreciation) on investments and assets and liabilities in foreign currencies | | 33,919,419 |
Net Assets | | $ 647,573,312 |
Statement of Assets and Liabilities - continued
| July 31, 2012 |
| | |
Calculation of Maximum Offering Price Class A:
Net Asset Value and redemption price per share ($253,331,873 ÷ 7,516,040 shares) | | $ 33.71 |
| | |
Maximum offering price per share (100/94.25 of $33.71) | | $ 35.77 |
Class T:
Net Asset Value and redemption price per share ($215,488,059 ÷ 6,264,385 shares) | | $ 34.40 |
| | |
Maximum offering price per share (100/96.50 of $34.40) | | $ 35.65 |
Class B:
Net Asset Value and offering price per share ($28,557,727 ÷ 909,266 shares)A | | $ 31.41 |
| | |
Class C:
Net Asset Value and offering price per share ($93,503,953 ÷ 2,955,799 shares)A | | $ 31.63 |
| | |
Institutional Class:
Net Asset Value, offering price and redemption price per share ($56,691,700 ÷ 1,607,132 shares) | | $ 35.28 |
A Redemption price per share is equal to net asset value less any applicable contingent deferred sales charge.
See accompanying notes which are an integral part of the financial statements.
Annual Report
Fidelity Advisor Energy Fund
Financial Statements - continued
Statement of Operations
| Year ended July 31, 2012 |
| | |
Investment Income | | |
Dividends | | $ 12,930,947 |
Interest | | 5,903 |
Income from Fidelity Central Funds | | 131,117 |
Total income | | 13,067,967 |
| | |
Expenses | | |
Management fee | $ 3,872,271 | |
Transfer agent fees | 1,952,670 | |
Distribution and service plan fees | 3,236,374 | |
Accounting and security lending fees | 249,221 | |
Custodian fees and expenses | 30,688 | |
Independent trustees' compensation | 4,638 | |
Registration fees | 97,452 | |
Audit | 47,577 | |
Legal | 2,610 | |
Miscellaneous | 8,149 | |
Total expenses before reductions | 9,501,650 | |
Expense reductions | (24,920) | 9,476,730 |
Net investment income (loss) | | 3,591,237 |
Realized and Unrealized Gain (Loss) Net realized gain (loss) on: | | |
Investment securities: | | |
Unaffiliated issuers | (47,746,242) | |
Foreign currency transactions | (5,773) | |
Total net realized gain (loss) | | (47,752,015) |
Change in net unrealized appreciation (depreciation) on: Investment securities | (91,974,915) | |
Assets and liabilities in foreign currencies | (454) | |
Total change in net unrealized appreciation (depreciation) | | (91,975,369) |
Net gain (loss) | | (139,727,384) |
Net increase (decrease) in net assets resulting from operations | | $ (136,136,147) |
Statement of Changes in Net Assets
| Year ended
July 31,
2012 | Year ended
July 31,
2011 |
Increase (Decrease) in Net Assets | | |
Operations | | |
Net investment income (loss) | $ 3,591,237 | $ 609,873 |
Net realized gain (loss) | (47,752,015) | 108,257,689 |
Change in net unrealized appreciation (depreciation) | (91,975,369) | 148,374,915 |
Net increase (decrease) in net assets resulting
from operations | (136,136,147) | 257,242,477 |
Distributions to shareholders from net investment income | (3,625,437) | (1,542,989) |
Share transactions - net increase (decrease) | (71,627,600) | 7,476,541 |
Redemption fees | 37,255 | 27,523 |
Total increase (decrease) in net assets | (211,351,929) | 263,203,552 |
| | |
Net Assets | | |
Beginning of period | 858,925,241 | 595,721,689 |
End of period (including accumulated net investment loss of $503,083 and accumulated net investment loss of $187, respectively) | $ 647,573,312 | $ 858,925,241 |
See accompanying notes which are an integral part of the financial statements.
Annual Report
Financial Highlights - Class A
Years ended July 31, | 2012 | 2011 | 2010 | 2009 | 2008 |
Selected Per-Share Data | | | | | |
Net asset value, beginning of period | $ 40.17 | $ 27.70 | $ 25.82 | $ 50.24 | $ 48.28 |
Income from Investment Operations | | | | | |
Net investment income (loss) C | .25 | .11 | (.05) | (.04) | (.17) |
Net realized and unrealized gain (loss) | (6.50) | 12.47 | 1.93 | (17.48) | 5.59 |
Total from investment operations | (6.25) | 12.58 | 1.88 | (17.52) | 5.42 |
Distributions from net investment income | (.21) | (.11) | - | - | - |
Distributions from net realized gain | - | - | - | (6.90) | (3.46) |
Total distributions | (.21) | (.11) | - | (6.90) | (3.46) |
Redemption fees added to paid in capital C, G | - | - | - | - | - |
Net asset value, end of period | $ 33.71 | $ 40.17 | $ 27.70 | $ 25.82 | $ 50.24 |
Total Return A, B | (15.58)% | 45.46% | 7.28% | (38.86)% | 11.52% |
Ratios to Average Net Assets D, F | | | | | |
Expenses before reductions | 1.17% | 1.16% | 1.20% | 1.22% | 1.14% |
Expenses net of fee waivers, if any | 1.17% | 1.16% | 1.20% | 1.22% | 1.14% |
Expenses net of all reductions | 1.17% | 1.16% | 1.19% | 1.21% | 1.14% |
Net investment income (loss) | .72% | .30% | (.16)% | (.14)% | (.32)% |
Supplemental Data | | | | | |
Net assets, end of period (000 omitted) | $ 253,332 | $ 331,120 | $ 214,407 | $ 216,595 | $ 355,200 |
Portfolio turnover rate E | 88% | 91% | 103% | 148% | 90% |
A Total returns would have been lower if certain expenses had not been reduced during the applicable periods shown.
B Total returns do not include the effect of the sales charges.
C Calculated based on average shares outstanding during the period.
D Fees and expenses of any underlying Fidelity Central Funds are not included in the Fund's expense ratio. The Fund indirectly bears its proportionate share of the expenses of any underlying Fidelity Central Funds.
E Amount does not include the portfolio activity of any underlying Fidelity Central Funds.
F Expense ratios reflect operating expenses of the class. Expenses before reductions do not reflect amounts reimbursed by the investment adviser or reductions from brokerage service arrangements or reductions from other expense offset arrangements and do not represent the amount paid by the class during periods when reimbursements or reductions occur. Expenses net of fee waivers reflect expenses after reimbursement by the investment adviser but prior to reductions from brokerage service arrangements or other expense offset arrangements. Expenses net of all reductions represent the net expenses paid by the class.
G Amount represents less than $.01 per share.
Financial Highlights - Class T
Years ended July 31, | 2012 | 2011 | 2010 | 2009 | 2008 |
Selected Per-Share Data | | | | | |
Net asset value, beginning of period | $ 41.04 | $ 28.33 | $ 26.47 | $ 51.40 | $ 49.26 |
Income from Investment Operations | | | | | |
Net investment income (loss) C | .18 | .03 | (.11) | (.10) | (.29) |
Net realized and unrealized gain (loss) | (6.65) | 12.75 | 1.97 | (17.93) | 5.72 |
Total from investment operations | (6.47) | 12.78 | 1.86 | (18.03) | 5.43 |
Distributions from net investment income | (.17) | (.07) | - | - | - |
Distributions from net realized gain | - | - | - | (6.90) | (3.29) |
Total distributions | (.17) | (.07) | - | (6.90) | (3.29) |
Redemption fees added to paid in capital C, G | - | - | - | - | - |
Net asset value, end of period | $ 34.40 | $ 41.04 | $ 28.33 | $ 26.47 | $ 51.40 |
Total Return A, B | (15.77)% | 45.16% | 7.03% | (38.99)% | 11.27% |
Ratios to Average Net Assets D, F | | | | | |
Expenses before reductions | 1.38% | 1.37% | 1.41% | 1.45% | 1.36% |
Expenses net of fee waivers, if any | 1.38% | 1.37% | 1.41% | 1.45% | 1.36% |
Expenses net of all reductions | 1.38% | 1.37% | 1.41% | 1.45% | 1.35% |
Net investment income (loss) | .50% | .09% | (.37)% | (.38)% | (.54)% |
Supplemental Data | | | | | |
Net assets, end of period (000 omitted) | $ 215,488 | $ 290,512 | $ 219,051 | $ 224,376 | $ 407,784 |
Portfolio turnover rate E | 88% | 91% | 103% | 148% | 90% |
A Total returns would have been lower if certain expenses had not been reduced during the applicable periods shown.
B Total returns do not include the effect of the sales charges.
C Calculated based on average shares outstanding during the period.
D Fees and expenses of any underlying Fidelity Central Funds are not included in the Fund's expense ratio. The Fund indirectly bears its proportionate share of the expenses of any underlying Fidelity Central Funds.
E Amount does not include the portfolio activity of any underlying Fidelity Central Funds.
F Expense ratios reflect operating expenses of the class. Expenses before reductions do not reflect amounts reimbursed by the investment adviser or reductions from brokerage service arrangements or reductions from other expense offset arrangements and do not represent the amount paid by the class during periods when reimbursements or reductions occur. Expenses net of fee waivers reflect expenses after reimbursement by the investment adviser but prior to reductions from brokerage service arrangements or other expense offset arrangements. Expenses net of all reductions represent the net expenses paid by the class.
G Amount represents less than $.01 per share.
See accompanying notes which are an integral part of the financial statements.
Annual Report
Financial Highlights - Class B
Years ended July 31, | 2012 | 2011 | 2010 | 2009 | 2008 |
Selected Per-Share Data | | | | | |
Net asset value, beginning of period | $ 37.61 | $ 26.06 | $ 24.48 | $ 48.35 | $ 46.64 |
Income from Investment Operations | | | | | |
Net investment income (loss) C | (.01) | (.15) | (.25) | (.22) | (.56) |
Net realized and unrealized gain (loss) | (6.09) | 11.71 | 1.83 | (16.75) | 5.41 |
Total from investment operations | (6.10) | 11.56 | 1.58 | (16.97) | 4.85 |
Distributions from net investment income | (.10) | (.01) | - | - | - |
Distributions from net realized gain | - | - | - | (6.90) | (3.14) |
Total distributions | (.10) | (.01) | - | (6.90) | (3.14) |
Redemption fees added to paid in capital C, G | - | - | - | - | - |
Net asset value, end of period | $ 31.41 | $ 37.61 | $ 26.06 | $ 24.48 | $ 48.35 |
Total Return A, B | (16.22)% | 44.38% | 6.45% | (39.31)% | 10.62% |
Ratios to Average Net Assets D, F | | | | | |
Expenses before reductions | 1.92% | 1.93% | 1.96% | 1.96% | 1.93% |
Expenses net of fee waivers, if any | 1.92% | 1.93% | 1.96% | 1.96% | 1.93% |
Expenses net of all reductions | 1.92% | 1.92% | 1.95% | 1.96% | 1.93% |
Net investment income (loss) | (.03)% | (.46)% | (.92)% | (.89)% | (1.11)% |
Supplemental Data | | | | | |
Net assets, end of period (000 omitted) | $ 28,558 | $ 49,793 | $ 44,330 | $ 47,795 | $ 98,602 |
Portfolio turnover rate E | 88% | 91% | 103% | 148% | 90% |
A Total returns would have been lower if certain expenses had not been reduced during the applicable periods shown.
B Total returns do not include the effect of the contingent deferred sales charge.
C Calculated based on average shares outstanding during the period.
D Fees and expenses of any underlying Fidelity Central Funds are not included in the Fund's expense ratio. The Fund indirectly bears its proportionate share of the expenses of any underlying Fidelity Central Funds.
E Amount does not include the portfolio activity of any underlying Fidelity Central Funds.
F Expense ratios reflect operating expenses of the class. Expenses before reductions do not reflect amounts reimbursed by the investment adviser or reductions from brokerage service arrangements or reductions from other expense offset arrangements and do not represent the amount paid by the class during periods when reimbursements or reductions occur. Expenses net of fee waivers reflect expenses after reimbursement by the investment adviser but prior to reductions from brokerage service arrangements or other expense offset arrangements. Expenses net of all reductions represent the net expenses paid by the class.
G Amount represents less than $.01 per share.
Financial Highlights - Class C
Years ended July 31, | 2012 | 2011 | 2010 | 2009 | 2008 |
Selected Per-Share Data | | | | | |
Net asset value, beginning of period | $ 37.88 | $ 26.25 | $ 24.65 | $ 48.63 | $ 46.88 |
Income from Investment Operations | | | | | |
Net investment income (loss) C | (.01) | (.15) | (.25) | (.21) | (.54) |
Net realized and unrealized gain (loss) | (6.13) | 11.80 | 1.85 | (16.87) | 5.45 |
Total from investment operations | (6.14) | 11.65 | 1.60 | (17.08) | 4.91 |
Distributions from net investment income | (.11) | (.02) | - | - | - |
Distributions from net realized gain | - | - | - | (6.90) | (3.16) |
Total distributions | (.11) | (.02) | - | (6.90) | (3.16) |
Redemption fees added to paid in capital C, G | - | - | - | - | - |
Net asset value, end of period | $ 31.63 | $ 37.88 | $ 26.25 | $ 24.65 | $ 48.63 |
Total Return A, B | (16.22)% | 44.38% | 6.49% | (39.31)% | 10.71% |
Ratios to Average Net Assets D, F | | | | | |
Expenses before reductions | 1.92% | 1.90% | 1.94% | 1.96% | 1.87% |
Expenses net of fee waivers, if any | 1.92% | 1.90% | 1.94% | 1.96% | 1.87% |
Expenses net of all reductions | 1.91% | 1.89% | 1.93% | 1.95% | 1.87% |
Net investment income (loss) | (.03)% | (.43)% | (.90)% | (.88)% | (1.05)% |
Supplemental Data | | | | | |
Net assets, end of period (000 omitted) | $ 93,504 | $ 133,476 | $ 90,596 | $ 86,650 | $ 156,393 |
Portfolio turnover rate E | 88% | 91% | 103% | 148% | 90% |
A Total returns would have been lower if certain expenses had not been reduced during the applicable periods shown.
B Total returns do not include the effect of the contingent deferred sales charge.
C Calculated based on average shares outstanding during the period.
D Fees and expenses of any underlying Fidelity Central Funds are not included in the Fund's expense ratio. The Fund indirectly bears its proportionate share of the expenses of any underlying Fidelity Central Funds.
E Amount does not include the portfolio activity of any underlying Fidelity Central Funds.
F Expense ratios reflect operating expenses of the class. Expenses before reductions do not reflect amounts reimbursed by the investment adviser or reductions from brokerage service arrangements or reductions from other expense offset arrangements and do not represent the amount paid by the class during periods when reimbursements or reductions occur. Expenses net of fee waivers reflect expenses after reimbursement by the investment adviser but prior to reductions from brokerage service arrangements or other expense offset arrangements. Expenses net of all reductions represent the net expenses paid by the class.
G Amount represents less than $.01 per share.
See accompanying notes which are an integral part of the financial statements.
Annual Report
Financial Highlights - Institutional Class
Years ended July 31, | 2012 | 2011 | 2010 | 2009 | 2008 |
Selected Per-Share Data | | | | | |
Net asset value, beginning of period | $ 41.95 | $ 28.87 | $ 26.83 | $ 51.76 | $ 49.68 |
Income from Investment Operations | | | | | |
Net investment income (loss) B | .37 | .23 | .04 | .03 | (.02) |
Net realized and unrealized gain (loss) | (6.79) | 12.99 | 2.00 | (18.06) | 5.74 |
Total from investment operations | (6.42) | 13.22 | 2.04 | (18.03) | 5.72 |
Distributions from net investment income | (.25) | (.14) | - | - | - |
Distributions from net realized gain | - | - | - | (6.90) | (3.64) |
Total distributions | (.25) | (.14) | - | (6.90) | (3.64) |
Redemption fees added to paid in capital B, F | - | - | - | - | - |
Net asset value, end of period | $ 35.28 | $ 41.95 | $ 28.87 | $ 26.83 | $ 51.76 |
Total Return A | (15.31)% | 45.87% | 7.60% | (38.68)% | 11.83% |
Ratios to Average Net Assets C, E | | | | | |
Expenses before reductions | .86% | .86% | .90% | .95% | .85% |
Expenses net of fee waivers, if any | .86% | .86% | .90% | .95% | .85% |
Expenses net of all reductions | .85% | .85% | .90% | .94% | .85% |
Net investment income (loss) | 1.03% | .60% | .14% | .13% | (.03)% |
Supplemental Data | | | | | |
Net assets, end of period (000 omitted) | $ 56,692 | $ 54,024 | $ 27,338 | $ 18,631 | $ 22,250 |
Portfolio turnover rate D | 88% | 91% | 103% | 148% | 90% |
A Total returns would have been lower if certain expenses had not been reduced during the applicable periods shown.
B Calculated based on average shares outstanding during the period.
C Fees and expenses of any underlying Fidelity Central Funds are not included in the Fund's expense ratio. The Fund indirectly bears its proportionate share of the expenses of any underlying Fidelity Central Funds.
D Amount does not include the portfolio activity of any underlying Fidelity Central Funds.
E Expense ratios reflect operating expenses of the class. Expenses before reductions do not reflect amounts reimbursed by the investment adviser or reductions from brokerage service arrangements or reductions from other expense offset arrangements and do not represent the amount paid by the class during periods when reimbursements or reductions occur. Expenses net of fee waivers reflect expenses after reimbursement by the investment adviser but prior to reductions from brokerage service arrangements or other expense offset arrangements. Expenses net of all reductions represent the net expenses paid by the class.
F Amount represents less than $.01 per share.
See accompanying notes which are an integral part of the financial statements.
Annual Report
Fidelity Advisor Energy Fund
Notes to Financial Statements
For the period ended July 31, 2012
1. Organization.
Fidelity Advisor Energy Fund (the Fund) is a non-diversified fund of Fidelity Advisor Series VII (the Trust) and is authorized to issue an unlimited number of shares. The Trust is registered under the Investment Company Act of 1940, as amended (the 1940 Act), as an open-end management investment company organized as a Massachusetts business trust. The Fund offers Class A, Class T, Class C, and Institutional Class shares, each of which, along with Class B shares, has equal rights as to assets and voting privileges. Effective after the close of business on September 1, 2010, Class B shares were closed to new accounts and additional purchases, except for exchanges and reinvestments. Each class has exclusive voting rights with respect to matters that affect that class. Class B shares will automatically convert to Class A shares after a holding period of seven years from the initial date of purchase. Investment income, realized and unrealized capital gains and losses, the common expenses of the Fund, and certain fund-level expense reductions, if any, are allocated on a pro-rata basis to each class based on the relative net assets of each class to the total net assets of the Fund. Each class differs with respect to transfer agent and distribution and service plan fees incurred. Certain expense reductions may also differ by class.
2. Investments in Fidelity Central Funds.
The Fund invests in Fidelity Central Funds, which are open-end investment companies available only to other investment companies and accounts managed by Fidelity Management & Research Company (FMR) and its affiliates. The Fund's Schedule of Investments lists each of the Fidelity Central Funds held as of period end, if any, as an investment of the Fund, but does not include the underlying holdings of each Fidelity Central Fund. As an Investing Fund, the Fund indirectly bears its proportionate share of the expenses of the underlying Fidelity Central Funds.
The Money Market Central Funds seek preservation of capital and current income and are managed by Fidelity Investments Money Management, Inc. (FIMM), an affiliate of FMR.
A complete unaudited list of holdings for each Fidelity Central Fund is available upon request or at the Securities and Exchange Commission (the SEC) web site at www.sec.gov. In addition, the financial statements of the Fidelity Central Funds, which are not covered by the Fund's Report of Independent Registered Public Accounting Firm, are available on the SEC web site or upon request.
3. Significant Accounting Policies.
The financial statements have been prepared in conformity with accounting principles generally accepted in the United States of America (GAAP), which require management to make certain estimates and assumptions at the date of the financial statements. Actual results could differ from those estimates. Subsequent events, if any, through the date that the financial statements were issued have been evaluated in the preparation of the financial statements. The following summarizes the significant accounting policies of the Fund:
Security Valuation. Investments are valued as of 4:00 p.m. Eastern time on the last calendar day of the period. In accordance with valuation policies and procedures approved by the Board of Trustees (the Board), the Fund attempts to obtain prices from one or more third party pricing vendor or broker to value its investments. When current market prices, quotations or rates are not readily available or reliable, securities will be fair valued in good faith by the FMR Fair Value Committee (the Committee), in accordance with procedures adopted by the Fund's Board. Factors used in determining fair value vary by security type and may include market or security specific events. The frequency with which these procedures are used cannot be predicted and they may be utilized to a significant extent. The Committee oversees the Fund's valuation policies and procedures and is responsible for approving and reporting to the Board all fair value determinations.
The Fund categorizes the inputs to valuation techniques used to value its investments into a disclosure hierarchy consisting of three levels as shown below:
Level 1 - quoted prices in active markets for identical investments
Level 2 - other significant observable inputs (including quoted prices for similar investments, interest rates, prepayment speeds, etc.)
Level 3 - unobservable inputs (including the Fund's own assumptions based on the best information available)
Valuation techniques used to value the Fund's investments by major category are as follows:
Equity securities, including restricted securities, for which market quotations are readily available, are valued at the last reported sale price or official closing price as reported by a third party pricing vendor on the primary market or exchange on which they are traded and are categorized as Level 1 in the hierarchy. In the event there were no sales during the day or closing prices are not available, securities are valued at the last quoted bid price or may be valued using the last available price and are generally categorized as Level 2 in the hierarchy. For foreign equity securities, when significant market or security specific events arise, comparisons to the valuation of American Depositary Receipts (ADRs), futures contracts, Exchange-Traded Funds (ETFs)and certain indexes as well as quoted prices for similar securities are used and are categorized as Level 2 in the hierarchy. Utilizing these techniques may result in transfers between Level 1 and Level 2. For restricted equity securities and private placements where observable inputs are limited, assumptions about market activity and risk are used and these securities are categorized as Level 3 in the hierarchy.
Annual Report
3. Significant Accounting Policies - continued
Security Valuation - continued
Investments in open-end mutual funds, including the Fidelity Central Funds, are valued at their closing net asset value each business day and are categorized as Level 1 in the hierarchy.
Changes in valuation techniques may result in transfers in or out of an assigned level within the disclosure hierarchy. The aggregate value of investments by input level, as of July 31, 2012, is included at the end of the Fund's Schedule of Investments.
Foreign Currency Translation. The Fund may use foreign currency contracts to facilitate transactions in foreign-denominated securities. Gains and losses from these transactions may arise from changes in the value of the foreign currency or if the counterparties do not perform under the contracts' terms.
Foreign-denominated assets, including investment securities, and liabilities are translated into U.S. dollars at the exchange rates at period end. Purchases and sales of investment securities, income and dividends received and expenses denominated in foreign currencies are translated into U.S. dollars at the exchange rate in effect on the transaction date.
The effects of exchange rate fluctuations on investments are included with the net realized and unrealized gain (loss) on investment securities. Other foreign currency transactions resulting in realized and unrealized gain (loss) are disclosed separately.
Investment Transactions and Income. For financial reporting purposes, the Fund's investment holdings and NAV include trades executed through the end of the last business day of the period. The NAV per share for processing shareholder transactions is calculated as of the close of business of the New York Stock Exchange (NYSE), normally 4:00 p.m. Eastern time and includes trades executed through the end of the prior business day. Gains and losses on securities sold are determined on the basis of identified cost and may include proceeds received from litigation. Dividend income is recorded on the ex-dividend date, except for certain dividends from foreign securities where the ex-dividend date may have passed, which are recorded as soon as the Fund is informed of the ex-dividend date. Non-cash dividends included in dividend income, if any, are recorded at the fair market value of the securities received. Distributions received on securities that represent a return of capital or capital gain are recorded as a reduction of cost of investments and/or as a realized gain. The Fund estimates the components of distributions received that may be considered return of capital distributions or capital gain distributions. Interest income and distributions from the Fidelity Central Funds are accrued as earned. Interest income includes coupon interest and amortization of premium and accretion of discount on debt securities. Investment income is recorded net of foreign taxes withheld where recovery of such taxes is uncertain.
Expenses. Expenses directly attributable to a fund are charged to that fund. Expenses attributable to more than one fund are allocated among the respective funds on the basis of relative net assets or other appropriate methods. Expense estimates are accrued in the period to which they relate and adjustments are made when actual amounts are known.
Income Tax Information and Distributions to Shareholders. Each year, the Fund intends to qualify as a regulated investment company under Subchapter M of the Internal Revenue Code, including distributing substantially all of its taxable income and realized gains. As a result, no provision for income taxes is required. As of July 31, 2012, the Fund did not have any unrecognized tax benefits in the financial statements; nor is the Fund aware of any tax positions for which it is reasonably possible that the total amounts of unrecognized tax benefits will significantly change in the next twelve months. The Fund files a U.S. federal tax return, in addition to state and local tax returns as required. A fund's federal income tax returns are subject to examination by the Internal Revenue Service (IRS) for a period of three fiscal years after they are filed. State and local tax returns may be subject to examination for an additional fiscal year depending on the jurisdiction. Foreign taxes are provided for based on the Fund's understanding of the tax rules and rates that exist in the foreign markets in which it invests.
Distributions are declared and recorded on the ex-dividend date. Income dividends and capital gain distributions are declared separately for each class. Income and capital gain distributions are determined in accordance with income tax regulations, which may differ from GAAP.
Capital accounts within the financial statements are adjusted for permanent book-tax differences. These adjustments have no impact on net assets or the results of operations. Temporary book-tax differences will reverse in a subsequent period.
Book-tax differences are primarily due to foreign currency transactions, partnerships, deferred trustees compensation, capital loss carryforwards, and losses deferred due to wash sales and excise tax regulations.
The federal tax cost of investment securities and unrealized appreciation (depreciation) as of period end were as follows:
Annual Report
Fidelity Advisor Energy Fund
Notes to Financial Statements - continued
3. Significant Accounting Policies - continued
Income Tax Information and Distributions to Shareholders - continued
Gross unrealized appreciation | $ 70,476,487 |
Gross unrealized depreciation | (39,744,261) |
Net unrealized appreciation (depreciation) on securities and other investments | $ 30,732,226 |
| |
Tax Cost | $ 621,528,826 |
The tax-based components of distributable earnings as of period end were as follows:
Capital loss carryforward | $ (42,733,087) |
Net unrealized appreciation (depreciation) | $ 30,731,887 |
Capital loss carryforwards are only available to offset future capital gains of the Fund to the extent provided by regulations and may be limited. Under the Regulated Investment Company Modernization Act of 2010 (the Act), the Fund is permitted to carry forward capital losses incurred in taxable years beginning after December 22, 2010 for an unlimited period and such capital losses are required to be used prior to any losses that expire. Capital loss carryforwards were as follows:
Fiscal year of expiration | |
| |
2017 | $ (2,848,921) |
2018 | (2,715,383) |
Total with expiration | (5,564,304) |
No expiration | |
Short-term | (37,168,783) |
Total capital loss carryforward | $ (42,733,087) |
The Fund intends to elect to defer to its fiscal year ending July 31, 2013 approximately $16,119,567 of losses recognized during the period November 1, 2011 to July 31, 2012.
The tax character of distributions paid was as follows:
| July 31, 2012 | July 31, 2011 |
Ordinary Income | $ 3,625,437 | $ 1,542,989 |
Short-Term Trading (Redemption) Fees. Shares held by investors in the Fund less than 30 days are subject to a redemption fee equal to .75% of the net asset value of shares redeemed. All redemption fees, which reduce the proceeds of the shareholder redemption, are retained by the Fund and accounted for as an addition to paid in capital.
New Accounting Pronouncement. In December 2011, the Financial Accounting Standards Board issued Accounting Standard Update No. 2011-11, Disclosures about Offsetting Assets and Liabilities. The update creates new disclosure requirements requiring entities to disclose both gross and net information for derivatives and other financial instruments that are either offset in the Statement of Assets and Liabilities or subject to an enforceable master netting arrangement or similar agreement. The disclosure requirements are effective for interim and annual reporting periods beginning on or after January 1, 2013. Management is currently evaluating the impact of the update's adoption on the Fund's financial statement disclosures.
4. Operating Policies.
Restricted Securities. The Fund may invest in securities that are subject to legal or contractual restrictions on resale. These securities generally may be resold in transactions exempt from registration or to the public if the securities are registered. Disposal of these securities may involve time-consuming negotiations and expense, and prompt sale at an acceptable price may be difficult. Information regarding restricted securities is included at the end of the Fund's Schedule of Investments.
5. Purchases and Sales of Investments.
Purchases and sales of securities, other than short-term securities, aggregated $616,352,470 and $698,886,570, respectively.
Annual Report
6. Fees and Other Transactions with Affiliates.
Management Fee. FMR and its affiliates provide the Fund with investment management related services for which the Fund pays a monthly management fee. The management fee is the sum of an individual fund fee rate that is based on an annual rate of .30% of the Fund's average net assets and an annualized group fee rate that averaged .26% during the period. The group fee rate is based upon the average net assets of all the mutual funds advised by FMR. The group fee rate decreases as assets under management increase and increases as assets under management decrease. For the period, the total annual management fee rate was .56% of the Fund's average net assets.
Distribution and Service Plan Fees. In accordance with Rule 12b-1 of the 1940 Act, the Fund has adopted separate Distribution and Service Plans for each class of shares. Certain classes pay Fidelity Distributors Corporation (FDC), an affiliate of FMR, separate Distribution and Service Fees, each of which is based on an annual percentage of each class' average net assets. In addition, FDC may pay financial intermediaries for selling shares of the Fund and providing shareholder support services. For the period, the Distribution and Service Fee rates, total fees and amounts retained by FDC were as follows:
| Distribution
Fee | Service
Fee | Total Fees | Retained
by FDC |
Class A | -% | .25% | $ 673,541 | $ 15,540 |
Class T | .25% | .25% | 1,163,443 | 5,233 |
Class B | .75% | .25% | 358,877 | 269,382 |
Class C | .75% | .25% | 1,040,513 | 147,717 |
| | | $ 3,236,374 | $ 437,872 |
Sales Load. FDC may receive a front-end sales charge of up to 5.75% for selling Class A shares and 3.50% for selling Class T shares, some of which is paid to financial intermediaries for selling shares of the Fund. Depending on the holding period, FDC may receive contingent deferred sales charges levied on Class A, Class T, Class B, and Class C redemptions. The deferred sales charges range from 5.00% to 1.00% for Class B shares, 1.00% for Class C shares, 1.00% for certain purchases of Class A shares and .25% for certain purchases of Class T shares.
For the period, sales charge amounts retained by FDC were as follows:
| Retained
by FDC |
Class A | $ 129,173 |
Class T | 25,570 |
Class B* | 56,910 |
Class C* | 15,188 |
| $ 226,841 |
* When Class B and Class C shares are initially sold, FDC pays commissions from its own resources to financial intermediaries through which the sales are made.
Transfer Agent Fees. Fidelity Investments Institutional Operations Company, Inc. (FIIOC), an affiliate of FMR, is the transfer, dividend disbursing and shareholder servicing agent for each class of the Fund. FIIOC receives account fees and asset-based fees that vary according to the account size and type of account of the shareholders of the respective classes of the Fund. FIIOC pays for typesetting, printing and mailing of shareholder reports, except proxy statements. For the period, transfer agent fees for each class were as follows:
| Amount | % of
Average
Net Assets |
Class A | $ 807,721 | .30 |
Class T | 611,222 | .26 |
Class B | 108,124 | .30 |
Class C | 305,678 | .29 |
Institutional Class | 119,925 | .23 |
| $ 1,952,670 | |
Accounting and Security Lending Fees. Fidelity Service Company, Inc. (FSC), an affiliate of FMR, maintains the Fund's accounting records. The accounting fee is based on the level of average net assets for each month. Under a separate contract, FSC administers the security lending program. The security lending fee is based on the number and duration of lending transactions.
Brokerage Commissions. The Fund placed a portion of its portfolio transactions with brokerage firms which are affiliates of the investment adviser. The commissions paid to these affiliated firms were $6,115 for the period.
Annual Report
Fidelity Advisor Energy Fund
Notes to Financial Statements - continued
7. Committed Line of Credit.
The Fund participates with other funds managed by FMR or an affiliate in a $4.25 billion credit facility (the "line of credit") to be utilized for temporary or emergency purposes to fund shareholder redemptions or for other short-term liquidity purposes. The Fund has agreed to pay commitment fees on its pro-rata portion of the line of credit, which amounted to $2,020 and is reflected in Miscellaneous expenses on the Statement of Operations. During the period, there were no borrowings on this line of credit.
8. Security Lending.
The Fund lends portfolio securities through a lending agent from time to time in order to earn additional income. For equity securities, a lending agent is used and may loan securities to certain qualified borrowers, including Fidelity Capital Markets (FCM), a broker-dealer affiliated with the Fund. On the settlement date of the loan, the Fund receives collateral (in the form of U.S. Treasury obligations, letters of credit and/or cash) against the loaned securities and maintains collateral in an amount not less than 100% of the market value of the loaned securities during the period of the loan. The market value of the loaned securities is determined at the close of business of the Fund and any additional required collateral is delivered to the Fund on the next business day. If the borrower defaults on its obligation to return the securities loaned because of insolvency or other reasons, a fund could experience delays and costs in recovering the securities loaned or in gaining access to the collateral. Any cash collateral received is invested in the Fidelity Securities Lending Cash Central Fund. The value of loaned securities and cash collateral at period end are disclosed on the Fund's Statement of Assets and Liabilities. Security lending income represents the income earned on investing cash collateral, less rebates paid to borrowers and any lending agent fees associated with the loan, plus any premium payments received for lending certain types of securities. Security lending income is presented in the Statement of Operations as a component of income from Fidelity Central Funds. Total security lending income during the period amounted to $120,606, including $455 from securities loaned to FCM.
9. Expense Reductions.
Many of the brokers with whom FMR places trades on behalf of the Fund provided services to the Fund in addition to trade execution. These services included payments of certain expenses on behalf of the Fund totaling $24,920 for the period.
10. Distributions to Shareholders.
Distributions to shareholders of each class were as follows:
Years ended July 31, | 2012 | 2011 |
From net investment income | | |
Class A | $ 1,638,737 | $ 788,179 |
Class T | 1,147,864 | 537,026 |
Class B | 121,615 | 21,298 |
Class C | 359,185 | 59,062 |
Institutional Class | 358,036 | 137,424 |
Total | $ 3,625,437 | $ 1,542,989 |
11. Share Transactions.
Transactions for each class of shares were as follows:
| Shares | Dollars |
Years ended July 31, | 2012 | 2011 | 2012 | 2011 |
Class A | | | | |
Shares sold | 1,965,815 | 2,848,824 | $ 67,878,173 | $ 108,457,523 |
Reinvestment of distributions | 41,823 | 20,239 | 1,442,046 | 701,079 |
Shares redeemed | (2,734,716) | (2,366,298) | (93,508,870) | (85,322,989) |
Net increase (decrease) | (727,078) | 502,765 | $ (24,188,651) | $ 23,835,613 |
Class T | | | | |
Shares sold | 716,955 | 1,191,543 | $ 25,119,936 | $ 45,538,389 |
Reinvestment of distributions | 30,771 | 14,153 | 1,084,070 | 502,257 |
Shares redeemed | (1,562,534) | (1,858,422) | (54,290,373) | (68,540,609) |
Net increase (decrease) | (814,808) | (652,726) | $ (28,086,367) | $ (22,499,963) |
Annual Report
11. Share Transactions - continued
| Shares | Dollars |
Years ended July 31, | 2012 | 2011 | 2012 | 2011 |
Class B | | | | |
Shares sold | 77,487 | 118,268 | $ 2,508,867 | $ 4,084,617 |
Reinvestment of distributions | 3,337 | 560 | 107,704 | 18,656 |
Shares redeemed | (495,555) | (495,702) | (15,865,000) | (16,527,555) |
Net increase (decrease) | (414,731) | (376,874) | $ (13,248,429) | $ (12,424,282) |
Class C | | | | |
Shares sold | 443,617 | 964,253 | $ 14,508,195 | $ 34,720,800 |
Reinvestment of distributions | 9,390 | 1,513 | 305,281 | 50,476 |
Shares redeemed | (1,020,680) | (893,659) | (32,456,638) | (30,160,985) |
Net increase (decrease) | (567,673) | 72,107 | $ (17,643,162) | $ 4,610,291 |
Institutional Class | | | | |
Shares sold | 947,827 | 771,369 | $ 33,843,047 | $ 30,606,839 |
Reinvestment of distributions | 7,770 | 3,300 | 279,800 | 119,042 |
Shares redeemed | (636,276) | (433,932) | (22,583,838) | (16,770,999) |
Net increase (decrease) | 319,321 | 340,737 | $ 11,539,009 | $ 13,954,882 |
12. Other.
The Fund's organizational documents provide former and current trustees and officers with a limited indemnification against liabilities arising in connection with the performance of their duties to the Fund. In the normal course of business, the Fund may also enter into contracts that provide general indemnifications. The Fund's maximum exposure under these arrangements is unknown as this would be dependent on future claims that may be made against the Fund. The risk of material loss from such claims is considered remote.
Annual Report
Fidelity Advisor Financial Services Fund - Class A, T, B, and C
Performance: The Bottom Line
Average annual total return reflects the change in the value of an investment, assuming reinvestment of the class' distributions from dividend income and capital gains (the profits earned upon the sale of securities that have grown in value, if any) and assuming a constant rate of performance each year. The $10,000 table and the fund's returns do not reflect the deduction of taxes that a shareholder would pay on fund distributions or the redemption of fund shares. During periods of reimbursement by Fidelity, a fund's total return will be greater than it would be had the reimbursement not occurred. How a fund did yesterday is no guarantee of how it will do tomorrow. Returns reflect the conversion of Class B shares to Class A shares after a maximum of seven years.
Average Annual Total Returns
Periods ended July 31, 2012 | Past 1
year | Past 5
years | Past 10
years |
Class A (incl. 5.75% sales charge) | -4.49% | -12.41% | -1.70% |
Class T (incl. 3.50% sales charge) | -2.50% | -12.23% | -1.71% |
Class B (incl. contingent deferred sales charge) A | -4.38% | -12.35% | -1.62% |
Class C (incl. contingent deferred sales charge) B | -0.48% | -12.03% | -1.82% |
A Class B shares' contingent deferred sales charges included in the past one year, past five years, and past ten years total return figures are 5%, 2%, and 0%, respectively.
B Class C shares' contingent deferred sales charges included in the past one year, past five years, and past ten years total return figures are 1%, 0%, and 0%, respectively.
$10,000 Over 10 Years
Let's say hypothetically that $10,000 was invested in Fidelity Advisor Financial Services Fund - Class A on July 31, 2002, and the current 5.75% sales charge was paid. The chart shows how the value of your investment would have changed, and also shows how the S&P 500 Index performed over the same period.
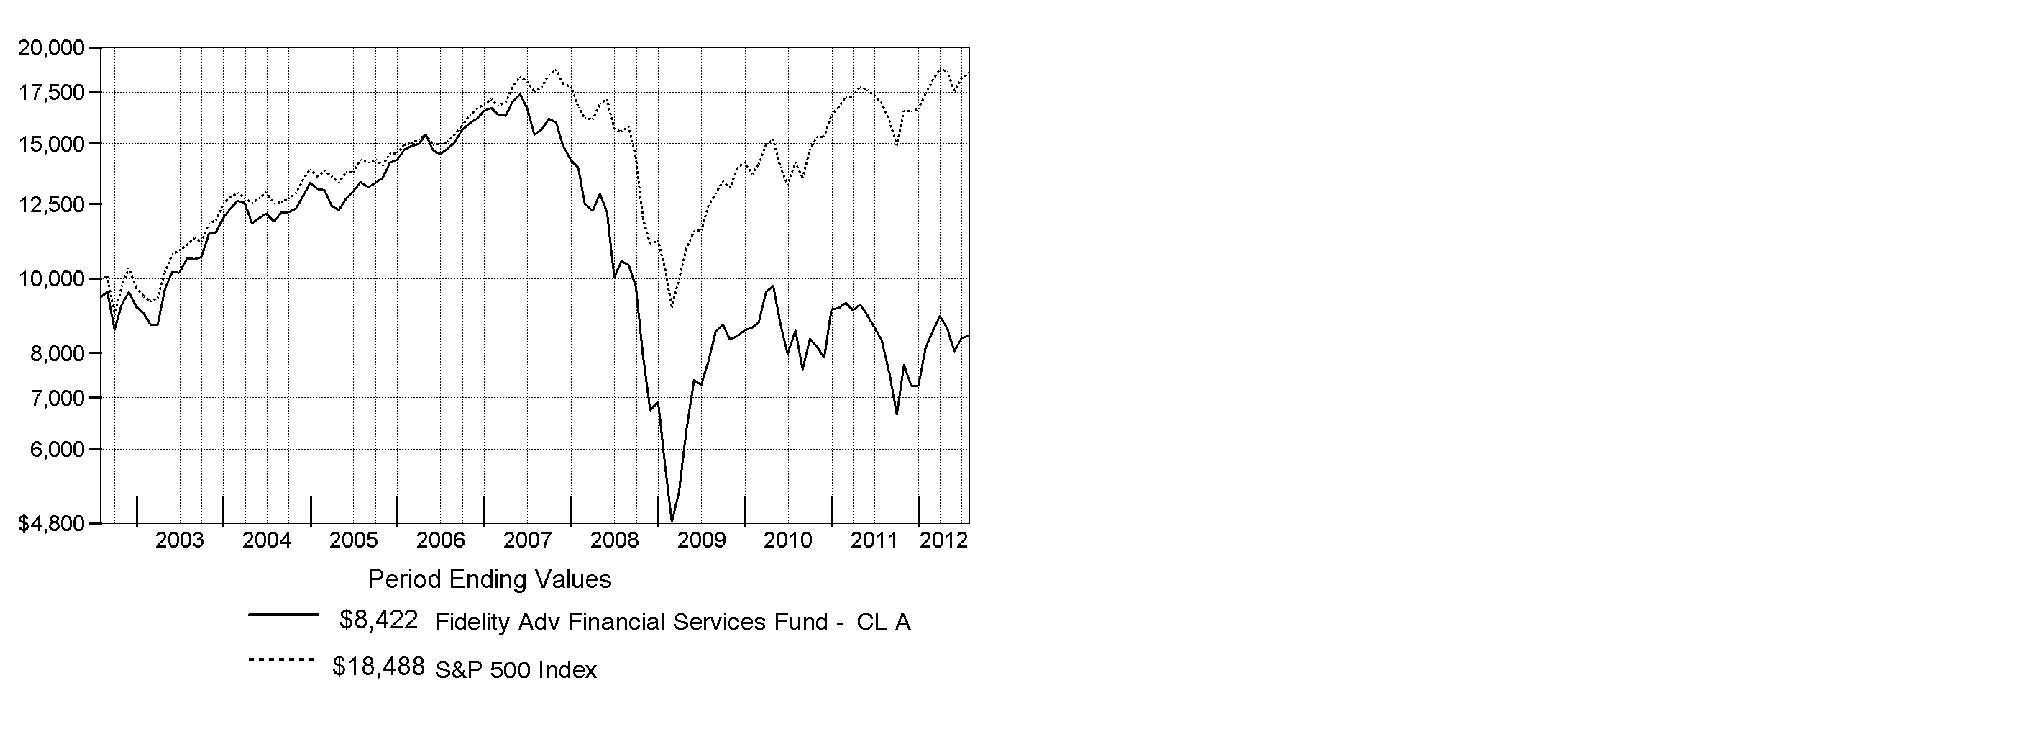
Annual Report
Fidelity Advisor Financial Services Fund
Market Recap: Major U.S. equity benchmarks posted solid gains for the year ending July 31, 2012, amid an uncertain investment environment. The broad-based S&P 500® Index returned 9.13%, while the blue-chip-laden Dow Jones Industrial AverageSM and technology-heavy Nasdaq Composite® Index gained 10.12% and 7.83%, respectively. Volatility spiked during the period's first half, as equities plummeted late last summer on Europe's debt woes, political wrangling over the U.S. debt ceiling and the sovereign credit-rating downgrade that followed. By October, a seemingly improved U.S. economy rejuvenated stocks, paving the way for major equity benchmarks to post their best first-quarter performance since 1998. However, more eurozone trouble, signs that the U.S. economy had turned sluggish and a slowdown in China caused stocks to slip in May, before a new wave of optimism took hold in June and July. Within the S&P 500®, more-defensive sectors such as telecommunication services (+30%) and consumer staples (+20%) fared best, while materials and energy significantly underperformed, returning -5%. Small- and mid-cap stocks trailed their less-volatile large-cap counterparts, with the Russell 2000® Index adding 0.19% and the Russell Midcap® Index rising 2.28%. Given turmoil and local currency weakness in Europe, foreign developed-markets stocks lost ground, with the MSCI® EAFE® Index returning -11.32%.
Comments from Benjamin Hesse, Portfolio Manager of Fidelity Advisor® Financial Services Fund: For the year, the fund's Class A, Class T, Class B and Class C shares returned 1.34%, 1.03%, 0.62% and 0.52%, respectively (excluding sales charges), lagging the 2.44% advance of the MSCI® U.S. IM Financials 25/50 Index and the broadly based S&P 500®. Investment banking/brokerage, diversified banks and property/casualty insurance detracted versus the MSCI index. An average overweighting in investment banking/brokerage hurt, as did specific stocks, including online broker E*TRADE Financial, whose shares declined amid news the company was not for sale, and commodities/derivatives broker MF Global Holdings, whose stock plunged after a sizable investment in European government debt went south. By contrast, positioning in other diversified financial services, specialized real estate investment trusts (REITs) and out-of-index data processing/outsourced services aided performance. In terms of individual contributors, the fund benefited from an average underweighting in diversified financial Bank of America, as low interest rates and sluggish loan growth pressured its returns. Shares of card processor MasterCard rallied sharply, as more people worldwide paid with plastic. MasterCard was not in the MSCI index, and MasterCard and MF Global were sold before period end.
The views expressed above reflect those of the portfolio manager(s) only through the end of the period as stated on the cover of this report and do not necessarily represent the views of Fidelity or any other person in the Fidelity organization. Any such views are subject to change at any time based upon market or other conditions and Fidelity disclaims any responsibility to update such views. These views may not be relied on as investment advice and, because investment decisions for a Fidelity fund are based on numerous factors, may not be relied on as an indication of trading intent on behalf of any Fidelity fund.
Annual Report
Fidelity Advisor Financial Services Fund
As a shareholder of the Fund, you incur two types of costs: (1) transaction costs, including sales charges (loads) on purchase payments or redemption proceeds, redemption fees and (2) ongoing costs, including management fees, distribution and/or service (12b-1) fees and other Fund expenses. This Example is intended to help you understand your ongoing costs (in dollars) of investing in the Fund and to compare these costs with the ongoing costs of investing in other mutual funds.
The Example is based on an investment of $1,000 invested at the beginning of the period and held for the entire period (February 1, 2012 to July 31, 2012).
Actual Expenses
The first line of the accompanying table for each class of the Fund provides information about actual account values and actual expenses. You may use the information in this line, together with the amount you invested, to estimate the expenses that you paid over the period. Simply divide your account value by $1,000.00 (for example, an $8,600 account value divided by $1,000.00 = 8.6), then multiply the result by the number in the first line for a class of the Fund under the heading entitled "Expenses Paid During Period" to estimate the expenses you paid on your account during this period. In addition, the Fund, as a shareholder in the underlying Fidelity Central Funds, will indirectly bear its pro-rata share of the fees and expenses incurred by the underlying Fidelity Central Funds. These fees and expenses are not included in the Fund's annualized expense ratio used to calculate the expense estimate in the table below.
Hypothetical Example for Comparison Purposes
The second line of the accompanying table for each class of the Fund provides information about hypothetical account values and hypothetical expenses based on a Class' actual expense ratio and an assumed rate of return of 5% per year before expenses, which is not the Class' actual return. The hypothetical account values and expenses may not be used to estimate the actual ending account balance or expenses you paid for the period. You may use this information to compare the ongoing costs of investing in the Fund and other funds. To do so, compare this 5% hypothetical example with the 5% hypothetical examples that appear in the shareholder reports of the other funds. In addition, the Fund, as a shareholder in the underlying Fidelity Central Funds, will indirectly bear its pro-rata share of the fees and expenses incurred by the underlying Fidelity Central Funds. These fees and expenses are not included in the Fund's annualized expense ratio used to calculate the expense estimate in the table below.
Please note that the expenses shown in the table are meant to highlight your ongoing costs only and do not reflect any transaction costs. Therefore, the second line of the table is useful in comparing ongoing costs only, and will not help you determine the relative total costs of owning different funds. In addition, if these transactional costs were included, your costs would have been higher.
| Annualized Expense Ratio | Beginning
Account Value
February 1, 2012 | Ending
Account Value
July 31, 2012 | Expenses Paid
During Period*
February 1, 2012
to July 31, 2012 |
Class A | 1.27% | | | |
Actual | | $ 1,000.00 | $ 1,036.70 | $ 6.43 |
HypotheticalA | | $ 1,000.00 | $ 1,018.55 | $ 6.37 |
Class T | 1.53% | | | |
Actual | | $ 1,000.00 | $ 1,034.80 | $ 7.74 |
HypotheticalA | | $ 1,000.00 | $ 1,017.26 | $ 7.67 |
Class B | 2.02% | | | |
Actual | | $ 1,000.00 | $ 1,032.70 | $ 10.21 |
HypotheticalA | | $ 1,000.00 | $ 1,014.82 | $ 10.12 |
Class C | 2.02% | | | |
Actual | | $ 1,000.00 | $ 1,031.90 | $ 10.21 |
HypotheticalA | | $ 1,000.00 | $ 1,014.82 | $ 10.12 |
Institutional Class | .94% | | | |
Actual | | $ 1,000.00 | $ 1,037.80 | $ 4.76 |
HypotheticalA | | $ 1,000.00 | $ 1,020.19 | $ 4.72 |
A 5% return per year before expenses
* Expenses are equal to each Class' annualized expense ratio, multiplied by the average account value over the period, multiplied by 182/366 (to reflect the one-half year period).
Annual Report
Fidelity Advisor Financial Services Fund
Investment Changes (Unaudited)
Top Ten Stocks as of July 31, 2012 |
| % of fund's
net assets | % of fund's net assets
6 months ago |
Citigroup, Inc. | 4.0 | 5.2 |
Big Yellow Group PLC | 3.6 | 1.2 |
PNC Financial Services Group, Inc. | 3.5 | 0.0 |
HCP, Inc. | 3.4 | 0.8 |
Health Care REIT, Inc. | 3.1 | 0.2 |
CME Group, Inc. | 3.0 | 0.0 |
ACE Ltd. | 2.5 | 2.2 |
BanColombia SA sponsored ADR | 2.3 | 0.6 |
The NASDAQ Stock Market, Inc. | 2.2 | 0.0 |
Prudential Financial, Inc. | 2.1 | 0.2 |
| 29.7 | |
Top Industries (% of fund's net assets) |
As of July 31, 2012 |
| Real Estate Investment Trusts | 28.1% | |
| Commercial Banks | 17.7% | |
| Diversified Financial Services | 13.0% | |
| Insurance | 12.8% | |
| Capital Markets | 10.9% | |
| All Others* | 17.5% | |

As of January 31, 2012 |
| Capital Markets | 17.0% | |
| Commercial Banks | 16.7% | |
| Diversified Financial Services | 16.6% | |
| Real Estate Investment Trusts | 16.0% | |
| Insurance | 14.6% | |
| All Others* | 19.1% | |

* Includes short-term investments and net other assets. |
Annual Report
Fidelity Advisor Financial Services Fund
Investments July 31, 2012
Showing Percentage of Net Assets
Common Stocks - 93.4% |
| Shares | | Value |
CAPITAL MARKETS - 10.9% |
Asset Management & Custody Banks - 8.1% |
A.F.P. Provida SA sponsored ADR | 5,200 | | $ 454,116 |
Affiliated Managers Group, Inc. (a) | 2,314 | | 258,219 |
Ameriprise Financial, Inc. | 200 | | 10,344 |
Apollo Global Management LLC Class A | 109,139 | | 1,481,016 |
Ares Capital Corp. | 42,600 | | 708,438 |
Bank of New York Mellon Corp. | 78,456 | | 1,669,544 |
BlackRock, Inc. Class A | 56 | | 9,535 |
Cetip SA | 46,600 | | 590,573 |
Fortress Investment Group LLC | 51,700 | | 195,426 |
Franklin Resources, Inc. | 4,623 | | 531,414 |
Invesco Ltd. | 538 | | 11,906 |
Julius Baer Group Ltd. | 300 | | 10,755 |
Legg Mason, Inc. | 853 | | 20,916 |
Northern Trust Corp. | 7,007 | | 318,118 |
State Street Corp. | 10,253 | | 414,016 |
The Blackstone Group LP | 119,759 | | 1,658,662 |
| | 8,342,998 |
Diversified Capital Markets - 0.2% |
Credit Suisse Group sponsored ADR | 472 | | 8,052 |
HFF, Inc. (a) | 10,500 | | 137,130 |
UBS AG (NY Shares) | 9,733 | | 103,170 |
| | 248,352 |
Investment Banking & Brokerage - 2.6% |
Charles Schwab Corp. | 900 | | 11,367 |
E*TRADE Financial Corp. (a) | 1,059 | | 8,080 |
Evercore Partners, Inc. Class A | 57,400 | | 1,329,958 |
GFI Group, Inc. | 320,278 | | 1,018,484 |
Goldman Sachs Group, Inc. | 2,588 | | 261,129 |
Greenhill & Co., Inc. | 600 | | 23,832 |
Investment Technology Group, Inc. (a) | 1,125 | | 9,315 |
Lazard Ltd. Class A | 443 | | 11,895 |
Macquarie Group Ltd. | 393 | | 10,317 |
Monex Group, Inc. | 32 | | 5,193 |
Morgan Stanley | 253 | | 3,456 |
Nomura Holdings, Inc. sponsored ADR (d) | 2,800 | | 9,744 |
| | 2,702,770 |
TOTAL CAPITAL MARKETS | | 11,294,120 |
COMMERCIAL BANKS - 17.7% |
Diversified Banks - 6.5% |
Banco ABC Brasil SA | 9,500 | | 49,651 |
Banco Bradesco SA (PN) sponsored ADR | 700 | | 10,738 |
Banco de Chile sponsored ADR | 101 | | 8,629 |
Banco Macro SA sponsored ADR (a) | 600 | | 7,362 |
Banco Pine SA | 228 | | 1,494 |
Banco Santander Chile sponsored ADR | 100 | | 7,516 |
Banco Santander SA (Spain) sponsored ADR (d) | 1,700 | | 10,132 |
Banco Santander SA (Brasil) ADR | 56,610 | | 431,934 |
|
| Shares | | Value |
BanColombia SA sponsored ADR (d) | 37,995 | | $ 2,349,611 |
Bangkok Bank Public Co. Ltd. (For. Reg.) | 15,900 | | 105,091 |
Bank of Baroda | 5,117 | | 60,426 |
Bank of the Philippine Islands (BPI) | 15,110 | | 26,278 |
Barclays PLC sponsored ADR | 181,186 | | 1,895,206 |
BBVA Banco Frances SA sponsored ADR (a) | 2,300 | | 7,843 |
BNP Paribas SA | 202 | | 7,498 |
China CITIC Bank Corp. Ltd. (H Shares) | 25,000 | | 12,638 |
Comerica, Inc. | 9,200 | | 277,932 |
CorpBanca SA sponsored ADR | 550 | | 10,219 |
Credicorp Ltd. (NY Shares) | 1,828 | | 211,938 |
Credit Agricole SA (a) | 200 | | 859 |
Development Credit Bank Ltd. (a) | 27,538 | | 19,925 |
Grupo Financiero Galicia SA sponsored ADR (a)(d) | 1,800 | | 8,352 |
Guaranty Trust Bank PLC GDR (Reg. S) | 5,300 | | 30,740 |
Hana Financial Group, Inc. | 2,410 | | 77,053 |
Hong Leong Bank Bhd | 3,400 | | 14,864 |
HSBC Holdings PLC sponsored ADR | 300 | | 12,540 |
ICICI Bank Ltd. sponsored ADR | 333 | | 11,528 |
Industrial & Commercial Bank of China Ltd. (H Shares) | 6,000 | | 3,443 |
Intesa Sanpaolo SpA | 8,105 | | 10,301 |
Itau Unibanco Banco Multiplo SA sponsored ADR | 619 | | 9,786 |
KB Financial Group, Inc. | 2,210 | | 69,595 |
Malayan Banking Bhd | 30,757 | | 86,232 |
National Australia Bank Ltd. | 254 | | 6,668 |
Nordea Bank AB | 1,200 | | 11,222 |
PT Bank Bukopin Tbk | 3,926,500 | | 261,905 |
PT Bank Central Asia Tbk | 13,500 | | 11,435 |
Raiffeisen International Bank-Holding AG (d) | 1,300 | | 42,955 |
Sberbank (Savings Bank of the Russian Federation) sponsored ADR | 1,100 | | 12,259 |
Standard Chartered PLC (United Kingdom) | 1,488 | | 34,166 |
Sumitomo Mitsui Financial Group, Inc. | 1,300 | | 40,939 |
Swedbank AB (A Shares) | 900 | | 15,696 |
The Jammu & Kashmir Bank Ltd. | 7,298 | | 120,169 |
The Toronto-Dominion Bank | 100 | | 7,870 |
U.S. Bancorp | 301 | | 10,084 |
UniCredit SpA (a) | 630 | | 2,146 |
United Overseas Bank Ltd. | 1,000 | | 16,072 |
Wells Fargo & Co. | 8,150 | | 275,552 |
Yes Bank Ltd. | 1,839 | | 12,088 |
| | 6,728,580 |
Regional Banks - 11.2% |
Alerus Financial Corp. | 435 | | 12,402 |
Banco Daycoval SA (PN) | 16,000 | | 74,566 |
Bancorp New Jersey, Inc. | 100 | | 1,030 |
BancTrust Financial Group, Inc. (a) | 28,700 | | 84,952 |
Bank of Hawaii Corp. | 300 | | 14,013 |
Common Stocks - continued |
| Shares | | Value |
COMMERCIAL BANKS - CONTINUED |
Regional Banks - continued |
Bank of the Ozarks, Inc. | 7,716 | | $ 248,378 |
BB&T Corp. | 870 | | 27,292 |
Boston Private Financial Holdings, Inc. | 2,200 | | 20,702 |
Bridge Capital Holdings (a) | 48,490 | | 753,050 |
BS Financial Group, Inc. | 52,600 | | 555,927 |
Canadian Western Bank, Edmonton (d) | 6,000 | | 157,172 |
Cascade Bancorp (a) | 900 | | 4,662 |
CIT Group, Inc. (a) | 7,654 | | 279,524 |
Citizens & Northern Corp. | 520 | | 9,615 |
City Holding Co. | 500 | | 16,525 |
City National Corp. | 300 | | 14,784 |
CNB Financial Corp., Pennsylvania | 803 | | 13,225 |
CoBiz, Inc. | 127,900 | | 856,930 |
Cullen/Frost Bankers, Inc. | 100 | | 5,531 |
Fifth Third Bancorp | 89,100 | | 1,231,362 |
First Business Finance Services, Inc. | 500 | | 10,905 |
First Commonwealth Financial Corp. | 15,322 | | 107,407 |
First Interstate Bancsystem, Inc. | 68,712 | | 990,140 |
First Midwest Bancorp, Inc., Delaware | 1,200 | | 13,560 |
First Republic Bank | 3,081 | | 100,225 |
FirstMerit Corp. | 800 | | 12,960 |
FNB Corp., Pennsylvania | 1,100 | | 11,968 |
Glacier Bancorp, Inc. | 924 | | 14,017 |
Huntington Bancshares, Inc. | 77,012 | | 478,630 |
KeyCorp | 1,500 | | 11,970 |
NBT Bancorp, Inc. | 200 | | 4,202 |
Northrim Bancorp, Inc. | 2,269 | | 45,743 |
Pacific Continental Corp. | 19,828 | | 183,012 |
PNC Financial Services Group, Inc. | 60,928 | | 3,600,845 |
PrivateBancorp, Inc. | 900 | | 13,788 |
PT Bank Tabungan Negara Tbk | 1,250,000 | | 181,313 |
Regions Financial Corp. | 1,757 | | 12,229 |
Sandy Spring Bancorp, Inc. | 200 | | 3,562 |
Savannah Bancorp, Inc. (a) | 8,798 | | 50,589 |
SCBT Financial Corp. | 800 | | 29,632 |
SunTrust Banks, Inc. | 392 | | 9,271 |
Susquehanna Bancshares, Inc. | 37,614 | | 400,965 |
SVB Financial Group (a) | 312 | | 18,037 |
Synovus Financial Corp. | 23,182 | | 44,046 |
TCF Financial Corp. | 1,137 | | 11,745 |
Texas Capital Bancshares, Inc. (a) | 2,300 | | 99,107 |
UMB Financial Corp. | 2,300 | | 110,538 |
Umpqua Holdings Corp. | 100 | | 1,248 |
Valley National Bancorp | 3,053 | | 28,393 |
Virginia Commerce Bancorp, Inc. (a) | 3,000 | | 24,210 |
Washington Trust Bancorp, Inc. | 6,544 | | 162,422 |
Webster Financial Corp. | 5,300 | | 108,756 |
Westamerica Bancorp. | 100 | | 4,600 |
|
| Shares | | Value |
Western Alliance Bancorp. (a) | 39,600 | | $ 365,112 |
Zions Bancorporation | 84 | | 1,529 |
| | 11,648,318 |
TOTAL COMMERCIAL BANKS | | 18,376,898 |
COMMERCIAL SERVICES & SUPPLIES - 0.0% |
Diversified Support Services - 0.0% |
Intrum Justitia AB | 1,000 | | 13,932 |
CONSUMER FINANCE - 1.3% |
Consumer Finance - 1.3% |
American Express Co. | 123 | | 7,098 |
Capital One Financial Corp. | 144 | | 8,135 |
DFC Global Corp. (a) | 2,000 | | 38,340 |
Discover Financial Services | 1,495 | | 53,760 |
EZCORP, Inc. (non-vtg.) Class A (a) | 16,066 | | 361,485 |
First Cash Financial Services, Inc. (a) | 3,390 | | 135,939 |
Green Dot Corp. Class A (a)(d) | 422 | | 4,406 |
International Personal Finance PLC | 176 | | 773 |
Nelnet, Inc. Class A | 700 | | 16,457 |
Netspend Holdings, Inc. (a) | 1,331 | | 11,713 |
PT Clipan Finance Indonesia Tbk | 338,000 | | 15,209 |
Regional Management Corp. | 11,300 | | 170,517 |
SLM Corp. | 31,765 | | 507,922 |
| | 1,331,754 |
DIVERSIFIED CONSUMER SERVICES - 0.0% |
Specialized Consumer Services - 0.0% |
Sotheby's Class A (Ltd. vtg.) | 350 | | 10,273 |
DIVERSIFIED FINANCIAL SERVICES - 13.0% |
Other Diversified Financial Services - 4.2% |
Bank of America Corp. | 35,743 | | 262,354 |
Citigroup, Inc. | 151,547 | | 4,111,467 |
JPMorgan Chase & Co. | 50 | | 1,800 |
| | 4,375,621 |
Specialized Finance - 8.8% |
BM&F Bovespa SA | 1,900 | | 10,663 |
CBOE Holdings, Inc. | 60,875 | | 1,734,938 |
CME Group, Inc. | 59,705 | | 3,111,228 |
IntercontinentalExchange, Inc. (a) | 3,284 | | 430,926 |
MarketAxess Holdings, Inc. | 900 | | 27,198 |
Moody's Corp. | 4,831 | | 195,800 |
NYSE Euronext | 400 | | 10,192 |
PHH Corp. (a)(d) | 79,316 | | 1,285,712 |
The NASDAQ Stock Market, Inc. | 100,649 | | 2,284,732 |
| | 9,091,389 |
TOTAL DIVERSIFIED FINANCIAL SERVICES | | 13,467,010 |
ENERGY EQUIPMENT & SERVICES - 0.0% |
Oil & Gas Equipment & Services - 0.0% |
SBM Offshore NV (a) | 1,200 | | 14,653 |
Common Stocks - continued |
| Shares | | Value |
HOTELS, RESTAURANTS & LEISURE - 0.6% |
Casinos & Gaming - 0.6% |
Boyd Gaming Corp. (a)(d) | 94,400 | | $ 538,080 |
Las Vegas Sands Corp. | 2,627 | | 95,675 |
MGM Mirage, Inc. (a) | 915 | | 8,711 |
Wynn Resorts Ltd. | 71 | | 6,656 |
| | 649,122 |
Hotels, Resorts & Cruise Lines - 0.0% |
Starwood Hotels & Resorts Worldwide, Inc. | 200 | | 10,830 |
TOTAL HOTELS, RESTAURANTS & LEISURE | | 659,952 |
HOUSEHOLD DURABLES - 0.0% |
Homebuilding - 0.0% |
M.D.C. Holdings, Inc. | 400 | | 12,744 |
PulteGroup, Inc. (a) | 1,400 | | 15,820 |
| | 28,564 |
INDUSTRIAL CONGLOMERATES - 0.0% |
Industrial Conglomerates - 0.0% |
Keppel Corp. Ltd. | 1,000 | | 8,984 |
INSURANCE - 12.8% |
Insurance Brokers - 0.4% |
Aon PLC | 300 | | 14,760 |
Brasil Insurance Participacoes e Administracao SA | 16,500 | | 146,142 |
Marsh & McLennan Companies, Inc. | 6,800 | | 225,828 |
National Financial Partners Corp. (a) | 800 | | 11,880 |
| | 398,610 |
Life & Health Insurance - 3.0% |
AFLAC, Inc. | 204 | | 8,931 |
Citizens, Inc. Class A (a) | 2,100 | | 21,714 |
CNO Financial Group, Inc. | 1,900 | | 15,751 |
Delta Lloyd NV | 800 | | 10,449 |
FBL Financial Group, Inc. Class A | 400 | | 12,380 |
Lincoln National Corp. | 14,800 | | 296,740 |
MetLife, Inc. | 17,035 | | 524,167 |
Phoenix Companies, Inc. (a) | 5,700 | | 9,291 |
Ping An Insurance Group Co. China Ltd. (H Shares) | 3,000 | | 23,541 |
Prudential Financial, Inc. | 43,854 | | 2,117,271 |
Resolution Ltd. | 2,800 | | 9,043 |
StanCorp Financial Group, Inc. | 300 | | 8,928 |
Symetra Financial Corp. | 1,100 | | 12,793 |
Torchmark Corp. | 300 | | 14,925 |
Unum Group | 600 | | 11,334 |
| | 3,097,258 |
Multi-Line Insurance - 1.2% |
American International Group, Inc. (a) | 14,811 | | 463,140 |
Assurant, Inc. | 8,829 | | 319,698 |
|
| Shares | | Value |
Fairfax Financial Holdings Ltd. (sub. vtg.) | 200 | | $ 75,285 |
Genworth Financial, Inc. Class A (a) | 45,050 | | 227,052 |
Hartford Financial Services Group, Inc. | 3,600 | | 59,220 |
Loews Corp. | 1,900 | | 75,221 |
Porto Seguro SA | 2,200 | | 19,217 |
| | 1,238,833 |
Property & Casualty Insurance - 5.9% |
ACE Ltd. | 35,540 | | 2,612,190 |
Allied World Assurance Co. Holdings Ltd. | 1,300 | | 98,059 |
Allstate Corp. | 7,400 | | 253,820 |
Assured Guaranty Ltd. | 700 | | 8,386 |
Axis Capital Holdings Ltd. | 9,000 | | 295,740 |
Berkshire Hathaway, Inc. Class B (a) | 149 | | 12,641 |
Erie Indemnity Co. Class A | 163 | | 11,620 |
Fidelity National Financial, Inc. Class A | 715 | | 13,313 |
First American Financial Corp. | 9,900 | | 181,368 |
The Travelers Companies, Inc. | 33,700 | | 2,111,305 |
W.R. Berkley Corp. | 2,500 | | 91,575 |
XL Group PLC Class A | 22,744 | | 469,664 |
| | 6,159,681 |
Reinsurance - 2.3% |
Arch Capital Group Ltd. (a) | 9,400 | | 364,720 |
Everest Re Group Ltd. | 5,000 | | 508,500 |
Montpelier Re Holdings Ltd. | 700 | | 14,182 |
Platinum Underwriters Holdings Ltd. | 9,300 | | 353,586 |
RenaissanceRe Holdings Ltd. | 7,750 | | 573,423 |
Swiss Re Ltd. | 162 | | 10,180 |
Validus Holdings Ltd. | 16,800 | | 546,504 |
| | 2,371,095 |
TOTAL INSURANCE | | 13,265,477 |
INTERNET SOFTWARE & SERVICES - 0.0% |
Internet Software & Services - 0.0% |
eBay, Inc. (a) | 309 | | 13,689 |
IT SERVICES - 6.7% |
Data Processing & Outsourced Services - 6.7% |
Alliance Data Systems Corp. (a) | 43 | | 5,590 |
Cielo SA | 480 | | 13,993 |
Fidelity National Information Services, Inc. | 600 | | 18,864 |
Fiserv, Inc. (a) | 233 | | 16,340 |
Global Cash Access Holdings, Inc. (a) | 11,600 | | 74,936 |
Jack Henry & Associates, Inc. | 30,400 | | 1,055,792 |
Lender Processing Services, Inc. | 100 | | 2,467 |
MoneyGram International, Inc. (a) | 700 | | 10,892 |
Redecard SA | 125,710 | | 2,027,482 |
The Western Union Co. | 106,091 | | 1,849,166 |
Total System Services, Inc. | 66,893 | | 1,582,019 |
Common Stocks - continued |
| Shares | | Value |
IT SERVICES - CONTINUED |
Data Processing & Outsourced Services - continued |
VeriFone Systems, Inc. (a) | 5,705 | | $ 207,034 |
Visa, Inc. Class A | 100 | | 12,907 |
| | 6,877,482 |
IT Consulting & Other Services - 0.0% |
Accenture PLC Class A | 200 | | 12,060 |
Cognizant Technology Solutions Corp. Class A (a) | 149 | | 8,459 |
| | 20,519 |
TOTAL IT SERVICES | | 6,898,001 |
MACHINERY - 0.1% |
Industrial Machinery - 0.1% |
Middleby Corp. (a) | 500 | | 48,960 |
MEDIA - 0.0% |
Publishing - 0.0% |
McGraw-Hill Companies, Inc. | 200 | | 9,392 |
PROFESSIONAL SERVICES - 0.0% |
Research & Consulting Services - 0.0% |
Equifax, Inc. | 370 | | 17,331 |
IHS, Inc. Class A (a) | 75 | | 8,270 |
| | 25,601 |
REAL ESTATE INVESTMENT TRUSTS - 28.1% |
Diversified REITs - 0.1% |
American Assets Trust, Inc. | 4,600 | | 119,600 |
Vornado Realty Trust | 200 | | 16,700 |
| | 136,300 |
Industrial REITs - 0.9% |
DCT Industrial Trust, Inc. | 33,800 | | 211,588 |
First Potomac Realty Trust | 700 | | 8,113 |
Prologis, Inc. | 20,494 | | 662,571 |
Stag Industrial, Inc. | 1,100 | | 15,906 |
| | 898,178 |
Mortgage REITs - 1.8% |
American Capital Agency Corp. (d) | 22,375 | | 786,258 |
American Capital Mortgage Investment Corp. | 1,700 | | 41,735 |
Invesco Mortgage Capital, Inc. | 36,200 | | 716,398 |
Pennymac Mortgage Investment Trust | 700 | | 14,749 |
Two Harbors Investment Corp. | 26,400 | | 302,808 |
| | 1,861,948 |
Office REITs - 4.9% |
Boston Properties, Inc. | 15,900 | | 1,763,310 |
Corporate Office Properties Trust (SBI) | 400 | | 8,904 |
Douglas Emmett, Inc. | 51,312 | | 1,206,345 |
Highwoods Properties, Inc. (SBI) | 13,080 | | 443,020 |
Kilroy Realty Corp. | 3,100 | | 146,754 |
Lexington Corporate Properties Trust (d) | 149,800 | | 1,339,212 |
|
| Shares | | Value |
MPG Office Trust, Inc. (a)(d) | 5,300 | | $ 15,688 |
SL Green Realty Corp. | 1,800 | | 141,750 |
| | 5,064,983 |
Residential REITs - 4.7% |
American Campus Communities, Inc. | 6,749 | | 321,657 |
Apartment Investment & Management Co. Class A | 10,541 | | 289,140 |
AvalonBay Communities, Inc. | 79 | | 11,620 |
BRE Properties, Inc. | 500 | | 26,340 |
Camden Property Trust (SBI) | 12,850 | | 916,334 |
Campus Crest Communities, Inc. | 1,100 | | 12,056 |
Colonial Properties Trust (SBI) | 33,600 | | 761,040 |
Equity Lifestyle Properties, Inc. | 6,700 | | 481,864 |
Equity Residential (SBI) | 12,400 | | 785,044 |
Essex Property Trust, Inc. | 200 | | 31,472 |
Home Properties, Inc. | 3,000 | | 196,830 |
Post Properties, Inc. | 13,085 | | 675,840 |
UDR, Inc. | 11,348 | | 301,970 |
| | 4,811,207 |
Retail REITs - 1.4% |
Federal Realty Investment Trust (SBI) | 1,903 | | 206,780 |
Glimcher Realty Trust | 400 | | 4,008 |
Kimco Realty Corp. | 700 | | 13,643 |
Realty Income Corp. | 9,050 | | 372,860 |
Simon Property Group, Inc. | 5,038 | | 808,549 |
Urstadt Biddle Properties, Inc. Class A | 1,300 | | 24,687 |
| | 1,430,527 |
Specialized REITs - 14.3% |
American Tower Corp. | 300 | | 21,693 |
Big Yellow Group PLC | 764,019 | | 3,737,346 |
CubeSmart | 1,000 | | 11,990 |
DiamondRock Hospitality Co. | 27,200 | | 257,312 |
HCP, Inc. | 74,394 | | 3,512,141 |
Health Care REIT, Inc. | 51,099 | | 3,179,891 |
Host Hotels & Resorts, Inc. | 15,700 | | 230,476 |
National Health Investors, Inc. | 5,400 | | 289,926 |
Plum Creek Timber Co., Inc. | 600 | | 24,354 |
Potlatch Corp. | 1,300 | | 44,993 |
Public Storage | 2,034 | | 302,964 |
Rayonier, Inc. | 13,600 | | 648,584 |
Sovran Self Storage, Inc. | 400 | | 22,840 |
Strategic Hotel & Resorts, Inc. (a) | 147,284 | | 892,541 |
Sunstone Hotel Investors, Inc. (a) | 16,200 | | 162,162 |
Ventas, Inc. | 22,436 | | 1,508,821 |
Weyerhaeuser Co. | 500 | | 11,675 |
| | 14,859,709 |
TOTAL REAL ESTATE INVESTMENT TRUSTS | | 29,062,852 |
Common Stocks - continued |
| Shares | | Value |
REAL ESTATE MANAGEMENT & DEVELOPMENT - 1.0% |
Diversified Real Estate Activities - 0.8% |
Tejon Ranch Co. (a) | 5,964 | | $ 155,004 |
The St. Joe Co. (a)(d) | 35,468 | | 600,473 |
| | 755,477 |
Real Estate Development - 0.0% |
Bukit Sembawang Estates Ltd. | 7,000 | | 26,438 |
Real Estate Operating Companies - 0.1% |
BR Malls Participacoes SA | 700 | | 8,171 |
Castellum AB | 927 | | 12,452 |
Forest City Enterprises, Inc. Class A (a) | 6,300 | | 88,893 |
Thomas Properties Group, Inc. | 2,262 | | 11,400 |
| | 120,916 |
Real Estate Services - 0.1% |
CBRE Group, Inc. (a) | 5,987 | | 93,277 |
Jones Lang LaSalle, Inc. | 116 | | 7,736 |
Kennedy-Wilson Holdings, Inc. | 2,000 | | 27,360 |
| | 128,373 |
TOTAL REAL ESTATE MANAGEMENT & DEVELOPMENT | | 1,031,204 |
SOFTWARE - 0.0% |
Application Software - 0.0% |
EPIQ Systems, Inc. | 500 | | 5,645 |
Fair Isaac Corp. | 100 | | 4,329 |
| | 9,974 |
SPECIALTY RETAIL - 1.1% |
Computer & Electronics Retail - 1.1% |
Rent-A-Center, Inc. | 32,473 | | 1,154,740 |
Home Improvement Retail - 0.0% |
Home Depot, Inc. | 300 | | 15,654 |
TOTAL SPECIALTY RETAIL | | 1,170,394 |
THRIFTS & MORTGAGE FINANCE - 0.1% |
Thrifts & Mortgage Finance - 0.1% |
BankUnited, Inc. | 500 | | 12,180 |
|
| Shares | | Value |
Brookline Bancorp, Inc., Delaware | 800 | | $ 6,728 |
Cape Bancorp, Inc. (a) | 1,400 | | 12,992 |
Cheviot Financial Corp. | 4,910 | | 42,963 |
Eagle Bancorp Montana, Inc. | 300 | | 3,051 |
Hudson City Bancorp, Inc. | 800 | | 5,080 |
People's United Financial, Inc. | 1,100 | | 12,606 |
| | 95,600 |
TOTAL COMMON STOCKS (Cost $97,877,904) |
96,837,284
|
Money Market Funds - 10.5% |
| | | |
Fidelity Cash Central Fund, 0.17% (b) | 5,957,990 | | 5,957,990 |
Fidelity Securities Lending Cash Central Fund, 0.18% (b)(c) | 4,910,355 | | 4,910,355 |
TOTAL MONEY MARKET FUNDS (Cost $10,868,345) |
10,868,345
|
TOTAL INVESTMENT PORTFOLIO - 103.9% (Cost $108,746,249) | | 107,705,629 |
NET OTHER ASSETS (LIABILITIES) - (3.9)% | | (4,067,840) |
NET ASSETS - 100% | $ 103,637,789 |
Legend |
(a) Non-income producing |
(b) Affiliated fund that is available only to investment companies and other accounts managed by Fidelity Investments. The rate quoted is the annualized seven-day yield of the fund at period end. A complete unaudited listing of the fund's holdings as of its most recent quarter end is available upon request. In addition, each Fidelity Central Fund's financial statements, which are not covered by the Fund's Report of Independent Registered Public Accounting Firm, are available on the SEC's website or upon request. |
(c) Investment made with cash collateral received from securities on loan. |
(d) Security or a portion of the security is on loan at period end. |
Affiliated Central Funds |
Information regarding fiscal year to date income earned by the Fund from investments in Fidelity Central Funds is as follows: |
Fund | Income earned |
Fidelity Cash Central Fund | $ 6,802 |
Fidelity Securities Lending Cash Central Fund | 23,394 |
Total | $ 30,196 |
Other Information |
The following is a summary of the inputs used, as of July 31, 2012, involving the Fund's assets and liabilities carried at fair value. The inputs or methodology used for valuing securities may not be an indication of the risk associated with investing in those securities. For more information on valuation inputs, and their aggregation into the levels used in the table below, please refer to the Security Valuation section in the accompanying Notes to Financial Statements. |
Valuation Inputs at Reporting Date: |
Description | Total | Level 1 | Level 2 | Level 3 |
Investments in Securities: | | | | |
Common Stocks | $ 96,837,284 | $ 96,721,557 | $ 115,727 | $ - |
Money Market Funds | 10,868,345 | 10,868,345 | - | - |
Total Investments in Securities: | $ 107,705,629 | $ 107,589,902 | $ 115,727 | $ - |
Distribution of investments by country or territory of incorporation, as a percentage of total net assets, is as follows. (Unaudited) |
United States of America | 80.2% |
United Kingdom | 5.4% |
Brazil | 3.4% |
Bermuda | 2.8% |
Switzerland | 2.7% |
Colombia | 2.3% |
Others (Individually Less Than 1%) | 3.2% |
| 100.0% |
See accompanying notes which are an integral part of the financial statements.
Annual Report
Fidelity Advisor Financial Services Fund
Statement of Assets and Liabilities
| July 31, 2012 |
| | |
Assets | | |
Investment in securities, at value (including securities loaned of $4,779,426) - See accompanying schedule: Unaffiliated issuers (cost $97,877,904) | $ 96,837,284 | |
Fidelity Central Funds (cost $10,868,345) | 10,868,345 | |
Total Investments (cost $108,746,249) | | $ 107,705,629 |
Foreign currency held at value (cost $5) | | 5 |
Receivable for investments sold | | 4,636,753 |
Receivable for fund shares sold | | 83,750 |
Dividends receivable | | 73,389 |
Distributions receivable from Fidelity Central Funds | | 2,122 |
Other receivables | | 38,538 |
Total assets | | 112,540,186 |
| | |
Liabilities | | |
Payable for investments purchased | $ 3,683,982 | |
Payable for fund shares redeemed | 146,702 | |
Accrued management fee | 48,124 | |
Distribution and service plan fees payable | 42,084 | |
Other affiliated payables | 28,138 | |
Other payables and accrued expenses | 43,012 | |
Collateral on securities loaned, at value | 4,910,355 | |
Total liabilities | | 8,902,397 |
| | |
Net Assets | | $ 103,637,789 |
Net Assets consist of: | | |
Paid in capital | | $ 193,695,338 |
Undistributed net investment income | | 195,946 |
Accumulated undistributed net realized gain (loss) on investments and foreign currency transactions | | (89,211,093) |
Net unrealized appreciation (depreciation) on investments and assets and liabilities in foreign currencies | | (1,042,402) |
Net Assets | | $ 103,637,789 |
Statement of Assets and Liabilities - continued
| July 31, 2012 |
| | |
Calculation of Maximum Offering Price Class A:
Net Asset Value and redemption price per share ($47,055,319 ÷ 4,621,936 shares) | | $ 10.18 |
| | |
Maximum offering price per share (100/94.25 of $10.18) | | $ 10.80 |
Class T:
Net Asset Value and redemption price per share ($24,367,456 ÷ 2,409,711 shares) | | $ 10.11 |
| | |
Maximum offering price per share (100/96.50 of $10.11) | | $ 10.48 |
Class B:
Net Asset Value and offering price per share ($5,744,554 ÷ 586,962 shares)A | | $ 9.79 |
| | |
Class C:
Net Asset Value and offering price per share ($20,874,868 ÷ 2,152,059 shares)A | | $ 9.70 |
| | |
Institutional Class:
Net Asset Value, offering price and redemption price per share ($5,595,592 ÷ 536,831 shares) | | $ 10.42 |
A Redemption price per share is equal to net asset value less any applicable contingent deferred sales charge.
See accompanying notes which are an integral part of the financial statements.
Annual Report
Fidelity Advisor Financial Services Fund
Financial Statements - continued
Statement of Operations
| Year ended July 31, 2012 |
| | |
Investment Income | | |
Dividends | | $ 2,133,434 |
Income from Fidelity Central Funds | | 30,196 |
Total income | | 2,163,630 |
| | |
Expenses | | |
Management fee | $ 631,666 | |
Transfer agent fees | 339,321 | |
Distribution and service plan fees | 521,860 | |
Accounting and security lending fees | 44,790 | |
Custodian fees and expenses | 36,227 | |
Independent trustees' compensation | 797 | |
Registration fees | 60,638 | |
Audit | 52,225 | |
Legal | 721 | |
Interest | 235 | |
Miscellaneous | 1,123 | |
Total expenses before reductions | 1,689,603 | |
Expense reductions | (100,487) | 1,589,116 |
Net investment income (loss) | | 574,514 |
Realized and Unrealized Gain (Loss) Net realized gain (loss) on: | | |
Investment securities: | | |
Unaffiliated issuers | (5,594,502) | |
Foreign currency transactions | (68,047) | |
Total net realized gain (loss) | | (5,662,549) |
Change in net unrealized appreciation (depreciation) on: Investment securities | 6,138,170 | |
Assets and liabilities in foreign currencies | (1,253) | |
Total change in net unrealized appreciation (depreciation) | | 6,136,917 |
Net gain (loss) | | 474,368 |
Net increase (decrease) in net assets resulting from operations | | $ 1,048,882 |
Statement of Changes in Net Assets
| Year ended
July 31,
2012 | Year ended
July 31,
2011 |
Increase (Decrease) in Net Assets | | |
Operations | | |
Net investment income (loss) | $ 574,514 | $ (682,395) |
Net realized gain (loss) | (5,662,549) | (942,210) |
Change in net unrealized appreciation (depreciation) | 6,136,917 | (2,518,839) |
Net increase (decrease) in net assets resulting from operations | 1,048,882 | (4,143,444) |
Distributions to shareholders from net investment income | (107,549) | - |
Share transactions - net increase (decrease) | (27,119,342) | (16,036,954) |
Redemption fees | 4,119 | 4,715 |
Total increase (decrease) in net assets | (26,173,890) | (20,175,683) |
| | |
Net Assets | | |
Beginning of period | 129,811,679 | 149,987,362 |
End of period (including undistributed net investment income of $195,946 and accumulated net investment loss of $116,048, respectively) | $ 103,637,789 | $ 129,811,679 |
See accompanying notes which are an integral part of the financial statements.
Annual Report
Financial Highlights - Class A
Years ended July 31, | 2012 | 2011 | 2010 | 2009 | 2008 |
Selected Per-Share Data | | | | | |
Net asset value, beginning of period | $ 10.06 | $ 10.35 | $ 9.53 | $ 13.18 | $ 21.02 |
Income from Investment Operations | | | | | |
Net investment income (loss) C | .07 | (.02) | (.01) | .19 | .30 |
Net realized and unrealized gain (loss) | .06 | (.27) | .93 | (3.58) | (6.41) |
Total from investment operations | .13 | (.29) | .92 | (3.39) | (6.11) |
Distributions from net investment income | (.01) | - | (.10) | (.24) | (.27) |
Distributions from net realized gain | - | - | - | (.02) | (1.46) |
Total distributions | (.01) | - | (.10) | (.26) | (1.73) |
Redemption fees added to paid in capital C, G | - | - | - | - | - |
Net asset value, end of period | $ 10.18 | $ 10.06 | $ 10.35 | $ 9.53 | $ 13.18 |
Total Return A, B | 1.34% | (2.80)% | 9.61% | (25.87)% | (31.67)% |
Ratios to Average Net Assets D, F | | | | | |
Expenses before reductions | 1.28% | 1.26% | 1.27% | 1.29% | 1.21% |
Expenses net of fee waivers, if any | 1.28% | 1.26% | 1.27% | 1.29% | 1.21% |
Expenses net of all reductions | 1.20% | 1.21% | 1.22% | 1.28% | 1.21% |
Net investment income (loss) | .72% | (.24)% | (.09)% | 2.12% | 1.75% |
Supplemental Data | | | | | |
Net assets, end of period (000 omitted) | $ 47,055 | $ 63,937 | $ 69,723 | $ 68,245 | $ 90,037 |
Portfolio turnover rate E | 441% | 260% | 254% | 269% | 48% |
A Total returns would have been lower if certain expenses had not been reduced during the applicable periods shown.
B Total returns do not include the effect of the sales charges.
C Calculated based on average shares outstanding during the period.
D Fees and expenses of any underlying Fidelity Central Funds are not included in the Fund's expense ratio. The Fund indirectly bears its proportionate share of the expenses of any underlying Fidelity Central Funds.
E Amount does not include the portfolio activity of any underlying Fidelity Central Funds.
F Expense ratios reflect operating expenses of the class. Expenses before reductions do not reflect amounts reimbursed by the investment adviser or reductions from brokerage service arrangements or reductions from other expense offset arrangements and do not represent the amount paid by the class during periods when reimbursements or reductions occur. Expenses net of fee waivers reflect expenses after reimbursement by the investment adviser but prior to reductions from brokerage service arrangements or other expense offset arrangements. Expenses net of all reductions represent the net expenses paid by the class.
G Amount represents less than $.01 per share.
Financial Highlights - Class T
Years ended July 31, | 2012 | 2011 | 2010 | 2009 | 2008 |
Selected Per-Share Data | | | | | |
Net asset value, beginning of period | $ 10.01 | $ 10.32 | $ 9.52 | $ 13.14 | $ 20.94 |
Income from Investment Operations | | | | | |
Net investment income (loss) C | .04 | (.05) | (.04) | .16 | .26 |
Net realized and unrealized gain (loss) | .06 | (.26) | .92 | (3.56) | (6.41) |
Total from investment operations | .10 | (.31) | .88 | (3.40) | (6.15) |
Distributions from net investment income | - G | - | (.08) | (.20) | (.19) |
Distributions from net realized gain | - | - | - | (.02) | (1.46) |
Total distributions | - G | - | (.08) | (.22) | (1.65) |
Redemption fees added to paid in capital C, G | - | - | - | - | - |
Net asset value, end of period | $ 10.11 | $ 10.01 | $ 10.32 | $ 9.52 | $ 13.14 |
Total Return A, B | 1.03% | (3.00)% | 9.26% | (26.00)% | (31.85)% |
Ratios to Average Net Assets D, F | | | | | |
Expenses before reductions | 1.54% | 1.52% | 1.53% | 1.55% | 1.47% |
Expenses net of fee waivers, if any | 1.54% | 1.52% | 1.53% | 1.55% | 1.47% |
Expenses net of all reductions | 1.45% | 1.47% | 1.47% | 1.54% | 1.47% |
Net investment income (loss) | .46% | (.49)% | (.35)% | 1.86% | 1.50% |
Supplemental Data | | | | | |
Net assets, end of period (000 omitted) | $ 24,367 | $ 27,037 | $ 33,310 | $ 34,927 | $ 53,526 |
Portfolio turnover rate E | 441% | 260% | 254% | 269% | 48% |
A Total returns would have been lower if certain expenses had not been reduced during the applicable periods shown.
B Total returns do not include the effect of the sales charges.
C Calculated based on average shares outstanding during the period.
D Fees and expenses of any underlying Fidelity Central Funds are not included in the Fund's expense ratio. The Fund indirectly bears its proportionate share of the expenses of any underlying Fidelity Central Funds.
E Amount does not include the portfolio activity of any underlying Fidelity Central Funds.
F Expense ratios reflect operating expenses of the class. Expenses before reductions do not reflect amounts reimbursed by the investment adviser or reductions from brokerage service arrangements or reductions from other expense offset arrangements and do not represent the amount paid by the class during periods when reimbursements or reductions occur. Expenses net of fee waivers reflect expenses after reimbursement by the investment adviser but prior to reductions from brokerage service arrangements or other expense offset arrangements. Expenses net of all reductions represent the net expenses paid by the class.
G Amount represents less than $.01 per share.
See accompanying notes which are an integral part of the financial statements.
Annual Report
Financial Highlights - Class B
Years ended July 31, | 2012 | 2011 | 2010 | 2009 | 2008 |
Selected Per-Share Data | | | | | |
Net asset value, beginning of period | $ 9.73 | $ 10.09 | $ 9.33 | $ 12.85 | $ 20.44 |
Income from Investment Operations | | | | | |
Net investment income (loss) C | - G | (.10) | (.09) | .12 | .18 |
Net realized and unrealized gain (loss) | .06 | (.26) | .91 | (3.50) | (6.29) |
Total from investment operations | .06 | (.36) | .82 | (3.38) | (6.11) |
Distributions from net investment income | - | - | (.06) | (.12) | (.04) |
Distributions from net realized gain | - | - | - | (.02) | (1.44) |
Total distributions | - | - | (.06) | (.14) | (1.48) |
Redemption fees added to paid in capital C, G | - | - | - | - | - |
Net asset value, end of period | $ 9.79 | $ 9.73 | $ 10.09 | $ 9.33 | $ 12.85 |
Total Return A, B | .62% | (3.57)% | 8.78% | (26.35)% | (32.21)% |
Ratios to Average Net Assets D, F | | | | | |
Expenses before reductions | 2.03% | 2.01% | 2.02% | 2.04% | 1.96% |
Expenses net of fee waivers, if any | 2.03% | 2.01% | 2.02% | 2.04% | 1.96% |
Expenses net of all reductions | 1.94% | 1.96% | 1.97% | 2.03% | 1.96% |
Net investment income (loss) | (.03)% | (.98)% | (.85)% | 1.38% | 1.01% |
Supplemental Data | | | | | |
Net assets, end of period (000 omitted) | $ 5,745 | $ 7,480 | $ 10,992 | $ 12,477 | $ 20,420 |
Portfolio turnover rate E | 441% | 260% | 254% | 269% | 48% |
A Total returns would have been lower if certain expenses had not been reduced during the applicable periods shown.
B Total returns do not include the effect of the contingent deferred sales charge.
C Calculated based on average shares outstanding during the period.
D Fees and expenses of any underlying Fidelity Central Funds are not included in the Fund's expense ratio. The Fund indirectly bears its proportionate share of the expenses of any underlying Fidelity Central Funds.
E Amount does not include the portfolio activity of any underlying Fidelity Central Funds.
F Expense ratios reflect operating expenses of the class. Expenses before reductions do not reflect amounts reimbursed by the investment adviser or reductions from brokerage service arrangements or reductions from other expense offset arrangements and do not represent the amount paid by the class during periods when reimbursements or reductions occur. Expenses net of fee waivers reflect expenses after reimbursement by the investment adviser but prior to reductions from brokerage service arrangements or other expense offset arrangements. Expenses net of all reductions represent the net expenses paid by the class.
G Amount represents less than $.01 per share.
Financial Highlights - Class C
Years ended July 31, | 2012 | 2011 | 2010 | 2009 | 2008 |
Selected Per-Share Data | | | | | |
Net asset value, beginning of period | $ 9.65 | $ 10.00 | $ 9.25 | $ 12.78 | $ 20.40 |
Income from Investment Operations | | | | | |
Net investment income (loss) C | - G | (.10) | (.09) | .12 | .17 |
Net realized and unrealized gain (loss) | .05 | (.25) | .90 | (3.48) | (6.24) |
Total from investment operations | .05 | (.35) | .81 | (3.36) | (6.07) |
Distributions from net investment income | - | - | (.06) | (.15) | (.09) |
Distributions from net realized gain | - | - | - | (.02) | (1.46) |
Total distributions | - | - | (.06) | (.17) | (1.55) |
Redemption fees added to paid in capital C, G | - | - | - | - | - |
Net asset value, end of period | $ 9.70 | $ 9.65 | $ 10.00 | $ 9.25 | $ 12.78 |
Total Return A, B | .52% | (3.50)% | 8.79% | (26.38)% | (32.18)% |
Ratios to Average Net Assets D, F | | | | | |
Expenses before reductions | 2.03% | 2.01% | 2.02% | 2.04% | 1.96% |
Expenses net of fee waivers, if any | 2.03% | 2.01% | 2.02% | 2.04% | 1.96% |
Expenses net of all reductions | 1.94% | 1.96% | 1.96% | 2.03% | 1.96% |
Net investment income (loss) | (.03)% | (.99)% | (.84)% | 1.37% | 1.01% |
Supplemental Data | | | | | |
Net assets, end of period (000 omitted) | $ 20,875 | $ 23,196 | $ 30,804 | $ 29,849 | $ 37,777 |
Portfolio turnover rate E | 441% | 260% | 254% | 269% | 48% |
A Total returns would have been lower if certain expenses had not been reduced during the applicable periods shown.
B Total returns do not include the effect of the contingent deferred sales charge.
C Calculated based on average shares outstanding during the period.
D Fees and expenses of any underlying Fidelity Central Funds are not included in the Fund's expense ratio. The Fund indirectly bears its proportionate share of the expenses of any underlying Fidelity Central Funds.
E Amount does not include the portfolio activity of any underlying Fidelity Central Funds.
F Expense ratios reflect operating expenses of the class. Expenses before reductions do not reflect amounts reimbursed by the investment adviser or reductions from brokerage service arrangements or reductions from other expense offset arrangements and do not represent the amount paid by the class during periods when reimbursements or reductions occur. Expenses net of fee waivers reflect expenses after reimbursement by the investment adviser but prior to reductions from brokerage service arrangements or other expense offset arrangements. Expenses net of all reductions represent the net expenses paid by the class.
G Amount represents less than $.01 per share.
See accompanying notes which are an integral part of the financial statements.
Annual Report
Financial Highlights - Institutional Class
Years ended July 31, | 2012 | 2011 | 2010 | 2009 | 2008 |
Selected Per-Share Data | | | | | |
Net asset value, beginning of period | $ 10.28 | $ 10.55 | $ 9.69 | $ 13.38 | $ 21.32 |
Income from Investment Operations | | | | | |
Net investment income (loss) B | .10 | .01 | .02 | .21 | .36 |
Net realized and unrealized gain (loss) | .06 | (.28) | .95 | (3.63) | (6.51) |
Total from investment operations | .16 | (.27) | .97 | (3.42) | (6.15) |
Distributions from net investment income | (.02) | - | (.11) | (.25) | (.33) |
Distributions from net realized gain | - | - | - | (.02) | (1.46) |
Total distributions | (.02) | - | (.11) | (.27) | (1.79) |
Redemption fees added to paid in capital B, F | - | - | - | - | - |
Net asset value, end of period | $ 10.42 | $ 10.28 | $ 10.55 | $ 9.69 | $ 13.38 |
Total Return A | 1.61% | (2.56)% | 9.99% | (25.68)% | (31.47)% |
Ratios to Average Net Assets C, E | | | | | |
Expenses before reductions | .98% | .96% | .99% | 1.04% | .93% |
Expenses net of fee waivers, if any | .98% | .96% | .99% | 1.04% | .93% |
Expenses net of all reductions | .89% | .91% | .94% | 1.03% | .92% |
Net investment income (loss) | 1.02% | .07% | .19% | 2.37% | 2.04% |
Supplemental Data | | | | | |
Net assets, end of period (000 omitted) | $ 5,596 | $ 8,162 | $ 5,158 | $ 3,797 | $ 5,819 |
Portfolio turnover rate D | 441% | 260% | 254% | 269% | 48% |
A Total returns would have been lower if certain expenses had not been reduced during the applicable periods shown.
B Calculated based on average shares outstanding during the period.
C Fees and expenses of any underlying Fidelity Central Funds are not included in the Fund's expense ratio. The Fund indirectly bears its proportionate share of the expenses of any underlying Fidelity Central Funds.
D Amount does not include the portfolio activity of any underlying Fidelity Central Funds.
E Expense ratios reflect operating expenses of the class. Expenses before reductions do not reflect amounts reimbursed by the investment adviser or reductions from brokerage service arrangements or reductions from other expense offset arrangements and do not represent the amount paid by the class during periods when reimbursements or reductions occur. Expenses net of fee waivers reflect expenses after reimbursement by the investment adviser but prior to reductions from brokerage service arrangements or other expense offset arrangements. Expenses net of all reductions represent the net expenses paid by the class.
F Amount represents less than $.01 per share.
See accompanying notes which are an integral part of the financial statements.
Annual Report
Fidelity Advisor Financial Services Fund
Notes to Financial Statements
For the period ended July 31, 2012
1. Organization.
Fidelity Advisor Financial Services Fund (the Fund) is a fund of Fidelity Advisor Series VII (the Trust) and is authorized to issue an unlimited number of shares. The Trust is registered under the Investment Company Act of 1940, as amended (the 1940 Act), as an open-end management investment company organized as a Massachusetts business trust. The Fund offers Class A, Class T, Class C, and Institutional Class shares, each of which, along with Class B shares, has equal rights as to assets and voting privileges. Effective after the close of business on September 1, 2010, Class B shares were closed to new accounts and additional purchases, except for exchanges and reinvestments. Each class has exclusive voting rights with respect to matters that affect that class. Class B shares will automatically convert to Class A shares after a holding period of seven years from the initial date of purchase. Investment income, realized and unrealized capital gains and losses, the common expenses of the Fund, and certain fund-level expense reductions, if any, are allocated on a pro-rata basis to each class based on the relative net assets of each class to the total net assets of the Fund. Each class differs with respect to transfer agent and distribution and service plan fees incurred. Certain expense reductions may also differ by class. The Fund's investments in emerging markets can be subject to social, economic, regulatory, and political uncertainties and can be extremely volatile.
2. Investments in Fidelity Central Funds.
The Fund invests in Fidelity Central Funds, which are open-end investment companies available only to other investment companies and accounts managed by Fidelity Management & Research Company (FMR) and its affiliates. The Fund's Schedule of Investments lists each of the Fidelity Central Funds held as of period end, if any, as an investment of the Fund, but does not include the underlying holdings of each Fidelity Central Fund. As an Investing Fund, the Fund indirectly bears its proportionate share of the expenses of the underlying Fidelity Central Funds.
The Money Market Central Funds seek preservation of capital and current income and are managed by Fidelity Investments Money Management, Inc. (FIMM), an affiliate of FMR.
A complete unaudited list of holdings for each Fidelity Central Fund is available upon request or at the Securities and Exchange Commission (the SEC) web site at www.sec.gov. In addition, the financial statements of the Fidelity Central Funds, which are not covered by the Fund's Report of Independent Registered Public Accounting Firm, are available on the SEC web site or upon request.
3. Significant Accounting Policies.
The financial statements have been prepared in conformity with accounting principles generally accepted in the United States of America (GAAP), which require management to make certain estimates and assumptions at the date of the financial statements. Actual results could differ from those estimates. Subsequent events, if any, through the date that the financial statements were issued have been evaluated in the preparation of the financial statements. The following summarizes the significant accounting policies of the Fund:
Security Valuation. Investments are valued as of 4:00 p.m. Eastern time on the last calendar day of the period. In accordance with valuation policies and procedures approved by the Board of Trustees (the Board), the Fund attempts to obtain prices from one or more third party pricing vendor or broker to value its investments. When current market prices, quotations or rates are not readily available or reliable, securities will be fair valued in good faith by the FMR Fair Value Committee (the Committee), in accordance with procedures adopted by the Fund's Board. Factors used in determining fair value vary by security type and may include market or security specific events. The frequency with which these procedures are used cannot be predicted and they may be utilized to a significant extent. The Committee oversees the Fund's valuation policies and procedures and is responsible for approving and reporting to the Board all fair value determinations.
The Fund categorizes the inputs to valuation techniques used to value its investments into a disclosure hierarchy consisting of three levels as shown below:
Level 1 - quoted prices in active markets for identical investments
Level 2 - other significant observable inputs (including quoted prices for similar investments, interest rates, prepayment speeds, etc.)
Level 3 - unobservable inputs (including the Fund's own assumptions based on the best information available)
Valuation techniques used to value the Fund's investments by major category are as follows:
Equity securities, including restricted securities, for which market quotations are readily available, are valued at the last reported sale price or official closing price as reported by a third party pricing vendor on the primary market or exchange on which they are traded and are categorized as Level 1 in the hierarchy. In the event there were no sales during the day or closing prices are not available, securities are valued at the last quoted bid price or may be valued using the last available price and are generally categorized as Level 2 in the hierarchy. For foreign equity securities, when significant market or security specific events arise, comparisons to the valuation of American Depositary Receipts (ADRs), futures contracts, Exchange-Traded Funds (ETFs) and certain indexes as well as quoted prices for similar securities are used and are categorized as Level 2 in the hierarchy. Utilizing these techniques may result in transfers between Level 1 and Level 2.
Annual Report
3. Significant Accounting Policies - continued
Security Valuation - continued
Investments in open-end mutual funds, including the Fidelity Central Funds, are valued at their closing net asset value each business day and are categorized as Level 1 in the hierarchy.
Changes in valuation techniques may result in transfers in or out of an assigned level within the disclosure hierarchy. The aggregate value of investments by input level, as of July 31, 2012, is included at the end of the Fund's Schedule of Investments.
Foreign Currency Translation. The Fund may use foreign currency contracts to facilitate transactions in foreign-denominated securities. Gains and losses from these transactions may arise from changes in the value of the foreign currency or if the counterparties do not perform under the contracts' terms.
Foreign-denominated assets, including investment securities, and liabilities are translated into U.S. dollars at the exchange rates at period end. Purchases and sales of investment securities, income and dividends received and expenses denominated in foreign currencies are translated into U.S. dollars at the exchange rate in effect on the transaction date.
The effects of exchange rate fluctuations on investments are included with the net realized and unrealized gain (loss) on investment securities. Other foreign currency transactions resulting in realized and unrealized gain (loss) are disclosed separately.
Investment Transactions and Income. For financial reporting purposes, the Fund's investment holdings and NAV include trades executed through the end of the last business day of the period. The NAV per share for processing shareholder transactions is calculated as of the close of business of the New York Stock Exchange (NYSE), normally 4:00 p.m. Eastern time and includes trades executed through the end of the prior business day. Gains and losses on securities sold are determined on the basis of identified cost and may include proceeds received from litigation. Dividend income is recorded on the ex-dividend date, except for certain dividends from foreign securities where the ex-dividend date may have passed, which are recorded as soon as the Fund is informed of the ex-dividend date. Non-cash dividends included in dividend income, if any, are recorded at the fair market value of the securities received. Distributions received on securities that represent a return of capital or capital gain are recorded as a reduction of cost of investments and/or as a realized gain. The Fund estimates the components of distributions received that may be considered return of capital distributions or capital gain distributions. Interest income and distributions from the Fidelity Central Funds are accrued as earned. Interest income includes coupon interest and amortization of premium and accretion of discount on debt securities. Investment income is recorded net of foreign taxes withheld where recovery of such taxes is uncertain.
Expenses. Expenses directly attributable to a fund are charged to that fund. Expenses attributable to more than one fund are allocated among the respective funds on the basis of relative net assets or other appropriate methods. Expense estimates are accrued in the period to which they relate and adjustments are made when actual amounts are known.
Income Tax Information and Distributions to Shareholders. Each year, the Fund intends to qualify as a regulated investment company under Subchapter M of the Internal Revenue Code, including distributing substantially all of its taxable income and realized gains. As a result, no provision for income taxes is required. As of July 31, 2012, the Fund did not have any unrecognized tax benefits in the financial statements; nor is the Fund aware of any tax positions for which it is reasonably possible that the total amounts of unrecognized tax benefits will significantly change in the next twelve months. The Fund files a U.S. federal tax return, in addition to state and local tax returns as required. A fund's federal income tax returns are subject to examination by the Internal Revenue Service (IRS) for a period of three fiscal years after they are filed. State and local tax returns may be subject to examination for an additional fiscal year depending on the jurisdiction. Foreign taxes are provided for based on the Fund's understanding of the tax rules and rates that exist in the foreign markets in which it invests.
Distributions are declared and recorded on the ex-dividend date. Income dividends and capital gain distributions are declared separately for each class. Income and capital gain distributions are determined in accordance with income tax regulations, which may differ from GAAP.
Capital accounts within the financial statements are adjusted for permanent book-tax differences. These adjustments have no impact on net assets or the results of operations. Temporary book-tax differences will reverse in a subsequent period.
Book-tax differences are primarily due to foreign currency transactions, partnerships, deferred trustees compensation, passive foreign investment companies (PFIC), capital loss carryforwards and losses deferred due to wash sales and excise tax regulations.
Annual Report
Fidelity Advisor Financial Services Fund
Notes to Financial Statements - continued
3. Significant Accounting Policies - continued
Income Tax Information and Distributions to Shareholders - continued
The federal tax cost of investment securities and unrealized appreciation (depreciation) as of period end were as follows:
Gross unrealized appreciation | $ 3,891,913 |
Gross unrealized depreciation | (7,459,553) |
Net unrealized appreciation (depreciation) on securities and other investments | $ (3,567,640) |
| |
Tax Cost | $ 111,273,269 |
The tax-based components of distributable earnings as of period end were as follows:
Undistributed ordinary income | $ 195,956 |
Capital loss carryforward | $ (83,462,006) |
Net unrealized appreciation (depreciation) | $ (3,569,422) |
Capital loss carryforwards are only available to offset future capital gains of the Fund to the extent provided by regulations and may be limited. Under the Regulated Investment Company Modernization Act of 2010 (the Act), the Fund is permitted to carry forward capital losses incurred in taxable years beginning after December 22, 2010 for an unlimited period and such capital losses are required to be used prior to any losses that expire. Capital loss carryforwards were as follows:
Fiscal year of expiration | |
| |
2017 | $ (55,672,202) |
2018 | (23,251,884) |
2019 | (450,657) |
Total with expiration | (79,374,743) |
No expiration | |
Long-term | (4,087,263) |
Total no expiration | (4,087,263) |
Total capital loss carryforward | $ (83,462,006) |
The Fund intends to elect to defer to its fiscal year ending July 31, 2013 approximately $3,222,067 of capital losses recognized during the period November 1, 2011 to July 31, 2012.
The tax character of distributions paid was as follows:
| July 31, 2012 | July 31, 2011 |
Ordinary Income | $ 107,549 | $ - |
Short-Term Trading (Redemption) Fees. Shares held by investors in the Fund less than 30 days are subject to a redemption fee equal to .75% of the net asset value of shares redeemed. All redemption fees, which reduce the proceeds of the shareholder redemption, are retained by the Fund and accounted for as an addition to paid in capital.
New Accounting Pronouncement. In December 2011, the Financial Accounting Standards Board issued Accounting Standard Update No. 2011-11, Disclosures about Offsetting Assets and Liabilities. The update creates new disclosure requirements requiring entities to disclose both gross and net information for derivatives and other financial instruments that are either offset in the Statement of Assets and Liabilities or subject to an enforceable master netting arrangement or similar agreement. The disclosure requirements are effective for interim and annual reporting periods beginning on or after January 1, 2013. Management is currently evaluating the impact of the update's adoption on the Fund's financial statement disclosures.
4. Purchases and Sales of Investments.
Purchases and sales of securities, other than short-term securities, aggregated $485,785,212 and $516,640,857, respectively.
Annual Report
5. Fees and Other Transactions with Affiliates.
Management Fee. FMR and its affiliates provide the Fund with investment management related services for which the Fund pays a monthly management fee. The management fee is the sum of an individual fund fee rate that is based on an annual rate of .30% of the Fund's average net assets and an annualized group fee rate that averaged .26% during the period. The group fee rate is based upon the average net assets of all the mutual funds advised by FMR. The group fee rate decreases as assets under management increase and increases as assets under management decrease. For the period, the total annual management fee rate was .56% of the Fund's average net assets.
Distribution and Service Plan Fees. In accordance with Rule 12b-1 of the 1940 Act, the Fund has adopted separate Distribution and Service Plans for each class of shares. Certain classes pay Fidelity Distributors Corporation (FDC), an affiliate of FMR, separate Distribution and Service Fees, each of which is based on an annual percentage of each class' average net assets. In addition, FDC may pay financial intermediaries for selling shares of the Fund and providing shareholder support services. For the period, the Distribution and Service Fee rates, total fees and amounts retained by FDC were as follows:
| Distribution
Fee | Service
Fee | Total Fees | Retained
by FDC |
Class A | -% | .25% | $ 141,129 | $ 21,140 |
Class T | .25% | .25% | 118,800 | 472 |
Class B | .75% | .25% | 61,047 | 45,809 |
Class C | .75% | .25% | 200,884 | 23,893 |
| | | $ 521,860 | $ 91,314 |
Sales Load. FDC may receive a front-end sales charge of up to 5.75% for selling Class A shares and 3.50% for selling Class T shares, some of which is paid to financial intermediaries for selling shares of the Fund. Depending on the holding period, FDC may receive contingent deferred sales charges levied on Class A, Class T, Class B, and Class C redemptions. The deferred sales charges range from 5.00% to 1.00% for Class B shares, 1.00% for Class C shares, 1.00% for certain purchases of Class A shares and .25% for certain purchases of Class T shares.
For the period, sales charge amounts retained by FDC were as follows:
| Retained
by FDC |
Class A | $ 54,284 |
Class T | 5,208 |
Class B* | 12,843 |
Class C* | 1,842 |
| $ 74,177 |
* When Class B and Class C shares are initially sold, FDC pays commissions from its own resources to financial intermediaries through which the sales are made.
Transfer Agent Fees. Fidelity Investments Institutional Operations Company, Inc. (FIIOC), an affiliate of FMR, is the transfer, dividend disbursing and shareholder servicing agent for each class of the Fund. FIIOC receives account fees and asset-based fees that vary according to the account size and type of account of the shareholders of the respective classes of the Fund. FIIOC pays for typesetting, printing and mailing of shareholder reports, except proxy statements. For the period, transfer agent fees for each class were as follows:
| Amount | % of
Average
Net Assets |
Class A | $ 169,930 | .30 |
Class T | 73,838 | .31 |
Class B | 18,390 | .30 |
Class C | 60,523 | .30 |
Institutional Class | 16,640 | .25 |
| $ 339,321 | |
Accounting and Security Lending Fees. Fidelity Service Company, Inc. (FSC), an affiliate of FMR, maintains the Fund's accounting records. The accounting fee is based on the level of average net assets for each month. Under a separate contract, FSC administers the security lending program. The security lending fee is based on the number and duration of lending transactions.
Brokerage Commissions. The Fund placed a portion of its portfolio transactions with brokerage firms which are affiliates of the investment adviser. The commissions paid to these affiliated firms were $28,761 for the period.
Annual Report
Fidelity Advisor Financial Services Fund
Notes to Financial Statements - continued
6. Committed Line of Credit.
The Fund participates with other funds managed by FMR or an affiliate in a $4.25 billion credit facility (the "line of credit") to be utilized for temporary or emergency purposes to fund shareholder redemptions or for other short-term liquidity purposes. The Fund has agreed to pay commitment fees on its pro-rata portion of the line of credit, which amounted to $327 and is reflected in Miscellaneous expenses on the Statement of Operations. During the period, there were no borrowings on this line of credit.
7. Security Lending.
The Fund lends portfolio securities through a lending agent from time to time in order to earn additional income. For equity securities, a lending agent is used and may loan securities to certain qualified borrowers, including Fidelity Capital Markets (FCM), a broker-dealer affiliated with the Fund. On the settlement date of the loan, the Fund receives collateral (in the form of U.S. Treasury obligations, letters of credit and/or cash) against the loaned securities and maintains collateral in an amount not less than 100% of the market value of the loaned securities during the period of the loan. The market value of the loaned securities is determined at the close of business of the Fund and any additional required collateral is delivered to the Fund on the next business day. If the borrower defaults on its obligation to return the securities loaned because of insolvency or other reasons, a fund could experience delays and costs in recovering the securities loaned or in gaining access to the collateral. Any cash collateral received is invested in the Fidelity Securities Lending Cash Central Fund. The value of loaned securities and cash collateral at period end are disclosed on the Fund's Statement of Assets and Liabilities. At period end, there were no security loans outstanding with FCM. Security lending income represents the income earned on investing cash collateral, less rebates paid to borrowers and any lending agent fees associated with the loan, plus any premium payments received for lending certain types of securities. Security lending income is presented in the Statement of Operations as a component of income from Fidelity Central Funds. Total security lending income during the period amounted to $23,394, including $9 from securities loaned to FCM.
8. Bank Borrowings.
The Fund is permitted to have bank borrowings for temporary or emergency purposes to fund shareholder redemptions or for other short-term liquidity requirements. The Fund has established borrowing arrangements with certain banks. The interest rate on the borrowings is the bank's base rate, as revised from time to time. The average loan balance during the period for which loans were outstanding amounted to $13,000,000. The weighted average interest rate was .65%. The interest expense amounted to $235 under the bank borrowing program. At period end, there were no bank borrowings outstanding.
9. Expense Reductions.
Many of the brokers with whom FMR places trades on behalf of the Fund provided services to the Fund in addition to trade execution. These services included payments of certain expenses on behalf of the Fund totaling $100,487 for the period.
10. Distributions to Shareholders.
Distributions to shareholders of each class were as follows:
Years ended July 31, | 2012 | 2011 |
From net investment income | | |
Class A | $ 83,840 | $ - |
Class T | 7,542 | - |
Institutional Class | 16,167 | - |
Total | $ 107,549 | $ - |
11. Share Transactions.
Transactions for each class of shares were as follows:
| Shares | Dollars |
Years ended July 31, | 2012 | 2011 | 2012 | 2011 |
Class A | | | | |
Shares sold | 1,565,665 | 2,161,457 | $ 14,397,253 | $ 22,928,387 |
Reinvestment of distributions | 8,251 | - | 73,682 | - |
Shares redeemed | (3,304,887) | (2,543,428) | (32,600,547) | (27,053,427) |
Net increase (decrease) | (1,730,971) | (381,971) | $ (18,129,612) | $ (4,125,040) |
Annual Report
11. Share Transactions - continued
| Shares | Dollars |
Years ended July 31, | 2012 | 2011 | 2012 | 2011 |
Class T | | | | |
Shares sold | 376,369 | 432,428 | $ 3,652,534 | $ 4,608,539 |
Reinvestment of distributions | 806 | - | 7,158 | - |
Shares redeemed | (668,164) | (958,085) | (6,208,120) | (10,097,220) |
Net increase (decrease) | (290,989) | (525,657) | $ (2,548,428) | $ (5,488,681) |
Class B | | | | |
Shares sold | 18,960 | 48,520 | $ 183,629 | $ 510,105 |
Shares redeemed | (200,436) | (369,736) | (1,817,467) | (3,763,785) |
Net increase (decrease) | (181,476) | (321,216) | $ (1,633,838) | $ (3,253,680) |
Class C | | | | |
Shares sold | 373,577 | 446,364 | $ 3,534,293 | $ 4,631,347 |
Shares redeemed | (625,998) | (1,122,959) | (5,580,570) | (11,383,791) |
Net increase (decrease) | (252,421) | (676,595) | $ (2,046,277) | $ (6,752,444) |
Institutional Class | | | | |
Shares sold | 366,163 | 691,657 | $ 3,659,590 | $ 7,779,752 |
Reinvestment of distributions | 1,570 | - | 14,317 | - |
Shares redeemed | (624,705) | (387,007) | (6,435,094) | (4,196,861) |
Net increase (decrease) | (256,972) | 304,650 | $ (2,761,187) | $ 3,582,891 |
12. Other.
The Fund's organizational documents provide former and current trustees and officers with a limited indemnification against liabilities arising in connection with the performance of their duties to the Fund. In the normal course of business, the Fund may also enter into contracts that provide general indemnifications. The Fund's maximum exposure under these arrangements is unknown as this would be dependent on future claims that may be made against the Fund. The risk of material loss from such claims is considered remote.
Annual Report
Fidelity Advisor Health Care Fund - Class A, T, B, and C
Performance: The Bottom Line
Average annual total return reflects the change in the value of an investment, assuming reinvestment of the class' distributions from dividend income and capital gains (the profits earned upon the sale of securities that have grown in value, if any) and assuming a constant rate of performance each year. The $10,000 table and the fund's returns do not reflect the deduction of taxes that a shareholder would pay on fund distributions or the redemption of fund shares. During periods of reimbursement by Fidelity, a fund's total return will be greater than it would be had the reimbursement not occurred. How a fund did yesterday is no guarantee of how it will do tomorrow. Returns reflect the conversion of Class B shares to Class A shares after a maximum of seven years.
Average Annual Total Returns
Periods ended July 31, 2012 | Past 1
year | Past 5
years | Past 10
years |
Class A (incl. 5.75% sales charge) | 1.40% | 4.83% | 7.08% |
Class T (incl. 3.50% sales charge) | 3.52% | 5.05% | 7.06% |
Class B (incl. contingent deferred sales charge) A | 2.13% | 4.96% | 7.15% |
Class C (incl. contingent deferred sales charge) B | 5.87% | 5.30% | 6.95% |
A Class B shares' contingent deferred sales charges included in the past one year, past five years, and past ten years total return figures are 5%, 2%, and 0%, respectively.
B Class C shares' contingent deferred sales charges included in the past one year, past five years, and past ten years total return figures are 1%, 0%, and 0%, respectively.
$10,000 Over 10 Years
Let's say hypothetically that $10,000 was invested in Fidelity Advisor Health Care Fund - Class A on July 31, 2002, and the current 5.75% sales charge was paid. The chart shows how the value of your investment would have changed, and also shows how the S&P 500 Index performed over the same period.
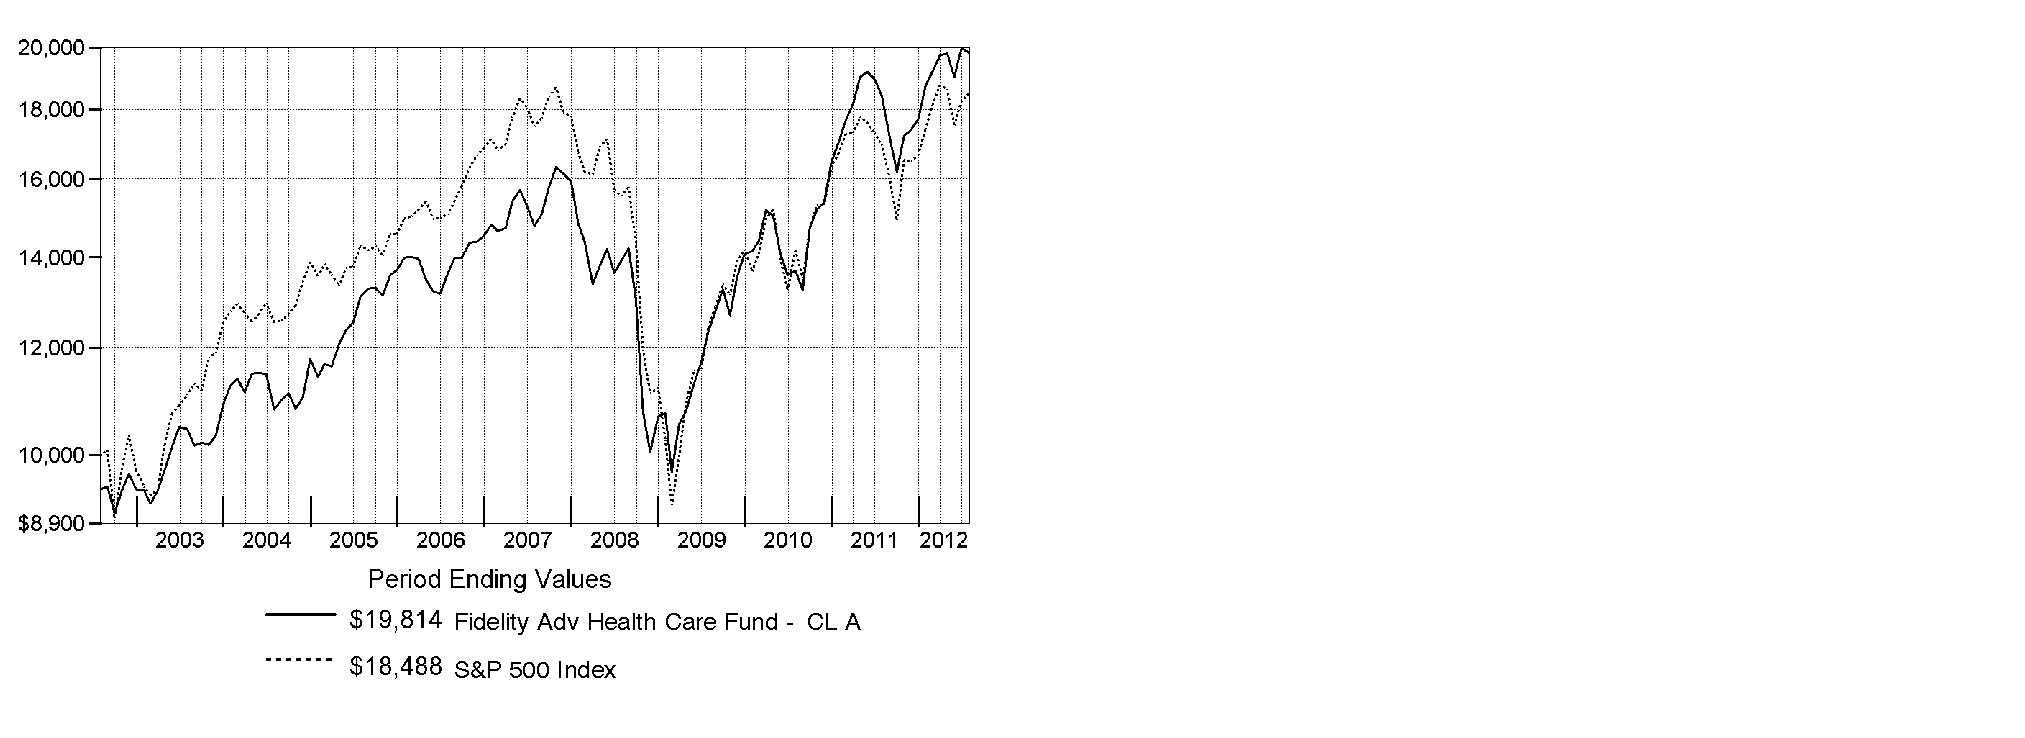
Annual Report
Fidelity Advisor Health Care Fund
Market Recap: Major U.S. equity benchmarks posted solid gains for the year ending July 31, 2012, amid an uncertain investment environment. The broad-based S&P 500® Index returned 9.13%, while the blue-chip-laden Dow Jones Industrial AverageSM and technology-heavy Nasdaq Composite® Index gained 10.12% and 7.83%, respectively. Volatility spiked during the period's first half, as equities plummeted late last summer on Europe's debt woes, political wrangling over the U.S. debt ceiling and the sovereign credit-rating downgrade that followed. By October, a seemingly improved U.S. economy rejuvenated stocks, paving the way for major equity benchmarks to post their best first-quarter performance since 1998. However, more eurozone trouble, signs that the U.S. economy had turned sluggish and a slowdown in China caused stocks to slip in May, before a new wave of optimism took hold in June and July. Within the S&P 500®, more-defensive sectors such as telecommunication services (+30%) and consumer staples (+20%) fared best, while materials and energy significantly underperformed, returning -5%. Small- and mid-cap stocks trailed their less-volatile large-cap counterparts, with the Russell 2000® Index adding 0.19% and the Russell Midcap® Index rising 2.28%. Given turmoil and local currency weakness in Europe, foreign developed-markets stocks lost ground, with the MSCI® EAFE® Index returning -11.32%.
Comments from Eddie Yoon, Portfolio Manager of Fidelity Advisor® Health Care Fund: For the year, the fund's Class A, Class T, Class B and Class C shares gained 7.58%, 7.27%, 6.78% and 6.80%, respectively (excluding sales charges), trailing the 14.50% gain of the MSCI® U.S. IM Health Care 25/50 Index and the broadly based S&P 500®. Versus the MSCI index, weak stock picks and a significant underweighting in the strong pharmaceuticals industry - by far the index's largest component - hurt the most. A less-than-index stake in a slew of large-cap pharma firms, such as index heavyweights Pfizer, Abbott Laboratories - since sold from the fund - and Merck, detracted. Positioning in managed health care, including a stake in both Health Net and Humana, and health care equipment also nicked results. Foreign holdings also hurt, due in part to a stronger U.S. dollar. Conversely, a decision to significantly overweight biotechnology stocks - the best-performing area in the benchmark - was rewarded, due largely to a flurry of merger-and-acquisition activity that lifted the group overall. The fund's top individual contributor was a small non-index stake in Inhibitex, whose shares rose in January on a takeover bid by Bristol-Meyers Squibb. I sold the stock shortly after. Shares of Amgen and Alexion Pharmaceuticals also were additive.
The views expressed above reflect those of the portfolio manager(s) only through the end of the period as stated on the cover of this report and do not necessarily represent the views of Fidelity or any other person in the Fidelity organization. Any such views are subject to change at any time based upon market or other conditions and Fidelity disclaims any responsibility to update such views. These views may not be relied on as investment advice and, because investment decisions for a Fidelity fund are based on numerous factors, may not be relied on as an indication of trading intent on behalf of any Fidelity fund.
Annual Report
Fidelity Advisor Health Care Fund
As a shareholder of the Fund, you incur two types of costs: (1) transaction costs, including sales charges (loads) on purchase payments or redemption proceeds, redemption fees and (2) ongoing costs, including management fees, distribution and/or service (12b-1) fees and other Fund expenses. This Example is intended to help you understand your ongoing costs (in dollars) of investing in the Fund and to compare these costs with the ongoing costs of investing in other mutual funds.
The Example is based on an investment of $1,000 invested at the beginning of the period and held for the entire period (February 1, 2012 to July 31, 2012).
Actual Expenses
The first line of the accompanying table for each class of the Fund provides information about actual account values and actual expenses. You may use the information in this line, together with the amount you invested, to estimate the expenses that you paid over the period. Simply divide your account value by $1,000.00 (for example, an $8,600 account value divided by $1,000.00 = 8.6), then multiply the result by the number in the first line for a class of the Fund under the heading entitled "Expenses Paid During Period" to estimate the expenses you paid on your account during this period. In addition, the Fund, as a shareholder in the underlying Fidelity Central Funds, will indirectly bear its pro-rata share of the fees and expenses incurred by the underlying Fidelity Central Funds. These fees and expenses are not included in the Fund's annualized expense ratio used to calculate the expense estimate in the table below.
Hypothetical Example for Comparison Purposes
The second line of the accompanying table for each class of the Fund provides information about hypothetical account values and hypothetical expenses based on a Class' actual expense ratio and an assumed rate of return of 5% per year before expenses, which is not the Class' actual return. The hypothetical account values and expenses may not be used to estimate the actual ending account balance or expenses you paid for the period. You may use this information to compare the ongoing costs of investing in the Fund and other funds. To do so, compare this 5% hypothetical example with the 5% hypothetical examples that appear in the shareholder reports of the other funds. In addition, the Fund, as a shareholder in the underlying Fidelity Central Funds, will indirectly bear its pro-rata share of the fees and expenses incurred by the underlying Fidelity Central Funds. These fees and expenses are not included in the Fund's annualized expense ratio used to calculate the expense estimate in the table below.
Please note that the expenses shown in the table are meant to highlight your ongoing costs only and do not reflect any transaction costs. Therefore, the second line of the table is useful in comparing ongoing costs only, and will not help you determine the relative total costs of owning different funds. In addition, if these transactional costs were included, your costs would have been higher.
| Annualized Expense Ratio | Beginning
Account Value
February 1, 2012 | Ending
Account Value
July 31, 2012 | Expenses Paid
During Period*
February 1, 2012
to July 31, 2012 |
Class A | 1.17% | | | |
Actual | | $ 1,000.00 | $ 1,056.90 | $ 5.98 |
HypotheticalA | | $ 1,000.00 | $ 1,019.05 | $ 5.87 |
Class T | 1.42% | | | |
Actual | | $ 1,000.00 | $ 1,055.40 | $ 7.26 |
HypotheticalA | | $ 1,000.00 | $ 1,017.80 | $ 7.12 |
Class B | 1.93% | | | |
Actual | | $ 1,000.00 | $ 1,052.80 | $ 9.85 |
HypotheticalA | | $ 1,000.00 | $ 1,015.27 | $ 9.67 |
Class C | 1.88% | | | |
Actual | | $ 1,000.00 | $ 1,052.90 | $ 9.60 |
HypotheticalA | | $ 1,000.00 | $ 1,015.51 | $ 9.42 |
Institutional Class | .88% | | | |
Actual | | $ 1,000.00 | $ 1,058.70 | $ 4.50 |
HypotheticalA | | $ 1,000.00 | $ 1,020.49 | $ 4.42 |
A 5% return per year before expenses
* Expenses are equal to each Class' annualized expense ratio, multiplied by the average account value over the period, multiplied by 182/366 (to reflect the one-half year period).
Annual Report
Fidelity Advisor Health Care Fund
Investment Changes (Unaudited)
Top Ten Stocks as of July 31, 2012 |
| % of fund's
net assets | % of fund's net assets
6 months ago |
Amgen, Inc. | 7.6 | 6.7 |
Pfizer, Inc. | 7.5 | 0.5 |
Merck & Co., Inc. | 5.3 | 3.9 |
Gilead Sciences, Inc. | 4.9 | 4.1 |
UnitedHealth Group, Inc. | 4.8 | 4.1 |
Eli Lilly & Co. | 3.9 | 1.3 |
Catamaran Corp. | 3.2 | 1.1 |
Johnson & Johnson | 3.1 | 0.0 |
Watson Pharmaceuticals, Inc. | 2.9 | 1.0 |
Biogen Idec, Inc. | 2.3 | 2.7 |
| 45.5 | |
Top Industries (% of fund's net assets) |
As of July 31, 2012 |
| Pharmaceuticals | 30.5% | |
| Biotechnology | 28.6% | |
| Health Care
Providers & Services | 21.7% | |
| Health Care
Equipment & Supplies | 8.9% | |
| Health Care Technology | 3.5% | |
| All Others* | 6.8% | |

As of January 31, 2012 |
| Health Care
Providers & Services | 31.5% | |
| Biotechnology | 26.8% | |
| Pharmaceuticals | 19.0% | |
| Health Care
Equipment & Supplies | 12.8% | |
| Food & Staples Retailing | 2.1% | |
| All Others* | 7.8% | |

* Includes short-term investments and net other assets. |
Annual Report
Fidelity Advisor Health Care Fund
Investments July 31, 2012
Showing Percentage of Net Assets
Common Stocks - 98.1% |
| Shares | | Value |
BIOTECHNOLOGY - 28.6% |
Biotechnology - 28.6% |
Achillion Pharmaceuticals, Inc. (a)(d) | 210,600 | | $ 1,394,172 |
Acorda Therapeutics, Inc. (a) | 64,527 | | 1,553,165 |
Alexion Pharmaceuticals, Inc. (a) | 19,271 | | 2,020,564 |
AMAG Pharmaceuticals, Inc. (a) | 32,589 | | 504,478 |
Amgen, Inc. | 448,365 | | 37,034,947 |
ARIAD Pharmaceuticals, Inc. (a) | 141,600 | | 2,708,808 |
AVEO Pharmaceuticals, Inc. (a)(d) | 117,282 | | 1,536,395 |
Biogen Idec, Inc. (a) | 75,783 | | 11,051,435 |
BioMarin Pharmaceutical, Inc. (a) | 225,141 | | 8,845,790 |
Biovitrum AB (a) | 262,300 | | 917,962 |
Discovery Laboratories, Inc. (a)(d) | 370,419 | | 937,160 |
Dynavax Technologies Corp. (a) | 822,100 | | 3,173,306 |
Gilead Sciences, Inc. (a) | 434,467 | | 23,604,592 |
Grifols SA ADR (d) | 152,150 | | 3,395,988 |
Infinity Pharmaceuticals, Inc. (a) | 109,600 | | 1,913,616 |
Lexicon Pharmaceuticals, Inc. (a) | 390,000 | | 943,800 |
Medivation, Inc. (a) | 52,170 | | 5,201,349 |
Merrimack Pharmaceuticals, Inc. | 8,300 | | 66,151 |
Merrimack Pharmaceuticals, Inc. (e) | 80,373 | | 576,516 |
Momenta Pharmaceuticals, Inc. (a) | 65,500 | | 931,410 |
Neurocrine Biosciences, Inc. (a) | 197,518 | | 1,501,137 |
NPS Pharmaceuticals, Inc. (a) | 212,800 | | 1,640,688 |
Onyx Pharmaceuticals, Inc. (a) | 45,100 | | 3,381,147 |
Progenics Pharmaceuticals, Inc. (a) | 66,100 | | 344,381 |
Rigel Pharmaceuticals, Inc. (a) | 100,000 | | 1,094,000 |
Seattle Genetics, Inc. (a)(d) | 87,857 | | 2,298,339 |
Spectrum Pharmaceuticals, Inc. (a) | 111,000 | | 1,552,890 |
Synageva BioPharma Corp. (a) | 95,900 | | 4,800,754 |
Targacept, Inc. (a) | 217,115 | | 937,937 |
Theravance, Inc. (a)(d) | 120,100 | | 3,498,513 |
Thrombogenics NV (a) | 45,100 | | 1,455,530 |
United Therapeutics Corp. (a) | 60,904 | | 3,336,321 |
Vertex Pharmaceuticals, Inc. (a) | 65,700 | | 3,187,107 |
Vical, Inc. (a) | 279,000 | | 965,340 |
ZIOPHARM Oncology, Inc. (a) | 105,600 | | 594,528 |
| | 138,900,216 |
DIVERSIFIED CONSUMER SERVICES - 0.4% |
Specialized Consumer Services - 0.4% |
Carriage Services, Inc. | 221,955 | | 1,793,396 |
FOOD & STAPLES RETAILING - 1.4% |
Drug Retail - 1.4% |
CVS Caremark Corp. | 91,900 | | 4,158,475 |
Drogasil SA | 214,800 | | 2,452,821 |
| | 6,611,296 |
HEALTH CARE EQUIPMENT & SUPPLIES - 8.9% |
Health Care Equipment - 7.9% |
Boston Scientific Corp. (a) | 1,840,501 | | 9,515,390 |
|
| Shares | | Value |
C.R. Bard, Inc. | 65,000 | | $ 6,321,900 |
Conceptus, Inc. (a) | 79,600 | | 1,478,968 |
CONMED Corp. | 56,000 | | 1,536,640 |
Covidien PLC | 65,196 | | 3,643,152 |
Genmark Diagnostics, Inc. (a) | 11,000 | | 62,150 |
HeartWare International, Inc. (a) | 42,000 | | 3,750,180 |
Hill-Rom Holdings, Inc. | 58,993 | | 1,542,667 |
Insulet Corp. (a) | 114,200 | | 2,233,752 |
Opto Circuits India Ltd. | 278,968 | | 772,484 |
Volcano Corp. (a) | 65,900 | | 1,743,055 |
William Demant Holding A/S (a) | 19,063 | | 1,801,295 |
Wright Medical Group, Inc. (a) | 128,234 | | 2,390,282 |
Zeltiq Aesthetics, Inc. | 205,900 | | 1,058,326 |
Zimmer Holdings, Inc. | 13,200 | | 777,876 |
| | 38,628,117 |
Health Care Supplies - 1.0% |
The Cooper Companies, Inc. | 65,050 | | 4,895,663 |
TOTAL HEALTH CARE EQUIPMENT & SUPPLIES | | 43,523,780 |
HEALTH CARE PROVIDERS & SERVICES - 21.7% |
Health Care Distributors & Services - 0.9% |
Amplifon SpA | 365,025 | | 1,358,159 |
McKesson Corp. | 32,820 | | 2,977,759 |
| | 4,335,918 |
Health Care Facilities - 1.9% |
Brookdale Senior Living, Inc. (a) | 173,672 | | 2,858,641 |
Emeritus Corp. (a) | 97,675 | | 1,655,591 |
Hanger, Inc. (a) | 65,665 | | 1,692,187 |
LCA-Vision, Inc. (a) | 196,700 | | 694,351 |
Sunrise Senior Living, Inc. (a)(d) | 367,909 | | 2,457,632 |
| | 9,358,402 |
Health Care Services - 9.4% |
Accretive Health, Inc. (a) | 124,845 | | 1,695,395 |
Catamaran Corp. (a) | 180,446 | | 15,326,709 |
Express Scripts Holding Co. (a) | 92,856 | | 5,380,077 |
Fresenius Medical Care AG & Co. KGaA | 61,213 | | 4,424,960 |
HMS Holdings Corp. (a) | 87,400 | | 3,007,434 |
MEDNAX, Inc. (a) | 113,500 | | 7,505,755 |
Omnicare, Inc. | 71,426 | | 2,243,491 |
Quest Diagnostics, Inc. | 109,248 | | 6,383,361 |
| | 45,967,182 |
Managed Health Care - 9.5% |
Aetna, Inc. | 130,500 | | 4,705,830 |
Centene Corp. (a) | 42,300 | | 1,609,092 |
CIGNA Corp. | 70,300 | | 2,831,684 |
Health Net, Inc. (a) | 217,100 | | 4,780,542 |
Humana, Inc. | 77,926 | | 4,800,242 |
UnitedHealth Group, Inc. | 455,523 | | 23,272,670 |
Common Stocks - continued |
| Shares | | Value |
HEALTH CARE PROVIDERS & SERVICES - CONTINUED |
Managed Health Care - continued |
Universal American Spin Corp. (a) | 66,000 | | $ 591,360 |
WellPoint, Inc. | 64,600 | | 3,442,534 |
| | 46,033,954 |
TOTAL HEALTH CARE PROVIDERS & SERVICES | | 105,695,456 |
HEALTH CARE TECHNOLOGY - 3.0% |
Health Care Technology - 3.0% |
athenahealth, Inc. (a) | 49,000 | | 4,483,500 |
Cerner Corp. (a) | 118,400 | | 8,752,128 |
HealthStream, Inc. (a) | 49,100 | | 1,371,854 |
| | 14,607,482 |
IT SERVICES - 0.7% |
IT Consulting & Other Services - 0.7% |
Maximus, Inc. | 63,190 | | 3,191,095 |
LIFE SCIENCES TOOLS & SERVICES - 0.7% |
Life Sciences Tools & Services - 0.7% |
Furiex Pharmaceuticals, Inc. (a) | 52,200 | | 1,003,284 |
Illumina, Inc. (a)(d) | 57,471 | | 2,383,322 |
| | 3,386,606 |
PERSONAL PRODUCTS - 0.6% |
Personal Products - 0.6% |
Prestige Brands Holdings, Inc. (a) | 171,172 | | 2,808,933 |
PHARMACEUTICALS - 30.5% |
Pharmaceuticals - 30.5% |
Cadence Pharmaceuticals, Inc. (a)(d) | 307,762 | | 1,304,911 |
Elan Corp. PLC sponsored ADR (a) | 317,500 | | 3,667,125 |
Eli Lilly & Co. | 429,600 | | 18,915,288 |
Endo Pharmaceuticals Holdings, Inc. (a) | 129,900 | | 3,861,927 |
Hi-Tech Pharmacal Co., Inc. (a) | 10,100 | | 347,036 |
Johnson & Johnson | 217,200 | | 15,034,584 |
Meda AB (A Shares) | 216,600 | | 2,052,726 |
Merck & Co., Inc. | 586,095 | | 25,887,816 |
Optimer Pharmaceuticals, Inc. (a)(d) | 171,954 | | 2,348,892 |
Pacira Pharmaceuticals, Inc. (a) | 54,500 | | 834,395 |
Pfizer, Inc. | 1,519,488 | | 36,528,492 |
Shire PLC sponsored ADR | 86,700 | | 7,471,806 |
UCB SA | 39,200 | | 1,965,923 |
Valeant Pharmaceuticals International, Inc. (Canada) (a) | 162,804 | | 7,759,915 |
ViroPharma, Inc. (a) | 241,100 | | 5,234,281 |
Watson Pharmaceuticals, Inc. (a) | 178,440 | | 13,887,985 |
XenoPort, Inc. (a) | 139,500 | | 1,099,260 |
| | 148,202,362 |
|
| Shares | | Value |
PROFESSIONAL SERVICES - 1.2% |
Research & Consulting Services - 1.2% |
Advisory Board Co. (a) | 60,500 | | $ 2,721,895 |
Qualicorp SA (a) | 349,000 | | 3,108,164 |
| | 5,830,059 |
SOFTWARE - 0.4% |
Application Software - 0.4% |
Nuance Communications, Inc. (a) | 97,700 | | 1,988,195 |
TOTAL COMMON STOCKS (Cost $407,645,739) |
476,538,876
|
Convertible Preferred Stocks - 0.5% |
| | | |
HEALTH CARE TECHNOLOGY - 0.5% |
Health Care Technology - 0.5% |
Castlight Health, Inc. Series D (a)(e)
(Cost $2,033,113) | 336,800 | |
2,357,600
|
Money Market Funds - 5.4% |
| | | |
Fidelity Cash Central Fund, 0.17% (b) | 12,320,233 | | 12,320,233 |
Fidelity Securities Lending Cash Central Fund, 0.18% (b)(c) | 14,089,821 | | 14,089,821 |
TOTAL MONEY MARKET FUNDS (Cost $26,410,054) |
26,410,054
|
TOTAL INVESTMENT PORTFOLIO - 104.0% (Cost $436,088,906) | | 505,306,530 |
NET OTHER ASSETS (LIABILITIES) - (4.0)% | | (19,247,900) |
NET ASSETS - 100% | $ 486,058,630 |
Legend |
(a) Non-income producing |
(b) Affiliated fund that is available only to investment companies and other accounts managed by Fidelity Investments. The rate quoted is the annualized seven-day yield of the fund at period end. A complete unaudited listing of the fund's holdings as of its most recent quarter end is available upon request. In addition, each Fidelity Central Fund's financial statements, which are not covered by the Fund's Report of Independent Registered Public Accounting Firm, are available on the SEC's website or upon request. |
(c) Investment made with cash collateral received from securities on loan. |
(d) Security or a portion of the security is on loan at period end. |
(e) Restricted securities - Investment in securities not registered under the Securities Act of 1933 (excluding 144A issues). At the end of the period, the value of restricted securities (excluding 144A issues) amounted to $2,934,116 or 0.6% of net assets. |
Additional information on each restricted holding is as follows: |
Security | Acquisition Date | Acquisition Cost |
Castlight Health, Inc. Series D | 4/25/12 | $ 2,033,113 |
Merrimack Pharmaceuticals, Inc. | 3/31/11 | $ 562,611 |
Affiliated Central Funds |
Information regarding fiscal year to date income earned by the Fund from investments in Fidelity Central Funds is as follows: |
Fund | Income earned |
Fidelity Cash Central Fund | $ 22,858 |
Fidelity Securities Lending Cash Central Fund | 105,759 |
Total | $ 128,617 |
Other Information |
The following is a summary of the inputs used, as of July 31, 2012, involving the Fund's assets and liabilities carried at fair value. The inputs or methodology used for valuing securities may not be an indication of the risk associated with investing in those securities. For more information on valuation inputs, and their aggregation into the levels used in the table below, please refer to the Security Valuation section in the accompanying Notes to Financial Statements. |
Valuation Inputs at Reporting Date: |
Description | Total | Level 1 | Level 2 | Level 3 |
Investments in Securities: | | | | |
Common Stocks | $ 476,538,876 | $ 471,537,400 | $ 5,001,476 | $ - |
Convertible Preferred Stocks | 2,357,600 | - | - | 2,357,600 |
Money Market Funds | 26,410,054 | 26,410,054 | - | - |
Total Investments in Securities: | $ 505,306,530 | $ 497,947,454 | $ 5,001,476 | $ 2,357,600 |
Distribution of investments by country or territory of incorporation, as a percentage of total net assets, is as follows. (Unaudited) |
United States of America | 87.4% |
Canada | 4.8% |
Bailiwick of Jersey | 1.5% |
Ireland | 1.4% |
Brazil | 1.1% |
Others (Individually Less Than 1%) | 3.8% |
| 100.0% |
See accompanying notes which are an integral part of the financial statements.
Annual Report
Fidelity Advisor Health Care Fund
Statement of Assets and Liabilities
| July 31, 2012 |
| | |
Assets | | |
Investment in securities, at value (including securities loaned of $13,556,580) - See accompanying schedule: Unaffiliated issuers (cost $409,678,852) | $ 478,896,476 | |
Fidelity Central Funds (cost $26,410,054) | 26,410,054 | |
Total Investments (cost $436,088,906) | | $ 505,306,530 |
Receivable for investments sold | | 6,800,694 |
Receivable for fund shares sold | | 338,012 |
Dividends receivable | | 56,993 |
Distributions receivable from Fidelity Central Funds | | 14,622 |
Other receivables | | 11,257 |
Total assets | | 512,528,108 |
| | |
Liabilities | | |
Payable for investments purchased | $ 10,132,067 | |
Payable for fund shares redeemed | 1,670,121 | |
Accrued management fee | 228,342 | |
Distribution and service plan fees payable | 178,054 | |
Other affiliated payables | 127,434 | |
Other payables and accrued expenses | 43,639 | |
Collateral on securities loaned, at value | 14,089,821 | |
Total liabilities | | 26,469,478 |
| | |
Net Assets | | $ 486,058,630 |
Net Assets consist of: | | |
Paid in capital | | $ 379,366,668 |
Accumulated net investment loss | | (849,653) |
Accumulated undistributed net realized gain (loss) on investments and foreign currency transactions | | 38,324,765 |
Net unrealized appreciation (depreciation) on investments and assets and liabilities in foreign currencies | | 69,216,850 |
Net Assets | | $ 486,058,630 |
Statement of Assets and Liabilities - continued
| July 31, 2012 |
| | |
Calculation of Maximum Offering Price Class A:
Net Asset Value and redemption price per share ($233,187,940 ÷ 9,577,063 shares) | | $ 24.35 |
| | |
Maximum offering price per share (100/94.25 of $24.35) | | $ 25.84 |
Class T:
Net Asset Value and redemption price per share ($117,968,719 ÷ 5,037,302 shares) | | $ 23.42 |
| | |
Maximum offering price per share (100/96.50 of $23.42) | | $ 24.27 |
Class B:
Net Asset Value and offering price per share ($15,402,854 ÷ 714,828 shares)A | | $ 21.55 |
| | |
Class C:
Net Asset Value and offering price per share ($78,762,566 ÷ 3,661,365 shares)A | | $ 21.51 |
| | |
Institutional Class:
Net Asset Value, offering price and redemption price per share ($40,736,551 ÷ 1,591,486 shares) | | $ 25.60 |
A Redemption price per share is equal to net asset value less any applicable contingent deferred sales charge.
See accompanying notes which are an integral part of the financial statements.
Annual Report
Fidelity Advisor Health Care Fund
Financial Statements - continued
Statement of Operations
| Year ended July 31, 2012 |
| | |
Investment Income | | |
Dividends | | $ 4,419,501 |
Income from Fidelity Central Funds | | 128,617 |
Total income | | 4,548,118 |
| | |
Expenses | | |
Management fee | $ 2,536,733 | |
Transfer agent fees | 1,310,614 | |
Distribution and service plan fees | 2,008,334 | |
Accounting and security lending fees | 179,978 | |
Custodian fees and expenses | 32,460 | |
Independent trustees' compensation | 3,058 | |
Registration fees | 81,929 | |
Audit | 51,857 | |
Legal | 2,274 | |
Miscellaneous | 4,278 | |
Total expenses before reductions | 6,211,515 | |
Expense reductions | (38,395) | 6,173,120 |
Net investment income (loss) | | (1,625,002) |
Realized and Unrealized Gain (Loss) Net realized gain (loss) on: | | |
Investment securities: | | |
Unaffiliated issuers | 42,656,991 | |
Foreign currency transactions | (91,386) | |
Total net realized gain (loss) | | 42,565,605 |
Change in net unrealized appreciation (depreciation) on: Investment securities | (11,611,030) | |
Assets and liabilities in foreign currencies | (5,294) | |
Total change in net unrealized appreciation (depreciation) | | (11,616,324) |
Net gain (loss) | | 30,949,281 |
Net increase (decrease) in net assets resulting from operations | | $ 29,324,279 |
Statement of Changes in Net Assets
| Year ended
July 31,
2012 | Year ended
July 31,
2011 |
Increase (Decrease) in Net Assets | | |
Operations | | |
Net investment income (loss) | $ (1,625,002) | $ (2,816,326) |
Net realized gain (loss) | 42,565,605 | 84,545,757 |
Change in net unrealized appreciation (depreciation) | (11,616,324) | 41,597,148 |
Net increase (decrease) in net assets resulting from operations | 29,324,279 | 123,326,579 |
Distributions to shareholders from net realized gain | (49,973,824) | - |
Share transactions - net increase (decrease) | 14,972,155 | (10,714,611) |
Redemption fees | 69,585 | 9,972 |
Total increase (decrease) in net assets | (5,607,805) | 112,621,940 |
| | |
Net Assets | | |
Beginning of period | 491,666,435 | 379,044,495 |
End of period (including accumulated net investment loss of $849,653 and accumulated net investment loss of $43,728, respectively) | $ 486,058,630 | $ 491,666,435 |
See accompanying notes which are an integral part of the financial statements.
Annual Report
Financial Highlights - Class A
Years ended July 31, | 2012 | 2011 | 2010 | 2009 | 2008 |
Selected Per-Share Data | | | | | |
Net asset value, beginning of period | $ 25.60 | $ 19.01 | $ 17.15 | $ 19.72 | $ 22.90 |
Income from Investment Operations | | | | | |
Net investment income (loss) C | (.04) | (.10) | (.07) | .02 | (.03) |
Net realized and unrealized gain (loss) | 1.43 | 6.69 | 1.93 | (2.22) | (1.08) |
Total from investment operations | 1.39 | 6.59 | 1.86 | (2.20) | (1.11) |
Distributions from net realized gain | (2.64) | - | - | (.37) | (2.07) |
Redemption fees added to paid in capital C, G | - | - | - | - | - |
Net asset value, end of period | $ 24.35 | $ 25.60 | $ 19.01 | $ 17.15 | $ 19.72 |
Total Return A, B | 7.58% | 34.67% | 10.85% | (11.37)% | (5.64)% |
Ratios to Average Net Assets D, F | | | | | |
Expenses before reductions | 1.19% | 1.19% | 1.22% | 1.23% | 1.20% |
Expenses net of fee waivers, if any | 1.19% | 1.19% | 1.22% | 1.23% | 1.20% |
Expenses net of all reductions | 1.18% | 1.18% | 1.21% | 1.23% | 1.19% |
Net investment income (loss) | (.18)% | (.43)% | (.36)% | .11% | (.13)% |
Supplemental Data | | | | | |
Net assets, end of period (000 omitted) | $ 233,188 | $ 224,704 | $ 179,586 | $ 177,890 | $ 220,888 |
Portfolio turnover rate E | 124% | 125% | 103% | 172% | 134% |
A Total returns would have been lower if certain expenses had not been reduced during the applicable periods shown.
B Total returns do not include the effect of the sales charges.
C Calculated based on average shares outstanding during the period.
D Fees and expenses of any underlying Fidelity Central Funds are not included in the Fund's expense ratio. The Fund indirectly bears its proportionate share of the expenses of any underlying Fidelity Central Funds.
E Amount does not include the portfolio activity of any underlying Fidelity Central Funds.
F Expense ratios reflect operating expenses of the class. Expenses before reductions do not reflect amounts reimbursed by the investment adviser or reductions from brokerage service arrangements or reductions from other expense offset arrangements and do not represent the amount paid by the class during periods when reimbursements or reductions occur. Expenses net of fee waivers reflect expenses after reimbursement by the investment adviser but prior to reductions from brokerage service arrangements or other expense offset arrangements. Expenses net of all reductions represent the net expenses paid by the class.
G Amount represents less than $.01 per share.
Financial Highlights - Class T
Years ended July 31, | 2012 | 2011 | 2010 | 2009 | 2008 |
Selected Per-Share Data | | | | | |
Net asset value, beginning of period | $ 24.80 | $ 18.46 | $ 16.69 | $ 19.26 | $ 22.39 |
Income from Investment Operations | | | | | |
Net investment income (loss) C | (.09) | (.16) | (.12) | (.02) | (.08) |
Net realized and unrealized gain (loss) | 1.35 | 6.50 | 1.89 | (2.18) | (1.06) |
Total from investment operations | 1.26 | 6.34 | 1.77 | (2.20) | (1.14) |
Distributions from net realized gain | (2.64) | - | - | (.37) | (1.99) |
Redemption fees added to paid in capital C, G | - | - | - | - | - |
Net asset value, end of period | $ 23.42 | $ 24.80 | $ 18.46 | $ 16.69 | $ 19.26 |
Total Return A, B | 7.27% | 34.34% | 10.61% | (11.65)% | (5.86)% |
Ratios to Average Net Assets D, F | | | | | |
Expenses before reductions | 1.43% | 1.44% | 1.47% | 1.49% | 1.46% |
Expenses net of fee waivers, if any | 1.43% | 1.44% | 1.47% | 1.49% | 1.46% |
Expenses net of all reductions | 1.43% | 1.43% | 1.46% | 1.49% | 1.45% |
Net investment income (loss) | (.42)% | (.69)% | (.62)% | (.15)% | (.40)% |
Supplemental Data | | | | | |
Net assets, end of period (000 omitted) | $ 117,969 | $ 123,606 | $ 100,883 | $ 103,772 | $ 143,237 |
Portfolio turnover rate E | 124% | 125% | 103% | 172% | 134% |
A Total returns would have been lower if certain expenses had not been reduced during the applicable periods shown.
B Total returns do not include the effect of the sales charges.
C Calculated based on average shares outstanding during the period.
D Fees and expenses of any underlying Fidelity Central Funds are not included in the Fund's expense ratio. The Fund indirectly bears its proportionate share of the expenses of any underlying Fidelity Central Funds.
E Amount does not include the portfolio activity of any underlying Fidelity Central Funds.
F Expense ratios reflect operating expenses of the class. Expenses before reductions do not reflect amounts reimbursed by the investment adviser or reductions from brokerage service arrangements or reductions from other expense offset arrangements and do not represent the amount paid by the class during periods when reimbursements or reductions occur. Expenses net of fee waivers reflect expenses after reimbursement by the investment adviser but prior to reductions from brokerage service arrangements or other expense offset arrangements. Expenses net of all reductions represent the net expenses paid by the class.
G Amount represents less than $.01 per share.
See accompanying notes which are an integral part of the financial statements.
Annual Report
Financial Highlights - Class B
Years ended July 31, | 2012 | 2011 | 2010 | 2009 | 2008 |
Selected Per-Share Data | | | | | |
Net asset value, beginning of period | $ 23.15 | $ 17.32 | $ 15.74 | $ 18.27 | $ 21.29 |
Income from Investment Operations | | | | | |
Net investment income (loss) C | (.19) | (.25) | (.20) | (.09) | (.18) |
Net realized and unrealized gain (loss) | 1.23 | 6.08 | 1.78 | (2.07) | (.99) |
Total from investment operations | 1.04 | 5.83 | 1.58 | (2.16) | (1.17) |
Distributions from net realized gain | (2.64) | - | - | (.37) | (1.85) |
Redemption fees added to paid in capital C, G | - | - | - | - | - |
Net asset value, end of period | $ 21.55 | $ 23.15 | $ 17.32 | $ 15.74 | $ 18.27 |
Total Return A, B | 6.78% | 33.66% | 10.04% | (12.07)% | (6.30)% |
Ratios to Average Net Assets D, F | | | | | |
Expenses before reductions | 1.94% | 1.94% | 1.97% | 1.98% | 1.95% |
Expenses net of fee waivers, if any | 1.94% | 1.94% | 1.97% | 1.98% | 1.95% |
Expenses net of all reductions | 1.93% | 1.93% | 1.96% | 1.98% | 1.94% |
Net investment income (loss) | (.93)% | (1.19)% | (1.11)% | (.64)% | (.89)% |
Supplemental Data | | | | | |
Net assets, end of period (000 omitted) | $ 15,403 | $ 20,365 | $ 23,543 | $ 29,381 | $ 55,589 |
Portfolio turnover rate E | 124% | 125% | 103% | 172% | 134% |
A Total returns would have been lower if certain expenses had not been reduced during the applicable periods shown.
B Total returns do not include the effect of the contingent deferred sales charge.
C Calculated based on average shares outstanding during the period.
D Fees and expenses of any underlying Fidelity Central Funds are not included in the Fund's expense ratio. The Fund indirectly bears its proportionate share of the expenses of any underlying Fidelity Central Funds.
E Amount does not include the portfolio activity of any underlying Fidelity Central Funds.
F Expense ratios reflect operating expenses of the class. Expenses before reductions do not reflect amounts reimbursed by the investment adviser or reductions from brokerage service arrangements or reductions from other expense offset arrangements and do not represent the amount paid by the class during periods when reimbursements or reductions occur. Expenses net of fee waivers reflect expenses after reimbursement by the investment adviser but prior to reductions from brokerage service arrangements or other expense offset arrangements. Expenses net of all reductions represent the net expenses paid by the class.
G Amount represents less than $.01 per share.
Financial Highlights - Class C
Years ended July 31, | 2012 | 2011 | 2010 | 2009 | 2008 |
Selected Per-Share Data | | | | | |
Net asset value, beginning of period | $ 23.11 | $ 17.29 | $ 15.70 | $ 18.23 | $ 21.29 |
Income from Investment Operations | | | | | |
Net investment income (loss) C | (.18) | (.24) | (.19) | (.09) | (.17) |
Net realized and unrealized gain (loss) | 1.22 | 6.06 | 1.78 | (2.07) | (1.00) |
Total from investment operations | 1.04 | 5.82 | 1.59 | (2.16) | (1.17) |
Distributions from net realized gain | (2.64) | - | - | (.37) | (1.89) |
Redemption fees added to paid in capital C, G | - | - | - | - | - |
Net asset value, end of period | $ 21.51 | $ 23.11 | $ 17.29 | $ 15.70 | $ 18.23 |
Total Return A, B | 6.80% | 33.66% | 10.13% | (12.09)% | (6.31)% |
Ratios to Average Net Assets D, F | | | | | |
Expenses before reductions | 1.90% | 1.90% | 1.94% | 1.98% | 1.94% |
Expenses net of fee waivers, if any | 1.90% | 1.90% | 1.94% | 1.98% | 1.94% |
Expenses net of all reductions | 1.89% | 1.89% | 1.93% | 1.98% | 1.94% |
Net investment income (loss) | (.89)% | (1.15)% | (1.08)% | (.64)% | (.88)% |
Supplemental Data | | | | | |
Net assets, end of period (000 omitted) | $ 78,763 | $ 77,749 | $ 60,861 | $ 64,002 | $ 83,133 |
Portfolio turnover rate E | 124% | 125% | 103% | 172% | 134% |
A Total returns would have been lower if certain expenses had not been reduced during the applicable periods shown.
B Total returns do not include the effect of the contingent deferred sales charge.
C Calculated based on average shares outstanding during the period.
D Fees and expenses of any underlying Fidelity Central Funds are not included in the Fund's expense ratio. The Fund indirectly bears its proportionate share of the expenses of any underlying Fidelity Central Funds.
E Amount does not include the portfolio activity of any underlying Fidelity Central Funds.
F Expense ratios reflect operating expenses of the class. Expenses before reductions do not reflect amounts reimbursed by the investment adviser or reductions from brokerage service arrangements or reductions from other expense offset arrangements and do not represent the amount paid by the class during periods when reimbursements or reductions occur. Expenses net of fee waivers reflect expenses after reimbursement by the investment adviser but prior to reductions from brokerage service arrangements or other expense offset arrangements. Expenses net of all reductions represent the net expenses paid by the class.
G Amount represents less than $.01 per share.
See accompanying notes which are an integral part of the financial statements.
Annual Report
Financial Highlights - Institutional Class
Years ended July 31, | 2012 | 2011 | 2010 | 2009 | 2008 |
Selected Per-Share Data | | | | | |
Net asset value, beginning of period | $ 26.69 | $ 19.77 | $ 17.78 | $ 20.39 | $ 23.62 |
Income from Investment Operations | | | | | |
Net investment income (loss) B | .03 | (.03) | (.02) | .06 | .03 |
Net realized and unrealized gain (loss) | 1.52 | 6.95 | 2.01 | (2.30) | (1.12) |
Total from investment operations | 1.55 | 6.92 | 1.99 | (2.24) | (1.09) |
Distributions from net realized gain | (2.64) | - | - | (.37) | (2.14) |
Redemption fees added to paid in capital B, F | - | - | - | - | - |
Net asset value, end of period | $ 25.60 | $ 26.69 | $ 19.77 | $ 17.78 | $ 20.39 |
Total Return A | 7.91% | 35.00% | 11.19% | (11.19)% | (5.36)% |
Ratios to Average Net Assets C, E | | | | | |
Expenses before reductions | .89% | .89% | .96% | .98% | .93% |
Expenses net of fee waivers, if any | .89% | .89% | .96% | .98% | .93% |
Expenses net of all reductions | .88% | .88% | .95% | .98% | .92% |
Net investment income (loss) | .12% | (.13)% | (.10)% | .36% | .14% |
Supplemental Data | | | | | |
Net assets, end of period (000 omitted) | $ 40,737 | $ 45,243 | $ 14,172 | $ 13,452 | $ 18,825 |
Portfolio turnover rate D | 124% | 125% | 103% | 172% | 134% |
A Total returns would have been lower if certain expenses had not been reduced during the applicable periods shown.
B Calculated based on average shares outstanding during the period.
C Fees and expenses of any underlying Fidelity Central Funds are not included in the Fund's expense ratio. The Fund indirectly bears its proportionate share of the expenses of any underlying Fidelity Central Funds.
D Amount does not include the portfolio activity of any underlying Fidelity Central Funds.
E Expense ratios reflect operating expenses of the class. Expenses before reductions do not reflect amounts reimbursed by the investment adviser or reductions from brokerage service arrangements or reductions from other expense offset arrangements and do not represent the amount paid by the class during periods when reimbursements or reductions occur. Expenses net of fee waivers reflect expenses after reimbursement by the investment adviser but prior to reductions from brokerage service arrangements or other expense offset arrangements. Expenses net of all reductions represent the net expenses paid by the class.
F Amount represents less than $.01 per share.
See accompanying notes which are an integral part of the financial statements.
Annual Report
Fidelity Advisor Health Care Fund
Notes to Financial Statements
For the period ended July 31, 2012
1. Organization.
Fidelity Advisor Health Care Fund (the Fund) is a fund of Fidelity Advisor Series VII (the Trust) and is authorized to issue an unlimited number of shares. The Trust is registered under the Investment Company Act of 1940, as amended (the 1940 Act), as an open-end management investment company organized as a Massachusetts business trust. The Fund offers Class A, Class T, Class C, and Institutional Class shares, each of which, along with Class B shares, has equal rights as to assets and voting privileges. Effective after the close of business on September 1, 2010, Class B shares were closed to new accounts and additional purchases, except for exchanges and reinvestments. Each class has exclusive voting rights with respect to matters that affect that class. Class B shares will automatically convert to Class A shares after a holding period of seven years from the initial date of purchase. Investment income, realized and unrealized capital gains and losses, the common expenses of the Fund, and certain fund-level expense reductions, if any, are allocated on a pro-rata basis to each class based on the relative net assets of each class to the total net assets of the Fund. Each class differs with respect to transfer agent and distribution and service plan fees incurred. Certain expense reductions may also differ by class.
2. Investments in Fidelity Central Funds.
The Fund invests in Fidelity Central Funds, which are open-end investment companies available only to other investment companies and accounts managed by Fidelity Management & Research Company (FMR) and its affiliates. The Fund's Schedule of Investments lists each of the Fidelity Central Funds held as of period end, if any, as an investment of the Fund, but does not include the underlying holdings of each Fidelity Central Fund. As an Investing Fund, the Fund indirectly bears its proportionate share of the expenses of the underlying Fidelity Central Funds.
The Money Market Central Funds seek preservation of capital and current income and are managed by Fidelity Investments Money Management, Inc. (FIMM), an affiliate of FMR.
A complete unaudited list of holdings for each Fidelity Central Fund is available upon request or at the Securities and Exchange Commission (the SEC) web site at www.sec.gov. In addition, the financial statements of the Fidelity Central Funds, which are not covered by the Fund's Report of Independent Registered Public Accounting Firm, are available on the SEC web site or upon request.
3. Significant Accounting Policies.
The financial statements have been prepared in conformity with accounting principles generally accepted in the United States of America (GAAP), which require management to make certain estimates and assumptions at the date of the financial statements. Actual results could differ from those estimates. Subsequent events, if any, through the date that the financial statements were issued have been evaluated in the preparation of the financial statements. The following summarizes the significant accounting policies of the Fund:
Security Valuation. Investments are valued as of 4:00 p.m. Eastern time on the last calendar day of the period. In accordance with valuation policies and procedures approved by the Board of Trustees (the Board), the Fund attempts to obtain prices from one or more third party pricing vendor or broker to value its investments. When current market prices, quotations or rates are not readily available or reliable, securities will be fair valued in good faith by the FMR Fair Value Committee (the Committee), in accordance with procedures adopted by the Fund's Board. Factors used in determining fair value vary by security type and may include market or security specific events. The frequency with which these procedures are used cannot be predicted and they may be utilized to a significant extent. The Committee oversees the Fund's valuation policies and procedures and is responsible for approving and reporting to the Board all fair value determinations.
The Fund categorizes the inputs to valuation techniques used to value its investments into a disclosure hierarchy consisting of three levels as shown below:
Level 1 - quoted prices in active markets for identical investments
Level 2 - other significant observable inputs (including quoted prices for similar investments, interest rates, prepayment speeds, etc.)
Level 3 - unobservable inputs (including the Fund's own assumptions based on the best information available)
Valuation techniques used to value the Fund's investments by major category are as follows:
Equity securities, including restricted securities, for which market quotations are readily available, are valued at the last reported sale price or official closing price as reported by a third party pricing vendor on the primary market or exchange on which they are traded and are categorized as Level 1 in the hierarchy. In the event there were no sales during the day or closing prices are not available, securities are valued at the last quoted bid price or may be valued using the last available price and are generally categorized as Level 2 in the hierarchy. For foreign equity securities, when significant market or security specific events arise, comparisons to the valuation of American Depositary Receipts (ADRs), futures contracts, Exchange-Traded Funds (ETFs) and certain indexes as well as quoted prices for similar securities are used and are categorized as Level 2 in the hierarchy. Utilizing these techniques may result in transfers between Level 1 and Level 2. For restricted equity securities and private placements where observable inputs are limited, assumptions about market activity and risk are used and these securities are categorized as Level 3 in the hierarchy.
Annual Report
3. Significant Accounting Policies - continued
Security Valuation - continued
Investments in open-end mutual funds, including the Fidelity Central Funds, are valued at their closing net asset value each business day and are categorized as Level 1 in the hierarchy.
Changes in valuation techniques may result in transfers in or out of an assigned level within the disclosure hierarchy. The aggregate value of investments by input level, as of July 31, 2012, is included at the end of the Fund's Schedule of Investments.
Foreign Currency Translation. The Fund may use foreign currency contracts to facilitate transactions in foreign-denominated securities. Gains and losses from these transactions may arise from changes in the value of the foreign currency or if the counterparties do not perform under the contracts' terms.
Foreign-denominated assets, including investment securities, and liabilities are translated into U.S. dollars at the exchange rates at period end. Purchases and sales of investment securities, income and dividends received and expenses denominated in foreign currencies are translated into U.S. dollars at the exchange rate in effect on the transaction date.
The effects of exchange rate fluctuations on investments are included with the net realized and unrealized gain (loss) on investment securities. Other foreign currency transactions resulting in realized and unrealized gain (loss) are disclosed separately.
Investment Transactions and Income. For financial reporting purposes, the Fund's investment holdings and NAV include trades executed through the end of the last business day of the period. The NAV per share for processing shareholder transactions is calculated as of the close of business of the New York Stock Exchange (NYSE), normally 4:00 p.m. Eastern time and includes trades executed through the end of the prior business day. Gains and losses on securities sold are determined on the basis of identified cost and may include proceeds received from litigation. Dividend income is recorded on the ex-dividend date, except for certain dividends from foreign securities where the ex-dividend date may have passed, which are recorded as soon as the Fund is informed of the ex-dividend date. Non-cash dividends included in dividend income, if any, are recorded at the fair market value of the securities received. Distributions received on securities that represent a return of capital or capital gain are recorded as a reduction of cost of investments and/or as a realized gain. The Fund estimates the components of distributions received that may be considered return of capital distributions or capital gain distributions. Interest income and distributions from the Fidelity Central Funds are accrued as earned. Interest income includes coupon interest and amortization of premium and accretion of discount on debt securities. Investment income is recorded net of foreign taxes withheld where recovery of such taxes is uncertain.
Expenses. Expenses directly attributable to a fund are charged to that fund. Expenses attributable to more than one fund are allocated among the respective funds on the basis of relative net assets or other appropriate methods. Expense estimates are accrued in the period to which they relate and adjustments are made when actual amounts are known.
Income Tax Information and Distributions to Shareholders. Each year, the Fund intends to qualify as a regulated investment company under Subchapter M of the Internal Revenue Code, including distributing substantially all of its taxable income and realized gains. As a result, no provision for income taxes is required. As of July 31, 2012, the Fund did not have any unrecognized tax benefits in the financial statements; nor is the Fund aware of any tax positions for which it is reasonably possible that the total amounts of unrecognized tax benefits will significantly change in the next twelve months. The Fund files a U.S. federal tax return, in addition to state and local tax returns as required. A fund's federal income tax returns are subject to examination by the Internal Revenue Service (IRS) for a period of three fiscal years after they are filed. State and local tax returns may be subject to examination for an additional fiscal year depending on the jurisdiction. Foreign taxes are provided for based on the Fund's understanding of the tax rules and rates that exist in the foreign markets in which it invests.
Distributions are declared and recorded on the ex-dividend date. Income dividends and capital gain distributions are declared separately for each class. Income and capital gain distributions are determined in accordance with income tax regulations, which may differ from GAAP. In addition, the Fund claimed a portion of the payment made to redeeming shareholders as a distribution for income tax purposes.
Capital accounts within the financial statements are adjusted for permanent book-tax differences. These adjustments have no impact on net assets or the results of operations. Temporary book-tax differences will reverse in a subsequent period.
Book-tax differences are primarily due to foreign currency transactions, deferred trustees compensation, net operating losses and losses deferred due to wash sales and excise tax regulations.
Annual Report
Fidelity Advisor Health Care Fund
Notes to Financial Statements - continued
3. Significant Accounting Policies - continued
Income Tax Information and Distributions to Shareholders - continued
The federal tax cost of investment securities and unrealized appreciation (depreciation) as of period end were as follows:
Gross unrealized appreciation | $ 86,591,704 |
Gross unrealized depreciation | (18,346,447) |
Net unrealized appreciation (depreciation) on securities and other investments | $ 68,245,257 |
| |
Tax Cost | $ 437,061,273 |
The tax-based components of distributable earnings as of period end were as follows:
Undistributed long-term capital gain | $ 39,297,133 |
Net unrealized appreciation (depreciation) | $ 68,244,483 |
The tax character of distributions paid was as follows:
| July 31, 2012 | July 31, 2011 |
Long-term Capital Gains | $ 49,973,824 | $ - |
Short-Term Trading (Redemption) Fees. Shares held by investors in the Fund less than 30 days are subject to a redemption fee equal to .75% of the net asset value of shares redeemed. All redemption fees, which reduce the proceeds of the shareholder redemption, are retained by the Fund and accounted for as an addition to paid in capital.
New Accounting Pronouncement. In December 2011, the Financial Accounting Standards Board issued Accounting Standard Update No. 2011-11, Disclosures about Offsetting Assets and Liabilities. The update creates new disclosure requirements requiring entities to disclose both gross and net information for derivatives and other financial instruments that are either offset in the Statement of Assets and Liabilities or subject to an enforceable master netting arrangement or similar agreement. The disclosure requirements are effective for interim and annual reporting periods beginning on or after January 1, 2013. Management is currently evaluating the impact of the update's adoption on the Fund's financial statement disclosures.
4. Operating Policies.
Restricted Securities. The Fund may invest in securities that are subject to legal or contractual restrictions on resale. These securities generally may be resold in transactions exempt from registration or to the public if the securities are registered. Disposal of these securities may involve time-consuming negotiations and expense, and prompt sale at an acceptable price may be difficult. Information regarding restricted securities is included at the end of the Fund's Schedule of Investments.
5. Purchases and Sales of Investments.
Purchases and sales of securities, other than short-term securities, aggregated $554,995,838 and $588,629,052, respectively.
6. Fees and Other Transactions with Affiliates.
Management Fee. FMR and its affiliates provide the Fund with investment management related services for which the Fund pays a monthly management fee. The management fee is the sum of an individual fund fee rate that is based on an annual rate of .30% of the Fund's average net assets and an annualized group fee rate that averaged .26% during the period. The group fee rate is based upon the average net assets of all the mutual funds advised by FMR. The group fee rate decreases as assets under management increase and increases as assets under management decrease. For the period, the total annual management fee rate was .56% of the Fund's average net assets.
Distribution and Service Plan Fees. In accordance with Rule 12b-1 of the 1940 Act, the Fund has adopted separate Distribution and Service Plans for each class of shares. Certain classes pay Fidelity Distributors Corporation (FDC), an affiliate of FMR, separate Distribution and Service Fees, each of which is based on an annual percentage of each class' average net assets. In addition, FDC may pay financial intermediaries for selling shares of the Fund and providing shareholder support services. For the period, the Distribution and Service Fee rates, total fees and amounts retained by FDC were as follows:
Annual Report
6. Fees and Other Transactions with Affiliates - continued
Distribution and Service Plan Fees - continued
| Distribution
Fee | Service
Fee | Total Fees | Retained
by FDC |
Class A | -% | .25% | $ 537,320 | $ 1,123 |
Class T | .25% | .25% | 569,064 | 890 |
Class B | .75% | .25% | 167,239 | 125,852 |
Class C | .75% | .25% | 734,711 | 48,788 |
| | | $ 2,008,334 | $ 176,653 |
Sales Load. FDC may receive a front-end sales charge of up to 5.75% for selling Class A shares and 3.50% for selling Class T shares, some of which is paid to financial intermediaries for selling shares of the Fund. Depending on the holding period, FDC may receive contingent deferred sales charges levied on Class A, Class T, Class B, and Class C redemptions. The deferred sales charges range from 5.00% to 1.00% for Class B shares, 1.00% for Class C shares, 1.00% for certain purchases of Class A shares and .25% for certain purchases of Class T shares.
For the period, sales charge amounts retained by FDC were as follows:
| Retained
by FDC |
Class A | $ 54,936 |
Class T | 17,051 |
Class B* | 14,725 |
Class C* | 3,070 |
| $ 89,782 |
* When Class B and Class C shares are initially sold, FDC pays commissions from its own resources to financial intermediaries through which the sales are made.
Transfer Agent Fees. Fidelity Investments Institutional Operations Company, Inc. (FIIOC), an affiliate of FMR, is the transfer, dividend disbursing and shareholder servicing agent for each class of the Fund. FIIOC receives account fees and asset-based fees that vary according to the account size and type of account of the shareholders of the respective classes of the Fund. FIIOC pays for typesetting, printing and mailing of shareholder reports, except proxy statements. For the period, transfer agent fees for each class were as follows:
| Amount | % of
Average
Net Assets |
Class A | $ 640,462 | .30 |
Class T | 338,721 | .30 |
Class B | 50,327 | .30 |
Class C | 190,872 | .26 |
Institutional Class | 90,232 | .26 |
| $ 1,310,614 | |
Accounting and Security Lending Fees. Fidelity Service Company, Inc. (FSC), an affiliate of FMR, maintains the Fund's accounting records. The accounting fee is based on the level of average net assets for each month. Under a separate contract, FSC administers the security lending program. The security lending fee is based on the number and duration of lending transactions.
Brokerage Commissions. The Fund placed a portion of its portfolio transactions with brokerage firms which are affiliates of the investment adviser. The commissions paid to these affiliated firms were $8,183 for the period.
7. Committed Line of Credit.
The Fund participates with other funds managed by FMR or an affiliate in a $4.25 billion credit facility (the "line of credit") to be utilized for temporary or emergency purposes to fund shareholder redemptions or for other short-term liquidity purposes. The Fund has agreed to pay commitment fees on its pro-rata portion of the line of credit, which amounted to $1,284 and is reflected in Miscellaneous expenses on the Statement of Operations. During the period, there were no borrowings on this line of credit.
Annual Report
Fidelity Advisor Health Care Fund
Notes to Financial Statements - continued
8. Security Lending.
The Fund lends portfolio securities through a lending agent from time to time in order to earn additional income. For equity securities, a lending agent is used and may loan securities to certain qualified borrowers, including Fidelity Capital Markets (FCM), a broker-dealer affiliated with the Fund. On the settlement date of the loan, the Fund receives collateral (in the form of U.S. Treasury obligations, letters of credit and/or cash) against the loaned securities and maintains collateral in an amount not less than 100% of the market value of the loaned securities during the period of the loan. The market value of the loaned securities is determined at the close of business of the Fund and any additional required collateral is delivered to the Fund on the next business day. If the borrower defaults on its obligation to return the securities loaned because of insolvency or other reasons, a fund could experience delays and costs in recovering the securities loaned or in gaining access to the collateral. Any cash collateral received is invested in the Fidelity Securities Lending Cash Central Fund. The value of loaned securities and cash collateral at period end are disclosed on the Fund's Statement of Assets and Liabilities. At period end, there were no security loans outstanding with FCM. Security lending income represents the income earned on investing cash collateral, less rebates paid to borrowers and any lending agent fees associated with the loan, plus any premium payments received for lending certain types of securities. Security lending income is presented in the Statement of Operations as a component of income from Fidelity Central Funds. Total security lending income during the period amounted to $105,759, including $1,420 from securities loaned to FCM.
9. Expense Reductions.
Many of the brokers with whom FMR places trades on behalf of the Fund provided services to the Fund in addition to trade execution. These services included payments of certain expenses on behalf of the Fund totaling $38,372 for the period. In addition, through arrangements with the Fund's custodian, credits realized as a result of uninvested cash balances were used to reduce the Fund's expenses. During the period, these credits reduced the Fund's custody expenses by $23.
10. Distributions to Shareholders.
Distributions to shareholders of each class were as follows:
Years ended July 31, | 2012 | 2011 |
From net realized gain | | |
Class A | $ 22,638,273 | $ - |
Class T | 12,838,928 | - |
Class B | 2,229,080 | - |
Class C | 8,852,071 | - |
Institutional Class | 3,415,472 | - |
Total | $ 49,973,824 | $ - |
11. Share Transactions.
Transactions for each class of shares were as follows:
| Shares | Dollars |
Years ended July 31, | 2012 | 2011 | 2012 | 2011 |
Class A | | | | |
Shares sold | 2,109,585 | 2,257,884 | $ 48,063,125 | $ 55,506,569 |
Reinvestment of distributions | 974,579 | - | 19,679,030 | - |
Shares redeemed | (2,283,119) | (2,927,010) | (51,867,480) | (69,236,135) |
Net increase (decrease) | 801,045 | (669,126) | $ 15,874,675 | $ (13,729,566) |
Class T | | | | |
Shares sold | 517,207 | 610,720 | $ 11,288,178 | $ 14,273,371 |
Reinvestment of distributions | 626,615 | - | 12,200,296 | - |
Shares redeemed | (1,091,618) | (1,090,770) | (23,806,614) | (24,737,327) |
Net increase (decrease) | 52,204 | (480,050) | $ (318,140) | $ (10,463,956) |
Class B | | | | |
Shares sold | 73,881 | 46,091 | $ 1,480,151 | $ 1,030,863 |
Reinvestment of distributions | 107,208 | - | 1,929,279 | - |
Shares redeemed | (345,800) | (525,569) | (6,952,570) | (10,871,447) |
Net increase (decrease) | (164,711) | (479,478) | $ (3,543,140) | $ (9,840,584) |
Annual Report
11. Share Transactions - continued
| Shares | Dollars |
Years ended July 31, | 2012 | 2011 | 2012 | 2011 |
Class C | | | | |
Shares sold | 610,790 | 524,474 | $ 12,332,347 | $ 11,843,311 |
Reinvestment of distributions | 406,182 | - | 7,293,865 | - |
Shares redeemed | (719,664) | (681,222) | (14,281,889) | (14,258,065) |
Net increase (decrease) | 297,308 | (156,748) | $ 5,344,323 | $ (2,414,754) |
Institutional Class | | | | |
Shares sold | 969,515 | 1,277,086 | $ 23,079,181 | $ 33,336,034 |
Reinvestment of distributions | 134,306 | - | 2,842,866 | - |
Shares redeemed | (1,207,175) | (299,253) | (28,307,610) | (7,601,785) |
Net increase (decrease) | (103,354) | 977,833 | $ (2,385,563) | $ 25,734,249 |
12. Other.
The Fund's organizational documents provide former and current trustees and officers with a limited indemnification against liabilities arising in connection with the performance of their duties to the Fund. In the normal course of business, the Fund may also enter into contracts that provide general indemnifications. The Fund's maximum exposure under these arrangements is unknown as this would be dependent on future claims that may be made against the Fund. The risk of material loss from such claims is considered remote.
Annual Report
Fidelity Advisor Industrials Fund - Class A, T, B, and C
Performance: The Bottom Line
Average annual total return reflects the change in the value of an investment, assuming reinvestment of the class' distributions from dividend income and capital gains (the profits earned upon the sale of securities that have grown in value, if any) and assuming a constant rate of performance each year. The $10,000 table and the fund's returns do not reflect the deduction of taxes that a shareholder would pay on fund distributions or the redemption of fund shares. During periods of reimbursement by Fidelity, a fund's total return will be greater than it would be had the reimbursement not occurred. How a fund did yesterday is no guarantee of how it will do tomorrow. Returns reflect the conversion of Class B shares to Class A shares after a maximum of seven years.
Average Annual Total Returns
Periods ended July 31, 2012 | Past 1
year | Past 5
years | Past 10
years |
Class A (incl. 5.75% sales charge)C | -2.53% | 1.98% | 10.28% |
Class T (incl. 3.50% sales charge)C | -0.46% | 2.20% | 10.27% |
Class B (incl. contingent deferred sales charge) A, C | -2.41% | 2.02% | 10.34% |
Class C (incl. contingent deferred sales charge) B, C | 1.67% | 2.43% | 10.12% |
A Class B shares contingent deferred sales charges included in the past one year, past five years, and past ten years total return figures are 5%, 2%, and 0%, respectively.
B Class C shares' contingent deferred sales charges included in the past one year, past five years, and past ten years total return figures are 1%, 0%, and 0%, respectively.
C Prior to October 1, 2006, Fidelity Advisor Industrials Fund operated under certain different investment policies. The historical performance for the fund may not represent its current investment policies.
$10,000 Over 10 Years
Let's say hypothetically that $10,000 was invested in Fidelity Advisor Industrials Fund - Class A on July 31, 2002, and the current 5.75% sales charge was paid. The chart shows how the value of your investment would have changed, and also shows how the S&P 500 Index performed over the same period.

Annual Report
Fidelity Advisor Industrials Fund
Market Recap: Major U.S. equity benchmarks posted solid gains for the year ending July 31, 2012, amid an uncertain investment environment. The broad-based S&P 500® Index returned 9.13%, while the blue-chip-laden Dow Jones Industrial AverageSM and technology-heavy Nasdaq Composite® Index gained 10.12% and 7.83%, respectively. Volatility spiked during the period's first half, as equities plummeted late last summer on Europe's debt woes, political wrangling over the U.S. debt ceiling and the sovereign credit-rating downgrade that followed. By October, a seemingly improved U.S. economy rejuvenated stocks, paving the way for major equity benchmarks to post their best first-quarter performance since 1998. However, more eurozone trouble, signs that the U.S. economy had turned sluggish and a slowdown in China caused stocks to slip in May, before a new wave of optimism took hold in June and July. Within the S&P 500®, more-defensive sectors such as telecommunication services (+30%) and consumer staples (+20%) fared best, while materials and energy significantly underperformed, returning -5%. Small- and mid-cap stocks trailed their less-volatile large-cap counterparts, with the Russell 2000® Index adding 0.19% and the Russell Midcap® Index rising 2.28%. Given turmoil and local currency weakness in Europe, foreign developed-markets stocks lost ground, with the MSCI® EAFE® Index returning -11.32%.
Comments from Tobias Welo, Portfolio Manager of Fidelity Advisor® Industrials Fund: For the year, the fund's Class A, Class T, Class B and Class C shares returned 3.42%, 3.15%, 2.59% and 2.67%, respectively (excluding sales charges), trailing the 5.07% gain of the MSCI® U.S. IM Industrials 25/50 Index and also lagging the S&P 500®. Versus the MSCI index, overweighting the construction/engineering group worked against relative performance, as did stock picking in trading companies/distributors and building products. A modest cash position hampered results as well. Shares of GrafTech International, a maker of graphite electrodes used in steel mini-mills, performed poorly, suffering from tepid overall demand for steel that caused the company to lower its first-quarter and fiscal 2012 earnings estimates. Our stake in India-based Jain Irrigation Systems also suffered a significant decline in value during the period. In my view, it was more due to adverse credit and market conditions than deterioration in company fundamentals. That said, I sold this stock during the period. Similarly, Italy-based Fiat Industrial, a manufacturer of trucks and tractors, suffered because of investor anxiety over that nation's debt woes. Jain Irrigation Systems and Fiat Industrial were out-of-benchmark positions. Building products maker Owens Corning also detracted, as a relatively benign storm season and higher raw materials costs trumped signs of recovery in the housing market. Further curbing our results was a sizable overweighting in Foster Wheeler, a construction/engineering firm specializing in large projects for companies in the energy and power industries. I liquidated this position. Lastly, the fund's foreign investments hurt, driven in part by a stronger U.S. dollar. Conversely, stock selection and an underweighting in the aerospace and defense group jointly were a significant positive factor. Within that segment, I continued to emphasize commercial aerospace stocks and underweight defense shares. One individual standout was aerospace components supplier Goodrich, the fund's top relative contributor. The stock surged higher in September 2011 after the company received a lucrative takeover bid from United Technologies, and I sold Goodrich during the period to lock in profits. A large underweighting in index heavyweight Caterpillar - which also was not held at period end - was timely. As we entered 2012, expectations for Cat were high, and I thought the company's exposure to decelerating emerging markets might limit the stock's upside potential. This analysis turned out to be on target. Strategic information provider IHS saw its shares advance smartly amid upwardly revised earnings and revenue guidance during the period. Heavily overweighting building products supplier Armstrong World Industries early in the period, when its stock was strong, also bolstered performance. I sold Armstrong in June.
The views expressed above reflect those of the portfolio manager(s) only through the end of the period as stated on the cover of this report and do not necessarily represent the views of Fidelity or any other person in the Fidelity organization. Any such views are subject to change at any time based upon market or other conditions and Fidelity disclaims any responsibility to update such views. These views may not be relied on as investment advice and, because investment decisions for a Fidelity fund are based on numerous factors, may not be relied on as an indication of trading intent on behalf of any Fidelity fund.
Annual Report
Fidelity Advisor Industrials Fund
As a shareholder of the Fund, you incur two types of costs: (1) transaction costs, including sales charges (loads) on purchase payments or redemption proceeds, redemption fees and (2) ongoing costs, including management fees, distribution and/or service (12b-1) fees and other Fund expenses. This Example is intended to help you understand your ongoing costs (in dollars) of investing in the Fund and to compare these costs with the ongoing costs of investing in other mutual funds.
The Example is based on an investment of $1,000 invested at the beginning of the period and held for the entire period (February 1, 2012 to July 31, 2012).
Actual Expenses
The first line of the accompanying table for each class of the Fund provides information about actual account values and actual expenses. You may use the information in this line, together with the amount you invested, to estimate the expenses that you paid over the period. Simply divide your account value by $1,000.00 (for example, an $8,600 account value divided by $1,000.00 = 8.6), then multiply the result by the number in the first line for a class of the Fund under the heading entitled "Expenses Paid During Period" to estimate the expenses you paid on your account during this period. In addition, the Fund, as a shareholder in the underlying Fidelity Central Funds, will indirectly bear its pro-rata share of the fees and expenses incurred by the underlying Fidelity Central Funds. These fees and expenses are not included in the Fund's annualized expense ratio used to calculate the expense estimate in the table below.
Hypothetical Example for Comparison Purposes
The second line of the accompanying table for each class of the Fund provides information about hypothetical account values and hypothetical expenses based on a Class' actual expense ratio and an assumed rate of return of 5% per year before expenses, which is not the Class' actual return. The hypothetical account values and expenses may not be used to estimate the actual ending account balance or expenses you paid for the period. You may use this information to compare the ongoing costs of investing in the Fund and other funds. To do so, compare this 5% hypothetical example with the 5% hypothetical examples that appear in the shareholder reports of the other funds. In addition, the Fund, as a shareholder in the underlying Fidelity Central Funds, will indirectly bear its pro-rata share of the fees and expenses incurred by the underlying Fidelity Central Funds. These fees and expenses are not included in the Fund's annualized expense ratio used to calculate the expense estimate in the table below.
Please note that the expenses shown in the table are meant to highlight your ongoing costs only and do not reflect any transaction costs. Therefore, the second line of the table is useful in comparing ongoing costs only, and will not help you determine the relative total costs of owning different funds. In addition, if these transactional costs were included, your costs would have been higher.
| Annualized Expense Ratio | Beginning
Account Value
February 1, 2012 | Ending
Account Value
July 31, 2012 | Expenses Paid
During Period*
February 1, 2012
to July 31, 2012 |
Class A | 1.12% | | | |
Actual | | $ 1,000.00 | $ 1,000.40 | $ 5.57 |
HypotheticalA | | $ 1,000.00 | $ 1,019.29 | $ 5.62 |
Class T | 1.38% | | | |
Actual | | $ 1,000.00 | $ 999.20 | $ 6.86 |
HypotheticalA | | $ 1,000.00 | $ 1,018.00 | $ 6.92 |
Class B | 1.93% | | | |
Actual | | $ 1,000.00 | $ 996.30 | $ 9.58 |
HypotheticalA | | $ 1,000.00 | $ 1,015.27 | $ 9.67 |
Class C | 1.87% | | | |
Actual | | $ 1,000.00 | $ 996.70 | $ 9.28 |
HypotheticalA | | $ 1,000.00 | $ 1,015.56 | $ 9.37 |
Institutional Class | .84% | | | |
Actual | | $ 1,000.00 | $ 1,001.80 | $ 4.18 |
HypotheticalA | | $ 1,000.00 | $ 1,020.69 | $ 4.22 |
A 5% return per year before expenses
* Expenses are equal to each Class' annualized expense ratio, multiplied by the average account value over the period, multiplied by 182/366 (to reflect the one-half year period).
Annual Report
Fidelity Advisor Industrials Fund
Investment Changes (Unaudited)
Top Ten Stocks as of July 31, 2012 |
| % of fund's
net assets | % of fund's net assets
6 months ago |
General Electric Co. | 15.0 | 11.7 |
United Technologies Corp. | 6.0 | 6.1 |
3M Co. | 4.7 | 3.8 |
Danaher Corp. | 3.9 | 3.9 |
Union Pacific Corp. | 3.8 | 3.8 |
Honeywell International, Inc. | 3.4 | 3.1 |
Cummins, Inc. | 3.2 | 3.0 |
Tyco International Ltd. | 2.5 | 2.3 |
Emerson Electric Co. | 2.4 | 3.3 |
Textron, Inc. | 2.4 | 2.1 |
| 47.3 | |
Top Industries (% of fund's net assets) |
As of July 31, 2012 |
| Industrial Conglomerates | 27.0% | |
| Machinery | 19.1% | |
| Aerospace & Defense | 13.9% | |
| Electrical Equipment | 7.6% | |
| Road & Rail | 7.4% | |
| All Others* | 25.0% | |

As of January 31, 2012 |
| Industrial Conglomerates | 22.4% | |
| Machinery | 19.9% | |
| Aerospace & Defense | 12.9% | |
| Electrical Equipment | 11.4% | |
| Road & Rail | 7.0% | |
| All Others* | 26.4% | |

* Includes short-term investments and net other assets. |
Annual Report
Fidelity Advisor Industrials Fund
Investments July 31, 2012
Showing Percentage of Net Assets
Common Stocks - 94.2% |
| Shares | | Value |
AEROSPACE & DEFENSE - 13.8% |
Aerospace & Defense - 13.8% |
Esterline Technologies Corp. (a) | 38,317 | | $ 2,249,974 |
Honeywell International, Inc. | 228,312 | | 13,253,512 |
Rockwell Collins, Inc. | 51,097 | | 2,583,975 |
Teledyne Technologies, Inc. (a) | 44,900 | | 2,797,270 |
Textron, Inc. | 351,618 | | 9,159,649 |
United Technologies Corp. | 307,658 | | 22,902,062 |
| | 52,946,442 |
AIR FREIGHT & LOGISTICS - 2.4% |
Air Freight & Logistics - 2.4% |
United Parcel Service, Inc. Class B | 120,222 | | 9,089,985 |
BUILDING PRODUCTS - 1.1% |
Building Products - 1.1% |
Owens Corning (a) | 159,686 | | 4,289,166 |
COMMERCIAL SERVICES & SUPPLIES - 2.7% |
Diversified Support Services - 0.3% |
Aggreko PLC | 29,500 | | 944,457 |
Copart, Inc. (a) | 5,100 | | 121,176 |
| | 1,065,633 |
Environmental & Facility Services - 1.5% |
Republic Services, Inc. | 198,565 | | 5,744,485 |
Office Services & Supplies - 0.4% |
Mine Safety Appliances Co. | 44,211 | | 1,517,322 |
Security & Alarm Services - 0.5% |
Corrections Corp. of America | 67,101 | | 2,085,499 |
TOTAL COMMERCIAL SERVICES & SUPPLIES | | 10,412,939 |
CONSTRUCTION & ENGINEERING - 4.5% |
Construction & Engineering - 4.5% |
AECOM Technology Corp. (a) | 249,768 | | 4,048,739 |
EMCOR Group, Inc. | 164,559 | | 4,332,838 |
Jacobs Engineering Group, Inc. (a) | 131,587 | | 5,075,311 |
MasTec, Inc. (a) | 71,998 | | 1,149,088 |
Quanta Services, Inc. (a) | 120,350 | | 2,766,847 |
| | 17,372,823 |
ELECTRICAL EQUIPMENT - 7.6% |
Electrical Components & Equipment - 7.6% |
AMETEK, Inc. | 198,600 | | 6,156,600 |
Emerson Electric Co. | 197,171 | | 9,418,859 |
GrafTech International Ltd. (a) | 238,900 | | 2,496,505 |
Hubbell, Inc. Class B | 60,231 | | 4,955,807 |
Prysmian SpA | 126,076 | | 2,027,470 |
Regal-Beloit Corp. | 67,617 | | 4,352,506 |
| | 29,407,747 |
|
| Shares | | Value |
INDUSTRIAL CONGLOMERATES - 27.0% |
Industrial Conglomerates - 27.0% |
3M Co. | 195,961 | | $ 17,877,522 |
Carlisle Companies, Inc. | 69,494 | | 3,508,752 |
Danaher Corp. | 286,682 | | 15,139,676 |
General Electric Co. | 2,772,584 | | 57,531,119 |
Tyco International Ltd. | 177,514 | | 9,752,619 |
| | 103,809,688 |
MACHINERY - 19.1% |
Construction & Farm Machinery & Heavy Trucks - 6.0% |
Cummins, Inc. | 128,654 | | 12,337,919 |
Deere & Co. | 65,000 | | 4,993,300 |
Fiat Industrial SpA | 101,600 | | 1,000,069 |
Manitowoc Co., Inc. (d) | 397,464 | | 4,769,568 |
| | 23,100,856 |
Industrial Machinery - 13.1% |
Actuant Corp. Class A | 85,160 | | 2,423,654 |
Dover Corp. | 78,640 | | 4,283,521 |
Flowserve Corp. | 29,600 | | 3,551,408 |
Graco, Inc. | 77,426 | | 3,552,305 |
Illinois Tool Works, Inc. | 156,629 | | 8,511,220 |
Ingersoll-Rand PLC | 114,947 | | 4,874,902 |
Pall Corp. | 78,861 | | 4,211,966 |
Parker Hannifin Corp. | 74,642 | | 5,995,245 |
SPX Corp. | 27,100 | | 1,645,512 |
Timken Co. | 63,312 | | 2,291,894 |
TriMas Corp. (a) | 182,602 | | 3,969,767 |
Valmont Industries, Inc. | 40,322 | | 4,995,089 |
| | 50,306,483 |
TOTAL MACHINERY | | 73,407,339 |
MARINE - 0.5% |
Marine - 0.5% |
Kirby Corp. (a) | 36,425 | | 1,922,147 |
PROFESSIONAL SERVICES - 5.1% |
Human Resource & Employment Services - 1.9% |
Manpower, Inc. | 75,801 | | 2,697,000 |
Towers Watson & Co. | 82,599 | | 4,842,779 |
| | 7,539,779 |
Research & Consulting Services - 3.2% |
Bureau Veritas SA | 32,375 | | 2,863,282 |
Dun & Bradstreet Corp. | 39,376 | | 3,157,561 |
IHS, Inc. Class A (a) | 48,574 | | 5,356,255 |
Nielsen Holdings B.V. (a) | 30,700 | | 874,950 |
| | 12,252,048 |
TOTAL PROFESSIONAL SERVICES | | 19,791,827 |
Common Stocks - continued |
| Shares | | Value |
ROAD & RAIL - 7.4% |
Railroads - 6.4% |
CSX Corp. | 329,998 | | $ 7,570,154 |
Genesee & Wyoming, Inc. Class A (a) | 42,999 | | 2,668,518 |
Union Pacific Corp. | 118,352 | | 14,511,139 |
| | 24,749,811 |
Trucking - 1.0% |
J.B. Hunt Transport Services, Inc. | 56,411 | | 3,103,733 |
Quality Distribution, Inc. (a) | 51,256 | | 517,686 |
| | 3,621,419 |
TOTAL ROAD & RAIL | | 28,371,230 |
TRADING COMPANIES & DISTRIBUTORS - 2.6% |
Trading Companies & Distributors - 2.6% |
W.W. Grainger, Inc. | 16,800 | | 3,441,144 |
Watsco, Inc. | 46,300 | | 3,145,622 |
WESCO International, Inc. (a) | 63,484 | | 3,536,694 |
| | 10,123,460 |
TRANSPORTATION INFRASTRUCTURE - 0.4% |
Airport Services - 0.4% |
Wesco Aircraft Holdings, Inc. (a) | 128,140 | | 1,710,669 |
TOTAL COMMON STOCKS (Cost $320,914,536) | 362,655,462 |
Convertible Preferred Stocks - 0.1% |
| | | |
AEROSPACE & DEFENSE - 0.1% |
Aerospace & Defense - 0.1% |
United Technologies Corp. 7.50%
(Cost $405,000) | 8,100 | | 427,275 |
Convertible Bonds - 0.5% |
| Principal Amount | | |
BUILDING PRODUCTS - 0.5% |
Building Products - 0.5% |
Aspen Aerogels, Inc.: | | | | |
8% 6/1/14 (f) | | $ 1,041,431 | | 1,041,431 |
8% 12/6/14 (f) | | 850,700 | | 850,700 |
8% 12/6/14 (f) | | 182,200 | | 182,200 |
TOTAL CONVERTIBLE BONDS (Cost $2,074,332) | | 2,074,331 |
U.S. Treasury Obligations - 0.1% |
|
U.S. Treasury Bills, yield at date of purchase 0.08% 8/23/12 (e)
(Cost $269,986) | | 270,000 | | 269,991 |
Money Market Funds - 6.1% |
| Shares | | Value |
Fidelity Cash Central Fund, 0.17% (b) | 22,495,521 | | $ 22,495,521 |
Fidelity Securities Lending Cash Central Fund, 0.18% (b)(c) | 1,087,800 | | 1,087,800 |
TOTAL MONEY MARKET FUNDS (Cost $23,583,321) | 23,583,321 |
TOTAL INVESTMENT PORTFOLIO - 101.0% (Cost $347,247,175) | | 389,010,380 |
NET OTHER ASSETS (LIABILITIES) - (1.0)% | | (3,821,377) |
NET ASSETS - 100% | $ 385,189,003 |
Futures Contracts |
| Expiration Date | | Underlying Face Amount at Value | | Unrealized Appreciation/(Depreciation) |
Purchased |
Equity Index Contracts |
120 CME E-mini Industrial Select Sector Index Contracts | Sept. 2012 | | $ 4,274,400 | | $ 195,061 |
|
The face value of futures purchased as a percentage of net assets is 1.1% |
Legend |
(a) Non-income producing |
(b) Affiliated fund that is available only to investment companies and other accounts managed by Fidelity Investments. The rate quoted is the annualized seven-day yield of the fund at period end. A complete unaudited listing of the fund's holdings as of its most recent quarter end is available upon request. In addition, each Fidelity Central Fund's financial statements, which are not covered by the Fund's Report of Independent Registered Public Accounting Firm, are available on the SEC's website or upon request. |
(c) Investment made with cash collateral received from securities on loan. |
(d) Security or a portion of the security is on loan at period end. |
(e) Security or a portion of the security was pledged to cover margin requirements for futures contracts. At the period end, the value of securities pledged amounted to $269,991. |
(f) Restricted securities - Investment in securities not registered under the Securities Act of 1933 (excluding 144A issues). At the end of the period, the value of restricted securities (excluding 144A issues) amounted to $2,074,331 or 0.5% of net assets. |
Additional information on each restricted holding is as follows: |
Security | Acquisition Date | Acquisition Cost |
Aspen Aerogels, Inc. 8% 6/1/14 | 6/14/11 | $ 1,041,431 |
Aspen Aerogels, Inc. 8% 12/6/14 | 12/6/11 - 6/12/12 | $ 1,032,900 |
Affiliated Central Funds |
Information regarding fiscal year to date income earned by the Fund from investments in Fidelity Central Funds is as follows: |
Fund | Income earned |
Fidelity Cash Central Fund | $ 16,137 |
Fidelity Securities Lending Cash Central Fund | 30,165 |
Total | $ 46,302 |
Other Information |
The following is a summary of the inputs used, as of July 31, 2012, involving the Fund's assets and liabilities carried at fair value. The inputs or methodology used for valuing securities may not be an indication of the risk associated with investing in those securities. For more information on valuation inputs, and their aggregation into the levels used in the table below, please refer to the Security Valuation section in the accompanying Notes to Financial Statements. |
Valuation Inputs at Reporting Date: |
Description | Total | Level 1 | Level 2 | Level 3 |
Investments in Securities: | | | | |
Common Stocks | $ 362,655,462 | $ 362,655,462 | $ - | $ - |
Convertible Preferred Stocks | 427,275 | 427,275 | - | - |
Convertible Bonds | 2,074,331 | - | - | 2,074,331 |
U.S. Treasury Obligations | 269,991 | - | 269,991 | - |
Money Market Funds | 23,583,321 | 23,583,321 | - | - |
Total Investments in Securities: | $ 389,010,380 | $ 386,666,058 | $ 269,991 | $ 2,074,331 |
Derivative Instruments: | | | | |
Assets | | | | |
Futures Contracts | $ 195,061 | $ 195,061 | $ - | $ - |
Value of Derivative Instruments |
The following table is a summary of the Fund's value of derivative instruments by risk exposure as of July 31, 2012. For additional information on derivative instruments, please refer to the Derivative Instruments section in the accompanying Notes to Financial Statements. |
Risk Exposure /
Derivative Type | Value |
| Asset | Liability |
Equity Risk | | |
Futures Contracts (a) | $ 195,061 | $ - |
Total Value of Derivatives | $ 195,061 | $ - |
(a) Reflects cumulative appreciation/(depreciation) on futures contracts as disclosed on the Schedule of Investments. Only the period end variation margin is separately disclosed on the Statement of Assets and Liabilities. |
See accompanying notes which are an integral part of the financial statements.
Annual Report
Fidelity Advisor Industrials Fund
Statement of Assets and Liabilities
| July 31, 2012 |
| | |
Assets | | |
Investment in securities, at value (including securities loaned of $1,065,600) - See accompanying schedule: Unaffiliated issuers (cost $323,663,854) | $ 365,427,059 | |
Fidelity Central Funds (cost $23,583,321) | 23,583,321 | |
Total Investments (cost $347,247,175) | | $ 389,010,380 |
Receivable for fund shares sold | | 181,648 |
Dividends receivable | | 73,541 |
Interest receivable | | 140,601 |
Distributions receivable from Fidelity Central Funds | | 2,437 |
Other receivables | | 3,881 |
Total assets | | 389,412,488 |
| | |
Liabilities | | |
Payable for investments purchased | $ 2,044,937 | |
Payable for fund shares redeemed | 632,644 | |
Accrued management fee | 177,350 | |
Distribution and service plan fees payable | 137,159 | |
Payable for daily variation margin on futures contracts | 13,200 | |
Other affiliated payables | 91,028 | |
Other payables and accrued expenses | 39,367 | |
Collateral on securities loaned, at value | 1,087,800 | |
Total liabilities | | 4,223,485 |
| | |
Net Assets | | $ 385,189,003 |
Net Assets consist of: | | |
Paid in capital | | $ 360,708,824 |
Undistributed net investment income | | 1,084,983 |
Accumulated undistributed net realized gain (loss) on investments and foreign currency transactions | | (18,562,014) |
Net unrealized appreciation (depreciation) on investments and assets and liabilities in foreign currencies | | 41,957,210 |
Net Assets | | $ 385,189,003 |
Statement of Assets and Liabilities - continued
| July 31, 2012 |
| | |
Calculation of Maximum Offering Price Class A:
Net Asset Value and redemption price per share ($192,037,955 ÷ 7,335,752 shares) | | $ 26.18 |
| | |
Maximum offering price per share (100/94.25 of $26.18) | | $ 27.78 |
Class T:
Net Asset Value and redemption price per share ($63,954,336 ÷ 2,483,465 shares) | | $ 25.75 |
| | |
Maximum offering price per share (100/96.50 of $25.75) | | $ 26.68 |
Class B:
Net Asset Value and offering price per share ($20,057,986 ÷ 825,772 shares)A | | $ 24.29 |
| | |
Class C:
Net Asset Value and offering price per share ($66,289,133 ÷ 2,719,490 shares)A | | $ 24.38 |
| | |
Institutional Class:
Net Asset Value, offering price and redemption price per share ($42,849,593 ÷ 1,576,750 shares) | | $ 27.18 |
A Redemption price per share is equal to net asset value less any applicable contingent deferred sales charge.
See accompanying notes which are an integral part of the financial statements.
Annual Report
Statement of Operations
| Year ended July 31, 2012 |
| | |
Investment Income | | |
Dividends | | $ 7,453,724 |
Interest | | 130,098 |
Income from Fidelity Central Funds | | 46,302 |
Total income | | 7,630,124 |
| | |
Expenses | | |
Management fee | $ 2,205,258 | |
Transfer agent fees | 984,550 | |
Distribution and service plan fees | 1,706,450 | |
Accounting and security lending fees | 154,236 | |
Custodian fees and expenses | 22,937 | |
Independent trustees' compensation | 2,649 | |
Registration fees | 87,074 | |
Audit | 48,732 | |
Legal | 1,365 | |
Interest | 576 | |
Miscellaneous | 4,130 | |
Total expenses before reductions | 5,217,957 | |
Expense reductions | (15,771) | 5,202,186 |
Net investment income (loss) | | 2,427,938 |
Realized and Unrealized Gain (Loss) Net realized gain (loss) on: | | |
Investment securities: | | |
Unaffiliated issuers | (17,375,832) | |
Foreign currency transactions | (38,024) | |
Futures contracts | 1,012,681 | |
Total net realized gain (loss) | | (16,401,175) |
Change in net unrealized appreciation (depreciation) on: Investment securities | 18,310,973 | |
Assets and liabilities in foreign currencies | (3,018) | |
Futures contracts | 195,061 | |
Total change in net unrealized appreciation (depreciation) | | 18,503,016 |
Net gain (loss) | | 2,101,841 |
Net increase (decrease) in net assets resulting from operations | | $ 4,529,779 |
Statement of Changes in Net Assets
| Year ended
July 31,
2012 | Year ended
July 31,
2011 |
Increase (Decrease) in Net Assets | | |
Operations | | |
Net investment income (loss) | $ 2,427,938 | $ 791,669 |
Net realized gain (loss) | (16,401,175) | 55,819,724 |
Change in net unrealized appreciation (depreciation) | 18,503,016 | 3,563,495 |
Net increase (decrease) in net assets resulting from operations | 4,529,779 | 60,174,888 |
Distributions to shareholders from net investment income | (1,437,740) | (328,907) |
Distributions to shareholders from net realized gain | (4,219,307) | - |
Total distributions | (5,657,047) | (328,907) |
Share transactions - net increase (decrease) | (82,942,475) | 75,767,831 |
Redemption fees | 15,881 | 11,341 |
Total increase (decrease) in net assets | (84,053,862) | 135,625,153 |
| | |
Net Assets | | |
Beginning of period | 469,242,865 | 333,617,712 |
End of period (including undistributed net investment income of $1,084,983 and undistributed net investment income of $259,179, respectively) | $ 385,189,003 | $ 469,242,865 |
See accompanying notes which are an integral part of the financial statements.
Annual Report
Financial Highlights - Class A
Years ended July 31, | 2012 | 2011 | 2010 | 2009 | 2008 |
Selected Per-Share Data | | | | | |
Net asset value, beginning of period | $ 25.73 | $ 21.54 | $ 16.87 | $ 21.97 | $ 25.49 |
Income from Investment Operations | | | | | |
Net investment income (loss) C | .20 | .09 | .06 | .13 | .11 |
Net realized and unrealized gain (loss) | .61 | 4.13 | 4.68 | (5.08) | (1.17) |
Total from investment operations | .81 | 4.22 | 4.74 | (4.95) | (1.06) |
Distributions from net investment income | (.11) | (.03) | (.07) | (.13) | - |
Distributions from net realized gain | (.25) | - | - | (.02) | (2.46) |
Total distributions | (.36) | (.03) | (.07) | (.15) | (2.46) |
Redemption fees added to paid in capital C, G | - | - | - | - | - |
Net asset value, end of period | $ 26.18 | $ 25.73 | $ 21.54 | $ 16.87 | $ 21.97 |
Total Return A, B | 3.42% | 19.59% | 28.13% | (22.49)% | (4.71)% |
Ratios to Average Net Assets D, F | | | | | |
Expenses before reductions | 1.14% | 1.13% | 1.18% | 1.23% | 1.17% |
Expenses net of fee waivers, if any | 1.14% | 1.13% | 1.18% | 1.23% | 1.17% |
Expenses net of all reductions | 1.14% | 1.13% | 1.17% | 1.23% | 1.16% |
Net investment income (loss) | .80% | .36% | .31% | .89% | .46% |
Supplemental Data | | | | | |
Net assets, end of period (000 omitted) | $ 192,038 | $ 228,106 | $ 165,029 | $ 130,860 | $ 188,859 |
Portfolio turnover rate E | 82% | 75% | 110% | 135% | 91% |
A Total returns would have been lower if certain expenses had not been reduced during the applicable periods shown.
B Total returns do not include the effect of the sales charges.
C Calculated based on average shares outstanding during the period.
D Fees and expenses of any underlying Fidelity Central Funds are not included in the Fund's expense ratio. The Fund indirectly bears its proportionate share of the expenses of any underlying Fidelity Central Funds.
E Amount does not include the portfolio activity of any underlying Fidelity Central Funds.
F Expense ratios reflect operating expenses of the class. Expenses before reductions do not reflect amounts reimbursed by the investment adviser or reductions from brokerage service arrangements or reductions from other expense offset arrangements and do not represent the amount paid by the class during periods when reimbursements or reductions occur. Expenses net of fee waivers reflect expenses after reimbursement by the investment adviser but prior to reductions from brokerage service arrangements or other expense offset arrangements. Expenses net of all reductions represent the net expenses paid by the class.
G Amount represents less than $.01 per share.
Financial Highlights - Class T
Years ended July 31, | 2012 | 2011 | 2010 | 2009 | 2008 |
Selected Per-Share Data | | | | | |
Net asset value, beginning of period | $ 25.33 | $ 21.24 | $ 16.64 | $ 21.67 | $ 25.17 |
Income from Investment Operations | | | | | |
Net investment income (loss) C | .13 | .03 | .01 | .10 | .05 |
Net realized and unrealized gain (loss) | .61 | 4.07 | 4.61 | (5.03) | (1.15) |
Total from investment operations | .74 | 4.10 | 4.62 | (4.93) | (1.10) |
Distributions from net investment income | (.07) | (.01) | (.02) | (.08) | - |
Distributions from net realized gain | (.25) | - | - | (.02) | (2.40) |
Total distributions | (.32) | (.01) | (.02) | (.10) | (2.40) |
Redemption fees added to paid in capital C, G | - | - | - | - | - |
Net asset value, end of period | $ 25.75 | $ 25.33 | $ 21.24 | $ 16.64 | $ 21.67 |
Total Return A, B | 3.15% | 19.28% | 27.80% | (22.68)% | (4.96)% |
Ratios to Average Net Assets D, F | | | | | |
Expenses before reductions | 1.40% | 1.39% | 1.44% | 1.48% | 1.41% |
Expenses net of fee waivers, if any | 1.40% | 1.39% | 1.44% | 1.48% | 1.41% |
Expenses net of all reductions | 1.39% | 1.38% | 1.43% | 1.48% | 1.41% |
Net investment income (loss) | .54% | .10% | .06% | .63% | .21% |
Supplemental Data | | | | | |
Net assets, end of period (000 omitted) | $ 63,954 | $ 71,542 | $ 58,202 | $ 48,054 | $ 85,025 |
Portfolio turnover rate E | 82% | 75% | 110% | 135% | 91% |
A Total returns would have been lower if certain expenses had not been reduced during the applicable periods shown.
B Total returns do not include the effect of the sales charges.
C Calculated based on average shares outstanding during the period.
D Fees and expenses of any underlying Fidelity Central Funds are not included in the Fund's expense ratio. The Fund indirectly bears its proportionate share of the expenses of any underlying Fidelity Central Funds.
E Amount does not include the portfolio activity of any underlying Fidelity Central Funds.
F Expense ratios reflect operating expenses of the class. Expenses before reductions do not reflect amounts reimbursed by the investment adviser or reductions from brokerage service arrangements or reductions from other expense offset arrangements and do not represent the amount paid by the class during periods when reimbursements or reductions occur. Expenses net of fee waivers reflect expenses after reimbursement by the investment adviser but prior to reductions from brokerage service arrangements or other expense offset arrangements. Expenses net of all reductions represent the net expenses paid by the class.
G Amount represents less than $.01 per share.
See accompanying notes which are an integral part of the financial statements.
Annual Report
Financial Highlights - Class B
Years ended July 31, | 2012 | 2011 | 2010 | 2009 | 2008 |
Selected Per-Share Data | | | | | |
Net asset value, beginning of period | $ 23.99 | $ 20.22 | $ 15.90 | $ 20.74 | $ 24.19 |
Income from Investment Operations | | | | | |
Net investment income (loss) C | - H | (.11) | (.09) | .02 | (.07) |
Net realized and unrealized gain (loss) | .57 | 3.88 | 4.41 | (4.82) | (1.10) |
Total from investment operations | .57 | 3.77 | 4.32 | (4.80) | (1.17) |
Distributions from net investment income | (.02) | - | - | (.04) | - |
Distributions from net realized gain | (.25) | - | - | - | (2.28) |
Total distributions | (.27) | - | - | (.04) | (2.28) |
Redemption fees added to paid in capital C, H | - | - | - | - | - |
Net asset value, end of period | $ 24.29 | $ 23.99 | $ 20.22 | $ 15.90 | $ 20.74 |
Total Return A, B | 2.59% | 18.64% | 27.17% | (23.10)% | (5.46)% |
Ratios to Average Net Assets D, G | | | | | |
Expenses before reductions | 1.94% | 1.93% | 1.97% | 1.98% | 1.95% |
Expenses net of fee waivers, if any | 1.94% | 1.93% | 1.97% | 1.98% | 1.95% |
Expenses net of all reductions | 1.94% | 1.93% | 1.97% | 1.98% | 1.95% |
Net investment income (loss) | -% F | (.44)% | (.48)% | .13% | (.33)% |
Supplemental Data | | | | | |
Net assets, end of period (000 omitted) | $ 20,058 | $ 28,600 | $ 29,048 | $ 25,212 | $ 39,989 |
Portfolio turnover rate E | 82% | 75% | 110% | 135% | 91% |
A Total returns would have been lower if certain expenses had not been reduced during the applicable periods shown.
B Total returns do not include the effect of the contingent deferred sales charge.
C Calculated based on average shares outstanding during the period.
D Fees and expenses of any underlying Fidelity Central Funds are not included in the Fund's expense ratio. The Fund indirectly bears its proportionate share of the expenses of any underlying Fidelity Central Funds.
E Amount does not include the portfolio activity of any underlying Fidelity Central Funds.
F Amount represents less than .01%.
G Expense ratios reflect operating expenses of the class. Expenses before reductions do not reflect amounts reimbursed by the investment adviser or reductions from brokerage service arrangements or reductions from other expense offset arrangements and do not represent the amount paid by the class during periods when reimbursements or reductions occur. Expenses net of fee waivers reflect expenses after reimbursement by the investment adviser but prior to reductions from brokerage service arrangements or other expense offset arrangements. Expenses net of all reductions represent the net expenses paid by the class.
H Amount represents less than $.01 per share.
Financial Highlights - Class C
Years ended July 31, | 2012 | 2011 | 2010 | 2009 | 2008 |
Selected Per-Share Data | | | | | |
Net asset value, beginning of period | $ 24.07 | $ 20.28 | $ 15.94 | $ 20.79 | $ 24.26 |
Income from Investment Operations | | | | | |
Net investment income (loss) C | .01 | (.09) | (.08) | .02 | (.06) |
Net realized and unrealized gain (loss) | .58 | 3.88 | 4.42 | (4.83) | (1.11) |
Total from investment operations | .59 | 3.79 | 4.34 | (4.81) | (1.17) |
Distributions from net investment income | (.03) | - | - | (.04) | - |
Distributions from net realized gain | (.25) | - | - | - | (2.30) |
Total distributions | (.28) | - | - | (.04) | (2.30) |
Redemption fees added to paid in capital C, G | - | - | - | - | - |
Net asset value, end of period | $ 24.38 | $ 24.07 | $ 20.28 | $ 15.94 | $ 20.79 |
Total Return A, B | 2.67% | 18.69% | 27.23% | (23.09)% | (5.44)% |
Ratios to Average Net Assets D, F | | | | | |
Expenses before reductions | 1.89% | 1.89% | 1.93% | 1.98% | 1.91% |
Expenses net of fee waivers, if any | 1.89% | 1.89% | 1.93% | 1.98% | 1.91% |
Expenses net of all reductions | 1.88% | 1.88% | 1.92% | 1.98% | 1.90% |
Net investment income (loss) | .05% | (.40)% | (.43)% | .14% | (.28)% |
Supplemental Data | | | | | |
Net assets, end of period (000 omitted) | $ 66,289 | $ 72,673 | $ 51,760 | $ 37,862 | $ 57,742 |
Portfolio turnover rate E | 82% | 75% | 110% | 135% | 91% |
A Total returns would have been lower if certain expenses had not been reduced during the applicable periods shown.
B Total returns do not include the effect of the contingent deferred sales charge.
C Calculated based on average shares outstanding during the period.
D Fees and expenses of any underlying Fidelity Central Funds are not included in the Fund's expense ratio. The Fund indirectly bears its proportionate share of the expenses of any underlying Fidelity Central Funds.
E Amount does not include the portfolio activity of any underlying Fidelity Central Funds.
F Expense ratios reflect operating expenses of the class. Expenses before reductions do not reflect amounts reimbursed by the investment adviser or reductions from brokerage service arrangements or reductions from other expense offset arrangements and do not represent the amount paid by the class during periods when reimbursements or reductions occur. Expenses net of fee waivers reflect expenses after reimbursement by the investment adviser but prior to reductions from brokerage service arrangements or other expense offset arrangements. Expenses net of all reductions represent the net expenses paid by the class.
G Amount represents less than $.01 per share.
See accompanying notes which are an integral part of the financial statements.
Annual Report
Financial Highlights - Institutional Class
Years ended July 31, | 2012 | 2011 | 2010 | 2009 | 2008 |
Selected Per-Share Data | | | | | |
Net asset value, beginning of period | $ 26.69 | $ 22.30 | $ 17.45 | $ 22.72 | $ 26.26 |
Income from Investment Operations | | | | | |
Net investment income (loss) B | .28 | .17 | .13 | .19 | .18 |
Net realized and unrealized gain (loss) | .63 | 4.28 | 4.83 | (5.27) | (1.19) |
Total from investment operations | .91 | 4.45 | 4.96 | (5.08) | (1.01) |
Distributions from net investment income | (.17) | (.06) | (.11) | (.17) | - |
Distributions from net realized gain | (.25) | - | - | (.02) | (2.53) |
Total distributions | (.42) | (.06) | (.11) | (.19) | (2.53) |
Redemption fees added to paid in capital B, F | - | - | - | - | - |
Net asset value, end of period | $ 27.18 | $ 26.69 | $ 22.30 | $ 17.45 | $ 22.72 |
Total Return A | 3.72% | 19.95% | 28.52% | (22.31)% | (4.40)% |
Ratios to Average Net Assets C, E | | | | | |
Expenses before reductions | .85% | .85% | .89% | .96% | .88% |
Expenses net of fee waivers, if any | .85% | .85% | .89% | .96% | .88% |
Expenses net of all reductions | .85% | .84% | .88% | .95% | .87% |
Net investment income (loss) | 1.08% | .65% | .61% | 1.16% | .75% |
Supplemental Data | | | | | |
Net assets, end of period (000 omitted) | $ 42,850 | $ 68,323 | $ 29,578 | $ 12,762 | $ 33,642 |
Portfolio turnover rate D | 82% | 75% | 110% | 135% | 91% |
A Total returns would have been lower if certain expenses had not been reduced during the applicable periods shown.
B Calculated based on average shares outstanding during the period.
C Fees and expenses of any underlying Fidelity Central Funds are not included in the Fund's expense ratio. The Fund indirectly bears its proportionate share of the expenses of any underlying Fidelity Central Funds.
D Amount does not include the portfolio activity of any underlying Fidelity Central Funds.
E Expense ratios reflect operating expenses of the class. Expenses before reductions do not reflect amounts reimbursed by the investment adviser or reductions from brokerage service arrangements or reductions from other expense offset arrangements and do not represent the amount paid by the class during periods when reimbursements or reductions occur. Expenses net of fee waivers reflect expenses after reimbursement by the investment adviser but prior to reductions from brokerage service arrangements or other expense offset arrangements. Expenses net of all reductions represent the net expenses paid by the class.
F Amount represents less than $.01 per share.
See accompanying notes which are an integral part of the financial statements.
Annual Report
Fidelity Advisor Industrials Fund
Notes to Financial Statements
For the period ended July 31, 2012
1. Organization.
Fidelity Advisor Industrials Fund (the Fund) is a non-diversified fund of Fidelity Advisor Series VII (the Trust) and is authorized to issue an unlimited number of shares. The Trust is registered under the Investment Company Act of 1940, as amended (the 1940 Act), as an open-end management investment company organized as a Massachusetts business trust. The Fund offers Class A, Class T, Class C, and Institutional Class shares, each of which, along with Class B shares, has equal rights as to assets and voting privileges. Effective after the close of business on September 1, 2010, Class B shares were closed to new accounts and additional purchases, except for exchanges and reinvestments. Each class has exclusive voting rights with respect to matters that affect that class. Class B shares will automatically convert to Class A shares after a holding period of seven years from the initial date of purchase. Investment income, realized and unrealized capital gains and losses, the common expenses of the Fund, and certain fund-level expense reductions, if any, are allocated on a pro-rata basis to each class based on the relative net assets of each class to the total net assets of the Fund. Each class differs with respect to transfer agent and distribution and service plan fees incurred. Certain expense reductions may also differ by class.
2. Investments in Fidelity Central Funds.
The Fund invests in Fidelity Central Funds, which are open-end investment companies available only to other investment companies and accounts managed by Fidelity Management & Research Company (FMR) and its affiliates. The Fund's Schedule of Investments lists each of the Fidelity Central Funds held as of period end, if any, as an investment of the Fund, but does not include the underlying holdings of each Fidelity Central Fund. As an Investing Fund, the Fund indirectly bears its proportionate share of the expenses of the underlying Fidelity Central Funds.
The Money Market Central Funds seek preservation of capital and current income and are managed by Fidelity Investments Money Management, Inc. (FIMM), an affiliate of FMR.
A complete unaudited list of holdings for each Fidelity Central Fund is available upon request or at the Securities and Exchange Commission (the SEC) web site at www.sec.gov. In addition, the financial statements of the Fidelity Central Funds, which are not covered by the Fund's Report of Independent Registered Public Accounting Firm, are available on the SEC web site or upon request.
3. Significant Accounting Policies.
The financial statements have been prepared in conformity with accounting principles generally accepted in the United States of America (GAAP), which require management to make certain estimates and assumptions at the date of the financial statements. Actual results could differ from those estimates. Subsequent events, if any, through the date that the financial statements were issued have been evaluated in the preparation of the financial statements. The following summarizes the significant accounting policies of the Fund:
Security Valuation. Investments are valued as of 4:00 p.m. Eastern time on the last calendar day of the period. In accordance with valuation policies and procedures approved by the Board of Trustees (the Board), the Fund attempts to obtain prices from one or more third party pricing vendor or broker to value its investments. When current market prices, quotations or rates are not readily available or reliable, securities will be fair valued in good faith by the FMR Fair Value Committee (the Committee), in accordance with procedures adopted by the Fund's Board. Factors used in determining fair value vary by security type and may include market or security specific events, changes in interest rates and credit quality. The frequency with which these procedures are used cannot be predicted and they may be utilized to a significant extent. The Committee oversees the Fund's valuation policies and procedures and is responsible for approving and reporting to the Board all fair value determinations.
The Fund categorizes the inputs to valuation techniques used to value its investments into a disclosure hierarchy consisting of three levels as shown below:
Level 1 - quoted prices in active markets for identical investments
Level 2 - other significant observable inputs (including quoted prices for similar investments, interest rates, prepayment speeds, etc.)
Level 3 - unobservable inputs (including the Fund's own assumptions based on the best information available)
Valuation techniques used to value the Fund's investments by major category are as follows:
Equity securities, including restricted securities, for which market quotations are readily available, are valued at the last reported sale price or official closing price as reported by a third party pricing vendor on the primary market or exchange on which they are traded and are categorized as Level 1 in the hierarchy. In the event there were no sales during the day or closing prices are not available, securities are valued at the last quoted bid price or may be valued using the last available price and are generally categorized as Level 2 in the hierarchy. For foreign equity securities, when significant market or security specific events arise, comparisons to the valuation of American Depositary Receipts (ADRs), futures contracts, Exchange-Traded Funds (ETFs) and certain indexes as well as quoted prices for similar securities are used and are categorized as Level 2 in the hierarchy. Utilizing these techniques may result in transfers between Level 1 and Level 2. For restricted equity securities and private placements where observable inputs are limited, assumptions about market activity and risk are used and these securities are categorized as Level 3 in the hierarchy.
Annual Report
3. Significant Accounting Policies - continued
Security Valuation - continued
Debt securities, including restricted securities, are valued based on evaluated prices received from third party pricing vendors or from brokers who make markets in such securities. For corporate bonds and U.S. government and government agency obligations, pricing vendors utilize matrix pricing which considers yield or price of bonds of comparable quality, coupon, maturity and type as well as broker-supplied prices and are generally categorized as Level 2 in the hierarchy. When independent prices are unavailable or unreliable, debt securities may be valued utilizing pricing methodologies which consider similar factors that would be used by third party pricing vendors. These are generally categorized as Level 2 in the hierarchy but may be Level 3 depending on the circumstances.
Futures contracts are valued at the settlement price established each day by the board of trade or exchange on which they are traded and are categorized as Level 1 in the hierarchy. Investments in open-end mutual funds, including the Fidelity Central Funds, are valued at their closing net asset value each business day and are categorized as Level 1 in the hierarchy.
Changes in valuation techniques may result in transfers in or out of an assigned level within the disclosure hierarchy. The aggregate value of investments by input level, as of July 31, 2012, is included at the end of the Fund's Schedule of Investments.
Foreign Currency Translation. The Fund may use foreign currency contracts to facilitate transactions in foreign-denominated securities. Gains and losses from these transactions may arise from changes in the value of the foreign currency or if the counterparties do not perform under the contracts' terms.
Foreign-denominated assets, including investment securities, and liabilities are translated into U.S. dollars at the exchange rates at period end. Purchases and sales of investment securities, income and dividends received and expenses denominated in foreign currencies are translated into U.S. dollars at the exchange rate in effect on the transaction date.
The effects of exchange rate fluctuations on investments are included with the net realized and unrealized gain (loss) on investment securities. Other foreign currency transactions resulting in realized and unrealized gain (loss) are disclosed separately.
Investment Transactions and Income. For financial reporting purposes, the Fund's investment holdings and NAV include trades executed through the end of the last business day of the period. The NAV per share for processing shareholder transactions is calculated as of the close of business of the New York Stock Exchange (NYSE), normally 4:00 p.m. Eastern time and includes trades executed through the end of the prior business day. Gains and losses on securities sold are determined on the basis of identified cost and may include proceeds received from litigation. Dividend income is recorded on the ex-dividend date, except for certain dividends from foreign securities where the ex-dividend date may have passed, which are recorded as soon as the Fund is informed of the ex-dividend date. Non-cash dividends included in dividend income, if any, are recorded at the fair market value of the securities received. Distributions received on securities that represent a return of capital or capital gain are recorded as a reduction of cost of investments and/or as a realized gain. The Fund estimates the components of distributions received that may be considered return of capital distributions or capital gain distributions. Interest income and distributions from the Fidelity Central Funds are accrued as earned. Interest income includes coupon interest and amortization of premium and accretion of discount on debt securities. Investment income is recorded net of foreign taxes withheld where recovery of such taxes is uncertain.
Expenses. Expenses directly attributable to a fund are charged to that fund. Expenses attributable to more than one fund are allocated among the respective funds on the basis of relative net assets or other appropriate methods. Expense estimates are accrued in the period to which they relate and adjustments are made when actual amounts are known.
Income Tax Information and Distributions to Shareholders. Each year, the Fund intends to qualify as a regulated investment company under Subchapter M of the Internal Revenue Code, including distributing substantially all of its taxable income and realized gains. As a result, no provision for income taxes is required. As of July 31, 2012, the Fund did not have any unrecognized tax benefits in the financial statements; nor is the Fund aware of any tax positions for which it is reasonably possible that the total amounts of unrecognized tax benefits will significantly change in the next twelve months. The Fund files a U.S. federal tax return, in addition to state and local tax returns as required. A fund's federal income tax returns are subject to examination by the Internal Revenue Service (IRS) for a period of three fiscal years after they are filed. State and local tax returns may be subject to examination for an additional fiscal year depending on the jurisdiction. Foreign taxes are provided for based on the Fund's understanding of the tax rules and rates that exist in the foreign markets in which it invests.
Distributions are declared and recorded on the ex-dividend date. Income dividends and capital gain distributions are declared separately for each class. Income and capital gain distributions are determined in accordance with income tax regulations, which may differ from GAAP. In addition, the Fund claimed a portion of the payment made to redeeming shareholders as a distribution for income tax purposes.
Capital accounts within the financial statements are adjusted for permanent book-tax differences. These adjustments have no impact on net assets or the results of operations. Temporary book-tax differences will reverse in a subsequent period.
Annual Report
Fidelity Advisor Industrials Fund
Notes to Financial Statements - continued
3. Significant Accounting Policies - continued
Income Tax Information and Distributions to Shareholders - continued
Book-tax differences are primarily due to foreign currency transactions, market discount, futures transactions, deferred trustees compensation, equity-debt classifications, capital loss carryforwards and losses deferred due to wash sales.
The federal tax cost of investment securities and unrealized appreciation (depreciation) as of period end were as follows:
Gross unrealized appreciation | $ 47,867,170 |
Gross unrealized depreciation | (8,874,903) |
Net unrealized appreciation (depreciation) on securities and other investments | $ 38,992,267 |
| |
Tax Cost | $ 350,018,113 |
The tax-based components of distributable earnings as of period end were as follows:
Undistributed ordinary income | $ 1,088,979 |
Capital loss carryforward | $ (15,596,016) |
Net unrealized appreciation (depreciation) | $ 38,991,211 |
Capital loss carryforwards are only available to offset future capital gains of the Fund to the extent provided by regulations and may be limited. Under the Regulated Investment Company Modernization Act of 2010 (the Act), the Fund is permitted to carry forward capital losses incurred in taxable years beginning after December 22, 2010 for an unlimited period and such capital losses are required to be used prior to any losses that expire. Capital loss carryforwards were as follows:
No expiration | |
Short-term | $ (15,596,016) |
The tax character of distributions paid was as follows:
| July 31, 2012 | July 31, 2011 |
Ordinary Income | $ 1,437,740 | $ 328,907 |
Long-term Capital Gains | 4,219,307 | - |
Total | $ 5,657,047 | $ 328,907 |
Short-Term Trading (Redemption) Fees. Shares held by investors in the Fund less than 30 days are subject to a redemption fee equal to .75% of the net asset value of shares redeemed. All redemption fees, which reduce the proceeds of the shareholder redemption, are retained by the Fund and accounted for as an addition to paid in capital.
New Accounting Pronouncement. In December 2011, the Financial Accounting Standards Board issued Accounting Standard Update No. 2011-11, Disclosures about Offsetting Assets and Liabilities. The update creates new disclosure requirements requiring entities to disclose both gross and net information for derivatives and other financial instruments that are either offset in the Statement of Assets and Liabilities or subject to an enforceable master netting arrangement or similar agreement. The disclosure requirements are effective for interim and annual reporting periods beginning on or after January 1, 2013. Management is currently evaluating the impact of the update's adoption on the Fund's financial statement disclosures.
4. Operating Policies.
Restricted Securities. The Fund may invest in securities that are subject to legal or contractual restrictions on resale. These securities generally may be resold in transactions exempt from registration or to the public if the securities are registered. Disposal of these securities may involve time-consuming negotiations and expense, and prompt sale at an acceptable price may be difficult. Information regarding restricted securities is included at the end of the Fund's Schedule of Investments.
5. Derivative Instruments.
Risk Exposures and the Use of Derivative Instruments. The Fund's investment objectives allow the Fund to enter into various types of derivative contracts, including futures contracts. Derivatives are investments whose value is derived from underlying assets, indices or reference rates and may be transacted on an exchange or over-the-counter (OTC). Derivatives may involve a future commitment to buy or sell a specified instrument based on specified terms, or to exchange future cash flows at periodic intervals based on a notional principal amount. The Fund used derivatives to increase returns and to manage exposure to certain risks as defined below. The success of any strategy involving derivatives depends on analysis of numerous economic factors, and if the strategies for investment do not work as intended, the Fund may not achieve its objectives.
Annual Report
5. Derivative Instruments - continued
Risk Exposures and the Use of Derivative Instruments - continued
The Fund's use of derivatives increased or decreased its exposure to the following risk:
Equity Risk | Equity risk relates to the fluctuations in the value of financial instruments as a result of changes in market prices (other than those arising from interest rate risk or foreign exchange risk), whether caused by factors specific to an individual investment, its issuer, or all factors affecting all instruments traded in a market or market segment. |
The Fund is also exposed to additional risks from investing in derivatives, such as liquidity risk and counterparty credit risk. Liquidity risk is the risk that the Fund will be unable to close out the derivative in the open market in a timely manner. Counterparty credit risk is the risk that the counterparty will not be able to fulfill its obligation to the Fund. Counterparty credit risk related to exchange-traded futures contracts is minimal because of the protection provided by the exchange on which they trade. Investing in derivatives may involve greater risks than investing in the underlying assets directly and, to varying degrees, involves risk of loss in excess of the initial investment, if any, collateral received and amounts recognized in the Statement of Assets and Liabilities. In addition, for futures contracts, there is the risk that the change in value of the derivative contract may not correspond to the change in value of the underlying instrument.
Futures Contracts. A futures contract is an agreement between two parties to buy or sell a specified underlying instrument for a fixed price at a specified future date. The Fund used futures contracts to manage its exposure to the stock market.
Upon entering into a futures contract, a fund is required to deposit either cash or securities (initial margin) with a clearing broker in an amount equal to a certain percentage of the face value of the contract. Futures contracts are marked-to-market daily and subsequent payments (variation margin) are made or received by a fund depending on the daily fluctuations in the value of the futures contracts and are recorded as unrealized appreciation or (depreciation). This receivable and/or payable is included in daily variation margin on futures contracts in the Statement of Assets and Liabilities. Realized gain or (loss) is recorded upon the expiration or closing of a futures contract.
Any open futures contracts at period end are shown in the Schedule of Investments under the caption "Futures Contracts." The underlying face amount at value reflects each contract's exposure to the underlying instrument at period end and is representative of activity for the period. Securities deposited to meet initial margin requirements are identified in the Schedule of Investments.
During the period the Fund recognized net realized gain (loss) of $1,012,681 and a change in net unrealized appreciation (depreciation) of $195,061 related to its investment in futures contracts. These amounts are included in the Statement of Operations.
6. Purchases and Sales of Investments.
Purchases and sales of securities, other than short-term securities, aggregated $319,308,352 and $422,627,733, respectively.
7. Fees and Other Transactions with Affiliates.
Management Fee. FMR and its affiliates provide the Fund with investment management related services for which the Fund pays a monthly management fee. The management fee is the sum of an individual fund fee rate that is based on an annual rate of .30% of the Fund's average net assets and an annualized group fee rate that averaged .26% during the period. The group fee rate is based upon the average net assets of all the mutual funds advised by FMR. The group fee rate decreases as assets under management increase and increases as assets under management decrease. For the period, the total annual management fee rate was .56% of the Fund's average net assets.
Distribution and Service Plan Fees. In accordance with Rule 12b-1 of the 1940 Act, the Fund has adopted separate Distribution and Service Plans for each class of shares. Certain classes pay Fidelity Distributors Corporation (FDC), an affiliate of FMR, separate Distribution and Service Fees, each of which is based on an annual percentage of each class' average net assets. In addition, FDC may pay financial intermediaries for selling shares of the Fund and providing shareholder support services. For the period, the Distribution and Service Fee rates, total fees and amounts retained by FDC were as follows:
| Distribution
Fee | Service
Fee | Total Fees | Retained
by FDC |
Class A | -% | .25% | $ 496,430 | $ 8,539 |
Class T | .25% | .25% | 316,028 | 456 |
Class B | .75% | .25% | 229,897 | 172,437 |
Class C | .75% | .25% | 664,095 | 112,438 |
| | | $ 1,706,450 | $ 293,870 |
Annual Report
Fidelity Advisor Industrials Fund
Notes to Financial Statements - continued
7. Fees and Other Transactions with Affiliates - continued
Sales Load. FDC may receive a front-end sales charge of up to 5.75% for selling Class A shares and 3.50% for selling Class T shares, some of which is paid to financial intermediaries for selling shares of the Fund. Depending on the holding period, FDC may receive contingent deferred sales charges levied on Class A, Class T, Class B, and Class C redemptions. The deferred sales charges range from 5.00% to 1.00% for Class B shares, 1.00% for Class C shares, 1.00% for certain purchases of Class A shares and .25% for certain purchases of Class T shares.
For the period, sales charge amounts retained by FDC were as follows:
| Retained
by FDC |
Class A | $ 63,331 |
Class T | 9,386 |
Class B* | 42,192 |
Class C* | 11,320 |
| $ 126,229 |
* When Class B and Class C shares are initially sold, FDC pays commissions from its own resources to financial intermediaries through which the sales are made.
Transfer Agent Fees. Fidelity Investments Institutional Operations Company, Inc. (FIIOC), an affiliate of FMR, is the transfer, dividend disbursing and shareholder servicing agent for each class of the Fund. FIIOC receives account fees and asset-based fees that vary according to the account size and type of account of the shareholders of the respective classes of the Fund. FIIOC pays for typesetting, printing and mailing of shareholder reports, except proxy statements. For the period, transfer agent fees for each class were as follows:
| Amount | % of
Average
Net Assets |
Class A | $ 496,808 | .25 |
Class T | 161,224 | .26 |
Class B | 69,135 | .30 |
Class C | 163,953 | .25 |
Institutional Class | 93,430 | .21 |
| $ 984,550 | |
Accounting and Security Lending Fees. Fidelity Service Company, Inc. (FSC), an affiliate of FMR, maintains the Fund's accounting records. The accounting fee is based on the level of average net assets for each month. Under a separate contract, FSC administers the security lending program. The security lending fee is based on the number and duration of lending transactions.
Brokerage Commissions. The Fund placed a portion of its portfolio transactions with brokerage firms which are affiliates of the investment adviser. The commissions paid to these affiliated firms were $7,231 for the period.
Interfund Lending Program. Pursuant to an Exemptive Order issued by the SEC, the Fund, along with other registered investment companies having management contracts with FMR, may participate in an interfund lending program. This program provides an alternative credit facility allowing the funds to borrow from, or lend money to, other participating affiliated funds. At period end, there were no interfund loans outstanding. The Fund's activity in this program during the period for which loans were outstanding was as follows:
Borrower or Lender | Average Loan
Balance | Weighted Average Interest Rate | Interest
Expense |
Borrower | $ 7,097,500 | .37% | $ 576 |
8. Committed Line of Credit.
The Fund participates with other funds managed by FMR or an affiliate in a $4.25 billion credit facility (the "line of credit") to be utilized for temporary or emergency purposes to fund shareholder redemptions or for other short-term liquidity purposes. The Fund has agreed to pay commitment fees on its pro-rata portion of the line of credit, which amounted to $1,142 and is reflected in Miscellaneous expenses on the Statement of Operations. During the period, there were no borrowings on this line of credit.
Annual Report
9. Security Lending.
The Fund lends portfolio securities through a lending agent from time to time in order to earn additional income. For equity securities, a lending agent is used and may loan securities to certain qualified borrowers, including Fidelity Capital Markets (FCM), a broker-dealer affiliated with the Fund. On the settlement date of the loan, the Fund receives collateral (in the form of U.S. Treasury obligations, letters of credit and/or cash) against the loaned securities and maintains collateral in an amount not less than 100% of the market value of the loaned securities during the period of the loan. The market value of the loaned securities is determined at the close of business of the Fund and any additional required collateral delivered to the Fund on the next business day. If the borrower defaults on its obligation to return the securities loaned because of insolvency or other reasons, a fund could experience delays and costs in recovering the securities loaned or in gaining access to the collateral. Any cash collateral received is invested in the Fidelity Securities Lending Cash Central Fund. The value of loaned securities and cash collateral at period end are disclosed on the Fund's Statement of Assets and Liabilities. Security lending income represents the income earned on investing cash collateral, less rebates paid to borrowers and any lending agent fees associated with the loan, plus any premium payments received for lending certain types of securities. Security lending income is presented in the Statement of Operations as a component of income from Fidelity Central Funds. Total security lending income during the period amounted to $30,165. During the period, there were no securities loaned to FCM.
10. Expense Reductions.
Many of the brokers with whom FMR places trades on behalf of the Fund provided services to the Fund in addition to trade execution. These services included payments of certain expenses on behalf of the Fund totaling $15,771 for the period.
11. Distributions to Shareholders.
Distributions to shareholders of each class were as follows:
Years ended July 31, | 2012 | 2011 |
From net investment income | | |
Class A | $ 896,458 | $ 235,263 |
Class T | 170,680 | 13,200 |
Class B | 16,830 | - |
Class C | 70,972 | - |
Institutional Class | 282,800 | 80,444 |
Total | $ 1,437,740 | $ 328,907 |
From net realized gain | | |
Class A | $ 2,092,354 | $ - |
Class T | 659,892 | - |
Class B | 286,480 | - |
Class C | 731,497 | - |
Institutional Class | 449,084 | - |
Total | $ 4,219,307 | $ - |
12. Share Transactions.
Transactions for each class of shares were as follows:
| Shares | Dollars |
Years ended July 31, | 2012 | 2011 | 2012 | 2011 |
Class A | | | | |
Shares sold | 1,757,163 | 3,645,278 | $ 44,013,667 | $ 95,442,701 |
Reinvestment of distributions | 118,075 | 8,108 | 2,609,664 | 205,122 |
Shares redeemed | (3,404,053) | (2,451,683) | (83,950,843) | (63,502,279) |
Net increase (decrease) | (1,528,815) | 1,201,703 | $ (37,327,512) | $ 32,145,544 |
Class T | | | | |
Shares sold | 369,147 | 757,485 | $ 9,058,222 | $ 19,402,949 |
Reinvestment of distributions | 36,910 | 500 | 800,817 | 12,596 |
Shares redeemed | (746,452) | (674,809) | (17,604,399) | (16,619,027) |
Net increase (decrease) | (340,395) | 83,176 | $ (7,745,360) | $ 2,796,518 |
Annual Report
Fidelity Advisor Industrials Fund
Notes to Financial Statements - continued
12. Share Transactions - continued
| Shares | Dollars |
Years ended July 31, | 2012 | 2011 | 2012 | 2011 |
Class B | | | | |
Shares sold | 62,276 | 89,875 | $ 1,371,568 | $ 2,150,821 |
Reinvestment of distributions | 12,641 | - | 255,322 | - |
Shares redeemed | (441,128) | (334,639) | (10,119,054) | (7,838,637) |
Net increase (decrease) | (366,211) | (244,764) | $ (8,492,164) | $ (5,687,816) |
Class C | | | | |
Shares sold | 457,163 | 1,054,416 | $ 10,854,816 | $ 25,772,946 |
Reinvestment of distributions | 31,555 | - | 641,832 | - |
Shares redeemed | (787,971) | (588,462) | (18,054,638) | (13,948,935) |
Net increase (decrease) | (299,253) | 465,954 | $ (6,557,990) | $ 11,824,011 |
Institutional Class | | | | |
Shares sold | 806,817 | 2,320,182 | $ 21,049,427 | $ 63,208,570 |
Reinvestment of distributions | 22,926 | 2,269 | 525,598 | 59,382 |
Shares redeemed | (1,812,880) | (1,089,149) | (44,394,474) | (28,578,378) |
Net increase (decrease) | (983,137) | 1,233,302 | $ (22,819,449) | $ 34,689,574 |
13. Other.
The Fund's organizational documents provide former and current trustees and officers with a limited indemnification against liabilities arising in connection with the performance of their duties to the Fund. In the normal course of business, the Fund may also enter into contracts that provide general indemnifications. The Fund's maximum exposure under these arrangements is unknown as this would be dependent on future claims that may be made against the Fund. The risk of material loss from such claims is considered remote.
Annual Report
Fidelity Advisor Technology Fund - Class A, T, B, and C
Performance: The Bottom Line
Average annual total return reflects the change in the value of an investment, assuming reinvestment of the class' distributions from dividend income and capital gains (the profits earned upon the sale of securities that have grown in value, if any) and assuming a constant rate of performance each year. The $10,000 table and the fund's returns do not reflect the deduction of taxes that a shareholder would pay on fund distributions or the redemption of fund shares. During periods of reimbursement by Fidelity, a fund's total return will be greater than it would be had the reimbursement not occurred. How a fund did yesterday is no guarantee of how it will do tomorrow. Returns reflect the conversion of Class B shares to Class A shares after a maximum of seven years.
Average Annual Total Returns
Periods ended July 31, 2012 | Past 1
year | Past 5
years | Past 10
years |
Class A (incl. 5.75% sales charge) | -5.34% | 2.98% | 9.08% |
Class T (incl. 3.50% sales charge) | -3.30% | 3.21% | 9.08% |
Class B (incl. contingent deferred sales charge) A | -5.29% | 3.07% | 9.17% |
Class C (incl. contingent deferred sales charge) B | -1.30% | 3.43% | 8.94% |
A Class B shares' contingent deferred sales charges included in the past one year, past five years and past ten years total return figures are 5%, 2%, and 0%, respectively.
B Class C shares' contingent deferred sales charges included in the past one year, past five years and past ten years total return figures are 1%, 0%, and 0%, respectively.
$10,000 Over 10 Years
Let's say hypothetically that $10,000 was invested in Fidelity Advisor Technology Fund - Class A on July 31, 2002, and the current 5.75% sales charge was paid. The chart shows how the value of your investment would have changed, and also shows how the S&P 500 Index performed over the same period.
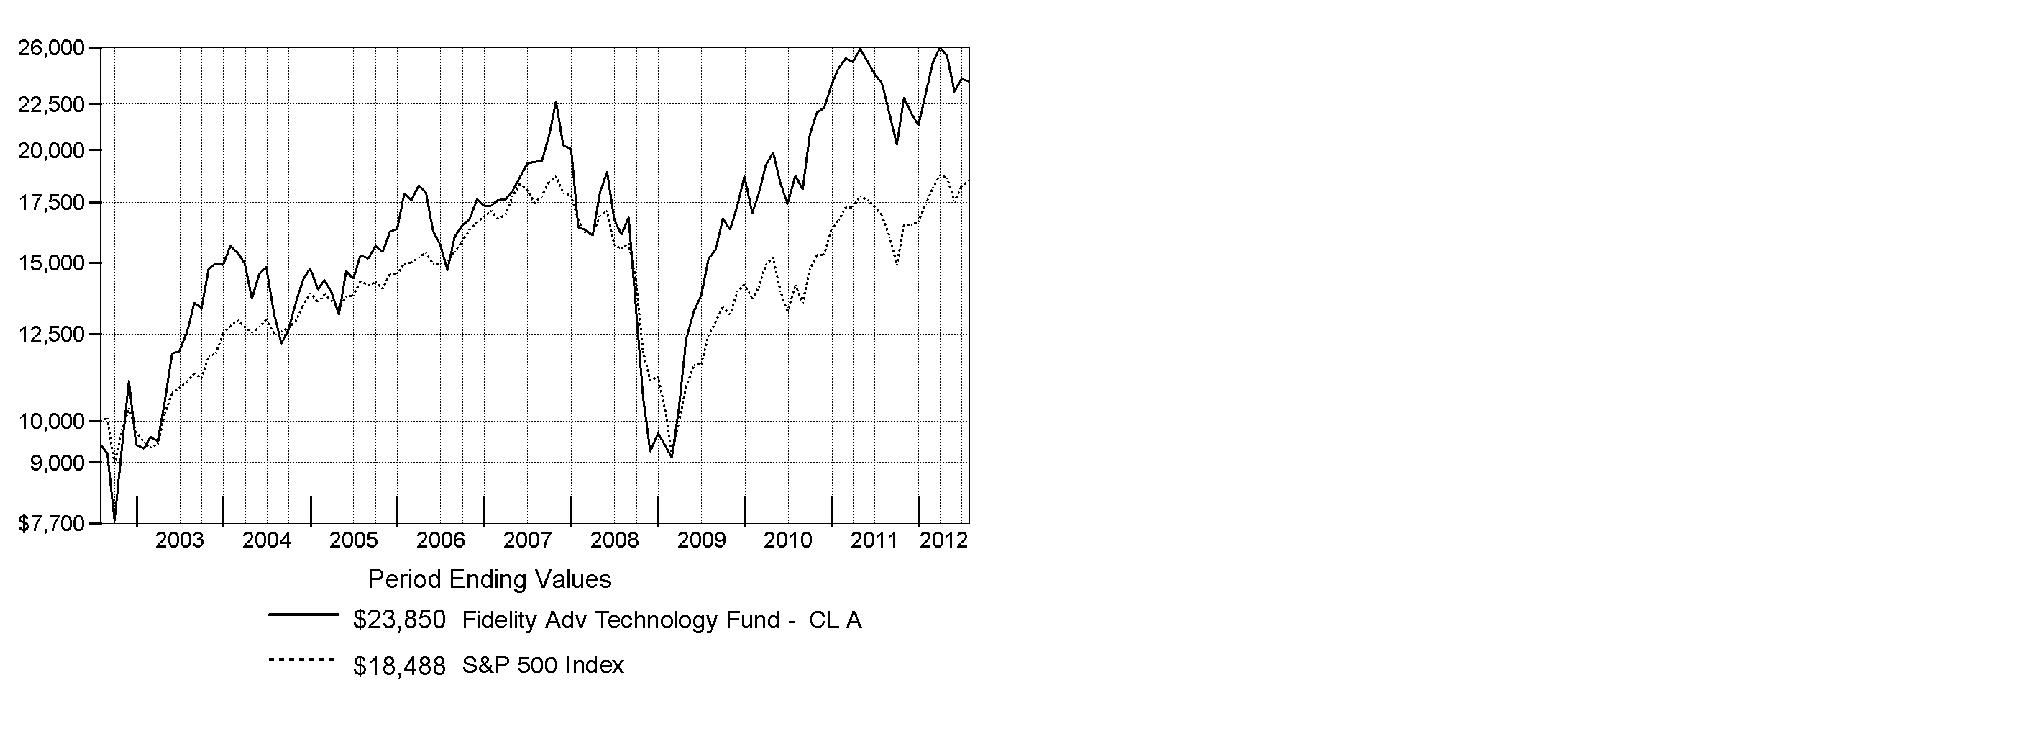
Annual Report
Fidelity Advisor Technology Fund
Market Recap: Major U.S. equity benchmarks posted solid gains for the year ending July 31, 2012, amid an uncertain investment environment. The broad-based S&P 500® Index returned 9.13%, while the blue-chip-laden Dow Jones Industrial AverageSM and technology-heavy Nasdaq Composite® Index gained 10.12% and 7.83%, respectively. Volatility spiked during the period's first half, as equities plummeted late last summer on Europe's debt woes, political wrangling over the U.S. debt ceiling and the sovereign credit-rating downgrade that followed. By October, a seemingly improved U.S. economy rejuvenated stocks, paving the way for major equity benchmarks to post their best first-quarter performance since 1998. However, more eurozone trouble, signs that the U.S. economy had turned sluggish and a slowdown in China caused stocks to slip in May, before a new wave of optimism took hold in June and July. Within the S&P 500®, more-defensive sectors such as telecommunication services (+30%) and consumer staples (+20%) fared best, while materials and energy significantly underperformed, returning -5%. Small- and mid-cap stocks trailed their less-volatile large-cap counterparts, with the Russell 2000® Index adding 0.19% and the Russell Midcap® Index rising 2.28%. Given turmoil and local currency weakness in Europe, foreign developed-markets stocks lost ground, with the MSCI® EAFE® Index returning -11.32%.
Comments from Charlie Chai, Portfolio Manager of Fidelity Advisor® Technology Fund: For the year, the fund's Class A, Class T, Class B and Class C shares returned 0.44%, 0.21%, -0.31% and -0.31%, respectively (excluding sales charges), significantly trailing the 10.29% gain of the MSCI® U.S. IM Information Technology 25/50 Index and also lagging the S&P 500®. Most of the fund's underperformance versus the MSCI index occurred during the period's first half, when investor concern about the European sovereign debt crisis and slowing economic growth in China hampered many of the portfolio's mid- and small-cap holdings, especially those with exposure to China. Among industry groups, the biggest detractors were semiconductors, application software, Internet software/services and communications equipment. In all of these cases, stock selection was the primary negative factor. Additionally, the fund's average cash position of roughly 5% was a drag on performance. At the individual stock level, a large overweighting in salesforce.com, a fast-growing player in cloud computing for customer relationship management software, worked against the fund's relative performance. Despite a solid rally in the first quarter of 2012, this stock delivered a loss for the period overall, as tepid global economic growth a relatively rich valuation to begin the period made investors wary of holding the stock. Also hampering our results were Polycom, a provider of high-definition videoconferencing equipment, enterprise software maker Kingdee International Software Group and online travel services provider Ctrip.com International, the latter of which was not held at period end. Kingdee and Ctrip are based in China and were non-index holdings. Conversely, stock picking in computer hardware stood out as a positive influence, while positioning in semiconductor equipment also helped. Within the former category, a sizable underweighting in Hewlett-Packard and not owning Dell were beneficial factors, given the weak showing of these two index components. Timely ownership of SanDisk, a manufacturer of the NAND flash memory used in mobile devices such as smartphones and tablets, also aided relative performance.
The views expressed above reflect those of the portfolio manager(s) only through the end of the period as stated on the cover of this report and do not necessarily represent the views of Fidelity or any other person in the Fidelity organization. Any such views are subject to change at any time based upon market or other conditions and Fidelity disclaims any responsibility to update such views. These views may not be relied on as investment advice and, because investment decisions for a Fidelity fund are based on numerous factors, may not be relied on as an indication of trading intent on behalf of any Fidelity fund.
Annual Report
Fidelity Advisor Technology Fund
As a shareholder of the Fund, you incur two types of costs: (1) transaction costs, including sales charges (loads) on purchase payments or redemption proceeds, redemption fees and (2) ongoing costs, including management fees, distribution and/or service (12b-1) fees and other Fund expenses. This Example is intended to help you understand your ongoing costs (in dollars) of investing in the Fund and to compare these costs with the ongoing costs of investing in other mutual funds.
The Example is based on an investment of $1,000 invested at the beginning of the period and held for the entire period (February 1, 2012 to July 31, 2012).
Actual Expenses
The first line of the accompanying table for each class of the Fund provides information about actual account values and actual expenses. You may use the information in this line, together with the amount you invested, to estimate the expenses that you paid over the period. Simply divide your account value by $1,000.00 (for example, an $8,600 account value divided by $1,000.00 = 8.6), then multiply the result by the number in the first line for a class of the Fund under the heading entitled "Expenses Paid During Period" to estimate the expenses you paid on your account during this period. In addition, the Fund, as a shareholder in the underlying Fidelity Central Funds, will indirectly bear its pro-rata share of the fees and expenses incurred by the underlying Fidelity Central Funds. These fees and expenses are not included in the Fund's annualized expense ratio used to calculate the expense estimate in the table below.
Hypothetical Example for Comparison Purposes
The second line of the accompanying table for each class of the Fund provides information about hypothetical account values and hypothetical expenses based on a Class' actual expense ratio and an assumed rate of return of 5% per year before expenses, which is not the Class' actual return. The hypothetical account values and expenses may not be used to estimate the actual ending account balance or expenses you paid for the period. You may use this information to compare the ongoing costs of investing in the Fund and other funds. To do so, compare this 5% hypothetical example with the 5% hypothetical examples that appear in the shareholder reports of the other funds. In addition, the Fund, as a shareholder in the underlying Fidelity Central Funds, will indirectly bear its pro-rata share of the fees and expenses incurred by the underlying Fidelity Central Funds. These fees and expenses are not included in the Fund's annualized expense ratio used to calculate the expense estimate in the table below.
Please note that the expenses shown in the table are meant to highlight your ongoing costs only and do not reflect any transaction costs. Therefore, the second line of the table is useful in comparing ongoing costs only, and will not help you determine the relative total costs of owning different funds. In addition, if these transactional costs were included, your costs would have been higher.
| Annualized Expense Ratio | Beginning
Account Value
February 1, 2012 | Ending
Account Value
July 31, 2012 | Expenses Paid
During Period*
February 1, 2012
to July 31, 2012 |
Class A | 1.18% | | | |
Actual | | $ 1,000.00 | $ 1,034.00 | $ 5.97 |
HypotheticalA | | $ 1,000.00 | $ 1,019.00 | $ 5.92 |
Class T | 1.43% | | | |
Actual | | $ 1,000.00 | $ 1,033.10 | $ 7.23 |
HypotheticalA | | $ 1,000.00 | $ 1,017.75 | $ 7.17 |
Class B | 1.93% | | | |
Actual | | $ 1,000.00 | $ 1,030.10 | $ 9.74 |
HypotheticalA | | $ 1,000.00 | $ 1,015.27 | $ 9.67 |
Class C | 1.91% | | | |
Actual | | $ 1,000.00 | $ 1,030.40 | $ 9.64 |
HypotheticalA | | $ 1,000.00 | $ 1,015.37 | $ 9.57 |
Institutional Class | .85% | | | |
Actual | | $ 1,000.00 | $ 1,036.00 | $ 4.30 |
HypotheticalA | | $ 1,000.00 | $ 1,020.64 | $ 4.27 |
A 5% return per year before expenses
* Expenses are equal to each Class' annualized expense ratio, multiplied by the average account value over the period, multiplied by 182/366 (to reflect the one-half year period).
Annual Report
Fidelity Advisor Technology Fund
Investment Changes (Unaudited)
Top Ten Stocks as of July 31, 2012 |
| % of fund's
net assets | % of fund's net assets
6 months ago |
Apple, Inc. | 21.6 | 15.3 |
Google, Inc. Class A | 5.2 | 3.0 |
Visa, Inc. Class A | 3.9 | 1.0 |
IBM Corp. | 3.0 | 1.5 |
QUALCOMM, Inc. | 2.9 | 2.0 |
salesforce.com, Inc. | 2.4 | 2.3 |
Cisco Systems, Inc. | 2.1 | 0.6 |
eBay, Inc. | 2.0 | 1.4 |
Altera Corp. | 1.9 | 2.0 |
Oracle Corp. | 1.7 | 3.2 |
| 46.7 | |
Top Industries (% of fund's net assets) |
As of July 31, 2012 |
| Computers & Peripherals | 24.5% | |
| Software | 17.6% | |
| Semiconductors & Semiconductor Equipment | 15.2% | |
| Internet Software & Services | 9.9% | |
| IT Services | 9.6% | |
| All Others* | 23.2% | |

As of January 31, 2012 |
| Semiconductors & Semiconductor Equipment | 23.6% | |
| Software | 22.8% | |
| Computers & Peripherals | 18.6% | |
| Internet Software & Services | 9.6% | |
| Communications Equipment | 7.5% | |
| All Others* | 17.9% | |

* Includes short-term investments and net other assets. |
Annual Report
Fidelity Advisor Technology Fund
Investments July 31, 2012
Showing Percentage of Net Assets
Common Stocks - 91.0% |
| Shares | | Value |
AEROSPACE & DEFENSE - 0.3% |
Aerospace & Defense - 0.3% |
DigitalGlobe, Inc. (a) | 69,951 | | $ 1,361,946 |
GeoEye, Inc. (a) | 27,167 | | 690,857 |
| | 2,052,803 |
AUTOMOBILES - 0.1% |
Automobile Manufacturers - 0.1% |
Tesla Motors, Inc. (a) | 12,300 | | 337,266 |
CHEMICALS - 0.6% |
Specialty Chemicals - 0.6% |
JSR Corp. | 243,100 | | 4,279,062 |
COMMUNICATIONS EQUIPMENT - 7.3% |
Communications Equipment - 7.3% |
AAC Acoustic Technology Holdings, Inc. | 337,000 | | 984,313 |
Acme Packet, Inc. (a) | 160,875 | | 2,549,869 |
ADTRAN, Inc. | 50,528 | | 1,090,394 |
ADVA AG Optical Networking (a) | 32,102 | | 195,122 |
Aruba Networks, Inc. (a) | 477 | | 6,764 |
Brocade Communications Systems, Inc. (a) | 13,400 | | 66,598 |
Ciena Corp. (a)(d) | 133,329 | | 2,137,264 |
Cisco Systems, Inc. | 936,599 | | 14,938,754 |
Comba Telecom Systems Holdings Ltd. | 187,500 | | 50,534 |
F5 Networks, Inc. (a) | 5,925 | | 553,277 |
Finisar Corp. (a) | 180,918 | | 2,248,811 |
Infinera Corp. (a) | 103,200 | | 569,664 |
JDS Uniphase Corp. (a) | 35,169 | | 346,063 |
Juniper Networks, Inc. (a) | 4,112 | | 72,083 |
Motorola Solutions, Inc. | 18,623 | | 900,236 |
NETGEAR, Inc. (a) | 23,005 | | 796,663 |
Polycom, Inc. (a) | 251,120 | | 2,194,789 |
QUALCOMM, Inc. | 347,064 | | 20,712,780 |
Riverbed Technology, Inc. (a) | 470 | | 8,291 |
Sandvine Corp. (a) | 751,600 | | 877,905 |
Sandvine Corp. (U.K.) (a) | 554,200 | | 641,045 |
Spirent Communications PLC | 28,700 | | 74,336 |
ZTE Corp. (H Shares) | 36,520 | | 48,695 |
| | 52,064,250 |
COMPUTERS & PERIPHERALS - 24.5% |
Computer Hardware - 22.5% |
Advantech Co. Ltd. | 136,000 | | 483,768 |
Apple, Inc. | 250,932 | | 153,259,215 |
Foxconn Technology Co. Ltd. | 60,000 | | 213,427 |
Getac Technology Corp. | 453,000 | | 335,135 |
Hewlett-Packard Co. | 58,165 | | 1,060,930 |
Lenovo Group Ltd. | 1,226,000 | | 850,565 |
Pegatron Corp. | 439,000 | | 576,242 |
Quanta Computer, Inc. | 84,000 | | 219,960 |
|
| Shares | | Value |
Stratasys, Inc. (a) | 40,675 | | $ 2,492,564 |
Wistron Corp. | 298,200 | | 322,203 |
| | 159,814,009 |
Computer Storage & Peripherals - 2.0% |
ADLINK Technology, Inc. | 2,300 | | 2,527 |
Catcher Technology Co. Ltd. | 126,000 | | 610,220 |
EMC Corp. (a) | 161,384 | | 4,229,875 |
Fusion-io, Inc. (a) | 43,200 | | 825,984 |
Gemalto NV | 10,513 | | 805,733 |
NetApp, Inc. (a) | 11,395 | | 372,275 |
SanDisk Corp. (a) | 121,026 | | 4,977,799 |
SIMPLO Technology Co. Ltd. | 36,000 | | 204,409 |
Synaptics, Inc. (a) | 65,513 | | 1,728,233 |
Wacom Co. Ltd. | 160 | | 356,202 |
| | 14,113,257 |
TOTAL COMPUTERS & PERIPHERALS | | 173,927,266 |
DIVERSIFIED CONSUMER SERVICES - 0.0% |
Education Services - 0.0% |
Educomp Solutions Ltd. | 16,123 | | 46,489 |
ELECTRICAL EQUIPMENT - 0.0% |
Electrical Components & Equipment - 0.0% |
Dynapack International Technology Corp. | 14,000 | | 64,295 |
ELECTRONIC EQUIPMENT & COMPONENTS - 2.7% |
Electronic Components - 1.7% |
Aeroflex Holding Corp. (a) | 20,143 | | 121,059 |
Amphenol Corp. Class A | 166 | | 9,774 |
Cheng Uei Precision Industries Co. Ltd. | 73,751 | | 135,481 |
Chimei Innolux Corp. (a) | 16,000 | | 5,104 |
FLEXium Interconnect, Inc. | 75,000 | | 304,359 |
InvenSense, Inc. | 11,134 | | 143,629 |
Largan Precision Co. Ltd. | 24,000 | | 492,986 |
Omron Corp. | 10,400 | | 207,089 |
Taiyo Yuden Co. Ltd. (d) | 7,500 | | 61,487 |
Tong Hsing Electronics Industries Ltd. | 834,000 | | 2,390,020 |
Universal Display Corp. (a)(d) | 210,316 | | 6,679,636 |
Vishay Intertechnology, Inc. (a) | 40,380 | | 398,551 |
Yageo Corp. | 2,014,000 | | 544,870 |
Zhen Ding Technology Holding Ltd. (a) | 61,000 | | 184,182 |
| | 11,678,227 |
Electronic Equipment & Instruments - 0.2% |
Chroma ATE, Inc. | 305,683 | | 684,060 |
Hitachi High-Technologies Corp. | 4,900 | | 121,960 |
Keyence Corp. | 950 | | 236,608 |
National Instruments Corp. | 2,746 | | 70,957 |
RealD, Inc. (a)(d) | 12,949 | | 125,605 |
SFA Engineering Corp. | 1,435 | | 53,432 |
SNU Precision Co. Ltd. (a) | 7,370 | | 48,431 |
Common Stocks - continued |
| Shares | | Value |
ELECTRONIC EQUIPMENT & COMPONENTS - CONTINUED |
Electronic Equipment & Instruments - continued |
Test Research, Inc. | 19,214 | | $ 29,681 |
TPK Holdings Co. | 31,662 | | 354,268 |
| | 1,725,002 |
Electronic Manufacturing Services - 0.7% |
Benchmark Electronics, Inc. (a) | 1,200 | | 18,912 |
Hon Hai Precision Industry Co. Ltd. (Foxconn) | 73,000 | | 206,273 |
IPG Photonics Corp. (a) | 2,200 | | 114,026 |
Jabil Circuit, Inc. | 120,280 | | 2,610,076 |
KEMET Corp. (a) | 1,417 | | 6,844 |
TE Connectivity Ltd. | 7,774 | | 256,620 |
Trimble Navigation Ltd. (a) | 38,311 | | 1,695,645 |
| | 4,908,396 |
Technology Distributors - 0.1% |
Arrow Electronics, Inc. (a) | 53 | | 1,789 |
Digital China Holdings Ltd. (H Shares) | 190,000 | | 296,465 |
VST Holdings Ltd. | 980,000 | | 152,914 |
WPG Holding Co. Ltd. | 111,975 | | 119,305 |
WT Microelectronics Co. Ltd. | 17,000 | | 21,946 |
| | 592,419 |
TOTAL ELECTRONIC EQUIPMENT & COMPONENTS | | 18,904,044 |
HEALTH CARE EQUIPMENT & SUPPLIES - 0.2% |
Health Care Equipment - 0.2% |
Biosensors International Group Ltd. (a) | 1,516,000 | | 1,498,457 |
China Kanghui Holdings sponsored ADR (a) | 200 | | 4,506 |
| | 1,502,963 |
HEALTH CARE TECHNOLOGY - 0.1% |
Health Care Technology - 0.1% |
athenahealth, Inc. (a) | 600 | | 54,900 |
So-net M3, Inc. | 93 | | 483,188 |
| | 538,088 |
HOUSEHOLD DURABLES - 0.0% |
Household Appliances - 0.0% |
Haier Electronics Group Co. Ltd. (a) | 17,000 | | 19,708 |
HOUSEHOLD PRODUCTS - 0.0% |
Household Products - 0.0% |
NVC Lighting Holdings Ltd. | 180,000 | | 32,729 |
INDUSTRIAL CONGLOMERATES - 0.1% |
Industrial Conglomerates - 0.1% |
Samsung Techwin Co. Ltd. | 8,218 | | 530,583 |
INTERNET & CATALOG RETAIL - 1.2% |
Internet Retail - 1.2% |
Amazon.com, Inc. (a) | 18,972 | | 4,426,168 |
E-Commerce China Dangdang, Inc. ADR (a) | 260 | | 1,310 |
|
| Shares | | Value |
Expedia, Inc. | 9,086 | | $ 517,811 |
Rakuten, Inc. | 284,400 | | 2,829,531 |
Start Today Co. Ltd. | 48,200 | | 637,763 |
TripAdvisor, Inc. (a) | 9,000 | | 336,690 |
| | 8,749,273 |
INTERNET SOFTWARE & SERVICES - 9.9% |
Internet Software & Services - 9.9% |
Active Network, Inc. (a) | 45,018 | | 638,805 |
Akamai Technologies, Inc. (a) | 65,627 | | 2,308,758 |
Baidu.com, Inc. sponsored ADR (a) | 559 | | 67,371 |
Bankrate, Inc. (a) | 21,500 | | 342,925 |
Bazaarvoice, Inc. (d) | 2,800 | | 43,400 |
Cornerstone OnDemand, Inc. (a) | 55,000 | | 1,307,900 |
DealerTrack Holdings, Inc. (a) | 12,300 | | 358,791 |
eBay, Inc. (a) | 317,148 | | 14,049,656 |
ExactTarget, Inc. (d) | 15,800 | | 360,240 |
Facebook, Inc.: | | | |
Class A | 240 | | 5,210 |
Class B (a)(f) | 37,876 | | 740,059 |
Google, Inc. Class A (a) | 58,790 | | 37,212,306 |
INFO Edge India Ltd. | 35,836 | | 207,205 |
Kakaku.com, Inc. | 25,600 | | 814,593 |
LogMeIn, Inc. (a) | 22,279 | | 422,187 |
Mail.ru Group Ltd. GDR (a)(e) | 1,800 | | 54,576 |
MercadoLibre, Inc. | 13,834 | | 924,250 |
Millennial Media, Inc. (d) | 32,200 | | 319,746 |
NHN Corp. | 2,044 | | 497,139 |
Open Text Corp. (a) | 100 | | 4,518 |
Qihoo 360 Technology Co. Ltd. ADR (a)(d) | 20,200 | | 297,142 |
Rackspace Hosting, Inc. (a) | 40,569 | | 1,780,168 |
Renren, Inc. ADR (a)(d) | 5,900 | | 22,125 |
Responsys, Inc. (a) | 114,840 | | 1,280,466 |
SciQuest, Inc. (a) | 51,877 | | 882,947 |
SINA Corp. (a)(d) | 1,526 | | 69,296 |
SouFun Holdings Ltd. ADR (d) | 47,370 | | 561,808 |
Tencent Holdings Ltd. | 23,300 | | 696,473 |
Tudou Holdings Ltd. ADR | 59,559 | | 1,570,571 |
Velti PLC (a) | 10,736 | | 58,511 |
VeriSign, Inc. (a) | 8,090 | | 359,358 |
Vocus, Inc. (a) | 84,600 | | 1,463,580 |
XO Group, Inc. (a) | 5,200 | | 44,772 |
Yahoo!, Inc. (a) | 4,568 | | 72,357 |
Yandex NV (a) | 16,176 | | 311,064 |
| | 70,150,273 |
IT SERVICES - 9.6% |
Data Processing & Outsourced Services - 5.3% |
Automatic Data Processing, Inc. | 40,907 | | 2,313,291 |
Fidelity National Information Services, Inc. | 55,105 | | 1,732,501 |
Fiserv, Inc. (a) | 9,900 | | 694,287 |
Global Payments, Inc. | 32,400 | | 1,387,368 |
Common Stocks - continued |
| Shares | | Value |
IT SERVICES - CONTINUED |
Data Processing & Outsourced Services - continued |
Jack Henry & Associates, Inc. | 22,692 | | $ 788,093 |
MasterCard, Inc. Class A | 6,666 | | 2,910,176 |
Paychex, Inc. | 2,300 | | 75,187 |
Syntel, Inc. | 7,600 | | 441,788 |
VeriFone Systems, Inc. (a) | 1,944 | | 70,548 |
Visa, Inc. Class A | 211,550 | | 27,304,759 |
| | 37,717,998 |
IT Consulting & Other Services - 4.3% |
Accenture PLC Class A | 39,376 | | 2,374,373 |
Bit-isle, Inc. | 1,600 | | 13,215 |
Camelot Information Systems, Inc. ADR (a) | 145 | | 305 |
ChinaSoft International Ltd. (a) | 20,000 | | 4,281 |
Cognizant Technology Solutions Corp. Class A (a) | 6,089 | | 345,673 |
HiSoft Technology International Ltd. ADR (a) | 11,117 | | 125,400 |
IBM Corp. | 108,717 | | 21,306,358 |
InterXion Holding N.V. (a) | 10,000 | | 192,500 |
ServiceSource International, Inc. (a)(d) | 472,081 | | 5,325,074 |
Teradata Corp. (a) | 11,046 | | 746,931 |
Virtusa Corp. (a) | 11,200 | | 169,680 |
| | 30,603,790 |
TOTAL IT SERVICES | | 68,321,788 |
LIFE SCIENCES TOOLS & SERVICES - 0.2% |
Life Sciences Tools & Services - 0.2% |
Illumina, Inc. (a)(d) | 29,106 | | 1,207,026 |
WuXi PharmaTech Cayman, Inc. sponsored ADR (a) | 27,300 | | 369,096 |
| | 1,576,122 |
MACHINERY - 0.4% |
Industrial Machinery - 0.4% |
Airtac International Group | 179,000 | | 908,751 |
Fanuc Corp. | 800 | | 123,511 |
HIWIN Technologies Corp. | 71,390 | | 661,681 |
Mirle Automation Corp. | 95,738 | | 62,354 |
Nippon Thompson Co. Ltd. | 149,000 | | 640,230 |
Shin Zu Shing Co. Ltd. | 247,000 | | 709,486 |
| | 3,106,013 |
MEDIA - 0.5% |
Advertising - 0.4% |
Dentsu, Inc. | 200 | | 5,309 |
Focus Media Holding Ltd. ADR (d) | 148,882 | | 2,944,886 |
ReachLocal, Inc. (a) | 1,558 | | 18,260 |
| | 2,968,455 |
Cable & Satellite - 0.1% |
DISH Network Corp. Class A | 12,360 | | 380,194 |
|
| Shares | | Value |
Movies & Entertainment - 0.0% |
IMAX Corp. (a) | 6,530 | | $ 144,705 |
TOTAL MEDIA | | 3,493,354 |
OFFICE ELECTRONICS - 0.0% |
Office Electronics - 0.0% |
Xerox Corp. | 8,333 | | 57,748 |
PHARMACEUTICALS - 0.1% |
Pharmaceuticals - 0.1% |
China Medical System Holding Ltd. | 1,259,250 | | 623,560 |
PROFESSIONAL SERVICES - 0.1% |
Research & Consulting Services - 0.1% |
Acacia Research Corp. - Acacia Technologies (a) | 8,600 | | 243,466 |
IHS, Inc. Class A (a) | 6,800 | | 749,836 |
| | 993,302 |
REAL ESTATE MANAGEMENT & DEVELOPMENT - 0.0% |
Real Estate Services - 0.0% |
E-House China Holdings Ltd. ADR | 70,929 | | 334,076 |
SEMICONDUCTORS & SEMICONDUCTOR EQUIPMENT - 14.9% |
Semiconductor Equipment - 2.2% |
Advanced Energy Industries, Inc. (a) | 5,757 | | 70,926 |
Amkor Technology, Inc. (a)(d) | 1,594 | | 8,496 |
Applied Materials, Inc. | 6,662 | | 72,549 |
Asia Pacific Systems, Inc. (a) | 13,929 | | 136,128 |
ASM International NV: | | | |
unit | 63,458 | | 2,404,424 |
(Netherlands) | 37,200 | | 1,412,718 |
ASML Holding NV | 60,335 | | 3,469,263 |
Cymer, Inc. (a) | 56,354 | | 3,224,012 |
Dainippon Screen Manufacturing Co. Ltd. | 18,000 | | 120,240 |
Entegris, Inc. (a) | 106,908 | | 860,609 |
GCL-Poly Energy Holdings Ltd. | 32,000 | | 4,746 |
GT Advanced Technologies, Inc. (a) | 1,264 | | 6,472 |
ICD Co. Ltd. | 17,376 | | 199,782 |
KLA-Tencor Corp. | 1,534 | | 78,096 |
Lam Research Corp. (a) | 1,989 | | 68,441 |
Micronics Japan Co. Ltd. | 34,800 | | 119,143 |
Rubicon Technology, Inc. (a) | 679 | | 6,824 |
Teradyne, Inc. (a) | 23,920 | | 351,863 |
Ultratech, Inc. (a) | 59,227 | | 1,884,011 |
Visual Photonics Epitaxy Co. Ltd. | 626,800 | | 933,710 |
| | 15,432,453 |
Semiconductors - 12.7% |
Advanced Micro Devices, Inc. (a) | 1,157 | | 4,697 |
Alpha & Omega Semiconductor Ltd. (a) | 8,432 | | 65,011 |
Altera Corp. | 371,889 | | 13,183,465 |
Analog Devices, Inc. | 1,873 | | 73,197 |
Applied Micro Circuits Corp. (a) | 157,393 | | 900,288 |
Common Stocks - continued |
| Shares | | Value |
SEMICONDUCTORS & SEMICONDUCTOR EQUIPMENT - CONTINUED |
Semiconductors - continued |
ARM Holdings PLC sponsored ADR | 3,019 | | $ 78,434 |
Atmel Corp. (a) | 11,522 | | 67,519 |
Avago Technologies Ltd. | 62,995 | | 2,330,815 |
Broadcom Corp. Class A | 253,285 | | 8,581,296 |
Canadian Solar, Inc. (a) | 32 | | 85 |
Cavium, Inc. (a)(d) | 166,300 | | 4,493,426 |
Cirrus Logic, Inc. (a) | 120,397 | | 4,426,998 |
Cree, Inc. (a)(d) | 479,416 | | 11,482,013 |
Cypress Semiconductor Corp. | 5,622 | | 60,099 |
Dialog Semiconductor PLC (a) | 31,666 | | 609,168 |
Diodes, Inc. (a) | 370 | | 7,008 |
Duksan Hi-Metal Co. Ltd. (a) | 13,744 | | 257,091 |
Epistar Corp. | 2,000 | | 3,754 |
Fairchild Semiconductor International, Inc. (a) | 565 | | 7,831 |
Freescale Semiconductor Holdings I Ltd. (a) | 692 | | 7,384 |
Genesis Photonics, Inc. | 15,000 | | 13,026 |
Hittite Microwave Corp. (a) | 6,029 | | 305,489 |
Imagination Technologies Group PLC (a) | 403,859 | | 3,172,284 |
Infineon Technologies AG | 10,500 | | 76,598 |
Inotera Memories, Inc. (a) | 3,139,000 | | 596,557 |
Inphi Corp. (a) | 41,784 | | 459,624 |
International Rectifier Corp. (a) | 19,349 | | 329,707 |
Intersil Corp. Class A | 71,923 | | 662,411 |
JA Solar Holdings Co. Ltd. ADR (a) | 40,931 | | 38,189 |
LSI Corp. (a) | 227,201 | | 1,567,687 |
MagnaChip Semiconductor Corp. (a) | 7,844 | | 79,852 |
Marvell Technology Group Ltd. | 566 | | 6,373 |
MediaTek, Inc. | 169,000 | | 1,439,379 |
Mellanox Technologies Ltd. (a) | 17,000 | | 1,782,620 |
Micrel, Inc. | 7,241 | | 67,631 |
Micron Technology, Inc. (a) | 705,995 | | 4,384,229 |
Microsemi Corp. (a) | 4,100 | | 79,376 |
Monolithic Power Systems, Inc. (a) | 66,633 | | 1,291,348 |
MStar Semiconductor, Inc. | 394,000 | | 2,520,074 |
Novatek Microelectronics Corp. | 81,000 | | 236,994 |
NVIDIA Corp. (a) | 6,070 | | 82,188 |
NXP Semiconductors NV (a) | 244,929 | | 5,532,946 |
O2Micro International Ltd. sponsored ADR (a) | 14,600 | | 56,648 |
Omnivision Technologies, Inc. (a) | 93,100 | | 1,305,262 |
ON Semiconductor Corp. (a) | 9,446 | | 65,555 |
Phison Electronics Corp. | 61,000 | | 499,165 |
PMC-Sierra, Inc. (a) | 59,184 | | 314,859 |
Power Integrations, Inc. | 26,300 | | 926,812 |
Radiant Opto-Electronics Corp. | 15,000 | | 59,118 |
Rambus, Inc. (a) | 165,107 | | 693,449 |
RF Micro Devices, Inc. (a) | 156,888 | | 608,725 |
Samsung Electronics Co. Ltd. | 350 | | 405,202 |
Semtech Corp. (a) | 15,100 | | 360,739 |
|
| Shares | | Value |
Seoul Semiconductor Co. Ltd. | 11,191 | | $ 210,820 |
Silicon Laboratories, Inc. (a) | 1,700 | | 62,815 |
SK Hynix, Inc. | 56,590 | | 1,086,084 |
Skyworks Solutions, Inc. (a) | 171,751 | | 4,968,756 |
Spreadtrum Communications, Inc. ADR (d) | 178,768 | | 3,232,125 |
Standard Microsystems Corp. (a) | 46,071 | | 1,700,481 |
STMicroelectronics NV | 16,900 | | 90,668 |
STMicroelectronics NV (NY Shares) unit | 160,200 | | 858,672 |
Taiwan Surface Mounting Technology Co. Ltd. | 107,320 | | 166,142 |
Texas Instruments, Inc. | 12,950 | | 352,758 |
Trina Solar Ltd. (a)(d) | 10,094 | | 47,644 |
TriQuint Semiconductor, Inc. (a) | 78,814 | | 444,511 |
United Microelectronics Corp. | 4,000 | | 1,673 |
Vanguard International Semiconductor Corp. | 17,000 | | 7,154 |
Win Semiconductors Corp. | 225,433 | | 266,544 |
Xilinx, Inc. | 244 | | 7,906 |
YoungTek Electronics Corp. | 1,146 | | 2,855 |
| | 90,167,303 |
TOTAL SEMICONDUCTORS & SEMICONDUCTOR EQUIPMENT | | 105,599,756 |
SOFTWARE - 17.6% |
Application Software - 9.5% |
Adobe Systems, Inc. (a) | 22,086 | | 682,016 |
ANSYS, Inc. (a) | 28,853 | | 1,730,026 |
AsiaInfo-Linkage, Inc. (a) | 202,188 | | 2,070,405 |
Aspen Technology, Inc. (a) | 204,102 | | 4,771,905 |
Autodesk, Inc. (a) | 15,108 | | 512,463 |
AutoNavi Holdings Ltd. ADR (a) | 5,621 | | 69,532 |
BroadSoft, Inc. (a)(d) | 86,165 | | 2,115,351 |
Citrix Systems, Inc. (a) | 137,795 | | 10,014,941 |
Comverse Technology, Inc. (a) | 47,105 | | 255,780 |
Concur Technologies, Inc. (a) | 46,598 | | 3,147,229 |
Descartes Systems Group, Inc. (a) | 139,200 | | 1,159,017 |
Informatica Corp. (a) | 69,036 | | 2,037,252 |
Intuit, Inc. | 12,136 | | 704,131 |
JDA Software Group, Inc. (a) | 12,441 | | 368,005 |
Jive Software, Inc. | 1,700 | | 34,051 |
Kingdee International Software Group Co. Ltd. (a) | 9,630,800 | | 1,117,738 |
Manhattan Associates, Inc. (a) | 97 | | 4,529 |
MicroStrategy, Inc. Class A (a) | 16,961 | | 1,975,278 |
Nuance Communications, Inc. (a) | 155,639 | | 3,167,254 |
Parametric Technology Corp. (a) | 201,585 | | 4,342,141 |
Pegasystems, Inc. (d) | 79,252 | | 2,201,621 |
PROS Holdings, Inc. (a) | 8,633 | | 120,344 |
QLIK Technologies, Inc. (a) | 79,587 | | 1,591,740 |
RealPage, Inc. (a) | 4,600 | | 102,212 |
salesforce.com, Inc. (a) | 135,653 | | 16,869,807 |
SolarWinds, Inc. (a) | 43,114 | | 2,301,856 |
Common Stocks - continued |
| Shares | | Value |
SOFTWARE - CONTINUED |
Application Software - continued |
Splunk, Inc. | 200 | | $ 5,880 |
Synchronoss Technologies, Inc. (a) | 92,548 | | 1,769,518 |
Synopsys, Inc. (a) | 2,500 | | 75,725 |
TIBCO Software, Inc. (a) | 37,780 | | 1,061,240 |
TiVo, Inc. (a) | 8,000 | | 69,520 |
VanceInfo Technologies, Inc. ADR (a)(d) | 78,953 | | 750,843 |
| | 67,199,350 |
Home Entertainment Software - 0.6% |
Activision Blizzard, Inc. | 46,300 | | 556,989 |
Capcom Co. Ltd. | 76,500 | | 1,555,958 |
Giant Interactive Group, Inc. ADR (d) | 388,429 | | 1,751,815 |
Nintendo Co. Ltd. | 600 | | 66,745 |
Take-Two Interactive Software, Inc. (a) | 64,262 | | 564,220 |
| | 4,495,727 |
Systems Software - 7.5% |
Allot Communications Ltd. (a) | 27,500 | | 675,950 |
Ariba, Inc. (a) | 80,599 | | 3,581,014 |
BMC Software, Inc. (a) | 43,366 | | 1,717,294 |
Check Point Software Technologies Ltd. (a) | 1,413 | | 68,629 |
CommVault Systems, Inc. (a) | 51,744 | | 2,510,619 |
Fortinet, Inc. (a) | 70,542 | | 1,693,713 |
Infoblox, Inc. | 3,000 | | 63,030 |
Insyde Software Corp. | 31,000 | | 111,306 |
Microsoft Corp. | 357,471 | | 10,534,670 |
NetSuite, Inc. (a) | 39,618 | | 2,192,460 |
Oracle Corp. | 396,058 | | 11,960,952 |
Progress Software Corp. (a) | 17,578 | | 341,716 |
Red Hat, Inc. (a) | 118,534 | | 6,360,534 |
ServiceNow, Inc. | 1,800 | | 48,600 |
Sourcefire, Inc. (a) | 14,743 | | 752,630 |
Symantec Corp. (a) | 285,048 | | 4,489,506 |
Totvs SA | 80,000 | | 1,475,698 |
VMware, Inc. Class A (a) | 55,146 | | 5,005,051 |
| | 53,583,372 |
TOTAL SOFTWARE | | 125,278,449 |
WIRELESS TELECOMMUNICATION SERVICES - 0.6% |
Wireless Telecommunication Services - 0.6% |
SBA Communications Corp. Class A (a) | 69,529 | | 4,106,383 |
TOTAL COMMON STOCKS (Cost $615,280,200) |
646,689,643
|
Convertible Bonds - 0.5% |
| Principal Amount | | |
COMMUNICATIONS EQUIPMENT - 0.2% |
Communications Equipment - 0.2% |
Ciena Corp. 0.25% 5/1/13 | | $ 1,270,000 | | 1,261,237 |
|
| Principal Amount | | Value |
SEMICONDUCTORS & SEMICONDUCTOR EQUIPMENT - 0.3% |
Semiconductors - 0.3% |
JA Solar Holdings Co. Ltd. 4.5% 5/15/13 | | $ 2,179,000 | | $ 1,993,785 |
TOTAL CONVERTIBLE BONDS (Cost $3,143,432) |
3,255,022
|
Master Notes - 0.0% |
|
OZ Optics Ltd. 5% 11/5/14 (f)
(Cost $183,336) | | 180,662 | |
180,662
|
Money Market Funds - 12.6% |
| Shares | | |
Fidelity Cash Central Fund, 0.17% (b) | 58,879,985 | | 58,879,985 |
Fidelity Securities Lending Cash Central Fund, 0.18% (b)(c) | 30,624,219 | | 30,624,219 |
TOTAL MONEY MARKET FUNDS (Cost $89,504,204) |
89,504,204
|
TOTAL INVESTMENT PORTFOLIO - 104.1% (Cost $708,111,172) | | 739,629,531 |
NET OTHER ASSETS (LIABILITIES) - (4.1)% | | (29,367,507) |
NET ASSETS - 100% | $ 710,262,024 |
Legend |
(a) Non-income producing |
(b) Affiliated fund that is available only to investment companies and other accounts managed by Fidelity Investments. The rate quoted is the annualized seven-day yield of the fund at period end. A complete unaudited listing of the fund's holdings as of its most recent quarter end is available upon request. In addition, each Fidelity Central Fund's financial statements, which are not covered by the Fund's Report of Independent Registered Public Accounting Firm, are available on the SEC's website or upon request. |
(c) Investment made with cash collateral received from securities on loan. |
(d) Security or a portion of the security is on loan at period end. |
(e) Security exempt from registration under Rule 144A of the Securities Act of 1933. These securities may be resold in transactions exempt from registration, normally to qualified institutional buyers. At the end of the period, the value of these securities amounted to $54,576 or 0.0% of net assets. |
(f) Restricted securities - Investment in securities not registered under the Securities Act of 1933 (excluding 144A issues). At the end of the period, the value of restricted securities (excluding 144A issues) amounted to $920,722 or 0.1% of net assets. |
Additional information on each restricted holding is as follows: |
Security | Acquisition Date | Acquisition Cost |
Facebook, Inc. Class B | 3/31/11 - 5/19/11 | $ 947,157 |
OZ Optics Ltd. 5% 11/5/14 | 11/5/10 | $ 185,227 |
Affiliated Central Funds |
Information regarding fiscal year to date income earned by the Fund from investments in Fidelity Central Funds is as follows: |
Fund | Income earned |
Fidelity Cash Central Fund | $ 55,296 |
Fidelity Securities Lending Cash Central Fund | 563,228 |
Total | $ 618,524 |
Other Information |
The following is a summary of the inputs used, as of July 31, 2012, involving the Fund's assets and liabilities carried at fair value. The inputs or methodology used for valuing securities may not be an indication of the risk associated with investing in those securities. For more information on valuation inputs, and their aggregation into the levels used in the table below, please refer to the Security Valuation section in the accompanying Notes to Financial Statements. |
Valuation Inputs at Reporting Date: |
Description | Total | Level 1 | Level 2 | Level 3 |
Investments in Securities: | | | | |
Common Stocks | $ 646,689,643 | $ 633,152,680 | $ 13,504,234 | $ 32,729 |
Convertible Bonds | 3,255,022 | - | 3,255,022 | - |
Master Notes | 180,662 | - | - | 180,662 |
Money Market Funds | 89,504,204 | 89,504,204 | - | - |
Total Investments in Securities: | $ 739,629,531 | $ 722,656,884 | $ 16,759,256 | $ 213,391 |
The following is a summary of transfers between Level 1 and Level 2 for the period ended July 31, 2012. Transfers are assumed to have occurred at the beginning of the period, and are primarily attributable to the valuation techniques used for foreign equity securities, as discussed in the accompanying Notes to Financial Statements: |
Transfers | Total |
Level 1 to Level 2 | $ 7,775,532 |
Level 2 to Level 1 | $ - |
Distribution of investments by country or territory of incorporation, as a percentage of total net assets, is as follows. (Unaudited) |
United States of America | 88.5% |
Cayman Islands | 2.9% |
Netherlands | 2.1% |
Taiwan | 1.7% |
Japan | 1.7% |
Others (Individually Less Than 1%) | 3.1% |
| 100.0% |
See accompanying notes which are an integral part of the financial statements.
Annual Report
Fidelity Advisor Technology Fund
Statement of Assets and Liabilities
| July 31, 2012 |
| | |
Assets | | |
Investment in securities, at value (including securities loaned of $29,733,355) - See accompanying schedule: Unaffiliated issuers (cost $618,606,968) | $ 650,125,327 | |
Fidelity Central Funds (cost $89,504,204) | 89,504,204 | |
Total Investments (cost $708,111,172) | | $ 739,629,531 |
Receivable for investments sold | | 13,437,674 |
Receivable for fund shares sold | | 234,920 |
Dividends receivable | | 418,973 |
Interest receivable | | 37,209 |
Distributions receivable from Fidelity Central Funds | | 26,513 |
Other receivables | | 33,608 |
Total assets | | 753,818,428 |
| | |
Liabilities | | |
Payable to custodian bank | $ 215 | |
Payable for investments purchased | 10,619,841 | |
Payable for fund shares redeemed | 1,501,342 | |
Accrued management fee | 328,034 | |
Distribution and service plan fees payable | 228,758 | |
Other affiliated payables | 191,808 | |
Other payables and accrued expenses | 62,187 | |
Collateral on securities loaned, at value | 30,624,219 | |
Total liabilities | | 43,556,404 |
| | |
Net Assets | | $ 710,262,024 |
Net Assets consist of: | | |
Paid in capital | | $ 806,641,990 |
Accumulated net investment loss | | (2,745,337) |
Accumulated undistributed net realized gain (loss) on investments and foreign currency transactions | | (125,154,107) |
Net unrealized appreciation (depreciation) on investments and assets and liabilities in foreign currencies | | 31,519,478 |
Net Assets | | $ 710,262,024 |
Statement of Assets and Liabilities - continued
| July 31, 2012 |
| | |
Calculation of Maximum Offering Price Class A:
Net Asset Value and redemption price per share ($336,692,832 ÷ 13,333,428 shares) | | $ 25.25 |
| | |
Maximum offering price per share (100/94.25 of $25.25) | | $ 26.79 |
Class T:
Net Asset Value and redemption price per share ($172,708,820 ÷ 7,084,653 shares) | | $ 24.38 |
| | |
Maximum offering price per share (100/96.50 of $24.38) | | $ 25.26 |
Class B:
Net Asset Value and offering price per share ($17,476,122 ÷ 773,220 shares)A | | $ 22.60 |
| | |
Class C:
Net Asset Value and offering price per share ($88,074,296 ÷ 3,879,255 shares)A | | $ 22.70 |
| | |
Institutional Class:
Net Asset Value, offering price and redemption price per share ($95,309,954 ÷ 3,596,895 shares) | | $ 26.50 |
A Redemption price per share is equal to net asset value less any applicable contingent deferred sales charge.
See accompanying notes which are an integral part of the financial statements.
Annual Report
Fidelity Advisor Technology Fund
Financial Statements - continued
Statement of Operations
| Year ended July 31, 2012 |
| | |
Investment Income | | |
Dividends | | $ 3,436,093 |
Interest | | 367,647 |
Income from Fidelity Central Funds (including $563,228 from security lending) | | 618,524 |
Total income | | 4,422,264 |
| | |
Expenses | | |
Management fee | $ 4,003,607 | |
Transfer agent fees | 2,091,380 | |
Distribution and service plan fees | 2,805,168 | |
Accounting and security lending fees | 261,338 | |
Custodian fees and expenses | 109,964 | |
Independent trustees' compensation | 4,863 | |
Registration fees | 88,559 | |
Audit | 54,104 | |
Legal | 3,271 | |
Miscellaneous | 7,711 | |
Total expenses before reductions | 9,429,965 | |
Expense reductions | (121,625) | 9,308,340 |
Net investment income (loss) | | (4,886,076) |
Realized and Unrealized Gain (Loss) Net realized gain (loss) on: | | |
Investment securities: | | |
Unaffiliated issuers | 13,607,206 | |
Foreign currency transactions | (41,554) | |
Total net realized gain (loss) | | 13,565,652 |
Change in net unrealized appreciation (depreciation) on: Investment securities | (12,833,312) | |
Assets and liabilities in foreign currencies | (1,891) | |
Total change in net unrealized appreciation (depreciation) | | (12,835,203) |
Net gain (loss) | | 730,449 |
Net increase (decrease) in net assets resulting from operations | | $ (4,155,627) |
Statement of Changes in Net Assets
| Year ended
July 31,
2012 | Year ended
July 31,
2011 |
Increase (Decrease) in Net Assets | | |
Operations | | |
Net investment income (loss) | $ (4,886,076) | $ (6,857,636) |
Net realized gain (loss) | 13,565,652 | 189,083,406 |
Change in net unrealized appreciation (depreciation) | (12,835,203) | (20,605,446) |
Net increase (decrease) in net assets resulting from operations | (4,155,627) | 161,620,324 |
Share transactions - net increase (decrease) | (54,812,282) | (15,631,022) |
Redemption fees | 30,293 | 32,306 |
Total increase (decrease) in net assets | (58,937,616) | 146,021,608 |
| | |
Net Assets | | |
Beginning of period | 769,199,640 | 623,178,032 |
End of period (including accumulated net investment loss of $2,745,337 and accumulated net investment loss of $24, respectively) | $ 710,262,024 | $ 769,199,640 |
See accompanying notes which are an integral part of the financial statements.
Annual Report
Financial Highlights - Class A
Years ended July 31, | 2012 | 2011 | 2010 | 2009 | 2008 |
Selected Per-Share Data | | | | | |
Net asset value, beginning of period | $ 25.14 | $ 19.83 | $ 16.03 | $ 17.04 | $ 20.55 |
Income from Investment Operations | | | | | |
Net investment income (loss) C | (.13) | (.18) | (.16) | .02 F | (.10) |
Net realized and unrealized gain (loss) | .24 | 5.49 | 3.96 | (1.03) | (3.41) |
Total from investment operations | .11 | 5.31 | 3.80 | (1.01) | (3.51) |
Redemption fees added to paid in capital C,H | - | - | - | - | - |
Net asset value, end of period | $ 25.25 | $ 25.14 | $ 19.83 | $ 16.03 | $ 17.04 |
Total Return A, B | .44% | 26.78% | 23.71% | (5.93)% | (17.08)% |
Ratios to Average Net Assets D, G | | | | | |
Expenses before reductions | 1.18% | 1.18% | 1.21% | 1.23% | 1.21% |
Expenses net of fee waivers, if any | 1.18% | 1.18% | 1.21% | 1.23% | 1.21% |
Expenses net of all reductions | 1.17% | 1.16% | 1.18% | 1.22% | 1.19% |
Net investment income (loss) | (.55)% | (.73)% | (.83)% | .17% F | (.49)% |
Supplemental Data | | | | | |
Net assets, end of period (000 omitted) | $ 336,693 | $ 375,609 | $ 312,659 | $ 258,433 | $ 275,117 |
Portfolio turnover rate E | 201% | 167% | 115% | 225% | 214% |
A Total returns would have been lower if certain expenses had not been reduced during the applicable periods shown.
B Total returns do not include the effect of the sales charges.
C Calculated based on average shares outstanding during the period.
D Fees and expenses of any underlying Fidelity Central Funds are not included in the Fund's expense ratio. The Fund indirectly bears its proportionate share of the expenses of any underlying Fidelity Central Funds.
E Amount does not include the portfolio activity of any underlying Fidelity Central Funds.
F Investment income per share reflects a large, non-recurring dividend which amounted to $.04 per share. Excluding this non-recurring dividend, the ratio of net investment income (loss) to average net assets would have been (.18)%.
G Expense ratios reflect operating expenses of the class. Expenses before reductions do not reflect amounts reimbursed by the investment adviser or reductions from brokerage service arrangements or reductions from other expense offset arrangements and do not represent the amount paid by the class during periods when reimbursements or reductions occur. Expenses net of fee waivers reflect expenses after reimbursement by the investment adviser but prior to reductions from brokerage service arrangements or other expense offset arrangements. Expenses net of all reductions represent the net expenses paid by the class.
H Amount represents less than $.01 per share.
Financial Highlights - Class T
Years ended July 31, | 2012 | 2011 | 2010 | 2009 | 2008 |
Selected Per-Share Data | | | | | |
Net asset value, beginning of period | $ 24.33 | $ 19.24 | $ 15.59 | $ 16.62 | $ 20.09 |
Income from Investment Operations | | | | | |
Net investment income (loss) C | (.19) | (.23) | (.20) | (.01) F | (.14) |
Net realized and unrealized gain (loss) | .24 | 5.32 | 3.85 | (1.02) | (3.33) |
Total from investment operations | .05 | 5.09 | 3.65 | (1.03) | (3.47) |
Redemption fees added to paid in capital C,H | - | - | - | - | - |
Net asset value, end of period | $ 24.38 | $ 24.33 | $ 19.24 | $ 15.59 | $ 16.62 |
Total Return A, B | .21% | 26.46% | 23.41% | (6.20)% | (17.27)% |
Ratios to Average Net Assets D, G | | | | | |
Expenses before reductions | 1.43% | 1.43% | 1.46% | 1.49% | 1.46% |
Expenses net of fee waivers, if any | 1.43% | 1.43% | 1.46% | 1.49% | 1.46% |
Expenses net of all reductions | 1.42% | 1.40% | 1.44% | 1.48% | 1.45% |
Net investment income (loss) | (.80)% | (.98)% | (1.09)% | (.09)% F | (.74)% |
Supplemental Data | | | | | |
Net assets, end of period (000 omitted) | $ 172,709 | $ 196,913 | $ 169,049 | $ 151,170 | $ 173,917 |
Portfolio turnover rate E | 201% | 167% | 115% | 225% | 214% |
A Total returns would have been lower if certain expenses had not been reduced during the applicable periods shown.
B Total returns do not include the effect of the sales charges.
C Calculated based on average shares outstanding during the period.
D Fees and expenses of any underlying Fidelity Central Funds are not included in the Fund's expense ratio. The Fund indirectly bears its proportionate share of the expenses of any underlying Fidelity Central Funds.
E Amount does not include the portfolio activity of any underlying Fidelity Central Funds.
F Investment income per share reflects a large, non-recurring dividend which amounted to $.04 per share. Excluding this non-recurring dividend, the ratio of net investment income (loss) to average net assets would have been (.44)%.
G Expense ratios reflect operating expenses of the class. Expenses before reductions do not reflect amounts reimbursed by the investment adviser or reductions from brokerage service arrangements or reductions from other expense offset arrangements and do not represent the amount paid by the class during periods when reimbursements or reductions occur. Expenses net of fee waivers reflect expenses after reimbursement by the investment adviser but prior to reductions from brokerage service arrangements or other expense offset arrangements. Expenses net of all reductions represent the net expenses paid by the class.
H Amount represents less than $.01 per share.
See accompanying notes which are an integral part of the financial statements.
Annual Report
Financial Highlights - Class B
Years ended July 31, | 2012 | 2011 | 2010 | 2009 | 2008 |
Selected Per-Share Data | | | | | |
Net asset value, beginning of period | $ 22.67 | $ 18.01 | $ 14.67 | $ 15.72 | $ 19.10 |
Income from Investment Operations | | | | | |
Net investment income (loss) C | (.28) | (.33) | (.27) | (.07) F | (.23) |
Net realized and unrealized gain (loss) | .21 | 4.99 | 3.61 | (.98) | (3.15) |
Total from investment operations | (.07) | 4.66 | 3.34 | (1.05) | (3.38) |
Redemption fees added to paid in capital C,H | - | - | - | - | - |
Net asset value, end of period | $ 22.60 | $ 22.67 | $ 18.01 | $ 14.67 | $ 15.72 |
Total Return A, B | (.31)% | 25.87% | 22.77% | (6.68)% | (17.70)% |
Ratios to Average Net Assets D, G | | | | | |
Expenses before reductions | 1.93% | 1.93% | 1.96% | 1.98% | 1.96% |
Expenses net of fee waivers, if any | 1.93% | 1.93% | 1.96% | 1.98% | 1.96% |
Expenses net of all reductions | 1.92% | 1.91% | 1.94% | 1.97% | 1.94% |
Net investment income (loss) | (1.30)% | (1.49)% | (1.59)% | (.58)% F | (1.24)% |
Supplemental Data | | | | | |
Net assets, end of period (000 omitted) | $ 17,476 | $ 25,508 | $ 29,176 | $ 30,580 | $ 47,294 |
Portfolio turnover rate E | 201% | 167% | 115% | 225% | 214% |
A Total returns would have been lower if certain expenses had not been reduced during the applicable periods shown.
B Total returns do not include the effect of the contingent deferred sales charge.
C Calculated based on average shares outstanding during the period.
D Fees and expenses of any underlying Fidelity Central Funds are not included in the Fund's expense ratio. The Fund indirectly bears its proportionate share of the expenses of any underlying Fidelity Central Funds.
E Amount does not include the portfolio activity of any underlying Fidelity Central Funds.
F Investment income per share reflects a large, non-recurring dividend which amounted to $.04 per share. Excluding this non-recurring dividend, the ratio of net investment income (loss) to average net assets would have been (.93)%.
G Expense ratios reflect operating expenses of the class. Expenses before reductions do not reflect amounts reimbursed by the investment adviser or reductions from brokerage service arrangements or reductions from other expense offset arrangements and do not represent the amount paid by the class during periods when reimbursements or reductions occur. Expenses net of fee waivers reflect expenses after reimbursement by the investment adviser but prior to reductions from brokerage service arrangements or other expense offset arrangements. Expenses net of all reductions represent the net expenses paid by the class.
H Amount represents less than $.01 per share.
Financial Highlights - Class C
Years ended July 31, | 2012 | 2011 | 2010 | 2009 | 2008 |
Selected Per-Share Data | | | | | |
Net asset value, beginning of period | $ 22.77 | $ 18.09 | $ 14.74 | $ 15.79 | $ 19.18 |
Income from Investment Operations | | | | | |
Net investment income (loss) C | (.29) | (.33) | (.28) | (.07) F | (.23) |
Net realized and unrealized gain (loss) | .22 | 5.01 | 3.63 | (.98) | (3.16) |
Total from investment operations | (.07) | 4.68 | 3.35 | (1.05) | (3.39) |
Redemption fees added to paid in capital C,H | - | - | - | - | - |
Net asset value, end of period | $ 22.70 | $ 22.77 | $ 18.09 | $ 14.74 | $ 15.79 |
Total Return A, B | (.31)% | 25.87% | 22.73% | (6.65)% | (17.67)% |
Ratios to Average Net Assets D, G | | | | | |
Expenses before reductions | 1.93% | 1.92% | 1.96% | 1.98% | 1.96% |
Expenses net of fee waivers, if any | 1.93% | 1.92% | 1.96% | 1.98% | 1.96% |
Expenses net of all reductions | 1.91% | 1.90% | 1.93% | 1.97% | 1.94% |
Net investment income (loss) | (1.29)% | (1.48)% | (1.58)% | (.58)% F | (1.24)% |
Supplemental Data | | | | | |
Net assets, end of period (000 omitted) | $ 88,074 | $ 89,819 | $ 70,017 | $ 55,645 | $ 63,590 |
Portfolio turnover rate E | 201% | 167% | 115% | 225% | 214% |
A Total returns would have been lower if certain expenses had not been reduced during the applicable periods shown.
B Total returns do not include the effect of the contingent deferred sales charge.
C Calculated based on average shares outstanding during the period.
D Fees and expenses of any underlying Fidelity Central Funds are not included in the Fund's expense ratio. The Fund indirectly bears its proportionate share of the expenses of any underlying Fidelity Central Funds.
E Amount does not include the portfolio activity of any underlying Fidelity Central Funds.
F Investment income per share reflects a large, non-recurring dividend which amounted to $.04 per share. Excluding this non-recurring dividend, the ratio of net investment income (loss) to average net assets would have been (.93)%.
G Expense ratios reflect operating expenses of the class. Expenses before reductions do not reflect amounts reimbursed by the investment adviser or reductions from brokerage service arrangements or reductions from other expense offset arrangements and do not represent the amount paid by the class during periods when reimbursements or reductions occur. Expenses net of fee waivers reflect expenses after reimbursement by the investment adviser but prior to reductions from brokerage service arrangements or other expense offset arrangements. Expenses net of all reductions represent the net expenses paid by the class.
H Amount represents less than $.01 per share.
See accompanying notes which are an integral part of the financial statements.
Annual Report
Financial Highlights - Institutional Class
Years ended July 31, | 2012 | 2011 | 2010 | 2009 | 2008 |
Selected Per-Share Data | | | | | |
Net asset value, beginning of period | $ 26.30 | $ 20.68 | $ 16.67 | $ 17.68 | $ 21.26 |
Income from Investment Operations | | | | | |
Net investment income (loss) B | (.06) | (.11) | (.11) | .06 E | (.04) |
Net realized and unrealized gain (loss) | .26 | 5.73 | 4.12 | (1.07) | (3.54) |
Total from investment operations | .20 | 5.62 | 4.01 | (1.01) | (3.58) |
Redemption fees added to paid in capital B,G | - | - | - | - | - |
Net asset value, end of period | $ 26.50 | $ 26.30 | $ 20.68 | $ 16.67 | $ 17.68 |
Total Return A | .76% | 27.18% | 24.06% | (5.71)% | (16.84)% |
Ratios to Average Net Assets C, F | | | | | |
Expenses before reductions | .86% | .87% | .92% | .98% | .94% |
Expenses net of fee waivers, if any | .86% | .87% | .92% | .98% | .94% |
Expenses net of all reductions | .85% | .85% | .90% | .97% | .92% |
Net investment income (loss) | (.23)% | (.43)% | (.55)% | .42% E | (.22)% |
Supplemental Data | | | | | |
Net assets, end of period (000 omitted) | $ 95,310 | $ 81,350 | $ 42,277 | $ 26,285 | $ 22,021 |
Portfolio turnover rate D | 201% | 167% | 115% | 225% | 214% |
A Total returns would have been lower if certain expenses had not been reduced during the applicable periods shown.
B Calculated based on average shares outstanding during the period.
C Fees and expenses of any underlying Fidelity Central Funds are not included in the Fund's expense ratio. The Fund indirectly bears its proportionate share of the expenses of any underlying Fidelity Central Funds.
D Amount does not include the portfolio activity of any underlying Fidelity Central Funds.
E Investment income per share reflects a large, non-recurring dividend which amounted to $.04 per share. Excluding this non-recurring dividend, the ratio of net investment income (loss) to average net assets would have been .07%.
F Expense ratios reflect operating expenses of the class. Expenses before reductions do not reflect amounts reimbursed by the investment adviser or reductions from brokerage service arrangements or reductions from other expense offset arrangements and do not represent the amount paid by the class during periods when reimbursements or reductions occur. Expenses net of fee waivers reflect expenses after reimbursement by the investment adviser but prior to reductions from brokerage service arrangements or other expense offset arrangements. Expenses net of all reductions represent the net expenses paid by the class.
G Amount represents less than $.01 per share.
See accompanying notes which are an integral part of the financial statements.
Annual Report
Fidelity Advisor Technology Fund
Notes to Financial Statements
For the period ended July 31, 2012
1. Organization.
Fidelity Advisor Technology Fund (the Fund) is a non-diversified fund of Fidelity Advisor Series VII (the Trust) and is authorized to issue an unlimited number of shares. The Trust is registered under the Investment Company Act of 1940, as amended (the 1940 Act), as an open-end management investment company organized as a Massachusetts business trust. The Fund offers Class A, Class T, Class C, and Institutional Class shares, each of which, along with Class B shares, has equal rights as to assets and voting privileges. Effective after the close of business on September 1, 2010, Class B shares were closed to new accounts and additional purchases, except for exchanges and reinvestments. Each class has exclusive voting rights with respect to matters that affect that class. Class B shares will automatically convert to Class A shares after a holding period of seven years from the initial date of purchase. Investment income, realized and unrealized capital gains and losses, the common expenses of the Fund, and certain fund-level expense reductions, if any, are allocated on a pro-rata basis to each class based on the relative net assets of each class to the total net assets of the Fund. Each class differs with respect to transfer agent and distribution and service plan fees incurred. Certain expense reductions may also differ by class. The Fund's investments in emerging markets can be subject to social, economic, regulatory, and political uncertainties and can be extremely volatile.
2. Investments in Fidelity Central Funds.
The Fund invests in Fidelity Central Funds, which are open-end investment companies available only to other investment companies and accounts managed by Fidelity Management & Research Company (FMR) and its affiliates. The Fund's Schedule of Investments lists each of the Fidelity Central Funds held as of period end, if any, as an investment of the Fund, but does not include the underlying holdings of each Fidelity Central Fund. As an Investing Fund, the Fund indirectly bears its proportionate share of the expenses of the underlying Fidelity Central Funds.
The Money Market Central Funds seek preservation of capital and current income and are managed by Fidelity Investments Money Management, Inc. (FIMM), an affiliate of FMR.
A complete unaudited list of holdings for each Fidelity Central Fund is available upon request or at the Securities and Exchange Commission (the SEC) web site at www.sec.gov. In addition, the financial statements of the Fidelity Central Funds, which are not covered by the Fund's Report of Independent Registered Public Accounting Firm, are available on the SEC web site or upon request.
3. Significant Accounting Policies.
The financial statements have been prepared in conformity with accounting principles generally accepted in the United States of America (GAAP), which require management to make certain estimates and assumptions at the date of the financial statements. Actual results could differ from those estimates. Subsequent events, if any, through the date that the financial statements were issued have been evaluated in the preparation of the financial statements. The following summarizes the significant accounting policies of the Fund:
Security Valuation. Investments are valued as of 4:00 p.m. Eastern time on the last calendar day of the period. In accordance with valuation policies and procedures approved by the Board of Trustees (the Board), the Fund attempts to obtain prices from one or more third party pricing vendor or broker to value its investments. When current market prices, quotations or rates are not readily available or reliable, securities will be fair valued in good faith by the FMR Fair Value Committee (the Committee), in accordance with procedures adopted by the Fund's Board. Factors used in determining fair value vary by security type and may include market or security specific events, changes in interest rates and credit quality. The frequency with which these procedures are used cannot be predicted and they may be utilized to a significant extent. The Committee oversees the Fund's valuation policies and procedures and is responsible for approving and reporting to the Board all fair value determinations.
The Fund categorizes the inputs to valuation techniques used to value its investments into a disclosure hierarchy consisting of three levels as shown below:
Level 1 - quoted prices in active markets for identical investments
Level 2 - other significant observable inputs (including quoted prices for similar investments, interest rates, prepayment speeds, etc.)
Level 3 - unobservable inputs (including the Fund's own assumptions based on the best information available)
Valuation techniques used to value the Fund's investments by major category are as follows:
Equity securities, including restricted securities, for which market quotations are readily available, are valued at the last reported sale price or official closing price as reported by a third party pricing vendor on the primary market or exchange on which they are traded and are categorized as Level 1 in the hierarchy. In the event there were no sales during the day or closing prices are not available, securities are valued at the last quoted bid price or may be valued using the last available price and are generally categorized as Level 2 in the hierarchy. For foreign equity securities, when significant market or security specific events arise, comparisons to the valuation of American Depositary Receipts (ADRs), futures contracts, Exchange-Traded Funds (ETFs) and certain indexes as well as quoted prices for similar securities are used and are categorized as Level 2 in the hierarchy. Utilizing these techniques may result in transfers between Level 1 and Level 2. For restricted equity securities and private placements where observable inputs are limited, assumptions about market activity and risk are used and these securities are categorized as Level 3 in the hierarchy.
Annual Report
3. Significant Accounting Policies - continued
Security Valuation - continued
Debt securities, including restricted securities, are valued based on evaluated prices received from third party pricing vendors or from brokers who make markets in such securities. For corporate bonds and master notes, pricing vendors utilize matrix pricing which considers yield or price of bonds of comparable quality, coupon, maturity and type as well as broker-supplied prices and are generally categorized as Level 2 in the hierarchy. When independent prices are unavailable or unreliable, debt securities may be valued utilizing pricing methodologies which consider similar factors that would be used by third party pricing vendors. These are generally categorized as Level 2 in the hierarchy but may be Level 3 depending on the circumstances.
Investments in open-end mutual funds, including the Fidelity Central Funds, are valued at their closing net asset value each business day and are categorized as Level 1 in the hierarchy.
Changes in valuation techniques may result in transfers in or out of an assigned level within the disclosure hierarchy. The aggregate value of investments by input level, as of July 31, 2012, including information on transfers between Levels 1 and 2, is included at the end of the Fund's Schedule of Investments.
Foreign Currency Translation. The Fund may use foreign currency contracts to facilitate transactions in foreign-denominated securities. Gains and losses from these transactions may arise from changes in the value of the foreign currency or if the counterparties do not perform under the contracts' terms.
Foreign-denominated assets, including investment securities, and liabilities are translated into U.S. dollars at the exchange rates at period end. Purchases and sales of investment securities, income and dividends received and expenses denominated in foreign currencies are translated into U.S. dollars at the exchange rate in effect on the transaction date.
The effects of exchange rate fluctuations on investments are included with the net realized and unrealized gain (loss) on investment securities. Other foreign currency transactions resulting in realized and unrealized gain (loss) are disclosed separately.
Investment Transactions and Income. For financial reporting purposes, the Fund's investment holdings and NAV include trades executed through the end of the last business day of the period. The NAV per share for processing shareholder transactions is calculated as of the close of business of the New York Stock Exchange (NYSE), normally 4:00 p.m. Eastern time and includes trades executed through the end of the prior business day. Gains and losses on securities sold are determined on the basis of identified cost and may include proceeds received from litigation. Dividend income is recorded on the ex-dividend date, except for certain dividends from foreign securities where the ex-dividend date may have passed, which are recorded as soon as the Fund is informed of the ex-dividend date. Non-cash dividends included in dividend income, if any, are recorded at the fair market value of the securities received. Distributions received on securities that represent a return of capital or capital gain are recorded as a reduction of cost of investments and/or as a realized gain. The Fund estimates the components of distributions received that may be considered return of capital distributions or capital gain distributions. Interest income and distributions from the Fidelity Central Funds are accrued as earned. Interest income includes coupon interest and amortization of premium and accretion of discount on debt securities. Investment income is recorded net of foreign taxes withheld where recovery of such taxes is uncertain.
Expenses. Expenses directly attributable to a fund are charged to that fund. Expenses attributable to more than one fund are allocated among the respective funds on the basis of relative net assets or other appropriate methods. Expense estimates are accrued in the period to which they relate and adjustments are made when actual amounts are known.
Income Tax Information and Distributions to Shareholders. Each year, the Fund intends to qualify as a regulated investment company under Subchapter M of the Internal Revenue Code, including distributing substantially all of its taxable income and realized gains. As a result, no provision for income taxes is required. As of July 31, 2012, the Fund did not have any unrecognized tax benefits in the financial statements; nor is the Fund aware of any tax positions for which it is reasonably possible that the total amounts of unrecognized tax benefits will significantly change in the next twelve months. The Fund files a U.S. federal tax return, in addition to state and local tax returns as required. A fund's federal income tax returns are subject to examination by the Internal Revenue Service (IRS) for a period of three fiscal years after they are filed. State and local tax returns may be subject to examination for an additional fiscal year depending on the jurisdiction. Foreign taxes are provided for based on the Fund's understanding of the tax rules and rates that exist in the foreign markets in which it invests.
Distributions are declared and recorded on the ex-dividend date. Income dividends and capital gain distributions are declared separately for each class. Income and capital gain distributions are determined in accordance with income tax regulations, which may differ from GAAP.
Capital accounts within the financial statements are adjusted for permanent book-tax differences. These adjustments have no impact on net assets or the results of operations. Temporary book-tax differences will reverse in a subsequent period.
Book-tax differences are primarily due to foreign currency transactions, deferred trustees compensation, net operating losses, capital loss carryforwards and losses deferred due to wash sales and excise tax regulations.
Annual Report
Fidelity Advisor Technology Fund
Notes to Financial Statements - continued
3. Significant Accounting Policies - continued
Income Tax Information and Distributions to Shareholders - continued
The federal tax cost of investment securities and unrealized appreciation (depreciation) as of period end were as follows:
Gross unrealized appreciation | $ 90,614,106 |
Gross unrealized depreciation | (66,449,756) |
Net unrealized appreciation (depreciation) on securities and other investments | $ 24,164,350 |
| |
Tax Cost | $ 715,465,181 |
The tax-based components of distributable earnings as of period end were as follows:
Capital loss carryforward | $ (117,524,425) |
Net unrealized appreciation (depreciation) | $ 24,165,469 |
Capital loss carryforwards are only available to offset future capital gains of the Fund to the extent provided by regulations and may be limited. Under the Regulated Investment Company Modernization Act of 2010 (the Act), the Fund is permitted to carry forward capital losses incurred in taxable years beginning after December 22, 2010 for an unlimited period and such capital losses are required to be used prior to any losses that expire. Capital loss carryforwards were as follows:
Fiscal year of expiration | |
| |
2017 | $ (117,524,425) |
Short-Term Trading (Redemption) Fees. Shares held by investors in the Fund less than 30 days are subject to a redemption fee equal to .75% of the net asset value of shares redeemed. All redemption fees, which reduce the proceeds of the shareholder redemption, are retained by the Fund and accounted for as an addition to paid in capital.
New Accounting Pronouncement. In December 2011, the Financial Accounting Standards Board issued Accounting Standard Update No. 2011-11, Disclosures about Offsetting Assets and Liabilities. The update creates new disclosure requirements requiring entities to disclose both gross and net information for derivatives and other financial instruments that are either offset in the Statement of Assets and Liabilities or subject to an enforceable master netting arrangement or similar agreement. The disclosure requirements are effective for interim and annual reporting periods beginning on or after January 1, 2013. Management is currently evaluating the impact of the update's adoption on the Fund's financial statement disclosures.
4. Operating Policies.
Restricted Securities. The Fund may invest in securities that are subject to legal or contractual restrictions on resale. These securities generally may be resold in transactions exempt from registration or to the public if the securities are registered. Disposal of these securities may involve time-consuming negotiations and expense, and prompt sale at an acceptable price may be difficult. Information regarding restricted securities is included at the end of the Fund's Schedule of Investments.
5. Purchases and Sales of Investments.
Purchases and sales of securities, other than short-term securities, aggregated $1,373,500,303 and $1,483,717,376, respectively.
6. Fees and Other Transactions with Affiliates.
Management Fee. FMR and its affiliates provide the Fund with investment management related services for which the Fund pays a monthly management fee. The management fee is the sum of an individual fund fee rate that is based on an annual rate of .30% of the Fund's average net assets and an annualized group fee rate that averaged .26% during the period. The group fee rate is based upon the average net assets of all the mutual funds advised by FMR. The group fee rate decreases as assets under management increase and increases as assets under management decrease. For the period, the total annual management fee rate was .56% of the Fund's average net assets.
Annual Report
6. Fees and Other Transactions with Affiliates - continued
Distribution and Service Plan Fees. In accordance with Rule 12b-1 of the 1940 Act, the Fund has adopted separate Distribution and Service Plans for each class of shares. Certain classes pay Fidelity Distributors Corporation (FDC), an affiliate of FMR, separate Distribution and Service Fees, each of which is based on an annual percentage of each class' average net assets. In addition, FDC may pay financial intermediaries for selling shares of the Fund and providing shareholder support services. For the period, the Distribution and Service Fee rates, total fees and amounts retained by FDC were as follows:
| Distribution
Fee | Service
Fee | Total Fees | Retained
by FDC |
Class A | -% | .25% | $ 854,371 | $ 9,467 |
Class T | .25% | .25% | 891,884 | 5,276 |
Class B | .75% | .25% | 204,917 | 154,181 |
Class C | .75% | .25% | 853,996 | 97,900 |
| | | $ 2,805,168 | $ 266,824 |
Sales Load. FDC may receive a front-end sales charge of up to 5.75% for selling Class A shares and 3.50% for selling Class T shares, some of which is paid to financial intermediaries for selling shares of the Fund. Depending on the holding period, FDC may receive contingent deferred sales charges levied on Class A, Class T, Class B, and Class C redemptions. The deferred sales charges range from 5.00% to 1.00% for Class B shares, 1.00% for Class C shares, 1.00% for certain purchases of Class A shares and .25% for certain purchases of Class T shares.
For the period, sales charge amounts retained by FDC were as follows:
| Retained
by FDC |
Class A | $ 70,974 |
Class T | 20,449 |
Class B* | 25,085 |
Class C* | 9,032 |
| $ 125,540 |
* When Class B and Class C shares are initially sold, FDC pays commissions from its own resources to financial intermediaries through which the sales are made.
Transfer Agent Fees. Fidelity Investments Institutional Operations Company, Inc. (FIIOC), an affiliate of FMR, is the transfer, dividend disbursing and shareholder servicing agent for each class of the Fund. FIIOC receives account fees and asset-based fees that vary according to the account size and type of account of the shareholders of the respective classes of the Fund. FIIOC pays for typesetting, printing and mailing of shareholder reports, except proxy statements. For the period, transfer agent fees for each class were as follows:
| Amount | % of
Average
Net Assets |
Class A | $ 1,029,833 | .30 |
Class T | 538,818 | .30 |
Class B | 61,789 | .30 |
Class C | 250,234 | .29 |
Institutional Class | 210,706 | .23 |
| $ 2,091,380 | |
Accounting and Security Lending Fees. Fidelity Service Company, Inc. (FSC), an affiliate of FMR, maintains the Fund's accounting records. The accounting fee is based on the level of average net assets for each month. Under a separate contract, FSC administers the security lending program. The security lending fee is based on the number and duration of lending transactions.
Brokerage Commissions. The Fund placed a portion of its portfolio transactions with brokerage firms which are affiliates of the investment adviser. The commissions paid to these affiliated firms were $50,376 for the period.
7. Committed Line of Credit.
The Fund participates with other funds managed by FMR or an affiliate in a $4.25 billion credit facility (the "line of credit") to be utilized for temporary or emergency purposes to fund shareholder redemptions or for other short-term liquidity purposes. The Fund has agreed to pay commitment fees on its pro-rata portion of the line of credit, which amounted to $2,040 and is reflected in Miscellaneous expenses on the Statement of Operations. During the period, there were no borrowings on this line of credit.
Annual Report
Fidelity Advisor Technology Fund
Notes to Financial Statements - continued
8. Security Lending.
The Fund lends portfolio securities through a lending agent from time to time in order to earn additional income. For equity securities, a lending agent is used and may loan securities to certain qualified borrowers, including Fidelity Capital Markets (FCM), a broker-dealer affiliated with the Fund. On the settlement date of the loan, the Fund receives collateral (in the form of U.S. Treasury obligations, letters of credit and/or cash) against the loaned securities and maintains collateral in an amount not less than 100% of the market value of the loaned securities during the period of the loan. The market value of the loaned securities is determined at the close of business of the Fund and any additional required collateral is delivered to the Fund on the next business day. If the borrower defaults on its obligation to return the securities loaned because of insolvency or other reasons, a fund could experience delays and costs in recovering the securities loaned or in gaining access to the collateral. Any cash collateral received is invested in the Fidelity Securities Lending Cash Central Fund. The value of loaned securities and cash collateral at period end are disclosed on the Fund's Statement of Assets and Liabilities. The value of securities loaned to FCM at period end was $870,300. Security lending income represents the income earned on investing cash collateral, less rebates paid to borrowers and any lending agent fees associated with the loan, plus any premium payments received for lending certain types of securities. Security lending income is presented in the Statement of Operations as a component of income from Fidelity Central Funds, and includes $26,600 from securities loaned to FCM.
9. Expense Reductions.
Many of the brokers with whom FMR places trades on behalf of the Fund provided services to the Fund in addition to trade execution. These services included payments of certain expenses on behalf of the Fund totaling $121,557 for the period. In addition, through arrangements with the Fund's custodian, credits realized as a result of uninvested cash balances were used to reduce the Fund's expenses. During the period, these credits reduced the Fund's custody expenses by $68.
10. Share Transactions.
Transactions for each class of shares were as follows:
| Shares | Dollars |
Years ended July 31, | 2012 | 2011 | 2012 | 2011 |
Class A | | | | |
Shares sold | 2,592,933 | 3,825,268 | $ 63,934,256 | $ 95,895,792 |
Shares redeemed | (4,198,134) | (4,656,846) | (101,495,361) | (115,935,925) |
Net increase (decrease) | (1,605,201) | (831,578) | $ (37,561,105) | $ (20,040,133) |
Class T | | | | |
Shares sold | 978,762 | 1,318,401 | $ 23,400,718 | $ 31,818,569 |
Shares redeemed | (1,986,110) | (2,014,796) | (46,751,109) | (47,878,372) |
Net increase (decrease) | (1,007,348) | (696,395) | $ (23,350,391) | $ (16,059,803) |
Class B | | | | |
Shares sold | 50,311 | 98,795 | $ 1,085,625 | $ 2,198,114 |
Shares redeemed | (402,080) | (593,453) | (8,778,422) | (13,054,972) |
Net increase (decrease) | (351,769) | (494,658) | $ (7,692,797) | $ (10,856,858) |
Class C | | | | |
Shares sold | 840,429 | 982,784 | $ 19,233,850 | $ 22,502,223 |
Shares redeemed | (904,947) | (908,933) | (19,636,815) | (20,073,701) |
Net increase (decrease) | (64,518) | 73,851 | $ (402,965) | $ 2,428,522 |
Institutional Class | | | | |
Shares sold | 2,443,052 | 2,740,439 | $ 63,798,153 | $ 73,729,514 |
Shares redeemed | (1,939,243) | (1,692,072) | (49,603,177) | (44,832,264) |
Net increase (decrease) | 503,809 | 1,048,367 | $ 14,194,976 | $ 28,897,250 |
11. Other.
The Fund's organizational documents provide former and current trustees and officers with a limited indemnification against liabilities arising in connection with the performance of their duties to the Fund. In the normal course of business, the Fund may also enter into contracts that provide general indemnifications. The Fund's maximum exposure under these arrangements is unknown as this would be dependent on future claims that may be made against the Fund. The risk of material loss from such claims is considered remote.
Annual Report
Fidelity Advisor Utilities Fund - Class A, T, B, and C
Performance: The Bottom Line
Average annual total return reflects the change in the value of an investment, assuming reinvestment of the class' distributions from dividend income and capital gains (the profits earned upon the sale of securities that have grown in value, if any) and assuming a constant rate of performance each year. The $10,000 table and the fund's returns do not reflect the deduction of taxes that a shareholder would pay on fund distributions or the redemption of fund shares. During periods of reimbursement by Fidelity, a fund's total return will be greater than it would be had the reimbursement not occurred. How a fund did yesterday is no guarantee of how it will do tomorrow. Returns reflect the conversion of Class B shares to Class A shares after a maximum of seven years.
Average Annual Total Returns
Periods ended July 31, 2012 | Past 1
year | Past 5
years | Past 10
years |
Class A (incl. 5.75% sales charge) C | 6.88% | 1.26% | 10.55% |
Class T (incl. 3.50% sales charge) C | 9.17% | 1.47% | 10.53% |
Class B (incl. contingent deferred sales charge) A,C | 7.54% | 1.32% | 10.64% |
Class C (incl. contingent deferred sales charge) B,C | 11.56% | 1.70% | 10.42% |
A Class B shares' contingent deferred sales charges included in the past one year, past five years and past ten years total return figures are 5%, 2%, and 0%, respectively.
B Class C shares' contingent deferred sales charges included in the past one year, past five years and past ten years total return figures are 1%, 0%, and 0%, respectively.
C Prior to October 1, 2006, Fidelity Advisor Utilities Fund operated under certain different investment policies. The historical performance for the fund may not represent its current investment policies.
$10,000 Over 10 Years
Let's say hypothetically that $10,000 was invested in Fidelity Advisor Utilities Fund - Class A on July 31, 2002, and the current 5.75% sales charge was paid. The chart shows how the value of your investment would have changed, and also shows how the S&P 500 Index performed over the same period.
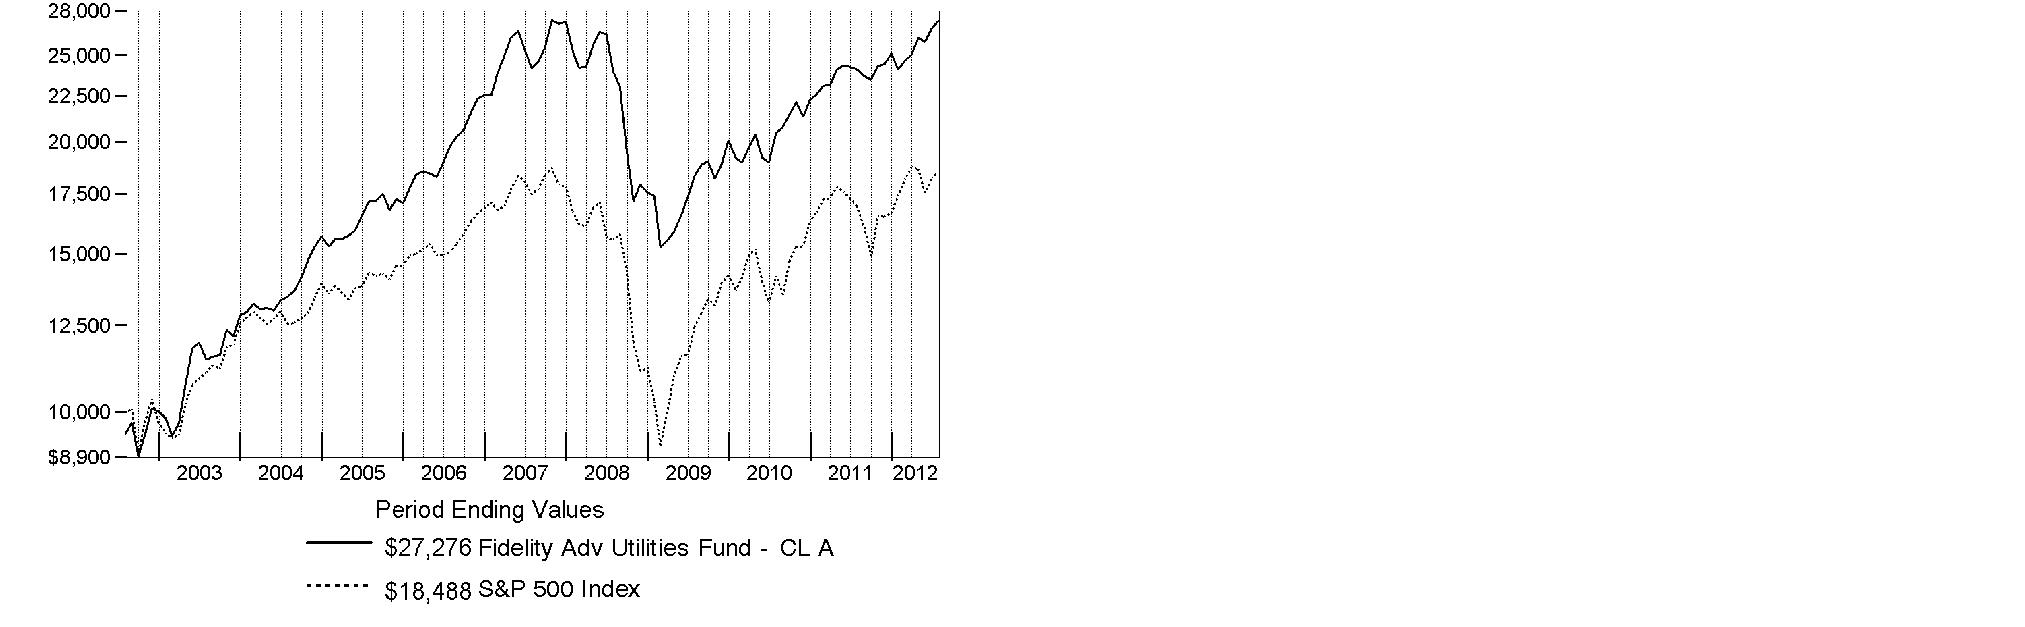
Annual Report
Fidelity Advisor Utilities Fund
Market Recap: Major U.S. equity benchmarks posted solid gains for the year ending July 31, 2012, amid an uncertain investment environment. The broad-based S&P 500® Index returned 9.13%, while the blue-chip-laden Dow Jones Industrial AverageSM and technology-heavy Nasdaq Composite® Index gained 10.12% and 7.83%, respectively. Volatility spiked during the period's first half, as equities plummeted late last summer on Europe's debt woes, political wrangling over the U.S. debt ceiling and the sovereign credit-rating downgrade that followed. By October, a seemingly improved U.S. economy rejuvenated stocks, paving the way for major equity benchmarks to post their best first-quarter performance since 1998. However, more eurozone trouble, signs that the U.S. economy had turned sluggish and a slowdown in China caused stocks to slip in May, before a new wave of optimism took hold in June and July. Within the S&P 500®, more-defensive sectors such as telecommunication services (+30%) and consumer staples (+20%) fared best, while materials and energy significantly underperformed, returning -5%. Small- and mid-cap stocks trailed their less-volatile large-cap counterparts, with the Russell 2000® Index adding 0.19% and the Russell Midcap® Index rising 2.28%. Given turmoil and local currency weakness in Europe, foreign developed-markets stocks lost ground, with the MSCI® EAFE® Index returning -11.32%.
Comments from Douglas Simmons, Portfolio Manager of Fidelity Advisor® Utilities Fund: For the year, the fund's Class A, Class T, Class B and Class C shares returned 13.40%, 13.13%, 12.54% and 12.56%, respectively (excluding sales charges), outperforming the S&P 500® but underperforming the 17.71% gain of the MSCI® U.S. IM 25/50 Utilities Index. Relative to the MSCI index, the fund was hurt by an overweighting in the lagging independent power/energy trade group, although this was mitigated to an extent by good stock picks here. Security selection in gas utilities and electric utilities also hurt, as did an underweighting in multi-utilities. The fund's modest cash position also curtailed returns in an up market. Detractors included untimely ownership of Oklahoma gas utility ONEOK, and investments in National Fuel Gas - with operations in western New York - Houston-based independent power producers Calpine and GenOn Energy, global power company AES and an untimely out-of-benchmark position in Tulsa-based oil/gas storage and transport company Williams Companies, the latter of which was not held at period end. On the plus side, we were helped by an out-of-benchmark position in oil/gas refining and marketing company Sunoco - which was sold from the fund before period end - and by two California multi-utilities, Sempra Energy and PG&E.
The views expressed above reflect those of the portfolio manager(s) only through the end of the period as stated on the cover of this report and do not necessarily represent the views of Fidelity or any other person in the Fidelity organization. Any such views are subject to change at any time based upon market or other conditions and Fidelity disclaims any responsibility to update such views. These views may not be relied on as investment advice and, because investment decisions for a Fidelity fund are based on numerous factors, may not be relied on as an indication of trading intent on behalf of any Fidelity fund.
Annual Report
Fidelity Advisor Utilities Fund
As a shareholder of the Fund, you incur two types of costs: (1) transaction costs, including sales charges (loads) on purchase payments or redemption proceeds, redemption fees and (2) ongoing costs, including management fees, distribution and/or service (12b-1) fees and other Fund expenses. This Example is intended to help you understand your ongoing costs (in dollars) of investing in the Fund and to compare these costs with the ongoing costs of investing in other mutual funds.
The Example is based on an investment of $1,000 invested at the beginning of the period and held for the entire period (February 1, 2012 to July 31, 2012).
Actual Expenses
The first line of the accompanying table for each class of the Fund provides information about actual account values and actual expenses. You may use the information in this line, together with the amount you invested, to estimate the expenses that you paid over the period. Simply divide your account value by $1,000.00 (for example, an $8,600 account value divided by $1,000.00 = 8.6), then multiply the result by the number in the first line for a class of the Fund under the heading entitled "Expenses Paid During Period" to estimate the expenses you paid on your account during this period. In addition, the Fund, as a shareholder in the underlying Fidelity Central Funds, will indirectly bear its pro-rata share of the fees and expenses incurred by the underlying Fidelity Central Funds. These fees and expenses are not included in the Fund's annualized expense ratio used to calculate the expense estimate in the table below.
Hypothetical Example for Comparison Purposes
The second line of the accompanying table for each class of the Fund provides information about hypothetical account values and hypothetical expenses based on a Class' actual expense ratio and an assumed rate of return of 5% per year before expenses, which is not the Class' actual return. The hypothetical account values and expenses may not be used to estimate the actual ending account balance or expenses you paid for the period. You may use this information to compare the ongoing costs of investing in the Fund and other funds. To do so, compare this 5% hypothetical example with the 5% hypothetical examples that appear in the shareholder reports of the other funds. In addition, the Fund, as a shareholder in the underlying Fidelity Central Funds, will indirectly bear its pro-rata share of the fees and expenses incurred by the underlying Fidelity Central Funds. These fees and expenses are not included in the Fund's annualized expense ratio used to calculate the expense estimate in the table below.
Please note that the expenses shown in the table are meant to highlight your ongoing costs only and do not reflect any transaction costs. Therefore, the second line of the table is useful in comparing ongoing costs only, and will not help you determine the relative total costs of owning different funds. In addition, if these transactional costs were included, your costs would have been higher.
| Annualized Expense Ratio | Beginning
Account Value
February 1, 2012 | Ending
Account Value
July 31, 2012 | Expenses Paid
During Period*
February 1, 2012
to July 31, 2012 |
Class A | 1.20% | | | |
Actual | | $ 1,000.00 | $ 1,132.50 | $ 6.36 |
HypotheticalA | | $ 1,000.00 | $ 1,018.90 | $ 6.02 |
Class T | 1.46% | | | |
Actual | | $ 1,000.00 | $ 1,130.60 | $ 7.73 |
HypotheticalA | | $ 1,000.00 | $ 1,017.60 | $ 7.32 |
Class B | 1.95% | | | |
Actual | | $ 1,000.00 | $ 1,128.10 | $ 10.32 |
HypotheticalA | | $ 1,000.00 | $ 1,015.17 | $ 9.77 |
Class C | 1.93% | | | |
Actual | | $ 1,000.00 | $ 1,128.00 | $ 10.21 |
HypotheticalA | | $ 1,000.00 | $ 1,015.27 | $ 9.67 |
Institutional Class | .86% | | | |
Actual | | $ 1,000.00 | $ 1,134.70 | $ 4.56 |
HypotheticalA | | $ 1,000.00 | $ 1,020.59 | $ 4.32 |
A 5% return per year before expenses
* Expenses are equal to each Class' annualized expense ratio, multiplied by the average account value over the period, multiplied by 182/366 (to reflect the one-half year period).
Annual Report
Fidelity Advisor Utilities Fund
Investment Changes (Unaudited)
Top Ten Stocks as of July 31, 2012 |
| % of fund's
net assets | % of fund's net assets
6 months ago |
Duke Energy Corp. | 14.8 | 10.6 |
PG&E Corp. | 7.3 | 6.1 |
FirstEnergy Corp. | 7.3 | 8.4 |
Edison International | 7.1 | 7.5 |
American Electric Power Co., Inc. | 6.9 | 4.8 |
CenterPoint Energy, Inc. | 5.3 | 4.4 |
Sempra Energy | 4.8 | 7.5 |
NextEra Energy, Inc. | 4.7 | 7.9 |
NiSource, Inc. | 4.7 | 4.6 |
American Water Works Co., Inc. | 4.0 | 3.1 |
| 66.9 | |
Top Industries (% of fund's net assets) |
As of July 31, 2012 |
| Electric Utilities | 55.1% | |
| Multi-Utilities | 22.1% | |
| Independent
Power Producers & Energy Traders | 9.5% | |
| Gas Utilities | 5.8% | |
| Water Utilities | 4.0% | |
| All Others* | 3.5% | |

As of January 31, 2012 |
| Electric Utilities | 44.5% | |
| Multi-Utilities | 30.3% | |
| Independent
Power Producers & Energy Traders | 11.5% | |
| Gas Utilities | 5.2% | |
| Oil, Gas & Consumable Fuels | 3.7% | |
| All Others* | 4.8% | |

* Includes short-term investments and net other assets. |
Annual Report
Fidelity Advisor Utilities Fund
Investments July 31, 2012
Showing Percentage of Net Assets
Common Stocks - 97.2% |
| Shares | | Value |
ELECTRIC UTILITIES - 55.1% |
Electric Utilities - 55.1% |
American Electric Power Co., Inc. | 317,461 | | $ 13,409,553 |
Duke Energy Corp. | 427,091 | | 28,948,226 |
Edison International | 298,594 | | 13,789,071 |
Exelon Corp. | 74,599 | | 2,918,313 |
FirstEnergy Corp. | 285,196 | | 14,322,543 |
Great Plains Energy, Inc. | 219,010 | | 4,857,642 |
ITC Holdings Corp. | 17,610 | | 1,306,486 |
NextEra Energy, Inc. | 130,532 | | 9,254,719 |
Northeast Utilities | 126,422 | | 5,041,709 |
OGE Energy Corp. | 93,849 | | 4,984,320 |
Pepco Holdings, Inc. | 100,100 | | 1,997,996 |
Southern Co. | 86,271 | | 4,153,949 |
UIL Holdings Corp. | 69,530 | | 2,575,391 |
| | 107,559,918 |
GAS UTILITIES - 5.8% |
Gas Utilities - 5.8% |
AGL Resources, Inc. | 31,945 | | 1,293,773 |
Atmos Energy Corp. | 86,804 | | 3,111,923 |
National Fuel Gas Co. | 34,069 | | 1,667,337 |
ONEOK, Inc. | 116,612 | | 5,190,400 |
| | 11,263,433 |
INDEPENDENT POWER PRODUCERS & ENERGY TRADERS - 9.5% |
Independent Power Producers & Energy Traders - 9.5% |
Calpine Corp. (a) | 403,230 | | 6,891,201 |
GenOn Energy, Inc. (a) | 489,881 | | 1,165,917 |
NRG Energy, Inc. (d) | 176,662 | | 3,501,441 |
The AES Corp. (a) | 583,761 | | 7,040,158 |
| | 18,598,717 |
MULTI-UTILITIES - 22.1% |
Multi-Utilities - 22.1% |
CenterPoint Energy, Inc. | 492,078 | | 10,363,163 |
NiSource, Inc. | 356,263 | | 9,116,770 |
PG&E Corp. | 310,374 | | 14,326,864 |
Sempra Energy | 133,531 | | 9,401,918 |
| | 43,208,715 |
|
| Shares | | Value |
OIL, GAS & CONSUMABLE FUELS - 0.7% |
Oil & Gas Storage & Transport - 0.7% |
Cheniere Energy, Inc. (a) | 98,998 | | $ 1,349,343 |
WATER UTILITIES - 4.0% |
Water Utilities - 4.0% |
American Water Works Co., Inc. | 215,125 | | 7,798,281 |
TOTAL COMMON STOCKS (Cost $174,104,060) |
189,778,407
|
Money Market Funds - 5.0% |
| | | |
Fidelity Cash Central Fund, 0.17% (b) | 6,247,666 | | 6,247,666 |
Fidelity Securities Lending Cash Central Fund, 0.18% (b)(c) | 3,495,250 | | 3,495,250 |
TOTAL MONEY MARKET FUNDS (Cost $9,742,916) |
9,742,916
|
TOTAL INVESTMENT PORTFOLIO - 102.2% (Cost $183,846,976) | | 199,521,323 |
NET OTHER ASSETS (LIABILITIES) - (2.2)% | | (4,249,174) |
NET ASSETS - 100% | $ 195,272,149 |
Legend |
(a) Non-income producing |
(b) Affiliated fund that is available only to investment companies and other accounts managed by Fidelity Investments. The rate quoted is the annualized seven-day yield of the fund at period end. A complete unaudited listing of the fund's holdings as of its most recent quarter end is available upon request. In addition, each Fidelity Central Fund's financial statements, which are not covered by the Fund's Report of Independent Registered Public Accounting Firm, are available on the SEC's website or upon request. |
(c) Investment made with cash collateral received from securities on loan. |
(d) Security or a portion of the security is on loan at period end. |
Affiliated Central Funds |
Information regarding fiscal year to date income earned by the Fund from investments in Fidelity Central Funds is as follows: |
Fund | Income earned |
Fidelity Cash Central Fund | $ 5,512 |
Fidelity Securities Lending Cash Central Fund | 25,507 |
Total | $ 31,019 |
Other Information |
All investments are categorized as Level 1 under the Fair Value Hierarchy. The inputs or methodology used for valuing securities may not be an indication of the risk associated with investing in those securities. For more information on valuation inputs, please refer to the Security Valuation section in the accompanying Notes to Financial Statements. |
See accompanying notes which are an integral part of the financial statements.
Annual Report
Fidelity Advisor Utilities Fund
Statement of Assets and Liabilities
| July 31, 2012 |
| | |
Assets | | |
Investment in securities, at value (including securities loaned of $3,379,310) - See accompanying schedule: Unaffiliated issuers (cost $174,104,060) | $ 189,778,407 | |
Fidelity Central Funds (cost $9,742,916) | 9,742,916 | |
Total Investments (cost $183,846,976) | | $ 199,521,323 |
Receivable for investments sold | | 1,034,685 |
Receivable for fund shares sold | | 392,394 |
Dividends receivable | | 156,134 |
Distributions receivable from Fidelity Central Funds | | 893 |
Other receivables | | 8,287 |
Total assets | | 201,113,716 |
| | |
Liabilities | | |
Payable for investments purchased | $ 1,820,042 | |
Payable for fund shares redeemed | 287,512 | |
Accrued management fee | 86,881 | |
Distribution and service plan fees payable | 66,201 | |
Other affiliated payables | 49,663 | |
Other payables and accrued expenses | 36,018 | |
Collateral on securities loaned, at value | 3,495,250 | |
Total liabilities | | 5,841,567 |
| | |
Net Assets | | $ 195,272,149 |
Net Assets consist of: | | |
Paid in capital | | $ 209,197,231 |
Undistributed net investment income | | 1,693,797 |
Accumulated undistributed net realized gain (loss) on investments and foreign currency transactions | | (31,293,226) |
Net unrealized appreciation (depreciation) on investments | | 15,674,347 |
Net Assets | | $ 195,272,149 |
Statement of Assets and Liabilities - continued
| July 31, 2012 |
| | |
Calculation of Maximum Offering Price Class A:
Net Asset Value and redemption price per share ($99,812,981 ÷ 4,707,997 shares) | | $ 21.20 |
| | |
Maximum offering price per share (100/94.25 of $21.20) | | $ 22.49 |
Class T:
Net Asset Value and redemption price per share ($38,275,755 ÷ 1,804,579 shares) | | $ 21.21 |
| | |
Maximum offering price per share (100/96.50 of $21.21) | | $ 21.98 |
Class B:
Net Asset Value and offering price per share ($6,677,348 ÷ 318,599 shares)A | | $ 20.96 |
| | |
Class C:
Net Asset Value and offering price per share ($29,941,814 ÷ 1,439,302 shares)A | | $ 20.80 |
| | |
Institutional Class:
Net Asset Value, offering price and redemption price per share ($20,564,251 ÷ 953,957 shares) | | $ 21.56 |
A Redemption price per share is equal to net asset value less any applicable contingent deferred sales charge.
See accompanying notes which are an integral part of the financial statements.
Annual Report
Fidelity Advisor Utilities Fund
Financial Statements - continued
Statement of Operations
| Year ended July 31, 2012 |
| | |
Investment Income | | |
Dividends | | $ 5,862,406 |
Income from Fidelity Central Funds | | 31,019 |
Total income | | 5,893,425 |
| | |
Expenses | | |
Management fee | $ 951,962 | |
Transfer agent fees | 504,122 | |
Distribution and service plan fees | 754,197 | |
Accounting and security lending fees | 66,483 | |
Custodian fees and expenses | 9,952 | |
Independent trustees' compensation | 1,123 | |
Registration fees | 66,576 | |
Audit | 47,941 | |
Legal | 1,925 | |
Miscellaneous | 1,432 | |
Total expenses before reductions | 2,405,713 | |
Expense reductions | (12,239) | 2,393,474 |
Net investment income (loss) | | 3,499,951 |
Realized and Unrealized Gain (Loss) Net realized gain (loss) on: | | |
Investment securities: | | |
Unaffiliated issuers | 12,579,670 | |
Foreign currency transactions | (4,830) | |
Total net realized gain (loss) | | 12,574,840 |
Change in net unrealized appreciation (depreciation) on investment securities | | 5,997,904 |
Net gain (loss) | | 18,572,744 |
Net increase (decrease) in net assets resulting from operations | | $ 22,072,695 |
Statement of Changes in Net Assets
| Year ended
July 31,
2012 | Year ended
July 31,
2011 |
Increase (Decrease) in Net Assets | | |
Operations | | |
Net investment income (loss) | $ 3,499,951 | $ 2,899,329 |
Net realized gain (loss) | 12,574,840 | 15,534,119 |
Change in net unrealized appreciation (depreciation) | 5,997,904 | 4,885,719 |
Net increase (decrease) in net assets resulting from operations | 22,072,695 | 23,319,167 |
Distributions to shareholders from net investment income | (3,107,112) | (2,864,390) |
Share transactions - net increase (decrease) | 16,682,706 | 3,898,632 |
Redemption fees | 8,157 | 2,026 |
Total increase (decrease) in net assets | 35,656,446 | 24,355,435 |
| | |
Net Assets | | |
Beginning of period | 159,615,703 | 135,260,268 |
End of period (including undistributed net investment income of $1,693,797 and undistributed net investment income of $1,305,339, respectively) | $ 195,272,149 | $ 159,615,703 |
See accompanying notes which are an integral part of the financial statements.
Annual Report
Financial Highlights - Class A
Years ended July 31, | 2012 | 2011 | 2010 | 2009 | 2008 |
Selected Per-Share Data | | | | | |
Net asset value, beginning of period | $ 19.09 | $ 16.59 | $ 15.27 | $ 20.28 | $ 20.74 |
Income from Investment Operations | | | | | |
Net investment income (loss) C | .43 | .39 | .40 | .35 | .24 |
Net realized and unrealized gain (loss) | 2.07 | 2.50 | 1.32 | (5.10) | (.38) |
Total from investment operations | 2.50 | 2.89 | 1.72 | (4.75) | (.14) |
Distributions from net investment income | (.39) | (.39) | (.40) | (.26) | (.32) |
Redemption fees added to paid in capital C, G | - | - | - | - | - |
Net asset value, end of period | $ 21.20 | $ 19.09 | $ 16.59 | $ 15.27 | $ 20.28 |
Total Return A, B | 13.40% | 17.71% | 11.42% | (23.44)% | (.82)% |
Ratios to Average Net Assets D, F | | | | | |
Expenses before reductions | 1.23% | 1.24% | 1.26% | 1.26% | 1.21% |
Expenses net of fee waivers, if any | 1.23% | 1.24% | 1.26% | 1.26% | 1.21% |
Expenses net of all reductions | 1.22% | 1.20% | 1.22% | 1.26% | 1.21% |
Net investment income (loss) | 2.24% | 2.18% | 2.49% | 2.37% | 1.11% |
Supplemental Data | | | | | |
Net assets, end of period (000 omitted) | $ 99,813 | $ 78,312 | $ 64,890 | $ 66,064 | $ 105,219 |
Portfolio turnover rate E | 195% | 201% | 216% | 247% | 77% |
A Total returns would have been lower if certain expenses had not been reduced during the applicable periods shown.
B Total returns do not include the effect of the sales charges.
C Calculated based on average shares outstanding during the period.
D Fees and expenses of any underlying Fidelity Central Funds are not included in the Fund's expense ratio. The Fund indirectly bears its proportionate share of the expenses of any underlying Fidelity Central Funds.
E Amount does not include the portfolio activity of any underlying Fidelity Central Funds.
F Expense ratios reflect operating expenses of the class. Expenses before reductions do not reflect amounts reimbursed by the investment adviser or reductions from brokerage service arrangements or reductions from other expense offset arrangements and do not represent the amount paid by the class during periods when reimbursements or reductions occur. Expenses net of fee waivers reflect expenses after reimbursement by the investment adviser but prior to reductions from brokerage service arrangements or other expense offset arrangements. Expenses net of all reductions represent the net expenses paid by the class.
G Amount represents less than $.01 per share.
Financial Highlights - Class T
Years ended July 31, | 2012 | 2011 | 2010 | 2009 | 2008 |
Selected Per-Share Data | | | | | |
Net asset value, beginning of period | $ 19.09 | $ 16.59 | $ 15.27 | $ 20.26 | $ 20.71 |
Income from Investment Operations | | | | | |
Net investment income (loss) C | .38 | .35 | .35 | .31 | .18 |
Net realized and unrealized gain (loss) | 2.07 | 2.50 | 1.33 | (5.10) | (.39) |
Total from investment operations | 2.45 | 2.85 | 1.68 | (4.79) | (.21) |
Distributions from net investment income | (.33) | (.35) | (.36) | (.20) | (.24) |
Redemption fees added to paid in capital C, G | - | - | - | - | - |
Net asset value, end of period | $ 21.21 | $ 19.09 | $ 16.59 | $ 15.27 | $ 20.26 |
Total Return A, B | 13.13% | 17.39% | 11.13% | (23.61)% | (1.11)% |
Ratios to Average Net Assets D, F | | | | | |
Expenses before reductions | 1.49% | 1.50% | 1.52% | 1.52% | 1.47% |
Expenses net of fee waivers, if any | 1.49% | 1.50% | 1.52% | 1.52% | 1.47% |
Expenses net of all reductions | 1.48% | 1.46% | 1.49% | 1.52% | 1.47% |
Net investment income (loss) | 1.98% | 1.92% | 2.23% | 2.11% | .84% |
Supplemental Data | | | | | |
Net assets, end of period (000 omitted) | $ 38,276 | $ 35,701 | $ 33,651 | $ 33,989 | $ 54,346 |
Portfolio turnover rate E | 195% | 201% | 216% | 247% | 77% |
A Total returns would have been lower if certain expenses had not been reduced during the applicable periods shown.
B Total returns do not include the effect of the sales charges.
C Calculated based on average shares outstanding during the period.
D Fees and expenses of any underlying Fidelity Central Funds are not included in the Fund's expense ratio. The Fund indirectly bears its proportionate share of the expenses of any underlying Fidelity Central Funds.
E Amount does not include the portfolio activity of any underlying Fidelity Central Funds.
F Expense ratios reflect operating expenses of the class. Expenses before reductions do not reflect amounts reimbursed by the investment adviser or reductions from brokerage service arrangements or reductions from other expense offset arrangements and do not represent the amount paid by the class during periods when reimbursements or reductions occur. Expenses net of fee waivers reflect expenses after reimbursement by the investment adviser but prior to reductions from brokerage service arrangements or other expense offset arrangements. Expenses net of all reductions represent the net expenses paid by the class.
G Amount represents less than $.01 per share.
See accompanying notes which are an integral part of the financial statements.
Annual Report
Financial Highlights - Class B
Years ended July 31, | 2012 | 2011 | 2010 | 2009 | 2008 |
Selected Per-Share Data | | | | | |
Net asset value, beginning of period | $ 18.86 | $ 16.38 | $ 15.08 | $ 20.01 | $ 20.40 |
Income from Investment Operations | | | | | |
Net investment income (loss) C | .28 | .25 | .27 | .24 | .08 |
Net realized and unrealized gain (loss) | 2.05 | 2.49 | 1.31 | (5.04) | (.39) |
Total from investment operations | 2.33 | 2.74 | 1.58 | (4.80) | (.31) |
Distributions from net investment income | (.23) | (.26) | (.28) | (.13) | (.08) |
Redemption fees added to paid in capital C, G | - | - | - | - | - |
Net asset value, end of period | $ 20.96 | $ 18.86 | $ 16.38 | $ 15.08 | $ 20.01 |
Total Return A, B | 12.54% | 16.87% | 10.56% | (23.97)% | (1.59)% |
Ratios to Average Net Assets D, F | | | | | |
Expenses before reductions | 1.98% | 1.99% | 2.01% | 2.01% | 1.96% |
Expenses net of fee waivers, if any | 1.98% | 1.99% | 2.01% | 2.01% | 1.96% |
Expenses net of all reductions | 1.97% | 1.95% | 1.98% | 2.01% | 1.95% |
Net investment income (loss) | 1.49% | 1.43% | 1.74% | 1.62% | .36% |
Supplemental Data | | | | | |
Net assets, end of period (000 omitted) | $ 6,677 | $ 7,773 | $ 8,794 | $ 10,634 | $ 20,747 |
Portfolio turnover rate E | 195% | 201% | 216% | 247% | 77% |
A Total returns would have been lower if certain expenses had not been reduced during the applicable periods shown.
B Total returns do not include the effect of the contingent deferred sales charge.
C Calculated based on average shares outstanding during the period.
D Fees and expenses of any underlying Fidelity Central Funds are not included in the Fund's expense ratio. The Fund indirectly bears its proportionate share of the expenses of any underlying Fidelity Central Funds.
E Amount does not include the portfolio activity of any underlying Fidelity Central Funds.
F Expense ratios reflect operating expenses of the class. Expenses before reductions do not reflect amounts reimbursed by the investment adviser or reductions from brokerage service arrangements or reductions from other expense offset arrangements and do not represent the amount paid by the class during periods when reimbursements or reductions occur. Expenses net of fee waivers reflect expenses after reimbursement by the investment adviser but prior to reductions from brokerage service arrangements or other expense offset arrangements. Expenses net of all reductions represent the net expenses paid by the class.
G Amount represents less than $.01 per share.
Financial Highlights - Class C
Years ended July 31, | 2012 | 2011 | 2010 | 2009 | 2008 |
Selected Per-Share Data | | | | | |
Net asset value, beginning of period | $ 18.75 | $ 16.30 | $ 15.02 | $ 19.93 | $ 20.38 |
Income from Investment Operations | | | | | |
Net investment income (loss) C | .29 | .26 | .27 | .24 | .08 |
Net realized and unrealized gain (loss) | 2.03 | 2.46 | 1.30 | (5.02) | (.39) |
Total from investment operations | 2.32 | 2.72 | 1.57 | (4.78) | (.31) |
Distributions from net investment income | (.27) | (.27) | (.29) | (.13) | (.14) |
Redemption fees added to paid in capital C, G | - | - | - | - | - |
Net asset value, end of period | $ 20.80 | $ 18.75 | $ 16.30 | $ 15.02 | $ 19.93 |
Total Return A, B | 12.56% | 16.85% | 10.54% | (23.96)% | (1.58)% |
Ratios to Average Net Assets D, F | | | | | |
Expenses before reductions | 1.95% | 1.98% | 2.01% | 2.01% | 1.95% |
Expenses net of fee waivers, if any | 1.95% | 1.98% | 2.01% | 2.01% | 1.95% |
Expenses net of all reductions | 1.95% | 1.94% | 1.97% | 2.01% | 1.95% |
Net investment income (loss) | 1.51% | 1.43% | 1.74% | 1.62% | .36% |
Supplemental Data | | | | | |
Net assets, end of period (000 omitted) | $ 29,942 | $ 26,915 | $ 21,415 | $ 22,352 | $ 37,387 |
Portfolio turnover rate E | 195% | 201% | 216% | 247% | 77% |
A Total returns would have been lower if certain expenses had not been reduced during the applicable periods shown.
B Total returns do not include the effect of the contingent deferred sales charge.
C Calculated based on average shares outstanding during the period.
D Fees and expenses of any underlying Fidelity Central Funds are not included in the Fund's expense ratio. The Fund indirectly bears its proportionate share of the expenses of any underlying Fidelity Central Funds.
E Amount does not include the portfolio activity of any underlying Fidelity Central Funds.
F Expense ratios reflect operating expenses of the class. Expenses before reductions do not reflect amounts reimbursed by the investment adviser or reductions from brokerage service arrangements or reductions from other expense offset arrangements and do not represent the amount paid by the class during periods when reimbursements or reductions occur. Expenses net of fee waivers reflect expenses after reimbursement by the investment adviser but prior to reductions from brokerage service arrangements or other expense offset arrangements. Expenses net of all reductions represent the net expenses paid by the class.
G Amount represents less than $.01 per share.
See accompanying notes which are an integral part of the financial statements.
Annual Report
Financial Highlights - Institutional Class
Years ended July 31, | 2012 | 2011 | 2010 | 2009 | 2008 |
Selected Per-Share Data | | | | | |
Net asset value, beginning of period | $ 19.40 | $ 16.85 | $ 15.51 | $ 20.52 | $ 20.95 |
Income from Investment Operations | | | | | |
Net investment income (loss) B | .50 | .45 | .44 | .39 | .31 |
Net realized and unrealized gain (loss) | 2.10 | 2.54 | 1.35 | (5.17) | (.38) |
Total from investment operations | 2.60 | 2.99 | 1.79 | (4.78) | (.07) |
Distributions from net investment income | (.44) | (.44) | (.45) | (.23) | (.36) |
Redemption fees added to paid in capital B, F | - | - | - | - | - |
Net asset value, end of period | $ 21.56 | $ 19.40 | $ 16.85 | $ 15.51 | $ 20.52 |
Total Return A | 13.79% | 18.05% | 11.66% | (23.24)% | (.49)% |
Ratios to Average Net Assets C, E | | | | | |
Expenses before reductions | .92% | .98% | 1.00% | 1.00% | .91% |
Expenses net of fee waivers, if any | .92% | .98% | 1.00% | 1.00% | .91% |
Expenses net of all reductions | .91% | .94% | .97% | 1.00% | .90% |
Net investment income (loss) | 2.55% | 2.44% | 2.75% | 2.63% | 1.41% |
Supplemental Data | | | | | |
Net assets, end of period (000 omitted) | $ 20,564 | $ 10,914 | $ 6,511 | $ 4,373 | $ 5,704 |
Portfolio turnover rate D | 195% | 201% | 216% | 247% | 77% |
A Total returns would have been lower if certain expenses had not been reduced during the applicable periods shown.
B Calculated based on average shares outstanding during the period.
C Fees and expenses of any underlying Fidelity Central Funds are not included in the Fund's expense ratio. The Fund indirectly bears its proportionate share of the expenses of any underlying Fidelity Central Funds.
D Amount does not include the portfolio activity of any underlying Fidelity Central Funds.
E Expense ratios reflect operating expenses of the class. Expenses before reductions do not reflect amounts reimbursed by the investment adviser or reductions from brokerage service arrangements or reductions from other expense offset arrangements and do not represent the amount paid by the class during periods when reimbursements or reductions occur. Expenses net of fee waivers reflect expenses after reimbursement by the investment adviser but prior to reductions from brokerage service arrangements or other expense offset arrangements. Expenses net of all reductions represent the net expenses paid by the class.
F Amount represents less than $.01 per share.
See accompanying notes which are an integral part of the financial statements.
Annual Report
Fidelity Advisor Utilities Fund
Notes to Financial Statements
For the period ended July 31, 2012
1. Organization.
Fidelity Advisor Utilities Fund (the Fund) is a non-diversified fund of Fidelity Advisor Series VII (the Trust) and is authorized to issue an unlimited number of shares. The Trust is registered under the Investment Company Act of 1940, as amended (the 1940 Act), as an open-end management investment company organized as a Massachusetts business trust. The Fund offers Class A, Class T, Class C, and Institutional Class shares, each of which, along with Class B shares, has equal rights as to assets and voting privileges. Effective after the close of business on September 1, 2010, Class B shares were closed to new accounts and additional purchases, except for exchanges and reinvestments. Each class has exclusive voting rights with respect to matters that affect that class. Class B shares will automatically convert to Class A shares after a holding period of seven years from the initial date of purchase. Investment income, realized and unrealized capital gains and losses, the common expenses of the Fund, and certain fund-level expense reductions, if any, are allocated on a pro-rata basis to each class based on the relative net assets of each class to the total net assets of the Fund. Each class differs with respect to transfer agent and distribution and service plan fees incurred. Certain expense reductions may also differ by class.
2. Investments in Fidelity Central Funds.
The Fund invests in Fidelity Central Funds, which are open-end investment companies available only to other investment companies and accounts managed by Fidelity Management & Research Company (FMR) and its affiliates. The Fund's Schedule of Investments lists each of the Fidelity Central Funds held as of period end, if any, as an investment of the Fund, but does not include the underlying holdings of each Fidelity Central Fund. As an Investing Fund, the Fund indirectly bears its proportionate share of the expenses of the underlying Fidelity Central Funds.
The Money Market Central Funds seek preservation of capital and current income and are managed by Fidelity Investments Money Management, Inc. (FIMM), an affiliate of FMR.
A complete unaudited list of holdings for each Fidelity Central Fund is available upon request or at the Securities and Exchange Commission (the SEC) web site at www.sec.gov. In addition, the financial statements of the Fidelity Central Funds, which are not covered by the Fund's Report of Independent Registered Public Accounting Firm, are available on the SEC web site or upon request.
3. Significant Accounting Policies.
The financial statements have been prepared in conformity with accounting principles generally accepted in the United States of America (GAAP), which require management to make certain estimates and assumptions at the date of the financial statements. Actual results could differ from those estimates. Subsequent events, if any, through the date that the financial statements were issued have been evaluated in the preparation of the financial statements. The following summarizes the significant accounting policies of the Fund:
Security Valuation. Investments are valued as of 4:00 p.m. Eastern time on the last calendar day of the period. In accordance with valuation policies and procedures approved by the Board of Trustees (the Board), the Fund attempts to obtain prices from one or more third party pricing vendor or broker to value its investments. When current market prices, quotations or rates are not readily available or reliable, securities will be fair valued in good faith by the FMR Fair Value Committee (the Committee), in accordance with procedures adopted by the Fund's Board. Factors used in determining fair value vary by security type and may include market or security specific events. The frequency with which these procedures are used cannot be predicted and they may be utilized to a significant extent. The Committee oversees the Fund's valuation policies and procedures and is responsible for approving and reporting to the Board all fair value determinations.
The Fund categorizes the inputs to valuation techniques used to value its investments into a disclosure hierarchy consisting of three levels as shown below:
Level 1 - quoted prices in active markets for identical investments
Level 2 - other significant observable inputs (including quoted prices for similar investments, interest rates, prepayment speeds, etc.)
Level 3 - unobservable inputs (including the Fund's own assumptions based on the best information available)
Valuation techniques used to value the Fund's investments by major category are as follows:
Equity securities, including restricted securities, for which market quotations are readily available, are valued at the last reported sale price or official closing price as reported by a third party pricing vendor on the primary market or exchange on which they are traded and are categorized as Level 1 in the hierarchy. In the event there were no sales during the day or closing prices are not available, securities are valued at the last quoted bid price or may be valued using the last available price and are generally categorized as Level 2 in the hierarchy. For foreign equity securities, when significant market or security specific events arise, comparisons to the valuation of American Depositary Receipts (ADRs), futures contracts, Exchange-Traded Funds (ETFs) and certain indexes as well as quoted prices for similar securities are used and are categorized as Level 2 in the hierarchy. Utilizing these techniques may result in transfers between Level 1 and Level 2.
Investments in open-end mutual funds, including the Fidelity Central Funds, are valued at their closing net asset value each business day and are categorized as Level 1 in the hierarchy.
Changes in valuation techniques may result in transfers in or out of an assigned level within the disclosure hierarchy.
Annual Report
3. Significant Accounting Policies - continued
Foreign Currency Translation. The Fund may use foreign currency contracts to facilitate transactions in foreign-denominated securities. Gains and losses from these transactions may arise from changes in the value of the foreign currency or if the counterparties do not perform under the contracts' terms.
Foreign-denominated assets, including investment securities, and liabilities are translated into U.S. dollars at the exchange rates at period end. Purchases and sales of investment securities, income and dividends received and expenses denominated in foreign currencies are translated into U.S. dollars at the exchange rate in effect on the transaction date.
The effects of exchange rate fluctuations on investments are included with the net realized and unrealized gain (loss) on investment securities. Other foreign currency transactions resulting in realized and unrealized gain (loss) are disclosed separately.
Investment Transactions and Income. For financial reporting purposes, the Fund's investment holdings and NAV include trades executed through the end of the last business day of the period. The NAV per share for processing shareholder transactions is calculated as of the close of business of the New York Stock Exchange (NYSE), normally 4:00 p.m. Eastern time and includes trades executed through the end of the prior business day. Gains and losses on securities sold are determined on the basis of identified cost and may include proceeds received from litigation. Dividend income is recorded on the ex-dividend date, except for certain dividends from foreign securities where the ex-dividend date may have passed, which are recorded as soon as the Fund is informed of the ex-dividend date. Non-cash dividends included in dividend income, if any, are recorded at the fair market value of the securities received. Interest income and distributions from the Fidelity Central Funds are accrued as earned. Interest income includes coupon interest and amortization of premium and accretion of discount on debt securities. Investment income is recorded net of foreign taxes withheld where recovery of such taxes is uncertain.
Expenses. Expenses directly attributable to a fund are charged to that fund. Expenses attributable to more than one fund are allocated among the respective funds on the basis of relative net assets or other appropriate methods. Expense estimates are accrued in the period to which they relate and adjustments are made when actual amounts are known.
Income Tax Information and Distributions to Shareholders. Each year, the Fund intends to qualify as a regulated investment company under Subchapter M of the Internal Revenue Code, including distributing substantially all of its taxable income and realized gains. As a result, no provision for income taxes is required. As of July 31, 2012, the Fund did not have any unrecognized tax benefits in the financial statements; nor is the Fund aware of any tax positions for which it is reasonably possible that the total amounts of unrecognized tax benefits will significantly change in the next twelve months. The Fund files a U.S. federal tax return, in addition to state and local tax returns as required. A fund's federal income tax returns are subject to examination by the Internal Revenue Service (IRS) for a period of three fiscal years after they are filed. State and local tax returns may be subject to examination for an additional fiscal year depending on the jurisdiction. Foreign taxes are provided for based on the Fund's understanding of the tax rules and rates that exist in the foreign markets in which it invests.
Distributions are declared and recorded on the ex-dividend date. Income dividends and capital gain distributions are declared separately for each class. Income and capital gain distributions are determined in accordance with income tax regulations, which may differ from GAAP.
Capital accounts within the financial statements are adjusted for permanent book-tax differences. These adjustments have no impact on net assets or the results of operations. Temporary book-tax differences will reverse in a subsequent period.
Book-tax differences are primarily due to foreign currency transactions, partnerships, equity-debt classifications, capital loss carryforwards and losses deferred due to wash sales.
The federal tax cost of investment securities and unrealized appreciation (depreciation) as of period end were as follows:
Gross unrealized appreciation | $ 16,531,709 |
Gross unrealized depreciation | (1,153,862) |
Net unrealized appreciation (depreciation) on securities and other investments | $ 15,377,847 |
| |
Tax Cost | $ 184,143,476 |
The tax-based components of distributable earnings as of period end were as follows:
Undistributed ordinary income | $ 1,693,801 |
Capital loss carryforward | $ (30,996,726) |
Net unrealized appreciation (depreciation) | $ 15,377,847 |
Annual Report
Fidelity Advisor Utilities Fund
Notes to Financial Statements - continued
3. Significant Accounting Policies - continued
Income Tax Information and Distributions to Shareholders - continued
Capital loss carryforwards are only available to offset future capital gains of the Fund to the extent provided by regulations and may be limited. Under the Regulated Investment Company Modernization Act of 2010 (the Act), the Fund is permitted to carry forward capital losses incurred in taxable years beginning after December 22, 2010 for an unlimited period and such capital losses are required to be used prior to any losses that expire. Capital loss carryforwards were as follows:
Fiscal year of expiration | |
2017 | $ (2,914,692) |
2018 | (28,082,034) |
Total capital loss carryforward | $ (30,996,726) |
The tax character of distributions paid was as follows:
| July 31, 2012 | July 31, 2011 |
Ordinary Income | $ 3,107,112 | $ 2,864,390 |
Short-Term Trading (Redemption) Fees. Shares held by investors in the Fund less than 30 days are subject to a redemption fee equal to .75% of the net asset value of shares redeemed. All redemption fees, which reduce the proceeds of the shareholder redemption, are retained by the Fund and accounted for as an addition to paid in capital.
New Accounting Pronouncement. In December 2011, the Financial Accounting Standards Board issued Accounting Standard Update No. 2011-11, Disclosures about Offsetting Assets and Liabilities. The update creates new disclosure requirements requiring entities to disclose both gross and net information for derivatives and other financial instruments that are either offset in the Statement of Assets and Liabilities or subject to an enforceable master netting arrangement or similar agreement. The disclosure requirements are effective for interim and annual reporting periods beginning on or after January 1, 2013. Management is currently evaluating the impact of the update's adoption on the Fund's financial statement disclosures.
4. Purchases and Sales of Investments.
Purchases and sales of securities, other than short-term securities, aggregated $342,529,260 and $328,678,428, respectively.
5. Fees and Other Transactions with Affiliates.
Management Fee. FMR and its affiliates provide the Fund with investment management related services for which the Fund pays a monthly management fee. The management fee is the sum of an individual fund fee rate that is based on an annual rate of .30% of the Fund's average net assets and an annualized group fee rate that averaged .26% during the period. The group fee rate is based upon the average net assets of all the mutual funds advised by FMR. The group fee rate decreases as assets under management increase and increases as assets under management decrease. For the period, the total annual management fee rate was .56% of the Fund's average net assets.
Distribution and Service Plan Fees. In accordance with Rule 12b-1 of the 1940 Act, the Fund has adopted separate Distribution and Service Plans for each class of shares. Certain classes pay Fidelity Distributors Corporation (FDC), an affiliate of FMR, separate Distribution and Service Fees, each of which is based on an annual percentage of each class' average net assets. In addition, FDC may pay financial intermediaries for selling shares of the Fund and providing shareholder support services. For the period, the Distribution and Service Fee rates, total fees and amounts retained by FDC were as follows:
| Distribution
Fee | Service
Fee | Total Fees | Retained
by FDC |
Class A | -% | .25% | $ 214,732 | $ 4,630 |
Class T | .25% | .25% | 181,944 | 1,028 |
Class B | .75% | .25% | 70,797 | 53,145 |
Class C | .75% | .25% | 286,724 | 41,280 |
| | | $ 754,197 | $ 100,083 |
Sales Load. FDC may receive a front-end sales charge of up to 5.75% for selling Class A shares and 3.50% for selling Class T shares, some of which is paid to financial intermediaries for selling shares of the Fund. Depending on the holding period, FDC may receive contingent deferred sales charges levied on Class A, Class T, Class B, and Class C redemptions. The deferred sales charges range from 5.00% to 1.00% for Class B shares, 1.00% for Class C shares, 1.00% for certain purchases of Class A shares and .25% for certain purchases of Class T shares.
Annual Report
5. Fees and Other Transactions with Affiliates - continued
Sales Load - continued
For the period, sales charge amounts retained by FDC were as follows:
| Retained
by FDC |
Class A | $ 84,073 |
Class T | 11,209 |
Class B* | 14,892 |
Class C* | 3,294 |
| $ 113,468 |
* When Class B and Class C shares are initially sold, FDC pays commissions from its own resources to financial intermediaries through which the sales are made.
Transfer Agent Fees. Fidelity Investments Institutional Operations Company, Inc. (FIIOC), an affiliate of FMR, is the transfer, dividend disbursing and shareholder servicing agent for each class of the Fund. FIIOC receives account fees and asset-based fees that vary according to the account size and type of account of the shareholders of the respective classes of the Fund. FIIOC pays for typesetting, printing and mailing of shareholder reports, except proxy statements. For the period, transfer agent fees for each class were as follows:
| Amount | % of
Average
Net Assets |
Class A | $ 258,677 | .30 |
Class T | 113,959 | .31 |
Class B | 21,373 | .30 |
Class C | 79,958 | .28 |
Institutional Class | 30,155 | .24 |
| $ 504,122 | |
Accounting and Security Lending Fees. Fidelity Service Company, Inc. (FSC), an affiliate of FMR, maintains the Fund's accounting records. The accounting fee is based on the level of average net assets for each month. Under a separate contract, FSC administers the security lending program. The security lending fee is based on the number and duration of lending transactions.
Brokerage Commissions. The Fund placed a portion of its portfolio transactions with brokerage firms which are affiliates of the investment adviser. The commissions paid to these affiliated firms were $9,377 for the period.
6. Committed Line of Credit.
The Fund participates with other funds managed by FMR or an affiliate in a $4.25 billion credit facility (the "line of credit") to be utilized for temporary or emergency purposes to fund shareholder redemptions or for other short-term liquidity purposes. The Fund has agreed to pay commitment fees on its pro-rata portion of the line of credit, which amounted to $477 and is reflected in Miscellaneous expenses on the Statement of Operations. During the period, there were no borrowings on this line of credit.
7. Security Lending.
The Fund lends portfolio securities through a lending agent from time to time in order to earn additional income. For equity securities, a lending agent is used and may loan securities to certain qualified borrowers, including Fidelity Capital Markets (FCM), a broker-dealer affiliated with the Fund. On the settlement date of the loan, the Fund receives collateral (in the form of U.S. Treasury obligations, letters of credit and/or cash) against the loaned securities and maintains collateral in an amount not less than 100% of the market value of the loaned securities during the period of the loan. The market value of the loaned securities is determined at the close of business of the Fund and any additional required collateral is delivered to the Fund on the next business day. If the borrower defaults on its obligation to return the securities loaned because of insolvency or other reasons, a fund could experience delays and costs in recovering the securities loaned or in gaining access to the collateral. Any cash collateral received is invested in the Fidelity Securities Lending Cash Central Fund. The value of loaned securities and cash collateral at period end are disclosed on the Fund's Statement of Assets and Liabilities. Security lending income represents the income earned on investing cash collateral, less rebates paid to borrowers and any lending agent fees associated with the loan, plus any premium payments received for lending certain types of securities. Security lending income is presented in the Statement of Operations as a component of income from Fidelity Central Funds. Total security lending income during the period amounted to $25,507. During the period, there were no securities loaned to FCM.
Annual Report
Fidelity Advisor Utilities Fund
Notes to Financial Statements - continued
8. Expense Reductions.
Many of the brokers with whom FMR places trades on behalf of the Fund provided services to the Fund in addition to trade execution. These services included payments of certain expenses on behalf of the Fund totaling $12,239 for the period.
9. Distributions to Shareholders.
Distributions to shareholders of each class were as follows:
Years ended July 31, | 2012 | 2011 |
From net investment income | | |
Class A | $ 1,654,303 | $ 1,536,373 |
Class T | 639,462 | 680,070 |
Class B | 91,242 | 128,700 |
Class C | 419,210 | 350,529 |
Institutional Class | 302,895 | 168,718 |
Total | $ 3,107,112 | $ 2,864,390 |
10. Share Transactions.
Transactions for each class of shares were as follows:
| Shares | Dollars |
Years ended July 31, | 2012 | 2011 | 2012 | 2011 |
Class A | | | | |
Shares sold | 1,455,060 | 951,835 | $ 28,046,781 | $ 17,339,635 |
Reinvestment of distributions | 77,893 | 78,008 | 1,433,959 | 1,339,641 |
Shares redeemed | (926,992) | (840,008) | (17,830,196) | (15,213,828) |
Net increase (decrease) | 605,961 | 189,835 | $ 11,650,544 | $ 3,465,448 |
Class T | | | | |
Shares sold | 428,140 | 251,762 | $ 8,180,543 | $ 4,579,718 |
Reinvestment of distributions | 32,850 | 37,445 | 606,115 | 644,378 |
Shares redeemed | (526,129) | (448,193) | (10,126,088) | (8,103,122) |
Net increase (decrease) | (65,139) | (158,986) | $ (1,339,430) | $ (2,879,026) |
Class B | | | | |
Shares sold | 59,712 | 39,073 | $ 1,111,703 | $ 679,580 |
Reinvestment of distributions | 4,324 | 6,858 | 79,307 | 116,904 |
Shares redeemed | (157,671) | (170,627) | (2,989,895) | (3,021,254) |
Net increase (decrease) | (93,635) | (124,696) | $ (1,798,885) | $ (2,224,770) |
Class C | | | | |
Shares sold | 518,655 | 405,545 | $ 9,682,101 | $ 7,271,889 |
Reinvestment of distributions | 18,237 | 15,668 | 332,155 | 265,763 |
Shares redeemed | (533,137) | (299,716) | (10,002,257) | (5,335,908) |
Net increase (decrease) | 3,755 | 121,497 | $ 11,999 | $ 2,201,744 |
Institutional Class | | | | |
Shares sold | 988,603 | 343,779 | $ 19,698,436 | $ 6,436,483 |
Reinvestment of distributions | 14,596 | 7,398 | 273,126 | 128,959 |
Shares redeemed | (611,715) | (175,049) | (11,813,084) | (3,230,206) |
Net increase (decrease) | 391,484 | 176,128 | $ 8,158,478 | $ 3,335,236 |
11. Other.
The Fund's organizational documents provide former and current trustees and officers with a limited indemnification against liabilities arising in connection with the performance of their duties to the Fund. In the normal course of business, the Fund may also enter into contracts that provide general indemnifications. The Fund's maximum exposure under these arrangements is unknown as this would be dependent on future claims that may be made against the Fund. The risk of material loss from such claims is considered remote.
Annual Report
Report of Independent Registered Public Accounting Firm
To the Trustees of Advisor Series VII and the Shareholders of Fidelity Advisor Biotechnology Fund, Fidelity Advisor Communications Equipment Fund, Fidelity Advisor Consumer Discretionary Fund, Fidelity Advisor Electronics Fund, Fidelity Advisor Energy Fund, Fidelity Advisor Financial Services Fund, Fidelity Advisor Health Care Fund, Fidelity Advisor Industrials Fund, Fidelity Advisor Technology Fund, and Fidelity Advisor Utilities Fund:
We have audited the accompanying statements of assets and liabilities of Fidelity Advisor Biotechnology Fund, Fidelity Advisor Communications Equipment Fund, Fidelity Advisor Consumer Discretionary Fund, Fidelity Advisor Electronics Fund, Fidelity Advisor Energy Fund, Fidelity Advisor Financial Services Fund, Fidelity Advisor Health Care Fund, Fidelity Advisor Industrials Fund, Fidelity Advisor Technology Fund, and Fidelity Advisor Utilities Fund (collectively, the "Funds"), including the schedules of investments, as of July 31, 2012, and the related statements of operations for the year then ended, the statements of changes in net assets for each of the two years in the period then ended, and the financial highlights for each of the five years in the period then ended. These financial statements and financial highlights are the responsibility of the Funds' management. Our responsibility is to express an opinion on these financial statements and financial highlights based on our audits.
We conducted our audits in accordance with the standards of the Public Company Accounting Oversight Board (United States). Those standards require that we plan and perform the audit to obtain reasonable assurance about whether the financial statements and financial highlights are free of material misstatement. The Funds are not required to have, nor were we engaged to perform, an audit of their internal control over financial reporting. Our audits included consideration of internal control over financial reporting as a basis for designing audit procedures that are appropriate in the circumstances, but not for the purpose of expressing an opinion on the effectiveness of the Fund's internal control over financial reporting. Accordingly, we express no such opinion. An audit also includes examining, on a test basis, evidence supporting the amounts and disclosures in the financial statements, assessing the accounting principles used and significant estimates made by management, as well as evaluating the overall financial statement presentation. Our procedures included confirmation of securities owned as of July 31, 2012, by correspondence with the custodians and brokers; where replies were not received from brokers, we performed other auditing procedures. We believe that our audits provide a reasonable basis for our opinion.
In our opinion, the financial statements and financial highlights referred to above present fairly, in all material respects, the financial position of Fidelity Advisor Biotechnology Fund, Fidelity Advisor Communications Equipment Fund, Fidelity Advisor Consumer Discretionary Fund, Fidelity Advisor Electronics Fund, Fidelity Advisor Energy Fund, Fidelity Advisor Financial Services Fund, Fidelity Advisor Health Care Fund, Fidelity Advisor Industrials Fund, Fidelity Advisor Technology Fund, and Fidelity Advisor Utilities Fund as of July 31, 2012, the results of their operations for the year then ended, the changes in their net assets for each of the two years in the period then ended, and their financial highlights for each of the five years in the period then ended, in conformity with accounting principles generally accepted in the United States of America.
DELOITTE & TOUCHE LLP
Boston, Massachusetts
September 14, 2012
Annual Report
The Trustees, Members of the Advisory Board, and executive officers of the trust and funds, as applicable, are listed below. The Board of Trustees governs each fund and is responsible for protecting the interests of shareholders. The Trustees are experienced executives who meet periodically throughout the year to oversee each fund's activities, review contractual arrangements with companies that provide services to each fund, oversee management of the risks associated with such activities and contractual arrangements, and review each fund's performance. Except for James C. Curvey, each of the Trustees oversees 228 funds advised by FMR or an affiliate. Mr. Curvey oversees 435 funds advised by FMR or an affiliate.
The Trustees hold office without limit in time except that (a) any Trustee may resign; (b) any Trustee may be removed by written instrument, signed by at least two-thirds of the number of Trustees prior to such removal; (c) any Trustee who requests to be retired or who has become incapacitated by illness or injury may be retired by written instrument signed by a majority of the other Trustees; and (d) any Trustee may be removed at any special meeting of shareholders by a two-thirds vote of the outstanding voting securities of the trust. Each Trustee who is not an interested person (as defined in the 1940 Act) (Independent Trustee), shall retire not later than the last day of the calendar year in which his or her 75th birthday occurs. The Independent Trustees may waive this mandatory retirement age policy with respect to individual Trustees. The executive officers and Advisory Board Members hold office without limit in time, except that any officer and Advisory Board Member may resign or may be removed by a vote of a majority of the Trustees at any regular meeting or any special meeting of the Trustees. Except as indicated, each individual has held the office shown or other offices in the same company for the past five years.
Experience, Skills, Attributes, and Qualifications of the Funds' Trustees. The Governance and Nominating Committee has adopted a statement of policy that describes the experience, qualifications, attributes, and skills that are necessary and desirable for potential Independent Trustee candidates (Statement of Policy). The Board believes that each Trustee satisfied at the time he or she was initially elected or appointed a Trustee, and continues to satisfy, the standards contemplated by the Statement of Policy. The Governance and Nominating Committee also engages professional search firms to help identify potential Independent Trustee candidates who have the experience, qualifications, attributes, and skills consistent with the Statement of Policy. From time to time, additional criteria based on the composition and skills of the current Independent Trustees, as well as experience or skills that may be appropriate in light of future changes to board composition, business conditions, and regulatory or other developments, have also been considered by the professional search firms and the Governance and Nominating Committee. In addition, the Board takes into account the Trustees' commitment and participation in Board and committee meetings, as well as their leadership of standing and ad hoc committees throughout their tenure.
In determining that a particular Trustee was and continues to be qualified to serve as a Trustee, the Board has considered a variety of criteria, none of which, in isolation, was controlling. The Board believes that, collectively, the Trustees have balanced and diverse experience, qualifications, attributes, and skills, which allow the Board to operate effectively in governing each fund and protecting the interests of shareholders. Information about the specific experience, skills, attributes, and qualifications of each Trustee, which in each case led to the Board's conclusion that the Trustee should serve (or continue to serve) as a trustee of the funds, is provided below.
Board Structure and Oversight Function. James C. Curvey is an interested person (as defined in the 1940 Act) and currently serves as Chairman. The Trustees have determined that an interested Chairman is appropriate and benefits shareholders because an interested Chairman has a personal and professional stake in the quality and continuity of services provided to the funds. Independent Trustees exercise their informed business judgment to appoint an individual of their choosing to serve as Chairman, regardless of whether the Trustee happens to be independent or a member of management. The Independent Trustees have determined that they can act independently and effectively without having an Independent Trustee serve as Chairman and that a key structural component for assuring that they are in a position to do so is for the Independent Trustees to constitute a substantial majority for the Board. The Independent Trustees also regularly meet in executive session. Ned C. Lautenbach serves as Chairman of the Independent Trustees and as such (i) acts as a liaison between the Independent Trustees and management with respect to matters important to the Independent Trustees and (ii) with management prepares agendas for Board meetings.
Fidelity funds are overseen by different Boards of Trustees. The funds' Board oversees Fidelity's equity and high income funds and another Board oversees Fidelity's investment-grade bond, money market, and asset allocation funds. The asset allocation funds may invest in Fidelity funds overseen by the funds' Board. The use of separate Boards, each with its own committee structure, allows the Trustees of each group of Fidelity funds to focus on the unique issues of the funds they oversee, including common research, investment, and operational issues. On occasion, the separate Boards establish joint committees to address issues of overlapping consequences for the Fidelity funds overseen by each Board.
The Trustees operate using a system of committees to facilitate the timely and efficient consideration of all matters of importance to the Trustees, each fund, and fund shareholders and to facilitate compliance with legal and regulatory requirements and oversight of the funds' activities and associated risks. The Board, acting through its committees, has charged FMR and its affiliates with (i) identifying events or circumstances the occurrence of which could have demonstrably adverse effects on the funds' business and/or reputation; (ii) implementing processes and controls to lessen the possibility that such events or circumstances occur or to mitigate the effects of such events or circumstances if they do occur; and (iii) creating and maintaining a system designed to evaluate continuously business and market conditions in order to facilitate the identification and implementation processes described in (i) and (ii) above. Because the day-to-day operations and activities of the funds are carried out by or through FMR, its affiliates and other service providers, the funds' exposure to risks is mitigated but not eliminated by the processes overseen by the Trustees. While each of the Board's committees has responsibility for overseeing different aspects of the funds' activities, oversight is exercised primarily through the Operations, Audit, and Compliance Committees. In addition, the Independent Trustees have worked with FMR to enhance the Board's oversight of investment and financial risks, legal and regulatory risks, technology risks, and operational risks, including the development of additional risk reporting to the Board. For example, a working group comprised of Independent Trustees and FMR has worked and continues to work to review the Fidelity funds' valuation-related activities, reporting and risk management. Appropriate personnel, including but not limited to the funds' Chief Compliance Officer (CCO), FMR's internal auditor, the independent accountants, the funds' Treasurer and portfolio management personnel, make periodic reports to the Board's committees, as appropriate, including an annual review of FMR's risk management program for the Fidelity funds. The responsibilities of each standing committee, including their oversight responsibilities, are described further under "Standing Committees of the Funds' Trustees."
Annual Report
The funds' Statement of Additional Information (SAI) includes more information about the Trustees. To request a free copy, call Fidelity at 1-877-208-0098.
Interested Trustees*:
Correspondence intended for each Trustee who is an interested person may be sent to Fidelity Investments, 82 Devonshire Street, Boston, Massachusetts 02109.
Name, Age; Principal Occupations and Other Relevant Experience+ |
James C. Curvey (77) |
| Year of Election or Appointment: 2007 Mr. Curvey is Trustee and Chairman of the Board of Trustees of certain Trusts. Mr. Curvey also serves as Trustee (2007-present) of other investment companies advised by FMR. Mr. Curvey is a Director of Fidelity Investments Money Management, Inc. (2009-present), Director of Fidelity Research & Analysis Co. (2009-present) and Director of FMR and FMR Co., Inc. (2007-present). Mr. Curvey is also Vice Chairman (2007-present) and Director of FMR LLC. In addition, Mr. Curvey serves as an Overseer for the Boston Symphony Orchestra and a member of the Trustees of Villanova University. Previously, Mr. Curvey was the Vice Chairman (2006-2007) and Director (2000-2007) of FMR Corp. |
Ronald P. O'Hanley (55) |
| Year of Election or Appointment: 2011 Mr. O'Hanley is Director of FMR Co., Inc. (2010-present), Director of Fidelity Investments Money Management, Inc. (2010-present), Director of Fidelity Research & Analysis Company (2010-present), President of Fidelity Asset Management and Corporate Services and a member of Fidelity's Executive Committee (2010-present). Previously, Mr. O'Hanley served as President and Chief Executive Officer of BNY Mellon Asset Management (2007-2010). Mr. O'Hanley also served as Vice Chairman of Bank New York Mellon Corp. and a member of that firm's Executive Committee. Prior to the 2007 merger of The Bank of New York and Mellon Financial Corporation, he was Vice Chairman of Mellon Financial Corporation and President and Chief Executive Officer of Mellon Asset Management. He joined Mellon in February 1997. Mr. O'Hanley currently serves as Chairman of the Boston Public Library Foundation Board of Directors and sits on the Board of Directors of Beth Israel Deaconess Medical Center, the Board of Trustees of the Marine Biological Laboratory and the Advisory Board of the Maxwell School of Citizenship and Public Administration at Syracuse University. Mr. O'Hanley also chairs the Council on Asset Management for the Financial Services Roundtable and is a member of the Board of Directors of Institutional Investor's U.S. Institute. |
* Trustees have been determined to be "Interested Trustees" by virtue of, among other things, their affiliation with the trust or various entities under common control with FMR.
+ The information above includes each Trustee's principal occupation during the last five years and other information relating to the experience, attributes, and skills relevant to each Trustee's qualifications to serve as a Trustee, which led to the conclusion that each Trustee should serve as a Trustee for each fund.
Independent Trustees:
Correspondence intended for each Independent Trustee (that is, the Trustees other than the Interested Trustees) may be sent to Fidelity Investments, P.O. Box 55235, Boston, Massachusetts 02205-5235.
Name, Age; Principal Occupations and Other Relevant Experience+ |
Dennis J. Dirks (64) |
| Year of Election or Appointment: 2005 Prior to his retirement in May 2003, Mr. Dirks was Chief Operating Officer and a member of the Board of The Depository Trust & Clearing Corporation (DTCC). He also served as President, Chief Operating Officer, and Board member of The Depository Trust Company (DTC) and President and Board member of the National Securities Clearing Corporation (NSCC). In addition, Mr. Dirks served as Chief Executive Officer and Board member of the Government Securities Clearing Corporation, Chief Executive Officer and Board member of the Mortgage-Backed Securities Clearing Corporation, as a Trustee and a member of the Finance Committee of Manhattan College (2005-2008), and as a Trustee and a member of the Finance Committee of AHRC of Nassau County (2006-2008). Mr. Dirks is a member of the Independent Directors Council (IDC) Governing Council (2010-present) and Board of Directors for The Brookville Center for Children's Services, Inc. (2009-present). |
Alan J. Lacy (58) |
| Year of Election or Appointment: 2008 Mr. Lacy serves as Senior Adviser (2007-present) of Oak Hill Capital Partners, L.P. (private equity). Mr. Lacy also served as Chief Executive Officer (2000-2005) and Vice Chairman (2005-2006) of Sears Holdings Corporation and Sears, Roebuck and Co. (retail). In addition, Mr. Lacy serves as a member of the Board of Directors of Dave & Buster's Entertainment, Inc. (restaurant and entertainment complexes, 2010-present), Earth Fare, Inc. (retail grocery, 2012-present), The Hillman Companies, Inc. (hardware wholesalers, 2010-present), and Bristol-Myers Squibb Company (global pharmaceuticals, 2007-present). Mr. Lacy is a member of the Board of Trustees of The National Parks Conservation Association (2006-present). Previously, Mr. Lacy served as Chairman of the Board of Trustees of the National Parks Conservation Association (2008-2011) and as a member of the Board of Directors for the Western Union Company (global money transfer, 2006-2011). |
Ned C. Lautenbach (68) |
| Year of Election or Appointment: 2000 Mr. Lautenbach is Chairman of the Independent Trustees of the Equity and High Income Funds (2006-present). Mr. Lautenbach currently serves as the Lead Director of the Eaton Corporation Board of Directors (diversified industrial, 1997-present). Mr. Lautenbach is Chairman of the Board of Directors of the Philharmonic Center for the Arts in Naples, Florida (2012-present) and a member of the Council on Foreign Relations (1994-present). Previously, Mr. Lautenbach was a Partner/Advisory Partner at Clayton, Dubilier & Rice, LLC (private equity investment, 1998-2010), as well as a Director of Sony Corporation (2006-2007). |
Joseph Mauriello (67) |
| Year of Election or Appointment: 2008 Prior to his retirement in January 2006, Mr. Mauriello served in numerous senior management positions including Deputy Chairman and Chief Operating Officer (2004-2005), and Vice Chairman of Financial Services (2002-2004) of KPMG LLP US (professional services, 1965-2005). Mr. Mauriello currently serves as a member of the Board of Directors of XL Group plc. (global insurance and re-insurance, 2006-present). Previously, Mr. Mauriello served as a Director of the Hamilton Funds of the Bank of New York (2006-2007) and of Arcadia Resources Inc. (health care services and products, 2007-2012). |
Robert W. Selander (61) |
| Year of Election or Appointment: 2011 Previously, Mr. Selander served as a Member of the Advisory Board of Fidelity's Equity and High Income Funds (2011), Executive Vice Chairman (2010), Chief Executive Officer (2009-2010), and President and Chief Executive Officer (1997-2009) of Mastercard, Inc. |
Cornelia M. Small (68) |
| Year of Election or Appointment: 2005 Ms. Small is a member of the Board of Directors of the Teagle Foundation (2009-present). Ms. Small is also a member of the Investment Committee, and Chair (2008-present) and a member of the Board of Trustees of Smith College. In addition, Ms. Small serves on the Investment Committee of the Berkshire Taconic Community Foundation (2008-present). Previously, Ms. Small served as Chairperson of the Investment Committee (2002-2008) of Smith College. In addition, Ms. Small served as Chief Investment Officer, Director of Global Equity Investments, and a member of the Board of Directors of Scudder, Stevens & Clark and Scudder Kemper Investments. |
William S. Stavropoulos (73) |
| Year of Election or Appointment: 2001 Mr. Stavropoulos is Vice Chairman of the Independent Trustees of the Equity and High Income Funds (2006-present). Mr. Stavropoulos serves as President and Founder of the Michigan Baseball Foundation, the Great Lakes Loons (2007-present). Mr. Stavropoulos is Chairman Emeritus of the Board of Directors of The Dow Chemical Company, where he previously served in numerous senior management positions, including President, CEO (1995-2000; 2002-2004), Chairman of the Executive Committee (2000-2006), and as a member of the Board of Directors (1990-2006). Currently, Mr. Stavropoulos is Chairman of Univar (global distributor of commodity and specialty chemicals, 2010-present), a Director of Teradata Corporation (data warehousing and technology solutions, 2008-present), Chemical Financial Corporation, Maersk Inc. (industrial conglomerate), Tyco International, Inc. (multinational manufacturing and services, 2007-present), and a member of the Advisory Board for Metalmark Capital (private equity investment, 2005-present). Mr. Stavropoulos is a special advisor to Clayton, Dubilier & Rice, LLC (private equity investment). In addition, Mr. Stavropoulos is a member of the University of Notre Dame Advisory Council for the College of Science. |
David M. Thomas (63) |
| Year of Election or Appointment: 2008 Previously, Mr. Thomas served as Executive Chairman (2005-2006) and Chairman and Chief Executive Officer (2000-2005) of IMS Health, Inc. (pharmaceutical and healthcare information solutions). In addition, Mr. Thomas serves as a member of the Board of Directors of Fortune Brands, Inc. (consumer products), and Interpublic Group of Companies, Inc. (marketing communication, 2004-present). |
Michael E. Wiley (61) |
| Year of Election or Appointment: 2008 Mr. Wiley also serves as a Director of Asia Pacific Exploration Consolidated (international oil and gas exploration and production, 2008-present). Mr. Wiley serves as a Director of Tesoro Corporation (independent oil refiner and marketer, 2005-present), and a Director of Bill Barrett Corporation (exploration and production, 2005-present). In addition, Mr. Wiley also serves as a Director of Post Oak Bank (privately-held bank, 2004-present). Previously, Mr. Wiley served as a member of the Board of Trustees of the University of Tulsa (2000-2006; 2007-2010), as a Senior Energy Advisor of Katzenbach Partners, LLC (consulting, 2006-2007), as an Advisory Director of Riverstone Holdings (private investment), Chairman, President, and CEO of Baker Hughes, Inc. (oilfield services, 2000-2004), and as Director of Spinnaker Exploration Company (exploration and production, 2001-2005). |
+ The information above includes each Trustee's principal occupation during the last five years and other information relating to the experience, attributes, and skills relevant to each Trustee's qualifications to serve as a Trustee, which led to the conclusion that each Trustee should serve as a Trustee for each fund.
Advisory Board Members and Executive Officers:
Correspondence intended for David A. Rosow and Garnett A. Smith may be sent to Fidelity Investments, P.O. Box 55235, Boston, Massachusetts 02205-5235. Correspondence intended for each executive officer, Edward C. Johnson 3d, and Peter S. Lynch may be sent to Fidelity Investments, 82 Devonshire Street, Boston, Massachusetts 02109.
Name, Age; Principal Occupation |
Edward C. Johnson 3d (82) |
| Year of Election or Appointment: 2011 Member of the Advisory Board of Fidelity's Equity and High Income Funds. Mr. Johnson serves as Chief Executive Officer, Chairman, and a Director of FMR LLC, and also serves as Chairman and Director of FIL Limited. Previously, Mr. Johnson served as a Trustee and Chairman of the Board of certain Fidelity Trusts, Chairman and a Director of FMR, Chairman and a Director of FMR Co., Inc., and President of FMR LLC (2006-2007). |
Peter S. Lynch (68) |
| Year of Election or Appointment: 2003 Member of the Advisory Board of Fidelity's Equity and High Income Funds. Mr. Lynch is Vice Chairman and a Director of FMR and FMR Co., Inc. In addition, Mr. Lynch serves as a Trustee of Boston College and as the Chairman of the Inner-City Scholarship Fund. Previously, Mr. Lynch served on the Special Olympics International Board of Directors (1997-2006). |
David A. Rosow (69) |
| Year of Election or Appointment: 2012 Member of the Advisory Board of Fidelity's Equity and High Income Funds. Chairman and Chief Executive Officer of International Golf Group, Inc. (golf course development, 1990-present). Previously, Mr. Rosow served as Chairman and Chief Executive Officer of Rosow & Company, Inc. (private investment company, 1989-2011), a Lead Director of Hudson United Bancorp (2001-2006) and as a Director of TD Banknorth (1996-2006). In addition, Mr. Rosow is a member (2008-present) and President (2009-present) of the Town Council of Palm Beach, Florida. |
Garnett A. Smith (64) |
| Year of Election or Appointment: 2012 Member of the Advisory Board of Fidelity's Equity and High Income Funds. Prior to Mr. Smith's retirement, he served as Chairman and Chief Executive Officer of Inbrand Corp. (manufacturer of personal absorbent products, 1990-1997). He also served as President (1986-1990) of Inbrand Corp. Prior to his employment with Inbrand Corp., he was employed by a retail fabric chain and North Carolina National Bank. In addition, Mr. Smith is a board member of the Jackson Hole Land Trust (2009-present). |
Kenneth B. Robins (42) |
| Year of Election or Appointment: 2008 President and Treasurer of Fidelity's Equity and High Income Funds. Mr. Robins also serves as President and Treasurer (2010-present) and Assistant Treasurer (2009-present) of other Fidelity funds and is an employee of Fidelity Investments (2004-present). Previously, Mr. Robins served as Deputy Treasurer of the Fidelity funds (2005-2008) and Treasurer and Chief Financial Officer of The North Carolina Capital Management Trust: Cash and Term Portfolios (2006-2008). |
Brian B. Hogan (47) |
| Year of Election or Appointment: 2009 Vice President of Equity and High Income Funds. Mr. Hogan also serves as President of FMR's Equity Division (2009-present). Previously, Mr. Hogan served as Senior Vice President, Equity Research of FMR (2006-2009) and as a portfolio manager. |
Christopher S. Bartel (40) |
| Year of Election or Appointment: 2009 Vice President of Fidelity's Sector and Real Estate Equity Funds. Mr. Bartel also serves as a Director, President, and Chief Executive Officer of Fidelity Management & Research (Japan) Inc. (2012-present), a Director of Fidelity Management & Research (Hong Kong) (2012-present), and Senior Vice President of Global Equity Research (2010-present). Previously, Mr. Bartel served as Senior Vice President of Equity Research (2009-2010), Managing Director of Research (2006-2009), and an analyst and portfolio manager (2000-2006). |
Scott C. Goebel (44) |
| Year of Election or Appointment: 2008 Secretary and Chief Legal Officer (CLO) of the Fidelity funds. Mr. Goebel also serves as Secretary of Fidelity Investments Money Management, Inc. (FIMM) (2010-present) and Fidelity Research and Analysis Company (FRAC) (2010-present); Secretary and CLO of The North Carolina Capital Management Trust: Cash and Term Portfolios (2008-present); General Counsel, Secretary, and Senior Vice President of FMR (2008-present) and FMR Co., Inc. (2008-present); employed by FMR LLC or an affiliate (2001-present); Chief Legal Officer of Fidelity Management & Research (Hong Kong) Limited (2008-present) and Assistant Secretary of Fidelity Management & Research (Japan) Inc. (2008-present), and Fidelity Management & Research (U.K.) Inc. (2008-present). Previously, Mr. Goebel served as Assistant Secretary of FIMM (2008-2010), FRAC (2008-2010), and the Funds (2007-2008) and as Vice President and Secretary of Fidelity Distributors Corporation (FDC) (2005-2007). |
William C. Coffey (43) |
| Year of Election or Appointment: 2009 Assistant Secretary of Fidelity's Equity and High Income Funds. Mr. Coffey also serves as Senior Vice President and Deputy General Counsel of FMR LLC (2010-present), and is an employee of Fidelity Investments. Previously, Mr. Coffey served as Vice President and Associate General Counsel of FMR LLC (2005-2009). |
Elizabeth Paige Baumann (44) |
| Year of Election or Appointment: 2012 Anti-Money Laundering (AML) Officer of the Fidelity funds. Ms. Baumann also serves as AML Officer of The North Carolina Capital Management Trust: Cash and Term Portfolios (2012-present), Chief AML Officer of FMR LLC (2012-present), and is an employee of Fidelity Investments. Previously, Ms. Baumann served as Vice President and Deputy Anti-Money Laundering Officer (2007-2012). |
Christine Reynolds (53) |
| Year of Election or Appointment: 2008 Chief Financial Officer of the Fidelity funds. Ms. Reynolds became President of Fidelity Pricing and Cash Management Services (FPCMS) in August 2008. Ms. Reynolds served as Chief Operating Officer of FPCMS (2007-2008). Previously, Ms. Reynolds served as President, Treasurer, and Anti-Money Laundering officer of the Fidelity funds (2004-2007). |
Joseph A. Hanlon (44) |
| Year of Election or Appointment: 2012 Chief Compliance Officer of Fidelity's Equity and High Income Funds. Mr. Hanlon serves as Compliance Officer of FMR, FMR Co., Inc., Fidelity Investments Money Management, Inc. (FIMM), Fidelity Research and Analysis Company (FRAC), Fidelity Management & Research (Japan) Inc., Fidelity Management & Research (U.K.) Inc., Fidelity Management & Research (Hong Kong), and Strategic Advisers, Inc. (2009-present), as Senior Vice President of the Fidelity Asset Management Division (2009-present), and is an employee of Fidelity Investments. |
Joseph F. Zambello (55) |
| Year of Election or Appointment: 2011 Deputy Treasurer of the Fidelity funds. Mr. Zambello is an employee of Fidelity Investments. Previously, Mr. Zambello served as Vice President of FMR's Program Management Group (2009-2011) and Vice President of the Transfer Agent Oversight Group (2005-2009). |
Adrien E. Deberghes (44) |
| Year of Election or Appointment: 2008 Deputy Treasurer of Fidelity's Equity and High Income Funds. Mr. Deberghes also serves as Vice President (2011-present) and Assistant Treasurer (2010-present) of other Fidelity funds, and is an employee of Fidelity Investments (2008-present). Previously, Mr. Deberghes served as Senior Vice President of Mutual Fund Administration at State Street Corporation (2007-2008), Senior Director of Mutual Fund Administration at Investors Bank & Trust (2005-2007), and Director of Finance for Dunkin' Brands (2000-2005). |
Stephanie J. Dorsey (43) |
| Year of Election or Appointment: 2010 Assistant Treasurer of Fidelity's Equity and High Income Funds. Ms. Dorsey also serves as Deputy Treasurer of other Fidelity funds (2008-present) and is an employee of Fidelity Investments (2008-present). Previously, Ms. Dorsey served as Treasurer (2004-2008) of the JPMorgan Mutual Funds and Vice President (2004-2008) of JPMorgan Chase Bank. |
John R. Hebble (54) |
| Year of Election or Appointment: 2009 Assistant Treasurer of Fidelity's Equity and High Income Funds. Mr. Hebble also serves as President (2011-present), Treasurer, and Chief Financial Officer of The North Carolina Capital Management Trust: Cash and Term Portfolios (2008-present), President and Treasurer of other Fidelity funds (2008-present) and is an employee of Fidelity Investments. |
Gary W. Ryan (53) |
| Year of Election or Appointment: 2005 Assistant Treasurer of the Fidelity funds. Mr. Ryan is an employee of Fidelity Investments. Previously, Mr. Ryan served as Vice President of Fund Reporting in Fidelity Pricing and Cash Management Services (FPCMS) (1999-2005). |
Jonathan Davis (44) |
| Year of Election or Appointment: 2010 Assistant Treasurer of the Fidelity funds. Mr. Davis is also Assistant Treasurer of Fidelity Rutland Square Trust II and Fidelity Commonwealth Trust II. Mr. Davis is an employee of Fidelity Investments. Previously, Mr. Davis served as Vice President and Associate General Counsel of FMR LLC (2003-2010). |
Annual Report
The Board of Trustees of each fund voted to pay to shareholders of record at the opening of business on record date the following distributions per share derived from capital gains realized from sales of portfolio securities and dividends derived from net investment income:
| Pay Date | Record Date | Dividends | Capital Gains |
Fidelity Advisor Biotechnology Fund | | | | |
Class A | 09/10/12 | 09/07/12 | $0.000 | $0.685 |
Class T | 09/10/12 | 09/07/12 | $0.000 | $0.685 |
Class B | 09/10/12 | 09/07/12 | $0.000 | $0.685 |
Class C | 09/10/12 | 09/07/12 | $0.000 | $0.685 |
Fidelity Advisor Communications Equipment Fund | | | | |
Class A | 09/10/12 | 09/07/12 | $0.000 | $0.000 |
Class T | 09/10/12 | 09/07/12 | $0.000 | $0.000 |
Class B | 09/10/12 | 09/07/12 | $0.000 | $0.000 |
Class C | 09/10/12 | 09/07/12 | $0.000 | $0.000 |
Fidelity Advisor Consumer Discretionary Fund | | | | |
Class A | 09/10/12 | 09/07/12 | $0.000 | $0.811 |
Class T | 09/10/12 | 09/07/12 | $0.000 | $0.811 |
Class B | 09/10/12 | 09/07/12 | $0.000 | $0.811 |
Class C | 09/10/12 | 09/07/12 | $0.000 | $0.811 |
Fidelity Advisor Electronics Fund | | | | |
Class A | 09/10/12 | 09/07/12 | $0.000 | $0.000 |
Class T | 09/10/12 | 09/07/12 | $0.000 | $0.000 |
Class B | 09/10/12 | 09/07/12 | $0.000 | $0.000 |
Class C | 09/10/12 | 09/07/12 | $0.000 | $0.000 |
Fidelity Advisor Energy Fund | | | | |
Class A | 09/10/12 | 09/07/12 | $0.000 | $0.000 |
Class T | 09/10/12 | 09/07/12 | $0.000 | $0.000 |
Class B | 09/10/12 | 09/07/12 | $0.000 | $0.000 |
Class C | 09/10/12 | 09/07/12 | $0.000 | $0.000 |
Fidelity Advisor Financial Services Fund | | | | |
Class A | 09/10/12 | 09/07/12 | $0.030 | $0.000 |
Class T | 09/10/12 | 09/07/12 | $0.020 | $0.000 |
Class B | 09/10/12 | 09/07/12 | $0.000 | $0.000 |
Class C | 09/10/12 | 09/07/12 | $0.000 | $0.000 |
Fidelity Advisor Health Care Fund | | | | |
Class A | 09/10/12 | 09/07/12 | $0.000 | $1.941 |
Class T | 09/10/12 | 09/07/12 | $0.000 | $1.941 |
Class B | 09/10/12 | 09/07/12 | $0.000 | $1.941 |
Class C | 09/10/12 | 09/07/12 | $0.000 | $1.941 |
Fidelity Advisor Industrials Fund | | | | |
Class A | 09/10/12 | 09/07/12 | $0.100 | $0.000 |
Class T | 09/10/12 | 09/07/12 | $0.064 | $0.000 |
Class B | 09/10/12 | 09/07/12 | $0.000 | $0.000 |
Class C | 09/10/12 | 09/07/12 | $0.000 | $0.000 |
Fidelity Advisor Technology Fund | | | | |
Class A | 09/10/12 | 09/07/12 | $0.000 | $0.000 |
Class T | 09/10/12 | 09/07/12 | $0.000 | $0.000 |
Class B | 09/10/12 | 09/07/12 | $0.000 | $0.000 |
Class C | 09/10/12 | 09/07/12 | $0.000 | $0.000 |
Fidelity Advisor Utilities Fund | | | | |
Class A | 09/10/12 | 09/07/12 | $0.208 | $0.000 |
Class T | 09/10/12 | 09/07/12 | $0.173 | $0.000 |
Class B | 09/10/12 | 09/07/12 | $0.100 | $0.000 |
Class C | 09/10/12 | 09/07/12 | $0.122 | $0.000 |
Annual Report
The funds hereby designate as capital gain dividend the amounts noted below for the taxable year ended July 31, 2012, or, if subsequently determined to be different, the net capital gain of such year.
Fidelity Advisor Biotechnology Fund | $10,507,377 |
Fidelity Advisor Consumer Discretionary Fund | $3,717,975 |
Fidelity Advisor Health Care Fund | $42,500,381 |
A percentage of the dividends distributed during the fiscal year for the following funds qualify for the dividends-received deduction for corporate shareholders:
| September 2011 | December 2011 |
Fidelity Advisor Consumer Discretionary Fund | | |
Class A | 0% | 100% |
Class T | 0% | 100% |
Class B | 0% | 0% |
Class C | 0% | 0% |
Fidelity Advisor Energy Fund | | |
Class A | 0% | 100% |
Class T | 0% | 100% |
Class B | 0% | 100% |
Class C | 0% | 100% |
Fidelity Advisor Financial Services Fund | | |
Class A | 0% | 100% |
Class T | 0% | 100% |
Class B | 0% | 0% |
Class C | 0% | 0% |
Fidelity Advisor Industrials Fund | | |
Class A | 100% | 100% |
Class T | 0% | 100% |
Class B | 0% | 100% |
Class C | 0% | 100% |
Fidelity Advisor Utilities Fund | | |
Class A | 100% | 100% |
Class T | 100% | 100% |
Class B | 100% | 100% |
Class C | 100% | 100% |
A percentage of the dividends distributed during the fiscal year for the following funds may be taken into account as a dividend for purposes of the maximum rate under section 1(h)(11) of the Internal Revenue Code.
| September 2011 | December 2011 |
Fidelity Advisor Consumer Discretionary Fund | | |
Class A | 0% | 100% |
Class T | 0% | 100% |
Class B | 0% | 0% |
Class C | 0% | 0% |
Fidelity Advisor Energy Fund | | |
Class A | 0% | 100% |
Class T | 0% | 100% |
Class B | 0% | 100% |
Class C | 0% | 100% |
| September 2011 | December 2011 |
Fidelity Advisor Financial Services Fund | | |
Class A | 0% | 100% |
Class T | 0% | 100% |
Class B | 0% | 0% |
Class C | 0% | 0% |
Fidelity Advisor Industrials Fund | | |
Class A | 100% | 100% |
Class T | 0% | 100% |
Class B | 0% | 100% |
Class C | 0% | 100% |
Fidelity Advisor Utilities Fund | | |
Class A | 100% | 100% |
Class T | 100% | 100% |
Class B | 100% | 100% |
Class C | 100% | 100% |
The funds will notify shareholders in January 2013 of amounts for use in preparing 2012 income tax returns.
Annual Report
Board Approval of Investment Advisory Contracts and Management Fees
Fidelity Advisor Focus Funds
Each year, the Board of Trustees, including the Independent Trustees (together, the Board), votes on the renewal of the management contract and sub-advisory agreements (together, the Advisory Contracts) for each fund. The Board, assisted by the advice of fund counsel and Independent Trustees' counsel, requests and considers a broad range of information relevant to the renewal of the Advisory Contracts throughout the year.
The Board meets regularly and, at each of its meetings, considers factors that are relevant to its annual consideration of the renewal of each fund's Advisory Contracts, including the services and support provided to each fund and its shareholders. The Board has established various standing committees, each composed of and chaired by Independent Trustees with varying backgrounds, to which the Board has assigned specific subject matter responsibilities in order to enhance effective decision-making by the Board. The Board, acting directly and through its Committees, requests and receives information concerning the annual consideration of the renewal of each fund's Advisory Contracts. The Board also meets as needed to consider matters specifically related to the Board's annual consideration of the renewal of Advisory Contracts. Members of the Board may also meet with trustees of other Fidelity funds through ad hoc joint committees to discuss certain matters relevant to the Fidelity funds.
At its July 2012 meeting, the Board of Trustees, including the Independent Trustees, unanimously determined to renew each fund's Advisory Contracts. In reaching its determination, the Board considered all factors it believed relevant, including (i) the nature, extent, and quality of the services to be provided to each fund and its shareholders (including the investment performance of each fund); (ii) the competitiveness of each fund's management fee and total expense ratio relative to peer funds; (iii) the total costs of the services to be provided by and the profits to be realized by Fidelity from its relationship with each fund; (iv) the extent to which economies of scale exist and would be realized as each fund grows; and (v) whether fee levels reflect these economies of scale, if any, for the benefit of fund shareholders.
In considering whether to renew the Advisory Contracts for each fund, the Board reached a determination, with the assistance of fund counsel and Independent Trustees' counsel and through the exercise of its business judgment, that the renewal of the Advisory Contracts is in the best interests of each fund and its shareholders and that the compensation payable under the Advisory Contracts is fair and reasonable. The Board's decision to renew the Advisory Contracts was not based on any single factor, but rather was based on a comprehensive consideration of all the information provided to the Board at its meetings throughout the year. The Board, in reaching its determination to renew the Advisory Contracts, is aware that shareholders in each fund have a broad range of investment choices available to them, including a wide choice among mutual funds offered by Fidelity's competitors, and that each fund's shareholders, who have the opportunity to review and weigh the disclosure provided by the fund in its prospectus and other public disclosures, have chosen to invest in that fund, managed by Fidelity.
Nature, Extent, and Quality of Services Provided. The Board considered the staffing within the investment adviser, FMR, and the sub-advisers (together, the Investment Advisers), including the backgrounds of the funds' investment personnel, and also considered the funds' investment objectives, strategies, and related investment philosophies. The Independent Trustees also had discussions with senior management of Fidelity's investment operations and investment groups. The Board considered the structure of the portfolio manager compensation program and whether this structure provides appropriate incentives to act in the best interests of each fund.
Resources Dedicated to Investment Management and Support Services. The Board and the Fund Oversight and Research Committees reviewed the general qualifications and capabilities of the Investment Advisers' investment staff, including its size, education, experience, and resources, as well as the Investment Advisers' approach to recruiting, training, managing, and compensating investment personnel. The Board also noted that FMR has continued to increase the resources devoted to non-U.S. offices, including expansion of Fidelity's global investment organization. The Board noted that Fidelity's analysts have extensive resources, tools and capabilities that allow them to conduct sophisticated quantitative and fundamental analysis, as well as credit analysis of issuers, counterparties and guarantors. The Board also believes that Fidelity's investment professionals have sufficient access to global information and data so as to provide competitive investment results over time, and that those professionals also have access to sophisticated tools that permit them to assess portfolio construction and risk and performance attribution characteristics continuously, as well as to transmit new information and research conclusions rapidly around the world. Additionally, in its deliberations, the Board considered the Investment Advisers' trading and risk management capabilities and resources, which are an integral part of the investment management process.
Shareholder and Administrative Services. The Board considered (i) the nature, extent, quality, and cost of advisory, administrative, and shareholder services performed by the Investment Advisers and their affiliates under the Advisory Contracts and under separate agreements covering transfer agency, pricing and bookkeeping, and securities lending services for each fund; (ii) the nature and extent of the supervision of third party service providers, principally custodians and subcustodians; and (iii) the resources devoted to, and the record of compliance with, each fund's compliance policies and procedures. The Board also reviewed the allocation of fund brokerage, including allocations to brokers affiliated with the Investment Advisers, the use of brokerage commissions to pay fund expenses, and the use of "soft" commission dollars to pay for research services.
The Board noted that the growth of fund assets over time across the complex allows Fidelity to reinvest in the development of services designed to enhance the value or convenience of the Fidelity funds as investment vehicles. These services include 24-hour access to account information and market information through telephone representatives and over the Internet, investor education materials and asset allocation tools, and the expanded availability of Fidelity Investor Centers.
Annual Report
Board Approval of Investment Advisory Contracts and Management Fees - continued
Investment in a Large Fund Family. The Board considered the benefits to shareholders of investing in a Fidelity fund, including the benefits of investing in a fund that is part of a large family of funds offering a variety of investment disciplines and providing a large variety of mutual fund investor services. The Board noted that Fidelity had taken, or had made recommendations that resulted in the Fidelity funds taking, a number of actions over the previous year that benefited particular funds, including (i) continuing to dedicate additional resources to investment research and support of the senior management team that oversees asset management; (ii) persisting in efforts to enhance Fidelity's research capabilities, in particular, international research; (iii) launching new funds and making other enhancements to meet client needs for global and income-oriented solutions; (iv) continuing to launch dedicated lower cost underlying funds to meet investment management's portfolio construction needs related to expanding underlying fund options, specifically for the Freedom Fund product lines; (v) adopting a "Stock Selector" sector neutral investment approach and employing a team of portfolio managers who are sector specialists to manage certain funds; (vi) rationalizing product lines and gaining increased efficiencies through the mergers of several funds into other funds; (vii) strengthening the Spartan Index Fund product line by adding new funds and/or new low-cost institutional share classes, restructuring fund expenses to accommodate new classes, and reducing investment minimums for certain classes of shares; (viii) modifying the eligibility criteria for Institutional Class shares to increase their appeal to government entities and charitable investors; and (ix) reducing certain transfer agent fee rates.
Investment Performance. The Board considered whether each fund has operated in accordance with its investment objective, as well as its record of compliance with its investment restrictions. It also reviewed each fund's absolute investment performance for each class, as well as each fund's relative investment performance for each class measured over multiple periods against a third-party-sponsored index that reflects the market sector in which the fund invests. The Board noted that FMR believes that no meaningful peer group exists for the funds principally because most other funds in each fund's third-party peer group focus on different industries or sectors than the fund.
For each fund (except Advisor Electronics), the following charts considered by the Board show, over the one-, three-, and five-year periods ended December 31, 2011, the cumulative total returns of Institutional Class (Class I) and Class B of the fund and the cumulative total returns of a third-party-sponsored index ("benchmark"). The returns of Institutional Class (Class I) and Class B show the performance of the highest and lowest performing classes, respectively (based on five-year performance).
For Advisor Electronics, the following charts considered by the Board show, over the one-, three-, and five-year periods ended December 31, 2011, the cumulative total returns of Institutional Class (Class I) and Class C of the fund and the cumulative total returns of a third-party-sponsored index ("benchmark"). The returns of Institutional Class (Class I) and Class C show the performance of the highest and lowest performing classes, respectively (based on five-year performance).
Fidelity Advisor Biotechnology Fund

The Board noted that the investment performance of Institutional Class (Class I) of the fund compared favorably to its benchmark for the one- and three-year periods, although the fund's five-year cumulative total return was lower than its benchmark. The Board considered that the variations in performance among the fund's classes reflect the variations in class expenses, which result in lower performance for higher expense classes. The Board also reviewed the fund's performance since inception as well as performance in the current year.
Annual Report
Fidelity Advisor Communications Equipment Fund

The Board noted that the investment performance of Institutional Class (Class I) of the fund compared favorably to its benchmark for the three- and five-year periods, although the fund's one-year total return was lower than its benchmark. The Board considered that the variations in performance among the fund's classes reflect the variations in class expenses, which result in lower performance for higher expense classes. The Board noted that there was a portfolio management change for the fund in January 2012. The Board also reviewed the fund's performance since inception as well as performance in the current year.
Fidelity Advisor Consumer Discretionary Fund
The Board noted that the investment performance of the fund was lower than its benchmark for all the periods shown. The Board considered that the variations in performance among the fund's classes reflect the variations in class expenses, which result in lower performance for higher expense classes. The Board discussed with FMR actions to improve the fund's below-benchmark performance. The Board noted that there was a portfolio management change for the fund in April 2012. The Board also reviewed the fund's performance since inception as well as performance in the current year. The Board will continue to closely monitor the performance of the fund in the coming year and discuss with FMR other appropriate actions to address the performance of the fund.
Annual Report
Board Approval of Investment Advisory Contracts and Management Fees - continued
Fidelity Advisor Electronics Fund
The Board noted that the investment performance of Institutional Class (Class I) of the fund compared favorably to its benchmark for the three- and five-year periods, although the fund's one-year total return was lower than its benchmark. The Board considered that the variations in performance among the fund's classes reflect the variations in class expenses, which result in lower performance for higher expense classes. The Board also reviewed the fund's performance since inception as well as performance in the current year.
Fidelity Advisor Energy Fund

The Board noted that the investment performance of the fund was lower than its benchmark for the one- and five-year periods, although the three-year cumulative total return of Institutional Class (Class I) compared favorably to its benchmark. The Board considered that the variations in performance among the fund's classes reflect the variations in class expenses, which result in lower performance for higher expense classes. The Board also reviewed the fund's performance since inception as well as performance in the current year. The Board will closely monitor the performance of the fund in the coming year.
Annual Report
Fidelity Advisor Financial Services Fund

The Board noted that the investment performance of the fund was lower than its benchmark for all the periods shown. The Board considered that the variations in performance among the fund's classes reflect the variations in class expenses, which result in lower performance for higher expense classes. The Board discussed with FMR actions to improve the fund's below-benchmark performance. The Board noted that this fund had underperformed in the past and discussed with FMR its disappointment with the continued underperformance of the fund. The Board also reviewed the fund's performance since inception as well as performance in the current year. The Board will continue to closely monitor the performance of the fund in the coming year and discuss with FMR other appropriate actions to address the performance of the fund.
Fidelity Advisor Health Care Fund

The Board noted that the investment performance of Institutional Class (Class I) of the fund compared favorably to its benchmark for the three- and five-year periods, although the fund's one-year total return was lower than its benchmark. The Board considered that the variations in performance among the fund's classes reflect the variations in class expenses, which result in lower performance for higher expense classes. The Board also reviewed the fund's performance since inception as well as performance in the current year.
Annual Report
Board Approval of Investment Advisory Contracts and Management Fees - continued
Fidelity Advisor Industrials Fund
The Board noted that the investment performance of Institutional Class (Class I) of the fund compared favorably to its benchmark for the three- and five-year periods, although the fund's one-year total return was lower than its benchmark. The Board considered that the variations in performance among the fund's classes reflect the variations in class expenses, which result in lower performance for higher expense classes. The Board also reviewed the fund's performance since inception as well as performance in the current year.
Fidelity Advisor Technology Fund

The Board noted that the investment performance of Institutional Class (Class I) of the fund compared favorably to its benchmark for the three- and five-year periods, although the fund's one-year total return was lower than its benchmark. The Board considered that the variations in performance among the fund's classes reflect the variations in class expenses, which result in lower performance for higher expense classes. The Board also reviewed the fund's performance since inception as well as performance in the current year.
Annual Report
Fidelity Advisor Utilities Fund

The Board noted that the investment performance of the fund was lower than its benchmark for the one- and five-year periods, although the three-year cumulative total return of Institutional Class (Class I) compared favorably to its benchmark. The Board considered that the variations in performance among the fund's classes reflect the variations in class expenses, which result in lower performance for higher expense classes. The Board also reviewed the fund's performance since inception as well as performance in the current year. The Board will closely monitor the performance of the fund in the coming year.
Based on its review, the Board concluded that the nature, extent, and quality of services provided to each fund under the Advisory Contracts should benefit each fund's shareholders.
Competitiveness of Management Fee and Total Expense Ratio. The Board considered each fund's management fee and total expense ratio compared to "mapped groups" of competitive funds and classes. Fidelity creates "mapped groups" by combining similar Lipper investment objective categories that have comparable management fee characteristics. Combining Lipper investment objective categories aids the Board's management fee and total expense ratio comparisons by broadening the competitive group used for comparison and by reducing the number of universes to which various Fidelity funds are compared.
Management Fee. The Board considered two proprietary management fee comparisons for the 12-month periods shown in the charts below. The group of Lipper funds used by the Board for management fee comparisons is referred to below as the "Total Mapped Group." The Total Mapped Group comparison focuses on a fund's standing relative to the total universe of comparable funds available to investors in terms of gross management fees before expense reimbursements or caps. "TMG %" represents the percentage of funds in the Total Mapped Group that had management fees that were lower than a fund's. For example, a TMG % of 6% means that 94% of the funds in the Total Mapped Group had higher management fees than a fund. The "Asset-Size Peer Group" (ASPG) comparison focuses on a fund's standing relative to non-Fidelity funds similar in size to the fund within the Total Mapped Group. The ASPG represents at least 15% of the funds in the Total Mapped Group with comparable asset size and management fee characteristics, subject to a minimum of 50 funds (or all funds in the Total Mapped Group if fewer than 50). Additional information, such as the ASPG quartile in which a fund's management fee ranked, is also included in the charts and considered by the Board.
Annual Report
Board Approval of Investment Advisory Contracts and Management Fees - continued
Fidelity Advisor Biotechnology Fund
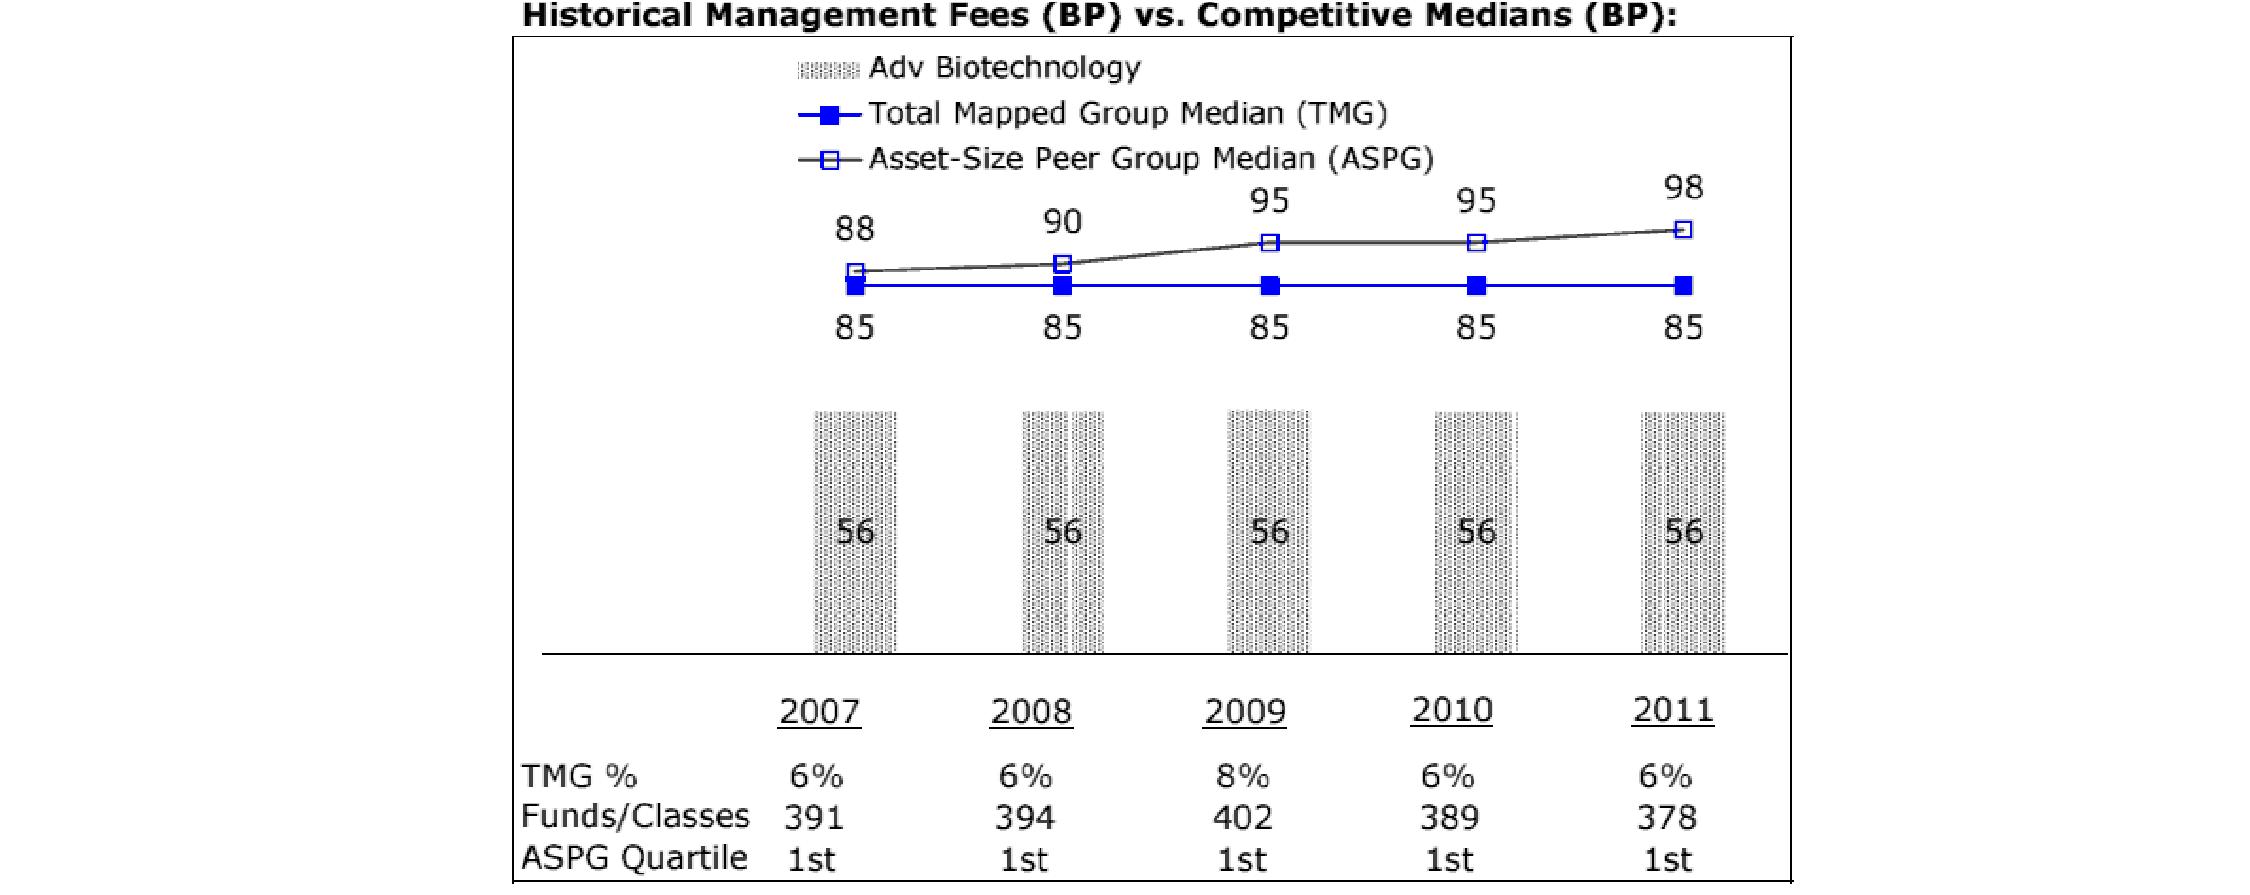
Fidelity Advisor Communications Equipment Fund

Annual Report
Fidelity Advisor Consumer Discretionary Fund
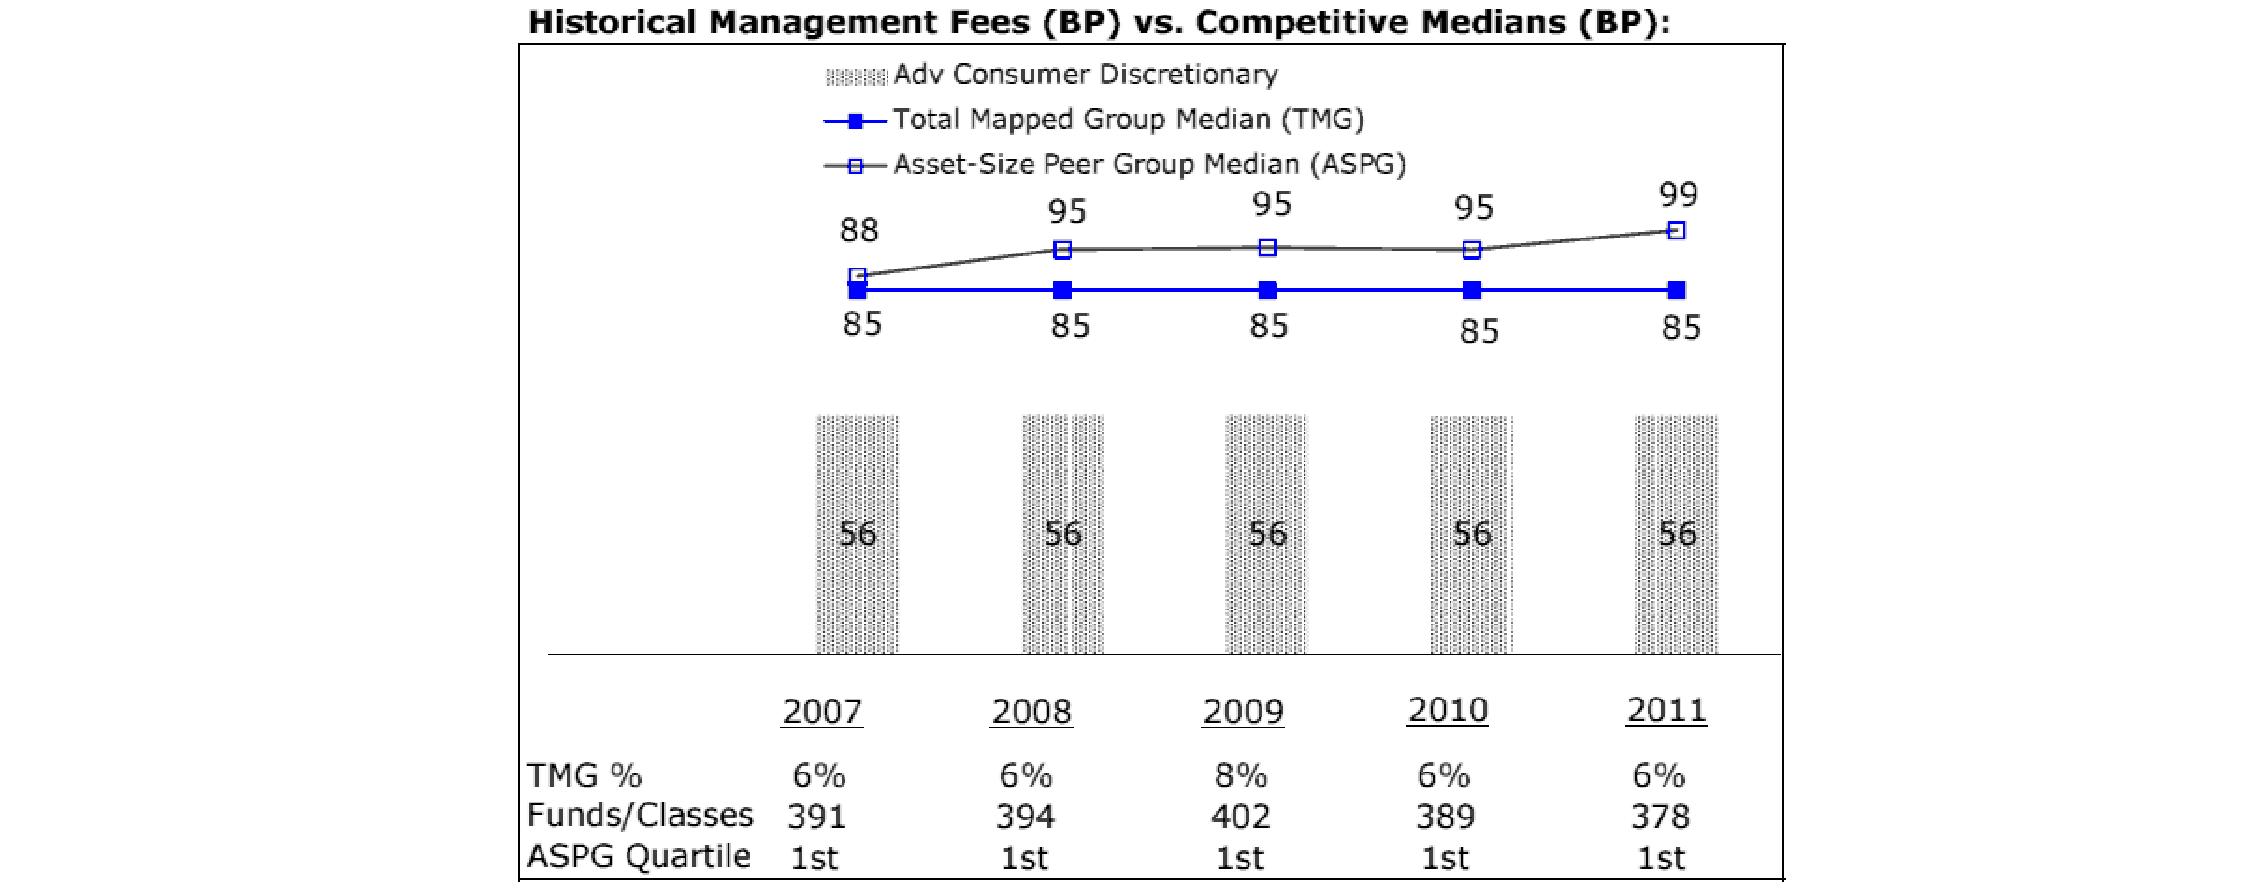
Fidelity Advisor Electronics Fund

Annual Report
Board Approval of Investment Advisory Contracts and Management Fees - continued
Fidelity Advisor Energy Fund
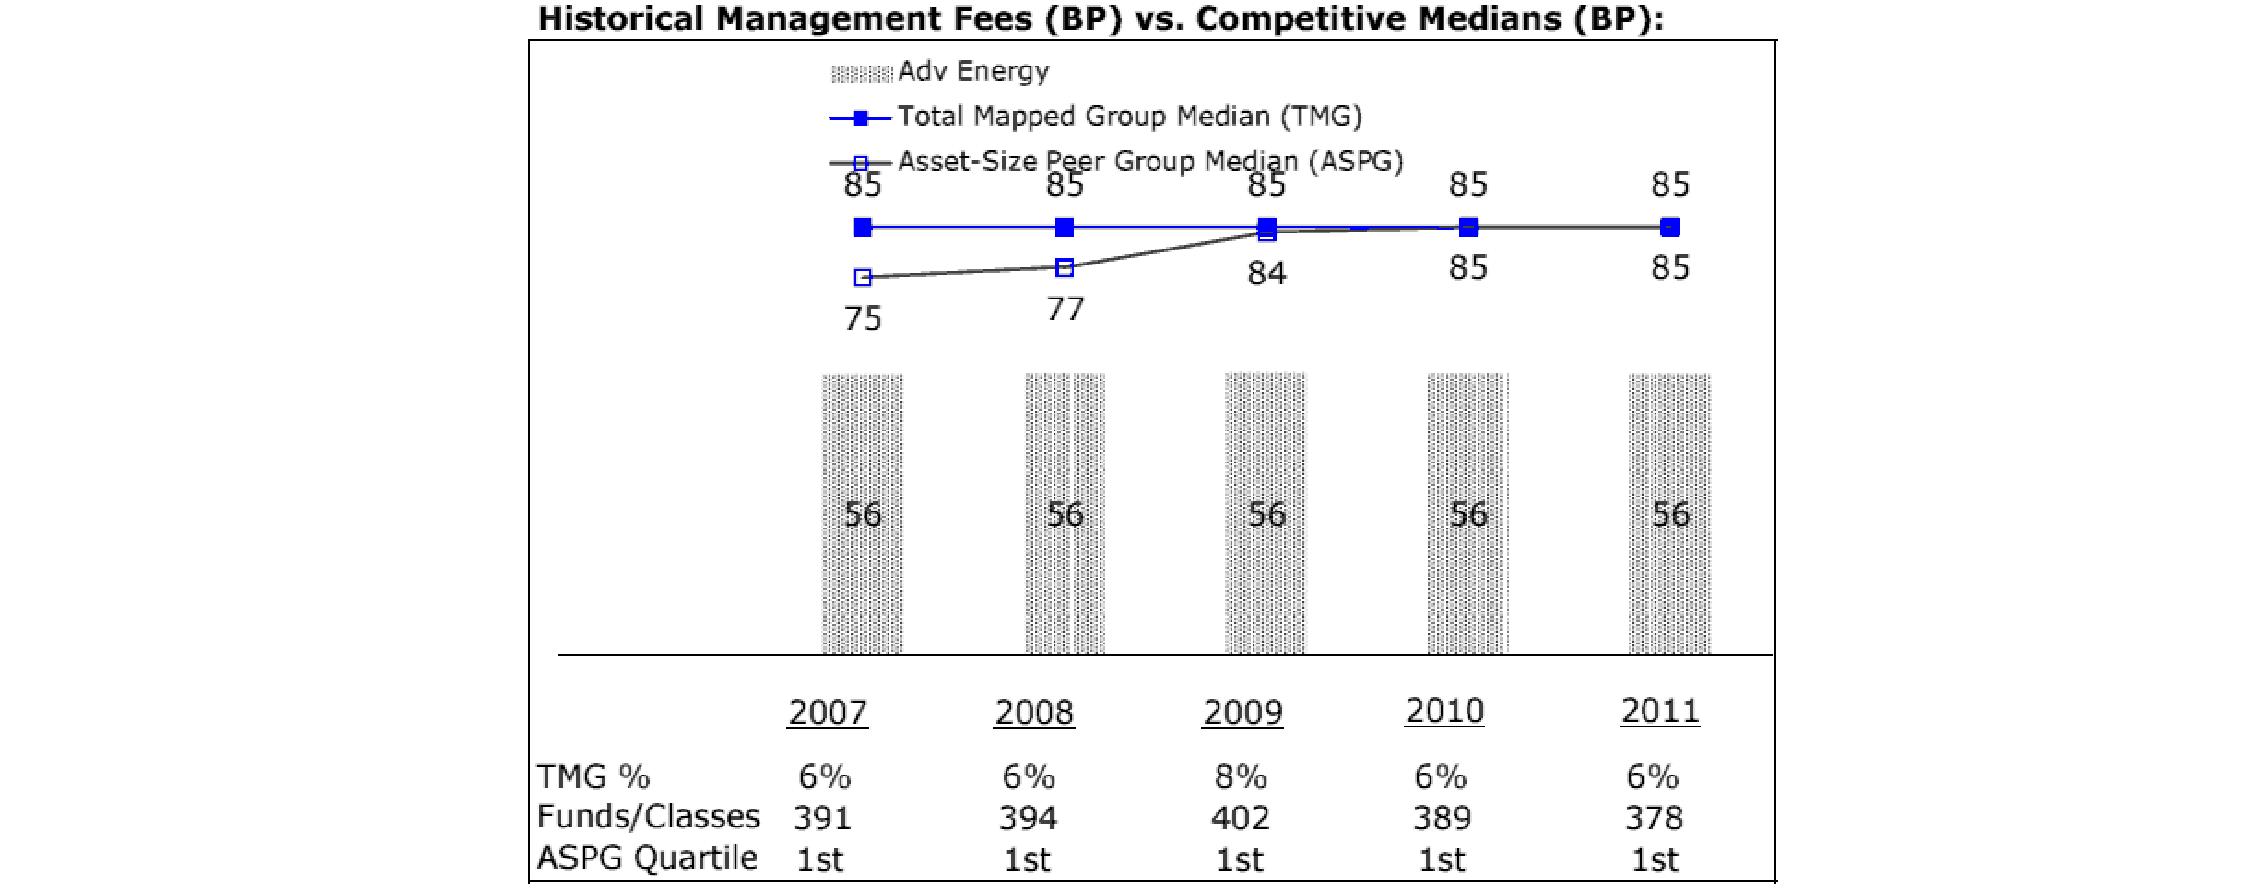
Fidelity Advisor Financial Services Fund
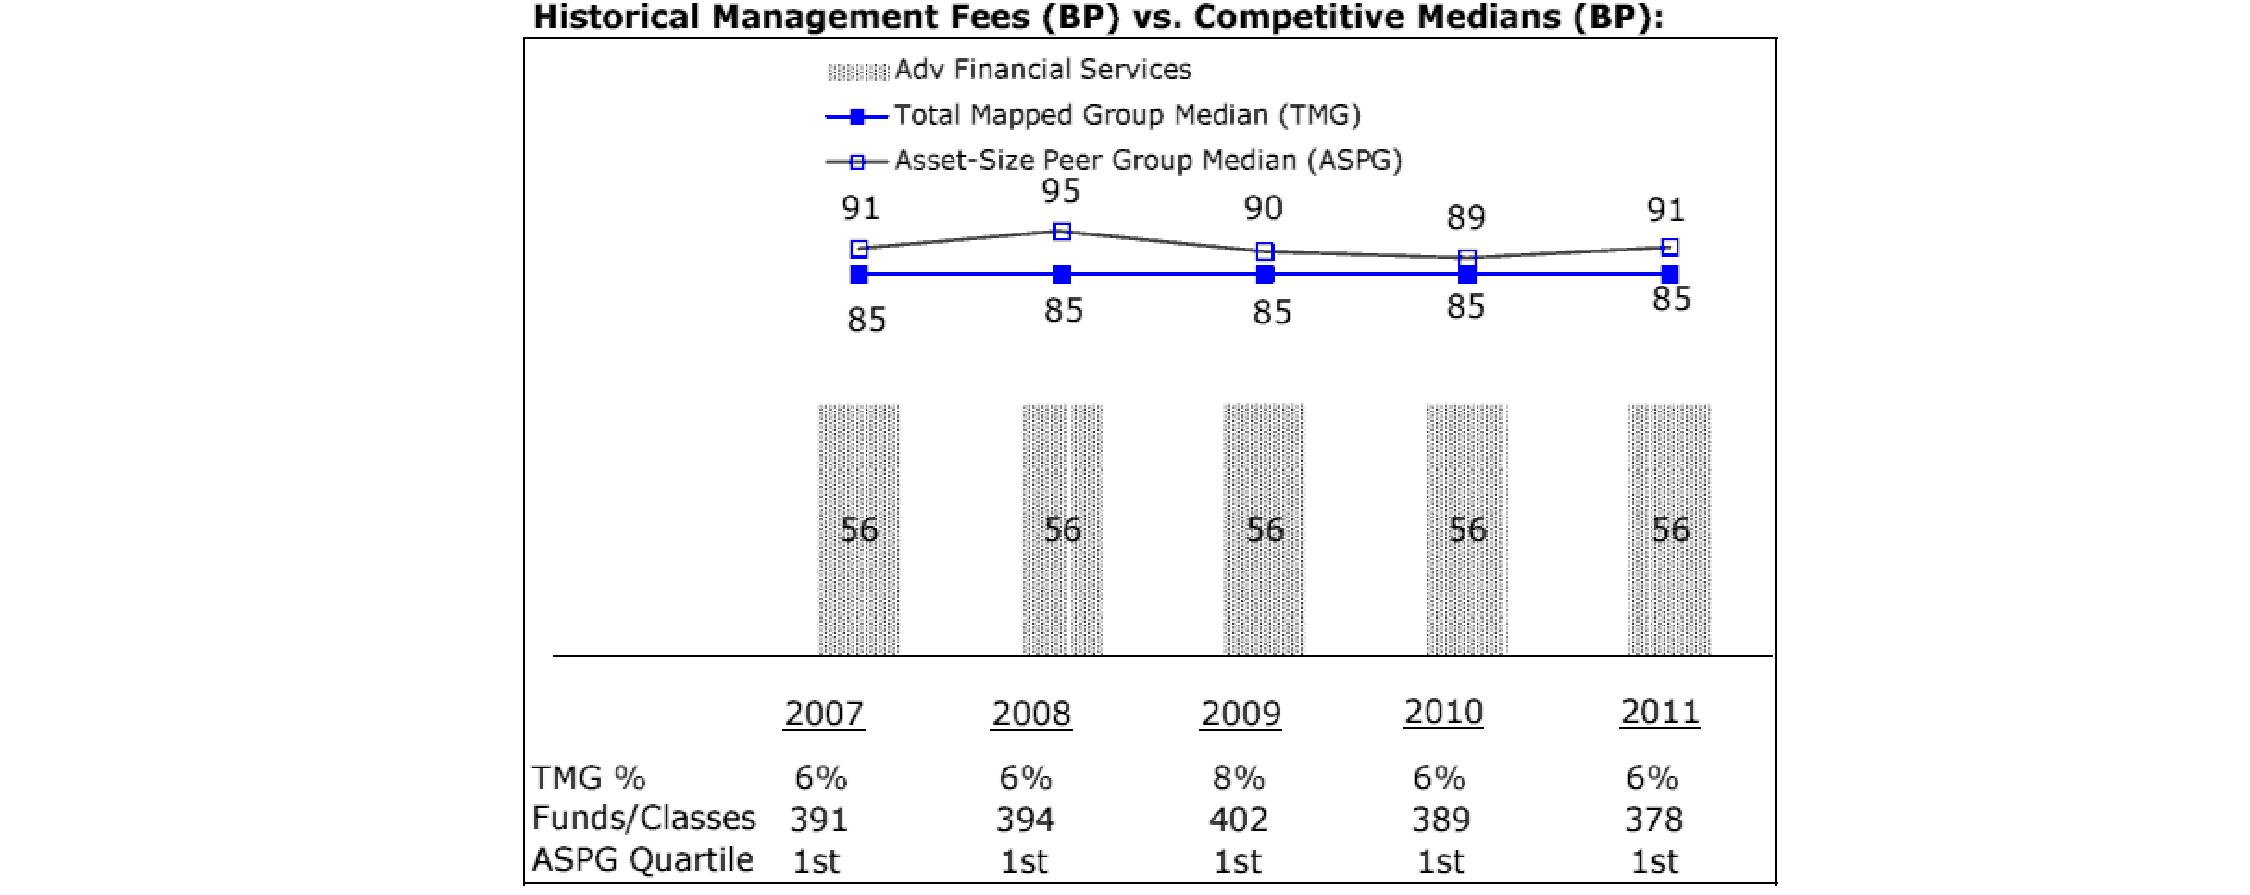
Annual Report
Fidelity Advisor Health Care Fund
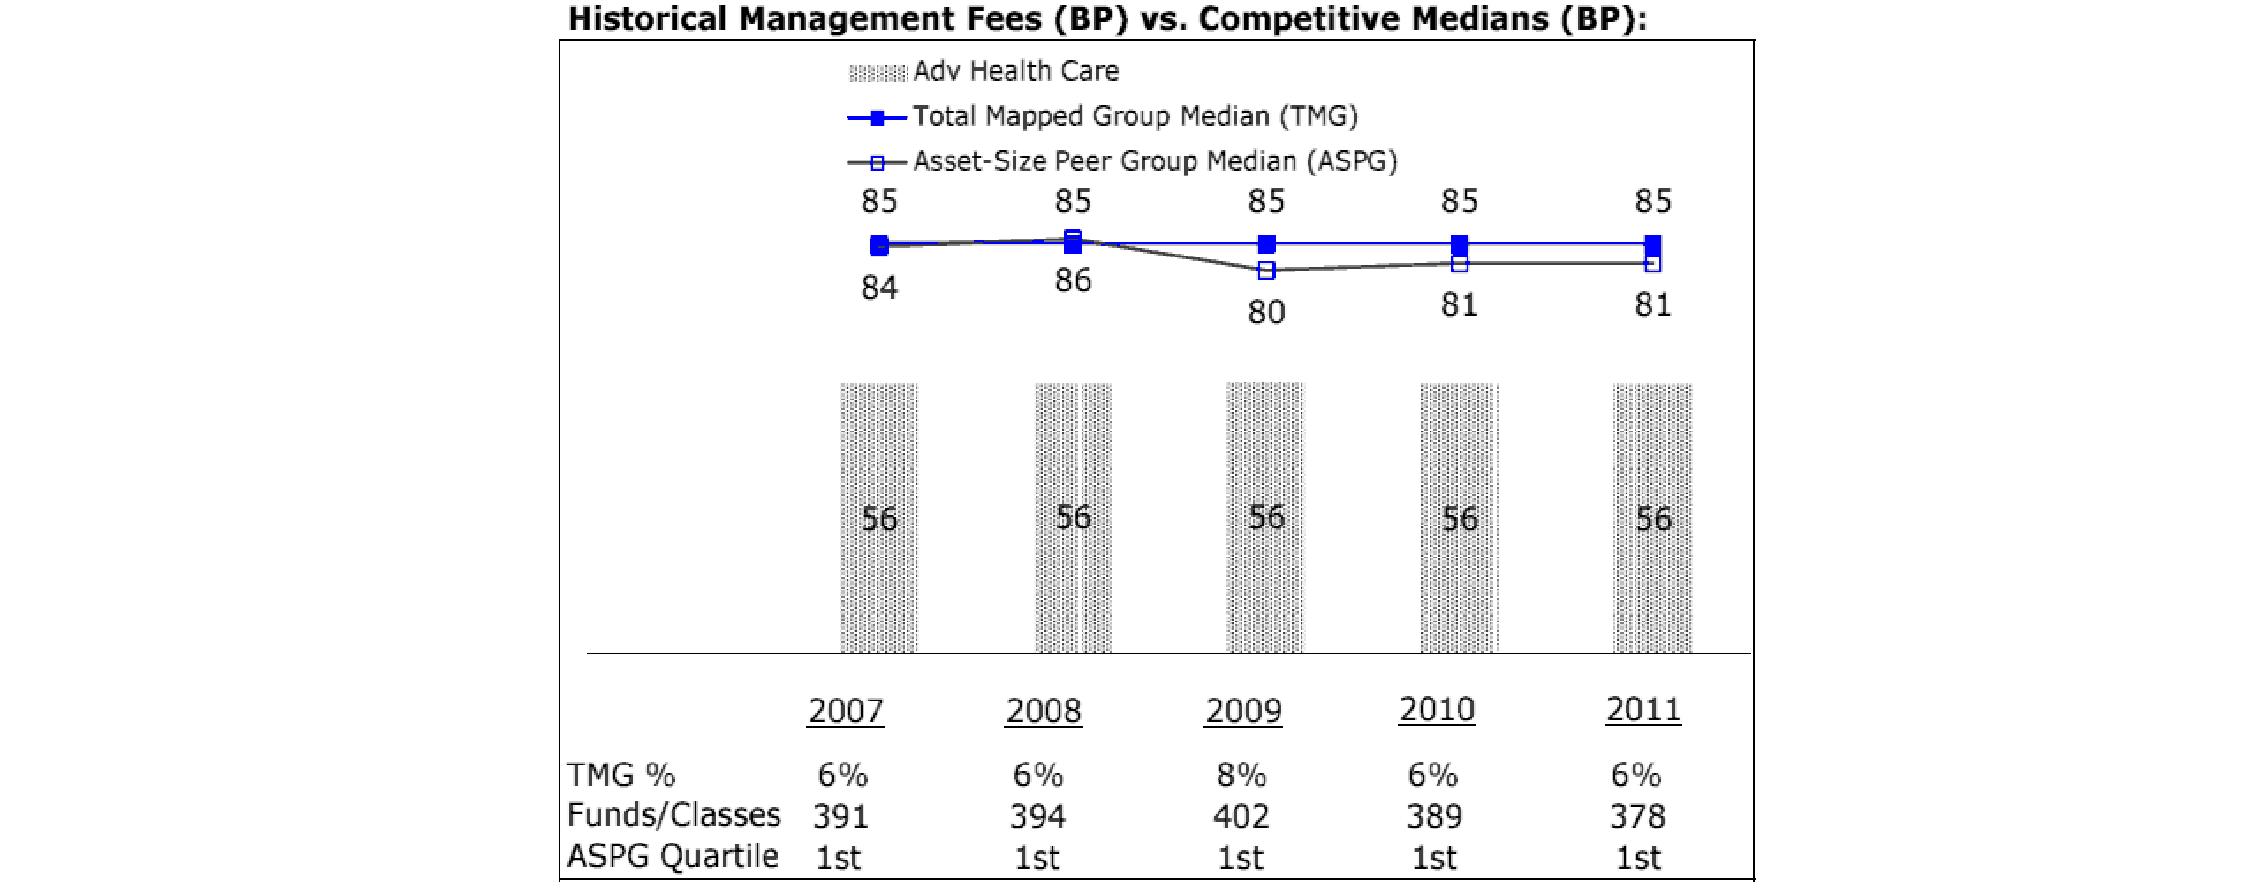
Fidelity Advisor Industrials Fund

Annual Report
Board Approval of Investment Advisory Contracts and Management Fees - continued
Fidelity Advisor Technology Fund

Fidelity Advisor Utilities Fund
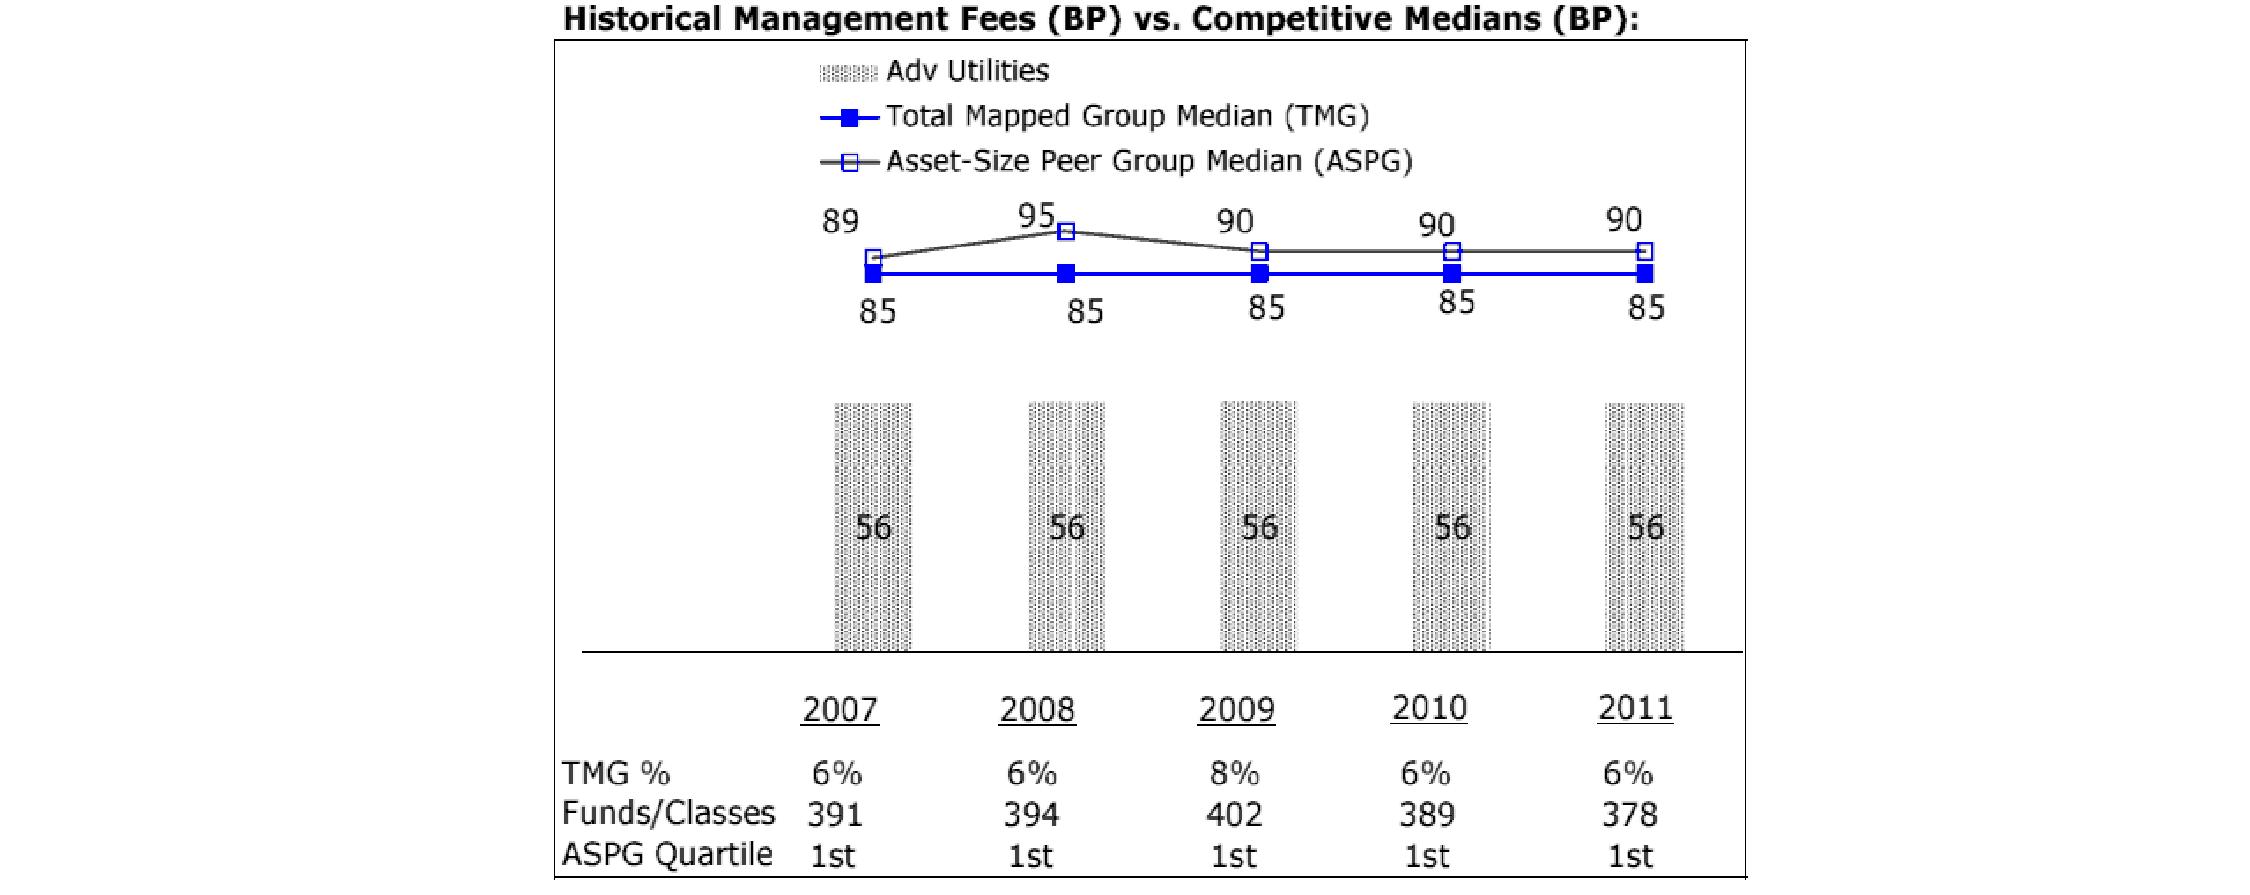
The Board noted that each fund's management fee ranked below the median of its Total Mapped Group and below the median of its ASPG for 2011.
Based on its review, the Board concluded that each fund's management fee is fair and reasonable in light of the services that the fund receives and the other factors considered.
Total Expense Ratio. In its review of the total expense ratio of each class of each fund, the Board considered the fund's management fee as well as other fund or class expenses, as applicable, such as transfer agent fees, pricing and bookkeeping fees, fund-paid 12b-1 fees, and custodial, legal, and audit fees. The Board also noted the effects of any waivers and reimbursements on fees and expenses. As part of its review, the Board also considered the current and historical total expense ratios of each class of each fund compared to competitive fund median expenses. Each class of each fund is compared to those funds and classes in the Total Mapped Group (used by the Board for management fee comparisons) that have a similar sales load structure.
The Board noted that each fund offers multiple classes, each of which has a different sales load and 12b-1 fee structure, and that the multiple structures are intended to offer a range of pricing options for the intermediary market. The Board also noted that the total expense ratios of the classes of each fund vary primarily by the level of their 12b-1 fees, although differences in transfer agent fees may also cause expenses to vary from class to class.
Annual Report
For Advisor Biotechnology, Advisor Financial Services, and Advisor Utilities, the Board noted that the total expense ratio of each of Class A, Class B, Class C, and Institutional Class ranked below its competitive median for 2011 and the total expense ratio of Class T ranked above its competitive median for 2011. The Board considered that various factors, including 12b-1 fees, positive or negative performance adjustments, and relatively higher other expenses in the case of small fund size, can affect total expense ratios. The Board noted that the total expense ratio of Class T was above the competitive median primarily because of higher 12b-1 fees on Class T. Class T has a higher 12b-1 fee, but a lower front-end sales charge, than traditionally priced front-end sales charge classes. The Board considered that Class T is primarily sold load-waived in the retirement plan market where its 0.50% 12b-1 fee is comparable to competing no-load, higher 12b-1 fee classes designed specifically for retirement plans.
For Advisor Communications Equipment and Advisor Electronics, the Board noted that the total expense ratio of Class A ranked below its competitive median for 2011 and the total expense ratio of each of Class T, Class B, Class C, and Institutional Class ranked above its competitive median for 2011. The Board considered that various factors, including 12b-1 fees, positive or negative performance adjustments, and relatively higher other expenses in the case of small fund size, can affect total expense ratios. The Board noted that the total expense ratio of Class T was above the competitive median primarily because of higher 12b-1 fees on Class T. Class T has a higher 12b-1 fee, but a lower front-end sales charge, than traditionally priced front-end sales charge classes. The Board considered that Class T is primarily sold load-waived in the retirement plan market where its 0.50% 12b-1 fee is comparable to competing no-load, higher 12b-1 fee classes designed specifically for retirement plans.
For Advisor Consumer Discretionary, the Board noted that the total expense ratio of each of Class A, Class C, and Institutional Class ranked below its competitive median for 2011 and the total expense ratio of each of Class T and Class B ranked above its competitive median for 2011. The Board considered that various factors, including 12b-1 fees, positive or negative performance adjustments, and relatively higher other expenses in the case of small fund size, can affect total expense ratios. The Board noted that the total expense ratio of Class T was above the competitive median primarily because of higher 12b-1 fees on Class T. Class T has a higher 12b-1 fee, but a lower front-end sales charge, than traditionally priced front-end sales charge classes. The Board considered that Class T is primarily sold load-waived in the retirement plan market where its 0.50% 12b-1 fee is comparable to competing no-load, higher 12b-1 fee classes designed specifically for retirement plans.
For Advisor Energy, Advisor Health Care, Advisor Industrials, and Advisor Technology, the Board noted that the total expense ratio of each class ranked below its competitive median for 2011.
Fees Charged to Other Fidelity Clients. The Board also considered Fidelity fee structures and other information with respect to clients of FMR and its affiliates, such as other mutual funds advised or subadvised by FMR or its affiliates, pension plan clients, and other institutional clients. The Board noted the findings of the 2010 ad hoc joint committee (created with the board of other Fidelity funds), which reviewed and compared Fidelity's institutional investment advisory business with its business of providing services to the Fidelity funds, including the differences in services provided, fees charged, and costs incurred, as well as competition in their respective marketplaces.
Based on its review of total expense ratios and fees charged to other Fidelity clients, the Board concluded that the total expense ratio of each class of each fund was reasonable, although in some cases above the median of the universe presented for comparison, in light of the services that the fund and its shareholders receive and the other factors considered.
Costs of the Services and Profitability. The Board considered the revenues earned and the expenses incurred by Fidelity in conducting the business of developing, marketing, distributing, managing, administering and servicing each fund and its shareholders. The Board also considered the level of Fidelity's profits in respect of all the Fidelity funds.
On an annual basis, FMR presents to the Board Fidelity's profitability for each fund. Fidelity calculates the profitability for each fund, as well as aggregate profitability for groups of Fidelity funds and all Fidelity funds, using a series of detailed revenue and cost allocation methodologies which originate with the books and records of Fidelity on which Fidelity's audited financial statements are based. The Audit Committee of the Board reviews any significant changes from the prior year's methodologies.
PricewaterhouseCoopers LLP (PwC), independent registered public accounting firm and auditor to Fidelity and certain Fidelity funds, has been engaged annually by the Board as part of the Board's assessment of Fidelity's profitability analysis. PwC's engagement includes the review and assessment of Fidelity's methodologies used in determining the revenues and expenses attributable to Fidelity's mutual fund business, and completion of agreed-upon procedures surrounding the mathematical accuracy of fund profitability and its conformity to allocation methodologies. After considering PwC's reports issued under the engagement and information provided by Fidelity, the Board concluded that while other allocation methods may also be reasonable, Fidelity's profitability methodologies are reasonable in all material respects.
The Board also reviewed Fidelity's non-fund businesses and fall-out benefits related to the mutual fund business as well as cases where Fidelity's affiliates may benefit from or be related to the funds' business.
The Board considered the costs of the services provided by and the profits realized by Fidelity in connection with the operation of each fund and was satisfied that the profitability was not excessive in the circumstances.
Annual Report
Board Approval of Investment Advisory Contracts and Management Fees - continued
Economies of Scale. The Board considered whether there have been economies of scale in respect of the management of the Fidelity funds, whether the Fidelity funds (including each fund) have appropriately benefited from any such economies of scale, and whether there is potential for realization of any further economies of scale. The Board considered the extent to which each fund will benefit from economies of scale through increased services to the fund, through waivers or reimbursements, or through fee or expense reductions. The Board also noted that in 2009, it and the board of other Fidelity funds created an ad hoc committee (the Economies of Scale Committee) to analyze whether FMR attains economies of scale in respect of the management and servicing of the Fidelity funds, whether the Fidelity funds have appropriately benefited from such economies of scale, and whether there is potential for realization of any further economies of scale.
The Board recognized that each fund's management contract incorporates a "group fee" structure, which provides for lower group fee rates as total fund assets under FMR's management increase, and for higher group fee rates as total fund assets under FMR's management decrease. FMR calculates the group fee rates based on a tiered asset "breakpoint" schedule that varies based on asset class. The Board considered that the group fee is designed to deliver the benefits of economies of scale to fund shareholders when total Fidelity fund assets increase, even if assets of any particular fund are unchanged or have declined, because some portion of Fidelity's costs are attributable to services provided to all Fidelity funds, and all funds benefit if those costs can be allocated among more assets. The Board concluded that, given the group fee structure, fund shareholders will benefit from lower management fees as assets under FMR's management increase at the fund complex level, regardless of whether Fidelity achieves any such economies of scale.
The Board concluded, taking into account the analysis of the Economies of Scale Committee, that economies of scale, if any, are being appropriately shared between fund shareholders and Fidelity.
Additional Information Requested by the Board. In order to develop fully the factual basis for consideration of the Fidelity funds' Advisory Contracts, the Board requested and received additional information on certain topics, including (i) fund performance trends, actions to be taken by FMR to improve certain funds' overall performance, and Fidelity's long-term strategies for certain funds; (ii) the potential to further rationalize the Fidelity fund lineup with the possibility of achieving savings for the funds and Fidelity; (iii) Fidelity's compensation structure for portfolio managers and other key investment personnel; (iv) the amount of the investment that each portfolio manager has made in the Fidelity fund(s) that he or she manages; (v) the realization of fall-out benefits in certain Fidelity business units; (vi) Fidelity's group fee structures, the potential impact of regulatory changes on such structures, and the rationale for the individual fee rates of certain funds; (vii) fund profitability methodology, including Fidelity's cost allocation methodology, and the impact of certain factors on fund profitability results; (viii) trends regarding industry use of performance fee structures and the possibility of implementing performance fee structures for additional funds; and (ix) the impact of net redemptions from the Fidelity funds.
Based on its evaluation of all of the conclusions noted above, and after considering all factors it believed relevant, the Board ultimately concluded that the advisory fee structures are fair and reasonable, and that each fund's Advisory Contracts should be renewed.
Annual Report
Investment Adviser
Fidelity Management & Research Company
Boston, MA
Investment Sub-Advisers
FMR Co., Inc.
Fidelity Management & Research (U.K.) Inc.
Fidelity Management & Research
(Hong Kong) Limited
Fidelity Management & Research
(Japan) Inc.
General Distributor
Fidelity Distributors Corporation
Smithfield, RI
Transfer and Service Agents
Fidelity Investments Institutional Operations Company, Inc.
Boston, MA
Fidelity Service Company, Inc.
Boston, MA
Custodians
JPMorgan Chase Bank†
New York, NY
Brown Brothers Harriman & Co. ††
Boston, MA
State Street Bank and Trust †††
Quincy, MA
† Custodian for Fidelity Advisor Consumer Discretionary Fund, Fidelity Advisor Financial Services Fund, Fidelity Advisor Health Care Fund, Fidelity Advisor Industrials Fund, Fidelity Advisor Technology Fund, and Fidelity Advisor Utilities Fund.
†† Custodian for Fidelity Advisor Energy Fund.
††† Custodian for Fidelity Advisor Biotechnology Fund, Fidelity Advisor
Communications Equipment Fund, and Fidelity Advisor Electronics Fund.

AFOC-UANNPRO-0912
1.789241.108

Fidelity Advisor
Focus Funds®
Institutional Class
Fidelity Advisor® Biotechnology Fund
Fidelity Advisor Communications Equipment Fund
Fidelity Advisor Consumer Discretionary Fund
Fidelity Advisor Electronics Fund
Fidelity Advisor Energy Fund
Fidelity Advisor Financial Services Fund
Fidelity Advisor Health Care Fund
Fidelity Advisor Industrials Fund
Fidelity Advisor Technology Fund
Fidelity Advisor Utilities Fund
Annual Report
July 31, 2012
(Fidelity Cover Art)
Contents
To view a fund's proxy voting guidelines and proxy voting record for the 12-month period ended June 30, visit http://www.fidelity.com/proxyvotingresults or visit the Securities and Exchange Commission's (SEC) web site at http://www.sec.gov. You may also call 1-877-208-0098 to request a free copy of the proxy voting guidelines.
Standard & Poor's, S&P and S&P 500 are registered service marks of The McGraw-Hill Companies, Inc. and have been licensed for use by Fidelity Distributors Corporation.
Other third party marks appearing herein are the property of their respective owners.
All other marks appearing herein are registered or unregistered trademarks or service marks of FMR LLC or an affiliated company. © 2012 FMR LLC. All rights reserved.
This report and the financial statements contained herein are submitted for the general information of the shareholders of the funds. This report is not authorized for distribution to prospective investors in the funds unless preceded or accompanied by an effective prospectus.
A fund files its complete schedule of portfolio holdings with the SEC for the first and third quarters of each fiscal year on Form N-Q. Forms N-Q are available on the SEC's web site at http://www.sec.gov. A fund's Forms N-Q may be reviewed and copied at the SEC's Public Reference Room in Washington, DC. Information regarding the operation of the SEC's Public Reference Room may be obtained by calling 1-800-SEC-0330. For a complete list of a fund's portfolio holdings, view the most recent holdings listing, semiannual report, or annual report on Fidelity's web site at http://www.fidelity.com, http://www.advisor.fidelity.com, or http://www.401k.com, as applicable.
NOT FDIC INSURED • MAY LOSE VALUE • NO BANK GUARANTEE
Neither the funds nor Fidelity Distributors Corporation is a bank.
Annual Report
Fidelity Advisor Biotechnology Fund - Institutional Class
Performance: The Bottom Line
Average annual total return reflects the change in the value of an investment, assuming reinvestment of the class' distributions from dividend income and capital gains (the profits earned upon the sale of securities that have grown in value, if any) and assuming a constant rate of performance each year. The $10,000 table and the fund's returns do not reflect the deduction of taxes that a shareholder would pay on fund distributions or the redemption of fund shares. During periods of reimbursement by Fidelity, a fund's total return will be greater than it would be had the reimbursement not occurred. How a fund did yesterday is no guarantee of how it will do tomorrow.
Average Annual Total Returns
Periods ended July 31, 2012 | Past 1
year | Past 5
years | Past 10
years |
Institutional Class | 34.29% | 12.19% | 11.53% |
$10,000 Over 10 Years
Let's say hypothetically that $10,000 was invested in Fidelity Advisor® Biotechnology Fund - Institutional Class on July 31, 2002. The chart shows how the value of your investment would have changed, and also shows how the S&P 500® Index performed over the same period.
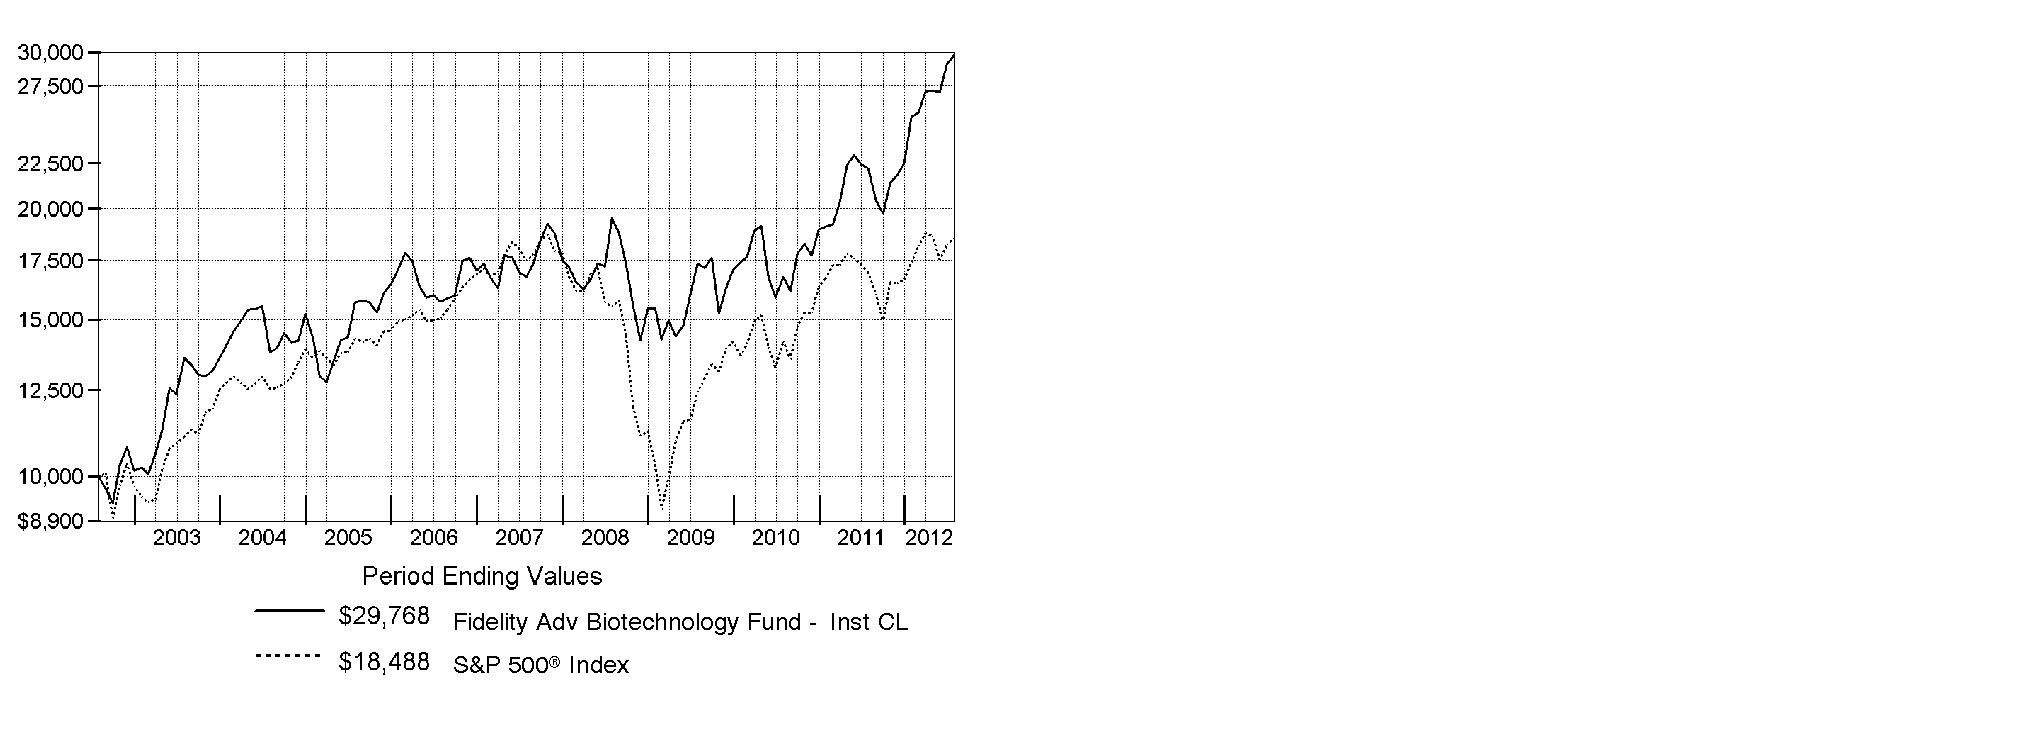
Annual Report
Fidelity Advisor Biotechnology Fund
Market Recap: Major U.S. equity benchmarks posted solid gains for the year ending July 31, 2012, amid an uncertain investment environment. The broad-based S&P 500® Index returned 9.13%, while the blue-chip-laden Dow Jones Industrial AverageSM and technology-heavy Nasdaq Composite® Index gained 10.12% and 7.83%, respectively. Volatility spiked during the period's first half, as equities plummeted late last summer on Europe's debt woes, political wrangling over the U.S. debt ceiling and the sovereign credit-rating downgrade that followed. By October, a seemingly improved U.S. economy rejuvenated stocks, paving the way for major equity benchmarks to post their best first-quarter performance since 1998. However, more eurozone trouble, signs that the U.S. economy had turned sluggish and a slowdown in China caused stocks to slip in May, before a new wave of optimism took hold in June and July. Within the S&P 500®, more-defensive sectors such as telecommunication services (+30%) and consumer staples (+20%) fared best, while materials and energy significantly underperformed, returning -5%. Small- and mid-cap stocks trailed their less-volatile large-cap counterparts, with the Russell 2000® Index adding 0.19% and the Russell Midcap® Index rising 2.28%. Given turmoil and local currency weakness in Europe, foreign developed-markets stocks lost ground, with the MSCI® EAFE® Index returning -11.32%.
Comments from Rajiv Kaul, Portfolio Manager of Fidelity Advisor® Biotechnology Fund: For the year, the fund's Institutional Class shares returned 34.29%, trailing the 36.18% advance of the MSCI® U.S. IM Biotechnology 25/50 Index but beating the S&P 500®. Versus the MSCI index, a sizable underweighting in strong-performing benchmark heavyweight Amgen - the fund's largest holding during the period - and a significant overweighting in small-cap biotech shares worked against relative performance. Exposure to some out-of-index pharmaceuticals stocks also curbed the fund's gain. An overweighting in InterMune detracted the most, as investors grew impatient with the pace of sales growth for the company's Esbriet® medication. An out-of-index stake in Vical and an overweighting in Progenics Pharmaceuticals also hurt. Conversely, the stock aiding relative performance the most was a sizable overweighting in Medivation, one of the fund's largest positions during the period. Positive clinical results for the company's prostate cancer treatment lifted its stock. Meanwhile, a small out-of-benchmark stake in pain medication maker Adolor soared in October after the company agreed to be acquired. I sold our position here to lock in profits. A modest underweighting in Gilead Sciences also helped.
The views expressed above reflect those of the portfolio manager(s) only through the end of the period as stated on the cover of this report and do not necessarily represent the views of Fidelity or any other person in the Fidelity organization. Any such views are subject to change at any time based upon market or other conditions and Fidelity disclaims any responsibility to update such views. These views may not be relied on as investment advice and, because investment decisions for a Fidelity fund are based on numerous factors, may not be relied on as an indication of trading intent on behalf of any Fidelity fund.
Annual Report
Fidelity Advisor Biotechnology Fund
As a shareholder of the Fund, you incur two types of costs: (1) transaction costs, including sales charges (loads) on purchase payments or redemption proceeds, redemption fees and (2) ongoing costs, including management fees, distribution and/or service (12b-1) fees and other Fund expenses. This Example is intended to help you understand your ongoing costs (in dollars) of investing in the Fund and to compare these costs with the ongoing costs of investing in other mutual funds.
The Example is based on an investment of $1,000 invested at the beginning of the period and held for the entire period (February 1, 2012 to July 31, 2012).
Actual Expenses
The first line of the accompanying table for each class of the Fund provides information about actual account values and actual expenses. You may use the information in this line, together with the amount you invested, to estimate the expenses that you paid over the period. Simply divide your account value by $1,000.00 (for example, an $8,600 account value divided by $1,000.00 = 8.6), then multiply the result by the number in the first line for a class of the Fund under the heading entitled "Expenses Paid During Period" to estimate the expenses you paid on your account during this period. In addition, the Fund, as a shareholder in the underlying Fidelity Central Funds, will indirectly bear its pro-rata share of the fees and expenses incurred by the underlying Fidelity Central Funds. These fees and expenses are not included in the Fund's annualized expense ratio used to calculate the expense estimate in the table below.
Hypothetical Example for Comparison Purposes
The second line of the accompanying table for each class of the Fund provides information about hypothetical account values and hypothetical expenses based on a Class' actual expense ratio and an assumed rate of return of 5% per year before expenses, which is not the Class' actual return. The hypothetical account values and expenses may not be used to estimate the actual ending account balance or expenses you paid for the period. You may use this information to compare the ongoing costs of investing in the Fund and other funds. To do so, compare this 5% hypothetical example with the 5% hypothetical examples that appear in the shareholder reports of the other funds. In addition, the Fund, as a shareholder in the underlying Fidelity Central Funds, will indirectly bear its pro-rata share of the fees and expenses incurred by the underlying Fidelity Central Funds. These fees and expenses are not included in the Fund's annualized expense ratio used to calculate the expense estimate in the table below.
Please note that the expenses shown in the table are meant to highlight your ongoing costs only and do not reflect any transaction costs. Therefore, the second line of the table is useful in comparing ongoing costs only, and will not help you determine the relative total costs of owning different funds. In addition, if these transactional costs were included, your costs would have been higher.
| Annualized
Expense Ratio | Beginning
Account Value
February 1, 2012 | Ending
Account Value
July 31, 2012 | Expenses Paid
During Period*
February 1, 2012
to July 31, 2012 |
Class A | 1.21% | | | |
Actual | | $ 1,000.00 | $ 1,170.80 | $ 6.53 |
Hypothetical A | | $ 1,000.00 | $ 1,018.85 | $ 6.07 |
Class T | 1.50% | | | |
Actual | | $ 1,000.00 | $ 1,168.90 | $ 8.09 |
Hypothetical A | | $ 1,000.00 | $ 1,017.40 | $ 7.52 |
Class B | 1.95% | | | |
Actual | | $ 1,000.00 | $ 1,165.90 | $ 10.50 |
Hypothetical A | | $ 1,000.00 | $ 1,015.17 | $ 9.77 |
Class C | 1.94% | | | |
Actual | | $ 1,000.00 | $ 1,167.00 | $ 10.45 |
Hypothetical A | | $ 1,000.00 | $ 1,015.22 | $ 9.72 |
Institutional Class | .90% | | | |
Actual | | $ 1,000.00 | $ 1,172.70 | $ 4.86 |
Hypothetical A | | $ 1,000.00 | $ 1,020.39 | $ 4.52 |
A 5% return per year before expenses
* Expenses are equal to each Class' annualized expense ratio, multiplied by the average account value over the period, multiplied by 182/366 (to reflect the one-half year period).
Annual Report
Fidelity Advisor Biotechnology Fund
Investment Changes (Unaudited)
Top Ten Stocks as of July 31, 2012 |
| % of fund's
net assets | % of fund's net assets
6 months ago |
Amgen, Inc. | 12.1 | 10.1 |
Gilead Sciences, Inc. | 10.1 | 10.6 |
Biogen Idec, Inc. | 7.8 | 6.1 |
Celgene Corp. | 4.4 | 4.2 |
Regeneron Pharmaceuticals, Inc. | 4.3 | 3.2 |
ONYX Pharmaceuticals, Inc. | 3.7 | 1.6 |
Vertex Pharmaceuticals, Inc. | 3.2 | 3.4 |
Alexion Pharmaceuticals, Inc. | 2.7 | 4.0 |
Medivation, Inc. | 2.7 | 2.3 |
BioMarin Pharmaceutical, Inc. | 1.7 | 2.6 |
| 52.7 | |
Top Industries (% of fund's net assets) |
As of July 31, 2012 |
 | Biotechnology | 91.8% | |
 | Pharmaceuticals | 4.6% | |
 | Life Sciences Tools & Services | 0.5% | |
 | Health Care Equipment & Supplies | 0.2% | |
 | Personal Products | 0.1% | |
 | All Others* | 2.8% | |

As of January 31, 2012 |
 | Biotechnology | 94.1% | |
 | Pharmaceuticals | 5.7% | |
 | Life Sciences Tools & Services | 0.4% | |
 | Health Care Equipment & Supplies | 0.0% | |
| All Others*† | (0.2)% | |

* Includes short-term investments and net other assets. |
† Short-Term Investments and Net Other Assets (Liabilities) are not included in the pie chart. |
Annual Report
Fidelity Advisor Biotechnology Fund
Investments July 31, 2012
Showing Percentage of Net Assets
Common Stocks - 97.1% |
| Shares | | Value |
BIOTECHNOLOGY - 91.8% |
Biotechnology - 91.8% |
A.P. Pharma, Inc. (e) | 949,565 | | $ 598,226 |
Acadia Pharmaceuticals, Inc. (a) | 157,447 | | 253,490 |
Achillion Pharmaceuticals, Inc. (a) | 47,601 | | 315,119 |
Acorda Therapeutics, Inc. (a) | 62,957 | | 1,515,375 |
Addex Pharmaceuticals Ltd. (a) | 60 | | 491 |
Aegerion Pharmaceuticals, Inc. (a) | 48,490 | | 736,078 |
Affymax, Inc. (a)(d) | 65,193 | | 1,058,082 |
Agenus, Inc. (a)(d) | 9,425 | | 45,523 |
Agenus, Inc. warrants 6/9/18 (a)(e) | 452,000 | | 93,550 |
Alexion Pharmaceuticals, Inc. (a) | 42,005 | | 4,404,224 |
Alkermes PLC (a) | 65,261 | | 1,213,202 |
Alnylam Pharmaceuticals, Inc. (a)(d) | 99,898 | | 1,867,094 |
AMAG Pharmaceuticals, Inc. (a) | 55,006 | | 851,493 |
Amarin Corp. PLC ADR (a)(d) | 95,879 | | 1,122,743 |
Amgen, Inc. | 237,814 | | 19,643,433 |
Amicus Therapeutics, Inc. (a) | 37,385 | | 184,308 |
Anacor Pharmaceuticals, Inc. (a) | 22,150 | | 130,685 |
Arena Pharmaceuticals, Inc. (a)(d) | 239,529 | | 2,002,462 |
ARIAD Pharmaceuticals, Inc. (a) | 128,106 | | 2,450,668 |
ArQule, Inc. (a) | 192,909 | | 1,167,099 |
AVEO Pharmaceuticals, Inc. (a)(d) | 23,752 | | 311,151 |
Biogen Idec, Inc. (a) | 86,357 | | 12,593,441 |
BioInvent International AB (a) | 35,090 | | 17,440 |
BioMarin Pharmaceutical, Inc. (a) | 71,556 | | 2,811,435 |
Bionovo, Inc. (a) | 46,000 | | 782 |
Bionovo, Inc. warrants 2/2/16 (a) | 56,850 | | 713 |
Biospecifics Technologies Corp. (a) | 1,244 | | 22,479 |
BioTime, Inc. (a)(d) | 32,817 | | 126,674 |
Catalyst Pharmaceutical Partners, Inc. (a) | 117,609 | | 149,363 |
Catalyst Pharmaceutical Partners, Inc.: | | | |
warrants 5/2/17 (a) | 8,557 | | 1,005 |
warrants 5/30/17 (a) | 17,900 | | 5,109 |
Celgene Corp. (a) | 104,660 | | 7,165,024 |
Cell Therapeutics, Inc. (a)(d) | 609,529 | | 314,517 |
Cell Therapeutics, Inc. warrants 7/6/16 (a) | 46,404 | | 5,312 |
Celldex Therapeutics, Inc. (a) | 121,557 | | 628,450 |
Cepheid, Inc. (a) | 35,400 | | 1,134,216 |
Clovis Oncology, Inc. (d) | 17,462 | | 308,903 |
Codexis, Inc. (a) | 47,542 | | 146,429 |
Cubist Pharmaceuticals, Inc. (a) | 36,792 | | 1,584,264 |
Cytokinetics, Inc. | 407,500 | | 282,805 |
Cytokinetics, Inc. warrants 6/25/17 (a) | 244,500 | | 2,490 |
Dendreon Corp. (a)(d) | 89,828 | | 427,581 |
Durata Therapeutics, Inc. | 13,800 | | 116,886 |
Dyax Corp. (a) | 209,795 | | 555,957 |
Dynavax Technologies Corp. (a) | 161,002 | | 621,468 |
Emergent BioSolutions, Inc. (a) | 17,500 | | 255,675 |
Enzon Pharmaceuticals, Inc. (a) | 29,534 | | 195,810 |
Exact Sciences Corp. (a) | 45,300 | | 464,325 |
Exelixis, Inc. (a)(d) | 67,145 | | 419,656 |
|
| Shares | | Value |
Genomic Health, Inc. (a) | 16,728 | | $ 561,559 |
Geron Corp. (a) | 8,061 | | 13,865 |
Gilead Sciences, Inc. (a) | 300,460 | | 16,323,992 |
Halozyme Therapeutics, Inc. (a)(d) | 84,958 | | 766,321 |
Horizon Pharma, Inc. (d) | 6,100 | | 34,831 |
Horizon Pharma, Inc. warrants 2/28/17 (a)(e) | 18,737 | | 29,510 |
Idenix Pharmaceuticals, Inc. (a)(d) | 74,406 | | 753,733 |
ImmunoGen, Inc. (a)(d) | 64,980 | | 1,048,777 |
Immunomedics, Inc. (a) | 36,350 | | 125,771 |
Incyte Corp. (a) | 74,938 | | 1,872,701 |
Infinity Pharmaceuticals, Inc. (a) | 26,533 | | 463,266 |
InterMune, Inc. (a) | 126,962 | | 1,121,074 |
Ironwood Pharmaceuticals, Inc.
Class A (a) | 108,728 | | 1,399,329 |
Isis Pharmaceuticals, Inc. (a)(d) | 59,810 | | 724,897 |
Keryx Biopharmaceuticals, Inc. (a) | 48,400 | | 88,088 |
Lexicon Pharmaceuticals, Inc. (a)(d) | 487,692 | | 1,180,215 |
Ligand Pharmaceuticals, Inc. Class B (a) | 30,154 | | 583,480 |
MannKind Corp. (a)(d) | 52,246 | | 124,345 |
Medivation, Inc. (a) | 44,013 | | 4,388,096 |
Merrimack Pharmaceuticals, Inc. | 2,800 | | 22,316 |
Metabolix, Inc. (a)(d) | 61,356 | | 113,509 |
Momenta Pharmaceuticals, Inc. (a)(d) | 31,866 | | 453,135 |
Myriad Genetics, Inc. (a) | 56,382 | | 1,401,093 |
Neurocrine Biosciences, Inc. (a) | 48,406 | | 367,886 |
NeurogesX, Inc. (a) | 37,202 | | 8,928 |
NeurogesX, Inc. (e) | 150,000 | | 36,000 |
NewLink Genetics Corp. (d) | 20,100 | | 238,788 |
Novavax, Inc. (a)(d) | 525,011 | | 1,170,775 |
Novelos Therapeutics, Inc. (a) | 137,600 | | 144,480 |
Novelos Therapeutics, Inc. warrants 12/6/16 (a) | 137,600 | | 64,346 |
NPS Pharmaceuticals, Inc. (a) | 97,378 | | 750,784 |
OncoGenex Pharmaceuticals, Inc. (a) | 8,605 | | 120,126 |
Oncothyreon, Inc. (a)(d) | 13,836 | | 58,526 |
Onyx Pharmaceuticals, Inc. (a) | 80,768 | | 6,055,177 |
Opko Health, Inc. (a)(d) | 129,700 | | 549,928 |
Oragenics, Inc. (e) | 108,608 | | 254,143 |
OREXIGEN Therapeutics, Inc. (a)(d) | 168,452 | | 830,468 |
Osiris Therapeutics, Inc. (a)(d) | 30,725 | | 267,922 |
PDL BioPharma, Inc. (d) | 81,188 | | 551,267 |
Pharmacyclics, Inc. (a)(d) | 46,849 | | 2,492,835 |
PolyMedix, Inc. (a) | 357,066 | | 117,832 |
PolyMedix, Inc. warrants 4/10/16 (a) | 163,833 | | 34,484 |
Progenics Pharmaceuticals, Inc. (a) | 180,835 | | 942,150 |
PROLOR Biotech, Inc. (a)(d) | 72,716 | | 357,763 |
Protalix BioTherapeutics, Inc. (a)(d) | 72,943 | | 424,528 |
Puma Biotechnology, Inc. | 32,887 | | 419,309 |
Raptor Pharmaceutical Corp. (a)(d) | 94,051 | | 468,374 |
Regeneron Pharmaceuticals, Inc. (a) | 52,104 | | 7,015,804 |
Rigel Pharmaceuticals, Inc. (a) | 75,572 | | 826,758 |
Sangamo Biosciences, Inc. (a) | 73,728 | | 387,809 |
Sarepta Therapeutics, Inc. (a) | 317 | | 2,875 |
Common Stocks - continued |
| Shares | | Value |
BIOTECHNOLOGY - CONTINUED |
Biotechnology - continued |
Savient Pharmaceuticals, Inc. (a)(d) | 81,455 | | $ 51,317 |
Seattle Genetics, Inc. (a)(d) | 56,734 | | 1,484,161 |
SIGA Technologies, Inc. (a)(d) | 101,286 | | 294,742 |
Sophiris Bio, Inc. | 138,000 | | 46,787 |
Sorrento Therapeutics, Inc. (e) | 720,000 | | 97,200 |
Spectrum Pharmaceuticals, Inc. (a) | 120,739 | | 1,689,139 |
Sunesis Pharmaceuticals, Inc. (a)(d) | 21,236 | | 63,071 |
Synageva BioPharma Corp. (a) | 16,000 | | 800,960 |
Synergy Pharmaceuticals, Inc. (a) | 41,200 | | 168,508 |
Synergy Pharmaceuticals, Inc. warrants 11/14/16 (a) | 20,600 | | 38,110 |
Synta Pharmaceuticals Corp. (a)(d) | 169,166 | | 1,243,370 |
Synthetic Biologics, Inc. (a) | 100 | | 224 |
Targacept, Inc. (a) | 37,697 | | 162,851 |
Theravance, Inc. (a)(d) | 85,858 | | 2,501,044 |
Threshold Pharmaceuticals, Inc. (a)(d) | 97,866 | | 679,190 |
Threshold Pharmaceuticals, Inc. warrants 3/16/16 (a) | 35,146 | | 188,731 |
Tranzyme, Inc. (a) | 50,400 | | 201,600 |
Trius Therapeutics, Inc. (a) | 57,653 | | 317,668 |
United Therapeutics Corp. (a) | 36,052 | | 1,974,929 |
Vanda Pharmaceuticals, Inc. (a) | 101,300 | | 408,239 |
Verastem, Inc. | 6,365 | | 59,449 |
Vertex Pharmaceuticals, Inc. (a) | 106,420 | | 5,162,434 |
Vical, Inc. (a)(d) | 266,077 | | 920,626 |
XOMA Corp. (a)(d) | 154,908 | | 562,316 |
ZIOPHARM Oncology, Inc. (a)(d) | 135,779 | | 764,436 |
| | 148,757,775 |
HEALTH CARE EQUIPMENT & SUPPLIES - 0.2% |
Health Care Equipment - 0.2% |
Alsius Corp. (a) | 14,200 | | 0 |
Aradigm Corp. (a) | 351,440 | | 40,416 |
InVivo Therapeutics Holdings Corp. (a) | 98,300 | | 242,801 |
| | 283,217 |
HEALTH CARE PROVIDERS & SERVICES - 0.0% |
Health Care Services - 0.0% |
OvaScience, Inc. (e) | 12,800 | | 70,400 |
LIFE SCIENCES TOOLS & SERVICES - 0.5% |
Life Sciences Tools & Services - 0.5% |
BG Medicine, Inc. (a) | 75,570 | | 504,808 |
ChromaDex, Inc. (a)(d) | 143,866 | | 89,197 |
Transgenomic, Inc. (a) | 33,100 | | 34,093 |
Transgenomic, Inc. (e) | 162,000 | | 166,860 |
Transgenomic, Inc. warrants 2/3/17 (a)(e) | 81,000 | | 2,469 |
| | 797,427 |
|
| Shares | | Value |
PERSONAL PRODUCTS - 0.1% |
Personal Products - 0.1% |
MYOS Corp. (e) | 333,300 | | $ 92,991 |
PHARMACEUTICALS - 4.5% |
Pharmaceuticals - 4.5% |
AcelRx Pharmaceuticals, Inc. (a) | 62,800 | | 184,632 |
Auxilium Pharmaceuticals, Inc. (a) | 22,858 | | 615,795 |
AVANIR Pharmaceuticals Class A (a)(d) | 295,541 | | 845,247 |
Corcept Therapeutics, Inc. (a)(d) | 34,013 | | 123,127 |
Elan Corp. PLC sponsored ADR (a) | 98,152 | | 1,133,656 |
Jazz Pharmaceuticals PLC (a) | 6,568 | | 315,724 |
Omeros Corp. (a) | 61,072 | | 577,130 |
Optimer Pharmaceuticals, Inc. (a)(d) | 24,917 | | 340,366 |
Pacira Pharmaceuticals, Inc. (a)(d) | 31,797 | | 486,812 |
Santarus, Inc. (a) | 45,025 | | 327,332 |
TherapeuticsMD, Inc. (a) | 90,100 | | 297,330 |
Transcept Pharmaceuticals, Inc. (a) | 6,000 | | 36,540 |
Ventrus Biosciences, Inc. (a) | 27,098 | | 99,179 |
ViroPharma, Inc. (a) | 21,074 | | 457,517 |
VIVUS, Inc. (a)(d) | 21,800 | | 458,454 |
XenoPort, Inc. (a) | 71,586 | | 564,098 |
Zogenix, Inc. (a) | 125,489 | | 276,076 |
Zogenix, Inc. unit (a) | 73,300 | | 163,022 |
| | 7,302,037 |
TOTAL COMMON STOCKS (Cost $125,259,337) |
157,303,847
|
Convertible Preferred Stocks - 0.1% |
| | | |
BIOTECHNOLOGY - 0.0% |
Biotechnology - 0.0% |
bluebird bio (e) | 35,360 | | 17,631 |
PHARMACEUTICALS - 0.1% |
Pharmaceuticals - 0.1% |
Agios Pharmaceuticals, Inc. Series C (e) | 13,990 | | 68,706 |
KaloBios Pharmaceuticals, Inc. Series E (a)(e) | 42,000 | | 142,800 |
| | 211,506 |
TOTAL CONVERTIBLE PREFERRED STOCKS (Cost $229,126) |
229,137
|
Money Market Funds - 18.8% |
| Shares | | Value |
Fidelity Cash Central Fund, 0.17% (b) | 10,111,771 | | $ 10,111,771 |
Fidelity Securities Lending Cash Central Fund, 0.18% (b)(c) | 20,291,175 | | 20,291,175 |
TOTAL MONEY MARKET FUNDS (Cost $30,402,946) |
30,402,946
|
TOTAL INVESTMENT PORTFOLIO - 116.0% (Cost $155,891,409) | | 187,935,930 |
NET OTHER ASSETS (LIABILITIES) - (16.0)% | | (25,957,339) |
NET ASSETS - 100% | $ 161,978,591 |
Legend |
(a) Non-income producing |
(b) Affiliated fund that is available only to investment companies and other accounts managed by Fidelity Investments. The rate quoted is the annualized seven-day yield of the fund at period end. A complete unaudited listing of the fund's holdings as of its most recent quarter end is available upon request. In addition, each Fidelity Central Fund's financial statements, which are not covered by the Fund's Report of Independent Registered Public Accounting Firm, are available on the SEC's website or upon request. |
(c) Investment made with cash collateral received from securities on loan. |
(d) Security or a portion of the security is on loan at period end. |
(e) Restricted securities - Investment in securities not registered under the Securities Act of 1933 (excluding 144A issues). At the end of the period, the value of restricted securities (excluding 144A issues) amounted to $1,670,486 or 1.0% of net assets. |
Additional information on each restricted holding is as follows: |
Security | Acquisition Date | Acquisition Cost |
A.P. Pharma, Inc. | 7/25/12 | $ 498,522 |
Agenus, Inc. warrants 6/9/18 | 1/9/08 | $ 563,722 |
Agios Pharmaceuticals, Inc. Series C | 11/16/11 | $ 68,706 |
bluebird bio | 7/23/12 | $ 17,620 |
Horizon Pharma, Inc. warrants 2/28/17 | 2/29/12 | $ 2,342 |
KaloBios Pharmaceuticals, Inc. Series E | 5/2/12 | $ 142,800 |
MYOS Corp. | 7/2/12 | $ 83,325 |
NeurogesX, Inc. | 2/1/12 | $ 151,500 |
Oragenics, Inc. | 7/31/12 | $ 162,912 |
OvaScience, Inc. | 3/29/12 | $ 70,400 |
Sorrento Therapeutics, Inc. | 5/15/12 | $ 115,200 |
Transgenomic, Inc. | 2/3/12 | $ 161,441 |
Transgenomic, Inc. warrants 2/3/17 | 2/3/12 | $ 559 |
Affiliated Central Funds |
Information regarding fiscal year to date income earned by the Fund from investments in Fidelity Central Funds is as follows: |
Fund | Income earned |
Fidelity Cash Central Fund | $ 2,923 |
Fidelity Securities Lending Cash Central Fund | 287,481 |
Total | $ 290,404 |
Other Information |
The following is a summary of the inputs used, as of July 31, 2012, involving the Fund's assets and liabilities carried at fair value. The inputs or methodology used for valuing securities may not be an indication of the risk associated with investing in those securities. For more information on valuation inputs, and their aggregation into the levels used in the table below, please refer to the Security Valuation section in the accompanying Notes to Financial Statements. |
Valuation Inputs at Reporting Date: |
Description | Total | Level 1 | Level 2 | Level 3 |
Investments in Securities: | | | | |
Common Stocks | $ 157,303,847 | $ 155,600,146 | $ 1,633,301 | $ 70,400 |
Convertible Preferred Stocks | 229,137 | - | - | 229,137 |
Money Market Funds | 30,402,946 | 30,402,946 | - | - |
Total Investments in Securities: | $ 187,935,930 | $ 186,003,092 | $ 1,633,301 | $ 299,537 |
See accompanying notes which are an integral part of the financial statements.
Annual Report
Fidelity Advisor Biotechnology Fund
Statement of Assets and Liabilities
| July 31, 2012 |
| | |
Assets | | |
Investment in securities, at value (including securities loaned of $18,695,107) - See accompanying schedule: Unaffiliated issuers (cost $125,488,463) | $ 157,532,984 | |
Fidelity Central Funds (cost $30,402,946 | 30,402,946 | |
Total Investments (cost $155,891,409) | | $ 187,935,930 |
Receivable for investments sold | | 2,869,141 |
Receivable for fund shares sold | | 2,085,272 |
Distributions receivable from Fidelity Central Funds | | 54,243 |
Other receivables | | 1,795 |
Total assets | | 192,946,381 |
| | |
Liabilities | | |
Payable to custodian bank | $ 129,543 | |
Payable for investments purchased | 10,000,077 | |
Payable for fund shares redeemed | 350,233 | |
Accrued management fee | 69,729 | |
Distribution and service plan fees payable | 56,003 | |
Other affiliated payables | 34,235 | |
Other payables and accrued expenses | 36,795 | |
Collateral on securities loaned, at value | 20,291,175 | |
Total liabilities | | 30,967,790 |
| | |
Net Assets | | $ 161,978,591 |
Net Assets consist of: | | |
Paid in capital | | $ 120,525,433 |
Accumulated undistributed net realized gain (loss) on investments and foreign currency transactions | | 9,408,637 |
Net unrealized appreciation (depreciation) on investments | | 32,044,521 |
Net Assets | | $ 161,978,591 |
Statement of Assets and Liabilities - continued
| July 31, 2012 |
| | |
Calculation of Maximum Offering Price Class A:
Net Asset Value and redemption price per share ($68,993,474 ÷ 5,851,707 shares) | | $ 11.79 |
| | |
Maximum offering price per share (100/94.25 of $11.79) | | $ 12.51 |
Class T:
Net Asset Value and redemption price per share ($28,153,833 ÷ 2,465,085 shares) | | $ 11.42 |
| | |
Maximum offering price per share (100/96.50 of $11.42) | | $ 11.83 |
Class B:
Net Asset Value and offering price per share ($6,349,281 ÷ 590,506 shares)A | | $ 10.75 |
| | |
Class C:
Net Asset Value and offering price per share ($31,709,620 ÷ 2,947,678 shares)A | | $ 10.76 |
| | |
Institutional Class:
Net Asset Value, offering price and redemption price per share ($26,772,383 ÷ 2,190,697 shares) | | $ 12.22 |
A Redemption price per share is equal to net asset value less any applicable contingent deferred sales charge.
See accompanying notes which are an integral part of the financial statements.
Annual Report
Statement of Operations
| Year ended July 31, 2012 |
| | |
Investment Income | | |
Dividends | | $ 220,191 |
Income from Fidelity Central Funds (including $287,481 from security lending) | | 290,404 |
Total income | | 510,595 |
| | |
Expenses | | |
Management fee | $ 531,816 | |
Transfer agent fees | 278,414 | |
Distribution and service plan fees | 454,730 | |
Accounting and security lending fees | 38,888 | |
Custodian fees and expenses | 15,932 | |
Independent trustees' compensation | 586 | |
Registration fees | 60,261 | |
Audit | 43,371 | |
Legal | 275 | |
Miscellaneous | 691 | |
Total expenses before reductions | 1,424,964 | |
Expense reductions | (3,767) | 1,421,197 |
Net investment income (loss) | | (910,602) |
Realized and Unrealized Gain (Loss) Net realized gain (loss) on: | | |
Investment securities: | | |
Unaffiliated issuers | 13,076,175 | |
Foreign currency transactions | 26 | |
Total net realized gain (loss) | | 13,076,201 |
Change in net unrealized appreciation (depreciation) on investment securities | | 17,166,425 |
Net gain (loss) | | 30,242,626 |
Net increase (decrease) in net assets resulting from operations | | $ 29,332,024 |
Statement of Changes in Net Assets
| Year ended
July 31,
2012 | Year ended
July 31,
2011 |
Increase (Decrease) in Net Assets | | |
Operations | | |
Net investment income (loss) | $ (910,602) | $ (708,078) |
Net realized gain (loss) | 13,076,201 | 5,234,202 |
Change in net unrealized appreciation (depreciation) | 17,166,425 | 11,018,770 |
Net increase (decrease) in net assets resulting from operations | 29,332,024 | 15,544,894 |
Share transactions - net increase (decrease) | 58,002,416 | 6,522,296 |
Redemption fees | 11,011 | 3,193 |
Total increase (decrease) in net assets | 87,345,451 | 22,070,383 |
| | |
Net Assets | | |
Beginning of period | 74,633,140 | 52,562,757 |
End of period (including accumulated net investment loss of $0 and $755, respectively) | $ 161,978,591 | $ 74,633,140 |
See accompanying notes which are an integral part of the financial statements.
Annual Report
Financial Highlights - Class A
Years ended July 31, | 2012 | 2011 | 2010 | 2009 | 2008 |
Selected Per-Share Data | | | | | |
Net asset value, beginning of period | $ 8.81 | $ 6.67 | $ 6.94 | $ 7.81 | $ 7.23 |
Income from Investment Operations | | | | | |
Net investment income (loss) C | (.07) | (.07) F | (.08) G | (.08) | (.09) H |
Net realized and unrealized gain (loss) | 3.05 | 2.21 | (.19) | (.79) | 1.20 |
Total from investment operations | 2.98 | 2.14 | (.27) | (.87) | 1.11 |
Distributions from net realized gain | - | - | - | - | (.53) |
Redemption fees added to paid in capital C, J | - | - | - | - | - |
Net asset value, end of period | $ 11.79 | $ 8.81 | $ 6.67 | $ 6.94 | $ 7.81 |
Total Return A, B | 33.83% | 32.08% | (3.89)% | (11.14)% | 15.95% |
Ratios to Average Net Assets D, I | | | | | |
Expenses before reductions | 1.27% | 1.35% | 1.39% | 1.40% | 1.37% |
Expenses net of fee waivers, if any | 1.27% | 1.35% | 1.39% | 1.40% | 1.37% |
Expenses net of all reductions | 1.27% | 1.34% | 1.38% | 1.40% | 1.37% |
Net investment income (loss) | (.73)% | (.91)% F | (1.15)% G | (1.27)% | (1.24)% H |
Supplemental Data | | | | | |
Net assets, end of period (000 omitted) | $ 68,993 | $ 30,639 | $ 20,154 | $ 19,858 | $ 18,249 |
Portfolio turnover rate E | 82% | 99% | 130% | 73% | 132% |
A Total returns would have been lower if certain expenses had not been reduced during the applicable periods shown.
B Total returns do not include the effect of the sales charges.
C Calculated based on average shares outstanding during the period.
D Fees and expenses of any underlying Fidelity Central Funds are not included in the Fund's expense ratio. The Fund indirectly bears its proportionate share of the expenses of any underlying Fidelity Central Funds.
E Amount does not include the portfolio activity of any underlying Fidelity Central Funds.
F Investment income per share reflects a large, non-recurring dividend which amounted to $.01 per share. Excluding this non-recurring dividend, the ratio of net investment income (loss) to average net assets would have been (1.04)%.
G Investment income per share reflects a large, non-recurring dividend which amounted to $.01 per share. Excluding this non-recurring dividend, the ratio of net investment income (loss) to average net assets would have been (1.29)%.
H Investment income per share reflects a large, non-recurring dividend which amounted to $.01 per share. Excluding this non-recurring dividend, the ratio of net investment income (loss) to average net assets would have been (1.33)%.
I Expense ratios reflect operating expenses of the class. Expenses before reductions do not reflect amounts reimbursed by the investment adviser or reductions from brokerage service arrangements or reductions from other expense offset arrangements and do not represent the amount paid by the class during periods when reimbursements or reductions occur. Expenses net of fee waivers reflect expenses after reimbursement by the investment adviser but prior to reductions from brokerage service arrangements or other expense offset arrangements. Expenses net of all reductions represent the net expenses paid by the class.
J Amount represents less than $.01 per share.
Financial Highlights - Class T
Years ended July 31, | 2012 | 2011 | 2010 | 2009 | 2008 |
Selected Per-Share Data | | | | | |
Net asset value, beginning of period | $ 8.56 | $ 6.50 | $ 6.78 | $ 7.65 | $ 7.11 |
Income from Investment Operations | | | | | |
Net investment income (loss) C | (.10) | (.09) F | (.09) G | (.09) | (.11) H |
Net realized and unrealized gain (loss) | 2.96 | 2.15 | (.19) | (.78) | 1.18 |
Total from investment operations | 2.86 | 2.06 | (.28) | (.87) | 1.07 |
Distributions from net realized gain | - | - | - | - | (.53) |
Redemption fees added to paid in capital C, J | - | - | - | - | - |
Net asset value, end of period | $ 11.42 | $ 8.56 | $ 6.50 | $ 6.78 | $ 7.65 |
Total Return A, B | 33.41% | 31.69% | (4.13)% | (11.37)% | 15.64% |
Ratios to Average Net Assets D, I | | | | | |
Expenses before reductions | 1.56% | 1.64% | 1.69% | 1.71% | 1.69% |
Expenses net of fee waivers, if any | 1.56% | 1.64% | 1.65% | 1.65% | 1.65% |
Expenses net of all reductions | 1.56% | 1.64% | 1.64% | 1.65% | 1.65% |
Net investment income (loss) | (1.02)% | (1.21)% F | (1.41)% G | (1.52)% | (1.53)% H |
Supplemental Data | | | | | |
Net assets, end of period (000 omitted) | $ 28,154 | $ 16,454 | $ 11,684 | $ 13,356 | $ 15,123 |
Portfolio turnover rate E | 82% | 99% | 130% | 73% | 132% |
A Total returns would have been lower if certain expenses had not been reduced during the applicable periods shown.
B Total returns do not include the effect of the sales charges.
C Calculated based on average shares outstanding during the period.
D Fees and expenses of any underlying Fidelity Central Funds are not included in the Fund's expense ratio. The Fund indirectly bears its proportionate share of the expenses of any underlying Fidelity Central Funds.
E Amount does not include the portfolio activity of any underlying Fidelity Central Funds.
F Investment income per share reflects a large, non-recurring dividend which amounted to $.01 per share. Excluding this non-recurring dividend, the ratio of net investment income (loss) to average net assets would have been (1.34)%.
G Investment income per share reflects a large, non-recurring dividend which amounted to $.01 per share. Excluding this non-recurring dividend, the ratio of net investment income (loss) to average net assets would have been (1.55)%.
H Investment income per share reflects a large, non-recurring dividend which amounted to $.01 per share. Excluding this non-recurring dividend, the ratio of net investment income (loss) to average net assets would have been (1.61)%.
I Expense ratios reflect operating expenses of the class. Expenses before reductions do not reflect amounts reimbursed by the investment adviser or reductions from brokerage service arrangements or reductions from other expense offset arrangements and do not represent the amount paid by the class during periods when reimbursements or reductions occur. Expenses net of fee waivers reflect expenses after reimbursement by the investment adviser but prior to reductions from brokerage service arrangements or other expense offset arrangements. Expenses net of all reductions represent the net expenses paid by the class.
J Amount represents less than $.01 per share.
See accompanying notes which are an integral part of the financial statements.
Annual Report
Financial Highlights - Class B
Years ended July 31, | 2012 | 2011 | 2010 | 2009 | 2008 |
Selected Per-Share Data | | | | | |
Net asset value, beginning of period | $ 8.09 | $ 6.17 | $ 6.47 | $ 7.34 | $ 6.88 |
Income from Investment Operations | | | | | |
Net investment income (loss) C | (.13) | (.12) F | (.12) G | (.12) | (.14) H |
Net realized and unrealized gain (loss) | 2.79 | 2.04 | (.18) | (.75) | 1.13 |
Total from investment operations | 2.66 | 1.92 | (.30) | (.87) | .99 |
Distributions from net realized gain | - | - | - | - | (.53) |
Redemption fees added to paid in capital C, J | - | - | - | - | - |
Net asset value, end of period | $ 10.75 | $ 8.09 | $ 6.17 | $ 6.47 | $ 7.34 |
Total Return A, B | 32.88% | 31.12% | (4.64)% | (11.85)% | 14.96% |
Ratios to Average Net Assets D, I | | | | | |
Expenses before reductions | 2.03% | 2.10% | 2.14% | 2.15% | 2.12% |
Expenses net of fee waivers, if any | 2.03% | 2.10% | 2.14% | 2.15% | 2.12% |
Expenses net of all reductions | 2.02% | 2.09% | 2.13% | 2.15% | 2.12% |
Net investment income (loss) | (1.49)% | (1.66)% F | (1.90)% G | (2.02)% | (2.00)% H |
Supplemental Data | | | | | |
Net assets, end of period (000 omitted) | $ 6,349 | $ 5,849 | $ 6,297 | $ 7,377 | $ 11,044 |
Portfolio turnover rate E | 82% | 99% | 130% | 73% | 132% |
A Total returns would have been lower if certain expenses had not been reduced during the applicable periods shown.
B Total returns do not include the effect of the contingent deferred sales charge.
C Calculated based on average shares outstanding during the period.
D Fees and expenses of any underlying Fidelity Central Funds are not included in the Fund's expense ratio. The Fund indirectly bears its proportionate share of the expenses of any underlying Fidelity Central Funds.
E Amount does not include the portfolio activity of any underlying Fidelity Central Funds.
F Investment income per share reflects a large, non-recurring dividend which amounted to $.01 per share. Excluding this non-recurring dividend, the ratio of net investment income (loss) to average net assets would have been (1.79)%.
G Investment income per share reflects a large, non-recurring dividend which amounted to $.01 per share. Excluding this non-recurring dividend, the ratio of net investment income (loss) to average net assets would have been (2.04)%.
H Investment income per share reflects a large, non-recurring dividend which amounted to $.01 per share. Excluding this non-recurring dividend, the ratio of net investment income (loss) to average net assets would have been (2.08)%.
I Expense ratios reflect operating expenses of the class. Expenses before reductions do not reflect amounts reimbursed by the investment adviser or reductions from brokerage service arrangements or reductions from other expense offset arrangements and do not represent the amount paid by the class during periods when reimbursements or reductions occur. Expenses net of fee waivers reflect expenses after reimbursement by the investment adviser but prior to reductions from brokerage service arrangements or other expense offset arrangements. Expenses net of all reductions represent the net expenses paid by the class.
J Amount represents less than $.01 per share.
Financial Highlights - Class C
Years ended July 31, | 2012 | 2011 | 2010 | 2009 | 2008 |
Selected Per-Share Data | | | | | |
Net asset value, beginning of period | $ 8.10 | $ 6.18 | $ 6.47 | $ 7.34 | $ 6.88 |
Income from Investment Operations | | | | | |
Net investment income (loss) C | (.13) | (.12) F | (.12) G | (.12) | (.13) H |
Net realized and unrealized gain (loss) | 2.79 | 2.04 | (.17) | (.75) | 1.12 |
Total from investment operations | 2.66 | 1.92 | (.29) | (.87) | .99 |
Distributions from net realized gain | - | - | - | - | (.53) |
Redemption fees added to paid in capital C, J | - | - | - | - | - |
Net asset value, end of period | $ 10.76 | $ 8.10 | $ 6.18 | $ 6.47 | $ 7.34 |
Total Return A, B | 32.84% | 31.07% | (4.48)% | (11.85)% | 14.96% |
Ratios to Average Net Assets D, I | | | | | |
Expenses before reductions | 2.01% | 2.10% | 2.14% | 2.15% | 2.12% |
Expenses net of fee waivers, if any | 2.01% | 2.10% | 2.14% | 2.15% | 2.12% |
Expenses net of all reductions | 2.01% | 2.09% | 2.13% | 2.15% | 2.12% |
Net investment income (loss) | (1.47)% | (1.66)% F | (1.90)% G | (2.02)% | (2.00)% H |
Supplemental Data | | | | | |
Net assets, end of period (000 omitted) | $ 31,710 | $ 15,787 | $ 11,421 | $ 12,426 | $ 13,323 |
Portfolio turnover rate E | 82% | 99% | 130% | 73% | 132% |
A Total returns would have been lower if certain expenses had not been reduced during the applicable periods shown.
B Total returns do not include the effect of the contingent deferred sales charge.
C Calculated based on average shares outstanding during the period.
D Fees and expenses of any underlying Fidelity Central Funds are not included in the Fund's expense ratio. The Fund indirectly bears its proportionate share of the expenses of any underlying Fidelity Central Funds.
E Amount does not include the portfolio activity of any underlying Fidelity Central Funds.
F Investment income per share reflects a large, non-recurring dividend which amounted to $.01 per share. Excluding this non-recurring dividend, the ratio of net investment income (loss) to average net assets would have been (1.79)%.
G Investment income per share reflects a large, non-recurring dividend which amounted to $.01 per share. Excluding this non-recurring dividend, the ratio of net investment income (loss) to average net assets would have been (2.04)%.
H Investment income per share reflects a large, non-recurring dividend which amounted to $.01 per share. Excluding this non-recurring dividend, the ratio of net investment income (loss) to average net assets would have been (2.08)%.
I Expense ratios reflect operating expenses of the class. Expenses before reductions do not reflect amounts reimbursed by the investment adviser or reductions from brokerage service arrangements or reductions from other expense offset arrangements and do not represent the amount paid by the class during periods when reimbursements or reductions occur. Expenses net of fee waivers reflect expenses after reimbursement by the investment adviser but prior to reductions from brokerage service arrangements or other expense offset arrangements. Expenses net of all reductions represent the net expenses paid by the class.
J Amount represents less than $.01 per share.
See accompanying notes which are an integral part of the financial statements.
Annual Report
Financial Highlights - Institutional Class
Years ended July 31, | 2012 | 2011 | 2010 | 2009 | 2008 |
Selected Per-Share Data | | | | | |
Net asset value, beginning of period | $ 9.10 | $ 6.87 | $ 7.12 | $ 8.00 | $ 7.37 |
Income from Investment Operations | | | | | |
Net investment income (loss) B | (.04) | (.05) E | (.06) F | (.06) | (.07) G |
Net realized and unrealized gain (loss) | 3.16 | 2.28 | (.19) | (.82) | 1.23 |
Total from investment operations | 3.12 | 2.23 | (.25) | (.88) | 1.16 |
Distributions from net realized gain | - | - | - | - | (.53) |
Redemption fees added to paid in capital B, I | - | - | - | - | - |
Net asset value, end of period | $ 12.22 | $ 9.10 | $ 6.87 | $ 7.12 | $ 8.00 |
Total Return A | 34.29% | 32.46% | (3.51)% | (11.00)% | 16.35% |
Ratios to Average Net Assets C, H | | | | | |
Expenses before reductions | .95% | 1.04% | 1.07% | 1.11% | 1.06% |
Expenses net of fee waivers, if any | .95% | 1.04% | 1.07% | 1.11% | 1.06% |
Expenses net of all reductions | .94% | 1.03% | 1.06% | 1.11% | 1.06% |
Net investment income (loss) | (.40)% | (.60)% E | (.83)% F | (.98)% | (.94)% G |
Supplemental Data | | | | | |
Net assets, end of period (000 omitted) | $ 26,772 | $ 5,903 | $ 3,008 | $ 1,901 | $ 1,117 |
Portfolio turnover rate D | 82% | 99% | 130% | 73% | 132% |
A Total returns would have been lower if certain expenses had not been reduced during the applicable periods shown.
B Calculated based on average shares outstanding during the period.
C Fees and expenses of any underlying Fidelity Central Funds are not included in the Fund's expense ratio. The Fund indirectly bears its proportionate share of the expenses of any underlying Fidelity Central Funds.
D Amount does not include the portfolio activity of any underlying Fidelity Central Funds.
E Investment income per share reflects a large, non-recurring dividend which amounted to $.01 per share. Excluding this non-recurring dividend, the ratio of net investment income (loss) to average net assets would have been (.73)%.
F Investment income per share reflects a large, non-recurring dividend which amounted to $.01 per share. Excluding this non-recurring dividend, the ratio of net investment income (loss) to average net assets would have been (.97)%.
G Investment income per share reflects a large, non-recurring dividend which amounted to $.01 per share. Excluding this non-recurring dividend, the ratio of net investment income (loss) to average net assets would have been (1.02)%.
H Expense ratios reflect operating expenses of the class. Expenses before reductions do not reflect amounts reimbursed by the investment adviser or reductions from brokerage service arrangements or reductions from other expense offset arrangements and do not represent the amount paid by the class during periods when reimbursements or reductions occur. Expenses net of fee waivers reflect expenses after reimbursement by the investment adviser but prior to reductions from brokerage service arrangements or other expense offset arrangements. Expenses net of all reductions represent the net expenses paid by the class.
I Amount represents less than $.01 per share.
See accompanying notes which are an integral part of the financial statements.
Annual Report
Fidelity Advisor Biotechnology Fund
Notes to Financial Statements
For the period ended July 31, 2012
1. Organization.
Fidelity Advisor Biotechnology Fund (the Fund) is a non-diversified fund of Fidelity Advisor Series VII (the Trust) and is authorized to issue an unlimited number of shares. The Trust is registered under the Investment Company Act of 1940, as amended (the 1940 Act), as an open-end management investment company organized as a Massachusetts business trust. The Fund offers Class A, Class T, Class C and Institutional Class shares, each of which, along with Class B shares, has equal rights as to assets and voting privileges. Effective after the close of business on September 1, 2010, Class B shares were closed to new accounts and additional purchases, except for exchanges and reinvestments. Each class has exclusive voting rights with respect to matters that affect that class. Class B shares will automatically convert to Class A shares after a holding period of seven years from the initial date of purchase. Investment income, realized and unrealized capital gains and losses, the common expenses of the Fund, and certain fund-level expense reductions, if any, are allocated on a pro-rata basis to each class based on the relative net assets of each class to the total net assets of the Fund. Each class differs with respect to transfer agent and distribution and service plan fees incurred. Certain expense reductions may also differ by class.
2. Investments in Fidelity Central Funds.
The Fund invests in Fidelity Central Funds, which are open-end investment companies available only to other investment companies and accounts managed by Fidelity Management & Research Company (FMR) and its affiliates. The Fund's Schedule of Investments lists each of the Fidelity Central Funds held as of period end, if any, as an investment of the Fund, but does not include the underlying holdings of each Fidelity Central Fund. As an Investing Fund, the Fund indirectly bears its proportionate share of the expenses of the underlying Fidelity Central Funds.
The Money Market Central Funds seek preservation of capital and current income and are managed by Fidelity Investments Money Management, Inc. (FIMM), an affiliate of FMR.
A complete unaudited list of holdings for each Fidelity Central Fund is available upon request or at the Securities and Exchange Commission (the SEC) web site at www.sec.gov. In addition, the financial statements of the Fidelity Central Funds, which are not covered by the Fund's Report of Independent Registered Public Accounting Firm, are available on the SEC web site or upon request.
3. Significant Accounting Policies.
The financial statements have been prepared in conformity with accounting principles generally accepted in the United States of America (GAAP), which require management to make certain estimates and assumptions at the date of the financial statements. Actual results could differ from those estimates. Subsequent events, if any, through the date that the financial statements were issued have been evaluated in the preparation of the financial statements. The following summarizes the significant accounting policies of the Fund:
Security Valuation. Investments are valued as of 4:00 p.m. Eastern time on the last calendar day of the period. In accordance with valuation policies and procedures approved by the Board of Trustees (the Board), the Fund attempts to obtain prices from one or more third party pricing vendor or broker to value its investments. When current market prices, quotations or rates are not readily available or reliable, securities will be fair valued in good faith by the FMR Fair Value Committee (the Committee), in accordance with procedures adopted by the Fund's Board. Factors used in determining fair value vary by security type and may include market or security specific events. The frequency with which these procedures are used cannot be predicted and they may be utilized to a significant extent. The Committee oversees the Fund's valuation policies and procedures and is responsible for approving and reporting to the Board all fair value determinations.
The Fund categorizes the inputs to valuation techniques used to value its investments into a disclosure hierarchy consisting of three levels as shown below:
Level 1 - quoted prices in active markets for identical investments
Level 2 - other significant observable inputs (including quoted prices for similar investments, interest rates, prepayment speeds, etc.)
Level 3 - unobservable inputs (including the Fund's own assumptions based on the best information available)
Valuation techniques used to value the Fund's investments by major category are as follows:
Equity securities, including restricted securities, for which market quotations are readily available, are valued at the last reported sale price or official closing price as reported by a third party pricing vendor on the primary market or exchange on which they are traded and are categorized as Level 1 in the hierarchy. In the event there were no sales during the day or closing prices are not available, securities are valued at the last quoted bid price or may be valued using the last available price and are generally categorized as Level 2 in the hierarchy. For foreign equity securities, when significant market or security specific events arise, comparisons to the valuation of American Depositary Receipts (ADRs), futures contracts, Exchange-Traded Funds (ETFs) and certain indexes as well as quoted prices for similar securities are used and are categorized as Level 2 in the hierarchy. Utilizing these techniques may result in transfers between Level 1 and Level 2. Restricted equity securities and private placements for which observable inputs are not available are valued using alternate valuation approaches, including the market approach and the income approach and are categorized as
Annual Report
Fidelity Advisor Biotechnology Fund
Notes to Financial Statements - continued
3. Significant Accounting Policies - continued
Security Valuation - continued
Level 3 in the hierarchy. The market approach generally consists of using comparable market transactions while the income approach generally consists of using the net present value of estimated future cash flows, adjusted as appropriate for liquidity, credit, market and/or other risk factors.
Investments in open-end mutual funds, including the Fidelity Central Funds, are valued at their closing net asset value each business day and are categorized as Level 1 in the hierarchy.
Changes in valuation techniques may result in transfers in or out of an assigned level within the disclosure hierarchy. The aggregate value of investments by input level, as of July 31, 2012, is included at the end of the Fund's Schedule of Investments.
Foreign Currency Translation. The Fund may use foreign currency contracts to facilitate transactions in foreign-denominated securities. Gains and losses from these transactions may arise from changes in the value of the foreign currency or if the counterparties do not perform under the contracts' terms.
Foreign-denominated assets, including investment securities, and liabilities are translated into U.S. dollars at the exchange rates at period end. Purchases and sales of investment securities, income and dividends received and expenses denominated in foreign currencies are translated into U.S. dollars at the exchange rate in effect on the transaction date.
The effects of exchange rate fluctuations on investments are included with the net realized and unrealized gain (loss) on investment securities. Other foreign currency transactions resulting in realized and unrealized gain (loss) are disclosed separately.
Investment Transactions and Income. For financial reporting purposes, the Fund's investment holdings and NAV include trades executed through the end of the last business day of the period. The NAV per share for processing shareholder transactions is calculated as of the close of business of the New York Stock Exchange (NYSE), normally 4:00 p.m. Eastern time and includes trades executed through the end of the prior business day. Gains and losses on securities sold are determined on the basis of identified cost and may include proceeds received from litigation. Dividend income is recorded on the ex-dividend date, except for certain dividends from foreign securities where the ex-dividend date may have passed, which are recorded as soon as the Fund is informed of the ex-dividend date. Non-cash dividends included in dividend income, if any, are recorded at the fair market value of the securities received. Interest income and distributions from the Fidelity Central Funds are accrued as earned. Interest income includes coupon interest and amortization of premium and accretion of discount on debt securities. Investment income is recorded net of foreign taxes withheld where recovery of such taxes is uncertain.
Expenses. Expenses directly attributable to a fund are charged to that fund. Expenses attributable to more than one fund are allocated among the respective funds on the basis of relative net assets or other appropriate methods. Expense estimates are accrued in the period to which they relate and adjustments are made when actual amounts are known.
Income Tax Information and Distributions to Shareholders. Each year, the Fund intends to qualify as a regulated investment company under Subchapter M of the Internal Revenue Code, including distributing substantially all of its taxable income and realized gains. As a result, no provision for income taxes is required. As of July 31, 2012, the Fund did not have any unrecognized tax benefits in the financial statements; nor is the Fund aware of any tax positions for which it is reasonably possible that the total amounts of unrecognized tax benefits will significantly change in the next twelve months. The Fund files a U.S. federal tax return, in addition to state and local tax returns as required. A fund's federal income tax returns are subject to examination by the Internal Revenue Service (IRS) for a period of three fiscal years after they are filed. State and local tax returns may be subject to examination for an additional fiscal year depending on the jurisdiction. Foreign taxes are provided for based on the Fund's understanding of the tax rules and rates that exist in the foreign markets in which it invests.
Distributions are declared and recorded on the ex-dividend date. Income dividends and capital gain distributions are declared separately for each class. Income and capital gain distributions are determined in accordance with income tax regulations, which may differ from GAAP. In addition, the Fund claimed a portion of the payment made to redeeming shareholders as a distribution for income tax purposes.
Capital accounts within the financial statements are adjusted for permanent book-tax differences. These adjustments have no impact on net assets or the results of operations. Temporary book-tax differences will reverse in a subsequent period.
Book-tax differences are primarily due to foreign currency transactions, net operating losses, capital loss carryforwards and losses deferred due to wash sales and excise tax regulations.
Annual Report
3. Significant Accounting Policies - continued
Income Tax Information and Distributions to Shareholders - continued
The federal tax cost of investment securities and unrealized appreciation (depreciation) as of period end were as follows:
Gross unrealized appreciation | $ 39,867,950 |
Gross unrealized depreciation | (8,813,285) |
Net unrealized appreciation (depreciation) on securities and other investments | $ 31,054,665 |
| |
Tax Cost | $ 156,881,265 |
The tax-based components of distributable earnings as of period end were as follows:
Undistributed long-term capital gain | $ 10,398,494 |
Net unrealized appreciation (depreciation) | $ 31,054,665 |
Short-Term Trading (Redemption) Fees. Shares held by investors in the Fund less than 30 days are subject to a redemption fee equal to .75% of the net asset value of shares redeemed. All redemption fees, which reduce the proceeds of the shareholder redemption, are retained by the Fund and accounted for as an addition to paid in capital.
New Accounting Pronouncement. In December 2011, the Financial Accounting Standards Board issued Accounting Standard Update No. 2011-11, Disclosures about Offsetting Assets and Liabilities. The update creates new disclosure requirements requiring entities to disclose both gross and net information for derivatives and other financial instruments that are either offset in the Statement of Assets and Liabilities or subject to an enforceable master netting arrangement or similar agreement. The disclosure requirements are effective for interim and annual reporting periods beginning on or after January 1, 2013. Management is currently evaluating the impact of the update's adoption on the Fund's financial statement disclosures.
4. Operating Policies.
Restricted Securities. The Fund may invest in securities that are subject to legal or contractual restrictions on resale. These securities generally may be resold in transactions exempt from registration or to the public if the securities are registered. Disposal of these securities may involve time-consuming negotiations and expense, and prompt sale at an acceptable price may be difficult. Information regarding restricted securities is included at the end of the Fund's Schedule of Investments.
5. Purchases and Sales of Investments.
Purchases and sales of securities, other than short-term securities, aggregated $133,762,323 and $78,603,407, respectively.
6. Fees and Other Transactions with Affiliates.
Management Fee. FMR and its affiliates provide the Fund with investment management related services for which the Fund pays a monthly management fee. The management fee is the sum of an individual fund fee rate that is based on an annual rate of .30% of the Fund's average net assets and an annualized group fee rate that averaged .26% during the period. The group fee rate is based upon the average net assets of all the mutual funds advised by FMR. The group fee rate decreases as assets under management increase and increases as assets under management decrease. For the period, the total annual management fee rate was .56% of the Fund's average net assets.
Distribution and Service Plan Fees. In accordance with Rule 12b-1 of the 1940 Act, the Fund has adopted separate Distribution and Service Plans for each class of shares. Certain classes pay Fidelity Distributors Corporation (FDC), an affiliate of FMR, separate Distribution and Service Fees, each of which is based on an annual percentage of each class' average net assets. In addition, FDC may pay financial intermediaries for selling shares of the Fund and providing shareholder support services. For the period, the Distribution and Service Fee rates, total fees and amounts retained by FDC were as follows:
| Distribution
Fee | Service
Fee | Total Fees | Retained
by FDC |
Class A | -% | .25% | $ 99,575 | $ 1,513 |
Class T | .25% | .25% | 100,188 | 514 |
Class B | .75% | .25% | 56,537 | 42,419 |
Class C | .75% | .25% | 198,430 | 42,757 |
| | | $ 454,730 | $ 87,203 |
Annual Report
Fidelity Advisor Biotechnology Fund
Notes to Financial Statements - continued
6. Fees and Other Transactions with Affiliates - continued
Sales Load. FDC may receive a front-end sales charge of up to 5.75% for selling Class A shares and 3.50% for selling Class T shares, some of which is paid to financial intermediaries for selling shares of the Fund. Depending on the holding period, FDC may receive contingent deferred sales charges levied on Class A, Class T, Class B, and Class C redemptions. The deferred sales charges range from 5.00% to 1.00% for Class B shares, 1.00% for Class C shares, 1.00% for certain purchases of Class A shares and .25% for certain purchases of Class T shares.
For the period, sales charge amounts retained by FDC were as follows:
| Retained
by FDC |
Class A | $ 69,588 |
Class T | 16,174 |
Class B* | 9,181 |
Class C* | 2,774 |
| $ 97,717 |
* When Class B and Class C shares are initially sold, FDC pays commissions from its own resources to financial intermediaries through which the sales are made.
Transfer Agent Fees. Fidelity Investments Institutional Operations Company, Inc. (FIIOC), an affiliate of FMR, is the transfer, dividend disbursing and shareholder servicing agent for each class of the Fund. FIIOC receives account fees and asset-based fees that vary according to the account size and type of account of the shareholders of the respective classes of the Fund. FIIOC pays for typesetting, printing and mailing of shareholder reports, except proxy statements. For the period, transfer agent fees for each class were as follows:
| Amount | % of
Average
Net Assets |
Class A | $ 117,729 | .30 |
Class T | 66,567 | .33 |
Class B | 17,003 | .30 |
Class C | 55,588 | .28 |
Institutional Class | 21,527 | .22 |
| $ 278,414 | |
Accounting and Security Lending Fees. Fidelity Service Company, Inc. (FSC), an affiliate of FMR, maintains the Fund's accounting records. The accounting fee is based on the level of average net assets for each month. Under a separate contract, FSC administers the security lending program. The security lending fee is based on the number and duration of lending transactions.
Brokerage Commissions. The Fund placed a portion of its portfolio transactions with brokerage firms which are affiliates of the investment adviser. The commissions paid to these affiliated firms were $1,712 for the period.
7. Committed Line of Credit.
The Fund participates with other funds managed by FMR or an affiliate in a $4.25 billion credit facility (the "line of credit") to be utilized for temporary or emergency purposes to fund shareholder redemptions or for other short-term liquidity purposes. The Fund has agreed to pay commitment fees on its pro-rata portion of the line of credit, which amounted to $248 and is reflected in Miscellaneous expenses on the Statement of Operations. During the period, there were no borrowings on this line of credit.
8. Security Lending.
The Fund lends portfolio securities through a lending agent from time to time in order to earn additional income. For equity securities, a lending agent is used and may loan securities to certain qualified borrowers, including Fidelity Capital Markets (FCM), a broker-dealer affiliated with the Fund. On the settlement date of the loan, the Fund receives collateral (in the form of U.S. Treasury obligations, letters of credit and/or cash) against the loaned securities and maintains collateral in an amount not less than 100% of the market value of the loaned securities during the period of the loan. The market value of the loaned securities is determined at the close of business of the Fund and any additional required collateral is delivered to the Fund on the next business day. If the borrower defaults on its obligation to return the securities loaned because of insolvency or other reasons, a fund could experience delays and costs in recovering the securities loaned or in gaining access to the collateral. Any cash collateral received is invested in the Fidelity Securities Lending Cash Central Fund. The value of loaned securities and cash collateral at period end are disclosed on the Fund's Statement of Assets and Liabilities. The value of securities loaned to FCM at period end was $244,641. Security lending income represents the income earned on investing cash collateral, less rebates paid to borrowers and any lending agent fees associated with the loan, plus any premium payments received for lending certain types of securities. Security lending income is presented in the Statement of Operations as a component of income from Fidelity Central Funds, and includes $5,763 from securities loaned to FCM.
Annual Report
9. Expense Reductions.
Many of the brokers with whom FMR places trades on behalf of the Fund provided services to the Fund in addition to trade execution. These services included payments of certain expenses on behalf of the Fund totaling $3,767 for the period.
10. Share Transactions.
Transactions for each class of shares were as follows:
| Shares | Dollars |
Years ended July 31, | 2012 | 2011 | 2012 | 2011 |
Class A | | | | |
Shares sold | 4,301,187 | 1,294,694 | $ 43,628,166 | $ 10,912,748 |
Shares redeemed | (1,928,092) | (838,372) | (17,472,965) | (6,529,914) |
Net increase (decrease) | 2,373,095 | 456,322 | $ 26,155,201 | $ 4,382,834 |
Class T | | | | |
Shares sold | 976,676 | 489,230 | $ 9,361,129 | $ 3,897,385 |
Shares redeemed | (434,679) | (364,605) | (3,953,170) | (2,767,714) |
Net increase (decrease) | 541,997 | 124,625 | $ 5,407,959 | $ 1,129,671 |
Class B | | | | |
Shares sold | 165,361 | 84,075 | $ 1,482,467 | $ 609,091 |
Shares redeemed | (297,605) | (381,301) | (2,590,187) | (2,636,098) |
Net increase (decrease) | (132,244) | (297,226) | $ (1,107,720) | $ (2,027,007) |
Class C | | | | |
Shares sold | 1,520,333 | 539,125 | $ 14,380,183 | $ 4,217,149 |
Shares redeemed | (522,745) | (438,419) | (4,501,065) | (3,130,462) |
Net increase (decrease) | 997,588 | 100,706 | $ 9,879,118 | $ 1,086,687 |
Institutional Class | | | | |
Shares sold | 2,252,478 | 436,761 | $ 24,903,066 | $ 3,719,527 |
Shares redeemed | (710,454) | (225,982) | (7,235,208) | (1,769,416) |
Net increase (decrease) | 1,542,024 | 210,779 | $ 17,667,858 | $ 1,950,111 |
11. Other.
The Fund's organizational documents provide former and current trustees and officers with a limited indemnification against liabilities arising in connection with the performance of their duties to the Fund. In the normal course of business, the Fund may also enter into contracts that provide general indemnifications. The Fund's maximum exposure under these arrangements is unknown as this would be dependent on future claims that may be made against the Fund. The risk of material loss from such claims is considered remote.
Annual Report
Fidelity Advisor Communications Equipment Fund - Institutional Class
Performance: The Bottom Line
Average annual total return reflects the change in the value of an investment, assuming reinvestment of the class' distributions from dividend income and capital gains (the profits earned upon the sale of securities that have grown in value, if any) and assuming a constant rate of performance each year. The $10,000 table and the fund's returns do not reflect the deduction of taxes that a shareholder would pay on fund distributions or the redemption of fund shares. During periods of reimbursement by Fidelity, a fund's total return will be greater than it would be had the reimbursement not occurred. How a fund did yesterday is no guarantee of how it will do tomorrow.
Average Annual Total Returns
Periods ended July 31, 2012 | Past 1
year | Past 5
years | Past 10
years |
Institutional Class A | -18.66% | -3.09% | 7.56% |
A Prior to October 1, 2006, Fidelity Advisor Communications Equipment Fund operated under certain different investment policies. The historical performance for the fund may not represent its current investment policies.
$10,000 Over 10 Years
Let's say hypothetically that $10,000 was invested in Fidelity Advisor Communications Equipment Fund - Institutional Class on July 31, 2002. The chart shows how the value of your investment would have changed, and also shows how the S&P 500 Index performed over the same period.
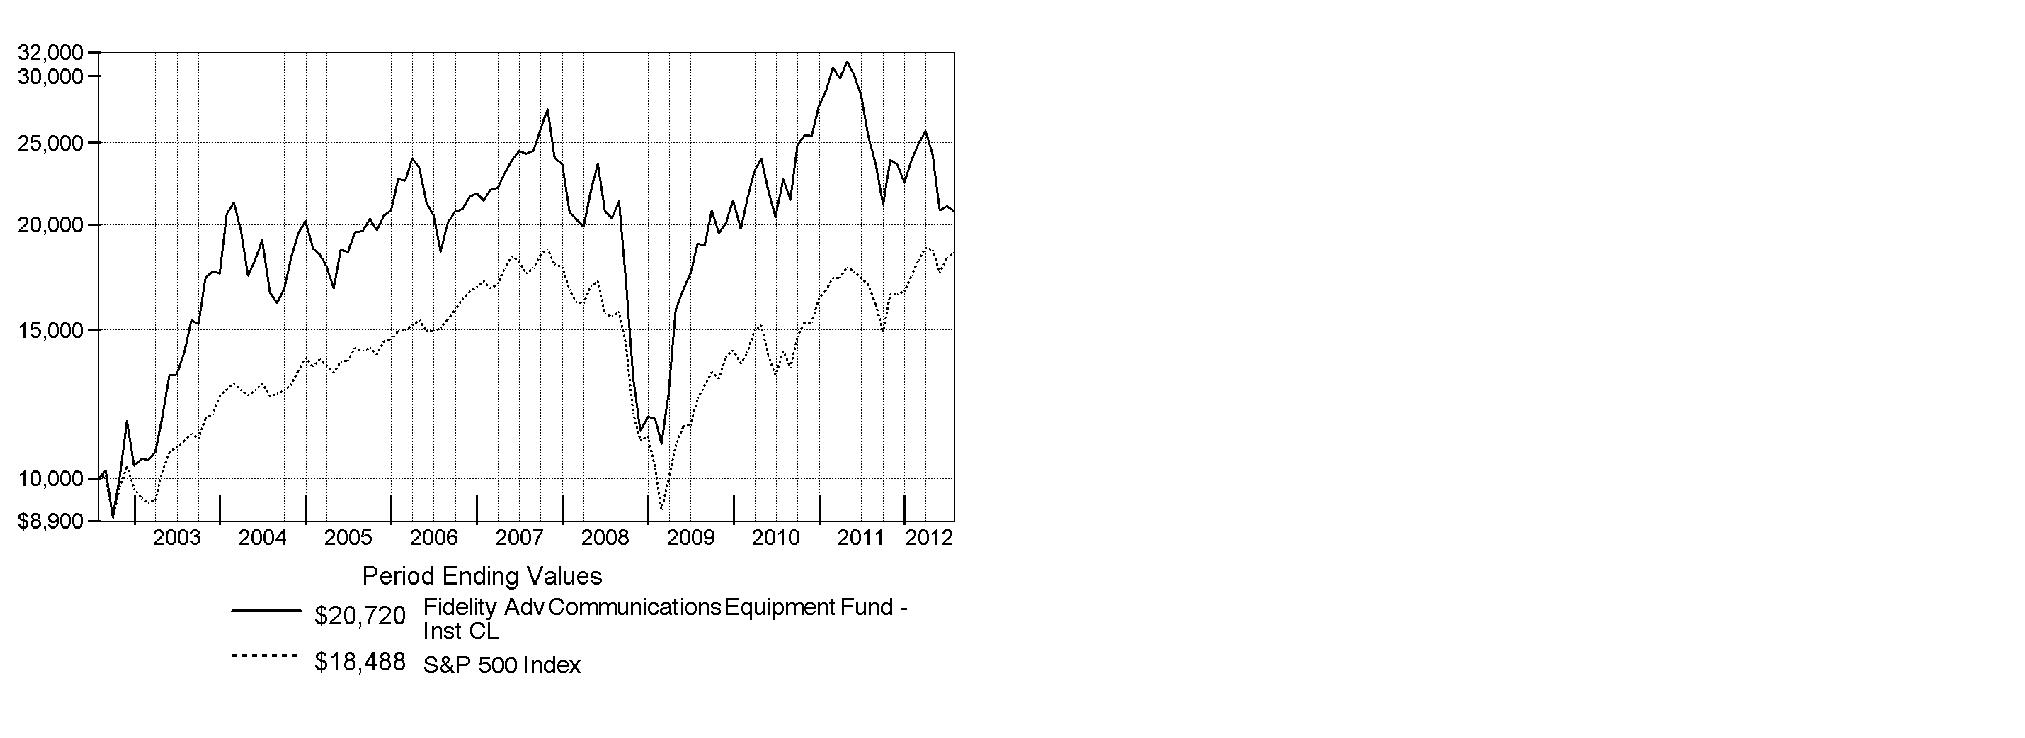
Annual Report
Fidelity Advisor Communications Equipment Fund
Market Recap: Major U.S. equity benchmarks posted solid gains for the year ending July 31, 2012, amid an uncertain investment environment. The broad-based S&P 500® Index returned 9.13%, while the blue-chip-laden Dow Jones Industrial AverageSM and technology-heavy Nasdaq Composite® Index gained 10.12% and 7.83%, respectively. Volatility spiked during the period's first half, as equities plummeted late last summer on Europe's debt woes, political wrangling over the U.S. debt ceiling and the sovereign credit-rating downgrade that followed. By October, a seemingly improved U.S. economy rejuvenated stocks, paving the way for major equity benchmarks to post their best first-quarter performance since 1998. However, more eurozone trouble, signs that the U.S. economy had turned sluggish and a slowdown in China caused stocks to slip in May, before a new wave of optimism took hold in June and July. Within the S&P 500®, more-defensive sectors such as telecommunication services (+30%) and consumer staples (+20%) fared best, while materials and energy significantly underperformed, returning -5%. Small- and mid-cap stocks trailed their less-volatile large-cap counterparts, with the Russell 2000® Index adding 0.19% and the Russell Midcap® Index rising 2.28%. Given turmoil and local currency weakness in Europe, foreign developed-markets stocks lost ground, with the MSCI® EAFE® Index returning -11.32%.
Comments from Charlie Chai, Co-Portfolio Manager of Fidelity Advisor® Communications Equipment Fund, and Ali Khan, who became Co-Portfolio Manager on January 12, 2012: For the year, the fund's Institutional Class shares returned -18.66%, considerably trailing the -14.98% return of the S&P® Custom Communications Equipment Index and also lagging the S&P 500®. Versus its industry benchmark, stock selection in communications equipment was responsible for most of the fund's underperformance, while several out-of-benchmark positions in application software also hurt. Noteworthy individual detractors included high-definition videoconferencing equipment provider Polycom. Downwardly revised financial guidance dinged the stock in October 2011 and April 2012. Also hampering results was a sizable out-of-index stake in AsiaInfo-Linkage, a Chinese provider of telecommunications software and technology security products. Here, too, our position was hurt by repeated disappointments in the company's quarterly financial results, and I sold this stock in January. The fund's early-period underweighting in handset maker and index component Motorola Mobility Holdings was counterproductive, given the stock's surge following Google's August 2011 offer to purchase the company. I sold the position to nail down profits. Conversely, out-of-benchmark representation in semiconductors and wireless telecommunication services helped curb the fund's loss. Sizable underexposure to Canadian smartphone maker Research In Motion paid off, as the company continued to lose market share to its competitors. Likewise, a minimal stake in Nokia was the right call, as this former market leader in the handset space struggled with staying competitive.
The views expressed above reflect those of the portfolio manager(s) only through the end of the period as stated on the cover of this report and do not necessarily represent the views of Fidelity or any other person in the Fidelity organization. Any such views are subject to change at any time based upon market or other conditions and Fidelity disclaims any responsibility to update such views. These views may not be relied on as investment advice and, because investment decisions for a Fidelity fund are based on numerous factors, may not be relied on as an indication of trading intent on behalf of any Fidelity fund.
Annual Report
Fidelity Advisor Communications Equipment Fund
As a shareholder of the Fund, you incur two types of costs: (1) transaction costs, including sales charges (loads) on purchase payments or redemption proceeds, redemption fees and (2) ongoing costs, including management fees, distribution and/or service (12b-1) fees and other Fund expenses. This Example is intended to help you understand your ongoing costs (in dollars) of investing in the Fund and to compare these costs with the ongoing costs of investing in other mutual funds.
The Example is based on an investment of $1,000 invested at the beginning of the period and held for the entire period (February 1, 2012 to July 31, 2012).
Actual Expenses
The first line of the accompanying table for each class of the Fund provides information about actual account values and actual expenses. You may use the information in this line, together with the amount you invested, to estimate the expenses that you paid over the period. Simply divide your account value by $1,000.00 (for example, an $8,600 account value divided by $1,000.00 = 8.6), then multiply the result by the number in the first line for a class of the Fund under the heading entitled "Expenses Paid During Period" to estimate the expenses you paid on your account during this period. In addition, the Fund, as a shareholder in the underlying Fidelity Central Funds, will indirectly bear its pro-rata share of the fees and expenses incurred by the underlying Fidelity Central Funds. These fees and expenses are not included in the Fund's annualized expense ratio used to calculate the expense estimate in the table below.
Hypothetical Example for Comparison Purposes
The second line of the accompanying table for each class of the Fund provides information about hypothetical account values and hypothetical expenses based on a Class' actual expense ratio and an assumed rate of return of 5% per year before expenses, which is not the Class' actual return. The hypothetical account values and expenses may not be used to estimate the actual ending account balance or expenses you paid for the period. You may use this information to compare the ongoing costs of investing in the Fund and other funds. To do so, compare this 5% hypothetical example with the 5% hypothetical examples that appear in the shareholder reports of the other funds. In addition, the Fund, as a shareholder in the underlying Fidelity Central Funds, will indirectly bear its pro-rata share of the fees and expenses incurred by the underlying Fidelity Central Funds. These fees and expenses are not included in the Fund's annualized expense ratio used to calculate the expense estimate in the table below.
Please note that the expenses shown in the table are meant to highlight your ongoing costs only and do not reflect any transaction costs. Therefore, the second line of the table is useful in comparing ongoing costs only, and will not help you determine the relative total costs of owning different funds. In addition, if these transactional costs were included, your costs would have been higher.
| Annualized
Expense Ratio | Beginning
Account Value
February 1, 2012 | Ending
Account Value
July 31, 2012 | Expenses Paid
During Period*
February 1, 2012
to July 31, 2012 |
Class A | 1.40% | | | |
Actual | | $ 1,000.00 | $ 867.30 | $ 6.50 |
HypotheticalA | | $ 1,000.00 | $ 1,017.90 | $ 7.02 |
Class T | 1.65% | | | |
Actual | | $ 1,000.00 | $ 866.90 | $ 7.66 |
HypotheticalA | | $ 1,000.00 | $ 1,016.66 | $ 8.27 |
Class B | 2.15% | | | |
Actual | | $ 1,000.00 | $ 864.00 | $ 9.96 |
HypotheticalA | | $ 1,000.00 | $ 1,014.17 | $ 10.77 |
Class C | 2.15% | | | |
Actual | | $ 1,000.00 | $ 865.00 | $ 9.97 |
HypotheticalA | | $ 1,000.00 | $ 1,014.17 | $ 10.77 |
Institutional Class | 1.15% | | | |
Actual | | $ 1,000.00 | $ 868.90 | $ 5.34 |
HypotheticalA | | $ 1,000.00 | $ 1,019.14 | $ 5.77 |
A 5% return per year before expenses
* Expenses are equal to each Class' annualized expense ratio, multiplied by the average account value over the period, multiplied by 182/366 (to reflect the one-half year period).
Annual Report
Fidelity Advisor Communications Equipment Fund
Investment Changes (Unaudited)
Top Ten Stocks as of July 31, 2012 |
| % of fund's
net assets | % of fund's net assets
6 months ago |
QUALCOMM, Inc. | 21.7 | 17.2 |
Cisco Systems, Inc. | 17.1 | 20.5 |
Telefonaktiebolaget LM Ericsson (B Shares) sponsored ADR | 5.5 | 4.9 |
Juniper Networks, Inc. | 4.8 | 4.4 |
Motorola Solutions, Inc. | 3.9 | 3.4 |
Brocade Communications Systems, Inc. | 3.5 | 3.1 |
Riverbed Technology, Inc. | 2.8 | 2.1 |
Polycom, Inc. | 2.6 | 4.1 |
Harris Corp. | 2.2 | 2.5 |
Analog Devices, Inc. | 2.1 | 1.5 |
| 66.2 | |
Top Industries (% of fund's net assets) |
As of July 31, 2012 |
| Communications Equipment | 86.0% | |
| Semiconductors & Semiconductor Equipment | 5.5% | |
| Electronic Equipment & Components | 4.6% | |
| Computers & Peripherals | 0.7% | |
| Software | 0.5% | |
| All Others* | 2.7% | |

As of January 31, 2012 |
| Communications Equipment | 83.7% | |
| Semiconductors & Semiconductor Equipment | 6.4% | |
| Electronic Equipment & Components | 2.5% | |
| Software | 2.4% | |
| Internet Software & Services | 2.2% | |
| All Others* | 2.8% | |

* Includes short-term investments and net other assets. |
Annual Report
Fidelity Advisor Communications Equipment Fund
Investments July 31, 2012
Showing Percentage of Net Assets
Common Stocks - 97.9% |
| Shares | | Value |
COMMUNICATIONS EQUIPMENT - 86.0% |
Communications Equipment - 86.0% |
Acme Packet, Inc. (a)(d) | 8,221 | | $ 130,303 |
ADTRAN, Inc. | 8,900 | | 192,062 |
Alcatel-Lucent SA sponsored ADR (a)(d) | 27,157 | | 29,873 |
Aruba Networks, Inc. (a)(d) | 11,840 | | 167,891 |
Brocade Communications Systems, Inc. (a) | 70,159 | | 348,690 |
Ciena Corp. (a) | 2,100 | | 33,663 |
Cisco Systems, Inc. | 105,824 | | 1,687,893 |
Comtech Telecommunications Corp. | 4,900 | | 133,868 |
Emulex Corp. (a) | 5,300 | | 34,291 |
F5 Networks, Inc. (a) | 1,665 | | 155,478 |
Finisar Corp. (a) | 13,859 | | 172,267 |
Harris Corp. | 5,300 | | 220,745 |
Infinera Corp. (a) | 18,200 | | 100,464 |
InterDigital, Inc. | 3,700 | | 101,010 |
JDS Uniphase Corp. (a) | 8,300 | | 81,672 |
Juniper Networks, Inc. (a) | 26,888 | | 471,347 |
Motorola Solutions, Inc. | 7,847 | | 379,324 |
NETGEAR, Inc. (a) | 5,300 | | 183,539 |
Nokia Corp. sponsored ADR (d) | 82,505 | | 198,837 |
Plantronics, Inc. | 2,600 | | 85,332 |
Polycom, Inc. (a) | 29,799 | | 260,443 |
QUALCOMM, Inc. | 35,781 | | 2,135,410 |
Research In Motion Ltd. (a)(d) | 6,400 | | 45,760 |
Riverbed Technology, Inc. (a) | 15,358 | | 270,915 |
Sycamore Networks, Inc. (a) | 5,400 | | 76,950 |
Telefonaktiebolaget LM Ericsson (B Shares) sponsored ADR (d) | 58,820 | | 544,085 |
ViaSat, Inc. (a) | 4,300 | | 164,690 |
Wi-Lan, Inc. | 12,400 | | 62,937 |
| | 8,469,739 |
COMPUTERS & PERIPHERALS - 0.7% |
Computer Hardware - 0.7% |
Apple, Inc. | 54 | | 32,981 |
Super Micro Computer, Inc. (a) | 2,500 | | 31,025 |
| | 64,006 |
ELECTRICAL EQUIPMENT - 0.3% |
Electrical Components & Equipment - 0.3% |
Prysmian SpA | 2,100 | | 33,771 |
ELECTRONIC EQUIPMENT & COMPONENTS - 4.6% |
Electronic Components - 0.6% |
Vishay Intertechnology, Inc. (a) | 5,900 | | 58,233 |
Electronic Manufacturing Services - 4.0% |
Fabrinet (a) | 3,700 | | 49,136 |
Flextronics International Ltd. (a) | 25,000 | | 160,250 |
TE Connectivity Ltd. | 5,500 | | 181,555 |
| | 390,941 |
TOTAL ELECTRONIC EQUIPMENT & COMPONENTS | | 449,174 |
|
| Shares | | Value |
MEDIA - 0.3% |
Advertising - 0.3% |
Digital Generation, Inc. (a) | 3,200 | | $ 34,112 |
SEMICONDUCTORS & SEMICONDUCTOR EQUIPMENT - 5.5% |
Semiconductor Equipment - 0.7% |
ASML Holding NV | 1,200 | | 69,000 |
Semiconductors - 4.8% |
Altera Corp. | 3,200 | | 113,440 |
Analog Devices, Inc. | 5,200 | | 203,216 |
GSI Technology, Inc. (a) | 14,600 | | 69,934 |
ON Semiconductor Corp. (a) | 5,200 | | 36,088 |
Texas Instruments, Inc. | 1,900 | | 51,756 |
| | 474,434 |
TOTAL SEMICONDUCTORS & SEMICONDUCTOR EQUIPMENT | | 543,434 |
SOFTWARE - 0.5% |
Application Software - 0.2% |
BroadSoft, Inc. (a)(d) | 900 | | 22,095 |
Systems Software - 0.3% |
Allot Communications Ltd. (a) | 1,000 | | 24,580 |
TOTAL SOFTWARE | | 46,675 |
TOTAL COMMON STOCKS (Cost $11,040,516) |
9,640,911
|
Money Market Funds - 9.6% |
| | | |
Fidelity Cash Central Fund, 0.17% (b) | 64,744 | | 64,744 |
Fidelity Securities Lending Cash Central Fund, 0.18% (b)(c) | 879,850 | | 879,850 |
TOTAL MONEY MARKET FUNDS (Cost $944,594) |
944,594
|
TOTAL INVESTMENT PORTFOLIO - 107.5% (Cost $11,985,110) | | 10,585,505 |
NET OTHER ASSETS (LIABILITIES) - (7.5)% | | (741,969) |
NET ASSETS - 100% | $ 9,843,536 |
Legend |
(a) Non-income producing |
(b) Affiliated fund that is available only to investment companies and other accounts managed by Fidelity Investments. The rate quoted is the annualized seven-day yield of the fund at period end. A complete unaudited listing of the fund's holdings as of its most recent quarter end is available upon request. In addition, each Fidelity Central Fund's financial statements, which are not covered by the Fund's Report of Independent Registered Public Accounting Firm, are available on the SEC's website or upon request. |
(c) Investment made with cash collateral received from securities on loan. |
(d) Security or a portion of the security is on loan at period end. |
Affiliated Central Funds |
Information regarding fiscal year to date income earned by the Fund from investments in Fidelity Central Funds is as follows: |
Fund | Income earned |
Fidelity Cash Central Fund | $ 332 |
Fidelity Securities Lending Cash Central Fund | 32,119 |
Total | $ 32,451 |
Other Information |
All investments are categorized as Level 1 under the Fair Value Hierarchy. The inputs or methodology used for valuing securities may not be an indication of the risk associated with investing in those securities. For more information on valuation inputs, please refer to the Security Valuation section in the accompanying Notes to Financial Statements. |
Distribution of investments by country or territory of incorporation, as a percentage of total net assets, is as follows. (Unaudited) |
United States of America | 85.8% |
Sweden | 5.5% |
Finland | 2.0% |
Switzerland | 1.9% |
Singapore | 1.6% |
Canada | 1.1% |
Others (Individually Less Than 1%) | 2.1% |
| 100.0% |
See accompanying notes which are an integral part of the financial statements.
Annual Report
Fidelity Advisor Communications Equipment Fund
Statement of Assets and Liabilities
| July 31, 2012 |
| | |
Assets | | |
Investment in securities, at value (including securities loaned of $873,114) - See accompanying schedule: Unaffiliated issuers (cost $11,040,516) | $ 9,640,911 | |
Fidelity Central Funds (cost $944,594) | 944,594 | |
Total Investments (cost $11,985,110) | | $ 10,585,505 |
Receivable for investments sold | | 148,965 |
Receivable for fund shares sold | | 1,572 |
Dividends receivable | | 2,472 |
Distributions receivable from Fidelity Central Funds | | 220 |
Receivable from investment adviser for expense reductions | | 2,418 |
Other receivables | | 53,295 |
Total assets | | 10,794,447 |
| | |
Liabilities | | |
Payable for investments purchased | $ 10,390 | |
Payable for fund shares redeemed | 13,746 | |
Accrued management fee | 4,556 | |
Distribution and service plan fees payable | 4,165 | |
Other affiliated payables | 2,938 | |
Other payables and accrued expenses | 35,266 | |
Collateral on securities loaned, at value | 879,850 | |
Total liabilities | | 950,911 |
| | |
Net Assets | | $ 9,843,536 |
Net Assets consist of: | | |
Paid in capital | | $ 13,003,035 |
Accumulated net investment loss | | (10,185) |
Accumulated undistributed net realized gain (loss) on investments and foreign currency transactions | | (1,749,709) |
Net unrealized appreciation (depreciation) on investments | | (1,399,605) |
Net Assets | | $ 9,843,536 |
Statement of Assets and Liabilities - continued
| July 31, 2012 |
| | |
Calculation of Maximum Offering Price Class A:
Net Asset Value and redemption price per share ($3,567,813 ÷ 462,689 shares) | | $ 7.71 |
| | |
Maximum offering price per share (100/94.25 of $7.71) | | $ 8.18 |
Class T:
Net Asset Value and redemption price per share ($2,842,784 ÷ 379,670 shares) | | $ 7.49 |
| | |
Maximum offering price per share (100/96.50 of $7.49) | | $ 7.76 |
Class B:
Net Asset Value and offering price per share ($569,752 ÷ 80,796 shares)A | | $ 7.05 |
| | |
Class C:
Net Asset Value and offering price per share ($2,142,039 ÷ 303,902 shares)A | | $ 7.05 |
| | |
Institutional Class:
Net Asset Value, offering price and redemption price per share ($721,148 ÷ 90,745 shares) | | $ 7.95 |
A Redemption price per share is equal to net asset value less any applicable contingent deferred sales charge.
See accompanying notes which are an integral part of the financial statements.
Annual Report
Fidelity Advisor Communications Equipment Fund
Financial Statements - continued
Statement of Operations
| Year ended July 31, 2012 |
| | |
Investment Income | | |
Dividends | | $ 134,337 |
Interest | | 22 |
Income from Fidelity Central Funds (including $32,119 from security lending) | | 32,451 |
Total income | | 166,810 |
| | |
Expenses | | |
Management fee | $ 75,608 | |
Transfer agent fees | 43,466 | |
Distribution and service plan fees | 69,611 | |
Accounting and security lending fees | 5,469 | |
Custodian fees and expenses | 8,977 | |
Independent trustees' compensation | 97 | |
Registration fees | 53,919 | |
Audit | 46,230 | |
Legal | 70 | |
Miscellaneous | 200 | |
Total expenses before reductions | 303,647 | |
Expense reductions | (79,648) | 223,999 |
Net investment income (loss) | | (57,189) |
Realized and Unrealized Gain (Loss) Net realized gain (loss) on: | | |
Investment securities: | | |
Unaffiliated issuers | (1,571,442) | |
Foreign currency transactions | (537) | |
Total net realized gain (loss) | | (1,571,979) |
Change in net unrealized appreciation (depreciation) on investment securities | | (2,005,379) |
Net gain (loss) | | (3,577,358) |
Net increase (decrease) in net assets resulting from operations | | $ (3,634,547) |
Statement of Changes in Net Assets
| Year ended
July 31,
2012 | Year ended
July 31,
2011 |
Increase (Decrease) in Net Assets | | |
Operations | | |
Net investment income (loss) | $ (57,189) | $ (190,541) |
Net realized gain (loss) | (1,571,979) | 1,590,280 |
Change in net unrealized appreciation (depreciation) | (2,005,379) | (1,230,510) |
Net increase (decrease) in net assets resulting from operations | (3,634,547) | 169,229 |
Distributions to shareholders from net realized gain | (401,208) | - |
Share transactions - net increase (decrease) | (9,551,912) | 8,972,466 |
Redemption fees | 639 | 1,851 |
Total increase (decrease) in net assets | (13,587,028) | 9,143,546 |
| | |
Net Assets | | |
Beginning of period | 23,430,564 | 14,287,018 |
End of period (including accumulated net investment loss of $10,185 and accumulated net investment loss of $2,793, respectively) | $ 9,843,536 | $ 23,430,564 |
See accompanying notes which are an integral part of the financial statements.
Annual Report
Financial Highlights - Class A
Years ended July 31, | 2012 | 2011 | 2010 | 2009 | 2008 |
Selected Per-Share Data | | | | | |
Net asset value, beginning of period | $ 9.73 | $ 8.67 | $ 7.28 | $ 7.82 | $ 9.49 |
Income from Investment Operations | | | | | |
Net investment income (loss) C | (.01) | (.06) | (.11) | .02 F | (.08) |
Net realized and unrealized gain (loss) | (1.81) | 1.12 | 1.50 | (.56) | (1.45) |
Total from investment operations | (1.82) | 1.06 | 1.39 | (.54) | (1.53) |
Distributions from net realized gain | (.20) | - | - | - | (.14) |
Redemption fees added to paid in capital C, H | - | - | - | - | - |
Net asset value, end of period | $ 7.71 | $ 9.73 | $ 8.67 | $ 7.28 | $ 7.82 |
Total Return A, B | (18.88)% | 12.23% | 19.09% | (6.91)% | (16.43)% |
Ratios to Average Net Assets D, G | | | | | |
Expenses before reductions | 1.96% | 1.64% | 1.90% | 3.15% | 2.25% |
Expenses net of fee waivers, if any | 1.40% | 1.40% | 1.40% | 1.40% | 1.40% |
Expenses net of all reductions | 1.39% | 1.39% | 1.38% | 1.40% | 1.39% |
Net investment income (loss) | (.16)% | (.60)% | (1.32)% | .26% F | (.91)% |
Supplemental Data | | | | | |
Net assets, end of period (000 omitted) | $ 3,568 | $ 8,787 | $ 4,860 | $ 3,476 | $ 2,459 |
Portfolio turnover rate E | 79% | 101% | 106% | 97% | 63% |
A Total returns would have been lower if certain expenses had not been reduced during the applicable periods shown.
B Total returns do not include the effect of the sales charges.
C Calculated based on average shares outstanding during the period.
D Fees and expenses of any underlying Fidelity Central Funds are not included in the Fund's expense ratio. The Fund indirectly bears its proportionate share of the expenses of any underlying Fidelity Central Funds.
E Amount does not include the portfolio activity of any underlying Fidelity Central Funds.
F Investment income per share reflects a large, non-recurring dividend which amounted to $.07 per share. Excluding this non-recurring dividend, the ratio of net investment income (loss) to average net assets would have been (.88)%.
G Expense ratios reflect operating expenses of the class. Expenses before reductions do not reflect amounts reimbursed by the investment adviser or reductions from brokerage service arrangements or reductions from other expense offset arrangements and do not represent the amount paid by the class during periods when reimbursements or reductions occur. Expenses net of fee waivers reflect expenses after reimbursement by the investment adviser but prior to reductions from brokerage service arrangements or other expense offset arrangements. Expenses net of all reductions represent the net expenses paid by the class.
H Amount represents less than $.01 per share.
Financial Highlights - Class T
Years ended July 31, | 2012 | 2011 | 2010 | 2009 | 2008 |
Selected Per-Share Data | | | | | |
Net asset value, beginning of period | $ 9.48 | $ 8.46 | $ 7.13 | $ 7.68 | $ 9.34 |
Income from Investment Operations | | | | | |
Net investment income (loss) C | (.03) | (.09) | (.13) | - F, H | (.10) |
Net realized and unrealized gain (loss) | (1.76) | 1.11 | 1.46 | (.55) | (1.42) |
Total from investment operations | (1.79) | 1.02 | 1.33 | (.55) | (1.52) |
Distributions from net realized gain | (.20) | - | - | - | (.14) |
Redemption fees added to paid in capital C, H | - | - | - | - | - |
Net asset value, end of period | $ 7.49 | $ 9.48 | $ 8.46 | $ 7.13 | $ 7.68 |
Total Return A, B | (19.06)% | 12.06% | 18.65% | (7.16)% | (16.59)% |
Ratios to Average Net Assets D, G | | | | | |
Expenses before reductions | 2.27% | 1.97% | 2.20% | 3.52% | 2.62% |
Expenses net of fee waivers, if any | 1.65% | 1.65% | 1.65% | 1.65% | 1.65% |
Expenses net of all reductions | 1.64% | 1.64% | 1.63% | 1.65% | 1.65% |
Net investment income (loss) | (.41)% | (.85)% | (1.57)% | .01% F | (1.16)% |
Supplemental Data | | | | | |
Net assets, end of period (000 omitted) | $ 2,843 | $ 4,607 | $ 3,273 | $ 2,396 | $ 2,138 |
Portfolio turnover rate E | 79% | 101% | 106% | 97% | 63% |
A Total returns would have been lower if certain expenses had not been reduced during the applicable periods shown.
B Total returns do not include the effect of the sales charges.
C Calculated based on average shares outstanding during the period.
D Fees and expenses of any underlying Fidelity Central Funds are not included in the Fund's expense ratio. The Fund indirectly bears its proportionate share of the expenses of any underlying Fidelity Central Funds.
E Amount does not include the portfolio activity of any underlying Fidelity Central Funds.
F Investment income per share reflects a large, non-recurring dividend which amounted to $.06 per share. Excluding this non-recurring dividend, the ratio of net investment income (loss) to average net assets would have been (1.13)%.
G Expense ratios reflect operating expenses of the class. Expenses before reductions do not reflect amounts reimbursed by the investment adviser or reductions from brokerage service arrangements or reductions from other expense offset arrangements and do not represent the amount paid by the class during periods when reimbursements or reductions occur. Expenses net of fee waivers reflect expenses after reimbursement by the investment adviser but prior to reductions from brokerage service arrangements or other expense offset arrangements. Expenses net of all reductions represent the net expenses paid by the class.
H Amount represents less than $.01 per share.
See accompanying notes which are an integral part of the financial statements.
Annual Report
Financial Highlights - Class B
Years ended July 31, | 2012 | 2011 | 2010 | 2009 | 2008 |
Selected Per-Share Data | | | | | |
Net asset value, beginning of period | $ 8.99 | $ 8.06 | $ 6.83 | $ 7.39 | $ 9.03 |
Income from Investment Operations | | | | | |
Net investment income (loss) C | (.07) | (.13) | (.16) | (.03) F | (.14) |
Net realized and unrealized gain (loss) | (1.67) | 1.06 | 1.39 | (.53) | (1.36) |
Total from investment operations | (1.74) | .93 | 1.23 | (.56) | (1.50) |
Distributions from net realized gain | (.20) | - | - | - | (.14) |
Redemption fees added to paid in capital C, H | - | - | - | - | - |
Net asset value, end of period | $ 7.05 | $ 8.99 | $ 8.06 | $ 6.83 | $ 7.39 |
Total Return A, B | (19.56)% | 11.54% | 18.01% | (7.58)% | (16.94)% |
Ratios to Average Net Assets D, G | | | | | |
Expenses before reductions | 2.71% | 2.47% | 2.68% | 3.98% | 3.03% |
Expenses net of fee waivers, if any | 2.15% | 2.15% | 2.15% | 2.15% | 2.15% |
Expenses net of all reductions | 2.13% | 2.14% | 2.13% | 2.15% | 2.15% |
Net investment income (loss) | (.91)% | (1.35)% | (2.07)% | (.49)% F | (1.67)% |
Supplemental Data | | | | | |
Net assets, end of period (000 omitted) | $ 570 | $ 1,316 | $ 1,408 | $ 1,281 | $ 1,219 |
Portfolio turnover rate E | 79% | 101% | 106% | 97% | 63% |
A Total returns would have been lower if certain expenses had not been reduced during the applicable periods shown.
B Total returns do not include the effect of the contingent deferred sales charge.
C Calculated based on average shares outstanding during the period.
D Fees and expenses of any underlying Fidelity Central Funds are not included in the Fund's expense ratio. The Fund indirectly bears its proportionate share of the expenses of any underlying Fidelity Central Funds.
E Amount does not include the portfolio activity of any underlying Fidelity Central Funds.
F Investment income per share reflects a large, non-recurring dividend which amounted to $.06 per share. Excluding this non-recurring dividend, the ratio of net investment income (loss) to average net assets would have been (1.63)%.
G Expense ratios reflect operating expenses of the class. Expenses before reductions do not reflect amounts reimbursed by the investment adviser or reductions from brokerage service arrangements or reductions from other expense offset arrangements and do not represent the amount paid by the class during periods when reimbursements or reductions occur. Expenses net of fee waivers reflect expenses after reimbursement by the investment adviser but prior to reductions from brokerage service arrangements or other expense offset arrangements. Expenses net of all reductions represent the net expenses paid by the class.
H Amount represents less than $.01 per share.
Financial Highlights - Class C
Years ended July 31, | 2012 | 2011 | 2010 | 2009 | 2008 |
Selected Per-Share Data | | | | | |
Net asset value, beginning of period | $ 8.98 | $ 8.06 | $ 6.82 | $ 7.38 | $ 9.03 |
Income from Investment Operations | | | | | |
Net investment income (loss) C | (.07) | (.13) | (.16) | (.03) F | (.14) |
Net realized and unrealized gain (loss) | (1.66) | 1.05 | 1.40 | (.53) | (1.37) |
Total from investment operations | (1.73) | .92 | 1.24 | (.56) | (1.51) |
Distributions from net realized gain | (.20) | - | - | - | (.14) |
Redemption fees added to paid in capital C, H | - | - | - | - | - |
Net asset value, end of period | $ 7.05 | $ 8.98 | $ 8.06 | $ 6.82 | $ 7.38 |
Total Return A, B | (19.47)% | 11.41% | 18.18% | (7.59)% | (17.06)% |
Ratios to Average Net Assets D, G | | | | | |
Expenses before reductions | 2.71% | 2.40% | 2.67% | 3.63% | 3.02% |
Expenses net of fee waivers, if any | 2.15% | 2.15% | 2.15% | 2.15% | 2.15% |
Expenses net of all reductions | 2.14% | 2.14% | 2.13% | 2.15% | 2.15% |
Net investment income (loss) | (.91)% | (1.35)% | (2.07)% | (.49)% F | (1.67)% |
Supplemental Data | | | | | |
Net assets, end of period (000 omitted) | $ 2,142 | $ 5,866 | $ 3,029 | $ 2,792 | $ 1,097 |
Portfolio turnover rate E | 79% | 101% | 106% | 97% | 63% |
A Total returns would have been lower if certain expenses had not been reduced during the applicable periods shown.
B Total returns do not include the effect of the contingent deferred sales charge.
C Calculated based on average shares outstanding during the period.
D Fees and expenses of any underlying Fidelity Central Funds are not included in the Fund's expense ratio. The Fund indirectly bears its proportionate share of the expenses of any underlying Fidelity Central Funds.
E Amount does not include the portfolio activity of any underlying Fidelity Central Funds.
F Investment income per share reflects a large, non-recurring dividend which amounted to $.06 per share. Excluding this non-recurring dividend, the ratio of net investment income (loss) to average net assets would have been (1.63)%.
G Expense ratios reflect operating expenses of the class. Expenses before reductions do not reflect amounts reimbursed by the investment adviser or reductions from brokerage service arrangements or reductions from other expense offset arrangements and do not represent the amount paid by the class during periods when reimbursements or reductions occur. Expenses net of fee waivers reflect expenses after reimbursement by the investment adviser but prior to reductions from brokerage service arrangements or other expense offset arrangements. Expenses net of all reductions represent the net expenses paid by the class.
H Amount represents less than $.01 per share.
See accompanying notes which are an integral part of the financial statements.
Annual Report
Financial Highlights - Institutional Class
Years ended July 31, | 2012 | 2011 | 2010 | 2009 | 2008 |
Selected Per-Share Data | | | | | |
Net asset value, beginning of period | $ 10.00 | $ 8.88 | $ 7.45 | $ 7.98 | $ 9.65 |
Income from Investment Operations | | | | | |
Net investment income (loss) B | .01 | (.04) | (.09) | .03 E | (.06) |
Net realized and unrealized gain (loss) | (1.86) | 1.16 | 1.52 | (.56) | (1.47) |
Total from investment operations | (1.85) | 1.12 | 1.43 | (.53) | (1.53) |
Distributions from net realized gain | (.20) | - | - | - | (.14) |
Redemption fees added to paid in capital B, G | - | - | - | - | - |
Net asset value, end of period | $ 7.95 | $ 10.00 | $ 8.88 | $ 7.45 | $ 7.98 |
Total Return A | (18.66)% | 12.61% | 19.19% | (6.64)% | (16.16)% |
Ratios to Average Net Assets C, F | | | | | |
Expenses before reductions | 1.66% | 1.22% | 1.54% | 2.44% | 1.94% |
Expenses net of fee waivers, if any | 1.15% | 1.15% | 1.15% | 1.15% | 1.15% |
Expenses net of all reductions | 1.13% | 1.14% | 1.13% | 1.15% | 1.14% |
Net investment income (loss) | .10% | (.35)% | (1.07)% | .51% E | (.66)% |
Supplemental Data | | | | | |
Net assets, end of period (000 omitted) | $ 721 | $ 2,855 | $ 1,717 | $ 957 | $ 229 |
Portfolio turnover rate D | 79% | 101% | 106% | 97% | 63% |
A Total returns would have been lower if certain expenses had not been reduced during the applicable periods shown.
B Calculated based on average shares outstanding during the period.
C Fees and expenses of any underlying Fidelity Central Funds are not included in the Fund's expense ratio. The Fund indirectly bears its proportionate share of the expenses of any underlying Fidelity Central Funds.
D Amount does not include the portfolio activity of any underlying Fidelity Central Funds.
E Investment income per share reflects a large, non-recurring dividend which amounted to $.07 per share. Excluding this non-recurring dividend, the ratio of net investment income (loss) to average net assets would have been (.63)%.
F Expense ratios reflect operating expenses of the class. Expenses before reductions do not reflect amounts reimbursed by the investment adviser or reductions from brokerage service arrangements or reductions from other expense offset arrangements and do not represent the amount paid by the class during periods when reimbursements or reductions occur. Expenses net of fee waivers reflect expenses after reimbursement by the investment adviser but prior to reductions from brokerage service arrangements or other expense offset arrangements. Expenses net of all reductions represent the net expenses paid by the class.
G Amount represents less than $.01 per share.
See accompanying notes which are an integral part of the financial statements.
Annual Report
Fidelity Advisor Communications Equipment Fund
Notes to Financial Statements
For the period ended July 31, 2012
1. Organization.
Fidelity Advisor Communications Equipment Fund (the Fund) is a non-diversified fund of Fidelity Advisor Series VII (the Trust) and is authorized to issue an unlimited number of shares. The Trust is registered under the Investment Company Act of 1940, as amended (the 1940 Act), as an open-end management investment company organized as a Massachusetts business trust. The Fund offers Class A, Class T, Class C and Institutional Class shares, each of which, along with Class B shares, has equal rights as to assets and voting privileges. Effective after the close of business on September 1, 2010, Class B shares were closed to new accounts and additional purchases, except for exchanges and reinvestments. Each class has exclusive voting rights with respect to matters that affect that class. Class B shares will automatically convert to Class A shares after a holding period of seven years from the initial date of purchase. Investment income, realized and unrealized capital gains and losses, the common expenses of the Fund, and certain fund-level expense reductions, if any, are allocated on a pro-rata basis to each class based on the relative net assets of each class to the total net assets of the Fund. Each class differs with respect to transfer agent and distribution and service plan fees incurred. Certain expense reductions may also differ by class.
2. Investments in Fidelity Central Funds.
The Fund invests in Fidelity Central Funds, which are open-end investment companies available only to other investment companies and accounts managed by Fidelity Management & Research Company (FMR) and its affiliates. The Fund's Schedule of Investments lists each of the Fidelity Central Funds held as of period end, if any, as an investment of the Fund, but does not include the underlying holdings of each Fidelity Central Fund. As an Investing Fund, the Fund indirectly bears its proportionate share of the expenses of the underlying Fidelity Central Funds.
The Money Market Central Funds seek preservation of capital and current income and are managed by Fidelity Investments Money Management, Inc. (FIMM), an affiliate of FMR.
A complete unaudited list of holdings for each Fidelity Central Fund is available upon request or at the Securities and Exchange Commission (the SEC) web site at www.sec.gov. In addition, the financial statements of the Fidelity Central Funds, which are not covered by the Fund's Report of Independent Registered Public Accounting Firm, are available on the SEC web site or upon request.
3. Significant Accounting Policies.
The financial statements have been prepared in conformity with accounting principles generally accepted in the United States of America (GAAP), which require management to make certain estimates and assumptions at the date of the financial statements. Actual results could differ from those estimates. Subsequent events, if any, through the date that the financial statements were issued have been evaluated in the preparation of the financial statements. The following summarizes the significant accounting policies of the Fund:
Security Valuation. Investments are valued as of 4:00 p.m. Eastern time on the last calendar day of the period. In accordance with valuation policies and procedures approved by the Board of Trustees (the Board), the Fund attempts to obtain prices from one or more third party pricing vendor or broker to value its investments. When current market prices, quotations or rates are not readily available or reliable, securities will be fair valued in good faith by the FMR Fair Value Committee (the Committee), in accordance with procedures adopted by the Fund's Board. Factors used in determining fair value vary by security type and may include market or security specific events. The frequency with which these procedures are used cannot be predicted and they may be utilized to a significant extent. The Committee oversees the Fund's valuation policies and procedures and is responsible for approving and reporting to the Board all fair value determinations.
The Fund categorizes the inputs to valuation techniques used to value its investments into a disclosure hierarchy consisting of three levels as shown below:
Level 1 - quoted prices in active markets for identical investments
Level 2 - other significant observable inputs (including quoted prices for similar investments, interest rates, prepayment speeds, etc.)
Level 3 - unobservable inputs (including the Fund's own assumptions based on the best information available)
Valuation techniques used to value the Fund's investments by major category are as follows:
Equity securities, including restricted securities, for which market quotations are readily available, are valued at the last reported sale price or official closing price as reported by a third party pricing vendor on the primary market or exchange on which they are traded and are categorized as Level 1 in the hierarchy. In the event there were no sales during the day or closing prices are not available, securities are valued at the last quoted bid price or may be valued using the last available price and are generally categorized as Level 2 in the hierarchy. For foreign equity securities, when significant market or security specific events arise, comparisons to the valuation of American Depositary Receipts (ADRs), futures contracts, Exchange-Traded Funds (ETFs) and certain indexes as well as quoted prices for similar securities are used and are categorized as Level 2 in the hierarchy. Utilizing these techniques may result in transfers between Level 1 and Level 2.
Annual Report
3. Significant Accounting Policies - continued
Security Valuation - continued
Investments in open-end mutual funds, including the Fidelity Central Funds, are valued at their closing net asset value each business day and are categorized as Level 1 in the hierarchy.
Changes in valuation techniques may result in transfers in or out of an assigned level within the disclosure hierarchy.
Foreign Currency Translation. The Fund may use foreign currency contracts to facilitate transactions in foreign-denominated securities. Gains and losses from these transactions may arise from changes in the value of the foreign currency or if the counterparties do not perform under the contracts' terms.
Foreign-denominated assets, including investment securities, and liabilities are translated into U.S. dollars at the exchange rates at period end. Purchases and sales of investment securities, income and dividends received and expenses denominated in foreign currencies are translated into U.S. dollars at the exchange rate in effect on the transaction date.
The effects of exchange rate fluctuations on investments are included with the net realized and unrealized gain (loss) on investment securities. Other foreign currency transactions resulting in realized and unrealized gain (loss) are disclosed separately.
Investment Transactions and Income. For financial reporting purposes, the Fund's investment holdings and NAV include trades executed through the end of the last business day of the period. The NAV per share for processing shareholder transactions is calculated as of the close of business of the New York Stock Exchange (NYSE), normally 4:00 p.m. Eastern time and includes trades executed through the end of the prior business day. Gains and losses on securities sold are determined on the basis of identified cost and may include proceeds received from litigation. Dividend income is recorded on the ex-dividend date, except for certain dividends from foreign securities where the ex-dividend date may have passed, which are recorded as soon as the Fund is informed of the ex-dividend date. Non-cash dividends included in dividend income, if any, are recorded at the fair market value of the securities received. Distributions received on securities that represent a return of capital or capital gain are recorded as a reduction of cost of investments and/or as a realized gain. The Fund estimates the components of distributions received that may be considered return of capital distributions or capital gain distributions. Interest income and distributions from the Fidelity Central Funds are accrued as earned. Interest income includes coupon interest and amortization of premium and accretion of discount on debt securities. Investment income is recorded net of foreign taxes withheld where recovery of such taxes is uncertain.
Expenses. Expenses directly attributable to a fund are charged to that fund. Expenses attributable to more than one fund are allocated among the respective funds on the basis of relative net assets or other appropriate methods. Expense estimates are accrued in the period to which they relate and adjustments are made when actual amounts are known.
Income Tax Information and Distributions to Shareholders. Each year, the Fund intends to qualify as a regulated investment company under Subchapter M of the Internal Revenue Code, including distributing substantially all of its taxable income and realized gains. As a result, no provision for income taxes is required. As of July 31, 2012, the Fund did not have any unrecognized tax benefits in the financial statements; nor is the Fund aware of any tax positions for which it is reasonably possible that the total amounts of unrecognized tax benefits will significantly change in the next twelve months. The Fund files a U.S. federal tax return, in addition to state and local tax returns as required. A fund's federal income tax returns are subject to examination by the Internal Revenue Service (IRS) for a period of three fiscal years after they are filed. State and local tax returns may be subject to examination for an additional fiscal year depending on the jurisdiction. Foreign taxes are provided for based on the Fund's understanding of the tax rules and rates that exist in the foreign markets in which it invests.
Distributions are declared and recorded on the ex-dividend date. Income dividends and capital gain distributions are declared separately for each class. Income and capital gain distributions are determined in accordance with income tax regulations, which may differ from GAAP.
Capital accounts within the financial statements are adjusted for permanent book-tax differences. These adjustments have no impact on net assets or the results of operations. Temporary book-tax differences will reverse in a subsequent period.
Book-tax differences are primarily due to foreign currency transactions, net operating losses, capital loss carryforwards and losses deferred due to wash sales and excise tax regulations.
The federal tax cost of investment securities and unrealized appreciation (depreciation) as of period end were as follows:
Gross unrealized appreciation | $ 578,798 |
Gross unrealized depreciation | (2,193,931) |
Net unrealized appreciation (depreciation) on securities and other investments | $ (1,615,133) |
| |
Tax Cost | $ 12,200,638 |
Annual Report
Fidelity Advisor Communications Equipment Fund
Notes to Financial Statements - continued
3. Significant Accounting Policies - continued
Income Tax Information and Distributions to Shareholders - continued
The tax-based components of distributable earnings as of period end were as follows:
Capital loss carryforward | $ (1,534,182) |
Net unrealized appreciation (depreciation) | $ (1,615,133) |
Capital loss carryforwards are only available to offset future capital gains of the Fund to the extent provided by regulations and may be limited. Under the Regulated Investment Company Modernization Act of 2010 (the Act), the Fund is permitted to carry forward capital losses incurred in taxable years beginning after December 22, 2010 for an unlimited period and such capital losses are required to be used prior to any losses that expire. Capital loss carryforwards were as follows:
No expiration | |
Short-term | $ (1,534,182) |
The tax character of distributions paid was as follows:
| July 31, 2012 | July 31, 2011 |
Long-term Capital Gains | $ 401,208 | $ - |
Short-Term Trading (Redemption) Fees. Shares held by investors in the Fund less than 30 days are subject to a redemption fee equal to .75% of the net asset value of shares redeemed. All redemption fees, which reduce the proceeds of the shareholder redemption, are retained by the Fund and accounted for as an addition to paid in capital.
New Accounting Pronouncement. In December 2011, the Financial Accounting Standards Board issued Accounting Standard Update No. 2011-11, Disclosures about Offsetting Assets and Liabilities. The update creates new disclosure requirements requiring entities to disclose both gross and net information for derivatives and other financial instruments that are either offset in the Statement of Assets and Liabilities or subject to an enforceable master netting arrangement or similar agreement. The disclosure requirements are effective for interim and annual reporting periods beginning on or after January 1, 2013. Management is currently evaluating the impact of the update's adoption on the Fund's financial statement disclosures.
4. Purchases and Sales of Investments.
Purchases and sales of securities, other than short-term securities, aggregated $10,794,252 and $20,314,263, respectively.
5. Fees and Other Transactions with Affiliates.
Management Fee. FMR and its affiliates provide the Fund with investment management related services for which the Fund pays a monthly management fee. The management fee is the sum of an individual fund fee rate that is based on an annual rate of .30% of the Fund's average net assets and an annualized group fee rate that averaged .26% during the period. The group fee rate is based upon the average net assets of all the mutual funds advised by FMR. The group fee rate decreases as assets under management increase and increases as assets under management decrease. For the period, the total annual management fee rate was .56% of the Fund's average net assets.
Distribution and Service Plan Fees. In accordance with Rule 12b-1 of the 1940 Act, the Fund has adopted separate Distribution and Service Plans for each class of shares. Certain classes pay Fidelity Distributors Corporation (FDC), an affiliate of FMR, separate Distribution and Service Fees, each of which is based on an annual percentage of each class' average net assets. In addition, FDC may pay financial intermediaries for selling shares of the Fund and providing shareholder support services. For the period, the Distribution and Service Fee rates, total fees and amounts retained by FDC were as follows:
| Distribution
Fee | Service
Fee | Total Fees | Retained
by FDC |
Class A | -% | .25% | $ 12,454 | $ 96 |
Class T | .25% | .25% | 18,072 | - |
Class B | .75% | .25% | 8,458 | 6,423 |
Class C | .75% | .25% | 30,627 | 7,539 |
| | | $ 69,611 | $ 14,058 |
Annual Report
5. Fees and Other Transactions with Affiliates - continued
Sales Load. FDC may receive a front-end sales charge of up to 5.75% for selling Class A shares and 3.50% for selling Class T shares, some of which is paid to financial intermediaries for selling shares of the Fund. Depending on the holding period, FDC may receive contingent deferred sales charges levied on Class A, Class T, Class B, and Class C redemptions. The deferred sales charges range from 5.00% to 1.00% for Class B shares, 1.00% for Class C shares, 1.00% for certain purchases of Class A shares and .25% for certain purchases of Class T shares.
For the period, sales charge amounts retained by FDC were as follows:
| Retained
by FDC |
Class A | $ 2,011 |
Class T | 2,152 |
Class B* | 3,030 |
Class C* | 1,783 |
| $ 8,976 |
* When Class B and Class C shares are initially sold, FDC pays commissions from its own resources to financial intermediaries through which the sales are made.
Transfer Agent Fees. Fidelity Investments Institutional Operations Company, Inc. (FIIOC), an affiliate of FMR, is the transfer, dividend disbursing and shareholder servicing agent for each class of the Fund. FIIOC receives account fees and asset-based fees that vary according to the account size and type of account of the shareholders of the respective classes of the Fund. FIIOC pays for typesetting, printing and mailing of shareholder reports, except proxy statements. For the period, transfer agent fees for each class were as follows:
| Amount | % of
Average
Net Assets |
Class A | $ 15,356 | .31 |
Class T | 13,120 | .36 |
Class B | 2,634 | .31 |
Class C | 9,658 | .31 |
Institutional Class | 2,698 | .26 |
| $ 43,466 | |
Accounting and Security Lending Fees. Fidelity Service Company, Inc. (FSC), an affiliate of FMR, maintains the Fund's accounting records. The accounting fee is based on the level of average net assets for each month. Under a separate contract, FSC administers the security lending program. The security lending fee is based on the number and duration of lending transactions.
Brokerage Commissions. The Fund placed a portion of its portfolio transactions with brokerage firms which are affiliates of the investment adviser. The commissions paid to these affiliated firms were $1,827 for the period.
6. Committed Line of Credit.
The Fund participates with other funds managed by FMR or an affiliate in a $4.25 billion credit facility (the "line of credit") to be utilized for temporary or emergency purposes to fund shareholder redemptions or for other short-term liquidity purposes. The Fund has agreed to pay commitment fees on its pro-rata portion of the line of credit, which amounted to $42 and is reflected in Miscellaneous expenses on the Statement of Operations. During the period, there were no borrowings on this line of credit.
7. Security Lending.
The Fund lends portfolio securities through a lending agent from time to time in order to earn additional income. For equity securities, a lending agent is used and may loan securities to certain qualified borrowers, including Fidelity Capital Markets (FCM), a broker-dealer affiliated with the Fund. On the settlement date of the loan, the Fund receives collateral (in the form of U.S. Treasury obligations, letters of credit and/or cash) against the loaned securities and maintains collateral in an amount not less than 100% of the market value of the loaned securities during the period of the loan. The market value of the loaned securities is determined at the close of business of the Fund and any additional required collateral is delivered to the Fund on the next business day. If the borrower defaults on its obligation to return the securities loaned because of insolvency or other reasons, a fund could experience delays and costs in recovering the securities loaned or in gaining access to the collateral. Any cash collateral received is invested in the Fidelity Securities Lending Cash Central Fund. The value of loaned securities and cash collateral at period end are disclosed on the Fund's Statement of Assets and Liabilities. Security lending income represents the income earned on investing cash collateral, less rebates paid to borrowers and any lending agent fees associated with the loan, plus any premium payments received for lending certain types of securities. Security lending income is presented in the Statement of Operations as a component of income from Fidelity Central Funds. During the period, there were no securities loaned to FCM.
Annual Report
Fidelity Advisor Communications Equipment Fund
Notes to Financial Statements - continued
8. Expense Reductions.
FMR voluntarily agreed to reimburse each class to the extent annual operating expenses exceeded certain levels of average net assets as noted in the table below. Some expenses, for example interest expense, including commitment fees, are excluded from this reimbursement.
The following classes were in reimbursement during the period:
| Expense
Limitations | Reimbursement
from adviser |
Class A | 1.40% | $ 27,873 |
Class T | 1.65% | 22,083 |
Class B | 2.15% | 4,729 |
Class C | 2.15% | 17,396 |
Institutional Class | 1.15% | 5,292 |
| | $ 77,373 |
Many of the brokers with whom FMR places trades on behalf of the Fund provided services to the Fund in addition to trade execution. These services included payments of certain expenses on behalf of the Fund totaling $2,275 for the period.
9. Distributions to Shareholders.
Distributions to shareholders of each class were as follows:
Years ended July 31, | 2012 | 2011 |
From net realized gain | | |
Class A | $ 136,672 | $ - |
Class T | 94,407 | - |
Class B | 23,930 | - |
Class C | 101,740 | - |
Institutional Class | 44,459 | - |
Total | $ 401,208 | $ - |
10. Share Transactions.
Transactions for each class of shares were as follows:
| Shares | Dollars |
Years ended July 31, | 2012 | 2011 | 2012 | 2011 |
Class A | | | | |
Shares sold | 95,217 | 848,465 | $ 825,716 | $ 9,277,193 |
Reinvestment of distributions | 15,026 | - | 125,915 | - |
Shares redeemed | (550,285) | (506,493) | (4,678,484) | (5,495,871) |
Net increase (decrease) | (440,042) | 341,972 | $ (3,726,853) | $ 3,781,322 |
Class T | | | | |
Shares sold | 99,348 | 222,009 | $ 845,573 | $ 2,346,633 |
Reinvestment of distributions | 11,468 | - | 93,466 | - |
Shares redeemed | (217,086) | (122,895) | (1,833,154) | (1,276,707) |
Net increase (decrease) | (106,270) | 99,114 | $ (894,115) | $ 1,069,926 |
Class B | | | | |
Shares sold | 1,631 | 48,553 | $ 14,069 | $ 469,014 |
Reinvestment of distributions | 3,015 | - | 23,244 | - |
Shares redeemed | (70,313) | (76,689) | (498,813) | (748,333) |
Net increase (decrease) | (65,667) | (28,136) | $ (461,500) | $ (279,319) |
Class C | | | | |
Shares sold | 45,249 | 468,878 | $ 356,072 | $ 4,767,947 |
Reinvestment of distributions | 10,744 | - | 82,834 | - |
Shares redeemed | (405,119) | (191,799) | (3,174,312) | (1,863,160) |
Net increase (decrease) | (349,126) | 277,079 | $ (2,735,406) | $ 2,904,787 |
Institutional Class | | | | |
Shares sold | 32,975 | 497,180 | $ 287,948 | $ 5,828,732 |
Reinvestment of distributions | 2,747 | - | 23,680 | - |
Shares redeemed | (230,453) | (405,041) | (2,045,666) | (4,332,982) |
Net increase (decrease) | (194,731) | 92,139 | $ (1,734,038) | $ 1,495,750 |
Annual Report
11. Other.
The Fund's organizational documents provide former and current trustees and officers with a limited indemnification against liabilities arising in connection with the performance of their duties to the Fund. In the normal course of business, the Fund may also enter into contracts that provide general indemnifications. The Fund's maximum exposure under these arrangements is unknown as this would be dependent on future claims that may be made against the Fund. The risk of material loss from such claims is considered remote.
Annual Report
Fidelity Advisor Consumer Discretionary Fund - Institutional Class
Performance: The Bottom Line
Average annual total return reflects the change in the value of an investment, assuming reinvestment of the class' distributions from dividend income and capital gains (the profits earned upon the sale of securities that have grown in value, if any) and assuming a constant rate of performance each year. The $10,000 table and the fund's returns do not reflect the deduction of taxes that a shareholder would pay on fund distributions or the redemption of fund shares. During periods of reimbursement by Fidelity, a fund's total return will be greater than it would be had the reimbursement not occurred. How a fund did yesterday is no guarantee of how it will do tomorrow.
Average Annual Total Returns
Periods ended July 31, 2012 | Past 1
year | Past 5
years | Past 10
years |
Institutional Class A | 8.33% | 3.95% | 6.34% |
A Prior to October 1, 2006, Fidelity Advisor Consumer Discretionary Fund operated under certain different investment policies. The historical performance for the fund may not represent its current investment policies.
$10,000 Over 10 Years
Let's say hypothetically that $10,000 was invested in Fidelity Advisor Consumer Discretionary Fund - Institutional Class on July 31, 2002. The chart shows how the value of your investment would have changed, and also shows how the S&P 500 Index performed over the same period.
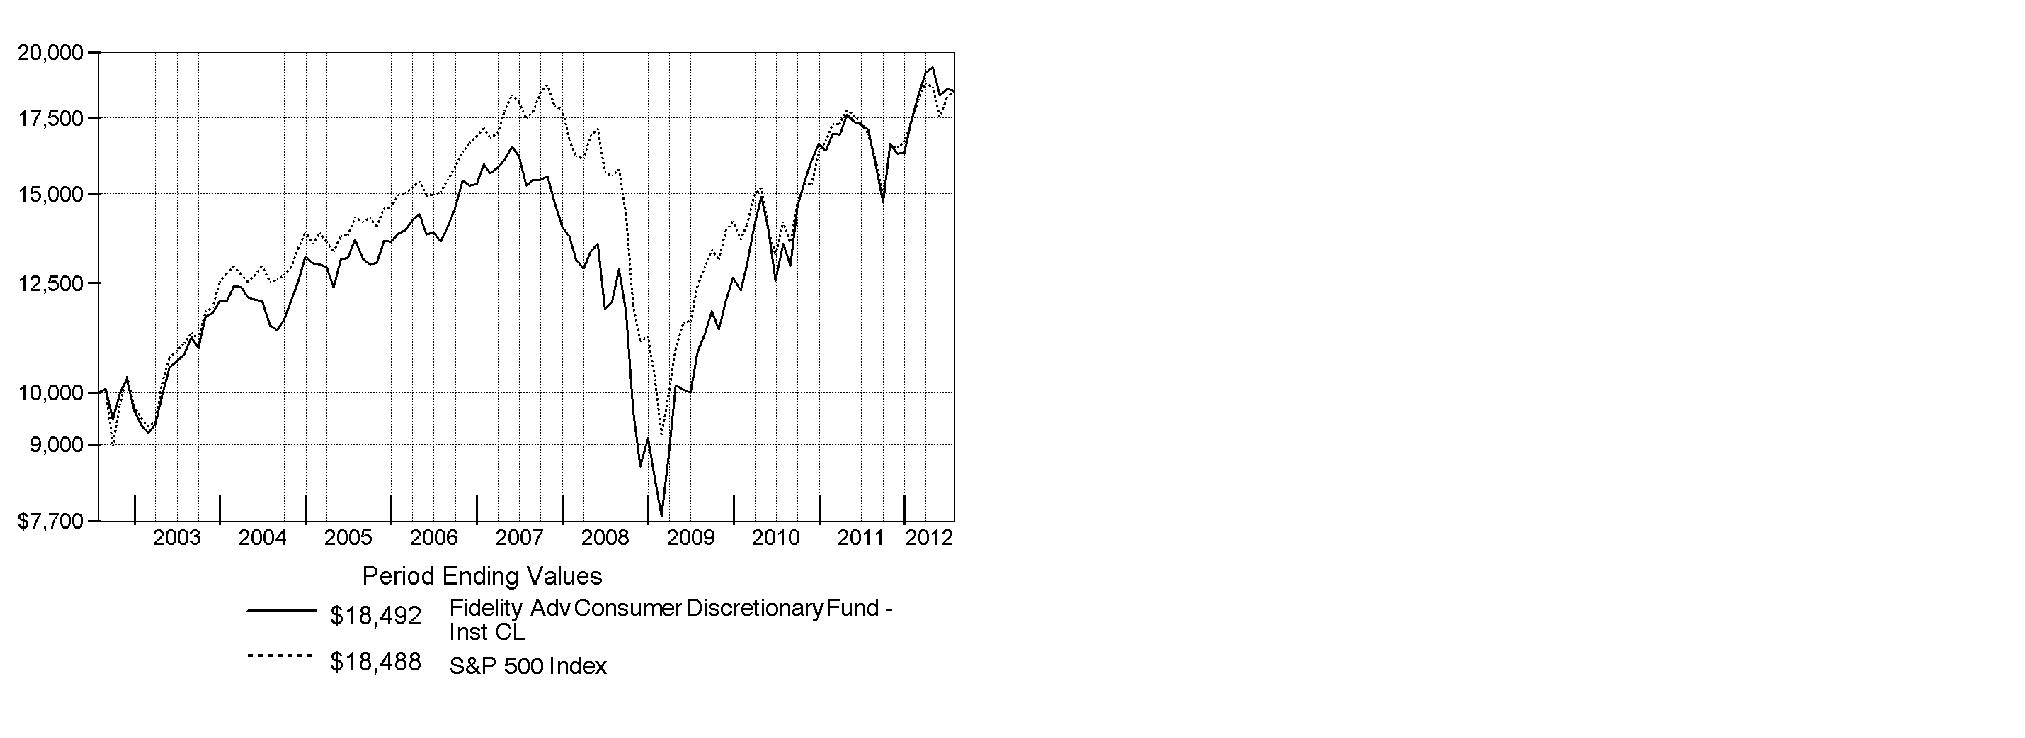
Annual Report
Fidelity Advisor Consumer Discretionary Fund
Market Recap: Major U.S. equity benchmarks posted solid gains for the year ending July 31, 2012, amid an uncertain investment environment. The broad-based S&P 500® Index returned 9.13%, while the blue-chip-laden Dow Jones Industrial AverageSM and technology-heavy Nasdaq Composite® Index gained 10.12% and 7.83%, respectively. Volatility spiked during the period's first half, as equities plummeted late last summer on Europe's debt woes, political wrangling over the U.S. debt ceiling and the sovereign credit-rating downgrade that followed. By October, a seemingly improved U.S. economy rejuvenated stocks, paving the way for major equity benchmarks to post their best first-quarter performance since 1998. However, more eurozone trouble, signs that the U.S. economy had turned sluggish and a slowdown in China caused stocks to slip in May, before a new wave of optimism took hold in June and July. Within the S&P 500®, more-defensive sectors such as telecommunication services (+30%) and consumer staples (+20%) fared best, while materials and energy significantly underperformed, returning -5%. Small- and mid-cap stocks trailed their less-volatile large-cap counterparts, with the Russell 2000® Index adding 0.19% and the Russell Midcap® Index rising 2.28%. Given turmoil and local currency weakness in Europe, foreign developed-markets stocks lost ground, with the MSCI® EAFE® Index returning -11.32%.
Comments from Gordon Scott, who became Portfolio Manager of Fidelity Advisor® Consumer Discretionary Fund on May 1, 2012: For the 12 months ending July 31, 2012, the fund's Institutional Class shares returned 8.33%, lagging both the 9.53% advance of the MSCI® U.S. IM Consumer Discretionary 25/50 Index and the S&P 500®. The fund underperformed its sector benchmark as a result of security selection. The fund performed well on an absolute basis during the early months of 2012, when the global economy was in a cyclical rally, offsetting the fund's less robust results during the second half of 2011, which is when most of the underperformance occurred. In April 2012, as equity markets retreated on renewed worries about the eurozone, the fund took on a more-defensive bias and that shift in positioning helped narrow the fund's relative underperformance. Among the stocks that detracted from the fund's performance versus its sector benchmark were premium mattress maker Tempur-Pedic International; online discount coupon purveyor Groupon, an out-of-index position; and auto-parts retailer O'Reilly Automotive, in which the fund was underweighted. Stocks that contributed included auto-parts maker Johnson Controls, a poor-performing index component in which we held no position; diversified media and entertainment giant Walt Disney; and after-market automotive retailer Advance Auto Parts. Some of the stocks mentioned in this annual review were no longer held at period end.
The views expressed above reflect those of the portfolio manager(s) only through the end of the period as stated on the cover of this report and do not necessarily represent the views of Fidelity or any other person in the Fidelity organization. Any such views are subject to change at any time based upon market or other conditions and Fidelity disclaims any responsibility to update such views. These views may not be relied on as investment advice and, because investment decisions for a Fidelity fund are based on numerous factors, may not be relied on as an indication of trading intent on behalf of any Fidelity fund.
Annual Report
Fidelity Advisor Consumer Discretionary Fund
As a shareholder of the Fund, you incur two types of costs: (1) transaction costs, including sales charges (loads) on purchase payments or redemption proceeds, redemption fees and (2) ongoing costs, including management fees, distribution and/or service (12b-1) fees and other Fund expenses. This Example is intended to help you understand your ongoing costs (in dollars) of investing in the Fund and to compare these costs with the ongoing costs of investing in other mutual funds.
The Example is based on an investment of $1,000 invested at the beginning of the period and held for the entire period (February 1, 2012 to July 31, 2012).
Actual Expenses
The first line of the accompanying table for each class of the Fund provides information about actual account values and actual expenses. You may use the information in this line, together with the amount you invested, to estimate the expenses that you paid over the period. Simply divide your account value by $1,000.00 (for example, an $8,600 account value divided by $1,000.00 = 8.6), then multiply the result by the number in the first line for a class of the Fund under the heading entitled "Expenses Paid During Period" to estimate the expenses you paid on your account during this period. In addition, the Fund, as a shareholder in the underlying Fidelity Central Funds, will indirectly bear its pro-rata share of the fees and expenses incurred by the underlying Fidelity Central Funds. These fees and expenses are not included in the Fund's annualized expense ratio used to calculate the expense estimate in the table below.
Hypothetical Example for Comparison Purposes
The second line of the accompanying table for each class of the Fund provides information about hypothetical account values and hypothetical expenses based on a Class' actual expense ratio and an assumed rate of return of 5% per year before expenses, which is not the Class' actual return. The hypothetical account values and expenses may not be used to estimate the actual ending account balance or expenses you paid for the period. You may use this information to compare the ongoing costs of investing in the Fund and other funds. To do so, compare this 5% hypothetical example with the 5% hypothetical examples that appear in the shareholder reports of the other funds. In addition, the Fund, as a shareholder in the underlying Fidelity Central Funds, will indirectly bear its pro-rata share of the fees and expenses incurred by the underlying Fidelity Central Funds. These fees and expenses are not included in the Fund's annualized expense ratio used to calculate the expense estimate in the table below.
Please note that the expenses shown in the table are meant to highlight your ongoing costs only and do not reflect any transaction costs. Therefore, the second line of the table is useful in comparing ongoing costs only, and will not help you determine the relative total costs of owning different funds. In addition, if these transactional costs were included, your costs would have been higher.
| Annualized
Expense Ratio | Beginning
Account Value
February 1, 2012 | Ending
Account Value
July 31, 2012 | Expenses Paid
During Period*
February 1, 2012
to July 31, 2012 |
Class A | 1.35% | | | |
Actual | | $ 1,000.00 | $ 1,059.40 | $ 6.91 |
HypotheticalA | | $ 1,000.00 | $ 1,018.15 | $ 6.77 |
Class T | 1.64% | | | |
Actual | | $ 1,000.00 | $ 1,058.50 | $ 8.39 |
HypotheticalA | | $ 1,000.00 | $ 1,016.71 | $ 8.22 |
Class B | 2.11% | | | |
Actual | | $ 1,000.00 | $ 1,055.60 | $ 10.78 |
HypotheticalA | | $ 1,000.00 | $ 1,014.37 | $ 10.57 |
Class C | 2.05% | | | |
Actual | | $ 1,000.00 | $ 1,056.30 | $ 10.48 |
HypotheticalA | | $ 1,000.00 | $ 1,014.67 | $ 10.27 |
Institutional Class | .96% | | | |
Actual | | $ 1,000.00 | $ 1,062.30 | $ 4.92 |
HypotheticalA | | $ 1,000.00 | $ 1,020.09 | $ 4.82 |
A 5% return per year before expenses
* Expenses are equal to each Class' annualized expense ratio, multiplied by the average account value over the period, multiplied by 182/366 (to reflect the one-half year period).
Annual Report
Fidelity Advisor Consumer Discretionary Fund
Investment Changes (Unaudited)
Top Ten Stocks as of July 31, 2012 |
| % of fund's
net assets | % of fund's net assets
6 months ago |
Comcast Corp. Class A | 7.8 | 5.0 |
The Walt Disney Co. | 7.1 | 5.7 |
McDonald's Corp. | 6.1 | 6.6 |
Home Depot, Inc. | 5.8 | 3.8 |
Amazon.com, Inc. | 5.3 | 4.9 |
News Corp. Class A | 4.8 | 1.3 |
TJX Companies, Inc. | 3.2 | 2.4 |
Target Corp. | 2.9 | 2.9 |
Yum! Brands, Inc. | 2.7 | 0.0 |
NIKE, Inc. Class B | 2.6 | 3.2 |
| 48.3 | |
Top Industries (% of fund's net assets) |
As of July 31, 2012 |
| Specialty Retail | 30.0% | |
| Media | 23.8% | |
| Hotels, Restaurants & Leisure | 15.0% | |
| Multiline Retail | 8.1% | |
| Internet & Catalog Retail | 7.8% | |
| All Others* | 15.3% | |

As of January 31, 2012 |
| Specialty Retail | 25.5% | |
| Media | 23.1% | |
| Hotels, Restaurants & Leisure | 18.8% | |
| Textiles, Apparel & Luxury Goods | 8.3% | |
| Internet & Catalog Retail | 5.6% | |
| All Others* | 18.7% | |

* Includes short-term investments and net other assets. |
Annual Report
Fidelity Advisor Consumer Discretionary Fund
Investments July 31, 2012
Showing Percentage of Net Assets
Common Stocks - 98.4% |
| Shares | | Value |
AUTO COMPONENTS - 2.1% |
Auto Parts & Equipment - 2.1% |
BorgWarner, Inc. (a) | 9,900 | | $ 664,290 |
Delphi Automotive PLC | 23,500 | | 667,165 |
| | 1,331,455 |
AUTOMOBILES - 0.8% |
Motorcycle Manufacturers - 0.8% |
Harley-Davidson, Inc. | 12,398 | | 535,966 |
BUILDING PRODUCTS - 0.5% |
Building Products - 0.5% |
Owens Corning (a) | 12,046 | | 323,556 |
CHEMICALS - 0.5% |
Specialty Chemicals - 0.5% |
Sherwin-Williams Co. | 2,500 | | 335,875 |
COMMERCIAL SERVICES & SUPPLIES - 0.5% |
Office Services & Supplies - 0.5% |
Interface, Inc. | 21,700 | | 287,742 |
DISTRIBUTORS - 1.3% |
Distributors - 1.3% |
LKQ Corp. (a) | 22,800 | | 805,524 |
HOTELS, RESTAURANTS & LEISURE - 15.0% |
Restaurants - 15.0% |
BJ's Restaurants, Inc. (a) | 5,783 | | 228,891 |
Buffalo Wild Wings, Inc. (a) | 6,100 | | 442,799 |
Domino's Pizza, Inc. | 19,993 | | 682,561 |
McDonald's Corp. | 43,453 | | 3,882,960 |
Panera Bread Co. Class A (a) | 4,100 | | 645,709 |
Starbucks Corp. | 34,590 | | 1,566,235 |
Texas Roadhouse, Inc. Class A | 17,475 | | 302,492 |
Yum! Brands, Inc. | 26,066 | | 1,690,119 |
| | 9,441,766 |
HOUSEHOLD DURABLES - 3.3% |
Homebuilding - 1.2% |
Lennar Corp. Class A | 15,611 | | 455,997 |
Ryland Group, Inc. | 12,000 | | 286,560 |
| | 742,557 |
Housewares & Specialties - 2.1% |
Jarden Corp. | 22,000 | | 994,400 |
Tupperware Brands Corp. | 6,541 | | 342,879 |
| | 1,337,279 |
TOTAL HOUSEHOLD DURABLES | | 2,079,836 |
|
| Shares | | Value |
INTERNET & CATALOG RETAIL - 7.8% |
Internet Retail - 7.8% |
Amazon.com, Inc. (a) | 14,186 | | $ 3,309,594 |
Priceline.com, Inc. (a) | 2,390 | | 1,581,559 |
| | 4,891,153 |
LEISURE EQUIPMENT & PRODUCTS - 0.8% |
Leisure Products - 0.8% |
Brunswick Corp. | 23,900 | | 525,561 |
MEDIA - 23.8% |
Broadcasting - 2.9% |
CBS Corp. Class B | 31,863 | | 1,066,136 |
Discovery Communications, Inc. (a) | 15,400 | | 779,702 |
| | 1,845,838 |
Cable & Satellite - 9.0% |
Charter Communications, Inc. Class A (a) | 9,896 | | 761,200 |
Comcast Corp. Class A | 152,000 | | 4,947,600 |
| | 5,708,800 |
Movies & Entertainment - 11.9% |
News Corp. Class A | 130,421 | | 3,002,291 |
The Walt Disney Co. | 91,122 | | 4,477,735 |
| | 7,480,026 |
TOTAL MEDIA | | 15,034,664 |
MULTILINE RETAIL - 8.1% |
General Merchandise Stores - 8.1% |
Dollar General Corp. (a) | 32,190 | | 1,642,012 |
Dollar Tree, Inc. (a) | 32,504 | | 1,636,251 |
Target Corp. | 29,865 | | 1,811,312 |
| | 5,089,575 |
SPECIALTY RETAIL - 30.0% |
Apparel Retail - 7.6% |
Abercrombie & Fitch Co. Class A | 7,100 | | 239,980 |
Limited Brands, Inc. | 17,161 | | 816,006 |
Ross Stores, Inc. | 18,700 | | 1,242,428 |
TJX Companies, Inc. | 45,931 | | 2,033,825 |
Urban Outfitters, Inc. (a) | 14,900 | | 455,195 |
| | 4,787,434 |
Automotive Retail - 4.8% |
AutoZone, Inc. (a) | 2,700 | | 1,013,121 |
CarMax, Inc. (a) | 33,200 | | 923,956 |
O'Reilly Automotive, Inc. (a) | 12,900 | | 1,106,046 |
| | 3,043,123 |
Home Improvement Retail - 6.1% |
Home Depot, Inc. | 69,889 | | 3,646,808 |
Lowe's Companies, Inc. | 8,753 | | 222,064 |
| | 3,868,872 |
Homefurnishing Retail - 0.8% |
Williams-Sonoma, Inc. | 14,575 | | 506,481 |
Common Stocks - continued |
| Shares | | Value |
SPECIALTY RETAIL - CONTINUED |
Specialty Stores - 10.7% |
Dick's Sporting Goods, Inc. | 20,369 | | $ 1,000,525 |
GNC Holdings, Inc. | 14,939 | | 575,600 |
Hibbett Sports, Inc. (a) | 10,600 | | 644,162 |
PetSmart, Inc. | 15,100 | | 998,261 |
Sally Beauty Holdings, Inc. (a) | 34,000 | | 898,280 |
Tiffany & Co., Inc. | 10,317 | | 566,713 |
Tractor Supply Co. | 11,235 | | 1,020,924 |
Ulta Salon, Cosmetics & Fragrance, Inc. | 5,850 | | 496,548 |
Vitamin Shoppe, Inc. (a) | 9,500 | | 521,740 |
| | 6,722,753 |
TOTAL SPECIALTY RETAIL | | 18,928,663 |
TEXTILES, APPAREL & LUXURY GOODS - 3.9% |
Apparel, Accessories & Luxury Goods - 1.3% |
PVH Corp. | 9,933 | | 788,978 |
Footwear - 2.6% |
NIKE, Inc. Class B | 17,726 | | 1,654,722 |
TOTAL TEXTILES, APPAREL & LUXURY GOODS | | 2,443,700 |
TOTAL COMMON STOCKS (Cost $54,555,811) |
62,055,036
|
Nonconvertible Preferred Stocks - 0.5% |
| Shares | | Value |
AUTOMOBILES - 0.5% |
Automobile Manufacturers - 0.5% |
Volkswagen AG
(Cost $294,558) | 1,700 | | $ 290,744 |
Money Market Funds - 1.9% |
| | | |
Fidelity Cash Central Fund, 0.17% (b)
(Cost $1,220,375) | 1,220,375 | |
1,220,375
|
TOTAL INVESTMENT PORTFOLIO - 100.8% (Cost $56,070,744) | | 63,566,155 |
NET OTHER ASSETS (LIABILITIES) - (0.8)% | | (504,753) |
NET ASSETS - 100% | $ 63,061,402 |
Legend |
(a) Non-income producing |
(b) Affiliated fund that is available only to investment companies and other accounts managed by Fidelity Investments. The rate quoted is the annualized seven-day yield of the fund at period end. A complete unaudited listing of the fund's holdings as of its most recent quarter end is available upon request. In addition, each Fidelity Central Fund's financial statements, which are not covered by the Fund's Report of Independent Registered Public Accounting Firm, are available on the SEC's website or upon request. |
Affiliated Central Funds |
Information regarding fiscal year to date income earned by the Fund from investments in Fidelity Central Funds is as follows: |
Fund | Income earned |
Fidelity Cash Central Fund | $ 805 |
Fidelity Securities Lending Cash Central Fund | 50,595 |
Total | $ 51,400 |
Other Information |
All investments are categorized as Level 1 under the Fair Value Hierarchy. The inputs or methodology used for valuing securities may not be an indication of the risk associated with investing in those securities. For more information on valuation inputs, please refer to the Security Valuation section in the accompanying Notes to Financial Statements. |
See accompanying notes which are an integral part of the financial statements.
Annual Report
Fidelity Advisor Consumer Discretionary Fund
Statement of Assets and Liabilities
| July 31, 2012 |
| | |
Assets | | |
Investment in securities, at value - See accompanying schedule: Unaffiliated issuers (cost $54,850,369) | $ 62,345,780 | |
Fidelity Central Funds (cost $1,220,375) | 1,220,375 | |
Total Investments (cost $56,070,744) | | $ 63,566,155 |
Receivable for investments sold | | 2,738,324 |
Receivable for fund shares sold | | 109,411 |
Dividends receivable | | 19,847 |
Distributions receivable from Fidelity Central Funds | | 168 |
Other receivables | | 1,317 |
Total assets | | 66,435,222 |
| | |
Liabilities | | |
Payable for investments purchased | $ 3,213,900 | |
Payable for fund shares redeemed | 51,149 | |
Accrued management fee | 30,760 | |
Distribution and service plan fees payable | 23,345 | |
Other affiliated payables | 15,707 | |
Other payables and accrued expenses | 38,959 | |
Total liabilities | | 3,373,820 |
| | |
Net Assets | | $ 63,061,402 |
Net Assets consist of: | | |
Paid in capital | | $ 52,815,045 |
Accumulated net investment loss | | (149,267) |
Accumulated undistributed net realized gain (loss) on investments and foreign currency transactions | | 2,900,310 |
Net unrealized appreciation (depreciation) on investments and assets and liabilities in foreign currencies | | 7,495,314 |
Net Assets | | $ 63,061,402 |
Statement of Assets and Liabilities - continued
| July 31, 2012 |
| | |
Calculation of Maximum Offering Price Class A:
Net Asset Value and redemption price per share ($26,546,565 ÷ 1,636,800 shares) | | $ 16.22 |
| | |
Maximum offering price per share (100/94.25 of $16.22) | | $ 17.21 |
Class T:
Net Asset Value and redemption price per share ($10,447,481 ÷ 671,015 shares) | | $ 15.57 |
| | |
Maximum offering price per share (100/96.50 of $15.57) | | $ 16.13 |
Class B:
Net Asset Value and offering price per share ($2,576,745 ÷ 181,078 shares)A | | $ 14.23 |
| | |
Class C:
Net Asset Value and offering price per share ($13,506,974 ÷ 946,447 shares)A | | $ 14.27 |
| | |
Institutional Class:
Net Asset Value, offering price and redemption price per share ($9,983,637 ÷ 585,984 shares) | | $ 17.04 |
A Redemption price per share is equal to net asset value less any applicable contingent deferred sales charge.
See accompanying notes which are an integral part of the financial statements.
Annual Report
Statement of Operations
| Year ended July 31, 2012 |
| | |
Investment Income | | |
Dividends | | $ 767,042 |
Interest | | 1 |
Income from Fidelity Central Funds (including $50,595 from security lending) | | 51,400 |
Total income | | 818,443 |
| | |
Expenses | | |
Management fee | $ 326,030 | |
Transfer agent fees | 155,087 | |
Distribution and service plan fees | 230,531 | |
Accounting and security lending fees | 23,140 | |
Custodian fees and expenses | 18,195 | |
Independent trustees' compensation | 384 | |
Registration fees | 56,525 | |
Audit | 56,356 | |
Legal | 178 | |
Interest | 523 | |
Miscellaneous | 491 | |
Total expenses before reductions | 867,440 | |
Expense reductions | (4,472) | 862,968 |
Net investment income (loss) | | (44,525) |
Realized and Unrealized Gain (Loss) Net realized gain (loss) on: | | |
Investment securities: | | |
Unaffiliated issuers (net of foreign taxes of $4,920) | 3,550,922 | |
Foreign currency transactions | (8,518) | |
Total net realized gain (loss) | | 3,542,404 |
Change in net unrealized appreciation (depreciation) on: Investment securities (net of decrease in deferred foreign taxes of $6,492) | 761,905 | |
Assets and liabilities in foreign currencies | 467 | |
Total change in net unrealized appreciation (depreciation) | | 762,372 |
Net gain (loss) | | 4,304,776 |
Net increase (decrease) in net assets resulting from operations | | $ 4,260,251 |
Statement of Changes in Net Assets
| Year ended
July 31,
2012 | Year ended
July 31,
2011 |
Increase (Decrease) in Net Assets | | |
Operations | | |
Net investment income (loss) | $ (44,525) | $ (180,164) |
Net realized gain (loss) | 3,542,404 | 5,895,581 |
Change in net unrealized appreciation (depreciation) | 762,372 | 6,053,008 |
Net increase (decrease) in net assets resulting from operations | 4,260,251 | 11,768,425 |
Distributions to shareholders from net investment income | (82,290) | - |
Distributions to shareholders from net realized gain | (2,716,672) | - |
Total distributions | (2,798,962) | - |
Share transactions - net increase (decrease) | 8,335,613 | (7,894,650) |
Redemption fees | 3,533 | 1,559 |
Total increase (decrease) in net assets | 9,800,435 | 3,875,334 |
| | |
Net Assets | | |
Beginning of period | 53,260,967 | 49,385,633 |
End of period (including accumulated net investment loss of $149,267 and accumulated net investment loss of
$8,467, respectively) | $ 63,061,402 | $ 53,260,967 |
See accompanying notes which are an integral part of the financial statements.
Annual Report
Financial Highlights - Class A
Years ended July 31, | 2012 | 2011 | 2010 | 2009 | 2008 |
Selected Per-Share Data | | | | | |
Net asset value, beginning of period | $ 16.00 | $ 12.75 | $ 10.26 | $ 11.41 | $ 15.89 |
Income from Investment Operations | | | | | |
Net investment income (loss) C | .01 | (.02) | (.02) | .04 | .02 |
Net realized and unrealized gain (loss) | 1.07 | 3.27 | 2.51 | (1.16) | (3.09) |
Total from investment operations | 1.08 | 3.25 | 2.49 | (1.12) | (3.07) |
Distributions from net investment income | (.03) | - | - | (.03) | - |
Distributions from net realized gain | (.83) | - | - | - | (1.41) |
Total distributions | (.86) | - | - | (.03) | (1.41) |
Redemption fees added to paid in capital C, G | - | - | - | - | - |
Net asset value, end of period | $ 16.22 | $ 16.00 | $ 12.75 | $ 10.26 | $ 11.41 |
Total Return A, B | 7.96% | 25.49% | 24.27% | (9.81)% | (21.24)% |
Ratios to Average Net Assets D, F | | | | | |
Expenses before reductions | 1.38% | 1.39% | 1.44% | 1.62% | 1.40% |
Expenses net of fee waivers, if any | 1.38% | 1.39% | 1.40% | 1.40% | 1.40% |
Expenses net of all reductions | 1.37% | 1.38% | 1.39% | 1.40% | 1.40% |
Net investment income (loss) | .04% | (.15)% | (.15)% | .42% | .15% |
Supplemental Data | | | | | |
Net assets, end of period (000 omitted) | $ 26,547 | $ 23,447 | $ 19,423 | $ 13,010 | $ 11,899 |
Portfolio turnover rate E | 217% | 179% | 163% | 99% | 63% |
A Total returns would have been lower if certain expenses had not been reduced during the applicable periods shown.
B Total returns do not include the effect of the sales charges.
C Calculated based on average shares outstanding during the period.
D Fees and expenses of any underlying Fidelity Central Funds are not included in the Fund's expense ratio. The Fund indirectly bears its proportionate share of the expenses of any underlying Fidelity Central Funds.
E Amount does not include the portfolio activity of any underlying Fidelity Central Funds.
F Expense ratios reflect operating expenses of the class. Expenses before reductions do not reflect amounts reimbursed by the investment adviser or reductions from brokerage service arrangements or reductions from other expense offset arrangements and do not represent the amount paid by the class during periods when reimbursements or reductions occur. Expenses net of fee waivers reflect expenses after reimbursement by the investment adviser but prior to reductions from brokerage service arrangements or other expense offset arrangements. Expenses net of all reductions represent the net expenses paid by the class.
G Amount represents less than $.01 per share.
Financial Highlights - Class T
Years ended July 31, | 2012 | 2011 | 2010 | 2009 | 2008 |
Selected Per-Share Data | | | | | |
Net asset value, beginning of period | $ 15.43 | $ 12.32 | $ 9.94 | $ 11.07 | $ 15.47 |
Income from Investment Operations | | | | | |
Net investment income (loss) C | (.03) | (.06) | (.05) | .01 | (.01) |
Net realized and unrealized gain (loss) | 1.02 | 3.17 | 2.43 | (1.12) | (3.00) |
Total from investment operations | .99 | 3.11 | 2.38 | (1.11) | (3.01) |
Distributions from net investment income | (.02) | - | - | (.02) | - |
Distributions from net realized gain | (.83) | - | - | - | (1.39) |
Total distributions | (.85) | - | - | (.02) | (1.39) |
Redemption fees added to paid in capital C, G | - | - | - | - | - |
Net asset value, end of period | $ 15.57 | $ 15.43 | $ 12.32 | $ 9.94 | $ 11.07 |
Total Return A, B | 7.62% | 25.24% | 23.94% | (10.04)% | (21.41)% |
Ratios to Average Net Assets D, F | | | | | |
Expenses before reductions | 1.64% | 1.66% | 1.71% | 1.89% | 1.64% |
Expenses net of fee waivers, if any | 1.64% | 1.65% | 1.65% | 1.65% | 1.64% |
Expenses net of all reductions | 1.63% | 1.64% | 1.64% | 1.65% | 1.62% |
Net investment income (loss) | (.23)% | (.40)% | (.40)% | .17% | (.08)% |
Supplemental Data | | | | | |
Net assets, end of period (000 omitted) | $ 10,447 | $ 9,897 | $ 8,018 | $ 6,738 | $ 9,095 |
Portfolio turnover rate E | 217% | 179% | 163% | 99% | 63% |
A Total returns would have been lower if certain expenses had not been reduced during the applicable periods shown.
B Total returns do not include the effect of the sales charges.
C Calculated based on average shares outstanding during the period.
D Fees and expenses of any underlying Fidelity Central Funds are not included in the Fund's expense ratio. The Fund indirectly bears its proportionate share of the expenses of any underlying Fidelity Central Funds.
E Amount does not include the portfolio activity of any underlying Fidelity Central Funds.
F Expense ratios reflect operating expenses of the class. Expenses before reductions do not reflect amounts reimbursed by the investment adviser or reductions from brokerage service arrangements or reductions from other expense offset arrangements and do not represent the amount paid by the class during periods when reimbursements or reductions occur. Expenses net of fee waivers reflect expenses after reimbursement by the investment adviser but prior to reductions from brokerage service arrangements or other expense offset arrangements. Expenses net of all reductions represent the net expenses paid by the class.
G Amount represents less than $.01 per share.
See accompanying notes which are an integral part of the financial statements.
Annual Report
Financial Highlights - Class B
Years ended July 31, | 2012 | 2011 | 2010 | 2009 | 2008 |
Selected Per-Share Data | | | | | |
Net asset value, beginning of period | $ 14.23 | $ 11.42 | $ 9.26 | $ 10.35 | $ 14.56 |
Income from Investment Operations | | | | | |
Net investment income (loss) C | (.10) | (.12) | (.10) | (.03) | (.07) |
Net realized and unrealized gain (loss) | .93 | 2.93 | 2.26 | (1.06) | (2.81) |
Total from investment operations | .83 | 2.81 | 2.16 | (1.09) | (2.88) |
Distributions from net realized gain | (.83) | - | - | - | (1.33) |
Redemption fees added to paid in capital C, G | - | - | - | - | - |
Net asset value, end of period | $ 14.23 | $ 14.23 | $ 11.42 | $ 9.26 | $ 10.35 |
Total Return A, B | 7.11% | 24.61% | 23.33% | (10.53)% | (21.80)% |
Ratios to Average Net Assets D, F | | | | | |
Expenses before reductions | 2.13% | 2.15% | 2.21% | 2.38% | 2.14% |
Expenses net of fee waivers, if any | 2.13% | 2.15% | 2.15% | 2.15% | 2.14% |
Expenses net of all reductions | 2.12% | 2.13% | 2.14% | 2.15% | 2.14% |
Net investment income (loss) | (.72)% | (.90)% | (.90)% | (.33)% | (.60)% |
Supplemental Data | | | | | |
Net assets, end of period (000 omitted) | $ 2,577 | $ 3,170 | $ 3,643 | $ 3,550 | $ 5,090 |
Portfolio turnover rate E | 217% | 179% | 163% | 99% | 63% |
A Total returns would have been lower if certain expenses had not been reduced during the applicable periods shown.
B Total returns do not include the effect of the contingent deferred sales charge.
C Calculated based on average shares outstanding during the period.
D Fees and expenses of any underlying Fidelity Central Funds are not included in the Fund's expense ratio. The Fund indirectly bears its proportionate share of the expenses of any underlying Fidelity Central Funds.
E Amount does not include the portfolio activity of any underlying Fidelity Central Funds.
F Expense ratios reflect operating expenses of the class. Expenses before reductions do not reflect amounts reimbursed by the investment adviser or reductions from brokerage service arrangements or reductions from other expense offset arrangements and do not represent the amount paid by the class during periods when reimbursements or reductions occur. Expenses net of fee waivers reflect expenses after reimbursement by the investment adviser but prior to reductions from brokerage service arrangements or other expense offset arrangements. Expenses net of all reductions represent the net expenses paid by the class.
G Amount represents less than $.01 per share.
Financial Highlights - Class C
Years ended July 31, | 2012 | 2011 | 2010 | 2009 | 2008 |
Selected Per-Share Data | | | | | |
Net asset value, beginning of period | $ 14.26 | $ 11.44 | $ 9.27 | $ 10.37 | $ 14.59 |
Income from Investment Operations | | | | | |
Net investment income (loss) C | (.09) | (.12) | (.10) | (.03) | (.07) |
Net realized and unrealized gain (loss) | .93 | 2.94 | 2.27 | (1.07) | (2.81) |
Total from investment operations | .84 | 2.82 | 2.17 | (1.10) | (2.88) |
Distributions from net realized gain | (.83) | - | - | - | (1.34) |
Redemption fees added to paid in capital C, G | - | - | - | - | - |
Net asset value, end of period | $ 14.27 | $ 14.26 | $ 11.44 | $ 9.27 | $ 10.37 |
Total Return A, B | 7.17% | 24.65% | 23.41% | (10.61)% | (21.77)% |
Ratios to Average Net Assets D, F | | | | | |
Expenses before reductions | 2.09% | 2.11% | 2.12% | 2.38% | 2.15% |
Expenses net of fee waivers, if any | 2.09% | 2.11% | 2.12% | 2.15% | 2.15% |
Expenses net of all reductions | 2.08% | 2.09% | 2.11% | 2.15% | 2.14% |
Net investment income (loss) | (.68)% | (.86)% | (.87)% | (.33)% | (.60)% |
Supplemental Data | | | | | |
Net assets, end of period (000 omitted) | $ 13,507 | $ 7,341 | $ 9,288 | $ 2,955 | $ 3,430 |
Portfolio turnover rate E | 217% | 179% | 163% | 99% | 63% |
A Total returns would have been lower if certain expenses had not been reduced during the applicable periods shown.
B Total returns do not include the effect of the contingent deferred sales charge.
C Calculated based on average shares outstanding during the period.
D Fees and expenses of any underlying Fidelity Central Funds are not included in the Fund's expense ratio. The Fund indirectly bears its proportionate share of the expenses of any underlying Fidelity Central Funds.
E Amount does not include the portfolio activity of any underlying Fidelity Central Funds.
F Expense ratios reflect operating expenses of the class. Expenses before reductions do not reflect amounts reimbursed by the investment adviser or reductions from brokerage service arrangements or reductions from other expense offset arrangements and do not represent the amount paid by the class during periods when reimbursements or reductions occur. Expenses net of fee waivers reflect expenses after reimbursement by the investment adviser but prior to reductions from brokerage service arrangements or other expense offset arrangements. Expenses net of all reductions represent the net expenses paid by the class.
G Amount represents less than $.01 per share.
See accompanying notes which are an integral part of the financial statements.
Annual Report
Financial Highlights - Institutional Class
Years ended July 31, | 2012 | 2011 | 2010 | 2009 | 2008 |
Selected Per-Share Data | | | | | |
Net asset value, beginning of period | $ 16.72 | $ 13.27 | $ 10.66 | $ 11.84 | $ 16.41 |
Income from Investment Operations | | | | | |
Net investment income (loss) B | .07 | .03 | .02 | .06 | .06 |
Net realized and unrealized gain (loss) | 1.13 | 3.42 | 2.60 | (1.20) | (3.22) |
Total from investment operations | 1.20 | 3.45 | 2.62 | (1.14) | (3.16) |
Distributions from net investment income | (.05) | - | (.01) | (.04) | - |
Distributions from net realized gain | (.83) | - | - | - | (1.41) |
Total distributions | (.88) | - | (.01) | (.04) | (1.41) |
Redemption fees added to paid in capital B, F | - | - | - | - | - |
Net asset value, end of period | $ 17.04 | $ 16.72 | $ 13.27 | $ 10.66 | $ 11.84 |
Total Return A | 8.33% | 26.00% | 24.62% | (9.59)% | (21.09)% |
Ratios to Average Net Assets C, E | | | | | |
Expenses before reductions | 1.00% | 1.03% | 1.09% | 1.15% | 1.14% |
Expenses net of fee waivers, if any | 1.00% | 1.03% | 1.09% | 1.15% | 1.14% |
Expenses net of all reductions | .99% | 1.01% | 1.08% | 1.15% | 1.14% |
Net investment income (loss) | .41% | .22% | .16% | .67% | .40% |
Supplemental Data | | | | | |
Net assets, end of period (000 omitted) | $ 9,984 | $ 9,406 | $ 9,013 | $ 5,990 | $ 398 |
Portfolio turnover rate D | 217% | 179% | 163% | 99% | 63% |
A Total returns would have been lower if certain expenses had not been reduced during the applicable periods shown.
B Calculated based on average shares outstanding during the period.
C Fees and expenses of any underlying Fidelity Central Funds are not included in the Fund's expense ratio. The Fund indirectly bears its proportionate share of the expenses of any underlying Fidelity Central Funds.
D Amount does not include the portfolio activity of any underlying Fidelity Central Funds.
E Expense ratios reflect operating expenses of the class. Expenses before reductions do not reflect amounts reimbursed by the investment adviser or reductions from brokerage service arrangements or reductions from other expense offset arrangements and do not represent the amount paid by the class during periods when reimbursements or reductions occur. Expenses net of fee waivers reflect expenses after reimbursement by the investment adviser but prior to reductions from brokerage service arrangements or other expense offset arrangements. Expenses net of all reductions represent the net expenses paid by the class.
F Amount represents less than $.01 per share.
See accompanying notes which are an integral part of the financial statements.
Annual Report
Fidelity Advisor Consumer Discretionary Fund
Notes to Financial Statements
For the period ended July 31, 2012
1. Organization.
Fidelity Advisor Consumer Discretionary Fund (the Fund) is a non-diversified fund of Fidelity Advisor Series VII (the Trust) and is authorized to issue an unlimited number of shares. The Trust is registered under the Investment Company Act of 1940, as amended (the 1940 Act), as an open-end management investment company organized as a Massachusetts business trust. The Fund offers Class A, Class T, Class C and Institutional Class shares, each of which, along with Class B shares, has equal rights as to assets and voting privileges. Effective after the close of business on September 1, 2010, Class B shares were closed to new accounts and additional purchases, except for exchanges and reinvestments. Each class has exclusive voting rights with respect to matters that affect that class. Class B shares will automatically convert to Class A shares after a holding period of seven years from the initial date of purchase. Investment income, realized and unrealized capital gains and losses, the common expenses of the Fund, and certain fund-level expense reductions, if any, are allocated on a pro-rata basis to each class based on the relative net assets of each class to the total net assets of the Fund. Each class differs with respect to transfer agent and distribution and service plan fees incurred. Certain expense reductions may also differ by class.
2. Investments in Fidelity Central Funds.
The Fund invests in Fidelity Central Funds, which are open-end investment companies available only to other investment companies and accounts managed by Fidelity Management & Research Company (FMR) and its affiliates. The Fund's Schedule of Investments lists each of the Fidelity Central Funds held as of period end, if any, as an investment of the Fund, but does not include the underlying holdings of each Fidelity Central Fund. As an Investing Fund, the Fund indirectly bears its proportionate share of the expenses of the underlying Fidelity Central Funds.
The Money Market Central Funds seek preservation of capital and current income and are managed by Fidelity Investments Money Management, Inc. (FIMM), an affiliate of FMR.
A complete unaudited list of holdings for each Fidelity Central Fund is available upon request or at the Securities and Exchange Commission (the SEC) web site at www.sec.gov. In addition, the financial statements of the Fidelity Central Funds, which are not covered by the Fund's Report of Independent Registered Public Accounting Firm, are available on the SEC web site or upon request.
3. Significant Accounting Policies.
The financial statements have been prepared in conformity with accounting principles generally accepted in the United States of America (GAAP), which require management to make certain estimates and assumptions at the date of the financial statements. Actual results could differ from those estimates. Subsequent events, if any, through the date that the financial statements were issued have been evaluated in the preparation of the financial statements. The following summarizes the significant accounting policies of the Fund:
Security Valuation. Investments are valued as of 4:00 p.m. Eastern time on the last calendar day of the period. In accordance with valuation policies and procedures approved by the Board of Trustees (the Board), the Fund attempts to obtain prices from one or more third party pricing vendor or broker to value its investments. When current market prices, quotations or rates are not readily available or reliable, securities will be fair valued in good faith by the FMR Fair Value Committee (the Committee), in accordance with procedures adopted by the Fund's Board. Factors used in determining fair value vary by security type and may include market or security specific events. The frequency with which these procedures are used cannot be predicted and they may be utilized to a significant extent. The Committee oversees the Fund's valuation policies and procedures and is responsible for approving and reporting to the Board all fair value determinations.
The Fund categorizes the inputs to valuation techniques used to value its investments into a disclosure hierarchy consisting of three levels as shown below:
Level 1 - quoted prices in active markets for identical investments
Level 2 - other significant observable inputs (including quoted prices for similar investments, interest rates, prepayment speeds, etc.)
Level 3 - unobservable inputs (including the Fund's own assumptions based on the best information available)
Valuation techniques used to value the Fund's investments by major category are as follows:
Equity securities, including restricted securities, for which market quotations are readily available, are valued at the last reported sale price or official closing price as reported by a third party pricing vendor on the primary market or exchange on which they are traded and are categorized as Level 1 in the hierarchy. In the event there were no sales during the day or closing prices are not available, securities are valued at the last quoted bid price or may be valued using the last available price and are generally categorized as Level 2 in the hierarchy. For foreign equity securities, when significant market or security specific events arise, comparisons to the valuation of American Depositary Receipts (ADRs), futures contracts, Exchange-Traded Funds (ETFs) and certain indexes as well as quoted prices for similar securities are used and are categorized as Level 2 in the hierarchy. Utilizing these techniques may result in transfers between Level 1 and Level 2.
Annual Report
Fidelity Advisor Consumer Discretionary Fund
Notes to Financial Statements - continued
3. Significant Accounting Policies - continued
Security Valuation - continued
Investments in open-end mutual funds, including the Fidelity Central Funds, are valued at their closing net asset value each business day and are categorized as Level 1 in the hierarchy.
Changes in valuation techniques may result in transfers in or out of an assigned level within the disclosure hierarchy.
Foreign Currency Translation. The Fund may use foreign currency contracts to facilitate transactions in foreign-denominated securities. Gains and losses from these transactions may arise from changes in the value of the foreign currency or if the counterparties do not perform under the contracts' terms.
Foreign-denominated assets, including investment securities, and liabilities are translated into U.S. dollars at the exchange rates at period end. Purchases and sales of investment securities, income and dividends received and expenses denominated in foreign currencies are translated into U.S. dollars at the exchange rate in effect on the transaction date.
The effects of exchange rate fluctuations on investments are included with the net realized and unrealized gain (loss) on investment securities. Other foreign currency transactions resulting in realized and unrealized gain (loss) are disclosed separately.
Investment Transactions and Income. For financial reporting purposes, the Fund's investment holdings and NAV include trades executed through the end of the last business day of the period. The NAV per share for processing shareholder transactions is calculated as of the close of business of the New York Stock Exchange (NYSE), normally 4:00 p.m. Eastern time and includes trades executed through the end of the prior business day. Gains and losses on securities sold are determined on the basis of identified cost and may include proceeds received from litigation. Dividend income is recorded on the ex-dividend date, except for certain dividends from foreign securities where the ex-dividend date may have passed, which are recorded as soon as the Fund is informed of the ex-dividend date. Non-cash dividends included in dividend income, if any, are recorded at the fair market value of the securities received. Distributions received on securities that represent a return of capital or capital gain are recorded as a reduction of cost of investments and/or as a realized gain. The Fund estimates the components of distributions received that may be considered return of capital distributions or capital gain distributions. Interest income and distributions from the Fidelity Central Funds are accrued as earned. Interest income includes coupon interest and amortization of premium and accretion of discount on debt securities. Investment income is recorded net of foreign taxes withheld where recovery of such taxes is uncertain.
Expenses. Expenses directly attributable to a fund are charged to that fund. Expenses attributable to more than one fund are allocated among the respective funds on the basis of relative net assets or other appropriate methods. Expense estimates are accrued in the period to which they relate and adjustments are made when actual amounts are known.
Income Tax Information and Distributions to Shareholders. Each year, the Fund intends to qualify as a regulated investment company under Subchapter M of the Internal Revenue Code, including distributing substantially all of its taxable income and realized gains. As a result, no provision for income taxes is required. As of July 31, 2012, the Fund did not have any unrecognized tax benefits in the financial statements; nor is the Fund aware of any tax positions for which it is reasonably possible that the total amounts of unrecognized tax benefits will significantly change in the next twelve months. The Fund files a U.S. federal tax return, in addition to state and local tax returns as required. A fund's federal income tax returns are subject to examination by the Internal Revenue Service (IRS) for a period of three fiscal years after they are filed. State and local tax returns may be subject to examination for an additional fiscal year depending on the jurisdiction. Foreign taxes are provided for based on the Fund's understanding of the tax rules and rates that exist in the foreign markets in which it invests.
Distributions are declared and recorded on the ex-dividend date. Income dividends and capital gain distributions are declared separately for each class. Income and capital gain distributions are determined in accordance with income tax regulations, which may differ from GAAP. In addition, the Fund claimed a portion of the payment made to redeeming shareholders as a distribution for income tax purposes.
Capital accounts within the financial statements are adjusted for permanent book-tax differences. These adjustments have no impact on net assets or the results of operations. Temporary book-tax differences will reverse in a subsequent period.
Book-tax differences are primarily due to foreign currency transactions, certain foreign taxes, deferred trustees compensation and losses deferred due to wash sales and excise tax regulations.
The federal tax cost of investment securities and unrealized appreciation (depreciation) as of period end were as follows:
Gross unrealized appreciation | $ 8,537,826 |
Gross unrealized depreciation | (1,468,209) |
Net unrealized appreciation (depreciation) on securities and other investments | $ 7,069,617 |
| |
Tax Cost | $ 56,496,538 |
Annual Report
3. Significant Accounting Policies - continued
Income Tax Information and Distributions to Shareholders - continued
The tax-based components of distributable earnings as of period end were as follows:
Undistributed long-term capital gain | $ 3,326,104 |
Net unrealized appreciation (depreciation) | $ 7,069,520 |
The tax character of distributions paid was as follows:
| July 31, 2012 | July 31, 2011 |
Ordinary Income | $ 82,290 | $ - |
Long-term Capital Gains | 2,716,672 | - |
Total | $ 2,798,962 | $ - |
Short-Term Trading (Redemption) Fees. Shares held by investors in the Fund less than 30 days are subject to a redemption fee equal to .75% of the net asset value of shares redeemed. All redemption fees, which reduce the proceeds of the shareholder redemption, are retained by the Fund and accounted for as an addition to paid in capital.
New Accounting Pronouncement. In December 2011, the Financial Accounting Standards Board issued Accounting Standard Update No. 2011-11, Disclosures about Offsetting Assets and Liabilities. The update creates new disclosure requirements requiring entities to disclose both gross and net information for derivatives and other financial instruments that are either offset in the Statement of Assets and Liabilities or subject to an enforceable master netting arrangement or similar agreement. The disclosure requirements are effective for interim and annual reporting periods beginning on or after January 1, 2013. Management is currently evaluating the impact of the update's adoption on the Fund's financial statement disclosures.
4. Purchases and Sales of Investments.
Purchases and sales of securities, other than short-term securities, aggregated $132,408,875 and $127,632,717, respectively.
5. Fees and Other Transactions with Affiliates.
Management Fee. FMR and its affiliates provide the Fund with investment management related services for which the Fund pays a monthly management fee. The management fee is the sum of an individual fund fee rate that is based on an annual rate of .30% of the Fund's average net assets and an annualized group fee rate that averaged .26% during the period. The group fee rate is based upon the average net assets of all the mutual funds advised by FMR. The group fee rate decreases as assets under management increase and increases as assets under management decrease. For the period, the total annual management fee rate was .56% of the Fund's average net assets.
Distribution and Service Plan Fees. In accordance with Rule 12b-1 of the 1940 Act, the Fund has adopted separate Distribution and Service Plans for each class of shares. Certain classes pay Fidelity Distributors Corporation (FDC), an affiliate of FMR, separate Distribution and Service Fees, each of which is based on an annual percentage of each class' average net assets. In addition, FDC may pay financial intermediaries for selling shares of the Fund and providing shareholder support services. For the period, the Distribution and Service Fee rates, total fees and amounts retained by FDC were as follows:
| Distribution
Fee | Service
Fee | Total Fees | Retained
by FDC |
Class A | -% | .25% | $ 55,927 | $ 1,999 |
Class T | .25% | .25% | 48,616 | 36 |
Class B | .75% | .25% | 28,529 | 21,409 |
Class C | .75% | .25% | 97,459 | 17,622 |
| | | $ 230,531 | $ 41,066 |
Sales Load. FDC may receive a front-end sales charge of up to 5.75% for selling Class A shares and 3.50% for selling Class T shares, some of which is paid to financial intermediaries for selling shares of the Fund. Depending on the holding period, FDC may receive contingent deferred sales charges levied on Class A, Class T, Class B, and Class C redemptions. The deferred sales charges range from 5.00% to 1.00% for Class B shares, 1.00% for Class C shares, 1.00% for certain purchases of Class A shares and .25% for certain purchases of Class T shares.
Annual Report
Fidelity Advisor Consumer Discretionary Fund
Notes to Financial Statements - continued
5. Fees and Other Transactions with Affiliates - continued
Sales Load - continued
For the period, sales charge amounts retained by FDC were as follows:
| Retained
by FDC |
Class A | $ 22,837 |
Class T | 4,056 |
Class B* | 3,769 |
Class C* | 776 |
| $ 31,438 |
* When Class B and Class C shares are initially sold, FDC pays commissions from its own resources to financial intermediaries through which the sales are made.
Transfer Agent Fees. Fidelity Investments Institutional Operations Company, Inc. (FIIOC), an affiliate of FMR, is the transfer, dividend disbursing and shareholder servicing agent for each class of the Fund. FIIOC receives account fees and asset-based fees that vary according to the account size and type of account of the shareholders of the respective classes of the Fund. FIIOC pays for typesetting, printing and mailing of shareholder reports, except proxy statements. For the period, transfer agent fees for each class were as follows:
| Amount | % of
Average
Net Assets |
Class A | $ 66,861 | .30 |
Class T | 30,637 | .32 |
Class B | 8,681 | .30 |
Class C | 25,473 | .26 |
Institutional Class | 23,435 | .17 |
| $ 155,087 | |
Accounting and Security Lending Fees. Fidelity Service Company, Inc. (FSC), an affiliate of FMR, maintains the Fund's accounting records. The accounting fee is based on the level of average net assets for each month. Under a separate contract, FSC administers the security lending program. The security lending fee is based on the number and duration of lending transactions.
Brokerage Commissions. The Fund placed a portion of its portfolio transactions with brokerage firms which are affiliates of the investment adviser. The commissions paid to these affiliated firms were $4,616 for the period.
6. Committed Line of Credit.
The Fund participates with other funds managed by FMR or an affiliate in a $4.25 billion credit facility (the "line of credit") to be utilized for temporary or emergency purposes to fund shareholder redemptions or for other short-term liquidity purposes. The Fund has agreed to pay commitment fees on its pro-rata portion of the line of credit, which amounted to $162 and is reflected in Miscellaneous expenses on the Statement of Operations. During the period, there were no borrowings on this line of credit.
7. Security Lending.
The Fund lends portfolio securities through a lending agent from time to time in order to earn additional income. For equity securities, a lending agent is used and may loan securities to certain qualified borrowers, including Fidelity Capital Markets (FCM), a broker-dealer affiliated with the Fund. On the settlement date of the loan, the Fund receives collateral (in the form of U.S. Treasury obligations, letters of credit and/or cash) against the loaned securities and maintains collateral in an amount not less than 100% of the market value of the loaned securities during the period of the loan. The market value of the loaned securities is determined at the close of business of the Fund and any additional required collateral is delivered to the Fund on the next business day. If the borrower defaults on its obligation to return the securities loaned because of insolvency or other reasons, a fund could experience delays and costs in recovering the securities loaned or in gaining access to the collateral. Any cash collateral received is invested in the Fidelity Securities Lending Cash Central Fund. At period end, there were no security loans outstanding. Security lending income represents the income earned on investing cash collateral, less rebates paid to borrowers and any lending agent fees associated with the loan, plus any premium payments received for lending certain types of securities. Security lending income is presented in the Statement of Operations as a component of income from Fidelity Central Funds. During the period, there were no securities loaned to FCM.
Annual Report
8. Bank Borrowings.
The Fund is permitted to have bank borrowings for temporary or emergency purposes to fund shareholder redemptions or for other short-term liquidity requirements. The Fund has established borrowing arrangements with certain banks. The interest rate on the borrowings is the bank's base rate, as revised from time to time. The average loan balance during the period for which loans were outstanding amounted to $9,423,333. The weighted average interest rate was .67%. The interest expense amounted to $523 under the bank borrowing program. At period end, there were no bank borrowings outstanding.
9. Expense Reductions.
Many of the brokers with whom FMR places trades on behalf of the Fund provided services to the Fund in addition to trade execution. These services included payments of certain expenses on behalf of the Fund totaling $4,472 for the period.
10. Distributions to Shareholders.
Distributions to shareholders of each class were as follows:
Years ended July 31, | 2012 | 2011 |
From net investment income | | |
Class A | $ 44,402 | $ - |
Class T | 11,934 | - |
Institutional Class | 25,954 | - |
Total | $ 82,290 | $ - |
From net realized gain | | |
Class A | $ 1,117,697 | $ - |
Class T | 525,372 | - |
Class B | 185,641 | - |
Class C | 423,815 | - |
Institutional Class | 464,147 | - |
Total | $ 2,716,672 | $ - |
11. Share Transactions.
Transactions for each class of shares were as follows:
| Shares | Dollars |
Years ended July 31, | 2012 | 2011 | 2012 | 2011 |
Class A | | | | |
Shares sold | 717,075 | 665,093 | $ 11,323,395 | $ 10,095,802 |
Reinvestment of distributions | 76,740 | - | 1,020,698 | - |
Shares redeemed | (622,172) | (723,296) | (9,280,575) | (10,778,369) |
Net increase (decrease) | 171,643 | (58,203) | $ 3,063,518 | $ (682,567) |
Class T | | | | |
Shares sold | 117,936 | 187,572 | $ 1,759,305 | $ 2,764,268 |
Reinvestment of distributions | 40,961 | - | 523,233 | - |
Shares redeemed | (129,403) | (196,717) | (1,880,946) | (2,907,152) |
Net increase (decrease) | 29,494 | (9,145) | $ 401,592 | $ (142,884) |
Class B | | | | |
Shares sold | 21,180 | 40,939 | $ 276,635 | $ 519,870 |
Reinvestment of distributions | 13,190 | - | 154,193 | - |
Shares redeemed | (76,089) | (137,051) | (1,037,384) | (1,818,569) |
Net increase (decrease) | (41,719) | (96,112) | $ (606,556) | $ (1,298,699) |
Class C | | | | |
Shares sold | 581,986 | 588,992 | $ 8,055,378 | $ 8,103,013 |
Reinvestment of distributions | 33,472 | - | 392,295 | - |
Shares redeemed | (183,759) | (885,890) | (2,469,033) | (12,399,353) |
Net increase (decrease) | 431,699 | (296,898) | $ 5,978,640 | $ (4,296,340) |
Annual Report
Fidelity Advisor Consumer Discretionary Fund
Notes to Financial Statements - continued
11. Share Transactions - continued
| Shares | Dollars |
Years ended July 31, | 2012 | 2011 | 2012 | 2011 |
Institutional Class | | | | |
Shares sold | 1,043,471 | 346,649 | $ 16,050,433 | $ 5,583,185 |
Reinvestment of distributions | 13,483 | - | 188,283 | - |
Shares redeemed | (1,033,551) | (463,053) | (16,740,297) | (7,057,345) |
Net increase (decrease) | 23,403 | (116,404) | $ (501,581) | $ (1,474,160) |
12. Other.
The Fund's organizational documents provide former and current trustees and officers with a limited indemnification against liabilities arising in connection with the performance of their duties to the Fund. In the normal course of business, the Fund may also enter into contracts that provide general indemnifications. The Fund's maximum exposure under these arrangements is unknown as this would be dependent on future claims that may be made against the Fund. The risk of material loss from such claims is considered remote.
Annual Report
Fidelity Advisor Electronics Fund - Institutional Class
Performance: The Bottom Line
Average annual total return reflects the change in the value of an investment, assuming reinvestment of the class' distributions from dividend income and capital gains (the profits earned upon the sale of securities that have grown in value, if any) and assuming a constant rate of performance each year. The $10,000 table and the fund's returns do not reflect the deduction of taxes that a shareholder would pay on fund distributions or the redemption of fund shares. During periods of reimbursement by Fidelity, a fund's total return will be greater than it would be had the reimbursement not occurred. How a fund did yesterday is no guarantee of how it will do tomorrow.
Average Annual Total Returns
Periods ended July 31, 2012 | Past 1
year | Past 5
years | Past 10
years |
Institutional Class | -5.11% | -1.19% | 4.58% |
$10,000 Over 10 Years
Let's say hypothetically that $10,000 was invested in Fidelity Advisor Electronics Fund - Institutional Class on July 31, 2002. The chart shows how the value of your investment would have changed, and also shows how the S&P 500 Index performed over the same period.
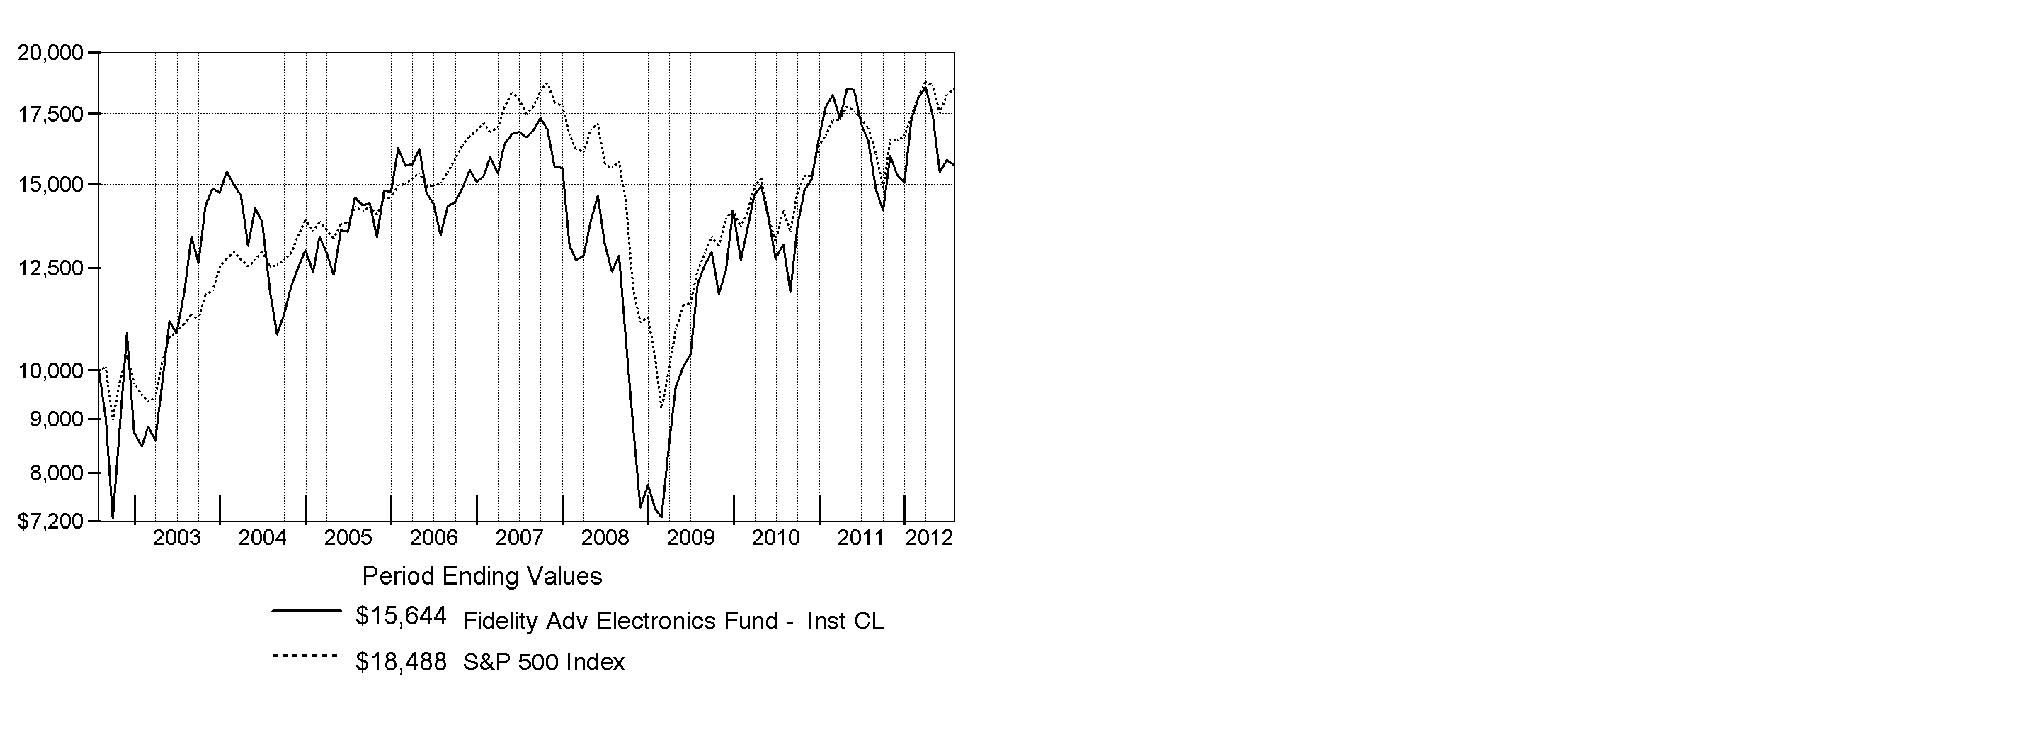
Annual Report
Fidelity Advisor Electronics Fund
Market Recap: Major U.S. equity benchmarks posted solid gains for the year ending July 31, 2012, amid an uncertain investment environment. The broad-based S&P 500® Index returned 9.13%, while the blue-chip-laden Dow Jones Industrial AverageSM and technology-heavy Nasdaq Composite® Index gained 10.12% and 7.83%, respectively. Volatility spiked during the period's first half, as equities plummeted late last summer on Europe's debt woes, political wrangling over the U.S. debt ceiling and the sovereign credit-rating downgrade that followed. By October, a seemingly improved U.S. economy rejuvenated stocks, paving the way for major equity benchmarks to post their best first-quarter performance since 1998. However, more eurozone trouble, signs that the U.S. economy had turned sluggish and a slowdown in China caused stocks to slip in May, before a new wave of optimism took hold in June and July. Within the S&P 500®, more-defensive sectors such as telecommunication services (+30%) and consumer staples (+20%) fared best, while materials and energy significantly underperformed, returning -5%. Small- and mid-cap stocks trailed their less-volatile large-cap counterparts, with the Russell 2000® Index adding 0.19% and the Russell Midcap® Index rising 2.28%. Given turmoil and local currency weakness in Europe, foreign developed-markets stocks lost ground, with the MSCI® EAFE® Index returning -11.32%.
Comments from Stephen Barwikowski and Christopher Lin, Co-Portfolio Managers of Fidelity Advisor® Electronics Fund: For the year, the fund's Institutional Class shares returned -5.11%, trailing the -3.11% return of the MSCI® U.S. IM Semiconductors & Semiconductor Equipment 25/50 Index and also lagging the S&P 500®. Versus the MSCI index, weak stock selection in semiconductors - in large part due to a sizable underweighting in strong-performing benchmark heavyweight Intel - by far the most negative impact on relative performance. That said, Intel was the portfolio's second-best absolute contributor. Substantial overweightings in Intel competitor Advanced Micro Devices and Freescale Semiconductor also hurt relative results. Conversely, stock selection in semiconductor equipment bolstered the fund's performance, as did out-of-index exposure to electronic manufacturing services. At the individual stock level, negligible exposure to weak-performing benchmark component First Solar was timely. Another notable contributor was Skyworks Solutions, a provider of radio frequency components in handsets. We took advantage of temporary weakness in the stock to benefit from its strong rebound beginning in December 2011. Later in the period, we sold some of the position to nail down profits.
The views expressed above reflect those of the portfolio manager(s) only through the end of the period as stated on the cover of this report and do not necessarily represent the views of Fidelity or any other person in the Fidelity organization. Any such views are subject to change at any time based upon market or other conditions and Fidelity disclaims any responsibility to update such views. These views may not be relied on as investment advice and, because investment decisions for a Fidelity fund are based on numerous factors, may not be relied on as an indication of trading intent on behalf of any Fidelity fund.
Annual Report
Fidelity Advisor Electronics Fund
As a shareholder of the Fund, you incur two types of costs: (1) transaction costs, including sales charges (loads) on purchase payments or redemption proceeds, redemption fees and (2) ongoing costs, including management fees, distribution and/or service (12b-1) fees and other Fund expenses. This Example is intended to help you understand your ongoing costs (in dollars) of investing in the Fund and to compare these costs with the ongoing costs of investing in other mutual funds.
The Example is based on an investment of $1,000 invested at the beginning of the period and held for the entire period (February 1, 2012 to July 31, 2012).
Actual Expenses
The first line of the accompanying table for each class of the Fund provides information about actual account values and actual expenses. You may use the information in this line, together with the amount you invested, to estimate the expenses that you paid over the period. Simply divide your account value by $1,000.00 (for example, an $8,600 account value divided by $1,000.00 = 8.6), then multiply the result by the number in the first line for a class of the Fund under the heading entitled "Expenses Paid During Period" to estimate the expenses you paid on your account during this period. In addition, the Fund, as a shareholder in the underlying Fidelity Central Funds, will indirectly bear its pro-rata share of the fees and expenses incurred by the underlying Fidelity Central Funds. These fees and expenses are not included in the Fund's annualized expense ratio used to calculate the expense estimate in the table below.
Hypothetical Example for Comparison Purposes
The second line of the accompanying table for each class of the Fund provides information about hypothetical account values and hypothetical expenses based on a Class' actual expense ratio and an assumed rate of return of 5% per year before expenses, which is not the Class' actual return. The hypothetical account values and expenses may not be used to estimate the actual ending account balance or expenses you paid for the period. You may use this information to compare the ongoing costs of investing in the Fund and other funds. To do so, compare this 5% hypothetical example with the 5% hypothetical examples that appear in the shareholder reports of the other funds. In addition, the Fund, as a shareholder in the underlying Fidelity Central Funds, will indirectly bear its pro-rata share of the fees and expenses incurred by the underlying Fidelity Central Funds. These fees and expenses are not included in the Fund's annualized expense ratio used to calculate the expense estimate in the table below.
Please note that the expenses shown in the table are meant to highlight your ongoing costs only and do not reflect any transaction costs. Therefore, the second line of the table is useful in comparing ongoing costs only, and will not help you determine the relative total costs of owning different funds. In addition, if these transactional costs were included, your costs would have been higher.
| Annualized
Expense Ratio | Beginning
Account Value
February 1, 2012 | Ending
Account Value
July 31, 2012 | Expenses Paid
During Period*
February 1, 2012
to July 31, 2012 |
Class A | 1.40% | | | |
Actual | | $ 1,000.00 | $ 903.70 | $ 6.63 |
HypotheticalA | | $ 1,000.00 | $ 1,017.90 | $ 7.02 |
Class T | 1.65% | | | |
Actual | | $ 1,000.00 | $ 902.50 | $ 7.80 |
HypotheticalA | | $ 1,000.00 | $ 1,016.66 | $ 8.27 |
Class B | 2.15% | | | |
Actual | | $ 1,000.00 | $ 900.60 | $ 10.16 |
HypotheticalA | | $ 1,000.00 | $ 1,014.17 | $ 10.77 |
Class C | 2.15% | | | |
Actual | | $ 1,000.00 | $ 899.40 | $ 10.15 |
HypotheticalA | | $ 1,000.00 | $ 1,014.17 | $ 10.77 |
Institutional Class | 1.15% | | | |
Actual | | $ 1,000.00 | $ 905.50 | $ 5.45 |
HypotheticalA | | $ 1,000.00 | $ 1,019.14 | $ 5.77 |
A 5% return per year before expenses
* Expenses are equal to each Class' annualized expense ratio, multiplied by the average account value over the period, multiplied by 182/366 (to reflect the one-half year period).
Annual Report
Fidelity Advisor Electronics Fund
Investment Changes (Unaudited)
Top Ten Stocks as of July 31, 2012 |
| % of fund's
net assets | % of fund's net assets
6 months ago |
Broadcom Corp. Class A | 9.7 | 8.3 |
Texas Instruments, Inc. | 9.2 | 8.6 |
Altera Corp. | 5.3 | 2.2 |
Freescale Semiconductor Holdings I Ltd. | 5.2 | 3.6 |
Marvell Technology Group Ltd. | 4.8 | 9.1 |
Intersil Corp. Class A | 4.4 | 3.6 |
QUALCOMM, Inc. | 4.2 | 1.9 |
NXP Semiconductors NV | 4.1 | 2.7 |
Avago Technologies Ltd. | 4.1 | 1.8 |
ON Semiconductor Corp. | 3.9 | 3.5 |
| 54.9 | |
Top Industries (% of fund's net assets) |
As of July 31, 2012 |
| Semiconductors & Semiconductor Equipment | 81.1% | |
| Electronic Equipment & Components | 9.2% | |
| Communications Equipment | 6.7% | |
| Computers & Peripherals | 1.3% | |
| Biotechnology | 0.0% | |
| All Others* | 1.7% | |

As of January 31, 2012 |
| Semiconductors & Semiconductor Equipment | 83.8% | |
| Electronic Equipment & Components | 5.4% | |
| Communications Equipment | 2.7% | |
| Computers & Peripherals | 2.4% | |
| Internet Software & Services | 0.7% | |
| All Others* | 5.0% | |

* Includes short-term investments and net other assets. |
Annual Report
Fidelity Advisor Electronics Fund
Investments July 31, 2012
Showing Percentage of Net Assets
Common Stocks - 98.3% |
| Shares | | Value |
BIOTECHNOLOGY - 0.0% |
Biotechnology - 0.0% |
Arrowhead Research Corp. warrants 5/21/17 (a)(e) | 64,879 | | $ 1 |
COMMUNICATIONS EQUIPMENT - 6.7% |
Communications Equipment - 6.7% |
Acme Packet, Inc. (a)(d) | 4,180 | | 66,253 |
Brocade Communications Systems, Inc. (a) | 18,703 | | 92,954 |
Finisar Corp. (a) | 3,872 | | 48,129 |
Polycom, Inc. (a) | 14,178 | | 123,916 |
QUALCOMM, Inc. | 12,107 | | 722,546 |
Riverbed Technology, Inc. (a) | 5,608 | | 98,925 |
| | 1,152,723 |
COMPUTERS & PERIPHERALS - 1.3% |
Computer Hardware - 0.4% |
Hewlett-Packard Co. | 4,070 | | 74,237 |
Computer Storage & Peripherals - 0.9% |
Fusion-io, Inc. (a) | 100 | | 1,912 |
QLogic Corp. (a) | 1,752 | | 20,218 |
SanDisk Corp. (a) | 3,192 | | 131,287 |
Synaptics, Inc. (a) | 70 | | 1,847 |
| | 155,264 |
TOTAL COMPUTERS & PERIPHERALS | | 229,501 |
ELECTRONIC EQUIPMENT & COMPONENTS - 9.2% |
Electronic Components - 1.8% |
Aeroflex Holding Corp. (a) | 32,536 | | 195,541 |
Amphenol Corp. Class A | 130 | | 7,654 |
Corning, Inc. | 4,855 | | 55,396 |
InvenSense, Inc. (d) | 4,216 | | 54,386 |
| | 312,977 |
Electronic Manufacturing Services - 7.4% |
Benchmark Electronics, Inc. (a) | 9,767 | | 153,928 |
Fabrinet (a) | 1,388 | | 18,433 |
Flextronics International Ltd. (a) | 59,219 | | 379,594 |
Jabil Circuit, Inc. | 20,137 | | 436,973 |
TE Connectivity Ltd. | 1,400 | | 46,214 |
TTM Technologies, Inc. (a) | 22,822 | | 249,673 |
Viasystems Group, Inc. (a) | 12 | | 185 |
| | 1,285,000 |
Technology Distributors - 0.0% |
Avnet, Inc. (a) | 180 | | 5,670 |
TOTAL ELECTRONIC EQUIPMENT & COMPONENTS | | 1,603,647 |
SEMICONDUCTORS & SEMICONDUCTOR EQUIPMENT - 81.1% |
Semiconductor Equipment - 4.5% |
Advanced Energy Industries, Inc. (a) | 15 | | 185 |
Amkor Technology, Inc. (a) | 45 | | 240 |
Applied Materials, Inc. | 3,214 | | 35,000 |
|
| Shares | | Value |
ASML Holding NV | 2,770 | | $ 159,275 |
Cabot Microelectronics Corp. | 60 | | 1,764 |
Cohu, Inc. | 20 | | 172 |
Cymer, Inc. (a) | 3,820 | | 218,542 |
Entegris, Inc. (a) | 10,591 | | 85,258 |
KLA-Tencor Corp. | 1,310 | | 66,692 |
Lam Research Corp. (a) | 5,967 | | 205,324 |
MEMC Electronic Materials, Inc. (a) | 82 | | 157 |
Nanometrics, Inc. (a) | 420 | | 6,380 |
Nova Measuring Instruments Ltd. (a) | 280 | | 2,285 |
Teradyne, Inc. (a) | 30 | | 441 |
| | 781,715 |
Semiconductors - 76.6% |
Advanced Micro Devices, Inc. (a) | 93,627 | | 380,126 |
Alpha & Omega Semiconductor Ltd. (a) | 8,434 | | 65,026 |
Altera Corp. | 26,113 | | 925,706 |
Analog Devices, Inc. | 3,240 | | 126,619 |
Applied Micro Circuits Corp. (a) | 6,883 | | 39,371 |
Atmel Corp. (a) | 22,067 | | 129,313 |
Avago Technologies Ltd. | 18,996 | | 702,852 |
BCD Semiconductor Manufacturing Ltd. ADR (a) | 22,195 | | 84,563 |
Broadcom Corp. Class A | 49,887 | | 1,690,163 |
Cirrus Logic, Inc. (a) | 6,580 | | 241,947 |
Cypress Semiconductor Corp. | 30,959 | | 330,952 |
Entropic Communications, Inc. (a)(d) | 13,182 | | 79,092 |
Exar Corp. (a) | 270 | | 1,998 |
Fairchild Semiconductor International, Inc. (a) | 3,503 | | 48,552 |
First Solar, Inc. (a)(d) | 2,398 | | 37,265 |
Freescale Semiconductor Holdings I Ltd. (a)(d) | 84,501 | | 901,626 |
Inphi Corp. (a) | 4,600 | | 50,600 |
Intel Corp. | 24,155 | | 620,784 |
Intermolecular, Inc. | 10,206 | | 67,972 |
International Rectifier Corp. (a) | 2,970 | | 50,609 |
Intersil Corp. Class A | 83,173 | | 766,023 |
Linear Technology Corp. | 40 | | 1,290 |
LSI Corp. (a) | 6,811 | | 46,996 |
MagnaChip Semiconductor Corp. (a) | 200 | | 2,036 |
Marvell Technology Group Ltd. | 73,583 | | 828,545 |
Maxim Integrated Products, Inc. | 2,690 | | 73,249 |
MediaTek, Inc. | 5,000 | | 42,585 |
Micron Technology, Inc. (a) | 72,204 | | 448,387 |
Motech Industries, Inc. | 1 | | 1 |
NVIDIA Corp. (a) | 45,151 | | 611,345 |
NXP Semiconductors NV (a) | 31,757 | | 717,391 |
O2Micro International Ltd. sponsored ADR (a) | 8,500 | | 32,980 |
ON Semiconductor Corp. (a) | 97,899 | | 679,419 |
PMC-Sierra, Inc. (a) | 40,533 | | 215,636 |
RDA Microelectronics, Inc. sponsored ADR (a) | 1,018 | | 10,160 |
Renesas Electronics Corp. (a)(d) | 9,900 | | 32,954 |
Common Stocks - continued |
| Shares | | Value |
SEMICONDUCTORS & SEMICONDUCTOR EQUIPMENT - CONTINUED |
Semiconductors - continued |
RF Micro Devices, Inc. (a) | 19,762 | | $ 76,677 |
Samsung Electronics Co. Ltd. | 34 | | 39,362 |
Skyworks Solutions, Inc. (a) | 12,344 | | 357,112 |
Spansion, Inc. Class A | 8,562 | | 87,761 |
STATS ChipPAC Ltd. (a) | 129,000 | | 38,356 |
Texas Instruments, Inc. | 58,832 | | 1,602,584 |
Trident Microsystems, Inc. (a) | 19 | | 7 |
Volterra Semiconductor Corp. (a) | 300 | | 6,894 |
Xilinx, Inc. | 90 | | 2,916 |
| | 13,295,802 |
TOTAL SEMICONDUCTORS & SEMICONDUCTOR EQUIPMENT | | 14,077,517 |
TOTAL COMMON STOCKS (Cost $21,595,874) |
17,063,389
|
Money Market Funds - 7.4% |
| | | |
Fidelity Cash Central Fund, 0.17% (b) | 202,302 | | 202,302 |
Fidelity Securities Lending Cash Central Fund, 0.18% (b)(c) | 1,081,614 | | 1,081,614 |
TOTAL MONEY MARKET FUNDS (Cost $1,283,916) |
1,283,916
|
TOTAL INVESTMENT PORTFOLIO - 105.7% (Cost $22,879,790) | | 18,347,305 |
NET OTHER ASSETS (LIABILITIES) - (5.7)% | | (987,559) |
NET ASSETS - 100% | $ 17,359,746 |
Legend |
(a) Non-income producing |
(b) Affiliated fund that is available only to investment companies and other accounts managed by Fidelity Investments. The rate quoted is the annualized seven-day yield of the fund at period end. A complete unaudited listing of the fund's holdings as of its most recent quarter end is available upon request. In addition, each Fidelity Central Fund's financial statements, which are not covered by the Fund's Report of Independent Registered Public Accounting Firm, are available on the SEC's website or upon request. |
(c) Investment made with cash collateral received from securities on loan. |
(d) Security or a portion of the security is on loan at period end. |
(e) Restricted securities - Investment in securities not registered under the Securities Act of 1933 (excluding 144A issues). At the end of the period, the value of restricted securities (excluding 144A issues) amounted to $1 or 0.0% of net assets. |
Additional information on each restricted holding is as follows: |
Security | Acquisition Date | Acquisition Cost |
Arrowhead Research Corp. warrants 5/21/17 | 5/18/07 | $ 234,942 |
Affiliated Central Funds |
Information regarding fiscal year to date income earned by the Fund from investments in Fidelity Central Funds is as follows: |
Fund | Income earned |
Fidelity Cash Central Fund | $ 476 |
Fidelity Securities Lending Cash Central Fund | 2,665 |
Total | $ 3,141 |
Other Information |
The following is a summary of the inputs used, as of July 31, 2012, involving the Fund's assets and liabilities carried at fair value. The inputs or methodology used for valuing securities may not be an indication of the risk associated with investing in those securities. For more information on valuation inputs, and their aggregation into the levels used in the table below, please refer to the Security Valuation section in the accompanying Notes to Financial Statements. |
Valuation Inputs at Reporting Date: |
Description | Total | Level 1 | Level 2 | Level 3 |
Investments in Securities: | | | | |
Common Stocks | $ 17,063,389 | $ 17,030,434 | $ 32,954 | $ 1 |
Money Market Funds | 1,283,916 | 1,283,916 | - | - |
Total Investments in Securities: | $ 18,347,305 | $ 18,314,350 | $ 32,954 | $ 1 |
Distribution of investments by country or territory of incorporation, as a percentage of total net assets, is as follows. (Unaudited) |
United States of America | 76.2% |
Bermuda | 10.4% |
Singapore | 6.5% |
Netherlands | 5.0% |
Others (Individually Less Than 1%) | 1.9% |
| 100.0% |
See accompanying notes which are an integral part of the financial statements.
Annual Report
Fidelity Advisor Electronics Fund
Statement of Assets and Liabilities
| July 31, 2012 |
| | |
Assets | | |
Investment in securities, at value (including securities loaned of $1,096,848) - See accompanying schedule: Unaffiliated issuers (cost $21,595,874) | $ 17,063,389 | |
Fidelity Central Funds (cost $1,283,916) | 1,283,916 | |
Total Investments (cost $22,879,790) | | $ 18,347,305 |
Cash | | 32,380 |
Receivable for investments sold | | 273,452 |
Receivable for fund shares sold | | 6,703 |
Dividends receivable | | 11,215 |
Distributions receivable from Fidelity Central Funds | | 463 |
Receivable from investment adviser for expense reductions | | 3,579 |
Other receivables | | 373 |
Total assets | | 18,675,470 |
| | |
Liabilities | | |
Payable for investments purchased | $ 140,381 | |
Payable for fund shares redeemed | 33,230 | |
Accrued management fee | 8,044 | |
Distribution and service plan fees payable | 6,609 | |
Other affiliated payables | 4,933 | |
Other payables and accrued expenses | 40,913 | |
Collateral on securities loaned, at value | 1,081,614 | |
Total liabilities | | 1,315,724 |
| | |
Net Assets | | $ 17,359,746 |
Net Assets consist of: | | |
Paid in capital | | $ 28,919,750 |
Accumulated net investment loss | | (91,150) |
Accumulated undistributed net realized gain (loss) on investments and foreign currency transactions | | (6,936,369) |
Net unrealized appreciation (depreciation) on investments | | (4,532,485) |
Net Assets | | $ 17,359,746 |
Statement of Assets and Liabilities - continued
| July 31, 2012 |
| | |
Calculation of Maximum Offering Price Class A:
Net Asset Value and redemption price per share ($6,000,387 ÷ 710,370 shares) | | $ 8.45 |
| | |
Maximum offering price per share (100/94.25 of $8.45) | | $ 8.97 |
Class T:
Net Asset Value and redemption price per share ($3,908,680 ÷ 474,362 shares) | | $ 8.24 |
| | |
Maximum offering price per share (100/96.50 of $8.24) | | $ 8.54 |
Class B:
Net Asset Value and offering price per share ($458,868 ÷ 58,898 shares)A | | $ 7.79 |
| | |
Class C:
Net Asset Value and offering price per share ($3,721,177 ÷ 478,158 shares)A | | $ 7.78 |
| | |
Institutional Class:
Net Asset Value, offering price and redemption price per share ($3,270,634 ÷ 375,271 shares) | | $ 8.72 |
A Redemption price per share is equal to net asset value less any applicable contingent deferred sales charge.
See accompanying notes which are an integral part of the financial statements.
Annual Report
Fund Name
Financial Statements - continued
Statement of Operations
| Year ended July 31, 2012 |
| | |
Investment Income | | |
Dividends | | $ 143,311 |
Interest | | 4,868 |
Income from Fidelity Central Funds | | 3,141 |
Total income | | 151,320 |
| | |
Expenses | | |
Management fee | $ 98,365 | |
Transfer agent fees | 54,932 | |
Distribution and service plan fees | 82,272 | |
Accounting and security lending fees | 7,078 | |
Custodian fees and expenses | 32,868 | |
Independent trustees' compensation | 117 | |
Registration fees | 53,842 | |
Audit | 43,499 | |
Legal | 107 | |
Miscellaneous | 165 | |
Total expenses before reductions | 373,245 | |
Expense reductions | (89,845) | 283,400 |
Net investment income (loss) | | (132,080) |
Realized and Unrealized Gain (Loss) Net realized gain (loss) on: | | |
Investment securities: | | |
Unaffiliated issuers | (811,255) | |
Foreign currency transactions | (435) | |
Total net realized gain (loss) | | (811,690) |
Change in net unrealized appreciation (depreciation) on: Investment securities | (927,868) | |
Assets and liabilities in foreign currencies | 4 | |
Total change in net unrealized appreciation (depreciation) | | (927,864) |
Net gain (loss) | | (1,739,554) |
Net increase (decrease) in net assets resulting from operations | | $ (1,871,634) |
Statement of Changes in Net Assets
| Year ended
July 31,
2012 | Year ended
July 31,
2011 |
Increase (Decrease) in Net Assets | | |
Operations | | |
Net investment income (loss) | $ (132,080) | $ (122,750) |
Net realized gain (loss) | (811,690) | 4,303,621 |
Change in net unrealized appreciation (depreciation) | (927,864) | (1,162,047) |
Net increase (decrease) in net assets resulting from operations | (1,871,634) | 3,018,824 |
Share transactions - net increase (decrease) | 925,003 | 1,054,457 |
Redemption fees | 775 | 1,863 |
Total increase (decrease) in net assets | (945,856) | 4,075,144 |
| | |
Net Assets | | |
Beginning of period | 18,305,602 | 14,230,458 |
End of period (including accumulated net investment loss of $91,150 and $0, respectively) | $ 17,359,746 | $ 18,305,602 |
See accompanying notes which are an integral part of the financial statements.
Annual Report
Financial Highlights - Class A
Years ended July 31, | 2012 | 2011 | 2010 | 2009 | 2008 |
Selected Per-Share Data | | | | | |
Net asset value, beginning of period | $ 8.93 | $ 7.14 | $ 6.59 | $ 6.79 | $ 9.11 |
Income from Investment Operations | | | | | |
Net investment income (loss) C | (.05) | (.04) | (.01) | .04 | - G |
Net realized and unrealized gain (loss) | (.43) | 1.83 | .59 | (.24) | (2.32) |
Total from investment operations | (.48) | 1.79 | .58 | (.20) | (2.32) |
Distributions from net investment income | - | - | (.03) | - | - |
Redemption fees added to paid in capital C, G | - | - | - | - | - |
Net asset value, end of period | $ 8.45 | $ 8.93 | $ 7.14 | $ 6.59 | $ 6.79 |
Total Return A, B | (5.38)% | 25.07% | 8.74% | (2.95)% | (25.47)% |
Ratios to Average Net Assets D, F | | | | | |
Expenses before reductions | 1.88% | 1.89% | 1.97% | 2.44% | 1.72% |
Expenses net of fee waivers, if any | 1.40% | 1.40% | 1.40% | 1.40% | 1.40% |
Expenses net of all reductions | 1.39% | 1.39% | 1.39% | 1.40% | 1.39% |
Net investment income (loss) | (.53)% | (.40)% | (.15)% | .69% | (.02)% |
Supplemental Data | | | | | |
Net assets, end of period (000 omitted) | $ 6,000 | $ 7,537 | $ 5,394 | $ 5,433 | $ 3,970 |
Portfolio turnover rate E | 140% | 166% | 87% | 92% | 93% |
A Total returns would have been lower if certain expenses had not been reduced during the applicable periods shown.
B Total returns do not include the effect of the sales charges.
C Calculated based on average shares outstanding during the period.
D Fees and expenses of any underlying Fidelity Central Funds are not included in the Fund's expense ratio. The Fund indirectly bears its proportionate share of the expenses of any underlying Fidelity Central Funds.
E Amount does not include the portfolio activity of any underlying Fidelity Central Funds.
F Expense ratios reflect operating expenses of the class. Expenses before reductions do not reflect amounts reimbursed by the investment adviser or reductions from brokerage service arrangements or reductions from other expense offset arrangements and do not represent the amount paid by the class during periods when reimbursements or reductions occur. Expenses net of fee waivers reflect expenses after reimbursement by the investment adviser but prior to reductions from brokerage service arrangements or other expense offset arrangements. Expenses net of all reductions represent the net expenses paid by the class.
G Amount represents less than $.01 per share.
Financial Highlights - Class T
Years ended July 31, | 2012 | 2011 | 2010 | 2009 | 2008 |
Selected Per-Share Data | | | | | |
Net asset value, beginning of period | $ 8.73 | $ 7.00 | $ 6.46 | $ 6.67 | $ 8.98 |
Income from Investment Operations | | | | | |
Net investment income (loss) C | (.07) | (.06) | (.03) | .02 | (.02) |
Net realized and unrealized gain (loss) | (.42) | 1.79 | .58 | (.23) | (2.29) |
Total from investment operations | (.49) | 1.73 | .55 | (.21) | (2.31) |
Distributions from net investment income | - | - | (.01) | - | - |
Redemption fees added to paid in capital C, G | - | - | - | - | - |
Net asset value, end of period | $ 8.24 | $ 8.73 | $ 7.00 | $ 6.46 | $ 6.67 |
Total Return A, B | (5.61)% | 24.71% | 8.50% | (3.15)% | (25.72)% |
Ratios to Average Net Assets D, F | | | | | |
Expenses before reductions | 2.23% | 2.25% | 2.26% | 2.77% | 2.02% |
Expenses net of fee waivers, if any | 1.65% | 1.65% | 1.65% | 1.65% | 1.65% |
Expenses net of all reductions | 1.64% | 1.64% | 1.64% | 1.65% | 1.64% |
Net investment income (loss) | (.78)% | (.65)% | (.40)% | .44% | (.27)% |
Supplemental Data | | | | | |
Net assets, end of period (000 omitted) | $ 3,909 | $ 4,476 | $ 3,862 | $ 4,195 | $ 4,635 |
Portfolio turnover rate E | 140% | 166% | 87% | 92% | 93% |
A Total returns would have been lower if certain expenses had not been reduced during the applicable periods shown.
B Total returns do not include the effect of the sales charges.
C Calculated based on average shares outstanding during the period.
D Fees and expenses of any underlying Fidelity Central Funds are not included in the Fund's expense ratio. The Fund indirectly bears its proportionate share of the expenses of any underlying Fidelity Central Funds.
E Amount does not include the portfolio activity of any underlying Fidelity Central Funds.
F Expense ratios reflect operating expenses of the class. Expenses before reductions do not reflect amounts reimbursed by the investment adviser or reductions from brokerage service arrangements or reductions from other expense offset arrangements and do not represent the amount paid by the class during periods when reimbursements or reductions occur. Expenses net of fee waivers reflect expenses after reimbursement by the investment adviser but prior to reductions from brokerage service arrangements or other expense offset arrangements. Expenses net of all reductions represent the net expenses paid by the class.
G Amount represents less than $.01 per share.
See accompanying notes which are an integral part of the financial statements.
Annual Report
Financial Highlights - Class B
Years ended July 31, | 2012 | 2011 | 2010 | 2009 | 2008 |
Selected Per-Share Data | | | | | |
Net asset value, beginning of period | $ 8.29 | $ 6.69 | $ 6.19 | $ 6.43 | $ 8.70 |
Income from Investment Operations | | | | | |
Net investment income (loss) C | (.10) | (.09) | (.06) | - G | (.06) |
Net realized and unrealized gain (loss) | (.40) | 1.69 | .56 | (.24) | (2.21) |
Total from investment operations | (.50) | 1.60 | .50 | (.24) | (2.27) |
Redemption fees added to paid in capital C, G | - | - | - | - | - |
Net asset value, end of period | $ 7.79 | $ 8.29 | $ 6.69 | $ 6.19 | $ 6.43 |
Total Return A, B | (6.03)% | 23.92% | 8.08% | (3.73)% | (26.09)% |
Ratios to Average Net Assets D, F | | | | | |
Expenses before reductions | 2.70% | 2.76% | 2.73% | 3.22% | 2.48% |
Expenses net of fee waivers, if any | 2.15% | 2.15% | 2.15% | 2.15% | 2.15% |
Expenses net of all reductions | 2.15% | 2.14% | 2.15% | 2.15% | 2.14% |
Net investment income (loss) | (1.29)% | (1.15)% | (.90)% | (.06)% | (.77)% |
Supplemental Data | | | | | |
Net assets, end of period (000 omitted) | $ 459 | $ 691 | $ 1,073 | $ 1,197 | $ 2,027 |
Portfolio turnover rate E | 140% | 166% | 87% | 92% | 93% |
A Total returns would have been lower if certain expenses had not been reduced during the applicable periods shown.
B Total returns do not include the effect of the contingent deferred sales charge.
C Calculated based on average shares outstanding during the period.
D Fees and expenses of any underlying Fidelity Central Funds are not included in the Fund's expense ratio. The Fund indirectly bears its proportionate share of the expenses of any underlying Fidelity Central Funds.
E Amount does not include the portfolio activity of any underlying Fidelity Central Funds.
F Expense ratios reflect operating expenses of the class. Expenses before reductions do not reflect amounts reimbursed by the investment adviser or reductions from brokerage service arrangements or reductions from other expense offset arrangements and do not represent the amount paid by the class during periods when reimbursements or reductions occur. Expenses net of fee waivers reflect expenses after reimbursement by the investment adviser but prior to reductions from brokerage service arrangements or other expense offset arrangements. Expenses net of all reductions represent the net expenses paid by the class.
G Amount represents less than $.01 per share.
Financial Highlights - Class C
Years ended July 31, | 2012 | 2011 | 2010 | 2009 | 2008 |
Selected Per-Share Data | | | | | |
Net asset value, beginning of period | $ 8.29 | $ 6.68 | $ 6.18 | $ 6.42 | $ 8.69 |
Income from Investment Operations | | | | | |
Net investment income (loss) C | (.10) | (.09) | (.06) | - G | (.06) |
Net realized and unrealized gain (loss) | (.41) | 1.70 | .56 | (.24) | (2.21) |
Total from investment operations | (.51) | 1.61 | .50 | (.24) | (2.27) |
Redemption fees added to paid in capital C, G | - | - | - | - | - |
Net asset value, end of period | $ 7.78 | $ 8.29 | $ 6.68 | $ 6.18 | $ 6.42 |
Total Return A, B | (6.15)% | 24.10% | 8.09% | (3.74)% | (26.12)% |
Ratios to Average Net Assets D, F | | | | | |
Expenses before reductions | 2.65% | 2.70% | 2.72% | 3.21% | 2.47% |
Expenses net of fee waivers, if any | 2.15% | 2.15% | 2.15% | 2.15% | 2.15% |
Expenses net of all reductions | 2.14% | 2.14% | 2.14% | 2.15% | 2.14% |
Net investment income (loss) | (1.28)% | (1.15)% | (.90)% | (.06)% | (.77)% |
Supplemental Data | | | | | |
Net assets, end of period (000 omitted) | $ 3,721 | $ 3,836 | $ 3,256 | $ 3,016 | $ 3,325 |
Portfolio turnover rate E | 140% | 166% | 87% | 92% | 93% |
A Total returns would have been lower if certain expenses had not been reduced during the applicable periods shown.
B Total returns do not include the effect of the contingent deferred sales charge.
C Calculated based on average shares outstanding during the period.
D Fees and expenses of any underlying Fidelity Central Funds are not included in the Fund's expense ratio. The Fund indirectly bears its proportionate share of the expenses of any underlying Fidelity Central Funds.
E Amount does not include the portfolio activity of any underlying Fidelity Central Funds.
F Expense ratios reflect operating expenses of the class. Expenses before reductions do not reflect amounts reimbursed by the investment adviser or reductions from brokerage service arrangements or reductions from other expense offset arrangements and do not represent the amount paid by the class during periods when reimbursements or reductions occur. Expenses net of fee waivers reflect expenses after reimbursement by the investment adviser but prior to reductions from brokerage service arrangements or other expense offset arrangements. Expenses net of all reductions represent the net expenses paid by the class.
G Amount represents less than $.01 per share.
See accompanying notes which are an integral part of the financial statements.
Annual Report
Financial Highlights - Institutional Class
Years ended July 31, | 2012 | 2011 | 2010 | 2009 | 2008 |
Selected Per-Share Data | | | | | |
Net asset value, beginning of period | $ 9.19 | $ 7.33 | $ 6.75 | $ 6.94 | $ 9.30 |
Income from Investment Operations | | | | | |
Net investment income (loss) B | (.02) | (.01) | .01 | .05 | .02 |
Net realized and unrealized gain (loss) | (.45) | 1.87 | .60 | (.24) | (2.38) |
Total from investment operations | (.47) | 1.86 | .61 | (.19) | (2.36) |
Distributions from net investment income | - | - | (.03) | - | - |
Redemption fees added to paid in capital B, F | - | - | - | - | - |
Net asset value, end of period | $ 8.72 | $ 9.19 | $ 7.33 | $ 6.75 | $ 6.94 |
Total Return A | (5.11)% | 25.38% | 9.10% | (2.74)% | (25.38)% |
Ratios to Average Net Assets C, E | | | | | |
Expenses before reductions | 1.55% | 1.42% | 1.64% | 2.16% | 1.47% |
Expenses net of fee waivers, if any | 1.15% | 1.15% | 1.15% | 1.15% | 1.15% |
Expenses net of all reductions | 1.14% | 1.14% | 1.14% | 1.15% | 1.14% |
Net investment income (loss) | (.28)% | (.15)% | .11% | .94% | .23% |
Supplemental Data | | | | | |
Net assets, end of period (000 omitted) | $ 3,271 | $ 1,765 | $ 645 | $ 367 | $ 353 |
Portfolio turnover rate D | 140% | 166% | 87% | 92% | 93% |
A Total returns would have been lower if certain expenses had not been reduced during the applicable periods shown.
B Calculated based on average shares outstanding during the period.
C Fees and expenses of any underlying Fidelity Central Funds are not included in the Fund's expense ratio. The Fund indirectly bears its proportionate share of the expenses of any underlying Fidelity Central Funds.
D Amount does not include the portfolio activity of any underlying Fidelity Central Funds.
E Expense ratios reflect operating expenses of the class. Expenses before reductions do not reflect amounts reimbursed by the investment adviser or reductions from brokerage service arrangements or reductions from other expense offset arrangements and do not represent the amount paid by the class during periods when reimbursements or reductions occur. Expenses net of fee waivers reflect expenses after reimbursement by the investment adviser but prior to reductions from brokerage service arrangements or other expense offset arrangements. Expenses net of all reductions represent the net expenses paid by the class.
F Amount represents less than $.01 per share.
See accompanying notes which are an integral part of the financial statements.
Annual Report
Fidelity Advisor Electronics Fund
Notes to Financial Statements
For the period ended July 31, 2012
1. Organization.
Fidelity Advisor Electronics Fund (the Fund) is a non-diversified fund of Fidelity Advisor Series VII (the Trust) and is authorized to issue an unlimited number of shares. The Trust is registered under the Investment Company Act of 1940, as amended (the 1940 Act), as an open-end management investment company organized as a Massachusetts business trust. The Fund offers Class A, Class T, Class C, and Institutional Class shares, each of which, along with Class B shares, has equal rights as to assets and voting privileges. Effective after the close of business on September 1, 2010, Class B shares were closed to new accounts and additional purchases, except for exchanges and reinvestments. Each class has exclusive voting rights with respect to matters that affect that class. Class B shares will automatically convert to Class A shares after a holding period of seven years from the initial date of purchase. Investment income, realized and unrealized capital gains and losses, the common expenses of the Fund, and certain fund-level expense reductions, if any, are allocated on a pro-rata basis to each class based on the relative net assets of each class to the total net assets of the Fund. Each class differs with respect to transfer agent and distribution and service plan fees incurred. Certain expense reductions may also differ by class. The Fund's investments in emerging markets can be subject to social, economic, regulatory, and political uncertainties and can be extremely volatile.
2. Investments in Fidelity Central Funds.
The Fund invests in Fidelity Central Funds, which are open-end investment companies available only to other investment companies and accounts managed by Fidelity Management & Research Company (FMR) and its affiliates. The Fund's Schedule of Investments lists each of the Fidelity Central Funds held as of period end, if any, as an investment of the Fund, but does not include the underlying holdings of each Fidelity Central Fund. As an Investing Fund, the Fund indirectly bears its proportionate share of the expenses of the underlying Fidelity Central Funds.
The Money Market Central Funds seek preservation of capital and current income and are managed by Fidelity Investments Money Management, Inc. (FIMM), an affiliate of FMR.
A complete unaudited list of holdings for each Fidelity Central Fund is available upon request or at the Securities and Exchange Commission (the SEC) web site at www.sec.gov. In addition, the financial statements of the Fidelity Central Funds, which are not covered by the Fund's Report of Independent Registered Public Accounting Firm, are available on the SEC web site or upon request.
3. Significant Accounting Policies.
The financial statements have been prepared in conformity with accounting principles generally accepted in the United States of America (GAAP), which require management to make certain estimates and assumptions at the date of the financial statements. Actual results could differ from those estimates. Subsequent events, if any, through the date that the financial statements were issued have been evaluated in the preparation of the financial statements. The following summarizes the significant accounting policies of the Fund:
Security Valuation. Investments are valued as of 4:00 p.m. Eastern time on the last calendar day of the period. In accordance with valuation policies and procedures approved by the Board of Trustees (the Board), the Fund attempts to obtain prices from one or more third party pricing vendor or broker to value its investments. When current market prices, quotations or rates are not readily available or reliable, securities will be fair valued in good faith by the FMR Fair Value Committee (the Committee), in accordance with procedures adopted by the Fund's Board. Factors used in determining fair value vary by security type and may include market or security specific events. The frequency with which these procedures are used cannot be predicted and they may be utilized to a significant extent. The Committee oversees the Fund's valuation policies and procedures and is responsible for approving and reporting to the Board all fair value determinations.
The Fund categorizes the inputs to valuation techniques used to value its investments into a disclosure hierarchy consisting of three levels as shown below:
Level 1 - quoted prices in active markets for identical investments
Level 2 - other significant observable inputs (including quoted prices for similar investments, interest rates, prepayment speeds, etc.)
Level 3 - unobservable inputs (including the Fund's own assumptions based on the best information available)
Valuation techniques used to value the Fund's investments by major category are as follows:
Equity securities, including restricted securities, for which market quotations are readily available, are valued at the last reported sale price or official closing price as reported by a third party pricing vendor on the primary market or exchange on which they are traded and are categorized as Level 1 in the hierarchy. In the event there were no sales during the day or closing prices are not available, securities are valued at the last quoted bid price or may be valued using the last available price and are generally categorized as Level 2 in the hierarchy. For foreign equity securities, when significant market or security specific events arise, comparisons to the valuation of American Depositary Receipts (ADRs), futures contracts, Exchange-Traded Funds (ETFs) and certain indexes as well as quoted prices for similar securities are used and are categorized as Level 2 in the hierarchy. Utilizing these techniques may result in transfers between Level 1 and Level 2. For restricted equity securities and private placements where observable inputs are limited, assumptions about market activity and risk are used and these securities are categorized as Level 3 in the hierarchy.
Annual Report
Fidelity Advisor Electronics Fund
Notes to Financial Statements - continued
3. Significant Accounting Policies - continued
Security Valuation - continued
Investments in open-end mutual funds, including the Fidelity Central Funds, are valued at their closing net asset value each business day and are categorized as Level 1 in the hierarchy.
Changes in valuation techniques may result in transfers in or out of an assigned level within the disclosure hierarchy. The aggregate value of investments by input level, as of July 31, 2012, is included at the end of the Fund's Schedule of Investments.
Foreign Currency Translation. The Fund may use foreign currency contracts to facilitate transactions in foreign-denominated securities. Gains and losses from these transactions may arise from changes in the value of the foreign currency or if the counterparties do not perform under the contracts' terms.
Foreign-denominated assets, including investment securities, and liabilities are translated into U.S. dollars at the exchange rates at period end. Purchases and sales of investment securities, income and dividends received and expenses denominated in foreign currencies are translated into U.S. dollars at the exchange rate in effect on the transaction date.
The effects of exchange rate fluctuations on investments are included with the net realized and unrealized gain (loss) on investment securities. Other foreign currency transactions resulting in realized and unrealized gain (loss) are disclosed separately.
Investment Transactions and Income. For financial reporting purposes, the Fund's investment holdings and NAV include trades executed through the end of the last business day of the period. The NAV per share for processing shareholder transactions is calculated as of the close of business of the New York Stock Exchange (NYSE), normally 4:00 p.m. Eastern time and includes trades executed through the end of the prior business day. Gains and losses on securities sold are determined on the basis of identified cost and may include proceeds received from litigation. Dividend income is recorded on the ex-dividend date, except for certain dividends from foreign securities where the ex-dividend date may have passed, which are recorded as soon as the Fund is informed of the ex-dividend date. Non-cash dividends included in dividend income, if any, are recorded at the fair market value of the securities received. Distributions received on securities that represent a return of capital or capital gain are recorded as a reduction of cost of investments and/or as a realized gain. The Fund estimates the components of distributions received that may be considered return of capital distributions or capital gain distributions. Interest income and distributions from the Fidelity Central Funds are accrued as earned. Interest income includes coupon interest and amortization of premium and accretion of discount on debt securities. Investment income is recorded net of foreign taxes withheld where recovery of such taxes is uncertain.
Expenses. Expenses directly attributable to a fund are charged to that fund. Expenses attributable to more than one fund are allocated among the respective funds on the basis of relative net assets or other appropriate methods. Expense estimates are accrued in the period to which they relate and adjustments are made when actual amounts are known.
Income Tax Information and Distributions to Shareholders. Each year, the Fund intends to qualify as a regulated investment company under Subchapter M of the Internal Revenue Code, including distributing substantially all of its taxable income and realized gains. As a result, no provision for income taxes is required. As of July 31, 2012, the Fund did not have any unrecognized tax benefits in the financial statements; nor is the Fund aware of any tax positions for which it is reasonably possible that the total amounts of unrecognized tax benefits will significantly change in the next twelve months. The Fund files a U.S. federal tax return, in addition to state and local tax returns as required. A fund's federal income tax returns are subject to examination by the Internal Revenue Service (IRS) for a period of three fiscal years after they are filed. State and local tax returns may be subject to examination for an additional fiscal year depending on the jurisdiction. Foreign taxes are provided for based on the Fund's understanding of the tax rules and rates that exist in the foreign markets in which it invests.
Distributions are declared and recorded on the ex-dividend date. Income dividends and capital gain distributions are declared separately for each class. Income and capital gain distributions are determined in accordance with income tax regulations, which may differ from GAAP.
Capital accounts within the financial statements are adjusted for permanent book-tax differences. These adjustments have no impact on net assets or the results of operations. Temporary book-tax differences will reverse in a subsequent period.
Book-tax differences are primarily due to foreign currency transactions, net operating losses, capital loss carryforwards and losses deferred due to wash sales and excise tax regulations.
The federal tax cost of investment securities and unrealized appreciation (depreciation) as of period end were as follows:
Gross unrealized appreciation | $ 390,290 |
Gross unrealized depreciation | (5,173,096) |
Net unrealized appreciation (depreciation) on securities and other investments | $ (4,782,806) |
| |
Tax Cost | $ 23,130,111 |
Annual Report
3. Significant Accounting Policies - continued
Income Tax Information and Distributions to Shareholders - continued
The tax-based components of distributable earnings as of period end were as follows:
Capital loss carryforward | $ (5,918,304) |
Net unrealized appreciation (depreciation) | $ (4,782,806) |
Capital loss carryforwards are only available to offset future capital gains of the Fund to the extent provided by regulations and may be limited. Under the Regulated Investment Company Modernization Act of 2010 (the Act), the Fund is permitted to carry forward capital losses incurred in taxable years beginning after December 22, 2010 for an unlimited period and such capital losses are required to be used prior to any losses that expire. Capital loss carryforwards were as follows:
Fiscal year of expiration | |
2013 | $ (279,201) |
2016 | (310,663) |
2017 | (5,202,838) |
Total with expiration | (5,792,702) |
No expiration | |
Long-term | (125,602) |
Total capital loss carryforward | $ (5,918,304) |
The Fund intends to elect to defer to its fiscal year ending July 31, 2013 approximately $767,744 of capital losses recognized during the period November 1, 2011 to July 31, 2012.
Short-Term Trading (Redemption) Fees. Shares held by investors in the Fund less than 30 days are subject to a redemption fee equal to .75% of the net asset value of shares redeemed. All redemption fees, which reduce the proceeds of the shareholder redemption, are retained by the Fund and accounted for as an addition to paid in capital.
New Accounting Pronouncement. In December 2011, the Financial Accounting Standards Board issued Accounting Standard Update No. 2011-11, Disclosures about Offsetting Assets and Liabilities. The update creates new disclosure requirements requiring entities to disclose both gross and net information for derivatives and other financial instruments that are either offset in the Statement of Assets and Liabilities or subject to an enforceable master netting arrangement or similar agreement. The disclosure requirements are effective for interim and annual reporting periods beginning on or after January 1, 2013. Management is currently evaluating the impact of the update's adoption on the Fund's financial statement disclosures.
4. Operating Policies.
Restricted Securities. The Fund may invest in securities that are subject to legal or contractual restrictions on resale. These securities generally may be resold in transactions exempt from registration or to the public if the securities are registered. Disposal of these securities may involve time-consuming negotiations and expense, and prompt sale at an acceptable price may be difficult. Information regarding restricted securities is included at the end of the Fund's Schedule of Investments.
5. Purchases and Sales of Investments.
Purchases and sales of securities, other than short-term securities, aggregated $25,098,152 and $24,332,670, respectively.
6. Fees and Other Transactions with Affiliates.
Management Fee. FMR and its affiliates provide the Fund with investment management related services for which the Fund pays a monthly management fee. The management fee is the sum of an individual fund fee rate that is based on an annual rate of .30% of the Fund's average net assets and an annualized group fee rate that averaged .26% during the period. The group fee rate is based upon the average net assets of all the mutual funds advised by FMR. The group fee rate decreases as assets under management increase and increases as assets under management decrease. For the period, the total annual management fee rate was .56% of the Fund's average net assets.
Annual Report
Fidelity Advisor Electronics Fund
Notes to Financial Statements - continued
6. Fees and Other Transactions with Affiliates - continued
Distribution and Service Plan Fees. In accordance with Rule 12b-1 of the 1940 Act, the Fund has adopted separate Distribution and Service Plans for each class of shares. Certain classes pay Fidelity Distributors Corporation (FDC), an affiliate of FMR, separate Distribution and Service Fees, each of which is based on an annual percentage of each class' average net assets. In addition, FDC may pay financial intermediaries for selling shares of the Fund and providing shareholder support services. For the period, the Distribution and Service Fee rates, total fees and amounts retained by FDC were as follows:
| Distribution
Fee | Service
Fee | Total Fees | Retained
by FDC |
Class A | -% | .25% | $ 19,191 | $ 783 |
Class T | .25% | .25% | 20,904 | 112 |
Class B | .75% | .25% | 5,680 | 4,265 |
Class C | .75% | .25% | 36,497 | 4,204 |
| | | $ 82,272 | $ 9,364 |
Sales Load. FDC may receive a front-end sales charge of up to 5.75% for selling Class A shares and 3.50% for selling Class T shares, some of which is paid to financial intermediaries for selling shares of the Fund. Depending on the holding period, FDC may receive contingent deferred sales charges levied on Class A, Class T, Class B, and Class C redemptions. The deferred sales charges range from 5.00% to 1.00% for Class B shares, 1.00% for Class C shares, 1.00% for certain purchases of Class A shares and .25% for certain purchases of Class T shares.
For the period, sales charge amounts retained by FDC were as follows:
| Retained
by FDC |
Class A | $ 2,775 |
Class T | 2,277 |
Class B* | 630 |
Class C* | 491 |
| $ 6,173 |
* When Class B and Class C shares are initially sold, FDC pays commissions from its own resources to financial intermediaries through which the sales are made.
Transfer Agent Fees. Fidelity Investments Institutional Operations Company, Inc. (FIIOC), an affiliate of FMR, is the transfer, dividend disbursing and shareholder servicing agent for each class of the Fund. FIIOC receives account fees and asset-based fees that vary according to the account size and type of account of the shareholders of the respective classes of the Fund. FIIOC pays for typesetting, printing and mailing of shareholder reports, except proxy statements. For the period, transfer agent fees for each class were as follows:
| Amount | % of
Average
Net Assets |
Class A | $ 23,737 | .31 |
Class T | 15,086 | .36 |
Class B | 1,759 | .31 |
Class C | 11,275 | .31 |
Institutional Class | 3,075 | .20 |
| $ 54,932 | |
Accounting and Security Lending Fees. Fidelity Service Company, Inc. (FSC), an affiliate of FMR, maintains the Fund's accounting records. The accounting fee is based on the level of average net assets for each month. Under a separate contract, FSC administers the security lending program. The security lending fee is based on the number and duration of lending transactions.
Brokerage Commissions. The Fund placed a portion of its portfolio transactions with brokerage firms which are affiliates of the investment adviser. The commissions paid to these affiliated firms were $2,373 for the period.
7. Committed Line of Credit.
The Fund participates with other funds managed by FMR or an affiliate in a $4.25 billion credit facility (the "line of credit") to be utilized for temporary or emergency purposes to fund shareholder redemptions or for other short-term liquidity purposes. The Fund has agreed to pay commitment fees on its pro-rata portion of the line of credit, which amounted to $50 and is reflected in Miscellaneous expenses on the Statement of Operations. During the period, there were no borrowings on this line of credit.
Annual Report
8. Security Lending.
The Fund lends portfolio securities through a lending agent from time to time in order to earn additional income. For equity securities, a lending agent is used and may loan securities to certain qualified borrowers, including Fidelity Capital Markets (FCM), a broker-dealer affiliated with the Fund. On the settlement date of the loan, the Fund receives collateral (in the form of U.S. Treasury obligations, letters of credit and/or cash) against the loaned securities and maintains collateral in an amount not less than 100% of the market value of the loaned securities during the period of the loan. The market value of the loaned securities is determined at the close of business of the Fund and any additional required collateral is delivered to the Fund on the next business day. If the borrower defaults on its obligation to return the securities loaned because of insolvency or other reasons, a fund could experience delays and costs in recovering the securities loaned or in gaining access to the collateral. Any cash collateral received is invested in the Fidelity Securities Lending Cash Central Fund. The value of loaned securities and cash collateral at period end are disclosed on the Fund's Statement of Assets and Liabilities. Security lending income represents the income earned on investing cash collateral, less rebates paid to borrowers and any lending agent fees associated with the loan, plus any premium payments received for lending certain types of securities. Security lending income is presented in the Statement of Operations as a component of income from Fidelity Central Funds. Total security lending income during the period amounted to $2,665. During the period, there were no securities loaned to FCM.
9. Expense Reductions.
FMR voluntarily agreed to reimburse each class to the extent annual operating expenses exceeded certain levels of average net assets as noted in the table below. Some expenses, for example interest expense, including commitment fees, are excluded from this reimbursement.
The following classes were in reimbursement during the period:
| Expense
Limitations | Reimbursement
from adviser |
Class A | 1.40% | $ 36,814 |
Class T | 1.65% | 24,072 |
Class B | 2.15% | 3,089 |
Class C | 2.15% | 18,181 |
Institutional Class | 1.15% | 6,337 |
| | $ 88,493 |
Many of the brokers with whom FMR places trades on behalf of the Fund provided services to the Fund in addition to trade execution. These services included payments of certain expenses on behalf of the Fund totaling $1,352 for the period.
10. Share Transactions.
Transactions for each class of shares were as follows:
| Shares | Dollars |
Years ended July 31, | 2012 | 2011 | 2012 | 2011 |
Class A | | | | |
Shares sold | 461,275 | 823,348 | $ 4,417,052 | $ 7,674,866 |
Shares redeemed | (595,271) | (734,519) | (4,948,629) | (6,789,005) |
Net increase (decrease) | (133,996) | 88,829 | $ (531,577) | $ 885,861 |
Class T | | | | |
Shares sold | 90,140 | 227,766 | $ 795,072 | $ 2,032,968 |
Shares redeemed | (128,587) | (266,704) | (1,079,505) | (2,292,080) |
Net increase (decrease) | (38,447) | (38,938) | $ (284,433) | $ (259,112) |
Class B | | | | |
Shares sold | 10,206 | 17,689 | $ 91,605 | $ 152,131 |
Shares redeemed | (34,653) | (94,901) | (276,903) | (767,577) |
Net increase (decrease) | (24,447) | (77,212) | $ (185,298) | $ (615,446) |
Class C | | | | |
Shares sold | 171,249 | 179,286 | $ 1,492,502 | $ 1,565,088 |
Shares redeemed | (156,060) | (203,889) | (1,218,105) | (1,673,259) |
Net increase (decrease) | 15,189 | (24,603) | $ 274,397 | $ (108,171) |
Institutional Class | | | | |
Shares sold | 380,436 | 302,052 | $ 3,355,122 | $ 3,051,352 |
Shares redeemed | (197,302) | (197,907) | (1,703,208) | (1,900,027) |
Net increase (decrease) | 183,134 | 104,145 | $ 1,651,914 | $ 1,151,325 |
Annual Report
Fidelity Advisor Electronics Fund
Notes to Financial Statements - continued
11. Other.
The Fund's organizational documents provide former and current trustees and officers with a limited indemnification against liabilities arising in connection with the performance of their duties to the Fund. In the normal course of business, the Fund may also enter into contracts that provide general indemnifications. The Fund's maximum exposure under these arrangements is unknown as this would be dependent on future claims that may be made against the Fund. The risk of material loss from such claims is considered remote.
Annual Report
Fidelity Advisor Energy Fund - Institutional Class
Performance: The Bottom Line
Average annual total return reflects the change in the value of an investment, assuming reinvestment of the class' distributions from dividend income and capital gains (the profits earned upon the sale of securities that have grown in value, if any) and assuming a constant rate of performance each year. The $10,000 table and the fund's returns do not reflect the deduction of taxes that a shareholder would pay on fund distributions or the redemption of fund shares. During periods of reimbursement by Fidelity, a fund's total return will be greater than it would be had the reimbursement not occurred. How a fund did yesterday is no guarantee of how it will do tomorrow.
Average Annual Total Returns
Periods ended July 31, 2012 | | Past 1
year | Past 5
years | Past 10
years |
Institutional Class A | | -15.31% | -1.83% | 12.01% |
A Prior to October 1, 2006, Fidelity Advisor Energy Fund operated under certain different investment policies. The historical performance for the fund may not represent its current investment policies.
$10,000 Over 10 Years
Let's say hypothetically that $10,000 was invested in Fidelity Advisor Energy Fund - Institutional Class on July 31, 2002. The chart shows how the value of your investment would have changed, and also shows how the S&P 500 Index performed over the same period.
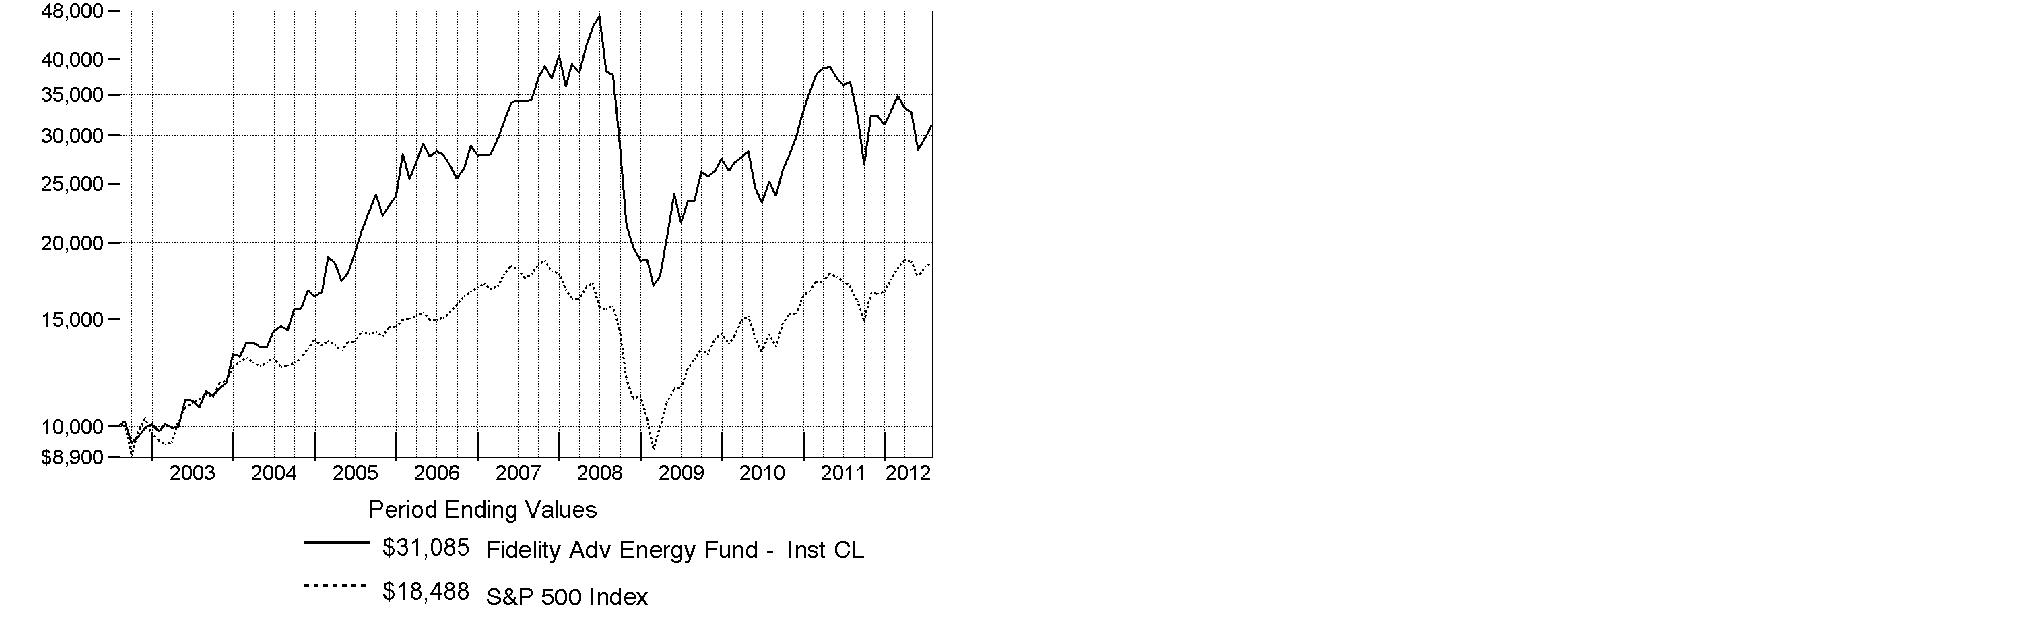
Annual Report
Fidelity Advisor Energy Fund
Market Recap: Major U.S. equity benchmarks posted solid gains for the year ending July 31, 2012, amid an uncertain investment environment. The broad-based S&P 500® Index returned 9.13%, while the blue-chip-laden Dow Jones Industrial AverageSM and technology-heavy Nasdaq Composite® Index gained 10.12% and 7.83%, respectively. Volatility spiked during the period's first half, as equities plummeted late last summer on Europe's debt woes, political wrangling over the U.S. debt ceiling and the sovereign credit-rating downgrade that followed. By October, a seemingly improved U.S. economy rejuvenated stocks, paving the way for major equity benchmarks to post their best first-quarter performance since 1998. However, more eurozone trouble, signs that the U.S. economy had turned sluggish and a slowdown in China caused stocks to slip in May, before a new wave of optimism took hold in June and July. Within the S&P 500®, more-defensive sectors such as telecommunication services (+30%) and consumer staples (+20%) fared best, while materials and energy significantly underperformed, returning -5%. Small- and mid-cap stocks trailed their less-volatile large-cap counterparts, with the Russell 2000® Index adding 0.19% and the Russell Midcap® Index rising 2.28%. Given turmoil and local currency weakness in Europe, foreign developed-markets stocks lost ground, with the MSCI® EAFE® Index returning -11.32%.
Comments from John Dowd, Portfolio Manager of Fidelity Advisor® Energy Fund: For the year, the fund's Institutional Class shares returned -15.31%, significantly underperforming the broad-based S&P 500® and the -8.43% return of the MSCI® U.S. IM Energy 25/50 Index. Energy stocks struggled during the period, hurt by falling commodity prices and weak economic growth, particularly in emerging markets. Relative to its sector benchmark, the fund's positioning in integrated oil/gas firms hurt performance the most, including a significant underweighting in benchmark heavyweight Exxon Mobil, which outperformed. Stocks that were sensitive to falling crude prices also curbed results, including integrated oil/gas firm Hess and exploration and production firm SM Energy. A stake in coal producer Alpha Natural Resources stung, as the company struggled under slumping coal prices and a global economic slowdown. I sold Alpha from the fund by period end. Stock selection in oil/gas equipment and services detracted, led by Baker Hughes. Conversely, an out-of-index holding in specialty chemicals maker LyondellBasell Industries helped the most. Although an overweighting in oil/gas drilling hurt, my picks there, led by an out-of-index stake in British offshore drill fleet operator Ensco, helped. Underweighting and then selling natural gas firm Chesapeake Energy also contributed.
The views expressed above reflect those of the portfolio manager(s) only through the end of the period as stated on the cover of this report and do not necessarily represent the views of Fidelity or any other person in the Fidelity organization. Any such views are subject to change at any time based upon market or other conditions and Fidelity disclaims any responsibility to update such views. These views may not be relied on as investment advice and, because investment decisions for a Fidelity fund are based on numerous factors, may not be relied on as an indication of trading intent on behalf of any Fidelity fund.
Annual Report
Fidelity Advisor Energy Fund
As a shareholder of the Fund, you incur two types of costs: (1) transaction costs, including sales charges (loads) on purchase payments or redemption proceeds, redemption fees and (2) ongoing costs, including management fees, distribution and/or service (12b-1) fees and other Fund expenses. This Example is intended to help you understand your ongoing costs (in dollars) of investing in the Fund and to compare these costs with the ongoing costs of investing in other mutual funds.
The Example is based on an investment of $1,000 invested at the beginning of the period and held for the entire period (February 1, 2012 to July 31, 2012).
Actual Expenses
The first line of the accompanying table for each class of the Fund provides information about actual account values and actual expenses. You may use the information in this line, together with the amount you invested, to estimate the expenses that you paid over the period. Simply divide your account value by $1,000.00 (for example, an $8,600 account value divided by $1,000.00 = 8.6), then multiply the result by the number in the first line for a class of the Fund under the heading entitled "Expenses Paid During Period" to estimate the expenses you paid on your account during this period. In addition, the Fund, as a shareholder in the underlying Fidelity Central Funds, will indirectly bear its pro-rata share of the fees and expenses incurred by the underlying Fidelity Central Funds. These fees and expenses are not included in the Fund's annualized expense ratio used to calculate the expense estimate in the table below.
Hypothetical Example for Comparison Purposes
The second line of the accompanying table for each class of the Fund provides information about hypothetical account values and hypothetical expenses based on a Class' actual expense ratio and an assumed rate of return of 5% per year before expenses, which is not the Class' actual return. The hypothetical account values and expenses may not be used to estimate the actual ending account balance or expenses you paid for the period. You may use this information to compare the ongoing costs of investing in the Fund and other funds. To do so, compare this 5% hypothetical example with the 5% hypothetical examples that appear in the shareholder reports of the other funds. In addition, the Fund, as a shareholder in the underlying Fidelity Central Funds, will indirectly bear its pro-rata share of the fees and expenses incurred by the underlying Fidelity Central Funds. These fees and expenses are not included in the Fund's annualized expense ratio used to calculate the expense estimate in the table below.
Please note that the expenses shown in the table are meant to highlight your ongoing costs only and do not reflect any transaction costs. Therefore, the second line of the table is useful in comparing ongoing costs only, and will not help you determine the relative total costs of owning different funds. In addition, if these transactional costs were included, your costs would have been higher.
| Annualized Expense Ratio | Beginning
Account Value
February 1, 2012 | Ending
Account Value
July 31, 2012 | Expenses Paid
During Period*
February 1, 2012
to July 31, 2012 |
Class A | 1.17% | | | |
Actual | | $ 1,000.00 | $ 944.80 | $ 5.66 |
HypotheticalA | | $ 1,000.00 | $ 1,019.05 | $ 5.87 |
Class T | 1.38% | | | |
Actual | | $ 1,000.00 | $ 943.50 | $ 6.67 |
HypotheticalA | | $ 1,000.00 | $ 1,018.00 | $ 6.92 |
Class B | 1.92% | | | |
Actual | | $ 1,000.00 | $ 941.00 | $ 9.27 |
HypotheticalA | | $ 1,000.00 | $ 1,015.32 | $ 9.62 |
Class C | 1.91% | | | |
Actual | | $ 1,000.00 | $ 940.80 | $ 9.22 |
HypotheticalA | | $ 1,000.00 | $ 1,015.37 | $ 9.57 |
Institutional Class | .85% | | | |
Actual | | $ 1,000.00 | $ 946.10 | $ 4.11 |
HypotheticalA | | $ 1,000.00 | $ 1,020.64 | $ 4.27 |
A 5% return per year before expenses
* Expenses are equal to each Class' annualized expense ratio, multiplied by the average account value over the period, multiplied by 182/366 (to reflect the one-half year period).
Annual Report
Fidelity Advisor Energy Fund
Investment Changes (Unaudited)
Top Ten Stocks as of July 31, 2012 |
| % of fund's
net assets | % of fund's net assets
6 months ago |
Chevron Corp. | 12.4 | 15.0 |
Exxon Mobil Corp. | 10.3 | 7.3 |
Occidental Petroleum Corp. | 7.6 | 7.6 |
National Oilwell Varco, Inc. | 4.8 | 4.4 |
EQT Corp. | 3.5 | 0.0 |
Hess Corp. | 3.5 | 4.8 |
Cabot Oil & Gas Corp. | 3.3 | 0.0 |
Noble Corp. | 3.2 | 1.5 |
Schlumberger Ltd. | 3.1 | 5.6 |
Apache Corp. | 2.6 | 2.5 |
| 54.3 | |
Top Industries (% of fund's net assets) |
As of July 31, 2012 |
| Oil, Gas & Consumable Fuels | 73.8% | |
| Energy Equipment & Services | 23.3% | |
| Chemicals | 0.6% | |
| Construction & Engineering | 0.4% | |
 | Hotels, Restaurants & Leisure | 0.0% | |
| All Others* | 1.9% | |

As of January 31, 2012 |
| Oil, Gas & Consumable Fuels | 71.7% | |
 | Energy Equipment & Services | 26.1% | |
 | Chemicals | 1.5% | |
| Construction & Engineering | 0.5% | |
| All Others* | 0.2% | |

* Includes short-term investments and net other assets. |
Annual Report
Fidelity Advisor Energy Fund
Investments July 31, 2012
Showing Percentage of Net Assets
Common Stocks - 98.1% |
| Shares | | Value |
CHEMICALS - 0.6% |
Specialty Chemicals - 0.6% |
LyondellBasell Industries NV Class A | 83,610 | | $ 3,723,153 |
CONSTRUCTION & ENGINEERING - 0.4% |
Construction & Engineering - 0.4% |
Foster Wheeler AG (a) | 158,675 | | 2,862,497 |
ENERGY EQUIPMENT & SERVICES - 23.3% |
Oil & Gas Drilling - 7.2% |
Discovery Offshore S.A. (a)(e) | 748,490 | | 1,303,871 |
Ensco PLC Class A | 223,851 | | 12,161,825 |
Noble Corp. | 559,864 | | 20,714,968 |
Northern Offshore Ltd. | 335,687 | | 562,490 |
Ocean Rig UDW, Inc. (United States) | 163,500 | | 2,450,865 |
Rowan Companies PLC (a) | 213,866 | | 7,513,113 |
Tuscany International Drilling, Inc. (a) | 1,080,000 | | 350,003 |
Vantage Drilling Co. (a) | 945,900 | | 1,485,063 |
| | 46,542,198 |
Oil & Gas Equipment & Services - 16.1% |
Anton Oilfield Services Group | 438,000 | | 86,982 |
Baker Hughes, Inc. | 38,600 | | 1,787,952 |
Cameron International Corp. (a) | 36,000 | | 1,809,720 |
Compagnie Generale de Geophysique SA (a) | 126,178 | | 3,611,621 |
FMC Technologies, Inc. (a) | 97,300 | | 4,390,176 |
Fugro NV (Certificaten Van Aandelen) unit | 184,345 | | 12,078,063 |
Gulfmark Offshore, Inc. Class A (a) | 143,927 | | 5,174,176 |
Halliburton Co. | 240,615 | | 7,971,575 |
McDermott International, Inc. (a) | 167,806 | | 1,963,330 |
National Oilwell Varco, Inc. | 432,307 | | 31,255,796 |
Oil States International, Inc. (a) | 86,650 | | 6,299,455 |
Schlumberger Ltd. | 286,593 | | 20,422,617 |
Schoeller-Bleckmann Oilfield Equipment AG | 8,662 | | 729,095 |
Superior Energy Services, Inc. (a) | 89,484 | | 1,939,118 |
Total Energy Services, Inc. | 53,200 | | 753,293 |
Weatherford International Ltd. (a) | 328,867 | | 3,962,847 |
| | 104,235,816 |
TOTAL ENERGY EQUIPMENT & SERVICES | | 150,778,014 |
HOTELS, RESTAURANTS & LEISURE - 0.0% |
Casinos & Gaming - 0.0% |
Icahn Enterprises LP rights (a) | 66,553 | | 1 |
OIL, GAS & CONSUMABLE FUELS - 73.8% |
Coal & Consumable Fuels - 1.2% |
Cloud Peak Energy, Inc. (a) | 93,300 | | 1,544,115 |
Peabody Energy Corp. | 299,526 | | 6,254,103 |
| | 7,798,218 |
|
| Shares | | Value |
Integrated Oil & Gas - 39.2% |
Chevron Corp. | 730,491 | | $ 80,047,206 |
Exxon Mobil Corp. | 770,528 | | 66,920,357 |
Hess Corp. | 479,661 | | 22,620,813 |
InterOil Corp. (a)(d) | 60,200 | | 5,155,528 |
Murphy Oil Corp. | 120,406 | | 6,460,986 |
Occidental Petroleum Corp. | 567,477 | | 49,387,523 |
Royal Dutch Shell PLC Class A sponsored ADR | 163,300 | | 11,137,060 |
Suncor Energy, Inc. | 403,460 | | 12,334,929 |
| | 254,064,402 |
Oil & Gas Exploration & Production - 24.9% |
Anadarko Petroleum Corp. | 152,141 | | 10,564,671 |
Apache Corp. | 193,186 | | 16,637,178 |
Atlas Resource Partners LP | 1,391 | | 34,845 |
Bill Barrett Corp. (a) | 27,500 | | 579,150 |
BPZ Energy, Inc. (a) | 263,764 | | 601,382 |
C&C Energia Ltd. (a) | 122,600 | | 768,962 |
Cabot Oil & Gas Corp. | 498,790 | | 21,043,950 |
Carrizo Oil & Gas, Inc. (a) | 26,300 | | 663,023 |
Cobalt International Energy, Inc. (a) | 140,000 | | 3,514,000 |
Comstock Resources, Inc. (a) | 338,606 | | 5,478,645 |
Concho Resources, Inc. (a) | 28,703 | | 2,446,931 |
Energen Corp. | 26,388 | | 1,351,329 |
EOG Resources, Inc. | 114,179 | | 11,190,684 |
EQT Corp. | 405,700 | | 22,881,480 |
EV Energy Partners LP | 61,000 | | 3,345,850 |
Gran Tierra Energy, Inc. (Canada) (a) | 398,872 | | 1,825,619 |
Halcon Resources Corp. (f) | 300,000 | | 1,980,000 |
Harvest Natural Resources, Inc. (a)(d) | 130,481 | | 1,028,190 |
Kodiak Oil & Gas Corp. (a)(d) | 79,900 | | 667,165 |
Marathon Oil Corp. | 240,164 | | 6,357,141 |
Midstates Petroleum Co., Inc. | 61,400 | | 523,128 |
Noble Energy, Inc. | 143,054 | | 12,507,211 |
Northern Oil & Gas, Inc. (a) | 54,100 | | 852,616 |
Painted Pony Petroleum Ltd. (a)(e) | 5,000 | | 46,617 |
Pioneer Natural Resources Co. | 140,900 | | 12,487,967 |
Plains Exploration & Production Co. (a) | 115,700 | | 4,623,372 |
Rosetta Resources, Inc. (a) | 203,781 | | 8,501,743 |
SM Energy Co. | 138,493 | | 6,521,635 |
Southwestern Energy Co. (a) | 52,600 | | 1,748,950 |
TAG Oil Ltd. (a) | 74,600 | | 521,460 |
TAG Oil Ltd. (e) | 11,400 | | 79,687 |
| | 161,374,581 |
Oil & Gas Refining & Marketing - 5.9% |
Calumet Specialty Products Partners LP | 121,335 | | 3,100,109 |
Marathon Petroleum Corp. | 219,187 | | 10,367,545 |
Northern Tier Energy LP Class A | 203,406 | | 3,138,555 |
Tesoro Corp. | 497,065 | | 13,743,847 |
Valero Energy Corp. | 281,245 | | 7,734,238 |
| | 38,084,294 |
Oil & Gas Storage & Transport - 2.6% |
Atlas Energy LP | 32,035 | | 1,006,860 |
Common Stocks - continued |
| Shares | | Value |
OIL, GAS & CONSUMABLE FUELS - CONTINUED |
Oil & Gas Storage & Transport - continued |
Atlas Pipeline Partners, LP | 110,200 | | $ 3,664,150 |
Cheniere Energy, Inc. (a) | 73,955 | | 1,008,007 |
Markwest Energy Partners LP | 36,000 | | 1,892,520 |
Tesoro Logistics LP | 65,366 | | 2,385,205 |
Williams Companies, Inc. | 204,810 | | 6,510,910 |
| | 16,467,652 |
TOTAL OIL, GAS & CONSUMABLE FUELS | | 477,789,147 |
TOTAL COMMON STOCKS (Cost $601,233,054) |
635,152,812
|
Money Market Funds - 2.6% |
| | | |
Fidelity Cash Central Fund, 0.17% (b) | 11,938,490 | | 11,938,490 |
Fidelity Securities Lending Cash Central Fund, 0.18% (b)(c) | 5,169,750 | | 5,169,750 |
TOTAL MONEY MARKET FUNDS (Cost $17,108,240) |
17,108,240
|
TOTAL INVESTMENT PORTFOLIO - 100.7% (Cost $618,341,294) | | 652,261,052 |
NET OTHER ASSETS (LIABILITIES) - (0.7)% | | (4,687,740) |
NET ASSETS - 100% | $ 647,573,312 |
Legend |
(a) Non-income producing |
(b) Affiliated fund that is available only to investment companies and other accounts managed by Fidelity Investments. The rate quoted is the annualized seven-day yield of the fund at period end. A complete unaudited listing of the fund's holdings as of its most recent quarter end is available upon request. In addition, each Fidelity Central Fund's financial statements, which are not covered by the Fund's Report of Independent Registered Public Accounting Firm, are available on the SEC's website or upon request. |
(c) Investment made with cash collateral received from securities on loan. |
(d) Security or a portion of the security is on loan at period end. |
(e) Security exempt from registration under Rule 144A of the Securities Act of 1933. These securities may be resold in transactions exempt from registration, normally to qualified institutional buyers. At the end of the period, the value of these securities amounted to $1,430,175 or 0.2% of net assets. |
(f) Restricted securities - Investment in securities not registered under the Securities Act of 1933 (excluding 144A issues). At the end of the period, the value of restricted securities (excluding 144A issues) amounted to $1,980,000 or 0.3% of net assets. |
Additional information on each restricted holding is as follows: |
Security | Acquisition Date | Acquisition Cost |
Halcon Resources Corp. | 3/1/12 | $ 2,700,000 |
Affiliated Central Funds |
Information regarding fiscal year to date income earned by the Fund from investments in Fidelity Central Funds is as follows: |
Fund | Income earned |
Fidelity Cash Central Fund | $ 10,511 |
Fidelity Securities Lending Cash Central Fund | 120,606 |
Total | $ 131,117 |
Other Information |
The following is a summary of the inputs used, as of July 31, 2012, involving the Fund's assets and liabilities carried at fair value. The inputs or methodology used for valuing securities may not be an indication of the risk associated with investing in those securities. For more information on valuation inputs, and their aggregation into the levels used in the table below, please refer to the Security Valuation section in the accompanying Notes to Financial Statements. |
Valuation Inputs at Reporting Date: |
Description | Total | Level 1 | Level 2 | Level 3 |
Investments in Securities: | | | | |
Common Stocks | $ 635,152,812 | $ 631,541,190 | $ 3,611,621 | $ 1 |
Money Market Funds | 17,108,240 | 17,108,240 | - | - |
Total Investments in Securities: | $ 652,261,052 | $ 648,649,430 | $ 3,611,621 | $ 1 |
Distribution of investments by country or territory of incorporation, as a percentage of total net assets, is as follows. (Unaudited) |
United States of America | 80.4% |
United Kingdom | 4.8% |
Switzerland | 4.2% |
Canada | 3.1% |
Curacao | 3.1% |
Netherlands | 2.5% |
Others (Individually Less Than 1%) | 1.9% |
| 100.0% |
See accompanying notes which are an integral part of the financial statements.
Annual Report
Fidelity Advisor Energy Fund
Statement of Assets and Liabilities
| July 31, 2012 |
| | |
Assets | | |
Investment in securities, at value (including securities loaned of $4,970,802) - See accompanying schedule: Unaffiliated issuers (cost $601,233,054) | $ 635,152,812 | |
Fidelity Central Funds (cost $17,108,240) | 17,108,240 | |
Total Investments (cost $618,341,294) | | $ 652,261,052 |
Receivable for investments sold | | 6,668,144 |
Receivable for fund shares sold | | 513,460 |
Dividends receivable | | 61,871 |
Distributions receivable from Fidelity Central Funds | | 19,710 |
Other receivables | | 13,854 |
Total assets | | 659,538,091 |
| | |
Liabilities | | |
Payable for investments purchased | $ 4,668,492 | |
Payable for fund shares redeemed | 1,383,348 | |
Accrued management fee | 294,986 | |
Distribution and service plan fees payable | 239,420 | |
Other affiliated payables | 163,077 | |
Other payables and accrued expenses | 45,706 | |
Collateral on securities loaned, at value | 5,169,750 | |
Total liabilities | | 11,964,779 |
| | |
Net Assets | | $ 647,573,312 |
Net Assets consist of: | | |
Paid in capital | | $ 676,197,162 |
Accumulated net investment loss | | (503,083) |
Accumulated undistributed net realized gain (loss) on investments and foreign currency transactions | | (62,040,186) |
Net unrealized appreciation (depreciation) on investments and assets and liabilities in foreign currencies | | 33,919,419 |
Net Assets | | $ 647,573,312 |
Statement of Assets and Liabilities - continued
| July 31, 2012 |
| | |
Calculation of Maximum Offering Price Class A:
Net Asset Value and redemption price per share ($253,331,873 ÷ 7,516,040 shares) | | $ 33.71 |
| | |
Maximum offering price per share (100/94.25 of $33.71) | | $ 35.77 |
Class T:
Net Asset Value and redemption price per share ($215,488,059 ÷ 6,264,385 shares) | | $ 34.40 |
| | |
Maximum offering price per share (100/96.50 of $34.40) | | $ 35.65 |
Class B:
Net Asset Value and offering price per share ($28,557,727 ÷ 909,266 shares)A | | $ 31.41 |
| | |
Class C:
Net Asset Value and offering price per share ($93,503,953 ÷ 2,955,799 shares)A | | $ 31.63 |
| | |
Institutional Class:
Net Asset Value, offering price and redemption price per share ($56,691,700 ÷ 1,607,132 shares) | | $ 35.28 |
A Redemption price per share is equal to net asset value less any applicable contingent deferred sales charge.
See accompanying notes which are an integral part of the financial statements.
Annual Report
Fidelity Advisor Energy Fund
Financial Statements - continued
Statement of Operations
| Year ended July 31, 2012 |
| | |
Investment Income | | |
Dividends | | $ 12,930,947 |
Interest | | 5,903 |
Income from Fidelity Central Funds | | 131,117 |
Total income | | 13,067,967 |
| | |
Expenses | | |
Management fee | $ 3,872,271 | |
Transfer agent fees | 1,952,670 | |
Distribution and service plan fees | 3,236,374 | |
Accounting and security lending fees | 249,221 | |
Custodian fees and expenses | 30,688 | |
Independent trustees' compensation | 4,638 | |
Registration fees | 97,452 | |
Audit | 47,577 | |
Legal | 2,610 | |
Miscellaneous | 8,149 | |
Total expenses before reductions | 9,501,650 | |
Expense reductions | (24,920) | 9,476,730 |
Net investment income (loss) | | 3,591,237 |
Realized and Unrealized Gain (Loss) Net realized gain (loss) on: | | |
Investment securities: | | |
Unaffiliated issuers | (47,746,242) | |
Foreign currency transactions | (5,773) | |
Total net realized gain (loss) | | (47,752,015) |
Change in net unrealized appreciation (depreciation) on: Investment securities | (91,974,915) | |
Assets and liabilities in foreign currencies | (454) | |
Total change in net unrealized appreciation (depreciation) | | (91,975,369) |
Net gain (loss) | | (139,727,384) |
Net increase (decrease) in net assets resulting from operations | | $ (136,136,147) |
Statement of Changes in Net Assets
| Year ended
July 31,
2012 | Year ended
July 31,
2011 |
Increase (Decrease) in Net Assets | | |
Operations | | |
Net investment income (loss) | $ 3,591,237 | $ 609,873 |
Net realized gain (loss) | (47,752,015) | 108,257,689 |
Change in net unrealized appreciation (depreciation) | (91,975,369) | 148,374,915 |
Net increase (decrease) in net assets resulting
from operations | (136,136,147) | 257,242,477 |
Distributions to shareholders from net investment income | (3,625,437) | (1,542,989) |
Share transactions - net increase (decrease) | (71,627,600) | 7,476,541 |
Redemption fees | 37,255 | 27,523 |
Total increase (decrease) in net assets | (211,351,929) | 263,203,552 |
| | |
Net Assets | | |
Beginning of period | 858,925,241 | 595,721,689 |
End of period (including accumulated net investment loss of $503,083 and accumulated net investment loss of $187, respectively) | $ 647,573,312 | $ 858,925,241 |
See accompanying notes which are an integral part of the financial statements.
Annual Report
Financial Highlights - Class A
Years ended July 31, | 2012 | 2011 | 2010 | 2009 | 2008 |
Selected Per-Share Data | | | | | |
Net asset value, beginning of period | $ 40.17 | $ 27.70 | $ 25.82 | $ 50.24 | $ 48.28 |
Income from Investment Operations | | | | | |
Net investment income (loss) C | .25 | .11 | (.05) | (.04) | (.17) |
Net realized and unrealized gain (loss) | (6.50) | 12.47 | 1.93 | (17.48) | 5.59 |
Total from investment operations | (6.25) | 12.58 | 1.88 | (17.52) | 5.42 |
Distributions from net investment income | (.21) | (.11) | - | - | - |
Distributions from net realized gain | - | - | - | (6.90) | (3.46) |
Total distributions | (.21) | (.11) | - | (6.90) | (3.46) |
Redemption fees added to paid in capital C, G | - | - | - | - | - |
Net asset value, end of period | $ 33.71 | $ 40.17 | $ 27.70 | $ 25.82 | $ 50.24 |
Total Return A, B | (15.58)% | 45.46% | 7.28% | (38.86)% | 11.52% |
Ratios to Average Net Assets D, F | | | | | |
Expenses before reductions | 1.17% | 1.16% | 1.20% | 1.22% | 1.14% |
Expenses net of fee waivers, if any | 1.17% | 1.16% | 1.20% | 1.22% | 1.14% |
Expenses net of all reductions | 1.17% | 1.16% | 1.19% | 1.21% | 1.14% |
Net investment income (loss) | .72% | .30% | (.16)% | (.14)% | (.32)% |
Supplemental Data | | | | | |
Net assets, end of period (000 omitted) | $ 253,332 | $ 331,120 | $ 214,407 | $ 216,595 | $ 355,200 |
Portfolio turnover rate E | 88% | 91% | 103% | 148% | 90% |
A Total returns would have been lower if certain expenses had not been reduced during the applicable periods shown.
B Total returns do not include the effect of the sales charges.
C Calculated based on average shares outstanding during the period.
D Fees and expenses of any underlying Fidelity Central Funds are not included in the Fund's expense ratio. The Fund indirectly bears its proportionate share of the expenses of any underlying Fidelity Central Funds.
E Amount does not include the portfolio activity of any underlying Fidelity Central Funds.
F Expense ratios reflect operating expenses of the class. Expenses before reductions do not reflect amounts reimbursed by the investment adviser or reductions from brokerage service arrangements or reductions from other expense offset arrangements and do not represent the amount paid by the class during periods when reimbursements or reductions occur. Expenses net of fee waivers reflect expenses after reimbursement by the investment adviser but prior to reductions from brokerage service arrangements or other expense offset arrangements. Expenses net of all reductions represent the net expenses paid by the class.
G Amount represents less than $.01 per share.
Financial Highlights - Class T
Years ended July 31, | 2012 | 2011 | 2010 | 2009 | 2008 |
Selected Per-Share Data | | | | | |
Net asset value, beginning of period | $ 41.04 | $ 28.33 | $ 26.47 | $ 51.40 | $ 49.26 |
Income from Investment Operations | | | | | |
Net investment income (loss) C | .18 | .03 | (.11) | (.10) | (.29) |
Net realized and unrealized gain (loss) | (6.65) | 12.75 | 1.97 | (17.93) | 5.72 |
Total from investment operations | (6.47) | 12.78 | 1.86 | (18.03) | 5.43 |
Distributions from net investment income | (.17) | (.07) | - | - | - |
Distributions from net realized gain | - | - | - | (6.90) | (3.29) |
Total distributions | (.17) | (.07) | - | (6.90) | (3.29) |
Redemption fees added to paid in capital C, G | - | - | - | - | - |
Net asset value, end of period | $ 34.40 | $ 41.04 | $ 28.33 | $ 26.47 | $ 51.40 |
Total Return A, B | (15.77)% | 45.16% | 7.03% | (38.99)% | 11.27% |
Ratios to Average Net Assets D, F | | | | | |
Expenses before reductions | 1.38% | 1.37% | 1.41% | 1.45% | 1.36% |
Expenses net of fee waivers, if any | 1.38% | 1.37% | 1.41% | 1.45% | 1.36% |
Expenses net of all reductions | 1.38% | 1.37% | 1.41% | 1.45% | 1.35% |
Net investment income (loss) | .50% | .09% | (.37)% | (.38)% | (.54)% |
Supplemental Data | | | | | |
Net assets, end of period (000 omitted) | $ 215,488 | $ 290,512 | $ 219,051 | $ 224,376 | $ 407,784 |
Portfolio turnover rate E | 88% | 91% | 103% | 148% | 90% |
A Total returns would have been lower if certain expenses had not been reduced during the applicable periods shown.
B Total returns do not include the effect of the sales charges.
C Calculated based on average shares outstanding during the period.
D Fees and expenses of any underlying Fidelity Central Funds are not included in the Fund's expense ratio. The Fund indirectly bears its proportionate share of the expenses of any underlying Fidelity Central Funds.
E Amount does not include the portfolio activity of any underlying Fidelity Central Funds.
F Expense ratios reflect operating expenses of the class. Expenses before reductions do not reflect amounts reimbursed by the investment adviser or reductions from brokerage service arrangements or reductions from other expense offset arrangements and do not represent the amount paid by the class during periods when reimbursements or reductions occur. Expenses net of fee waivers reflect expenses after reimbursement by the investment adviser but prior to reductions from brokerage service arrangements or other expense offset arrangements. Expenses net of all reductions represent the net expenses paid by the class.
G Amount represents less than $.01 per share.
See accompanying notes which are an integral part of the financial statements.
Annual Report
Financial Highlights - Class B
Years ended July 31, | 2012 | 2011 | 2010 | 2009 | 2008 |
Selected Per-Share Data | | | | | |
Net asset value, beginning of period | $ 37.61 | $ 26.06 | $ 24.48 | $ 48.35 | $ 46.64 |
Income from Investment Operations | | | | | |
Net investment income (loss) C | (.01) | (.15) | (.25) | (.22) | (.56) |
Net realized and unrealized gain (loss) | (6.09) | 11.71 | 1.83 | (16.75) | 5.41 |
Total from investment operations | (6.10) | 11.56 | 1.58 | (16.97) | 4.85 |
Distributions from net investment income | (.10) | (.01) | - | - | - |
Distributions from net realized gain | - | - | - | (6.90) | (3.14) |
Total distributions | (.10) | (.01) | - | (6.90) | (3.14) |
Redemption fees added to paid in capital C, G | - | - | - | - | - |
Net asset value, end of period | $ 31.41 | $ 37.61 | $ 26.06 | $ 24.48 | $ 48.35 |
Total Return A, B | (16.22)% | 44.38% | 6.45% | (39.31)% | 10.62% |
Ratios to Average Net Assets D, F | | | | | |
Expenses before reductions | 1.92% | 1.93% | 1.96% | 1.96% | 1.93% |
Expenses net of fee waivers, if any | 1.92% | 1.93% | 1.96% | 1.96% | 1.93% |
Expenses net of all reductions | 1.92% | 1.92% | 1.95% | 1.96% | 1.93% |
Net investment income (loss) | (.03)% | (.46)% | (.92)% | (.89)% | (1.11)% |
Supplemental Data | | | | | |
Net assets, end of period (000 omitted) | $ 28,558 | $ 49,793 | $ 44,330 | $ 47,795 | $ 98,602 |
Portfolio turnover rate E | 88% | 91% | 103% | 148% | 90% |
A Total returns would have been lower if certain expenses had not been reduced during the applicable periods shown.
B Total returns do not include the effect of the contingent deferred sales charge.
C Calculated based on average shares outstanding during the period.
D Fees and expenses of any underlying Fidelity Central Funds are not included in the Fund's expense ratio. The Fund indirectly bears its proportionate share of the expenses of any underlying Fidelity Central Funds.
E Amount does not include the portfolio activity of any underlying Fidelity Central Funds.
F Expense ratios reflect operating expenses of the class. Expenses before reductions do not reflect amounts reimbursed by the investment adviser or reductions from brokerage service arrangements or reductions from other expense offset arrangements and do not represent the amount paid by the class during periods when reimbursements or reductions occur. Expenses net of fee waivers reflect expenses after reimbursement by the investment adviser but prior to reductions from brokerage service arrangements or other expense offset arrangements. Expenses net of all reductions represent the net expenses paid by the class.
G Amount represents less than $.01 per share.
Financial Highlights - Class C
Years ended July 31, | 2012 | 2011 | 2010 | 2009 | 2008 |
Selected Per-Share Data | | | | | |
Net asset value, beginning of period | $ 37.88 | $ 26.25 | $ 24.65 | $ 48.63 | $ 46.88 |
Income from Investment Operations | | | | | |
Net investment income (loss) C | (.01) | (.15) | (.25) | (.21) | (.54) |
Net realized and unrealized gain (loss) | (6.13) | 11.80 | 1.85 | (16.87) | 5.45 |
Total from investment operations | (6.14) | 11.65 | 1.60 | (17.08) | 4.91 |
Distributions from net investment income | (.11) | (.02) | - | - | - |
Distributions from net realized gain | - | - | - | (6.90) | (3.16) |
Total distributions | (.11) | (.02) | - | (6.90) | (3.16) |
Redemption fees added to paid in capital C, G | - | - | - | - | - |
Net asset value, end of period | $ 31.63 | $ 37.88 | $ 26.25 | $ 24.65 | $ 48.63 |
Total Return A, B | (16.22)% | 44.38% | 6.49% | (39.31)% | 10.71% |
Ratios to Average Net Assets D, F | | | | | |
Expenses before reductions | 1.92% | 1.90% | 1.94% | 1.96% | 1.87% |
Expenses net of fee waivers, if any | 1.92% | 1.90% | 1.94% | 1.96% | 1.87% |
Expenses net of all reductions | 1.91% | 1.89% | 1.93% | 1.95% | 1.87% |
Net investment income (loss) | (.03)% | (.43)% | (.90)% | (.88)% | (1.05)% |
Supplemental Data | | | | | |
Net assets, end of period (000 omitted) | $ 93,504 | $ 133,476 | $ 90,596 | $ 86,650 | $ 156,393 |
Portfolio turnover rate E | 88% | 91% | 103% | 148% | 90% |
A Total returns would have been lower if certain expenses had not been reduced during the applicable periods shown.
B Total returns do not include the effect of the contingent deferred sales charge.
C Calculated based on average shares outstanding during the period.
D Fees and expenses of any underlying Fidelity Central Funds are not included in the Fund's expense ratio. The Fund indirectly bears its proportionate share of the expenses of any underlying Fidelity Central Funds.
E Amount does not include the portfolio activity of any underlying Fidelity Central Funds.
F Expense ratios reflect operating expenses of the class. Expenses before reductions do not reflect amounts reimbursed by the investment adviser or reductions from brokerage service arrangements or reductions from other expense offset arrangements and do not represent the amount paid by the class during periods when reimbursements or reductions occur. Expenses net of fee waivers reflect expenses after reimbursement by the investment adviser but prior to reductions from brokerage service arrangements or other expense offset arrangements. Expenses net of all reductions represent the net expenses paid by the class.
G Amount represents less than $.01 per share.
See accompanying notes which are an integral part of the financial statements.
Annual Report
Financial Highlights - Institutional Class
Years ended July 31, | 2012 | 2011 | 2010 | 2009 | 2008 |
Selected Per-Share Data | | | | | |
Net asset value, beginning of period | $ 41.95 | $ 28.87 | $ 26.83 | $ 51.76 | $ 49.68 |
Income from Investment Operations | | | | | |
Net investment income (loss) B | .37 | .23 | .04 | .03 | (.02) |
Net realized and unrealized gain (loss) | (6.79) | 12.99 | 2.00 | (18.06) | 5.74 |
Total from investment operations | (6.42) | 13.22 | 2.04 | (18.03) | 5.72 |
Distributions from net investment income | (.25) | (.14) | - | - | - |
Distributions from net realized gain | - | - | - | (6.90) | (3.64) |
Total distributions | (.25) | (.14) | - | (6.90) | (3.64) |
Redemption fees added to paid in capital B, F | - | - | - | - | - |
Net asset value, end of period | $ 35.28 | $ 41.95 | $ 28.87 | $ 26.83 | $ 51.76 |
Total Return A | (15.31)% | 45.87% | 7.60% | (38.68)% | 11.83% |
Ratios to Average Net Assets C, E | | | | | |
Expenses before reductions | .86% | .86% | .90% | .95% | .85% |
Expenses net of fee waivers, if any | .86% | .86% | .90% | .95% | .85% |
Expenses net of all reductions | .85% | .85% | .90% | .94% | .85% |
Net investment income (loss) | 1.03% | .60% | .14% | .13% | (.03)% |
Supplemental Data | | | | | |
Net assets, end of period (000 omitted) | $ 56,692 | $ 54,024 | $ 27,338 | $ 18,631 | $ 22,250 |
Portfolio turnover rate D | 88% | 91% | 103% | 148% | 90% |
A Total returns would have been lower if certain expenses had not been reduced during the applicable periods shown.
B Calculated based on average shares outstanding during the period.
C Fees and expenses of any underlying Fidelity Central Funds are not included in the Fund's expense ratio. The Fund indirectly bears its proportionate share of the expenses of any underlying Fidelity Central Funds.
D Amount does not include the portfolio activity of any underlying Fidelity Central Funds.
E Expense ratios reflect operating expenses of the class. Expenses before reductions do not reflect amounts reimbursed by the investment adviser or reductions from brokerage service arrangements or reductions from other expense offset arrangements and do not represent the amount paid by the class during periods when reimbursements or reductions occur. Expenses net of fee waivers reflect expenses after reimbursement by the investment adviser but prior to reductions from brokerage service arrangements or other expense offset arrangements. Expenses net of all reductions represent the net expenses paid by the class.
F Amount represents less than $.01 per share.
See accompanying notes which are an integral part of the financial statements.
Annual Report
Fidelity Advisor Energy Fund
Notes to Financial Statements
For the period ended July 31, 2012
1. Organization.
Fidelity Advisor Energy Fund (the Fund) is a non-diversified fund of Fidelity Advisor Series VII (the Trust) and is authorized to issue an unlimited number of shares. The Trust is registered under the Investment Company Act of 1940, as amended (the 1940 Act), as an open-end management investment company organized as a Massachusetts business trust. The Fund offers Class A, Class T, Class C, and Institutional Class shares, each of which, along with Class B shares, has equal rights as to assets and voting privileges. Effective after the close of business on September 1, 2010, Class B shares were closed to new accounts and additional purchases, except for exchanges and reinvestments. Each class has exclusive voting rights with respect to matters that affect that class. Class B shares will automatically convert to Class A shares after a holding period of seven years from the initial date of purchase. Investment income, realized and unrealized capital gains and losses, the common expenses of the Fund, and certain fund-level expense reductions, if any, are allocated on a pro-rata basis to each class based on the relative net assets of each class to the total net assets of the Fund. Each class differs with respect to transfer agent and distribution and service plan fees incurred. Certain expense reductions may also differ by class.
2. Investments in Fidelity Central Funds.
The Fund invests in Fidelity Central Funds, which are open-end investment companies available only to other investment companies and accounts managed by Fidelity Management & Research Company (FMR) and its affiliates. The Fund's Schedule of Investments lists each of the Fidelity Central Funds held as of period end, if any, as an investment of the Fund, but does not include the underlying holdings of each Fidelity Central Fund. As an Investing Fund, the Fund indirectly bears its proportionate share of the expenses of the underlying Fidelity Central Funds.
The Money Market Central Funds seek preservation of capital and current income and are managed by Fidelity Investments Money Management, Inc. (FIMM), an affiliate of FMR.
A complete unaudited list of holdings for each Fidelity Central Fund is available upon request or at the Securities and Exchange Commission (the SEC) web site at www.sec.gov. In addition, the financial statements of the Fidelity Central Funds, which are not covered by the Fund's Report of Independent Registered Public Accounting Firm, are available on the SEC web site or upon request.
3. Significant Accounting Policies.
The financial statements have been prepared in conformity with accounting principles generally accepted in the United States of America (GAAP), which require management to make certain estimates and assumptions at the date of the financial statements. Actual results could differ from those estimates. Subsequent events, if any, through the date that the financial statements were issued have been evaluated in the preparation of the financial statements. The following summarizes the significant accounting policies of the Fund:
Security Valuation. Investments are valued as of 4:00 p.m. Eastern time on the last calendar day of the period. In accordance with valuation policies and procedures approved by the Board of Trustees (the Board), the Fund attempts to obtain prices from one or more third party pricing vendor or broker to value its investments. When current market prices, quotations or rates are not readily available or reliable, securities will be fair valued in good faith by the FMR Fair Value Committee (the Committee), in accordance with procedures adopted by the Fund's Board. Factors used in determining fair value vary by security type and may include market or security specific events. The frequency with which these procedures are used cannot be predicted and they may be utilized to a significant extent. The Committee oversees the Fund's valuation policies and procedures and is responsible for approving and reporting to the Board all fair value determinations.
The Fund categorizes the inputs to valuation techniques used to value its investments into a disclosure hierarchy consisting of three levels as shown below:
Level 1 - quoted prices in active markets for identical investments
Level 2 - other significant observable inputs (including quoted prices for similar investments, interest rates, prepayment speeds, etc.)
Level 3 - unobservable inputs (including the Fund's own assumptions based on the best information available)
Valuation techniques used to value the Fund's investments by major category are as follows:
Equity securities, including restricted securities, for which market quotations are readily available, are valued at the last reported sale price or official closing price as reported by a third party pricing vendor on the primary market or exchange on which they are traded and are categorized as Level 1 in the hierarchy. In the event there were no sales during the day or closing prices are not available, securities are valued at the last quoted bid price or may be valued using the last available price and are generally categorized as Level 2 in the hierarchy. For foreign equity securities, when significant market or security specific events arise, comparisons to the valuation of American Depositary Receipts (ADRs), futures contracts, Exchange-Traded Funds (ETFs)and certain indexes as well as quoted prices for similar securities are used and are categorized as Level 2 in the hierarchy. Utilizing these techniques may result in transfers between Level 1 and Level 2. For restricted equity securities and private placements where observable inputs are limited, assumptions about market activity and risk are used and these securities are categorized as Level 3 in the hierarchy.
Annual Report
3. Significant Accounting Policies - continued
Security Valuation - continued
Investments in open-end mutual funds, including the Fidelity Central Funds, are valued at their closing net asset value each business day and are categorized as Level 1 in the hierarchy.
Changes in valuation techniques may result in transfers in or out of an assigned level within the disclosure hierarchy. The aggregate value of investments by input level, as of July 31, 2012, is included at the end of the Fund's Schedule of Investments.
Foreign Currency Translation. The Fund may use foreign currency contracts to facilitate transactions in foreign-denominated securities. Gains and losses from these transactions may arise from changes in the value of the foreign currency or if the counterparties do not perform under the contracts' terms.
Foreign-denominated assets, including investment securities, and liabilities are translated into U.S. dollars at the exchange rates at period end. Purchases and sales of investment securities, income and dividends received and expenses denominated in foreign currencies are translated into U.S. dollars at the exchange rate in effect on the transaction date.
The effects of exchange rate fluctuations on investments are included with the net realized and unrealized gain (loss) on investment securities. Other foreign currency transactions resulting in realized and unrealized gain (loss) are disclosed separately.
Investment Transactions and Income. For financial reporting purposes, the Fund's investment holdings and NAV include trades executed through the end of the last business day of the period. The NAV per share for processing shareholder transactions is calculated as of the close of business of the New York Stock Exchange (NYSE), normally 4:00 p.m. Eastern time and includes trades executed through the end of the prior business day. Gains and losses on securities sold are determined on the basis of identified cost and may include proceeds received from litigation. Dividend income is recorded on the ex-dividend date, except for certain dividends from foreign securities where the ex-dividend date may have passed, which are recorded as soon as the Fund is informed of the ex-dividend date. Non-cash dividends included in dividend income, if any, are recorded at the fair market value of the securities received. Distributions received on securities that represent a return of capital or capital gain are recorded as a reduction of cost of investments and/or as a realized gain. The Fund estimates the components of distributions received that may be considered return of capital distributions or capital gain distributions. Interest income and distributions from the Fidelity Central Funds are accrued as earned. Interest income includes coupon interest and amortization of premium and accretion of discount on debt securities. Investment income is recorded net of foreign taxes withheld where recovery of such taxes is uncertain.
Expenses. Expenses directly attributable to a fund are charged to that fund. Expenses attributable to more than one fund are allocated among the respective funds on the basis of relative net assets or other appropriate methods. Expense estimates are accrued in the period to which they relate and adjustments are made when actual amounts are known.
Income Tax Information and Distributions to Shareholders. Each year, the Fund intends to qualify as a regulated investment company under Subchapter M of the Internal Revenue Code, including distributing substantially all of its taxable income and realized gains. As a result, no provision for income taxes is required. As of July 31, 2012, the Fund did not have any unrecognized tax benefits in the financial statements; nor is the Fund aware of any tax positions for which it is reasonably possible that the total amounts of unrecognized tax benefits will significantly change in the next twelve months. The Fund files a U.S. federal tax return, in addition to state and local tax returns as required. A fund's federal income tax returns are subject to examination by the Internal Revenue Service (IRS) for a period of three fiscal years after they are filed. State and local tax returns may be subject to examination for an additional fiscal year depending on the jurisdiction. Foreign taxes are provided for based on the Fund's understanding of the tax rules and rates that exist in the foreign markets in which it invests.
Distributions are declared and recorded on the ex-dividend date. Income dividends and capital gain distributions are declared separately for each class. Income and capital gain distributions are determined in accordance with income tax regulations, which may differ from GAAP.
Capital accounts within the financial statements are adjusted for permanent book-tax differences. These adjustments have no impact on net assets or the results of operations. Temporary book-tax differences will reverse in a subsequent period.
Book-tax differences are primarily due to foreign currency transactions, partnerships, deferred trustees compensation, capital loss carryforwards, and losses deferred due to wash sales and excise tax regulations.
The federal tax cost of investment securities and unrealized appreciation (depreciation) as of period end were as follows:
Annual Report
Fidelity Advisor Energy Fund
Notes to Financial Statements - continued
3. Significant Accounting Policies - continued
Income Tax Information and Distributions to Shareholders - continued
Gross unrealized appreciation | $ 70,476,487 |
Gross unrealized depreciation | (39,744,261) |
Net unrealized appreciation (depreciation) on securities and other investments | $ 30,732,226 |
| |
Tax Cost | $ 621,528,826 |
The tax-based components of distributable earnings as of period end were as follows:
Capital loss carryforward | $ (42,733,087) |
Net unrealized appreciation (depreciation) | $ 30,731,887 |
Capital loss carryforwards are only available to offset future capital gains of the Fund to the extent provided by regulations and may be limited. Under the Regulated Investment Company Modernization Act of 2010 (the Act), the Fund is permitted to carry forward capital losses incurred in taxable years beginning after December 22, 2010 for an unlimited period and such capital losses are required to be used prior to any losses that expire. Capital loss carryforwards were as follows:
Fiscal year of expiration | |
| |
2017 | $ (2,848,921) |
2018 | (2,715,383) |
Total with expiration | (5,564,304) |
No expiration | |
Short-term | (37,168,783) |
Total capital loss carryforward | $ (42,733,087) |
The Fund intends to elect to defer to its fiscal year ending July 31, 2013 approximately $16,119,567 of losses recognized during the period November 1, 2011 to July 31, 2012.
The tax character of distributions paid was as follows:
| July 31, 2012 | July 31, 2011 |
Ordinary Income | $ 3,625,437 | $ 1,542,989 |
Short-Term Trading (Redemption) Fees. Shares held by investors in the Fund less than 30 days are subject to a redemption fee equal to .75% of the net asset value of shares redeemed. All redemption fees, which reduce the proceeds of the shareholder redemption, are retained by the Fund and accounted for as an addition to paid in capital.
New Accounting Pronouncement. In December 2011, the Financial Accounting Standards Board issued Accounting Standard Update No. 2011-11, Disclosures about Offsetting Assets and Liabilities. The update creates new disclosure requirements requiring entities to disclose both gross and net information for derivatives and other financial instruments that are either offset in the Statement of Assets and Liabilities or subject to an enforceable master netting arrangement or similar agreement. The disclosure requirements are effective for interim and annual reporting periods beginning on or after January 1, 2013. Management is currently evaluating the impact of the update's adoption on the Fund's financial statement disclosures.
4. Operating Policies.
Restricted Securities. The Fund may invest in securities that are subject to legal or contractual restrictions on resale. These securities generally may be resold in transactions exempt from registration or to the public if the securities are registered. Disposal of these securities may involve time-consuming negotiations and expense, and prompt sale at an acceptable price may be difficult. Information regarding restricted securities is included at the end of the Fund's Schedule of Investments.
5. Purchases and Sales of Investments.
Purchases and sales of securities, other than short-term securities, aggregated $616,352,470 and $698,886,570, respectively.
Annual Report
6. Fees and Other Transactions with Affiliates.
Management Fee. FMR and its affiliates provide the Fund with investment management related services for which the Fund pays a monthly management fee. The management fee is the sum of an individual fund fee rate that is based on an annual rate of .30% of the Fund's average net assets and an annualized group fee rate that averaged .26% during the period. The group fee rate is based upon the average net assets of all the mutual funds advised by FMR. The group fee rate decreases as assets under management increase and increases as assets under management decrease. For the period, the total annual management fee rate was .56% of the Fund's average net assets.
Distribution and Service Plan Fees. In accordance with Rule 12b-1 of the 1940 Act, the Fund has adopted separate Distribution and Service Plans for each class of shares. Certain classes pay Fidelity Distributors Corporation (FDC), an affiliate of FMR, separate Distribution and Service Fees, each of which is based on an annual percentage of each class' average net assets. In addition, FDC may pay financial intermediaries for selling shares of the Fund and providing shareholder support services. For the period, the Distribution and Service Fee rates, total fees and amounts retained by FDC were as follows:
| Distribution
Fee | Service
Fee | Total Fees | Retained
by FDC |
Class A | -% | .25% | $ 673,541 | $ 15,540 |
Class T | .25% | .25% | 1,163,443 | 5,233 |
Class B | .75% | .25% | 358,877 | 269,382 |
Class C | .75% | .25% | 1,040,513 | 147,717 |
| | | $ 3,236,374 | $ 437,872 |
Sales Load. FDC may receive a front-end sales charge of up to 5.75% for selling Class A shares and 3.50% for selling Class T shares, some of which is paid to financial intermediaries for selling shares of the Fund. Depending on the holding period, FDC may receive contingent deferred sales charges levied on Class A, Class T, Class B, and Class C redemptions. The deferred sales charges range from 5.00% to 1.00% for Class B shares, 1.00% for Class C shares, 1.00% for certain purchases of Class A shares and .25% for certain purchases of Class T shares.
For the period, sales charge amounts retained by FDC were as follows:
| Retained
by FDC |
Class A | $ 129,173 |
Class T | 25,570 |
Class B* | 56,910 |
Class C* | 15,188 |
| $ 226,841 |
* When Class B and Class C shares are initially sold, FDC pays commissions from its own resources to financial intermediaries through which the sales are made.
Transfer Agent Fees. Fidelity Investments Institutional Operations Company, Inc. (FIIOC), an affiliate of FMR, is the transfer, dividend disbursing and shareholder servicing agent for each class of the Fund. FIIOC receives account fees and asset-based fees that vary according to the account size and type of account of the shareholders of the respective classes of the Fund. FIIOC pays for typesetting, printing and mailing of shareholder reports, except proxy statements. For the period, transfer agent fees for each class were as follows:
| Amount | % of
Average
Net Assets |
Class A | $ 807,721 | .30 |
Class T | 611,222 | .26 |
Class B | 108,124 | .30 |
Class C | 305,678 | .29 |
Institutional Class | 119,925 | .23 |
| $ 1,952,670 | |
Accounting and Security Lending Fees. Fidelity Service Company, Inc. (FSC), an affiliate of FMR, maintains the Fund's accounting records. The accounting fee is based on the level of average net assets for each month. Under a separate contract, FSC administers the security lending program. The security lending fee is based on the number and duration of lending transactions.
Brokerage Commissions. The Fund placed a portion of its portfolio transactions with brokerage firms which are affiliates of the investment adviser. The commissions paid to these affiliated firms were $6,115 for the period.
Annual Report
Fidelity Advisor Energy Fund
Notes to Financial Statements - continued
7. Committed Line of Credit.
The Fund participates with other funds managed by FMR or an affiliate in a $4.25 billion credit facility (the "line of credit") to be utilized for temporary or emergency purposes to fund shareholder redemptions or for other short-term liquidity purposes. The Fund has agreed to pay commitment fees on its pro-rata portion of the line of credit, which amounted to $2,020 and is reflected in Miscellaneous expenses on the Statement of Operations. During the period, there were no borrowings on this line of credit.
8. Security Lending.
The Fund lends portfolio securities through a lending agent from time to time in order to earn additional income. For equity securities, a lending agent is used and may loan securities to certain qualified borrowers, including Fidelity Capital Markets (FCM), a broker-dealer affiliated with the Fund. On the settlement date of the loan, the Fund receives collateral (in the form of U.S. Treasury obligations, letters of credit and/or cash) against the loaned securities and maintains collateral in an amount not less than 100% of the market value of the loaned securities during the period of the loan. The market value of the loaned securities is determined at the close of business of the Fund and any additional required collateral is delivered to the Fund on the next business day. If the borrower defaults on its obligation to return the securities loaned because of insolvency or other reasons, a fund could experience delays and costs in recovering the securities loaned or in gaining access to the collateral. Any cash collateral received is invested in the Fidelity Securities Lending Cash Central Fund. The value of loaned securities and cash collateral at period end are disclosed on the Fund's Statement of Assets and Liabilities. Security lending income represents the income earned on investing cash collateral, less rebates paid to borrowers and any lending agent fees associated with the loan, plus any premium payments received for lending certain types of securities. Security lending income is presented in the Statement of Operations as a component of income from Fidelity Central Funds. Total security lending income during the period amounted to $120,606, including $455 from securities loaned to FCM.
9. Expense Reductions.
Many of the brokers with whom FMR places trades on behalf of the Fund provided services to the Fund in addition to trade execution. These services included payments of certain expenses on behalf of the Fund totaling $24,920 for the period.
10. Distributions to Shareholders.
Distributions to shareholders of each class were as follows:
Years ended July 31, | 2012 | 2011 |
From net investment income | | |
Class A | $ 1,638,737 | $ 788,179 |
Class T | 1,147,864 | 537,026 |
Class B | 121,615 | 21,298 |
Class C | 359,185 | 59,062 |
Institutional Class | 358,036 | 137,424 |
Total | $ 3,625,437 | $ 1,542,989 |
11. Share Transactions.
Transactions for each class of shares were as follows:
| Shares | Dollars |
Years ended July 31, | 2012 | 2011 | 2012 | 2011 |
Class A | | | | |
Shares sold | 1,965,815 | 2,848,824 | $ 67,878,173 | $ 108,457,523 |
Reinvestment of distributions | 41,823 | 20,239 | 1,442,046 | 701,079 |
Shares redeemed | (2,734,716) | (2,366,298) | (93,508,870) | (85,322,989) |
Net increase (decrease) | (727,078) | 502,765 | $ (24,188,651) | $ 23,835,613 |
Class T | | | | |
Shares sold | 716,955 | 1,191,543 | $ 25,119,936 | $ 45,538,389 |
Reinvestment of distributions | 30,771 | 14,153 | 1,084,070 | 502,257 |
Shares redeemed | (1,562,534) | (1,858,422) | (54,290,373) | (68,540,609) |
Net increase (decrease) | (814,808) | (652,726) | $ (28,086,367) | $ (22,499,963) |
Annual Report
11. Share Transactions - continued
| Shares | Dollars |
Years ended July 31, | 2012 | 2011 | 2012 | 2011 |
Class B | | | | |
Shares sold | 77,487 | 118,268 | $ 2,508,867 | $ 4,084,617 |
Reinvestment of distributions | 3,337 | 560 | 107,704 | 18,656 |
Shares redeemed | (495,555) | (495,702) | (15,865,000) | (16,527,555) |
Net increase (decrease) | (414,731) | (376,874) | $ (13,248,429) | $ (12,424,282) |
Class C | | | | |
Shares sold | 443,617 | 964,253 | $ 14,508,195 | $ 34,720,800 |
Reinvestment of distributions | 9,390 | 1,513 | 305,281 | 50,476 |
Shares redeemed | (1,020,680) | (893,659) | (32,456,638) | (30,160,985) |
Net increase (decrease) | (567,673) | 72,107 | $ (17,643,162) | $ 4,610,291 |
Institutional Class | | | | |
Shares sold | 947,827 | 771,369 | $ 33,843,047 | $ 30,606,839 |
Reinvestment of distributions | 7,770 | 3,300 | 279,800 | 119,042 |
Shares redeemed | (636,276) | (433,932) | (22,583,838) | (16,770,999) |
Net increase (decrease) | 319,321 | 340,737 | $ 11,539,009 | $ 13,954,882 |
12. Other.
The Fund's organizational documents provide former and current trustees and officers with a limited indemnification against liabilities arising in connection with the performance of their duties to the Fund. In the normal course of business, the Fund may also enter into contracts that provide general indemnifications. The Fund's maximum exposure under these arrangements is unknown as this would be dependent on future claims that may be made against the Fund. The risk of material loss from such claims is considered remote.
Annual Report
Fidelity Advisor Financial Services Fund - Institutional Class
Performance: The Bottom Line
Average annual total return reflects the change in the value of an investment, assuming reinvestment of the class' distributions from dividend income and capital gains (the profits earned upon the sale of securities that have grown in value, if any) and assuming a constant rate of performance each year. The $10,000 table and the fund's returns do not reflect the deduction of taxes that a shareholder would pay on fund distributions or the redemption of fund shares. During periods of reimbursement by Fidelity, a fund's total return will be greater than it would be had the reimbursement not occurred. How a fund did yesterday is no guarantee of how it will do tomorrow.
Average Annual Total Returns
Periods ended July 31, 2012 | Past 1
year | Past 5
years | Past 10
years |
Institutional Class | 1.61% | -11.12% | -0.79% |
$10,000 Over 10 Years
Let's say hypothetically that $10,000 was invested in Fidelity Advisor Financial Services Fund - Institutional Class on July 31, 2002. The chart shows how the value of your investment would have changed, and also shows how the S&P 500 Index performed over the same period.
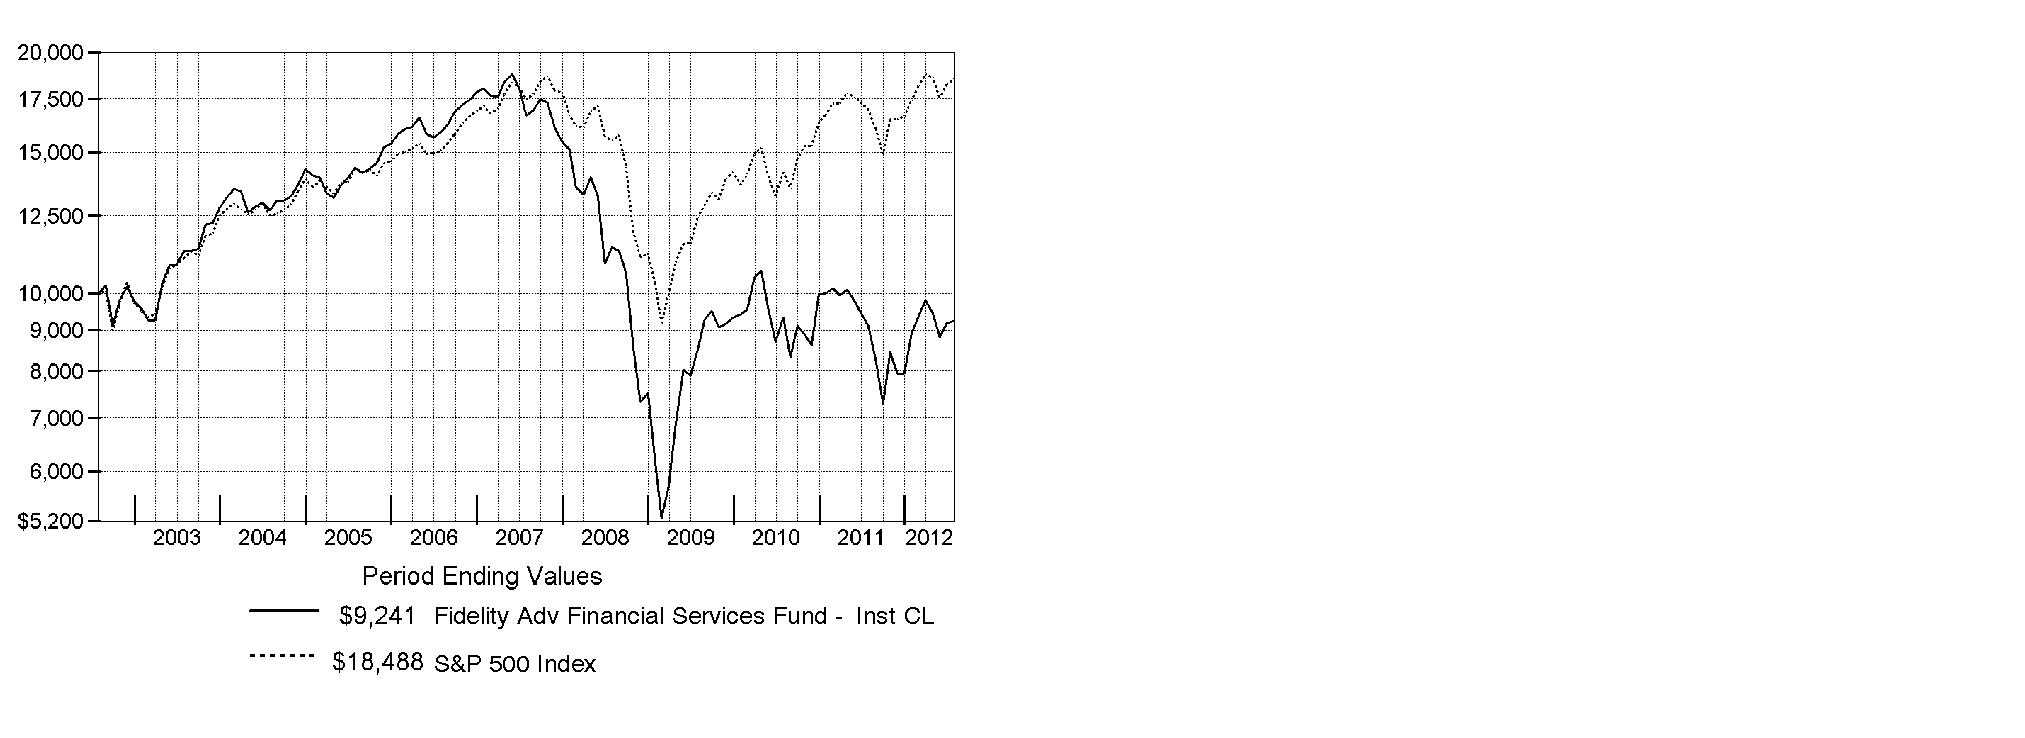
Annual Report
Fidelity Advisor Financial Services Fund
Market Recap: Major U.S. equity benchmarks posted solid gains for the year ending July 31, 2012, amid an uncertain investment environment. The broad-based S&P 500® Index returned 9.13%, while the blue-chip-laden Dow Jones Industrial AverageSM and technology-heavy Nasdaq Composite® Index gained 10.12% and 7.83%, respectively. Volatility spiked during the period's first half, as equities plummeted late last summer on Europe's debt woes, political wrangling over the U.S. debt ceiling and the sovereign credit-rating downgrade that followed. By October, a seemingly improved U.S. economy rejuvenated stocks, paving the way for major equity benchmarks to post their best first-quarter performance since 1998. However, more eurozone trouble, signs that the U.S. economy had turned sluggish and a slowdown in China caused stocks to slip in May, before a new wave of optimism took hold in June and July. Within the S&P 500®, more-defensive sectors such as telecommunication services (+30%) and consumer staples (+20%) fared best, while materials and energy significantly underperformed, returning -5%. Small- and mid-cap stocks trailed their less-volatile large-cap counterparts, with the Russell 2000® Index adding 0.19% and the Russell Midcap® Index rising 2.28%. Given turmoil and local currency weakness in Europe, foreign developed-markets stocks lost ground, with the MSCI® EAFE® Index returning -11.32%.
Comments from Benjamin Hesse, Portfolio Manager of Fidelity Advisor® Financial Services Fund: For the year, the fund's Institutional Class shares returned 1.61%, lagging the 2.44% advance of the MSCI® U.S. IM Financials 25/50 Index and the broadly based S&P 500®. Investment banking/brokerage, diversified banks and property/casualty insurance detracted versus the MSCI index. An average overweighting in investment banking/brokerage hurt, as did specific stocks, including online broker E*TRADE Financial, whose shares declined amid news the company was not for sale, and commodities/derivatives broker MF Global Holdings, whose stock plunged after a sizable investment in European government debt went south. By contrast, positioning in other diversified financial services, specialized real estate investment trusts (REITs) and out-of-index data processing/outsourced services aided performance. In terms of individual contributors, the fund benefited from an average underweighting in diversified financial Bank of America, as low interest rates and sluggish loan growth pressured its returns. Shares of card processor MasterCard rallied sharply, as more people worldwide paid with plastic. MasterCard was not in the MSCI index, and MasterCard and MF Global were sold before period end.
The views expressed above reflect those of the portfolio manager(s) only through the end of the period as stated on the cover of this report and do not necessarily represent the views of Fidelity or any other person in the Fidelity organization. Any such views are subject to change at any time based upon market or other conditions and Fidelity disclaims any responsibility to update such views. These views may not be relied on as investment advice and, because investment decisions for a Fidelity fund are based on numerous factors, may not be relied on as an indication of trading intent on behalf of any Fidelity fund.
Annual Report
Fidelity Advisor Financial Services Fund
As a shareholder of the Fund, you incur two types of costs: (1) transaction costs, including sales charges (loads) on purchase payments or redemption proceeds, redemption fees and (2) ongoing costs, including management fees, distribution and/or service (12b-1) fees and other Fund expenses. This Example is intended to help you understand your ongoing costs (in dollars) of investing in the Fund and to compare these costs with the ongoing costs of investing in other mutual funds.
The Example is based on an investment of $1,000 invested at the beginning of the period and held for the entire period (February 1, 2012 to July 31, 2012).
Actual Expenses
The first line of the accompanying table for each class of the Fund provides information about actual account values and actual expenses. You may use the information in this line, together with the amount you invested, to estimate the expenses that you paid over the period. Simply divide your account value by $1,000.00 (for example, an $8,600 account value divided by $1,000.00 = 8.6), then multiply the result by the number in the first line for a class of the Fund under the heading entitled "Expenses Paid During Period" to estimate the expenses you paid on your account during this period. In addition, the Fund, as a shareholder in the underlying Fidelity Central Funds, will indirectly bear its pro-rata share of the fees and expenses incurred by the underlying Fidelity Central Funds. These fees and expenses are not included in the Fund's annualized expense ratio used to calculate the expense estimate in the table below.
Hypothetical Example for Comparison Purposes
The second line of the accompanying table for each class of the Fund provides information about hypothetical account values and hypothetical expenses based on a Class' actual expense ratio and an assumed rate of return of 5% per year before expenses, which is not the Class' actual return. The hypothetical account values and expenses may not be used to estimate the actual ending account balance or expenses you paid for the period. You may use this information to compare the ongoing costs of investing in the Fund and other funds. To do so, compare this 5% hypothetical example with the 5% hypothetical examples that appear in the shareholder reports of the other funds. In addition, the Fund, as a shareholder in the underlying Fidelity Central Funds, will indirectly bear its pro-rata share of the fees and expenses incurred by the underlying Fidelity Central Funds. These fees and expenses are not included in the Fund's annualized expense ratio used to calculate the expense estimate in the table below.
Please note that the expenses shown in the table are meant to highlight your ongoing costs only and do not reflect any transaction costs. Therefore, the second line of the table is useful in comparing ongoing costs only, and will not help you determine the relative total costs of owning different funds. In addition, if these transactional costs were included, your costs would have been higher.
| Annualized Expense Ratio | Beginning
Account Value
February 1, 2012 | Ending
Account Value
July 31, 2012 | Expenses Paid
During Period*
February 1, 2012
to July 31, 2012 |
Class A | 1.27% | | | |
Actual | | $ 1,000.00 | $ 1,036.70 | $ 6.43 |
HypotheticalA | | $ 1,000.00 | $ 1,018.55 | $ 6.37 |
Class T | 1.53% | | | |
Actual | | $ 1,000.00 | $ 1,034.80 | $ 7.74 |
HypotheticalA | | $ 1,000.00 | $ 1,017.26 | $ 7.67 |
Class B | 2.02% | | | |
Actual | | $ 1,000.00 | $ 1,032.70 | $ 10.21 |
HypotheticalA | | $ 1,000.00 | $ 1,014.82 | $ 10.12 |
Class C | 2.02% | | | |
Actual | | $ 1,000.00 | $ 1,031.90 | $ 10.21 |
HypotheticalA | | $ 1,000.00 | $ 1,014.82 | $ 10.12 |
Institutional Class | .94% | | | |
Actual | | $ 1,000.00 | $ 1,037.80 | $ 4.76 |
HypotheticalA | | $ 1,000.00 | $ 1,020.19 | $ 4.72 |
A 5% return per year before expenses
* Expenses are equal to each Class' annualized expense ratio, multiplied by the average account value over the period, multiplied by 182/366 (to reflect the one-half year period).
Annual Report
Fidelity Advisor Financial Services Fund
Investment Changes (Unaudited)
Top Ten Stocks as of July 31, 2012 |
| % of fund's
net assets | % of fund's net assets
6 months ago |
Citigroup, Inc. | 4.0 | 5.2 |
Big Yellow Group PLC | 3.6 | 1.2 |
PNC Financial Services Group, Inc. | 3.5 | 0.0 |
HCP, Inc. | 3.4 | 0.8 |
Health Care REIT, Inc. | 3.1 | 0.2 |
CME Group, Inc. | 3.0 | 0.0 |
ACE Ltd. | 2.5 | 2.2 |
BanColombia SA sponsored ADR | 2.3 | 0.6 |
The NASDAQ Stock Market, Inc. | 2.2 | 0.0 |
Prudential Financial, Inc. | 2.1 | 0.2 |
| 29.7 | |
Top Industries (% of fund's net assets) |
As of July 31, 2012 |
| Real Estate Investment Trusts | 28.1% | |
| Commercial Banks | 17.7% | |
| Diversified Financial Services | 13.0% | |
| Insurance | 12.8% | |
| Capital Markets | 10.9% | |
| All Others* | 17.5% | |

As of January 31, 2012 |
| Capital Markets | 17.0% | |
| Commercial Banks | 16.7% | |
| Diversified Financial Services | 16.6% | |
| Real Estate Investment Trusts | 16.0% | |
| Insurance | 14.6% | |
| All Others* | 19.1% | |

* Includes short-term investments and net other assets. |
Annual Report
Fidelity Advisor Financial Services Fund
Investments July 31, 2012
Showing Percentage of Net Assets
Common Stocks - 93.4% |
| Shares | | Value |
CAPITAL MARKETS - 10.9% |
Asset Management & Custody Banks - 8.1% |
A.F.P. Provida SA sponsored ADR | 5,200 | | $ 454,116 |
Affiliated Managers Group, Inc. (a) | 2,314 | | 258,219 |
Ameriprise Financial, Inc. | 200 | | 10,344 |
Apollo Global Management LLC Class A | 109,139 | | 1,481,016 |
Ares Capital Corp. | 42,600 | | 708,438 |
Bank of New York Mellon Corp. | 78,456 | | 1,669,544 |
BlackRock, Inc. Class A | 56 | | 9,535 |
Cetip SA | 46,600 | | 590,573 |
Fortress Investment Group LLC | 51,700 | | 195,426 |
Franklin Resources, Inc. | 4,623 | | 531,414 |
Invesco Ltd. | 538 | | 11,906 |
Julius Baer Group Ltd. | 300 | | 10,755 |
Legg Mason, Inc. | 853 | | 20,916 |
Northern Trust Corp. | 7,007 | | 318,118 |
State Street Corp. | 10,253 | | 414,016 |
The Blackstone Group LP | 119,759 | | 1,658,662 |
| | 8,342,998 |
Diversified Capital Markets - 0.2% |
Credit Suisse Group sponsored ADR | 472 | | 8,052 |
HFF, Inc. (a) | 10,500 | | 137,130 |
UBS AG (NY Shares) | 9,733 | | 103,170 |
| | 248,352 |
Investment Banking & Brokerage - 2.6% |
Charles Schwab Corp. | 900 | | 11,367 |
E*TRADE Financial Corp. (a) | 1,059 | | 8,080 |
Evercore Partners, Inc. Class A | 57,400 | | 1,329,958 |
GFI Group, Inc. | 320,278 | | 1,018,484 |
Goldman Sachs Group, Inc. | 2,588 | | 261,129 |
Greenhill & Co., Inc. | 600 | | 23,832 |
Investment Technology Group, Inc. (a) | 1,125 | | 9,315 |
Lazard Ltd. Class A | 443 | | 11,895 |
Macquarie Group Ltd. | 393 | | 10,317 |
Monex Group, Inc. | 32 | | 5,193 |
Morgan Stanley | 253 | | 3,456 |
Nomura Holdings, Inc. sponsored ADR (d) | 2,800 | | 9,744 |
| | 2,702,770 |
TOTAL CAPITAL MARKETS | | 11,294,120 |
COMMERCIAL BANKS - 17.7% |
Diversified Banks - 6.5% |
Banco ABC Brasil SA | 9,500 | | 49,651 |
Banco Bradesco SA (PN) sponsored ADR | 700 | | 10,738 |
Banco de Chile sponsored ADR | 101 | | 8,629 |
Banco Macro SA sponsored ADR (a) | 600 | | 7,362 |
Banco Pine SA | 228 | | 1,494 |
Banco Santander Chile sponsored ADR | 100 | | 7,516 |
Banco Santander SA (Spain) sponsored ADR (d) | 1,700 | | 10,132 |
Banco Santander SA (Brasil) ADR | 56,610 | | 431,934 |
|
| Shares | | Value |
BanColombia SA sponsored ADR (d) | 37,995 | | $ 2,349,611 |
Bangkok Bank Public Co. Ltd. (For. Reg.) | 15,900 | | 105,091 |
Bank of Baroda | 5,117 | | 60,426 |
Bank of the Philippine Islands (BPI) | 15,110 | | 26,278 |
Barclays PLC sponsored ADR | 181,186 | | 1,895,206 |
BBVA Banco Frances SA sponsored ADR (a) | 2,300 | | 7,843 |
BNP Paribas SA | 202 | | 7,498 |
China CITIC Bank Corp. Ltd. (H Shares) | 25,000 | | 12,638 |
Comerica, Inc. | 9,200 | | 277,932 |
CorpBanca SA sponsored ADR | 550 | | 10,219 |
Credicorp Ltd. (NY Shares) | 1,828 | | 211,938 |
Credit Agricole SA (a) | 200 | | 859 |
Development Credit Bank Ltd. (a) | 27,538 | | 19,925 |
Grupo Financiero Galicia SA sponsored ADR (a)(d) | 1,800 | | 8,352 |
Guaranty Trust Bank PLC GDR (Reg. S) | 5,300 | | 30,740 |
Hana Financial Group, Inc. | 2,410 | | 77,053 |
Hong Leong Bank Bhd | 3,400 | | 14,864 |
HSBC Holdings PLC sponsored ADR | 300 | | 12,540 |
ICICI Bank Ltd. sponsored ADR | 333 | | 11,528 |
Industrial & Commercial Bank of China Ltd. (H Shares) | 6,000 | | 3,443 |
Intesa Sanpaolo SpA | 8,105 | | 10,301 |
Itau Unibanco Banco Multiplo SA sponsored ADR | 619 | | 9,786 |
KB Financial Group, Inc. | 2,210 | | 69,595 |
Malayan Banking Bhd | 30,757 | | 86,232 |
National Australia Bank Ltd. | 254 | | 6,668 |
Nordea Bank AB | 1,200 | | 11,222 |
PT Bank Bukopin Tbk | 3,926,500 | | 261,905 |
PT Bank Central Asia Tbk | 13,500 | | 11,435 |
Raiffeisen International Bank-Holding AG (d) | 1,300 | | 42,955 |
Sberbank (Savings Bank of the Russian Federation) sponsored ADR | 1,100 | | 12,259 |
Standard Chartered PLC (United Kingdom) | 1,488 | | 34,166 |
Sumitomo Mitsui Financial Group, Inc. | 1,300 | | 40,939 |
Swedbank AB (A Shares) | 900 | | 15,696 |
The Jammu & Kashmir Bank Ltd. | 7,298 | | 120,169 |
The Toronto-Dominion Bank | 100 | | 7,870 |
U.S. Bancorp | 301 | | 10,084 |
UniCredit SpA (a) | 630 | | 2,146 |
United Overseas Bank Ltd. | 1,000 | | 16,072 |
Wells Fargo & Co. | 8,150 | | 275,552 |
Yes Bank Ltd. | 1,839 | | 12,088 |
| | 6,728,580 |
Regional Banks - 11.2% |
Alerus Financial Corp. | 435 | | 12,402 |
Banco Daycoval SA (PN) | 16,000 | | 74,566 |
Bancorp New Jersey, Inc. | 100 | | 1,030 |
BancTrust Financial Group, Inc. (a) | 28,700 | | 84,952 |
Bank of Hawaii Corp. | 300 | | 14,013 |
Common Stocks - continued |
| Shares | | Value |
COMMERCIAL BANKS - CONTINUED |
Regional Banks - continued |
Bank of the Ozarks, Inc. | 7,716 | | $ 248,378 |
BB&T Corp. | 870 | | 27,292 |
Boston Private Financial Holdings, Inc. | 2,200 | | 20,702 |
Bridge Capital Holdings (a) | 48,490 | | 753,050 |
BS Financial Group, Inc. | 52,600 | | 555,927 |
Canadian Western Bank, Edmonton (d) | 6,000 | | 157,172 |
Cascade Bancorp (a) | 900 | | 4,662 |
CIT Group, Inc. (a) | 7,654 | | 279,524 |
Citizens & Northern Corp. | 520 | | 9,615 |
City Holding Co. | 500 | | 16,525 |
City National Corp. | 300 | | 14,784 |
CNB Financial Corp., Pennsylvania | 803 | | 13,225 |
CoBiz, Inc. | 127,900 | | 856,930 |
Cullen/Frost Bankers, Inc. | 100 | | 5,531 |
Fifth Third Bancorp | 89,100 | | 1,231,362 |
First Business Finance Services, Inc. | 500 | | 10,905 |
First Commonwealth Financial Corp. | 15,322 | | 107,407 |
First Interstate Bancsystem, Inc. | 68,712 | | 990,140 |
First Midwest Bancorp, Inc., Delaware | 1,200 | | 13,560 |
First Republic Bank | 3,081 | | 100,225 |
FirstMerit Corp. | 800 | | 12,960 |
FNB Corp., Pennsylvania | 1,100 | | 11,968 |
Glacier Bancorp, Inc. | 924 | | 14,017 |
Huntington Bancshares, Inc. | 77,012 | | 478,630 |
KeyCorp | 1,500 | | 11,970 |
NBT Bancorp, Inc. | 200 | | 4,202 |
Northrim Bancorp, Inc. | 2,269 | | 45,743 |
Pacific Continental Corp. | 19,828 | | 183,012 |
PNC Financial Services Group, Inc. | 60,928 | | 3,600,845 |
PrivateBancorp, Inc. | 900 | | 13,788 |
PT Bank Tabungan Negara Tbk | 1,250,000 | | 181,313 |
Regions Financial Corp. | 1,757 | | 12,229 |
Sandy Spring Bancorp, Inc. | 200 | | 3,562 |
Savannah Bancorp, Inc. (a) | 8,798 | | 50,589 |
SCBT Financial Corp. | 800 | | 29,632 |
SunTrust Banks, Inc. | 392 | | 9,271 |
Susquehanna Bancshares, Inc. | 37,614 | | 400,965 |
SVB Financial Group (a) | 312 | | 18,037 |
Synovus Financial Corp. | 23,182 | | 44,046 |
TCF Financial Corp. | 1,137 | | 11,745 |
Texas Capital Bancshares, Inc. (a) | 2,300 | | 99,107 |
UMB Financial Corp. | 2,300 | | 110,538 |
Umpqua Holdings Corp. | 100 | | 1,248 |
Valley National Bancorp | 3,053 | | 28,393 |
Virginia Commerce Bancorp, Inc. (a) | 3,000 | | 24,210 |
Washington Trust Bancorp, Inc. | 6,544 | | 162,422 |
Webster Financial Corp. | 5,300 | | 108,756 |
Westamerica Bancorp. | 100 | | 4,600 |
|
| Shares | | Value |
Western Alliance Bancorp. (a) | 39,600 | | $ 365,112 |
Zions Bancorporation | 84 | | 1,529 |
| | 11,648,318 |
TOTAL COMMERCIAL BANKS | | 18,376,898 |
COMMERCIAL SERVICES & SUPPLIES - 0.0% |
Diversified Support Services - 0.0% |
Intrum Justitia AB | 1,000 | | 13,932 |
CONSUMER FINANCE - 1.3% |
Consumer Finance - 1.3% |
American Express Co. | 123 | | 7,098 |
Capital One Financial Corp. | 144 | | 8,135 |
DFC Global Corp. (a) | 2,000 | | 38,340 |
Discover Financial Services | 1,495 | | 53,760 |
EZCORP, Inc. (non-vtg.) Class A (a) | 16,066 | | 361,485 |
First Cash Financial Services, Inc. (a) | 3,390 | | 135,939 |
Green Dot Corp. Class A (a)(d) | 422 | | 4,406 |
International Personal Finance PLC | 176 | | 773 |
Nelnet, Inc. Class A | 700 | | 16,457 |
Netspend Holdings, Inc. (a) | 1,331 | | 11,713 |
PT Clipan Finance Indonesia Tbk | 338,000 | | 15,209 |
Regional Management Corp. | 11,300 | | 170,517 |
SLM Corp. | 31,765 | | 507,922 |
| | 1,331,754 |
DIVERSIFIED CONSUMER SERVICES - 0.0% |
Specialized Consumer Services - 0.0% |
Sotheby's Class A (Ltd. vtg.) | 350 | | 10,273 |
DIVERSIFIED FINANCIAL SERVICES - 13.0% |
Other Diversified Financial Services - 4.2% |
Bank of America Corp. | 35,743 | | 262,354 |
Citigroup, Inc. | 151,547 | | 4,111,467 |
JPMorgan Chase & Co. | 50 | | 1,800 |
| | 4,375,621 |
Specialized Finance - 8.8% |
BM&F Bovespa SA | 1,900 | | 10,663 |
CBOE Holdings, Inc. | 60,875 | | 1,734,938 |
CME Group, Inc. | 59,705 | | 3,111,228 |
IntercontinentalExchange, Inc. (a) | 3,284 | | 430,926 |
MarketAxess Holdings, Inc. | 900 | | 27,198 |
Moody's Corp. | 4,831 | | 195,800 |
NYSE Euronext | 400 | | 10,192 |
PHH Corp. (a)(d) | 79,316 | | 1,285,712 |
The NASDAQ Stock Market, Inc. | 100,649 | | 2,284,732 |
| | 9,091,389 |
TOTAL DIVERSIFIED FINANCIAL SERVICES | | 13,467,010 |
ENERGY EQUIPMENT & SERVICES - 0.0% |
Oil & Gas Equipment & Services - 0.0% |
SBM Offshore NV (a) | 1,200 | | 14,653 |
Common Stocks - continued |
| Shares | | Value |
HOTELS, RESTAURANTS & LEISURE - 0.6% |
Casinos & Gaming - 0.6% |
Boyd Gaming Corp. (a)(d) | 94,400 | | $ 538,080 |
Las Vegas Sands Corp. | 2,627 | | 95,675 |
MGM Mirage, Inc. (a) | 915 | | 8,711 |
Wynn Resorts Ltd. | 71 | | 6,656 |
| | 649,122 |
Hotels, Resorts & Cruise Lines - 0.0% |
Starwood Hotels & Resorts Worldwide, Inc. | 200 | | 10,830 |
TOTAL HOTELS, RESTAURANTS & LEISURE | | 659,952 |
HOUSEHOLD DURABLES - 0.0% |
Homebuilding - 0.0% |
M.D.C. Holdings, Inc. | 400 | | 12,744 |
PulteGroup, Inc. (a) | 1,400 | | 15,820 |
| | 28,564 |
INDUSTRIAL CONGLOMERATES - 0.0% |
Industrial Conglomerates - 0.0% |
Keppel Corp. Ltd. | 1,000 | | 8,984 |
INSURANCE - 12.8% |
Insurance Brokers - 0.4% |
Aon PLC | 300 | | 14,760 |
Brasil Insurance Participacoes e Administracao SA | 16,500 | | 146,142 |
Marsh & McLennan Companies, Inc. | 6,800 | | 225,828 |
National Financial Partners Corp. (a) | 800 | | 11,880 |
| | 398,610 |
Life & Health Insurance - 3.0% |
AFLAC, Inc. | 204 | | 8,931 |
Citizens, Inc. Class A (a) | 2,100 | | 21,714 |
CNO Financial Group, Inc. | 1,900 | | 15,751 |
Delta Lloyd NV | 800 | | 10,449 |
FBL Financial Group, Inc. Class A | 400 | | 12,380 |
Lincoln National Corp. | 14,800 | | 296,740 |
MetLife, Inc. | 17,035 | | 524,167 |
Phoenix Companies, Inc. (a) | 5,700 | | 9,291 |
Ping An Insurance Group Co. China Ltd. (H Shares) | 3,000 | | 23,541 |
Prudential Financial, Inc. | 43,854 | | 2,117,271 |
Resolution Ltd. | 2,800 | | 9,043 |
StanCorp Financial Group, Inc. | 300 | | 8,928 |
Symetra Financial Corp. | 1,100 | | 12,793 |
Torchmark Corp. | 300 | | 14,925 |
Unum Group | 600 | | 11,334 |
| | 3,097,258 |
Multi-Line Insurance - 1.2% |
American International Group, Inc. (a) | 14,811 | | 463,140 |
Assurant, Inc. | 8,829 | | 319,698 |
|
| Shares | | Value |
Fairfax Financial Holdings Ltd. (sub. vtg.) | 200 | | $ 75,285 |
Genworth Financial, Inc. Class A (a) | 45,050 | | 227,052 |
Hartford Financial Services Group, Inc. | 3,600 | | 59,220 |
Loews Corp. | 1,900 | | 75,221 |
Porto Seguro SA | 2,200 | | 19,217 |
| | 1,238,833 |
Property & Casualty Insurance - 5.9% |
ACE Ltd. | 35,540 | | 2,612,190 |
Allied World Assurance Co. Holdings Ltd. | 1,300 | | 98,059 |
Allstate Corp. | 7,400 | | 253,820 |
Assured Guaranty Ltd. | 700 | | 8,386 |
Axis Capital Holdings Ltd. | 9,000 | | 295,740 |
Berkshire Hathaway, Inc. Class B (a) | 149 | | 12,641 |
Erie Indemnity Co. Class A | 163 | | 11,620 |
Fidelity National Financial, Inc. Class A | 715 | | 13,313 |
First American Financial Corp. | 9,900 | | 181,368 |
The Travelers Companies, Inc. | 33,700 | | 2,111,305 |
W.R. Berkley Corp. | 2,500 | | 91,575 |
XL Group PLC Class A | 22,744 | | 469,664 |
| | 6,159,681 |
Reinsurance - 2.3% |
Arch Capital Group Ltd. (a) | 9,400 | | 364,720 |
Everest Re Group Ltd. | 5,000 | | 508,500 |
Montpelier Re Holdings Ltd. | 700 | | 14,182 |
Platinum Underwriters Holdings Ltd. | 9,300 | | 353,586 |
RenaissanceRe Holdings Ltd. | 7,750 | | 573,423 |
Swiss Re Ltd. | 162 | | 10,180 |
Validus Holdings Ltd. | 16,800 | | 546,504 |
| | 2,371,095 |
TOTAL INSURANCE | | 13,265,477 |
INTERNET SOFTWARE & SERVICES - 0.0% |
Internet Software & Services - 0.0% |
eBay, Inc. (a) | 309 | | 13,689 |
IT SERVICES - 6.7% |
Data Processing & Outsourced Services - 6.7% |
Alliance Data Systems Corp. (a) | 43 | | 5,590 |
Cielo SA | 480 | | 13,993 |
Fidelity National Information Services, Inc. | 600 | | 18,864 |
Fiserv, Inc. (a) | 233 | | 16,340 |
Global Cash Access Holdings, Inc. (a) | 11,600 | | 74,936 |
Jack Henry & Associates, Inc. | 30,400 | | 1,055,792 |
Lender Processing Services, Inc. | 100 | | 2,467 |
MoneyGram International, Inc. (a) | 700 | | 10,892 |
Redecard SA | 125,710 | | 2,027,482 |
The Western Union Co. | 106,091 | | 1,849,166 |
Total System Services, Inc. | 66,893 | | 1,582,019 |
Common Stocks - continued |
| Shares | | Value |
IT SERVICES - CONTINUED |
Data Processing & Outsourced Services - continued |
VeriFone Systems, Inc. (a) | 5,705 | | $ 207,034 |
Visa, Inc. Class A | 100 | | 12,907 |
| | 6,877,482 |
IT Consulting & Other Services - 0.0% |
Accenture PLC Class A | 200 | | 12,060 |
Cognizant Technology Solutions Corp. Class A (a) | 149 | | 8,459 |
| | 20,519 |
TOTAL IT SERVICES | | 6,898,001 |
MACHINERY - 0.1% |
Industrial Machinery - 0.1% |
Middleby Corp. (a) | 500 | | 48,960 |
MEDIA - 0.0% |
Publishing - 0.0% |
McGraw-Hill Companies, Inc. | 200 | | 9,392 |
PROFESSIONAL SERVICES - 0.0% |
Research & Consulting Services - 0.0% |
Equifax, Inc. | 370 | | 17,331 |
IHS, Inc. Class A (a) | 75 | | 8,270 |
| | 25,601 |
REAL ESTATE INVESTMENT TRUSTS - 28.1% |
Diversified REITs - 0.1% |
American Assets Trust, Inc. | 4,600 | | 119,600 |
Vornado Realty Trust | 200 | | 16,700 |
| | 136,300 |
Industrial REITs - 0.9% |
DCT Industrial Trust, Inc. | 33,800 | | 211,588 |
First Potomac Realty Trust | 700 | | 8,113 |
Prologis, Inc. | 20,494 | | 662,571 |
Stag Industrial, Inc. | 1,100 | | 15,906 |
| | 898,178 |
Mortgage REITs - 1.8% |
American Capital Agency Corp. (d) | 22,375 | | 786,258 |
American Capital Mortgage Investment Corp. | 1,700 | | 41,735 |
Invesco Mortgage Capital, Inc. | 36,200 | | 716,398 |
Pennymac Mortgage Investment Trust | 700 | | 14,749 |
Two Harbors Investment Corp. | 26,400 | | 302,808 |
| | 1,861,948 |
Office REITs - 4.9% |
Boston Properties, Inc. | 15,900 | | 1,763,310 |
Corporate Office Properties Trust (SBI) | 400 | | 8,904 |
Douglas Emmett, Inc. | 51,312 | | 1,206,345 |
Highwoods Properties, Inc. (SBI) | 13,080 | | 443,020 |
Kilroy Realty Corp. | 3,100 | | 146,754 |
Lexington Corporate Properties Trust (d) | 149,800 | | 1,339,212 |
|
| Shares | | Value |
MPG Office Trust, Inc. (a)(d) | 5,300 | | $ 15,688 |
SL Green Realty Corp. | 1,800 | | 141,750 |
| | 5,064,983 |
Residential REITs - 4.7% |
American Campus Communities, Inc. | 6,749 | | 321,657 |
Apartment Investment & Management Co. Class A | 10,541 | | 289,140 |
AvalonBay Communities, Inc. | 79 | | 11,620 |
BRE Properties, Inc. | 500 | | 26,340 |
Camden Property Trust (SBI) | 12,850 | | 916,334 |
Campus Crest Communities, Inc. | 1,100 | | 12,056 |
Colonial Properties Trust (SBI) | 33,600 | | 761,040 |
Equity Lifestyle Properties, Inc. | 6,700 | | 481,864 |
Equity Residential (SBI) | 12,400 | | 785,044 |
Essex Property Trust, Inc. | 200 | | 31,472 |
Home Properties, Inc. | 3,000 | | 196,830 |
Post Properties, Inc. | 13,085 | | 675,840 |
UDR, Inc. | 11,348 | | 301,970 |
| | 4,811,207 |
Retail REITs - 1.4% |
Federal Realty Investment Trust (SBI) | 1,903 | | 206,780 |
Glimcher Realty Trust | 400 | | 4,008 |
Kimco Realty Corp. | 700 | | 13,643 |
Realty Income Corp. | 9,050 | | 372,860 |
Simon Property Group, Inc. | 5,038 | | 808,549 |
Urstadt Biddle Properties, Inc. Class A | 1,300 | | 24,687 |
| | 1,430,527 |
Specialized REITs - 14.3% |
American Tower Corp. | 300 | | 21,693 |
Big Yellow Group PLC | 764,019 | | 3,737,346 |
CubeSmart | 1,000 | | 11,990 |
DiamondRock Hospitality Co. | 27,200 | | 257,312 |
HCP, Inc. | 74,394 | | 3,512,141 |
Health Care REIT, Inc. | 51,099 | | 3,179,891 |
Host Hotels & Resorts, Inc. | 15,700 | | 230,476 |
National Health Investors, Inc. | 5,400 | | 289,926 |
Plum Creek Timber Co., Inc. | 600 | | 24,354 |
Potlatch Corp. | 1,300 | | 44,993 |
Public Storage | 2,034 | | 302,964 |
Rayonier, Inc. | 13,600 | | 648,584 |
Sovran Self Storage, Inc. | 400 | | 22,840 |
Strategic Hotel & Resorts, Inc. (a) | 147,284 | | 892,541 |
Sunstone Hotel Investors, Inc. (a) | 16,200 | | 162,162 |
Ventas, Inc. | 22,436 | | 1,508,821 |
Weyerhaeuser Co. | 500 | | 11,675 |
| | 14,859,709 |
TOTAL REAL ESTATE INVESTMENT TRUSTS | | 29,062,852 |
Common Stocks - continued |
| Shares | | Value |
REAL ESTATE MANAGEMENT & DEVELOPMENT - 1.0% |
Diversified Real Estate Activities - 0.8% |
Tejon Ranch Co. (a) | 5,964 | | $ 155,004 |
The St. Joe Co. (a)(d) | 35,468 | | 600,473 |
| | 755,477 |
Real Estate Development - 0.0% |
Bukit Sembawang Estates Ltd. | 7,000 | | 26,438 |
Real Estate Operating Companies - 0.1% |
BR Malls Participacoes SA | 700 | | 8,171 |
Castellum AB | 927 | | 12,452 |
Forest City Enterprises, Inc. Class A (a) | 6,300 | | 88,893 |
Thomas Properties Group, Inc. | 2,262 | | 11,400 |
| | 120,916 |
Real Estate Services - 0.1% |
CBRE Group, Inc. (a) | 5,987 | | 93,277 |
Jones Lang LaSalle, Inc. | 116 | | 7,736 |
Kennedy-Wilson Holdings, Inc. | 2,000 | | 27,360 |
| | 128,373 |
TOTAL REAL ESTATE MANAGEMENT & DEVELOPMENT | | 1,031,204 |
SOFTWARE - 0.0% |
Application Software - 0.0% |
EPIQ Systems, Inc. | 500 | | 5,645 |
Fair Isaac Corp. | 100 | | 4,329 |
| | 9,974 |
SPECIALTY RETAIL - 1.1% |
Computer & Electronics Retail - 1.1% |
Rent-A-Center, Inc. | 32,473 | | 1,154,740 |
Home Improvement Retail - 0.0% |
Home Depot, Inc. | 300 | | 15,654 |
TOTAL SPECIALTY RETAIL | | 1,170,394 |
THRIFTS & MORTGAGE FINANCE - 0.1% |
Thrifts & Mortgage Finance - 0.1% |
BankUnited, Inc. | 500 | | 12,180 |
|
| Shares | | Value |
Brookline Bancorp, Inc., Delaware | 800 | | $ 6,728 |
Cape Bancorp, Inc. (a) | 1,400 | | 12,992 |
Cheviot Financial Corp. | 4,910 | | 42,963 |
Eagle Bancorp Montana, Inc. | 300 | | 3,051 |
Hudson City Bancorp, Inc. | 800 | | 5,080 |
People's United Financial, Inc. | 1,100 | | 12,606 |
| | 95,600 |
TOTAL COMMON STOCKS (Cost $97,877,904) |
96,837,284
|
Money Market Funds - 10.5% |
| | | |
Fidelity Cash Central Fund, 0.17% (b) | 5,957,990 | | 5,957,990 |
Fidelity Securities Lending Cash Central Fund, 0.18% (b)(c) | 4,910,355 | | 4,910,355 |
TOTAL MONEY MARKET FUNDS (Cost $10,868,345) |
10,868,345
|
TOTAL INVESTMENT PORTFOLIO - 103.9% (Cost $108,746,249) | | 107,705,629 |
NET OTHER ASSETS (LIABILITIES) - (3.9)% | | (4,067,840) |
NET ASSETS - 100% | $ 103,637,789 |
Legend |
(a) Non-income producing |
(b) Affiliated fund that is available only to investment companies and other accounts managed by Fidelity Investments. The rate quoted is the annualized seven-day yield of the fund at period end. A complete unaudited listing of the fund's holdings as of its most recent quarter end is available upon request. In addition, each Fidelity Central Fund's financial statements, which are not covered by the Fund's Report of Independent Registered Public Accounting Firm, are available on the SEC's website or upon request. |
(c) Investment made with cash collateral received from securities on loan. |
(d) Security or a portion of the security is on loan at period end. |
Affiliated Central Funds |
Information regarding fiscal year to date income earned by the Fund from investments in Fidelity Central Funds is as follows: |
Fund | Income earned |
Fidelity Cash Central Fund | $ 6,802 |
Fidelity Securities Lending Cash Central Fund | 23,394 |
Total | $ 30,196 |
Other Information |
The following is a summary of the inputs used, as of July 31, 2012, involving the Fund's assets and liabilities carried at fair value. The inputs or methodology used for valuing securities may not be an indication of the risk associated with investing in those securities. For more information on valuation inputs, and their aggregation into the levels used in the table below, please refer to the Security Valuation section in the accompanying Notes to Financial Statements. |
Valuation Inputs at Reporting Date: |
Description | Total | Level 1 | Level 2 | Level 3 |
Investments in Securities: | | | | |
Common Stocks | $ 96,837,284 | $ 96,721,557 | $ 115,727 | $ - |
Money Market Funds | 10,868,345 | 10,868,345 | - | - |
Total Investments in Securities: | $ 107,705,629 | $ 107,589,902 | $ 115,727 | $ - |
Distribution of investments by country or territory of incorporation, as a percentage of total net assets, is as follows. (Unaudited) |
United States of America | 80.2% |
United Kingdom | 5.4% |
Brazil | 3.4% |
Bermuda | 2.8% |
Switzerland | 2.7% |
Colombia | 2.3% |
Others (Individually Less Than 1%) | 3.2% |
| 100.0% |
See accompanying notes which are an integral part of the financial statements.
Annual Report
Fidelity Advisor Financial Services Fund
Statement of Assets and Liabilities
| July 31, 2012 |
| | |
Assets | | |
Investment in securities, at value (including securities loaned of $4,779,426) - See accompanying schedule: Unaffiliated issuers (cost $97,877,904) | $ 96,837,284 | |
Fidelity Central Funds (cost $10,868,345) | 10,868,345 | |
Total Investments (cost $108,746,249) | | $ 107,705,629 |
Foreign currency held at value (cost $5) | | 5 |
Receivable for investments sold | | 4,636,753 |
Receivable for fund shares sold | | 83,750 |
Dividends receivable | | 73,389 |
Distributions receivable from Fidelity Central Funds | | 2,122 |
Other receivables | | 38,538 |
Total assets | | 112,540,186 |
| | |
Liabilities | | |
Payable for investments purchased | $ 3,683,982 | |
Payable for fund shares redeemed | 146,702 | |
Accrued management fee | 48,124 | |
Distribution and service plan fees payable | 42,084 | |
Other affiliated payables | 28,138 | |
Other payables and accrued expenses | 43,012 | |
Collateral on securities loaned, at value | 4,910,355 | |
Total liabilities | | 8,902,397 |
| | |
Net Assets | | $ 103,637,789 |
Net Assets consist of: | | |
Paid in capital | | $ 193,695,338 |
Undistributed net investment income | | 195,946 |
Accumulated undistributed net realized gain (loss) on investments and foreign currency transactions | | (89,211,093) |
Net unrealized appreciation (depreciation) on investments and assets and liabilities in foreign currencies | | (1,042,402) |
Net Assets | | $ 103,637,789 |
Statement of Assets and Liabilities - continued
| July 31, 2012 |
| | |
Calculation of Maximum Offering Price Class A:
Net Asset Value and redemption price per share ($47,055,319 ÷ 4,621,936 shares) | | $ 10.18 |
| | |
Maximum offering price per share (100/94.25 of $10.18) | | $ 10.80 |
Class T:
Net Asset Value and redemption price per share ($24,367,456 ÷ 2,409,711 shares) | | $ 10.11 |
| | |
Maximum offering price per share (100/96.50 of $10.11) | | $ 10.48 |
Class B:
Net Asset Value and offering price per share ($5,744,554 ÷ 586,962 shares)A | | $ 9.79 |
| | |
Class C:
Net Asset Value and offering price per share ($20,874,868 ÷ 2,152,059 shares)A | | $ 9.70 |
| | |
Institutional Class:
Net Asset Value, offering price and redemption price per share ($5,595,592 ÷ 536,831 shares) | | $ 10.42 |
A Redemption price per share is equal to net asset value less any applicable contingent deferred sales charge.
See accompanying notes which are an integral part of the financial statements.
Annual Report
Fidelity Advisor Financial Services Fund
Financial Statements - continued
Statement of Operations
| Year ended July 31, 2012 |
| | |
Investment Income | | |
Dividends | | $ 2,133,434 |
Income from Fidelity Central Funds | | 30,196 |
Total income | | 2,163,630 |
| | |
Expenses | | |
Management fee | $ 631,666 | |
Transfer agent fees | 339,321 | |
Distribution and service plan fees | 521,860 | |
Accounting and security lending fees | 44,790 | |
Custodian fees and expenses | 36,227 | |
Independent trustees' compensation | 797 | |
Registration fees | 60,638 | |
Audit | 52,225 | |
Legal | 721 | |
Interest | 235 | |
Miscellaneous | 1,123 | |
Total expenses before reductions | 1,689,603 | |
Expense reductions | (100,487) | 1,589,116 |
Net investment income (loss) | | 574,514 |
Realized and Unrealized Gain (Loss) Net realized gain (loss) on: | | |
Investment securities: | | |
Unaffiliated issuers | (5,594,502) | |
Foreign currency transactions | (68,047) | |
Total net realized gain (loss) | | (5,662,549) |
Change in net unrealized appreciation (depreciation) on: Investment securities | 6,138,170 | |
Assets and liabilities in foreign currencies | (1,253) | |
Total change in net unrealized appreciation (depreciation) | | 6,136,917 |
Net gain (loss) | | 474,368 |
Net increase (decrease) in net assets resulting from operations | | $ 1,048,882 |
Statement of Changes in Net Assets
| Year ended
July 31,
2012 | Year ended
July 31,
2011 |
Increase (Decrease) in Net Assets | | |
Operations | | |
Net investment income (loss) | $ 574,514 | $ (682,395) |
Net realized gain (loss) | (5,662,549) | (942,210) |
Change in net unrealized appreciation (depreciation) | 6,136,917 | (2,518,839) |
Net increase (decrease) in net assets resulting from operations | 1,048,882 | (4,143,444) |
Distributions to shareholders from net investment income | (107,549) | - |
Share transactions - net increase (decrease) | (27,119,342) | (16,036,954) |
Redemption fees | 4,119 | 4,715 |
Total increase (decrease) in net assets | (26,173,890) | (20,175,683) |
| | |
Net Assets | | |
Beginning of period | 129,811,679 | 149,987,362 |
End of period (including undistributed net investment income of $195,946 and accumulated net investment loss of $116,048, respectively) | $ 103,637,789 | $ 129,811,679 |
See accompanying notes which are an integral part of the financial statements.
Annual Report
Financial Highlights - Class A
Years ended July 31, | 2012 | 2011 | 2010 | 2009 | 2008 |
Selected Per-Share Data | | | | | |
Net asset value, beginning of period | $ 10.06 | $ 10.35 | $ 9.53 | $ 13.18 | $ 21.02 |
Income from Investment Operations | | | | | |
Net investment income (loss) C | .07 | (.02) | (.01) | .19 | .30 |
Net realized and unrealized gain (loss) | .06 | (.27) | .93 | (3.58) | (6.41) |
Total from investment operations | .13 | (.29) | .92 | (3.39) | (6.11) |
Distributions from net investment income | (.01) | - | (.10) | (.24) | (.27) |
Distributions from net realized gain | - | - | - | (.02) | (1.46) |
Total distributions | (.01) | - | (.10) | (.26) | (1.73) |
Redemption fees added to paid in capital C, G | - | - | - | - | - |
Net asset value, end of period | $ 10.18 | $ 10.06 | $ 10.35 | $ 9.53 | $ 13.18 |
Total Return A, B | 1.34% | (2.80)% | 9.61% | (25.87)% | (31.67)% |
Ratios to Average Net Assets D, F | | | | | |
Expenses before reductions | 1.28% | 1.26% | 1.27% | 1.29% | 1.21% |
Expenses net of fee waivers, if any | 1.28% | 1.26% | 1.27% | 1.29% | 1.21% |
Expenses net of all reductions | 1.20% | 1.21% | 1.22% | 1.28% | 1.21% |
Net investment income (loss) | .72% | (.24)% | (.09)% | 2.12% | 1.75% |
Supplemental Data | | | | | |
Net assets, end of period (000 omitted) | $ 47,055 | $ 63,937 | $ 69,723 | $ 68,245 | $ 90,037 |
Portfolio turnover rate E | 441% | 260% | 254% | 269% | 48% |
A Total returns would have been lower if certain expenses had not been reduced during the applicable periods shown.
B Total returns do not include the effect of the sales charges.
C Calculated based on average shares outstanding during the period.
D Fees and expenses of any underlying Fidelity Central Funds are not included in the Fund's expense ratio. The Fund indirectly bears its proportionate share of the expenses of any underlying Fidelity Central Funds.
E Amount does not include the portfolio activity of any underlying Fidelity Central Funds.
F Expense ratios reflect operating expenses of the class. Expenses before reductions do not reflect amounts reimbursed by the investment adviser or reductions from brokerage service arrangements or reductions from other expense offset arrangements and do not represent the amount paid by the class during periods when reimbursements or reductions occur. Expenses net of fee waivers reflect expenses after reimbursement by the investment adviser but prior to reductions from brokerage service arrangements or other expense offset arrangements. Expenses net of all reductions represent the net expenses paid by the class.
G Amount represents less than $.01 per share.
Financial Highlights - Class T
Years ended July 31, | 2012 | 2011 | 2010 | 2009 | 2008 |
Selected Per-Share Data | | | | | |
Net asset value, beginning of period | $ 10.01 | $ 10.32 | $ 9.52 | $ 13.14 | $ 20.94 |
Income from Investment Operations | | | | | |
Net investment income (loss) C | .04 | (.05) | (.04) | .16 | .26 |
Net realized and unrealized gain (loss) | .06 | (.26) | .92 | (3.56) | (6.41) |
Total from investment operations | .10 | (.31) | .88 | (3.40) | (6.15) |
Distributions from net investment income | - G | - | (.08) | (.20) | (.19) |
Distributions from net realized gain | - | - | - | (.02) | (1.46) |
Total distributions | - G | - | (.08) | (.22) | (1.65) |
Redemption fees added to paid in capital C, G | - | - | - | - | - |
Net asset value, end of period | $ 10.11 | $ 10.01 | $ 10.32 | $ 9.52 | $ 13.14 |
Total Return A, B | 1.03% | (3.00)% | 9.26% | (26.00)% | (31.85)% |
Ratios to Average Net Assets D, F | | | | | |
Expenses before reductions | 1.54% | 1.52% | 1.53% | 1.55% | 1.47% |
Expenses net of fee waivers, if any | 1.54% | 1.52% | 1.53% | 1.55% | 1.47% |
Expenses net of all reductions | 1.45% | 1.47% | 1.47% | 1.54% | 1.47% |
Net investment income (loss) | .46% | (.49)% | (.35)% | 1.86% | 1.50% |
Supplemental Data | | | | | |
Net assets, end of period (000 omitted) | $ 24,367 | $ 27,037 | $ 33,310 | $ 34,927 | $ 53,526 |
Portfolio turnover rate E | 441% | 260% | 254% | 269% | 48% |
A Total returns would have been lower if certain expenses had not been reduced during the applicable periods shown.
B Total returns do not include the effect of the sales charges.
C Calculated based on average shares outstanding during the period.
D Fees and expenses of any underlying Fidelity Central Funds are not included in the Fund's expense ratio. The Fund indirectly bears its proportionate share of the expenses of any underlying Fidelity Central Funds.
E Amount does not include the portfolio activity of any underlying Fidelity Central Funds.
F Expense ratios reflect operating expenses of the class. Expenses before reductions do not reflect amounts reimbursed by the investment adviser or reductions from brokerage service arrangements or reductions from other expense offset arrangements and do not represent the amount paid by the class during periods when reimbursements or reductions occur. Expenses net of fee waivers reflect expenses after reimbursement by the investment adviser but prior to reductions from brokerage service arrangements or other expense offset arrangements. Expenses net of all reductions represent the net expenses paid by the class.
G Amount represents less than $.01 per share.
See accompanying notes which are an integral part of the financial statements.
Annual Report
Financial Highlights - Class B
Years ended July 31, | 2012 | 2011 | 2010 | 2009 | 2008 |
Selected Per-Share Data | | | | | |
Net asset value, beginning of period | $ 9.73 | $ 10.09 | $ 9.33 | $ 12.85 | $ 20.44 |
Income from Investment Operations | | | | | |
Net investment income (loss) C | - G | (.10) | (.09) | .12 | .18 |
Net realized and unrealized gain (loss) | .06 | (.26) | .91 | (3.50) | (6.29) |
Total from investment operations | .06 | (.36) | .82 | (3.38) | (6.11) |
Distributions from net investment income | - | - | (.06) | (.12) | (.04) |
Distributions from net realized gain | - | - | - | (.02) | (1.44) |
Total distributions | - | - | (.06) | (.14) | (1.48) |
Redemption fees added to paid in capital C, G | - | - | - | - | - |
Net asset value, end of period | $ 9.79 | $ 9.73 | $ 10.09 | $ 9.33 | $ 12.85 |
Total Return A, B | .62% | (3.57)% | 8.78% | (26.35)% | (32.21)% |
Ratios to Average Net Assets D, F | | | | | |
Expenses before reductions | 2.03% | 2.01% | 2.02% | 2.04% | 1.96% |
Expenses net of fee waivers, if any | 2.03% | 2.01% | 2.02% | 2.04% | 1.96% |
Expenses net of all reductions | 1.94% | 1.96% | 1.97% | 2.03% | 1.96% |
Net investment income (loss) | (.03)% | (.98)% | (.85)% | 1.38% | 1.01% |
Supplemental Data | | | | | |
Net assets, end of period (000 omitted) | $ 5,745 | $ 7,480 | $ 10,992 | $ 12,477 | $ 20,420 |
Portfolio turnover rate E | 441% | 260% | 254% | 269% | 48% |
A Total returns would have been lower if certain expenses had not been reduced during the applicable periods shown.
B Total returns do not include the effect of the contingent deferred sales charge.
C Calculated based on average shares outstanding during the period.
D Fees and expenses of any underlying Fidelity Central Funds are not included in the Fund's expense ratio. The Fund indirectly bears its proportionate share of the expenses of any underlying Fidelity Central Funds.
E Amount does not include the portfolio activity of any underlying Fidelity Central Funds.
F Expense ratios reflect operating expenses of the class. Expenses before reductions do not reflect amounts reimbursed by the investment adviser or reductions from brokerage service arrangements or reductions from other expense offset arrangements and do not represent the amount paid by the class during periods when reimbursements or reductions occur. Expenses net of fee waivers reflect expenses after reimbursement by the investment adviser but prior to reductions from brokerage service arrangements or other expense offset arrangements. Expenses net of all reductions represent the net expenses paid by the class.
G Amount represents less than $.01 per share.
Financial Highlights - Class C
Years ended July 31, | 2012 | 2011 | 2010 | 2009 | 2008 |
Selected Per-Share Data | | | | | |
Net asset value, beginning of period | $ 9.65 | $ 10.00 | $ 9.25 | $ 12.78 | $ 20.40 |
Income from Investment Operations | | | | | |
Net investment income (loss) C | - G | (.10) | (.09) | .12 | .17 |
Net realized and unrealized gain (loss) | .05 | (.25) | .90 | (3.48) | (6.24) |
Total from investment operations | .05 | (.35) | .81 | (3.36) | (6.07) |
Distributions from net investment income | - | - | (.06) | (.15) | (.09) |
Distributions from net realized gain | - | - | - | (.02) | (1.46) |
Total distributions | - | - | (.06) | (.17) | (1.55) |
Redemption fees added to paid in capital C, G | - | - | - | - | - |
Net asset value, end of period | $ 9.70 | $ 9.65 | $ 10.00 | $ 9.25 | $ 12.78 |
Total Return A, B | .52% | (3.50)% | 8.79% | (26.38)% | (32.18)% |
Ratios to Average Net Assets D, F | | | | | |
Expenses before reductions | 2.03% | 2.01% | 2.02% | 2.04% | 1.96% |
Expenses net of fee waivers, if any | 2.03% | 2.01% | 2.02% | 2.04% | 1.96% |
Expenses net of all reductions | 1.94% | 1.96% | 1.96% | 2.03% | 1.96% |
Net investment income (loss) | (.03)% | (.99)% | (.84)% | 1.37% | 1.01% |
Supplemental Data | | | | | |
Net assets, end of period (000 omitted) | $ 20,875 | $ 23,196 | $ 30,804 | $ 29,849 | $ 37,777 |
Portfolio turnover rate E | 441% | 260% | 254% | 269% | 48% |
A Total returns would have been lower if certain expenses had not been reduced during the applicable periods shown.
B Total returns do not include the effect of the contingent deferred sales charge.
C Calculated based on average shares outstanding during the period.
D Fees and expenses of any underlying Fidelity Central Funds are not included in the Fund's expense ratio. The Fund indirectly bears its proportionate share of the expenses of any underlying Fidelity Central Funds.
E Amount does not include the portfolio activity of any underlying Fidelity Central Funds.
F Expense ratios reflect operating expenses of the class. Expenses before reductions do not reflect amounts reimbursed by the investment adviser or reductions from brokerage service arrangements or reductions from other expense offset arrangements and do not represent the amount paid by the class during periods when reimbursements or reductions occur. Expenses net of fee waivers reflect expenses after reimbursement by the investment adviser but prior to reductions from brokerage service arrangements or other expense offset arrangements. Expenses net of all reductions represent the net expenses paid by the class.
G Amount represents less than $.01 per share.
See accompanying notes which are an integral part of the financial statements.
Annual Report
Financial Highlights - Institutional Class
Years ended July 31, | 2012 | 2011 | 2010 | 2009 | 2008 |
Selected Per-Share Data | | | | | |
Net asset value, beginning of period | $ 10.28 | $ 10.55 | $ 9.69 | $ 13.38 | $ 21.32 |
Income from Investment Operations | | | | | |
Net investment income (loss) B | .10 | .01 | .02 | .21 | .36 |
Net realized and unrealized gain (loss) | .06 | (.28) | .95 | (3.63) | (6.51) |
Total from investment operations | .16 | (.27) | .97 | (3.42) | (6.15) |
Distributions from net investment income | (.02) | - | (.11) | (.25) | (.33) |
Distributions from net realized gain | - | - | - | (.02) | (1.46) |
Total distributions | (.02) | - | (.11) | (.27) | (1.79) |
Redemption fees added to paid in capital B, F | - | - | - | - | - |
Net asset value, end of period | $ 10.42 | $ 10.28 | $ 10.55 | $ 9.69 | $ 13.38 |
Total Return A | 1.61% | (2.56)% | 9.99% | (25.68)% | (31.47)% |
Ratios to Average Net Assets C, E | | | | | |
Expenses before reductions | .98% | .96% | .99% | 1.04% | .93% |
Expenses net of fee waivers, if any | .98% | .96% | .99% | 1.04% | .93% |
Expenses net of all reductions | .89% | .91% | .94% | 1.03% | .92% |
Net investment income (loss) | 1.02% | .07% | .19% | 2.37% | 2.04% |
Supplemental Data | | | | | |
Net assets, end of period (000 omitted) | $ 5,596 | $ 8,162 | $ 5,158 | $ 3,797 | $ 5,819 |
Portfolio turnover rate D | 441% | 260% | 254% | 269% | 48% |
A Total returns would have been lower if certain expenses had not been reduced during the applicable periods shown.
B Calculated based on average shares outstanding during the period.
C Fees and expenses of any underlying Fidelity Central Funds are not included in the Fund's expense ratio. The Fund indirectly bears its proportionate share of the expenses of any underlying Fidelity Central Funds.
D Amount does not include the portfolio activity of any underlying Fidelity Central Funds.
E Expense ratios reflect operating expenses of the class. Expenses before reductions do not reflect amounts reimbursed by the investment adviser or reductions from brokerage service arrangements or reductions from other expense offset arrangements and do not represent the amount paid by the class during periods when reimbursements or reductions occur. Expenses net of fee waivers reflect expenses after reimbursement by the investment adviser but prior to reductions from brokerage service arrangements or other expense offset arrangements. Expenses net of all reductions represent the net expenses paid by the class.
F Amount represents less than $.01 per share.
See accompanying notes which are an integral part of the financial statements.
Annual Report
Fidelity Advisor Financial Services Fund
Notes to Financial Statements
For the period ended July 31, 2012
1. Organization.
Fidelity Advisor Financial Services Fund (the Fund) is a fund of Fidelity Advisor Series VII (the Trust) and is authorized to issue an unlimited number of shares. The Trust is registered under the Investment Company Act of 1940, as amended (the 1940 Act), as an open-end management investment company organized as a Massachusetts business trust. The Fund offers Class A, Class T, Class C, and Institutional Class shares, each of which, along with Class B shares, has equal rights as to assets and voting privileges. Effective after the close of business on September 1, 2010, Class B shares were closed to new accounts and additional purchases, except for exchanges and reinvestments. Each class has exclusive voting rights with respect to matters that affect that class. Class B shares will automatically convert to Class A shares after a holding period of seven years from the initial date of purchase. Investment income, realized and unrealized capital gains and losses, the common expenses of the Fund, and certain fund-level expense reductions, if any, are allocated on a pro-rata basis to each class based on the relative net assets of each class to the total net assets of the Fund. Each class differs with respect to transfer agent and distribution and service plan fees incurred. Certain expense reductions may also differ by class. The Fund's investments in emerging markets can be subject to social, economic, regulatory, and political uncertainties and can be extremely volatile.
2. Investments in Fidelity Central Funds.
The Fund invests in Fidelity Central Funds, which are open-end investment companies available only to other investment companies and accounts managed by Fidelity Management & Research Company (FMR) and its affiliates. The Fund's Schedule of Investments lists each of the Fidelity Central Funds held as of period end, if any, as an investment of the Fund, but does not include the underlying holdings of each Fidelity Central Fund. As an Investing Fund, the Fund indirectly bears its proportionate share of the expenses of the underlying Fidelity Central Funds.
The Money Market Central Funds seek preservation of capital and current income and are managed by Fidelity Investments Money Management, Inc. (FIMM), an affiliate of FMR.
A complete unaudited list of holdings for each Fidelity Central Fund is available upon request or at the Securities and Exchange Commission (the SEC) web site at www.sec.gov. In addition, the financial statements of the Fidelity Central Funds, which are not covered by the Fund's Report of Independent Registered Public Accounting Firm, are available on the SEC web site or upon request.
3. Significant Accounting Policies.
The financial statements have been prepared in conformity with accounting principles generally accepted in the United States of America (GAAP), which require management to make certain estimates and assumptions at the date of the financial statements. Actual results could differ from those estimates. Subsequent events, if any, through the date that the financial statements were issued have been evaluated in the preparation of the financial statements. The following summarizes the significant accounting policies of the Fund:
Security Valuation. Investments are valued as of 4:00 p.m. Eastern time on the last calendar day of the period. In accordance with valuation policies and procedures approved by the Board of Trustees (the Board), the Fund attempts to obtain prices from one or more third party pricing vendor or broker to value its investments. When current market prices, quotations or rates are not readily available or reliable, securities will be fair valued in good faith by the FMR Fair Value Committee (the Committee), in accordance with procedures adopted by the Fund's Board. Factors used in determining fair value vary by security type and may include market or security specific events. The frequency with which these procedures are used cannot be predicted and they may be utilized to a significant extent. The Committee oversees the Fund's valuation policies and procedures and is responsible for approving and reporting to the Board all fair value determinations.
The Fund categorizes the inputs to valuation techniques used to value its investments into a disclosure hierarchy consisting of three levels as shown below:
Level 1 - quoted prices in active markets for identical investments
Level 2 - other significant observable inputs (including quoted prices for similar investments, interest rates, prepayment speeds, etc.)
Level 3 - unobservable inputs (including the Fund's own assumptions based on the best information available)
Valuation techniques used to value the Fund's investments by major category are as follows:
Equity securities, including restricted securities, for which market quotations are readily available, are valued at the last reported sale price or official closing price as reported by a third party pricing vendor on the primary market or exchange on which they are traded and are categorized as Level 1 in the hierarchy. In the event there were no sales during the day or closing prices are not available, securities are valued at the last quoted bid price or may be valued using the last available price and are generally categorized as Level 2 in the hierarchy. For foreign equity securities, when significant market or security specific events arise, comparisons to the valuation of American Depositary Receipts (ADRs), futures contracts, Exchange-Traded Funds (ETFs) and certain indexes as well as quoted prices for similar securities are used and are categorized as Level 2 in the hierarchy. Utilizing these techniques may result in transfers between Level 1 and Level 2.
Annual Report
3. Significant Accounting Policies - continued
Security Valuation - continued
Investments in open-end mutual funds, including the Fidelity Central Funds, are valued at their closing net asset value each business day and are categorized as Level 1 in the hierarchy.
Changes in valuation techniques may result in transfers in or out of an assigned level within the disclosure hierarchy. The aggregate value of investments by input level, as of July 31, 2012, is included at the end of the Fund's Schedule of Investments.
Foreign Currency Translation. The Fund may use foreign currency contracts to facilitate transactions in foreign-denominated securities. Gains and losses from these transactions may arise from changes in the value of the foreign currency or if the counterparties do not perform under the contracts' terms.
Foreign-denominated assets, including investment securities, and liabilities are translated into U.S. dollars at the exchange rates at period end. Purchases and sales of investment securities, income and dividends received and expenses denominated in foreign currencies are translated into U.S. dollars at the exchange rate in effect on the transaction date.
The effects of exchange rate fluctuations on investments are included with the net realized and unrealized gain (loss) on investment securities. Other foreign currency transactions resulting in realized and unrealized gain (loss) are disclosed separately.
Investment Transactions and Income. For financial reporting purposes, the Fund's investment holdings and NAV include trades executed through the end of the last business day of the period. The NAV per share for processing shareholder transactions is calculated as of the close of business of the New York Stock Exchange (NYSE), normally 4:00 p.m. Eastern time and includes trades executed through the end of the prior business day. Gains and losses on securities sold are determined on the basis of identified cost and may include proceeds received from litigation. Dividend income is recorded on the ex-dividend date, except for certain dividends from foreign securities where the ex-dividend date may have passed, which are recorded as soon as the Fund is informed of the ex-dividend date. Non-cash dividends included in dividend income, if any, are recorded at the fair market value of the securities received. Distributions received on securities that represent a return of capital or capital gain are recorded as a reduction of cost of investments and/or as a realized gain. The Fund estimates the components of distributions received that may be considered return of capital distributions or capital gain distributions. Interest income and distributions from the Fidelity Central Funds are accrued as earned. Interest income includes coupon interest and amortization of premium and accretion of discount on debt securities. Investment income is recorded net of foreign taxes withheld where recovery of such taxes is uncertain.
Expenses. Expenses directly attributable to a fund are charged to that fund. Expenses attributable to more than one fund are allocated among the respective funds on the basis of relative net assets or other appropriate methods. Expense estimates are accrued in the period to which they relate and adjustments are made when actual amounts are known.
Income Tax Information and Distributions to Shareholders. Each year, the Fund intends to qualify as a regulated investment company under Subchapter M of the Internal Revenue Code, including distributing substantially all of its taxable income and realized gains. As a result, no provision for income taxes is required. As of July 31, 2012, the Fund did not have any unrecognized tax benefits in the financial statements; nor is the Fund aware of any tax positions for which it is reasonably possible that the total amounts of unrecognized tax benefits will significantly change in the next twelve months. The Fund files a U.S. federal tax return, in addition to state and local tax returns as required. A fund's federal income tax returns are subject to examination by the Internal Revenue Service (IRS) for a period of three fiscal years after they are filed. State and local tax returns may be subject to examination for an additional fiscal year depending on the jurisdiction. Foreign taxes are provided for based on the Fund's understanding of the tax rules and rates that exist in the foreign markets in which it invests.
Distributions are declared and recorded on the ex-dividend date. Income dividends and capital gain distributions are declared separately for each class. Income and capital gain distributions are determined in accordance with income tax regulations, which may differ from GAAP.
Capital accounts within the financial statements are adjusted for permanent book-tax differences. These adjustments have no impact on net assets or the results of operations. Temporary book-tax differences will reverse in a subsequent period.
Book-tax differences are primarily due to foreign currency transactions, partnerships, deferred trustees compensation, passive foreign investment companies (PFIC), capital loss carryforwards and losses deferred due to wash sales and excise tax regulations.
Annual Report
Fidelity Advisor Financial Services Fund
Notes to Financial Statements - continued
3. Significant Accounting Policies - continued
Income Tax Information and Distributions to Shareholders - continued
The federal tax cost of investment securities and unrealized appreciation (depreciation) as of period end were as follows:
Gross unrealized appreciation | $ 3,891,913 |
Gross unrealized depreciation | (7,459,553) |
Net unrealized appreciation (depreciation) on securities and other investments | $ (3,567,640) |
| |
Tax Cost | $ 111,273,269 |
The tax-based components of distributable earnings as of period end were as follows:
Undistributed ordinary income | $ 195,956 |
Capital loss carryforward | $ (83,462,006) |
Net unrealized appreciation (depreciation) | $ (3,569,422) |
Capital loss carryforwards are only available to offset future capital gains of the Fund to the extent provided by regulations and may be limited. Under the Regulated Investment Company Modernization Act of 2010 (the Act), the Fund is permitted to carry forward capital losses incurred in taxable years beginning after December 22, 2010 for an unlimited period and such capital losses are required to be used prior to any losses that expire. Capital loss carryforwards were as follows:
Fiscal year of expiration | |
| |
2017 | $ (55,672,202) |
2018 | (23,251,884) |
2019 | (450,657) |
Total with expiration | (79,374,743) |
No expiration | |
Long-term | (4,087,263) |
Total no expiration | (4,087,263) |
Total capital loss carryforward | $ (83,462,006) |
The Fund intends to elect to defer to its fiscal year ending July 31, 2013 approximately $3,222,067 of capital losses recognized during the period November 1, 2011 to July 31, 2012.
The tax character of distributions paid was as follows:
| July 31, 2012 | July 31, 2011 |
Ordinary Income | $ 107,549 | $ - |
Short-Term Trading (Redemption) Fees. Shares held by investors in the Fund less than 30 days are subject to a redemption fee equal to .75% of the net asset value of shares redeemed. All redemption fees, which reduce the proceeds of the shareholder redemption, are retained by the Fund and accounted for as an addition to paid in capital.
New Accounting Pronouncement. In December 2011, the Financial Accounting Standards Board issued Accounting Standard Update No. 2011-11, Disclosures about Offsetting Assets and Liabilities. The update creates new disclosure requirements requiring entities to disclose both gross and net information for derivatives and other financial instruments that are either offset in the Statement of Assets and Liabilities or subject to an enforceable master netting arrangement or similar agreement. The disclosure requirements are effective for interim and annual reporting periods beginning on or after January 1, 2013. Management is currently evaluating the impact of the update's adoption on the Fund's financial statement disclosures.
4. Purchases and Sales of Investments.
Purchases and sales of securities, other than short-term securities, aggregated $485,785,212 and $516,640,857, respectively.
Annual Report
5. Fees and Other Transactions with Affiliates.
Management Fee. FMR and its affiliates provide the Fund with investment management related services for which the Fund pays a monthly management fee. The management fee is the sum of an individual fund fee rate that is based on an annual rate of .30% of the Fund's average net assets and an annualized group fee rate that averaged .26% during the period. The group fee rate is based upon the average net assets of all the mutual funds advised by FMR. The group fee rate decreases as assets under management increase and increases as assets under management decrease. For the period, the total annual management fee rate was .56% of the Fund's average net assets.
Distribution and Service Plan Fees. In accordance with Rule 12b-1 of the 1940 Act, the Fund has adopted separate Distribution and Service Plans for each class of shares. Certain classes pay Fidelity Distributors Corporation (FDC), an affiliate of FMR, separate Distribution and Service Fees, each of which is based on an annual percentage of each class' average net assets. In addition, FDC may pay financial intermediaries for selling shares of the Fund and providing shareholder support services. For the period, the Distribution and Service Fee rates, total fees and amounts retained by FDC were as follows:
| Distribution
Fee | Service
Fee | Total Fees | Retained
by FDC |
Class A | -% | .25% | $ 141,129 | $ 21,140 |
Class T | .25% | .25% | 118,800 | 472 |
Class B | .75% | .25% | 61,047 | 45,809 |
Class C | .75% | .25% | 200,884 | 23,893 |
| | | $ 521,860 | $ 91,314 |
Sales Load. FDC may receive a front-end sales charge of up to 5.75% for selling Class A shares and 3.50% for selling Class T shares, some of which is paid to financial intermediaries for selling shares of the Fund. Depending on the holding period, FDC may receive contingent deferred sales charges levied on Class A, Class T, Class B, and Class C redemptions. The deferred sales charges range from 5.00% to 1.00% for Class B shares, 1.00% for Class C shares, 1.00% for certain purchases of Class A shares and .25% for certain purchases of Class T shares.
For the period, sales charge amounts retained by FDC were as follows:
| Retained
by FDC |
Class A | $ 54,284 |
Class T | 5,208 |
Class B* | 12,843 |
Class C* | 1,842 |
| $ 74,177 |
* When Class B and Class C shares are initially sold, FDC pays commissions from its own resources to financial intermediaries through which the sales are made.
Transfer Agent Fees. Fidelity Investments Institutional Operations Company, Inc. (FIIOC), an affiliate of FMR, is the transfer, dividend disbursing and shareholder servicing agent for each class of the Fund. FIIOC receives account fees and asset-based fees that vary according to the account size and type of account of the shareholders of the respective classes of the Fund. FIIOC pays for typesetting, printing and mailing of shareholder reports, except proxy statements. For the period, transfer agent fees for each class were as follows:
| Amount | % of
Average
Net Assets |
Class A | $ 169,930 | .30 |
Class T | 73,838 | .31 |
Class B | 18,390 | .30 |
Class C | 60,523 | .30 |
Institutional Class | 16,640 | .25 |
| $ 339,321 | |
Accounting and Security Lending Fees. Fidelity Service Company, Inc. (FSC), an affiliate of FMR, maintains the Fund's accounting records. The accounting fee is based on the level of average net assets for each month. Under a separate contract, FSC administers the security lending program. The security lending fee is based on the number and duration of lending transactions.
Brokerage Commissions. The Fund placed a portion of its portfolio transactions with brokerage firms which are affiliates of the investment adviser. The commissions paid to these affiliated firms were $28,761 for the period.
Annual Report
Fidelity Advisor Financial Services Fund
Notes to Financial Statements - continued
6. Committed Line of Credit.
The Fund participates with other funds managed by FMR or an affiliate in a $4.25 billion credit facility (the "line of credit") to be utilized for temporary or emergency purposes to fund shareholder redemptions or for other short-term liquidity purposes. The Fund has agreed to pay commitment fees on its pro-rata portion of the line of credit, which amounted to $327 and is reflected in Miscellaneous expenses on the Statement of Operations. During the period, there were no borrowings on this line of credit.
7. Security Lending.
The Fund lends portfolio securities through a lending agent from time to time in order to earn additional income. For equity securities, a lending agent is used and may loan securities to certain qualified borrowers, including Fidelity Capital Markets (FCM), a broker-dealer affiliated with the Fund. On the settlement date of the loan, the Fund receives collateral (in the form of U.S. Treasury obligations, letters of credit and/or cash) against the loaned securities and maintains collateral in an amount not less than 100% of the market value of the loaned securities during the period of the loan. The market value of the loaned securities is determined at the close of business of the Fund and any additional required collateral is delivered to the Fund on the next business day. If the borrower defaults on its obligation to return the securities loaned because of insolvency or other reasons, a fund could experience delays and costs in recovering the securities loaned or in gaining access to the collateral. Any cash collateral received is invested in the Fidelity Securities Lending Cash Central Fund. The value of loaned securities and cash collateral at period end are disclosed on the Fund's Statement of Assets and Liabilities. At period end, there were no security loans outstanding with FCM. Security lending income represents the income earned on investing cash collateral, less rebates paid to borrowers and any lending agent fees associated with the loan, plus any premium payments received for lending certain types of securities. Security lending income is presented in the Statement of Operations as a component of income from Fidelity Central Funds. Total security lending income during the period amounted to $23,394, including $9 from securities loaned to FCM.
8. Bank Borrowings.
The Fund is permitted to have bank borrowings for temporary or emergency purposes to fund shareholder redemptions or for other short-term liquidity requirements. The Fund has established borrowing arrangements with certain banks. The interest rate on the borrowings is the bank's base rate, as revised from time to time. The average loan balance during the period for which loans were outstanding amounted to $13,000,000. The weighted average interest rate was .65%. The interest expense amounted to $235 under the bank borrowing program. At period end, there were no bank borrowings outstanding.
9. Expense Reductions.
Many of the brokers with whom FMR places trades on behalf of the Fund provided services to the Fund in addition to trade execution. These services included payments of certain expenses on behalf of the Fund totaling $100,487 for the period.
10. Distributions to Shareholders.
Distributions to shareholders of each class were as follows:
Years ended July 31, | 2012 | 2011 |
From net investment income | | |
Class A | $ 83,840 | $ - |
Class T | 7,542 | - |
Institutional Class | 16,167 | - |
Total | $ 107,549 | $ - |
11. Share Transactions.
Transactions for each class of shares were as follows:
| Shares | Dollars |
Years ended July 31, | 2012 | 2011 | 2012 | 2011 |
Class A | | | | |
Shares sold | 1,565,665 | 2,161,457 | $ 14,397,253 | $ 22,928,387 |
Reinvestment of distributions | 8,251 | - | 73,682 | - |
Shares redeemed | (3,304,887) | (2,543,428) | (32,600,547) | (27,053,427) |
Net increase (decrease) | (1,730,971) | (381,971) | $ (18,129,612) | $ (4,125,040) |
Annual Report
11. Share Transactions - continued
| Shares | Dollars |
Years ended July 31, | 2012 | 2011 | 2012 | 2011 |
Class T | | | | |
Shares sold | 376,369 | 432,428 | $ 3,652,534 | $ 4,608,539 |
Reinvestment of distributions | 806 | - | 7,158 | - |
Shares redeemed | (668,164) | (958,085) | (6,208,120) | (10,097,220) |
Net increase (decrease) | (290,989) | (525,657) | $ (2,548,428) | $ (5,488,681) |
Class B | | | | |
Shares sold | 18,960 | 48,520 | $ 183,629 | $ 510,105 |
Shares redeemed | (200,436) | (369,736) | (1,817,467) | (3,763,785) |
Net increase (decrease) | (181,476) | (321,216) | $ (1,633,838) | $ (3,253,680) |
Class C | | | | |
Shares sold | 373,577 | 446,364 | $ 3,534,293 | $ 4,631,347 |
Shares redeemed | (625,998) | (1,122,959) | (5,580,570) | (11,383,791) |
Net increase (decrease) | (252,421) | (676,595) | $ (2,046,277) | $ (6,752,444) |
Institutional Class | | | | |
Shares sold | 366,163 | 691,657 | $ 3,659,590 | $ 7,779,752 |
Reinvestment of distributions | 1,570 | - | 14,317 | - |
Shares redeemed | (624,705) | (387,007) | (6,435,094) | (4,196,861) |
Net increase (decrease) | (256,972) | 304,650 | $ (2,761,187) | $ 3,582,891 |
12. Other.
The Fund's organizational documents provide former and current trustees and officers with a limited indemnification against liabilities arising in connection with the performance of their duties to the Fund. In the normal course of business, the Fund may also enter into contracts that provide general indemnifications. The Fund's maximum exposure under these arrangements is unknown as this would be dependent on future claims that may be made against the Fund. The risk of material loss from such claims is considered remote.
Annual Report
Fidelity Advisor Health Care Fund - Institutional Class
Performance: The Bottom Line
Average annual total return reflects the change in the value of an investment, assuming reinvestment of the class' distributions from dividend income and capital gains (the profits earned upon the sale of securities that have grown in value, if any) and assuming a constant rate of performance each year. The $10,000 table and the fund's returns do not reflect the deduction of taxes that a shareholder would pay on fund distributions or the redemption of fund shares. During periods of reimbursement by Fidelity, a fund's total return will be greater than it would be had the reimbursement not occurred. How a fund did yesterday is no guarantee of how it will do tomorrow.
Average Annual Total Returns
Periods ended July 31, 2012 | | Past 1
year | Past 5
years | Past 10
years |
Institutional Class | | 7.91% | 6.37% | 8.07% |
$10,000 Over 10 Years
Let's say hypothetically that $10,000 was invested in Fidelity Advisor Health Care Fund - Institutional Class on July 31, 2002. The chart shows how the value of your investment would have changed, and also shows how the S&P 500 Index performed over the same period.
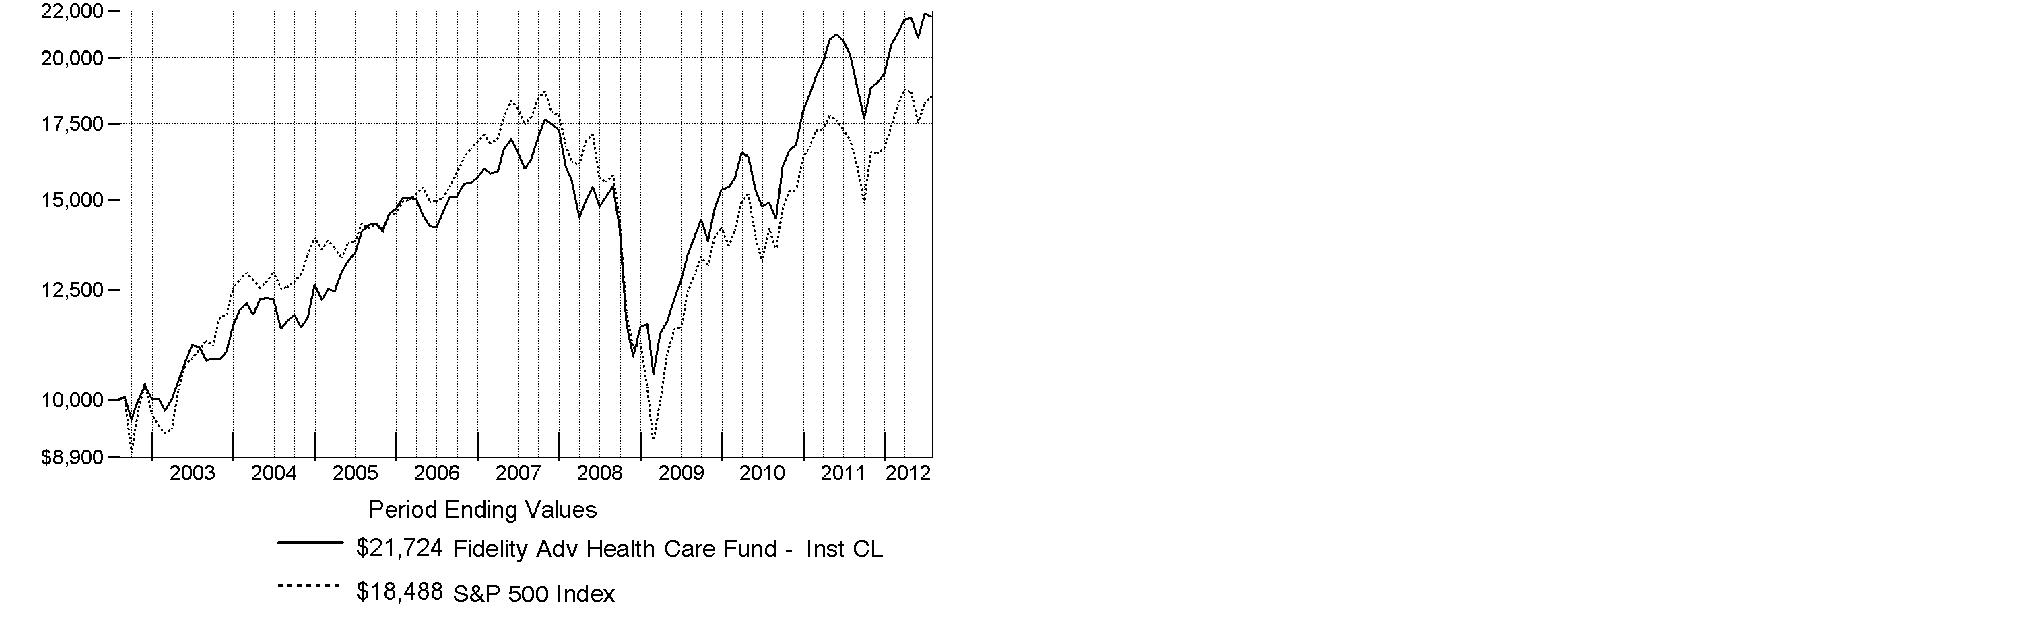
Annual Report
Fidelity Advisor Health Care Fund
Market Recap: Major U.S. equity benchmarks posted solid gains for the year ending July 31, 2012, amid an uncertain investment environment. The broad-based S&P 500® Index returned 9.13%, while the blue-chip-laden Dow Jones Industrial AverageSM and technology-heavy Nasdaq Composite® Index gained 10.12% and 7.83%, respectively. Volatility spiked during the period's first half, as equities plummeted late last summer on Europe's debt woes, political wrangling over the U.S. debt ceiling and the sovereign credit-rating downgrade that followed. By October, a seemingly improved U.S. economy rejuvenated stocks, paving the way for major equity benchmarks to post their best first-quarter performance since 1998. However, more eurozone trouble, signs that the U.S. economy had turned sluggish and a slowdown in China caused stocks to slip in May, before a new wave of optimism took hold in June and July. Within the S&P 500®, more-defensive sectors such as telecommunication services (+30%) and consumer staples (+20%) fared best, while materials and energy significantly underperformed, returning -5%. Small- and mid-cap stocks trailed their less-volatile large-cap counterparts, with the Russell 2000® Index adding 0.19% and the Russell Midcap® Index rising 2.28%. Given turmoil and local currency weakness in Europe, foreign developed-markets stocks lost ground, with the MSCI® EAFE® Index returning -11.32%.
Comments from Eddie Yoon, Portfolio Manager of Fidelity Advisor® Health Care Fund: For the year, the fund's Institutional Class shares gained 7.91%, trailing the 14.50% gain of the MSCI® U.S. IM Health Care 25/50 Index and the broadly based S&P 500®. Versus the MSCI index, weak stock picks and a significant underweighting in the strong pharmaceuticals industry - by far the index's largest component - hurt the most. A less-than-index stake in a slew of large-cap pharma firms, such as index heavyweights Pfizer, Abbott Laboratories - since sold from the fund - and Merck, detracted. Positioning in managed health care, including a stake in both Health Net and Humana, and health care equipment also nicked results. Foreign holdings also hurt, due in part to a stronger U.S. dollar. Conversely, a decision to significantly overweight biotechnology stocks-the best-performing area in the benchmark - was rewarded, due largely to a flurry of merger-and-acquisition activity that lifted the group overall. The fund's top individual contributor was a small non-index stake in Inhibitex, whose shares rose in January on a takeover bid by Bristol-Meyers Squibb. I sold the stock shortly after. Shares of Amgen and Alexion Pharmaceuticals also were additive.
The views expressed above reflect those of the portfolio manager(s) only through the end of the period as stated on the cover of this report and do not necessarily represent the views of Fidelity or any other person in the Fidelity organization. Any such views are subject to change at any time based upon market or other conditions and Fidelity disclaims any responsibility to update such views. These views may not be relied on as investment advice and, because investment decisions for a Fidelity fund are based on numerous factors, may not be relied on as an indication of trading intent on behalf of any Fidelity fund.
Annual Report
Fidelity Advisor Health Care Fund
As a shareholder of the Fund, you incur two types of costs: (1) transaction costs, including sales charges (loads) on purchase payments or redemption proceeds, redemption fees and (2) ongoing costs, including management fees, distribution and/or service (12b-1) fees and other Fund expenses. This Example is intended to help you understand your ongoing costs (in dollars) of investing in the Fund and to compare these costs with the ongoing costs of investing in other mutual funds.
The Example is based on an investment of $1,000 invested at the beginning of the period and held for the entire period (February 1, 2012 to July 31, 2012).
Actual Expenses
The first line of the accompanying table for each class of the Fund provides information about actual account values and actual expenses. You may use the information in this line, together with the amount you invested, to estimate the expenses that you paid over the period. Simply divide your account value by $1,000.00 (for example, an $8,600 account value divided by $1,000.00 = 8.6), then multiply the result by the number in the first line for a class of the Fund under the heading entitled "Expenses Paid During Period" to estimate the expenses you paid on your account during this period. In addition, the Fund, as a shareholder in the underlying Fidelity Central Funds, will indirectly bear its pro-rata share of the fees and expenses incurred by the underlying Fidelity Central Funds. These fees and expenses are not included in the Fund's annualized expense ratio used to calculate the expense estimate in the table below.
Hypothetical Example for Comparison Purposes
The second line of the accompanying table for each class of the Fund provides information about hypothetical account values and hypothetical expenses based on a Class' actual expense ratio and an assumed rate of return of 5% per year before expenses, which is not the Class' actual return. The hypothetical account values and expenses may not be used to estimate the actual ending account balance or expenses you paid for the period. You may use this information to compare the ongoing costs of investing in the Fund and other funds. To do so, compare this 5% hypothetical example with the 5% hypothetical examples that appear in the shareholder reports of the other funds. In addition, the Fund, as a shareholder in the underlying Fidelity Central Funds, will indirectly bear its pro-rata share of the fees and expenses incurred by the underlying Fidelity Central Funds. These fees and expenses are not included in the Fund's annualized expense ratio used to calculate the expense estimate in the table below.
Please note that the expenses shown in the table are meant to highlight your ongoing costs only and do not reflect any transaction costs. Therefore, the second line of the table is useful in comparing ongoing costs only, and will not help you determine the relative total costs of owning different funds. In addition, if these transactional costs were included, your costs would have been higher.
| Annualized Expense Ratio | Beginning
Account Value
February 1, 2012 | Ending
Account Value
July 31, 2012 | Expenses Paid
During Period*
February 1, 2012
to July 31, 2012 |
Class A | 1.17% | | | |
Actual | | $ 1,000.00 | $ 1,056.90 | $ 5.98 |
HypotheticalA | | $ 1,000.00 | $ 1,019.05 | $ 5.87 |
Class T | 1.42% | | | |
Actual | | $ 1,000.00 | $ 1,055.40 | $ 7.26 |
HypotheticalA | | $ 1,000.00 | $ 1,017.80 | $ 7.12 |
Class B | 1.93% | | | |
Actual | | $ 1,000.00 | $ 1,052.80 | $ 9.85 |
HypotheticalA | | $ 1,000.00 | $ 1,015.27 | $ 9.67 |
Class C | 1.88% | | | |
Actual | | $ 1,000.00 | $ 1,052.90 | $ 9.60 |
HypotheticalA | | $ 1,000.00 | $ 1,015.51 | $ 9.42 |
Institutional Class | .88% | | | |
Actual | | $ 1,000.00 | $ 1,058.70 | $ 4.50 |
HypotheticalA | | $ 1,000.00 | $ 1,020.49 | $ 4.42 |
A 5% return per year before expenses
* Expenses are equal to each Class' annualized expense ratio, multiplied by the average account value over the period, multiplied by 182/366 (to reflect the one-half year period).
Annual Report
Fidelity Advisor Health Care Fund
Investment Changes (Unaudited)
Top Ten Stocks as of July 31, 2012 |
| % of fund's
net assets | % of fund's net assets
6 months ago |
Amgen, Inc. | 7.6 | 6.7 |
Pfizer, Inc. | 7.5 | 0.5 |
Merck & Co., Inc. | 5.3 | 3.9 |
Gilead Sciences, Inc. | 4.9 | 4.1 |
UnitedHealth Group, Inc. | 4.8 | 4.1 |
Eli Lilly & Co. | 3.9 | 1.3 |
Catamaran Corp. | 3.2 | 1.1 |
Johnson & Johnson | 3.1 | 0.0 |
Watson Pharmaceuticals, Inc. | 2.9 | 1.0 |
Biogen Idec, Inc. | 2.3 | 2.7 |
| 45.5 | |
Top Industries (% of fund's net assets) |
As of July 31, 2012 |
| Pharmaceuticals | 30.5% | |
| Biotechnology | 28.6% | |
| Health Care
Providers & Services | 21.7% | |
| Health Care
Equipment & Supplies | 8.9% | |
| Health Care Technology | 3.5% | |
| All Others* | 6.8% | |

As of January 31, 2012 |
| Health Care
Providers & Services | 31.5% | |
| Biotechnology | 26.8% | |
| Pharmaceuticals | 19.0% | |
| Health Care
Equipment & Supplies | 12.8% | |
| Food & Staples Retailing | 2.1% | |
| All Others* | 7.8% | |

* Includes short-term investments and net other assets. |
Annual Report
Fidelity Advisor Health Care Fund
Investments July 31, 2012
Showing Percentage of Net Assets
Common Stocks - 98.1% |
| Shares | | Value |
BIOTECHNOLOGY - 28.6% |
Biotechnology - 28.6% |
Achillion Pharmaceuticals, Inc. (a)(d) | 210,600 | | $ 1,394,172 |
Acorda Therapeutics, Inc. (a) | 64,527 | | 1,553,165 |
Alexion Pharmaceuticals, Inc. (a) | 19,271 | | 2,020,564 |
AMAG Pharmaceuticals, Inc. (a) | 32,589 | | 504,478 |
Amgen, Inc. | 448,365 | | 37,034,947 |
ARIAD Pharmaceuticals, Inc. (a) | 141,600 | | 2,708,808 |
AVEO Pharmaceuticals, Inc. (a)(d) | 117,282 | | 1,536,395 |
Biogen Idec, Inc. (a) | 75,783 | | 11,051,435 |
BioMarin Pharmaceutical, Inc. (a) | 225,141 | | 8,845,790 |
Biovitrum AB (a) | 262,300 | | 917,962 |
Discovery Laboratories, Inc. (a)(d) | 370,419 | | 937,160 |
Dynavax Technologies Corp. (a) | 822,100 | | 3,173,306 |
Gilead Sciences, Inc. (a) | 434,467 | | 23,604,592 |
Grifols SA ADR (d) | 152,150 | | 3,395,988 |
Infinity Pharmaceuticals, Inc. (a) | 109,600 | | 1,913,616 |
Lexicon Pharmaceuticals, Inc. (a) | 390,000 | | 943,800 |
Medivation, Inc. (a) | 52,170 | | 5,201,349 |
Merrimack Pharmaceuticals, Inc. | 8,300 | | 66,151 |
Merrimack Pharmaceuticals, Inc. (e) | 80,373 | | 576,516 |
Momenta Pharmaceuticals, Inc. (a) | 65,500 | | 931,410 |
Neurocrine Biosciences, Inc. (a) | 197,518 | | 1,501,137 |
NPS Pharmaceuticals, Inc. (a) | 212,800 | | 1,640,688 |
Onyx Pharmaceuticals, Inc. (a) | 45,100 | | 3,381,147 |
Progenics Pharmaceuticals, Inc. (a) | 66,100 | | 344,381 |
Rigel Pharmaceuticals, Inc. (a) | 100,000 | | 1,094,000 |
Seattle Genetics, Inc. (a)(d) | 87,857 | | 2,298,339 |
Spectrum Pharmaceuticals, Inc. (a) | 111,000 | | 1,552,890 |
Synageva BioPharma Corp. (a) | 95,900 | | 4,800,754 |
Targacept, Inc. (a) | 217,115 | | 937,937 |
Theravance, Inc. (a)(d) | 120,100 | | 3,498,513 |
Thrombogenics NV (a) | 45,100 | | 1,455,530 |
United Therapeutics Corp. (a) | 60,904 | | 3,336,321 |
Vertex Pharmaceuticals, Inc. (a) | 65,700 | | 3,187,107 |
Vical, Inc. (a) | 279,000 | | 965,340 |
ZIOPHARM Oncology, Inc. (a) | 105,600 | | 594,528 |
| | 138,900,216 |
DIVERSIFIED CONSUMER SERVICES - 0.4% |
Specialized Consumer Services - 0.4% |
Carriage Services, Inc. | 221,955 | | 1,793,396 |
FOOD & STAPLES RETAILING - 1.4% |
Drug Retail - 1.4% |
CVS Caremark Corp. | 91,900 | | 4,158,475 |
Drogasil SA | 214,800 | | 2,452,821 |
| | 6,611,296 |
HEALTH CARE EQUIPMENT & SUPPLIES - 8.9% |
Health Care Equipment - 7.9% |
Boston Scientific Corp. (a) | 1,840,501 | | 9,515,390 |
|
| Shares | | Value |
C.R. Bard, Inc. | 65,000 | | $ 6,321,900 |
Conceptus, Inc. (a) | 79,600 | | 1,478,968 |
CONMED Corp. | 56,000 | | 1,536,640 |
Covidien PLC | 65,196 | | 3,643,152 |
Genmark Diagnostics, Inc. (a) | 11,000 | | 62,150 |
HeartWare International, Inc. (a) | 42,000 | | 3,750,180 |
Hill-Rom Holdings, Inc. | 58,993 | | 1,542,667 |
Insulet Corp. (a) | 114,200 | | 2,233,752 |
Opto Circuits India Ltd. | 278,968 | | 772,484 |
Volcano Corp. (a) | 65,900 | | 1,743,055 |
William Demant Holding A/S (a) | 19,063 | | 1,801,295 |
Wright Medical Group, Inc. (a) | 128,234 | | 2,390,282 |
Zeltiq Aesthetics, Inc. | 205,900 | | 1,058,326 |
Zimmer Holdings, Inc. | 13,200 | | 777,876 |
| | 38,628,117 |
Health Care Supplies - 1.0% |
The Cooper Companies, Inc. | 65,050 | | 4,895,663 |
TOTAL HEALTH CARE EQUIPMENT & SUPPLIES | | 43,523,780 |
HEALTH CARE PROVIDERS & SERVICES - 21.7% |
Health Care Distributors & Services - 0.9% |
Amplifon SpA | 365,025 | | 1,358,159 |
McKesson Corp. | 32,820 | | 2,977,759 |
| | 4,335,918 |
Health Care Facilities - 1.9% |
Brookdale Senior Living, Inc. (a) | 173,672 | | 2,858,641 |
Emeritus Corp. (a) | 97,675 | | 1,655,591 |
Hanger, Inc. (a) | 65,665 | | 1,692,187 |
LCA-Vision, Inc. (a) | 196,700 | | 694,351 |
Sunrise Senior Living, Inc. (a)(d) | 367,909 | | 2,457,632 |
| | 9,358,402 |
Health Care Services - 9.4% |
Accretive Health, Inc. (a) | 124,845 | | 1,695,395 |
Catamaran Corp. (a) | 180,446 | | 15,326,709 |
Express Scripts Holding Co. (a) | 92,856 | | 5,380,077 |
Fresenius Medical Care AG & Co. KGaA | 61,213 | | 4,424,960 |
HMS Holdings Corp. (a) | 87,400 | | 3,007,434 |
MEDNAX, Inc. (a) | 113,500 | | 7,505,755 |
Omnicare, Inc. | 71,426 | | 2,243,491 |
Quest Diagnostics, Inc. | 109,248 | | 6,383,361 |
| | 45,967,182 |
Managed Health Care - 9.5% |
Aetna, Inc. | 130,500 | | 4,705,830 |
Centene Corp. (a) | 42,300 | | 1,609,092 |
CIGNA Corp. | 70,300 | | 2,831,684 |
Health Net, Inc. (a) | 217,100 | | 4,780,542 |
Humana, Inc. | 77,926 | | 4,800,242 |
UnitedHealth Group, Inc. | 455,523 | | 23,272,670 |
Common Stocks - continued |
| Shares | | Value |
HEALTH CARE PROVIDERS & SERVICES - CONTINUED |
Managed Health Care - continued |
Universal American Spin Corp. (a) | 66,000 | | $ 591,360 |
WellPoint, Inc. | 64,600 | | 3,442,534 |
| | 46,033,954 |
TOTAL HEALTH CARE PROVIDERS & SERVICES | | 105,695,456 |
HEALTH CARE TECHNOLOGY - 3.0% |
Health Care Technology - 3.0% |
athenahealth, Inc. (a) | 49,000 | | 4,483,500 |
Cerner Corp. (a) | 118,400 | | 8,752,128 |
HealthStream, Inc. (a) | 49,100 | | 1,371,854 |
| | 14,607,482 |
IT SERVICES - 0.7% |
IT Consulting & Other Services - 0.7% |
Maximus, Inc. | 63,190 | | 3,191,095 |
LIFE SCIENCES TOOLS & SERVICES - 0.7% |
Life Sciences Tools & Services - 0.7% |
Furiex Pharmaceuticals, Inc. (a) | 52,200 | | 1,003,284 |
Illumina, Inc. (a)(d) | 57,471 | | 2,383,322 |
| | 3,386,606 |
PERSONAL PRODUCTS - 0.6% |
Personal Products - 0.6% |
Prestige Brands Holdings, Inc. (a) | 171,172 | | 2,808,933 |
PHARMACEUTICALS - 30.5% |
Pharmaceuticals - 30.5% |
Cadence Pharmaceuticals, Inc. (a)(d) | 307,762 | | 1,304,911 |
Elan Corp. PLC sponsored ADR (a) | 317,500 | | 3,667,125 |
Eli Lilly & Co. | 429,600 | | 18,915,288 |
Endo Pharmaceuticals Holdings, Inc. (a) | 129,900 | | 3,861,927 |
Hi-Tech Pharmacal Co., Inc. (a) | 10,100 | | 347,036 |
Johnson & Johnson | 217,200 | | 15,034,584 |
Meda AB (A Shares) | 216,600 | | 2,052,726 |
Merck & Co., Inc. | 586,095 | | 25,887,816 |
Optimer Pharmaceuticals, Inc. (a)(d) | 171,954 | | 2,348,892 |
Pacira Pharmaceuticals, Inc. (a) | 54,500 | | 834,395 |
Pfizer, Inc. | 1,519,488 | | 36,528,492 |
Shire PLC sponsored ADR | 86,700 | | 7,471,806 |
UCB SA | 39,200 | | 1,965,923 |
Valeant Pharmaceuticals International, Inc. (Canada) (a) | 162,804 | | 7,759,915 |
ViroPharma, Inc. (a) | 241,100 | | 5,234,281 |
Watson Pharmaceuticals, Inc. (a) | 178,440 | | 13,887,985 |
XenoPort, Inc. (a) | 139,500 | | 1,099,260 |
| | 148,202,362 |
|
| Shares | | Value |
PROFESSIONAL SERVICES - 1.2% |
Research & Consulting Services - 1.2% |
Advisory Board Co. (a) | 60,500 | | $ 2,721,895 |
Qualicorp SA (a) | 349,000 | | 3,108,164 |
| | 5,830,059 |
SOFTWARE - 0.4% |
Application Software - 0.4% |
Nuance Communications, Inc. (a) | 97,700 | | 1,988,195 |
TOTAL COMMON STOCKS (Cost $407,645,739) |
476,538,876
|
Convertible Preferred Stocks - 0.5% |
| | | |
HEALTH CARE TECHNOLOGY - 0.5% |
Health Care Technology - 0.5% |
Castlight Health, Inc. Series D (a)(e)
(Cost $2,033,113) | 336,800 | |
2,357,600
|
Money Market Funds - 5.4% |
| | | |
Fidelity Cash Central Fund, 0.17% (b) | 12,320,233 | | 12,320,233 |
Fidelity Securities Lending Cash Central Fund, 0.18% (b)(c) | 14,089,821 | | 14,089,821 |
TOTAL MONEY MARKET FUNDS (Cost $26,410,054) |
26,410,054
|
TOTAL INVESTMENT PORTFOLIO - 104.0% (Cost $436,088,906) | | 505,306,530 |
NET OTHER ASSETS (LIABILITIES) - (4.0)% | | (19,247,900) |
NET ASSETS - 100% | $ 486,058,630 |
Legend |
(a) Non-income producing |
(b) Affiliated fund that is available only to investment companies and other accounts managed by Fidelity Investments. The rate quoted is the annualized seven-day yield of the fund at period end. A complete unaudited listing of the fund's holdings as of its most recent quarter end is available upon request. In addition, each Fidelity Central Fund's financial statements, which are not covered by the Fund's Report of Independent Registered Public Accounting Firm, are available on the SEC's website or upon request. |
(c) Investment made with cash collateral received from securities on loan. |
(d) Security or a portion of the security is on loan at period end. |
(e) Restricted securities - Investment in securities not registered under the Securities Act of 1933 (excluding 144A issues). At the end of the period, the value of restricted securities (excluding 144A issues) amounted to $2,934,116 or 0.6% of net assets. |
Additional information on each restricted holding is as follows: |
Security | Acquisition Date | Acquisition Cost |
Castlight Health, Inc. Series D | 4/25/12 | $ 2,033,113 |
Merrimack Pharmaceuticals, Inc. | 3/31/11 | $ 562,611 |
Affiliated Central Funds |
Information regarding fiscal year to date income earned by the Fund from investments in Fidelity Central Funds is as follows: |
Fund | Income earned |
Fidelity Cash Central Fund | $ 22,858 |
Fidelity Securities Lending Cash Central Fund | 105,759 |
Total | $ 128,617 |
Other Information |
The following is a summary of the inputs used, as of July 31, 2012, involving the Fund's assets and liabilities carried at fair value. The inputs or methodology used for valuing securities may not be an indication of the risk associated with investing in those securities. For more information on valuation inputs, and their aggregation into the levels used in the table below, please refer to the Security Valuation section in the accompanying Notes to Financial Statements. |
Valuation Inputs at Reporting Date: |
Description | Total | Level 1 | Level 2 | Level 3 |
Investments in Securities: | | | | |
Common Stocks | $ 476,538,876 | $ 471,537,400 | $ 5,001,476 | $ - |
Convertible Preferred Stocks | 2,357,600 | - | - | 2,357,600 |
Money Market Funds | 26,410,054 | 26,410,054 | - | - |
Total Investments in Securities: | $ 505,306,530 | $ 497,947,454 | $ 5,001,476 | $ 2,357,600 |
Distribution of investments by country or territory of incorporation, as a percentage of total net assets, is as follows. (Unaudited) |
United States of America | 87.4% |
Canada | 4.8% |
Bailiwick of Jersey | 1.5% |
Ireland | 1.4% |
Brazil | 1.1% |
Others (Individually Less Than 1%) | 3.8% |
| 100.0% |
See accompanying notes which are an integral part of the financial statements.
Annual Report
Fidelity Advisor Health Care Fund
Statement of Assets and Liabilities
| July 31, 2012 |
| | |
Assets | | |
Investment in securities, at value (including securities loaned of $13,556,580) - See accompanying schedule: Unaffiliated issuers (cost $409,678,852) | $ 478,896,476 | |
Fidelity Central Funds (cost $26,410,054) | 26,410,054 | |
Total Investments (cost $436,088,906) | | $ 505,306,530 |
Receivable for investments sold | | 6,800,694 |
Receivable for fund shares sold | | 338,012 |
Dividends receivable | | 56,993 |
Distributions receivable from Fidelity Central Funds | | 14,622 |
Other receivables | | 11,257 |
Total assets | | 512,528,108 |
| | |
Liabilities | | |
Payable for investments purchased | $ 10,132,067 | |
Payable for fund shares redeemed | 1,670,121 | |
Accrued management fee | 228,342 | |
Distribution and service plan fees payable | 178,054 | |
Other affiliated payables | 127,434 | |
Other payables and accrued expenses | 43,639 | |
Collateral on securities loaned, at value | 14,089,821 | |
Total liabilities | | 26,469,478 |
| | |
Net Assets | | $ 486,058,630 |
Net Assets consist of: | | |
Paid in capital | | $ 379,366,668 |
Accumulated net investment loss | | (849,653) |
Accumulated undistributed net realized gain (loss) on investments and foreign currency transactions | | 38,324,765 |
Net unrealized appreciation (depreciation) on investments and assets and liabilities in foreign currencies | | 69,216,850 |
Net Assets | | $ 486,058,630 |
Statement of Assets and Liabilities - continued
| July 31, 2012 |
| | |
Calculation of Maximum Offering Price Class A:
Net Asset Value and redemption price per share ($233,187,940 ÷ 9,577,063 shares) | | $ 24.35 |
| | |
Maximum offering price per share (100/94.25 of $24.35) | | $ 25.84 |
Class T:
Net Asset Value and redemption price per share ($117,968,719 ÷ 5,037,302 shares) | | $ 23.42 |
| | |
Maximum offering price per share (100/96.50 of $23.42) | | $ 24.27 |
Class B:
Net Asset Value and offering price per share ($15,402,854 ÷ 714,828 shares)A | | $ 21.55 |
| | |
Class C:
Net Asset Value and offering price per share ($78,762,566 ÷ 3,661,365 shares)A | | $ 21.51 |
| | |
Institutional Class:
Net Asset Value, offering price and redemption price per share ($40,736,551 ÷ 1,591,486 shares) | | $ 25.60 |
A Redemption price per share is equal to net asset value less any applicable contingent deferred sales charge.
See accompanying notes which are an integral part of the financial statements.
Annual Report
Fidelity Advisor Health Care Fund
Financial Statements - continued
Statement of Operations
| Year ended July 31, 2012 |
| | |
Investment Income | | |
Dividends | | $ 4,419,501 |
Income from Fidelity Central Funds | | 128,617 |
Total income | | 4,548,118 |
| | |
Expenses | | |
Management fee | $ 2,536,733 | |
Transfer agent fees | 1,310,614 | |
Distribution and service plan fees | 2,008,334 | |
Accounting and security lending fees | 179,978 | |
Custodian fees and expenses | 32,460 | |
Independent trustees' compensation | 3,058 | |
Registration fees | 81,929 | |
Audit | 51,857 | |
Legal | 2,274 | |
Miscellaneous | 4,278 | |
Total expenses before reductions | 6,211,515 | |
Expense reductions | (38,395) | 6,173,120 |
Net investment income (loss) | | (1,625,002) |
Realized and Unrealized Gain (Loss) Net realized gain (loss) on: | | |
Investment securities: | | |
Unaffiliated issuers | 42,656,991 | |
Foreign currency transactions | (91,386) | |
Total net realized gain (loss) | | 42,565,605 |
Change in net unrealized appreciation (depreciation) on: Investment securities | (11,611,030) | |
Assets and liabilities in foreign currencies | (5,294) | |
Total change in net unrealized appreciation (depreciation) | | (11,616,324) |
Net gain (loss) | | 30,949,281 |
Net increase (decrease) in net assets resulting from operations | | $ 29,324,279 |
Statement of Changes in Net Assets
| Year ended
July 31,
2012 | Year ended
July 31,
2011 |
Increase (Decrease) in Net Assets | | |
Operations | | |
Net investment income (loss) | $ (1,625,002) | $ (2,816,326) |
Net realized gain (loss) | 42,565,605 | 84,545,757 |
Change in net unrealized appreciation (depreciation) | (11,616,324) | 41,597,148 |
Net increase (decrease) in net assets resulting from operations | 29,324,279 | 123,326,579 |
Distributions to shareholders from net realized gain | (49,973,824) | - |
Share transactions - net increase (decrease) | 14,972,155 | (10,714,611) |
Redemption fees | 69,585 | 9,972 |
Total increase (decrease) in net assets | (5,607,805) | 112,621,940 |
| | |
Net Assets | | |
Beginning of period | 491,666,435 | 379,044,495 |
End of period (including accumulated net investment loss of $849,653 and accumulated net investment loss of $43,728, respectively) | $ 486,058,630 | $ 491,666,435 |
See accompanying notes which are an integral part of the financial statements.
Annual Report
Financial Highlights - Class A
Years ended July 31, | 2012 | 2011 | 2010 | 2009 | 2008 |
Selected Per-Share Data | | | | | |
Net asset value, beginning of period | $ 25.60 | $ 19.01 | $ 17.15 | $ 19.72 | $ 22.90 |
Income from Investment Operations | | | | | |
Net investment income (loss) C | (.04) | (.10) | (.07) | .02 | (.03) |
Net realized and unrealized gain (loss) | 1.43 | 6.69 | 1.93 | (2.22) | (1.08) |
Total from investment operations | 1.39 | 6.59 | 1.86 | (2.20) | (1.11) |
Distributions from net realized gain | (2.64) | - | - | (.37) | (2.07) |
Redemption fees added to paid in capital C, G | - | - | - | - | - |
Net asset value, end of period | $ 24.35 | $ 25.60 | $ 19.01 | $ 17.15 | $ 19.72 |
Total Return A, B | 7.58% | 34.67% | 10.85% | (11.37)% | (5.64)% |
Ratios to Average Net Assets D, F | | | | | |
Expenses before reductions | 1.19% | 1.19% | 1.22% | 1.23% | 1.20% |
Expenses net of fee waivers, if any | 1.19% | 1.19% | 1.22% | 1.23% | 1.20% |
Expenses net of all reductions | 1.18% | 1.18% | 1.21% | 1.23% | 1.19% |
Net investment income (loss) | (.18)% | (.43)% | (.36)% | .11% | (.13)% |
Supplemental Data | | | | | |
Net assets, end of period (000 omitted) | $ 233,188 | $ 224,704 | $ 179,586 | $ 177,890 | $ 220,888 |
Portfolio turnover rate E | 124% | 125% | 103% | 172% | 134% |
A Total returns would have been lower if certain expenses had not been reduced during the applicable periods shown.
B Total returns do not include the effect of the sales charges.
C Calculated based on average shares outstanding during the period.
D Fees and expenses of any underlying Fidelity Central Funds are not included in the Fund's expense ratio. The Fund indirectly bears its proportionate share of the expenses of any underlying Fidelity Central Funds.
E Amount does not include the portfolio activity of any underlying Fidelity Central Funds.
F Expense ratios reflect operating expenses of the class. Expenses before reductions do not reflect amounts reimbursed by the investment adviser or reductions from brokerage service arrangements or reductions from other expense offset arrangements and do not represent the amount paid by the class during periods when reimbursements or reductions occur. Expenses net of fee waivers reflect expenses after reimbursement by the investment adviser but prior to reductions from brokerage service arrangements or other expense offset arrangements. Expenses net of all reductions represent the net expenses paid by the class.
G Amount represents less than $.01 per share.
Financial Highlights - Class T
Years ended July 31, | 2012 | 2011 | 2010 | 2009 | 2008 |
Selected Per-Share Data | | | | | |
Net asset value, beginning of period | $ 24.80 | $ 18.46 | $ 16.69 | $ 19.26 | $ 22.39 |
Income from Investment Operations | | | | | |
Net investment income (loss) C | (.09) | (.16) | (.12) | (.02) | (.08) |
Net realized and unrealized gain (loss) | 1.35 | 6.50 | 1.89 | (2.18) | (1.06) |
Total from investment operations | 1.26 | 6.34 | 1.77 | (2.20) | (1.14) |
Distributions from net realized gain | (2.64) | - | - | (.37) | (1.99) |
Redemption fees added to paid in capital C, G | - | - | - | - | - |
Net asset value, end of period | $ 23.42 | $ 24.80 | $ 18.46 | $ 16.69 | $ 19.26 |
Total Return A, B | 7.27% | 34.34% | 10.61% | (11.65)% | (5.86)% |
Ratios to Average Net Assets D, F | | | | | |
Expenses before reductions | 1.43% | 1.44% | 1.47% | 1.49% | 1.46% |
Expenses net of fee waivers, if any | 1.43% | 1.44% | 1.47% | 1.49% | 1.46% |
Expenses net of all reductions | 1.43% | 1.43% | 1.46% | 1.49% | 1.45% |
Net investment income (loss) | (.42)% | (.69)% | (.62)% | (.15)% | (.40)% |
Supplemental Data | | | | | |
Net assets, end of period (000 omitted) | $ 117,969 | $ 123,606 | $ 100,883 | $ 103,772 | $ 143,237 |
Portfolio turnover rate E | 124% | 125% | 103% | 172% | 134% |
A Total returns would have been lower if certain expenses had not been reduced during the applicable periods shown.
B Total returns do not include the effect of the sales charges.
C Calculated based on average shares outstanding during the period.
D Fees and expenses of any underlying Fidelity Central Funds are not included in the Fund's expense ratio. The Fund indirectly bears its proportionate share of the expenses of any underlying Fidelity Central Funds.
E Amount does not include the portfolio activity of any underlying Fidelity Central Funds.
F Expense ratios reflect operating expenses of the class. Expenses before reductions do not reflect amounts reimbursed by the investment adviser or reductions from brokerage service arrangements or reductions from other expense offset arrangements and do not represent the amount paid by the class during periods when reimbursements or reductions occur. Expenses net of fee waivers reflect expenses after reimbursement by the investment adviser but prior to reductions from brokerage service arrangements or other expense offset arrangements. Expenses net of all reductions represent the net expenses paid by the class.
G Amount represents less than $.01 per share.
See accompanying notes which are an integral part of the financial statements.
Annual Report
Financial Highlights - Class B
Years ended July 31, | 2012 | 2011 | 2010 | 2009 | 2008 |
Selected Per-Share Data | | | | | |
Net asset value, beginning of period | $ 23.15 | $ 17.32 | $ 15.74 | $ 18.27 | $ 21.29 |
Income from Investment Operations | | | | | |
Net investment income (loss) C | (.19) | (.25) | (.20) | (.09) | (.18) |
Net realized and unrealized gain (loss) | 1.23 | 6.08 | 1.78 | (2.07) | (.99) |
Total from investment operations | 1.04 | 5.83 | 1.58 | (2.16) | (1.17) |
Distributions from net realized gain | (2.64) | - | - | (.37) | (1.85) |
Redemption fees added to paid in capital C, G | - | - | - | - | - |
Net asset value, end of period | $ 21.55 | $ 23.15 | $ 17.32 | $ 15.74 | $ 18.27 |
Total Return A, B | 6.78% | 33.66% | 10.04% | (12.07)% | (6.30)% |
Ratios to Average Net Assets D, F | | | | | |
Expenses before reductions | 1.94% | 1.94% | 1.97% | 1.98% | 1.95% |
Expenses net of fee waivers, if any | 1.94% | 1.94% | 1.97% | 1.98% | 1.95% |
Expenses net of all reductions | 1.93% | 1.93% | 1.96% | 1.98% | 1.94% |
Net investment income (loss) | (.93)% | (1.19)% | (1.11)% | (.64)% | (.89)% |
Supplemental Data | | | | | |
Net assets, end of period (000 omitted) | $ 15,403 | $ 20,365 | $ 23,543 | $ 29,381 | $ 55,589 |
Portfolio turnover rate E | 124% | 125% | 103% | 172% | 134% |
A Total returns would have been lower if certain expenses had not been reduced during the applicable periods shown.
B Total returns do not include the effect of the contingent deferred sales charge.
C Calculated based on average shares outstanding during the period.
D Fees and expenses of any underlying Fidelity Central Funds are not included in the Fund's expense ratio. The Fund indirectly bears its proportionate share of the expenses of any underlying Fidelity Central Funds.
E Amount does not include the portfolio activity of any underlying Fidelity Central Funds.
F Expense ratios reflect operating expenses of the class. Expenses before reductions do not reflect amounts reimbursed by the investment adviser or reductions from brokerage service arrangements or reductions from other expense offset arrangements and do not represent the amount paid by the class during periods when reimbursements or reductions occur. Expenses net of fee waivers reflect expenses after reimbursement by the investment adviser but prior to reductions from brokerage service arrangements or other expense offset arrangements. Expenses net of all reductions represent the net expenses paid by the class.
G Amount represents less than $.01 per share.
Financial Highlights - Class C
Years ended July 31, | 2012 | 2011 | 2010 | 2009 | 2008 |
Selected Per-Share Data | | | | | |
Net asset value, beginning of period | $ 23.11 | $ 17.29 | $ 15.70 | $ 18.23 | $ 21.29 |
Income from Investment Operations | | | | | |
Net investment income (loss) C | (.18) | (.24) | (.19) | (.09) | (.17) |
Net realized and unrealized gain (loss) | 1.22 | 6.06 | 1.78 | (2.07) | (1.00) |
Total from investment operations | 1.04 | 5.82 | 1.59 | (2.16) | (1.17) |
Distributions from net realized gain | (2.64) | - | - | (.37) | (1.89) |
Redemption fees added to paid in capital C, G | - | - | - | - | - |
Net asset value, end of period | $ 21.51 | $ 23.11 | $ 17.29 | $ 15.70 | $ 18.23 |
Total Return A, B | 6.80% | 33.66% | 10.13% | (12.09)% | (6.31)% |
Ratios to Average Net Assets D, F | | | | | |
Expenses before reductions | 1.90% | 1.90% | 1.94% | 1.98% | 1.94% |
Expenses net of fee waivers, if any | 1.90% | 1.90% | 1.94% | 1.98% | 1.94% |
Expenses net of all reductions | 1.89% | 1.89% | 1.93% | 1.98% | 1.94% |
Net investment income (loss) | (.89)% | (1.15)% | (1.08)% | (.64)% | (.88)% |
Supplemental Data | | | | | |
Net assets, end of period (000 omitted) | $ 78,763 | $ 77,749 | $ 60,861 | $ 64,002 | $ 83,133 |
Portfolio turnover rate E | 124% | 125% | 103% | 172% | 134% |
A Total returns would have been lower if certain expenses had not been reduced during the applicable periods shown.
B Total returns do not include the effect of the contingent deferred sales charge.
C Calculated based on average shares outstanding during the period.
D Fees and expenses of any underlying Fidelity Central Funds are not included in the Fund's expense ratio. The Fund indirectly bears its proportionate share of the expenses of any underlying Fidelity Central Funds.
E Amount does not include the portfolio activity of any underlying Fidelity Central Funds.
F Expense ratios reflect operating expenses of the class. Expenses before reductions do not reflect amounts reimbursed by the investment adviser or reductions from brokerage service arrangements or reductions from other expense offset arrangements and do not represent the amount paid by the class during periods when reimbursements or reductions occur. Expenses net of fee waivers reflect expenses after reimbursement by the investment adviser but prior to reductions from brokerage service arrangements or other expense offset arrangements. Expenses net of all reductions represent the net expenses paid by the class.
G Amount represents less than $.01 per share.
See accompanying notes which are an integral part of the financial statements.
Annual Report
Financial Highlights - Institutional Class
Years ended July 31, | 2012 | 2011 | 2010 | 2009 | 2008 |
Selected Per-Share Data | | | | | |
Net asset value, beginning of period | $ 26.69 | $ 19.77 | $ 17.78 | $ 20.39 | $ 23.62 |
Income from Investment Operations | | | | | |
Net investment income (loss) B | .03 | (.03) | (.02) | .06 | .03 |
Net realized and unrealized gain (loss) | 1.52 | 6.95 | 2.01 | (2.30) | (1.12) |
Total from investment operations | 1.55 | 6.92 | 1.99 | (2.24) | (1.09) |
Distributions from net realized gain | (2.64) | - | - | (.37) | (2.14) |
Redemption fees added to paid in capital B, F | - | - | - | - | - |
Net asset value, end of period | $ 25.60 | $ 26.69 | $ 19.77 | $ 17.78 | $ 20.39 |
Total Return A | 7.91% | 35.00% | 11.19% | (11.19)% | (5.36)% |
Ratios to Average Net Assets C, E | | | | | |
Expenses before reductions | .89% | .89% | .96% | .98% | .93% |
Expenses net of fee waivers, if any | .89% | .89% | .96% | .98% | .93% |
Expenses net of all reductions | .88% | .88% | .95% | .98% | .92% |
Net investment income (loss) | .12% | (.13)% | (.10)% | .36% | .14% |
Supplemental Data | | | | | |
Net assets, end of period (000 omitted) | $ 40,737 | $ 45,243 | $ 14,172 | $ 13,452 | $ 18,825 |
Portfolio turnover rate D | 124% | 125% | 103% | 172% | 134% |
A Total returns would have been lower if certain expenses had not been reduced during the applicable periods shown.
B Calculated based on average shares outstanding during the period.
C Fees and expenses of any underlying Fidelity Central Funds are not included in the Fund's expense ratio. The Fund indirectly bears its proportionate share of the expenses of any underlying Fidelity Central Funds.
D Amount does not include the portfolio activity of any underlying Fidelity Central Funds.
E Expense ratios reflect operating expenses of the class. Expenses before reductions do not reflect amounts reimbursed by the investment adviser or reductions from brokerage service arrangements or reductions from other expense offset arrangements and do not represent the amount paid by the class during periods when reimbursements or reductions occur. Expenses net of fee waivers reflect expenses after reimbursement by the investment adviser but prior to reductions from brokerage service arrangements or other expense offset arrangements. Expenses net of all reductions represent the net expenses paid by the class.
F Amount represents less than $.01 per share.
See accompanying notes which are an integral part of the financial statements.
Annual Report
Fidelity Advisor Health Care Fund
Notes to Financial Statements
For the period ended July 31, 2012
1. Organization.
Fidelity Advisor Health Care Fund (the Fund) is a fund of Fidelity Advisor Series VII (the Trust) and is authorized to issue an unlimited number of shares. The Trust is registered under the Investment Company Act of 1940, as amended (the 1940 Act), as an open-end management investment company organized as a Massachusetts business trust. The Fund offers Class A, Class T, Class C, and Institutional Class shares, each of which, along with Class B shares, has equal rights as to assets and voting privileges. Effective after the close of business on September 1, 2010, Class B shares were closed to new accounts and additional purchases, except for exchanges and reinvestments. Each class has exclusive voting rights with respect to matters that affect that class. Class B shares will automatically convert to Class A shares after a holding period of seven years from the initial date of purchase. Investment income, realized and unrealized capital gains and losses, the common expenses of the Fund, and certain fund-level expense reductions, if any, are allocated on a pro-rata basis to each class based on the relative net assets of each class to the total net assets of the Fund. Each class differs with respect to transfer agent and distribution and service plan fees incurred. Certain expense reductions may also differ by class.
2. Investments in Fidelity Central Funds.
The Fund invests in Fidelity Central Funds, which are open-end investment companies available only to other investment companies and accounts managed by Fidelity Management & Research Company (FMR) and its affiliates. The Fund's Schedule of Investments lists each of the Fidelity Central Funds held as of period end, if any, as an investment of the Fund, but does not include the underlying holdings of each Fidelity Central Fund. As an Investing Fund, the Fund indirectly bears its proportionate share of the expenses of the underlying Fidelity Central Funds.
The Money Market Central Funds seek preservation of capital and current income and are managed by Fidelity Investments Money Management, Inc. (FIMM), an affiliate of FMR.
A complete unaudited list of holdings for each Fidelity Central Fund is available upon request or at the Securities and Exchange Commission (the SEC) web site at www.sec.gov. In addition, the financial statements of the Fidelity Central Funds, which are not covered by the Fund's Report of Independent Registered Public Accounting Firm, are available on the SEC web site or upon request.
3. Significant Accounting Policies.
The financial statements have been prepared in conformity with accounting principles generally accepted in the United States of America (GAAP), which require management to make certain estimates and assumptions at the date of the financial statements. Actual results could differ from those estimates. Subsequent events, if any, through the date that the financial statements were issued have been evaluated in the preparation of the financial statements. The following summarizes the significant accounting policies of the Fund:
Security Valuation. Investments are valued as of 4:00 p.m. Eastern time on the last calendar day of the period. In accordance with valuation policies and procedures approved by the Board of Trustees (the Board), the Fund attempts to obtain prices from one or more third party pricing vendor or broker to value its investments. When current market prices, quotations or rates are not readily available or reliable, securities will be fair valued in good faith by the FMR Fair Value Committee (the Committee), in accordance with procedures adopted by the Fund's Board. Factors used in determining fair value vary by security type and may include market or security specific events. The frequency with which these procedures are used cannot be predicted and they may be utilized to a significant extent. The Committee oversees the Fund's valuation policies and procedures and is responsible for approving and reporting to the Board all fair value determinations.
The Fund categorizes the inputs to valuation techniques used to value its investments into a disclosure hierarchy consisting of three levels as shown below:
Level 1 - quoted prices in active markets for identical investments
Level 2 - other significant observable inputs (including quoted prices for similar investments, interest rates, prepayment speeds, etc.)
Level 3 - unobservable inputs (including the Fund's own assumptions based on the best information available)
Valuation techniques used to value the Fund's investments by major category are as follows:
Equity securities, including restricted securities, for which market quotations are readily available, are valued at the last reported sale price or official closing price as reported by a third party pricing vendor on the primary market or exchange on which they are traded and are categorized as Level 1 in the hierarchy. In the event there were no sales during the day or closing prices are not available, securities are valued at the last quoted bid price or may be valued using the last available price and are generally categorized as Level 2 in the hierarchy. For foreign equity securities, when significant market or security specific events arise, comparisons to the valuation of American Depositary Receipts (ADRs), futures contracts, Exchange-Traded Funds (ETFs) and certain indexes as well as quoted prices for similar securities are used and are categorized as Level 2 in the hierarchy. Utilizing these techniques may result in transfers between Level 1 and Level 2. For restricted equity securities and private placements where observable inputs are limited, assumptions about market activity and risk are used and these securities are categorized as Level 3 in the hierarchy.
Annual Report
3. Significant Accounting Policies - continued
Security Valuation - continued
Investments in open-end mutual funds, including the Fidelity Central Funds, are valued at their closing net asset value each business day and are categorized as Level 1 in the hierarchy.
Changes in valuation techniques may result in transfers in or out of an assigned level within the disclosure hierarchy. The aggregate value of investments by input level, as of July 31, 2012, is included at the end of the Fund's Schedule of Investments.
Foreign Currency Translation. The Fund may use foreign currency contracts to facilitate transactions in foreign-denominated securities. Gains and losses from these transactions may arise from changes in the value of the foreign currency or if the counterparties do not perform under the contracts' terms.
Foreign-denominated assets, including investment securities, and liabilities are translated into U.S. dollars at the exchange rates at period end. Purchases and sales of investment securities, income and dividends received and expenses denominated in foreign currencies are translated into U.S. dollars at the exchange rate in effect on the transaction date.
The effects of exchange rate fluctuations on investments are included with the net realized and unrealized gain (loss) on investment securities. Other foreign currency transactions resulting in realized and unrealized gain (loss) are disclosed separately.
Investment Transactions and Income. For financial reporting purposes, the Fund's investment holdings and NAV include trades executed through the end of the last business day of the period. The NAV per share for processing shareholder transactions is calculated as of the close of business of the New York Stock Exchange (NYSE), normally 4:00 p.m. Eastern time and includes trades executed through the end of the prior business day. Gains and losses on securities sold are determined on the basis of identified cost and may include proceeds received from litigation. Dividend income is recorded on the ex-dividend date, except for certain dividends from foreign securities where the ex-dividend date may have passed, which are recorded as soon as the Fund is informed of the ex-dividend date. Non-cash dividends included in dividend income, if any, are recorded at the fair market value of the securities received. Distributions received on securities that represent a return of capital or capital gain are recorded as a reduction of cost of investments and/or as a realized gain. The Fund estimates the components of distributions received that may be considered return of capital distributions or capital gain distributions. Interest income and distributions from the Fidelity Central Funds are accrued as earned. Interest income includes coupon interest and amortization of premium and accretion of discount on debt securities. Investment income is recorded net of foreign taxes withheld where recovery of such taxes is uncertain.
Expenses. Expenses directly attributable to a fund are charged to that fund. Expenses attributable to more than one fund are allocated among the respective funds on the basis of relative net assets or other appropriate methods. Expense estimates are accrued in the period to which they relate and adjustments are made when actual amounts are known.
Income Tax Information and Distributions to Shareholders. Each year, the Fund intends to qualify as a regulated investment company under Subchapter M of the Internal Revenue Code, including distributing substantially all of its taxable income and realized gains. As a result, no provision for income taxes is required. As of July 31, 2012, the Fund did not have any unrecognized tax benefits in the financial statements; nor is the Fund aware of any tax positions for which it is reasonably possible that the total amounts of unrecognized tax benefits will significantly change in the next twelve months. The Fund files a U.S. federal tax return, in addition to state and local tax returns as required. A fund's federal income tax returns are subject to examination by the Internal Revenue Service (IRS) for a period of three fiscal years after they are filed. State and local tax returns may be subject to examination for an additional fiscal year depending on the jurisdiction. Foreign taxes are provided for based on the Fund's understanding of the tax rules and rates that exist in the foreign markets in which it invests.
Distributions are declared and recorded on the ex-dividend date. Income dividends and capital gain distributions are declared separately for each class. Income and capital gain distributions are determined in accordance with income tax regulations, which may differ from GAAP. In addition, the Fund claimed a portion of the payment made to redeeming shareholders as a distribution for income tax purposes.
Capital accounts within the financial statements are adjusted for permanent book-tax differences. These adjustments have no impact on net assets or the results of operations. Temporary book-tax differences will reverse in a subsequent period.
Book-tax differences are primarily due to foreign currency transactions, deferred trustees compensation, net operating losses and losses deferred due to wash sales and excise tax regulations.
Annual Report
Fidelity Advisor Health Care Fund
Notes to Financial Statements - continued
3. Significant Accounting Policies - continued
Income Tax Information and Distributions to Shareholders - continued
The federal tax cost of investment securities and unrealized appreciation (depreciation) as of period end were as follows:
Gross unrealized appreciation | $ 86,591,704 |
Gross unrealized depreciation | (18,346,447) |
Net unrealized appreciation (depreciation) on securities and other investments | $ 68,245,257 |
| |
Tax Cost | $ 437,061,273 |
The tax-based components of distributable earnings as of period end were as follows:
Undistributed long-term capital gain | $ 39,297,133 |
Net unrealized appreciation (depreciation) | $ 68,244,483 |
The tax character of distributions paid was as follows:
| July 31, 2012 | July 31, 2011 |
Long-term Capital Gains | $ 49,973,824 | $ - |
Short-Term Trading (Redemption) Fees. Shares held by investors in the Fund less than 30 days are subject to a redemption fee equal to .75% of the net asset value of shares redeemed. All redemption fees, which reduce the proceeds of the shareholder redemption, are retained by the Fund and accounted for as an addition to paid in capital.
New Accounting Pronouncement. In December 2011, the Financial Accounting Standards Board issued Accounting Standard Update No. 2011-11, Disclosures about Offsetting Assets and Liabilities. The update creates new disclosure requirements requiring entities to disclose both gross and net information for derivatives and other financial instruments that are either offset in the Statement of Assets and Liabilities or subject to an enforceable master netting arrangement or similar agreement. The disclosure requirements are effective for interim and annual reporting periods beginning on or after January 1, 2013. Management is currently evaluating the impact of the update's adoption on the Fund's financial statement disclosures.
4. Operating Policies.
Restricted Securities. The Fund may invest in securities that are subject to legal or contractual restrictions on resale. These securities generally may be resold in transactions exempt from registration or to the public if the securities are registered. Disposal of these securities may involve time-consuming negotiations and expense, and prompt sale at an acceptable price may be difficult. Information regarding restricted securities is included at the end of the Fund's Schedule of Investments.
5. Purchases and Sales of Investments.
Purchases and sales of securities, other than short-term securities, aggregated $554,995,838 and $588,629,052, respectively.
6. Fees and Other Transactions with Affiliates.
Management Fee. FMR and its affiliates provide the Fund with investment management related services for which the Fund pays a monthly management fee. The management fee is the sum of an individual fund fee rate that is based on an annual rate of .30% of the Fund's average net assets and an annualized group fee rate that averaged .26% during the period. The group fee rate is based upon the average net assets of all the mutual funds advised by FMR. The group fee rate decreases as assets under management increase and increases as assets under management decrease. For the period, the total annual management fee rate was .56% of the Fund's average net assets.
Distribution and Service Plan Fees. In accordance with Rule 12b-1 of the 1940 Act, the Fund has adopted separate Distribution and Service Plans for each class of shares. Certain classes pay Fidelity Distributors Corporation (FDC), an affiliate of FMR, separate Distribution and Service Fees, each of which is based on an annual percentage of each class' average net assets. In addition, FDC may pay financial intermediaries for selling shares of the Fund and providing shareholder support services. For the period, the Distribution and Service Fee rates, total fees and amounts retained by FDC were as follows:
Annual Report
6. Fees and Other Transactions with Affiliates - continued
Distribution and Service Plan Fees - continued
| Distribution
Fee | Service
Fee | Total Fees | Retained
by FDC |
Class A | -% | .25% | $ 537,320 | $ 1,123 |
Class T | .25% | .25% | 569,064 | 890 |
Class B | .75% | .25% | 167,239 | 125,852 |
Class C | .75% | .25% | 734,711 | 48,788 |
| | | $ 2,008,334 | $ 176,653 |
Sales Load. FDC may receive a front-end sales charge of up to 5.75% for selling Class A shares and 3.50% for selling Class T shares, some of which is paid to financial intermediaries for selling shares of the Fund. Depending on the holding period, FDC may receive contingent deferred sales charges levied on Class A, Class T, Class B, and Class C redemptions. The deferred sales charges range from 5.00% to 1.00% for Class B shares, 1.00% for Class C shares, 1.00% for certain purchases of Class A shares and .25% for certain purchases of Class T shares.
For the period, sales charge amounts retained by FDC were as follows:
| Retained
by FDC |
Class A | $ 54,936 |
Class T | 17,051 |
Class B* | 14,725 |
Class C* | 3,070 |
| $ 89,782 |
* When Class B and Class C shares are initially sold, FDC pays commissions from its own resources to financial intermediaries through which the sales are made.
Transfer Agent Fees. Fidelity Investments Institutional Operations Company, Inc. (FIIOC), an affiliate of FMR, is the transfer, dividend disbursing and shareholder servicing agent for each class of the Fund. FIIOC receives account fees and asset-based fees that vary according to the account size and type of account of the shareholders of the respective classes of the Fund. FIIOC pays for typesetting, printing and mailing of shareholder reports, except proxy statements. For the period, transfer agent fees for each class were as follows:
| Amount | % of
Average
Net Assets |
Class A | $ 640,462 | .30 |
Class T | 338,721 | .30 |
Class B | 50,327 | .30 |
Class C | 190,872 | .26 |
Institutional Class | 90,232 | .26 |
| $ 1,310,614 | |
Accounting and Security Lending Fees. Fidelity Service Company, Inc. (FSC), an affiliate of FMR, maintains the Fund's accounting records. The accounting fee is based on the level of average net assets for each month. Under a separate contract, FSC administers the security lending program. The security lending fee is based on the number and duration of lending transactions.
Brokerage Commissions. The Fund placed a portion of its portfolio transactions with brokerage firms which are affiliates of the investment adviser. The commissions paid to these affiliated firms were $8,183 for the period.
7. Committed Line of Credit.
The Fund participates with other funds managed by FMR or an affiliate in a $4.25 billion credit facility (the "line of credit") to be utilized for temporary or emergency purposes to fund shareholder redemptions or for other short-term liquidity purposes. The Fund has agreed to pay commitment fees on its pro-rata portion of the line of credit, which amounted to $1,284 and is reflected in Miscellaneous expenses on the Statement of Operations. During the period, there were no borrowings on this line of credit.
Annual Report
Fidelity Advisor Health Care Fund
Notes to Financial Statements - continued
8. Security Lending.
The Fund lends portfolio securities through a lending agent from time to time in order to earn additional income. For equity securities, a lending agent is used and may loan securities to certain qualified borrowers, including Fidelity Capital Markets (FCM), a broker-dealer affiliated with the Fund. On the settlement date of the loan, the Fund receives collateral (in the form of U.S. Treasury obligations, letters of credit and/or cash) against the loaned securities and maintains collateral in an amount not less than 100% of the market value of the loaned securities during the period of the loan. The market value of the loaned securities is determined at the close of business of the Fund and any additional required collateral is delivered to the Fund on the next business day. If the borrower defaults on its obligation to return the securities loaned because of insolvency or other reasons, a fund could experience delays and costs in recovering the securities loaned or in gaining access to the collateral. Any cash collateral received is invested in the Fidelity Securities Lending Cash Central Fund. The value of loaned securities and cash collateral at period end are disclosed on the Fund's Statement of Assets and Liabilities. At period end, there were no security loans outstanding with FCM. Security lending income represents the income earned on investing cash collateral, less rebates paid to borrowers and any lending agent fees associated with the loan, plus any premium payments received for lending certain types of securities. Security lending income is presented in the Statement of Operations as a component of income from Fidelity Central Funds. Total security lending income during the period amounted to $105,759, including $1,420 from securities loaned to FCM.
9. Expense Reductions.
Many of the brokers with whom FMR places trades on behalf of the Fund provided services to the Fund in addition to trade execution. These services included payments of certain expenses on behalf of the Fund totaling $38,372 for the period. In addition, through arrangements with the Fund's custodian, credits realized as a result of uninvested cash balances were used to reduce the Fund's expenses. During the period, these credits reduced the Fund's custody expenses by $23.
10. Distributions to Shareholders.
Distributions to shareholders of each class were as follows:
Years ended July 31, | 2012 | 2011 |
From net realized gain | | |
Class A | $ 22,638,273 | $ - |
Class T | 12,838,928 | - |
Class B | 2,229,080 | - |
Class C | 8,852,071 | - |
Institutional Class | 3,415,472 | - |
Total | $ 49,973,824 | $ - |
11. Share Transactions.
Transactions for each class of shares were as follows:
| Shares | Dollars |
Years ended July 31, | 2012 | 2011 | 2012 | 2011 |
Class A | | | | |
Shares sold | 2,109,585 | 2,257,884 | $ 48,063,125 | $ 55,506,569 |
Reinvestment of distributions | 974,579 | - | 19,679,030 | - |
Shares redeemed | (2,283,119) | (2,927,010) | (51,867,480) | (69,236,135) |
Net increase (decrease) | 801,045 | (669,126) | $ 15,874,675 | $ (13,729,566) |
Class T | | | | |
Shares sold | 517,207 | 610,720 | $ 11,288,178 | $ 14,273,371 |
Reinvestment of distributions | 626,615 | - | 12,200,296 | - |
Shares redeemed | (1,091,618) | (1,090,770) | (23,806,614) | (24,737,327) |
Net increase (decrease) | 52,204 | (480,050) | $ (318,140) | $ (10,463,956) |
Class B | | | | |
Shares sold | 73,881 | 46,091 | $ 1,480,151 | $ 1,030,863 |
Reinvestment of distributions | 107,208 | - | 1,929,279 | - |
Shares redeemed | (345,800) | (525,569) | (6,952,570) | (10,871,447) |
Net increase (decrease) | (164,711) | (479,478) | $ (3,543,140) | $ (9,840,584) |
Annual Report
11. Share Transactions - continued
| Shares | Dollars |
Years ended July 31, | 2012 | 2011 | 2012 | 2011 |
Class C | | | | |
Shares sold | 610,790 | 524,474 | $ 12,332,347 | $ 11,843,311 |
Reinvestment of distributions | 406,182 | - | 7,293,865 | - |
Shares redeemed | (719,664) | (681,222) | (14,281,889) | (14,258,065) |
Net increase (decrease) | 297,308 | (156,748) | $ 5,344,323 | $ (2,414,754) |
Institutional Class | | | | |
Shares sold | 969,515 | 1,277,086 | $ 23,079,181 | $ 33,336,034 |
Reinvestment of distributions | 134,306 | - | 2,842,866 | - |
Shares redeemed | (1,207,175) | (299,253) | (28,307,610) | (7,601,785) |
Net increase (decrease) | (103,354) | 977,833 | $ (2,385,563) | $ 25,734,249 |
12. Other.
The Fund's organizational documents provide former and current trustees and officers with a limited indemnification against liabilities arising in connection with the performance of their duties to the Fund. In the normal course of business, the Fund may also enter into contracts that provide general indemnifications. The Fund's maximum exposure under these arrangements is unknown as this would be dependent on future claims that may be made against the Fund. The risk of material loss from such claims is considered remote.
Annual Report
Fidelity Advisor Industrials Fund - Institutional Class
Performance: The Bottom Line
Average annual total return reflects the change in the value of an investment, assuming reinvestment of the class' distributions from dividend income and capital gains (the profits earned upon the sale of securities that have grown in value, if any) and assuming a constant rate of performance each year. The $10,000 table and the fund's returns do not reflect the deduction of taxes that a shareholder would pay on fund distributions or the redemption of fund shares. During periods of reimbursement by Fidelity, a fund's total return will be greater than it would be had the reimbursement not occurred. How a fund did yesterday is no guarantee of how it will do tomorrow.
Average Annual Total Returns
Periods ended July 31, 2012 | Past 1
year | Past 5
years | Past 10
years |
Institutional Class A | 3.72% | 3.50% | 11.26% |
A Prior to October 1, 2006, Fidelity Advisor Industrials Fund operated under certain different investment policies. The historical performance for the fund may not represent its current investment policies.
$10,000 Over 10 Years
Let's say hypothetically that $10,000 was invested in Fidelity Advisor Industrials Fund - Institutional Class on July 31, 2002. The chart shows how the value of your investment would have changed, and also shows how the S&P 500 Index performed over the same period.
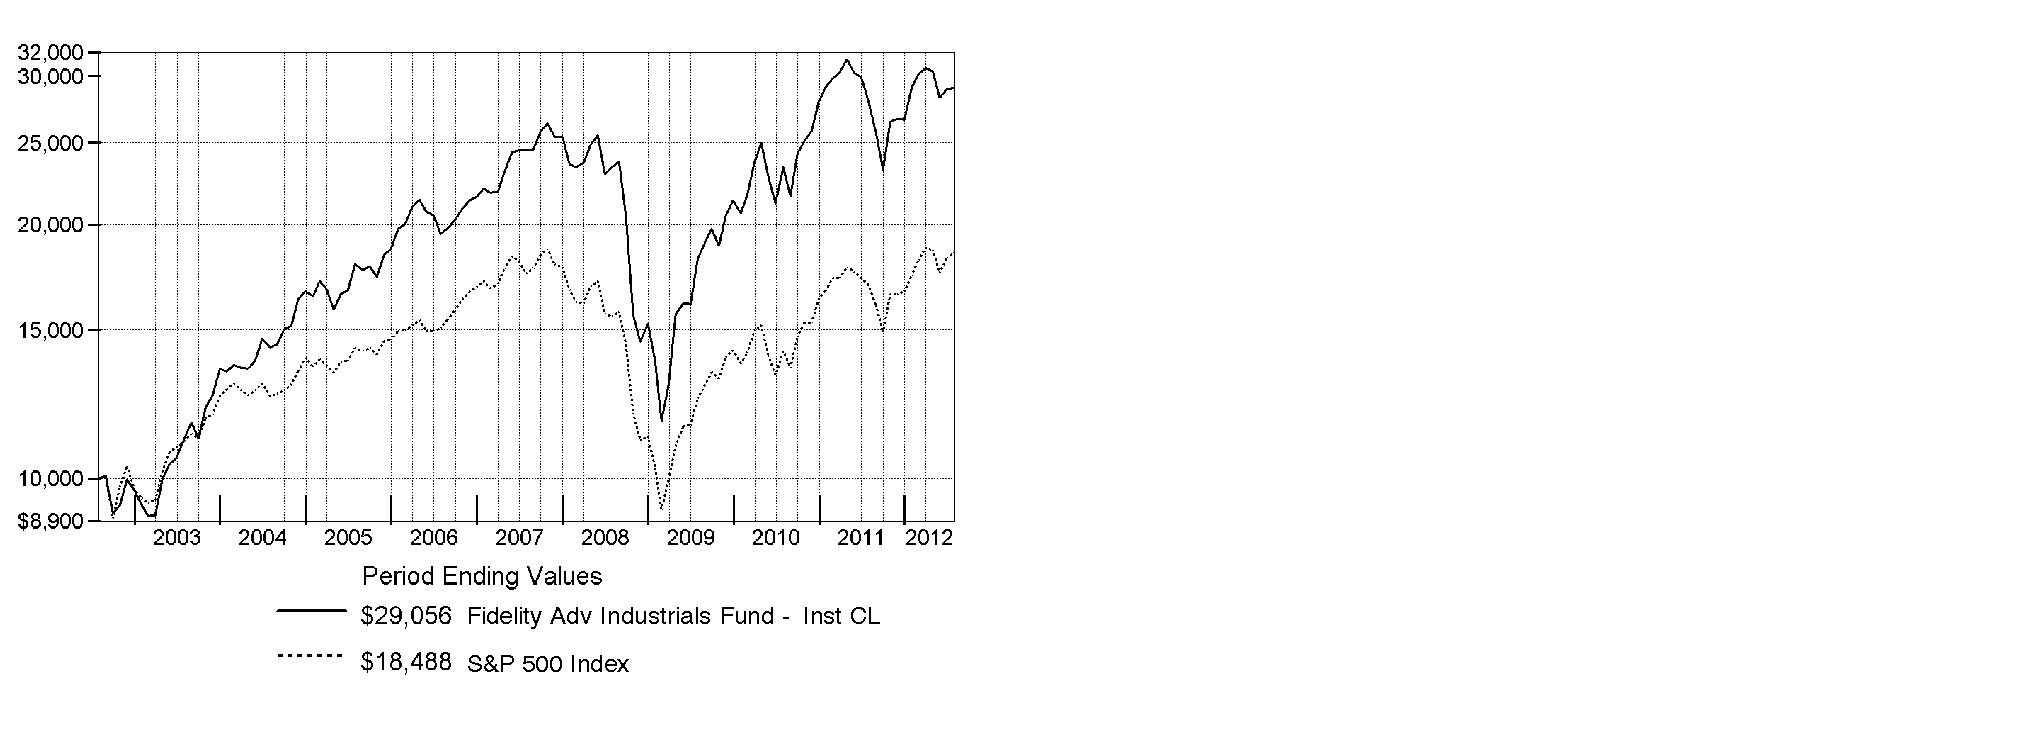
Annual Report
Fidelity Advisor Industrials Fund
Market Recap: Major U.S. equity benchmarks posted solid gains for the year ending July 31, 2012, amid an uncertain investment environment. The broad-based S&P 500® Index returned 9.13%, while the blue-chip-laden Dow Jones Industrial AverageSM and technology-heavy Nasdaq Composite® Index gained 10.12% and 7.83%, respectively. Volatility spiked during the period's first half, as equities plummeted late last summer on Europe's debt woes, political wrangling over the U.S. debt ceiling and the sovereign credit-rating downgrade that followed. By October, a seemingly improved U.S. economy rejuvenated stocks, paving the way for major equity benchmarks to post their best first-quarter performance since 1998. However, more eurozone trouble, signs that the U.S. economy had turned sluggish and a slowdown in China caused stocks to slip in May, before a new wave of optimism took hold in June and July. Within the S&P 500®, more-defensive sectors such as telecommunication services (+30%) and consumer staples (+20%) fared best, while materials and energy significantly underperformed, returning -5%. Small- and mid-cap stocks trailed their less-volatile large-cap counterparts, with the Russell 2000® Index adding 0.19% and the Russell Midcap® Index rising 2.28%. Given turmoil and local currency weakness in Europe, foreign developed-markets stocks lost ground, with the MSCI® EAFE® Index returning -11.32%.
Comments from Tobias Welo, Portfolio Manager of Fidelity Advisor® Industrials Fund: For the year, the fund's Institutional Class shares returned 3.72%, trailing the 5.07% gain of the MSCI® U.S. IM Industrials 25/50 Index and also lagging the S&P 500®. Versus the MSCI index, overweighting the construction/engineering group worked against relative performance, as did stock picking in trading companies/distributors and building products. A modest cash position hampered results as well. Shares of GrafTech International, a maker of graphite electrodes used in steel mini-mills, performed poorly, suffering from tepid overall demand for steel that caused the company to lower its first-quarter and fiscal 2012 earnings estimates. Our stake in India-based Jain Irrigation Systems also suffered a significant decline in value during the period. In my view, it was more due to adverse credit and market conditions than deterioration in company fundamentals. That said, I sold this stock during the period. Similarly, Italy-based Fiat Industrial, a manufacturer of trucks and tractors, suffered because of investor anxiety over that nation's debt woes. Jain Irrigation Systems and Fiat Industrial were out-of-benchmark positions. Building products maker Owens Corning also detracted, as a relatively benign storm season and higher raw materials costs trumped signs of recovery in the housing market. Further curbing our results was a sizable overweighting in Foster Wheeler, a construction/engineering firm specializing in large projects for companies in the energy and power industries. I liquidated this position. Lastly, the fund's foreign investments hurt, driven in part by a stronger U.S. dollar. Conversely, stock selection and an underweighting in the aerospace and defense group jointly were a significant positive factor. Within that segment, I continued to emphasize commercial aerospace stocks and underweight defense shares. One individual standout was aerospace components supplier Goodrich, the fund's top relative contributor. The stock surged higher in September 2011 after the company received a lucrative takeover bid from United Technologies, and I sold Goodrich during the period to lock in profits. A large underweighting in index heavyweight Caterpillar - which also was not held at period end - was timely. As we entered 2012, expectations for Cat were high, and I thought the company's exposure to decelerating emerging markets might limit the stock's upside potential. This analysis turned out to be on target. Strategic information provider IHS saw its shares advance smartly amid upwardly revised earnings and revenue guidance during the period. Heavily overweighting building products supplier Armstrong World Industries early in the period, when its stock was strong, also bolstered performance. I sold Armstrong in June.
The views expressed above reflect those of the portfolio manager(s) only through the end of the period as stated on the cover of this report and do not necessarily represent the views of Fidelity or any other person in the Fidelity organization. Any such views are subject to change at any time based upon market or other conditions and Fidelity disclaims any responsibility to update such views. These views may not be relied on as investment advice and, because investment decisions for a Fidelity fund are based on numerous factors, may not be relied on as an indication of trading intent on behalf of any Fidelity fund.
Annual Report
Fidelity Advisor Industrials Fund
As a shareholder of the Fund, you incur two types of costs: (1) transaction costs, including sales charges (loads) on purchase payments or redemption proceeds, redemption fees and (2) ongoing costs, including management fees, distribution and/or service (12b-1) fees and other Fund expenses. This Example is intended to help you understand your ongoing costs (in dollars) of investing in the Fund and to compare these costs with the ongoing costs of investing in other mutual funds.
The Example is based on an investment of $1,000 invested at the beginning of the period and held for the entire period (February 1, 2012 to July 31, 2012).
Actual Expenses
The first line of the accompanying table for each class of the Fund provides information about actual account values and actual expenses. You may use the information in this line, together with the amount you invested, to estimate the expenses that you paid over the period. Simply divide your account value by $1,000.00 (for example, an $8,600 account value divided by $1,000.00 = 8.6), then multiply the result by the number in the first line for a class of the Fund under the heading entitled "Expenses Paid During Period" to estimate the expenses you paid on your account during this period. In addition, the Fund, as a shareholder in the underlying Fidelity Central Funds, will indirectly bear its pro-rata share of the fees and expenses incurred by the underlying Fidelity Central Funds. These fees and expenses are not included in the Fund's annualized expense ratio used to calculate the expense estimate in the table below.
Hypothetical Example for Comparison Purposes
The second line of the accompanying table for each class of the Fund provides information about hypothetical account values and hypothetical expenses based on a Class' actual expense ratio and an assumed rate of return of 5% per year before expenses, which is not the Class' actual return. The hypothetical account values and expenses may not be used to estimate the actual ending account balance or expenses you paid for the period. You may use this information to compare the ongoing costs of investing in the Fund and other funds. To do so, compare this 5% hypothetical example with the 5% hypothetical examples that appear in the shareholder reports of the other funds. In addition, the Fund, as a shareholder in the underlying Fidelity Central Funds, will indirectly bear its pro-rata share of the fees and expenses incurred by the underlying Fidelity Central Funds. These fees and expenses are not included in the Fund's annualized expense ratio used to calculate the expense estimate in the table below.
Please note that the expenses shown in the table are meant to highlight your ongoing costs only and do not reflect any transaction costs. Therefore, the second line of the table is useful in comparing ongoing costs only, and will not help you determine the relative total costs of owning different funds. In addition, if these transactional costs were included, your costs would have been higher.
| Annualized Expense Ratio | Beginning
Account Value
February 1, 2012 | Ending
Account Value
July 31, 2012 | Expenses Paid
During Period*
February 1, 2012
to July 31, 2012 |
Class A | 1.12% | | | |
Actual | | $ 1,000.00 | $ 1,000.40 | $ 5.57 |
HypotheticalA | | $ 1,000.00 | $ 1,019.29 | $ 5.62 |
Class T | 1.38% | | | |
Actual | | $ 1,000.00 | $ 999.20 | $ 6.86 |
HypotheticalA | | $ 1,000.00 | $ 1,018.00 | $ 6.92 |
Class B | 1.93% | | | |
Actual | | $ 1,000.00 | $ 996.30 | $ 9.58 |
HypotheticalA | | $ 1,000.00 | $ 1,015.27 | $ 9.67 |
Class C | 1.87% | | | |
Actual | | $ 1,000.00 | $ 996.70 | $ 9.28 |
HypotheticalA | | $ 1,000.00 | $ 1,015.56 | $ 9.37 |
Institutional Class | .84% | | | |
Actual | | $ 1,000.00 | $ 1,001.80 | $ 4.18 |
HypotheticalA | | $ 1,000.00 | $ 1,020.69 | $ 4.22 |
A 5% return per year before expenses
* Expenses are equal to each Class' annualized expense ratio, multiplied by the average account value over the period, multiplied by 182/366 (to reflect the one-half year period).
Annual Report
Fidelity Advisor Industrials Fund
Investment Changes (Unaudited)
Top Ten Stocks as of July 31, 2012 |
| % of fund's
net assets | % of fund's net assets
6 months ago |
General Electric Co. | 15.0 | 11.7 |
United Technologies Corp. | 6.0 | 6.1 |
3M Co. | 4.7 | 3.8 |
Danaher Corp. | 3.9 | 3.9 |
Union Pacific Corp. | 3.8 | 3.8 |
Honeywell International, Inc. | 3.4 | 3.1 |
Cummins, Inc. | 3.2 | 3.0 |
Tyco International Ltd. | 2.5 | 2.3 |
Emerson Electric Co. | 2.4 | 3.3 |
Textron, Inc. | 2.4 | 2.1 |
| 47.3 | |
Top Industries (% of fund's net assets) |
As of July 31, 2012 |
| Industrial Conglomerates | 27.0% | |
| Machinery | 19.1% | |
| Aerospace & Defense | 13.9% | |
| Electrical Equipment | 7.6% | |
| Road & Rail | 7.4% | |
| All Others* | 25.0% | |

As of January 31, 2012 |
| Industrial Conglomerates | 22.4% | |
| Machinery | 19.9% | |
| Aerospace & Defense | 12.9% | |
| Electrical Equipment | 11.4% | |
| Road & Rail | 7.0% | |
| All Others* | 26.4% | |

* Includes short-term investments and net other assets. |
Annual Report
Fidelity Advisor Industrials Fund
Investments July 31, 2012
Showing Percentage of Net Assets
Common Stocks - 94.2% |
| Shares | | Value |
AEROSPACE & DEFENSE - 13.8% |
Aerospace & Defense - 13.8% |
Esterline Technologies Corp. (a) | 38,317 | | $ 2,249,974 |
Honeywell International, Inc. | 228,312 | | 13,253,512 |
Rockwell Collins, Inc. | 51,097 | | 2,583,975 |
Teledyne Technologies, Inc. (a) | 44,900 | | 2,797,270 |
Textron, Inc. | 351,618 | | 9,159,649 |
United Technologies Corp. | 307,658 | | 22,902,062 |
| | 52,946,442 |
AIR FREIGHT & LOGISTICS - 2.4% |
Air Freight & Logistics - 2.4% |
United Parcel Service, Inc. Class B | 120,222 | | 9,089,985 |
BUILDING PRODUCTS - 1.1% |
Building Products - 1.1% |
Owens Corning (a) | 159,686 | | 4,289,166 |
COMMERCIAL SERVICES & SUPPLIES - 2.7% |
Diversified Support Services - 0.3% |
Aggreko PLC | 29,500 | | 944,457 |
Copart, Inc. (a) | 5,100 | | 121,176 |
| | 1,065,633 |
Environmental & Facility Services - 1.5% |
Republic Services, Inc. | 198,565 | | 5,744,485 |
Office Services & Supplies - 0.4% |
Mine Safety Appliances Co. | 44,211 | | 1,517,322 |
Security & Alarm Services - 0.5% |
Corrections Corp. of America | 67,101 | | 2,085,499 |
TOTAL COMMERCIAL SERVICES & SUPPLIES | | 10,412,939 |
CONSTRUCTION & ENGINEERING - 4.5% |
Construction & Engineering - 4.5% |
AECOM Technology Corp. (a) | 249,768 | | 4,048,739 |
EMCOR Group, Inc. | 164,559 | | 4,332,838 |
Jacobs Engineering Group, Inc. (a) | 131,587 | | 5,075,311 |
MasTec, Inc. (a) | 71,998 | | 1,149,088 |
Quanta Services, Inc. (a) | 120,350 | | 2,766,847 |
| | 17,372,823 |
ELECTRICAL EQUIPMENT - 7.6% |
Electrical Components & Equipment - 7.6% |
AMETEK, Inc. | 198,600 | | 6,156,600 |
Emerson Electric Co. | 197,171 | | 9,418,859 |
GrafTech International Ltd. (a) | 238,900 | | 2,496,505 |
Hubbell, Inc. Class B | 60,231 | | 4,955,807 |
Prysmian SpA | 126,076 | | 2,027,470 |
Regal-Beloit Corp. | 67,617 | | 4,352,506 |
| | 29,407,747 |
|
| Shares | | Value |
INDUSTRIAL CONGLOMERATES - 27.0% |
Industrial Conglomerates - 27.0% |
3M Co. | 195,961 | | $ 17,877,522 |
Carlisle Companies, Inc. | 69,494 | | 3,508,752 |
Danaher Corp. | 286,682 | | 15,139,676 |
General Electric Co. | 2,772,584 | | 57,531,119 |
Tyco International Ltd. | 177,514 | | 9,752,619 |
| | 103,809,688 |
MACHINERY - 19.1% |
Construction & Farm Machinery & Heavy Trucks - 6.0% |
Cummins, Inc. | 128,654 | | 12,337,919 |
Deere & Co. | 65,000 | | 4,993,300 |
Fiat Industrial SpA | 101,600 | | 1,000,069 |
Manitowoc Co., Inc. (d) | 397,464 | | 4,769,568 |
| | 23,100,856 |
Industrial Machinery - 13.1% |
Actuant Corp. Class A | 85,160 | | 2,423,654 |
Dover Corp. | 78,640 | | 4,283,521 |
Flowserve Corp. | 29,600 | | 3,551,408 |
Graco, Inc. | 77,426 | | 3,552,305 |
Illinois Tool Works, Inc. | 156,629 | | 8,511,220 |
Ingersoll-Rand PLC | 114,947 | | 4,874,902 |
Pall Corp. | 78,861 | | 4,211,966 |
Parker Hannifin Corp. | 74,642 | | 5,995,245 |
SPX Corp. | 27,100 | | 1,645,512 |
Timken Co. | 63,312 | | 2,291,894 |
TriMas Corp. (a) | 182,602 | | 3,969,767 |
Valmont Industries, Inc. | 40,322 | | 4,995,089 |
| | 50,306,483 |
TOTAL MACHINERY | | 73,407,339 |
MARINE - 0.5% |
Marine - 0.5% |
Kirby Corp. (a) | 36,425 | | 1,922,147 |
PROFESSIONAL SERVICES - 5.1% |
Human Resource & Employment Services - 1.9% |
Manpower, Inc. | 75,801 | | 2,697,000 |
Towers Watson & Co. | 82,599 | | 4,842,779 |
| | 7,539,779 |
Research & Consulting Services - 3.2% |
Bureau Veritas SA | 32,375 | | 2,863,282 |
Dun & Bradstreet Corp. | 39,376 | | 3,157,561 |
IHS, Inc. Class A (a) | 48,574 | | 5,356,255 |
Nielsen Holdings B.V. (a) | 30,700 | | 874,950 |
| | 12,252,048 |
TOTAL PROFESSIONAL SERVICES | | 19,791,827 |
Common Stocks - continued |
| Shares | | Value |
ROAD & RAIL - 7.4% |
Railroads - 6.4% |
CSX Corp. | 329,998 | | $ 7,570,154 |
Genesee & Wyoming, Inc. Class A (a) | 42,999 | | 2,668,518 |
Union Pacific Corp. | 118,352 | | 14,511,139 |
| | 24,749,811 |
Trucking - 1.0% |
J.B. Hunt Transport Services, Inc. | 56,411 | | 3,103,733 |
Quality Distribution, Inc. (a) | 51,256 | | 517,686 |
| | 3,621,419 |
TOTAL ROAD & RAIL | | 28,371,230 |
TRADING COMPANIES & DISTRIBUTORS - 2.6% |
Trading Companies & Distributors - 2.6% |
W.W. Grainger, Inc. | 16,800 | | 3,441,144 |
Watsco, Inc. | 46,300 | | 3,145,622 |
WESCO International, Inc. (a) | 63,484 | | 3,536,694 |
| | 10,123,460 |
TRANSPORTATION INFRASTRUCTURE - 0.4% |
Airport Services - 0.4% |
Wesco Aircraft Holdings, Inc. (a) | 128,140 | | 1,710,669 |
TOTAL COMMON STOCKS (Cost $320,914,536) | 362,655,462 |
Convertible Preferred Stocks - 0.1% |
| | | |
AEROSPACE & DEFENSE - 0.1% |
Aerospace & Defense - 0.1% |
United Technologies Corp. 7.50%
(Cost $405,000) | 8,100 | | 427,275 |
Convertible Bonds - 0.5% |
| Principal Amount | | |
BUILDING PRODUCTS - 0.5% |
Building Products - 0.5% |
Aspen Aerogels, Inc.: | | | | |
8% 6/1/14 (f) | | $ 1,041,431 | | 1,041,431 |
8% 12/6/14 (f) | | 850,700 | | 850,700 |
8% 12/6/14 (f) | | 182,200 | | 182,200 |
TOTAL CONVERTIBLE BONDS (Cost $2,074,332) | | 2,074,331 |
U.S. Treasury Obligations - 0.1% |
|
U.S. Treasury Bills, yield at date of purchase 0.08% 8/23/12 (e)
(Cost $269,986) | | 270,000 | | 269,991 |
Money Market Funds - 6.1% |
| Shares | | Value |
Fidelity Cash Central Fund, 0.17% (b) | 22,495,521 | | $ 22,495,521 |
Fidelity Securities Lending Cash Central Fund, 0.18% (b)(c) | 1,087,800 | | 1,087,800 |
TOTAL MONEY MARKET FUNDS (Cost $23,583,321) | 23,583,321 |
TOTAL INVESTMENT PORTFOLIO - 101.0% (Cost $347,247,175) | | 389,010,380 |
NET OTHER ASSETS (LIABILITIES) - (1.0)% | | (3,821,377) |
NET ASSETS - 100% | $ 385,189,003 |
Futures Contracts |
| Expiration Date | | Underlying Face Amount at Value | | Unrealized Appreciation/(Depreciation) |
Purchased |
Equity Index Contracts |
120 CME E-mini Industrial Select Sector Index Contracts | Sept. 2012 | | $ 4,274,400 | | $ 195,061 |
|
The face value of futures purchased as a percentage of net assets is 1.1% |
Legend |
(a) Non-income producing |
(b) Affiliated fund that is available only to investment companies and other accounts managed by Fidelity Investments. The rate quoted is the annualized seven-day yield of the fund at period end. A complete unaudited listing of the fund's holdings as of its most recent quarter end is available upon request. In addition, each Fidelity Central Fund's financial statements, which are not covered by the Fund's Report of Independent Registered Public Accounting Firm, are available on the SEC's website or upon request. |
(c) Investment made with cash collateral received from securities on loan. |
(d) Security or a portion of the security is on loan at period end. |
(e) Security or a portion of the security was pledged to cover margin requirements for futures contracts. At the period end, the value of securities pledged amounted to $269,991. |
(f) Restricted securities - Investment in securities not registered under the Securities Act of 1933 (excluding 144A issues). At the end of the period, the value of restricted securities (excluding 144A issues) amounted to $2,074,331 or 0.5% of net assets. |
Additional information on each restricted holding is as follows: |
Security | Acquisition Date | Acquisition Cost |
Aspen Aerogels, Inc. 8% 6/1/14 | 6/14/11 | $ 1,041,431 |
Aspen Aerogels, Inc. 8% 12/6/14 | 12/6/11 - 6/12/12 | $ 1,032,900 |
Affiliated Central Funds |
Information regarding fiscal year to date income earned by the Fund from investments in Fidelity Central Funds is as follows: |
Fund | Income earned |
Fidelity Cash Central Fund | $ 16,137 |
Fidelity Securities Lending Cash Central Fund | 30,165 |
Total | $ 46,302 |
Other Information |
The following is a summary of the inputs used, as of July 31, 2012, involving the Fund's assets and liabilities carried at fair value. The inputs or methodology used for valuing securities may not be an indication of the risk associated with investing in those securities. For more information on valuation inputs, and their aggregation into the levels used in the table below, please refer to the Security Valuation section in the accompanying Notes to Financial Statements. |
Valuation Inputs at Reporting Date: |
Description | Total | Level 1 | Level 2 | Level 3 |
Investments in Securities: | | | | |
Common Stocks | $ 362,655,462 | $ 362,655,462 | $ - | $ - |
Convertible Preferred Stocks | 427,275 | 427,275 | - | - |
Convertible Bonds | 2,074,331 | - | - | 2,074,331 |
U.S. Treasury Obligations | 269,991 | - | 269,991 | - |
Money Market Funds | 23,583,321 | 23,583,321 | - | - |
Total Investments in Securities: | $ 389,010,380 | $ 386,666,058 | $ 269,991 | $ 2,074,331 |
Derivative Instruments: | | | | |
Assets | | | | |
Futures Contracts | $ 195,061 | $ 195,061 | $ - | $ - |
Value of Derivative Instruments |
The following table is a summary of the Fund's value of derivative instruments by risk exposure as of July 31, 2012. For additional information on derivative instruments, please refer to the Derivative Instruments section in the accompanying Notes to Financial Statements. |
Risk Exposure /
Derivative Type | Value |
| Asset | Liability |
Equity Risk | | |
Futures Contracts (a) | $ 195,061 | $ - |
Total Value of Derivatives | $ 195,061 | $ - |
(a) Reflects cumulative appreciation/(depreciation) on futures contracts as disclosed on the Schedule of Investments. Only the period end variation margin is separately disclosed on the Statement of Assets and Liabilities. |
See accompanying notes which are an integral part of the financial statements.
Annual Report
Fidelity Advisor Industrials Fund
Statement of Assets and Liabilities
| July 31, 2012 |
| | |
Assets | | |
Investment in securities, at value (including securities loaned of $1,065,600) - See accompanying schedule: Unaffiliated issuers (cost $323,663,854) | $ 365,427,059 | |
Fidelity Central Funds (cost $23,583,321) | 23,583,321 | |
Total Investments (cost $347,247,175) | | $ 389,010,380 |
Receivable for fund shares sold | | 181,648 |
Dividends receivable | | 73,541 |
Interest receivable | | 140,601 |
Distributions receivable from Fidelity Central Funds | | 2,437 |
Other receivables | | 3,881 |
Total assets | | 389,412,488 |
| | |
Liabilities | | |
Payable for investments purchased | $ 2,044,937 | |
Payable for fund shares redeemed | 632,644 | |
Accrued management fee | 177,350 | |
Distribution and service plan fees payable | 137,159 | |
Payable for daily variation margin on futures contracts | 13,200 | |
Other affiliated payables | 91,028 | |
Other payables and accrued expenses | 39,367 | |
Collateral on securities loaned, at value | 1,087,800 | |
Total liabilities | | 4,223,485 |
| | |
Net Assets | | $ 385,189,003 |
Net Assets consist of: | | |
Paid in capital | | $ 360,708,824 |
Undistributed net investment income | | 1,084,983 |
Accumulated undistributed net realized gain (loss) on investments and foreign currency transactions | | (18,562,014) |
Net unrealized appreciation (depreciation) on investments and assets and liabilities in foreign currencies | | 41,957,210 |
Net Assets | | $ 385,189,003 |
Statement of Assets and Liabilities - continued
| July 31, 2012 |
| | |
Calculation of Maximum Offering Price Class A:
Net Asset Value and redemption price per share ($192,037,955 ÷ 7,335,752 shares) | | $ 26.18 |
| | |
Maximum offering price per share (100/94.25 of $26.18) | | $ 27.78 |
Class T:
Net Asset Value and redemption price per share ($63,954,336 ÷ 2,483,465 shares) | | $ 25.75 |
| | |
Maximum offering price per share (100/96.50 of $25.75) | | $ 26.68 |
Class B:
Net Asset Value and offering price per share ($20,057,986 ÷ 825,772 shares)A | | $ 24.29 |
| | |
Class C:
Net Asset Value and offering price per share ($66,289,133 ÷ 2,719,490 shares)A | | $ 24.38 |
| | |
Institutional Class:
Net Asset Value, offering price and redemption price per share ($42,849,593 ÷ 1,576,750 shares) | | $ 27.18 |
A Redemption price per share is equal to net asset value less any applicable contingent deferred sales charge.
See accompanying notes which are an integral part of the financial statements.
Annual Report
Statement of Operations
| Year ended July 31, 2012 |
| | |
Investment Income | | |
Dividends | | $ 7,453,724 |
Interest | | 130,098 |
Income from Fidelity Central Funds | | 46,302 |
Total income | | 7,630,124 |
| | |
Expenses | | |
Management fee | $ 2,205,258 | |
Transfer agent fees | 984,550 | |
Distribution and service plan fees | 1,706,450 | |
Accounting and security lending fees | 154,236 | |
Custodian fees and expenses | 22,937 | |
Independent trustees' compensation | 2,649 | |
Registration fees | 87,074 | |
Audit | 48,732 | |
Legal | 1,365 | |
Interest | 576 | |
Miscellaneous | 4,130 | |
Total expenses before reductions | 5,217,957 | |
Expense reductions | (15,771) | 5,202,186 |
Net investment income (loss) | | 2,427,938 |
Realized and Unrealized Gain (Loss) Net realized gain (loss) on: | | |
Investment securities: | | |
Unaffiliated issuers | (17,375,832) | |
Foreign currency transactions | (38,024) | |
Futures contracts | 1,012,681 | |
Total net realized gain (loss) | | (16,401,175) |
Change in net unrealized appreciation (depreciation) on: Investment securities | 18,310,973 | |
Assets and liabilities in foreign currencies | (3,018) | |
Futures contracts | 195,061 | |
Total change in net unrealized appreciation (depreciation) | | 18,503,016 |
Net gain (loss) | | 2,101,841 |
Net increase (decrease) in net assets resulting from operations | | $ 4,529,779 |
Statement of Changes in Net Assets
| Year ended
July 31,
2012 | Year ended
July 31,
2011 |
Increase (Decrease) in Net Assets | | |
Operations | | |
Net investment income (loss) | $ 2,427,938 | $ 791,669 |
Net realized gain (loss) | (16,401,175) | 55,819,724 |
Change in net unrealized appreciation (depreciation) | 18,503,016 | 3,563,495 |
Net increase (decrease) in net assets resulting from operations | 4,529,779 | 60,174,888 |
Distributions to shareholders from net investment income | (1,437,740) | (328,907) |
Distributions to shareholders from net realized gain | (4,219,307) | - |
Total distributions | (5,657,047) | (328,907) |
Share transactions - net increase (decrease) | (82,942,475) | 75,767,831 |
Redemption fees | 15,881 | 11,341 |
Total increase (decrease) in net assets | (84,053,862) | 135,625,153 |
| | |
Net Assets | | |
Beginning of period | 469,242,865 | 333,617,712 |
End of period (including undistributed net investment income of $1,084,983 and undistributed net investment income of $259,179, respectively) | $ 385,189,003 | $ 469,242,865 |
See accompanying notes which are an integral part of the financial statements.
Annual Report
Financial Highlights - Class A
Years ended July 31, | 2012 | 2011 | 2010 | 2009 | 2008 |
Selected Per-Share Data | | | | | |
Net asset value, beginning of period | $ 25.73 | $ 21.54 | $ 16.87 | $ 21.97 | $ 25.49 |
Income from Investment Operations | | | | | |
Net investment income (loss) C | .20 | .09 | .06 | .13 | .11 |
Net realized and unrealized gain (loss) | .61 | 4.13 | 4.68 | (5.08) | (1.17) |
Total from investment operations | .81 | 4.22 | 4.74 | (4.95) | (1.06) |
Distributions from net investment income | (.11) | (.03) | (.07) | (.13) | - |
Distributions from net realized gain | (.25) | - | - | (.02) | (2.46) |
Total distributions | (.36) | (.03) | (.07) | (.15) | (2.46) |
Redemption fees added to paid in capital C, G | - | - | - | - | - |
Net asset value, end of period | $ 26.18 | $ 25.73 | $ 21.54 | $ 16.87 | $ 21.97 |
Total Return A, B | 3.42% | 19.59% | 28.13% | (22.49)% | (4.71)% |
Ratios to Average Net Assets D, F | | | | | |
Expenses before reductions | 1.14% | 1.13% | 1.18% | 1.23% | 1.17% |
Expenses net of fee waivers, if any | 1.14% | 1.13% | 1.18% | 1.23% | 1.17% |
Expenses net of all reductions | 1.14% | 1.13% | 1.17% | 1.23% | 1.16% |
Net investment income (loss) | .80% | .36% | .31% | .89% | .46% |
Supplemental Data | | | | | |
Net assets, end of period (000 omitted) | $ 192,038 | $ 228,106 | $ 165,029 | $ 130,860 | $ 188,859 |
Portfolio turnover rate E | 82% | 75% | 110% | 135% | 91% |
A Total returns would have been lower if certain expenses had not been reduced during the applicable periods shown.
B Total returns do not include the effect of the sales charges.
C Calculated based on average shares outstanding during the period.
D Fees and expenses of any underlying Fidelity Central Funds are not included in the Fund's expense ratio. The Fund indirectly bears its proportionate share of the expenses of any underlying Fidelity Central Funds.
E Amount does not include the portfolio activity of any underlying Fidelity Central Funds.
F Expense ratios reflect operating expenses of the class. Expenses before reductions do not reflect amounts reimbursed by the investment adviser or reductions from brokerage service arrangements or reductions from other expense offset arrangements and do not represent the amount paid by the class during periods when reimbursements or reductions occur. Expenses net of fee waivers reflect expenses after reimbursement by the investment adviser but prior to reductions from brokerage service arrangements or other expense offset arrangements. Expenses net of all reductions represent the net expenses paid by the class.
G Amount represents less than $.01 per share.
Financial Highlights - Class T
Years ended July 31, | 2012 | 2011 | 2010 | 2009 | 2008 |
Selected Per-Share Data | | | | | |
Net asset value, beginning of period | $ 25.33 | $ 21.24 | $ 16.64 | $ 21.67 | $ 25.17 |
Income from Investment Operations | | | | | |
Net investment income (loss) C | .13 | .03 | .01 | .10 | .05 |
Net realized and unrealized gain (loss) | .61 | 4.07 | 4.61 | (5.03) | (1.15) |
Total from investment operations | .74 | 4.10 | 4.62 | (4.93) | (1.10) |
Distributions from net investment income | (.07) | (.01) | (.02) | (.08) | - |
Distributions from net realized gain | (.25) | - | - | (.02) | (2.40) |
Total distributions | (.32) | (.01) | (.02) | (.10) | (2.40) |
Redemption fees added to paid in capital C, G | - | - | - | - | - |
Net asset value, end of period | $ 25.75 | $ 25.33 | $ 21.24 | $ 16.64 | $ 21.67 |
Total Return A, B | 3.15% | 19.28% | 27.80% | (22.68)% | (4.96)% |
Ratios to Average Net Assets D, F | | | | | |
Expenses before reductions | 1.40% | 1.39% | 1.44% | 1.48% | 1.41% |
Expenses net of fee waivers, if any | 1.40% | 1.39% | 1.44% | 1.48% | 1.41% |
Expenses net of all reductions | 1.39% | 1.38% | 1.43% | 1.48% | 1.41% |
Net investment income (loss) | .54% | .10% | .06% | .63% | .21% |
Supplemental Data | | | | | |
Net assets, end of period (000 omitted) | $ 63,954 | $ 71,542 | $ 58,202 | $ 48,054 | $ 85,025 |
Portfolio turnover rate E | 82% | 75% | 110% | 135% | 91% |
A Total returns would have been lower if certain expenses had not been reduced during the applicable periods shown.
B Total returns do not include the effect of the sales charges.
C Calculated based on average shares outstanding during the period.
D Fees and expenses of any underlying Fidelity Central Funds are not included in the Fund's expense ratio. The Fund indirectly bears its proportionate share of the expenses of any underlying Fidelity Central Funds.
E Amount does not include the portfolio activity of any underlying Fidelity Central Funds.
F Expense ratios reflect operating expenses of the class. Expenses before reductions do not reflect amounts reimbursed by the investment adviser or reductions from brokerage service arrangements or reductions from other expense offset arrangements and do not represent the amount paid by the class during periods when reimbursements or reductions occur. Expenses net of fee waivers reflect expenses after reimbursement by the investment adviser but prior to reductions from brokerage service arrangements or other expense offset arrangements. Expenses net of all reductions represent the net expenses paid by the class.
G Amount represents less than $.01 per share.
See accompanying notes which are an integral part of the financial statements.
Annual Report
Financial Highlights - Class B
Years ended July 31, | 2012 | 2011 | 2010 | 2009 | 2008 |
Selected Per-Share Data | | | | | |
Net asset value, beginning of period | $ 23.99 | $ 20.22 | $ 15.90 | $ 20.74 | $ 24.19 |
Income from Investment Operations | | | | | |
Net investment income (loss) C | - H | (.11) | (.09) | .02 | (.07) |
Net realized and unrealized gain (loss) | .57 | 3.88 | 4.41 | (4.82) | (1.10) |
Total from investment operations | .57 | 3.77 | 4.32 | (4.80) | (1.17) |
Distributions from net investment income | (.02) | - | - | (.04) | - |
Distributions from net realized gain | (.25) | - | - | - | (2.28) |
Total distributions | (.27) | - | - | (.04) | (2.28) |
Redemption fees added to paid in capital C, H | - | - | - | - | - |
Net asset value, end of period | $ 24.29 | $ 23.99 | $ 20.22 | $ 15.90 | $ 20.74 |
Total Return A, B | 2.59% | 18.64% | 27.17% | (23.10)% | (5.46)% |
Ratios to Average Net Assets D, G | | | | | |
Expenses before reductions | 1.94% | 1.93% | 1.97% | 1.98% | 1.95% |
Expenses net of fee waivers, if any | 1.94% | 1.93% | 1.97% | 1.98% | 1.95% |
Expenses net of all reductions | 1.94% | 1.93% | 1.97% | 1.98% | 1.95% |
Net investment income (loss) | -% F | (.44)% | (.48)% | .13% | (.33)% |
Supplemental Data | | | | | |
Net assets, end of period (000 omitted) | $ 20,058 | $ 28,600 | $ 29,048 | $ 25,212 | $ 39,989 |
Portfolio turnover rate E | 82% | 75% | 110% | 135% | 91% |
A Total returns would have been lower if certain expenses had not been reduced during the applicable periods shown.
B Total returns do not include the effect of the contingent deferred sales charge.
C Calculated based on average shares outstanding during the period.
D Fees and expenses of any underlying Fidelity Central Funds are not included in the Fund's expense ratio. The Fund indirectly bears its proportionate share of the expenses of any underlying Fidelity Central Funds.
E Amount does not include the portfolio activity of any underlying Fidelity Central Funds.
F Amount represents less than .01%.
G Expense ratios reflect operating expenses of the class. Expenses before reductions do not reflect amounts reimbursed by the investment adviser or reductions from brokerage service arrangements or reductions from other expense offset arrangements and do not represent the amount paid by the class during periods when reimbursements or reductions occur. Expenses net of fee waivers reflect expenses after reimbursement by the investment adviser but prior to reductions from brokerage service arrangements or other expense offset arrangements. Expenses net of all reductions represent the net expenses paid by the class.
H Amount represents less than $.01 per share.
Financial Highlights - Class C
Years ended July 31, | 2012 | 2011 | 2010 | 2009 | 2008 |
Selected Per-Share Data | | | | | |
Net asset value, beginning of period | $ 24.07 | $ 20.28 | $ 15.94 | $ 20.79 | $ 24.26 |
Income from Investment Operations | | | | | |
Net investment income (loss) C | .01 | (.09) | (.08) | .02 | (.06) |
Net realized and unrealized gain (loss) | .58 | 3.88 | 4.42 | (4.83) | (1.11) |
Total from investment operations | .59 | 3.79 | 4.34 | (4.81) | (1.17) |
Distributions from net investment income | (.03) | - | - | (.04) | - |
Distributions from net realized gain | (.25) | - | - | - | (2.30) |
Total distributions | (.28) | - | - | (.04) | (2.30) |
Redemption fees added to paid in capital C, G | - | - | - | - | - |
Net asset value, end of period | $ 24.38 | $ 24.07 | $ 20.28 | $ 15.94 | $ 20.79 |
Total Return A, B | 2.67% | 18.69% | 27.23% | (23.09)% | (5.44)% |
Ratios to Average Net Assets D, F | | | | | |
Expenses before reductions | 1.89% | 1.89% | 1.93% | 1.98% | 1.91% |
Expenses net of fee waivers, if any | 1.89% | 1.89% | 1.93% | 1.98% | 1.91% |
Expenses net of all reductions | 1.88% | 1.88% | 1.92% | 1.98% | 1.90% |
Net investment income (loss) | .05% | (.40)% | (.43)% | .14% | (.28)% |
Supplemental Data | | | | | |
Net assets, end of period (000 omitted) | $ 66,289 | $ 72,673 | $ 51,760 | $ 37,862 | $ 57,742 |
Portfolio turnover rate E | 82% | 75% | 110% | 135% | 91% |
A Total returns would have been lower if certain expenses had not been reduced during the applicable periods shown.
B Total returns do not include the effect of the contingent deferred sales charge.
C Calculated based on average shares outstanding during the period.
D Fees and expenses of any underlying Fidelity Central Funds are not included in the Fund's expense ratio. The Fund indirectly bears its proportionate share of the expenses of any underlying Fidelity Central Funds.
E Amount does not include the portfolio activity of any underlying Fidelity Central Funds.
F Expense ratios reflect operating expenses of the class. Expenses before reductions do not reflect amounts reimbursed by the investment adviser or reductions from brokerage service arrangements or reductions from other expense offset arrangements and do not represent the amount paid by the class during periods when reimbursements or reductions occur. Expenses net of fee waivers reflect expenses after reimbursement by the investment adviser but prior to reductions from brokerage service arrangements or other expense offset arrangements. Expenses net of all reductions represent the net expenses paid by the class.
G Amount represents less than $.01 per share.
See accompanying notes which are an integral part of the financial statements.
Annual Report
Financial Highlights - Institutional Class
Years ended July 31, | 2012 | 2011 | 2010 | 2009 | 2008 |
Selected Per-Share Data | | | | | |
Net asset value, beginning of period | $ 26.69 | $ 22.30 | $ 17.45 | $ 22.72 | $ 26.26 |
Income from Investment Operations | | | | | |
Net investment income (loss) B | .28 | .17 | .13 | .19 | .18 |
Net realized and unrealized gain (loss) | .63 | 4.28 | 4.83 | (5.27) | (1.19) |
Total from investment operations | .91 | 4.45 | 4.96 | (5.08) | (1.01) |
Distributions from net investment income | (.17) | (.06) | (.11) | (.17) | - |
Distributions from net realized gain | (.25) | - | - | (.02) | (2.53) |
Total distributions | (.42) | (.06) | (.11) | (.19) | (2.53) |
Redemption fees added to paid in capital B, F | - | - | - | - | - |
Net asset value, end of period | $ 27.18 | $ 26.69 | $ 22.30 | $ 17.45 | $ 22.72 |
Total Return A | 3.72% | 19.95% | 28.52% | (22.31)% | (4.40)% |
Ratios to Average Net Assets C, E | | | | | |
Expenses before reductions | .85% | .85% | .89% | .96% | .88% |
Expenses net of fee waivers, if any | .85% | .85% | .89% | .96% | .88% |
Expenses net of all reductions | .85% | .84% | .88% | .95% | .87% |
Net investment income (loss) | 1.08% | .65% | .61% | 1.16% | .75% |
Supplemental Data | | | | | |
Net assets, end of period (000 omitted) | $ 42,850 | $ 68,323 | $ 29,578 | $ 12,762 | $ 33,642 |
Portfolio turnover rate D | 82% | 75% | 110% | 135% | 91% |
A Total returns would have been lower if certain expenses had not been reduced during the applicable periods shown.
B Calculated based on average shares outstanding during the period.
C Fees and expenses of any underlying Fidelity Central Funds are not included in the Fund's expense ratio. The Fund indirectly bears its proportionate share of the expenses of any underlying Fidelity Central Funds.
D Amount does not include the portfolio activity of any underlying Fidelity Central Funds.
E Expense ratios reflect operating expenses of the class. Expenses before reductions do not reflect amounts reimbursed by the investment adviser or reductions from brokerage service arrangements or reductions from other expense offset arrangements and do not represent the amount paid by the class during periods when reimbursements or reductions occur. Expenses net of fee waivers reflect expenses after reimbursement by the investment adviser but prior to reductions from brokerage service arrangements or other expense offset arrangements. Expenses net of all reductions represent the net expenses paid by the class.
F Amount represents less than $.01 per share.
See accompanying notes which are an integral part of the financial statements.
Annual Report
Fidelity Advisor Industrials Fund
Notes to Financial Statements
For the period ended July 31, 2012
1. Organization.
Fidelity Advisor Industrials Fund (the Fund) is a non-diversified fund of Fidelity Advisor Series VII (the Trust) and is authorized to issue an unlimited number of shares. The Trust is registered under the Investment Company Act of 1940, as amended (the 1940 Act), as an open-end management investment company organized as a Massachusetts business trust. The Fund offers Class A, Class T, Class C, and Institutional Class shares, each of which, along with Class B shares, has equal rights as to assets and voting privileges. Effective after the close of business on September 1, 2010, Class B shares were closed to new accounts and additional purchases, except for exchanges and reinvestments. Each class has exclusive voting rights with respect to matters that affect that class. Class B shares will automatically convert to Class A shares after a holding period of seven years from the initial date of purchase. Investment income, realized and unrealized capital gains and losses, the common expenses of the Fund, and certain fund-level expense reductions, if any, are allocated on a pro-rata basis to each class based on the relative net assets of each class to the total net assets of the Fund. Each class differs with respect to transfer agent and distribution and service plan fees incurred. Certain expense reductions may also differ by class.
2. Investments in Fidelity Central Funds.
The Fund invests in Fidelity Central Funds, which are open-end investment companies available only to other investment companies and accounts managed by Fidelity Management & Research Company (FMR) and its affiliates. The Fund's Schedule of Investments lists each of the Fidelity Central Funds held as of period end, if any, as an investment of the Fund, but does not include the underlying holdings of each Fidelity Central Fund. As an Investing Fund, the Fund indirectly bears its proportionate share of the expenses of the underlying Fidelity Central Funds.
The Money Market Central Funds seek preservation of capital and current income and are managed by Fidelity Investments Money Management, Inc. (FIMM), an affiliate of FMR.
A complete unaudited list of holdings for each Fidelity Central Fund is available upon request or at the Securities and Exchange Commission (the SEC) web site at www.sec.gov. In addition, the financial statements of the Fidelity Central Funds, which are not covered by the Fund's Report of Independent Registered Public Accounting Firm, are available on the SEC web site or upon request.
3. Significant Accounting Policies.
The financial statements have been prepared in conformity with accounting principles generally accepted in the United States of America (GAAP), which require management to make certain estimates and assumptions at the date of the financial statements. Actual results could differ from those estimates. Subsequent events, if any, through the date that the financial statements were issued have been evaluated in the preparation of the financial statements. The following summarizes the significant accounting policies of the Fund:
Security Valuation. Investments are valued as of 4:00 p.m. Eastern time on the last calendar day of the period. In accordance with valuation policies and procedures approved by the Board of Trustees (the Board), the Fund attempts to obtain prices from one or more third party pricing vendor or broker to value its investments. When current market prices, quotations or rates are not readily available or reliable, securities will be fair valued in good faith by the FMR Fair Value Committee (the Committee), in accordance with procedures adopted by the Fund's Board. Factors used in determining fair value vary by security type and may include market or security specific events, changes in interest rates and credit quality. The frequency with which these procedures are used cannot be predicted and they may be utilized to a significant extent. The Committee oversees the Fund's valuation policies and procedures and is responsible for approving and reporting to the Board all fair value determinations.
The Fund categorizes the inputs to valuation techniques used to value its investments into a disclosure hierarchy consisting of three levels as shown below:
Level 1 - quoted prices in active markets for identical investments
Level 2 - other significant observable inputs (including quoted prices for similar investments, interest rates, prepayment speeds, etc.)
Level 3 - unobservable inputs (including the Fund's own assumptions based on the best information available)
Valuation techniques used to value the Fund's investments by major category are as follows:
Equity securities, including restricted securities, for which market quotations are readily available, are valued at the last reported sale price or official closing price as reported by a third party pricing vendor on the primary market or exchange on which they are traded and are categorized as Level 1 in the hierarchy. In the event there were no sales during the day or closing prices are not available, securities are valued at the last quoted bid price or may be valued using the last available price and are generally categorized as Level 2 in the hierarchy. For foreign equity securities, when significant market or security specific events arise, comparisons to the valuation of American Depositary Receipts (ADRs), futures contracts, Exchange-Traded Funds (ETFs) and certain indexes as well as quoted prices for similar securities are used and are categorized as Level 2 in the hierarchy. Utilizing these techniques may result in transfers between Level 1 and Level 2. For restricted equity securities and private placements where observable inputs are limited, assumptions about market activity and risk are used and these securities are categorized as Level 3 in the hierarchy.
Annual Report
3. Significant Accounting Policies - continued
Security Valuation - continued
Debt securities, including restricted securities, are valued based on evaluated prices received from third party pricing vendors or from brokers who make markets in such securities. For corporate bonds and U.S. government and government agency obligations, pricing vendors utilize matrix pricing which considers yield or price of bonds of comparable quality, coupon, maturity and type as well as broker-supplied prices and are generally categorized as Level 2 in the hierarchy. When independent prices are unavailable or unreliable, debt securities may be valued utilizing pricing methodologies which consider similar factors that would be used by third party pricing vendors. These are generally categorized as Level 2 in the hierarchy but may be Level 3 depending on the circumstances.
Futures contracts are valued at the settlement price established each day by the board of trade or exchange on which they are traded and are categorized as Level 1 in the hierarchy. Investments in open-end mutual funds, including the Fidelity Central Funds, are valued at their closing net asset value each business day and are categorized as Level 1 in the hierarchy.
Changes in valuation techniques may result in transfers in or out of an assigned level within the disclosure hierarchy. The aggregate value of investments by input level, as of July 31, 2012, is included at the end of the Fund's Schedule of Investments.
Foreign Currency Translation. The Fund may use foreign currency contracts to facilitate transactions in foreign-denominated securities. Gains and losses from these transactions may arise from changes in the value of the foreign currency or if the counterparties do not perform under the contracts' terms.
Foreign-denominated assets, including investment securities, and liabilities are translated into U.S. dollars at the exchange rates at period end. Purchases and sales of investment securities, income and dividends received and expenses denominated in foreign currencies are translated into U.S. dollars at the exchange rate in effect on the transaction date.
The effects of exchange rate fluctuations on investments are included with the net realized and unrealized gain (loss) on investment securities. Other foreign currency transactions resulting in realized and unrealized gain (loss) are disclosed separately.
Investment Transactions and Income. For financial reporting purposes, the Fund's investment holdings and NAV include trades executed through the end of the last business day of the period. The NAV per share for processing shareholder transactions is calculated as of the close of business of the New York Stock Exchange (NYSE), normally 4:00 p.m. Eastern time and includes trades executed through the end of the prior business day. Gains and losses on securities sold are determined on the basis of identified cost and may include proceeds received from litigation. Dividend income is recorded on the ex-dividend date, except for certain dividends from foreign securities where the ex-dividend date may have passed, which are recorded as soon as the Fund is informed of the ex-dividend date. Non-cash dividends included in dividend income, if any, are recorded at the fair market value of the securities received. Distributions received on securities that represent a return of capital or capital gain are recorded as a reduction of cost of investments and/or as a realized gain. The Fund estimates the components of distributions received that may be considered return of capital distributions or capital gain distributions. Interest income and distributions from the Fidelity Central Funds are accrued as earned. Interest income includes coupon interest and amortization of premium and accretion of discount on debt securities. Investment income is recorded net of foreign taxes withheld where recovery of such taxes is uncertain.
Expenses. Expenses directly attributable to a fund are charged to that fund. Expenses attributable to more than one fund are allocated among the respective funds on the basis of relative net assets or other appropriate methods. Expense estimates are accrued in the period to which they relate and adjustments are made when actual amounts are known.
Income Tax Information and Distributions to Shareholders. Each year, the Fund intends to qualify as a regulated investment company under Subchapter M of the Internal Revenue Code, including distributing substantially all of its taxable income and realized gains. As a result, no provision for income taxes is required. As of July 31, 2012, the Fund did not have any unrecognized tax benefits in the financial statements; nor is the Fund aware of any tax positions for which it is reasonably possible that the total amounts of unrecognized tax benefits will significantly change in the next twelve months. The Fund files a U.S. federal tax return, in addition to state and local tax returns as required. A fund's federal income tax returns are subject to examination by the Internal Revenue Service (IRS) for a period of three fiscal years after they are filed. State and local tax returns may be subject to examination for an additional fiscal year depending on the jurisdiction. Foreign taxes are provided for based on the Fund's understanding of the tax rules and rates that exist in the foreign markets in which it invests.
Distributions are declared and recorded on the ex-dividend date. Income dividends and capital gain distributions are declared separately for each class. Income and capital gain distributions are determined in accordance with income tax regulations, which may differ from GAAP. In addition, the Fund claimed a portion of the payment made to redeeming shareholders as a distribution for income tax purposes.
Capital accounts within the financial statements are adjusted for permanent book-tax differences. These adjustments have no impact on net assets or the results of operations. Temporary book-tax differences will reverse in a subsequent period.
Annual Report
Fidelity Advisor Industrials Fund
Notes to Financial Statements - continued
3. Significant Accounting Policies - continued
Income Tax Information and Distributions to Shareholders - continued
Book-tax differences are primarily due to foreign currency transactions, market discount, futures transactions, deferred trustees compensation, equity-debt classifications, capital loss carryforwards and losses deferred due to wash sales.
The federal tax cost of investment securities and unrealized appreciation (depreciation) as of period end were as follows:
Gross unrealized appreciation | $ 47,867,170 |
Gross unrealized depreciation | (8,874,903) |
Net unrealized appreciation (depreciation) on securities and other investments | $ 38,992,267 |
| |
Tax Cost | $ 350,018,113 |
The tax-based components of distributable earnings as of period end were as follows:
Undistributed ordinary income | $ 1,088,979 |
Capital loss carryforward | $ (15,596,016) |
Net unrealized appreciation (depreciation) | $ 38,991,211 |
Capital loss carryforwards are only available to offset future capital gains of the Fund to the extent provided by regulations and may be limited. Under the Regulated Investment Company Modernization Act of 2010 (the Act), the Fund is permitted to carry forward capital losses incurred in taxable years beginning after December 22, 2010 for an unlimited period and such capital losses are required to be used prior to any losses that expire. Capital loss carryforwards were as follows:
No expiration | |
Short-term | $ (15,596,016) |
The tax character of distributions paid was as follows:
| July 31, 2012 | July 31, 2011 |
Ordinary Income | $ 1,437,740 | $ 328,907 |
Long-term Capital Gains | 4,219,307 | - |
Total | $ 5,657,047 | $ 328,907 |
Short-Term Trading (Redemption) Fees. Shares held by investors in the Fund less than 30 days are subject to a redemption fee equal to .75% of the net asset value of shares redeemed. All redemption fees, which reduce the proceeds of the shareholder redemption, are retained by the Fund and accounted for as an addition to paid in capital.
New Accounting Pronouncement. In December 2011, the Financial Accounting Standards Board issued Accounting Standard Update No. 2011-11, Disclosures about Offsetting Assets and Liabilities. The update creates new disclosure requirements requiring entities to disclose both gross and net information for derivatives and other financial instruments that are either offset in the Statement of Assets and Liabilities or subject to an enforceable master netting arrangement or similar agreement. The disclosure requirements are effective for interim and annual reporting periods beginning on or after January 1, 2013. Management is currently evaluating the impact of the update's adoption on the Fund's financial statement disclosures.
4. Operating Policies.
Restricted Securities. The Fund may invest in securities that are subject to legal or contractual restrictions on resale. These securities generally may be resold in transactions exempt from registration or to the public if the securities are registered. Disposal of these securities may involve time-consuming negotiations and expense, and prompt sale at an acceptable price may be difficult. Information regarding restricted securities is included at the end of the Fund's Schedule of Investments.
5. Derivative Instruments.
Risk Exposures and the Use of Derivative Instruments. The Fund's investment objectives allow the Fund to enter into various types of derivative contracts, including futures contracts. Derivatives are investments whose value is derived from underlying assets, indices or reference rates and may be transacted on an exchange or over-the-counter (OTC). Derivatives may involve a future commitment to buy or sell a specified instrument based on specified terms, or to exchange future cash flows at periodic intervals based on a notional principal amount. The Fund used derivatives to increase returns and to manage exposure to certain risks as defined below. The success of any strategy involving derivatives depends on analysis of numerous economic factors, and if the strategies for investment do not work as intended, the Fund may not achieve its objectives.
Annual Report
5. Derivative Instruments - continued
Risk Exposures and the Use of Derivative Instruments - continued
The Fund's use of derivatives increased or decreased its exposure to the following risk:
Equity Risk | Equity risk relates to the fluctuations in the value of financial instruments as a result of changes in market prices (other than those arising from interest rate risk or foreign exchange risk), whether caused by factors specific to an individual investment, its issuer, or all factors affecting all instruments traded in a market or market segment. |
The Fund is also exposed to additional risks from investing in derivatives, such as liquidity risk and counterparty credit risk. Liquidity risk is the risk that the Fund will be unable to close out the derivative in the open market in a timely manner. Counterparty credit risk is the risk that the counterparty will not be able to fulfill its obligation to the Fund. Counterparty credit risk related to exchange-traded futures contracts is minimal because of the protection provided by the exchange on which they trade. Investing in derivatives may involve greater risks than investing in the underlying assets directly and, to varying degrees, involves risk of loss in excess of the initial investment, if any, collateral received and amounts recognized in the Statement of Assets and Liabilities. In addition, for futures contracts, there is the risk that the change in value of the derivative contract may not correspond to the change in value of the underlying instrument.
Futures Contracts. A futures contract is an agreement between two parties to buy or sell a specified underlying instrument for a fixed price at a specified future date. The Fund used futures contracts to manage its exposure to the stock market.
Upon entering into a futures contract, a fund is required to deposit either cash or securities (initial margin) with a clearing broker in an amount equal to a certain percentage of the face value of the contract. Futures contracts are marked-to-market daily and subsequent payments (variation margin) are made or received by a fund depending on the daily fluctuations in the value of the futures contracts and are recorded as unrealized appreciation or (depreciation). This receivable and/or payable is included in daily variation margin on futures contracts in the Statement of Assets and Liabilities. Realized gain or (loss) is recorded upon the expiration or closing of a futures contract.
Any open futures contracts at period end are shown in the Schedule of Investments under the caption "Futures Contracts." The underlying face amount at value reflects each contract's exposure to the underlying instrument at period end and is representative of activity for the period. Securities deposited to meet initial margin requirements are identified in the Schedule of Investments.
During the period the Fund recognized net realized gain (loss) of $1,012,681 and a change in net unrealized appreciation (depreciation) of $195,061 related to its investment in futures contracts. These amounts are included in the Statement of Operations.
6. Purchases and Sales of Investments.
Purchases and sales of securities, other than short-term securities, aggregated $319,308,352 and $422,627,733, respectively.
7. Fees and Other Transactions with Affiliates.
Management Fee. FMR and its affiliates provide the Fund with investment management related services for which the Fund pays a monthly management fee. The management fee is the sum of an individual fund fee rate that is based on an annual rate of .30% of the Fund's average net assets and an annualized group fee rate that averaged .26% during the period. The group fee rate is based upon the average net assets of all the mutual funds advised by FMR. The group fee rate decreases as assets under management increase and increases as assets under management decrease. For the period, the total annual management fee rate was .56% of the Fund's average net assets.
Distribution and Service Plan Fees. In accordance with Rule 12b-1 of the 1940 Act, the Fund has adopted separate Distribution and Service Plans for each class of shares. Certain classes pay Fidelity Distributors Corporation (FDC), an affiliate of FMR, separate Distribution and Service Fees, each of which is based on an annual percentage of each class' average net assets. In addition, FDC may pay financial intermediaries for selling shares of the Fund and providing shareholder support services. For the period, the Distribution and Service Fee rates, total fees and amounts retained by FDC were as follows:
| Distribution
Fee | Service
Fee | Total Fees | Retained
by FDC |
Class A | -% | .25% | $ 496,430 | $ 8,539 |
Class T | .25% | .25% | 316,028 | 456 |
Class B | .75% | .25% | 229,897 | 172,437 |
Class C | .75% | .25% | 664,095 | 112,438 |
| | | $ 1,706,450 | $ 293,870 |
Annual Report
Fidelity Advisor Industrials Fund
Notes to Financial Statements - continued
7. Fees and Other Transactions with Affiliates - continued
Sales Load. FDC may receive a front-end sales charge of up to 5.75% for selling Class A shares and 3.50% for selling Class T shares, some of which is paid to financial intermediaries for selling shares of the Fund. Depending on the holding period, FDC may receive contingent deferred sales charges levied on Class A, Class T, Class B, and Class C redemptions. The deferred sales charges range from 5.00% to 1.00% for Class B shares, 1.00% for Class C shares, 1.00% for certain purchases of Class A shares and .25% for certain purchases of Class T shares.
For the period, sales charge amounts retained by FDC were as follows:
| Retained
by FDC |
Class A | $ 63,331 |
Class T | 9,386 |
Class B* | 42,192 |
Class C* | 11,320 |
| $ 126,229 |
* When Class B and Class C shares are initially sold, FDC pays commissions from its own resources to financial intermediaries through which the sales are made.
Transfer Agent Fees. Fidelity Investments Institutional Operations Company, Inc. (FIIOC), an affiliate of FMR, is the transfer, dividend disbursing and shareholder servicing agent for each class of the Fund. FIIOC receives account fees and asset-based fees that vary according to the account size and type of account of the shareholders of the respective classes of the Fund. FIIOC pays for typesetting, printing and mailing of shareholder reports, except proxy statements. For the period, transfer agent fees for each class were as follows:
| Amount | % of
Average
Net Assets |
Class A | $ 496,808 | .25 |
Class T | 161,224 | .26 |
Class B | 69,135 | .30 |
Class C | 163,953 | .25 |
Institutional Class | 93,430 | .21 |
| $ 984,550 | |
Accounting and Security Lending Fees. Fidelity Service Company, Inc. (FSC), an affiliate of FMR, maintains the Fund's accounting records. The accounting fee is based on the level of average net assets for each month. Under a separate contract, FSC administers the security lending program. The security lending fee is based on the number and duration of lending transactions.
Brokerage Commissions. The Fund placed a portion of its portfolio transactions with brokerage firms which are affiliates of the investment adviser. The commissions paid to these affiliated firms were $7,231 for the period.
Interfund Lending Program. Pursuant to an Exemptive Order issued by the SEC, the Fund, along with other registered investment companies having management contracts with FMR, may participate in an interfund lending program. This program provides an alternative credit facility allowing the funds to borrow from, or lend money to, other participating affiliated funds. At period end, there were no interfund loans outstanding. The Fund's activity in this program during the period for which loans were outstanding was as follows:
Borrower or Lender | Average Loan
Balance | Weighted Average Interest Rate | Interest
Expense |
Borrower | $ 7,097,500 | .37% | $ 576 |
8. Committed Line of Credit.
The Fund participates with other funds managed by FMR or an affiliate in a $4.25 billion credit facility (the "line of credit") to be utilized for temporary or emergency purposes to fund shareholder redemptions or for other short-term liquidity purposes. The Fund has agreed to pay commitment fees on its pro-rata portion of the line of credit, which amounted to $1,142 and is reflected in Miscellaneous expenses on the Statement of Operations. During the period, there were no borrowings on this line of credit.
Annual Report
9. Security Lending.
The Fund lends portfolio securities through a lending agent from time to time in order to earn additional income. For equity securities, a lending agent is used and may loan securities to certain qualified borrowers, including Fidelity Capital Markets (FCM), a broker-dealer affiliated with the Fund. On the settlement date of the loan, the Fund receives collateral (in the form of U.S. Treasury obligations, letters of credit and/or cash) against the loaned securities and maintains collateral in an amount not less than 100% of the market value of the loaned securities during the period of the loan. The market value of the loaned securities is determined at the close of business of the Fund and any additional required collateral delivered to the Fund on the next business day. If the borrower defaults on its obligation to return the securities loaned because of insolvency or other reasons, a fund could experience delays and costs in recovering the securities loaned or in gaining access to the collateral. Any cash collateral received is invested in the Fidelity Securities Lending Cash Central Fund. The value of loaned securities and cash collateral at period end are disclosed on the Fund's Statement of Assets and Liabilities. Security lending income represents the income earned on investing cash collateral, less rebates paid to borrowers and any lending agent fees associated with the loan, plus any premium payments received for lending certain types of securities. Security lending income is presented in the Statement of Operations as a component of income from Fidelity Central Funds. Total security lending income during the period amounted to $30,165. During the period, there were no securities loaned to FCM.
10. Expense Reductions.
Many of the brokers with whom FMR places trades on behalf of the Fund provided services to the Fund in addition to trade execution. These services included payments of certain expenses on behalf of the Fund totaling $15,771 for the period.
11. Distributions to Shareholders.
Distributions to shareholders of each class were as follows:
Years ended July 31, | 2012 | 2011 |
From net investment income | | |
Class A | $ 896,458 | $ 235,263 |
Class T | 170,680 | 13,200 |
Class B | 16,830 | - |
Class C | 70,972 | - |
Institutional Class | 282,800 | 80,444 |
Total | $ 1,437,740 | $ 328,907 |
From net realized gain | | |
Class A | $ 2,092,354 | $ - |
Class T | 659,892 | - |
Class B | 286,480 | - |
Class C | 731,497 | - |
Institutional Class | 449,084 | - |
Total | $ 4,219,307 | $ - |
12. Share Transactions.
Transactions for each class of shares were as follows:
| Shares | Dollars |
Years ended July 31, | 2012 | 2011 | 2012 | 2011 |
Class A | | | | |
Shares sold | 1,757,163 | 3,645,278 | $ 44,013,667 | $ 95,442,701 |
Reinvestment of distributions | 118,075 | 8,108 | 2,609,664 | 205,122 |
Shares redeemed | (3,404,053) | (2,451,683) | (83,950,843) | (63,502,279) |
Net increase (decrease) | (1,528,815) | 1,201,703 | $ (37,327,512) | $ 32,145,544 |
Class T | | | | |
Shares sold | 369,147 | 757,485 | $ 9,058,222 | $ 19,402,949 |
Reinvestment of distributions | 36,910 | 500 | 800,817 | 12,596 |
Shares redeemed | (746,452) | (674,809) | (17,604,399) | (16,619,027) |
Net increase (decrease) | (340,395) | 83,176 | $ (7,745,360) | $ 2,796,518 |
Annual Report
Fidelity Advisor Industrials Fund
Notes to Financial Statements - continued
12. Share Transactions - continued
| Shares | Dollars |
Years ended July 31, | 2012 | 2011 | 2012 | 2011 |
Class B | | | | |
Shares sold | 62,276 | 89,875 | $ 1,371,568 | $ 2,150,821 |
Reinvestment of distributions | 12,641 | - | 255,322 | - |
Shares redeemed | (441,128) | (334,639) | (10,119,054) | (7,838,637) |
Net increase (decrease) | (366,211) | (244,764) | $ (8,492,164) | $ (5,687,816) |
Class C | | | | |
Shares sold | 457,163 | 1,054,416 | $ 10,854,816 | $ 25,772,946 |
Reinvestment of distributions | 31,555 | - | 641,832 | - |
Shares redeemed | (787,971) | (588,462) | (18,054,638) | (13,948,935) |
Net increase (decrease) | (299,253) | 465,954 | $ (6,557,990) | $ 11,824,011 |
Institutional Class | | | | |
Shares sold | 806,817 | 2,320,182 | $ 21,049,427 | $ 63,208,570 |
Reinvestment of distributions | 22,926 | 2,269 | 525,598 | 59,382 |
Shares redeemed | (1,812,880) | (1,089,149) | (44,394,474) | (28,578,378) |
Net increase (decrease) | (983,137) | 1,233,302 | $ (22,819,449) | $ 34,689,574 |
13. Other.
The Fund's organizational documents provide former and current trustees and officers with a limited indemnification against liabilities arising in connection with the performance of their duties to the Fund. In the normal course of business, the Fund may also enter into contracts that provide general indemnifications. The Fund's maximum exposure under these arrangements is unknown as this would be dependent on future claims that may be made against the Fund. The risk of material loss from such claims is considered remote.
Annual Report
Fidelity Advisor Technology Fund - Institutional Class
Performance: The Bottom Line
Average annual total return reflects the change in the value of an investment, assuming reinvestment of the class' distributions from dividend income and capital gains (the profits earned upon the sale of securities that have grown in value, if any) and assuming a constant rate of performance each year. The $10,000 table and the fund's returns do not reflect the deduction of taxes that a shareholder would pay on fund distributions or the redemption of fund shares. During periods of reimbursement by Fidelity, a fund's total return will be greater than it would be had the reimbursement not occurred. How a fund did yesterday is no guarantee of how it will do tomorrow.
Average Annual Total Returns
Periods ended July 31, 2012 | Past 1
year | Past 5
years | Past 10
years |
Institutional Class | 0.76% | 4.50% | 10.15% |
$10,000 Over 10 Years
Let's say hypothetically that $10,000 was invested in Fidelity Advisor Technology Fund - Institutional Class on July 31, 2002. The chart shows how the value of your investment would have changed, and also shows how the S&P 500 Index performed over the same period.
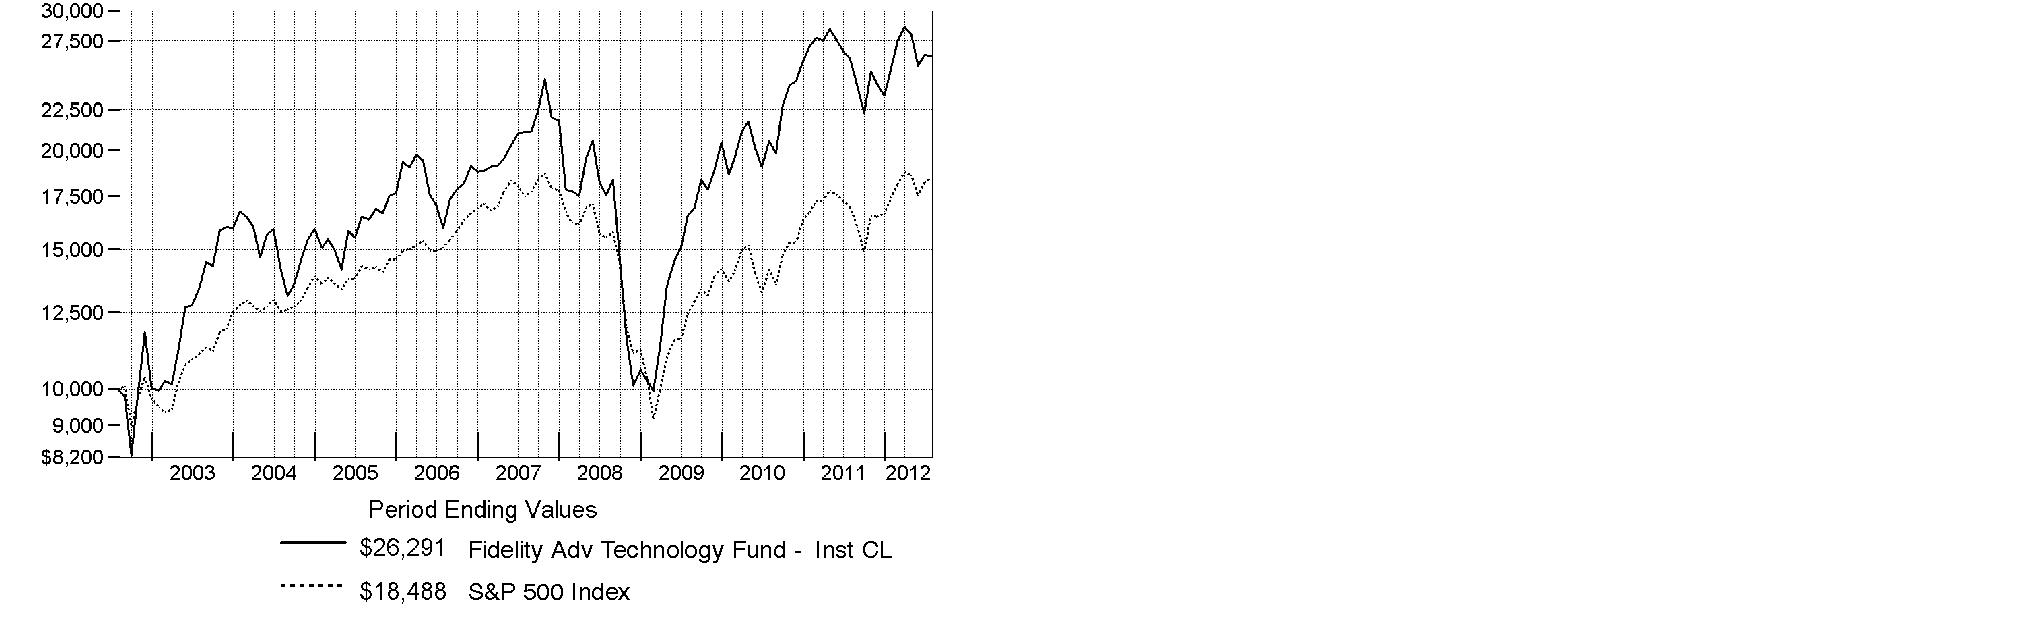
Annual Report
Fidelity Advisor Technology Fund
Market Recap: Major U.S. equity benchmarks posted solid gains for the year ending July 31, 2012, amid an uncertain investment environment. The broad-based S&P 500® Index returned 9.13%, while the blue-chip-laden Dow Jones Industrial AverageSM and technology-heavy Nasdaq Composite® Index gained 10.12% and 7.83%, respectively. Volatility spiked during the period's first half, as equities plummeted late last summer on Europe's debt woes, political wrangling over the U.S. debt ceiling and the sovereign credit-rating downgrade that followed. By October, a seemingly improved U.S. economy rejuvenated stocks, paving the way for major equity benchmarks to post their best first-quarter performance since 1998. However, more eurozone trouble, signs that the U.S. economy had turned sluggish and a slowdown in China caused stocks to slip in May, before a new wave of optimism took hold in June and July. Within the S&P 500®, more-defensive sectors such as telecommunication services (+30%) and consumer staples (+20%) fared best, while materials and energy significantly underperformed, returning -5%. Small- and mid-cap stocks trailed their less-volatile large-cap counterparts, with the Russell 2000® Index adding 0.19% and the Russell Midcap® Index rising 2.28%. Given turmoil and local currency weakness in Europe, foreign developed-markets stocks lost ground, with the MSCI® EAFE® Index returning -11.32%.
Comments from Charlie Chai, Portfolio Manager of Fidelity Advisor® Technology Fund: For the year, the fund's Institutional Class shares returned 0.76%, significantly trailing the 10.29% gain of the MSCI® U.S. IM Information Technology 25/50 Index and also lagging the S&P 500®. Most of the fund's underperformance versus the MSCI index occurred during the period's first half, when investor concern about the European sovereign debt crisis and slowing economic growth in China hampered many of the portfolio's mid- and small-cap holdings, especially those with exposure to China. Among industry groups, the biggest detractors were semiconductors, application software, Internet software/services and communications equipment. In all of these cases, stock selection was the primary negative factor. Additionally, the fund's average cash position of roughly 5% was a drag on performance. At the individual stock level, a large overweighting in salesforce.com, a fast-growing player in cloud computing for customer relationship management software, worked against the fund's relative performance. Despite a solid rally in the first quarter of 2012, this stock delivered a loss for the period overall, as tepid global economic growth a relatively rich valuation to begin the period made investors wary of holding the stock. Moreover, the stock began the period with a relatively rich valuation. Also hampering our results were Polycom, a provider of high-definition videoconferencing equipment, enterprise software maker Kingdee International Software Group and online travel services provider Ctrip.com International, the latter of which was not held at period end. Kingdee and Ctrip are based in China and were non-index holdings. Conversely, stock picking in computer hardware stood out as a positive influence, while positioning in semiconductor equipment also helped. Within the former category, a sizable underweighting in Hewlett-Packard and not owning Dell were beneficial factors, given the weak showing of these two index components. Timely ownership of SanDisk, a manufacturer of the NAND flash memory used in mobile devices such as smartphones and tablets, also aided relative performance. Timely ownership of SanDisk, a manufacturer of the NAND flash memory used in mobile devices such as smartphones and tablets, also aided relative performance.
The views expressed above reflect those of the portfolio manager(s) only through the end of the period as stated on the cover of this report and do not necessarily represent the views of Fidelity or any other person in the Fidelity organization. Any such views are subject to change at any time based upon market or other conditions and Fidelity disclaims any responsibility to update such views. These views may not be relied on as investment advice and, because investment decisions for a Fidelity fund are based on numerous factors, may not be relied on as an indication of trading intent on behalf of any Fidelity fund.
Annual Report
Fidelity Advisor Technology Fund
As a shareholder of the Fund, you incur two types of costs: (1) transaction costs, including sales charges (loads) on purchase payments or redemption proceeds, redemption fees and (2) ongoing costs, including management fees, distribution and/or service (12b-1) fees and other Fund expenses. This Example is intended to help you understand your ongoing costs (in dollars) of investing in the Fund and to compare these costs with the ongoing costs of investing in other mutual funds.
The Example is based on an investment of $1,000 invested at the beginning of the period and held for the entire period (February 1, 2012 to July 31, 2012).
Actual Expenses
The first line of the accompanying table for each class of the Fund provides information about actual account values and actual expenses. You may use the information in this line, together with the amount you invested, to estimate the expenses that you paid over the period. Simply divide your account value by $1,000.00 (for example, an $8,600 account value divided by $1,000.00 = 8.6), then multiply the result by the number in the first line for a class of the Fund under the heading entitled "Expenses Paid During Period" to estimate the expenses you paid on your account during this period. In addition, the Fund, as a shareholder in the underlying Fidelity Central Funds, will indirectly bear its pro-rata share of the fees and expenses incurred by the underlying Fidelity Central Funds. These fees and expenses are not included in the Fund's annualized expense ratio used to calculate the expense estimate in the table below.
Hypothetical Example for Comparison Purposes
The second line of the accompanying table for each class of the Fund provides information about hypothetical account values and hypothetical expenses based on a Class' actual expense ratio and an assumed rate of return of 5% per year before expenses, which is not the Class' actual return. The hypothetical account values and expenses may not be used to estimate the actual ending account balance or expenses you paid for the period. You may use this information to compare the ongoing costs of investing in the Fund and other funds. To do so, compare this 5% hypothetical example with the 5% hypothetical examples that appear in the shareholder reports of the other funds. In addition, the Fund, as a shareholder in the underlying Fidelity Central Funds, will indirectly bear its pro-rata share of the fees and expenses incurred by the underlying Fidelity Central Funds. These fees and expenses are not included in the Fund's annualized expense ratio used to calculate the expense estimate in the table below.
Please note that the expenses shown in the table are meant to highlight your ongoing costs only and do not reflect any transaction costs. Therefore, the second line of the table is useful in comparing ongoing costs only, and will not help you determine the relative total costs of owning different funds. In addition, if these transactional costs were included, your costs would have been higher.
| Annualized Expense Ratio | Beginning
Account Value
February 1, 2012 | Ending
Account Value
July 31, 2012 | Expenses Paid
During Period*
February 1, 2012
to July 31, 2012 |
Class A | 1.18% | | | |
Actual | | $ 1,000.00 | $ 1,034.00 | $ 5.97 |
HypotheticalA | | $ 1,000.00 | $ 1,019.00 | $ 5.92 |
Class T | 1.43% | | | |
Actual | | $ 1,000.00 | $ 1,033.10 | $ 7.23 |
HypotheticalA | | $ 1,000.00 | $ 1,017.75 | $ 7.17 |
Class B | 1.93% | | | |
Actual | | $ 1,000.00 | $ 1,030.10 | $ 9.74 |
HypotheticalA | | $ 1,000.00 | $ 1,015.27 | $ 9.67 |
Class C | 1.91% | | | |
Actual | | $ 1,000.00 | $ 1,030.40 | $ 9.64 |
HypotheticalA | | $ 1,000.00 | $ 1,015.37 | $ 9.57 |
Institutional Class | .85% | | | |
Actual | | $ 1,000.00 | $ 1,036.00 | $ 4.30 |
HypotheticalA | | $ 1,000.00 | $ 1,020.64 | $ 4.27 |
A 5% return per year before expenses
* Expenses are equal to each Class' annualized expense ratio, multiplied by the average account value over the period, multiplied by 182/366 (to reflect the one-half year period).
Annual Report
Fidelity Advisor Technology Fund
Investment Changes (Unaudited)
Top Ten Stocks as of July 31, 2012 |
| % of fund's
net assets | % of fund's net assets
6 months ago |
Apple, Inc. | 21.6 | 15.3 |
Google, Inc. Class A | 5.2 | 3.0 |
Visa, Inc. Class A | 3.9 | 1.0 |
IBM Corp. | 3.0 | 1.5 |
QUALCOMM, Inc. | 2.9 | 2.0 |
salesforce.com, Inc. | 2.4 | 2.3 |
Cisco Systems, Inc. | 2.1 | 0.6 |
eBay, Inc. | 2.0 | 1.4 |
Altera Corp. | 1.9 | 2.0 |
Oracle Corp. | 1.7 | 3.2 |
| 46.7 | |
Top Industries (% of fund's net assets) |
As of July 31, 2012 |
| Computers & Peripherals | 24.5% | |
| Software | 17.6% | |
| Semiconductors & Semiconductor Equipment | 15.2% | |
| Internet Software & Services | 9.9% | |
| IT Services | 9.6% | |
| All Others* | 23.2% | |

As of January 31, 2012 |
| Semiconductors & Semiconductor Equipment | 23.6% | |
| Software | 22.8% | |
| Computers & Peripherals | 18.6% | |
| Internet Software & Services | 9.6% | |
| Communications Equipment | 7.5% | |
| All Others* | 17.9% | |

* Includes short-term investments and net other assets. |
Annual Report
Fidelity Advisor Technology Fund
Investments July 31, 2012
Showing Percentage of Net Assets
Common Stocks - 91.0% |
| Shares | | Value |
AEROSPACE & DEFENSE - 0.3% |
Aerospace & Defense - 0.3% |
DigitalGlobe, Inc. (a) | 69,951 | | $ 1,361,946 |
GeoEye, Inc. (a) | 27,167 | | 690,857 |
| | 2,052,803 |
AUTOMOBILES - 0.1% |
Automobile Manufacturers - 0.1% |
Tesla Motors, Inc. (a) | 12,300 | | 337,266 |
CHEMICALS - 0.6% |
Specialty Chemicals - 0.6% |
JSR Corp. | 243,100 | | 4,279,062 |
COMMUNICATIONS EQUIPMENT - 7.3% |
Communications Equipment - 7.3% |
AAC Acoustic Technology Holdings, Inc. | 337,000 | | 984,313 |
Acme Packet, Inc. (a) | 160,875 | | 2,549,869 |
ADTRAN, Inc. | 50,528 | | 1,090,394 |
ADVA AG Optical Networking (a) | 32,102 | | 195,122 |
Aruba Networks, Inc. (a) | 477 | | 6,764 |
Brocade Communications Systems, Inc. (a) | 13,400 | | 66,598 |
Ciena Corp. (a)(d) | 133,329 | | 2,137,264 |
Cisco Systems, Inc. | 936,599 | | 14,938,754 |
Comba Telecom Systems Holdings Ltd. | 187,500 | | 50,534 |
F5 Networks, Inc. (a) | 5,925 | | 553,277 |
Finisar Corp. (a) | 180,918 | | 2,248,811 |
Infinera Corp. (a) | 103,200 | | 569,664 |
JDS Uniphase Corp. (a) | 35,169 | | 346,063 |
Juniper Networks, Inc. (a) | 4,112 | | 72,083 |
Motorola Solutions, Inc. | 18,623 | | 900,236 |
NETGEAR, Inc. (a) | 23,005 | | 796,663 |
Polycom, Inc. (a) | 251,120 | | 2,194,789 |
QUALCOMM, Inc. | 347,064 | | 20,712,780 |
Riverbed Technology, Inc. (a) | 470 | | 8,291 |
Sandvine Corp. (a) | 751,600 | | 877,905 |
Sandvine Corp. (U.K.) (a) | 554,200 | | 641,045 |
Spirent Communications PLC | 28,700 | | 74,336 |
ZTE Corp. (H Shares) | 36,520 | | 48,695 |
| | 52,064,250 |
COMPUTERS & PERIPHERALS - 24.5% |
Computer Hardware - 22.5% |
Advantech Co. Ltd. | 136,000 | | 483,768 |
Apple, Inc. | 250,932 | | 153,259,215 |
Foxconn Technology Co. Ltd. | 60,000 | | 213,427 |
Getac Technology Corp. | 453,000 | | 335,135 |
Hewlett-Packard Co. | 58,165 | | 1,060,930 |
Lenovo Group Ltd. | 1,226,000 | | 850,565 |
Pegatron Corp. | 439,000 | | 576,242 |
Quanta Computer, Inc. | 84,000 | | 219,960 |
|
| Shares | | Value |
Stratasys, Inc. (a) | 40,675 | | $ 2,492,564 |
Wistron Corp. | 298,200 | | 322,203 |
| | 159,814,009 |
Computer Storage & Peripherals - 2.0% |
ADLINK Technology, Inc. | 2,300 | | 2,527 |
Catcher Technology Co. Ltd. | 126,000 | | 610,220 |
EMC Corp. (a) | 161,384 | | 4,229,875 |
Fusion-io, Inc. (a) | 43,200 | | 825,984 |
Gemalto NV | 10,513 | | 805,733 |
NetApp, Inc. (a) | 11,395 | | 372,275 |
SanDisk Corp. (a) | 121,026 | | 4,977,799 |
SIMPLO Technology Co. Ltd. | 36,000 | | 204,409 |
Synaptics, Inc. (a) | 65,513 | | 1,728,233 |
Wacom Co. Ltd. | 160 | | 356,202 |
| | 14,113,257 |
TOTAL COMPUTERS & PERIPHERALS | | 173,927,266 |
DIVERSIFIED CONSUMER SERVICES - 0.0% |
Education Services - 0.0% |
Educomp Solutions Ltd. | 16,123 | | 46,489 |
ELECTRICAL EQUIPMENT - 0.0% |
Electrical Components & Equipment - 0.0% |
Dynapack International Technology Corp. | 14,000 | | 64,295 |
ELECTRONIC EQUIPMENT & COMPONENTS - 2.7% |
Electronic Components - 1.7% |
Aeroflex Holding Corp. (a) | 20,143 | | 121,059 |
Amphenol Corp. Class A | 166 | | 9,774 |
Cheng Uei Precision Industries Co. Ltd. | 73,751 | | 135,481 |
Chimei Innolux Corp. (a) | 16,000 | | 5,104 |
FLEXium Interconnect, Inc. | 75,000 | | 304,359 |
InvenSense, Inc. | 11,134 | | 143,629 |
Largan Precision Co. Ltd. | 24,000 | | 492,986 |
Omron Corp. | 10,400 | | 207,089 |
Taiyo Yuden Co. Ltd. (d) | 7,500 | | 61,487 |
Tong Hsing Electronics Industries Ltd. | 834,000 | | 2,390,020 |
Universal Display Corp. (a)(d) | 210,316 | | 6,679,636 |
Vishay Intertechnology, Inc. (a) | 40,380 | | 398,551 |
Yageo Corp. | 2,014,000 | | 544,870 |
Zhen Ding Technology Holding Ltd. (a) | 61,000 | | 184,182 |
| | 11,678,227 |
Electronic Equipment & Instruments - 0.2% |
Chroma ATE, Inc. | 305,683 | | 684,060 |
Hitachi High-Technologies Corp. | 4,900 | | 121,960 |
Keyence Corp. | 950 | | 236,608 |
National Instruments Corp. | 2,746 | | 70,957 |
RealD, Inc. (a)(d) | 12,949 | | 125,605 |
SFA Engineering Corp. | 1,435 | | 53,432 |
SNU Precision Co. Ltd. (a) | 7,370 | | 48,431 |
Common Stocks - continued |
| Shares | | Value |
ELECTRONIC EQUIPMENT & COMPONENTS - CONTINUED |
Electronic Equipment & Instruments - continued |
Test Research, Inc. | 19,214 | | $ 29,681 |
TPK Holdings Co. | 31,662 | | 354,268 |
| | 1,725,002 |
Electronic Manufacturing Services - 0.7% |
Benchmark Electronics, Inc. (a) | 1,200 | | 18,912 |
Hon Hai Precision Industry Co. Ltd. (Foxconn) | 73,000 | | 206,273 |
IPG Photonics Corp. (a) | 2,200 | | 114,026 |
Jabil Circuit, Inc. | 120,280 | | 2,610,076 |
KEMET Corp. (a) | 1,417 | | 6,844 |
TE Connectivity Ltd. | 7,774 | | 256,620 |
Trimble Navigation Ltd. (a) | 38,311 | | 1,695,645 |
| | 4,908,396 |
Technology Distributors - 0.1% |
Arrow Electronics, Inc. (a) | 53 | | 1,789 |
Digital China Holdings Ltd. (H Shares) | 190,000 | | 296,465 |
VST Holdings Ltd. | 980,000 | | 152,914 |
WPG Holding Co. Ltd. | 111,975 | | 119,305 |
WT Microelectronics Co. Ltd. | 17,000 | | 21,946 |
| | 592,419 |
TOTAL ELECTRONIC EQUIPMENT & COMPONENTS | | 18,904,044 |
HEALTH CARE EQUIPMENT & SUPPLIES - 0.2% |
Health Care Equipment - 0.2% |
Biosensors International Group Ltd. (a) | 1,516,000 | | 1,498,457 |
China Kanghui Holdings sponsored ADR (a) | 200 | | 4,506 |
| | 1,502,963 |
HEALTH CARE TECHNOLOGY - 0.1% |
Health Care Technology - 0.1% |
athenahealth, Inc. (a) | 600 | | 54,900 |
So-net M3, Inc. | 93 | | 483,188 |
| | 538,088 |
HOUSEHOLD DURABLES - 0.0% |
Household Appliances - 0.0% |
Haier Electronics Group Co. Ltd. (a) | 17,000 | | 19,708 |
HOUSEHOLD PRODUCTS - 0.0% |
Household Products - 0.0% |
NVC Lighting Holdings Ltd. | 180,000 | | 32,729 |
INDUSTRIAL CONGLOMERATES - 0.1% |
Industrial Conglomerates - 0.1% |
Samsung Techwin Co. Ltd. | 8,218 | | 530,583 |
INTERNET & CATALOG RETAIL - 1.2% |
Internet Retail - 1.2% |
Amazon.com, Inc. (a) | 18,972 | | 4,426,168 |
E-Commerce China Dangdang, Inc. ADR (a) | 260 | | 1,310 |
|
| Shares | | Value |
Expedia, Inc. | 9,086 | | $ 517,811 |
Rakuten, Inc. | 284,400 | | 2,829,531 |
Start Today Co. Ltd. | 48,200 | | 637,763 |
TripAdvisor, Inc. (a) | 9,000 | | 336,690 |
| | 8,749,273 |
INTERNET SOFTWARE & SERVICES - 9.9% |
Internet Software & Services - 9.9% |
Active Network, Inc. (a) | 45,018 | | 638,805 |
Akamai Technologies, Inc. (a) | 65,627 | | 2,308,758 |
Baidu.com, Inc. sponsored ADR (a) | 559 | | 67,371 |
Bankrate, Inc. (a) | 21,500 | | 342,925 |
Bazaarvoice, Inc. (d) | 2,800 | | 43,400 |
Cornerstone OnDemand, Inc. (a) | 55,000 | | 1,307,900 |
DealerTrack Holdings, Inc. (a) | 12,300 | | 358,791 |
eBay, Inc. (a) | 317,148 | | 14,049,656 |
ExactTarget, Inc. (d) | 15,800 | | 360,240 |
Facebook, Inc.: | | | |
Class A | 240 | | 5,210 |
Class B (a)(f) | 37,876 | | 740,059 |
Google, Inc. Class A (a) | 58,790 | | 37,212,306 |
INFO Edge India Ltd. | 35,836 | | 207,205 |
Kakaku.com, Inc. | 25,600 | | 814,593 |
LogMeIn, Inc. (a) | 22,279 | | 422,187 |
Mail.ru Group Ltd. GDR (a)(e) | 1,800 | | 54,576 |
MercadoLibre, Inc. | 13,834 | | 924,250 |
Millennial Media, Inc. (d) | 32,200 | | 319,746 |
NHN Corp. | 2,044 | | 497,139 |
Open Text Corp. (a) | 100 | | 4,518 |
Qihoo 360 Technology Co. Ltd. ADR (a)(d) | 20,200 | | 297,142 |
Rackspace Hosting, Inc. (a) | 40,569 | | 1,780,168 |
Renren, Inc. ADR (a)(d) | 5,900 | | 22,125 |
Responsys, Inc. (a) | 114,840 | | 1,280,466 |
SciQuest, Inc. (a) | 51,877 | | 882,947 |
SINA Corp. (a)(d) | 1,526 | | 69,296 |
SouFun Holdings Ltd. ADR (d) | 47,370 | | 561,808 |
Tencent Holdings Ltd. | 23,300 | | 696,473 |
Tudou Holdings Ltd. ADR | 59,559 | | 1,570,571 |
Velti PLC (a) | 10,736 | | 58,511 |
VeriSign, Inc. (a) | 8,090 | | 359,358 |
Vocus, Inc. (a) | 84,600 | | 1,463,580 |
XO Group, Inc. (a) | 5,200 | | 44,772 |
Yahoo!, Inc. (a) | 4,568 | | 72,357 |
Yandex NV (a) | 16,176 | | 311,064 |
| | 70,150,273 |
IT SERVICES - 9.6% |
Data Processing & Outsourced Services - 5.3% |
Automatic Data Processing, Inc. | 40,907 | | 2,313,291 |
Fidelity National Information Services, Inc. | 55,105 | | 1,732,501 |
Fiserv, Inc. (a) | 9,900 | | 694,287 |
Global Payments, Inc. | 32,400 | | 1,387,368 |
Common Stocks - continued |
| Shares | | Value |
IT SERVICES - CONTINUED |
Data Processing & Outsourced Services - continued |
Jack Henry & Associates, Inc. | 22,692 | | $ 788,093 |
MasterCard, Inc. Class A | 6,666 | | 2,910,176 |
Paychex, Inc. | 2,300 | | 75,187 |
Syntel, Inc. | 7,600 | | 441,788 |
VeriFone Systems, Inc. (a) | 1,944 | | 70,548 |
Visa, Inc. Class A | 211,550 | | 27,304,759 |
| | 37,717,998 |
IT Consulting & Other Services - 4.3% |
Accenture PLC Class A | 39,376 | | 2,374,373 |
Bit-isle, Inc. | 1,600 | | 13,215 |
Camelot Information Systems, Inc. ADR (a) | 145 | | 305 |
ChinaSoft International Ltd. (a) | 20,000 | | 4,281 |
Cognizant Technology Solutions Corp. Class A (a) | 6,089 | | 345,673 |
HiSoft Technology International Ltd. ADR (a) | 11,117 | | 125,400 |
IBM Corp. | 108,717 | | 21,306,358 |
InterXion Holding N.V. (a) | 10,000 | | 192,500 |
ServiceSource International, Inc. (a)(d) | 472,081 | | 5,325,074 |
Teradata Corp. (a) | 11,046 | | 746,931 |
Virtusa Corp. (a) | 11,200 | | 169,680 |
| | 30,603,790 |
TOTAL IT SERVICES | | 68,321,788 |
LIFE SCIENCES TOOLS & SERVICES - 0.2% |
Life Sciences Tools & Services - 0.2% |
Illumina, Inc. (a)(d) | 29,106 | | 1,207,026 |
WuXi PharmaTech Cayman, Inc. sponsored ADR (a) | 27,300 | | 369,096 |
| | 1,576,122 |
MACHINERY - 0.4% |
Industrial Machinery - 0.4% |
Airtac International Group | 179,000 | | 908,751 |
Fanuc Corp. | 800 | | 123,511 |
HIWIN Technologies Corp. | 71,390 | | 661,681 |
Mirle Automation Corp. | 95,738 | | 62,354 |
Nippon Thompson Co. Ltd. | 149,000 | | 640,230 |
Shin Zu Shing Co. Ltd. | 247,000 | | 709,486 |
| | 3,106,013 |
MEDIA - 0.5% |
Advertising - 0.4% |
Dentsu, Inc. | 200 | | 5,309 |
Focus Media Holding Ltd. ADR (d) | 148,882 | | 2,944,886 |
ReachLocal, Inc. (a) | 1,558 | | 18,260 |
| | 2,968,455 |
Cable & Satellite - 0.1% |
DISH Network Corp. Class A | 12,360 | | 380,194 |
|
| Shares | | Value |
Movies & Entertainment - 0.0% |
IMAX Corp. (a) | 6,530 | | $ 144,705 |
TOTAL MEDIA | | 3,493,354 |
OFFICE ELECTRONICS - 0.0% |
Office Electronics - 0.0% |
Xerox Corp. | 8,333 | | 57,748 |
PHARMACEUTICALS - 0.1% |
Pharmaceuticals - 0.1% |
China Medical System Holding Ltd. | 1,259,250 | | 623,560 |
PROFESSIONAL SERVICES - 0.1% |
Research & Consulting Services - 0.1% |
Acacia Research Corp. - Acacia Technologies (a) | 8,600 | | 243,466 |
IHS, Inc. Class A (a) | 6,800 | | 749,836 |
| | 993,302 |
REAL ESTATE MANAGEMENT & DEVELOPMENT - 0.0% |
Real Estate Services - 0.0% |
E-House China Holdings Ltd. ADR | 70,929 | | 334,076 |
SEMICONDUCTORS & SEMICONDUCTOR EQUIPMENT - 14.9% |
Semiconductor Equipment - 2.2% |
Advanced Energy Industries, Inc. (a) | 5,757 | | 70,926 |
Amkor Technology, Inc. (a)(d) | 1,594 | | 8,496 |
Applied Materials, Inc. | 6,662 | | 72,549 |
Asia Pacific Systems, Inc. (a) | 13,929 | | 136,128 |
ASM International NV: | | | |
unit | 63,458 | | 2,404,424 |
(Netherlands) | 37,200 | | 1,412,718 |
ASML Holding NV | 60,335 | | 3,469,263 |
Cymer, Inc. (a) | 56,354 | | 3,224,012 |
Dainippon Screen Manufacturing Co. Ltd. | 18,000 | | 120,240 |
Entegris, Inc. (a) | 106,908 | | 860,609 |
GCL-Poly Energy Holdings Ltd. | 32,000 | | 4,746 |
GT Advanced Technologies, Inc. (a) | 1,264 | | 6,472 |
ICD Co. Ltd. | 17,376 | | 199,782 |
KLA-Tencor Corp. | 1,534 | | 78,096 |
Lam Research Corp. (a) | 1,989 | | 68,441 |
Micronics Japan Co. Ltd. | 34,800 | | 119,143 |
Rubicon Technology, Inc. (a) | 679 | | 6,824 |
Teradyne, Inc. (a) | 23,920 | | 351,863 |
Ultratech, Inc. (a) | 59,227 | | 1,884,011 |
Visual Photonics Epitaxy Co. Ltd. | 626,800 | | 933,710 |
| | 15,432,453 |
Semiconductors - 12.7% |
Advanced Micro Devices, Inc. (a) | 1,157 | | 4,697 |
Alpha & Omega Semiconductor Ltd. (a) | 8,432 | | 65,011 |
Altera Corp. | 371,889 | | 13,183,465 |
Analog Devices, Inc. | 1,873 | | 73,197 |
Applied Micro Circuits Corp. (a) | 157,393 | | 900,288 |
Common Stocks - continued |
| Shares | | Value |
SEMICONDUCTORS & SEMICONDUCTOR EQUIPMENT - CONTINUED |
Semiconductors - continued |
ARM Holdings PLC sponsored ADR | 3,019 | | $ 78,434 |
Atmel Corp. (a) | 11,522 | | 67,519 |
Avago Technologies Ltd. | 62,995 | | 2,330,815 |
Broadcom Corp. Class A | 253,285 | | 8,581,296 |
Canadian Solar, Inc. (a) | 32 | | 85 |
Cavium, Inc. (a)(d) | 166,300 | | 4,493,426 |
Cirrus Logic, Inc. (a) | 120,397 | | 4,426,998 |
Cree, Inc. (a)(d) | 479,416 | | 11,482,013 |
Cypress Semiconductor Corp. | 5,622 | | 60,099 |
Dialog Semiconductor PLC (a) | 31,666 | | 609,168 |
Diodes, Inc. (a) | 370 | | 7,008 |
Duksan Hi-Metal Co. Ltd. (a) | 13,744 | | 257,091 |
Epistar Corp. | 2,000 | | 3,754 |
Fairchild Semiconductor International, Inc. (a) | 565 | | 7,831 |
Freescale Semiconductor Holdings I Ltd. (a) | 692 | | 7,384 |
Genesis Photonics, Inc. | 15,000 | | 13,026 |
Hittite Microwave Corp. (a) | 6,029 | | 305,489 |
Imagination Technologies Group PLC (a) | 403,859 | | 3,172,284 |
Infineon Technologies AG | 10,500 | | 76,598 |
Inotera Memories, Inc. (a) | 3,139,000 | | 596,557 |
Inphi Corp. (a) | 41,784 | | 459,624 |
International Rectifier Corp. (a) | 19,349 | | 329,707 |
Intersil Corp. Class A | 71,923 | | 662,411 |
JA Solar Holdings Co. Ltd. ADR (a) | 40,931 | | 38,189 |
LSI Corp. (a) | 227,201 | | 1,567,687 |
MagnaChip Semiconductor Corp. (a) | 7,844 | | 79,852 |
Marvell Technology Group Ltd. | 566 | | 6,373 |
MediaTek, Inc. | 169,000 | | 1,439,379 |
Mellanox Technologies Ltd. (a) | 17,000 | | 1,782,620 |
Micrel, Inc. | 7,241 | | 67,631 |
Micron Technology, Inc. (a) | 705,995 | | 4,384,229 |
Microsemi Corp. (a) | 4,100 | | 79,376 |
Monolithic Power Systems, Inc. (a) | 66,633 | | 1,291,348 |
MStar Semiconductor, Inc. | 394,000 | | 2,520,074 |
Novatek Microelectronics Corp. | 81,000 | | 236,994 |
NVIDIA Corp. (a) | 6,070 | | 82,188 |
NXP Semiconductors NV (a) | 244,929 | | 5,532,946 |
O2Micro International Ltd. sponsored ADR (a) | 14,600 | | 56,648 |
Omnivision Technologies, Inc. (a) | 93,100 | | 1,305,262 |
ON Semiconductor Corp. (a) | 9,446 | | 65,555 |
Phison Electronics Corp. | 61,000 | | 499,165 |
PMC-Sierra, Inc. (a) | 59,184 | | 314,859 |
Power Integrations, Inc. | 26,300 | | 926,812 |
Radiant Opto-Electronics Corp. | 15,000 | | 59,118 |
Rambus, Inc. (a) | 165,107 | | 693,449 |
RF Micro Devices, Inc. (a) | 156,888 | | 608,725 |
Samsung Electronics Co. Ltd. | 350 | | 405,202 |
Semtech Corp. (a) | 15,100 | | 360,739 |
|
| Shares | | Value |
Seoul Semiconductor Co. Ltd. | 11,191 | | $ 210,820 |
Silicon Laboratories, Inc. (a) | 1,700 | | 62,815 |
SK Hynix, Inc. | 56,590 | | 1,086,084 |
Skyworks Solutions, Inc. (a) | 171,751 | | 4,968,756 |
Spreadtrum Communications, Inc. ADR (d) | 178,768 | | 3,232,125 |
Standard Microsystems Corp. (a) | 46,071 | | 1,700,481 |
STMicroelectronics NV | 16,900 | | 90,668 |
STMicroelectronics NV (NY Shares) unit | 160,200 | | 858,672 |
Taiwan Surface Mounting Technology Co. Ltd. | 107,320 | | 166,142 |
Texas Instruments, Inc. | 12,950 | | 352,758 |
Trina Solar Ltd. (a)(d) | 10,094 | | 47,644 |
TriQuint Semiconductor, Inc. (a) | 78,814 | | 444,511 |
United Microelectronics Corp. | 4,000 | | 1,673 |
Vanguard International Semiconductor Corp. | 17,000 | | 7,154 |
Win Semiconductors Corp. | 225,433 | | 266,544 |
Xilinx, Inc. | 244 | | 7,906 |
YoungTek Electronics Corp. | 1,146 | | 2,855 |
| | 90,167,303 |
TOTAL SEMICONDUCTORS & SEMICONDUCTOR EQUIPMENT | | 105,599,756 |
SOFTWARE - 17.6% |
Application Software - 9.5% |
Adobe Systems, Inc. (a) | 22,086 | | 682,016 |
ANSYS, Inc. (a) | 28,853 | | 1,730,026 |
AsiaInfo-Linkage, Inc. (a) | 202,188 | | 2,070,405 |
Aspen Technology, Inc. (a) | 204,102 | | 4,771,905 |
Autodesk, Inc. (a) | 15,108 | | 512,463 |
AutoNavi Holdings Ltd. ADR (a) | 5,621 | | 69,532 |
BroadSoft, Inc. (a)(d) | 86,165 | | 2,115,351 |
Citrix Systems, Inc. (a) | 137,795 | | 10,014,941 |
Comverse Technology, Inc. (a) | 47,105 | | 255,780 |
Concur Technologies, Inc. (a) | 46,598 | | 3,147,229 |
Descartes Systems Group, Inc. (a) | 139,200 | | 1,159,017 |
Informatica Corp. (a) | 69,036 | | 2,037,252 |
Intuit, Inc. | 12,136 | | 704,131 |
JDA Software Group, Inc. (a) | 12,441 | | 368,005 |
Jive Software, Inc. | 1,700 | | 34,051 |
Kingdee International Software Group Co. Ltd. (a) | 9,630,800 | | 1,117,738 |
Manhattan Associates, Inc. (a) | 97 | | 4,529 |
MicroStrategy, Inc. Class A (a) | 16,961 | | 1,975,278 |
Nuance Communications, Inc. (a) | 155,639 | | 3,167,254 |
Parametric Technology Corp. (a) | 201,585 | | 4,342,141 |
Pegasystems, Inc. (d) | 79,252 | | 2,201,621 |
PROS Holdings, Inc. (a) | 8,633 | | 120,344 |
QLIK Technologies, Inc. (a) | 79,587 | | 1,591,740 |
RealPage, Inc. (a) | 4,600 | | 102,212 |
salesforce.com, Inc. (a) | 135,653 | | 16,869,807 |
SolarWinds, Inc. (a) | 43,114 | | 2,301,856 |
Common Stocks - continued |
| Shares | | Value |
SOFTWARE - CONTINUED |
Application Software - continued |
Splunk, Inc. | 200 | | $ 5,880 |
Synchronoss Technologies, Inc. (a) | 92,548 | | 1,769,518 |
Synopsys, Inc. (a) | 2,500 | | 75,725 |
TIBCO Software, Inc. (a) | 37,780 | | 1,061,240 |
TiVo, Inc. (a) | 8,000 | | 69,520 |
VanceInfo Technologies, Inc. ADR (a)(d) | 78,953 | | 750,843 |
| | 67,199,350 |
Home Entertainment Software - 0.6% |
Activision Blizzard, Inc. | 46,300 | | 556,989 |
Capcom Co. Ltd. | 76,500 | | 1,555,958 |
Giant Interactive Group, Inc. ADR (d) | 388,429 | | 1,751,815 |
Nintendo Co. Ltd. | 600 | | 66,745 |
Take-Two Interactive Software, Inc. (a) | 64,262 | | 564,220 |
| | 4,495,727 |
Systems Software - 7.5% |
Allot Communications Ltd. (a) | 27,500 | | 675,950 |
Ariba, Inc. (a) | 80,599 | | 3,581,014 |
BMC Software, Inc. (a) | 43,366 | | 1,717,294 |
Check Point Software Technologies Ltd. (a) | 1,413 | | 68,629 |
CommVault Systems, Inc. (a) | 51,744 | | 2,510,619 |
Fortinet, Inc. (a) | 70,542 | | 1,693,713 |
Infoblox, Inc. | 3,000 | | 63,030 |
Insyde Software Corp. | 31,000 | | 111,306 |
Microsoft Corp. | 357,471 | | 10,534,670 |
NetSuite, Inc. (a) | 39,618 | | 2,192,460 |
Oracle Corp. | 396,058 | | 11,960,952 |
Progress Software Corp. (a) | 17,578 | | 341,716 |
Red Hat, Inc. (a) | 118,534 | | 6,360,534 |
ServiceNow, Inc. | 1,800 | | 48,600 |
Sourcefire, Inc. (a) | 14,743 | | 752,630 |
Symantec Corp. (a) | 285,048 | | 4,489,506 |
Totvs SA | 80,000 | | 1,475,698 |
VMware, Inc. Class A (a) | 55,146 | | 5,005,051 |
| | 53,583,372 |
TOTAL SOFTWARE | | 125,278,449 |
WIRELESS TELECOMMUNICATION SERVICES - 0.6% |
Wireless Telecommunication Services - 0.6% |
SBA Communications Corp. Class A (a) | 69,529 | | 4,106,383 |
TOTAL COMMON STOCKS (Cost $615,280,200) |
646,689,643
|
Convertible Bonds - 0.5% |
| Principal Amount | | |
COMMUNICATIONS EQUIPMENT - 0.2% |
Communications Equipment - 0.2% |
Ciena Corp. 0.25% 5/1/13 | | $ 1,270,000 | | 1,261,237 |
|
| Principal Amount | | Value |
SEMICONDUCTORS & SEMICONDUCTOR EQUIPMENT - 0.3% |
Semiconductors - 0.3% |
JA Solar Holdings Co. Ltd. 4.5% 5/15/13 | | $ 2,179,000 | | $ 1,993,785 |
TOTAL CONVERTIBLE BONDS (Cost $3,143,432) |
3,255,022
|
Master Notes - 0.0% |
|
OZ Optics Ltd. 5% 11/5/14 (f)
(Cost $183,336) | | 180,662 | |
180,662
|
Money Market Funds - 12.6% |
| Shares | | |
Fidelity Cash Central Fund, 0.17% (b) | 58,879,985 | | 58,879,985 |
Fidelity Securities Lending Cash Central Fund, 0.18% (b)(c) | 30,624,219 | | 30,624,219 |
TOTAL MONEY MARKET FUNDS (Cost $89,504,204) |
89,504,204
|
TOTAL INVESTMENT PORTFOLIO - 104.1% (Cost $708,111,172) | | 739,629,531 |
NET OTHER ASSETS (LIABILITIES) - (4.1)% | | (29,367,507) |
NET ASSETS - 100% | $ 710,262,024 |
Legend |
(a) Non-income producing |
(b) Affiliated fund that is available only to investment companies and other accounts managed by Fidelity Investments. The rate quoted is the annualized seven-day yield of the fund at period end. A complete unaudited listing of the fund's holdings as of its most recent quarter end is available upon request. In addition, each Fidelity Central Fund's financial statements, which are not covered by the Fund's Report of Independent Registered Public Accounting Firm, are available on the SEC's website or upon request. |
(c) Investment made with cash collateral received from securities on loan. |
(d) Security or a portion of the security is on loan at period end. |
(e) Security exempt from registration under Rule 144A of the Securities Act of 1933. These securities may be resold in transactions exempt from registration, normally to qualified institutional buyers. At the end of the period, the value of these securities amounted to $54,576 or 0.0% of net assets. |
(f) Restricted securities - Investment in securities not registered under the Securities Act of 1933 (excluding 144A issues). At the end of the period, the value of restricted securities (excluding 144A issues) amounted to $920,722 or 0.1% of net assets. |
Additional information on each restricted holding is as follows: |
Security | Acquisition Date | Acquisition Cost |
Facebook, Inc. Class B | 3/31/11 - 5/19/11 | $ 947,157 |
OZ Optics Ltd. 5% 11/5/14 | 11/5/10 | $ 185,227 |
Affiliated Central Funds |
Information regarding fiscal year to date income earned by the Fund from investments in Fidelity Central Funds is as follows: |
Fund | Income earned |
Fidelity Cash Central Fund | $ 55,296 |
Fidelity Securities Lending Cash Central Fund | 563,228 |
Total | $ 618,524 |
Other Information |
The following is a summary of the inputs used, as of July 31, 2012, involving the Fund's assets and liabilities carried at fair value. The inputs or methodology used for valuing securities may not be an indication of the risk associated with investing in those securities. For more information on valuation inputs, and their aggregation into the levels used in the table below, please refer to the Security Valuation section in the accompanying Notes to Financial Statements. |
Valuation Inputs at Reporting Date: |
Description | Total | Level 1 | Level 2 | Level 3 |
Investments in Securities: | | | | |
Common Stocks | $ 646,689,643 | $ 633,152,680 | $ 13,504,234 | $ 32,729 |
Convertible Bonds | 3,255,022 | - | 3,255,022 | - |
Master Notes | 180,662 | - | - | 180,662 |
Money Market Funds | 89,504,204 | 89,504,204 | - | - |
Total Investments in Securities: | $ 739,629,531 | $ 722,656,884 | $ 16,759,256 | $ 213,391 |
The following is a summary of transfers between Level 1 and Level 2 for the period ended July 31, 2012. Transfers are assumed to have occurred at the beginning of the period, and are primarily attributable to the valuation techniques used for foreign equity securities, as discussed in the accompanying Notes to Financial Statements: |
Transfers | Total |
Level 1 to Level 2 | $ 7,775,532 |
Level 2 to Level 1 | $ - |
Distribution of investments by country or territory of incorporation, as a percentage of total net assets, is as follows. (Unaudited) |
United States of America | 88.5% |
Cayman Islands | 2.9% |
Netherlands | 2.1% |
Taiwan | 1.7% |
Japan | 1.7% |
Others (Individually Less Than 1%) | 3.1% |
| 100.0% |
See accompanying notes which are an integral part of the financial statements.
Annual Report
Fidelity Advisor Technology Fund
Statement of Assets and Liabilities
| July 31, 2012 |
| | |
Assets | | |
Investment in securities, at value (including securities loaned of $29,733,355) - See accompanying schedule: Unaffiliated issuers (cost $618,606,968) | $ 650,125,327 | |
Fidelity Central Funds (cost $89,504,204) | 89,504,204 | |
Total Investments (cost $708,111,172) | | $ 739,629,531 |
Receivable for investments sold | | 13,437,674 |
Receivable for fund shares sold | | 234,920 |
Dividends receivable | | 418,973 |
Interest receivable | | 37,209 |
Distributions receivable from Fidelity Central Funds | | 26,513 |
Other receivables | | 33,608 |
Total assets | | 753,818,428 |
| | |
Liabilities | | |
Payable to custodian bank | $ 215 | |
Payable for investments purchased | 10,619,841 | |
Payable for fund shares redeemed | 1,501,342 | |
Accrued management fee | 328,034 | |
Distribution and service plan fees payable | 228,758 | |
Other affiliated payables | 191,808 | |
Other payables and accrued expenses | 62,187 | |
Collateral on securities loaned, at value | 30,624,219 | |
Total liabilities | | 43,556,404 |
| | |
Net Assets | | $ 710,262,024 |
Net Assets consist of: | | |
Paid in capital | | $ 806,641,990 |
Accumulated net investment loss | | (2,745,337) |
Accumulated undistributed net realized gain (loss) on investments and foreign currency transactions | | (125,154,107) |
Net unrealized appreciation (depreciation) on investments and assets and liabilities in foreign currencies | | 31,519,478 |
Net Assets | | $ 710,262,024 |
Statement of Assets and Liabilities - continued
| July 31, 2012 |
| | |
Calculation of Maximum Offering Price Class A:
Net Asset Value and redemption price per share ($336,692,832 ÷ 13,333,428 shares) | | $ 25.25 |
| | |
Maximum offering price per share (100/94.25 of $25.25) | | $ 26.79 |
Class T:
Net Asset Value and redemption price per share ($172,708,820 ÷ 7,084,653 shares) | | $ 24.38 |
| | |
Maximum offering price per share (100/96.50 of $24.38) | | $ 25.26 |
Class B:
Net Asset Value and offering price per share ($17,476,122 ÷ 773,220 shares)A | | $ 22.60 |
| | |
Class C:
Net Asset Value and offering price per share ($88,074,296 ÷ 3,879,255 shares)A | | $ 22.70 |
| | |
Institutional Class:
Net Asset Value, offering price and redemption price per share ($95,309,954 ÷ 3,596,895 shares) | | $ 26.50 |
A Redemption price per share is equal to net asset value less any applicable contingent deferred sales charge.
See accompanying notes which are an integral part of the financial statements.
Annual Report
Statement of Operations
| Year ended July 31, 2012 |
| | |
Investment Income | | |
Dividends | | $ 3,436,093 |
Interest | | 367,647 |
Income from Fidelity Central Funds (including $563,228 from security lending) | | 618,524 |
Total income | | 4,422,264 |
| | |
Expenses | | |
Management fee | $ 4,003,607 | |
Transfer agent fees | 2,091,380 | |
Distribution and service plan fees | 2,805,168 | |
Accounting and security lending fees | 261,338 | |
Custodian fees and expenses | 109,964 | |
Independent trustees' compensation | 4,863 | |
Registration fees | 88,559 | |
Audit | 54,104 | |
Legal | 3,271 | |
Miscellaneous | 7,711 | |
Total expenses before reductions | 9,429,965 | |
Expense reductions | (121,625) | 9,308,340 |
Net investment income (loss) | | (4,886,076) |
Realized and Unrealized Gain (Loss) Net realized gain (loss) on: | | |
Investment securities: | | |
Unaffiliated issuers | 13,607,206 | |
Foreign currency transactions | (41,554) | |
Total net realized gain (loss) | | 13,565,652 |
Change in net unrealized appreciation (depreciation) on: Investment securities | (12,833,312) | |
Assets and liabilities in foreign currencies | (1,891) | |
Total change in net unrealized appreciation (depreciation) | | (12,835,203) |
Net gain (loss) | | 730,449 |
Net increase (decrease) in net assets resulting from operations | | $ (4,155,627) |
Statement of Changes in Net Assets
| Year ended
July 31,
2012 | Year ended
July 31,
2011 |
Increase (Decrease) in Net Assets | | |
Operations | | |
Net investment income (loss) | $ (4,886,076) | $ (6,857,636) |
Net realized gain (loss) | 13,565,652 | 189,083,406 |
Change in net unrealized appreciation (depreciation) | (12,835,203) | (20,605,446) |
Net increase (decrease) in net assets resulting from operations | (4,155,627) | 161,620,324 |
Share transactions - net increase (decrease) | (54,812,282) | (15,631,022) |
Redemption fees | 30,293 | 32,306 |
Total increase (decrease) in net assets | (58,937,616) | 146,021,608 |
| | |
Net Assets | | |
Beginning of period | 769,199,640 | 623,178,032 |
End of period (including accumulated net investment loss of $2,745,337 and accumulated net investment loss of $24, respectively) | $ 710,262,024 | $ 769,199,640 |
See accompanying notes which are an integral part of the financial statements.
Annual Report
Financial Highlights - Class A
Years ended July 31, | 2012 | 2011 | 2010 | 2009 | 2008 |
Selected Per-Share Data | | | | | |
Net asset value, beginning of period | $ 25.14 | $ 19.83 | $ 16.03 | $ 17.04 | $ 20.55 |
Income from Investment Operations | | | | | |
Net investment income (loss) C | (.13) | (.18) | (.16) | .02 F | (.10) |
Net realized and unrealized gain (loss) | .24 | 5.49 | 3.96 | (1.03) | (3.41) |
Total from investment operations | .11 | 5.31 | 3.80 | (1.01) | (3.51) |
Redemption fees added to paid in capital C,H | - | - | - | - | - |
Net asset value, end of period | $ 25.25 | $ 25.14 | $ 19.83 | $ 16.03 | $ 17.04 |
Total Return A, B | .44% | 26.78% | 23.71% | (5.93)% | (17.08)% |
Ratios to Average Net Assets D, G | | | | | |
Expenses before reductions | 1.18% | 1.18% | 1.21% | 1.23% | 1.21% |
Expenses net of fee waivers, if any | 1.18% | 1.18% | 1.21% | 1.23% | 1.21% |
Expenses net of all reductions | 1.17% | 1.16% | 1.18% | 1.22% | 1.19% |
Net investment income (loss) | (.55)% | (.73)% | (.83)% | .17% F | (.49)% |
Supplemental Data | | | | | |
Net assets, end of period (000 omitted) | $ 336,693 | $ 375,609 | $ 312,659 | $ 258,433 | $ 275,117 |
Portfolio turnover rate E | 201% | 167% | 115% | 225% | 214% |
A Total returns would have been lower if certain expenses had not been reduced during the applicable periods shown.
B Total returns do not include the effect of the sales charges.
C Calculated based on average shares outstanding during the period.
D Fees and expenses of any underlying Fidelity Central Funds are not included in the Fund's expense ratio. The Fund indirectly bears its proportionate share of the expenses of any underlying Fidelity Central Funds.
E Amount does not include the portfolio activity of any underlying Fidelity Central Funds.
F Investment income per share reflects a large, non-recurring dividend which amounted to $.04 per share. Excluding this non-recurring dividend, the ratio of net investment income (loss) to average net assets would have been (.18)%.
G Expense ratios reflect operating expenses of the class. Expenses before reductions do not reflect amounts reimbursed by the investment adviser or reductions from brokerage service arrangements or reductions from other expense offset arrangements and do not represent the amount paid by the class during periods when reimbursements or reductions occur. Expenses net of fee waivers reflect expenses after reimbursement by the investment adviser but prior to reductions from brokerage service arrangements or other expense offset arrangements. Expenses net of all reductions represent the net expenses paid by the class.
H Amount represents less than $.01 per share.
Financial Highlights - Class T
Years ended July 31, | 2012 | 2011 | 2010 | 2009 | 2008 |
Selected Per-Share Data | | | | | |
Net asset value, beginning of period | $ 24.33 | $ 19.24 | $ 15.59 | $ 16.62 | $ 20.09 |
Income from Investment Operations | | | | | |
Net investment income (loss) C | (.19) | (.23) | (.20) | (.01) F | (.14) |
Net realized and unrealized gain (loss) | .24 | 5.32 | 3.85 | (1.02) | (3.33) |
Total from investment operations | .05 | 5.09 | 3.65 | (1.03) | (3.47) |
Redemption fees added to paid in capital C,H | - | - | - | - | - |
Net asset value, end of period | $ 24.38 | $ 24.33 | $ 19.24 | $ 15.59 | $ 16.62 |
Total Return A, B | .21% | 26.46% | 23.41% | (6.20)% | (17.27)% |
Ratios to Average Net Assets D, G | | | | | |
Expenses before reductions | 1.43% | 1.43% | 1.46% | 1.49% | 1.46% |
Expenses net of fee waivers, if any | 1.43% | 1.43% | 1.46% | 1.49% | 1.46% |
Expenses net of all reductions | 1.42% | 1.40% | 1.44% | 1.48% | 1.45% |
Net investment income (loss) | (.80)% | (.98)% | (1.09)% | (.09)% F | (.74)% |
Supplemental Data | | | | | |
Net assets, end of period (000 omitted) | $ 172,709 | $ 196,913 | $ 169,049 | $ 151,170 | $ 173,917 |
Portfolio turnover rate E | 201% | 167% | 115% | 225% | 214% |
A Total returns would have been lower if certain expenses had not been reduced during the applicable periods shown.
B Total returns do not include the effect of the sales charges.
C Calculated based on average shares outstanding during the period.
D Fees and expenses of any underlying Fidelity Central Funds are not included in the Fund's expense ratio. The Fund indirectly bears its proportionate share of the expenses of any underlying Fidelity Central Funds.
E Amount does not include the portfolio activity of any underlying Fidelity Central Funds.
F Investment income per share reflects a large, non-recurring dividend which amounted to $.04 per share. Excluding this non-recurring dividend, the ratio of net investment income (loss) to average net assets would have been (.44)%.
G Expense ratios reflect operating expenses of the class. Expenses before reductions do not reflect amounts reimbursed by the investment adviser or reductions from brokerage service arrangements or reductions from other expense offset arrangements and do not represent the amount paid by the class during periods when reimbursements or reductions occur. Expenses net of fee waivers reflect expenses after reimbursement by the investment adviser but prior to reductions from brokerage service arrangements or other expense offset arrangements. Expenses net of all reductions represent the net expenses paid by the class.
H Amount represents less than $.01 per share.
See accompanying notes which are an integral part of the financial statements.
Annual Report
Financial Highlights - Class B
Years ended July 31, | 2012 | 2011 | 2010 | 2009 | 2008 |
Selected Per-Share Data | | | | | |
Net asset value, beginning of period | $ 22.67 | $ 18.01 | $ 14.67 | $ 15.72 | $ 19.10 |
Income from Investment Operations | | | | | |
Net investment income (loss) C | (.28) | (.33) | (.27) | (.07) F | (.23) |
Net realized and unrealized gain (loss) | .21 | 4.99 | 3.61 | (.98) | (3.15) |
Total from investment operations | (.07) | 4.66 | 3.34 | (1.05) | (3.38) |
Redemption fees added to paid in capital C,H | - | - | - | - | - |
Net asset value, end of period | $ 22.60 | $ 22.67 | $ 18.01 | $ 14.67 | $ 15.72 |
Total Return A, B | (.31)% | 25.87% | 22.77% | (6.68)% | (17.70)% |
Ratios to Average Net Assets D, G | | | | | |
Expenses before reductions | 1.93% | 1.93% | 1.96% | 1.98% | 1.96% |
Expenses net of fee waivers, if any | 1.93% | 1.93% | 1.96% | 1.98% | 1.96% |
Expenses net of all reductions | 1.92% | 1.91% | 1.94% | 1.97% | 1.94% |
Net investment income (loss) | (1.30)% | (1.49)% | (1.59)% | (.58)% F | (1.24)% |
Supplemental Data | | | | | |
Net assets, end of period (000 omitted) | $ 17,476 | $ 25,508 | $ 29,176 | $ 30,580 | $ 47,294 |
Portfolio turnover rate E | 201% | 167% | 115% | 225% | 214% |
A Total returns would have been lower if certain expenses had not been reduced during the applicable periods shown.
B Total returns do not include the effect of the contingent deferred sales charge.
C Calculated based on average shares outstanding during the period.
D Fees and expenses of any underlying Fidelity Central Funds are not included in the Fund's expense ratio. The Fund indirectly bears its proportionate share of the expenses of any underlying Fidelity Central Funds.
E Amount does not include the portfolio activity of any underlying Fidelity Central Funds.
F Investment income per share reflects a large, non-recurring dividend which amounted to $.04 per share. Excluding this non-recurring dividend, the ratio of net investment income (loss) to average net assets would have been (.93)%.
G Expense ratios reflect operating expenses of the class. Expenses before reductions do not reflect amounts reimbursed by the investment adviser or reductions from brokerage service arrangements or reductions from other expense offset arrangements and do not represent the amount paid by the class during periods when reimbursements or reductions occur. Expenses net of fee waivers reflect expenses after reimbursement by the investment adviser but prior to reductions from brokerage service arrangements or other expense offset arrangements. Expenses net of all reductions represent the net expenses paid by the class.
H Amount represents less than $.01 per share.
Financial Highlights - Class C
Years ended July 31, | 2012 | 2011 | 2010 | 2009 | 2008 |
Selected Per-Share Data | | | | | |
Net asset value, beginning of period | $ 22.77 | $ 18.09 | $ 14.74 | $ 15.79 | $ 19.18 |
Income from Investment Operations | | | | | |
Net investment income (loss) C | (.29) | (.33) | (.28) | (.07) F | (.23) |
Net realized and unrealized gain (loss) | .22 | 5.01 | 3.63 | (.98) | (3.16) |
Total from investment operations | (.07) | 4.68 | 3.35 | (1.05) | (3.39) |
Redemption fees added to paid in capital C,H | - | - | - | - | - |
Net asset value, end of period | $ 22.70 | $ 22.77 | $ 18.09 | $ 14.74 | $ 15.79 |
Total Return A, B | (.31)% | 25.87% | 22.73% | (6.65)% | (17.67)% |
Ratios to Average Net Assets D, G | | | | | |
Expenses before reductions | 1.93% | 1.92% | 1.96% | 1.98% | 1.96% |
Expenses net of fee waivers, if any | 1.93% | 1.92% | 1.96% | 1.98% | 1.96% |
Expenses net of all reductions | 1.91% | 1.90% | 1.93% | 1.97% | 1.94% |
Net investment income (loss) | (1.29)% | (1.48)% | (1.58)% | (.58)% F | (1.24)% |
Supplemental Data | | | | | |
Net assets, end of period (000 omitted) | $ 88,074 | $ 89,819 | $ 70,017 | $ 55,645 | $ 63,590 |
Portfolio turnover rate E | 201% | 167% | 115% | 225% | 214% |
A Total returns would have been lower if certain expenses had not been reduced during the applicable periods shown.
B Total returns do not include the effect of the contingent deferred sales charge.
C Calculated based on average shares outstanding during the period.
D Fees and expenses of any underlying Fidelity Central Funds are not included in the Fund's expense ratio. The Fund indirectly bears its proportionate share of the expenses of any underlying Fidelity Central Funds.
E Amount does not include the portfolio activity of any underlying Fidelity Central Funds.
F Investment income per share reflects a large, non-recurring dividend which amounted to $.04 per share. Excluding this non-recurring dividend, the ratio of net investment income (loss) to average net assets would have been (.93)%.
G Expense ratios reflect operating expenses of the class. Expenses before reductions do not reflect amounts reimbursed by the investment adviser or reductions from brokerage service arrangements or reductions from other expense offset arrangements and do not represent the amount paid by the class during periods when reimbursements or reductions occur. Expenses net of fee waivers reflect expenses after reimbursement by the investment adviser but prior to reductions from brokerage service arrangements or other expense offset arrangements. Expenses net of all reductions represent the net expenses paid by the class.
H Amount represents less than $.01 per share.
See accompanying notes which are an integral part of the financial statements.
Annual Report
Financial Highlights - Institutional Class
Years ended July 31, | 2012 | 2011 | 2010 | 2009 | 2008 |
Selected Per-Share Data | | | | | |
Net asset value, beginning of period | $ 26.30 | $ 20.68 | $ 16.67 | $ 17.68 | $ 21.26 |
Income from Investment Operations | | | | | |
Net investment income (loss) B | (.06) | (.11) | (.11) | .06 E | (.04) |
Net realized and unrealized gain (loss) | .26 | 5.73 | 4.12 | (1.07) | (3.54) |
Total from investment operations | .20 | 5.62 | 4.01 | (1.01) | (3.58) |
Redemption fees added to paid in capital B,G | - | - | - | - | - |
Net asset value, end of period | $ 26.50 | $ 26.30 | $ 20.68 | $ 16.67 | $ 17.68 |
Total Return A | .76% | 27.18% | 24.06% | (5.71)% | (16.84)% |
Ratios to Average Net Assets C, F | | | | | |
Expenses before reductions | .86% | .87% | .92% | .98% | .94% |
Expenses net of fee waivers, if any | .86% | .87% | .92% | .98% | .94% |
Expenses net of all reductions | .85% | .85% | .90% | .97% | .92% |
Net investment income (loss) | (.23)% | (.43)% | (.55)% | .42% E | (.22)% |
Supplemental Data | | | | | |
Net assets, end of period (000 omitted) | $ 95,310 | $ 81,350 | $ 42,277 | $ 26,285 | $ 22,021 |
Portfolio turnover rate D | 201% | 167% | 115% | 225% | 214% |
A Total returns would have been lower if certain expenses had not been reduced during the applicable periods shown.
B Calculated based on average shares outstanding during the period.
C Fees and expenses of any underlying Fidelity Central Funds are not included in the Fund's expense ratio. The Fund indirectly bears its proportionate share of the expenses of any underlying Fidelity Central Funds.
D Amount does not include the portfolio activity of any underlying Fidelity Central Funds.
E Investment income per share reflects a large, non-recurring dividend which amounted to $.04 per share. Excluding this non-recurring dividend, the ratio of net investment income (loss) to average net assets would have been .07%.
F Expense ratios reflect operating expenses of the class. Expenses before reductions do not reflect amounts reimbursed by the investment adviser or reductions from brokerage service arrangements or reductions from other expense offset arrangements and do not represent the amount paid by the class during periods when reimbursements or reductions occur. Expenses net of fee waivers reflect expenses after reimbursement by the investment adviser but prior to reductions from brokerage service arrangements or other expense offset arrangements. Expenses net of all reductions represent the net expenses paid by the class.
G Amount represents less than $.01 per share.
See accompanying notes which are an integral part of the financial statements.
Annual Report
Fidelity Advisor Technology Fund
Notes to Financial Statements
For the period ended July 31, 2012
1. Organization.
Fidelity Advisor Technology Fund (the Fund) is a non-diversified fund of Fidelity Advisor Series VII (the Trust) and is authorized to issue an unlimited number of shares. The Trust is registered under the Investment Company Act of 1940, as amended (the 1940 Act), as an open-end management investment company organized as a Massachusetts business trust. The Fund offers Class A, Class T, Class C, and Institutional Class shares, each of which, along with Class B shares, has equal rights as to assets and voting privileges. Effective after the close of business on September 1, 2010, Class B shares were closed to new accounts and additional purchases, except for exchanges and reinvestments. Each class has exclusive voting rights with respect to matters that affect that class. Class B shares will automatically convert to Class A shares after a holding period of seven years from the initial date of purchase. Investment income, realized and unrealized capital gains and losses, the common expenses of the Fund, and certain fund-level expense reductions, if any, are allocated on a pro-rata basis to each class based on the relative net assets of each class to the total net assets of the Fund. Each class differs with respect to transfer agent and distribution and service plan fees incurred. Certain expense reductions may also differ by class. The Fund's investments in emerging markets can be subject to social, economic, regulatory, and political uncertainties and can be extremely volatile.
2. Investments in Fidelity Central Funds.
The Fund invests in Fidelity Central Funds, which are open-end investment companies available only to other investment companies and accounts managed by Fidelity Management & Research Company (FMR) and its affiliates. The Fund's Schedule of Investments lists each of the Fidelity Central Funds held as of period end, if any, as an investment of the Fund, but does not include the underlying holdings of each Fidelity Central Fund. As an Investing Fund, the Fund indirectly bears its proportionate share of the expenses of the underlying Fidelity Central Funds.
The Money Market Central Funds seek preservation of capital and current income and are managed by Fidelity Investments Money Management, Inc. (FIMM), an affiliate of FMR.
A complete unaudited list of holdings for each Fidelity Central Fund is available upon request or at the Securities and Exchange Commission (the SEC) web site at www.sec.gov. In addition, the financial statements of the Fidelity Central Funds, which are not covered by the Fund's Report of Independent Registered Public Accounting Firm, are available on the SEC web site or upon request.
3. Significant Accounting Policies.
The financial statements have been prepared in conformity with accounting principles generally accepted in the United States of America (GAAP), which require management to make certain estimates and assumptions at the date of the financial statements. Actual results could differ from those estimates. Subsequent events, if any, through the date that the financial statements were issued have been evaluated in the preparation of the financial statements. The following summarizes the significant accounting policies of the Fund:
Security Valuation. Investments are valued as of 4:00 p.m. Eastern time on the last calendar day of the period. In accordance with valuation policies and procedures approved by the Board of Trustees (the Board), the Fund attempts to obtain prices from one or more third party pricing vendor or broker to value its investments. When current market prices, quotations or rates are not readily available or reliable, securities will be fair valued in good faith by the FMR Fair Value Committee (the Committee), in accordance with procedures adopted by the Fund's Board. Factors used in determining fair value vary by security type and may include market or security specific events, changes in interest rates and credit quality. The frequency with which these procedures are used cannot be predicted and they may be utilized to a significant extent. The Committee oversees the Fund's valuation policies and procedures and is responsible for approving and reporting to the Board all fair value determinations.
The Fund categorizes the inputs to valuation techniques used to value its investments into a disclosure hierarchy consisting of three levels as shown below:
Level 1 - quoted prices in active markets for identical investments
Level 2 - other significant observable inputs (including quoted prices for similar investments, interest rates, prepayment speeds, etc.)
Level 3 - unobservable inputs (including the Fund's own assumptions based on the best information available)
Valuation techniques used to value the Fund's investments by major category are as follows:
Equity securities, including restricted securities, for which market quotations are readily available, are valued at the last reported sale price or official closing price as reported by a third party pricing vendor on the primary market or exchange on which they are traded and are categorized as Level 1 in the hierarchy. In the event there were no sales during the day or closing prices are not available, securities are valued at the last quoted bid price or may be valued using the last available price and are generally categorized as Level 2 in the hierarchy. For foreign equity securities, when significant market or security specific events arise, comparisons to the valuation of American Depositary Receipts (ADRs), futures contracts, Exchange-Traded Funds (ETFs) and certain indexes as well as quoted prices for similar securities are used and are categorized as Level 2 in the hierarchy. Utilizing these techniques may result in transfers between Level 1 and Level 2. For restricted equity securities and private placements where observable inputs are limited, assumptions about market activity and risk are used and these securities are categorized as Level 3 in the hierarchy.
Annual Report
Fidelity Advisor Technology Fund
Notes to Financial Statements - continued
3. Significant Accounting Policies - continued
Security Valuation - continued
Debt securities, including restricted securities, are valued based on evaluated prices received from third party pricing vendors or from brokers who make markets in such securities. For corporate bonds and master notes, pricing vendors utilize matrix pricing which considers yield or price of bonds of comparable quality, coupon, maturity and type as well as broker-supplied prices and are generally categorized as Level 2 in the hierarchy. When independent prices are unavailable or unreliable, debt securities may be valued utilizing pricing methodologies which consider similar factors that would be used by third party pricing vendors. These are generally categorized as Level 2 in the hierarchy but may be Level 3 depending on the circumstances.
Investments in open-end mutual funds, including the Fidelity Central Funds, are valued at their closing net asset value each business day and are categorized as Level 1 in the hierarchy.
Changes in valuation techniques may result in transfers in or out of an assigned level within the disclosure hierarchy. The aggregate value of investments by input level, as of July 31, 2012, including information on transfers between Levels 1 and 2, is included at the end of the Fund's Schedule of Investments.
Foreign Currency Translation. The Fund may use foreign currency contracts to facilitate transactions in foreign-denominated securities. Gains and losses from these transactions may arise from changes in the value of the foreign currency or if the counterparties do not perform under the contracts' terms.
Foreign-denominated assets, including investment securities, and liabilities are translated into U.S. dollars at the exchange rates at period end. Purchases and sales of investment securities, income and dividends received and expenses denominated in foreign currencies are translated into U.S. dollars at the exchange rate in effect on the transaction date.
The effects of exchange rate fluctuations on investments are included with the net realized and unrealized gain (loss) on investment securities. Other foreign currency transactions resulting in realized and unrealized gain (loss) are disclosed separately.
Investment Transactions and Income. For financial reporting purposes, the Fund's investment holdings and NAV include trades executed through the end of the last business day of the period. The NAV per share for processing shareholder transactions is calculated as of the close of business of the New York Stock Exchange (NYSE), normally 4:00 p.m. Eastern time and includes trades executed through the end of the prior business day. Gains and losses on securities sold are determined on the basis of identified cost and may include proceeds received from litigation. Dividend income is recorded on the ex-dividend date, except for certain dividends from foreign securities where the ex-dividend date may have passed, which are recorded as soon as the Fund is informed of the ex-dividend date. Non-cash dividends included in dividend income, if any, are recorded at the fair market value of the securities received. Distributions received on securities that represent a return of capital or capital gain are recorded as a reduction of cost of investments and/or as a realized gain. The Fund estimates the components of distributions received that may be considered return of capital distributions or capital gain distributions. Interest income and distributions from the Fidelity Central Funds are accrued as earned. Interest income includes coupon interest and amortization of premium and accretion of discount on debt securities. Investment income is recorded net of foreign taxes withheld where recovery of such taxes is uncertain.
Expenses. Expenses directly attributable to a fund are charged to that fund. Expenses attributable to more than one fund are allocated among the respective funds on the basis of relative net assets or other appropriate methods. Expense estimates are accrued in the period to which they relate and adjustments are made when actual amounts are known.
Income Tax Information and Distributions to Shareholders. Each year, the Fund intends to qualify as a regulated investment company under Subchapter M of the Internal Revenue Code, including distributing substantially all of its taxable income and realized gains. As a result, no provision for income taxes is required. As of July 31, 2012, the Fund did not have any unrecognized tax benefits in the financial statements; nor is the Fund aware of any tax positions for which it is reasonably possible that the total amounts of unrecognized tax benefits will significantly change in the next twelve months. The Fund files a U.S. federal tax return, in addition to state and local tax returns as required. A fund's federal income tax returns are subject to examination by the Internal Revenue Service (IRS) for a period of three fiscal years after they are filed. State and local tax returns may be subject to examination for an additional fiscal year depending on the jurisdiction. Foreign taxes are provided for based on the Fund's understanding of the tax rules and rates that exist in the foreign markets in which it invests.
Distributions are declared and recorded on the ex-dividend date. Income dividends and capital gain distributions are declared separately for each class. Income and capital gain distributions are determined in accordance with income tax regulations, which may differ from GAAP.
Capital accounts within the financial statements are adjusted for permanent book-tax differences. These adjustments have no impact on net assets or the results of operations. Temporary book-tax differences will reverse in a subsequent period.
Book-tax differences are primarily due to foreign currency transactions, deferred trustees compensation, net operating losses, capital loss carryforwards and losses deferred due to wash sales and excise tax regulations.
Annual Report
3. Significant Accounting Policies - continued
Income Tax Information and Distributions to Shareholders - continued
The federal tax cost of investment securities and unrealized appreciation (depreciation) as of period end were as follows:
Gross unrealized appreciation | $ 90,614,106 |
Gross unrealized depreciation | (66,449,756) |
Net unrealized appreciation (depreciation) on securities and other investments | $ 24,164,350 |
| |
Tax Cost | $ 715,465,181 |
The tax-based components of distributable earnings as of period end were as follows:
Capital loss carryforward | $ (117,524,425) |
Net unrealized appreciation (depreciation) | $ 24,165,469 |
Capital loss carryforwards are only available to offset future capital gains of the Fund to the extent provided by regulations and may be limited. Under the Regulated Investment Company Modernization Act of 2010 (the Act), the Fund is permitted to carry forward capital losses incurred in taxable years beginning after December 22, 2010 for an unlimited period and such capital losses are required to be used prior to any losses that expire. Capital loss carryforwards were as follows:
Fiscal year of expiration | |
| |
2017 | $ (117,524,425) |
Short-Term Trading (Redemption) Fees. Shares held by investors in the Fund less than 30 days are subject to a redemption fee equal to .75% of the net asset value of shares redeemed. All redemption fees, which reduce the proceeds of the shareholder redemption, are retained by the Fund and accounted for as an addition to paid in capital.
New Accounting Pronouncement. In December 2011, the Financial Accounting Standards Board issued Accounting Standard Update No. 2011-11, Disclosures about Offsetting Assets and Liabilities. The update creates new disclosure requirements requiring entities to disclose both gross and net information for derivatives and other financial instruments that are either offset in the Statement of Assets and Liabilities or subject to an enforceable master netting arrangement or similar agreement. The disclosure requirements are effective for interim and annual reporting periods beginning on or after January 1, 2013. Management is currently evaluating the impact of the update's adoption on the Fund's financial statement disclosures.
4. Operating Policies.
Restricted Securities. The Fund may invest in securities that are subject to legal or contractual restrictions on resale. These securities generally may be resold in transactions exempt from registration or to the public if the securities are registered. Disposal of these securities may involve time-consuming negotiations and expense, and prompt sale at an acceptable price may be difficult. Information regarding restricted securities is included at the end of the Fund's Schedule of Investments.
5. Purchases and Sales of Investments.
Purchases and sales of securities, other than short-term securities, aggregated $1,373,500,303 and $1,483,717,376, respectively.
6. Fees and Other Transactions with Affiliates.
Management Fee. FMR and its affiliates provide the Fund with investment management related services for which the Fund pays a monthly management fee. The management fee is the sum of an individual fund fee rate that is based on an annual rate of .30% of the Fund's average net assets and an annualized group fee rate that averaged .26% during the period. The group fee rate is based upon the average net assets of all the mutual funds advised by FMR. The group fee rate decreases as assets under management increase and increases as assets under management decrease. For the period, the total annual management fee rate was .56% of the Fund's average net assets.
Annual Report
Fidelity Advisor Technology Fund
Notes to Financial Statements - continued
6. Fees and Other Transactions with Affiliates - continued
Distribution and Service Plan Fees. In accordance with Rule 12b-1 of the 1940 Act, the Fund has adopted separate Distribution and Service Plans for each class of shares. Certain classes pay Fidelity Distributors Corporation (FDC), an affiliate of FMR, separate Distribution and Service Fees, each of which is based on an annual percentage of each class' average net assets. In addition, FDC may pay financial intermediaries for selling shares of the Fund and providing shareholder support services. For the period, the Distribution and Service Fee rates, total fees and amounts retained by FDC were as follows:
| Distribution
Fee | Service
Fee | Total Fees | Retained
by FDC |
Class A | -% | .25% | $ 854,371 | $ 9,467 |
Class T | .25% | .25% | 891,884 | 5,276 |
Class B | .75% | .25% | 204,917 | 154,181 |
Class C | .75% | .25% | 853,996 | 97,900 |
| | | $ 2,805,168 | $ 266,824 |
Sales Load. FDC may receive a front-end sales charge of up to 5.75% for selling Class A shares and 3.50% for selling Class T shares, some of which is paid to financial intermediaries for selling shares of the Fund. Depending on the holding period, FDC may receive contingent deferred sales charges levied on Class A, Class T, Class B, and Class C redemptions. The deferred sales charges range from 5.00% to 1.00% for Class B shares, 1.00% for Class C shares, 1.00% for certain purchases of Class A shares and .25% for certain purchases of Class T shares.
For the period, sales charge amounts retained by FDC were as follows:
| Retained
by FDC |
Class A | $ 70,974 |
Class T | 20,449 |
Class B* | 25,085 |
Class C* | 9,032 |
| $ 125,540 |
* When Class B and Class C shares are initially sold, FDC pays commissions from its own resources to financial intermediaries through which the sales are made.
Transfer Agent Fees. Fidelity Investments Institutional Operations Company, Inc. (FIIOC), an affiliate of FMR, is the transfer, dividend disbursing and shareholder servicing agent for each class of the Fund. FIIOC receives account fees and asset-based fees that vary according to the account size and type of account of the shareholders of the respective classes of the Fund. FIIOC pays for typesetting, printing and mailing of shareholder reports, except proxy statements. For the period, transfer agent fees for each class were as follows:
| Amount | % of
Average
Net Assets |
Class A | $ 1,029,833 | .30 |
Class T | 538,818 | .30 |
Class B | 61,789 | .30 |
Class C | 250,234 | .29 |
Institutional Class | 210,706 | .23 |
| $ 2,091,380 | |
Accounting and Security Lending Fees. Fidelity Service Company, Inc. (FSC), an affiliate of FMR, maintains the Fund's accounting records. The accounting fee is based on the level of average net assets for each month. Under a separate contract, FSC administers the security lending program. The security lending fee is based on the number and duration of lending transactions.
Brokerage Commissions. The Fund placed a portion of its portfolio transactions with brokerage firms which are affiliates of the investment adviser. The commissions paid to these affiliated firms were $50,376 for the period.
7. Committed Line of Credit.
The Fund participates with other funds managed by FMR or an affiliate in a $4.25 billion credit facility (the "line of credit") to be utilized for temporary or emergency purposes to fund shareholder redemptions or for other short-term liquidity purposes. The Fund has agreed to pay commitment fees on its pro-rata portion of the line of credit, which amounted to $2,040 and is reflected in Miscellaneous expenses on the Statement of Operations. During the period, there were no borrowings on this line of credit.
Annual Report
8. Security Lending.
The Fund lends portfolio securities through a lending agent from time to time in order to earn additional income. For equity securities, a lending agent is used and may loan securities to certain qualified borrowers, including Fidelity Capital Markets (FCM), a broker-dealer affiliated with the Fund. On the settlement date of the loan, the Fund receives collateral (in the form of U.S. Treasury obligations, letters of credit and/or cash) against the loaned securities and maintains collateral in an amount not less than 100% of the market value of the loaned securities during the period of the loan. The market value of the loaned securities is determined at the close of business of the Fund and any additional required collateral is delivered to the Fund on the next business day. If the borrower defaults on its obligation to return the securities loaned because of insolvency or other reasons, a fund could experience delays and costs in recovering the securities loaned or in gaining access to the collateral. Any cash collateral received is invested in the Fidelity Securities Lending Cash Central Fund. The value of loaned securities and cash collateral at period end are disclosed on the Fund's Statement of Assets and Liabilities. The value of securities loaned to FCM at period end was $870,300. Security lending income represents the income earned on investing cash collateral, less rebates paid to borrowers and any lending agent fees associated with the loan, plus any premium payments received for lending certain types of securities. Security lending income is presented in the Statement of Operations as a component of income from Fidelity Central Funds, and includes $26,600 from securities loaned to FCM.
9. Expense Reductions.
Many of the brokers with whom FMR places trades on behalf of the Fund provided services to the Fund in addition to trade execution. These services included payments of certain expenses on behalf of the Fund totaling $121,557 for the period. In addition, through arrangements with the Fund's custodian, credits realized as a result of uninvested cash balances were used to reduce the Fund's expenses. During the period, these credits reduced the Fund's custody expenses by $68.
10. Share Transactions.
Transactions for each class of shares were as follows:
| Shares | Dollars |
Years ended July 31, | 2012 | 2011 | 2012 | 2011 |
Class A | | | | |
Shares sold | 2,592,933 | 3,825,268 | $ 63,934,256 | $ 95,895,792 |
Shares redeemed | (4,198,134) | (4,656,846) | (101,495,361) | (115,935,925) |
Net increase (decrease) | (1,605,201) | (831,578) | $ (37,561,105) | $ (20,040,133) |
Class T | | | | |
Shares sold | 978,762 | 1,318,401 | $ 23,400,718 | $ 31,818,569 |
Shares redeemed | (1,986,110) | (2,014,796) | (46,751,109) | (47,878,372) |
Net increase (decrease) | (1,007,348) | (696,395) | $ (23,350,391) | $ (16,059,803) |
Class B | | | | |
Shares sold | 50,311 | 98,795 | $ 1,085,625 | $ 2,198,114 |
Shares redeemed | (402,080) | (593,453) | (8,778,422) | (13,054,972) |
Net increase (decrease) | (351,769) | (494,658) | $ (7,692,797) | $ (10,856,858) |
Class C | | | | |
Shares sold | 840,429 | 982,784 | $ 19,233,850 | $ 22,502,223 |
Shares redeemed | (904,947) | (908,933) | (19,636,815) | (20,073,701) |
Net increase (decrease) | (64,518) | 73,851 | $ (402,965) | $ 2,428,522 |
Institutional Class | | | | |
Shares sold | 2,443,052 | 2,740,439 | $ 63,798,153 | $ 73,729,514 |
Shares redeemed | (1,939,243) | (1,692,072) | (49,603,177) | (44,832,264) |
Net increase (decrease) | 503,809 | 1,048,367 | $ 14,194,976 | $ 28,897,250 |
11. Other.
The Fund's organizational documents provide former and current trustees and officers with a limited indemnification against liabilities arising in connection with the performance of their duties to the Fund. In the normal course of business, the Fund may also enter into contracts that provide general indemnifications. The Fund's maximum exposure under these arrangements is unknown as this would be dependent on future claims that may be made against the Fund. The risk of material loss from such claims is considered remote.
Annual Report
Fidelity Advisor Utilities Fund - Institutional Class
Performance: The Bottom Line
Average annual total return reflects the change in the value of an investment, assuming reinvestment of the class' distributions from dividend income and capital gains (the profits earned upon the sale of securities that have grown in value, if any) and assuming a constant rate of performance each year. The $10,000 table and the fund's returns do not reflect the deduction of taxes that a shareholder would pay on fund distributions or the redemption of fund shares. During periods of reimbursement by Fidelity, a fund's total return will be greater than it would be had the reimbursement not occurred. How a fund did yesterday is no guarantee of how it will do tomorrow.
Average Annual Total Returns
Periods ended July 31, 2012 | | Past 1
year | Past 5
years | Past 10
years |
Institutional Class A | | 13.79% | 2.76% | 11.61% |
A Prior to October 1, 2006, Fidelity Advisor Utilities Fund operated under certain different investment policies. The historical performance for the fund may not represent its current investment policies.
$10,000 Over 10 Years
Let's say hypothetically that $10,000 was invested in Fidelity Advisor Utilities Fund - Institutional Class on July 31, 2002. The chart shows how the value of your investment would have changed, and also shows how the S&P 500 Index performed over the same period.
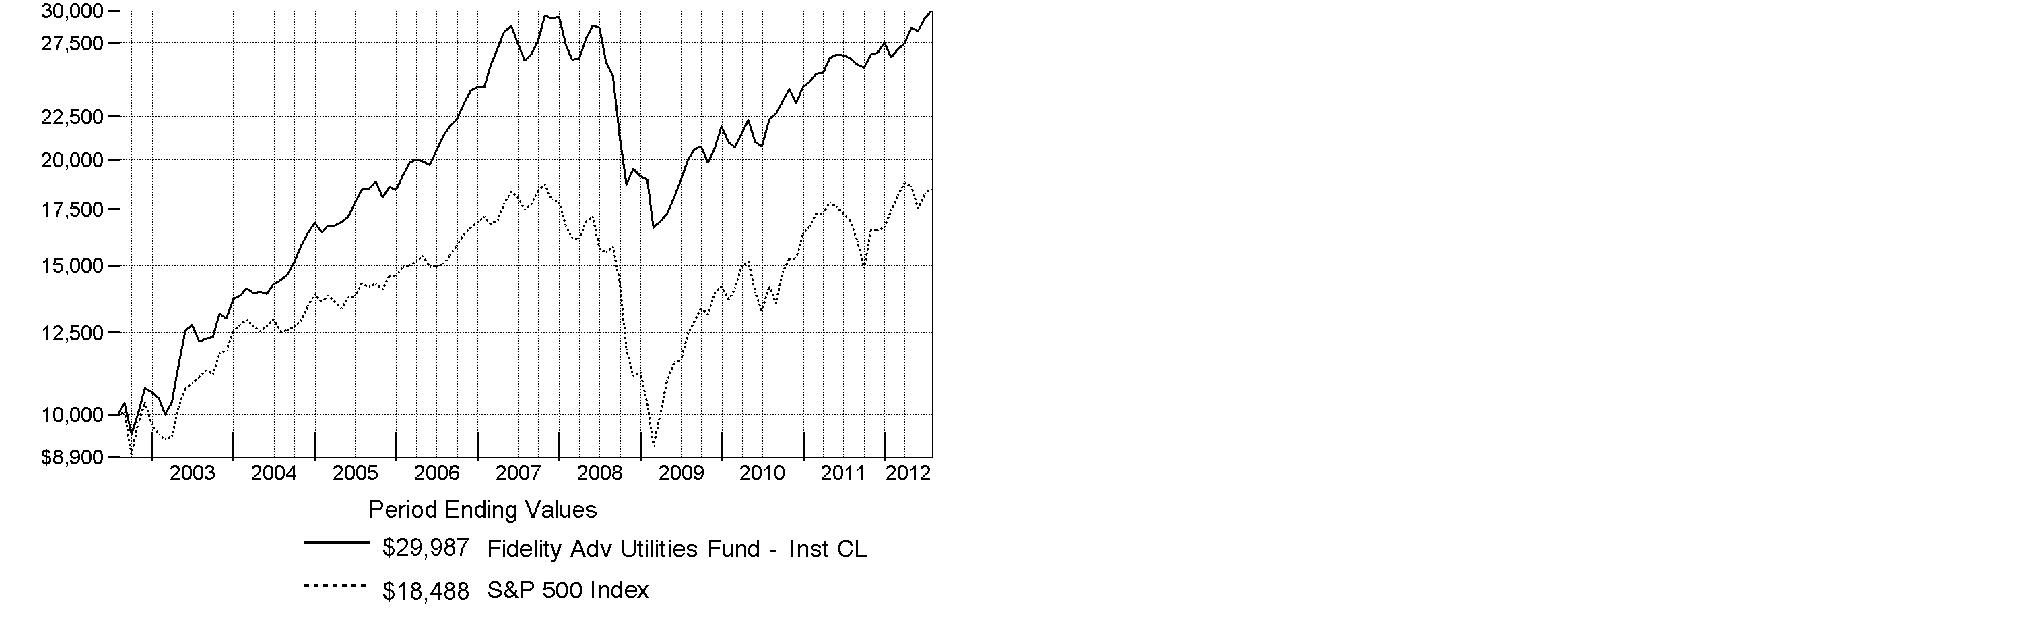
Annual Report
Fidelity Advisor Utilities Fund
Market Recap: Major U.S. equity benchmarks posted solid gains for the year ending July 31, 2012, amid an uncertain investment environment. The broad-based S&P 500® Index returned 9.13%, while the blue-chip-laden Dow Jones Industrial AverageSM and technology-heavy Nasdaq Composite® Index gained 10.12% and 7.83%, respectively. Volatility spiked during the period's first half, as equities plummeted late last summer on Europe's debt woes, political wrangling over the U.S. debt ceiling and the sovereign credit-rating downgrade that followed. By October, a seemingly improved U.S. economy rejuvenated stocks, paving the way for major equity benchmarks to post their best first-quarter performance since 1998. However, more eurozone trouble, signs that the U.S. economy had turned sluggish and a slowdown in China caused stocks to slip in May, before a new wave of optimism took hold in June and July. Within the S&P 500®, more-defensive sectors such as telecommunication services (+30%) and consumer staples (+20%) fared best, while materials and energy significantly underperformed, returning -5%. Small- and mid-cap stocks trailed their less-volatile large-cap counterparts, with the Russell 2000® Index adding 0.19% and the Russell Midcap® Index rising 2.28%. Given turmoil and local currency weakness in Europe, foreign developed-markets stocks lost ground, with the MSCI® EAFE® Index returning -11.32%.
Comments from Douglas Simmons, Portfolio Manager of Fidelity Advisor® Utilities Fund: For the year, the fund's Institutional Class shares returned 13.79%, outperforming the S&P 500® but underperforming the 17.71% gain of the MSCI® U.S. IM 25/50 Utilities Index. Relative to the MSCI index, the fund was hurt by an overweighting in the lagging independent power/energy trade group, although this was mitigated to an extent by good stock picks here. Security selection in gas utilities and electric utilities also hurt, as did an underweighting in multi-utilities. The fund's modest cash position also curtailed returns in an up market. Detractors included untimely ownership of Oklahoma gas utility ONEOK, and investments in National Fuel Gas - with operations in western New York - Houston-based independent power producers Calpine and GenOn Energy, global power company AES and an untimely out-of-benchmark position in Tulsa-based oil/gas storage and transport company Williams Companies, the latter of which was not held at period end. On the plus side, we were helped by an out-of-benchmark position in oil/gas refining and marketing company Sunoco - which was sold from the fund before period end - and by two California multi-utilities, Sempra Energy and PG&E.
The views expressed above reflect those of the portfolio manager(s) only through the end of the period as stated on the cover of this report and do not necessarily represent the views of Fidelity or any other person in the Fidelity organization. Any such views are subject to change at any time based upon market or other conditions and Fidelity disclaims any responsibility to update such views. These views may not be relied on as investment advice and, because investment decisions for a Fidelity fund are based on numerous factors, may not be relied on as an indication of trading intent on behalf of any Fidelity fund.
Annual Report
Fidelity Advisor Utilities Fund
As a shareholder of the Fund, you incur two types of costs: (1) transaction costs, including sales charges (loads) on purchase payments or redemption proceeds, redemption fees and (2) ongoing costs, including management fees, distribution and/or service (12b-1) fees and other Fund expenses. This Example is intended to help you understand your ongoing costs (in dollars) of investing in the Fund and to compare these costs with the ongoing costs of investing in other mutual funds.
The Example is based on an investment of $1,000 invested at the beginning of the period and held for the entire period (February 1, 2012 to July 31, 2012).
Actual Expenses
The first line of the accompanying table for each class of the Fund provides information about actual account values and actual expenses. You may use the information in this line, together with the amount you invested, to estimate the expenses that you paid over the period. Simply divide your account value by $1,000.00 (for example, an $8,600 account value divided by $1,000.00 = 8.6), then multiply the result by the number in the first line for a class of the Fund under the heading entitled "Expenses Paid During Period" to estimate the expenses you paid on your account during this period. In addition, the Fund, as a shareholder in the underlying Fidelity Central Funds, will indirectly bear its pro-rata share of the fees and expenses incurred by the underlying Fidelity Central Funds. These fees and expenses are not included in the Fund's annualized expense ratio used to calculate the expense estimate in the table below.
Hypothetical Example for Comparison Purposes
The second line of the accompanying table for each class of the Fund provides information about hypothetical account values and hypothetical expenses based on a Class' actual expense ratio and an assumed rate of return of 5% per year before expenses, which is not the Class' actual return. The hypothetical account values and expenses may not be used to estimate the actual ending account balance or expenses you paid for the period. You may use this information to compare the ongoing costs of investing in the Fund and other funds. To do so, compare this 5% hypothetical example with the 5% hypothetical examples that appear in the shareholder reports of the other funds. In addition, the Fund, as a shareholder in the underlying Fidelity Central Funds, will indirectly bear its pro-rata share of the fees and expenses incurred by the underlying Fidelity Central Funds. These fees and expenses are not included in the Fund's annualized expense ratio used to calculate the expense estimate in the table below.
Please note that the expenses shown in the table are meant to highlight your ongoing costs only and do not reflect any transaction costs. Therefore, the second line of the table is useful in comparing ongoing costs only, and will not help you determine the relative total costs of owning different funds. In addition, if these transactional costs were included, your costs would have been higher.
| Annualized Expense Ratio | Beginning
Account Value
February 1, 2012 | Ending
Account Value
July 31, 2012 | Expenses Paid
During Period*
February 1, 2012
to July 31, 2012 |
Class A | 1.20% | | | |
Actual | | $ 1,000.00 | $ 1,132.50 | $ 6.36 |
HypotheticalA | | $ 1,000.00 | $ 1,018.90 | $ 6.02 |
Class T | 1.46% | | | |
Actual | | $ 1,000.00 | $ 1,130.60 | $ 7.73 |
HypotheticalA | | $ 1,000.00 | $ 1,017.60 | $ 7.32 |
Class B | 1.95% | | | |
Actual | | $ 1,000.00 | $ 1,128.10 | $ 10.32 |
HypotheticalA | | $ 1,000.00 | $ 1,015.17 | $ 9.77 |
Class C | 1.93% | | | |
Actual | | $ 1,000.00 | $ 1,128.00 | $ 10.21 |
HypotheticalA | | $ 1,000.00 | $ 1,015.27 | $ 9.67 |
Institutional Class | .86% | | | |
Actual | | $ 1,000.00 | $ 1,134.70 | $ 4.56 |
HypotheticalA | | $ 1,000.00 | $ 1,020.59 | $ 4.32 |
A 5% return per year before expenses
* Expenses are equal to each Class' annualized expense ratio, multiplied by the average account value over the period, multiplied by 182/366 (to reflect the one-half year period).
Annual Report
Fidelity Advisor Utilities Fund
Investment Changes (Unaudited)
Top Ten Stocks as of July 31, 2012 |
| % of fund's
net assets | % of fund's net assets
6 months ago |
Duke Energy Corp. | 14.8 | 10.6 |
PG&E Corp. | 7.3 | 6.1 |
FirstEnergy Corp. | 7.3 | 8.4 |
Edison International | 7.1 | 7.5 |
American Electric Power Co., Inc. | 6.9 | 4.8 |
CenterPoint Energy, Inc. | 5.3 | 4.4 |
Sempra Energy | 4.8 | 7.5 |
NextEra Energy, Inc. | 4.7 | 7.9 |
NiSource, Inc. | 4.7 | 4.6 |
American Water Works Co., Inc. | 4.0 | 3.1 |
| 66.9 | |
Top Industries (% of fund's net assets) |
As of July 31, 2012 |
| Electric Utilities | 55.1% | |
| Multi-Utilities | 22.1% | |
| Independent
Power Producers & Energy Traders | 9.5% | |
| Gas Utilities | 5.8% | |
| Water Utilities | 4.0% | |
| All Others* | 3.5% | |

As of January 31, 2012 |
| Electric Utilities | 44.5% | |
| Multi-Utilities | 30.3% | |
| Independent
Power Producers & Energy Traders | 11.5% | |
| Gas Utilities | 5.2% | |
| Oil, Gas & Consumable Fuels | 3.7% | |
| All Others* | 4.8% | |

* Includes short-term investments and net other assets. |
Annual Report
Fidelity Advisor Utilities Fund
Investments July 31, 2012
Showing Percentage of Net Assets
Common Stocks - 97.2% |
| Shares | | Value |
ELECTRIC UTILITIES - 55.1% |
Electric Utilities - 55.1% |
American Electric Power Co., Inc. | 317,461 | | $ 13,409,553 |
Duke Energy Corp. | 427,091 | | 28,948,226 |
Edison International | 298,594 | | 13,789,071 |
Exelon Corp. | 74,599 | | 2,918,313 |
FirstEnergy Corp. | 285,196 | | 14,322,543 |
Great Plains Energy, Inc. | 219,010 | | 4,857,642 |
ITC Holdings Corp. | 17,610 | | 1,306,486 |
NextEra Energy, Inc. | 130,532 | | 9,254,719 |
Northeast Utilities | 126,422 | | 5,041,709 |
OGE Energy Corp. | 93,849 | | 4,984,320 |
Pepco Holdings, Inc. | 100,100 | | 1,997,996 |
Southern Co. | 86,271 | | 4,153,949 |
UIL Holdings Corp. | 69,530 | | 2,575,391 |
| | 107,559,918 |
GAS UTILITIES - 5.8% |
Gas Utilities - 5.8% |
AGL Resources, Inc. | 31,945 | | 1,293,773 |
Atmos Energy Corp. | 86,804 | | 3,111,923 |
National Fuel Gas Co. | 34,069 | | 1,667,337 |
ONEOK, Inc. | 116,612 | | 5,190,400 |
| | 11,263,433 |
INDEPENDENT POWER PRODUCERS & ENERGY TRADERS - 9.5% |
Independent Power Producers & Energy Traders - 9.5% |
Calpine Corp. (a) | 403,230 | | 6,891,201 |
GenOn Energy, Inc. (a) | 489,881 | | 1,165,917 |
NRG Energy, Inc. (d) | 176,662 | | 3,501,441 |
The AES Corp. (a) | 583,761 | | 7,040,158 |
| | 18,598,717 |
MULTI-UTILITIES - 22.1% |
Multi-Utilities - 22.1% |
CenterPoint Energy, Inc. | 492,078 | | 10,363,163 |
NiSource, Inc. | 356,263 | | 9,116,770 |
PG&E Corp. | 310,374 | | 14,326,864 |
Sempra Energy | 133,531 | | 9,401,918 |
| | 43,208,715 |
|
| Shares | | Value |
OIL, GAS & CONSUMABLE FUELS - 0.7% |
Oil & Gas Storage & Transport - 0.7% |
Cheniere Energy, Inc. (a) | 98,998 | | $ 1,349,343 |
WATER UTILITIES - 4.0% |
Water Utilities - 4.0% |
American Water Works Co., Inc. | 215,125 | | 7,798,281 |
TOTAL COMMON STOCKS (Cost $174,104,060) |
189,778,407
|
Money Market Funds - 5.0% |
| | | |
Fidelity Cash Central Fund, 0.17% (b) | 6,247,666 | | 6,247,666 |
Fidelity Securities Lending Cash Central Fund, 0.18% (b)(c) | 3,495,250 | | 3,495,250 |
TOTAL MONEY MARKET FUNDS (Cost $9,742,916) |
9,742,916
|
TOTAL INVESTMENT PORTFOLIO - 102.2% (Cost $183,846,976) | | 199,521,323 |
NET OTHER ASSETS (LIABILITIES) - (2.2)% | | (4,249,174) |
NET ASSETS - 100% | $ 195,272,149 |
Legend |
(a) Non-income producing |
(b) Affiliated fund that is available only to investment companies and other accounts managed by Fidelity Investments. The rate quoted is the annualized seven-day yield of the fund at period end. A complete unaudited listing of the fund's holdings as of its most recent quarter end is available upon request. In addition, each Fidelity Central Fund's financial statements, which are not covered by the Fund's Report of Independent Registered Public Accounting Firm, are available on the SEC's website or upon request. |
(c) Investment made with cash collateral received from securities on loan. |
(d) Security or a portion of the security is on loan at period end. |
Affiliated Central Funds |
Information regarding fiscal year to date income earned by the Fund from investments in Fidelity Central Funds is as follows: |
Fund | Income earned |
Fidelity Cash Central Fund | $ 5,512 |
Fidelity Securities Lending Cash Central Fund | 25,507 |
Total | $ 31,019 |
Other Information |
All investments are categorized as Level 1 under the Fair Value Hierarchy. The inputs or methodology used for valuing securities may not be an indication of the risk associated with investing in those securities. For more information on valuation inputs, please refer to the Security Valuation section in the accompanying Notes to Financial Statements. |
See accompanying notes which are an integral part of the financial statements.
Annual Report
Fidelity Advisor Utilities Fund
Statement of Assets and Liabilities
| July 31, 2012 |
| | |
Assets | | |
Investment in securities, at value (including securities loaned of $3,379,310) - See accompanying schedule: Unaffiliated issuers (cost $174,104,060) | $ 189,778,407 | |
Fidelity Central Funds (cost $9,742,916) | 9,742,916 | |
Total Investments (cost $183,846,976) | | $ 199,521,323 |
Receivable for investments sold | | 1,034,685 |
Receivable for fund shares sold | | 392,394 |
Dividends receivable | | 156,134 |
Distributions receivable from Fidelity Central Funds | | 893 |
Other receivables | | 8,287 |
Total assets | | 201,113,716 |
| | |
Liabilities | | |
Payable for investments purchased | $ 1,820,042 | |
Payable for fund shares redeemed | 287,512 | |
Accrued management fee | 86,881 | |
Distribution and service plan fees payable | 66,201 | |
Other affiliated payables | 49,663 | |
Other payables and accrued expenses | 36,018 | |
Collateral on securities loaned, at value | 3,495,250 | |
Total liabilities | | 5,841,567 |
| | |
Net Assets | | $ 195,272,149 |
Net Assets consist of: | | |
Paid in capital | | $ 209,197,231 |
Undistributed net investment income | | 1,693,797 |
Accumulated undistributed net realized gain (loss) on investments and foreign currency transactions | | (31,293,226) |
Net unrealized appreciation (depreciation) on investments | | 15,674,347 |
Net Assets | | $ 195,272,149 |
Statement of Assets and Liabilities - continued
| July 31, 2012 |
| | |
Calculation of Maximum Offering Price Class A:
Net Asset Value and redemption price per share ($99,812,981 ÷ 4,707,997 shares) | | $ 21.20 |
| | |
Maximum offering price per share (100/94.25 of $21.20) | | $ 22.49 |
Class T:
Net Asset Value and redemption price per share ($38,275,755 ÷ 1,804,579 shares) | | $ 21.21 |
| | |
Maximum offering price per share (100/96.50 of $21.21) | | $ 21.98 |
Class B:
Net Asset Value and offering price per share ($6,677,348 ÷ 318,599 shares)A | | $ 20.96 |
| | |
Class C:
Net Asset Value and offering price per share ($29,941,814 ÷ 1,439,302 shares)A | | $ 20.80 |
| | |
Institutional Class:
Net Asset Value, offering price and redemption price per share ($20,564,251 ÷ 953,957 shares) | | $ 21.56 |
A Redemption price per share is equal to net asset value less any applicable contingent deferred sales charge.
See accompanying notes which are an integral part of the financial statements.
Annual Report
Statement of Operations
| Year ended July 31, 2012 |
| | |
Investment Income | | |
Dividends | | $ 5,862,406 |
Income from Fidelity Central Funds | | 31,019 |
Total income | | 5,893,425 |
| | |
Expenses | | |
Management fee | $ 951,962 | |
Transfer agent fees | 504,122 | |
Distribution and service plan fees | 754,197 | |
Accounting and security lending fees | 66,483 | |
Custodian fees and expenses | 9,952 | |
Independent trustees' compensation | 1,123 | |
Registration fees | 66,576 | |
Audit | 47,941 | |
Legal | 1,925 | |
Miscellaneous | 1,432 | |
Total expenses before reductions | 2,405,713 | |
Expense reductions | (12,239) | 2,393,474 |
Net investment income (loss) | | 3,499,951 |
Realized and Unrealized Gain (Loss) Net realized gain (loss) on: | | |
Investment securities: | | |
Unaffiliated issuers | 12,579,670 | |
Foreign currency transactions | (4,830) | |
Total net realized gain (loss) | | 12,574,840 |
Change in net unrealized appreciation (depreciation) on investment securities | | 5,997,904 |
Net gain (loss) | | 18,572,744 |
Net increase (decrease) in net assets resulting from operations | | $ 22,072,695 |
Statement of Changes in Net Assets
| Year ended
July 31,
2012 | Year ended
July 31,
2011 |
Increase (Decrease) in Net Assets | | |
Operations | | |
Net investment income (loss) | $ 3,499,951 | $ 2,899,329 |
Net realized gain (loss) | 12,574,840 | 15,534,119 |
Change in net unrealized appreciation (depreciation) | 5,997,904 | 4,885,719 |
Net increase (decrease) in net assets resulting from operations | 22,072,695 | 23,319,167 |
Distributions to shareholders from net investment income | (3,107,112) | (2,864,390) |
Share transactions - net increase (decrease) | 16,682,706 | 3,898,632 |
Redemption fees | 8,157 | 2,026 |
Total increase (decrease) in net assets | 35,656,446 | 24,355,435 |
| | |
Net Assets | | |
Beginning of period | 159,615,703 | 135,260,268 |
End of period (including undistributed net investment income of $1,693,797 and undistributed net investment income of $1,305,339, respectively) | $ 195,272,149 | $ 159,615,703 |
See accompanying notes which are an integral part of the financial statements.
Annual Report
Financial Highlights - Class A
Years ended July 31, | 2012 | 2011 | 2010 | 2009 | 2008 |
Selected Per-Share Data | | | | | |
Net asset value, beginning of period | $ 19.09 | $ 16.59 | $ 15.27 | $ 20.28 | $ 20.74 |
Income from Investment Operations | | | | | |
Net investment income (loss) C | .43 | .39 | .40 | .35 | .24 |
Net realized and unrealized gain (loss) | 2.07 | 2.50 | 1.32 | (5.10) | (.38) |
Total from investment operations | 2.50 | 2.89 | 1.72 | (4.75) | (.14) |
Distributions from net investment income | (.39) | (.39) | (.40) | (.26) | (.32) |
Redemption fees added to paid in capital C, G | - | - | - | - | - |
Net asset value, end of period | $ 21.20 | $ 19.09 | $ 16.59 | $ 15.27 | $ 20.28 |
Total Return A, B | 13.40% | 17.71% | 11.42% | (23.44)% | (.82)% |
Ratios to Average Net Assets D, F | | | | | |
Expenses before reductions | 1.23% | 1.24% | 1.26% | 1.26% | 1.21% |
Expenses net of fee waivers, if any | 1.23% | 1.24% | 1.26% | 1.26% | 1.21% |
Expenses net of all reductions | 1.22% | 1.20% | 1.22% | 1.26% | 1.21% |
Net investment income (loss) | 2.24% | 2.18% | 2.49% | 2.37% | 1.11% |
Supplemental Data | | | | | |
Net assets, end of period (000 omitted) | $ 99,813 | $ 78,312 | $ 64,890 | $ 66,064 | $ 105,219 |
Portfolio turnover rate E | 195% | 201% | 216% | 247% | 77% |
A Total returns would have been lower if certain expenses had not been reduced during the applicable periods shown.
B Total returns do not include the effect of the sales charges.
C Calculated based on average shares outstanding during the period.
D Fees and expenses of any underlying Fidelity Central Funds are not included in the Fund's expense ratio. The Fund indirectly bears its proportionate share of the expenses of any underlying Fidelity Central Funds.
E Amount does not include the portfolio activity of any underlying Fidelity Central Funds.
F Expense ratios reflect operating expenses of the class. Expenses before reductions do not reflect amounts reimbursed by the investment adviser or reductions from brokerage service arrangements or reductions from other expense offset arrangements and do not represent the amount paid by the class during periods when reimbursements or reductions occur. Expenses net of fee waivers reflect expenses after reimbursement by the investment adviser but prior to reductions from brokerage service arrangements or other expense offset arrangements. Expenses net of all reductions represent the net expenses paid by the class.
G Amount represents less than $.01 per share.
Financial Highlights - Class T
Years ended July 31, | 2012 | 2011 | 2010 | 2009 | 2008 |
Selected Per-Share Data | | | | | |
Net asset value, beginning of period | $ 19.09 | $ 16.59 | $ 15.27 | $ 20.26 | $ 20.71 |
Income from Investment Operations | | | | | |
Net investment income (loss) C | .38 | .35 | .35 | .31 | .18 |
Net realized and unrealized gain (loss) | 2.07 | 2.50 | 1.33 | (5.10) | (.39) |
Total from investment operations | 2.45 | 2.85 | 1.68 | (4.79) | (.21) |
Distributions from net investment income | (.33) | (.35) | (.36) | (.20) | (.24) |
Redemption fees added to paid in capital C, G | - | - | - | - | - |
Net asset value, end of period | $ 21.21 | $ 19.09 | $ 16.59 | $ 15.27 | $ 20.26 |
Total Return A, B | 13.13% | 17.39% | 11.13% | (23.61)% | (1.11)% |
Ratios to Average Net Assets D, F | | | | | |
Expenses before reductions | 1.49% | 1.50% | 1.52% | 1.52% | 1.47% |
Expenses net of fee waivers, if any | 1.49% | 1.50% | 1.52% | 1.52% | 1.47% |
Expenses net of all reductions | 1.48% | 1.46% | 1.49% | 1.52% | 1.47% |
Net investment income (loss) | 1.98% | 1.92% | 2.23% | 2.11% | .84% |
Supplemental Data | | | | | |
Net assets, end of period (000 omitted) | $ 38,276 | $ 35,701 | $ 33,651 | $ 33,989 | $ 54,346 |
Portfolio turnover rate E | 195% | 201% | 216% | 247% | 77% |
A Total returns would have been lower if certain expenses had not been reduced during the applicable periods shown.
B Total returns do not include the effect of the sales charges.
C Calculated based on average shares outstanding during the period.
D Fees and expenses of any underlying Fidelity Central Funds are not included in the Fund's expense ratio. The Fund indirectly bears its proportionate share of the expenses of any underlying Fidelity Central Funds.
E Amount does not include the portfolio activity of any underlying Fidelity Central Funds.
F Expense ratios reflect operating expenses of the class. Expenses before reductions do not reflect amounts reimbursed by the investment adviser or reductions from brokerage service arrangements or reductions from other expense offset arrangements and do not represent the amount paid by the class during periods when reimbursements or reductions occur. Expenses net of fee waivers reflect expenses after reimbursement by the investment adviser but prior to reductions from brokerage service arrangements or other expense offset arrangements. Expenses net of all reductions represent the net expenses paid by the class.
G Amount represents less than $.01 per share.
See accompanying notes which are an integral part of the financial statements.
Annual Report
Financial Highlights - Class B
Years ended July 31, | 2012 | 2011 | 2010 | 2009 | 2008 |
Selected Per-Share Data | | | | | |
Net asset value, beginning of period | $ 18.86 | $ 16.38 | $ 15.08 | $ 20.01 | $ 20.40 |
Income from Investment Operations | | | | | |
Net investment income (loss) C | .28 | .25 | .27 | .24 | .08 |
Net realized and unrealized gain (loss) | 2.05 | 2.49 | 1.31 | (5.04) | (.39) |
Total from investment operations | 2.33 | 2.74 | 1.58 | (4.80) | (.31) |
Distributions from net investment income | (.23) | (.26) | (.28) | (.13) | (.08) |
Redemption fees added to paid in capital C, G | - | - | - | - | - |
Net asset value, end of period | $ 20.96 | $ 18.86 | $ 16.38 | $ 15.08 | $ 20.01 |
Total Return A, B | 12.54% | 16.87% | 10.56% | (23.97)% | (1.59)% |
Ratios to Average Net Assets D, F | | | | | |
Expenses before reductions | 1.98% | 1.99% | 2.01% | 2.01% | 1.96% |
Expenses net of fee waivers, if any | 1.98% | 1.99% | 2.01% | 2.01% | 1.96% |
Expenses net of all reductions | 1.97% | 1.95% | 1.98% | 2.01% | 1.95% |
Net investment income (loss) | 1.49% | 1.43% | 1.74% | 1.62% | .36% |
Supplemental Data | | | | | |
Net assets, end of period (000 omitted) | $ 6,677 | $ 7,773 | $ 8,794 | $ 10,634 | $ 20,747 |
Portfolio turnover rate E | 195% | 201% | 216% | 247% | 77% |
A Total returns would have been lower if certain expenses had not been reduced during the applicable periods shown.
B Total returns do not include the effect of the contingent deferred sales charge.
C Calculated based on average shares outstanding during the period.
D Fees and expenses of any underlying Fidelity Central Funds are not included in the Fund's expense ratio. The Fund indirectly bears its proportionate share of the expenses of any underlying Fidelity Central Funds.
E Amount does not include the portfolio activity of any underlying Fidelity Central Funds.
F Expense ratios reflect operating expenses of the class. Expenses before reductions do not reflect amounts reimbursed by the investment adviser or reductions from brokerage service arrangements or reductions from other expense offset arrangements and do not represent the amount paid by the class during periods when reimbursements or reductions occur. Expenses net of fee waivers reflect expenses after reimbursement by the investment adviser but prior to reductions from brokerage service arrangements or other expense offset arrangements. Expenses net of all reductions represent the net expenses paid by the class.
G Amount represents less than $.01 per share.
Financial Highlights - Class C
Years ended July 31, | 2012 | 2011 | 2010 | 2009 | 2008 |
Selected Per-Share Data | | | | | |
Net asset value, beginning of period | $ 18.75 | $ 16.30 | $ 15.02 | $ 19.93 | $ 20.38 |
Income from Investment Operations | | | | | |
Net investment income (loss) C | .29 | .26 | .27 | .24 | .08 |
Net realized and unrealized gain (loss) | 2.03 | 2.46 | 1.30 | (5.02) | (.39) |
Total from investment operations | 2.32 | 2.72 | 1.57 | (4.78) | (.31) |
Distributions from net investment income | (.27) | (.27) | (.29) | (.13) | (.14) |
Redemption fees added to paid in capital C, G | - | - | - | - | - |
Net asset value, end of period | $ 20.80 | $ 18.75 | $ 16.30 | $ 15.02 | $ 19.93 |
Total Return A, B | 12.56% | 16.85% | 10.54% | (23.96)% | (1.58)% |
Ratios to Average Net Assets D, F | | | | | |
Expenses before reductions | 1.95% | 1.98% | 2.01% | 2.01% | 1.95% |
Expenses net of fee waivers, if any | 1.95% | 1.98% | 2.01% | 2.01% | 1.95% |
Expenses net of all reductions | 1.95% | 1.94% | 1.97% | 2.01% | 1.95% |
Net investment income (loss) | 1.51% | 1.43% | 1.74% | 1.62% | .36% |
Supplemental Data | | | | | |
Net assets, end of period (000 omitted) | $ 29,942 | $ 26,915 | $ 21,415 | $ 22,352 | $ 37,387 |
Portfolio turnover rate E | 195% | 201% | 216% | 247% | 77% |
A Total returns would have been lower if certain expenses had not been reduced during the applicable periods shown.
B Total returns do not include the effect of the contingent deferred sales charge.
C Calculated based on average shares outstanding during the period.
D Fees and expenses of any underlying Fidelity Central Funds are not included in the Fund's expense ratio. The Fund indirectly bears its proportionate share of the expenses of any underlying Fidelity Central Funds.
E Amount does not include the portfolio activity of any underlying Fidelity Central Funds.
F Expense ratios reflect operating expenses of the class. Expenses before reductions do not reflect amounts reimbursed by the investment adviser or reductions from brokerage service arrangements or reductions from other expense offset arrangements and do not represent the amount paid by the class during periods when reimbursements or reductions occur. Expenses net of fee waivers reflect expenses after reimbursement by the investment adviser but prior to reductions from brokerage service arrangements or other expense offset arrangements. Expenses net of all reductions represent the net expenses paid by the class.
G Amount represents less than $.01 per share.
See accompanying notes which are an integral part of the financial statements.
Annual Report
Financial Highlights - Institutional Class
Years ended July 31, | 2012 | 2011 | 2010 | 2009 | 2008 |
Selected Per-Share Data | | | | | |
Net asset value, beginning of period | $ 19.40 | $ 16.85 | $ 15.51 | $ 20.52 | $ 20.95 |
Income from Investment Operations | | | | | |
Net investment income (loss) B | .50 | .45 | .44 | .39 | .31 |
Net realized and unrealized gain (loss) | 2.10 | 2.54 | 1.35 | (5.17) | (.38) |
Total from investment operations | 2.60 | 2.99 | 1.79 | (4.78) | (.07) |
Distributions from net investment income | (.44) | (.44) | (.45) | (.23) | (.36) |
Redemption fees added to paid in capital B, F | - | - | - | - | - |
Net asset value, end of period | $ 21.56 | $ 19.40 | $ 16.85 | $ 15.51 | $ 20.52 |
Total Return A | 13.79% | 18.05% | 11.66% | (23.24)% | (.49)% |
Ratios to Average Net Assets C, E | | | | | |
Expenses before reductions | .92% | .98% | 1.00% | 1.00% | .91% |
Expenses net of fee waivers, if any | .92% | .98% | 1.00% | 1.00% | .91% |
Expenses net of all reductions | .91% | .94% | .97% | 1.00% | .90% |
Net investment income (loss) | 2.55% | 2.44% | 2.75% | 2.63% | 1.41% |
Supplemental Data | | | | | |
Net assets, end of period (000 omitted) | $ 20,564 | $ 10,914 | $ 6,511 | $ 4,373 | $ 5,704 |
Portfolio turnover rate D | 195% | 201% | 216% | 247% | 77% |
A Total returns would have been lower if certain expenses had not been reduced during the applicable periods shown.
B Calculated based on average shares outstanding during the period.
C Fees and expenses of any underlying Fidelity Central Funds are not included in the Fund's expense ratio. The Fund indirectly bears its proportionate share of the expenses of any underlying Fidelity Central Funds.
D Amount does not include the portfolio activity of any underlying Fidelity Central Funds.
E Expense ratios reflect operating expenses of the class. Expenses before reductions do not reflect amounts reimbursed by the investment adviser or reductions from brokerage service arrangements or reductions from other expense offset arrangements and do not represent the amount paid by the class during periods when reimbursements or reductions occur. Expenses net of fee waivers reflect expenses after reimbursement by the investment adviser but prior to reductions from brokerage service arrangements or other expense offset arrangements. Expenses net of all reductions represent the net expenses paid by the class.
F Amount represents less than $.01 per share.
See accompanying notes which are an integral part of the financial statements.
Annual Report
Fidelity Advisor Utilities Fund
Notes to Financial Statements
For the period ended July 31, 2012
1. Organization.
Fidelity Advisor Utilities Fund (the Fund) is a non-diversified fund of Fidelity Advisor Series VII (the Trust) and is authorized to issue an unlimited number of shares. The Trust is registered under the Investment Company Act of 1940, as amended (the 1940 Act), as an open-end management investment company organized as a Massachusetts business trust. The Fund offers Class A, Class T, Class C, and Institutional Class shares, each of which, along with Class B shares, has equal rights as to assets and voting privileges. Effective after the close of business on September 1, 2010, Class B shares were closed to new accounts and additional purchases, except for exchanges and reinvestments. Each class has exclusive voting rights with respect to matters that affect that class. Class B shares will automatically convert to Class A shares after a holding period of seven years from the initial date of purchase. Investment income, realized and unrealized capital gains and losses, the common expenses of the Fund, and certain fund-level expense reductions, if any, are allocated on a pro-rata basis to each class based on the relative net assets of each class to the total net assets of the Fund. Each class differs with respect to transfer agent and distribution and service plan fees incurred. Certain expense reductions may also differ by class.
2. Investments in Fidelity Central Funds.
The Fund invests in Fidelity Central Funds, which are open-end investment companies available only to other investment companies and accounts managed by Fidelity Management & Research Company (FMR) and its affiliates. The Fund's Schedule of Investments lists each of the Fidelity Central Funds held as of period end, if any, as an investment of the Fund, but does not include the underlying holdings of each Fidelity Central Fund. As an Investing Fund, the Fund indirectly bears its proportionate share of the expenses of the underlying Fidelity Central Funds.
The Money Market Central Funds seek preservation of capital and current income and are managed by Fidelity Investments Money Management, Inc. (FIMM), an affiliate of FMR.
A complete unaudited list of holdings for each Fidelity Central Fund is available upon request or at the Securities and Exchange Commission (the SEC) web site at www.sec.gov. In addition, the financial statements of the Fidelity Central Funds, which are not covered by the Fund's Report of Independent Registered Public Accounting Firm, are available on the SEC web site or upon request.
3. Significant Accounting Policies.
The financial statements have been prepared in conformity with accounting principles generally accepted in the United States of America (GAAP), which require management to make certain estimates and assumptions at the date of the financial statements. Actual results could differ from those estimates. Subsequent events, if any, through the date that the financial statements were issued have been evaluated in the preparation of the financial statements. The following summarizes the significant accounting policies of the Fund:
Security Valuation. Investments are valued as of 4:00 p.m. Eastern time on the last calendar day of the period. In accordance with valuation policies and procedures approved by the Board of Trustees (the Board), the Fund attempts to obtain prices from one or more third party pricing vendor or broker to value its investments. When current market prices, quotations or rates are not readily available or reliable, securities will be fair valued in good faith by the FMR Fair Value Committee (the Committee), in accordance with procedures adopted by the Fund's Board. Factors used in determining fair value vary by security type and may include market or security specific events. The frequency with which these procedures are used cannot be predicted and they may be utilized to a significant extent. The Committee oversees the Fund's valuation policies and procedures and is responsible for approving and reporting to the Board all fair value determinations.
The Fund categorizes the inputs to valuation techniques used to value its investments into a disclosure hierarchy consisting of three levels as shown below:
Level 1 - quoted prices in active markets for identical investments
Level 2 - other significant observable inputs (including quoted prices for similar investments, interest rates, prepayment speeds, etc.)
Level 3 - unobservable inputs (including the Fund's own assumptions based on the best information available)
Valuation techniques used to value the Fund's investments by major category are as follows:
Equity securities, including restricted securities, for which market quotations are readily available, are valued at the last reported sale price or official closing price as reported by a third party pricing vendor on the primary market or exchange on which they are traded and are categorized as Level 1 in the hierarchy. In the event there were no sales during the day or closing prices are not available, securities are valued at the last quoted bid price or may be valued using the last available price and are generally categorized as Level 2 in the hierarchy. For foreign equity securities, when significant market or security specific events arise, comparisons to the valuation of American Depositary Receipts (ADRs), futures contracts, Exchange-Traded Funds (ETFs) and certain indexes as well as quoted prices for similar securities are used and are categorized as Level 2 in the hierarchy. Utilizing these techniques may result in transfers between Level 1 and Level 2.
Investments in open-end mutual funds, including the Fidelity Central Funds, are valued at their closing net asset value each business day and are categorized as Level 1 in the hierarchy.
Changes in valuation techniques may result in transfers in or out of an assigned level within the disclosure hierarchy.
Annual Report
Fidelity Advisor Utilities Fund
Notes to Financial Statements - continued
3. Significant Accounting Policies - continued
Foreign Currency Translation. The Fund may use foreign currency contracts to facilitate transactions in foreign-denominated securities. Gains and losses from these transactions may arise from changes in the value of the foreign currency or if the counterparties do not perform under the contracts' terms.
Foreign-denominated assets, including investment securities, and liabilities are translated into U.S. dollars at the exchange rates at period end. Purchases and sales of investment securities, income and dividends received and expenses denominated in foreign currencies are translated into U.S. dollars at the exchange rate in effect on the transaction date.
The effects of exchange rate fluctuations on investments are included with the net realized and unrealized gain (loss) on investment securities. Other foreign currency transactions resulting in realized and unrealized gain (loss) are disclosed separately.
Investment Transactions and Income. For financial reporting purposes, the Fund's investment holdings and NAV include trades executed through the end of the last business day of the period. The NAV per share for processing shareholder transactions is calculated as of the close of business of the New York Stock Exchange (NYSE), normally 4:00 p.m. Eastern time and includes trades executed through the end of the prior business day. Gains and losses on securities sold are determined on the basis of identified cost and may include proceeds received from litigation. Dividend income is recorded on the ex-dividend date, except for certain dividends from foreign securities where the ex-dividend date may have passed, which are recorded as soon as the Fund is informed of the ex-dividend date. Non-cash dividends included in dividend income, if any, are recorded at the fair market value of the securities received. Interest income and distributions from the Fidelity Central Funds are accrued as earned. Interest income includes coupon interest and amortization of premium and accretion of discount on debt securities. Investment income is recorded net of foreign taxes withheld where recovery of such taxes is uncertain.
Expenses. Expenses directly attributable to a fund are charged to that fund. Expenses attributable to more than one fund are allocated among the respective funds on the basis of relative net assets or other appropriate methods. Expense estimates are accrued in the period to which they relate and adjustments are made when actual amounts are known.
Income Tax Information and Distributions to Shareholders. Each year, the Fund intends to qualify as a regulated investment company under Subchapter M of the Internal Revenue Code, including distributing substantially all of its taxable income and realized gains. As a result, no provision for income taxes is required. As of July 31, 2012, the Fund did not have any unrecognized tax benefits in the financial statements; nor is the Fund aware of any tax positions for which it is reasonably possible that the total amounts of unrecognized tax benefits will significantly change in the next twelve months. The Fund files a U.S. federal tax return, in addition to state and local tax returns as required. A fund's federal income tax returns are subject to examination by the Internal Revenue Service (IRS) for a period of three fiscal years after they are filed. State and local tax returns may be subject to examination for an additional fiscal year depending on the jurisdiction. Foreign taxes are provided for based on the Fund's understanding of the tax rules and rates that exist in the foreign markets in which it invests.
Distributions are declared and recorded on the ex-dividend date. Income dividends and capital gain distributions are declared separately for each class. Income and capital gain distributions are determined in accordance with income tax regulations, which may differ from GAAP.
Capital accounts within the financial statements are adjusted for permanent book-tax differences. These adjustments have no impact on net assets or the results of operations. Temporary book-tax differences will reverse in a subsequent period.
Book-tax differences are primarily due to foreign currency transactions, partnerships, equity-debt classifications, capital loss carryforwards and losses deferred due to wash sales.
The federal tax cost of investment securities and unrealized appreciation (depreciation) as of period end were as follows:
Gross unrealized appreciation | $ 16,531,709 |
Gross unrealized depreciation | (1,153,862) |
Net unrealized appreciation (depreciation) on securities and other investments | $ 15,377,847 |
| |
Tax Cost | $ 184,143,476 |
The tax-based components of distributable earnings as of period end were as follows:
Undistributed ordinary income | $ 1,693,801 |
Capital loss carryforward | $ (30,996,726) |
Net unrealized appreciation (depreciation) | $ 15,377,847 |
Annual Report
3. Significant Accounting Policies - continued
Income Tax Information and Distributions to Shareholders - continued
Capital loss carryforwards are only available to offset future capital gains of the Fund to the extent provided by regulations and may be limited. Under the Regulated Investment Company Modernization Act of 2010 (the Act), the Fund is permitted to carry forward capital losses incurred in taxable years beginning after December 22, 2010 for an unlimited period and such capital losses are required to be used prior to any losses that expire. Capital loss carryforwards were as follows:
Fiscal year of expiration | |
2017 | $ (2,914,692) |
2018 | (28,082,034) |
Total capital loss carryforward | $ (30,996,726) |
The tax character of distributions paid was as follows:
| July 31, 2012 | July 31, 2011 |
Ordinary Income | $ 3,107,112 | $ 2,864,390 |
Short-Term Trading (Redemption) Fees. Shares held by investors in the Fund less than 30 days are subject to a redemption fee equal to .75% of the net asset value of shares redeemed. All redemption fees, which reduce the proceeds of the shareholder redemption, are retained by the Fund and accounted for as an addition to paid in capital.
New Accounting Pronouncement. In December 2011, the Financial Accounting Standards Board issued Accounting Standard Update No. 2011-11, Disclosures about Offsetting Assets and Liabilities. The update creates new disclosure requirements requiring entities to disclose both gross and net information for derivatives and other financial instruments that are either offset in the Statement of Assets and Liabilities or subject to an enforceable master netting arrangement or similar agreement. The disclosure requirements are effective for interim and annual reporting periods beginning on or after January 1, 2013. Management is currently evaluating the impact of the update's adoption on the Fund's financial statement disclosures.
4. Purchases and Sales of Investments.
Purchases and sales of securities, other than short-term securities, aggregated $342,529,260 and $328,678,428, respectively.
5. Fees and Other Transactions with Affiliates.
Management Fee. FMR and its affiliates provide the Fund with investment management related services for which the Fund pays a monthly management fee. The management fee is the sum of an individual fund fee rate that is based on an annual rate of .30% of the Fund's average net assets and an annualized group fee rate that averaged .26% during the period. The group fee rate is based upon the average net assets of all the mutual funds advised by FMR. The group fee rate decreases as assets under management increase and increases as assets under management decrease. For the period, the total annual management fee rate was .56% of the Fund's average net assets.
Distribution and Service Plan Fees. In accordance with Rule 12b-1 of the 1940 Act, the Fund has adopted separate Distribution and Service Plans for each class of shares. Certain classes pay Fidelity Distributors Corporation (FDC), an affiliate of FMR, separate Distribution and Service Fees, each of which is based on an annual percentage of each class' average net assets. In addition, FDC may pay financial intermediaries for selling shares of the Fund and providing shareholder support services. For the period, the Distribution and Service Fee rates, total fees and amounts retained by FDC were as follows:
| Distribution
Fee | Service
Fee | Total Fees | Retained
by FDC |
Class A | -% | .25% | $ 214,732 | $ 4,630 |
Class T | .25% | .25% | 181,944 | 1,028 |
Class B | .75% | .25% | 70,797 | 53,145 |
Class C | .75% | .25% | 286,724 | 41,280 |
| | | $ 754,197 | $ 100,083 |
Sales Load. FDC may receive a front-end sales charge of up to 5.75% for selling Class A shares and 3.50% for selling Class T shares, some of which is paid to financial intermediaries for selling shares of the Fund. Depending on the holding period, FDC may receive contingent deferred sales charges levied on Class A, Class T, Class B, and Class C redemptions. The deferred sales charges range from 5.00% to 1.00% for Class B shares, 1.00% for Class C shares, 1.00% for certain purchases of Class A shares and .25% for certain purchases of Class T shares.
Annual Report
Fidelity Advisor Utilities Fund
Notes to Financial Statements - continued
5. Fees and Other Transactions with Affiliates - continued
Sales Load - continued
For the period, sales charge amounts retained by FDC were as follows:
| Retained
by FDC |
Class A | $ 84,073 |
Class T | 11,209 |
Class B* | 14,892 |
Class C* | 3,294 |
| $ 113,468 |
* When Class B and Class C shares are initially sold, FDC pays commissions from its own resources to financial intermediaries through which the sales are made.
Transfer Agent Fees. Fidelity Investments Institutional Operations Company, Inc. (FIIOC), an affiliate of FMR, is the transfer, dividend disbursing and shareholder servicing agent for each class of the Fund. FIIOC receives account fees and asset-based fees that vary according to the account size and type of account of the shareholders of the respective classes of the Fund. FIIOC pays for typesetting, printing and mailing of shareholder reports, except proxy statements. For the period, transfer agent fees for each class were as follows:
| Amount | % of
Average
Net Assets |
Class A | $ 258,677 | .30 |
Class T | 113,959 | .31 |
Class B | 21,373 | .30 |
Class C | 79,958 | .28 |
Institutional Class | 30,155 | .24 |
| $ 504,122 | |
Accounting and Security Lending Fees. Fidelity Service Company, Inc. (FSC), an affiliate of FMR, maintains the Fund's accounting records. The accounting fee is based on the level of average net assets for each month. Under a separate contract, FSC administers the security lending program. The security lending fee is based on the number and duration of lending transactions.
Brokerage Commissions. The Fund placed a portion of its portfolio transactions with brokerage firms which are affiliates of the investment adviser. The commissions paid to these affiliated firms were $9,377 for the period.
6. Committed Line of Credit.
The Fund participates with other funds managed by FMR or an affiliate in a $4.25 billion credit facility (the "line of credit") to be utilized for temporary or emergency purposes to fund shareholder redemptions or for other short-term liquidity purposes. The Fund has agreed to pay commitment fees on its pro-rata portion of the line of credit, which amounted to $477 and is reflected in Miscellaneous expenses on the Statement of Operations. During the period, there were no borrowings on this line of credit.
7. Security Lending.
The Fund lends portfolio securities through a lending agent from time to time in order to earn additional income. For equity securities, a lending agent is used and may loan securities to certain qualified borrowers, including Fidelity Capital Markets (FCM), a broker-dealer affiliated with the Fund. On the settlement date of the loan, the Fund receives collateral (in the form of U.S. Treasury obligations, letters of credit and/or cash) against the loaned securities and maintains collateral in an amount not less than 100% of the market value of the loaned securities during the period of the loan. The market value of the loaned securities is determined at the close of business of the Fund and any additional required collateral is delivered to the Fund on the next business day. If the borrower defaults on its obligation to return the securities loaned because of insolvency or other reasons, a fund could experience delays and costs in recovering the securities loaned or in gaining access to the collateral. Any cash collateral received is invested in the Fidelity Securities Lending Cash Central Fund. The value of loaned securities and cash collateral at period end are disclosed on the Fund's Statement of Assets and Liabilities. Security lending income represents the income earned on investing cash collateral, less rebates paid to borrowers and any lending agent fees associated with the loan, plus any premium payments received for lending certain types of securities. Security lending income is presented in the Statement of Operations as a component of income from Fidelity Central Funds. Total security lending income during the period amounted to $25,507. During the period, there were no securities loaned to FCM.
Annual Report
8. Expense Reductions.
Many of the brokers with whom FMR places trades on behalf of the Fund provided services to the Fund in addition to trade execution. These services included payments of certain expenses on behalf of the Fund totaling $12,239 for the period.
9. Distributions to Shareholders.
Distributions to shareholders of each class were as follows:
Years ended July 31, | 2012 | 2011 |
From net investment income | | |
Class A | $ 1,654,303 | $ 1,536,373 |
Class T | 639,462 | 680,070 |
Class B | 91,242 | 128,700 |
Class C | 419,210 | 350,529 |
Institutional Class | 302,895 | 168,718 |
Total | $ 3,107,112 | $ 2,864,390 |
10. Share Transactions.
Transactions for each class of shares were as follows:
| Shares | Dollars |
Years ended July 31, | 2012 | 2011 | 2012 | 2011 |
Class A | | | | |
Shares sold | 1,455,060 | 951,835 | $ 28,046,781 | $ 17,339,635 |
Reinvestment of distributions | 77,893 | 78,008 | 1,433,959 | 1,339,641 |
Shares redeemed | (926,992) | (840,008) | (17,830,196) | (15,213,828) |
Net increase (decrease) | 605,961 | 189,835 | $ 11,650,544 | $ 3,465,448 |
Class T | | | | |
Shares sold | 428,140 | 251,762 | $ 8,180,543 | $ 4,579,718 |
Reinvestment of distributions | 32,850 | 37,445 | 606,115 | 644,378 |
Shares redeemed | (526,129) | (448,193) | (10,126,088) | (8,103,122) |
Net increase (decrease) | (65,139) | (158,986) | $ (1,339,430) | $ (2,879,026) |
Class B | | | | |
Shares sold | 59,712 | 39,073 | $ 1,111,703 | $ 679,580 |
Reinvestment of distributions | 4,324 | 6,858 | 79,307 | 116,904 |
Shares redeemed | (157,671) | (170,627) | (2,989,895) | (3,021,254) |
Net increase (decrease) | (93,635) | (124,696) | $ (1,798,885) | $ (2,224,770) |
Class C | | | | |
Shares sold | 518,655 | 405,545 | $ 9,682,101 | $ 7,271,889 |
Reinvestment of distributions | 18,237 | 15,668 | 332,155 | 265,763 |
Shares redeemed | (533,137) | (299,716) | (10,002,257) | (5,335,908) |
Net increase (decrease) | 3,755 | 121,497 | $ 11,999 | $ 2,201,744 |
Institutional Class | | | | |
Shares sold | 988,603 | 343,779 | $ 19,698,436 | $ 6,436,483 |
Reinvestment of distributions | 14,596 | 7,398 | 273,126 | 128,959 |
Shares redeemed | (611,715) | (175,049) | (11,813,084) | (3,230,206) |
Net increase (decrease) | 391,484 | 176,128 | $ 8,158,478 | $ 3,335,236 |
11. Other.
The Fund's organizational documents provide former and current trustees and officers with a limited indemnification against liabilities arising in connection with the performance of their duties to the Fund. In the normal course of business, the Fund may also enter into contracts that provide general indemnifications. The Fund's maximum exposure under these arrangements is unknown as this would be dependent on future claims that may be made against the Fund. The risk of material loss from such claims is considered remote.
Annual Report
Report of Independent Registered Public Accounting Firm
To the Trustees of Advisor Series VII and the Shareholders of Fidelity Advisor Biotechnology Fund, Fidelity Advisor Communications Equipment Fund, Fidelity Advisor Consumer Discretionary Fund, Fidelity Advisor Electronics Fund, Fidelity Advisor Energy Fund, Fidelity Advisor Financial Services Fund, Fidelity Advisor Health Care Fund, Fidelity Advisor Industrials Fund, Fidelity Advisor Technology Fund, and Fidelity Advisor Utilities Fund:
We have audited the accompanying statements of assets and liabilities of Fidelity Advisor Biotechnology Fund, Fidelity Advisor Communications Equipment Fund, Fidelity Advisor Consumer Discretionary Fund, Fidelity Advisor Electronics Fund, Fidelity Advisor Energy Fund, Fidelity Advisor Financial Services Fund, Fidelity Advisor Health Care Fund, Fidelity Advisor Industrials Fund, Fidelity Advisor Technology Fund, and Fidelity Advisor Utilities Fund (collectively, the "Funds"), including the schedules of investments, as of July 31, 2012, and the related statements of operations for the year then ended, the statements of changes in net assets for each of the two years in the period then ended, and the financial highlights for each of the five years in the period then ended. These financial statements and financial highlights are the responsibility of the Funds' management. Our responsibility is to express an opinion on these financial statements and financial highlights based on our audits.
We conducted our audits in accordance with the standards of the Public Company Accounting Oversight Board (United States). Those standards require that we plan and perform the audit to obtain reasonable assurance about whether the financial statements and financial highlights are free of material misstatement. The Funds are not required to have, nor were we engaged to perform, an audit of their internal control over financial reporting. Our audits included consideration of internal control over financial reporting as a basis for designing audit procedures that are appropriate in the circumstances, but not for the purpose of expressing an opinion on the effectiveness of the Fund's internal control over financial reporting. Accordingly, we express no such opinion. An audit also includes examining, on a test basis, evidence supporting the amounts and disclosures in the financial statements, assessing the accounting principles used and significant estimates made by management, as well as evaluating the overall financial statement presentation. Our procedures included confirmation of securities owned as of July 31, 2012, by correspondence with the custodians and brokers; where replies were not received from brokers, we performed other auditing procedures. We believe that our audits provide a reasonable basis for our opinion.
In our opinion, the financial statements and financial highlights referred to above present fairly, in all material respects, the financial position of Fidelity Advisor Biotechnology Fund, Fidelity Advisor Communications Equipment Fund, Fidelity Advisor Consumer Discretionary Fund, Fidelity Advisor Electronics Fund, Fidelity Advisor Energy Fund, Fidelity Advisor Financial Services Fund, Fidelity Advisor Health Care Fund, Fidelity Advisor Industrials Fund, Fidelity Advisor Technology Fund, and Fidelity Advisor Utilities Fund as of July 31, 2012, the results of their operations for the year then ended, the changes in their net assets for each of the two years in the period then ended, and their financial highlights for each of the five years in the period then ended, in conformity with accounting principles generally accepted in the United States of America.
DELOITTE & TOUCHE LLP
Boston, Massachusetts
September 14, 2012
Annual Report
The Trustees, Members of the Advisory Board, and executive officers of the trust and funds, as applicable, are listed below. The Board of Trustees governs each fund and is responsible for protecting the interests of shareholders. The Trustees are experienced executives who meet periodically throughout the year to oversee each fund's activities, review contractual arrangements with companies that provide services to each fund, oversee management of the risks associated with such activities and contractual arrangements, and review each fund's performance. Except for James C. Curvey, each of the Trustees oversees 228 funds advised by FMR or an affiliate. Mr. Curvey oversees 435 funds advised by FMR or an affiliate.
The Trustees hold office without limit in time except that (a) any Trustee may resign; (b) any Trustee may be removed by written instrument, signed by at least two-thirds of the number of Trustees prior to such removal; (c) any Trustee who requests to be retired or who has become incapacitated by illness or injury may be retired by written instrument signed by a majority of the other Trustees; and (d) any Trustee may be removed at any special meeting of shareholders by a two-thirds vote of the outstanding voting securities of the trust. Each Trustee who is not an interested person (as defined in the 1940 Act) (Independent Trustee), shall retire not later than the last day of the calendar year in which his or her 75th birthday occurs. The Independent Trustees may waive this mandatory retirement age policy with respect to individual Trustees. The executive officers and Advisory Board Members hold office without limit in time, except that any officer and Advisory Board Member may resign or may be removed by a vote of a majority of the Trustees at any regular meeting or any special meeting of the Trustees. Except as indicated, each individual has held the office shown or other offices in the same company for the past five years.
Experience, Skills, Attributes, and Qualifications of the Funds' Trustees. The Governance and Nominating Committee has adopted a statement of policy that describes the experience, qualifications, attributes, and skills that are necessary and desirable for potential Independent Trustee candidates (Statement of Policy). The Board believes that each Trustee satisfied at the time he or she was initially elected or appointed a Trustee, and continues to satisfy, the standards contemplated by the Statement of Policy. The Governance and Nominating Committee also engages professional search firms to help identify potential Independent Trustee candidates who have the experience, qualifications, attributes, and skills consistent with the Statement of Policy. From time to time, additional criteria based on the composition and skills of the current Independent Trustees, as well as experience or skills that may be appropriate in light of future changes to board composition, business conditions, and regulatory or other developments, have also been considered by the professional search firms and the Governance and Nominating Committee. In addition, the Board takes into account the Trustees' commitment and participation in Board and committee meetings, as well as their leadership of standing and ad hoc committees throughout their tenure.
In determining that a particular Trustee was and continues to be qualified to serve as a Trustee, the Board has considered a variety of criteria, none of which, in isolation, was controlling. The Board believes that, collectively, the Trustees have balanced and diverse experience, qualifications, attributes, and skills, which allow the Board to operate effectively in governing each fund and protecting the interests of shareholders. Information about the specific experience, skills, attributes, and qualifications of each Trustee, which in each case led to the Board's conclusion that the Trustee should serve (or continue to serve) as a trustee of the funds, is provided below.
Board Structure and Oversight Function. James C. Curvey is an interested person (as defined in the 1940 Act) and currently serves as Chairman. The Trustees have determined that an interested Chairman is appropriate and benefits shareholders because an interested Chairman has a personal and professional stake in the quality and continuity of services provided to the funds. Independent Trustees exercise their informed business judgment to appoint an individual of their choosing to serve as Chairman, regardless of whether the Trustee happens to be independent or a member of management. The Independent Trustees have determined that they can act independently and effectively without having an Independent Trustee serve as Chairman and that a key structural component for assuring that they are in a position to do so is for the Independent Trustees to constitute a substantial majority for the Board. The Independent Trustees also regularly meet in executive session. Ned C. Lautenbach serves as Chairman of the Independent Trustees and as such (i) acts as a liaison between the Independent Trustees and management with respect to matters important to the Independent Trustees and (ii) with management prepares agendas for Board meetings.
Fidelity funds are overseen by different Boards of Trustees. The funds' Board oversees Fidelity's equity and high income funds and another Board oversees Fidelity's investment-grade bond, money market, and asset allocation funds. The asset allocation funds may invest in Fidelity funds overseen by the funds' Board. The use of separate Boards, each with its own committee structure, allows the Trustees of each group of Fidelity funds to focus on the unique issues of the funds they oversee, including common research, investment, and operational issues. On occasion, the separate Boards establish joint committees to address issues of overlapping consequences for the Fidelity funds overseen by each Board.
The Trustees operate using a system of committees to facilitate the timely and efficient consideration of all matters of importance to the Trustees, each fund, and fund shareholders and to facilitate compliance with legal and regulatory requirements and oversight of the funds' activities and associated risks. The Board, acting through its committees, has charged FMR and its affiliates with (i) identifying events or circumstances the occurrence of which could have demonstrably adverse effects on the funds' business and/or reputation; (ii) implementing processes and controls to lessen the possibility that such events or circumstances occur or to mitigate the effects of such events or circumstances if they do occur; and (iii) creating and maintaining a system designed to evaluate continuously business and market conditions in order to facilitate the identification and implementation processes described in (i) and (ii) above. Because the day-to-day operations and activities of the funds are carried out by or through FMR, its affiliates and other service providers, the funds' exposure to risks is mitigated but not eliminated by the processes overseen by the Trustees. While each of the Board's committees has responsibility for overseeing different aspects of the funds' activities, oversight is exercised primarily through the Operations, Audit, and Compliance Committees. In addition, the Independent Trustees have worked with FMR to enhance the Board's oversight of investment and financial risks, legal and regulatory risks, technology risks, and operational risks, including the development of additional risk reporting to the Board. For example, a working group comprised of Independent Trustees and FMR has worked and continues to work to review the Fidelity funds' valuation-related activities, reporting and risk management. Appropriate personnel, including but not limited to the funds' Chief Compliance Officer (CCO), FMR's internal auditor, the independent accountants, the funds' Treasurer and portfolio management personnel, make periodic reports to the Board's committees, as appropriate, including an annual review of FMR's risk management program for the Fidelity funds. The responsibilities of each standing committee, including their oversight responsibilities, are described further under "Standing Committees of the Funds' Trustees."
Annual Report
Trustees and Officers - continued
The funds' Statement of Additional Information (SAI) includes more information about the Trustees. To request a free copy, call Fidelity at 1-877-208-0098.
Interested Trustees*:
Correspondence intended for each Trustee who is an interested person may be sent to Fidelity Investments, 82 Devonshire Street, Boston, Massachusetts 02109.
Name, Age; Principal Occupations and Other Relevant Experience+ |
James C. Curvey (77) |
| Year of Election or Appointment: 2007 Mr. Curvey is Trustee and Chairman of the Board of Trustees of certain Trusts. Mr. Curvey also serves as Trustee (2007-present) of other investment companies advised by FMR. Mr. Curvey is a Director of Fidelity Investments Money Management, Inc. (2009-present), Director of Fidelity Research & Analysis Co. (2009-present) and Director of FMR and FMR Co., Inc. (2007-present). Mr. Curvey is also Vice Chairman (2007-present) and Director of FMR LLC. In addition, Mr. Curvey serves as an Overseer for the Boston Symphony Orchestra and a member of the Trustees of Villanova University. Previously, Mr. Curvey was the Vice Chairman (2006-2007) and Director (2000-2007) of FMR Corp. |
Ronald P. O'Hanley (55) |
| Year of Election or Appointment: 2011 Mr. O'Hanley is Director of FMR Co., Inc. (2010-present), Director of Fidelity Investments Money Management, Inc. (2010-present), Director of Fidelity Research & Analysis Company (2010-present), President of Fidelity Asset Management and Corporate Services and a member of Fidelity's Executive Committee (2010-present). Previously, Mr. O'Hanley served as President and Chief Executive Officer of BNY Mellon Asset Management (2007-2010). Mr. O'Hanley also served as Vice Chairman of Bank New York Mellon Corp. and a member of that firm's Executive Committee. Prior to the 2007 merger of The Bank of New York and Mellon Financial Corporation, he was Vice Chairman of Mellon Financial Corporation and President and Chief Executive Officer of Mellon Asset Management. He joined Mellon in February 1997. Mr. O'Hanley currently serves as Chairman of the Boston Public Library Foundation Board of Directors and sits on the Board of Directors of Beth Israel Deaconess Medical Center, the Board of Trustees of the Marine Biological Laboratory and the Advisory Board of the Maxwell School of Citizenship and Public Administration at Syracuse University. Mr. O'Hanley also chairs the Council on Asset Management for the Financial Services Roundtable and is a member of the Board of Directors of Institutional Investor's U.S. Institute. |
* Trustees have been determined to be "Interested Trustees" by virtue of, among other things, their affiliation with the trust or various entities under common control with FMR.
+ The information above includes each Trustee's principal occupation during the last five years and other information relating to the experience, attributes, and skills relevant to each Trustee's qualifications to serve as a Trustee, which led to the conclusion that each Trustee should serve as a Trustee for each fund.
Independent Trustees:
Correspondence intended for each Independent Trustee (that is, the Trustees other than the Interested Trustees) may be sent to Fidelity Investments, P.O. Box 55235, Boston, Massachusetts 02205-5235.
Name, Age; Principal Occupations and Other Relevant Experience+ |
Dennis J. Dirks (64) |
| Year of Election or Appointment: 2005 Prior to his retirement in May 2003, Mr. Dirks was Chief Operating Officer and a member of the Board of The Depository Trust & Clearing Corporation (DTCC). He also served as President, Chief Operating Officer, and Board member of The Depository Trust Company (DTC) and President and Board member of the National Securities Clearing Corporation (NSCC). In addition, Mr. Dirks served as Chief Executive Officer and Board member of the Government Securities Clearing Corporation, Chief Executive Officer and Board member of the Mortgage-Backed Securities Clearing Corporation, as a Trustee and a member of the Finance Committee of Manhattan College (2005-2008), and as a Trustee and a member of the Finance Committee of AHRC of Nassau County (2006-2008). Mr. Dirks is a member of the Independent Directors Council (IDC) Governing Council (2010-present) and Board of Directors for The Brookville Center for Children's Services, Inc. (2009-present). |
Alan J. Lacy (58) |
| Year of Election or Appointment: 2008 Mr. Lacy serves as Senior Adviser (2007-present) of Oak Hill Capital Partners, L.P. (private equity). Mr. Lacy also served as Chief Executive Officer (2000-2005) and Vice Chairman (2005-2006) of Sears Holdings Corporation and Sears, Roebuck and Co. (retail). In addition, Mr. Lacy serves as a member of the Board of Directors of Dave & Buster's Entertainment, Inc. (restaurant and entertainment complexes, 2010-present), Earth Fare, Inc. (retail grocery, 2012-present), The Hillman Companies, Inc. (hardware wholesalers, 2010-present), and Bristol-Myers Squibb Company (global pharmaceuticals, 2007-present). Mr. Lacy is a member of the Board of Trustees of The National Parks Conservation Association (2006-present). Previously, Mr. Lacy served as Chairman of the Board of Trustees of the National Parks Conservation Association (2008-2011) and as a member of the Board of Directors for the Western Union Company (global money transfer, 2006-2011). |
Ned C. Lautenbach (68) |
| Year of Election or Appointment: 2000 Mr. Lautenbach is Chairman of the Independent Trustees of the Equity and High Income Funds (2006-present). Mr. Lautenbach currently serves as the Lead Director of the Eaton Corporation Board of Directors (diversified industrial, 1997-present). Mr. Lautenbach is Chairman of the Board of Directors of the Philharmonic Center for the Arts in Naples, Florida (2012-present) and a member of the Council on Foreign Relations (1994-present). Previously, Mr. Lautenbach was a Partner/Advisory Partner at Clayton, Dubilier & Rice, LLC (private equity investment, 1998-2010), as well as a Director of Sony Corporation (2006-2007). |
Joseph Mauriello (67) |
| Year of Election or Appointment: 2008 Prior to his retirement in January 2006, Mr. Mauriello served in numerous senior management positions including Deputy Chairman and Chief Operating Officer (2004-2005), and Vice Chairman of Financial Services (2002-2004) of KPMG LLP US (professional services, 1965-2005). Mr. Mauriello currently serves as a member of the Board of Directors of XL Group plc. (global insurance and re-insurance, 2006-present). Previously, Mr. Mauriello served as a Director of the Hamilton Funds of the Bank of New York (2006-2007) and of Arcadia Resources Inc. (health care services and products, 2007-2012). |
Robert W. Selander (61) |
| Year of Election or Appointment: 2011 Previously, Mr. Selander served as a Member of the Advisory Board of Fidelity's Equity and High Income Funds (2011), Executive Vice Chairman (2010), Chief Executive Officer (2009-2010), and President and Chief Executive Officer (1997-2009) of Mastercard, Inc. |
Cornelia M. Small (68) |
| Year of Election or Appointment: 2005 Ms. Small is a member of the Board of Directors of the Teagle Foundation (2009-present). Ms. Small is also a member of the Investment Committee, and Chair (2008-present) and a member of the Board of Trustees of Smith College. In addition, Ms. Small serves on the Investment Committee of the Berkshire Taconic Community Foundation (2008-present). Previously, Ms. Small served as Chairperson of the Investment Committee (2002-2008) of Smith College. In addition, Ms. Small served as Chief Investment Officer, Director of Global Equity Investments, and a member of the Board of Directors of Scudder, Stevens & Clark and Scudder Kemper Investments. |
William S. Stavropoulos (73) |
| Year of Election or Appointment: 2001 Mr. Stavropoulos is Vice Chairman of the Independent Trustees of the Equity and High Income Funds (2006-present). Mr. Stavropoulos serves as President and Founder of the Michigan Baseball Foundation, the Great Lakes Loons (2007-present). Mr. Stavropoulos is Chairman Emeritus of the Board of Directors of The Dow Chemical Company, where he previously served in numerous senior management positions, including President, CEO (1995-2000; 2002-2004), Chairman of the Executive Committee (2000-2006), and as a member of the Board of Directors (1990-2006). Currently, Mr. Stavropoulos is Chairman of Univar (global distributor of commodity and specialty chemicals, 2010-present), a Director of Teradata Corporation (data warehousing and technology solutions, 2008-present), Chemical Financial Corporation, Maersk Inc. (industrial conglomerate), Tyco International, Inc. (multinational manufacturing and services, 2007-present), and a member of the Advisory Board for Metalmark Capital (private equity investment, 2005-present). Mr. Stavropoulos is a special advisor to Clayton, Dubilier & Rice, LLC (private equity investment). In addition, Mr. Stavropoulos is a member of the University of Notre Dame Advisory Council for the College of Science. |
David M. Thomas (63) |
| Year of Election or Appointment: 2008 Previously, Mr. Thomas served as Executive Chairman (2005-2006) and Chairman and Chief Executive Officer (2000-2005) of IMS Health, Inc. (pharmaceutical and healthcare information solutions). In addition, Mr. Thomas serves as a member of the Board of Directors of Fortune Brands, Inc. (consumer products), and Interpublic Group of Companies, Inc. (marketing communication, 2004-present). |
Michael E. Wiley (61) |
| Year of Election or Appointment: 2008 Mr. Wiley also serves as a Director of Asia Pacific Exploration Consolidated (international oil and gas exploration and production, 2008-present). Mr. Wiley serves as a Director of Tesoro Corporation (independent oil refiner and marketer, 2005-present), and a Director of Bill Barrett Corporation (exploration and production, 2005-present). In addition, Mr. Wiley also serves as a Director of Post Oak Bank (privately-held bank, 2004-present). Previously, Mr. Wiley served as a member of the Board of Trustees of the University of Tulsa (2000-2006; 2007-2010), as a Senior Energy Advisor of Katzenbach Partners, LLC (consulting, 2006-2007), as an Advisory Director of Riverstone Holdings (private investment), Chairman, President, and CEO of Baker Hughes, Inc. (oilfield services, 2000-2004), and as Director of Spinnaker Exploration Company (exploration and production, 2001-2005). |
+ The information above includes each Trustee's principal occupation during the last five years and other information relating to the experience, attributes, and skills relevant to each Trustee's qualifications to serve as a Trustee, which led to the conclusion that each Trustee should serve as a Trustee for each fund.
Advisory Board Members and Executive Officers:
Correspondence intended for David A. Rosow and Garnett A. Smith may be sent to Fidelity Investments, P.O. Box 55235, Boston, Massachusetts 02205-5235. Correspondence intended for each executive officer, Edward C. Johnson 3d, and Peter S. Lynch may be sent to Fidelity Investments, 82 Devonshire Street, Boston, Massachusetts 02109.
Name, Age; Principal Occupation |
Edward C. Johnson 3d (82) |
| Year of Election or Appointment: 2011 Member of the Advisory Board of Fidelity's Equity and High Income Funds. Mr. Johnson serves as Chief Executive Officer, Chairman, and a Director of FMR LLC, and also serves as Chairman and Director of FIL Limited. Previously, Mr. Johnson served as a Trustee and Chairman of the Board of certain Fidelity Trusts, Chairman and a Director of FMR, Chairman and a Director of FMR Co., Inc., and President of FMR LLC (2006-2007). |
Peter S. Lynch (68) |
| Year of Election or Appointment: 2003 Member of the Advisory Board of Fidelity's Equity and High Income Funds. Mr. Lynch is Vice Chairman and a Director of FMR and FMR Co., Inc. In addition, Mr. Lynch serves as a Trustee of Boston College and as the Chairman of the Inner-City Scholarship Fund. Previously, Mr. Lynch served on the Special Olympics International Board of Directors (1997-2006). |
David A. Rosow (69) |
| Year of Election or Appointment: 2012 Member of the Advisory Board of Fidelity's Equity and High Income Funds. Chairman and Chief Executive Officer of International Golf Group, Inc. (golf course development, 1990-present). Previously, Mr. Rosow served as Chairman and Chief Executive Officer of Rosow & Company, Inc. (private investment company, 1989-2011), a Lead Director of Hudson United Bancorp (2001-2006) and as a Director of TD Banknorth (1996-2006). In addition, Mr. Rosow is a member (2008-present) and President (2009-present) of the Town Council of Palm Beach, Florida. |
Garnett A. Smith (64) |
| Year of Election or Appointment: 2012 Member of the Advisory Board of Fidelity's Equity and High Income Funds. Prior to Mr. Smith's retirement, he served as Chairman and Chief Executive Officer of Inbrand Corp. (manufacturer of personal absorbent products, 1990-1997). He also served as President (1986-1990) of Inbrand Corp. Prior to his employment with Inbrand Corp., he was employed by a retail fabric chain and North Carolina National Bank. In addition, Mr. Smith is a board member of the Jackson Hole Land Trust (2009-present). |
Kenneth B. Robins (42) |
| Year of Election or Appointment: 2008 President and Treasurer of Fidelity's Equity and High Income Funds. Mr. Robins also serves as President and Treasurer (2010-present) and Assistant Treasurer (2009-present) of other Fidelity funds and is an employee of Fidelity Investments (2004-present). Previously, Mr. Robins served as Deputy Treasurer of the Fidelity funds (2005-2008) and Treasurer and Chief Financial Officer of The North Carolina Capital Management Trust: Cash and Term Portfolios (2006-2008). |
Brian B. Hogan (47) |
| Year of Election or Appointment: 2009 Vice President of Equity and High Income Funds. Mr. Hogan also serves as President of FMR's Equity Division (2009-present). Previously, Mr. Hogan served as Senior Vice President, Equity Research of FMR (2006-2009) and as a portfolio manager. |
Christopher S. Bartel (40) |
| Year of Election or Appointment: 2009 Vice President of Fidelity's Sector and Real Estate Equity Funds. Mr. Bartel also serves as a Director, President, and Chief Executive Officer of Fidelity Management & Research (Japan) Inc. (2012-present), a Director of Fidelity Management & Research (Hong Kong) (2012-present), and Senior Vice President of Global Equity Research (2010-present). Previously, Mr. Bartel served as Senior Vice President of Equity Research (2009-2010), Managing Director of Research (2006-2009), and an analyst and portfolio manager (2000-2006). |
Scott C. Goebel (44) |
| Year of Election or Appointment: 2008 Secretary and Chief Legal Officer (CLO) of the Fidelity funds. Mr. Goebel also serves as Secretary of Fidelity Investments Money Management, Inc. (FIMM) (2010-present) and Fidelity Research and Analysis Company (FRAC) (2010-present); Secretary and CLO of The North Carolina Capital Management Trust: Cash and Term Portfolios (2008-present); General Counsel, Secretary, and Senior Vice President of FMR (2008-present) and FMR Co., Inc. (2008-present); employed by FMR LLC or an affiliate (2001-present); Chief Legal Officer of Fidelity Management & Research (Hong Kong) Limited (2008-present) and Assistant Secretary of Fidelity Management & Research (Japan) Inc. (2008-present), and Fidelity Management & Research (U.K.) Inc. (2008-present). Previously, Mr. Goebel served as Assistant Secretary of FIMM (2008-2010), FRAC (2008-2010), and the Funds (2007-2008) and as Vice President and Secretary of Fidelity Distributors Corporation (FDC) (2005-2007). |
William C. Coffey (43) |
| Year of Election or Appointment: 2009 Assistant Secretary of Fidelity's Equity and High Income Funds. Mr. Coffey also serves as Senior Vice President and Deputy General Counsel of FMR LLC (2010-present), and is an employee of Fidelity Investments. Previously, Mr. Coffey served as Vice President and Associate General Counsel of FMR LLC (2005-2009). |
Elizabeth Paige Baumann (44) |
| Year of Election or Appointment: 2012 Anti-Money Laundering (AML) Officer of the Fidelity funds. Ms. Baumann also serves as AML Officer of The North Carolina Capital Management Trust: Cash and Term Portfolios (2012-present), Chief AML Officer of FMR LLC (2012-present), and is an employee of Fidelity Investments. Previously, Ms. Baumann served as Vice President and Deputy Anti-Money Laundering Officer (2007-2012). |
Christine Reynolds (53) |
| Year of Election or Appointment: 2008 Chief Financial Officer of the Fidelity funds. Ms. Reynolds became President of Fidelity Pricing and Cash Management Services (FPCMS) in August 2008. Ms. Reynolds served as Chief Operating Officer of FPCMS (2007-2008). Previously, Ms. Reynolds served as President, Treasurer, and Anti-Money Laundering officer of the Fidelity funds (2004-2007). |
Joseph A. Hanlon (44) |
| Year of Election or Appointment: 2012 Chief Compliance Officer of Fidelity's Equity and High Income Funds. Mr. Hanlon serves as Compliance Officer of FMR, FMR Co., Inc., Fidelity Investments Money Management, Inc. (FIMM), Fidelity Research and Analysis Company (FRAC), Fidelity Management & Research (Japan) Inc., Fidelity Management & Research (U.K.) Inc., Fidelity Management & Research (Hong Kong), and Strategic Advisers, Inc. (2009-present), as Senior Vice President of the Fidelity Asset Management Division (2009-present), and is an employee of Fidelity Investments. |
Joseph F. Zambello (55) |
| Year of Election or Appointment: 2011 Deputy Treasurer of the Fidelity funds. Mr. Zambello is an employee of Fidelity Investments. Previously, Mr. Zambello served as Vice President of FMR's Program Management Group (2009-2011) and Vice President of the Transfer Agent Oversight Group (2005-2009). |
Adrien E. Deberghes (44) |
| Year of Election or Appointment: 2008 Deputy Treasurer of Fidelity's Equity and High Income Funds. Mr. Deberghes also serves as Vice President (2011-present) and Assistant Treasurer (2010-present) of other Fidelity funds, and is an employee of Fidelity Investments (2008-present). Previously, Mr. Deberghes served as Senior Vice President of Mutual Fund Administration at State Street Corporation (2007-2008), Senior Director of Mutual Fund Administration at Investors Bank & Trust (2005-2007), and Director of Finance for Dunkin' Brands (2000-2005). |
Stephanie J. Dorsey (43) |
| Year of Election or Appointment: 2010 Assistant Treasurer of Fidelity's Equity and High Income Funds. Ms. Dorsey also serves as Deputy Treasurer of other Fidelity funds (2008-present) and is an employee of Fidelity Investments (2008-present). Previously, Ms. Dorsey served as Treasurer (2004-2008) of the JPMorgan Mutual Funds and Vice President (2004-2008) of JPMorgan Chase Bank. |
John R. Hebble (54) |
| Year of Election or Appointment: 2009 Assistant Treasurer of Fidelity's Equity and High Income Funds. Mr. Hebble also serves as President (2011-present), Treasurer, and Chief Financial Officer of The North Carolina Capital Management Trust: Cash and Term Portfolios (2008-present), President and Treasurer of other Fidelity funds (2008-present) and is an employee of Fidelity Investments. |
Gary W. Ryan (53) |
| Year of Election or Appointment: 2005 Assistant Treasurer of the Fidelity funds. Mr. Ryan is an employee of Fidelity Investments. Previously, Mr. Ryan served as Vice President of Fund Reporting in Fidelity Pricing and Cash Management Services (FPCMS) (1999-2005). |
Jonathan Davis (44) |
| Year of Election or Appointment: 2010 Assistant Treasurer of the Fidelity funds. Mr. Davis is also Assistant Treasurer of Fidelity Rutland Square Trust II and Fidelity Commonwealth Trust II. Mr. Davis is an employee of Fidelity Investments. Previously, Mr. Davis served as Vice President and Associate General Counsel of FMR LLC (2003-2010). |
Annual Report
The Board of Trustees of each fund voted to pay to shareholders of record at the opening of business on record date the following distributions per share derived from capital gains realized from sales of portfolio securities and dividends derived from net investment income:
| Pay Date | Record Date | Dividends | Capital Gains |
Fidelity Advisor Biotechnology Fund | | | | |
Institutional Class | 09/10/12 | 09/07/12 | $0.000 | $0.685 |
Fidelity Advisor Communications Equipment Fund | | | | |
Institutional Class | 09/10/12 | 09/07/12 | $0.000 | $0.000 |
Fidelity Advisor Consumer Discretionary Fund | | | | |
Institutional Class | 09/10/12 | 09/07/12 | $0.000 | $0.811 |
Fidelity Advisor Electronics Fund | | | | |
Institutional Class | 09/10/12 | 09/07/12 | $0.000 | $0.000 |
Fidelity Advisor Energy Fund | | | | |
Institutional Class | 09/10/12 | 09/07/12 | $0.000 | $0.000 |
Fidelity Advisor Financial Services Fund | | | | |
Institutional Class | 09/10/12 | 09/07/12 | $0.053 | $0.000 |
Fidelity Advisor Health Care Fund | | | | |
Institutional Class | 09/10/12 | 09/07/12 | $0.000 | $1.941 |
Fidelity Advisor Industrials Fund | | | | |
Institutional Class | 09/10/12 | 09/07/12 | $0.146 | $0.000 |
Fidelity Advisor Technology Fund | | | | |
Institutional Class | 09/10/12 | 09/07/12 | $0.000 | $0.000 |
Fidelity Advisor Utilities Fund | | | | |
Institutional Class | 09/10/12 | 09/07/12 | $0.251 | $0.000 |
The funds hereby designate as capital gain dividend the amounts noted below for the taxable year ended July 31, 2012, or, if subsequently determined to be different, the net capital gain of such year.
Fidelity Advisor Biotechnology Fund | $10,507,377 |
Fidelity Advisor Consumer Discretionary Fund | $3,717,975 |
Fidelity Advisor Health Care Fund | $42,500,381 |
A percentage of the dividends distributed during the fiscal year for the following funds qualify for the dividends-received deduction for corporate shareholders:
| September 2011 | December 2011 |
Fidelity Advisor Consumer Discretionary Fund | | |
Institutional Class | 0% | 100% |
Fidelity Advisor Energy Fund | | |
Institutional Class | 0% | 100% |
Fidelity Advisor Financial Services Fund | | |
Institutional Class | 0% | 100% |
Fidelity Advisor Industrials Fund | | |
Institutional Class | 100% | 100% |
Fidelity Advisor Utilities Fund | | |
Institutional Class | 100% | 100% |
Annual Report
Distributions - continued
A percentage of the dividends distributed during the fiscal year for the following funds may be taken into account as a dividend for purposes of the maximum rate under section 1(h)(11) of the Internal Revenue Code.
| September 2011 | December 2011 |
Fidelity Advisor Consumer Discretionary Fund | | |
Institutional Class | 0% | 100% |
Fidelity Advisor Energy Fund | | |
Institutional Class | 0% | 100% |
Fidelity Advisor Financial Services Fund | | |
Institutional Class | 0% | 100% |
Fidelity Advisor Industrials Fund | | |
Institutional Class | 100% | 100% |
Fidelity Advisor Utilities Fund | | |
Institutional Class | 100% | 100% |
The funds will notify shareholders in January 2013 of amounts for use in preparing 2012 income tax returns.
Annual Report
Board Approval of Investment Advisory Contracts and Management Fees
Fidelity Advisor Focus Funds
Each year, the Board of Trustees, including the Independent Trustees (together, the Board), votes on the renewal of the management contract and sub-advisory agreements (together, the Advisory Contracts) for each fund. The Board, assisted by the advice of fund counsel and Independent Trustees' counsel, requests and considers a broad range of information relevant to the renewal of the Advisory Contracts throughout the year.
The Board meets regularly and, at each of its meetings, considers factors that are relevant to its annual consideration of the renewal of each fund's Advisory Contracts, including the services and support provided to each fund and its shareholders. The Board has established various standing committees, each composed of and chaired by Independent Trustees with varying backgrounds, to which the Board has assigned specific subject matter responsibilities in order to enhance effective decision-making by the Board. The Board, acting directly and through its Committees, requests and receives information concerning the annual consideration of the renewal of each fund's Advisory Contracts. The Board also meets as needed to consider matters specifically related to the Board's annual consideration of the renewal of Advisory Contracts. Members of the Board may also meet with trustees of other Fidelity funds through ad hoc joint committees to discuss certain matters relevant to the Fidelity funds.
At its July 2012 meeting, the Board of Trustees, including the Independent Trustees, unanimously determined to renew each fund's Advisory Contracts. In reaching its determination, the Board considered all factors it believed relevant, including (i) the nature, extent, and quality of the services to be provided to each fund and its shareholders (including the investment performance of each fund); (ii) the competitiveness of each fund's management fee and total expense ratio relative to peer funds; (iii) the total costs of the services to be provided by and the profits to be realized by Fidelity from its relationship with each fund; (iv) the extent to which economies of scale exist and would be realized as each fund grows; and (v) whether fee levels reflect these economies of scale, if any, for the benefit of fund shareholders.
In considering whether to renew the Advisory Contracts for each fund, the Board reached a determination, with the assistance of fund counsel and Independent Trustees' counsel and through the exercise of its business judgment, that the renewal of the Advisory Contracts is in the best interests of each fund and its shareholders and that the compensation payable under the Advisory Contracts is fair and reasonable. The Board's decision to renew the Advisory Contracts was not based on any single factor, but rather was based on a comprehensive consideration of all the information provided to the Board at its meetings throughout the year. The Board, in reaching its determination to renew the Advisory Contracts, is aware that shareholders in each fund have a broad range of investment choices available to them, including a wide choice among mutual funds offered by Fidelity's competitors, and that each fund's shareholders, who have the opportunity to review and weigh the disclosure provided by the fund in its prospectus and other public disclosures, have chosen to invest in that fund, managed by Fidelity.
Nature, Extent, and Quality of Services Provided. The Board considered the staffing within the investment adviser, FMR, and the sub-advisers (together, the Investment Advisers), including the backgrounds of the funds' investment personnel, and also considered the funds' investment objectives, strategies, and related investment philosophies. The Independent Trustees also had discussions with senior management of Fidelity's investment operations and investment groups. The Board considered the structure of the portfolio manager compensation program and whether this structure provides appropriate incentives to act in the best interests of each fund.
Resources Dedicated to Investment Management and Support Services. The Board and the Fund Oversight and Research Committees reviewed the general qualifications and capabilities of the Investment Advisers' investment staff, including its size, education, experience, and resources, as well as the Investment Advisers' approach to recruiting, training, managing, and compensating investment personnel. The Board also noted that FMR has continued to increase the resources devoted to non-U.S. offices, including expansion of Fidelity's global investment organization. The Board noted that Fidelity's analysts have extensive resources, tools and capabilities that allow them to conduct sophisticated quantitative and fundamental analysis, as well as credit analysis of issuers, counterparties and guarantors. The Board also believes that Fidelity's investment professionals have sufficient access to global information and data so as to provide competitive investment results over time, and that those professionals also have access to sophisticated tools that permit them to assess portfolio construction and risk and performance attribution characteristics continuously, as well as to transmit new information and research conclusions rapidly around the world. Additionally, in its deliberations, the Board considered the Investment Advisers' trading and risk management capabilities and resources, which are an integral part of the investment management process.
Shareholder and Administrative Services. The Board considered (i) the nature, extent, quality, and cost of advisory, administrative, and shareholder services performed by the Investment Advisers and their affiliates under the Advisory Contracts and under separate agreements covering transfer agency, pricing and bookkeeping, and securities lending services for each fund; (ii) the nature and extent of the supervision of third party service providers, principally custodians and subcustodians; and (iii) the resources devoted to, and the record of compliance with, each fund's compliance policies and procedures. The Board also reviewed the allocation of fund brokerage, including allocations to brokers affiliated with the Investment Advisers, the use of brokerage commissions to pay fund expenses, and the use of "soft" commission dollars to pay for research services.
The Board noted that the growth of fund assets over time across the complex allows Fidelity to reinvest in the development of services designed to enhance the value or convenience of the Fidelity funds as investment vehicles. These services include 24-hour access to account information and market information through telephone representatives and over the Internet, investor education materials and asset allocation tools, and the expanded availability of Fidelity Investor Centers.
Annual Report
Board Approval of Investment Advisory Contracts and Management Fees - continued
Investment in a Large Fund Family. The Board considered the benefits to shareholders of investing in a Fidelity fund, including the benefits of investing in a fund that is part of a large family of funds offering a variety of investment disciplines and providing a large variety of mutual fund investor services. The Board noted that Fidelity had taken, or had made recommendations that resulted in the Fidelity funds taking, a number of actions over the previous year that benefited particular funds, including (i) continuing to dedicate additional resources to investment research and support of the senior management team that oversees asset management; (ii) persisting in efforts to enhance Fidelity's research capabilities, in particular, international research; (iii) launching new funds and making other enhancements to meet client needs for global and income-oriented solutions; (iv) continuing to launch dedicated lower cost underlying funds to meet investment management's portfolio construction needs related to expanding underlying fund options, specifically for the Freedom Fund product lines; (v) adopting a "Stock Selector" sector neutral investment approach and employing a team of portfolio managers who are sector specialists to manage certain funds; (vi) rationalizing product lines and gaining increased efficiencies through the mergers of several funds into other funds; (vii) strengthening the Spartan Index Fund product line by adding new funds and/or new low-cost institutional share classes, restructuring fund expenses to accommodate new classes, and reducing investment minimums for certain classes of shares; (viii) modifying the eligibility criteria for Institutional Class shares to increase their appeal to government entities and charitable investors; and (ix) reducing certain transfer agent fee rates.
Investment Performance. The Board considered whether each fund has operated in accordance with its investment objective, as well as its record of compliance with its investment restrictions. It also reviewed each fund's absolute investment performance for each class, as well as each fund's relative investment performance for each class measured over multiple periods against a third-party-sponsored index that reflects the market sector in which the fund invests. The Board noted that FMR believes that no meaningful peer group exists for the funds principally because most other funds in each fund's third-party peer group focus on different industries or sectors than the fund.
For each fund (except Advisor Electronics), the following charts considered by the Board show, over the one-, three-, and five-year periods ended December 31, 2011, the cumulative total returns of Institutional Class (Class I) and Class B of the fund and the cumulative total returns of a third-party-sponsored index ("benchmark"). The returns of Institutional Class (Class I) and Class B show the performance of the highest and lowest performing classes, respectively (based on five-year performance).
For Advisor Electronics, the following charts considered by the Board show, over the one-, three-, and five-year periods ended December 31, 2011, the cumulative total returns of Institutional Class (Class I) and Class C of the fund and the cumulative total returns of a third-party-sponsored index ("benchmark"). The returns of Institutional Class (Class I) and Class C show the performance of the highest and lowest performing classes, respectively (based on five-year performance).
Fidelity Advisor Biotechnology Fund
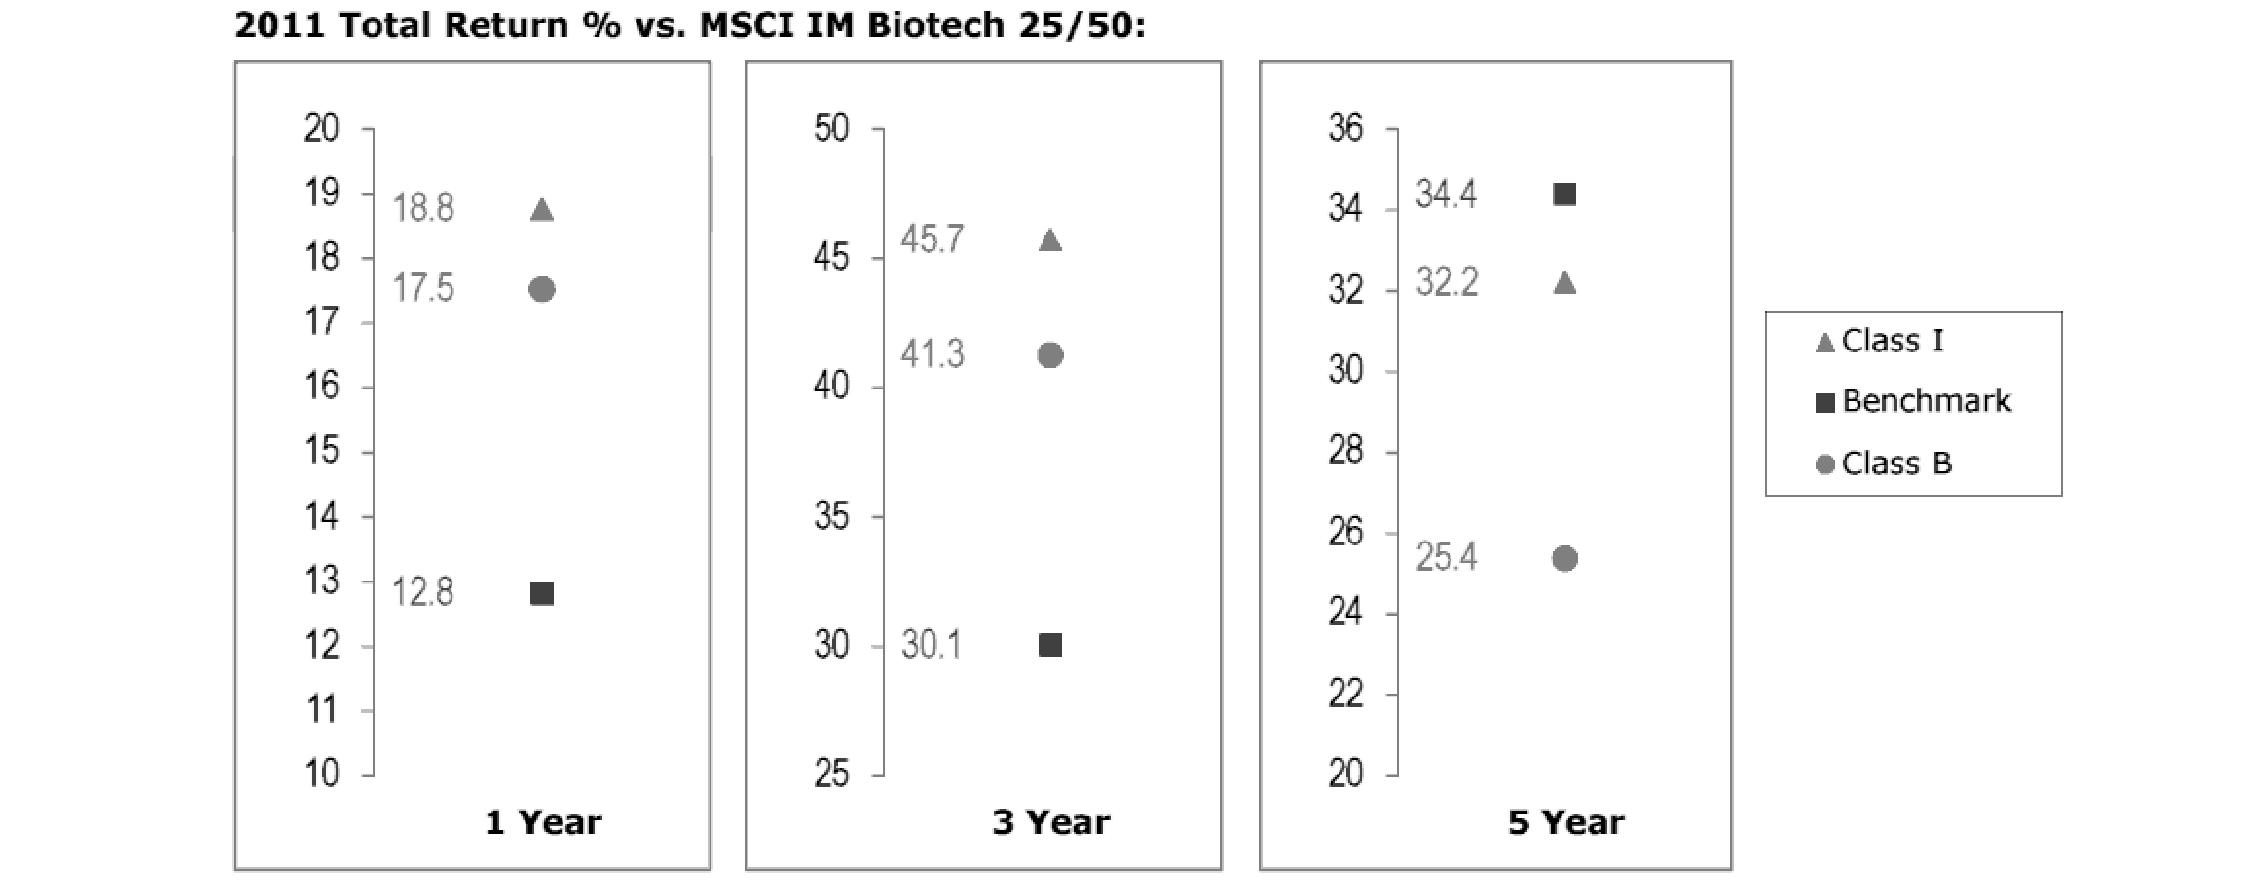
The Board noted that the investment performance of Institutional Class (Class I) of the fund compared favorably to its benchmark for the one- and three-year periods, although the fund's five-year cumulative total return was lower than its benchmark. The Board considered that the variations in performance among the fund's classes reflect the variations in class expenses, which result in lower performance for higher expense classes. The Board also reviewed the fund's performance since inception as well as performance in the current year.
Annual Report
Fidelity Advisor Communications Equipment Fund

The Board noted that the investment performance of Institutional Class (Class I) of the fund compared favorably to its benchmark for the three- and five-year periods, although the fund's one-year total return was lower than its benchmark. The Board considered that the variations in performance among the fund's classes reflect the variations in class expenses, which result in lower performance for higher expense classes. The Board noted that there was a portfolio management change for the fund in January 2012. The Board also reviewed the fund's performance since inception as well as performance in the current year.
Fidelity Advisor Consumer Discretionary Fund

The Board noted that the investment performance of the fund was lower than its benchmark for all the periods shown. The Board considered that the variations in performance among the fund's classes reflect the variations in class expenses, which result in lower performance for higher expense classes. The Board discussed with FMR actions to improve the fund's below-benchmark performance. The Board noted that there was a portfolio management change for the fund in April 2012. The Board also reviewed the fund's performance since inception as well as performance in the current year. The Board will continue to closely monitor the performance of the fund in the coming year and discuss with FMR other appropriate actions to address the performance of the fund.
Annual Report
Board Approval of Investment Advisory Contracts and Management Fees - continued
Fidelity Advisor Electronics Fund

The Board noted that the investment performance of Institutional Class (Class I) of the fund compared favorably to its benchmark for the three- and five-year periods, although the fund's one-year total return was lower than its benchmark. The Board considered that the variations in performance among the fund's classes reflect the variations in class expenses, which result in lower performance for higher expense classes. The Board also reviewed the fund's performance since inception as well as performance in the current year.
Fidelity Advisor Energy Fund
The Board noted that the investment performance of the fund was lower than its benchmark for the one- and five-year periods, although the three-year cumulative total return of Institutional Class (Class I) compared favorably to its benchmark. The Board considered that the variations in performance among the fund's classes reflect the variations in class expenses, which result in lower performance for higher expense classes. The Board also reviewed the fund's performance since inception as well as performance in the current year. The Board will closely monitor the performance of the fund in the coming year.
Annual Report
Fidelity Advisor Financial Services Fund
The Board noted that the investment performance of the fund was lower than its benchmark for all the periods shown. The Board considered that the variations in performance among the fund's classes reflect the variations in class expenses, which result in lower performance for higher expense classes. The Board discussed with FMR actions to improve the fund's below-benchmark performance. The Board noted that this fund had underperformed in the past and discussed with FMR its disappointment with the continued underperformance of the fund. The Board also reviewed the fund's performance since inception as well as performance in the current year. The Board will continue to closely monitor the performance of the fund in the coming year and discuss with FMR other appropriate actions to address the performance of the fund.
Fidelity Advisor Health Care Fund
The Board noted that the investment performance of Institutional Class (Class I) of the fund compared favorably to its benchmark for the three- and five-year periods, although the fund's one-year total return was lower than its benchmark. The Board considered that the variations in performance among the fund's classes reflect the variations in class expenses, which result in lower performance for higher expense classes. The Board also reviewed the fund's performance since inception as well as performance in the current year.
Annual Report
Board Approval of Investment Advisory Contracts and Management Fees - continued
Fidelity Advisor Industrials Fund

The Board noted that the investment performance of Institutional Class (Class I) of the fund compared favorably to its benchmark for the three- and five-year periods, although the fund's one-year total return was lower than its benchmark. The Board considered that the variations in performance among the fund's classes reflect the variations in class expenses, which result in lower performance for higher expense classes. The Board also reviewed the fund's performance since inception as well as performance in the current year.
Fidelity Advisor Technology Fund
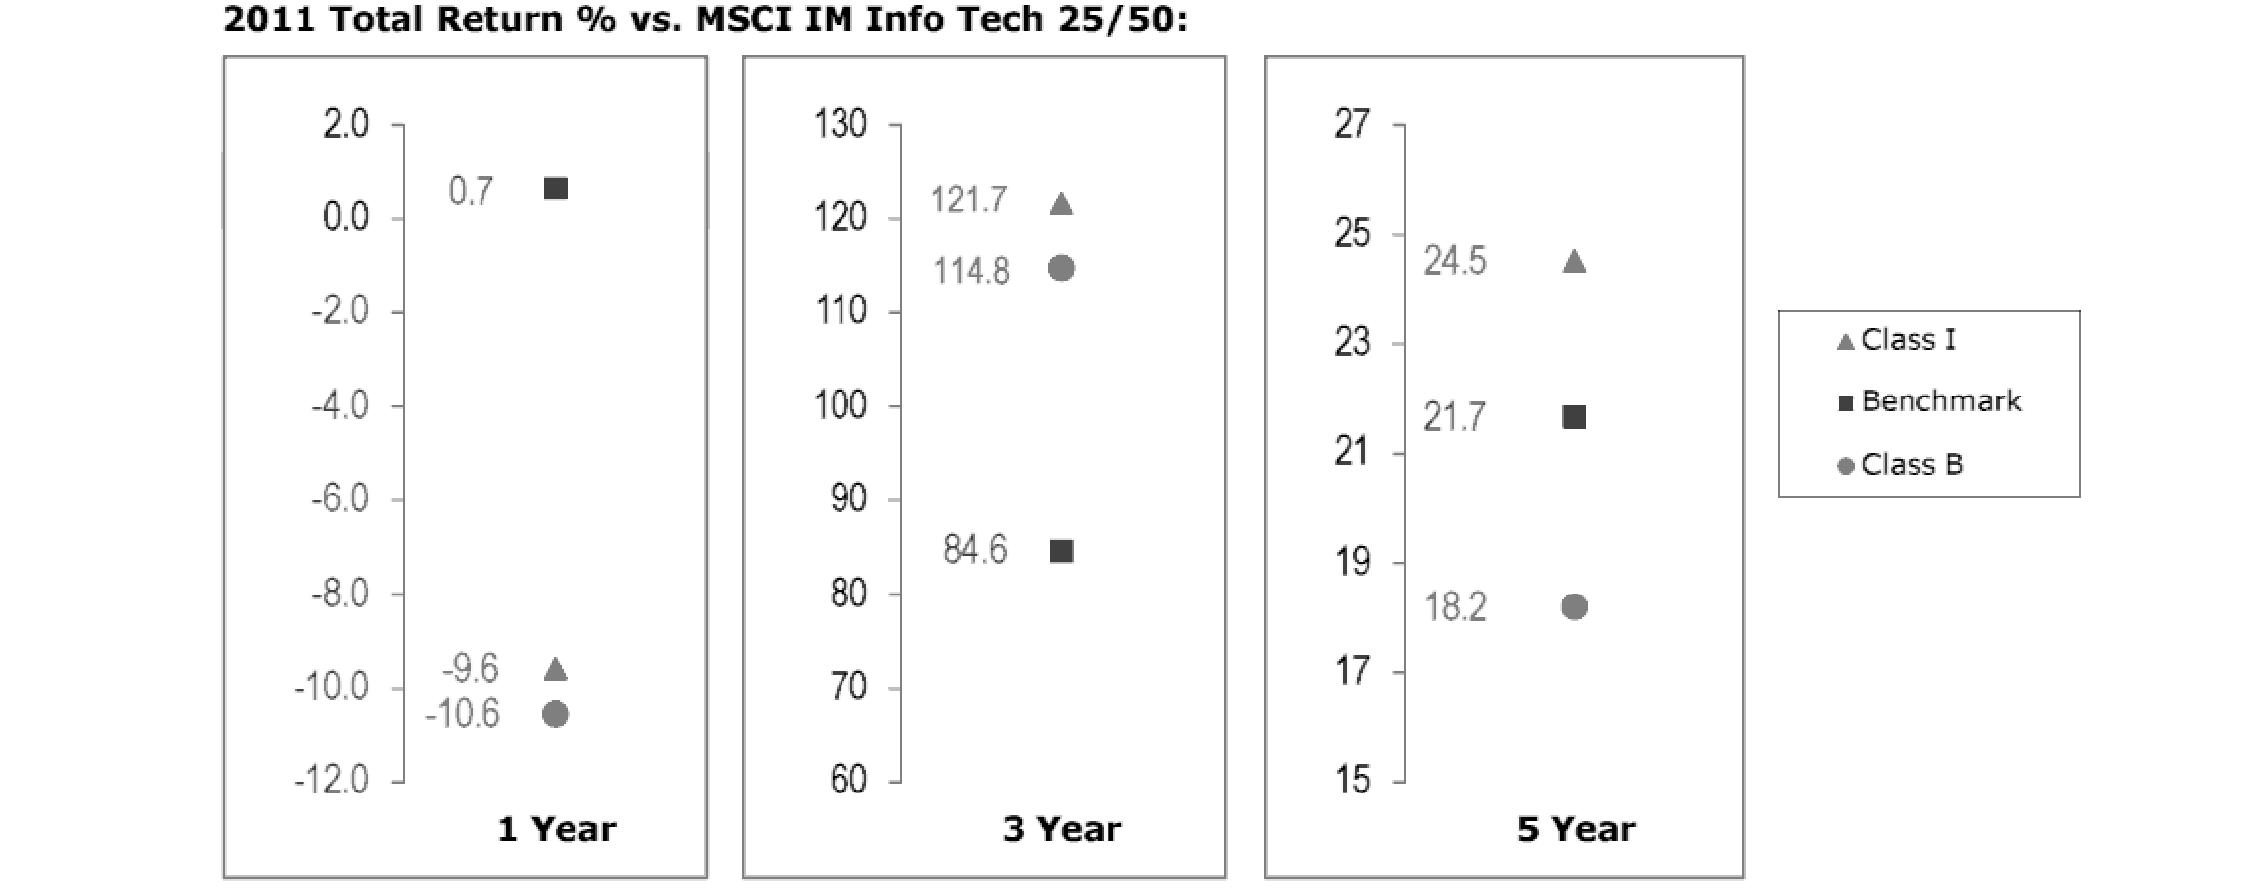
The Board noted that the investment performance of Institutional Class (Class I) of the fund compared favorably to its benchmark for the three- and five-year periods, although the fund's one-year total return was lower than its benchmark. The Board considered that the variations in performance among the fund's classes reflect the variations in class expenses, which result in lower performance for higher expense classes. The Board also reviewed the fund's performance since inception as well as performance in the current year.
Annual Report
Fidelity Advisor Utilities Fund
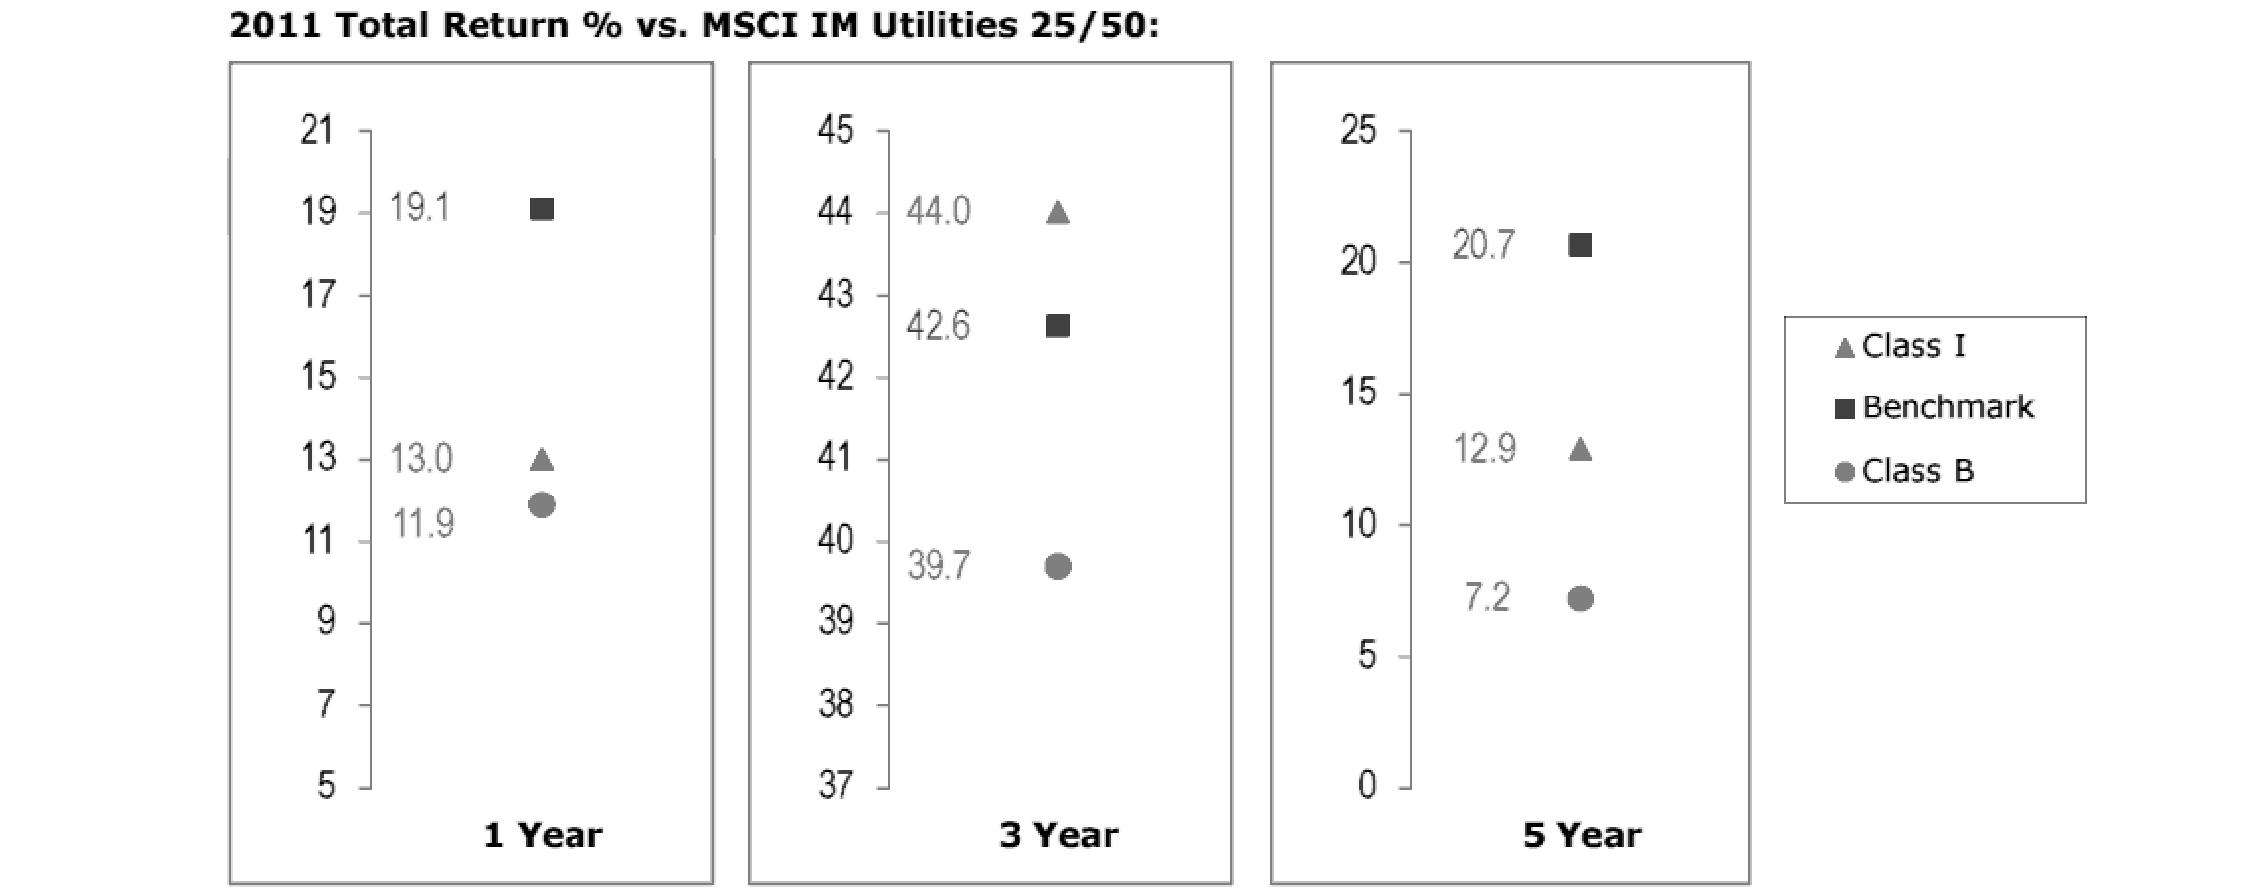
The Board noted that the investment performance of the fund was lower than its benchmark for the one- and five-year periods, although the three-year cumulative total return of Institutional Class (Class I) compared favorably to its benchmark. The Board considered that the variations in performance among the fund's classes reflect the variations in class expenses, which result in lower performance for higher expense classes. The Board also reviewed the fund's performance since inception as well as performance in the current year. The Board will closely monitor the performance of the fund in the coming year.
Based on its review, the Board concluded that the nature, extent, and quality of services provided to each fund under the Advisory Contracts should benefit each fund's shareholders.
Competitiveness of Management Fee and Total Expense Ratio. The Board considered each fund's management fee and total expense ratio compared to "mapped groups" of competitive funds and classes. Fidelity creates "mapped groups" by combining similar Lipper investment objective categories that have comparable management fee characteristics. Combining Lipper investment objective categories aids the Board's management fee and total expense ratio comparisons by broadening the competitive group used for comparison and by reducing the number of universes to which various Fidelity funds are compared.
Management Fee. The Board considered two proprietary management fee comparisons for the 12-month periods shown in the charts below. The group of Lipper funds used by the Board for management fee comparisons is referred to below as the "Total Mapped Group." The Total Mapped Group comparison focuses on a fund's standing relative to the total universe of comparable funds available to investors in terms of gross management fees before expense reimbursements or caps. "TMG %" represents the percentage of funds in the Total Mapped Group that had management fees that were lower than a fund's. For example, a TMG % of 6% means that 94% of the funds in the Total Mapped Group had higher management fees than a fund. The "Asset-Size Peer Group" (ASPG) comparison focuses on a fund's standing relative to non-Fidelity funds similar in size to the fund within the Total Mapped Group. The ASPG represents at least 15% of the funds in the Total Mapped Group with comparable asset size and management fee characteristics, subject to a minimum of 50 funds (or all funds in the Total Mapped Group if fewer than 50). Additional information, such as the ASPG quartile in which a fund's management fee ranked, is also included in the charts and considered by the Board.
Annual Report
Board Approval of Investment Advisory Contracts and Management Fees - continued
Fidelity Advisor Biotechnology Fund

Fidelity Advisor Communications Equipment Fund

Annual Report
Fidelity Advisor Consumer Discretionary Fund

Fidelity Advisor Electronics Fund
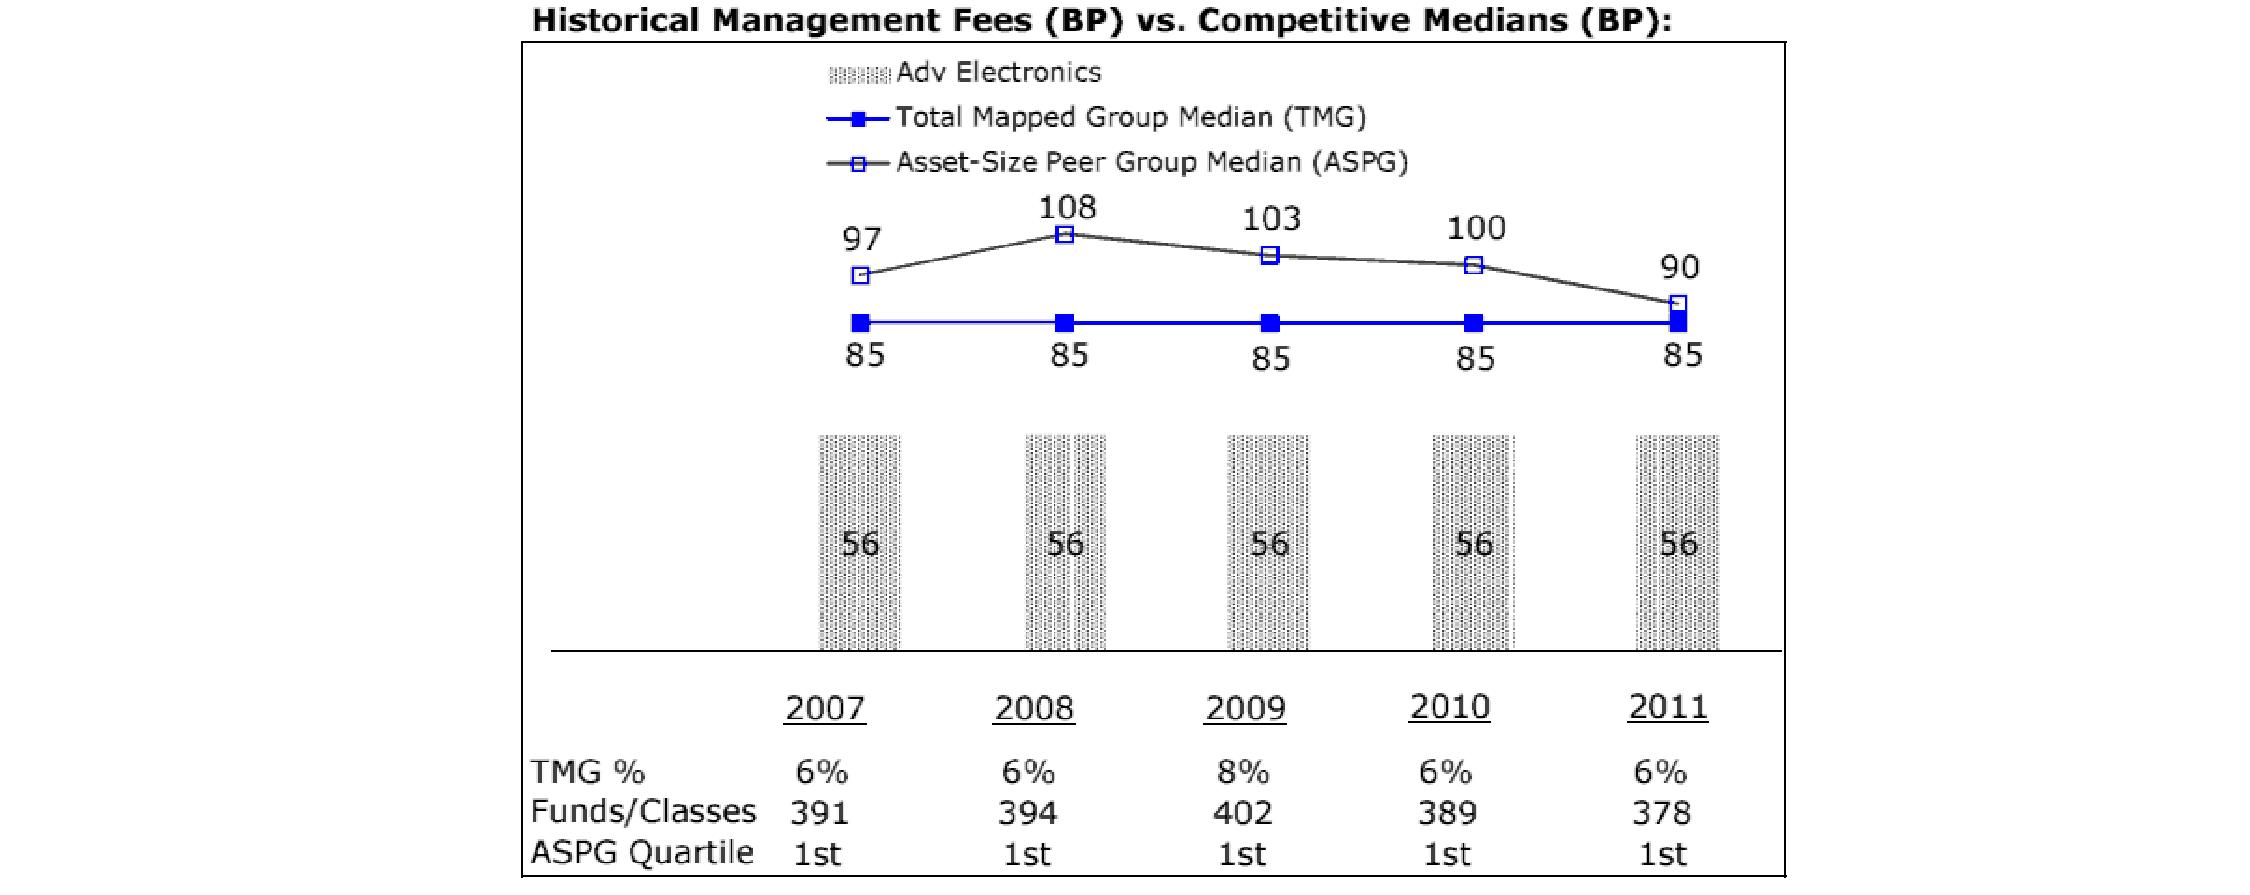
Annual Report
Board Approval of Investment Advisory Contracts and Management Fees - continued
Fidelity Advisor Energy Fund

Fidelity Advisor Financial Services Fund

Annual Report
Fidelity Advisor Health Care Fund

Fidelity Advisor Industrials Fund

Annual Report
Board Approval of Investment Advisory Contracts and Management Fees - continued
Fidelity Advisor Technology Fund
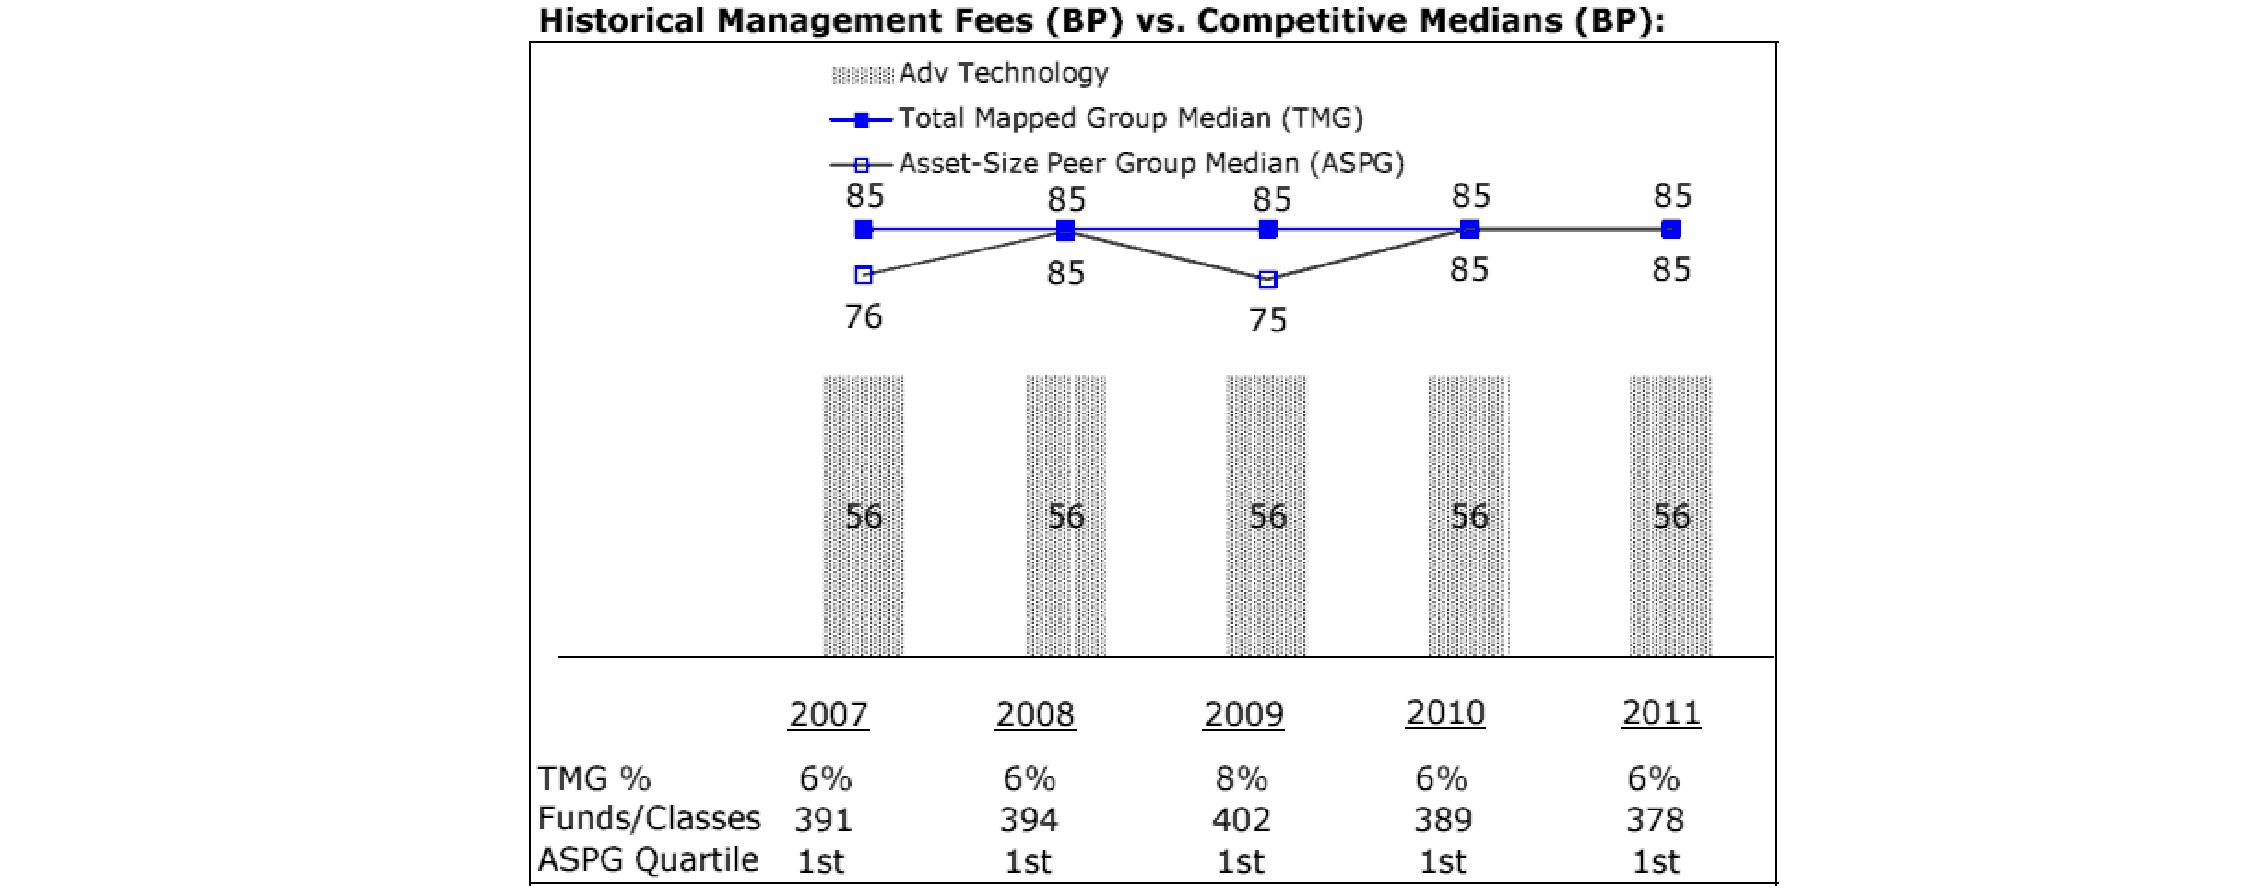
Fidelity Advisor Utilities Fund

The Board noted that each fund's management fee ranked below the median of its Total Mapped Group and below the median of its ASPG for 2011.
Based on its review, the Board concluded that each fund's management fee is fair and reasonable in light of the services that the fund receives and the other factors considered.
Total Expense Ratio. In its review of the total expense ratio of each class of each fund, the Board considered the fund's management fee as well as other fund or class expenses, as applicable, such as transfer agent fees, pricing and bookkeeping fees, fund-paid 12b-1 fees, and custodial, legal, and audit fees. The Board also noted the effects of any waivers and reimbursements on fees and expenses. As part of its review, the Board also considered the current and historical total expense ratios of each class of each fund compared to competitive fund median expenses. Each class of each fund is compared to those funds and classes in the Total Mapped Group (used by the Board for management fee comparisons) that have a similar sales load structure.
The Board noted that each fund offers multiple classes, each of which has a different sales load and 12b-1 fee structure, and that the multiple structures are intended to offer a range of pricing options for the intermediary market. The Board also noted that the total expense ratios of the classes of each fund vary primarily by the level of their 12b-1 fees, although differences in transfer agent fees may also cause expenses to vary from class to class.
Annual Report
For Advisor Biotechnology, Advisor Financial Services, and Advisor Utilities, the Board noted that the total expense ratio of each of Class A, Class B, Class C, and Institutional Class ranked below its competitive median for 2011 and the total expense ratio of Class T ranked above its competitive median for 2011. The Board considered that various factors, including 12b-1 fees, positive or negative performance adjustments, and relatively higher other expenses in the case of small fund size, can affect total expense ratios. The Board noted that the total expense ratio of Class T was above the competitive median primarily because of higher 12b-1 fees on Class T. Class T has a higher 12b-1 fee, but a lower front-end sales charge, than traditionally priced front-end sales charge classes. The Board considered that Class T is primarily sold load-waived in the retirement plan market where its 0.50% 12b-1 fee is comparable to competing no-load, higher 12b-1 fee classes designed specifically for retirement plans.
For Advisor Communications Equipment and Advisor Electronics, the Board noted that the total expense ratio of Class A ranked below its competitive median for 2011 and the total expense ratio of each of Class T, Class B, Class C, and Institutional Class ranked above its competitive median for 2011. The Board considered that various factors, including 12b-1 fees, positive or negative performance adjustments, and relatively higher other expenses in the case of small fund size, can affect total expense ratios. The Board noted that the total expense ratio of Class T was above the competitive median primarily because of higher 12b-1 fees on Class T. Class T has a higher 12b-1 fee, but a lower front-end sales charge, than traditionally priced front-end sales charge classes. The Board considered that Class T is primarily sold load-waived in the retirement plan market where its 0.50% 12b-1 fee is comparable to competing no-load, higher 12b-1 fee classes designed specifically for retirement plans.
For Advisor Consumer Discretionary, the Board noted that the total expense ratio of each of Class A, Class C, and Institutional Class ranked below its competitive median for 2011 and the total expense ratio of each of Class T and Class B ranked above its competitive median for 2011. The Board considered that various factors, including 12b-1 fees, positive or negative performance adjustments, and relatively higher other expenses in the case of small fund size, can affect total expense ratios. The Board noted that the total expense ratio of Class T was above the competitive median primarily because of higher 12b-1 fees on Class T. Class T has a higher 12b-1 fee, but a lower front-end sales charge, than traditionally priced front-end sales charge classes. The Board considered that Class T is primarily sold load-waived in the retirement plan market where its 0.50% 12b-1 fee is comparable to competing no-load, higher 12b-1 fee classes designed specifically for retirement plans.
For Advisor Energy, Advisor Health Care, Advisor Industrials, and Advisor Technology, the Board noted that the total expense ratio of each class ranked below its competitive median for 2011.
Fees Charged to Other Fidelity Clients. The Board also considered Fidelity fee structures and other information with respect to clients of FMR and its affiliates, such as other mutual funds advised or subadvised by FMR or its affiliates, pension plan clients, and other institutional clients. The Board noted the findings of the 2010 ad hoc joint committee (created with the board of other Fidelity funds), which reviewed and compared Fidelity's institutional investment advisory business with its business of providing services to the Fidelity funds, including the differences in services provided, fees charged, and costs incurred, as well as competition in their respective marketplaces.
Based on its review of total expense ratios and fees charged to other Fidelity clients, the Board concluded that the total expense ratio of each class of each fund was reasonable, although in some cases above the median of the universe presented for comparison, in light of the services that the fund and its shareholders receive and the other factors considered.
Costs of the Services and Profitability. The Board considered the revenues earned and the expenses incurred by Fidelity in conducting the business of developing, marketing, distributing, managing, administering and servicing each fund and its shareholders. The Board also considered the level of Fidelity's profits in respect of all the Fidelity funds.
On an annual basis, FMR presents to the Board Fidelity's profitability for each fund. Fidelity calculates the profitability for each fund, as well as aggregate profitability for groups of Fidelity funds and all Fidelity funds, using a series of detailed revenue and cost allocation methodologies which originate with the books and records of Fidelity on which Fidelity's audited financial statements are based. The Audit Committee of the Board reviews any significant changes from the prior year's methodologies.
PricewaterhouseCoopers LLP (PwC), independent registered public accounting firm and auditor to Fidelity and certain Fidelity funds, has been engaged annually by the Board as part of the Board's assessment of Fidelity's profitability analysis. PwC's engagement includes the review and assessment of Fidelity's methodologies used in determining the revenues and expenses attributable to Fidelity's mutual fund business, and completion of agreed-upon procedures surrounding the mathematical accuracy of fund profitability and its conformity to allocation methodologies. After considering PwC's reports issued under the engagement and information provided by Fidelity, the Board concluded that while other allocation methods may also be reasonable, Fidelity's profitability methodologies are reasonable in all material respects.
The Board also reviewed Fidelity's non-fund businesses and fall-out benefits related to the mutual fund business as well as cases where Fidelity's affiliates may benefit from or be related to the funds' business.
The Board considered the costs of the services provided by and the profits realized by Fidelity in connection with the operation of each fund and was satisfied that the profitability was not excessive in the circumstances.
Annual Report
Board Approval of Investment Advisory Contracts and Management Fees - continued
Economies of Scale. The Board considered whether there have been economies of scale in respect of the management of the Fidelity funds, whether the Fidelity funds (including each fund) have appropriately benefited from any such economies of scale, and whether there is potential for realization of any further economies of scale. The Board considered the extent to which each fund will benefit from economies of scale through increased services to the fund, through waivers or reimbursements, or through fee or expense reductions. The Board also noted that in 2009, it and the board of other Fidelity funds created an ad hoc committee (the Economies of Scale Committee) to analyze whether FMR attains economies of scale in respect of the management and servicing of the Fidelity funds, whether the Fidelity funds have appropriately benefited from such economies of scale, and whether there is potential for realization of any further economies of scale.
The Board recognized that each fund's management contract incorporates a "group fee" structure, which provides for lower group fee rates as total fund assets under FMR's management increase, and for higher group fee rates as total fund assets under FMR's management decrease. FMR calculates the group fee rates based on a tiered asset "breakpoint" schedule that varies based on asset class. The Board considered that the group fee is designed to deliver the benefits of economies of scale to fund shareholders when total Fidelity fund assets increase, even if assets of any particular fund are unchanged or have declined, because some portion of Fidelity's costs are attributable to services provided to all Fidelity funds, and all funds benefit if those costs can be allocated among more assets. The Board concluded that, given the group fee structure, fund shareholders will benefit from lower management fees as assets under FMR's management increase at the fund complex level, regardless of whether Fidelity achieves any such economies of scale.
The Board concluded, taking into account the analysis of the Economies of Scale Committee, that economies of scale, if any, are being appropriately shared between fund shareholders and Fidelity.
Additional Information Requested by the Board. In order to develop fully the factual basis for consideration of the Fidelity funds' Advisory Contracts, the Board requested and received additional information on certain topics, including (i) fund performance trends, actions to be taken by FMR to improve certain funds' overall performance, and Fidelity's long-term strategies for certain funds; (ii) the potential to further rationalize the Fidelity fund lineup with the possibility of achieving savings for the funds and Fidelity; (iii) Fidelity's compensation structure for portfolio managers and other key investment personnel; (iv) the amount of the investment that each portfolio manager has made in the Fidelity fund(s) that he or she manages; (v) the realization of fall-out benefits in certain Fidelity business units; (vi) Fidelity's group fee structures, the potential impact of regulatory changes on such structures, and the rationale for the individual fee rates of certain funds; (vii) fund profitability methodology, including Fidelity's cost allocation methodology, and the impact of certain factors on fund profitability results; (viii) trends regarding industry use of performance fee structures and the possibility of implementing performance fee structures for additional funds; and (ix) the impact of net redemptions from the Fidelity funds.
Based on its evaluation of all of the conclusions noted above, and after considering all factors it believed relevant, the Board ultimately concluded that the advisory fee structures are fair and reasonable, and that each fund's Advisory Contracts should be renewed.
Annual Report
Investment Adviser
Fidelity Management & Research Company
Boston, MA
Investment Sub-Advisers
FMR Co., Inc.
Fidelity Management & Research (U.K.) Inc.
Fidelity Management & Research
(Hong Kong) Limited
Fidelity Management & Research
(Japan) Inc.
General Distributor
Fidelity Distributors Corporation
Smithfield, RI
Transfer and Service Agents
Fidelity Investments Institutional Operations Company, Inc.
Boston, MA
Fidelity Service Company, Inc.
Boston, MA
Custodians
JPMorgan Chase Bank†
New York, NY
Brown Brothers Harriman & Co. ††
Boston, MA
State Street Bank and Trust †††
Quincy, MA
† Custodian for Fidelity Advisor Consumer Discretionary Fund, Fidelity Advisor Financial Services Fund, Fidelity Advisor Health Care Fund, Fidelity Advisor Industrials Fund, Fidelity Advisor Technology Fund, and Fidelity Advisor Utilities Fund.
†† Custodian for Fidelity Advisor Energy Fund.
††† Custodian for Fidelity Advisor Biotechnology Fund, Fidelity Advisor
Communications Equipment Fund, and Fidelity Advisor Electronics Fund.

AFOCI-UANNPRO-0912
1.789242.108
(Fidelity Investment logo)(registered trademark)
Fidelity Advisor®
Real Estate
Fund - Class A, Class T, Class B
and Class C
Annual Report
July 31, 2012
(Fidelity Cover Art)
Contents
Performance | (Click Here) | How the fund has done over time. |
Management's Discussion of Fund Performance | (Click Here) | The Portfolio Manager's review of fund performance and strategy. |
Shareholder Expense Example | (Click Here) | An example of shareholder expenses. |
Investment Changes | (Click Here) | A summary of major shifts in the fund's investments over the past six months. |
Investments | (Click Here) | A complete list of the fund's investments with their market values. |
Financial Statements | (Click Here) | Statements of assets and liabilities, operations, and changes in net assets, as well as financial highlights. |
Notes | (Click Here) | Notes to financial statements. |
Report of Independent Registered Public Accounting Firm | (Click Here) | |
Trustees and Officers | (Click Here) | |
Distributions | (Click Here) | |
Board Approval of Investment Advisory Contracts and Management Fees | (Click Here) | |
To view a fund's proxy voting guidelines and proxy voting record for the 12-month period ended June 30, visit http://www.fidelity.com/proxyvotingresults or visit the Securities and Exchange Commission's (SEC) web site at http://www.sec.gov. You may also call 1-877-208-0098 to request a free copy of the proxy voting guidelines.
Standard & Poor's, S&P and S&P 500 are registered service marks of The McGraw-Hill Companies, Inc. and have been licensed for use by Fidelity Distributors Corporation.
Other third party marks appearing herein are the property of their respective owners.
All other marks appearing herein are registered or unregistered trademarks or service marks of FMR LLC or an affiliated company. © 2012 FMR LLC. All rights reserved.
Annual Report
This report and the financial statements contained herein are submitted for the general information of the shareholders of the fund. This report is not authorized for distribution to prospective investors in the fund unless preceded or accompanied by an effective prospectus.
A fund files its complete schedule of portfolio holdings with the SEC for the first and third quarters of each fiscal year on Form N-Q. Forms N-Q are available on the SEC's web site at http://www.sec.gov. A fund's Forms N-Q may be reviewed and copied at the SEC's Public Reference Room in Washington, DC. Information regarding the operation of the SEC's Public Reference Room may be obtained by calling 1-800-SEC-0330. For a complete list of a fund's portfolio holdings, view the most recent holdings listing, semiannual report, or annual report on Fidelity's web site at http://www.fidelity.com, http://www.advisor.fidelity.com, or http://www.401k.com, as applicable.
NOT FDIC INSURED • MAY LOSE VALUE • NO BANK GUARANTEE
Neither the fund nor Fidelity Distributors Corporation is a bank.
Annual Report
Average annual total return reflects the change in the value of an investment, assuming reinvestment of the class' distributions from dividend income and capital gains (the profits earned upon the sale of securities that have grown in value, if any) and assuming a constant rate of performance each year. The $10,000 table and the fund's returns do not reflect the deduction of taxes that a shareholder would pay on fund distributions or the redemption of fund shares. During periods of reimbursement by Fidelity, a fund's total return will be greater than it would be had the reimbursement not occurred. How a fund did yesterday is no guarantee of how it will do tomorrow. Returns reflect the conversion of Class B shares to Class A shares after a maximum of seven years.
Average Annual Total Returns
Periods ended July 31, 2012 | Past 1
year | Past 5
years | Life of
fund A |
Class A (incl. 5.75% sales charge) | 6.32% | 3.53% | 11.07% |
Class T (incl. 3.50% sales charge) | 8.58% | 3.76% | 11.04% |
Class B (incl. contingent deferred sales charge) B | 6.99% | 3.65% | 11.13% |
Class C (incl. contingent deferred sales charge) C | 10.92% | 3.99% | 10.90% |
A From September 12, 2002.
B Class B shares' contingent deferred sales charges included in the past one year, past five years, and life of fund total return figures are 5%, 2%, and 0%, respectively.
C Class C shares' contingent deferred sales charges included in the past one year, past five years, and life of fund total return figures are 1%, 0%, and 0%, respectively.
Annual Report
$10,000 Over Life of Fund
Let's say hypothetically that $10,000 was invested in Fidelity Advisor® Real Estate Fund - Class A on September 12, 2002, when the fund started, and the current 5.75% sales charge was paid. The chart shows how the value of your investment would have changed, and also shows how the S&P 500® Index performed over the same period.
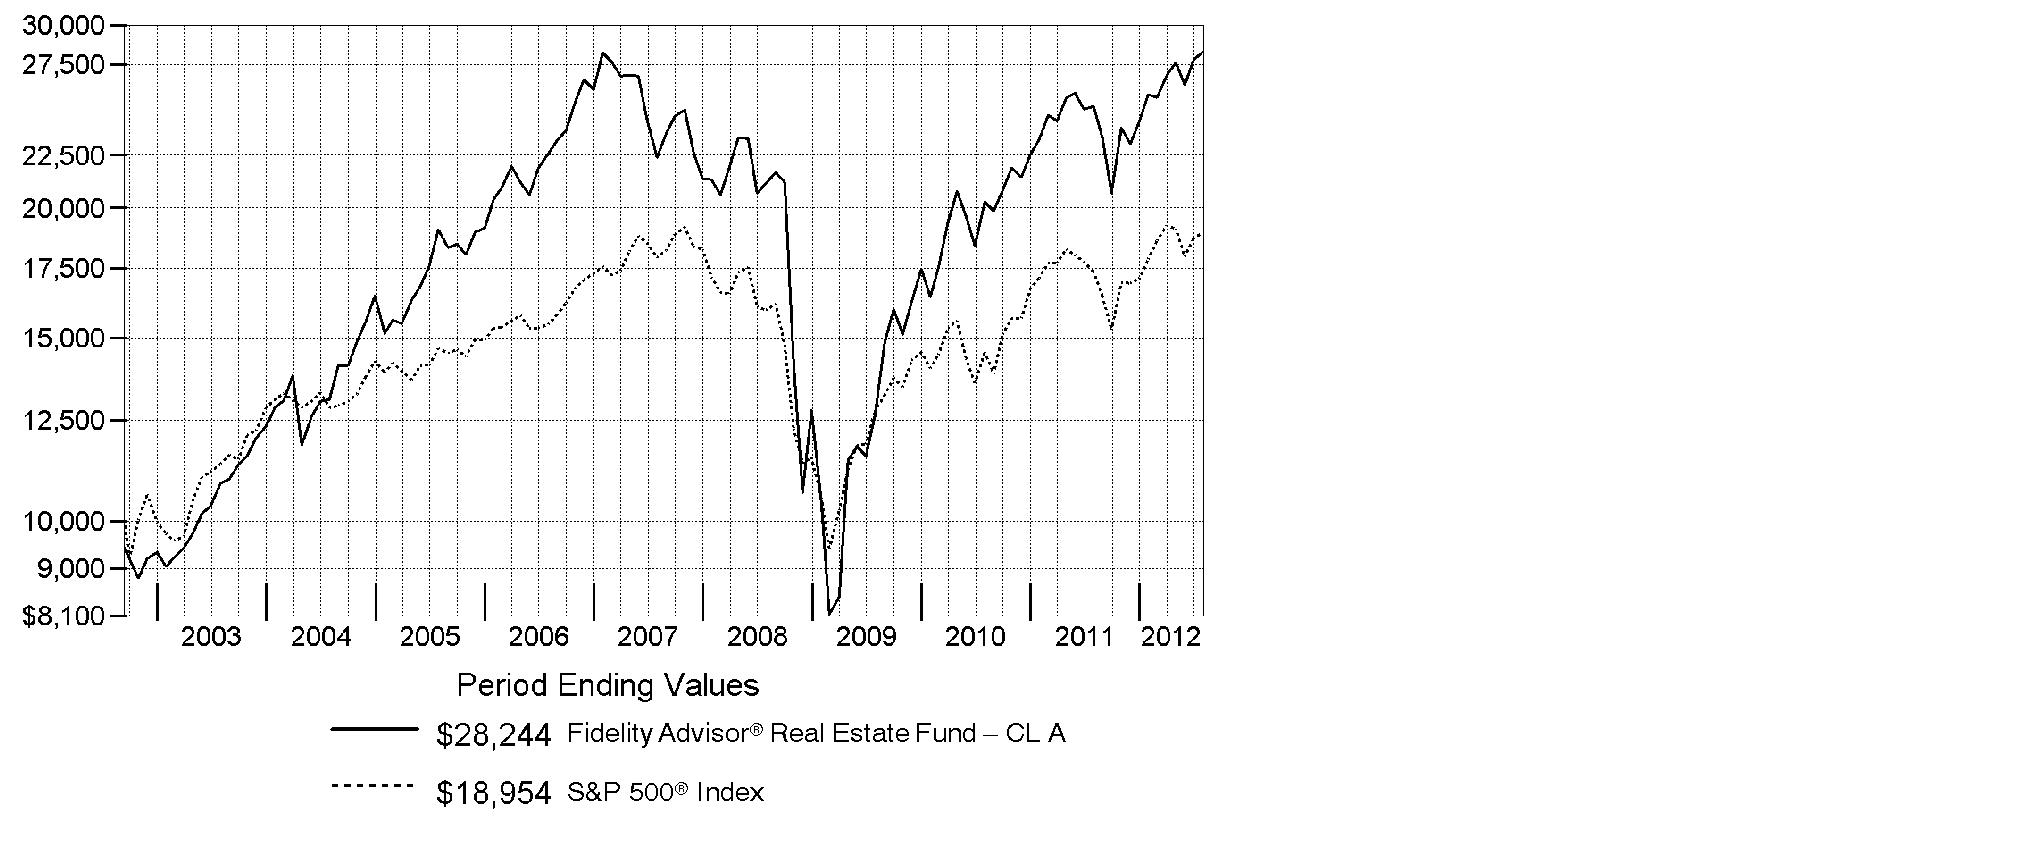
Annual Report
Market Recap: Major U.S. equity benchmarks posted solid gains for the year ending July 31, 2012, amid an uncertain investment environment. The broad-based S&P 500® Index returned 9.13%, while the blue-chip-laden Dow Jones Industrial AverageSM and technology-heavy Nasdaq Composite® Index gained 10.12% and 7.83%, respectively. Volatility spiked during the period's first half, as equities plummeted late last summer on Europe's debt woes, political wrangling over the U.S. debt ceiling, and the sovereign credit-rating downgrade that followed. By October, a seemingly improved U.S. economy rejuvenated stocks, paving the way for major equity benchmarks to post their best first-quarter performance since 1998. However, more eurozone trouble, signs that the U.S. economy had turned sluggish and a slowdown in China caused stocks to slip in May, before a new wave of optimism took hold in June and July. Within the S&P 500®, more-defensive sectors such as telecommunication services (+30%) and consumer staples (+20%) fared best, while materials and energy significantly underperformed, returning -5%. Small- and mid-cap stocks trailed their less-volatile large-cap counterparts, with the Russell 2000® Index adding 0.19% and the Russell Midcap® Index rising 2.28%. Given turmoil and local currency weakness in Europe, foreign developed-markets stocks lost ground, with the MSCI® EAFE® Index returning -11.32%.
Comments from Samuel Wald, Portfolio Manager of Fidelity Advisor® Real Estate Fund: For the 12 months ending July 31, 2012, the fund's Class A, Class T, Class B and Class C shares gained 12.81%, 12.52%, 11.99% and 11.92%, respectively (excluding sales charges), compared with 12.88% for the Dow Jones U.S. Select Real Estate Securities IndexSM and the 9.13% rise of the S&P 500® Index. Relative to the Dow Jones real estate index, the fund's top individual contributor was Vornado Realty Trust, a diversified REIT that lagged and in which the fund was underweighted. The fund's stake in health care REIT Ventas did well, while maintaining lower-than-index exposure to Host Hotels & Resorts was helpful, as that stock lost ground early in the period. Other contributors of note included student housing REIT Education Realty Trust and self-storage leader Public Storage. On the negative side, two senior housing companies, Brookdale Senior Living and Emeritus, significantly underperformed and hampered the fund's results. In both cases, I felt these out-of-benchmark stocks were attractively valued compared to many health care REITs, such as HCP, a strong-performing index component that, unfortunately, I underweighted during the period. The biggest individual detractor during the past 12 months was SL Green Realty, an office properties REIT focused on the New York City market. Untimely positioning in Sunstone Hotel Investors, a hotel REIT, also hurt results, as did the fund's average cash position in a rising market.
The views expressed above reflect those of the portfolio manager(s) only through the end of the period as stated on the cover of this report and do not necessarily represent the views of Fidelity or any other person in the Fidelity organization. Any such views are subject to change at any time based upon market or other conditions and Fidelity disclaims any responsibility to update such views. These views may not be relied on as investment advice and, because investment decisions for a Fidelity fund are based on numerous factors, may not be relied on as an indication of trading intent on behalf of any Fidelity fund.
Annual Report
Shareholder Expense Example
As a shareholder of the Fund, you incur two types of costs: (1) transaction costs, including sales charges (loads) on purchase payments or redemption proceeds, and (2) ongoing costs, including management fees, distribution and/or service (12b-1) fees and other Fund expenses. This Example is intended to help you understand your ongoing costs (in dollars) of investing in the Fund and to compare these costs with the ongoing costs of investing in other mutual funds.
The Example is based on an investment of $1,000 invested at the beginning of the period and held for the entire period (February 1, 2012 to July 31, 2012).
Actual Expenses
The first line of the accompanying table for each class of the Fund provides information about actual account values and actual expenses. You may use the information in this line, together with the amount you invested, to estimate the expenses that you paid over the period. Simply divide your account value by $1,000.00 (for example, an $8,600 account value divided by $1,000.00 = 8.6), then multiply the result by the number in the first line for a class of the Fund under the heading entitled "Expenses Paid During Period" to estimate the expenses you paid on your account during this period. In addition, the Fund, as a shareholder in the underlying Fidelity Central Funds, will indirectly bear its pro-rata share of the fees and expenses incurred by the underlying Fidelity Central Funds. These fees and expenses are not included in the Fund's annualized expense ratio used to calculate the expense estimate in the table below.
Hypothetical Example for Comparison Purposes
The second line of the accompanying table for each class of the Fund provides information about hypothetical account values and hypothetical expenses based on a Class' actual expense ratio and an assumed rate of return of 5% per year before expenses, which is not the Class' actual return. The hypothetical account values and expenses may not be used to estimate the actual ending account balance or expenses you paid for the period. You may use this information to compare the ongoing costs of investing in the Fund and other funds. To do so, compare this 5% hypothetical example with the 5% hypothetical examples that appear in the shareholder reports of the other funds. In addition, the Fund, as a shareholder in the underlying Fidelity Central Funds, will indirectly bear its pro-rata share of the fees and expenses incurred by the underlying Fidelity Central Funds. These fees and expenses are not included in the Fund's annualized expense ratio used to calculate the expense estimate in the table below.
Please note that the expenses shown in the table are meant to highlight your ongoing costs only and do not reflect any transaction costs. Therefore, the second line of the table is useful in comparing ongoing costs only, and will not help you determine the relative total costs of owning different funds. In addition, if these transactional costs were included, your costs would have been higher.
Annual Report
| Annualized
Expense Ratio | Beginning
Account Value
February 1, 2012 | Ending
Account Value
July 31, 2012 | Expenses Paid
During Period*
February 1, 2012
to July 31, 2012 |
Class A | 1.17% | | | |
Actual | | $ 1,000.00 | $ 1,099.20 | $ 6.11 |
HypotheticalA | | $ 1,000.00 | $ 1,019.05 | $ 5.87 |
Class T | 1.41% | | | |
Actual | | $ 1,000.00 | $ 1,098.10 | $ 7.36 |
HypotheticalA | | $ 1,000.00 | $ 1,017.85 | $ 7.07 |
Class B | 1.92% | | | |
Actual | | $ 1,000.00 | $ 1,095.60 | $ 10.00 |
HypotheticalA | | $ 1,000.00 | $ 1,015.32 | $ 9.62 |
Class C | 1.91% | | | |
Actual | | $ 1,000.00 | $ 1,095.20 | $ 9.95 |
HypotheticalA | | $ 1,000.00 | $ 1,015.37 | $ 9.57 |
Institutional Class | .92% | | | |
Actual | | $ 1,000.00 | $ 1,101.30 | $ 4.81 |
HypotheticalA | | $ 1,000.00 | $ 1,020.29 | $ 4.62 |
A 5% return per year before expenses
* Expenses are equal to each Class' annualized expense ratio, multiplied by the average account value over the period, multiplied by 182/366 (to reflect the one-half year period).
Annual Report
Investment Changes (Unaudited)
Top Ten Stocks as of July 31, 2012 |
| % of fund's
net assets | % of fund's net assets
6 months ago |
Simon Property Group, Inc. | 13.1 | 11.3 |
Ventas, Inc. | 7.7 | 7.2 |
Public Storage | 6.6 | 7.5 |
Prologis, Inc. | 5.3 | 5.9 |
Boston Properties, Inc. | 5.1 | 4.5 |
SL Green Realty Corp. | 4.3 | 4.0 |
Essex Property Trust, Inc. | 4.2 | 3.8 |
Camden Property Trust (SBI) | 3.8 | 3.8 |
Digital Realty Trust, Inc. | 3.8 | 4.6 |
HCP, Inc. | 2.9 | 2.0 |
| 56.8 | |
Top Five REIT Sectors as of July 31, 2012 |
| % of fund's
net assets | % of fund's net assets
6 months ago |
REITs - Apartments | 17.6 | 17.2 |
REITs - Malls | 16.5 | 15.8 |
REITs - Office Buildings | 15.2 | 14.5 |
REITs - Industrial Buildings | 13.4 | 14.5 |
REITs - Health Care Facilities | 11.7 | 10.6 |
Asset Allocation (% of fund's net assets) |
As of July 31, 2012 * | As of January 31, 2012 ** |
 | Stocks 96.7% | | | Stocks 96.1% | |
 | Convertible
Securities 0.0% | |  | Convertible
Securities† 0.0% | |
 | Short-Term
Investments and
Net Other Assets
(Liabilities) 3.3% | | | Short-Term
Investments and
Net Other Assets
(Liabilities) 3.9% | |
* Foreign investments | 0.0% | | ** Foreign investments | 0.7% | |

† Amount represents less than 0.1%.
Annual Report
Investments July 31, 2012
Showing Percentage of Net Assets
Common Stocks - 96.7% |
| Shares | | Value |
HEALTH CARE PROVIDERS & SERVICES - 1.8% |
Health Care Facilities - 1.8% |
Brookdale Senior Living, Inc. (a) | 205,573 | | $ 3,383,732 |
Emeritus Corp. (a) | 365,665 | | 6,198,022 |
Sunrise Senior Living, Inc. (a)(d) | 296,292 | | 1,979,231 |
TOTAL HEALTH CARE FACILITIES | | 11,560,985 |
REAL ESTATE INVESTMENT TRUSTS - 93.9% |
REITs - Apartments - 17.6% |
Apartment Investment & Management Co. Class A | 234,766 | | 6,439,631 |
AvalonBay Communities, Inc. | 70,382 | | 10,352,488 |
Camden Property Trust (SBI) | 338,484 | | 24,137,294 |
Education Realty Trust, Inc. | 1,239,612 | | 14,528,253 |
Equity Residential (SBI) | 269,212 | | 17,043,812 |
Essex Property Trust, Inc. | 169,422 | | 26,660,246 |
Home Properties, Inc. | 42,470 | | 2,786,457 |
Post Properties, Inc. | 182,390 | | 9,420,444 |
TOTAL REITS - APARTMENTS | | 111,368,625 |
REITs - Health Care Facilities - 11.7% |
HCP, Inc. | 396,774 | | 18,731,701 |
Health Care REIT, Inc. | 77,335 | | 4,812,557 |
LTC Properties, Inc. | 50,000 | | 1,785,000 |
Ventas, Inc. | 722,969 | | 48,619,665 |
TOTAL REITS - HEALTH CARE FACILITIES | | 73,948,923 |
REITs - Hotels - 4.8% |
Chesapeake Lodging Trust | 458,598 | | 7,782,408 |
Host Hotels & Resorts, Inc. | 588,134 | | 8,633,807 |
LaSalle Hotel Properties (SBI) | 312,400 | | 8,203,624 |
Sunstone Hotel Investors, Inc. (a) | 588,191 | | 5,887,792 |
TOTAL REITS - HOTELS | | 30,507,631 |
REITs - Industrial Buildings - 13.4% |
DCT Industrial Trust, Inc. | 789,800 | | 4,944,148 |
First Potomac Realty Trust | 144,000 | | 1,668,960 |
Prologis, Inc. | 1,041,857 | | 33,683,237 |
Common Stocks - continued |
| Shares | | Value |
REAL ESTATE INVESTMENT TRUSTS - CONTINUED |
REITs - Industrial Buildings - continued |
Public Storage | 283,521 | | $ 42,230,453 |
Stag Industrial, Inc. | 183,600 | | 2,654,856 |
TOTAL REITS - INDUSTRIAL BUILDINGS | | 85,181,654 |
REITs - Malls - 16.5% |
CBL & Associates Properties, Inc. | 904,954 | | 17,854,742 |
Simon Property Group, Inc. | 519,000 | | 83,294,308 |
The Macerich Co. | 64,646 | | 3,775,973 |
TOTAL REITS - MALLS | | 104,925,023 |
REITs - Management/Investment - 3.9% |
Digital Realty Trust, Inc. (d) | 308,153 | | 24,057,505 |
Lexington Corporate Properties Trust | 91,600 | | 818,904 |
TOTAL REITS - MANAGEMENT/INVESTMENT | | 24,876,409 |
REITs - Mobile Home Parks - 0.6% |
Sun Communities, Inc. | 85,300 | | 3,974,127 |
REITs - Mortgage - 0.3% |
Newcastle Investment Corp. | 217,600 | | 1,621,120 |
REITs - Office Buildings - 15.2% |
Boston Properties, Inc. | 289,249 | | 32,077,714 |
Douglas Emmett, Inc. | 732,000 | | 17,209,320 |
Highwoods Properties, Inc. (SBI) | 437,325 | | 14,812,198 |
SL Green Realty Corp. | 343,365 | | 27,039,994 |
Sovran Self Storage, Inc. | 91,100 | | 5,201,810 |
TOTAL REITS - OFFICE BUILDINGS | | 96,341,036 |
REITs - Shopping Centers - 9.9% |
Acadia Realty Trust (SBI) | 485,400 | | 11,620,476 |
Cedar Shopping Centers, Inc. | 554,172 | | 2,853,986 |
DDR Corp. | 475,994 | | 7,158,950 |
Equity One, Inc. | 853,963 | | 18,522,457 |
Excel Trust, Inc. | 73,725 | | 902,394 |
Glimcher Realty Trust | 676,866 | | 6,782,197 |
Common Stocks - continued |
| Shares | | Value |
REAL ESTATE INVESTMENT TRUSTS - CONTINUED |
REITs - Shopping Centers - continued |
Kite Realty Group Trust | 490,131 | | $ 2,465,359 |
Vornado Realty Trust | 146,688 | | 12,248,448 |
TOTAL REITS - SHOPPING CENTERS | | 62,554,267 |
TOTAL REAL ESTATE INVESTMENT TRUSTS | | 595,298,815 |
REAL ESTATE MANAGEMENT & DEVELOPMENT - 1.0% |
Real Estate Operating Companies - 0.8% |
Forest City Enterprises, Inc. Class A (a) | 375,167 | | 5,293,606 |
Real Estate Services - 0.2% |
CBRE Group, Inc. (a) | 61,500 | | 958,170 |
TOTAL REAL ESTATE MANAGEMENT & DEVELOPMENT | | 6,251,776 |
TOTAL COMMON STOCKS (Cost $474,595,337) |
613,111,576
|
Money Market Funds - 5.5% |
| | | |
Fidelity Cash Central Fund, 0.17% (b) | 21,733,739 | | 21,733,739 |
Fidelity Securities Lending Cash Central Fund, 0.18% (b)(c) | 12,725,650 | | 12,725,650 |
TOTAL MONEY MARKET FUNDS (Cost $34,459,389) |
34,459,389
|
TOTAL INVESTMENT PORTFOLIO - 102.2% (Cost $509,054,726) | | 647,570,965 |
NET OTHER ASSETS (LIABILITIES) - (2.2)% | | (13,681,878) |
NET ASSETS - 100% | $ 633,889,087 |
Legend |
(a) Non-income producing |
(b) Affiliated fund that is available only to investment companies and other accounts managed by Fidelity Investments. The rate quoted is the annualized seven-day yield of the fund at period end. A complete unaudited listing of the fund's holdings as of its most recent quarter end is available upon request. In addition, each Fidelity Central Fund's financial statements, which are not covered by the Fund's Report of Independent Registered Public Accounting Firm, are available on the SEC's website or upon request. |
(c) Investment made with cash collateral received from securities on loan. |
(d) Security or a portion of the security is on loan at period end. |
Affiliated Central Funds |
Information regarding fiscal year to date income earned by the Fund from investments in Fidelity Central Funds is as follows: |
Fund | Income earned |
Fidelity Cash Central Fund | $ 24,707 |
Fidelity Securities Lending Cash Central Fund | 178,910 |
Total | $ 203,617 |
Other Information |
All investments are categorized as Level 1 under the Fair Value Hierarchy. The inputs or methodology used for valuing securities may not be an indication of the risk associated with investing in those securities. For more information on valuation inputs, please refer to the Security Valuation section in the accompanying Notes to Financial Statements. |
See accompanying notes which are an integral part of the financial statements.
Annual Report
Statement of Assets and Liabilities
| July 31, 2012 |
| | |
Assets | | |
Investment in securities, at value (including securities loaned of $12,329,531) - See accompanying schedule: Unaffiliated issuers (cost $474,595,337) | $ 613,111,576 | |
Fidelity Central Funds (cost $34,459,389) | 34,459,389 | |
Total Investments (cost $509,054,726) | | $ 647,570,965 |
Receivable for investments sold | | 1,754,419 |
Receivable for fund shares sold | | 1,095,032 |
Dividends receivable | | 123,861 |
Distributions receivable from Fidelity Central Funds | | 4,590 |
Other receivables | | 5,998 |
Total assets | | 650,554,865 |
| | |
Liabilities | | |
Payable for investments purchased | $ 2,481,162 | |
Payable for fund shares redeemed | 831,064 | |
Accrued management fee | 291,278 | |
Distribution and service plan fees payable | 129,277 | |
Other affiliated payables | 165,380 | |
Other payables and accrued expenses | 41,967 | |
Collateral on securities loaned, at value | 12,725,650 | |
Total liabilities | | 16,665,778 |
| | |
Net Assets | | $ 633,889,087 |
Net Assets consist of: | | |
Paid in capital | | $ 508,225,103 |
Undistributed net investment income | | 1,437,270 |
Accumulated undistributed net realized gain (loss) on investments and foreign currency transactions | | (14,289,525) |
Net unrealized appreciation (depreciation) on investments | | 138,516,239 |
Net Assets | | $ 633,889,087 |
See accompanying notes which are an integral part of the financial statements.
Annual Report
Statement of Assets and Liabilities - continued
| July 31, 2012 |
| | |
Calculation of Maximum Offering Price Class A:
Net Asset Value and redemption price per share ($199,303,293 ÷ 10,049,097 shares) | | $ 19.83 |
| | |
Maximum offering price per share (100/94.25 of $19.83) | | $ 21.04 |
Class T:
Net Asset Value and redemption price per share ($86,986,563 ÷ 4,388,463 shares) | | $ 19.82 |
| | |
Maximum offering price per share (100/96.50 of $19.82) | | $ 20.54 |
Class B:
Net Asset Value and offering price per share ($9,481,026 ÷ 484,043 shares)A | | $ 19.59 |
| | |
Class C:
Net Asset Value and offering price per share ($55,064,253 ÷ 2,816,216 shares)A | | $ 19.55 |
| | |
Institutional Class:
Net Asset Value, offering price and redemption price per share ($283,053,952 ÷ 14,176,053 shares) | | $ 19.97 |
A Redemption price per share is equal to net asset value less any applicable contingent deferred sales charge.
See accompanying notes which are an integral part of the financial statements.
Annual Report
Financial Statements - continued
Statement of Operations
| Year ended July 31, 2012 |
| | |
Investment Income | | |
Dividends | | $ 10,948,206 |
Income from Fidelity Central Funds | | 203,617 |
Total income | | 11,151,823 |
| | |
Expenses | | |
Management fee | $ 2,879,010 | |
Transfer agent fees | 1,540,993 | |
Distribution and service plan fees | 1,348,584 | |
Accounting and security lending fees | 200,051 | |
Custodian fees and expenses | 25,829 | |
Independent trustees' compensation | 3,321 | |
Registration fees | 110,528 | |
Audit | 47,308 | |
Legal | 1,501 | |
Miscellaneous | 4,381 | |
Total expenses before reductions | 6,161,506 | |
Expense reductions | (13,260) | 6,148,246 |
Net investment income (loss) | | 5,003,577 |
Realized and Unrealized Gain (Loss) Net realized gain (loss) on: | | |
Investment securities: | | |
Unaffiliated issuers | (3,801,786) | |
Foreign currency transactions | (1,490) | |
Total net realized gain (loss) | | (3,803,276) |
Change in net unrealized appreciation (depreciation) on investment securities | | 70,218,055 |
Net gain (loss) | | 66,414,779 |
Net increase (decrease) in net assets resulting from operations | | $ 71,418,356 |
See accompanying notes which are an integral part of the financial statements.
Annual Report
Statement of Changes in Net Assets
| Year ended
July 31,
2012 | Year ended
July 31,
2011 |
Increase (Decrease) in Net Assets | | |
Operations | | |
Net investment income (loss) | $ 5,003,577 | $ 2,958,826 |
Net realized gain (loss) | (3,803,276) | 54,414,285 |
Change in net unrealized appreciation (depreciation) | 70,218,055 | 34,015,366 |
Net increase (decrease) in net assets resulting
from operations | 71,418,356 | 91,388,477 |
Distributions to shareholders from net investment income | (3,900,509) | (3,454,847) |
Distributions to shareholders from net realized gain | (12,354,208) | - |
Total distributions | (16,254,717) | (3,454,847) |
Share transactions - net increase (decrease) | 89,359,376 | 12,993,567 |
Total increase (decrease) in net assets | 144,523,015 | 100,927,197 |
| | |
Net Assets | | |
Beginning of period | 489,366,072 | 388,438,875 |
End of period (including undistributed net investment income of $1,437,270 and undistributed net investment income of $48,238, respectively) | $ 633,889,087 | $ 489,366,072 |
See accompanying notes which are an integral part of the financial statements.
Annual Report
Financial Highlights - Class A
Years ended July 31, | 2012 | 2011 | 2010 | 2009 | 2008 |
Selected Per-Share Data | | | | |
Net asset value, beginning of period | $ 18.24 | $ 14.88 | $ 9.41 | $ 16.39 | $ 18.67 |
Income from Investment Operations | | | | | |
Net investment income (loss) C | .17 | .12 | .19 | .27 | .30 |
Net realized and unrealized gain (loss) | 2.02 | 3.37 | 5.46 | (6.86) | (1.24) |
Total from investment operations | 2.19 | 3.49 | 5.65 | (6.59) | (.94) |
Distributions from net investment income | (.13) | (.13) | (.18) | (.36) | (.26) |
Distributions from net realized gain | (.47) | - | - | (.03) | (1.09) |
Total distributions | (.60) | (.13) | (.18) | (.39) | (1.34) G |
Net asset value, end of period | $ 19.83 | $ 18.24 | $ 14.88 | $ 9.41 | $ 16.39 |
Total Return A, B | 12.81% | 23.63% | 60.38% | (40.19)% | (5.66)% |
Ratios to Average Net Assets D, F | | | | |
Expenses before reductions | 1.19% | 1.19% | 1.23% | 1.27% | 1.22% |
Expenses net of fee waivers, if any | 1.19% | 1.19% | 1.23% | 1.25% | 1.22% |
Expenses net of all reductions | 1.18% | 1.18% | 1.22% | 1.25% | 1.21% |
Net investment income (loss) | .98% | .69% | 1.45% | 2.73% | 1.71% |
Supplemental Data | | | | |
Net assets, end of period (000 omitted) | $ 199,303 | $ 178,978 | $ 117,929 | $ 62,422 | $ 109,442 |
Portfolio turnover rate E | 48% | 63% | 60% | 98% | 86% |
A Total returns would have been lower if certain expenses had not been reduced during the applicable periods shown.
B Total returns do not include the effect of the sales charges.
C Calculated based on average shares outstanding during the period.
D Fees and expenses of any underlying Fidelity Central Funds are not included in the Fund's expense ratio. The Fund indirectly bears its proportionate share of the expenses of any underlying Fidelity Central Funds.
E Amount does not include the portfolio activity of any underlying Fidelity Central Funds.
F Expense ratios reflect operating expenses of the class. Expenses before reductions do not reflect amounts reimbursed by the investment adviser or reductions from brokerage service arrangements or reductions from other expense offset arrangements and do not represent the amount paid by the class during periods when reimbursements or reductions occur. Expenses net of fee waivers reflect expenses after reimbursement by the investment adviser but prior to reductions from brokerage service arrangements or other expense offset arrangements. Expenses net of all reductions represent the net expenses paid by the class.
G Total distributions of $1.34 per share is comprised of distributions from net investment income of $.256 and distributions from net realized gain of $1.085 per share.
See accompanying notes which are an integral part of the financial statements.
Annual Report
Financial Highlights - Class T
Years ended July 31, | 2012 | 2011 | 2010 | 2009 | 2008 |
Selected Per-Share Data | | | | |
Net asset value, beginning of period | $ 18.24 | $ 14.90 | $ 9.42 | $ 16.40 | $ 18.64 |
Income from Investment Operations | | | | | |
Net investment income (loss) C | .13 | .07 | .15 | .25 | .26 |
Net realized and unrealized gain (loss) | 2.02 | 3.38 | 5.47 | (6.87) | (1.24) |
Total from investment operations | 2.15 | 3.45 | 5.62 | (6.62) | (.98) |
Distributions from net investment income | (.10) | (.11) | (.14) | (.33) | (.17) |
Distributions from net realized gain | (.47) | - | - | (.03) | (1.09) |
Total distributions | (.57) | (.11) | (.14) | (.36) | (1.26) G |
Net asset value, end of period | $ 19.82 | $ 18.24 | $ 14.90 | $ 9.42 | $ 16.40 |
Total Return A, B | 12.52% | 23.28% | 60.02% | (40.33)% | (5.88)% |
Ratios to Average Net Assets D, F | | | | |
Expenses before reductions | 1.43% | 1.44% | 1.49% | 1.54% | 1.47% |
Expenses net of fee waivers, if any | 1.43% | 1.44% | 1.49% | 1.50% | 1.47% |
Expenses net of all reductions | 1.43% | 1.44% | 1.48% | 1.50% | 1.47% |
Net investment income (loss) | .73% | .43% | 1.19% | 2.48% | 1.45% |
Supplemental Data | | | | |
Net assets, end of period (000 omitted) | $ 86,987 | $ 76,785 | $ 59,529 | $ 40,276 | $ 81,938 |
Portfolio turnover rate E | 48% | 63% | 60% | 98% | 86% |
A Total returns would have been lower if certain expenses had not been reduced during the applicable periods shown.
B Total returns do not include the effect of the sales charges.
C Calculated based on average shares outstanding during the period.
D Fees and expenses of any underlying Fidelity Central Funds are not included in the Fund's expense ratio. The Fund indirectly bears its proportionate share of the expenses of any underlying Fidelity Central Funds.
E Amount does not include the portfolio activity of any underlying Fidelity Central Funds.
F Expense ratios reflect operating expenses of the class. Expenses before reductions do not reflect amounts reimbursed by the investment adviser or reductions from brokerage service arrangements or reductions from other expense offset arrangements and do not represent the amount paid by the class during periods when reimbursements or reductions occur. Expenses net of fee waivers reflect expenses after reimbursement by the investment adviser but prior to reductions from brokerage service arrangements or other expense offset arrangements. Expenses net of all reductions represent the net expenses paid by the class.
G Total distributions of $1.26 per share is comprised of distributions from net investment income of $.173 and distributions from net realized gain of $1.085 per share.
See accompanying notes which are an integral part of the financial statements.
Annual Report
Financial Highlights - Class B
Years ended July 31, | 2012 | 2011 | 2010 | 2009 | 2008 |
Selected Per-Share Data | | | | |
Net asset value, beginning of period | $ 18.05 | $ 14.77 | $ 9.35 | $ 16.26 | $ 18.51 |
Income from Investment Operations | | | | | |
Net investment income (loss) C | .04 | (.01) | .09 | .20 | .17 |
Net realized and unrealized gain (loss) | 2.00 | 3.35 | 5.42 | (6.81) | (1.23) |
Total from investment operations | 2.04 | 3.34 | 5.51 | (6.61) | (1.06) |
Distributions from net investment income | (.03) | (.06) | (.09) | (.27) | (.10) |
Distributions from net realized gain | (.47) | - | - | (.03) | (1.09) |
Total distributions | (.50) | (.06) | (.09) | (.30) | (1.19) G |
Net asset value, end of period | $ 19.59 | $ 18.05 | $ 14.77 | $ 9.35 | $ 16.26 |
Total Return A, B | 11.99% | 22.69% | 59.14% | (40.60)% | (6.37)% |
Ratios to Average Net Assets D, F | | | | |
Expenses before reductions | 1.93% | 1.94% | 1.98% | 2.04% | 1.96% |
Expenses net of fee waivers, if any | 1.93% | 1.94% | 1.98% | 2.00% | 1.96% |
Expenses net of all reductions | 1.93% | 1.93% | 1.97% | 2.00% | 1.96% |
Net investment income (loss) | .23% | (.07)% | .70% | 1.98% | .96% |
Supplemental Data | | | | |
Net assets, end of period (000 omitted) | $ 9,481 | $ 11,542 | $ 12,078 | $ 7,933 | $ 16,879 |
Portfolio turnover rate E | 48% | 63% | 60% | 98% | 86% |
A Total returns would have been lower if certain expenses had not been reduced during the applicable periods shown.
B Total returns do not include the effect of the contingent deferred sales charge.
C Calculated based on average shares outstanding during the period.
D Fees and expenses of any underlying Fidelity Central Funds are not included in the Fund's expense ratio. The Fund indirectly bears its proportionate share of the expenses of any underlying Fidelity Central Funds.
E Amount does not include the portfolio activity of any underlying Fidelity Central Funds.
F Expense ratios reflect operating expenses of the class. Expenses before reductions do not reflect amounts reimbursed by the investment adviser or reductions from brokerage service arrangements or reductions from other expense offset arrangements and do not represent the amount paid by the class during periods when reimbursements or reductions occur. Expenses net of fee waivers reflect expenses after reimbursement by the investment adviser but prior to reductions from brokerage service arrangements or other expense offset arrangements. Expenses net of all reductions represent the net expenses paid by the class.
G Total distributions of $1.19 per share is comprised of distributions from net investment income of $.102 and distributions from net realized gain of $1.085 per share.
See accompanying notes which are an integral part of the financial statements.
Annual Report
Financial Highlights - Class C
Years ended July 31, | 2012 | 2011 | 2010 | 2009 | 2008 |
Selected Per-Share Data | | | | |
Net asset value, beginning of period | $ 18.03 | $ 14.76 | $ 9.34 | $ 16.26 | $ 18.51 |
Income from Investment Operations | | | | | |
Net investment income (loss) C | .04 | (.01) | .09 | .19 | .17 |
Net realized and unrealized gain (loss) | 1.98 | 3.35 | 5.43 | (6.81) | (1.23) |
Total from investment operations | 2.02 | 3.34 | 5.52 | (6.62) | (1.06) |
Distributions from net investment income | (.03) | (.07) | (.10) | (.27) | (.11) |
Distributions from net realized gain | (.47) | - | - | (.03) | (1.09) |
Total distributions | (.50) | (.07) | (.10) | (.30) | (1.19) G |
Net asset value, end of period | $ 19.55 | $ 18.03 | $ 14.76 | $ 9.34 | $ 16.26 |
Total Return A, B | 11.92% | 22.69% | 59.28% | (40.64)% | (6.35)% |
Ratios to Average Net Assets D, F | | | | |
Expenses before reductions | 1.93% | 1.94% | 1.98% | 2.01% | 1.96% |
Expenses net of fee waivers, if any | 1.93% | 1.94% | 1.98% | 2.00% | 1.96% |
Expenses net of all reductions | 1.93% | 1.93% | 1.97% | 2.00% | 1.96% |
Net investment income (loss) | .23% | (.07)% | .71% | 1.98% | .96% |
Supplemental Data | | | | |
Net assets, end of period (000 omitted) | $ 55,064 | $ 47,406 | $ 31,204 | $ 13,226 | $ 24,984 |
Portfolio turnover rate E | 48% | 63% | 60% | 98% | 86% |
A Total returns would have been lower if certain expenses had not been reduced during the applicable periods shown.
B Total returns do not include the effect of the contingent deferred sales charge.
C Calculated based on average shares outstanding during the period.
D Fees and expenses of any underlying Fidelity Central Funds are not included in the Fund's expense ratio. The Fund indirectly bears its proportionate share of the expenses of any underlying Fidelity Central Funds.
E Amount does not include the portfolio activity of any underlying Fidelity Central Funds.
F Expense ratios reflect operating expenses of the class. Expenses before reductions do not reflect amounts reimbursed by the investment adviser or reductions from brokerage service arrangements or reductions from other expense offset arrangements and do not represent the amount paid by the class during periods when reimbursements or reductions occur. Expenses net of fee waivers reflect expenses after reimbursement by the investment adviser but prior to reductions from brokerage service arrangements or other expense offset arrangements. Expenses net of all reductions represent the net expenses paid by the class.
G Total distributions of $1.19 per share is comprised of distributions from net investment income of $.106 and distributions from net realized gain of $1.085 per share.
See accompanying notes which are an integral part of the financial statements.
Annual Report
Financial Highlights - Institutional Class
Years ended July 31, | 2012 | 2011 | 2010 | 2009 | 2008 |
Selected Per-Share Data | | | | |
Net asset value, beginning of period | $ 18.36 | $ 14.96 | $ 9.46 | $ 16.47 | $ 18.80 |
Income from Investment Operations | | | | | |
Net investment income (loss) B | .22 | .16 | .23 | .30 | .34 |
Net realized and unrealized gain (loss) | 2.03 | 3.39 | 5.47 | (6.90) | (1.23) |
Total from investment operations | 2.25 | 3.55 | 5.70 | (6.60) | (.89) |
Distributions from net investment income | (.17) | (.15) | (.20) | (.38) | (.35) |
Distributions from net realized gain | (.47) | - | - | (.03) | (1.09) |
Total distributions | (.64) | (.15) | (.20) | (.41) | (1.44) F |
Net asset value, end of period | $ 19.97 | $ 18.36 | $ 14.96 | $ 9.46 | $ 16.47 |
Total Return A | 13.12% | 23.92% | 60.75% | (40.03)% | (5.39)% |
Ratios to Average Net Assets C, E | | | | |
Expenses before reductions | .93% | .93% | .97% | 1.01% | .95% |
Expenses net of fee waivers, if any | .93% | .93% | .97% | 1.00% | .95% |
Expenses net of all reductions | .93% | .92% | .96% | 1.00% | .95% |
Net investment income (loss) | 1.23% | .94% | 1.71% | 2.98% | 1.97% |
Supplemental Data | | | | |
Net assets, end of period (000 omitted) | $ 283,054 | $ 174,655 | $ 167,699 | $ 55,177 | $ 72,780 |
Portfolio turnover rate D | 48% | 63% | 60% | 98% | 86% |
A Total returns would have been lower if certain expenses had not been reduced during the applicable periods shown.
B Calculated based on average shares outstanding during the period.
C Fees and expenses of any underlying Fidelity Central Funds are not included in the Fund's expense ratio. The Fund indirectly bears its proportionate share of the expenses of any underlying Fidelity Central Funds.
D Amount does not include the portfolio activity of any underlying Fidelity Central Funds.
E Expense ratios reflect operating expenses of the class. Expenses before reductions do not reflect amounts reimbursed by the investment adviser or reductions from brokerage service arrangements or reductions from other expense offset arrangements and do not represent the amount paid by the class during periods when reimbursements or reductions occur. Expenses net of fee waivers reflect expenses after reimbursement by the investment adviser but prior to reductions from brokerage service arrangements or other expense offset arrangements. Expenses net of all reductions represent the net expenses paid by the class.
F Total distributions of $1.44 per share is comprised of distributions from net investment income of $.352 and distributions from net realized gain of $1.085 per share.
See accompanying notes which are an integral part of the financial statements.
Annual Report
Notes to Financial Statements
For the period ended July 31, 2012
1. Organization.
Fidelity Advisor Real Estate Fund (the Fund) is a non-diversified fund of Fidelity Advisor Series VII (the Trust) and is authorized to issue an unlimited number of shares. The Trust is registered under the Investment Company Act of 1940, as amended (the 1940 Act), as an open-end management investment company organized as a Massachusetts business trust. The Fund offers Class A, Class T, Class C and Institutional Class shares, each of which, along with Class B shares, has equal rights as to assets and voting privileges. Effective after the close of business on September 1, 2010, Class B shares were closed to new accounts and additional purchases, except for exchanges and reinvestments. Each class has exclusive voting rights with respect to matters that affect that class. Class B shares will automatically convert to Class A shares after a holding period of seven years from the initial date of purchase. Investment income, realized and unrealized capital gains and losses, the common expenses of the Fund, and certain fund-level expense reductions, if any, are allocated on a pro-rata basis to each class based on the relative net assets of each class to the total net assets of the Fund. Each class differs with respect to transfer agent and distribution and service plan fees incurred. Certain expense reductions may also differ by class.
2. Investments in Fidelity Central Funds.
The Fund invests in Fidelity Central Funds, which are open-end investment companies available only to other investment companies and accounts managed by Fidelity Management & Research Company (FMR) and its affiliates. The Fund's Schedule of Investments lists each of the Fidelity Central Funds held as of period end, if any, as an investment of the Fund, but does not include the underlying holdings of each Fidelity Central Fund. As an Investing Fund, the Fund indirectly bears its proportionate share of the expenses of the underlying Fidelity Central Funds.
The Money Market Central Funds seek preservation of capital and current income and are managed by Fidelity Investments Money Management, Inc. (FIMM), an affiliate of FMR.
A complete unaudited list of holdings for each Fidelity Central Fund is available upon request or at the Securities and Exchange Commission (the SEC) web site at www.sec.gov. In addition, the financial statements of the Fidelity Central Funds, which are not covered by the Fund's Report of Independent Registered Public Accounting Firm, are available on the SEC web site or upon request.
3. Significant Accounting Policies.
The financial statements have been prepared in conformity with accounting principles generally accepted in the United States of America (GAAP), which require management to make certain estimates and assumptions at the date of the financial statements.
Annual Report
3. Significant Accounting Policies - continued
Actual results could differ from those estimates. Subsequent events, if any, through the date that the financial statements were issued have been evaluated in the preparation of the financial statements. The following summarizes the significant accounting policies of the Fund:
Security Valuation. Investments are valued as of 4:00 p.m. Eastern time on the last calendar day of the period. In accordance with valuation policies and procedures approved by the Board of Trustees (the Board), the Fund attempts to obtain prices from one or more third party pricing vendor or broker to value its investments. When current market prices, quotations or rates are not readily available or reliable, securities will be fair valued in good faith by the FMR Fair Value Committee (the Committee), in accordance with procedures adopted by the Fund's Board. Factors used in determining fair value vary by security type and may include market or security specific events. The frequency with which these procedures are used cannot be predicted and they may be utilized to a significant extent. The Committee oversees the Fund's valuation policies and procedures and is responsible for approving and reporting to the Board all fair value determinations.
The Fund categorizes the inputs to valuation techniques used to value its investments into a disclosure hierarchy consisting of three levels as shown below:
Level 1 - quoted prices in active markets for identical investments
Level 2 - other significant observable inputs (including quoted prices for similar investments, interest rates, prepayment speeds, etc.)
Level 3 - unobservable inputs (including the Fund's own assumptions based on the best information available)
Valuation techniques used to value the Fund's investments by major category are as follows:
Equity securities, including restricted securities, for which market quotations are readily available, are valued at the last reported sale price or official closing price as reported by a third party pricing vendor on the primary market or exchange on which they are traded and are categorized as Level 1 in the hierarchy. In the event there were no sales during the day or closing prices are not available, securities are valued at the last quoted bid price or may be valued using the last available price and are generally categorized as Level 2 in the hierarchy. For foreign equity securities, when significant market or security specific events arise, comparisons to the valuation of American Depositary Receipts (ADRs), futures contracts, Exchange-Traded Funds (ETFs) and certain indexes as well as quoted prices for similar securities are used and are categorized as Level 2 in the hierarchy. Utilizing these techniques may result in transfers between Level 1 and Level 2.
Annual Report
Notes to Financial Statements - continued
3. Significant Accounting Policies - continued
Security Valuation - continued
Investments in open-end mutual funds, including the Fidelity Central Funds, are valued at their closing net asset value each business day and are categorized as Level 1 in the hierarchy.
Changes in valuation techniques may result in transfers in or out of an assigned level within the disclosure hierarchy.
Foreign Currency Translation. The Fund may use foreign currency contracts to facilitate transactions in foreign-denominated securities. Gains and losses from these transactions may arise from changes in the value of the foreign currency or if the counterparties do not perform under the contracts' terms.
Foreign-denominated assets, including investment securities, and liabilities are translated into U.S. dollars at the exchange rates at period end. Purchases and sales of investment securities, income and dividends received and expenses denominated in foreign currencies are translated into U.S. dollars at the exchange rate in effect on the transaction date.
The effects of exchange rate fluctuations on investments are included with the net realized and unrealized gain (loss) on investment securities. Other foreign currency transactions resulting in realized and unrealized gain (loss) are disclosed separately.
Investment Transactions and Income. For financial reporting purposes, the Fund's investment holdings and NAV include trades executed through the end of the last business day of the period. The NAV per share for processing shareholder transactions is calculated as of the close of business of the New York Stock Exchange (NYSE), normally 4:00 p.m. Eastern time and includes trades executed through the end of the prior business day. Gains and losses on securities sold are determined on the basis of identified cost and may include proceeds received from litigation. Dividend income is recorded on the ex-dividend date, except for certain dividends from foreign securities where the ex-dividend date may have passed, which are recorded as soon as the Fund is informed of the ex-dividend date. Non-cash dividends included in dividend income, if any, are recorded at the fair market value of the securities received. Distributions received on securities that represent a return of capital or capital gain are recorded as a reduction of cost of investments and/or as a realized gain. The Fund estimates the components of distributions received that may be considered return of capital distributions or capital gain distributions. Interest income and distributions from the Fidelity Central Funds are accrued as earned. Interest income includes coupon interest and amortization of premium and accretion of discount on debt securities. Investment income is recorded net of foreign taxes withheld where recovery of such taxes is uncertain.
Annual Report
3. Significant Accounting Policies - continued
Expenses. Expenses directly attributable to a fund are charged to that fund. Expenses attributable to more than one fund are allocated among the respective funds on the basis of relative net assets or other appropriate methods. Expense estimates are accrued in the period to which they relate and adjustments are made when actual amounts are known.
Income Tax Information and Distributions to Shareholders. Each year, the Fund intends to qualify as a regulated investment company under Subchapter M of the Internal Revenue Code, including distributing substantially all of its taxable income and realized gains. As a result, no provision for income taxes is required. As of July 31, 2012, the Fund did not have any unrecognized tax benefits in the financial statements; nor is the Fund aware of any tax positions for which it is reasonably possible that the total amounts of unrecognized tax benefits will significantly change in the next twelve months. The Fund files a U.S. federal tax return, in addition to state and local tax returns as required. A fund's federal income tax returns are subject to examination by the Internal Revenue Service (IRS) for a period of three fiscal years after they are filed. State and local tax returns may be subject to examination for an additional fiscal year depending on the jurisdiction. Foreign taxes are provided for based on the Fund's understanding of the tax rules and rates that exist in the foreign markets in which it invests.
Distributions are declared and recorded on the ex-dividend date. Income dividends and capital gain distributions are declared separately for each class. Income and capital gain distributions are determined in accordance with income tax regulations, which may differ from GAAP.
Capital accounts within the financial statements are adjusted for permanent book-tax differences. These adjustments have no impact on net assets or the results of operations. Temporary book-tax differences will reverse in a subsequent period.
Book-tax differences are primarily due to foreign currency transactions, capital loss carryforwards and losses deferred due to wash sales.
The federal tax cost of investment securities and unrealized appreciation (depreciation) as of period end were as follows:
Gross unrealized appreciation | $ 142,985,212 |
Gross unrealized depreciation | (10,763,303) |
Net unrealized appreciation (depreciation) on securities and other investments | $ 132,221,909 |
| |
Tax Cost | $ 515,349,056 |
Annual Report
Notes to Financial Statements - continued
3. Significant Accounting Policies - continued
Income Tax Information and Distributions to Shareholders - continued
The tax-based components of distributable earnings as of period end were as follows:
Undistributed ordinary income | $ 1,437,270 |
Capital loss carryforward | $ (7,995,195) |
Net unrealized appreciation (depreciation) | $ 132,221,909 |
Capital loss carryforwards are only available to offset future capital gains of the Fund to the extent provided by regulations and may be limited. Under the Regulated Investment Company Modernization Act of 2010 (the Act), the Fund is permitted to carry forward capital losses incurred in taxable years beginning after December 22, 2010 for an unlimited period and such capital losses are required to be used prior to any losses that expire. Capital loss carryforwards were as follows:
No expiration | |
Short-term | $ (7,995,195) |
The tax character of distributions paid was as follows:
| July 31, 2012 | July 31, 2011 |
Ordinary Income | $ 3,900,509 | $ 3,454,847 |
Long-term Capital Gains | 12,354,208 | - |
Total | $ 16,254,717 | $ 3,454,847 |
New Accounting Pronouncement. In December 2011, the Financial Accounting Standards Board issued Accounting Standard Update No. 2011-11, Disclosures about Offsetting Assets and Liabilities. The update creates new disclosure requirements requiring entities to disclose both gross and net information for derivatives and other financial instruments that are either offset in the Statement of Assets and Liabilities or subject to an enforceable master netting arrangement or similar agreement. The disclosure requirements are effective for interim and annual reporting periods beginning on or after January 1, 2013. Management is currently evaluating the impact of the update's adoption on the Fund's financial statement disclosures.
4. Purchases and Sales of Investments.
Purchases and sales of securities, other than short-term securities, aggregated $319,623,933 and $244,922,077, respectively.
Annual Report
5. Fees and Other Transactions with Affiliates.
Management Fee. FMR and its affiliates provide the Fund with investment management related services for which the Fund pays a monthly management fee. The management fee is the sum of an individual fund fee rate that is based on an annual rate of .30% of the Fund's average net assets and an annualized group fee rate that averaged .26% during the period. The group fee rate is based upon the average net assets of all the mutual funds advised by FMR. The group fee rate decreases as assets under management increase and increases as assets under management decrease. For the period, the total annual management fee rate was .56% of the Fund's average net assets.
Distribution and Service Plan Fees. In accordance with Rule 12b-1 of the 1940 Act, the Fund has adopted separate Distribution and Service Plans for each class of shares. Certain classes pay Fidelity Distributors Corporation (FDC), an affiliate of FMR, separate Distribution and Service Fees, each of which is based on an annual percentage of each class' average net assets. In addition, FDC may pay financial intermediaries for selling shares of the Fund and providing shareholder support services. For the period, the Distribution and Service Fee rates, total fees and amounts retained by FDC were as follows:
| Distribution
Fee | Service
Fee | Total Fees | Retained
by FDC |
Class A | -% | .25% | $ 417,501 | $ 6,984 |
Class T | .25% | .25% | 366,136 | 342 |
Class B | .75% | .25% | 94,834 | 71,155 |
Class C | .75% | .25% | 470,113 | 80,484 |
| | | $ 1,348,584 | $ 158,965 |
Sales Load. FDC may receive a front-end sales charge of up to 5.75% for selling Class A shares and 3.50% for selling Class T shares, some of which is paid to financial intermediaries for selling shares of the Fund. Depending on the holding period, FDC may receive contingent deferred sales charges levied on Class A, Class T, Class B, and Class C redemptions. The deferred sales charges range from 5.00% to 1.00% for Class B shares, 1.00% for Class C shares, 1.00% for certain purchases of Class A shares and .25% for certain purchases of Class T shares.
Annual Report
Notes to Financial Statements - continued
5. Fees and Other Transactions with Affiliates - continued
Sales Load - continued
For the period, sales charge amounts retained by FDC were as follows:
| Retained
by FDC |
Class A | $ 56,896 |
Class T | 12,432 |
Class B* | 16,487 |
Class C* | 5,578 |
| $ 91,393 |
* When Class B and Class C shares are initially sold, FDC pays commissions from its own resources to financial intermediaries through which the sales are made.
Transfer Agent Fees. Fidelity Investments Institutional Operations Company, Inc. (FIIOC), an affiliate of FMR, is the transfer, dividend disbursing and shareholder servicing agent for each class of the Fund. FIIOC receives account fees and asset-based fees that vary according to the account size and type of account of the shareholders of the respective classes of the Fund. FIIOC pays for typesetting, printing and mailing of shareholder reports, except proxy statements. For the period, transfer agent fees for each class were as follows:
| Amount | % of
Average
Net Assets |
Class A | $ 501,163 | .30 |
Class T | 218,194 | .30 |
Class B | 28,405 | .30 |
Class C | 140,279 | .30 |
Institutional Class | 652,952 | .30 |
| $ 1,540,993 | |
Accounting and Security Lending Fees. Fidelity Service Company, Inc. (FSC), an affiliate of FMR, maintains the Fund's accounting records. The accounting fee is based on the level of average net assets for each month. Under a separate contract, FSC administers the security lending program. The security lending fee is based on the number and duration of lending transactions.
Brokerage Commissions. The Fund placed a portion of its portfolio transactions with brokerage firms which are affiliates of the investment adviser. The commissions paid to these affiliated firms were $4,780 for the period.
Annual Report
6. Committed Line of Credit.
The Fund participates with other funds managed by FMR or an affiliate in a $4.25 billion credit facility (the "line of credit") to be utilized for temporary or emergency purposes to fund shareholder redemptions or for other short-term liquidity purposes. The Fund has agreed to pay commitment fees on its pro-rata portion of the line of credit, which amounted to $1,419 and is reflected in Miscellaneous expenses on the Statement of Operations. During the period, there were no borrowings on this line of credit.
7. Security Lending.
The Fund lends portfolio securities through a lending agent from time to time in order to earn additional income. For equity securities, a lending agent is used and may loan securities to certain qualified borrowers, including Fidelity Capital Markets (FCM), a broker-dealer affiliated with the Fund. On the settlement date of the loan, the Fund receives collateral (in the form of U.S. Treasury obligations, letters of credit and/or cash) against the loaned securities and maintains collateral in an amount not less than 100% of the market value of the loaned securities during the period of the loan. The market value of the loaned securities is determined at the close of business of the Fund and any additional required collateral is delivered to the Fund on the next business day. If the borrower defaults on its obligation to return the securities loaned because of insolvency or other reasons, a fund could experience delays and costs in recovering the securities loaned or in gaining access to the collateral. Any cash collateral received is invested in the Fidelity Securities Lending Cash Central Fund. The value of loaned securities and cash collateral at period end are disclosed on the Fund's Statement of Assets and Liabilities. At period end, there were no security loans outstanding with FCM. Security lending income represents the income earned on investing cash collateral, less rebates paid to borrowers and any lending agent fees associated with the loan, plus any premium payments received for lending certain types of securities. Security lending income is presented in the Statement of Operations as a component of income from Fidelity Central Funds. Total security lending income during the period amounted to $178,910, including $257 from securities loaned to FCM.
8. Expense Reductions.
Many of the brokers with whom FMR places trades on behalf of the Fund provided services to the Fund in addition to trade execution. These services included payments of certain expenses on behalf of the Fund totaling $13,251 for the period. In addition, through arrangements with the Fund's custodian, credits realized as a result of uninvested cash balances were used to reduce the Fund's expenses. During the period, these credits reduced the Fund's custody expenses by $9.
Annual Report
Notes to Financial Statements - continued
9. Distributions to Shareholders.
Distributions to shareholders of each class were as follows:
Years ended July 31, | 2012 | 2011 |
From net investment income | | |
Class A | $ 1,233,446 | $ 1,134,674 |
Class T | 395,519 | 470,285 |
Class B | 17,337 | 48,095 |
Class C | 91,538 | 150,722 |
Institutional Class | 2,162,669 | 1,651,071 |
Total | $ 3,900,509 | $ 3,454,847 |
From net realized gain | | |
Class A | $ 4,374,052 | $ - |
Class T | 1,941,846 | - |
Class B | 284,191 | - |
Class C | 1,220,926 | - |
Institutional Class | 4,533,193 | - |
Total | $ 12,354,208 | $ - |
10. Share Transactions.
Transactions for each class of shares were as follows:
| Shares | Dollars |
Years ended July 31, | 2012 | 2011 | 2012 | 2011 |
Class A | | | | |
Shares sold | 4,390,323 | 4,653,877 | $ 77,870,328 | $ 78,524,629 |
Reinvestment of distributions | 330,295 | 65,899 | 5,307,780 | 1,031,857 |
Shares redeemed | (4,481,644) | (2,832,440) | (76,348,944) | (47,536,681) |
Net increase (decrease) | 238,974 | 1,887,336 | $ 6,829,164 | $ 32,019,805 |
Class T | | | | |
Shares sold | 1,486,467 | 1,651,686 | $ 26,569,039 | $ 27,537,800 |
Reinvestment of distributions | 143,406 | 29,190 | 2,295,629 | 457,660 |
Shares redeemed | (1,450,832) | (1,467,042) | (25,262,634) | (24,575,305) |
Net increase (decrease) | 179,041 | 213,834 | $ 3,602,034 | $ 3,420,155 |
Class B | | | | |
Shares sold | 71,396 | 93,823 | $ 1,224,427 | $ 1,516,799 |
Reinvestment of distributions | 17,389 | 2,787 | 272,976 | 43,338 |
Shares redeemed | (244,068) | (274,854) | (4,157,648) | (4,557,495) |
Net increase (decrease) | (155,283) | (178,244) | $ (2,660,245) | $ (2,997,358) |
Annual Report
10. Share Transactions - continued
| Shares | Dollars |
Years ended July 31, | 2012 | 2011 | 2012 | 2011 |
Class C | | | | |
Shares sold | 701,378 | 1,010,530 | $ 12,249,173 | $ 16,785,045 |
Reinvestment of distributions | 76,897 | 8,844 | 1,206,065 | 137,459 |
Shares redeemed | (591,840) | (504,158) | (10,136,308) | (8,281,154) |
Net increase (decrease) | 186,435 | 515,216 | $ 3,318,930 | $ 8,641,350 |
Institutional Class | | | | |
Shares sold | 7,861,392 | 4,421,526 | $ 135,053,241 | $ 73,745,390 |
Reinvestment of distributions | 250,120 | 72,024 | 4,059,507 | 1,131,385 |
Shares redeemed | (3,446,764) | (6,191,578) | (60,843,255) | (102,967,160) |
Net increase (decrease) | 4,664,748 | (1,698,028) | $ 78,269,493 | $ (28,090,385) |
11. Other.
The Fund's organizational documents provide former and current trustees and officers with a limited indemnification against liabilities arising in connection with the performance of their duties to the Fund. In the normal course of business, the Fund may also enter into contracts that provide general indemnifications. The Fund's maximum exposure under these arrangements is unknown as this would be dependent on future claims that may be made against the Fund. The risk of material loss from such claims is considered remote.
At the end of the period, Strategic Advisers Small-Mid Cap Fund was the owner of record of 10% of the total outstanding shares of the Fund.
Annual Report
To the Trustees of Fidelity Advisor Series VII and Shareholders of Fidelity Advisor Real Estate Fund:
We have audited the accompanying statement of assets and liabilities of Fidelity Advisor Real Estate Fund (the Fund), a fund of Fidelity Advisor Series VII, including the schedule of investments, as of July 31, 2012, and the related statement of operations for the year then ended, the statement of changes in net assets for each of the two years in the period then ended, and the financial highlights for each of the five years in the period then ended. These financial statements and financial highlights are the responsibility of the Fund's management. Our responsibility is to express an opinion on these financial statements and financial highlights based on our audits.
We conducted our audits in accordance with the standards of the Public Company Accounting Oversight Board (United States). Those standards require that we plan and perform the audit to obtain reasonable assurance about whether the financial statements and financial highlights are free of material misstatement. The Fund is not required to have, nor were we engaged to perform, an audit of its internal control over financial reporting. Our audits included consideration of internal control over financial reporting as a basis for designing audit procedures that are appropriate in the circumstances, but not for the purpose of expressing an opinion on the effectiveness of the Fund's internal control over financial reporting. Accordingly, we express no such opinion. An audit also includes examining, on a test basis, evidence supporting the amounts and disclosures in the financial statements, assessing the accounting principles used and significant estimates made by management, as well as evaluating the overall financial statement presentation. Our procedures included confirmation of securities owned as of July 31, 2012, by correspondence with the custodians and brokers; where replies were not received from brokers, we performed other auditing procedures. We believe that our audits provide a reasonable basis for our opinion.
In our opinion, the financial statements and financial highlights referred to above present fairly, in all material respects, the financial position of Fidelity Advisor Real Estate Fund as of July 31, 2012, the results of its operations for the year then ended, the changes in its net assets for each of the two years in the period then ended, and the financial highlights for each of the five years in the period then ended, in conformity with accounting principles generally accepted in the United States of America.
DELOITTE & TOUCHE LLP
Boston, Massachusetts
September 13, 2012
Annual Report
The Trustees, Members of the Advisory Board, and executive officers of the trust and fund, as applicable, are listed below. The Board of Trustees governs the fund and is responsible for protecting the interests of shareholders. The Trustees are experienced executives who meet periodically throughout the year to oversee the fund's activities, review contractual arrangements with companies that provide services to the fund, oversee management of the risks associated with such activities and contractual arrangements, and review the fund's performance. Except for James C. Curvey, each of the Trustees oversees 228 funds advised by FMR or an affiliate. Mr. Curvey oversees 435 funds advised by FMR or an affiliate.
The Trustees hold office without limit in time except that (a) any Trustee may resign; (b) any Trustee may be removed by written instrument, signed by at least two-thirds of the number of Trustees prior to such removal; (c) any Trustee who requests to be retired or who has become incapacitated by illness or injury may be retired by written instrument signed by a majority of the other Trustees; and (d) any Trustee may be removed at any special meeting of shareholders by a two-thirds vote of the outstanding voting securities of the trust. Each Trustee who is not an interested person (as defined in the 1940 Act) (Independent Trustee), shall retire not later than the last day of the calendar year in which his or her 75th birthday occurs. The Independent Trustees may waive this mandatory retirement age policy with respect to individual Trustees. The executive officers and Advisory Board Members hold office without limit in time, except that any officer and Advisory Board Member may resign or may be removed by a vote of a majority of the Trustees at any regular meeting or any special meeting of the Trustees. Except as indicated, each individual has held the office shown or other offices in the same company for the past five years.
Experience, Skills, Attributes, and Qualifications of the Fund's Trustees. The Governance and Nominating Committee has adopted a statement of policy that describes the experience, qualifications, attributes, and skills that are necessary and desirable for potential Independent Trustee candidates (Statement of Policy). The Board believes that each Trustee satisfied at the time he or she was initially elected or appointed a Trustee, and continues to satisfy, the standards contemplated by the Statement of Policy. The Governance and Nominating Committee also engages professional search firms to help identify potential Independent Trustee candidates who have the experience, qualifications, attributes, and skills consistent with the Statement of Policy. From time to time, additional criteria based on the composition and skills of the current Independent Trustees, as well as experience or skills that may be appropriate in light of future changes to board composition, business conditions, and regulatory or other developments, have also been considered by the professional search firms and the Governance and Nominating Committee. In addition, the Board takes into account the Trustees' commitment and participation in Board and committee meetings, as well as their leadership of standing and ad hoc committees throughout their tenure.
In determining that a particular Trustee was and continues to be qualified to serve as a Trustee, the Board has considered a variety of criteria, none of which, in isolation, was controlling. The Board believes that, collectively, the Trustees have balanced and diverse experience, qualifications, attributes, and skills, which allow the Board to operate effectively in governing the fund and protecting the interests of shareholders. Information about the specific experience, skills, attributes, and qualifications of each Trustee, which in each case led to the Board's conclusion that the Trustee should serve (or continue to serve) as a trustee of the fund, is provided below.
Annual Report
Board Structure and Oversight Function. James C. Curvey is an interested person (as defined in the 1940 Act) and currently serves as Chairman. The Trustees have determined that an interested Chairman is appropriate and benefits shareholders because an interested Chairman has a personal and professional stake in the quality and continuity of services provided to the fund. Independent Trustees exercise their informed business judgment to appoint an individual of their choosing to serve as Chairman, regardless of whether the Trustee happens to be independent or a member of management. The Independent Trustees have determined that they can act independently and effectively without having an Independent Trustee serve as Chairman and that a key structural component for assuring that they are in a position to do so is for the Independent Trustees to constitute a substantial majority for the Board. The Independent Trustees also regularly meet in executive session. Ned C. Lautenbach serves as Chairman of the Independent Trustees and as such (i) acts as a liaison between the Independent Trustees and management with respect to matters important to the Independent Trustees and (ii) with management prepares agendas for Board meetings.
Fidelity funds are overseen by different Boards of Trustees. The fund's Board oversees Fidelity's equity and high income funds and another Board oversees Fidelity's investment-grade bond, money market, and asset allocation funds. The asset allocation funds may invest in Fidelity funds overseen by the fund's Board. The use of separate Boards, each with its own committee structure, allows the Trustees of each group of Fidelity funds to focus on the unique issues of the funds they oversee, including common research, investment, and operational issues. On occasion, the separate Boards establish joint committees to address issues of overlapping consequences for the Fidelity funds overseen by each Board.
The Trustees operate using a system of committees to facilitate the timely and efficient consideration of all matters of importance to the Trustees, the fund, and fund shareholders and to facilitate compliance with legal and regulatory requirements and oversight of the fund's activities and associated risks. The Board, acting through its committees, has charged FMR and its affiliates with (i) identifying events or circumstances the occurrence of which could have demonstrably adverse effects on the fund's business and/or reputation; (ii) implementing processes and controls to lessen the possibility that such events or circumstances occur or to mitigate the effects of such events or circumstances if they do occur; and (iii) creating and maintaining a system designed to evaluate continuously business and market conditions in order to facilitate the identification and implementation processes described in (i) and (ii) above. Because the day-to-day operations and activities of the fund are carried out by or through FMR, its affiliates and other service providers, the fund's exposure to risks is mitigated but not eliminated by the processes overseen by the Trustees. While each of the Board's committees has responsibility for overseeing different aspects of the fund's activities, oversight is exercised primarily through the Operations, Audit, and Compliance Committees. In addition, the Independent Trustees have worked with FMR to enhance the Board's oversight of investment and financial risks, legal and regulatory risks, technology risks, and operational risks, including the development of additional risk reporting to the Board. For example, a working group comprised of Independent Trustees and FMR has worked and continues to work to review the Fidelity funds' valuation-related activities, reporting and risk management. Appropriate personnel, including but not limited to the fund's Chief Compliance Officer (CCO), FMR's internal auditor, the independent accountants, the fund's Treasurer and portfolio management personnel, make periodic reports to the Board's committees, as appropriate, including an annual review of FMR's risk management program for the Fidelity funds. The responsibilities of each standing committee, including their oversight responsibilities, are described further under "Standing Committees of the Fund's Trustees."
Annual Report
Trustees and Officers - continued
The fund's Statement of Additional Information (SAI) includes more information about the Trustees. To request a free copy, call Fidelity at 1-800-208-0098.
Interested Trustees*:
Correspondence intended for each Trustee who is an interested person may be sent to Fidelity Investments, 82 Devonshire Street, Boston, Massachusetts 02109.
Name, Age; Principal Occupations and Other Relevant Experience+ |
James C. Curvey (77) |
| Year of Election or Appointment: 2007 Mr. Curvey is Trustee and Chairman of the Board of Trustees of certain Trusts. Mr. Curvey also serves as Trustee (2007-present) of other investment companies advised by FMR. Mr. Curvey is a Director of Fidelity Investments Money Management, Inc. (2009-present), Director of Fidelity Research & Analysis Co. (2009-present) and Director of FMR and FMR Co., Inc. (2007-present). Mr. Curvey is also Vice Chairman (2007-present) and Director of FMR LLC. In addition, Mr. Curvey serves as an Overseer for the Boston Symphony Orchestra and a member of the Trustees of Villanova University. Previously, Mr. Curvey was the Vice Chairman (2006-2007) and Director (2000-2007) of FMR Corp. |
Ronald P. O'Hanley (55) |
| Year of Election or Appointment: 2011 Mr. O'Hanley is Director of FMR Co., Inc. (2010-present), Director of Fidelity Investments Money Management, Inc. (2010-present), Director of Fidelity Research & Analysis Company (2010-present), President of Fidelity Asset Management and Corporate Services and a member of Fidelity's Executive Committee (2010-present). Previously, Mr. O'Hanley served as President and Chief Executive Officer of BNY Mellon Asset Management (2007-2010). Mr. O'Hanley also served as Vice Chairman of Bank New York Mellon Corp. and a member of that firm's Executive Committee. Prior to the 2007 merger of The Bank of New York and Mellon Financial Corporation, he was Vice Chairman of Mellon Financial Corporation and President and Chief Executive Officer of Mellon Asset Management. He joined Mellon in February 1997. Mr. O'Hanley currently serves as Chairman of the Boston Public Library Foundation Board of Directors and sits on the Board of Directors of Beth Israel Deaconess Medical Center, the Board of Trustees of the Marine Biological Laboratory and the Advisory Board of the Maxwell School of Citizenship and Public Administration at Syracuse University. Mr. O'Hanley also chairs the Council on Asset Management for the Financial Services Roundtable and is a member of the Board of Directors of Institutional Investor's U.S. Institute. |
* Trustees have been determined to be "Interested Trustees" by virtue of, among other things, their affiliation with the trust or various entities under common control with FMR.
+ The information above includes each Trustee's principal occupation during the last five years and other information relating to the experience, attributes, and skills relevant to each Trustee's qualifications to serve as a Trustee, which led to the conclusion that each Trustee should serve as a Trustee for the fund.
Annual Report
Trustees and Officers - continued
Independent Trustees:
Correspondence intended for each Independent Trustee (that is, the Trustees other than the Interested Trustees) may be sent to Fidelity Investments, P.O. Box 55235, Boston, Massachusetts 02205-5235.
Name, Age; Principal Occupations and Other Relevant Experience+ |
Dennis J. Dirks (64) |
| Year of Election or Appointment: 2005 Prior to his retirement in May 2003, Mr. Dirks was Chief Operating Officer and a member of the Board of The Depository Trust & Clearing Corporation (DTCC). He also served as President, Chief Operating Officer, and Board member of The Depository Trust Company (DTC) and President and Board member of the National Securities Clearing Corporation (NSCC). In addition, Mr. Dirks served as Chief Executive Officer and Board member of the Government Securities Clearing Corporation, Chief Executive Officer and Board member of the Mortgage-Backed Securities Clearing Corporation, as a Trustee and a member of the Finance Committee of Manhattan College (2005-2008), and as a Trustee and a member of the Finance Committee of AHRC of Nassau County (2006-2008). Mr. Dirks is a member of the Independent Directors Council (IDC) Governing Council (2010-present) and Board of Directors for The Brookville Center for Children's Services, Inc. (2009-present). |
Alan J. Lacy (58) |
| Year of Election or Appointment: 2008 Mr. Lacy serves as Senior Adviser (2007-present) of Oak Hill Capital Partners, L.P. (private equity). Mr. Lacy also served as Chief Executive Officer (2000-2005) and Vice Chairman (2005-2006) of Sears Holdings Corporation and Sears, Roebuck and Co. (retail). In addition, Mr. Lacy serves as a member of the Board of Directors of Dave & Buster's Entertainment, Inc. (restaurant and entertainment complexes, 2010-present), Earth Fare, Inc. (retail grocery, 2012-present), The Hillman Companies, Inc. (hardware wholesalers, 2010-present), and Bristol-Myers Squibb Company (global pharmaceuticals, 2007-present). Mr. Lacy is a member of the Board of Trustees of The National Parks Conservation Association (2006-present). Previously, Mr. Lacy served as Chairman of the Board of Trustees of the National Parks Conservation Association (2008-2011) and as a member of the Board of Directors for the Western Union Company (global money transfer, 2006-2011). |
Ned C. Lautenbach (68) |
| Year of Election or Appointment:2000 Mr. Lautenbach is Chairman of the Independent Trustees of the Equity and High Income Funds (2006-present). Mr. Lautenbach currently serves as the Lead Director of the Eaton Corporation Board of Directors (diversified industrial, 1997-present). Mr. Lautenbach is Chairman of the Board of Directors of the Philharmonic Center for the Arts in Naples, Florida (2012-present); and a member of the Council on Foreign Relations (1994-present). Previously, Mr. Lautenbach was a Partner/Advisory Partner at Clayton, Dubilier & Rice, LLC (private equity investment, 1998-2010), as well as a Director of Sony Corporation (2006-2007). |
Joseph Mauriello (67) |
| Year of Election or Appointment: 2008 Prior to his retirement in January 2006, Mr. Mauriello served in numerous senior management positions including Deputy Chairman and Chief Operating Officer (2004-2005), and Vice Chairman of Financial Services (2002-2004) of KPMG LLP US (professional services, 1965-2005). Mr. Mauriello currently serves as a member of the Board of Directors of XL Group plc. (global insurance and re-insurance, 2006-present). Previously, Mr. Mauriello served as a Director of the Hamilton Funds of the Bank of New York (2006-2007) and of Arcadia Resources Inc. (health care services and products, 2007-2012). |
Robert W. Selander (61) |
| Year of Election or Appointment: 2011 Previously, Mr. Selander served as a Member of the Advisory Board of Fidelity's Equity and High Income Funds (2011), Executive Vice Chairman (2010), Chief Executive Officer (2009-2010), and President and Chief Executive Officer (1997-2009) of Mastercard, Inc. |
Cornelia M. Small (68) |
| Year of Election or Appointment: 2005 Ms. Small is a member of the Board of Directors of the Teagle Foundation (2009-present). Ms. Small is also a member of the Investment Committee, and Chair (2008-present) and a member of the Board of Trustees of Smith College. In addition, Ms. Small serves on the Investment Committee of the Berkshire Taconic Community Foundation (2008-present). Previously, Ms. Small served as Chairperson of the Investment Committee (2002-2008) of Smith College. In addition, Ms. Small served as Chief Investment Officer, Director of Global Equity Investments, and a member of the Board of Directors of Scudder, Stevens & Clark and Scudder Kemper Investments. |
William S. Stavropoulos (73) |
| Year of Election or Appointment: 2001 Mr. Stavropoulos is Vice Chairman of the Independent Trustees of the Equity and High Income Funds (2006-present). Mr. Stavropoulos serves as President and Founder of the Michigan Baseball Foundation, the Great Lakes Loons (2007-present). Mr. Stavropoulos is Chairman Emeritus of the Board of Directors of The Dow Chemical Company, where he previously served in numerous senior management positions, including President, CEO (1995-2000; 2002-2004), Chairman of the Executive Committee (2000-2006), and as a member of the Board of Directors (1990-2006). Currently, Mr. Stavropoulos is Chairman of Univar (global distributor of commodity and specialty chemicals, 2010-present), a Director of Teradata Corporation (data warehousing and technology solutions, 2008-present), Chemical Financial Corporation, Maersk Inc. (industrial conglomerate), Tyco International, Inc. (multinational manufacturing and services, 2007-present), and a member of the Advisory Board for Metalmark Capital (private equity investment, 2005-present). Mr. Stavropoulos is a special advisor to Clayton, Dubilier & Rice, LLC (private equity investment). In addition, Mr. Stavropoulos is a member of the University of Notre Dame Advisory Council for the College of Science. |
David M. Thomas (63) |
| Year of Election or Appointment: 2008 Previously, Mr. Thomas served as Executive Chairman (2005-2006) and Chairman and Chief Executive Officer (2000-2005) of IMS Health, Inc. (pharmaceutical and healthcare information solutions). In addition, Mr. Thomas serves as a member of the Board of Directors of Fortune Brands, Inc. (consumer products), and Interpublic Group of Companies, Inc. (marketing communication, 2004-present). |
Michael E. Wiley (61) |
| Year of Election or Appointment:2008 Mr. Wiley also serves as a Director of Asia Pacific Exploration Consolidated (international oil and gas exploration and production, 2008-present). Mr. Wiley serves as a Director of Tesoro Corporation (independent oil refiner and marketer, 2005-present), and a Director of Bill Barrett Corporation (exploration and production, 2005-present). In addition, Mr. Wiley also serves as a Director of Post Oak Bank (privately-held bank, 2004-present). Previously, Mr. Wiley served as a member of the Board of Trustees of the University of Tulsa (2000-2006; 2007-2010), as a Senior Energy Advisor of Katzenbach Partners, LLC (consulting, 2006-2007), as an Advisory Director of Riverstone Holdings (private investment), Chairman, President, and CEO of Baker Hughes, Inc. (oilfield services, 2000-2004), and as Director of Spinnaker Exploration Company (exploration and production, 2001-2005). |
Annual Report
+ The information above includes each Trustee's principal occupation during the last five years and other information relating to the experience, attributes, and skills relevant to each Trustee's qualifications to serve as a Trustee, which led to the conclusion that each Trustee should serve as a Trustee for the fund.
Advisory Board Members and Executive Officers:
Correspondence intended for David A. Rosow and Garnett A Smith may be sent to Fidelity Investments, P.O. Box 55235, Boston, Massachusetts 02205-5235. Correspondence intended for each executive officer, Edward C. Johnson 3d, and Peter S. Lynch may be sent to Fidelity Investments, 82 Devonshire Street, Boston, Massachusetts 02109.
Name, Age; Principal Occupation |
Edward C. Johnson 3d (82) |
| Year of Election or Appointment: 2011 Member of the Advisory Board of Fidelity's Equity and High Income Funds. Mr. Johnson serves as Chief Executive Officer, Chairman, and a Director of FMR LLC, and also serves as Chairman and Director of FIL Limited. Previously, Mr. Johnson served as a Trustee and Chairman of the Board of certain Fidelity Trusts, Chairman and a Director of FMR, Chairman and a Director of FMR Co., Inc., and President of FMR LLC (2006-2007). |
Peter S. Lynch (68) |
| Year of Election or Appointment: 2003 Member of the Advisory Board of Fidelity's Equity and High Income Funds. Mr. Lynch is Vice Chairman and a Director of FMR and FMR Co., Inc. In addition, Mr. Lynch serves as a Trustee of Boston College and as the Chairman of the Inner-City Scholarship Fund. Previously, Mr. Lynch served on the Special Olympics International Board of Directors (1997-2006). |
David A. Rosow (69) |
| Year of Election or Appointment: 2012 Member of the Advisory Board of Fidelity's Equity and High Income Funds. Chairman and Chief Executive Officer of International Golf Group, Inc. (golf course development, 1990-present). Previously, Mr. Rosow served as Chairman and Chief Executive Officer of Rosow & Company, Inc. (private investment company, 1989-2011), a Lead Director of Hudson United Bancorp (2001-2006) and as a Director of TD Banknorth (1996-2006). In addition, Mr. Rosow is a member (2008-present) and President (2009-present) of the Town Council of Palm Beach, Florida. |
Garnett A. Smith (64) |
| Year of Election or Appointment: 2012 Member of the Advisory Board of Fidelity's Equity and High Income Funds. Prior to Mr. Smith's retirement, he served as Chairman and Chief Executive Officer of Inbrand Corp. (manufacturer of personal absorbent products, 1990-1997). He also served as President (1986-1990) of Inbrand Corp. Prior to his employment with Inbrand Corp., he was employed by a retail fabric chain and North Carolina National Bank. In addition, Mr. Smith is a board member of the Jackson Hole Land Trust (2009-present). |
Kenneth B. Robins (42) |
| Year of Election or Appointment: 2008 President and Treasurer of Fidelity's Equity and High Income Funds. Mr. Robins also serves as President and Treasurer (2010-present) and Assistant Treasurer (2009-present) of other Fidelity funds and is an employee of Fidelity Investments (2004-present). Previously, Mr. Robins served as Deputy Treasurer of the Fidelity funds (2005-2008) and Treasurer and Chief Financial Officer of The North Carolina Capital Management Trust: Cash and Term Portfolios (2006-2008). |
Brian B. Hogan (47) |
| Year of Election or Appointment: 2009 Vice President of Equity and High Income Funds. Mr. Hogan also serves as President of FMR's Equity Division (2009-present). Previously, Mr. Hogan served as Senior Vice President, Equity Research of FMR (2006-2009) and as a portfolio manager. |
Christopher S. Bartel (40) |
| Year of Election or Appointment: 2009 Vice President of Fidelity's Sector and Real Estate Equity Funds. Mr. Bartel also serves as a Director, President, and Chief Executive Officer of Fidelity Management & Research (Japan) Inc. (2012-present), a Director of Fidelity Management & Research (Hong Kong) (2012-present), and Senior Vice President of Global Equity Research (2010-present). Previously, Mr. Bartel served as Senior Vice President of Equity Research (2009-2010), Managing Director of Research (2006-2009), and an analyst and portfolio manager (2000-2006). |
Scott C. Goebel (44) |
| Year of Election or Appointment: 2008 Secretary and Chief Legal Officer (CLO) of the Fidelity funds. Mr. Goebel also serves as Secretary of Fidelity Investments Money Management, Inc. (FIMM) (2010-present) and Fidelity Research and Analysis Company (FRAC) (2010-present); Secretary and CLO of The North Carolina Capital Management Trust: Cash and Term Portfolios (2008-present); General Counsel, Secretary, and Senior Vice President of FMR (2008-present) and FMR Co., Inc. (2008-present); employed by FMR LLC or an affiliate (2001-present); Chief Legal Officer of Fidelity Management & Research (Hong Kong) Limited (2008-present) and Assistant Secretary of Fidelity Management & Research (Japan) Inc. (2008-present), and Fidelity Management & Research (U.K.) Inc. (2008-present). Previously, Mr. Goebel served as Assistant Secretary of FIMM (2008-2010), FRAC (2008-2010), and the Funds (2007-2008) and as Vice President and Secretary of Fidelity Distributors Corporation (FDC) (2005-2007). |
William C. Coffey (43) |
| Year of Election or Appointment: 2009 Assistant Secretary of Fidelity's Equity and High Income Funds. Mr. Coffey also serves as Senior Vice President and Deputy General Counsel of FMR LLC (2010-present), and is an employee of Fidelity Investments. Previously, Mr. Coffey served as Vice President and Associate General Counsel of FMR LLC (2005-2009). |
Elizabeth Paige Baumann (44) |
| Year of Election or Appointment: 2012 Anti-Money Laundering (AML) Officer of the Fidelity funds. Ms. Baumann also serves as AML Officer of The North Carolina Capital Management Trust: Cash and Term Portfolios (2012-present), Chief AML Officer of FMR LLC (2012-present), and is an employee of Fidelity Investments. Previously, Ms. Baumann served as Vice President and Deputy Anti-Money Laundering Officer (2007-2012). |
Christine Reynolds (53) |
| Year of Election or Appointment: 2008 Chief Financial Officer of the Fidelity funds. Ms. Reynolds became President of Fidelity Pricing and Cash Management Services (FPCMS) in August 2008. Ms. Reynolds served as Chief Operating Officer of FPCMS (2007-2008). Previously, Ms. Reynolds served as President, Treasurer, and Anti-Money Laundering officer of the Fidelity funds (2004-2007). |
Joseph A. Hanlon (44) |
| Year of Election or Appointment: 2012 Chief Compliance Officer of Fidelity's Equity and High Income Funds. Mr. Hanlon serves as Compliance Officer of FMR, FMR Co., Inc., Fidelity Investments Money Management, Inc. (FIMM), Fidelity Research and Analysis Company (FRAC), Fidelity Management & Research (Japan) Inc., Fidelity Management & Research (U.K.) Inc., Fidelity Management & Research (Hong Kong), and Strategic Advisers, Inc. (2009-present), as Senior Vice President of the Fidelity Asset Management Division (2009-present), and is an employee of Fidelity Investments. |
Joseph F. Zambello (55) |
| Year of Election or Appointment: 2011 Deputy Treasurer of the Fidelity funds. Mr. Zambello is an employee of Fidelity Investments. Previously, Mr. Zambello served as Vice President of FMR's Program Management Group (2009-2011) and Vice President of the Transfer Agent Oversight Group (2005-2009). |
Adrien E. Deberghes (44) |
| Year of Election or Appointment: 2008 Deputy Treasurer of Fidelity's Equity and High Income Funds. Mr. Deberghes also serves as Vice President (2011-present) and Assistant Treasurer (2010-present) of other Fidelity funds, and is an employee of Fidelity Investments (2008-present). Previously, Mr. Deberghes served as Senior Vice President of Mutual Fund Administration at State Street Corporation (2007-2008), Senior Director of Mutual Fund Administration at Investors Bank & Trust (2005-2007), and Director of Finance for Dunkin' Brands (2000-2005). |
Stephanie J. Dorsey (43) |
| Year of Election or Appointment: 2010 Assistant Treasurer of Fidelity's Equity and High Income Funds. Ms. Dorsey also serves as Deputy Treasurer of other Fidelity funds (2008-present) and is an employee of Fidelity Investments (2008-present). Previously, Ms. Dorsey served as Treasurer (2004-2008) of the JPMorgan Mutual Funds and Vice President (2004-2008) of JPMorgan Chase Bank. |
John R. Hebble (54) |
| Year of Election or Appointment: 2009 Assistant Treasurer of Fidelity's Equity and High Income Funds. Mr. Hebble also serves as President (2011-present), Treasurer, and Chief Financial Officer of The North Carolina Capital Management Trust: Cash and Term Portfolios (2008-present), President and Treasurer of other Fidelity funds (2008-present) and is an employee of Fidelity Investments. |
Gary W. Ryan (53) |
| Year of Election or Appointment: 2005 Assistant Treasurer of the Fidelity funds. Mr. Ryan is an employee of Fidelity Investments. Previously, Mr. Ryan served as Vice President of Fund Reporting in Fidelity Pricing and Cash Management Services (FPCMS) (1999-2005). |
Jonathan Davis (44) |
| Year of Election or Appointment: 2010 Assistant Treasurer of the Fidelity funds. Mr. Davis is also Assistant Treasurer of Fidelity Rutland Square Trust II and Fidelity Commonwealth Trust II. Mr. Davis is an employee of Fidelity Investments. Previously, Mr. Davis served as Vice President and Associate General Counsel of FMR LLC (2003-2010). |
Annual Report
A total of 0.05% of the dividends distributed during the fiscal year was derived from interest on U.S. Government securities which is generally exempt from state income tax.
The fund will notify shareholders in January 2013 of amounts for use in preparing 2012 income tax returns.
Annual Report
Board Approval of Investment Advisory Contracts and Management Fees
Fidelity Advisor Real Estate Fund
Each year, the Board of Trustees, including the Independent Trustees (together, the Board), votes on the renewal of the management contract and sub-advisory agreements (together, the Advisory Contracts) for the fund. The Board, assisted by the advice of fund counsel and Independent Trustees' counsel, requests and considers a broad range of information relevant to the renewal of the Advisory Contracts throughout the year.
The Board meets regularly and, at each of its meetings, considers factors that are relevant to its annual consideration of the renewal of the fund's Advisory Contracts, including the services and support provided to the fund and its shareholders. The Board has established various standing committees, each composed of and chaired by Independent Trustees with varying backgrounds, to which the Board has assigned specific subject matter responsibilities in order to enhance effective decision-making by the Board. The Board, acting directly and through its Committees, requests and receives information concerning the annual consideration of the renewal of the fund's Advisory Contracts. The Board also meets as needed to consider matters specifically related to the Board's annual consideration of the renewal of Advisory Contracts. Members of the Board may also meet with trustees of other Fidelity funds through ad hoc joint committees to discuss certain matters relevant to the Fidelity funds.
At its July 2012 meeting, the Board of Trustees, including the Independent Trustees, unanimously determined to renew the fund's Advisory Contracts. In reaching its determination, the Board considered all factors it believed relevant, including (i) the nature, extent, and quality of the services to be provided to the fund and its shareholders (including the investment performance of the fund); (ii) the competitiveness of the fund's management fee and total expense ratio relative to peer funds; (iii) the total costs of the services to be provided by and the profits to be realized by Fidelity from its relationship with the fund; (iv) the extent to which economies of scale exist and would be realized as the fund grows; and (v) whether fee levels reflect these economies of scale, if any, for the benefit of fund shareholders.
In considering whether to renew the Advisory Contracts for the fund, the Board reached a determination, with the assistance of fund counsel and Independent Trustees' counsel and through the exercise of its business judgment, that the renewal of the Advisory Contracts is in the best interests of the fund and its shareholders and that the compensation payable under the Advisory Contracts is fair and reasonable. The Board's decision to renew the Advisory Contracts was not based on any single factor, but rather was based on a comprehensive consideration of all the information provided to the Board at its meetings throughout the year. The Board, in reaching its determination to renew the Advisory Contracts, is aware that shareholders in the fund have a broad range of investment choices available to them, including a wide choice among mutual funds offered by Fidelity's competitors, and that the fund's shareholders, who have the opportunity to review and weigh the disclosure provided by the fund in its prospectus and other public disclosures, have chosen to invest in this fund, managed by Fidelity.
Annual Report
Board Approval of Investment Advisory Contracts and
Management Fees - continued
Nature, Extent, and Quality of Services Provided. The Board considered the staffing within the investment adviser, FMR, and the sub-advisers (together, the Investment Advisers), including the backgrounds of the fund's investment personnel, and also considered the fund's investment objective, strategies, and related investment philosophy. The Independent Trustees also had discussions with senior management of Fidelity's investment operations and investment groups. The Board considered the structure of the portfolio manager compensation program and whether this structure provides appropriate incentives to act in the best interests of the fund.
Resources Dedicated to Investment Management and Support Services. The Board and the Fund Oversight and Research Committees reviewed the general qualifications and capabilities of the Investment Advisers' investment staff, including its size, education, experience, and resources, as well as the Investment Advisers' approach to recruiting, training, managing, and compensating investment personnel. The Board also noted that FMR has continued to increase the resources devoted to non-U.S. offices, including expansion of Fidelity's global investment organization. The Board noted that Fidelity's analysts have extensive resources, tools and capabilities that allow them to conduct sophisticated quantitative and fundamental analysis, as well as credit analysis of issuers, counterparties and guarantors. The Board also believes that Fidelity's investment professionals have sufficient access to global information and data so as to provide competitive investment results over time, and that those professionals also have access to sophisticated tools that permit them to assess portfolio construction and risk and performance attribution characteristics continuously, as well as to transmit new information and research conclusions rapidly around the world. Additionally, in its deliberations, the Board considered the Investment Advisers' trading and risk management capabilities and resources, which are an integral part of the investment management process.
Shareholder and Administrative Services. The Board considered (i) the nature, extent, quality, and cost of advisory, administrative, and shareholder services performed by the Investment Advisers and their affiliates under the Advisory Contracts and under separate agreements covering transfer agency, pricing and bookkeeping, and securities lending services for the fund; (ii) the nature and extent of the supervision of third party service providers, principally custodians and subcustodians; and (iii) the resources devoted to, and the record of compliance with, the fund's compliance policies and procedures. The Board also reviewed the allocation of fund brokerage, including allocations to brokers affiliated with the Investment Advisers, the use of brokerage commissions to pay fund expenses, and the use of "soft" commission dollars to pay for research services.
Annual Report
The Board noted that the growth of fund assets over time across the complex allows Fidelity to reinvest in the development of services designed to enhance the value or convenience of the Fidelity funds as investment vehicles. These services include 24-hour access to account information and market information through telephone representatives and over the Internet, investor education materials and asset allocation tools, and the expanded availability of Fidelity Investor Centers.
Investment in a Large Fund Family. The Board considered the benefits to shareholders of investing in a Fidelity fund, including the benefits of investing in a fund that is part of a large family of funds offering a variety of investment disciplines and providing a large variety of mutual fund investor services. The Board noted that Fidelity had taken, or had made recommendations that resulted in the Fidelity funds taking, a number of actions over the previous year that benefited particular funds, including (i) continuing to dedicate additional resources to investment research and support of the senior management team that oversees asset management; (ii) persisting in efforts to enhance Fidelity's research capabilities, in particular, international research; (iii) launching new funds and making other enhancements to meet client needs for global and income-oriented solutions; (iv) continuing to launch dedicated lower cost underlying funds to meet investment management's portfolio construction needs related to expanding underlying fund options, specifically for the Freedom Fund product lines; (v) adopting a "Stock Selector" sector neutral investment approach and employing a team of portfolio managers who are sector specialists to manage certain funds; (vi) rationalizing product lines and gaining increased efficiencies through the mergers of several funds into other funds; (vii) strengthening the Spartan Index Fund product line by adding new funds and/or new low-cost institutional share classes, restructuring fund expenses to accommodate new classes, and reducing investment minimums for certain classes of shares; (viii) modifying the eligibility criteria for Institutional Class shares to increase their appeal to government entities and charitable investors; and (ix) reducing certain transfer agent fee rates.
Investment Performance. The Board considered whether the fund has operated in accordance with its investment objective, as well as its record of compliance with its investment restrictions. It also reviewed the fund's absolute investment performance for each class, as well as the fund's relative investment performance for each class measured over multiple periods against a broad-based securities market index. The Board noted that FMR believes that no meaningful peer group exists for the fund principally because most other funds in the fund's third-party peer group focus on different industries or sectors than the fund. The following charts considered by the Board show, over the one-, three-, and five-year periods ended December 31, 2011, the cumulative total returns of Institutional Class (Class I) and Class C of the fund and the cumulative total returns of a broad-based securities market index ("benchmark"). The returns of Institutional Class (Class I) and Class C show the performance of the highest and lowest performing classes, respectively (based on five-year performance).
Annual Report
Board Approval of Investment Advisory Contracts and
Management Fees - continued
Fidelity Advisor Real Estate Fund
The Board noted that the investment performance of Institutional Class (Class I) of the fund compared favorably to its benchmark for the three- and five-year periods, although the fund's one-year total return was lower than its benchmark. The Board considered that the variations in performance among the fund's classes reflect the variations in class expenses, which result in lower performance for higher expense classes. The Board also reviewed the fund's performance since inception as well as performance in the current year.
Based on its review, the Board concluded that the nature, extent, and quality of services provided to the fund under the Advisory Contracts should benefit the fund's shareholders.
Competitiveness of Management Fee and Total Expense Ratio. The Board considered the fund's management fee and total expense ratio compared to "mapped groups" of competitive funds and classes. Fidelity creates "mapped groups" by combining similar Lipper investment objective categories that have comparable management fee characteristics. Combining Lipper investment objective categories aids the Board's management fee and total expense ratio comparisons by broadening the competitive group used for comparison and by reducing the number of universes to which various Fidelity funds are compared.
Annual Report
Management Fee. The Board considered two proprietary management fee comparisons for the 12-month periods shown in the chart below. The group of Lipper funds used by the Board for management fee comparisons is referred to below as the "Total Mapped Group." The Total Mapped Group comparison focuses on a fund's standing relative to the total universe of comparable funds available to investors in terms of gross management fees before expense reimbursements or caps. "TMG %" represents the percentage of funds in the Total Mapped Group that had management fees that were lower than the fund's. For example, a TMG % of 6% means that 94% of the funds in the Total Mapped Group had higher management fees than the fund. The "Asset-Size Peer Group" (ASPG) comparison focuses on a fund's standing relative to non-Fidelity funds similar in size to the fund within the Total Mapped Group. The ASPG represents at least 15% of the funds in the Total Mapped Group with comparable asset size and management fee characteristics, subject to a minimum of 50 funds (or all funds in the Total Mapped Group if fewer than 50). Additional information, such as the ASPG quartile in which the fund's management fee ranked, is also included in the chart and considered by the Board.
Fidelity Advisor Real Estate Fund

The Board noted that the fund's management fee ranked below the median of its Total Mapped Group and below the median of its ASPG for 2011.
Based on its review, the Board concluded that the fund's management fee is fair and reasonable in light of the services that the fund receives and the other factors considered.
Total Expense Ratio. In its review of each class's total expense ratio, the Board considered the fund's management fee as well as other fund or class expenses, as applicable, such as transfer agent fees, pricing and bookkeeping fees, fund-paid 12b-1 fees, and custodial, legal, and audit fees. The Board also noted the effects of any waivers and reimbursements on fees and expenses. As part of its review, the Board also considered the current and historical total expense ratios of each class of the fund compared to competitive fund median expenses. Each class of the fund is compared to those funds and classes in the Total Mapped Group (used by the Board for management fee comparisons) that have a similar sales load structure.
Annual Report
Board Approval of Investment Advisory Contracts and
Management Fees - continued
The Board noted that the total expense ratio of each of Class A, Class B, Class C, and Institutional Class ranked below its competitive median for 2011 and the total expense ratio of Class T ranked equal to its competitive median for 2011.
Fees Charged to Other Fidelity Clients. The Board also considered Fidelity fee structures and other information with respect to clients of FMR and its affiliates, such as other mutual funds advised or subadvised by FMR or its affiliates, pension plan clients, and other institutional clients. The Board noted the findings of the 2010 ad hoc joint committee (created with the board of other Fidelity funds), which reviewed and compared Fidelity's institutional investment advisory business with its business of providing services to the Fidelity funds, including the differences in services provided, fees charged, and costs incurred, as well as competition in their respective marketplaces.
Based on its review of total expense ratios and fees charged to other Fidelity clients, the Board concluded that the total expense ratio of each class of the fund was reasonable in light of the services that the fund and its shareholders receive and the other factors considered.
Costs of the Services and Profitability. The Board considered the revenues earned and the expenses incurred by Fidelity in conducting the business of developing, marketing, distributing, managing, administering and servicing the fund and its shareholders. The Board also considered the level of Fidelity's profits in respect of all the Fidelity funds.
On an annual basis, FMR presents to the Board Fidelity's profitability for the fund. Fidelity calculates the profitability for each fund, as well as aggregate profitability for groups of Fidelity funds and all Fidelity funds, using a series of detailed revenue and cost allocation methodologies which originate with the books and records of Fidelity on which Fidelity's audited financial statements are based. The Audit Committee of the Board reviews any significant changes from the prior year's methodologies.
PricewaterhouseCoopers LLP (PwC), independent registered public accounting firm and auditor to Fidelity and certain Fidelity funds, has been engaged annually by the Board as part of the Board's assessment of Fidelity's profitability analysis. PwC's engagement includes the review and assessment of Fidelity's methodologies used in determining the revenues and expenses attributable to Fidelity's mutual fund business, and completion of agreed-upon procedures surrounding the mathematical accuracy of fund profitability and its conformity to allocation methodologies. After considering PwC's reports issued under the engagement and information provided by Fidelity, the Board concluded that while other allocation methods may also be reasonable, Fidelity's profitability methodologies are reasonable in all material respects.
Annual Report
The Board also reviewed Fidelity's non-fund businesses and fall-out benefits related to the mutual fund business as well as cases where Fidelity's affiliates may benefit from or be related to the fund's business.
The Board considered the costs of the services provided by and the profits realized by Fidelity in connection with the operation of the fund and was satisfied that the profitability was not excessive in the circumstances.
Economies of Scale. The Board considered whether there have been economies of scale in respect of the management of the Fidelity funds, whether the Fidelity funds (including the fund) have appropriately benefited from any such economies of scale, and whether there is potential for realization of any further economies of scale. The Board considered the extent to which the fund will benefit from economies of scale through increased services to the fund, through waivers or reimbursements, or through fee or expense reductions. The Board also noted that in 2009, it and the board of other Fidelity funds created an ad hoc committee (the Economies of Scale Committee) to analyze whether FMR attains economies of scale in respect of the management and servicing of the Fidelity funds, whether the Fidelity funds have appropriately benefited from such economies of scale, and whether there is potential for realization of any further economies of scale.
The Board recognized that the fund's management contract incorporates a "group fee" structure, which provides for lower group fee rates as total fund assets under FMR's management increase, and for higher group fee rates as total fund assets under FMR's management decrease. FMR calculates the group fee rates based on a tiered asset "breakpoint" schedule that varies based on asset class. The Board considered that the group fee is designed to deliver the benefits of economies of scale to fund shareholders when total Fidelity fund assets increase, even if assets of any particular fund are unchanged or have declined, because some portion of Fidelity's costs are attributable to services provided to all Fidelity funds, and all funds benefit if those costs can be allocated among more assets. The Board concluded that, given the group fee structure, fund shareholders will benefit from lower management fees as assets under FMR's management increase at the fund complex level, regardless of whether Fidelity achieves any such economies of scale.
The Board concluded, taking into account the analysis of the Economies of Scale Committee, that economies of scale, if any, are being appropriately shared between fund shareholders and Fidelity.
Annual Report
Board Approval of Investment Advisory Contracts and
Management Fees - continued
Additional Information Requested by the Board. In order to develop fully the factual basis for consideration of the Fidelity funds' Advisory Contracts, the Board requested and received additional information on certain topics, including (i) fund performance trends, actions to be taken by FMR to improve certain funds' overall performance, and Fidelity's long-term strategies for certain funds; (ii) the potential to further rationalize the Fidelity fund lineup with the possibility of achieving savings for the funds and Fidelity; (iii) Fidelity's compensation structure for portfolio managers and other key investment personnel; (iv) the amount of the investment that each portfolio manager has made in the Fidelity fund(s) that he or she manages; (v) the realization of fall-out benefits in certain Fidelity business units; (vi) Fidelity's group fee structures, the potential impact of regulatory changes on such structures, and the rationale for the individual fee rates of certain funds; (vii) fund profitability methodology, including Fidelity's cost allocation methodology, and the impact of certain factors on fund profitability results; (viii) trends regarding industry use of performance fee structures and the possibility of implementing performance fee structures for additional funds; and (ix) the impact of net redemptions from the Fidelity funds.
Based on its evaluation of all of the conclusions noted above, and after considering all factors it believed relevant, the Board ultimately concluded that the advisory fee structures are fair and reasonable, and that the fund's Advisory Contracts should be renewed.
Annual Report
Investment Adviser
Fidelity Management & Research Company
Boston, MA
Investment Sub-Advisers
FMR Co., Inc.
Fidelity Management & Research
(Hong Kong) Limited
Fidelity Management & Research
(Japan) Inc.
Fidelity Management & Research
(U.K.) Inc.
General Distributor
Fidelity Distributors Corporation
Smithfield, RI
Transfer and Service Agents
Fidelity Investments Institutional Operations Company, Inc.
Boston, MA
Fidelity Service Company, Inc.
Boston, MA
Custodian
The Bank of New York Mellon
New York, NY
(Fidelity Investment logo)(registered trademark)
ARE-UANN-0912
1.789707.109
(Fidelity Investment logo)(registered trademark)
Fidelity Advisor®
Real Estate
Fund - Institutional Class
Annual Report
July 31, 2012
(Fidelity Cover Art)
Contents
Performance | (Click Here) | How the fund has done over time. |
Management's Discussion of Fund Performance | (Click Here) | The Portfolio Manager's review of fund performance and strategy. |
Shareholder Expense Example | (Click Here) | An example of shareholder expenses. |
Investment Changes | (Click Here) | A summary of major shifts in the fund's investments over the past six months. |
Investments | (Click Here) | A complete list of the fund's investments with their market values. |
Financial Statements | (Click Here) | Statements of assets and liabilities, operations, and changes in net assets, as well as financial highlights. |
Notes | (Click Here) | Notes to financial statements. |
Report of Independent Registered Public Accounting Firm | (Click Here) | |
Trustees and Officers | (Click Here) | |
Distributions | (Click Here) | |
Board Approval of Investment Advisory Contracts and Management Fees | (Click Here) | |
To view a fund's proxy voting guidelines and proxy voting record for the 12-month period ended June 30, visit http://www.fidelity.com/proxyvotingresults or visit the Securities and Exchange Commission's (SEC) web site at http://www.sec.gov. You may also call 1-877-208-0098 to request a free copy of the proxy voting guidelines.
Standard & Poor's, S&P and S&P 500 are registered service marks of The McGraw-Hill Companies, Inc. and have been licensed for use by Fidelity Distributors Corporation.
Other third party marks appearing herein are the property of their respective owners.
All other marks appearing herein are registered or unregistered trademarks or service marks of FMR LLC or an affiliated company. © 2012 FMR LLC. All rights reserved.
Annual Report
This report and the financial statements contained herein are submitted for the general information of the shareholders of the fund. This report is not authorized for distribution to prospective investors in the fund unless preceded or accompanied by an effective prospectus.
A fund files its complete schedule of portfolio holdings with the SEC for the first and third quarters of each fiscal year on Form N-Q. Forms N-Q are available on the SEC's web site at http://www.sec.gov. A fund's Forms N-Q may be reviewed and copied at the SEC's Public Reference Room in Washington, DC. Information regarding the operation of the SEC's Public Reference Room may be obtained by calling 1-800-SEC-0330. For a complete list of a fund's portfolio holdings, view the most recent holdings listing, semiannual report, or annual report on Fidelity's web site at http://www.fidelity.com, http://www.advisor.fidelity.com, or http://www.401k.com, as applicable.
NOT FDIC INSURED • MAY LOSE VALUE • NO BANK GUARANTEE
Neither the fund nor Fidelity Distributors Corporation is a bank.
Annual Report
Average annual total return reflects the change in the value of an investment, assuming reinvestment of the class' distributions from dividend income and capital gains (the profits earned upon the sale of securities that have grown in value, if any) and assuming a constant rate of performance each year. The $10,000 table and the fund's returns do not reflect the deduction of taxes that a shareholder would pay on fund distributions or the redemption of fund shares. During periods of reimbursement by Fidelity, a fund's total return will be greater than it would be had the reimbursement not occurred. How a fund did yesterday is no guarantee of how it will do tomorrow.
Average Annual Total Returns
Periods ended July 31, 2012 | Past 1
year | Past 5
years | Life of
fund A |
Institutional Class | 13.12% | 5.04% | 12.06% |
A From September 12, 2002.
$10,000 Over Life of Fund
Let's say hypothetically that $10,000 was invested in Fidelity Advisor® Real Estate Fund - Institutional Class on September 12, 2002, when the fund started. The chart shows how the value of your investment would have changed, and also shows how the S&P 500® Index performed over the same period.
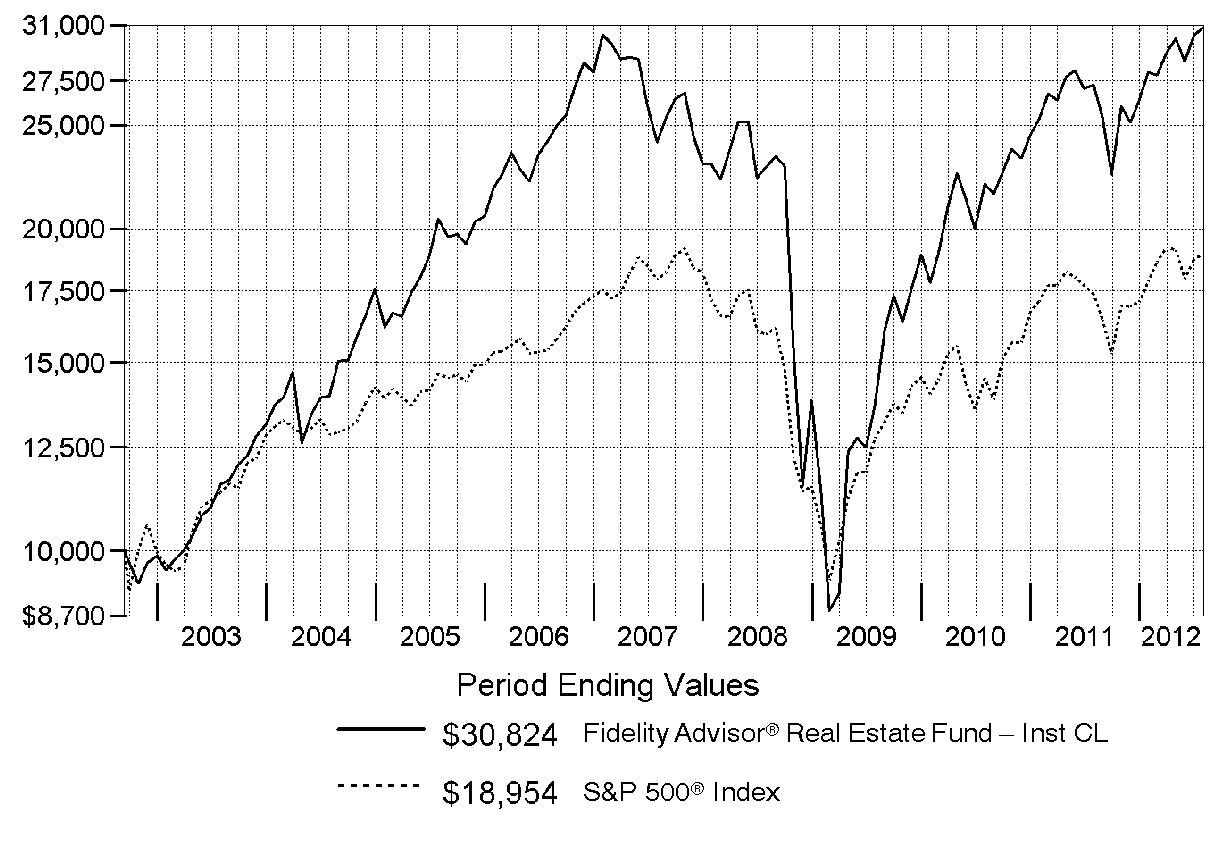
Annual Report
Market Recap: Major U.S. equity benchmarks posted solid gains for the year ending July 31, 2012, amid an uncertain investment environment. The broad-based S&P 500® Index returned 9.13%, while the blue-chip-laden Dow Jones Industrial AverageSM and technology-heavy Nasdaq Composite® Index gained 10.12% and 7.83%, respectively. Volatility spiked during the period's first half, as equities plummeted late last summer on Europe's debt woes, political wrangling over the U.S. debt ceiling, and the sovereign credit-rating downgrade that followed. By October, a seemingly improved U.S. economy rejuvenated stocks, paving the way for major equity benchmarks to post their best first-quarter performance since 1998. However, more eurozone trouble, signs that the U.S. economy had turned sluggish and a slowdown in China caused stocks to slip in May, before a new wave of optimism took hold in June and July. Within the S&P 500®, more-defensive sectors such as telecommunication services (+30%) and consumer staples (+20%) fared best, while materials and energy significantly underperformed, returning -5%. Small- and mid-cap stocks trailed their less-volatile large-cap counterparts, with the Russell 2000® Index adding 0.19% and the Russell Midcap® Index rising 2.28%. Given turmoil and local currency weakness in Europe, foreign developed-markets stocks lost ground, with the MSCI® EAFE® Index returning -11.32%.
Comments from Samuel Wald, Portfolio Manager of Fidelity Advisor® Real Estate Fund: For the 12 months ending July 31, 2012, the fund's Institutional Class shares gained 13.12%, compared with 12.88% for the Dow Jones U.S. Select Real Estate Securities IndexSM and the 9.13% rise of the S&P 500® Index. Relative to the Dow Jones real estate index, the fund's top individual contributor was Vornado Realty Trust, a diversified REIT that lagged and in which the fund was underweighted. The fund's stake in health care REIT Ventas did well, while maintaining lower-than-index exposure to Host Hotels & Resorts was helpful, as that stock lost ground early in the period. Other contributors of note included student housing REIT Education Realty Trust and self-storage leader Public Storage. On the negative side, two senior housing companies, Brookdale Senior Living and Emeritus, significantly underperformed and hampered the fund's results. In both cases, I felt these out-of-benchmark stocks were attractively valued compared to many health care REITs, such as HCP, a strong-performing index component that, unfortunately, I underweighted during the period. The biggest individual detractor during the past 12 months was SL Green Realty, an office properties REIT focused on the New York City market. Untimely positioning in Sunstone Hotel Investors, a hotel REIT, also hurt results, as did the fund's average cash position in a rising market.
The views expressed above reflect those of the portfolio manager(s) only through the end of the period as stated on the cover of this report and do not necessarily represent the views of Fidelity or any other person in the Fidelity organization. Any such views are subject to change at any time based upon market or other conditions and Fidelity disclaims any responsibility to update such views. These views may not be relied on as investment advice and, because investment decisions for a Fidelity fund are based on numerous factors, may not be relied on as an indication of trading intent on behalf of any Fidelity fund.
Annual Report
Shareholder Expense Example
As a shareholder of the Fund, you incur two types of costs: (1) transaction costs, including sales charges (loads) on purchase payments or redemption proceeds, and (2) ongoing costs, including management fees, distribution and/or service (12b-1) fees and other Fund expenses. This Example is intended to help you understand your ongoing costs (in dollars) of investing in the Fund and to compare these costs with the ongoing costs of investing in other mutual funds.
The Example is based on an investment of $1,000 invested at the beginning of the period and held for the entire period (February 1, 2012 to July 31, 2012).
Actual Expenses
The first line of the accompanying table for each class of the Fund provides information about actual account values and actual expenses. You may use the information in this line, together with the amount you invested, to estimate the expenses that you paid over the period. Simply divide your account value by $1,000.00 (for example, an $8,600 account value divided by $1,000.00 = 8.6), then multiply the result by the number in the first line for a class of the Fund under the heading entitled "Expenses Paid During Period" to estimate the expenses you paid on your account during this period. In addition, the Fund, as a shareholder in the underlying Fidelity Central Funds, will indirectly bear its pro-rata share of the fees and expenses incurred by the underlying Fidelity Central Funds. These fees and expenses are not included in the Fund's annualized expense ratio used to calculate the expense estimate in the table below.
Hypothetical Example for Comparison Purposes
The second line of the accompanying table for each class of the Fund provides information about hypothetical account values and hypothetical expenses based on a Class' actual expense ratio and an assumed rate of return of 5% per year before expenses, which is not the Class' actual return. The hypothetical account values and expenses may not be used to estimate the actual ending account balance or expenses you paid for the period. You may use this information to compare the ongoing costs of investing in the Fund and other funds. To do so, compare this 5% hypothetical example with the 5% hypothetical examples that appear in the shareholder reports of the other funds. In addition, the Fund, as a shareholder in the underlying Fidelity Central Funds, will indirectly bear its pro-rata share of the fees and expenses incurred by the underlying Fidelity Central Funds. These fees and expenses are not included in the Fund's annualized expense ratio used to calculate the expense estimate in the table below.
Please note that the expenses shown in the table are meant to highlight your ongoing costs only and do not reflect any transaction costs. Therefore, the second line of the table is useful in comparing ongoing costs only, and will not help you determine the relative total costs of owning different funds. In addition, if these transactional costs were included, your costs would have been higher.
Annual Report
| Annualized
Expense Ratio | Beginning
Account Value
February 1, 2012 | Ending
Account Value
July 31, 2012 | Expenses Paid
During Period*
February 1, 2012
to July 31, 2012 |
Class A | 1.17% | | | |
Actual | | $ 1,000.00 | $ 1,099.20 | $ 6.11 |
HypotheticalA | | $ 1,000.00 | $ 1,019.05 | $ 5.87 |
Class T | 1.41% | | | |
Actual | | $ 1,000.00 | $ 1,098.10 | $ 7.36 |
HypotheticalA | | $ 1,000.00 | $ 1,017.85 | $ 7.07 |
Class B | 1.92% | | | |
Actual | | $ 1,000.00 | $ 1,095.60 | $ 10.00 |
HypotheticalA | | $ 1,000.00 | $ 1,015.32 | $ 9.62 |
Class C | 1.91% | | | |
Actual | | $ 1,000.00 | $ 1,095.20 | $ 9.95 |
HypotheticalA | | $ 1,000.00 | $ 1,015.37 | $ 9.57 |
Institutional Class | .92% | | | |
Actual | | $ 1,000.00 | $ 1,101.30 | $ 4.81 |
HypotheticalA | | $ 1,000.00 | $ 1,020.29 | $ 4.62 |
A 5% return per year before expenses
* Expenses are equal to each Class' annualized expense ratio, multiplied by the average account value over the period, multiplied by 182/366 (to reflect the one-half year period).
Annual Report
Investment Changes (Unaudited)
Top Ten Stocks as of July 31, 2012 |
| % of fund's
net assets | % of fund's net assets
6 months ago |
Simon Property Group, Inc. | 13.1 | 11.3 |
Ventas, Inc. | 7.7 | 7.2 |
Public Storage | 6.6 | 7.5 |
Prologis, Inc. | 5.3 | 5.9 |
Boston Properties, Inc. | 5.1 | 4.5 |
SL Green Realty Corp. | 4.3 | 4.0 |
Essex Property Trust, Inc. | 4.2 | 3.8 |
Camden Property Trust (SBI) | 3.8 | 3.8 |
Digital Realty Trust, Inc. | 3.8 | 4.6 |
HCP, Inc. | 2.9 | 2.0 |
| 56.8 | |
Top Five REIT Sectors as of July 31, 2012 |
| % of fund's
net assets | % of fund's net assets
6 months ago |
REITs - Apartments | 17.6 | 17.2 |
REITs - Malls | 16.5 | 15.8 |
REITs - Office Buildings | 15.2 | 14.5 |
REITs - Industrial Buildings | 13.4 | 14.5 |
REITs - Health Care Facilities | 11.7 | 10.6 |
Asset Allocation (% of fund's net assets) |
As of July 31, 2012 * | As of January 31, 2012 ** |
 | Stocks 96.7% | | | Stocks 96.1% | |
 | Convertible
Securities 0.0% | |  | Convertible
Securities† 0.0% | |
 | Short-Term
Investments and
Net Other Assets
(Liabilities) 3.3% | | | Short-Term
Investments and
Net Other Assets
(Liabilities) 3.9% | |
* Foreign investments | 0.0% | | ** Foreign investments | 0.7% | |

† Amount represents less than 0.1%.
Annual Report
Investments July 31, 2012
Showing Percentage of Net Assets
Common Stocks - 96.7% |
| Shares | | Value |
HEALTH CARE PROVIDERS & SERVICES - 1.8% |
Health Care Facilities - 1.8% |
Brookdale Senior Living, Inc. (a) | 205,573 | | $ 3,383,732 |
Emeritus Corp. (a) | 365,665 | | 6,198,022 |
Sunrise Senior Living, Inc. (a)(d) | 296,292 | | 1,979,231 |
TOTAL HEALTH CARE FACILITIES | | 11,560,985 |
REAL ESTATE INVESTMENT TRUSTS - 93.9% |
REITs - Apartments - 17.6% |
Apartment Investment & Management Co. Class A | 234,766 | | 6,439,631 |
AvalonBay Communities, Inc. | 70,382 | | 10,352,488 |
Camden Property Trust (SBI) | 338,484 | | 24,137,294 |
Education Realty Trust, Inc. | 1,239,612 | | 14,528,253 |
Equity Residential (SBI) | 269,212 | | 17,043,812 |
Essex Property Trust, Inc. | 169,422 | | 26,660,246 |
Home Properties, Inc. | 42,470 | | 2,786,457 |
Post Properties, Inc. | 182,390 | | 9,420,444 |
TOTAL REITS - APARTMENTS | | 111,368,625 |
REITs - Health Care Facilities - 11.7% |
HCP, Inc. | 396,774 | | 18,731,701 |
Health Care REIT, Inc. | 77,335 | | 4,812,557 |
LTC Properties, Inc. | 50,000 | | 1,785,000 |
Ventas, Inc. | 722,969 | | 48,619,665 |
TOTAL REITS - HEALTH CARE FACILITIES | | 73,948,923 |
REITs - Hotels - 4.8% |
Chesapeake Lodging Trust | 458,598 | | 7,782,408 |
Host Hotels & Resorts, Inc. | 588,134 | | 8,633,807 |
LaSalle Hotel Properties (SBI) | 312,400 | | 8,203,624 |
Sunstone Hotel Investors, Inc. (a) | 588,191 | | 5,887,792 |
TOTAL REITS - HOTELS | | 30,507,631 |
REITs - Industrial Buildings - 13.4% |
DCT Industrial Trust, Inc. | 789,800 | | 4,944,148 |
First Potomac Realty Trust | 144,000 | | 1,668,960 |
Prologis, Inc. | 1,041,857 | | 33,683,237 |
Common Stocks - continued |
| Shares | | Value |
REAL ESTATE INVESTMENT TRUSTS - CONTINUED |
REITs - Industrial Buildings - continued |
Public Storage | 283,521 | | $ 42,230,453 |
Stag Industrial, Inc. | 183,600 | | 2,654,856 |
TOTAL REITS - INDUSTRIAL BUILDINGS | | 85,181,654 |
REITs - Malls - 16.5% |
CBL & Associates Properties, Inc. | 904,954 | | 17,854,742 |
Simon Property Group, Inc. | 519,000 | | 83,294,308 |
The Macerich Co. | 64,646 | | 3,775,973 |
TOTAL REITS - MALLS | | 104,925,023 |
REITs - Management/Investment - 3.9% |
Digital Realty Trust, Inc. (d) | 308,153 | | 24,057,505 |
Lexington Corporate Properties Trust | 91,600 | | 818,904 |
TOTAL REITS - MANAGEMENT/INVESTMENT | | 24,876,409 |
REITs - Mobile Home Parks - 0.6% |
Sun Communities, Inc. | 85,300 | | 3,974,127 |
REITs - Mortgage - 0.3% |
Newcastle Investment Corp. | 217,600 | | 1,621,120 |
REITs - Office Buildings - 15.2% |
Boston Properties, Inc. | 289,249 | | 32,077,714 |
Douglas Emmett, Inc. | 732,000 | | 17,209,320 |
Highwoods Properties, Inc. (SBI) | 437,325 | | 14,812,198 |
SL Green Realty Corp. | 343,365 | | 27,039,994 |
Sovran Self Storage, Inc. | 91,100 | | 5,201,810 |
TOTAL REITS - OFFICE BUILDINGS | | 96,341,036 |
REITs - Shopping Centers - 9.9% |
Acadia Realty Trust (SBI) | 485,400 | | 11,620,476 |
Cedar Shopping Centers, Inc. | 554,172 | | 2,853,986 |
DDR Corp. | 475,994 | | 7,158,950 |
Equity One, Inc. | 853,963 | | 18,522,457 |
Excel Trust, Inc. | 73,725 | | 902,394 |
Glimcher Realty Trust | 676,866 | | 6,782,197 |
Common Stocks - continued |
| Shares | | Value |
REAL ESTATE INVESTMENT TRUSTS - CONTINUED |
REITs - Shopping Centers - continued |
Kite Realty Group Trust | 490,131 | | $ 2,465,359 |
Vornado Realty Trust | 146,688 | | 12,248,448 |
TOTAL REITS - SHOPPING CENTERS | | 62,554,267 |
TOTAL REAL ESTATE INVESTMENT TRUSTS | | 595,298,815 |
REAL ESTATE MANAGEMENT & DEVELOPMENT - 1.0% |
Real Estate Operating Companies - 0.8% |
Forest City Enterprises, Inc. Class A (a) | 375,167 | | 5,293,606 |
Real Estate Services - 0.2% |
CBRE Group, Inc. (a) | 61,500 | | 958,170 |
TOTAL REAL ESTATE MANAGEMENT & DEVELOPMENT | | 6,251,776 |
TOTAL COMMON STOCKS (Cost $474,595,337) |
613,111,576
|
Money Market Funds - 5.5% |
| | | |
Fidelity Cash Central Fund, 0.17% (b) | 21,733,739 | | 21,733,739 |
Fidelity Securities Lending Cash Central Fund, 0.18% (b)(c) | 12,725,650 | | 12,725,650 |
TOTAL MONEY MARKET FUNDS (Cost $34,459,389) |
34,459,389
|
TOTAL INVESTMENT PORTFOLIO - 102.2% (Cost $509,054,726) | | 647,570,965 |
NET OTHER ASSETS (LIABILITIES) - (2.2)% | | (13,681,878) |
NET ASSETS - 100% | $ 633,889,087 |
Legend |
(a) Non-income producing |
(b) Affiliated fund that is available only to investment companies and other accounts managed by Fidelity Investments. The rate quoted is the annualized seven-day yield of the fund at period end. A complete unaudited listing of the fund's holdings as of its most recent quarter end is available upon request. In addition, each Fidelity Central Fund's financial statements, which are not covered by the Fund's Report of Independent Registered Public Accounting Firm, are available on the SEC's website or upon request. |
(c) Investment made with cash collateral received from securities on loan. |
(d) Security or a portion of the security is on loan at period end. |
Affiliated Central Funds |
Information regarding fiscal year to date income earned by the Fund from investments in Fidelity Central Funds is as follows: |
Fund | Income earned |
Fidelity Cash Central Fund | $ 24,707 |
Fidelity Securities Lending Cash Central Fund | 178,910 |
Total | $ 203,617 |
Other Information |
All investments are categorized as Level 1 under the Fair Value Hierarchy. The inputs or methodology used for valuing securities may not be an indication of the risk associated with investing in those securities. For more information on valuation inputs, please refer to the Security Valuation section in the accompanying Notes to Financial Statements. |
See accompanying notes which are an integral part of the financial statements.
Annual Report
Statement of Assets and Liabilities
| July 31, 2012 |
| | |
Assets | | |
Investment in securities, at value (including securities loaned of $12,329,531) - See accompanying schedule: Unaffiliated issuers (cost $474,595,337) | $ 613,111,576 | |
Fidelity Central Funds (cost $34,459,389) | 34,459,389 | |
Total Investments (cost $509,054,726) | | $ 647,570,965 |
Receivable for investments sold | | 1,754,419 |
Receivable for fund shares sold | | 1,095,032 |
Dividends receivable | | 123,861 |
Distributions receivable from Fidelity Central Funds | | 4,590 |
Other receivables | | 5,998 |
Total assets | | 650,554,865 |
| | |
Liabilities | | |
Payable for investments purchased | $ 2,481,162 | |
Payable for fund shares redeemed | 831,064 | |
Accrued management fee | 291,278 | |
Distribution and service plan fees payable | 129,277 | |
Other affiliated payables | 165,380 | |
Other payables and accrued expenses | 41,967 | |
Collateral on securities loaned, at value | 12,725,650 | |
Total liabilities | | 16,665,778 |
| | |
Net Assets | | $ 633,889,087 |
Net Assets consist of: | | |
Paid in capital | | $ 508,225,103 |
Undistributed net investment income | | 1,437,270 |
Accumulated undistributed net realized gain (loss) on investments and foreign currency transactions | | (14,289,525) |
Net unrealized appreciation (depreciation) on investments | | 138,516,239 |
Net Assets | | $ 633,889,087 |
See accompanying notes which are an integral part of the financial statements.
Annual Report
Statement of Assets and Liabilities - continued
| July 31, 2012 |
| | |
Calculation of Maximum Offering Price Class A:
Net Asset Value and redemption price per share ($199,303,293 ÷ 10,049,097 shares) | | $ 19.83 |
| | |
Maximum offering price per share (100/94.25 of $19.83) | | $ 21.04 |
Class T:
Net Asset Value and redemption price per share ($86,986,563 ÷ 4,388,463 shares) | | $ 19.82 |
| | |
Maximum offering price per share (100/96.50 of $19.82) | | $ 20.54 |
Class B:
Net Asset Value and offering price per share ($9,481,026 ÷ 484,043 shares)A | | $ 19.59 |
| | |
Class C:
Net Asset Value and offering price per share ($55,064,253 ÷ 2,816,216 shares)A | | $ 19.55 |
| | |
Institutional Class:
Net Asset Value, offering price and redemption price per share ($283,053,952 ÷ 14,176,053 shares) | | $ 19.97 |
A Redemption price per share is equal to net asset value less any applicable contingent deferred sales charge.
See accompanying notes which are an integral part of the financial statements.
Annual Report
Financial Statements - continued
Statement of Operations
| Year ended July 31, 2012 |
| | |
Investment Income | | |
Dividends | | $ 10,948,206 |
Income from Fidelity Central Funds | | 203,617 |
Total income | | 11,151,823 |
| | |
Expenses | | |
Management fee | $ 2,879,010 | |
Transfer agent fees | 1,540,993 | |
Distribution and service plan fees | 1,348,584 | |
Accounting and security lending fees | 200,051 | |
Custodian fees and expenses | 25,829 | |
Independent trustees' compensation | 3,321 | |
Registration fees | 110,528 | |
Audit | 47,308 | |
Legal | 1,501 | |
Miscellaneous | 4,381 | |
Total expenses before reductions | 6,161,506 | |
Expense reductions | (13,260) | 6,148,246 |
Net investment income (loss) | | 5,003,577 |
Realized and Unrealized Gain (Loss) Net realized gain (loss) on: | | |
Investment securities: | | |
Unaffiliated issuers | (3,801,786) | |
Foreign currency transactions | (1,490) | |
Total net realized gain (loss) | | (3,803,276) |
Change in net unrealized appreciation (depreciation) on investment securities | | 70,218,055 |
Net gain (loss) | | 66,414,779 |
Net increase (decrease) in net assets resulting from operations | | $ 71,418,356 |
See accompanying notes which are an integral part of the financial statements.
Annual Report
Statement of Changes in Net Assets
| Year ended
July 31,
2012 | Year ended
July 31,
2011 |
Increase (Decrease) in Net Assets | | |
Operations | | |
Net investment income (loss) | $ 5,003,577 | $ 2,958,826 |
Net realized gain (loss) | (3,803,276) | 54,414,285 |
Change in net unrealized appreciation (depreciation) | 70,218,055 | 34,015,366 |
Net increase (decrease) in net assets resulting
from operations | 71,418,356 | 91,388,477 |
Distributions to shareholders from net investment income | (3,900,509) | (3,454,847) |
Distributions to shareholders from net realized gain | (12,354,208) | - |
Total distributions | (16,254,717) | (3,454,847) |
Share transactions - net increase (decrease) | 89,359,376 | 12,993,567 |
Total increase (decrease) in net assets | 144,523,015 | 100,927,197 |
| | |
Net Assets | | |
Beginning of period | 489,366,072 | 388,438,875 |
End of period (including undistributed net investment income of $1,437,270 and undistributed net investment income of $48,238, respectively) | $ 633,889,087 | $ 489,366,072 |
See accompanying notes which are an integral part of the financial statements.
Annual Report
Financial Highlights - Class A
Years ended July 31, | 2012 | 2011 | 2010 | 2009 | 2008 |
Selected Per-Share Data | | | | |
Net asset value, beginning of period | $ 18.24 | $ 14.88 | $ 9.41 | $ 16.39 | $ 18.67 |
Income from Investment Operations | | | | | |
Net investment income (loss) C | .17 | .12 | .19 | .27 | .30 |
Net realized and unrealized gain (loss) | 2.02 | 3.37 | 5.46 | (6.86) | (1.24) |
Total from investment operations | 2.19 | 3.49 | 5.65 | (6.59) | (.94) |
Distributions from net investment income | (.13) | (.13) | (.18) | (.36) | (.26) |
Distributions from net realized gain | (.47) | - | - | (.03) | (1.09) |
Total distributions | (.60) | (.13) | (.18) | (.39) | (1.34) G |
Net asset value, end of period | $ 19.83 | $ 18.24 | $ 14.88 | $ 9.41 | $ 16.39 |
Total Return A, B | 12.81% | 23.63% | 60.38% | (40.19)% | (5.66)% |
Ratios to Average Net Assets D, F | | | | |
Expenses before reductions | 1.19% | 1.19% | 1.23% | 1.27% | 1.22% |
Expenses net of fee waivers, if any | 1.19% | 1.19% | 1.23% | 1.25% | 1.22% |
Expenses net of all reductions | 1.18% | 1.18% | 1.22% | 1.25% | 1.21% |
Net investment income (loss) | .98% | .69% | 1.45% | 2.73% | 1.71% |
Supplemental Data | | | | |
Net assets, end of period (000 omitted) | $ 199,303 | $ 178,978 | $ 117,929 | $ 62,422 | $ 109,442 |
Portfolio turnover rate E | 48% | 63% | 60% | 98% | 86% |
A Total returns would have been lower if certain expenses had not been reduced during the applicable periods shown.
B Total returns do not include the effect of the sales charges.
C Calculated based on average shares outstanding during the period.
D Fees and expenses of any underlying Fidelity Central Funds are not included in the Fund's expense ratio. The Fund indirectly bears its proportionate share of the expenses of any underlying Fidelity Central Funds.
E Amount does not include the portfolio activity of any underlying Fidelity Central Funds.
F Expense ratios reflect operating expenses of the class. Expenses before reductions do not reflect amounts reimbursed by the investment adviser or reductions from brokerage service arrangements or reductions from other expense offset arrangements and do not represent the amount paid by the class during periods when reimbursements or reductions occur. Expenses net of fee waivers reflect expenses after reimbursement by the investment adviser but prior to reductions from brokerage service arrangements or other expense offset arrangements. Expenses net of all reductions represent the net expenses paid by the class.
G Total distributions of $1.34 per share is comprised of distributions from net investment income of $.256 and distributions from net realized gain of $1.085 per share.
See accompanying notes which are an integral part of the financial statements.
Annual Report
Financial Highlights - Class T
Years ended July 31, | 2012 | 2011 | 2010 | 2009 | 2008 |
Selected Per-Share Data | | | | |
Net asset value, beginning of period | $ 18.24 | $ 14.90 | $ 9.42 | $ 16.40 | $ 18.64 |
Income from Investment Operations | | | | | |
Net investment income (loss) C | .13 | .07 | .15 | .25 | .26 |
Net realized and unrealized gain (loss) | 2.02 | 3.38 | 5.47 | (6.87) | (1.24) |
Total from investment operations | 2.15 | 3.45 | 5.62 | (6.62) | (.98) |
Distributions from net investment income | (.10) | (.11) | (.14) | (.33) | (.17) |
Distributions from net realized gain | (.47) | - | - | (.03) | (1.09) |
Total distributions | (.57) | (.11) | (.14) | (.36) | (1.26) G |
Net asset value, end of period | $ 19.82 | $ 18.24 | $ 14.90 | $ 9.42 | $ 16.40 |
Total Return A, B | 12.52% | 23.28% | 60.02% | (40.33)% | (5.88)% |
Ratios to Average Net Assets D, F | | | | |
Expenses before reductions | 1.43% | 1.44% | 1.49% | 1.54% | 1.47% |
Expenses net of fee waivers, if any | 1.43% | 1.44% | 1.49% | 1.50% | 1.47% |
Expenses net of all reductions | 1.43% | 1.44% | 1.48% | 1.50% | 1.47% |
Net investment income (loss) | .73% | .43% | 1.19% | 2.48% | 1.45% |
Supplemental Data | | | | |
Net assets, end of period (000 omitted) | $ 86,987 | $ 76,785 | $ 59,529 | $ 40,276 | $ 81,938 |
Portfolio turnover rate E | 48% | 63% | 60% | 98% | 86% |
A Total returns would have been lower if certain expenses had not been reduced during the applicable periods shown.
B Total returns do not include the effect of the sales charges.
C Calculated based on average shares outstanding during the period.
D Fees and expenses of any underlying Fidelity Central Funds are not included in the Fund's expense ratio. The Fund indirectly bears its proportionate share of the expenses of any underlying Fidelity Central Funds.
E Amount does not include the portfolio activity of any underlying Fidelity Central Funds.
F Expense ratios reflect operating expenses of the class. Expenses before reductions do not reflect amounts reimbursed by the investment adviser or reductions from brokerage service arrangements or reductions from other expense offset arrangements and do not represent the amount paid by the class during periods when reimbursements or reductions occur. Expenses net of fee waivers reflect expenses after reimbursement by the investment adviser but prior to reductions from brokerage service arrangements or other expense offset arrangements. Expenses net of all reductions represent the net expenses paid by the class.
G Total distributions of $1.26 per share is comprised of distributions from net investment income of $.173 and distributions from net realized gain of $1.085 per share.
See accompanying notes which are an integral part of the financial statements.
Annual Report
Financial Highlights - Class B
Years ended July 31, | 2012 | 2011 | 2010 | 2009 | 2008 |
Selected Per-Share Data | | | | |
Net asset value, beginning of period | $ 18.05 | $ 14.77 | $ 9.35 | $ 16.26 | $ 18.51 |
Income from Investment Operations | | | | | |
Net investment income (loss) C | .04 | (.01) | .09 | .20 | .17 |
Net realized and unrealized gain (loss) | 2.00 | 3.35 | 5.42 | (6.81) | (1.23) |
Total from investment operations | 2.04 | 3.34 | 5.51 | (6.61) | (1.06) |
Distributions from net investment income | (.03) | (.06) | (.09) | (.27) | (.10) |
Distributions from net realized gain | (.47) | - | - | (.03) | (1.09) |
Total distributions | (.50) | (.06) | (.09) | (.30) | (1.19) G |
Net asset value, end of period | $ 19.59 | $ 18.05 | $ 14.77 | $ 9.35 | $ 16.26 |
Total Return A, B | 11.99% | 22.69% | 59.14% | (40.60)% | (6.37)% |
Ratios to Average Net Assets D, F | | | | |
Expenses before reductions | 1.93% | 1.94% | 1.98% | 2.04% | 1.96% |
Expenses net of fee waivers, if any | 1.93% | 1.94% | 1.98% | 2.00% | 1.96% |
Expenses net of all reductions | 1.93% | 1.93% | 1.97% | 2.00% | 1.96% |
Net investment income (loss) | .23% | (.07)% | .70% | 1.98% | .96% |
Supplemental Data | | | | |
Net assets, end of period (000 omitted) | $ 9,481 | $ 11,542 | $ 12,078 | $ 7,933 | $ 16,879 |
Portfolio turnover rate E | 48% | 63% | 60% | 98% | 86% |
A Total returns would have been lower if certain expenses had not been reduced during the applicable periods shown.
B Total returns do not include the effect of the contingent deferred sales charge.
C Calculated based on average shares outstanding during the period.
D Fees and expenses of any underlying Fidelity Central Funds are not included in the Fund's expense ratio. The Fund indirectly bears its proportionate share of the expenses of any underlying Fidelity Central Funds.
E Amount does not include the portfolio activity of any underlying Fidelity Central Funds.
F Expense ratios reflect operating expenses of the class. Expenses before reductions do not reflect amounts reimbursed by the investment adviser or reductions from brokerage service arrangements or reductions from other expense offset arrangements and do not represent the amount paid by the class during periods when reimbursements or reductions occur. Expenses net of fee waivers reflect expenses after reimbursement by the investment adviser but prior to reductions from brokerage service arrangements or other expense offset arrangements. Expenses net of all reductions represent the net expenses paid by the class.
G Total distributions of $1.19 per share is comprised of distributions from net investment income of $.102 and distributions from net realized gain of $1.085 per share.
See accompanying notes which are an integral part of the financial statements.
Annual Report
Financial Highlights - Class C
Years ended July 31, | 2012 | 2011 | 2010 | 2009 | 2008 |
Selected Per-Share Data | | | | |
Net asset value, beginning of period | $ 18.03 | $ 14.76 | $ 9.34 | $ 16.26 | $ 18.51 |
Income from Investment Operations | | | | | |
Net investment income (loss) C | .04 | (.01) | .09 | .19 | .17 |
Net realized and unrealized gain (loss) | 1.98 | 3.35 | 5.43 | (6.81) | (1.23) |
Total from investment operations | 2.02 | 3.34 | 5.52 | (6.62) | (1.06) |
Distributions from net investment income | (.03) | (.07) | (.10) | (.27) | (.11) |
Distributions from net realized gain | (.47) | - | - | (.03) | (1.09) |
Total distributions | (.50) | (.07) | (.10) | (.30) | (1.19) G |
Net asset value, end of period | $ 19.55 | $ 18.03 | $ 14.76 | $ 9.34 | $ 16.26 |
Total Return A, B | 11.92% | 22.69% | 59.28% | (40.64)% | (6.35)% |
Ratios to Average Net Assets D, F | | | | |
Expenses before reductions | 1.93% | 1.94% | 1.98% | 2.01% | 1.96% |
Expenses net of fee waivers, if any | 1.93% | 1.94% | 1.98% | 2.00% | 1.96% |
Expenses net of all reductions | 1.93% | 1.93% | 1.97% | 2.00% | 1.96% |
Net investment income (loss) | .23% | (.07)% | .71% | 1.98% | .96% |
Supplemental Data | | | | |
Net assets, end of period (000 omitted) | $ 55,064 | $ 47,406 | $ 31,204 | $ 13,226 | $ 24,984 |
Portfolio turnover rate E | 48% | 63% | 60% | 98% | 86% |
A Total returns would have been lower if certain expenses had not been reduced during the applicable periods shown.
B Total returns do not include the effect of the contingent deferred sales charge.
C Calculated based on average shares outstanding during the period.
D Fees and expenses of any underlying Fidelity Central Funds are not included in the Fund's expense ratio. The Fund indirectly bears its proportionate share of the expenses of any underlying Fidelity Central Funds.
E Amount does not include the portfolio activity of any underlying Fidelity Central Funds.
F Expense ratios reflect operating expenses of the class. Expenses before reductions do not reflect amounts reimbursed by the investment adviser or reductions from brokerage service arrangements or reductions from other expense offset arrangements and do not represent the amount paid by the class during periods when reimbursements or reductions occur. Expenses net of fee waivers reflect expenses after reimbursement by the investment adviser but prior to reductions from brokerage service arrangements or other expense offset arrangements. Expenses net of all reductions represent the net expenses paid by the class.
G Total distributions of $1.19 per share is comprised of distributions from net investment income of $.106 and distributions from net realized gain of $1.085 per share.
See accompanying notes which are an integral part of the financial statements.
Annual Report
Financial Highlights - Institutional Class
Years ended July 31, | 2012 | 2011 | 2010 | 2009 | 2008 |
Selected Per-Share Data | | | | |
Net asset value, beginning of period | $ 18.36 | $ 14.96 | $ 9.46 | $ 16.47 | $ 18.80 |
Income from Investment Operations | | | | | |
Net investment income (loss) B | .22 | .16 | .23 | .30 | .34 |
Net realized and unrealized gain (loss) | 2.03 | 3.39 | 5.47 | (6.90) | (1.23) |
Total from investment operations | 2.25 | 3.55 | 5.70 | (6.60) | (.89) |
Distributions from net investment income | (.17) | (.15) | (.20) | (.38) | (.35) |
Distributions from net realized gain | (.47) | - | - | (.03) | (1.09) |
Total distributions | (.64) | (.15) | (.20) | (.41) | (1.44) F |
Net asset value, end of period | $ 19.97 | $ 18.36 | $ 14.96 | $ 9.46 | $ 16.47 |
Total Return A | 13.12% | 23.92% | 60.75% | (40.03)% | (5.39)% |
Ratios to Average Net Assets C, E | | | | |
Expenses before reductions | .93% | .93% | .97% | 1.01% | .95% |
Expenses net of fee waivers, if any | .93% | .93% | .97% | 1.00% | .95% |
Expenses net of all reductions | .93% | .92% | .96% | 1.00% | .95% |
Net investment income (loss) | 1.23% | .94% | 1.71% | 2.98% | 1.97% |
Supplemental Data | | | | |
Net assets, end of period (000 omitted) | $ 283,054 | $ 174,655 | $ 167,699 | $ 55,177 | $ 72,780 |
Portfolio turnover rate D | 48% | 63% | 60% | 98% | 86% |
A Total returns would have been lower if certain expenses had not been reduced during the applicable periods shown.
B Calculated based on average shares outstanding during the period.
C Fees and expenses of any underlying Fidelity Central Funds are not included in the Fund's expense ratio. The Fund indirectly bears its proportionate share of the expenses of any underlying Fidelity Central Funds.
D Amount does not include the portfolio activity of any underlying Fidelity Central Funds.
E Expense ratios reflect operating expenses of the class. Expenses before reductions do not reflect amounts reimbursed by the investment adviser or reductions from brokerage service arrangements or reductions from other expense offset arrangements and do not represent the amount paid by the class during periods when reimbursements or reductions occur. Expenses net of fee waivers reflect expenses after reimbursement by the investment adviser but prior to reductions from brokerage service arrangements or other expense offset arrangements. Expenses net of all reductions represent the net expenses paid by the class.
F Total distributions of $1.44 per share is comprised of distributions from net investment income of $.352 and distributions from net realized gain of $1.085 per share.
See accompanying notes which are an integral part of the financial statements.
Annual Report
Notes to Financial Statements
For the period ended July 31, 2012
1. Organization.
Fidelity Advisor Real Estate Fund (the Fund) is a non-diversified fund of Fidelity Advisor Series VII (the Trust) and is authorized to issue an unlimited number of shares. The Trust is registered under the Investment Company Act of 1940, as amended (the 1940 Act), as an open-end management investment company organized as a Massachusetts business trust. The Fund offers Class A, Class T, Class C and Institutional Class shares, each of which, along with Class B shares, has equal rights as to assets and voting privileges. Effective after the close of business on September 1, 2010, Class B shares were closed to new accounts and additional purchases, except for exchanges and reinvestments. Each class has exclusive voting rights with respect to matters that affect that class. Class B shares will automatically convert to Class A shares after a holding period of seven years from the initial date of purchase. Investment income, realized and unrealized capital gains and losses, the common expenses of the Fund, and certain fund-level expense reductions, if any, are allocated on a pro-rata basis to each class based on the relative net assets of each class to the total net assets of the Fund. Each class differs with respect to transfer agent and distribution and service plan fees incurred. Certain expense reductions may also differ by class.
2. Investments in Fidelity Central Funds.
The Fund invests in Fidelity Central Funds, which are open-end investment companies available only to other investment companies and accounts managed by Fidelity Management & Research Company (FMR) and its affiliates. The Fund's Schedule of Investments lists each of the Fidelity Central Funds held as of period end, if any, as an investment of the Fund, but does not include the underlying holdings of each Fidelity Central Fund. As an Investing Fund, the Fund indirectly bears its proportionate share of the expenses of the underlying Fidelity Central Funds.
The Money Market Central Funds seek preservation of capital and current income and are managed by Fidelity Investments Money Management, Inc. (FIMM), an affiliate of FMR.
A complete unaudited list of holdings for each Fidelity Central Fund is available upon request or at the Securities and Exchange Commission (the SEC) web site at www.sec.gov. In addition, the financial statements of the Fidelity Central Funds, which are not covered by the Fund's Report of Independent Registered Public Accounting Firm, are available on the SEC web site or upon request.
3. Significant Accounting Policies.
The financial statements have been prepared in conformity with accounting principles generally accepted in the United States of America (GAAP), which require management to make certain estimates and assumptions at the date of the financial statements.
Annual Report
3. Significant Accounting Policies - continued
Actual results could differ from those estimates. Subsequent events, if any, through the date that the financial statements were issued have been evaluated in the preparation of the financial statements. The following summarizes the significant accounting policies of the Fund:
Security Valuation. Investments are valued as of 4:00 p.m. Eastern time on the last calendar day of the period. In accordance with valuation policies and procedures approved by the Board of Trustees (the Board), the Fund attempts to obtain prices from one or more third party pricing vendor or broker to value its investments. When current market prices, quotations or rates are not readily available or reliable, securities will be fair valued in good faith by the FMR Fair Value Committee (the Committee), in accordance with procedures adopted by the Fund's Board. Factors used in determining fair value vary by security type and may include market or security specific events. The frequency with which these procedures are used cannot be predicted and they may be utilized to a significant extent. The Committee oversees the Fund's valuation policies and procedures and is responsible for approving and reporting to the Board all fair value determinations.
The Fund categorizes the inputs to valuation techniques used to value its investments into a disclosure hierarchy consisting of three levels as shown below:
Level 1 - quoted prices in active markets for identical investments
Level 2 - other significant observable inputs (including quoted prices for similar investments, interest rates, prepayment speeds, etc.)
Level 3 - unobservable inputs (including the Fund's own assumptions based on the best information available)
Valuation techniques used to value the Fund's investments by major category are as follows:
Equity securities, including restricted securities, for which market quotations are readily available, are valued at the last reported sale price or official closing price as reported by a third party pricing vendor on the primary market or exchange on which they are traded and are categorized as Level 1 in the hierarchy. In the event there were no sales during the day or closing prices are not available, securities are valued at the last quoted bid price or may be valued using the last available price and are generally categorized as Level 2 in the hierarchy. For foreign equity securities, when significant market or security specific events arise, comparisons to the valuation of American Depositary Receipts (ADRs), futures contracts, Exchange-Traded Funds (ETFs) and certain indexes as well as quoted prices for similar securities are used and are categorized as Level 2 in the hierarchy. Utilizing these techniques may result in transfers between Level 1 and Level 2.
Annual Report
Notes to Financial Statements - continued
3. Significant Accounting Policies - continued
Security Valuation - continued
Investments in open-end mutual funds, including the Fidelity Central Funds, are valued at their closing net asset value each business day and are categorized as Level 1 in the hierarchy.
Changes in valuation techniques may result in transfers in or out of an assigned level within the disclosure hierarchy.
Foreign Currency Translation. The Fund may use foreign currency contracts to facilitate transactions in foreign-denominated securities. Gains and losses from these transactions may arise from changes in the value of the foreign currency or if the counterparties do not perform under the contracts' terms.
Foreign-denominated assets, including investment securities, and liabilities are translated into U.S. dollars at the exchange rates at period end. Purchases and sales of investment securities, income and dividends received and expenses denominated in foreign currencies are translated into U.S. dollars at the exchange rate in effect on the transaction date.
The effects of exchange rate fluctuations on investments are included with the net realized and unrealized gain (loss) on investment securities. Other foreign currency transactions resulting in realized and unrealized gain (loss) are disclosed separately.
Investment Transactions and Income. For financial reporting purposes, the Fund's investment holdings and NAV include trades executed through the end of the last business day of the period. The NAV per share for processing shareholder transactions is calculated as of the close of business of the New York Stock Exchange (NYSE), normally 4:00 p.m. Eastern time and includes trades executed through the end of the prior business day. Gains and losses on securities sold are determined on the basis of identified cost and may include proceeds received from litigation. Dividend income is recorded on the ex-dividend date, except for certain dividends from foreign securities where the ex-dividend date may have passed, which are recorded as soon as the Fund is informed of the ex-dividend date. Non-cash dividends included in dividend income, if any, are recorded at the fair market value of the securities received. Distributions received on securities that represent a return of capital or capital gain are recorded as a reduction of cost of investments and/or as a realized gain. The Fund estimates the components of distributions received that may be considered return of capital distributions or capital gain distributions. Interest income and distributions from the Fidelity Central Funds are accrued as earned. Interest income includes coupon interest and amortization of premium and accretion of discount on debt securities. Investment income is recorded net of foreign taxes withheld where recovery of such taxes is uncertain.
Annual Report
3. Significant Accounting Policies - continued
Expenses. Expenses directly attributable to a fund are charged to that fund. Expenses attributable to more than one fund are allocated among the respective funds on the basis of relative net assets or other appropriate methods. Expense estimates are accrued in the period to which they relate and adjustments are made when actual amounts are known.
Income Tax Information and Distributions to Shareholders. Each year, the Fund intends to qualify as a regulated investment company under Subchapter M of the Internal Revenue Code, including distributing substantially all of its taxable income and realized gains. As a result, no provision for income taxes is required. As of July 31, 2012, the Fund did not have any unrecognized tax benefits in the financial statements; nor is the Fund aware of any tax positions for which it is reasonably possible that the total amounts of unrecognized tax benefits will significantly change in the next twelve months. The Fund files a U.S. federal tax return, in addition to state and local tax returns as required. A fund's federal income tax returns are subject to examination by the Internal Revenue Service (IRS) for a period of three fiscal years after they are filed. State and local tax returns may be subject to examination for an additional fiscal year depending on the jurisdiction. Foreign taxes are provided for based on the Fund's understanding of the tax rules and rates that exist in the foreign markets in which it invests.
Distributions are declared and recorded on the ex-dividend date. Income dividends and capital gain distributions are declared separately for each class. Income and capital gain distributions are determined in accordance with income tax regulations, which may differ from GAAP.
Capital accounts within the financial statements are adjusted for permanent book-tax differences. These adjustments have no impact on net assets or the results of operations. Temporary book-tax differences will reverse in a subsequent period.
Book-tax differences are primarily due to foreign currency transactions, capital loss carryforwards and losses deferred due to wash sales.
The federal tax cost of investment securities and unrealized appreciation (depreciation) as of period end were as follows:
Gross unrealized appreciation | $ 142,985,212 |
Gross unrealized depreciation | (10,763,303) |
Net unrealized appreciation (depreciation) on securities and other investments | $ 132,221,909 |
| |
Tax Cost | $ 515,349,056 |
Annual Report
Notes to Financial Statements - continued
3. Significant Accounting Policies - continued
Income Tax Information and Distributions to Shareholders - continued
The tax-based components of distributable earnings as of period end were as follows:
Undistributed ordinary income | $ 1,437,270 |
Capital loss carryforward | $ (7,995,195) |
Net unrealized appreciation (depreciation) | $ 132,221,909 |
Capital loss carryforwards are only available to offset future capital gains of the Fund to the extent provided by regulations and may be limited. Under the Regulated Investment Company Modernization Act of 2010 (the Act), the Fund is permitted to carry forward capital losses incurred in taxable years beginning after December 22, 2010 for an unlimited period and such capital losses are required to be used prior to any losses that expire. Capital loss carryforwards were as follows:
No expiration | |
Short-term | $ (7,995,195) |
The tax character of distributions paid was as follows:
| July 31, 2012 | July 31, 2011 |
Ordinary Income | $ 3,900,509 | $ 3,454,847 |
Long-term Capital Gains | 12,354,208 | - |
Total | $ 16,254,717 | $ 3,454,847 |
New Accounting Pronouncement. In December 2011, the Financial Accounting Standards Board issued Accounting Standard Update No. 2011-11, Disclosures about Offsetting Assets and Liabilities. The update creates new disclosure requirements requiring entities to disclose both gross and net information for derivatives and other financial instruments that are either offset in the Statement of Assets and Liabilities or subject to an enforceable master netting arrangement or similar agreement. The disclosure requirements are effective for interim and annual reporting periods beginning on or after January 1, 2013. Management is currently evaluating the impact of the update's adoption on the Fund's financial statement disclosures.
4. Purchases and Sales of Investments.
Purchases and sales of securities, other than short-term securities, aggregated $319,623,933 and $244,922,077, respectively.
Annual Report
5. Fees and Other Transactions with Affiliates.
Management Fee. FMR and its affiliates provide the Fund with investment management related services for which the Fund pays a monthly management fee. The management fee is the sum of an individual fund fee rate that is based on an annual rate of .30% of the Fund's average net assets and an annualized group fee rate that averaged .26% during the period. The group fee rate is based upon the average net assets of all the mutual funds advised by FMR. The group fee rate decreases as assets under management increase and increases as assets under management decrease. For the period, the total annual management fee rate was .56% of the Fund's average net assets.
Distribution and Service Plan Fees. In accordance with Rule 12b-1 of the 1940 Act, the Fund has adopted separate Distribution and Service Plans for each class of shares. Certain classes pay Fidelity Distributors Corporation (FDC), an affiliate of FMR, separate Distribution and Service Fees, each of which is based on an annual percentage of each class' average net assets. In addition, FDC may pay financial intermediaries for selling shares of the Fund and providing shareholder support services. For the period, the Distribution and Service Fee rates, total fees and amounts retained by FDC were as follows:
| Distribution
Fee | Service
Fee | Total Fees | Retained
by FDC |
Class A | -% | .25% | $ 417,501 | $ 6,984 |
Class T | .25% | .25% | 366,136 | 342 |
Class B | .75% | .25% | 94,834 | 71,155 |
Class C | .75% | .25% | 470,113 | 80,484 |
| | | $ 1,348,584 | $ 158,965 |
Sales Load. FDC may receive a front-end sales charge of up to 5.75% for selling Class A shares and 3.50% for selling Class T shares, some of which is paid to financial intermediaries for selling shares of the Fund. Depending on the holding period, FDC may receive contingent deferred sales charges levied on Class A, Class T, Class B, and Class C redemptions. The deferred sales charges range from 5.00% to 1.00% for Class B shares, 1.00% for Class C shares, 1.00% for certain purchases of Class A shares and .25% for certain purchases of Class T shares.
Annual Report
Notes to Financial Statements - continued
5. Fees and Other Transactions with Affiliates - continued
Sales Load - continued
For the period, sales charge amounts retained by FDC were as follows:
| Retained
by FDC |
Class A | $ 56,896 |
Class T | 12,432 |
Class B* | 16,487 |
Class C* | 5,578 |
| $ 91,393 |
* When Class B and Class C shares are initially sold, FDC pays commissions from its own resources to financial intermediaries through which the sales are made.
Transfer Agent Fees. Fidelity Investments Institutional Operations Company, Inc. (FIIOC), an affiliate of FMR, is the transfer, dividend disbursing and shareholder servicing agent for each class of the Fund. FIIOC receives account fees and asset-based fees that vary according to the account size and type of account of the shareholders of the respective classes of the Fund. FIIOC pays for typesetting, printing and mailing of shareholder reports, except proxy statements. For the period, transfer agent fees for each class were as follows:
| Amount | % of
Average
Net Assets |
Class A | $ 501,163 | .30 |
Class T | 218,194 | .30 |
Class B | 28,405 | .30 |
Class C | 140,279 | .30 |
Institutional Class | 652,952 | .30 |
| $ 1,540,993 | |
Accounting and Security Lending Fees. Fidelity Service Company, Inc. (FSC), an affiliate of FMR, maintains the Fund's accounting records. The accounting fee is based on the level of average net assets for each month. Under a separate contract, FSC administers the security lending program. The security lending fee is based on the number and duration of lending transactions.
Brokerage Commissions. The Fund placed a portion of its portfolio transactions with brokerage firms which are affiliates of the investment adviser. The commissions paid to these affiliated firms were $4,780 for the period.
Annual Report
6. Committed Line of Credit.
The Fund participates with other funds managed by FMR or an affiliate in a $4.25 billion credit facility (the "line of credit") to be utilized for temporary or emergency purposes to fund shareholder redemptions or for other short-term liquidity purposes. The Fund has agreed to pay commitment fees on its pro-rata portion of the line of credit, which amounted to $1,419 and is reflected in Miscellaneous expenses on the Statement of Operations. During the period, there were no borrowings on this line of credit.
7. Security Lending.
The Fund lends portfolio securities through a lending agent from time to time in order to earn additional income. For equity securities, a lending agent is used and may loan securities to certain qualified borrowers, including Fidelity Capital Markets (FCM), a broker-dealer affiliated with the Fund. On the settlement date of the loan, the Fund receives collateral (in the form of U.S. Treasury obligations, letters of credit and/or cash) against the loaned securities and maintains collateral in an amount not less than 100% of the market value of the loaned securities during the period of the loan. The market value of the loaned securities is determined at the close of business of the Fund and any additional required collateral is delivered to the Fund on the next business day. If the borrower defaults on its obligation to return the securities loaned because of insolvency or other reasons, a fund could experience delays and costs in recovering the securities loaned or in gaining access to the collateral. Any cash collateral received is invested in the Fidelity Securities Lending Cash Central Fund. The value of loaned securities and cash collateral at period end are disclosed on the Fund's Statement of Assets and Liabilities. At period end, there were no security loans outstanding with FCM. Security lending income represents the income earned on investing cash collateral, less rebates paid to borrowers and any lending agent fees associated with the loan, plus any premium payments received for lending certain types of securities. Security lending income is presented in the Statement of Operations as a component of income from Fidelity Central Funds. Total security lending income during the period amounted to $178,910, including $257 from securities loaned to FCM.
8. Expense Reductions.
Many of the brokers with whom FMR places trades on behalf of the Fund provided services to the Fund in addition to trade execution. These services included payments of certain expenses on behalf of the Fund totaling $13,251 for the period. In addition, through arrangements with the Fund's custodian, credits realized as a result of uninvested cash balances were used to reduce the Fund's expenses. During the period, these credits reduced the Fund's custody expenses by $9.
Annual Report
Notes to Financial Statements - continued
9. Distributions to Shareholders.
Distributions to shareholders of each class were as follows:
Years ended July 31, | 2012 | 2011 |
From net investment income | | |
Class A | $ 1,233,446 | $ 1,134,674 |
Class T | 395,519 | 470,285 |
Class B | 17,337 | 48,095 |
Class C | 91,538 | 150,722 |
Institutional Class | 2,162,669 | 1,651,071 |
Total | $ 3,900,509 | $ 3,454,847 |
From net realized gain | | |
Class A | $ 4,374,052 | $ - |
Class T | 1,941,846 | - |
Class B | 284,191 | - |
Class C | 1,220,926 | - |
Institutional Class | 4,533,193 | - |
Total | $ 12,354,208 | $ - |
10. Share Transactions.
Transactions for each class of shares were as follows:
| Shares | Dollars |
Years ended July 31, | 2012 | 2011 | 2012 | 2011 |
Class A | | | | |
Shares sold | 4,390,323 | 4,653,877 | $ 77,870,328 | $ 78,524,629 |
Reinvestment of distributions | 330,295 | 65,899 | 5,307,780 | 1,031,857 |
Shares redeemed | (4,481,644) | (2,832,440) | (76,348,944) | (47,536,681) |
Net increase (decrease) | 238,974 | 1,887,336 | $ 6,829,164 | $ 32,019,805 |
Class T | | | | |
Shares sold | 1,486,467 | 1,651,686 | $ 26,569,039 | $ 27,537,800 |
Reinvestment of distributions | 143,406 | 29,190 | 2,295,629 | 457,660 |
Shares redeemed | (1,450,832) | (1,467,042) | (25,262,634) | (24,575,305) |
Net increase (decrease) | 179,041 | 213,834 | $ 3,602,034 | $ 3,420,155 |
Class B | | | | |
Shares sold | 71,396 | 93,823 | $ 1,224,427 | $ 1,516,799 |
Reinvestment of distributions | 17,389 | 2,787 | 272,976 | 43,338 |
Shares redeemed | (244,068) | (274,854) | (4,157,648) | (4,557,495) |
Net increase (decrease) | (155,283) | (178,244) | $ (2,660,245) | $ (2,997,358) |
Annual Report
10. Share Transactions - continued
| Shares | Dollars |
Years ended July 31, | 2012 | 2011 | 2012 | 2011 |
Class C | | | | |
Shares sold | 701,378 | 1,010,530 | $ 12,249,173 | $ 16,785,045 |
Reinvestment of distributions | 76,897 | 8,844 | 1,206,065 | 137,459 |
Shares redeemed | (591,840) | (504,158) | (10,136,308) | (8,281,154) |
Net increase (decrease) | 186,435 | 515,216 | $ 3,318,930 | $ 8,641,350 |
Institutional Class | | | | |
Shares sold | 7,861,392 | 4,421,526 | $ 135,053,241 | $ 73,745,390 |
Reinvestment of distributions | 250,120 | 72,024 | 4,059,507 | 1,131,385 |
Shares redeemed | (3,446,764) | (6,191,578) | (60,843,255) | (102,967,160) |
Net increase (decrease) | 4,664,748 | (1,698,028) | $ 78,269,493 | $ (28,090,385) |
11. Other.
The Fund's organizational documents provide former and current trustees and officers with a limited indemnification against liabilities arising in connection with the performance of their duties to the Fund. In the normal course of business, the Fund may also enter into contracts that provide general indemnifications. The Fund's maximum exposure under these arrangements is unknown as this would be dependent on future claims that may be made against the Fund. The risk of material loss from such claims is considered remote.
At the end of the period, Strategic Advisers Small-Mid Cap Fund was the owner of record of 10% of the total outstanding shares of the Fund.
Annual Report
To the Trustees of Fidelity Advisor Series VII and Shareholders of Fidelity Advisor Real Estate Fund:
We have audited the accompanying statement of assets and liabilities of Fidelity Advisor Real Estate Fund (the Fund), a fund of Fidelity Advisor Series VII, including the schedule of investments, as of July 31, 2012, and the related statement of operations for the year then ended, the statement of changes in net assets for each of the two years in the period then ended, and the financial highlights for each of the five years in the period then ended. These financial statements and financial highlights are the responsibility of the Fund's management. Our responsibility is to express an opinion on these financial statements and financial highlights based on our audits.
We conducted our audits in accordance with the standards of the Public Company Accounting Oversight Board (United States). Those standards require that we plan and perform the audit to obtain reasonable assurance about whether the financial statements and financial highlights are free of material misstatement. The Fund is not required to have, nor were we engaged to perform, an audit of its internal control over financial reporting. Our audits included consideration of internal control over financial reporting as a basis for designing audit procedures that are appropriate in the circumstances, but not for the purpose of expressing an opinion on the effectiveness of the Fund's internal control over financial reporting. Accordingly, we express no such opinion. An audit also includes examining, on a test basis, evidence supporting the amounts and disclosures in the financial statements, assessing the accounting principles used and significant estimates made by management, as well as evaluating the overall financial statement presentation. Our procedures included confirmation of securities owned as of July 31, 2012, by correspondence with the custodians and brokers; where replies were not received from brokers, we performed other auditing procedures. We believe that our audits provide a reasonable basis for our opinion.
In our opinion, the financial statements and financial highlights referred to above present fairly, in all material respects, the financial position of Fidelity Advisor Real Estate Fund as of July 31, 2012, the results of its operations for the year then ended, the changes in its net assets for each of the two years in the period then ended, and the financial highlights for each of the five years in the period then ended, in conformity with accounting principles generally accepted in the United States of America.
DELOITTE & TOUCHE LLP
Boston, Massachusetts
September 13, 2012
Annual Report
The Trustees, Members of the Advisory Board, and executive officers of the trust and fund, as applicable, are listed below. The Board of Trustees governs the fund and is responsible for protecting the interests of shareholders. The Trustees are experienced executives who meet periodically throughout the year to oversee the fund's activities, review contractual arrangements with companies that provide services to the fund, oversee management of the risks associated with such activities and contractual arrangements, and review the fund's performance. Except for James C. Curvey, each of the Trustees oversees 228 funds advised by FMR or an affiliate. Mr. Curvey oversees 435 funds advised by FMR or an affiliate.
The Trustees hold office without limit in time except that (a) any Trustee may resign; (b) any Trustee may be removed by written instrument, signed by at least two-thirds of the number of Trustees prior to such removal; (c) any Trustee who requests to be retired or who has become incapacitated by illness or injury may be retired by written instrument signed by a majority of the other Trustees; and (d) any Trustee may be removed at any special meeting of shareholders by a two-thirds vote of the outstanding voting securities of the trust. Each Trustee who is not an interested person (as defined in the 1940 Act) (Independent Trustee), shall retire not later than the last day of the calendar year in which his or her 75th birthday occurs. The Independent Trustees may waive this mandatory retirement age policy with respect to individual Trustees. The executive officers and Advisory Board Members hold office without limit in time, except that any officer and Advisory Board Member may resign or may be removed by a vote of a majority of the Trustees at any regular meeting or any special meeting of the Trustees. Except as indicated, each individual has held the office shown or other offices in the same company for the past five years.
Experience, Skills, Attributes, and Qualifications of the Fund's Trustees. The Governance and Nominating Committee has adopted a statement of policy that describes the experience, qualifications, attributes, and skills that are necessary and desirable for potential Independent Trustee candidates (Statement of Policy). The Board believes that each Trustee satisfied at the time he or she was initially elected or appointed a Trustee, and continues to satisfy, the standards contemplated by the Statement of Policy. The Governance and Nominating Committee also engages professional search firms to help identify potential Independent Trustee candidates who have the experience, qualifications, attributes, and skills consistent with the Statement of Policy. From time to time, additional criteria based on the composition and skills of the current Independent Trustees, as well as experience or skills that may be appropriate in light of future changes to board composition, business conditions, and regulatory or other developments, have also been considered by the professional search firms and the Governance and Nominating Committee. In addition, the Board takes into account the Trustees' commitment and participation in Board and committee meetings, as well as their leadership of standing and ad hoc committees throughout their tenure.
In determining that a particular Trustee was and continues to be qualified to serve as a Trustee, the Board has considered a variety of criteria, none of which, in isolation, was controlling. The Board believes that, collectively, the Trustees have balanced and diverse experience, qualifications, attributes, and skills, which allow the Board to operate effectively in governing the fund and protecting the interests of shareholders. Information about the specific experience, skills, attributes, and qualifications of each Trustee, which in each case led to the Board's conclusion that the Trustee should serve (or continue to serve) as a trustee of the fund, is provided below.
Annual Report
Board Structure and Oversight Function. James C. Curvey is an interested person (as defined in the 1940 Act) and currently serves as Chairman. The Trustees have determined that an interested Chairman is appropriate and benefits shareholders because an interested Chairman has a personal and professional stake in the quality and continuity of services provided to the fund. Independent Trustees exercise their informed business judgment to appoint an individual of their choosing to serve as Chairman, regardless of whether the Trustee happens to be independent or a member of management. The Independent Trustees have determined that they can act independently and effectively without having an Independent Trustee serve as Chairman and that a key structural component for assuring that they are in a position to do so is for the Independent Trustees to constitute a substantial majority for the Board. The Independent Trustees also regularly meet in executive session. Ned C. Lautenbach serves as Chairman of the Independent Trustees and as such (i) acts as a liaison between the Independent Trustees and management with respect to matters important to the Independent Trustees and (ii) with management prepares agendas for Board meetings.
Fidelity funds are overseen by different Boards of Trustees. The fund's Board oversees Fidelity's equity and high income funds and another Board oversees Fidelity's investment-grade bond, money market, and asset allocation funds. The asset allocation funds may invest in Fidelity funds overseen by the fund's Board. The use of separate Boards, each with its own committee structure, allows the Trustees of each group of Fidelity funds to focus on the unique issues of the funds they oversee, including common research, investment, and operational issues. On occasion, the separate Boards establish joint committees to address issues of overlapping consequences for the Fidelity funds overseen by each Board.
The Trustees operate using a system of committees to facilitate the timely and efficient consideration of all matters of importance to the Trustees, the fund, and fund shareholders and to facilitate compliance with legal and regulatory requirements and oversight of the fund's activities and associated risks. The Board, acting through its committees, has charged FMR and its affiliates with (i) identifying events or circumstances the occurrence of which could have demonstrably adverse effects on the fund's business and/or reputation; (ii) implementing processes and controls to lessen the possibility that such events or circumstances occur or to mitigate the effects of such events or circumstances if they do occur; and (iii) creating and maintaining a system designed to evaluate continuously business and market conditions in order to facilitate the identification and implementation processes described in (i) and (ii) above. Because the day-to-day operations and activities of the fund are carried out by or through FMR, its affiliates and other service providers, the fund's exposure to risks is mitigated but not eliminated by the processes overseen by the Trustees. While each of the Board's committees has responsibility for overseeing different aspects of the fund's activities, oversight is exercised primarily through the Operations, Audit, and Compliance Committees. In addition, the Independent Trustees have worked with FMR to enhance the Board's oversight of investment and financial risks, legal and regulatory risks, technology risks, and operational risks, including the development of additional risk reporting to the Board. For example, a working group comprised of Independent Trustees and FMR has worked and continues to work to review the Fidelity funds' valuation-related activities, reporting and risk management. Appropriate personnel, including but not limited to the fund's Chief Compliance Officer (CCO), FMR's internal auditor, the independent accountants, the fund's Treasurer and portfolio management personnel, make periodic reports to the Board's committees, as appropriate, including an annual review of FMR's risk management program for the Fidelity funds. The responsibilities of each standing committee, including their oversight responsibilities, are described further under "Standing Committees of the Fund's Trustees."
Annual Report
Trustees and Officers - continued
The fund's Statement of Additional Information (SAI) includes more information about the Trustees. To request a free copy, call Fidelity at 1-800-208-0098.
Interested Trustees*:
Correspondence intended for each Trustee who is an interested person may be sent to Fidelity Investments, 82 Devonshire Street, Boston, Massachusetts 02109.
Name, Age; Principal Occupations and Other Relevant Experience+ |
James C. Curvey (77) |
| Year of Election or Appointment: 2007 Mr. Curvey is Trustee and Chairman of the Board of Trustees of certain Trusts. Mr. Curvey also serves as Trustee (2007-present) of other investment companies advised by FMR. Mr. Curvey is a Director of Fidelity Investments Money Management, Inc. (2009-present), Director of Fidelity Research & Analysis Co. (2009-present) and Director of FMR and FMR Co., Inc. (2007-present). Mr. Curvey is also Vice Chairman (2007-present) and Director of FMR LLC. In addition, Mr. Curvey serves as an Overseer for the Boston Symphony Orchestra and a member of the Trustees of Villanova University. Previously, Mr. Curvey was the Vice Chairman (2006-2007) and Director (2000-2007) of FMR Corp. |
Ronald P. O'Hanley (55) |
| Year of Election or Appointment: 2011 Mr. O'Hanley is Director of FMR Co., Inc. (2010-present), Director of Fidelity Investments Money Management, Inc. (2010-present), Director of Fidelity Research & Analysis Company (2010-present), President of Fidelity Asset Management and Corporate Services and a member of Fidelity's Executive Committee (2010-present). Previously, Mr. O'Hanley served as President and Chief Executive Officer of BNY Mellon Asset Management (2007-2010). Mr. O'Hanley also served as Vice Chairman of Bank New York Mellon Corp. and a member of that firm's Executive Committee. Prior to the 2007 merger of The Bank of New York and Mellon Financial Corporation, he was Vice Chairman of Mellon Financial Corporation and President and Chief Executive Officer of Mellon Asset Management. He joined Mellon in February 1997. Mr. O'Hanley currently serves as Chairman of the Boston Public Library Foundation Board of Directors and sits on the Board of Directors of Beth Israel Deaconess Medical Center, the Board of Trustees of the Marine Biological Laboratory and the Advisory Board of the Maxwell School of Citizenship and Public Administration at Syracuse University. Mr. O'Hanley also chairs the Council on Asset Management for the Financial Services Roundtable and is a member of the Board of Directors of Institutional Investor's U.S. Institute. |
* Trustees have been determined to be "Interested Trustees" by virtue of, among other things, their affiliation with the trust or various entities under common control with FMR.
+ The information above includes each Trustee's principal occupation during the last five years and other information relating to the experience, attributes, and skills relevant to each Trustee's qualifications to serve as a Trustee, which led to the conclusion that each Trustee should serve as a Trustee for the fund.
Annual Report
Trustees and Officers - continued
Independent Trustees:
Correspondence intended for each Independent Trustee (that is, the Trustees other than the Interested Trustees) may be sent to Fidelity Investments, P.O. Box 55235, Boston, Massachusetts 02205-5235.
Name, Age; Principal Occupations and Other Relevant Experience+ |
Dennis J. Dirks (64) |
| Year of Election or Appointment: 2005 Prior to his retirement in May 2003, Mr. Dirks was Chief Operating Officer and a member of the Board of The Depository Trust & Clearing Corporation (DTCC). He also served as President, Chief Operating Officer, and Board member of The Depository Trust Company (DTC) and President and Board member of the National Securities Clearing Corporation (NSCC). In addition, Mr. Dirks served as Chief Executive Officer and Board member of the Government Securities Clearing Corporation, Chief Executive Officer and Board member of the Mortgage-Backed Securities Clearing Corporation, as a Trustee and a member of the Finance Committee of Manhattan College (2005-2008), and as a Trustee and a member of the Finance Committee of AHRC of Nassau County (2006-2008). Mr. Dirks is a member of the Independent Directors Council (IDC) Governing Council (2010-present) and Board of Directors for The Brookville Center for Children's Services, Inc. (2009-present). |
Alan J. Lacy (58) |
| Year of Election or Appointment: 2008 Mr. Lacy serves as Senior Adviser (2007-present) of Oak Hill Capital Partners, L.P. (private equity). Mr. Lacy also served as Chief Executive Officer (2000-2005) and Vice Chairman (2005-2006) of Sears Holdings Corporation and Sears, Roebuck and Co. (retail). In addition, Mr. Lacy serves as a member of the Board of Directors of Dave & Buster's Entertainment, Inc. (restaurant and entertainment complexes, 2010-present), Earth Fare, Inc. (retail grocery, 2012-present), The Hillman Companies, Inc. (hardware wholesalers, 2010-present), and Bristol-Myers Squibb Company (global pharmaceuticals, 2007-present). Mr. Lacy is a member of the Board of Trustees of The National Parks Conservation Association (2006-present). Previously, Mr. Lacy served as Chairman of the Board of Trustees of the National Parks Conservation Association (2008-2011) and as a member of the Board of Directors for the Western Union Company (global money transfer, 2006-2011). |
Ned C. Lautenbach (68) |
| Year of Election or Appointment:2000 Mr. Lautenbach is Chairman of the Independent Trustees of the Equity and High Income Funds (2006-present). Mr. Lautenbach currently serves as the Lead Director of the Eaton Corporation Board of Directors (diversified industrial, 1997-present). Mr. Lautenbach is Chairman of the Board of Directors of the Philharmonic Center for the Arts in Naples, Florida (2012-present); and a member of the Council on Foreign Relations (1994-present). Previously, Mr. Lautenbach was a Partner/Advisory Partner at Clayton, Dubilier & Rice, LLC (private equity investment, 1998-2010), as well as a Director of Sony Corporation (2006-2007). |
Joseph Mauriello (67) |
| Year of Election or Appointment: 2008 Prior to his retirement in January 2006, Mr. Mauriello served in numerous senior management positions including Deputy Chairman and Chief Operating Officer (2004-2005), and Vice Chairman of Financial Services (2002-2004) of KPMG LLP US (professional services, 1965-2005). Mr. Mauriello currently serves as a member of the Board of Directors of XL Group plc. (global insurance and re-insurance, 2006-present). Previously, Mr. Mauriello served as a Director of the Hamilton Funds of the Bank of New York (2006-2007) and of Arcadia Resources Inc. (health care services and products, 2007-2012). |
Robert W. Selander (61) |
| Year of Election or Appointment: 2011 Previously, Mr. Selander served as a Member of the Advisory Board of Fidelity's Equity and High Income Funds (2011), Executive Vice Chairman (2010), Chief Executive Officer (2009-2010), and President and Chief Executive Officer (1997-2009) of Mastercard, Inc. |
Cornelia M. Small (68) |
| Year of Election or Appointment: 2005 Ms. Small is a member of the Board of Directors of the Teagle Foundation (2009-present). Ms. Small is also a member of the Investment Committee, and Chair (2008-present) and a member of the Board of Trustees of Smith College. In addition, Ms. Small serves on the Investment Committee of the Berkshire Taconic Community Foundation (2008-present). Previously, Ms. Small served as Chairperson of the Investment Committee (2002-2008) of Smith College. In addition, Ms. Small served as Chief Investment Officer, Director of Global Equity Investments, and a member of the Board of Directors of Scudder, Stevens & Clark and Scudder Kemper Investments. |
William S. Stavropoulos (73) |
| Year of Election or Appointment: 2001 Mr. Stavropoulos is Vice Chairman of the Independent Trustees of the Equity and High Income Funds (2006-present). Mr. Stavropoulos serves as President and Founder of the Michigan Baseball Foundation, the Great Lakes Loons (2007-present). Mr. Stavropoulos is Chairman Emeritus of the Board of Directors of The Dow Chemical Company, where he previously served in numerous senior management positions, including President, CEO (1995-2000; 2002-2004), Chairman of the Executive Committee (2000-2006), and as a member of the Board of Directors (1990-2006). Currently, Mr. Stavropoulos is Chairman of Univar (global distributor of commodity and specialty chemicals, 2010-present), a Director of Teradata Corporation (data warehousing and technology solutions, 2008-present), Chemical Financial Corporation, Maersk Inc. (industrial conglomerate), Tyco International, Inc. (multinational manufacturing and services, 2007-present), and a member of the Advisory Board for Metalmark Capital (private equity investment, 2005-present). Mr. Stavropoulos is a special advisor to Clayton, Dubilier & Rice, LLC (private equity investment). In addition, Mr. Stavropoulos is a member of the University of Notre Dame Advisory Council for the College of Science. |
David M. Thomas (63) |
| Year of Election or Appointment: 2008 Previously, Mr. Thomas served as Executive Chairman (2005-2006) and Chairman and Chief Executive Officer (2000-2005) of IMS Health, Inc. (pharmaceutical and healthcare information solutions). In addition, Mr. Thomas serves as a member of the Board of Directors of Fortune Brands, Inc. (consumer products), and Interpublic Group of Companies, Inc. (marketing communication, 2004-present). |
Michael E. Wiley (61) |
| Year of Election or Appointment:2008 Mr. Wiley also serves as a Director of Asia Pacific Exploration Consolidated (international oil and gas exploration and production, 2008-present). Mr. Wiley serves as a Director of Tesoro Corporation (independent oil refiner and marketer, 2005-present), and a Director of Bill Barrett Corporation (exploration and production, 2005-present). In addition, Mr. Wiley also serves as a Director of Post Oak Bank (privately-held bank, 2004-present). Previously, Mr. Wiley served as a member of the Board of Trustees of the University of Tulsa (2000-2006; 2007-2010), as a Senior Energy Advisor of Katzenbach Partners, LLC (consulting, 2006-2007), as an Advisory Director of Riverstone Holdings (private investment), Chairman, President, and CEO of Baker Hughes, Inc. (oilfield services, 2000-2004), and as Director of Spinnaker Exploration Company (exploration and production, 2001-2005). |
Annual Report
+ The information above includes each Trustee's principal occupation during the last five years and other information relating to the experience, attributes, and skills relevant to each Trustee's qualifications to serve as a Trustee, which led to the conclusion that each Trustee should serve as a Trustee for the fund.
Advisory Board Members and Executive Officers:
Correspondence intended for David A. Rosow and Garnett A Smith may be sent to Fidelity Investments, P.O. Box 55235, Boston, Massachusetts 02205-5235. Correspondence intended for each executive officer, Edward C. Johnson 3d, and Peter S. Lynch may be sent to Fidelity Investments, 82 Devonshire Street, Boston, Massachusetts 02109.
Name, Age; Principal Occupation |
Edward C. Johnson 3d (82) |
| Year of Election or Appointment: 2011 Member of the Advisory Board of Fidelity's Equity and High Income Funds. Mr. Johnson serves as Chief Executive Officer, Chairman, and a Director of FMR LLC, and also serves as Chairman and Director of FIL Limited. Previously, Mr. Johnson served as a Trustee and Chairman of the Board of certain Fidelity Trusts, Chairman and a Director of FMR, Chairman and a Director of FMR Co., Inc., and President of FMR LLC (2006-2007). |
Peter S. Lynch (68) |
| Year of Election or Appointment: 2003 Member of the Advisory Board of Fidelity's Equity and High Income Funds. Mr. Lynch is Vice Chairman and a Director of FMR and FMR Co., Inc. In addition, Mr. Lynch serves as a Trustee of Boston College and as the Chairman of the Inner-City Scholarship Fund. Previously, Mr. Lynch served on the Special Olympics International Board of Directors (1997-2006). |
David A. Rosow (69) |
| Year of Election or Appointment: 2012 Member of the Advisory Board of Fidelity's Equity and High Income Funds. Chairman and Chief Executive Officer of International Golf Group, Inc. (golf course development, 1990-present). Previously, Mr. Rosow served as Chairman and Chief Executive Officer of Rosow & Company, Inc. (private investment company, 1989-2011), a Lead Director of Hudson United Bancorp (2001-2006) and as a Director of TD Banknorth (1996-2006). In addition, Mr. Rosow is a member (2008-present) and President (2009-present) of the Town Council of Palm Beach, Florida. |
Garnett A. Smith (64) |
| Year of Election or Appointment: 2012 Member of the Advisory Board of Fidelity's Equity and High Income Funds. Prior to Mr. Smith's retirement, he served as Chairman and Chief Executive Officer of Inbrand Corp. (manufacturer of personal absorbent products, 1990-1997). He also served as President (1986-1990) of Inbrand Corp. Prior to his employment with Inbrand Corp., he was employed by a retail fabric chain and North Carolina National Bank. In addition, Mr. Smith is a board member of the Jackson Hole Land Trust (2009-present). |
Kenneth B. Robins (42) |
| Year of Election or Appointment: 2008 President and Treasurer of Fidelity's Equity and High Income Funds. Mr. Robins also serves as President and Treasurer (2010-present) and Assistant Treasurer (2009-present) of other Fidelity funds and is an employee of Fidelity Investments (2004-present). Previously, Mr. Robins served as Deputy Treasurer of the Fidelity funds (2005-2008) and Treasurer and Chief Financial Officer of The North Carolina Capital Management Trust: Cash and Term Portfolios (2006-2008). |
Brian B. Hogan (47) |
| Year of Election or Appointment: 2009 Vice President of Equity and High Income Funds. Mr. Hogan also serves as President of FMR's Equity Division (2009-present). Previously, Mr. Hogan served as Senior Vice President, Equity Research of FMR (2006-2009) and as a portfolio manager. |
Christopher S. Bartel (40) |
| Year of Election or Appointment: 2009 Vice President of Fidelity's Sector and Real Estate Equity Funds. Mr. Bartel also serves as a Director, President, and Chief Executive Officer of Fidelity Management & Research (Japan) Inc. (2012-present), a Director of Fidelity Management & Research (Hong Kong) (2012-present), and Senior Vice President of Global Equity Research (2010-present). Previously, Mr. Bartel served as Senior Vice President of Equity Research (2009-2010), Managing Director of Research (2006-2009), and an analyst and portfolio manager (2000-2006). |
Scott C. Goebel (44) |
| Year of Election or Appointment: 2008 Secretary and Chief Legal Officer (CLO) of the Fidelity funds. Mr. Goebel also serves as Secretary of Fidelity Investments Money Management, Inc. (FIMM) (2010-present) and Fidelity Research and Analysis Company (FRAC) (2010-present); Secretary and CLO of The North Carolina Capital Management Trust: Cash and Term Portfolios (2008-present); General Counsel, Secretary, and Senior Vice President of FMR (2008-present) and FMR Co., Inc. (2008-present); employed by FMR LLC or an affiliate (2001-present); Chief Legal Officer of Fidelity Management & Research (Hong Kong) Limited (2008-present) and Assistant Secretary of Fidelity Management & Research (Japan) Inc. (2008-present), and Fidelity Management & Research (U.K.) Inc. (2008-present). Previously, Mr. Goebel served as Assistant Secretary of FIMM (2008-2010), FRAC (2008-2010), and the Funds (2007-2008) and as Vice President and Secretary of Fidelity Distributors Corporation (FDC) (2005-2007). |
William C. Coffey (43) |
| Year of Election or Appointment: 2009 Assistant Secretary of Fidelity's Equity and High Income Funds. Mr. Coffey also serves as Senior Vice President and Deputy General Counsel of FMR LLC (2010-present), and is an employee of Fidelity Investments. Previously, Mr. Coffey served as Vice President and Associate General Counsel of FMR LLC (2005-2009). |
Elizabeth Paige Baumann (44) |
| Year of Election or Appointment: 2012 Anti-Money Laundering (AML) Officer of the Fidelity funds. Ms. Baumann also serves as AML Officer of The North Carolina Capital Management Trust: Cash and Term Portfolios (2012-present), Chief AML Officer of FMR LLC (2012-present), and is an employee of Fidelity Investments. Previously, Ms. Baumann served as Vice President and Deputy Anti-Money Laundering Officer (2007-2012). |
Christine Reynolds (53) |
| Year of Election or Appointment: 2008 Chief Financial Officer of the Fidelity funds. Ms. Reynolds became President of Fidelity Pricing and Cash Management Services (FPCMS) in August 2008. Ms. Reynolds served as Chief Operating Officer of FPCMS (2007-2008). Previously, Ms. Reynolds served as President, Treasurer, and Anti-Money Laundering officer of the Fidelity funds (2004-2007). |
Joseph A. Hanlon (44) |
| Year of Election or Appointment: 2012 Chief Compliance Officer of Fidelity's Equity and High Income Funds. Mr. Hanlon serves as Compliance Officer of FMR, FMR Co., Inc., Fidelity Investments Money Management, Inc. (FIMM), Fidelity Research and Analysis Company (FRAC), Fidelity Management & Research (Japan) Inc., Fidelity Management & Research (U.K.) Inc., Fidelity Management & Research (Hong Kong), and Strategic Advisers, Inc. (2009-present), as Senior Vice President of the Fidelity Asset Management Division (2009-present), and is an employee of Fidelity Investments. |
Joseph F. Zambello (55) |
| Year of Election or Appointment: 2011 Deputy Treasurer of the Fidelity funds. Mr. Zambello is an employee of Fidelity Investments. Previously, Mr. Zambello served as Vice President of FMR's Program Management Group (2009-2011) and Vice President of the Transfer Agent Oversight Group (2005-2009). |
Adrien E. Deberghes (44) |
| Year of Election or Appointment: 2008 Deputy Treasurer of Fidelity's Equity and High Income Funds. Mr. Deberghes also serves as Vice President (2011-present) and Assistant Treasurer (2010-present) of other Fidelity funds, and is an employee of Fidelity Investments (2008-present). Previously, Mr. Deberghes served as Senior Vice President of Mutual Fund Administration at State Street Corporation (2007-2008), Senior Director of Mutual Fund Administration at Investors Bank & Trust (2005-2007), and Director of Finance for Dunkin' Brands (2000-2005). |
Stephanie J. Dorsey (43) |
| Year of Election or Appointment: 2010 Assistant Treasurer of Fidelity's Equity and High Income Funds. Ms. Dorsey also serves as Deputy Treasurer of other Fidelity funds (2008-present) and is an employee of Fidelity Investments (2008-present). Previously, Ms. Dorsey served as Treasurer (2004-2008) of the JPMorgan Mutual Funds and Vice President (2004-2008) of JPMorgan Chase Bank. |
John R. Hebble (54) |
| Year of Election or Appointment: 2009 Assistant Treasurer of Fidelity's Equity and High Income Funds. Mr. Hebble also serves as President (2011-present), Treasurer, and Chief Financial Officer of The North Carolina Capital Management Trust: Cash and Term Portfolios (2008-present), President and Treasurer of other Fidelity funds (2008-present) and is an employee of Fidelity Investments. |
Gary W. Ryan (53) |
| Year of Election or Appointment: 2005 Assistant Treasurer of the Fidelity funds. Mr. Ryan is an employee of Fidelity Investments. Previously, Mr. Ryan served as Vice President of Fund Reporting in Fidelity Pricing and Cash Management Services (FPCMS) (1999-2005). |
Jonathan Davis (44) |
| Year of Election or Appointment: 2010 Assistant Treasurer of the Fidelity funds. Mr. Davis is also Assistant Treasurer of Fidelity Rutland Square Trust II and Fidelity Commonwealth Trust II. Mr. Davis is an employee of Fidelity Investments. Previously, Mr. Davis served as Vice President and Associate General Counsel of FMR LLC (2003-2010). |
Annual Report
A total of 0.05% of the dividends distributed during the fiscal year was derived from interest on U.S. Government securities which is generally exempt from state income tax.
The fund will notify shareholders in January 2013 of amounts for use in preparing 2012 income tax returns.
Annual Report
Board Approval of Investment Advisory Contracts and Management Fees
Fidelity Advisor Real Estate Fund
Each year, the Board of Trustees, including the Independent Trustees (together, the Board), votes on the renewal of the management contract and sub-advisory agreements (together, the Advisory Contracts) for the fund. The Board, assisted by the advice of fund counsel and Independent Trustees' counsel, requests and considers a broad range of information relevant to the renewal of the Advisory Contracts throughout the year.
The Board meets regularly and, at each of its meetings, considers factors that are relevant to its annual consideration of the renewal of the fund's Advisory Contracts, including the services and support provided to the fund and its shareholders. The Board has established various standing committees, each composed of and chaired by Independent Trustees with varying backgrounds, to which the Board has assigned specific subject matter responsibilities in order to enhance effective decision-making by the Board. The Board, acting directly and through its Committees, requests and receives information concerning the annual consideration of the renewal of the fund's Advisory Contracts. The Board also meets as needed to consider matters specifically related to the Board's annual consideration of the renewal of Advisory Contracts. Members of the Board may also meet with trustees of other Fidelity funds through ad hoc joint committees to discuss certain matters relevant to the Fidelity funds.
At its July 2012 meeting, the Board of Trustees, including the Independent Trustees, unanimously determined to renew the fund's Advisory Contracts. In reaching its determination, the Board considered all factors it believed relevant, including (i) the nature, extent, and quality of the services to be provided to the fund and its shareholders (including the investment performance of the fund); (ii) the competitiveness of the fund's management fee and total expense ratio relative to peer funds; (iii) the total costs of the services to be provided by and the profits to be realized by Fidelity from its relationship with the fund; (iv) the extent to which economies of scale exist and would be realized as the fund grows; and (v) whether fee levels reflect these economies of scale, if any, for the benefit of fund shareholders.
In considering whether to renew the Advisory Contracts for the fund, the Board reached a determination, with the assistance of fund counsel and Independent Trustees' counsel and through the exercise of its business judgment, that the renewal of the Advisory Contracts is in the best interests of the fund and its shareholders and that the compensation payable under the Advisory Contracts is fair and reasonable. The Board's decision to renew the Advisory Contracts was not based on any single factor, but rather was based on a comprehensive consideration of all the information provided to the Board at its meetings throughout the year. The Board, in reaching its determination to renew the Advisory Contracts, is aware that shareholders in the fund have a broad range of investment choices available to them, including a wide choice among mutual funds offered by Fidelity's competitors, and that the fund's shareholders, who have the opportunity to review and weigh the disclosure provided by the fund in its prospectus and other public disclosures, have chosen to invest in this fund, managed by Fidelity.
Annual Report
Board Approval of Investment Advisory Contracts and
Management Fees - continued
Nature, Extent, and Quality of Services Provided. The Board considered the staffing within the investment adviser, FMR, and the sub-advisers (together, the Investment Advisers), including the backgrounds of the fund's investment personnel, and also considered the fund's investment objective, strategies, and related investment philosophy. The Independent Trustees also had discussions with senior management of Fidelity's investment operations and investment groups. The Board considered the structure of the portfolio manager compensation program and whether this structure provides appropriate incentives to act in the best interests of the fund.
Resources Dedicated to Investment Management and Support Services. The Board and the Fund Oversight and Research Committees reviewed the general qualifications and capabilities of the Investment Advisers' investment staff, including its size, education, experience, and resources, as well as the Investment Advisers' approach to recruiting, training, managing, and compensating investment personnel. The Board also noted that FMR has continued to increase the resources devoted to non-U.S. offices, including expansion of Fidelity's global investment organization. The Board noted that Fidelity's analysts have extensive resources, tools and capabilities that allow them to conduct sophisticated quantitative and fundamental analysis, as well as credit analysis of issuers, counterparties and guarantors. The Board also believes that Fidelity's investment professionals have sufficient access to global information and data so as to provide competitive investment results over time, and that those professionals also have access to sophisticated tools that permit them to assess portfolio construction and risk and performance attribution characteristics continuously, as well as to transmit new information and research conclusions rapidly around the world. Additionally, in its deliberations, the Board considered the Investment Advisers' trading and risk management capabilities and resources, which are an integral part of the investment management process.
Shareholder and Administrative Services. The Board considered (i) the nature, extent, quality, and cost of advisory, administrative, and shareholder services performed by the Investment Advisers and their affiliates under the Advisory Contracts and under separate agreements covering transfer agency, pricing and bookkeeping, and securities lending services for the fund; (ii) the nature and extent of the supervision of third party service providers, principally custodians and subcustodians; and (iii) the resources devoted to, and the record of compliance with, the fund's compliance policies and procedures. The Board also reviewed the allocation of fund brokerage, including allocations to brokers affiliated with the Investment Advisers, the use of brokerage commissions to pay fund expenses, and the use of "soft" commission dollars to pay for research services.
Annual Report
The Board noted that the growth of fund assets over time across the complex allows Fidelity to reinvest in the development of services designed to enhance the value or convenience of the Fidelity funds as investment vehicles. These services include 24-hour access to account information and market information through telephone representatives and over the Internet, investor education materials and asset allocation tools, and the expanded availability of Fidelity Investor Centers.
Investment in a Large Fund Family. The Board considered the benefits to shareholders of investing in a Fidelity fund, including the benefits of investing in a fund that is part of a large family of funds offering a variety of investment disciplines and providing a large variety of mutual fund investor services. The Board noted that Fidelity had taken, or had made recommendations that resulted in the Fidelity funds taking, a number of actions over the previous year that benefited particular funds, including (i) continuing to dedicate additional resources to investment research and support of the senior management team that oversees asset management; (ii) persisting in efforts to enhance Fidelity's research capabilities, in particular, international research; (iii) launching new funds and making other enhancements to meet client needs for global and income-oriented solutions; (iv) continuing to launch dedicated lower cost underlying funds to meet investment management's portfolio construction needs related to expanding underlying fund options, specifically for the Freedom Fund product lines; (v) adopting a "Stock Selector" sector neutral investment approach and employing a team of portfolio managers who are sector specialists to manage certain funds; (vi) rationalizing product lines and gaining increased efficiencies through the mergers of several funds into other funds; (vii) strengthening the Spartan Index Fund product line by adding new funds and/or new low-cost institutional share classes, restructuring fund expenses to accommodate new classes, and reducing investment minimums for certain classes of shares; (viii) modifying the eligibility criteria for Institutional Class shares to increase their appeal to government entities and charitable investors; and (ix) reducing certain transfer agent fee rates.
Investment Performance. The Board considered whether the fund has operated in accordance with its investment objective, as well as its record of compliance with its investment restrictions. It also reviewed the fund's absolute investment performance for each class, as well as the fund's relative investment performance for each class measured over multiple periods against a broad-based securities market index. The Board noted that FMR believes that no meaningful peer group exists for the fund principally because most other funds in the fund's third-party peer group focus on different industries or sectors than the fund. The following charts considered by the Board show, over the one-, three-, and five-year periods ended December 31, 2011, the cumulative total returns of Institutional Class (Class I) and Class C of the fund and the cumulative total returns of a broad-based securities market index ("benchmark"). The returns of Institutional Class (Class I) and Class C show the performance of the highest and lowest performing classes, respectively (based on five-year performance).
Annual Report
Board Approval of Investment Advisory Contracts and
Management Fees - continued
Fidelity Advisor Real Estate Fund

The Board noted that the investment performance of Institutional Class (Class I) of the fund compared favorably to its benchmark for the three- and five-year periods, although the fund's one-year total return was lower than its benchmark. The Board considered that the variations in performance among the fund's classes reflect the variations in class expenses, which result in lower performance for higher expense classes. The Board also reviewed the fund's performance since inception as well as performance in the current year.
Based on its review, the Board concluded that the nature, extent, and quality of services provided to the fund under the Advisory Contracts should benefit the fund's shareholders.
Competitiveness of Management Fee and Total Expense Ratio. The Board considered the fund's management fee and total expense ratio compared to "mapped groups" of competitive funds and classes. Fidelity creates "mapped groups" by combining similar Lipper investment objective categories that have comparable management fee characteristics. Combining Lipper investment objective categories aids the Board's management fee and total expense ratio comparisons by broadening the competitive group used for comparison and by reducing the number of universes to which various Fidelity funds are compared.
Annual Report
Management Fee. The Board considered two proprietary management fee comparisons for the 12-month periods shown in the chart below. The group of Lipper funds used by the Board for management fee comparisons is referred to below as the "Total Mapped Group." The Total Mapped Group comparison focuses on a fund's standing relative to the total universe of comparable funds available to investors in terms of gross management fees before expense reimbursements or caps. "TMG %" represents the percentage of funds in the Total Mapped Group that had management fees that were lower than the fund's. For example, a TMG % of 6% means that 94% of the funds in the Total Mapped Group had higher management fees than the fund. The "Asset-Size Peer Group" (ASPG) comparison focuses on a fund's standing relative to non-Fidelity funds similar in size to the fund within the Total Mapped Group. The ASPG represents at least 15% of the funds in the Total Mapped Group with comparable asset size and management fee characteristics, subject to a minimum of 50 funds (or all funds in the Total Mapped Group if fewer than 50). Additional information, such as the ASPG quartile in which the fund's management fee ranked, is also included in the chart and considered by the Board.
Fidelity Advisor Real Estate Fund
The Board noted that the fund's management fee ranked below the median of its Total Mapped Group and below the median of its ASPG for 2011.
Based on its review, the Board concluded that the fund's management fee is fair and reasonable in light of the services that the fund receives and the other factors considered.
Total Expense Ratio. In its review of each class's total expense ratio, the Board considered the fund's management fee as well as other fund or class expenses, as applicable, such as transfer agent fees, pricing and bookkeeping fees, fund-paid 12b-1 fees, and custodial, legal, and audit fees. The Board also noted the effects of any waivers and reimbursements on fees and expenses. As part of its review, the Board also considered the current and historical total expense ratios of each class of the fund compared to competitive fund median expenses. Each class of the fund is compared to those funds and classes in the Total Mapped Group (used by the Board for management fee comparisons) that have a similar sales load structure.
Annual Report
Board Approval of Investment Advisory Contracts and
Management Fees - continued
The Board noted that the total expense ratio of each of Class A, Class B, Class C, and Institutional Class ranked below its competitive median for 2011 and the total expense ratio of Class T ranked equal to its competitive median for 2011.
Fees Charged to Other Fidelity Clients. The Board also considered Fidelity fee structures and other information with respect to clients of FMR and its affiliates, such as other mutual funds advised or subadvised by FMR or its affiliates, pension plan clients, and other institutional clients. The Board noted the findings of the 2010 ad hoc joint committee (created with the board of other Fidelity funds), which reviewed and compared Fidelity's institutional investment advisory business with its business of providing services to the Fidelity funds, including the differences in services provided, fees charged, and costs incurred, as well as competition in their respective marketplaces.
Based on its review of total expense ratios and fees charged to other Fidelity clients, the Board concluded that the total expense ratio of each class of the fund was reasonable in light of the services that the fund and its shareholders receive and the other factors considered.
Costs of the Services and Profitability. The Board considered the revenues earned and the expenses incurred by Fidelity in conducting the business of developing, marketing, distributing, managing, administering and servicing the fund and its shareholders. The Board also considered the level of Fidelity's profits in respect of all the Fidelity funds.
On an annual basis, FMR presents to the Board Fidelity's profitability for the fund. Fidelity calculates the profitability for each fund, as well as aggregate profitability for groups of Fidelity funds and all Fidelity funds, using a series of detailed revenue and cost allocation methodologies which originate with the books and records of Fidelity on which Fidelity's audited financial statements are based. The Audit Committee of the Board reviews any significant changes from the prior year's methodologies.
PricewaterhouseCoopers LLP (PwC), independent registered public accounting firm and auditor to Fidelity and certain Fidelity funds, has been engaged annually by the Board as part of the Board's assessment of Fidelity's profitability analysis. PwC's engagement includes the review and assessment of Fidelity's methodologies used in determining the revenues and expenses attributable to Fidelity's mutual fund business, and completion of agreed-upon procedures surrounding the mathematical accuracy of fund profitability and its conformity to allocation methodologies. After considering PwC's reports issued under the engagement and information provided by Fidelity, the Board concluded that while other allocation methods may also be reasonable, Fidelity's profitability methodologies are reasonable in all material respects.
Annual Report
The Board also reviewed Fidelity's non-fund businesses and fall-out benefits related to the mutual fund business as well as cases where Fidelity's affiliates may benefit from or be related to the fund's business.
The Board considered the costs of the services provided by and the profits realized by Fidelity in connection with the operation of the fund and was satisfied that the profitability was not excessive in the circumstances.
Economies of Scale. The Board considered whether there have been economies of scale in respect of the management of the Fidelity funds, whether the Fidelity funds (including the fund) have appropriately benefited from any such economies of scale, and whether there is potential for realization of any further economies of scale. The Board considered the extent to which the fund will benefit from economies of scale through increased services to the fund, through waivers or reimbursements, or through fee or expense reductions. The Board also noted that in 2009, it and the board of other Fidelity funds created an ad hoc committee (the Economies of Scale Committee) to analyze whether FMR attains economies of scale in respect of the management and servicing of the Fidelity funds, whether the Fidelity funds have appropriately benefited from such economies of scale, and whether there is potential for realization of any further economies of scale.
The Board recognized that the fund's management contract incorporates a "group fee" structure, which provides for lower group fee rates as total fund assets under FMR's management increase, and for higher group fee rates as total fund assets under FMR's management decrease. FMR calculates the group fee rates based on a tiered asset "breakpoint" schedule that varies based on asset class. The Board considered that the group fee is designed to deliver the benefits of economies of scale to fund shareholders when total Fidelity fund assets increase, even if assets of any particular fund are unchanged or have declined, because some portion of Fidelity's costs are attributable to services provided to all Fidelity funds, and all funds benefit if those costs can be allocated among more assets. The Board concluded that, given the group fee structure, fund shareholders will benefit from lower management fees as assets under FMR's management increase at the fund complex level, regardless of whether Fidelity achieves any such economies of scale.
The Board concluded, taking into account the analysis of the Economies of Scale Committee, that economies of scale, if any, are being appropriately shared between fund shareholders and Fidelity.
Annual Report
Board Approval of Investment Advisory Contracts and
Management Fees - continued
Additional Information Requested by the Board. In order to develop fully the factual basis for consideration of the Fidelity funds' Advisory Contracts, the Board requested and received additional information on certain topics, including (i) fund performance trends, actions to be taken by FMR to improve certain funds' overall performance, and Fidelity's long-term strategies for certain funds; (ii) the potential to further rationalize the Fidelity fund lineup with the possibility of achieving savings for the funds and Fidelity; (iii) Fidelity's compensation structure for portfolio managers and other key investment personnel; (iv) the amount of the investment that each portfolio manager has made in the Fidelity fund(s) that he or she manages; (v) the realization of fall-out benefits in certain Fidelity business units; (vi) Fidelity's group fee structures, the potential impact of regulatory changes on such structures, and the rationale for the individual fee rates of certain funds; (vii) fund profitability methodology, including Fidelity's cost allocation methodology, and the impact of certain factors on fund profitability results; (viii) trends regarding industry use of performance fee structures and the possibility of implementing performance fee structures for additional funds; and (ix) the impact of net redemptions from the Fidelity funds.
Based on its evaluation of all of the conclusions noted above, and after considering all factors it believed relevant, the Board ultimately concluded that the advisory fee structures are fair and reasonable, and that the fund's Advisory Contracts should be renewed.
Annual Report
Investment Adviser
Fidelity Management & Research Company
Boston, MA
Investment Sub-Advisers
FMR Co., Inc.
Fidelity Management & Research
(Hong Kong) Limited
Fidelity Management & Research
(Japan) Inc.
Fidelity Management & Research
(U.K.) Inc.
General Distributor
Fidelity Distributors Corporation
Smithfield, RI
Transfer and Service Agents
Fidelity Investments Institutional
Operations Company, Inc.
Boston, MA
Fidelity Service Company, Inc.
Boston, MA
Custodian
The Bank of New York Mellon
New York, NY
(Fidelity Investment logo)(registered trademark)
AREI-UANN-0912
1.789708.109
Item 2. Code of Ethics
As of the end of the period, July 31, 2012, Fidelity Advisor Series VII (the trust) has adopted a code of ethics, as defined in Item 2 of Form N-CSR, that applies to its President and Treasurer and its Chief Financial Officer. A copy of the code of ethics is filed as an exhibit to this Form N-CSR.
Item 3. Audit Committee Financial Expert
The Board of Trustees of the trust has determined that Joseph Mauriello is an audit committee financial expert, as defined in Item 3 of Form N-CSR. Mr. Mauriello is independent for purposes of Item 3 of Form N-CSR.
Item 4. Principal Accountant Fees and Services
Fees and Services
The following table presents fees billed by Deloitte & Touche LLP, the member firms of Deloitte Touche Tohmatsu, and their respective affiliates (collectively, "Deloitte Entities") in each of the last two fiscal years for services rendered to Fidelity Advisor Biotechnology Fund, Fidelity Advisor Communications Equipment Fund, Fidelity Advisor Consumer Discretionary Fund, Fidelity Advisor Electronics Fund, Fidelity Advisor Energy Fund, Fidelity Advisor Financial Services Fund, Fidelity Advisor Health Care Fund, Fidelity Advisor Industrials Fund, Fidelity Advisor Real Estate Fund, Fidelity Advisor Technology Fund, and Fidelity Advisor Utilities Fund (the "Funds"):
Services Billed by Deloitte Entities
July 31, 2012 FeesA
| Audit Fees | Audit-Related Fees | Tax Fees | All Other Fees |
Fidelity Advisor Biotechnology Fund | $33,000 | $- | $4,600 | $400 |
Fidelity Advisor Communications Equipment Fund | $35,000 | $- | $4,600 | $400 |
Fidelity Advisor Consumer Discretionary Fund | $33,000 | $- | $5,700 | $400 |
Fidelity Advisor Electronics Fund | $33,000 | $- | $4,600 | $400 |
Fidelity Advisor Energy Fund | $34,000 | $- | $6,700 | $500 |
Fidelity Advisor Financial Services Fund | $35,000 | $- | $6,700 | $400 |
Fidelity Advisor Health Care Fund | $34,000 | $- | $5,700 | $400 |
Fidelity Advisor Industrials Fund | $33,000 | $- | $5,700 | $400 |
Fidelity Advisor Real Estate Fund | $36,000 | $- | $5,700 | $400 |
Fidelity Advisor Technology Fund | $35,000 | $- | $5,700 | $500 |
Fidelity Advisor Utilities Fund | $33,000 | $- | $5,700 | $400 |
July 31, 2011 FeesA
| Audit Fees | Audit-Related Fees | Tax Fees | All Other Fees |
Fidelity Advisor Biotechnology Fund | $34,000 | $- | $4,600 | $200 |
Fidelity Advisor Communications Equipment Fund | $35,000 | $- | $4,600 | $200 |
Fidelity Advisor Consumer Discretionary Fund | $33,000 | $- | $5,700 | $200 |
Fidelity Advisor Electronics Fund | $33,000 | $- | $4,600 | $200 |
Fidelity Advisor Energy Fund | $34,000 | $- | $6,700 | $200 |
Fidelity Advisor Financial Services Fund | $35,000 | $- | $8,700 | $200 |
Fidelity Advisor Health Care Fund | $34,000 | $- | $5,700 | $200 |
Fidelity Advisor Industrials Fund | $34,000 | $- | $5,700 | $200 |
Fidelity Advisor Real Estate Fund | $36,000 | $- | $5,700 | $200 |
Fidelity Advisor Technology Fund | $35,000 | $- | $5,700 | $200 |
Fidelity Advisor Utilities Fund | $33,000 | $- | $5,700 | $200 |
A Amounts may reflect rounding.
The following table presents fees billed by Deloitte Entities that were required to be approved by the Audit Committee for services that relate directly to the operations and financial reporting of the Funds and that are rendered on behalf of Fidelity Management & Research Company ("FMR") and entities controlling, controlled by, or under common control with FMR (not including any sub-adviser whose role is primarily portfolio management and is subcontracted with or overseen by another investment adviser) that provide ongoing services to the Funds ("Fund Service Providers"):
Services Billed by Deloitte Entities
| July 31, 2012A | July 31, 2011A |
Audit-Related Fees | $615,000 | $645,000 |
Tax Fees | $- | $- |
All Other Fees | $1,115,000 | $730,000 |
A Amounts may reflect rounding.
"Audit-Related Fees" represent fees billed for assurance and related services that are reasonably related to the performance of the fund audit or the review of the fund's financial statements and that are not reported under Audit Fees.
"Tax Fees" represent fees billed for tax compliance, tax advice or tax planning that relate directly to the operations and financial reporting of the fund.
"All Other Fees" represent fees billed for services provided to the fund or Fund Service Provider, a significant portion of which are assurance related, that relate directly to the operations and financial reporting of the fund, excluding those services that are reported under Audit Fees, Audit-Related Fees or Tax Fees.
Assurance services must be performed by an independent public accountant.
* * *
The aggregate non-audit fees billed by Deloitte Entities for services rendered to the Funds, FMR (not including any sub-adviser whose role is primarily portfolio management and is subcontracted with or overseen by another investment adviser), and any Fund Service Provider for each of the last two fiscal years of the Funds are as follows:
Billed By | July 31, 2012 A | July 31, 2011 A |
Deloitte Entities | $1,885,000 | $1,535,000 |
A Amounts may reflect rounding.
The trust's Audit Committee has considered non-audit services that were not pre-approved that were provided by Deloitte Entities to Fund Service Providers to be compatible with maintaining the independence of Deloitte Entities in its audit of the Funds, taking into account representations from Deloitte Entities, in accordance with Public Company Accounting Oversight Board rules, regarding its independence from the Funds and their related entities and FMR's review of the appropriateness and permissibility under applicable law of such non-audit services prior to their provision to the Fund Service Providers.
Audit Committee Pre-Approval Policies and Procedures
The trust's Audit Committee must pre-approve all audit and non-audit services provided by a fund's independent registered public accounting firm relating to the operations or financial reporting of the fund. Prior to the commencement of any audit or non-audit services to a fund, the Audit Committee reviews the services to determine whether they are appropriate and permissible under applicable law.
The Audit Committee has adopted policies and procedures to, among other purposes, provide a framework for the Committee's consideration of non-audit services by the audit firms that audit the Fidelity funds. The policies and procedures require that any non-audit service provided by a fund audit firm to a Fidelity fund and any non-audit service provided by a fund auditor to a Fund Service Provider that relates directly to the operations and financial reporting of a Fidelity fund ("Covered Service") are subject to approval by the Audit Committee before such service is provided.
All Covered Services must be approved in advance of provision of the service either: (i) by formal resolution of the Audit Committee, or (ii) by oral or written approval of the service by the Chair of the Audit Committee (or if the Chair is unavailable, such other member of the Audit Committee as may be designated by the Chair to act in the Chair's absence). The approval contemplated by (ii) above is permitted where the Treasurer determines that action on such an engagement is necessary before the next meeting of the Audit Committee.
Non-audit services provided by a fund audit firm to a Fund Service Provider that do not relate directly to the operations and financial reporting of a Fidelity fund are reported to the Audit Committee on a periodic basis.
Non-Audit Services Approved Pursuant to Rule 2-01(c)(7)(i)(C) and (ii) of Regulation S-X ("De Minimis Exception")
There were no non-audit services approved or required to be approved by the Audit Committee pursuant to the De Minimis Exception during the Funds' last two fiscal years relating to services provided to (i) the Funds or (ii) any Fund Service Provider that relate directly to the operations and financial reporting of the Funds.
Item 5. Audit Committee of Listed Registrants
Not applicable.
Item 6. Investments
(a) Not applicable.
(b) Not applicable
Item 7. Disclosure of Proxy Voting Policies and Procedures for Closed-End Management Investment Companies
Not applicable.
Item 8. Portfolio Managers of Closed-End Management Investment Companies
Not applicable.
Item 9. Purchase of Equity Securities by Closed-End Management Investment Company and Affiliated Purchasers
Not applicable.
Item 10. Submission of Matters to a Vote of Security Holders
There were no material changes to the procedures by which shareholders may recommend nominees to the trust's Board of Trustees.
Item 11. Controls and Procedures
(a)(i) The President and Treasurer and the Chief Financial Officer have concluded that the trust's disclosure controls and procedures (as defined in Rule 30a-3(c) under the Investment Company Act) provide reasonable assurances that material information relating to the trust is made known to them by the appropriate persons, based on their evaluation of these controls and procedures as of a date within 90 days of the filing date of this report.
(a)(ii) There was no change in the trust's internal control over financial reporting (as defined in Rule 30a-3(d) under the Investment Company Act) that occurred during the second fiscal quarter of the period covered by this report that has materially affected, or is reasonably likely to materially affect, the trust's internal control over financial reporting.
Item 12. Exhibits
(a) | (1) | Code of Ethics pursuant to Item 2 of Form N-CSR is filed and attached hereto as EX-99.CODE ETH. |
(a) | (2) | Certification pursuant to Rule 30a-2(a) under the Investment Company Act of 1940 (17 CFR 270.30a-2(a)) is filed and attached hereto as Exhibit 99.CERT. |
(a) | (3) | Not applicable. |
(b) | | Certification pursuant to Rule 30a-2(b) under the Investment Company Act of 1940 (17 CFR 270.30a-2(b)) is furnished and attached hereto as Exhibit 99.906CERT. |
SIGNATURES
Pursuant to the requirements of the Securities Exchange Act of 1934 and the Investment Company Act of 1940, the registrant has duly caused this report to be signed on its behalf by the undersigned, thereunto duly authorized.
Fidelity Advisor Series VII
By: | /s/Kenneth B. Robins |
| Kenneth B. Robins |
| President and Treasurer |
| |
Date: | September 27, 2012 |
Pursuant to the requirements of the Securities Exchange Act of 1934 and the Investment Company Act of 1940, this report has been signed below by the following persons on behalf of the registrant and in the capacities and on the dates indicated.
By: | /s/Kenneth B. Robins |
| Kenneth B. Robins |
| President and Treasurer |
| |
Date: | September 27, 2012 |
By: | /s/Christine Reynolds |
| Christine Reynolds |
| Chief Financial Officer |
| |
Date: | September 27, 2012 |