UNITED STATES
SECURITIES AND EXCHANGE COMMISSION
Washington, D.C. 20549
FORM N-CSR
CERTIFIED SHAREHOLDER REPORT OF REGISTERED
MANAGEMENT INVESTMENT COMPANIES
Investment Company Act file number 811-3010
Fidelity Advisor Series VII
(Exact name of registrant as specified in charter)
82 Devonshire St., Boston, Massachusetts 02109
(Address of principal executive offices) (Zip code)
Scott C. Goebel, Secretary
82 Devonshire St.
Boston, Massachusetts 02109
(Name and address of agent for service)
Registrant's telephone number, including area code: 617-563-7000
Date of fiscal year end: | July 31 |
| |
Date of reporting period: | July 31, 2011 |
Item 1. Reports to Stockholders

Fidelity Advisor
Focus Funds®
Class A, Class T, Class B and Class C
Fidelity Advisor® Biotechnology Fund
Fidelity Advisor Communications Equipment Fund
Fidelity Advisor Consumer Discretionary Fund
Fidelity Advisor Electronics Fund
Fidelity Advisor Energy Fund
Fidelity Advisor Financial Services Fund
Fidelity Advisor Health Care Fund
Fidelity Advisor Industrials Fund
Fidelity Advisor Technology Fund
Fidelity Advisor Utilities Fund
Annual Report
July 31, 2011
(2_fidelity_logos) (Registered_Trademark)
Contents
To view a fund's proxy voting guidelines and proxy voting record for the 12-month period ended June 30, visit http://www.fidelity.com/proxyvotingresults or visit the Securities and Exchange Commission's (SEC) web site at http://www.sec.gov. You may also call 1-877-208-0098 to request a free copy of the proxy voting guidelines.
Standard & Poor's, S&P and S&P 500 are registered service marks of The McGraw-Hill Companies, Inc. and have been licensed for use by Fidelity Distributors Corporation.
Other third party marks appearing herein are the property of their respective owners.
All other marks appearing herein are registered or unregistered trademarks or service marks of FMR LLC or an affiliated company.
This report and the financial statements contained herein are submitted for the general information of the shareholders of the funds. This report is not authorized for distribution to prospective investors in the funds unless preceded or accompanied by an effective prospectus.
A fund files its complete schedule of portfolio holdings with the SEC for the first and third quarters of each fiscal year on Form N-Q. Forms N-Q are available on the SEC's web site at http://www.sec.gov. A fund's Forms N-Q may be reviewed and copied at the SEC's Public Reference Room in Washington, DC. Information regarding the operation of the SEC's Public Reference Room may be obtained by calling 1-800-SEC-0330. For a complete list of a fund's portfolio holdings, view the most recent holdings listing, semiannual report, or annual report on Fidelity's web site at http://www.fidelity.com, http://www.advisor.fidelity.com, or http://www.401k.com, as applicable.
NOT FDIC INSURED • MAY LOSE VALUE • NO BANK GUARANTEE
Neither the funds nor Fidelity Distributors Corporation is a bank.
Annual Report
(photo_of_James_C_Curvey)
Dear Shareholder:
The second half of 2011 began with U.S. equities continuing to give back some of the gains achieved earlier in the year. In the days leading up to July 31, markets were shaken by a political stalemate in which Congress struggled to address the debt ceiling issue before an early-August deadline. The resulting uncertainty held back markets in July, the third consecutive monthly decline for equities, effectively reversing the positive momentum seen through the end of April. Financial markets are always unpredictable, of course, but there are several time-tested investment principles that can help put the odds in your favor.
One of the basic tenets is to invest for the long term. Over time, riding out the markets' inevitable ups and downs has proven much more effective than selling into panic or chasing the hottest trend. Even missing only a few of the markets' best days can significantly diminish investor returns. Patience also affords the benefits of compounding - of earning interest on additional income or reinvested dividends and capital gains. There can be tax advantages and cost benefits to consider as well. While staying the course doesn't eliminate risk, it can considerably lessen the effect of short-term declines.
You can further manage your investing risk through diversification. And today, more than ever, geographic diversification should be taken into account. Studies indicate that asset allocation is the single most important determinant of a portfolio's long-term success. The right mix of stocks, bonds and cash - aligned to your particular risk tolerance and investment objective - is very important. Age-appropriate rebalancing is also an essential aspect of asset allocation. For younger investors, an emphasis on equities - which historically have been the best-performing asset class over time - is encouraged. As investors near their specific goal, such as retirement or sending a child to college, consideration may be given to replacing volatile assets (e.g. common stocks) with more-stable fixed investments (bonds or savings plans).
A third principle - investing regularly - can help lower the average cost of your purchases. Investing a certain amount of money each month or quarter helps ensure you won't pay for all your shares at market highs. This strategy - known as dollar cost averaging - also reduces "emotion" from investing, helping shareholders avoid selling weak performers just prior to an upswing, or chasing a hot performer just before a correction.
We invite you to contact us via the Internet, through our Investor Centers or by phone. It is our privilege to provide you the information you need to make the investments that are right for you.
Sincerely,
(The acting chairman's signature appears here.)
James C. Curvey
Acting Chairman
Annual Report
Fidelity Advisor Biotechnology Fund - Class A, T, B, and C
Average annual total return reflects the change in the value of an investment, assuming reinvestment of the class' distributions from dividend income and capital gains (the profits earned upon the sale of securities that have grown in value, if any) and assuming a constant rate of performance each year. The $10,000 table and the fund's returns do not reflect the deduction of taxes that a shareholder would pay on fund distributions or the redemption of fund shares. During periods of reimbursement by Fidelity, a fund's total return will be greater than it would be had the reimbursement not occurred. How a fund did yesterday is no guarantee of how it will do tomorrow. Returns reflect the conversion of Class B shares to Class A shares after a maximum of seven years.
Average Annual Total Returns
Periods ended July 31, 2011 | Past 1
year | Past 5
years | Past 10 years |
Class A (incl. 5.75% sales charge) | 24.49% | 5.53% | 2.31% |
Class T (incl. 3.50% sales charge) | 27.08% | 5.76% | 2.30% |
Class B (incl. contingent deferred sales charge) A | 26.12% | 5.66% | 2.38% |
Class C (incl. contingent deferred sales charge) B | 30.07% | 6.01% | 2.16% |
A Class B shares' contingent deferred sales charges included in the past one year, past five years, and past ten years total return figures are 5%, 2%, and 0%, respectively.
B Class C shares' contingent deferred sales charges included in the past one year, past five years, and past ten years total return figures are 1%, 0%, and 0%, respectively.
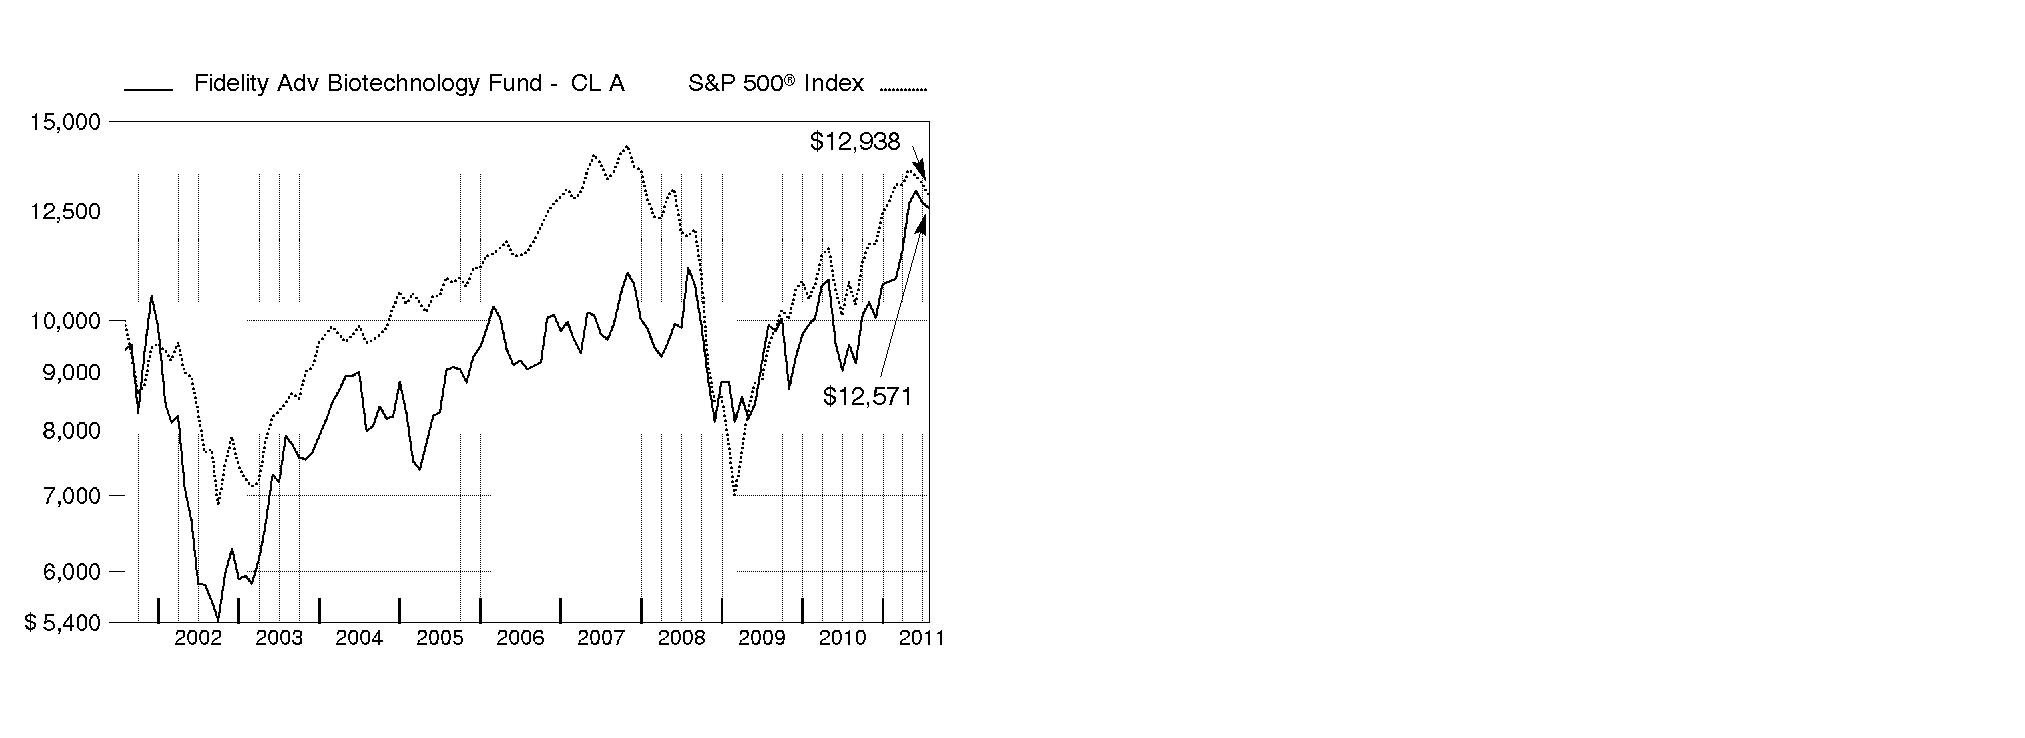
$10,000 Over 10 Years
Let's say hypothetically that $10,000 was invested in Fidelity Advisor® Biotechnology Fund - Class A on July 31, 2001, and the current 5.75% sales charge was paid. The chart shows how the value of your investment would have changed, and also shows how the S&P 500® Index performed over the same period.
Annual Report
Fidelity Advisor Biotechnology Fund
Market Recap: U.S. stocks registered solid double-digit gains for the 12 months ending July 31, 2011, extending a rally that began more than two years earlier. Despite a rough start in August 2010, markets turned positive in September, as increased demand for capital goods and other upbeat indicators trumped investor worry about a U.S. recessionary relapse. The broad market, as measured by the S&P 500® Index, rose 9% that month, its biggest September gain in 71 years. Seven more monthly advances followed, fueled by encouraging corporate earnings and economic activity. However, volatility picked up in the period's latter months, as markets reacted to continued high U.S. unemployment, nagging debt troubles in Europe and looming legislative battles over the federal debt ceiling. May unemployment rose above 9% for the first time in 2011, contributing to a traditional "June swoon" for stocks. Market uncertainty lingered in July, when the S&P 500® posted its second-biggest monthly loss of the period. For the full year, the S&P 500® climbed 19.65%, while the blue-chip-laden Dow Jones Industrial AverageSM rose a comparable 19.09% and the technology-heavy Nasdaq Composite® Index gained 23.40%. On the capitalization spectrum, stocks of mid-cap companies fared best, with the Russell Midcap® Index rising 24.51% and the small-cap Russell 2000® Index adding 23.92%.
Comments from Rajiv Kaul, Portfolio Manager of Fidelity Advisor® Biotechnology Fund: For the year, the fund's Class A, Class T, Class B and Class C shares returned 32.08%, 31.69%, 31.12% and 31.07%, respectively (excluding sales charges), well ahead of the S&P 500 and the 23.75% advance of the MSCI® U.S. IM Biotechnology 25/50 Index. Versus the MSCI index, stock selection in biotechnology aided relative performance, as did out-of-benchmark exposure to pharmaceuticals. The fund's emphasis on mid- and small-cap stocks was particularly beneficial. Alexion Pharmaceuticals was the fund's top individual contributor, fueled by the success of the company's Soliris® medication. Other contributors included Questcor Pharmaceuticals, which was an out-of-benchmark position, and three notable underweightings: Celgene, Gilead Sciences and Amgen. Conversely, Acorda Therapeutics was the fund's largest relative detractor, as sales of AMPYRA®, the company's multiple sclerosis medication, were disappointing. Out-of-index positions in vaccine developer Antigenics, which in January changed its name to Agenus, and in Auxilium Pharmaceuticals also performed poorly. Largely avoiding ZymoGenetics, an index component whose stock price nearly doubled following news of the company's acquisition by Bristol-Myers Squibb during the fourth quarter of 2010, also dampened performance.
Comments from Rajiv Kaul, Portfolio Manager of Fidelity® Advisor Biotechnology Fund: For the year, the fund's Institutional Class shares returned 32.46%, well ahead of the S&P 500 and the 23.75% advance of the MSCI® U.S. IM Biotechnology 25/50 Index. Versus the MSCI index, stock selection in biotechnology aided relative performance, as did out-of-benchmark exposure to pharmaceuticals. The fund's emphasis on mid- and small-cap stocks was particularly beneficial. Alexion Pharmaceuticals was the fund's top individual contributor, fueled by the success of the company's Soliris® medication. Other contributors included Questcor Pharmaceuticals, which was an out-of-benchmark position, and three notable underweightings: Celgene, Gilead Sciences and Amgen. Conversely, Acorda Therapeutics was the fund's largest relative detractor, as sales of AMPYRA®, the company's multiple sclerosis medication, were disappointing. Out-of-index positions in vaccine developer Antigenics, which in January changed its name to Agenus, and in Auxilium Pharmaceuticals also performed poorly. Largely avoiding ZymoGenetics, an index component whose stock price nearly doubled following news of the company's acquisition by Bristol-Myers Squibb during the fourth quarter of 2010, also dampened performance.
The views expressed above reflect those of the portfolio manager(s) only through the end of the period as stated on the cover of this report and do not necessarily represent the views of Fidelity or any other person in the Fidelity organization. Any such views are subject to change at any time based upon market or other conditions and Fidelity disclaims any responsibility to update such views. These views may not be relied on as investment advice and, because investment decisions for a Fidelity fund are based on numerous factors, may not be relied on as an indication of trading intent on behalf of any Fidelity fund.
Annual Report
Fidelity Advisor Biotechnology Fund
As a shareholder of the Fund, you incur two types of costs: (1) transaction costs, including sales charges (loads) on purchase payments or redemption proceeds, redemption fees, and (2) ongoing costs, including management fees, distribution and/or service (12b-1) fees and other Fund expenses. This Example is intended to help you understand your ongoing costs (in dollars) of investing in the Fund and to compare these costs with the ongoing costs of investing in other mutual funds.
The Example is based on an investment of $1,000 invested at the beginning of the period and held for the entire period (February 1, 2011 to July 31, 2011).
Actual Expenses
The first line of the accompanying table for each class of the Fund provides information about actual account values and actual expenses. You may use the information in this line, together with the amount you invested, to estimate the expenses that you paid over the period. Simply divide your account value by $1,000.00 (for example, an $8,600 account value divided by $1,000.00 = 8.6), then multiply the result by the number in the first line for a class of the Fund under the heading entitled "Expenses Paid During Period" to estimate the expenses you paid on your account during this period. In addition, the Fund, as a shareholder in the underlying Fidelity Central Funds, will indirectly bear its pro-rata share of the fees and expenses incurred by the underlying Fidelity Central Funds. These fees and expenses are not included in the Fund's annualized expense ratio used to calculate the expense estimate in the table below.
Hypothetical Example for Comparison Purposes
The second line of the accompanying table for each class of the Fund provides information about hypothetical account values and hypothetical expenses based on a Class' actual expense ratio and an assumed rate of return of 5% per year before expenses, which is not the Class' actual return. The hypothetical account values and expenses may not be used to estimate the actual ending account balance or expenses you paid for the period. You may use this information to compare the ongoing costs of investing in the Fund and other funds. To do so, compare this 5% hypothetical example with the 5% hypothetical examples that appear in the shareholder reports of the other funds. In addition, the Fund, as a shareholder in the underlying Fidelity Central Funds, will indirectly bear its pro-rata share of the fees and expenses incurred by the underlying Fidelity Central Funds. These fees and expenses are not included in the Fund's annualized expense ratio used to calculate the expense estimate in the table below.
Please note that the expenses shown in the table are meant to highlight your ongoing costs only and do not reflect any transaction costs. Therefore, the second line of the table is useful in comparing ongoing costs only, and will not help you determine the relative total costs of owning different funds. In addition, if these transactional costs were included, your costs would have been higher.
| Annualized
Expense Ratio | Beginning
Account Value
February 1, 2011 | Ending
Account Value
July 31, 2011 | Expenses Paid
During Period*
February 1, 2011 to
July 31, 2011 |
Class A | 1.30% | | | |
Actual | | $ 1,000.00 | $ 1,160.70 | $ 6.96 |
HypotheticalA | | $ 1,000.00 | $ 1,018.35 | $ 6.51 |
Class T | 1.64% | | | |
Actual | | $ 1,000.00 | $ 1,159.90 | $ 8.78 |
HypotheticalA | | $ 1,000.00 | $ 1,016.66 | $ 8.20 |
Class B | 2.04% | | | |
Actual | | $ 1,000.00 | $ 1,155.70 | $ 10.90 |
HypotheticalA | | $ 1,000.00 | $ 1,014.68 | $ 10.19 |
Class C | 2.05% | | | |
Actual | | $ 1,000.00 | $ 1,157.10 | $ 10.96 |
HypotheticalA | | $ 1,000.00 | $ 1,014.63 | $ 10.24 |
Institutional Class | .97% | | | |
Actual | | $ 1,000.00 | $ 1,162.20 | $ 5.20 |
HypotheticalA | | $ 1,000.00 | $ 1,019.98 | $ 4.86 |
A 5% return per year before expenses
* Expenses are equal to each Class' annualized expense ratio, multiplied by the average account value over the period, multiplied by 181/365 (to reflect the one-half year period).
Annual Report
Fidelity Advisor Biotechnology Fund
Investment Changes (Unaudited)
Top Ten Stocks as of July 31, 2011 |
| % of fund's
net assets | % of fund's net assets
6 months ago |
Amgen, Inc. | 15.7 | 18.4 |
Gilead Sciences, Inc. | 9.8 | 2.8 |
Biogen Idec, Inc. | 5.6 | 3.2 |
Alexion Pharmaceuticals, Inc. | 5.2 | 6.7 |
Vertex Pharmaceuticals, Inc. | 4.4 | 6.1 |
BioMarin Pharmaceutical, Inc. | 3.8 | 2.6 |
Celgene Corp. | 3.5 | 0.0 |
InterMune, Inc. | 2.6 | 2.7 |
Pharmasset, Inc. | 2.5 | 1.5 |
United Therapeutics Corp. | 2.1 | 4.4 |
| 55.2 | |
Top Industries (% of fund's net assets) |
As of July 31, 2011 |
 | Biotechnology | 89.6% | |
 | Pharmaceuticals | 7.0% | |
 | Health Care Equipment & Supplies | 0.1% | |
 | All Others* | 3.3% | |

As of January 31, 2011 |
| Biotechnology | 91.7% | |
| Pharmaceuticals | 7.8% | |
| Health Care Equipment & Supplies | 0.0% | |
| All Others* | 0.5% | |

* Includes short-term investments and net other assets. |
Annual Report
Fidelity Advisor Biotechnology Fund
Investments July 31, 2011
Showing Percentage of Net Assets
Common Stocks - 96.7% |
| Shares | | Value |
BIOTECHNOLOGY - 89.6% |
Biotechnology - 89.6% |
Acadia Pharmaceuticals, Inc. (a) | 59,446 | | $ 96,897 |
Acorda Therapeutics, Inc. (a) | 36,779 | | 1,044,524 |
ADVENTRX Pharmaceuticals, Inc. (a)(d) | 37,232 | | 109,834 |
Affymax, Inc. (a) | 4,506 | | 29,785 |
Agenus, Inc. (a)(d) | 21,100 | | 16,142 |
Agenus, Inc. warrants 1/9/18 (a) | 452,000 | | 45,605 |
Alexion Pharmaceuticals, Inc. (a) | 67,890 | | 3,856,152 |
Alkermes, Inc. (a) | 37,961 | | 654,448 |
Allos Therapeutics, Inc. (a) | 55,750 | | 103,695 |
Alnylam Pharmaceuticals, Inc. (a) | 13,498 | | 126,611 |
AMAG Pharmaceuticals, Inc. (a)(d) | 39,471 | | 584,566 |
Amarin Corp. PLC ADR (a) | 8,900 | | 120,506 |
Amgen, Inc. | 213,776 | | 11,693,545 |
Amylin Pharmaceuticals, Inc. (a) | 53,384 | | 635,803 |
Ardea Biosciences, Inc. (a) | 3,300 | | 77,220 |
ARIAD Pharmaceuticals, Inc. (a)(d) | 69,106 | | 821,670 |
ArQule, Inc. (a) | 24,866 | | 139,250 |
AVEO Pharmaceuticals, Inc. (a) | 10,500 | | 200,655 |
Biogen Idec, Inc. (a) | 41,126 | | 4,189,506 |
BioInvent International AB (a) | 28,800 | | 88,343 |
BioMarin Pharmaceutical, Inc. (a)(d) | 91,134 | | 2,846,115 |
Bionovo, Inc. (a) | 73,900 | | 57,642 |
Bionovo, Inc. warrants 1/21/16 (a) | 56,850 | | 18,008 |
Catalyst Pharmaceutical Partners, Inc. (a) | 82,595 | | 128,022 |
Celgene Corp. (a) | 43,718 | | 2,592,477 |
Cell Therapeutics, Inc. (a) | 185,219 | | 250,046 |
Cell Therapeutics, Inc. warrants 7/6/16 (a) | 46,404 | | 41,468 |
Cepheid, Inc. (a) | 23,300 | | 879,808 |
Chelsea Therapeutics International Ltd. (a) | 11,860 | | 59,537 |
China Biologic Products, Inc. (a)(d) | 4,867 | | 45,750 |
Codexis, Inc. (a) | 12,700 | | 114,300 |
Cubist Pharmaceuticals, Inc. (a) | 24,792 | | 842,184 |
Dendreon Corp. (a) | 40,933 | | 1,510,428 |
Dynavax Technologies Corp. (a) | 50,600 | | 141,680 |
Enzon Pharmaceuticals, Inc. (a)(d) | 26,034 | | 253,050 |
Exelixis, Inc. (a) | 63,245 | | 486,987 |
Genomic Health, Inc. (a) | 11,428 | | 306,842 |
Geron Corp. (a)(d) | 64,461 | | 248,175 |
Gilead Sciences, Inc. (a) | 172,043 | | 7,287,741 |
Halozyme Therapeutics, Inc. (a) | 42,400 | | 294,256 |
Horizon Pharma, Inc. | 29,700 | | 268,488 |
Human Genome Sciences, Inc. (a)(d) | 60,208 | | 1,264,970 |
Idenix Pharmaceuticals, Inc. (a) | 129,831 | | 867,271 |
ImmunoGen, Inc. (a) | 16,200 | | 219,186 |
Incyte Corp. (a)(d) | 47,838 | | 834,295 |
Inhibitex, Inc. (a) | 29,900 | | 123,786 |
InterMune, Inc. (a) | 57,331 | | 1,913,709 |
Ironwood Pharmaceuticals, Inc. Class A (a) | 12,732 | | 190,343 |
|
| Shares | | Value |
Isis Pharmaceuticals, Inc. (a) | 500 | | $ 4,320 |
Keryx Biopharmaceuticals, Inc. (a)(d) | 34,100 | | 150,381 |
Lexicon Pharmaceuticals, Inc. (a) | 200,961 | | 337,614 |
Ligand Pharmaceuticals, Inc. Class B (a) | 9,614 | | 130,943 |
Medivation, Inc. (a) | 23,213 | | 492,580 |
Metabolix, Inc. (a) | 17,330 | | 118,364 |
Micromet, Inc. (a)(d) | 17,700 | | 100,182 |
Momenta Pharmaceuticals, Inc. (a)(d) | 22,829 | | 403,160 |
Myrexis, Inc. (a) | 302 | | 1,024 |
Neurocrine Biosciences, Inc. (a) | 37,106 | | 286,829 |
NPS Pharmaceuticals, Inc. (a) | 95,000 | | 917,700 |
Oncothyreon, Inc. (a)(d) | 4,574 | | 36,638 |
ONYX Pharmaceuticals, Inc. (a) | 24,501 | | 808,043 |
Opko Health, Inc. (a) | 81,400 | | 354,090 |
OREXIGEN Therapeutics, Inc. (a) | 30,600 | | 50,490 |
PDL BioPharma, Inc. (d) | 55,288 | | 342,233 |
Pharmacyclics, Inc. (a) | 8,300 | | 103,833 |
Pharmasset, Inc. (a) | 15,417 | | 1,871,315 |
PolyMedix, Inc. (a) | 327,666 | | 229,366 |
PolyMedix, Inc. warrants 4/10/16 (a) | 163,833 | | 54,248 |
Progenics Pharmaceuticals, Inc. (a) | 53,400 | | 291,564 |
Protalix BioTherapeutics, Inc. (a)(d) | 20,990 | | 135,176 |
Protox Therapeutics, Inc. (a) | 138,000 | | 72,221 |
Regeneron Pharmaceuticals, Inc. (a) | 20,047 | | 1,063,694 |
Rigel Pharmaceuticals, Inc. (a) | 46,170 | | 401,217 |
Sangamo Biosciences, Inc. (a)(d) | 23,828 | | 129,148 |
Savient Pharmaceuticals, Inc. (a)(d) | 9,755 | | 68,285 |
Seattle Genetics, Inc. (a)(d) | 43,481 | | 740,481 |
SIGA Technologies, Inc. (a)(d) | 23,912 | | 181,970 |
Spectrum Pharmaceuticals, Inc. (a)(d) | 104,676 | | 1,109,566 |
Synta Pharmaceuticals Corp. (a) | 18,783 | | 87,717 |
Targacept, Inc. (a) | 14,300 | | 292,292 |
Theravance, Inc. (a)(d) | 29,078 | | 621,688 |
Threshold Pharmaceuticals, Inc. (a) | 87,866 | | 146,736 |
Threshold Pharmaceuticals, Inc. warrants 3/16/16 (a) | 35,146 | | 30,640 |
United Therapeutics Corp. (a) | 26,752 | | 1,535,030 |
Vertex Pharmaceuticals, Inc. (a) | 63,815 | | 3,309,446 |
Vical, Inc. (a) | 94,477 | | 454,434 |
ZIOPHARM Oncology, Inc. (a)(d) | 80,500 | | 437,920 |
Zogenix, Inc. | 47,489 | | 241,244 |
| | 66,865,143 |
HEALTH CARE EQUIPMENT & SUPPLIES - 0.1% |
Health Care Equipment - 0.1% |
Alsius Corp. (a) | 14,200 | | 0 |
Aradigm Corp. (a) | 21,800 | | 3,989 |
Aradigm Corp. (e) | 329,640 | | 54,292 |
| | 58,281 |
PHARMACEUTICALS - 7.0% |
Pharmaceuticals - 7.0% |
AcelRx Pharmaceuticals, Inc. | 58,400 | | 241,776 |
Adolor Corp. (a) | 199,599 | | 443,110 |
Common Stocks - continued |
| Shares | | Value |
PHARMACEUTICALS - CONTINUED |
Pharmaceuticals - continued |
Aegerion Pharmaceuticals, Inc. | 8,900 | | $ 139,819 |
Akorn, Inc. (a) | 15,479 | | 107,269 |
Auxilium Pharmaceuticals, Inc. (a)(d) | 42,158 | | 790,041 |
AVANIR Pharmaceuticals Class A (a)(d) | 113,980 | | 427,425 |
Columbia Laboratories, Inc. (a) | 6,400 | | 18,304 |
Corcept Therapeutics, Inc. (a) | 64,600 | | 231,268 |
Elan Corp. PLC sponsored ADR (a) | 82,050 | | 907,473 |
Jazz Pharmaceuticals, Inc. (a) | 3,943 | | 159,573 |
NuPathe, Inc. | 900 | | 6,210 |
Optimer Pharmaceuticals, Inc. (a)(d) | 27,915 | | 295,341 |
Pacira Pharmaceuticals, Inc. | 16,732 | | 167,655 |
Questcor Pharmaceuticals, Inc. (a) | 16,116 | | 500,402 |
Ventrus Biosciences, Inc. | 38,695 | | 467,823 |
XenoPort, Inc. (a) | 46,025 | | 326,317 |
| | 5,229,806 |
TOTAL COMMON STOCKS (Cost $57,275,134) | 72,153,230 |
Money Market Funds - 13.9% |
| Shares | | Value |
Fidelity Cash Central Fund, 0.14% (b) | 2,191,523 | | $ 2,191,523 |
Fidelity Securities Lending Cash Central Fund, 0.15% (b)(c) | 8,211,549 | | 8,211,549 |
TOTAL MONEY MARKET FUNDS (Cost $10,403,072) | 10,403,072 |
TOTAL INVESTMENT PORTFOLIO - 110.6% (Cost $67,678,206) | 82,556,302 |
NET OTHER ASSETS (LIABILITIES) - (10.6)% | | (7,923,162) |
NET ASSETS - 100% | $ 74,633,140 |
Legend |
(a) Non-income producing |
(b) Affiliated fund that is available only to investment companies and other accounts managed by Fidelity Investments. The rate quoted is the annualized seven-day yield of the fund at period end. A complete unaudited listing of the fund's holdings as of its most recent quarter end is available upon request. In addition, each Fidelity Central Fund's financial statements, which are not covered by the Fund's Report of Independent Registered Public Accounting Firm, are available on the SEC's website or upon request. |
(c) Investment made with cash collateral received from securities on loan. |
(d) Security or a portion of the security is on loan at period end. |
(e) Restricted securities - Investment in securities not registered under the Securities Act of 1933 (excluding 144A issues). At the end of the period, the value of restricted securities (excluding 144A issues) amounted to $54,292 or 0.1% of net assets. |
Additional information on each restricted holding is as follows: |
Security | Acquisition Date | Acquisition Cost |
Aradigm Corp. | 7/6/11 | $ 62,632 |
Affiliated Central Funds |
Information regarding fiscal year to date income earned by the Fund from investments in Fidelity Central Funds is as follows: |
Fund | Income earned |
Fidelity Cash Central Fund | $ 1,208 |
Fidelity Securities Lending Cash Central Fund | 145,035 |
Total | $ 146,243 |
Other Information |
The following is a summary of the inputs used, as of July 31, 2011, involving the Fund's assets and liabilities carried at fair value. The inputs or methodology used for valuing securities may not be an indication of the risk associated with investing in those securities. For more information on valuation inputs, and their aggregation into the levels used in the table below, please refer to the Security Valuation section in the accompanying Notes to Financial Statements. |
Valuation Inputs at Reporting Date: |
Description | Total | Level 1 | Level 2 | Level 3 |
Investments in Securities: | | | | |
Common Stocks | $ 72,153,230 | $ 71,908,969 | $ 244,261 | $ - |
Money Market Funds | 10,403,072 | 10,403,072 | - | - |
Total Investments in Securities: | $ 82,556,302 | $ 82,312,041 | $ 244,261 | $ - |
Income Tax Information |
At July 31, 2011, the fund had a capital loss carryforward of approximately $1,530,367 all of which will expire in fiscal year 2017. Capital loss carryforward are only available to offset future capital gains of the Fund to the extent provided by regulations and may be limited. |
See accompanying notes which are an integral part of the financial statements.
Annual Report
Fidelity Advisor Biotechnology Fund
Statement of Assets and Liabilities
| July 31, 2011 |
| | |
Assets | | |
Investment in securities, at value (including securities loaned of $8,120,986) - See accompanying schedule: Unaffiliated issuers (cost $57,275,134) | $ 72,153,230 | |
Fidelity Central Funds (cost $10,403,072) | 10,403,072 | |
Total Investments (cost $67,678,206) | | $ 82,556,302 |
Receivable for investments sold | | 1,746,646 |
Receivable for fund shares sold | | 203,081 |
Distributions receivable from Fidelity Central Funds | | 17,106 |
Other receivables | | 1,757 |
Total assets | | 84,524,892 |
| | |
Liabilities | | |
Payable to custodian bank | $ 64,757 | |
Payable for investments purchased | 1,233,043 | |
Payable for fund shares redeemed | 262,107 | |
Accrued management fee | 35,339 | |
Distribution and service plan fees payable | 31,330 | |
Other affiliated payables | 19,582 | |
Other payables and accrued expenses | 34,045 | |
Collateral on securities loaned, at value | 8,211,549 | |
Total liabilities | | 9,891,752 |
| | |
Net Assets | | $ 74,633,140 |
Net Assets consist of: | | |
Paid in capital | | $ 62,179,088 |
Accumulated net investment loss | | (755) |
Accumulated undistributed net realized gain (loss) on investments and foreign currency transactions | | (2,423,289) |
Net unrealized appreciation (depreciation) on investments | | 14,878,096 |
Net Assets | | $ 74,633,140 |
Statement of Assets and Liabilities - continued
| July 31, 2011 |
| | |
Calculation of Maximum Offering Price Class A:
Net Asset Value and redemption price per share ($30,639,078 ÷ 3,478,612 shares) | | $ 8.81 |
| | |
Maximum offering price per share (100/94.25 of $8.81) | | $ 9.35 |
Class T:
Net Asset Value and redemption price per share ($16,454,237 ÷ 1,923,088 shares) | | $ 8.56 |
| | |
Maximum offering price per share (100/96.50 of $8.56) | | $ 8.87 |
Class B:
Net Asset Value and offering price per share ($5,849,306 ÷ 722,750 shares)A | | $ 8.09 |
| | |
Class C:
Net Asset Value and offering price per share ($15,787,398 ÷ 1,950,090 shares)A | | $ 8.10 |
| | |
Institutional Class:
Net Asset Value, offering price and redemption price per share ($5,903,121 ÷ 648,673 shares) | | $ 9.10 |
A Redemption price per share is equal to net asset value less any applicable contingent deferred sales charge.
See accompanying notes which are an integral part of the financial statements.
Annual Report
Fidelity Advisor Biotechnology Fund
Financial Statements - continued
Statement of Operations
| Year ended July 31, 2011 |
| | |
Investment Income | | |
Dividends | | $ 31,001 |
Special dividends | | 76,944 |
Interest | | 1 |
Income from Fidelity Central Funds (including $145,035 from security lending) | | 146,243 |
Total income | | 254,189 |
| | |
Expenses | | |
Management fee | $ 330,558 | |
Transfer agent fees | 181,956 | |
Distribution and service plan fees | 312,037 | |
Accounting and security lending fees | 24,080 | |
Custodian fees and expenses | 15,889 | |
Independent trustees' compensation | 309 | |
Registration fees | 56,448 | |
Audit | 43,969 | |
Legal | 281 | |
Miscellaneous | 585 | |
Total expenses before reductions | 966,112 | |
Expense reductions | (3,845) | 962,267 |
Net investment income (loss) | | (708,078) |
Realized and Unrealized Gain (Loss) Net realized gain (loss) on: | | |
Investment securities: | | |
Unaffiliated issuers | 5,234,979 | |
Foreign currency transactions | (777) | |
Total net realized gain (loss) | | 5,234,202 |
Change in net unrealized appreciation (depreciation) on investment securities | | 11,018,770 |
Net gain (loss) | | 16,252,972 |
Net increase (decrease) in net assets resulting from operations | | $ 15,544,894 |
Statement of Changes in Net Assets
| Year ended
July 31,
2011 | Year ended
July 31,
2010 |
Increase (Decrease) in Net Assets | | |
Operations | | |
Net investment income (loss) | $ (708,078) | $ (784,049) |
Net realized gain (loss) | 5,234,202 | (2,345,490) |
Change in net unrealized appreciation (depreciation) | 11,018,770 | 88,127 |
Net increase (decrease) in net assets resulting from operations | 15,544,894 | (3,041,412) |
Share transactions - net increase (decrease) | 6,522,296 | 684,738 |
Redemption fees | 3,193 | 1,690 |
Total increase (decrease) in net assets | 22,070,383 | (2,354,984) |
| | |
Net Assets | | |
Beginning of period | 52,562,757 | 54,917,741 |
End of period (including accumulated net investment loss of $755 and undistributed net investment income of $0, respectively) | $ 74,633,140 | $ 52,562,757 |
See accompanying notes which are an integral part of the financial statements.
Annual Report
Financial Highlights - Class A
Years ended July 31, | 2011 | 2010 | 2009 | 2008 | 2007 |
Selected Per-Share Data | | | | | |
Net asset value, beginning of period | $ 6.67 | $ 6.94 | $ 7.81 | $ 7.23 | $ 6.81 |
Income from Investment Operations | | | | | |
Net investment income (loss) C | (.07) F | (.08) G | (.08) | (.09) H | (.09) |
Net realized and unrealized gain (loss) | 2.21 | (.19) | (.79) | 1.20 | .51 |
Total from investment operations | 2.14 | (.27) | (.87) | 1.11 | .42 |
Distributions from net realized gain | - | - | - | (.53) | - |
Redemption fees added to paid in capital C, J | - | - | - | - | - |
Net asset value, end of period | $ 8.81 | $ 6.67 | $ 6.94 | $ 7.81 | $ 7.23 |
Total Return A, B | 32.08% | (3.89)% | (11.14)% | 15.95% | 6.17% |
Ratios to Average Net Assets D, I | | | | | |
Expenses before reductions | 1.35% | 1.39% | 1.40% | 1.37% | 1.42% |
Expenses net of fee waivers, if any | 1.35% | 1.39% | 1.40% | 1.37% | 1.40% |
Expenses net of all reductions | 1.34% | 1.38% | 1.40% | 1.37% | 1.40% |
Net investment income (loss) | (.91)% F | (1.15)% G | (1.27)% | (1.24)% H | (1.25)% |
Supplemental Data | | | | | |
Net assets, end of period (000 omitted) | $ 30,639 | $ 20,154 | $ 19,858 | $ 18,249 | $ 13,081 |
Portfolio turnover rate E | 99% | 130% | 73% | 132% | 120% |
A Total returns would have been lower if certain expenses had not been reduced during the applicable periods shown.
B Total returns do not include the effect of the sales charges.
C Calculated based on average shares outstanding during the period.
D Fees and expenses of any underlying Fidelity Central Funds are not included in the Fund's expense ratio. The Fund indirectly bears its proportionate share of the expenses of any underlying Fidelity Central Funds.
E Amount does not include the portfolio activity of any underlying Fidelity Central Funds.
F Investment income per share reflects a special dividend which amounted to $.01 per share. Excluding the special dividend, the ratio of net investment income (loss) to average net assets would have been (1.04)%.
G Investment income per share reflects a special dividend which amounted to $.01 per share. Excluding the special dividend, the ratio of net investment income (loss) to average net assets would have been (1.29)%.
H Investment income per share reflects a special dividend which amounted to $.01 per share. Excluding the special dividend, the ratio of net investment income (loss) to average net assets would have been (1.33)%.
I Expense ratios reflect operating expenses of the class. Expenses before reductions do not reflect amounts reimbursed by the investment adviser or reductions from brokerage service arrangements or reductions from other expense offset arrangements and do not represent the amount paid by the class during periods when reimbursements or reductions occur. Expenses net of fee waivers reflect expenses after reimbursement by the investment adviser but prior to reductions from brokerage service arrangements or other expense offset arrangements. Expenses net of all reductions represent the net expenses paid by the class.
J Amount represents less than $.01 per share.
Financial Highlights - Class T
Years ended July 31, | 2011 | 2010 | 2009 | 2008 | 2007 |
Selected Per-Share Data | | | | | |
Net asset value, beginning of period | $ 6.50 | $ 6.78 | $ 7.65 | $ 7.11 | $ 6.71 |
Income from Investment Operations | | | | | |
Net investment income (loss) C | (.09) F | (.09) G | (.09) | (.11) H | (.11) |
Net realized and unrealized gain (loss) | 2.15 | (.19) | (.78) | 1.18 | .51 |
Total from investment operations | 2.06 | (.28) | (.87) | 1.07 | .40 |
Distributions from net realized gain | - | - | - | (.53) | - |
Redemption fees added to paid in capital C, J | - | - | - | - | - |
Net asset value, end of period | $ 8.56 | $ 6.50 | $ 6.78 | $ 7.65 | $ 7.11 |
Total Return A, B | 31.69% | (4.13)% | (11.37)% | 15.64% | 5.96% |
Ratios to Average Net Assets D, I | | | | | |
Expenses before reductions | 1.64% | 1.69% | 1.71% | 1.69% | 1.75% |
Expenses net of fee waivers, if any | 1.64% | 1.65% | 1.65% | 1.65% | 1.65% |
Expenses net of all reductions | 1.64% | 1.64% | 1.65% | 1.65% | 1.65% |
Net investment income (loss) | (1.21)% F | (1.41)% G | (1.52)% | (1.53)% H | (1.49)% |
Supplemental Data | | | | | |
Net assets, end of period (000 omitted) | $ 16,454 | $ 11,684 | $ 13,356 | $ 15,123 | $ 13,008 |
Portfolio turnover rate E | 99% | 130% | 73% | 132% | 120% |
A Total returns would have been lower if certain expenses had not been reduced during the applicable periods shown.
B Total returns do not include the effect of the sales charges.
C Calculated based on average shares outstanding during the period.
D Fees and expenses of any underlying Fidelity Central Funds are not included in the Fund's expense ratio. The Fund indirectly bears its proportionate share of the expenses of any underlying Fidelity Central Funds.
E Amount does not include the portfolio activity of any underlying Fidelity Central Funds.
F Investment income per share reflects a special dividend which amounted to $.01 per share. Excluding the special dividend, the ratio of net investment income (loss) to average net assets would have been (1.34)%.
G Investment income per share reflects a special dividend which amounted to $.01 per share. Excluding the special dividend, the ratio of net investment income (loss) to average net assets would have been (1.55)%.
H Investment income per share reflects a special dividend which amounted to $.01 per share. Excluding the special dividend, the ratio of net investment income (loss) to average net assets would have been (1.61)%.
I Expense ratios reflect operating expenses of the class. Expenses before reductions do not reflect amounts reimbursed by the investment adviser or reductions from brokerage service arrangements or reductions from other expense offset arrangements and do not represent the amount paid by the class during periods when reimbursements or reductions occur. Expenses net of fee waivers reflect expenses after reimbursement by the investment adviser but prior to reductions from brokerage service arrangements or other expense offset arrangements. Expenses net of all reductions represent the net expenses paid by the class.
J Amount represents less than $.01 per share.
See accompanying notes which are an integral part of the financial statements.
Annual Report
Financial Highlights - Class B
Years ended July 31, | 2011 | 2010 | 2009 | 2008 | 2007 |
Selected Per-Share Data | | | | | |
Net asset value, beginning of period | $ 6.17 | $ 6.47 | $ 7.34 | $ 6.88 | $ 6.52 |
Income from Investment Operations | | | | | |
Net investment income (loss) C | (.12) F | (.12) G | (.12) | (.14) H | (.14) |
Net realized and unrealized gain (loss) | 2.04 | (.18) | (.75) | 1.13 | .50 |
Total from investment operations | 1.92 | (.30) | (.87) | .99 | .36 |
Distributions from net realized gain | - | - | - | (.53) | - |
Redemption fees added to paid in capital C, J | - | - | - | - | - |
Net asset value, end of period | $ 8.09 | $ 6.17 | $ 6.47 | $ 7.34 | $ 6.88 |
Total Return A, B | 31.12% | (4.64)% | (11.85)% | 14.96% | 5.52% |
Ratios to Average Net Assets D, I | | | | | |
Expenses before reductions | 2.10% | 2.14% | 2.15% | 2.12% | 2.17% |
Expenses net of fee waivers, if any | 2.10% | 2.14% | 2.15% | 2.12% | 2.15% |
Expenses net of all reductions | 2.09% | 2.13% | 2.15% | 2.12% | 2.15% |
Net investment income (loss) | (1.66)% F | (1.90)% G | (2.02)% | (2.00)% H | (1.99)% |
Supplemental Data | | | | | |
Net assets, end of period (000 omitted) | $ 5,849 | $ 6,297 | $ 7,377 | $ 11,044 | $ 12,656 |
Portfolio turnover rate E | 99% | 130% | 73% | 132% | 120% |
A Total returns would have been lower if certain expenses had not been reduced during the applicable periods shown.
B Total returns do not include the effect of the contingent deferred sales charge.
C Calculated based on average shares outstanding during the period.
D Fees and expenses of any underlying Fidelity Central Funds are not included in the Fund's expense ratio. The Fund indirectly bears its proportionate share of the expenses of any underlying Fidelity Central Funds.
E Amount does not include the portfolio activity of any underlying Fidelity Central Funds.
F Investment income per share reflects a special dividend which amounted to $.01 per share. Excluding the special dividend, the ratio of net investment income (loss) to average net assets would have been (1.79)%.
G Investment income per share reflects a special dividend which amounted to $.01 per share. Excluding the special dividend, the ratio of net investment income (loss) to average net assets would have been (2.04)%.
H Investment income per share reflects a special dividend which amounted to $.01 per share. Excluding the special dividend, the ratio of net investment income (loss) to average net assets would have been (2.08)%.
I Expense ratios reflect operating expenses of the class. Expenses before reductions do not reflect amounts reimbursed by the investment adviser or reductions from brokerage service arrangements or reductions from other expense offset arrangements and do not represent the amount paid by the class during periods when reimbursements or reductions occur. Expenses net of fee waivers reflect expenses after reimbursement by the investment adviser but prior to reductions from brokerage service arrangements or other expense offset arrangements. Expenses net of all reductions represent the net expenses paid by the class.
J Amount represents less than $.01 per share.
Financial Highlights - Class C
Years ended July 31, | 2011 | 2010 | 2009 | 2008 | 2007 |
Selected Per-Share Data | | | | | |
Net asset value, beginning of period | $ 6.18 | $ 6.47 | $ 7.34 | $ 6.88 | $ 6.52 |
Income from Investment Operations | | | | | |
Net investment income (loss) C | (.12) F | (.12) G | (.12) | (.13) H | (.14) |
Net realized and unrealized gain (loss) | 2.04 | (.17) | (.75) | 1.12 | .50 |
Total from investment operations | 1.92 | (.29) | (.87) | .99 | .36 |
Distributions from net realized gain | - | - | - | (.53) | - |
Redemption fees added to paid in capital C, J | - | - | - | - | - |
Net asset value, end of period | $ 8.10 | $ 6.18 | $ 6.47 | $ 7.34 | $ 6.88 |
Total Return A, B | 31.07% | (4.48)% | (11.85)% | 14.96% | 5.52% |
Ratios to Average Net Assets D, I | | | | | |
Expenses before reductions | 2.10% | 2.14% | 2.15% | 2.12% | 2.16% |
Expenses net of fee waivers, if any | 2.10% | 2.14% | 2.15% | 2.12% | 2.15% |
Expenses net of all reductions | 2.09% | 2.13% | 2.15% | 2.12% | 2.15% |
Net investment income (loss) | (1.66)% F | (1.90)% G | (2.02)% | (2.00)% H | (1.99)% |
Supplemental Data | | | | | |
Net assets, end of period (000 omitted) | $ 15,787 | $ 11,421 | $ 12,426 | $ 13,323 | $ 11,813 |
Portfolio turnover rate E | 99% | 130% | 73% | 132% | 120% |
A Total returns would have been lower if certain expenses had not been reduced during the applicable periods shown.
B Total returns do not include the effect of the contingent deferred sales charge.
C Calculated based on average shares outstanding during the period.
D Fees and expenses of any underlying Fidelity Central Funds are not included in the Fund's expense ratio. The Fund indirectly bears its proportionate share of the expenses of any underlying Fidelity Central Funds.
E Amount does not include the portfolio activity of any underlying Fidelity Central Funds.
F Investment income per share reflects a special dividend which amounted to $.01 per share. Excluding the special dividend, the ratio of net investment income (loss) to average net assets would have been (1.79)%.
G Investment income per share reflects a special dividend which amounted to $.01 per share. Excluding the special dividend, the ratio of net investment income (loss) to average net assets would have been (2.04)%.
H Investment income per share reflects a special dividend which amounted to $.01 per share. Excluding the special dividend, the ratio of net investment income (loss) to average net assets would have been (2.08)%.
I Expense ratios reflect operating expenses of the class. Expenses before reductions do not reflect amounts reimbursed by the investment adviser or reductions from brokerage service arrangements or reductions from other expense offset arrangements and do not represent the amount paid by the class during periods when reimbursements or reductions occur. Expenses net of fee waivers reflect expenses after reimbursement by the investment adviser but prior to reductions from brokerage service arrangements or other expense offset arrangements. Expenses net of all reductions represent the net expenses paid by the class.
J Amount represents less than $.01 per share.
See accompanying notes which are an integral part of the financial statements.
Annual Report
Financial Highlights - Institutional Class
Years ended July 31, | 2011 | 2010 | 2009 | 2008 | 2007 |
Selected Per-Share Data | | | | | |
Net asset value, beginning of period | $ 6.87 | $ 7.12 | $ 8.00 | $ 7.37 | $ 6.91 |
Income from Investment Operations | | | | | |
Net investment income (loss) B | (.05) E | (.06) F | (.06) | (.07) G | (.07) |
Net realized and unrealized gain (loss) | 2.28 | (.19) | (.82) | 1.23 | .53 |
Total from investment operations | 2.23 | (.25) | (.88) | 1.16 | .46 |
Distributions from net realized gain | - | - | - | (.53) | - |
Redemption fees added to paid in capital B, I | - | - | - | - | - |
Net asset value, end of period | $ 9.10 | $ 6.87 | $ 7.12 | $ 8.00 | $ 7.37 |
Total Return A | 32.46% | (3.51)% | (11.00)% | 16.35% | 6.66% |
Ratios to Average Net Assets C, H | | | | | |
Expenses before reductions | 1.04% | 1.07% | 1.11% | 1.06% | 1.06% |
Expenses net of fee waivers, if any | 1.04% | 1.07% | 1.11% | 1.06% | 1.06% |
Expenses net of all reductions | 1.03% | 1.06% | 1.11% | 1.06% | 1.06% |
Net investment income (loss) | (.60)% E | (.83)% F | (.98)% | (.94)% G | (.91)% |
Supplemental Data | | | | | |
Net assets, end of period (000 omitted) | $ 5,903 | $ 3,008 | $ 1,901 | $ 1,117 | $ 991 |
Portfolio turnover rate D | 99% | 130% | 73% | 132% | 120% |
A Total returns would have been lower if certain expenses had not been reduced during the applicable periods shown.
B Calculated based on average shares outstanding during the period.
C Fees and expenses of any underlying Fidelity Central Funds are not included in the Fund's expense ratio. The Fund indirectly bears its proportionate share of the expenses of any underlying Fidelity Central Funds.
D Amount does not include the portfolio activity of any underlying Fidelity Central Funds.
E Investment income per share reflects a special dividend which amounted to $.01 per share. Excluding the special dividend, the ratio of net investment income (loss) to average net assets would have been (.73)%.
F Investment income per share reflects a special dividend which amounted to $.01 per share. Excluding the special dividend, the ratio of net investment income (loss) to average net assets would have been (.97)%.
G Investment income per share reflects a special dividend which amounted to $.01 per share. Excluding the special dividend, the ratio of net investment income (loss) to average net assets would have been (1.02)%.
H Expense ratios reflect operating expenses of the class. Expenses before reductions do not reflect amounts reimbursed by the investment adviser or reductions from brokerage service arrangements or reductions from other expense offset arrangements and do not represent the amount paid by the class during periods when reimbursements or reductions occur. Expenses net of fee waivers reflect expenses after reimbursement by the investment adviser but prior to reductions from brokerage service arrangements or other expense offset arrangements. Expenses net of all reductions represent the net expenses paid by the class.
I Amount represents less than $.01 per share.
See accompanying notes which are an integral part of the financial statements.
Annual Report
Notes to Financial Statements
For the period ended July 31, 2011
1. Organization.
Fidelity Advisor Biotechnology Fund (the Fund) is a non-diversified fund of Fidelity Advisor Series VII (the Trust) and is authorized to issue an unlimited number of shares. The Trust is registered under the Investment Company Act of 1940, as amended (the 1940 Act), as an open-end management investment company organized as a Massachusetts business trust. The Fund offers Class A, Class T, Class C and Institutional Class shares, each of which, along with Class B shares, has equal rights as to assets and voting privileges. Effective after the close of business on September 1, 2010, Class B shares were closed to new accounts and additional purchases, except for exchanges and reinvestments, by existing shareholders. Each class has exclusive voting rights with respect to matters that affect that class. Class B shares will automatically convert to Class A shares after a holding period of seven years from the initial date of purchase. Investment income, realized and unrealized capital gains and losses, the common expenses of the Fund, and certain fund-level expense reductions, if any, are allocated on a pro-rata basis to each class based on the relative net assets of each class to the total net assets of the Fund. Each class differs with respect to transfer agent and distribution and service plan fees incurred. Certain expense reductions may also differ by class.
2. Investments in Fidelity Central Funds.
The Fund invests in Fidelity Central Funds, which are open-end investment companies available only to other investment companies and accounts managed by Fidelity Management & Research Company (FMR) and its affiliates. The Fund's Schedule of Investments lists each of the Fidelity Central Funds held as of period end, if any, as an investment of the Fund, but does not include the underlying holdings of each Fidelity Central Fund. As an Investing Fund, the Fund indirectly bears its proportionate share of the expenses of the underlying Fidelity Central Funds.
The Money Market Central Funds seek preservation of capital and current income and are managed by Fidelity Investments Money Management, Inc. (FIMM), an affiliate of FMR.
A complete unaudited list of holdings for each Fidelity Central Fund is available upon request or at the Securities and Exchange Commission (the SEC) web site at www.sec.gov. In addition, the financial statements of the Fidelity Central Funds, which are not covered by the Fund's Report of Independent Registered Public Accounting Firm, are available on the SEC web site or upon request.
3. Significant Accounting Policies.
The financial statements have been prepared in conformity with accounting principles generally accepted in the United States of America (GAAP), which require management to make certain estimates and assumptions at the date of the financial statements. Actual results could differ from those estimates. Subsequent events, if any, through the date that the financial statements were issued have been evaluated in the preparation of the financial statements. The following summarizes the significant accounting policies of the Fund:
Security Valuation. Investments are valued as of 4:00 p.m. Eastern time on the last calendar day of the period. The Fund uses independent pricing services approved by the Board of Trustees to value its investments. When current market prices or quotations are not readily available or reliable, valuations may be determined in good faith in accordance with procedures adopted by the Board of Trustees. Factors used in determining value may include market or security specific events. The frequency with which these procedures are used cannot be predicted and they may be utilized to a significant extent. The value used for net asset value (NAV) calculation under these procedures may differ from published prices for the same securities.
The Fund categorizes the inputs to valuation techniques used to value its investments into a disclosure hierarchy consisting of three levels as shown below:
Level 1 - quoted prices in active markets for identical investments
Level 2 - other significant observable inputs (including quoted prices for similar investments, interest rates, prepayment speeds, etc.)
Level 3 - unobservable inputs (including the Fund's own assumptions based on the best information available)
Changes in valuation techniques may result in transfers in or out of an assigned level within the disclosure hierarchy. The aggregate value of investments by input level, as of July 31, 2011, is included at the end of the Fund's Schedule of Investments. Valuation techniques used to value the Fund's investments by major category are as follows:
Equity securities, including restricted securities, for which market quotations are readily available, are valued at the last reported sale price or official closing price as reported by an independent pricing service on the primary market or exchange on which they are traded and are categorized as Level 1 in the hierarchy. In the event there were no sales during the day or closing prices are not available, securities are valued at the last quoted bid price or may be valued using the last available price and are generally categorized as Level 2 in the hierarchy. For foreign equity securities, when significant market or security specific events arise, comparisons to the valuation of American Depositary Receipts (ADRs), futures contracts, Exchange-traded funds (ETFs) and certain indexes as well as quoted prices for similar securities are used and are categorized as Level 2 in the hierarchy in these
Annual Report
3. Significant Accounting Policies - continued
Security Valuation - continued
circumstances. Utilizing these techniques may result in transfers between Level 1 and Level 2. For restricted equity securities and private placements where observable inputs are limited, assumptions about market activity and risk are used and are categorized as Level 3 in the hierarchy.
Investments in open-end mutual funds, including the Fidelity Central Funds, are valued at their closing net asset value each business day and are categorized as Level 1 in the hierarchy.
Foreign Currency. The Fund may use foreign currency contracts to facilitate transactions in foreign-denominated securities. Gains and losses from these transactions may arise from changes in the value of the foreign currency or if the counterparties do not perform under the contracts' terms.
Foreign-denominated assets, including investment securities, and liabilities are translated into U.S. dollars at the exchange rate at period end. Purchases and sales of investment securities, income and dividends received and expenses denominated in foreign currencies are translated into U.S. dollars at the exchange rate in effect on the transaction date.
The effects of exchange rate fluctuations on investments are included with the net realized and unrealized gain (loss) on investment securities. Other foreign currency transactions resulting in realized and unrealized gain (loss) are disclosed separately.
Investment Transactions and Income. For financial reporting purposes, the Fund's investment holdings and NAV include trades executed through the end of the last business day of the period. The NAV per share for processing shareholder transactions is calculated as of the close of business of the New York Stock Exchange (NYSE), normally 4:00 p.m. Eastern time and includes trades executed through the end of the prior business day. Gains and losses on securities sold are determined on the basis of identified cost and may include proceeds received from litigation. Dividend income is recorded on the ex-dividend date, except for certain dividends from foreign securities where the ex-dividend date may have passed, which are recorded as soon as the Fund is informed of the ex-dividend date. Non-cash dividends included in dividend income, if any, are recorded at the fair market value of the securities received. Distributions received on securities that represent a return of capital or capital gain are recorded as a reduction of cost of investments and/or as a realized gain. The Fund estimates the components of distributions received that may be considered return of capital distributions or capital gain distributions. Large, non-recurring dividends recognized by the Fund are presented separately on the Statement of Operations as "Special Dividends" and the impact of these dividends is presented in the Financial Highlights. Interest income and distributions from the Fidelity Central Funds are accrued as earned. Interest income includes coupon interest and amortization of premium and accretion of discount on debt securities. Investment income is recorded net of foreign taxes withheld where recovery of such taxes is uncertain.
Expenses. Expenses directly attributable to a fund are charged to that fund. Expenses attributable to more than one fund are allocated among the respective funds on the basis of relative net assets or other appropriate methods. Expense estimates are accrued in the period to which they relate and adjustments are made when actual amounts are known.
Income Tax Information and Distributions to Shareholders. Each year, the Fund intends to qualify as a regulated investment company, including distributing substantially all of its taxable income and realized gains under Subchapter M of the Internal Revenue Code and filing its U.S. federal tax return. As a result, no provision for income taxes is required. As of July 31, 2011, the Fund did not have any unrecognized tax benefits in the financial statements. A fund's federal tax return is subject to examination by the Internal Revenue Service (IRS) for a period of three years. Foreign taxes are provided for based on the Fund's understanding of the tax rules and rates that exist in the foreign markets in which it invests.
Distributions are declared and recorded on the ex-dividend date. Income dividends and capital gain distributions are declared separately for each class. Income and capital gain distributions are determined in accordance with income tax regulations, which may differ from GAAP.
Capital accounts within the financial statements are adjusted for permanent book-tax differences. These adjustments have no impact on net assets or the results of operations. Temporary book-tax differences will reverse in a subsequent period.
Book-tax differences are primarily due to foreign currency transactions, net operating losses, capital loss carryforwards, and losses deferred due to wash sales and excise tax regulations.
The federal tax cost of investment securities and unrealized appreciation (depreciation) as of period end were as follows:
Gross unrealized appreciation | $ 17,373,315 |
Gross unrealized depreciation | (3,388,141) |
Net unrealized appreciation (depreciation) on securities and other investments | $ 13,985,174 |
| |
Tax Cost | $ 68,571,128 |
Annual Report
Notes to Financial Statements - continued
3. Significant Accounting Policies - continued
Income Tax Information and Distributions to Shareholders - continued
The tax-based components of distributable earnings as of period end were as follows:
Capital loss carryforward | $ (1,530,367) |
Net unrealized appreciation (depreciation) | $ 13,985,174 |
Under the recently enacted Regulated Investment Company Modernization Act of 2010 (the Act), the Fund will be permitted to carry forward capital losses incurred in taxable years beginning after December 22, 2010 for an unlimited period. However, any losses incurred during those future taxable years will be required to be utilized prior to any losses incurred in pre-enactment taxable years, which generally expire after eight years from when they are incurred. Additionally, post-enactment capital losses that are carried forward will retain their character as either short-term or long-term capital losses rather than being considered all short-term as under previous law. The Fund's first fiscal year end subject to the Act will be July 31, 2012.
Short-Term Trading (Redemption) Fees. Shares held by investors in the Fund less than 30 days are subject to a redemption fee equal to .75% of the net asset value of shares redeemed. All redemption fees, which reduce the proceeds of the shareholder redemption, are retained by the Fund and accounted for as an addition to paid in capital.
New Accounting Pronouncement. In May 2011, the Financial Accounting Standards Board issued Accounting Standard Update No. 2011-04, Fair Value Measurement (Topic 820) - Amendments to Achieve Common Fair Value Measurement and Disclosure Requirements in U.S. GAAP and IFRSs. The update changes the wording used to describe the requirements in GAAP for measuring fair value and for disclosing information about fair value measurements. The update is effective during interim and annual periods beginning after December 15, 2011. Management is currently evaluating the impact of the update's adoption on the Fund's financial statement disclosures.
4. Operating Policies.
Restricted Securities. The Fund may invest in securities that are subject to legal or contractual restrictions on resale. These securities generally may be resold in transactions exempt from registration or to the public if the securities are registered. Disposal of these securities may involve time-consuming negotiations and expense, and prompt sale at an acceptable price may be difficult. Information regarding securities is included at the end of the Fund's Schedule of Investments.
5. Purchases and Sales of Investments.
Purchases and sales of securities, other than short-term securities, aggregated $62,081,587 and $58,253,150, respectively.
6. Fees and Other Transactions with Affiliates.
Management Fee. FMR and its affiliates provide the Fund with investment management related services for which the Fund pays a monthly management fee. The management fee is the sum of an individual fund fee rate that is based on an annual rate of .30% of the Fund's average net assets and a group fee rate that averaged .26% during the period. The group fee rate is based upon the average net assets of all the mutual funds advised by FMR. The group fee rate decreases as assets under management increase and increases as assets under management decrease. For the period, the total annual management fee rate was .56% of the Fund's average net assets.
Distribution and Service Plan Fees. In accordance with Rule 12b-1 of the 1940 Act, the Fund has adopted separate Distribution and Service Plans for each class of shares. Certain classes pay Fidelity Distributors Corporation (FDC), an affiliate of FMR, separate Distribution and Service Fees, each of which is based on an annual percentage of each class' average net assets. In addition, FDC may pay financial intermediaries for selling shares of the Fund and providing shareholder support services.
For the period, the Distribution and Service Fee rates, total fees and amounts retained by FDC were as follows:
| Distribution
Fee | Service
Fee | Total Fees | Retained
by FDC |
Class A | -% | .25% | $ 58,447 | $ 603 |
Class T | .25% | .25% | 68,378 | 324 |
Class B | .75% | .25% | 58,357 | 43,808 |
Class C | .75% | .25% | 126,855 | 18,450 |
| | | $ 312,037 | $ 63,185 |
Annual Report
6. Fees and Other Transactions with Affiliates - continued
Sales Load. FDC may receive a front-end sales charge of up to 5.75% for selling Class A shares, and 3.50% for selling Class T shares, some of which is paid to financial intermediaries for selling shares of the Fund. Depending on the holding period, FDC may receive contingent deferred sales charges levied on Class A, Class T, Class B, and Class C redemptions. The deferred sales charges range from 5% to 1% for Class B, 1% for Class C, 1.00% for certain purchases of Class A shares and .25% for certain purchases of Class T shares.
For the period, sales charge amounts retained by FDC were as follows:
| Retained
by FDC |
Class A | $ 17,148 |
Class T | 6,533 |
Class B* | 12,854 |
Class C* | 572 |
| $ 37,107 |
* When Class B and Class C shares are initially sold, FDC pays commissions from its own resources to financial intermediaries through which the sales are made.
Transfer Agent Fees. Fidelity Investments Institutional Operations Company, Inc. (FIIOC), an affiliate of FMR, is the transfer, dividend disbursing and shareholder servicing agent for each class of the Fund. FIIOC receives account fees and asset-based fees that vary according to the account size and type of account of the shareholders of the respective classes of the Fund. FIIOC pays for typesetting, printing and mailing of shareholder reports, except proxy statements. For the period, transfer agent fees for each class were as follows:
| Amount | % of
Average
Net Assets |
Class A | $ 70,163 | .30 |
Class T | 47,123 | .35 |
Class B | 17,595 | .30 |
Class C | 38,036 | .30 |
Institutional Class | 9,039 | .24 |
| $ 181,956 | |
Accounting and Security Lending Fees. Fidelity Service Company, Inc. (FSC), an affiliate of FMR, maintains the Fund's accounting records. The accounting fee is based on the level of average net assets for the month. Under a separate contract, FSC administers the security lending program. The security lending fee is based on the number and duration of lending transactions.
Brokerage Commissions. The Fund placed a portion of its portfolio transactions with brokerage firms which are affiliates of the investment adviser. The commissions paid to these affiliated firms were $1,659 for the period.
7. Committed Line of Credit.
The Fund participates with other funds managed by FMR or an affiliate in a $4.0 billion credit facility (the "line of credit") to be utilized for temporary or emergency purposes to fund shareholder redemptions or for other short-term liquidity purposes. The Fund has agreed to pay commitment fees on its pro-rata portion of the line of credit, which amounted to $191 and is reflected in Miscellaneous expenses on the Statement of Operations. During the period, there were no borrowings on this line of credit.
8. Security Lending.
The Fund lends portfolio securities through a lending agent from time to time in order to earn additional income. The lending agent may loan securities to certain qualified borrowers, including Fidelity Capital Markets (FCM), a broker-dealer affiliated with the Fund. On the settlement date of the loan, the Fund receives collateral (in the form of U.S. Treasury obligations, letters of credit and/or cash) against the loaned securities and maintains collateral in an amount not less than 100% of the market value of the loaned securities during the period of the loan. The market value of the loaned securities is determined at the close of business of the Fund and any additional required collateral is delivered to the Fund on the next business day. If the borrower defaults on its obligation to return the securities loaned because of insolvency or other reasons, a fund could experience delays and costs in recovering the securities loaned or in gaining access to the collateral. Any cash collateral received is invested in the Fidelity Securities Lending Cash Central Fund. The value of loaned securities and cash collateral at period end are disclosed on the Fund's Statement of Assets and Liabilities. Security
Annual Report
Notes to Financial Statements - continued
8. Security Lending - continued
lending income represents the income earned on investing cash collateral, less rebates paid to borrowers and lending agent fees associated with the loan, plus any premium payments received for lending certain types of securities. Security lending income is presented in the Statement of Operations as a component of income from Fidelity Central Funds, and includes $128 from securities loaned to FCM.
9. Expense Reductions.
Many of the brokers with whom FMR places trades on behalf of the Fund provided services to the Fund in addition to trade execution. These services included payments of certain expenses on behalf of the Fund totaling $3,845 for the period.
10. Share Transactions.
Transactions for each class of shares were as follows:
| Shares | Dollars |
Years ended July 31, | 2011 | 2010 | 2011 | 2010 |
Class A | | | | |
Shares sold | 1,294,694 | 1,118,865 | $ 10,912,748 | $ 7,975,997 |
Shares redeemed | (838,372) | (959,085) | (6,529,914) | (6,583,930) |
Net increase (decrease) | 456,322 | 159,780 | $ 4,382,834 | $ 1,392,067 |
Class T | | | | |
Shares sold | 489,230 | 412,827 | $ 3,897,385 | $ 2,848,621 |
Shares redeemed | (364,605) | (585,419) | (2,767,714) | (3,906,373) |
Net increase (decrease) | 124,625 | (172,592) | $ 1,129,671 | $ (1,057,752) |
Class B | | | | |
Shares sold | 84,075 | 304,652 | $ 609,091 | $ 1,993,007 |
Shares redeemed | (381,301) | (424,638) | (2,636,098) | (2,696,945) |
Net increase (decrease) | (297,226) | (119,986) | $ (2,027,007) | $ (703,938) |
Class C | | | | |
Shares sold | 539,125 | 489,582 | $ 4,217,149 | $ 3,216,700 |
Shares redeemed | (438,419) | (559,923) | (3,130,462) | (3,577,484) |
Net increase (decrease) | 100,706 | (70,341) | $ 1,086,687 | $ (360,784) |
Institutional Class | | | | |
Shares sold | 436,761 | 453,122 | $ 3,719,527 | $ 3,410,559 |
Shares redeemed | (225,982) | (282,175) | (1,769,416) | (1,995,414) |
Net increase (decrease) | 210,779 | 170,947 | $ 1,950,111 | $ 1,415,145 |
11. Other.
The Fund's organizational documents provide former and current trustees and officers with a limited indemnification against liabilities arising in connection with the performance of their duties to the Fund. In the normal course of business, the Fund may also enter into contracts that provide general indemnifications. The Fund's maximum exposure under these arrangements is unknown as this would be dependent on future claims that may be made against the Fund. The risk of material loss from such claims is considered remote.
Annual Report
Fidelity Advisor Communications Equipment Fund - Class A, T, B, and C
Performance: The Bottom Line
Average annual total return reflects the change in the value of an investment, assuming reinvestment of the class' distributions from dividend income and capital gains (the profits earned upon the sale of securities that have grown in value, if any) and assuming a constant rate of performance each year. The $10,000 table and the fund's returns do not reflect the deduction of taxes that a shareholder would pay on fund distributions or the redemption of fund shares. During periods of reimbursement by Fidelity, a fund's total return will be greater than it would be had the reimbursement not occurred. How a fund did yesterday is no guarantee of how it will do tomorrow. Returns reflect the conversion of Class B shares to Class A shares after a maximum of seven years.
Average Annual Total Returns
Periods ended July 31, 2011 | Past 1
year | Past 5
years | Past 10
years |
Class A (incl. 5.75% sales charge) C | 5.77% | 4.99% | 1.02% |
Class T (incl. 3.50% sales charge) C | 8.13% | 5.24% | 1.00% |
Class B (incl. contingent deferred sales charge)A,C | 6.54% | 5.15% | 1.09% |
Class C (incl. contingent deferred sales charge)B,C | 10.41% | 5.45% | 0.85% |
A Class B shares' contingent deferred sales charges included in the past one year, past five years, and past ten years total return figures are 5%, 2%, and 0%, respectively.
B Class C shares' contingent deferred sales charges included in the past one year, past five years, and past ten years total return figures are 1%, 0%, and 0%, respectively.
C Prior to October 1, 2006, Fidelity Advisor Communications Equipment Fund operated under certain different investment policies. The historical performance for the fund may not represent its current investment policies.
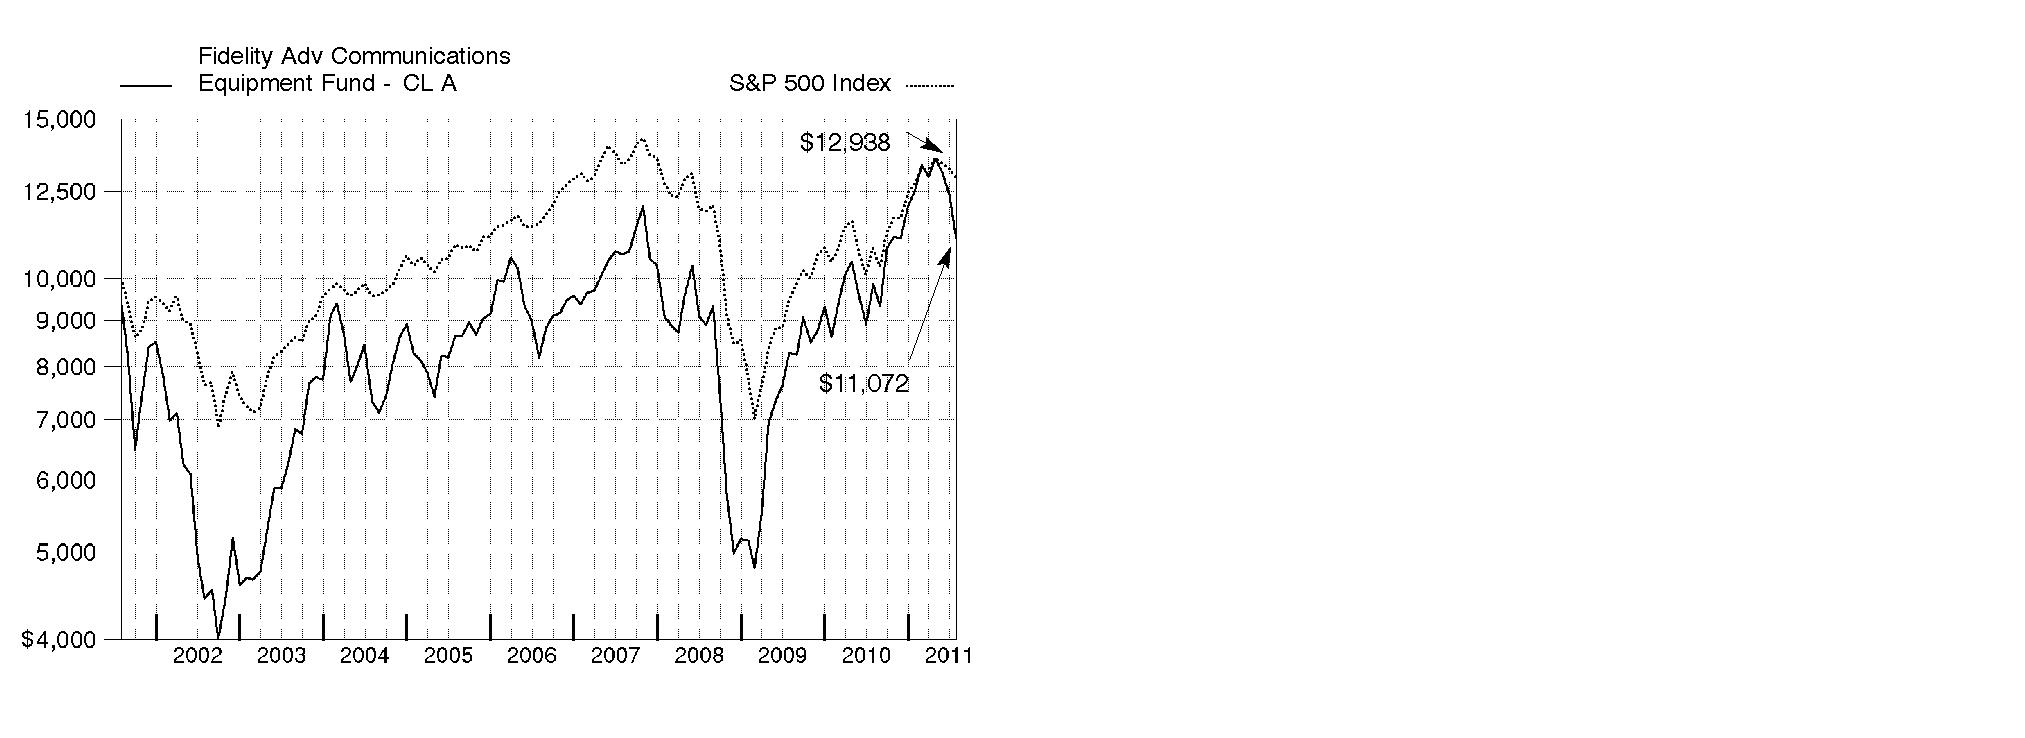
$10,000 Over 10 Years
Let's say hypothetically that $10,000 was invested in Fidelity Advisor Communications Equipment Fund - Class A on July 31, 2001, and the current 5.75% sales charge was paid. The chart shows how the value of your investment would have changed, and also shows how the S&P 500 Index performed over the same period.
Annual Report
Fidelity Advisor Communications Equipment Fund
Market Recap: U.S. stocks registered solid double-digit gains for the 12 months ending July 31, 2011, extending a rally that began more than two years earlier. Despite a rough start in August 2010, markets turned positive in September, as increased demand for capital goods and other upbeat indicators trumped investor worry about a U.S. recessionary relapse. The broad market, as measured by the S&P 500® Index, rose 9% that month, its biggest September gain in 71 years. Seven more monthly advances followed, fueled by encouraging corporate earnings and economic activity. However, volatility picked up in the period's latter months, as markets reacted to continued high U.S. unemployment, nagging debt troubles in Europe and looming legislative battles over the federal debt ceiling. May unemployment rose above 9% for the first time in 2011, contributing to a traditional "June swoon" for stocks. Market uncertainty lingered in July, when the S&P 500® posted its second-biggest monthly loss of the period. For the full year, the S&P 500® climbed 19.65%, while the blue-chip-laden Dow Jones Industrial AverageSM rose a comparable 19.09% and the technology-heavy Nasdaq Composite® Index gained 23.40%. On the capitalization spectrum, stocks of mid-cap companies fared best, with the Russell Midcap® Index rising 24.51% and the small-cap Russell 2000® Index adding 23.92%.
Comments from Charlie Chai, Portfolio Manager of Fidelity Advisor® Communications Equipment Fund: During the past year, the fund's Class A, Class T, Class B and Class C shares returned 12.23%, 12.06%, 11.54% and 11.41%, respectively (excluding sales charges), well ahead of the 3.14% advance of the S&P® Custom Communications Equipment Index but lagging the S&P 500. Versus its industry benchmark, stock picking in communications equipment, which represented the vast majority of the fund's net assets during the period, was primarily responsible for its outperformance. Out-of-benchmark exposure to a variety of groups, especially wireless telecommunication services, systems software, application software and electronic manufacturing services, also bolstered the fund's results. Three of the four largest individual contributors were weak-performing benchmark components in which the fund had relatively light exposure. Large underweightings in Canadian smartphone maker Research In Motion - which I sold - and Finnish handset manufacturer Nokia were particularly beneficial, jointly accounting for more than six percentage points of outperformance for the fund. Underweighting networking equipment provider Cisco Systems, a major benchmark component, also proved beneficial, as the company's size and lack of strategic focus began to catch up with it, resulting in slowing growth and poor stock performance. I'll also mention an out-of-index position in Taiwan-based HTC, one of the smartphone makers using Google's AndroidTM operating system that "ate the lunch" of less well-positioned rivals. Acme Packet, which makes session-border-control equipment used to integrate Internet Protocol (IP) capabilities with corporate phone systems, was a success story from the first half of the period, and I sold some of the position to lock in profits. Conversely, not owning benchmark constituent InterDigital, a provider of products that enable wireless communications, worked against the fund's relative performance, as the stock surged in July amid rumors the company might be bought by Google. Underweighting communications equipment firm Motorola, known as Motorola Solutions as of January 4, 2011, also detracted. Meanwhile, a slight average overweighting in Finisar, a maker of optical subsystems and components for local area networks, hampered results. The stock took a big hit in March, when the company reduced its financial outlook.
Comments from Charlie Chai, Portfolio Manager of Fidelity Advisor® Communications Equipment Fund: During the past year, the fund's Institutional Class shares returned 12.61%, well ahead of the 3.14% advance of the S&P® Custom Communications Equipment Index but lagging the S&P 500. Versus its industry benchmark, stock picking in communications equipment, which represented the vast majority of the fund's net assets during the period, was primarily responsible for its outperformance. Out-of-benchmark exposure to a variety of groups, especially wireless telecommunication services, systems software, application software and electronic manufacturing services, also bolstered the fund's results. Three of the four largest individual contributors were weak-performing benchmark components in which the fund had relatively light exposure. Large underweightings in Canadian smartphone maker Research In Motion - which I sold - and Finnish handset manufacturer Nokia were particularly beneficial, jointly accounting for more than six percentage points of outperformance for the fund. Underweighting networking equipment provider Cisco Systems, a major benchmark component, also proved beneficial, as the company's size and lack of strategic focus began to catch up with it, resulting in slowing growth and poor stock performance. I'll also mention an out-of-index position in Taiwan-based HTC, one of the smartphone makers using Google's AndroidTM operating system that "ate the lunch" of less well-positioned rivals. Acme Packet, which makes session-border-control equipment used to integrate Internet Protocol (IP) capabilities with corporate phone systems, was a success story from the first half of the period, and I sold some of the position to lock in profits. Conversely, not owning benchmark constituent InterDigital, a provider of products that enable wireless communications, worked against the fund's relative performance, as the stock surged in July amid rumors the company might be bought by Google. Underweighting communications equipment firm Motorola, known as Motorola Solutions as of January 4, 2011, also detracted. Meanwhile, a slight average overweighting in Finisar, a maker of optical subsystems and components for local area networks, hampered results. The stock took a big hit in March, when the company reduced its financial outlook.
The views expressed above reflect those of the portfolio manager(s) only through the end of the period as stated on the cover of this report and do not necessarily represent the views of Fidelity or any other person in the Fidelity organization. Any such views are subject to change at any time based upon market or other conditions and Fidelity disclaims any responsibility to update such views. These views may not be relied on as investment advice and, because investment decisions for a Fidelity fund are based on numerous factors, may not be relied on as an indication of trading intent on behalf of any Fidelity fund.
Annual Report
Fidelity Advisor Communications Equipment Fund
As a shareholder of the Fund, you incur two types of costs: (1) transaction costs, including sales charges (loads) on purchase payments or redemption proceeds, redemption fees, and (2) ongoing costs, including management fees, distribution and/or service (12b-1) fees and other Fund expenses. This Example is intended to help you understand your ongoing costs (in dollars) of investing in the Fund and to compare these costs with the ongoing costs of investing in other mutual funds.
The Example is based on an investment of $1,000 invested at the beginning of the period and held for the entire period (February 1, 2011 to July 31, 2011).
Actual Expenses
The first line of the accompanying table for each class of the Fund provides information about actual account values and actual expenses. You may use the information in this line, together with the amount you invested, to estimate the expenses that you paid over the period. Simply divide your account value by $1,000.00 (for example, an $8,600 account value divided by $1,000.00 = 8.6), then multiply the result by the number in the first line for a class of the Fund under the heading entitled "Expenses Paid During Period" to estimate the expenses you paid on your account during this period. In addition, the Fund, as a shareholder in the underlying Fidelity Central Funds, will indirectly bear its pro-rata share of the fees and expenses incurred by the underlying Fidelity Central Funds. These fees and expenses are not included in the Fund's annualized expense ratio used to calculate the expense estimate in the table below.
Hypothetical Example for Comparison Purposes
The second line of the accompanying table for each class of the Fund provides information about hypothetical account values and hypothetical expenses based on a Class' actual expense ratio and an assumed rate of return of 5% per year before expenses, which is not the Class' actual return. The hypothetical account values and expenses may not be used to estimate the actual ending account balance or expenses you paid for the period. You may use this information to compare the ongoing costs of investing in the Fund and other funds. To do so, compare this 5% hypothetical example with the 5% hypothetical examples that appear in the shareholder reports of the other funds. In addition, the Fund, as a shareholder in the underlying Fidelity Central Funds, will indirectly bear its pro-rata share of the fees and expenses incurred by the underlying Fidelity Central Funds. These fees and expenses are not included in the Fund's annualized expense ratio used to calculate the expense estimate in the table below.
Please note that the expenses shown in the table are meant to highlight your ongoing costs only and do not reflect any transaction costs. Therefore, the second line of the table is useful in comparing ongoing costs only, and will not help you determine the relative total costs of owning different funds. In addition, if these transactional costs were included, your costs would have been higher.
| Annualized
Expense Ratio | Beginning
Account Value
February 1, 2011 | Ending
Account Value
July 31, 2011 | Expenses Paid
During Period*
February 1, 2011 to
July 31, 2011 |
Class A | 1.40% | | | |
Actual | | $ 1,000.00 | $ 885.40 | $ 6.54 |
HypotheticalA | | $ 1,000.00 | $ 1,017.85 | $ 7.00 |
Class T | 1.65% | | | |
Actual | | $ 1,000.00 | $ 884.30 | $ 7.71 |
HypotheticalA | | $ 1,000.00 | $ 1,016.61 | $ 8.25 |
Class B | 2.15% | | | |
Actual | | $ 1,000.00 | $ 882.20 | $ 10.03 |
HypotheticalA | | $ 1,000.00 | $ 1,014.13 | $ 10.74 |
Class C | 2.15% | | | |
Actual | | $ 1,000.00 | $ 882.10 | $ 10.03 |
HypotheticalA | | $ 1,000.00 | $ 1,014.13 | $ 10.74 |
Institutional Class | 1.15% | | | |
Actual | | $ 1,000.00 | $ 886.50 | $ 5.38 |
HypotheticalA | | $ 1,000.00 | $ 1,019.09 | $ 5.76 |
A 5% return per year before expenses
* Expenses are equal to each Class' annualized expense ratio, multiplied by the average account value over the period, multiplied by 181/365 (to reflect the one-half year period).
Annual Report
Fidelity Advisor Communications Equipment Fund
Investment Changes (Unaudited)
Top Ten Stocks as of July 31, 2011 |
| % of fund's
net assets | % of fund's net assets
6 months ago |
Cisco Systems, Inc. | 12.9 | 16.3 |
Telefonaktiebolaget LM Ericsson (B Shares) sponsored ADR | 10.9 | 7.5 |
QUALCOMM, Inc. | 9.9 | 13.2 |
AsiaInfo-Linkage, Inc. | 3.7 | 0.3 |
Polycom, Inc. | 3.5 | 1.4 |
Alcatel-Lucent SA sponsored ADR | 3.0 | 2.5 |
Ciena Corp. | 3.0 | 2.6 |
American Tower Corp. Class A | 2.8 | 0.6 |
SBA Communications Corp. Class A | 2.6 | 0.6 |
Crown Castle International Corp. | 2.4 | 0.5 |
| 54.7 | |
Top Industries (% of fund's net assets) |
As of July 31, 2011 |
| Communications Equipment | 75.0% | |
 | Software | 8.5% | |
 | Wireless Telecommunication Services | 7.9% | |
 | Semiconductors & Semiconductor Equipment | 2.4% | |
 | Computers & Peripherals | 1.1% | |
| All Others* | 5.1% | |

As of January 31, 2011 |
| Communications Equipment | 81.3% | |
| Semiconductors & Semiconductor Equipment | 4.5% | |
| Electronic Equipment & Components | 3.4% | |
| Software | 3.3% | |
| Computers & Peripherals | 2.7% | |
| All Others* | 4.8% | |

* Includes short-term investments and net other assets. |
Annual Report
Fidelity Advisor Communications Equipment Fund
Investments July 31, 2011
Showing Percentage of Net Assets
Common Stocks - 97.2% |
| Shares | | Value |
COMMUNICATIONS EQUIPMENT - 74.9% |
Communications Equipment - 74.9% |
Acme Packet, Inc. (a) | 6,171 | | $ 363,595 |
ADTRAN, Inc. | 10,079 | | 333,514 |
ADVA AG Optical Networking (a) | 34,256 | | 211,255 |
Alcatel-Lucent SA sponsored ADR (a) | 172,557 | | 698,856 |
Arris Group, Inc. (a) | 18,971 | | 227,652 |
Aruba Networks, Inc. (a)(d) | 17,140 | | 393,363 |
Aviat Networks, Inc. (a) | 10,867 | | 42,055 |
BigBand Networks, Inc. (a) | 29,453 | | 57,433 |
Brocade Communications Systems, Inc. (a) | 89,459 | | 490,235 |
Calix Networks, Inc. (a)(d) | 10,300 | | 188,902 |
Ceragon Networks Ltd. (a) | 5,515 | | 68,772 |
Ciena Corp. (a)(d) | 45,109 | | 697,385 |
Cisco Systems, Inc. | 189,774 | | 3,030,689 |
Comba Telecom Systems Holdings Ltd. | 58,850 | | 54,064 |
Comtech Telecommunications Corp. | 2,300 | | 61,985 |
Comverse Technology, Inc. (a) | 906 | | 6,795 |
DG FastChannel, Inc. (a) | 2,700 | | 76,302 |
Digi International, Inc. (a) | 2,700 | | 38,583 |
DragonWave, Inc. (a) | 18,300 | | 93,473 |
EchoStar Holding Corp. Class A (a) | 2,120 | | 70,935 |
EMCORE Corp. (a)(d) | 4,600 | | 12,052 |
Emulex Corp. (a) | 7,600 | | 64,220 |
Extreme Networks, Inc. (a) | 5,400 | | 18,306 |
F5 Networks, Inc. (a) | 746 | | 69,736 |
Finisar Corp. (a) | 29,759 | | 507,093 |
Harmonic, Inc. (a) | 11,860 | | 64,400 |
Harris Corp. | 6,700 | | 267,129 |
HTC Corp. | 2,520 | | 74,867 |
Infinera Corp. (a) | 2,800 | | 18,004 |
Ixia (a) | 16,496 | | 164,960 |
JDS Uniphase Corp. (a) | 13,664 | | 179,682 |
Juniper Networks, Inc. (a) | 14,688 | | 343,552 |
Motorola Mobility Holdings, Inc. | 11,341 | | 253,812 |
Motorola Solutions, Inc. | 147 | | 6,599 |
NETGEAR, Inc. (a) | 7,933 | | 261,075 |
Nokia Corp. sponsored ADR | 5 | | 29 |
Oclaro, Inc. (a)(d) | 18,075 | | 84,953 |
Oplink Communications, Inc. (a) | 1,854 | | 31,296 |
Opnext, Inc. (a) | 44,255 | | 83,642 |
Polycom, Inc. (a) | 30,000 | | 810,900 |
Powerwave Technologies, Inc. (a) | 30,200 | | 65,534 |
QUALCOMM, Inc. | 42,281 | | 2,316,153 |
Riverbed Technology, Inc. (a) | 15,758 | | 451,152 |
Sandvine Corp. (a) | 56,400 | | 124,529 |
Sandvine Corp. (U.K.) (a) | 65,330 | | 146,333 |
ShoreTel, Inc. (a) | 27,054 | | 230,500 |
Sierra Wireless, Inc. (a) | 17,900 | | 192,977 |
Sonus Networks, Inc. (a) | 44,300 | | 131,128 |
Sycamore Networks, Inc. | 5,600 | | 110,320 |
Tekelec (a) | 14,913 | | 117,067 |
|
| Shares | | Value |
Telefonaktiebolaget LM Ericsson (B Shares) sponsored ADR | 204,520 | | $ 2,556,500 |
Tellabs, Inc. | 6,000 | | 24,840 |
ViaSat, Inc. (a) | 11,300 | | 507,709 |
ZTE Corp. (H Shares) | 19,260 | | 60,174 |
| | 17,557,066 |
COMPUTERS & PERIPHERALS - 1.1% |
Computer Storage & Peripherals - 1.1% |
Gemalto NV | 2,573 | | 122,870 |
Novatel Wireless, Inc. (a) | 25,198 | | 129,266 |
| | 252,136 |
ELECTRICAL EQUIPMENT - 0.0% |
Electrical Components & Equipment - 0.0% |
A123 Systems, Inc. (a) | 100 | | 513 |
ELECTRONIC EQUIPMENT & COMPONENTS - 0.8% |
Electronic Components - 0.5% |
E Ink Holdings, Inc. | 16,000 | | 33,186 |
Universal Display Corp. (a) | 2,800 | | 83,748 |
| | 116,934 |
Electronic Manufacturing Services - 0.3% |
NeoPhotonics Corp. | 8,200 | | 60,516 |
TOTAL ELECTRONIC EQUIPMENT & COMPONENTS | | 177,450 |
INTERNET SOFTWARE & SERVICES - 0.7% |
Internet Software & Services - 0.7% |
Equinix, Inc. (a) | 300 | | 31,341 |
Keynote Systems, Inc. | 4,300 | | 102,985 |
Rackspace Hosting, Inc. (a) | 600 | | 24,000 |
| | 158,326 |
IT SERVICES - 0.1% |
Data Processing & Outsourced Services - 0.1% |
NeuStar, Inc. Class A (a) | 700 | | 18,228 |
IT Consulting & Other Services - 0.0% |
Yucheng Technologies Ltd. (a) | 1,200 | | 4,392 |
TOTAL IT SERVICES | | 22,620 |
MEDIA - 0.8% |
Advertising - 0.3% |
Focus Media Holding Ltd. ADR (a)(d) | 2,200 | | 72,358 |
Broadcasting - 0.2% |
Television Broadcasts Ltd. | 5,000 | | 34,226 |
Cable & Satellite - 0.3% |
Virgin Media, Inc. | 3,050 | | 80,703 |
TOTAL MEDIA | | 187,287 |
SEMICONDUCTORS & SEMICONDUCTOR EQUIPMENT - 2.4% |
Semiconductors - 2.4% |
Cavium, Inc. (a) | 2,499 | | 86,191 |
Common Stocks - continued |
| Shares | | Value |
SEMICONDUCTORS & SEMICONDUCTOR EQUIPMENT - CONTINUED |
Semiconductors - continued |
CSR PLC | 2,483 | | $ 11,380 |
Entropic Communications, Inc. (a) | 200 | | 1,336 |
Exar Corp. (a) | 143 | | 945 |
Ikanos Communications, Inc. (a) | 3,985 | | 5,021 |
Inphi Corp. | 2,400 | | 30,456 |
Marvell Technology Group Ltd. (a) | 2,300 | | 34,086 |
Netlogic Microsystems, Inc. (a) | 2,102 | | 72,624 |
ON Semiconductor Corp. (a) | 4,298 | | 37,350 |
Pericom Semiconductor Corp. (a) | 1,700 | | 13,906 |
Phison Electronics Corp. | 17,000 | | 85,353 |
Pixelplus Co. Ltd. ADR (a) | 900 | | 2,160 |
PLX Technology, Inc. (a) | 900 | | 3,069 |
PMC-Sierra, Inc. (a) | 3,100 | | 21,669 |
Spreadtrum Communications, Inc. ADR (d) | 8,830 | | 119,647 |
Standard Microsystems Corp. (a) | 1,200 | | 28,392 |
| | 553,585 |
SOFTWARE - 8.5% |
Application Software - 7.0% |
AsiaInfo-Linkage, Inc. (a)(d) | 55,700 | | 851,096 |
AutoNavi Holdings Ltd. ADR | 8,800 | | 145,728 |
BroadSoft, Inc. (a)(d) | 12,700 | | 370,967 |
KongZhong Corp. sponsored ADR (a) | 100 | | 493 |
NetScout Systems, Inc. (a) | 2,393 | | 36,493 |
SolarWinds, Inc. (a) | 5,729 | | 123,231 |
Synchronoss Technologies, Inc. (a) | 3,447 | | 100,825 |
Taleo Corp. Class A (a) | 100 | | 3,310 |
TeleNav, Inc. (a) | 300 | | 3,009 |
| | 1,635,152 |
Home Entertainment Software - 0.0% |
Giant Interactive Group, Inc. ADR (d) | 2,000 | | 15,380 |
Systems Software - 1.5% |
Allot Communications Ltd. (a) | 5,400 | | 80,028 |
Fortinet, Inc. (a) | 3,900 | | 79,248 |
Opnet Technologies, Inc. | 1,653 | | 56,714 |
Rovi Corp. (a) | 1,800 | | 95,346 |
TeleCommunication Systems, Inc. Class A (a) | 6,977 | | 35,443 |
| | 346,779 |
TOTAL SOFTWARE | | 1,997,311 |
|
| Shares | | Value |
WIRELESS TELECOMMUNICATION SERVICES - 7.9% |
Wireless Telecommunication Services - 7.9% |
American Tower Corp. Class A (a) | 12,490 | | $ 656,100 |
Crown Castle International Corp. (a) | 12,800 | | 555,520 |
Leap Wireless International, Inc. (a) | 300 | | 4,038 |
SBA Communications Corp. Class A (a) | 16,177 | | 617,476 |
SOFTBANK CORP. | 700 | | 27,376 |
| | 1,860,510 |
TOTAL COMMON STOCKS (Cost $22,160,300) | 22,766,804 |
Convertible Bonds - 0.1% |
| Principal
Amount | | |
COMMUNICATIONS EQUIPMENT - 0.1% |
Communications Equipment - 0.1% |
Ciena Corp. 0.25% 5/1/13
(Cost $20,000) | | $ 20,000 | | 19,270 |
Money Market Funds - 6.6% |
| Shares | | |
Fidelity Securities Lending Cash Central Fund, 0.15% (b)(c)
(Cost $1,558,200) | 1,558,200 | | 1,558,200 |
TOTAL INVESTMENT PORTFOLIO - 103.9% (Cost $23,738,500) | 24,344,274 |
NET OTHER ASSETS (LIABILITIES) - (3.9)% | | (913,710) |
NET ASSETS - 100% | $ 23,430,564 |
Legend |
(a) Non-income producing |
(b) Affiliated fund that is available only to investment companies and other accounts managed by Fidelity Investments. The rate quoted is the annualized seven-day yield of the fund at period end. A complete unaudited listing of the fund's holdings as of its most recent quarter end is available upon request. In addition, each Fidelity Central Fund's financial statements, which are not covered by the Fund's Report of Independent Registered Public Accounting Firm, are available on the SEC's website or upon request. |
(c) Investment made with cash collateral received from securities on loan. |
(d) Security or a portion of the security is on loan at period end. |
Affiliated Central Funds |
Information regarding fiscal year to date income earned by the Fund from investments in Fidelity Central Funds is as follows: |
Fund | Income earned |
Fidelity Cash Central Fund | $ 1,169 |
Fidelity Securities Lending Cash Central Fund | 26,436 |
Total | $ 27,605 |
Other Information |
The following is a summary of the inputs used, as of July 31, 2011, involving the Fund's assets and liabilities carried at fair value. The inputs or methodology used for valuing securities may not be an indication of the risk associated with investing in those securities. For more information on valuation inputs, and their aggregation into the levels used in the table below, please refer to the Security Valuation section in the accompanying Notes to Financial Statements. |
Valuation Inputs at Reporting Date: |
Description | Total | Level 1 | Level 2 | Level 3 |
Investments in Securities: | | | | |
Common Stocks | $ 22,766,804 | $ 22,766,804 | $ - | $ - |
Convertible Bonds | 19,270 | - | 19,270 | - |
Money Market Funds | 1,558,200 | 1,558,200 | - | - |
Total Investments in Securities: | $ 24,344,274 | $ 24,325,004 | $ 19,270 | $ - |
Distribution of investments by country of issue, as a percentage of total net assets, is as follows: (Unaudited) |
United States of America | 78.7% |
Sweden | 10.9% |
France | 3.0% |
Canada | 2.3% |
Cayman Islands | 1.1% |
Others (Individually Less Than 1%) | 4.0% |
| 100.0% |
See accompanying notes which are an integral part of the financial statements.
Annual Report
Fidelity Advisor Communications Equipment Fund
Statement of Assets and Liabilities
| July 31, 2011 |
| | |
Assets | | |
Investment in securities, at value (including securities loaned of $1,466,754) - See accompanying schedule: Unaffiliated issuers (cost $22,180,300) | $ 22,786,074 | |
Fidelity Central Funds (cost $1,558,200) | 1,558,200 | |
Total Investments (cost $23,738,500) | | $ 24,344,274 |
Receivable for investments sold | | 895,752 |
Receivable for fund shares sold | | 30,429 |
Dividends receivable | | 5,112 |
Interest receivable | | 12 |
Distributions receivable from Fidelity Central Funds | | 12,626 |
Other receivables | | 1,381 |
Total assets | | 25,289,586 |
| | |
Liabilities | | |
Payable to custodian bank | $ 18,570 | |
Payable for fund shares redeemed | 215,750 | |
Accrued management fee | 13,407 | |
Distribution and service plan fees payable | 10,804 | |
Other affiliated payables | 7,641 | |
Other payables and accrued expenses | 34,650 | |
Collateral on securities loaned, at value | 1,558,200 | |
Total liabilities | | 1,859,022 |
| | |
Net Assets | | $ 23,430,564 |
Net Assets consist of: | | |
Paid in capital | | $ 22,606,837 |
Accumulated net investment loss | | (2,793) |
Accumulated undistributed net realized gain (loss) on investments and foreign currency transactions | | 220,746 |
Net unrealized appreciation (depreciation) on investments | | 605,774 |
Net Assets | | $ 23,430,564 |
Statement of Assets and Liabilities - continued
| July 31, 2011 |
| | |
Calculation of Maximum Offering Price Class A:
Net Asset Value and redemption price per share ($8,786,662 ÷ 902,731 shares) | | $ 9.73 |
| | |
Maximum offering price per share (100/94.25 of $9.73) | | $ 10.32 |
Class T:
Net Asset Value and redemption price per share ($4,607,079 ÷ 485,940 shares) | | $ 9.48 |
| | |
Maximum offering price per share (100/96.50 of $9.48) | | $ 9.82 |
Class B:
Net Asset Value and offering price per share ($1,316,181 ÷ 146,463 shares)A | | $ 8.99 |
| | |
Class C:
Net Asset Value and offering price per share ($5,865,756 ÷ 653,028 shares)A | | $ 8.98 |
| | |
Institutional Class:
Net Asset Value, offering price and redemption price per share ($2,854,886 ÷ 285,476 shares) | | $ 10.00 |
A Redemption price per share is equal to net asset value less any applicable contingent deferred sales charge.
See accompanying notes which are an integral part of the financial statements.
Annual Report
Fidelity Advisor Communications Equipment Fund
Financial Statements - continued
Statement of Operations
| Year ended July 31, 2011 |
| | |
Investment Income | | |
Dividends | | $ 156,198 |
Interest | | 54 |
Income from Fidelity Central Funds (including $26,436 from security lending) | | 27,605 |
Total income | | 183,857 |
| | |
Expenses | | |
Management fee | $ 130,244 | |
Transfer agent fees | 70,336 | |
Distribution and service plan fees | 109,324 | |
Accounting and security lending fees | 9,461 | |
Custodian fees and expenses | 11,775 | |
Independent trustees' compensation | 118 | |
Registration fees | 54,576 | |
Audit | 46,085 | |
Legal | 85 | |
Miscellaneous | 171 | |
Total expenses before reductions | 432,175 | |
Expense reductions | (57,777) | 374,398 |
Net investment income (loss) | | (190,541) |
Realized and Unrealized Gain (Loss) Net realized gain (loss) on: | | |
Investment securities: | | |
Unaffiliated issuers | 1,594,195 | |
Foreign currency transactions | (3,915) | |
Total net realized gain (loss) | | 1,590,280 |
Change in net unrealized appreciation (depreciation) on: Investment securities | (1,230,505) | |
Assets and liabilities in foreign currencies | (5) | |
Total change in net unrealized appreciation (depreciation) | | (1,230,510) |
Net gain (loss) | | 359,770 |
Net increase (decrease) in net assets resulting from operations | | $ 169,229 |
Statement of Changes in Net Assets
| Year ended
July 31,
2011 | Year ended
July 31,
2010 |
Increase (Decrease) in Net Assets | | |
Operations | | |
Net investment income (loss) | $ (190,541) | $ (225,209) |
Net realized gain (loss) | 1,590,280 | 955,330 |
Change in net unrealized appreciation (depreciation) | (1,230,510) | 1,311,875 |
Net increase (decrease) in net assets resulting from operations | 169,229 | 2,041,996 |
Share transactions - net increase (decrease) | 8,972,466 | 1,341,807 |
Redemption fees | 1,851 | 1,464 |
Total increase (decrease) in net assets | 9,143,546 | 3,385,267 |
| | |
Net Assets | | |
Beginning of period | 14,287,018 | 10,901,751 |
End of period (including accumulated net investment loss of $2,793 and undistributed net investment income of $0, respectively) | $ 23,430,564 | $ 14,287,018 |
See accompanying notes which are an integral part of the financial statements.
Annual Report
Financial Highlights - Class A
Years ended July 31, | 2011 | 2010 | 2009 | 2008 | 2007 |
Selected Per-Share Data | | | | | |
Net asset value, beginning of period | $ 8.67 | $ 7.28 | $ 7.82 | $ 9.49 | $ 7.29 |
Income from Investment Operations | | | | | |
Net investment income (loss) C | (.06) | (.11) | .02 F | (.08) | (.09) |
Net realized and unrealized gain (loss) | 1.12 | 1.50 | (.56) | (1.45) | 2.29 |
Total from investment operations | 1.06 | 1.39 | (.54) | (1.53) | 2.20 |
Distributions from net realized gain | - | - | - | (.14) | - |
Redemption fees added to paid in capital C, H | - | - | - | - | - |
Net asset value, end of period | $ 9.73 | $ 8.67 | $ 7.28 | $ 7.82 | $ 9.49 |
Total Return A, B | 12.23% | 19.09% | (6.91)% | (16.43)% | 30.18% |
Ratios to Average Net Assets D, G | | | | | |
Expenses before reductions | 1.64% | 1.90% | 3.15% | 2.25% | 2.24% |
Expenses net of fee waivers, if any | 1.40% | 1.40% | 1.40% | 1.40% | 1.40% |
Expenses net of all reductions | 1.39% | 1.38% | 1.40% | 1.39% | 1.40% |
Net investment income (loss) | (.60)% | (1.32)% | .26% F | (.91)% | (1.00)% |
Supplemental Data | | | | | |
Net assets, end of period (000 omitted) | $ 8,787 | $ 4,860 | $ 3,476 | $ 2,459 | $ 2,825 |
Portfolio turnover rate E | 101% | 106% | 97% | 63% | 58% |
A Total returns would have been lower if certain expenses had not been reduced during the applicable periods shown.
B Total returns do not include the effect of the sales charges.
C Calculated based on average shares outstanding during the period.
D Fees and expenses of any underlying Fidelity Central Funds are not included in the Fund's expense ratio. The Fund indirectly bears its proportionate share of the expenses of any underlying Fidelity Central Funds.
E Amount does not include the portfolio activity of any underlying Fidelity Central Funds.
F Investment income per share reflects a special dividend which amounted to $.07 per share. Excluding the special dividend, the ratio of net investment income (loss) to average net assets would have been (.88)%.
G Expense ratios reflect operating expenses of the class. Expenses before reductions do not reflect amounts reimbursed by the investment adviser or reductions from brokerage service arrangements or reductions from other expense offset arrangements and do not represent the amount paid by the class during periods when reimbursements or reductions occur. Expenses net of fee waivers reflect expenses after reimbursement by the investment adviser but prior to reductions from brokerage service arrangements or other expense offset arrangements. Expenses net of all reductions represent the net expenses paid by the class.
H Amount represents less than $.01 per share.
Financial Highlights - Class T
Years ended July 31, | 2011 | 2010 | 2009 | 2008 | 2007 |
Selected Per-Share Data | | | | | |
Net asset value, beginning of period | $ 8.46 | $ 7.13 | $ 7.68 | $ 9.34 | $ 7.19 |
Income from Investment Operations | | | | | |
Net investment income (loss) C | (.09) | (.13) | - F, H | (.10) | (.11) |
Net realized and unrealized gain (loss) | 1.11 | 1.46 | (.55) | (1.42) | 2.26 |
Total from investment operations | 1.02 | 1.33 | (.55) | (1.52) | 2.15 |
Distributions from net realized gain | - | - | - | (.14) | - |
Redemption fees added to paid in capital C, H | - | - | - | - | - |
Net asset value, end of period | $ 9.48 | $ 8.46 | $ 7.13 | $ 7.68 | $ 9.34 |
Total Return A, B | 12.06% | 18.65% | (7.16)% | (16.59)% | 29.90% |
Ratios to Average Net Assets D, G | | | | | |
Expenses before reductions | 1.97% | 2.20% | 3.52% | 2.62% | 2.57% |
Expenses net of fee waivers, if any | 1.65% | 1.65% | 1.65% | 1.65% | 1.65% |
Expenses net of all reductions | 1.64% | 1.63% | 1.65% | 1.65% | 1.64% |
Net investment income (loss) | (.85)% | (1.57)% | .01% F | (1.16)% | (1.25)% |
Supplemental Data | | | | | |
Net assets, end of period (000 omitted) | $ 4,607 | $ 3,273 | $ 2,396 | $ 2,138 | $ 3,271 |
Portfolio turnover rate E | 101% | 106% | 97% | 63% | 58% |
A Total returns would have been lower if certain expenses had not been reduced during the applicable periods shown.
B Total returns do not include the effect of the sales charges.
C Calculated based on average shares outstanding during the period.
D Fees and expenses of any underlying Fidelity Central Funds are not included in the Fund's expense ratio. The Fund indirectly bears its proportionate share of the expenses of any underlying Fidelity Central Funds.
E Amount does not include the portfolio activity of any underlying Fidelity Central Funds.
F Investment income per share reflects a special dividend which amounted to $.06 per share. Excluding the special dividend, the ratio of net investment income (loss) to average net assets would have been (1.13)%.
G Expense ratios reflect operating expenses of the class. Expenses before reductions do not reflect amounts reimbursed by the investment adviser or reductions from brokerage service arrangements or reductions from other expense offset arrangements and do not represent the amount paid by the class during periods when reimbursements or reductions occur. Expenses net of fee waivers reflect expenses after reimbursement by the investment adviser but prior to reductions from brokerage service arrangements or other expense offset arrangements. Expenses net of all reductions represent the net expenses paid by the class.
H Amount represents less than $.01 per share.
See accompanying notes which are an integral part of the financial statements.
Annual Report
Financial Highlights - Class B
Years ended July 31, | 2011 | 2010 | 2009 | 2008 | 2007 |
Selected Per-Share Data | | | | | |
Net asset value, beginning of period | $ 8.06 | $ 6.83 | $ 7.39 | $ 9.03 | $ 6.99 |
Income from Investment Operations | | | | | |
Net investment income (loss) C | (.13) | (.16) | (.03) F | (.14) | (.14) |
Net realized and unrealized gain (loss) | 1.06 | 1.39 | (.53) | (1.36) | 2.18 |
Total from investment operations | .93 | 1.23 | (.56) | (1.50) | 2.04 |
Distributions from net realized gain | - | - | - | (.14) | - |
Redemption fees added to paid in capital C, H | - | - | - | - | - |
Net asset value, end of period | $ 8.99 | $ 8.06 | $ 6.83 | $ 7.39 | $ 9.03 |
Total Return A, B | 11.54% | 18.01% | (7.58)% | (16.94)% | 29.18% |
Ratios to Average Net Assets D, G | | | | | |
Expenses before reductions | 2.47% | 2.68% | 3.98% | 3.03% | 3.00% |
Expenses net of fee waivers, if any | 2.15% | 2.15% | 2.15% | 2.15% | 2.15% |
Expenses net of all reductions | 2.14% | 2.13% | 2.15% | 2.15% | 2.15% |
Net investment income (loss) | (1.35)% | (2.07)% | (.49)% F | (1.67)% | (1.75)% |
Supplemental Data | | | | | |
Net assets, end of period (000 omitted) | $ 1,316 | $ 1,408 | $ 1,281 | $ 1,219 | $ 2,225 |
Portfolio turnover rate E | 101% | 106% | 97% | 63% | 58% |
A Total returns would have been lower if certain expenses had not been reduced during the applicable periods shown.
B Total returns do not include the effect of the contingent deferred sales charge.
C Calculated based on average shares outstanding during the period.
D Fees and expenses of any underlying Fidelity Central Funds are not included in the Fund's expense ratio. The Fund indirectly bears its proportionate share of the expenses of any underlying Fidelity Central Funds.
E Amount does not include the portfolio activity of any underlying Fidelity Central Funds.
F Investment income per share reflects a special dividend which amounted to $.06 per share. Excluding the special dividend, the ratio of net investment income (loss) to average net assets would have been (1.63)%.
G Expense ratios reflect operating expenses of the class. Expenses before reductions do not reflect amounts reimbursed by the investment adviser or reductions from brokerage service arrangements or reductions from other expense offset arrangements and do not represent the amount paid by the class during periods when reimbursements or reductions occur. Expenses net of fee waivers reflect expenses after reimbursement by the investment adviser but prior to reductions from brokerage service arrangements or other expense offset arrangements. Expenses net of all reductions represent the net expenses paid by the class.
H Amount represents less than $.01 per share.
Financial Highlights - Class C
Years ended July 31, | 2011 | 2010 | 2009 | 2008 | 2007 |
Selected Per-Share Data | | | | | |
Net asset value, beginning of period | $ 8.06 | $ 6.82 | $ 7.38 | $ 9.03 | $ 6.99 |
Income from Investment Operations | | | | | |
Net investment income (loss) C | (.13) | (.16) | (.03) F | (.14) | (.14) |
Net realized and unrealized gain (loss) | 1.05 | 1.40 | (.53) | (1.37) | 2.18 |
Total from investment operations | .92 | 1.24 | (.56) | (1.51) | 2.04 |
Distributions from net realized gain | - | - | - | (.14) | - |
Redemption fees added to paid in capital C, H | - | - | - | - | - |
Net asset value, end of period | $ 8.98 | $ 8.06 | $ 6.82 | $ 7.38 | $ 9.03 |
Total Return A, B | 11.41% | 18.18% | (7.59)% | (17.06)% | 29.18% |
Ratios to Average Net Assets D, G | | | | | |
Expenses before reductions | 2.40% | 2.67% | 3.63% | 3.02% | 2.98% |
Expenses net of fee waivers, if any | 2.15% | 2.15% | 2.15% | 2.15% | 2.15% |
Expenses net of all reductions | 2.14% | 2.13% | 2.15% | 2.15% | 2.15% |
Net investment income (loss) | (1.35)% | (2.07)% | (.49)% F | (1.67)% | (1.75)% |
Supplemental Data | | | | | |
Net assets, end of period (000 omitted) | $ 5,866 | $ 3,029 | $ 2,792 | $ 1,097 | $ 1,745 |
Portfolio turnover rate E | 101% | 106% | 97% | 63% | 58% |
A Total returns would have been lower if certain expenses had not been reduced during the applicable periods shown.
B Total returns do not include the effect of the contingent deferred sales charge.
C Calculated based on average shares outstanding during the period.
D Fees and expenses of any underlying Fidelity Central Funds are not included in the Fund's expense ratio. The Fund indirectly bears its proportionate share of the expenses of any underlying Fidelity Central Funds.
E Amount does not include the portfolio activity of any underlying Fidelity Central Funds.
F Investment income per share reflects a special dividend which amounted to $.06 per share. Excluding the special dividend, the ratio of net investment income (loss) to average net assets would have been (1.63)%.
G Expense ratios reflect operating expenses of the class. Expenses before reductions do not reflect amounts reimbursed by the investment adviser or reductions from brokerage service arrangements or reductions from other expense offset arrangements and do not represent the amount paid by the class during periods when reimbursements or reductions occur. Expenses net of fee waivers reflect expenses after reimbursement by the investment adviser but prior to reductions from brokerage service arrangements or other expense offset arrangements. Expenses net of all reductions represent the net expenses paid by the class.
H Amount represents less than $.01 per share.
See accompanying notes which are an integral part of the financial statements.
Annual Report
Financial Highlights - Institutional Class
Years ended July 31, | 2011 | 2010 | 2009 | 2008 | 2007 |
Selected Per-Share Data | | | | | |
Net asset value, beginning of period | $ 8.88 | $ 7.45 | $ 7.98 | $ 9.65 | $ 7.39 |
Income from Investment Operations | | | | | |
Net investment income (loss) B | (.04) | (.09) | .03 E | (.06) | (.07) |
Net realized and unrealized gain (loss) | 1.16 | 1.52 | (.56) | (1.47) | 2.33 |
Total from investment operations | 1.12 | 1.43 | (.53) | (1.53) | 2.26 |
Distributions from net realized gain | - | - | - | (.14) | - |
Redemption fees added to paid in capital B, G | - | - | - | - | - |
Net asset value, end of period | $ 10.00 | $ 8.88 | $ 7.45 | $ 7.98 | $ 9.65 |
Total Return A | 12.61% | 19.19% | (6.64)% | (16.16)% | 30.58% |
Ratios to Average Net Assets C, F | | | | | |
Expenses before reductions | 1.22% | 1.54% | 2.44% | 1.94% | 1.87% |
Expenses net of fee waivers, if any | 1.15% | 1.15% | 1.15% | 1.15% | 1.15% |
Expenses net of all reductions | 1.14% | 1.13% | 1.15% | 1.14% | 1.15% |
Net investment income (loss) | (.35)% | (1.07)% | .51% E | (.66)% | (.75)% |
Supplemental Data | | | | | |
Net assets, end of period (000 omitted) | $ 2,855 | $ 1,717 | $ 957 | $ 229 | $ 324 |
Portfolio turnover rate D | 101% | 106% | 97% | 63% | 58% |
A Total returns would have been lower if certain expenses had not been reduced during the applicable periods shown.
B Calculated based on average shares outstanding during the period.
C Fees and expenses of any underlying Fidelity Central Funds are not included in the Fund's expense ratio. The Fund indirectly bears its proportionate share of the expenses of any underlying Fidelity Central Funds.
D Amount does not include the portfolio activity of any underlying Fidelity Central Funds.
E Investment income per share reflects a special dividend which amounted to $.07 per share. Excluding the special dividend, the ratio of net investment income (loss) to average net assets would have been (.63)%.
F Expense ratios reflect operating expenses of the class. Expenses before reductions do not reflect amounts reimbursed by the investment adviser or reductions from brokerage service arrangements or reductions from other expense offset arrangements and do not represent the amount paid by the class during periods when reimbursements or reductions occur. Expenses net of fee waivers reflect expenses after reimbursement by the investment adviser but prior to reductions from brokerage service arrangements or other expense offset arrangements. Expenses net of all reductions represent the net expenses paid by the class.
G Amount represents less than $.01 per share.
See accompanying notes which are an integral part of the financial statements.
Annual Report
Notes to Financial Statements
For the period ended July 31, 2011
1. Organization.
Fidelity Advisor Communications Equipment Fund (the Fund) is a non-diversified fund of Fidelity Advisor Series VII (the Trust) and is authorized to issue an unlimited number of shares. The Trust is registered under the Investment Company Act of 1940, as amended (the 1940 Act), as an open-end management investment company organized as a Massachusetts business trust. The Fund offers Class A, Class T, Class C and Institutional Class shares, each of which, along with Class B shares, has equal rights as to assets and voting privileges. Effective after the close of business on September 1, 2010, Class B shares were closed to new accounts and additional purchases, except for exchanges and reinvestments, by existing shareholders. Each class has exclusive voting rights with respect to matters that affect that class. Class B shares will automatically convert to Class A shares after a holding period of seven years from the initial date of purchase. Investment income, realized and unrealized capital gains and losses, the common expenses of the Fund, and certain fund-level expense reductions, if any, are allocated on a pro-rata basis to each class based on the relative net assets of each class to the total net assets of the Fund. Each class differs with respect to transfer agent and distribution and service plan fees incurred. Certain expense reductions may also differ by class.
2. Investments in Fidelity Central Funds.
The Fund invests in Fidelity Central Funds, which are open-end investment companies available only to other investment companies and accounts managed by Fidelity Management & Research Company (FMR) and its affiliates. The Fund's Schedule of Investments lists each of the Fidelity Central Funds held as of period end, if any, as an investment of the Fund, but does not include the underlying holdings of each Fidelity Central Fund. As an Investing Fund, the Fund indirectly bears its proportionate share of the expenses of the underlying Fidelity Central Funds.
The Money Market Central Funds seek preservation of capital and current income and are managed by Fidelity Investments Money Management, Inc. (FIMM), an affiliate of FMR.
A complete unaudited list of holdings for each Fidelity Central Fund is available upon request or at the Securities and Exchange Commission (the SEC) web site at www.sec.gov. In addition, the financial statements of the Fidelity Central Funds, which are not covered by the Fund's Report of Independent Registered Public Accounting Firm, are available on the SEC web site or upon request.
3. Significant Accounting Policies.
The financial statements have been prepared in conformity with accounting principles generally accepted in the United States of America (GAAP), which require management to make certain estimates and assumptions at the date of the financial statements. Actual results could differ from those estimates. Subsequent events, if any, through the date that the financial statements were issued have been evaluated in the preparation of the financial statements. The following summarizes the significant accounting policies of the Fund:
Security Valuation. Investments are valued as of 4:00 p.m. Eastern time on the last calendar day of the period. The Fund uses independent pricing services approved by the Board of Trustees to value its investments. When current market prices or quotations are not readily available or reliable, valuations may be determined in good faith in accordance with procedures adopted by the Board of Trustees. Factors used in determining value may include market or security specific events, changes in interest rates and credit quality. The frequency with which these procedures are used cannot be predicted and they may be utilized to a significant extent. The value used for net asset value (NAV) calculation under these procedures may differ from published prices for the same securities.
The Fund categorizes the inputs to valuation techniques used to value its investments into a disclosure hierarchy consisting of three levels as shown below:
Level 1 - quoted prices in active markets for identical investments
Level 2 - other significant observable inputs (including quoted prices for similar investments, interest rates, prepayment speeds, etc.)
Level 3 - unobservable inputs (including the Fund's own assumptions based on the best information available)
Changes in valuation techniques may result in transfers in or out of an assigned level within the disclosure hierarchy. The aggregate value of investments by input level, as of July 31, 2011, is included at the end of the Fund's Schedule of Investments. Valuation techniques used to value the Fund's investments by major category are as follows:
Equity securities, including restricted securities, for which market quotations are readily available, are valued at the last reported sale price or official closing price as reported by an independent pricing service on the primary market or exchange on which they are traded and are categorized as Level 1 in the hierarchy. In the event there were no sales during the day or closing prices are not available, securities are valued at the last quoted bid price or may be valued using the last available price and are generally categorized as Level 2 in the hierarchy. For foreign equity securities, when significant market or security specific events arise, comparisons to the valuation of American Depositary Receipts (ADRs), futures contracts, Exchange-traded funds (ETFs) and certain indexes as well as quoted prices for similar securities are used and are categorized as Level 2 in the hierarchy in these
Annual Report
3. Significant Accounting Policies - continued
Security Valuation - continued
circumstances. Utilizing these techniques may result in transfers between Level 1 and Level 2. For restricted equity securities and private placements where observable inputs are limited, assumptions about market activity and risk are used and are categorized as Level 3 in the hierarchy.
Debt securities, including restricted securities, are valued based on evaluated prices received from independent pricing services or from dealers who make markets in such securities. For corporate bonds, pricing services utilize matrix pricing which considers yield or price of bonds of comparable quality, coupon, maturity and type as well as dealer supplied prices and are generally categorized as Level 2 in the hierarchy. When independent prices are unavailable or unreliable, debt securities may be valued utilizing pricing matrices which consider similar factors that would be used by independent pricing services. These are generally categorized as Level 2 in the hierarchy but may be Level 3 depending on the circumstances.
Investments in open-end mutual funds, including the Fidelity Central Funds, are valued at their closing net asset value each business day and are categorized as Level 1 in the hierarchy.
Foreign Currency. The Fund may use foreign currency contracts to facilitate transactions in foreign-denominated securities. Gains and losses from these transactions may arise from changes in the value of the foreign currency or if the counterparties do not perform under the contracts' terms.
Foreign-denominated assets, including investment securities, and liabilities are translated into U.S. dollars at the exchange rate at period end. Purchases and sales of investment securities, income and dividends received and expenses denominated in foreign currencies are translated into U.S. dollars at the exchange rate in effect on the transaction date.
The effects of exchange rate fluctuations on investments are included with the net realized and unrealized gain (loss) on investment securities. Other foreign currency transactions resulting in realized and unrealized gain (loss) are disclosed separately.
Investment Transactions and Income. For financial reporting purposes, the Fund's investment holdings and NAV include trades executed through the end of the last business day of the period. The NAV per share for processing shareholder transactions is calculated as of the close of business of the New York Stock Exchange (NYSE), normally 4:00 p.m. Eastern time and includes trades executed through the end of the prior business day. Gains and losses on securities sold are determined on the basis of identified cost and may include proceeds received from litigation. Dividend income is recorded on the ex-dividend date, except for certain dividends from foreign securities where the ex-dividend date may have passed, which are recorded as soon as the Fund is informed of the ex-dividend date. Non-cash dividends included in dividend income, if any, are recorded at the fair market value of the securities received. Distributions received on securities that represent a return of capital or capital gain are recorded as a reduction of cost of investments and/or as a realized gain. The Fund estimates the components of distributions received that may be considered return of capital distributions or capital gain distributions. Interest income and distributions from the Fidelity Central Funds are accrued as earned. Interest income includes coupon interest and amortization of premium and accretion of discount on debt securities. Investment income is recorded net of foreign taxes withheld where recovery of such taxes is uncertain.
Expenses. Expenses directly attributable to a fund are charged to that fund. Expenses attributable to more than one fund are allocated among the respective funds on the basis of relative net assets or other appropriate methods. Expense estimates are accrued in the period to which they relate and adjustments are made when actual amounts are known.
Income Tax Information and Distributions to Shareholders. Each year, the Fund intends to qualify as a regulated investment company, including distributing substantially all of its taxable income and realized gains under Subchapter M of the Internal Revenue Code and filing its U.S. federal tax return. As a result, no provision for income taxes is required. As of July 31, 2011, the Fund did not have any unrecognized tax benefits in the financial statements. A fund's federal tax return is subject to examination by the Internal Revenue Service (IRS) for a period of three years. Foreign taxes are provided for based on the Fund's understanding of the tax rules and rates that exist in the foreign markets in which it invests.
Distributions are declared and recorded on the ex-dividend date. Income dividends and capital gain distributions are declared separately for each class. Income and capital gain distributions are determined in accordance with income tax regulations, which may differ from GAAP.
Capital accounts within the financial statements are adjusted for permanent book-tax differences. These adjustments have no impact on net assets or the results of operations. Temporary book-tax differences will reverse in a subsequent period.
Book-tax differences are primarily due to foreign currency transactions, net operating losses, capital loss carryforwards and losses deferred due to wash sales and excise tax regulations.
Annual Report
Notes to Financial Statements - continued
3. Significant Accounting Policies - continued
Income Tax Information and Distributions to Shareholders - continued
The federal tax cost of investment securities and unrealized appreciation (depreciation) as of period end were as follows:
Gross unrealized appreciation | $ 3,005,143 |
Gross unrealized depreciation | (2,577,638) |
Net unrealized appreciation (depreciation) on securities and other investments | $ 427,505 |
| |
Tax Cost | $ 23,916,769 |
The tax-based components of distributable earnings as of period end were as follows:
Undistributed long-term capital gain | $ 399,015 |
Net unrealized appreciation (depreciation) | $ 427,505 |
Under the recently enacted Regulated Investment Company Modernization Act of 2010 (the Act), the Fund will be permitted to carry forward capital losses incurred in taxable years beginning after December 22, 2010 for an unlimited period. However, any losses incurred during those future taxable years will be required to be utilized prior to any losses incurred in pre-enactment taxable years, which generally expire after eight years from when they are incurred. Additionally, post-enactment capital losses that are carried forward will retain their character as either short-term or long-term capital losses rather than being considered all short-term as under previous law. The Fund's first fiscal year end subject to the Act will be July 31, 2012.
Short-Term Trading (Redemption) Fees. Shares held by investors in the Fund less than 30 days are subject to a redemption fee equal to .75% of the net asset value of shares redeemed. All redemption fees, which reduce the proceeds of the shareholder redemption, are retained by the Fund and accounted for as an addition to paid in capital.
New Accounting Pronouncement. In May 2011, the Financial Accounting Standards Board issued Accounting Standard Update No. 2011-04, Fair Value Measurement (Topic 820) - Amendments to Achieve Common Fair Value Measurement and Disclosure Requirements in U.S. GAAP and IFRSs. The update changes the wording used to describe the requirements in GAAP for measuring fair value and for disclosing information about fair value measurements. The update is effective during interim and annual periods beginning after December 15, 2011. Management is currently evaluating the impact of the update's adoption on the Fund's financial statement disclosures.
4. Purchases and Sales of Investments.
Purchases and sales of securities, other than short-term securities, aggregated $30,828,844 and $22,744,085, respectively.
5. Fees and Other Transactions with Affiliates.
Management Fee. FMR and its affiliates provide the Fund with investment management related services for which the Fund pays a monthly management fee. The management fee is the sum of an individual fund fee rate that is based on an annual rate of .30% of the Fund's average net assets and a group fee rate that averaged .26% during the period. The group fee rate is based upon the average net assets of all the mutual funds advised by FMR. The group fee rate decreases as assets under management increase and increases as assets under management decrease. For the period, the total annual management fee rate was .56% of the Fund's average net assets.
Distribution and Service Plan Fees. In accordance with Rule 12b-1 of the 1940 Act, the Fund has adopted separate Distribution and Service Plans for each class of shares. Certain classes pay Fidelity Distributors Corporation (FDC), an affiliate of FMR, separate Distribution and Service Fees, each of which is based on an annual percentage of each class' average net assets. In addition, FDC may pay financial intermediaries for selling shares of the Fund and providing shareholder support services.
For the period, the Distribution and Service Fee rates, total fees and amounts retained by FDC were as follows:
| Distribution
Fee | Service
Fee | Total Fees | Retained
by FDC |
Class A | -% | .25% | $ 21,251 | $ 768 |
Class T | .25% | .25% | 23,038 | 8 |
Class B | .75% | .25% | 16,676 | 12,520 |
Class C | .75% | .25% | 48,359 | 11,948 |
| | | $ 109,324 | $ 25,244 |
Annual Report
5. Fees and Other Transactions with Affiliates - continued
Sales Load. FDC may receive a front-end sales charge of up to 5.75% for selling Class A shares, and 3.50% for selling Class T shares, some of which is paid to financial intermediaries for selling shares of the Fund. Depending on the holding period, FDC may receive contingent deferred sales charges levied on Class A, Class T, Class B, and Class C redemptions. The deferred sales charges range from 5% to 1% for Class B, 1% for Class C, 1.00% for certain purchases of Class A shares and .25% for certain purchases of Class T shares.
For the period, sales charge amounts retained by FDC were as follows:
| Retained
by FDC |
Class A | $ 11,855 |
Class T | 4,778 |
Class B* | 1,900 |
Class C* | 1,087 |
| $ 19,620 |
* When Class B and Class C shares are initially sold, FDC pays commissions from its own resources to financial intermediaries through which the sales are made.
Transfer Agent Fees. Fidelity Investments Institutional Operations Company, Inc. (FIIOC), an affiliate of FMR, is the transfer, dividend disbursing and shareholder servicing agent for each class of the Fund. FIIOC receives account fees and asset-based fees that vary according to the account size and type of account of the shareholders of the respective classes of the Fund. FIIOC pays for typesetting, printing and mailing of shareholder reports, except proxy statements. For the period, transfer agent fees for each class were as follows:
| Amount | % of
Average
Net Assets |
Class A | $ 26,251 | .31 |
Class T | 15,840 | .34 |
Class B | 5,116 | .31 |
Class C | 14,796 | .31 |
Institutional Class | 8,333 | .22 |
| $ 70,336 | |
Accounting and Security Lending Fees. Fidelity Service Company, Inc. (FSC), an affiliate of FMR, maintains the Fund's accounting records. The accounting fee is based on the level of average net assets for the month. Under a separate contract, FSC administers the security lending program. The security lending fee is based on the number and duration of lending transactions.
Brokerage Commissions. The Fund placed a portion of its portfolio transactions with brokerage firms which are affiliates of the investment adviser. The commissions paid to these affiliated firms were $1,794 for the period.
6. Committed Line of Credit.
The Fund participates with other funds managed by FMR or an affiliate in a $4.0 billion credit facility (the "line of credit") to be utilized for temporary or emergency purposes to fund shareholder redemptions or for other short-term liquidity purposes. The Fund has agreed to pay commitment fees on its pro-rata portion of the line of credit, which amounted to $72 and is reflected in Miscellaneous expenses on the Statement of Operations. During the period, there were no borrowings on this line of credit.
7. Security Lending.
The Fund lends portfolio securities through a lending agent from time to time in order to earn additional income. The lending agent may loan securities to certain qualified borrowers, including Fidelity Capital Markets (FCM), a broker-dealer affiliated with the Fund. On the settlement date of the loan, the Fund receives collateral (in the form of U.S. Treasury obligations, letters of credit and/or cash) against the loaned securities and maintains collateral in an amount not less than 100% of the market value of the loaned securities during the period of the loan. The market value of the loaned securities is determined at the close of business of the Fund and any additional required collateral is delivered to the Fund on the next business day. If the borrower defaults on its obligation to return the securities loaned because of insolvency or other reasons, a fund could experience delays and costs in recovering the securities loaned or in gaining access to the collateral. Any cash collateral received is invested in the Fidelity Securities Lending Cash Central Fund. The value of loaned securities and cash collateral at period end are disclosed on the Fund's Statement of Assets and Liabilities. Security
Annual Report
Notes to Financial Statements - continued
7. Security Lending - continued
lending income represents the income earned on investing cash collateral, less rebates paid to borrowers and lending agent fees associated with the loan, plus any premium payments received for lending certain types of securities. Security lending income is presented in the Statement of Operations as a component of income from Fidelity Central Funds. During the period, there were no securities loaned to FCM.
8. Expense Reductions.
FMR voluntarily agreed to reimburse each class to the extent annual operating expenses exceeded certain levels of average net assets as noted in the table below. Some expenses, for example interest expense, including commitment fees, are excluded from this reimbursement.
The following classes were in reimbursement during the period:
| Expense
Limitations | Reimbursement
from adviser |
Class A | 1.40% | $ 20,101 |
Class T | 1.65% | 14,755 |
Class B | 2.15% | 5,389 |
Class C | 2.15% | 11,901 |
Institutional Class | 1.15% | 2,808 |
| | $ 54,954 |
Many of the brokers with whom FMR places trades on behalf of the Fund provided services to the Fund in addition to trade execution. These services included payments of certain expenses on behalf of the Fund totaling $2,823 for the period.
9. Share Transactions.
Transactions for each class of shares were as follows:
| Shares | Dollars |
Years ended July 31, | 2011 | 2010 | 2011 | 2010 |
Class A | | | | |
Shares sold | 848,465 | 379,066 | $ 9,277,193 | $ 3,104,413 |
Shares redeemed | (506,493) | (295,518) | (5,495,871) | (2,391,964) |
Net increase (decrease) | 341,972 | 83,548 | $ 3,781,322 | $ 712,449 |
Class T | | | | |
Shares sold | 222,009 | 156,340 | $ 2,346,633 | $ 1,239,925 |
Shares redeemed | (122,895) | (105,545) | (1,276,707) | (829,604) |
Net increase (decrease) | 99,114 | 50,795 | $ 1,069,926 | $ 410,321 |
Class B | | | | |
Shares sold | 48,553 | 104,878 | $ 469,014 | $ 798,141 |
Shares redeemed | (76,689) | (117,849) | (748,333) | (896,172) |
Net increase (decrease) | (28,136) | (12,971) | $ (279,319) | $ (98,031) |
Class C | | | | |
Shares sold | 468,878 | 234,346 | $ 4,767,947 | $ 1,790,479 |
Shares redeemed | (191,799) | (267,515) | (1,863,160) | (1,967,047) |
Net increase (decrease) | 277,079 | (33,169) | $ 2,904,787 | $ (176,568) |
Institutional Class | | | | |
Shares sold | 497,180 | 263,129 | $ 5,828,732 | $ 2,147,225 |
Shares redeemed | (405,041) | (198,313) | (4,332,982) | (1,653,589) |
Net increase (decrease) | 92,139 | 64,816 | $ 1,495,750 | $ 493,636 |
10. Other.
The Fund's organizational documents provide former and current trustees and officers with a limited indemnification against liabilities arising in connection with the performance of their duties to the Fund. In the normal course of business, the Fund may also enter into contracts that provide general indemnifications. The Fund's maximum exposure under these arrangements is unknown as this would be dependent on future claims that may be made against the Fund. The risk of material loss from such claims is considered remote.
Annual Report
Fidelity Advisor Consumer Discretionary Fund - Class A, T, B, and C
Performance: The Bottom Line
Average annual total return reflects the change in the value of an investment, assuming reinvestment of the class' distributions from dividend income and capital gains (the profits earned upon the sale of securities that have grown in value, if any) and assuming a constant rate of performance each year. The $10,000 table and the fund's returns do not reflect the deduction of taxes that a shareholder would pay on fund distributions or the redemption of fund shares. During periods of reimbursement by Fidelity, a fund's total return will be greater than it would be had the reimbursement not occurred. How a fund did yesterday is no guarantee of how it will do tomorrow. Returns reflect the conversion of Class B shares to Class A shares after a maximum of seven years.
Average Annual Total Returns
Periods ended July 31, 2011 | Past 1
year | Past 5
years | Past 10
years |
Class A (incl. 5.75% sales charge)C | 18.27% | 3.12% | 3.02% |
Class T (incl. 3.50% sales charge)C | 20.86% | 3.37% | 3.02% |
Class B (incl. contingent deferred sales charge) A, C | 19.61% | 3.24% | 3.10% |
Class C (incl. contingent deferred sales charge) B, C | 23.65% | 3.59% | 2.87% |
A Class B shares' contingent deferred sales charges included in the past one year, past five years, and past ten years total return figures are 5%, 2%, and 0%, respectively.
B Class C shares' contingent deferred sales charges included in the past one year, past five years, and past ten years total return figures are 1%, 0%, and 0%, respectively.
C Prior to October 1, 2006, Fidelity Advisor Consumer Discretionary Fund operated under certain different investment policies. The historical performance for the fund may not represent its current investment policies.
$10,000 Over 10 Years
Let's say hypothetically that $10,000 was invested in Fidelity Advisor Consumer Discretionary Fund - Class A on July 31, 2001, and the current 5.75% sales charge was paid. The chart shows how the value of your investment would have changed, and also shows how the S&P 500 Index performed over the same period.
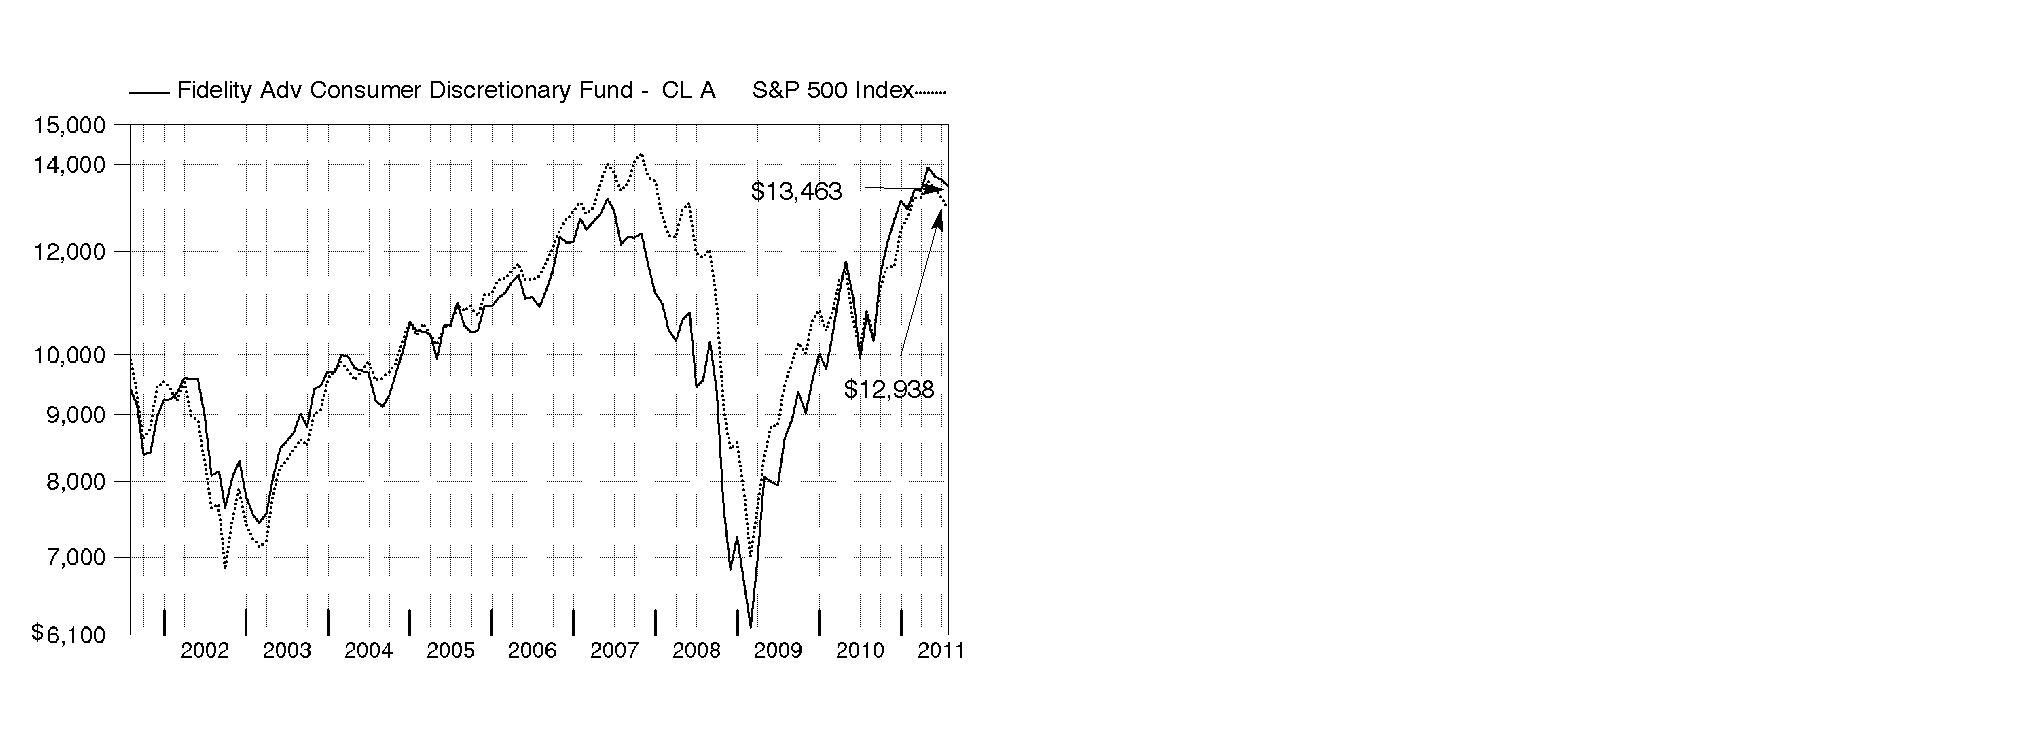
Annual Report
Fidelity Advisor Consumer Discretionary Fund
Market Recap: U.S. stocks registered solid double-digit gains for the 12 months ending July 31, 2011, extending a rally that began more than two years earlier. Despite a rough start in August 2010, markets turned positive in September, as increased demand for capital goods and other upbeat indicators trumped investor worry about a U.S. recessionary relapse. The broad market, as measured by the S&P 500® Index, rose 9% that month, its biggest September gain in 71 years. Seven more monthly advances followed, fueled by encouraging corporate earnings and economic activity. However, volatility picked up in the period's latter months, as markets reacted to continued high U.S. unemployment, nagging debt troubles in Europe and looming legislative battles over the federal debt ceiling. May unemployment rose above 9% for the first time in 2011, contributing to a traditional "June swoon" for stocks. Market uncertainty lingered in July, when the S&P 500® posted its second-biggest monthly loss of the period. For the full year, the S&P 500® climbed 19.65%, while the blue-chip-laden Dow Jones Industrial AverageSM rose a comparable 19.09% and the technology-heavy Nasdaq Composite® Index gained 23.40%. On the capitalization spectrum, stocks of mid-cap companies fared best, with the Russell Midcap® Index rising 24.51% and the small-cap Russell 2000® Index adding 23.92%.
Comments from John Harris, Portfolio Manager of Fidelity® Advisor Consumer Discretionary Fund: For the 12 months ending July 31, 2011, the fund's Class A, Class T, Class B and Class C shares returned 25.49%, 25.24%, 24.61% and 24.65%, respectively (excluding sales charges), underperforming the 29.36% gain of the MSCI® U.S. IM Consumer Discretionary 25/50 Index but outpacing the 19.65% advance of the broadly based S&P 500® Index. Positioning in home improvement retail hurt performance versus the sector benchmark, as did stock picking in apparel retail, Internet retail, automotive retail, and hotels, resorts and cruise lines. On an individual security basis, overweightings in home improvement chains Lowe's Companies and Lumber Liquidators Holdings were major detractors, along with off-price apparel retailer Citi Trends, office supplies retailer OfficeMax, and WMS Industries, which manufactures and distributes slot machines. Not owning movie subscription service and index component Netflix for most of the period also hurt, as its share price climbed sharply. On the other hand, we were well-positioned in automobile manufacturers, where we underweighted the stock of Ford Motor, which lost ground, and held an out-of benchmark position in strong-performing German automaker BMW. Stock selection in homefurnishings also helped, as did an overweighting in casinos and gaming, and an out-of-benchmark position in Internet software and services. Other individual contributors included overweightings in casino company Las Vegas Sands, premium bed manufacturer Tempur-Pedic International and specialty rural retailer Tractor Supply. Some of the positions I've mentioned were sold by period end.
Comments from John Harris, Portfolio Manager of Fidelity® Advisor Consumer Discretionary Fund: For the 12 months ending July 31, 2011, the fund's Institutional Class shares returned 26.00%, underperforming the 29.36% gain of the MSCI® U.S. IM Consumer Discretionary 25/50 Index but outpacing the 19.65% advance of the broadly based S&P 500® Index. Positioning in home improvement retail hurt performance versus the sector benchmark, as did stock picking in apparel retail, Internet retail, automotive retail, and hotels, resorts and cruise lines. On an individual security basis, overweightings in home improvement chains Lowe's Companies and Lumber Liquidators Holdings were major detractors, along with off-price apparel retailer Citi Trends, office supplies retailer OfficeMax, and WMS Industries, which manufactures and distributes slot machines. Not owning movie subscription service and index component Netflix for most of the period also hurt, as its share price climbed sharply. On the other hand, we were well-positioned in automobile manufacturers, where we underweighted the stock of Ford Motor, which lost ground, and held an out-of benchmark position in strong-performing German automaker BMW. Stock selection in homefurnishings also helped, as did an overweighting in casinos and gaming, and an out-of-benchmark position in Internet software and services. Other individual contributors included overweightings in casino company Las Vegas Sands, premium bed manufacturer Tempur-Pedic International and specialty rural retailer Tractor Supply. Some of the positions I've mentioned were sold by period end.
The views expressed above reflect those of the portfolio manager(s) only through the end of the period as stated on the cover of this report and do not necessarily represent the views of Fidelity or any other person in the Fidelity organization. Any such views are subject to change at any time based upon market or other conditions and Fidelity disclaims any responsibility to update such views. These views may not be relied on as investment advice and, because investment decisions for a Fidelity fund are based on numerous factors, may not be relied on as an indication of trading intent on behalf of any Fidelity fund.
Annual Report
Fidelity Advisor Consumer Discretionary Fund
As a shareholder of the Fund, you incur two types of costs: (1) transaction costs, including sales charges (loads) on purchase payments or redemption proceeds, redemption fees, and (2) ongoing costs, including management fees, distribution and/or service (12b-1) fees and other Fund expenses. This Example is intended to help you understand your ongoing costs (in dollars) of investing in the Fund and to compare these costs with the ongoing costs of investing in other mutual funds.
The Example is based on an investment of $1,000 invested at the beginning of the period and held for the entire period (February 1, 2011 to July 31, 2011).
Actual Expenses
The first line of the accompanying table for each class of the Fund provides information about actual account values and actual expenses. You may use the information in this line, together with the amount you invested, to estimate the expenses that you paid over the period. Simply divide your account value by $1,000.00 (for example, an $8,600 account value divided by $1,000.00 = 8.6), then multiply the result by the number in the first line for a class of the Fund under the heading entitled "Expenses Paid During Period" to estimate the expenses you paid on your account during this period. In addition, the Fund, as a shareholder in the underlying Fidelity Central Funds, will indirectly bear its pro-rata share of the fees and expenses incurred by the underlying Fidelity Central Funds. These fees and expenses are not included in the Fund's annualized expense ratio used to calculate the expense estimate in the table below.
Hypothetical Example for Comparison Purposes
The second line of the accompanying table for each class of the Fund provides information about hypothetical account values and hypothetical expenses based on a Class' actual expense ratio and an assumed rate of return of 5% per year before expenses, which is not the Class' actual return. The hypothetical account values and expenses may not be used to estimate the actual ending account balance or expenses you paid for the period. You may use this information to compare the ongoing costs of investing in the Fund and other funds. To do so, compare this 5% hypothetical example with the 5% hypothetical examples that appear in the shareholder reports of the other funds. In addition, the Fund, as a shareholder in the underlying Fidelity Central Funds, will indirectly bear its pro-rata share of the fees and expenses incurred by the underlying Fidelity Central Funds. These fees and expenses are not included in the Fund's annualized expense ratio used to calculate the expense estimate in the table below.
Please note that the expenses shown in the table are meant to highlight your ongoing costs only and do not reflect any transaction costs. Therefore, the second line of the table is useful in comparing ongoing costs only, and will not help you determine the relative total costs of owning different funds. In addition, if these transactional costs were included, your costs would have been higher.
| Annualized
Expense Ratio | Beginning
Account Value
February 1, 2011 | Ending
Account Value
July 31, 2011 | Expenses Paid
During Period*
February 1, 2011 to July 31, 2011 |
Class A | 1.39% | | | |
Actual | | $ 1,000.00 | $ 1,041.00 | $ 7.03 |
Hypothetical A | | $ 1,000.00 | $ 1,017.90 | $ 6.95 |
Class T | 1.65% | | | |
Actual | | $ 1,000.00 | $ 1,039.80 | $ 8.35 |
Hypothetical A | | $ 1,000.00 | $ 1,016.61 | $ 8.25 |
Class B | 2.14% | | | |
Actual | | $ 1,000.00 | $ 1,037.20 | $ 10.81 |
Hypothetical A | | $ 1,000.00 | $ 1,014.18 | $ 10.69 |
Class C | 2.06% | | | |
Actual | | $ 1,000.00 | $ 1,037.80 | $ 10.41 |
Hypothetical A | | $ 1,000.00 | $ 1,014.58 | $ 10.29 |
Institutional Class | .99% | | | |
Actual | | $ 1,000.00 | $ 1,043.00 | $ 5.01 |
Hypothetical A | | $ 1,000.00 | $ 1,019.89 | $ 4.96 |
A 5% return per year before expenses
* Expenses are equal to each Class' annualized expense ratio, multiplied by the average account value over the period, multiplied by 181/365 (to reflect the one-half year period).
Annual Report
Fidelity Advisor Consumer Discretionary Fund
Investment Changes (Unaudited)
Top Ten Stocks as of July 31, 2011 |
| % of fund's
net assets | % of fund's net assets
6 months ago |
Amazon.com, Inc. | 5.8 | 3.3 |
Lowe's Companies, Inc. | 5.3 | 5.7 |
McDonald's Corp. | 4.9 | 4.3 |
DIRECTV | 3.9 | 2.9 |
Time Warner, Inc. | 3.8 | 0.0 |
Target Corp. | 3.5 | 3.6 |
The Walt Disney Co. | 3.1 | 5.5 |
Bed Bath & Beyond, Inc. | 2.9 | 2.8 |
TJX Companies, Inc. | 2.8 | 2.6 |
Starbucks Corp. | 2.8 | 2.2 |
| 38.8 | |
Top Industries (% of fund's net assets) |
As of July 31, 2011 |
| Hotels, Restaurants & Leisure | 22.8% | |
| Specialty Retail | 20.8% | |
 | Media | 20.0% | |
| Internet & Catalog Retail | 9.6% | |
 | Textiles, Apparel & Luxury Goods | 5.3% | |
| All Others* | 21.5% | |

As of January 31, 2011 |
| Specialty Retail | 24.6% | |
| Media | 24.1% | |
| Hotels, Restaurants & Leisure | 19.4% | |
| Textiles, Apparel & Luxury Goods | 4.5% | |
| Automobiles | 4.5% | |
| All Others* | 22.9% | |

* Includes short-term investments and net other assets. |
Annual Report
Fidelity Advisor Consumer Discretionary Fund
Investments July 31, 2011
Showing Percentage of Net Assets
Common Stocks - 99.1% |
| Shares | | Value |
AUTO COMPONENTS - 3.1% |
Auto Parts & Equipment - 3.1% |
Autoliv, Inc. | 10,745 | | $ 710,889 |
Gentex Corp. | 18,490 | | 524,007 |
TRW Automotive Holdings Corp. (a) | 8,401 | | 423,998 |
| | 1,658,894 |
AUTOMOBILES - 2.9% |
Automobile Manufacturers - 1.8% |
Bayerische Motoren Werke AG (BMW) | 4,201 | | 421,448 |
Honda Motor Co. Ltd. | 14,000 | | 555,608 |
| | 977,056 |
Motorcycle Manufacturers - 1.1% |
Harley-Davidson, Inc. | 13,476 | | 584,724 |
TOTAL AUTOMOBILES | | 1,561,780 |
DIVERSIFIED CONSUMER SERVICES - 4.4% |
Education Services - 1.2% |
DeVry, Inc. | 10,468 | | 650,482 |
Specialized Consumer Services - 3.2% |
Sotheby's Class A (Ltd. vtg.) | 14,106 | | 597,389 |
Steiner Leisure Ltd. (a) | 9,505 | | 462,133 |
Weight Watchers International, Inc. | 8,085 | | 624,081 |
| | 1,683,603 |
TOTAL DIVERSIFIED CONSUMER SERVICES | | 2,334,085 |
FOOD & STAPLES RETAILING - 0.5% |
Hypermarkets & Super Centers - 0.5% |
Costco Wholesale Corp. | 3,329 | | 260,494 |
HOTELS, RESTAURANTS & LEISURE - 22.8% |
Casinos & Gaming - 4.7% |
Las Vegas Sands Corp. (a) | 24,271 | | 1,145,106 |
Las Vegas Sands Corp. unit | 810 | | 643,496 |
MGM Mirage, Inc. (a) | 46,900 | | 708,659 |
| | 2,497,261 |
Hotels, Resorts & Cruise Lines - 4.1% |
InterContinental Hotel Group PLC | 11,000 | | 217,077 |
Royal Caribbean Cruises Ltd. | 19,000 | | 581,780 |
Starwood Hotels & Resorts Worldwide, Inc. | 25,331 | | 1,392,192 |
| | 2,191,049 |
Restaurants - 14.0% |
Ajisen (China) Holdings Ltd. | 128,000 | | 251,934 |
Arcos Dorados Holdings, Inc. | 6,000 | | 140,760 |
BJ's Restaurants, Inc. (a) | 8,510 | | 394,609 |
Bravo Brio Restaurant Group, Inc. | 6,500 | | 145,275 |
Darden Restaurants, Inc. | 14,563 | | 739,800 |
Dunkin' Brands Group, Inc. | 5,000 | | 144,650 |
Einstein Noah Restaurant Group, Inc. | 3,579 | | 56,119 |
McDonald's Corp. | 30,061 | | 2,599,675 |
|
| Shares | | Value |
Panera Bread Co. Class A (a) | 3,343 | | $ 385,481 |
Ruth's Hospitality Group, Inc. (a) | 69,163 | | 397,687 |
Starbucks Corp. | 37,718 | | 1,512,115 |
Texas Roadhouse, Inc. Class A | 43,025 | | 710,773 |
| | 7,478,878 |
TOTAL HOTELS, RESTAURANTS & LEISURE | | 12,167,188 |
HOUSEHOLD DURABLES - 2.9% |
Home Furnishings - 1.3% |
Tempur-Pedic International, Inc. (a) | 9,908 | | 713,475 |
Homebuilding - 1.6% |
Lennar Corp. Class A | 35,811 | | 633,497 |
Toll Brothers, Inc. (a) | 9,600 | | 191,616 |
| | 825,113 |
TOTAL HOUSEHOLD DURABLES | | 1,538,588 |
INTERNET & CATALOG RETAIL - 9.6% |
Internet Retail - 9.6% |
Amazon.com, Inc. (a) | 13,963 | | 3,107,044 |
Blue Nile, Inc. (a)(d) | 6,100 | | 258,396 |
Netflix, Inc. (a) | 500 | | 132,995 |
Ocado Group PLC (a)(d) | 42,100 | | 117,697 |
Priceline.com, Inc. (a) | 2,587 | | 1,390,901 |
Start Today Co. Ltd. | 5,100 | | 126,697 |
| | 5,133,730 |
INTERNET SOFTWARE & SERVICES - 1.0% |
Internet Software & Services - 1.0% |
Google, Inc. Class A (a) | 898 | | 542,114 |
LEISURE EQUIPMENT & PRODUCTS - 0.9% |
Leisure Products - 0.9% |
Hasbro, Inc. | 11,600 | | 458,896 |
MEDIA - 20.0% |
Advertising - 1.0% |
National CineMedia, Inc. | 35,298 | | 519,940 |
Broadcasting - 0.7% |
Discovery Communications, Inc. (a) | 9,800 | | 390,040 |
Cable & Satellite - 8.9% |
DIRECTV (a) | 40,882 | | 2,071,900 |
Sirius XM Radio, Inc. (a) | 246,800 | | 520,748 |
Time Warner Cable, Inc. | 18,139 | | 1,329,770 |
Virgin Media, Inc. | 29,667 | | 784,989 |
| | 4,707,407 |
Movies & Entertainment - 9.4% |
The Walt Disney Co. | 42,768 | | 1,651,700 |
Time Warner, Inc. | 57,117 | | 2,008,234 |
Viacom, Inc. Class B (non-vtg.) | 27,874 | | 1,349,659 |
| | 5,009,593 |
TOTAL MEDIA | | 10,626,980 |
Common Stocks - continued |
| Shares | | Value |
MULTILINE RETAIL - 4.9% |
Department Stores - 0.4% |
Marisa Lojas SA | 13,800 | | $ 193,940 |
General Merchandise Stores - 4.5% |
Dollar Tree, Inc. (a) | 7,739 | | 512,554 |
Target Corp. | 36,644 | | 1,886,800 |
| | 2,399,354 |
TOTAL MULTILINE RETAIL | | 2,593,294 |
SPECIALTY RETAIL - 20.8% |
Apparel Retail - 7.2% |
Body Central Corp. | 4,000 | | 85,960 |
Chico's FAS, Inc. | 30,489 | | 460,079 |
Foot Locker, Inc. | 11,157 | | 242,442 |
Foschini Ltd. | 4,500 | | 59,194 |
Inditex SA | 3,238 | | 293,760 |
Limited Brands, Inc. | 15,500 | | 586,830 |
TJX Companies, Inc. | 27,434 | | 1,517,100 |
Urban Outfitters, Inc. (a) | 16,678 | | 542,702 |
Workman Co. Ltd. | 1,000 | | 27,545 |
| | 3,815,612 |
Automotive Retail - 2.4% |
Advance Auto Parts, Inc. | 18,320 | | 1,007,050 |
Penske Automotive Group, Inc. | 13,600 | | 300,968 |
| | 1,308,018 |
Computer & Electronics Retail - 1.2% |
Best Buy Co., Inc. | 24,100 | | 665,160 |
Home Improvement Retail - 5.8% |
Lowe's Companies, Inc. | 130,853 | | 2,823,808 |
Lumber Liquidators Holdings, Inc. (a)(d) | 15,625 | | 245,469 |
| | 3,069,277 |
Homefurnishing Retail - 2.9% |
Bed Bath & Beyond, Inc. (a) | 26,045 | | 1,523,372 |
Specialty Stores - 1.3% |
OfficeMax, Inc. (a) | 20,710 | | 146,627 |
Tractor Supply Co. | 8,179 | | 539,160 |
| | 685,787 |
TOTAL SPECIALTY RETAIL | | 11,067,226 |
TEXTILES, APPAREL & LUXURY GOODS - 5.3% |
Apparel, Accessories & Luxury Goods - 4.4% |
Polo Ralph Lauren Corp. Class A | 1,092 | | 147,496 |
|
| Shares | | Value |
PVH Corp. | 10,098 | | $ 722,512 |
Titan Industries Ltd. | 32,060 | | 165,521 |
Trinity Ltd. | 124,000 | | 137,463 |
Vera Bradley, Inc. | 3,600 | | 130,572 |
VF Corp. | 8,700 | | 1,016,160 |
| | 2,319,724 |
Footwear - 0.9% |
NIKE, Inc. Class B | 5,468 | | 492,940 |
TOTAL TEXTILES, APPAREL & LUXURY GOODS | | 2,812,664 |
TOTAL COMMON STOCKS (Cost $46,030,345) | 52,755,933 |
Nonconvertible Preferred Stocks - 1.0% |
| | | |
AUTOMOBILES - 1.0% |
Automobile Manufacturers - 1.0% |
Volkswagen AG
(Cost $506,549) | 2,600 | | 520,959 |
Money Market Funds - 1.9% |
| | | |
Fidelity Cash Central Fund, 0.14% (b) | 397,268 | | 397,268 |
Fidelity Securities Lending Cash Central Fund, 0.15% (b)(c) | 634,000 | | 634,000 |
TOTAL MONEY MARKET FUNDS (Cost $1,031,268) | 1,031,268 |
TOTAL INVESTMENT PORTFOLIO - 102.0% (Cost $47,568,162) | | 54,308,160 |
NET OTHER ASSETS (LIABILITIES) - (2.0)% | | (1,047,193) |
NET ASSETS - 100% | $ 53,260,967 |
Legend |
(a) Non-income producing |
(b) Affiliated fund that is available only to investment companies and other accounts managed by Fidelity Investments. The rate quoted is the annualized seven-day yield of the fund at period end. A complete unaudited listing of the fund's holdings as of its most recent quarter end is available upon request. In addition, each Fidelity Central Fund's financial statements, which are not covered by the Fund's Report of Independent Registered Public Accounting Firm, are available on the SEC's website or upon request. |
(c) Investment made with cash collateral received from securities on loan. |
(d) Security or a portion of the security is on loan at period end. |
Affiliated Central Funds |
Information regarding fiscal year to date income earned by the Fund from investments in Fidelity Central Funds is as follows: |
Fund | Income earned |
Fidelity Cash Central Fund | $ 958 |
Fidelity Securities Lending Cash Central Fund | 11,911 |
Total | $ 12,869 |
Other Information |
The following is a summary of the inputs used, as of July 31, 2011, involving the Fund's assets and liabilities carried at fair value. The inputs or methodology used for valuing securities may not be an indication of the risk associated with investing in those securities. For more information on valuation inputs, and their aggregation into the levels used in the table below, please refer to the Security Valuation section in the accompanying Notes to Financial Statements. |
Valuation Inputs at Reporting Date: |
Description | Total | Level 1 | Level 2 | Level 3 |
Investments in Securities: | | | | |
Common Stocks | $ 52,755,933 | $ 51,339,752 | $ 1,416,181 | $ - |
Nonconvertible Preferred Stocks | 520,959 | 520,959 | - | - |
Money Market Funds | 1,031,268 | 1,031,268 | - | - |
Total Investments in Securities: | $ 54,308,160 | $ 52,891,979 | $ 1,416,181 | $ - |
See accompanying notes which are an integral part of the financial statements.
Annual Report
Fidelity Advisor Consumer Discretionary Fund
Statement of Assets and Liabilities
| July 31, 2011 |
| | |
Assets | | |
Investment in securities, at value (including securities loaned of $617,038) - See accompanying schedule: Unaffiliated issuers (cost $46,536,894) | $ 53,276,892 | |
Fidelity Central Funds (cost $1,031,268) | 1,031,268 | |
Total Investments (cost $47,568,162) | | $ 54,308,160 |
Cash | | 6,593 |
Receivable for investments sold | | 1,571,172 |
Receivable for fund shares sold | | 26,043 |
Dividends receivable | | 34,533 |
Distributions receivable from Fidelity Central Funds | | 893 |
Other receivables | | 3,374 |
Total assets | | 55,950,768 |
| | |
Liabilities | | |
Payable for investments purchased | $ 1,554,764 | |
Payable for fund shares redeemed | 401,297 | |
Accrued management fee | 26,175 | |
Distribution and service plan fees payable | 18,413 | |
Other affiliated payables | 14,109 | |
Other payables and accrued expenses | 41,043 | |
Collateral on securities loaned, at value | 634,000 | |
Total liabilities | | 2,689,801 |
| | |
Net Assets | | $ 53,260,967 |
Net Assets consist of: | | |
Paid in capital | | $ 44,087,434 |
Accumulated net investment loss | | (8,467) |
Accumulated undistributed net realized gain (loss) on investments and foreign currency transactions | | 2,449,058 |
Net unrealized appreciation (depreciation) on investments and assets and liabilities in foreign currencies | | 6,732,942 |
Net Assets | | $ 53,260,967 |
Statement of Assets and Liabilities - continued
| July 31, 2011 |
| | |
Calculation of Maximum Offering Price Class A:
Net Asset Value and redemption price per share ($23,446,652 ÷ 1,465,157 shares) | | $ 16.00 |
| | |
Maximum offering price per share (100/94.25 of $16.00) | | $ 16.98 |
Class T:
Net Asset Value and redemption price per share ($9,896,793 ÷ 641,521 shares) | | $ 15.43 |
| | |
Maximum offering price per share (100/96.50 of $15.43) | | $ 15.99 |
Class B:
Net Asset Value and offering price per share ($3,170,478 ÷ 222,797 shares)A | | $ 14.23 |
| | |
Class C:
Net Asset Value and offering price per share ($7,341,284 ÷ 514,748 shares)A | | $ 14.26 |
| | |
Institutional Class:
Net Asset Value, offering price and redemption price per share ($9,405,760 ÷ 562,581 shares) | | $ 16.72 |
A Redemption price per share is equal to net asset value less any applicable contingent deferred sales charge.
See accompanying notes which are an integral part of the financial statements.
Annual Report
Statement of Operations
| Year ended July 31, 2011 |
| | |
Investment Income | | |
Dividends | | $ 683,074 |
Interest | | 2 |
Income from Fidelity Central Funds | | 12,869 |
Total income | | 695,945 |
| | |
Expenses | | |
Management fee | $ 315,315 | |
Transfer agent fees | 155,696 | |
Distribution and service plan fees | 253,840 | |
Accounting and security lending fees | 22,469 | |
Custodian fees and expenses | 26,410 | |
Independent trustees' compensation | 305 | |
Registration fees | 58,540 | |
Audit | 52,544 | |
Legal | 229 | |
Miscellaneous | 546 | |
Total expenses before reductions | 885,894 | |
Expense reductions | (9,785) | 876,109 |
Net investment income (loss) | | (180,164) |
Realized and Unrealized Gain (Loss) Net realized gain (loss) on: | | |
Investment securities: | | |
Unaffiliated issuers (net of foreign taxes of $9,649) | 5,903,900 | |
Foreign currency transactions | (8,319) | |
Total net realized gain (loss) | | 5,895,581 |
Change in net unrealized appreciation (depreciation) on: Investment securities (net of increase in deferred foreign taxes of $6,492) | 6,053,577 | |
Assets and liabilities in foreign currencies | (569) | |
Total change in net unrealized appreciation (depreciation) | | 6,053,008 |
Net gain (loss) | | 11,948,589 |
Net increase (decrease) in net assets resulting from operations | | $ 11,768,425 |
Statement of Changes in Net Assets
| Year ended
July 31,
2011 | Year ended
July 31,
2010 |
Increase (Decrease) in Net Assets | | |
Operations | | |
Net investment income (loss) | $ (180,164) | $ (139,360) |
Net realized gain (loss) | 5,895,581 | 6,027,146 |
Change in net unrealized appreciation (depreciation) | 6,053,008 | 1,905,033 |
Net increase (decrease) in net assets resulting from operations | 11,768,425 | 7,792,819 |
Distributions to shareholders from net investment income | - | (6,476) |
Share transactions - net increase (decrease) | (7,894,650) | 9,354,979 |
Redemption fees | 1,559 | 1,671 |
Total increase (decrease) in net assets | 3,875,334 | 17,142,993 |
| | |
Net Assets | | |
Beginning of period | 49,385,633 | 32,242,640 |
End of period (including accumulated net investment loss of $8,467 and undistributed net investment income of $0, respectively) | $ 53,260,967 | $ 49,385,633 |
See accompanying notes which are an integral part of the financial statements.
Annual Report
Financial Highlights - Class A
Years ended July 31, | 2011 | 2010 | 2009 | 2008 | 2007 |
Selected Per-Share Data | | | | | |
Net asset value, beginning of period | $ 12.75 | $ 10.26 | $ 11.41 | $ 15.89 | $ 16.39 |
Income from Investment Operations | | | | | |
Net investment income (loss) C | (.02) | (.02) | .04 | .02 | .02 F |
Net realized and unrealized gain (loss) | 3.27 | 2.51 | (1.16) | (3.09) | 1.83 |
Total from investment operations | 3.25 | 2.49 | (1.12) | (3.07) | 1.85 |
Distributions from net investment income | - | - | (.03) | - | (.05) |
Distributions from net realized gain | - | - | - | (1.41) | (2.30) |
Total distributions | - | - | (.03) | (1.41) | (2.35) |
Redemption fees added to paid in capital C,H | - | - | - | - | - |
Net asset value, end of period | $ 16.00 | $ 12.75 | $ 10.26 | $ 11.41 | $ 15.89 |
Total Return A,B | 25.49% | 24.27% | (9.81)% | (21.24)% | 11.67% |
Ratios to Average Net Assets D,G | | | | | |
Expenses before reductions | 1.39% | 1.44% | 1.62% | 1.40% | 1.42% |
Expenses net of fee waivers, if any | 1.39% | 1.40% | 1.40% | 1.40% | 1.40% |
Expenses net of all reductions | 1.38% | 1.39% | 1.40% | 1.40% | 1.39% |
Net investment income (loss) | (.15)% | (.15)% | .42% | .15% | .11% F |
Supplemental Data | | | | | |
Net assets, end of period (000 omitted) | $ 23,447 | $ 19,423 | $ 13,010 | $ 11,899 | $ 19,708 |
Portfolio turnover rate E | 179% | 163% | 99% | 63% | 164% |
A Total returns would have been lower if certain expenses had not been reduced during the applicable periods shown.
B Total returns do not include the effect of the sales charges.
C Calculated based on average shares outstanding during the period.
D Fees and expenses of any underlying Fidelity Central Funds are not included in the Fund's expense ratio. The Fund indirectly bears its proportionate share of the expenses of any underlying Fidelity Central Funds.
E Amount does not include the portfolio activity of any underlying Fidelity Central Funds.
F Investment income per share reflects a special dividend which amounted to $.07 per share. Excluding the special dividend, the ratio of net investment income (loss) to average net assets would have been (.32)%.
G Expense ratios reflect operating expenses of the class. Expenses before reductions do not reflect amounts reimbursed by the investment adviser or reductions from brokerage service arrangements or reductions from other expense offset arrangements and do not represent the amount paid by the class during periods when reimbursements or reductions occur. Expenses net of fee waivers reflect expenses after reimbursement by the investment adviser but prior to reductions from brokerage service arrangements or other expense offset arrangements. Expenses net of all reductions represent the net expenses paid by the class.
H Amount represents less than $.01 per share.
Financial Highlights - Class T
Years ended July 31, | 2011 | 2010 | 2009 | 2008 | 2007 |
Selected Per-Share Data | | | | | |
Net asset value, beginning of period | $ 12.32 | $ 9.94 | $ 11.07 | $ 15.47 | $ 16.03 |
Income from Investment Operations | | | | | |
Net investment income (loss) C | (.06) | (.05) | .01 | (.01) | (.02) F |
Net realized and unrealized gain (loss) | 3.17 | 2.43 | (1.12) | (3.00) | 1.79 |
Total from investment operations | 3.11 | 2.38 | (1.11) | (3.01) | 1.77 |
Distributions from net investment income | - | - | (.02) | - | (.03) |
Distributions from net realized gain | - | - | - | (1.39) | (2.30) |
Total distributions | - | - | (.02) | (1.39) | (2.33) |
Redemption fees added to paid in capital C,H | - | - | - | - | - |
Net asset value, end of period | $ 15.43 | $ 12.32 | $ 9.94 | $ 11.07 | $ 15.47 |
Total Return A,B | 25.24% | 23.94% | (10.04)% | (21.41)% | 11.43% |
Ratios to Average Net Assets D,G | | | | | |
Expenses before reductions | 1.66% | 1.71% | 1.89% | 1.64% | 1.69% |
Expenses net of fee waivers, if any | 1.65% | 1.65% | 1.65% | 1.64% | 1.65% |
Expenses net of all reductions | 1.64% | 1.64% | 1.65% | 1.62% | 1.61% |
Net investment income (loss) | (.40)% | (.40)% | .17% | (.08)% | (.10)% F |
Supplemental Data | | | | | |
Net assets, end of period (000 omitted) | $ 9,897 | $ 8,018 | $ 6,738 | $ 9,095 | $ 14,787 |
Portfolio turnover rate E | 179% | 163% | 99% | 63% | 164% |
A Total returns would have been lower if certain expenses had not been reduced during the applicable periods shown.
B Total returns do not include the effect of the sales charges.
C Calculated based on average shares outstanding during the period.
D Fees and expenses of any underlying Fidelity Central Funds are not included in the Fund's expense ratio. The Fund indirectly bears its proportionate share of the expenses of any underlying Fidelity Central Funds.
E Amount does not include the portfolio activity of any underlying Fidelity Central Funds.
F Investment income per share reflects a special dividend which amounted to $.07 per share. Excluding the special dividend, the ratio of net investment income (loss) to average net assets would have been (.53)%.
G Expense ratios reflect operating expenses of the class. Expenses before reductions do not reflect amounts reimbursed by the investment adviser or reductions from brokerage service arrangements or reductions from other expense offset arrangements and do not represent the amount paid by the class during periods when reimbursements or reductions occur. Expenses net of fee waivers reflect expenses after reimbursement by the investment adviser but prior to reductions from brokerage service arrangements or other expense offset arrangements. Expenses net of all reductions represent the net expenses paid by the class.
H Amount represents less than $.01 per share.
See accompanying notes which are an integral part of the financial statements.
Annual Report
Financial Highlights - Class B
Years ended July 31, | 2011 | 2010 | 2009 | 2008 | 2007 |
Selected Per-Share Data | | | | | |
Net asset value, beginning of period | $ 11.42 | $ 9.26 | $ 10.35 | $ 14.56 | $ 15.26 |
Income from Investment Operations | | | | | |
Net investment income (loss) C | (.12) | (.10) | (.03) | (.07) | (.10) F |
Net realized and unrealized gain (loss) | 2.93 | 2.26 | (1.06) | (2.81) | 1.70 |
Total from investment operations | 2.81 | 2.16 | (1.09) | (2.88) | 1.60 |
Distributions from net realized gain | - | - | - | (1.33) | (2.30) |
Redemption fees added to paid in capital C,H | - | - | - | - | - |
Net asset value, end of period | $ 14.23 | $ 11.42 | $ 9.26 | $ 10.35 | $ 14.56 |
Total Return A,B | 24.61% | 23.33% | (10.53)% | (21.80)% | 10.82% |
Ratios to Average Net Assets D,G | | | | | |
Expenses before reductions | 2.15% | 2.21% | 2.38% | 2.14% | 2.20% |
Expenses net of fee waivers, if any | 2.15% | 2.15% | 2.15% | 2.14% | 2.15% |
Expenses net of all reductions | 2.13% | 2.14% | 2.15% | 2.14% | 2.15% |
Net investment income (loss) | (.90)% | (.90)% | (.33)% | (.60)% | (.64)% F |
Supplemental Data | | | | | |
Net assets, end of period (000 omitted) | $ 3,170 | $ 3,643 | $ 3,550 | $ 5,090 | $ 11,081 |
Portfolio turnover rate E | 179% | 163% | 99% | 63% | 164% |
A Total returns would have been lower if certain expenses had not been reduced during the applicable periods shown.
B Total returns do not include the effect of the contingent deferred sales charge.
C Calculated based on average shares outstanding during the period.
D Fees and expenses of any underlying Fidelity Central Funds are not included in the Fund's expense ratio. The Fund indirectly bears its proportionate share of the expenses of any underlying Fidelity Central Funds.
E Amount does not include the portfolio activity of any underlying Fidelity Central Funds.
F Investment income per share reflects a special dividend which amounted to $.07 per share. Excluding the special dividend, the ratio of net investment income (loss) to average net assets would have been (1.07)%.
G Expense ratios reflect operating expenses of the class. Expenses before reductions do not reflect amounts reimbursed by the investment adviser or reductions from brokerage service arrangements or reductions from other expense offset arrangements and do not represent the amount paid by the class during periods when reimbursements or reductions occur. Expenses net of fee waivers reflect expenses after reimbursement by the investment adviser but prior to reductions from brokerage service arrangements or other expense offset arrangements. Expenses net of all reductions represent the net expenses paid by the class.
H Amount represents less than $.01 per share.
Financial Highlights - Class C
Years ended July 31, | 2011 | 2010 | 2009 | 2008 | 2007 |
Selected Per-Share Data | | | | | |
Net asset value, beginning of period | $ 11.44 | $ 9.27 | $ 10.37 | $ 14.59 | $ 15.28 |
Income from Investment Operations | | | | | |
Net investment income (loss) C | (.12) | (.10) | (.03) | (.07) | (.10) F |
Net realized and unrealized gain (loss) | 2.94 | 2.27 | (1.07) | (2.81) | 1.71 |
Total from investment operations | 2.82 | 2.17 | (1.10) | (2.88) | 1.61 |
Distributions from net realized gain | - | - | - | (1.34) | (2.30) |
Redemption fees added to paid in capital C,H | - | - | - | - | - |
Net asset value, end of period | $ 14.26 | $ 11.44 | $ 9.27 | $ 10.37 | $ 14.59 |
Total Return A,B | 24.65% | 23.41% | (10.61)% | (21.77)% | 10.88% |
Ratios to Average Net Assets D,G | | | | | |
Expenses before reductions | 2.11% | 2.12% | 2.38% | 2.15% | 2.16% |
Expenses net of fee waivers, if any | 2.11% | 2.12% | 2.15% | 2.15% | 2.15% |
Expenses net of all reductions | 2.09% | 2.11% | 2.15% | 2.14% | 2.15% |
Net investment income (loss) | (.86)% | (.87)% | (.33)% | (.60)% | (.64)% F |
Supplemental Data | | | | | |
Net assets, end of period (000 omitted) | $ 7,341 | $ 9,288 | $ 2,955 | $ 3,430 | $ 8,051 |
Portfolio turnover rate E | 179% | 163% | 99% | 63% | 164% |
A Total returns would have been lower if certain expenses had not been reduced during the applicable periods shown.
B Total returns do not include the effect of the contingent deferred sales charge.
C Calculated based on average shares outstanding during the period.
D Fees and expenses of any underlying Fidelity Central Funds are not included in the Fund's expense ratio. The Fund indirectly bears its proportionate share of the expenses of any underlying Fidelity Central Funds.
E Amount does not include the portfolio activity of any underlying Fidelity Central Funds.
F Investment income per share reflects a special dividend which amounted to $.07 per share. Excluding the special dividend, the ratio of net investment income (loss) to average net assets would have been (1.07)%.
G Expense ratios reflect operating expenses of the class. Expenses before reductions do not reflect amounts reimbursed by the investment adviser or reductions from brokerage service arrangements or reductions from other expense offset arrangements and do not represent the amount paid by the class during periods when reimbursements or reductions occur. Expenses net of fee waivers reflect expenses after reimbursement by the investment adviser but prior to reductions from brokerage service arrangements or other expense offset arrangements. Expenses net of all reductions represent the net expenses paid by the class.
H Amount represents less than $.01 per share.
See accompanying notes which are an integral part of the financial statements.
Annual Report
Financial Highlights - Institutional Class
Years ended July 31, | 2011 | 2010 | 2009 | 2008 | 2007 |
Selected Per-Share Data | | | | | |
Net asset value, beginning of period | $ 13.27 | $ 10.66 | $ 11.84 | $ 16.41 | $ 16.82 |
Income from Investment Operations | | | | | |
Net investment income (loss) B | .03 | .02 | .06 | .06 | .06 E |
Net realized and unrealized gain (loss) | 3.42 | 2.60 | (1.20) | (3.22) | 1.89 |
Total from investment operations | 3.45 | 2.62 | (1.14) | (3.16) | 1.95 |
Distributions from net investment income | - | (.01) | (.04) | - | (.06) |
Distributions from net realized gain | - | - | - | (1.41) | (2.30) |
Total distributions | - | (.01) | (.04) | (1.41) | (2.36) |
Redemption fees added to paid in capital B,G | - | - | - | - | - |
Net asset value, end of period | $ 16.72 | $ 13.27 | $ 10.66 | $ 11.84 | $ 16.41 |
Total Return A | 26.00% | 24.62% | (9.59)% | (21.09)% | 12.04% |
Ratios to Average Net Assets C,F | | | | | |
Expenses before reductions | 1.03% | 1.09% | 1.15% | 1.14% | 1.15% |
Expenses net of fee waivers, if any | 1.03% | 1.09% | 1.15% | 1.14% | 1.15% |
Expenses net of all reductions | 1.01% | 1.08% | 1.15% | 1.14% | 1.14% |
Net investment income (loss) | .22% | .16% | .67% | .40% | .36% E |
Supplemental Data | | | | | |
Net assets, end of period (000 omitted) | $ 9,406 | $ 9,013 | $ 5,990 | $ 398 | $ 1,385 |
Portfolio turnover rate D | 179% | 163% | 99% | 63% | 164% |
A Total returns would have been lower if certain expenses had not been reduced during the applicable periods shown.
B Calculated based on average shares outstanding during the period.
C Fees and expenses of any underlying Fidelity Central Funds are not included in the Fund's expense ratio. The Fund indirectly bears its proportionate share of the expenses of any underlying Fidelity Central Funds.
D Amount does not include the portfolio activity of any underlying Fidelity Central Funds.
E Investment income per share reflects a special dividend which amounted to $.07 per share. Excluding the special dividend, the ratio of net investment income (loss) to average net assets would have been (.07)%.
F Expense ratios reflect operating expenses of the class. Expenses before reductions do not reflect amounts reimbursed by the investment adviser or reductions from brokerage service arrangements or reductions from other expense offset arrangements and do not represent the amount paid by the class during periods when reimbursements or reductions occur. Expenses net of fee waivers reflect expenses after reimbursement by the investment adviser but prior to reductions from brokerage service arrangements or other expense offset arrangements. Expenses net of all reductions represent the net expenses paid by the class.
G Amount represents less than $.01 per share.
See accompanying notes which are an integral part of the financial statements.
Annual Report
Notes to Financial Statements
For the period ended July 31, 2011
1. Organization.
Fidelity Advisor Consumer Discretionary Fund (the Fund) is a non-diversified fund of Fidelity Advisor Series VII (the Trust) and is authorized to issue an unlimited number of shares. The Trust is registered under the Investment Company Act of 1940, as amended (the 1940 Act), as an open-end management investment company organized as a Massachusetts business trust. The Fund offers Class A, Class T, Class C and Institutional Class shares, each of which, along with Class B shares, has equal rights as to assets and voting privileges. Effective after the close of business on September 1, 2010, Class B shares were closed to new accounts and additional purchases, except for exchanges and reinvestments, by existing shareholders. Each class has exclusive voting rights with respect to matters that affect that class. Class B shares will automatically convert to Class A shares after a holding period of seven years from the initial date of purchase. Investment income, realized and unrealized capital gains and losses, the common expenses of the Fund, and certain fund-level expense reductions, if any, are allocated on a pro-rata basis to each class based on the relative net assets of each class to the total net assets of the Fund. Each class differs with respect to transfer agent and distribution and service plan fees incurred. Certain expense reductions may also differ by class.
2. Investments in Fidelity Central Funds.
The Fund invests in Fidelity Central Funds, which are open-end investment companies available only to other investment companies and accounts managed by Fidelity Management & Research Company (FMR) and its affiliates. The Fund's Schedule of Investments lists each of the Fidelity Central Funds held as of period end, if any, as an investment of the Fund, but does not include the underlying holdings of each Fidelity Central Fund. As an Investing Fund, the Fund indirectly bears its proportionate share of the expenses of the underlying Fidelity Central Funds.
The Money Market Central Funds seek preservation of capital and current income and are managed by Fidelity Investments Money Management, Inc. (FIMM), an affiliate of FMR.
A complete unaudited list of holdings for each Fidelity Central Fund is available upon request or at the Securities and Exchange Commission (the SEC) web site at www.sec.gov. In addition, the financial statements of the Fidelity Central Funds, which are not covered by the Fund's Report of Independent Registered Public Accounting Firm, are available on the SEC web site or upon request.
3. Significant Accounting Policies.
The financial statements have been prepared in conformity with accounting principles generally accepted in the United States of America (GAAP), which require management to make certain estimates and assumptions at the date of the financial statements. Actual results could differ from those estimates. Subsequent events, if any, through the date that the financial statements were issued have been evaluated in the preparation of the financial statements. The following summarizes the significant accounting policies of the Fund:
Security Valuation. Investments are valued as of 4:00 p.m. Eastern time on the last calendar day of the period. The Fund uses independent pricing services approved by the Board of Trustees to value its investments. When current market prices or quotations are not readily available or reliable, valuations may be determined in good faith in accordance with procedures adopted by the Board of Trustees. Factors used in determining value may include market or security specific events. The frequency with which these procedures are used cannot be predicted and they may be utilized to a significant extent. The value used for net asset value (NAV) calculation under these procedures may differ from published prices for the same securities.
The Fund categorizes the inputs to valuation techniques used to value its investments into a disclosure hierarchy consisting of three levels as shown below:
Level 1 - quoted prices in active markets for identical investments
Level 2 - other significant observable inputs (including quoted prices for similar investments, interest rates, prepayment speeds, etc.)
Level 3 - unobservable inputs (including the Fund's own assumptions based on the best information available)
Changes in valuation techniques may result in transfers in or out of an assigned level within the disclosure hierarchy. The aggregate value of investments by input level, as of July 31, 2011, is included at the end of the Fund's Schedule of Investments. Valuation techniques used to value the Fund's investments by major category are as follows:
Equity securities, including restricted securities, for which market quotations are readily available, are valued at the last reported sale price or official closing price as reported by an independent pricing service on the primary market or exchange on which they are traded and are categorized as Level 1 in the hierarchy. In the event there were no sales during the day or closing prices are not available, securities are valued at the last quoted bid price or may be valued using the last available price and are generally categorized as Level 2 in the hierarchy. For foreign equity securities, when significant market or security specific events arise, comparisons to the valuation of American Depositary Receipts (ADRs), futures contracts, Exchange-traded funds (ETFs) and certain indexes as well as quoted prices for similar securities are used and are categorized as Level 2 in the hierarchy in these
Annual Report
Notes to Financial Statements - continued
3. Significant Accounting Policies - continued
Security Valuation - continued
circumstances. Utilizing these techniques may result in transfers between Level 1 and Level 2. For restricted equity securities and private placements where observable inputs are limited, assumptions about market activity and risk are used and are categorized as Level 3 in the hierarchy.
Investments in open-end mutual funds, including the Fidelity Central Funds, are valued at their closing net asset value each business day and are categorized as Level 1 in the hierarchy.
Foreign Currency. The Fund may use foreign currency contracts to facilitate transactions in foreign-denominated securities. Gains and losses from these transactions may arise from changes in the value of the foreign currency or if the counterparties do not perform under the contracts' terms.
Foreign-denominated assets, including investment securities, and liabilities are translated into U.S. dollars at the exchange rate at period end. Purchases and sales of investment securities, income and dividends received and expenses denominated in foreign currencies are translated into U.S. dollars at the exchange rate in effect on the transaction date.
The effects of exchange rate fluctuations on investments are included with the net realized and unrealized gain (loss) on investment securities. Other foreign currency transactions resulting in realized and unrealized gain (loss) are disclosed separately.
Investment Transactions and Income. For financial reporting purposes, the Fund's investment holdings and NAV include trades executed through the end of the last business day of the period. The NAV per share for processing shareholder transactions is calculated as of the close of business of the New York Stock Exchange (NYSE), normally 4:00 p.m. Eastern time and includes trades executed through the end of the prior business day. Gains and losses on securities sold are determined on the basis of identified cost and may include proceeds received from litigation. Dividend income is recorded on the ex-dividend date, except for certain dividends from foreign securities where the ex-dividend date may have passed, which are recorded as soon as the Fund is informed of the ex-dividend date. Non-cash dividends included in dividend income, if any, are recorded at the fair market value of the securities received. Distributions received on securities that represent a return of capital or capital gain are recorded as a reduction of cost of investments and/or as a realized gain. The Fund estimates the components of distributions received that may be considered return of capital distributions or capital gain distributions. Interest income and distributions from the Fidelity Central Funds are accrued as earned. Interest income includes coupon interest and amortization of premium and accretion of discount on debt securities. Investment income is recorded net of foreign taxes withheld where recovery of such taxes is uncertain.
Expenses. Expenses directly attributable to a fund are charged to that fund. Expenses attributable to more than one fund are allocated among the respective funds on the basis of relative net assets or other appropriate methods. Expense estimates are accrued in the period to which they relate and adjustments are made when actual amounts are known.
Income Tax Information and Distributions to Shareholders. Each year, the Fund intends to qualify as a regulated investment company, including distributing substantially all of its taxable income and realized gains under Subchapter M of the Internal Revenue Code and filing its U.S. federal tax return. As a result, no provision for income taxes is required. As of July 31, 2011, the Fund did not have any unrecognized tax benefits in the financial statements. A fund's federal tax return is subject to examination by the Internal Revenue Service (IRS) for a period of three years. Foreign taxes are provided for based on the Fund's understanding of the tax rules and rates that exist in the foreign markets in which it invests. The Fund is subject to a tax imposed on realized short term capital gains on securities of certain issuers domiciled in India. An estimated deferred tax liability for net unrealized gains on these securities is included in Other payables and accrued expenses on the Statement of Assets & Liabilities.
Distributions are declared and recorded on the ex-dividend date. Income dividends and capital gain distributions are declared separately for each class. Income and capital gain distributions are determined in accordance with income tax regulations, which may differ from GAAP. In addition, the fund claimed a portion of the payment made to redeeming shareholders as a distribution for income tax purposes.
Capital accounts within the financial statements are adjusted for permanent book-tax differences. These adjustments have no impact on net assets or the results of operations. Temporary book-tax differences will reverse in a subsequent period.
Book-tax differences are primarily due to foreign currency transactions, certain foreign taxes, deferred trustees compensation, net operating losses, capital loss carryforwards and losses deferred due to wash sales and excise tax regulations.
The federal tax cost of investment securities and unrealized appreciation (depreciation) as of period end were as follows:
Gross unrealized appreciation | $ 8,208,614 |
Gross unrealized depreciation | (1,732,825) |
Net unrealized appreciation (depreciation) on securities and other investments | $ 6,475,789 |
| |
Tax Cost | $ 47,832,371 |
Annual Report
3. Significant Accounting Policies - continued
Income Tax Information and Distributions to Shareholders - continued
The tax-based components of distributable earnings as of period end were as follows:
Undistributed long-term capital gain | $ 2,713,267 |
Net unrealized appreciation (depreciation) | $ 6,475,225 |
The tax character of distributions paid was as follows:
| July 31, 2011 | July 31, 2010 |
Ordinary Income | $ - | $ 6,476 |
Under the recently enacted Regulated Investment Company Modernization Act of 2010 (the Act), the Fund will be permitted to carry forward capital losses incurred in taxable years beginning after December 22, 2010 for an unlimited period. However, any losses incurred during those future taxable years will be required to be utilized prior to any losses incurred in pre-enactment taxable years, which generally expire after eight years from when they are incurred. Additionally, post-enactment capital losses that are carried forward will retain their character as either short-term or long-term capital losses rather than being considered all short-term as under previous law. The Fund's first fiscal year end subject to the Act will be July 31, 2012.
Short-Term Trading (Redemption) Fees. Shares held by investors in the Fund less than 30 days are subject to a redemption fee equal to .75% of the net asset value of shares redeemed. All redemption fees, which reduce the proceeds of the shareholder redemption, are retained by the Fund and accounted for as an addition to paid in capital.
New Accounting Pronouncement. In May 2011, the Financial Accounting Standards Board issued Accounting Standard Update No. 2011-04, Fair Value Measurement (Topic 820) - Amendments to Achieve Common Fair Value Measurement and Disclosure Requirements in U.S. GAAP and IFRSs. The update changes the wording used to describe the requirements in GAAP for measuring fair value and for disclosing information about fair value measurements. The update is effective during interim and annual periods beginning after December 15, 2011. Management is currently evaluating the impact of the update's adoption on the Fund's financial statement disclosures.
4. Purchases and Sales of Investments.
Purchases and sales of securities, other than short-term securities, aggregated $99,818,524 and $107,421,190, respectively.
5. Fees and Other Transactions with Affiliates.
Management Fee. FMR and its affiliates provide the Fund with investment management related services for which the Fund pays a monthly management fee. The management fee is the sum of an individual fund fee rate that is based on an annual rate of .30% of the Fund's average net assets and a group fee rate that averaged .26% during the period. The group fee rate is based upon the average net assets of all the mutual funds advised by FMR. The group fee rate decreases as assets under management increase and increases as assets under management decrease. For the period, the total annual management fee rate was .56% of the Fund's average net assets.
Distribution and Service Plan Fees. In accordance with Rule 12b-1 of the 1940 Act, the Fund has adopted separate Distribution and Service Plans for each class of shares. Certain classes pay Fidelity Distributors Corporation (FDC), an affiliate of FMR, separate Distribution and Service Fees, each of which is based on an annual percentage of each class' average net assets. In addition, FDC may pay financial intermediaries for selling shares of the Fund and providing shareholder support services. For the period, the Distribution and Service Fee rates, total fees and amounts retained by FDC were as follows:
| Distribution
Fee | Service
Fee | Total Fees | Retained
by FDC |
Class A | -% | .25% | $ 57,507 | $ 1,875 |
Class T | .25% | .25% | 48,950 | - |
Class B | .75% | .25% | 36,668 | 27,501 |
Class C | .75% | .25% | 110,715 | 16,330 |
| | | $ 253,840 | $ 45,706 |
Annual Report
Notes to Financial Statements - continued
5. Fees and Other Transactions with Affiliates - continued
Sales Load. FDC may receive a front-end sales charge of up to 5.75% for selling Class A shares, and 3.50% for selling Class T shares, some of which is paid to financial intermediaries for selling shares of the Fund. Depending on the holding period, FDC may receive contingent deferred sales charges levied on Class A, Class T, Class B, and Class C redemptions. The deferred sales charges range from 5% to 1% for Class B, 1% for Class C, 1.00% for certain purchases of Class A shares and .25% for certain purchases of Class T shares.
For the period, sales charge amounts retained by FDC were as follows:
| Retained
by FDC |
Class A | $ 17,684 |
Class T | 5,544 |
Class B* | 4,769 |
Class C* | 2,153 |
| $ 30,150 |
* When Class B and Class C shares are initially sold, FDC pays commissions from its own resources to financial intermediaries through which the sales are made.
Transfer Agent Fees. Fidelity Investments Institutional Operations Company, Inc. (FIIOC), an affiliate of FMR, is the transfer, dividend disbursing and shareholder servicing agent for each class of the Fund. FIIOC receives account fees and asset-based fees that vary according to the account size and type of account of the shareholders of the respective classes of the Fund. FIIOC pays for typesetting, printing and mailing of shareholder reports, except proxy statements. For the period, transfer agent fees for each class were as follows:
| Amount | % of
Average
Net Assets |
Class A | $ 68,923 | .30 |
Class T | 30,589 | .31 |
Class B | 11,042 | .30 |
Class C | 28,544 | .26 |
Institutional Class | 16,598 | .18 |
| $ 155,696 | |
Accounting and Security Lending Fees. Fidelity Service Company, Inc. (FSC), an affiliate of FMR, maintains the Fund's accounting records. The accounting fee is based on the level of average net assets for the month. Under a separate contract, FSC administers the security lending program. The security lending fee is based on the number and duration of lending transactions.
Brokerage Commissions. The Fund placed a portion of its portfolio transactions with brokerage firms which are affiliates of the investment adviser. The commissions paid to these affiliated firms were $5,609 for the period.
6. Committed Line of Credit.
The Fund participates with other funds managed by FMR or an affiliate in a $4.0 billion credit facility (the "line of credit") to be utilized for temporary or emergency purposes to fund shareholder redemptions or for other short-term liquidity purposes. The Fund has agreed to pay commitment fees on its pro-rata portion of the line of credit, which amounted to $188 and is reflected in Miscellaneous expenses on the Statement of Operations. During the period, there were no borrowings on this line of credit.
7. Security Lending.
The Fund lends portfolio securities through a lending agent from time to time in order to earn additional income. The lending agent may loan securities to certain qualified borrowers, including Fidelity Capital Markets (FCM), a broker-dealer affiliated with the Fund. On the settlement date of the loan, the Fund receives collateral (in the form of U.S. Treasury obligations, letters of credit and/or cash) against the loaned securities and maintains collateral in an amount not less than 100% of the market value of the loaned securities during the period of the loan. The market value of the loaned securities is determined at the close of business of the Fund and any additional required collateral is delivered to the Fund on the next business day. If the borrower defaults on its obligation to return the securities loaned because of insolvency or other reasons, a fund could experience delays and costs in recovering the securities loaned or in gaining access to the collateral. Any cash collateral received is invested in the Fidelity Securities Lending Cash Central Fund. The value of loaned securities and cash collateral at period end are disclosed on the Fund's Statement of Assets and Liabilities. Security lending income represents the income earned on investing cash collateral, less rebates paid to borrowers and lending agent fees associated with the loan, plus any premium payments received for lending certain types of securities. Security lending income is presented in the Statement of Operations
Annual Report
7. Security Lending - continued
as a component of income from Fidelity Central Funds, and includes $613 from securities loaned to FCM. Total security lending income during the period amounted to $11,911.
8. Expense Reductions.
FMR voluntarily agreed to reimburse each class to the extent annual operating expenses exceeded certain levels of average net assets as noted in the table below. Some expenses, for example interest expense, including commitment fees, are excluded from this reimbursement.
The following classes were in reimbursement during the period:
| Expense
Limitations | Reimbursement
from adviser |
Class T | 1.65% | $ 442 |
Many of the brokers with whom FMR places trades on behalf of the Fund provided services to the Fund in addition to trade execution. These services included payments of certain expenses on behalf of the Fund totaling $9,343 for the period.
9. Distributions to Shareholders.
Distributions to shareholders of each class were as follows:
Years ended July 31, | 2011 | 2010 |
From net investment income | | |
Institutional Class | $ - | $ 6,476 |
10. Share Transactions.
Transactions for each class of shares were as follows:
| Shares | Dollars |
Years ended July 31, | 2011 | 2010 | 2011 | 2010 |
Class A | | | | |
Shares sold | 665,093 | 790,157 | $ 10,095,802 | $ 9,916,430 |
Shares redeemed | (723,296) | (535,046) | (10,778,369) | (6,621,987) |
Net increase (decrease) | (58,203) | 255,111 | $ (682,567) | $ 3,294,443 |
Class T | | | | |
Shares sold | 187,572 | 124,293 | $ 2,764,268 | $ 1,532,286 |
Shares redeemed | (196,717) | (151,532) | (2,907,152) | (1,774,930) |
Net increase (decrease) | (9,145) | (27,239) | $ (142,884) | $ (242,644) |
Class B | | | | |
Shares sold | 40,939 | 84,992 | $ 519,870 | $ 960,028 |
Shares redeemed | (137,051) | (149,463) | (1,818,569) | (1,626,686) |
Net increase (decrease) | (96,112) | (64,471) | $ (1,298,699) | $ (666,658) |
Class C | | | | |
Shares sold | 588,992 | 651,335 | $ 8,103,013 | $ 6,961,979 |
Shares redeemed | (885,890) | (158,268) | (12,399,353) | (1,769,753) |
Net increase (decrease) | (296,898) | 493,067 | $ (4,296,340) | $ 5,192,226 |
Institutional Class | | | | |
Shares sold | 346,649 | 718,370 | $ 5,583,185 | $ 9,586,550 |
Reinvestment of distributions | - | 555 | - | 6,322 |
Shares redeemed | (463,053) | (601,861) | (7,057,345) | (7,815,260) |
Net increase (decrease) | (116,404) | 117,064 | $ (1,474,160) | $ 1,777,612 |
11. Other.
The Fund's organizational documents provide former and current trustees and officers with a limited indemnification against liabilities arising in connection with the performance of their duties to the Fund. In the normal course of business, the Fund may also enter into contracts that provide general indemnifications. The Fund's maximum exposure under these arrangements is unknown as this would be dependent on future claims that may be made against the Fund. The risk of material loss from such claims is considered remote.
Annual Report
Fidelity Advisor Electronics Fund - Class A, T, B, and C
Average annual total return reflects the change in the value of an investment, assuming reinvestment of the class' distributions from dividend income and capital gains (the profits earned upon the sale of securities that have grown in value, if any) and assuming a constant rate of performance each year. The $10,000 table and the fund's returns do not reflect the deduction of taxes that a shareholder would pay on fund distributions or the redemption of fund shares. During periods of reimbursement by Fidelity, a fund's total return will be greater than it would be had the reimbursement not occurred. How a fund did yesterday is no guarantee of how it will do tomorrow. Returns reflect the conversion of Class B shares to Class A shares after a maximum of seven years.
Average Annual Total Returns
Periods ended July 31, 2011 | Past 1
year | Past 5
years | Past 10
years |
Class A (incl. 5.75% sales charge) | 17.88% | 2.74% | -1.29% |
Class T (incl. 3.50% sales charge) | 20.35% | 2.96% | -1.31% |
Class B (incl. contingent deferred sales charge) A | 18.92% | 2.79% | -1.22% |
Class C (incl. contingent deferred sales charge) B | 23.10% | 3.18% | -1.45% |
A Class B shares' contingent deferred sales charges included in the past one year, past five years, and past ten years total return figures are 5%, 2%, and 0%, respectively.
B Class C shares' contingent deferred sales charges included in the past one year, past five years, and past ten years total return figures are 1%, 0%, and 0%, respectively.
$10,000 Over 10 Years
Let's say hypothetically that $10,000 was invested in Fidelity Advisor Electronics Fund - Class A on July 31, 2001, and the current 5.75% sales charge was paid. The chart shows how the value of your investment would have changed, and also shows how the S&P 500 Index performed over the same period.
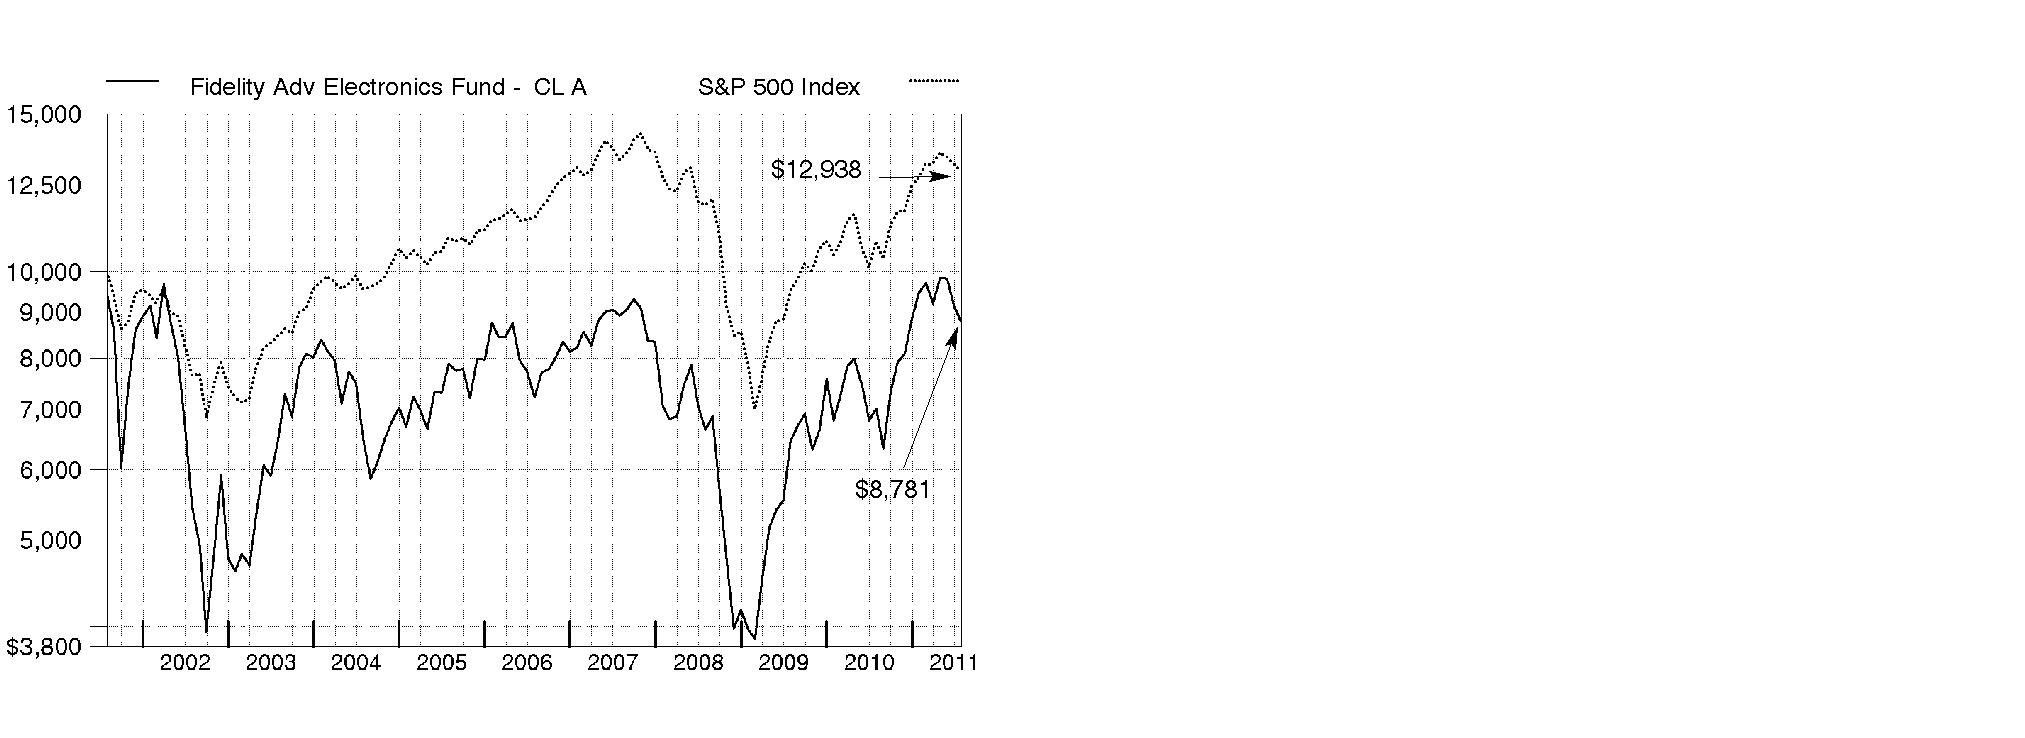
Annual Report
Fidelity Advisor Electronics Fund
Market Recap: U.S. stocks registered solid double-digit gains for the 12 months ending July 31, 2011, extending a rally that began more than two years earlier. Despite a rough start in August 2010, markets turned positive in September, as increased demand for capital goods and other upbeat indicators trumped investor worry about a U.S. recessionary relapse. The broad market, as measured by the S&P 500® Index, rose 9% that month, its biggest September gain in 71 years. Seven more monthly advances followed, fueled by encouraging corporate earnings and economic activity. However, volatility picked up in the period's latter months, as markets reacted to continued high U.S. unemployment, nagging debt troubles in Europe and looming legislative battles over the federal debt ceiling. May unemployment rose above 9% for the first time in 2011, contributing to a traditional "June swoon" for stocks. Market uncertainty lingered in July, when the S&P 500® posted its second-biggest monthly loss of the period. For the full year, the S&P 500® climbed 19.65%, while the blue-chip-laden Dow Jones Industrial AverageSM rose a comparable 19.09% and the technology-heavy Nasdaq Composite® Index gained 23.40%. On the capitalization spectrum, stocks of mid-cap companies fared best, with the Russell Midcap® Index rising 24.51% and the small-cap Russell 2000® Index adding 23.92%.
Comments from Stephen Barwikowski and Christopher Lin, Co-Portfolio Managers of Fidelity Advisor® Electronics Fund: For the year, the fund's Class A, Class T, Class B and Class C shares returned 25.07%, 24.71%, 23.92% and 24.10%, respectively (excluding sales charges), handily beating the S&P 500 and the 16.88% gain of the MSCI® U.S. IM Semiconductors & Semiconductor Equipment 25/50 Index. Versus the MSCI index, solid stock picking in the fund's primary category of semiconductors accounted for most of its outperformance. Additionally, out-of-benchmark exposure to electronic manufacturing services, computer storage/peripherals and communications equipment added value, as did security selection in semiconductor equipment. Far and away, the largest individual contributor in both relative and absolute terms was National Semiconductor. In April, the analog chip maker received a takeover bid of $25 per share from Texas Instruments, which represented a healthy premium over where the stock had been trading around $14 a share. Shortly after the takeover bid was announced, we sold our position to lock in profits. Other contributors included Fairchild Semiconductor International, a stock we bought advantageously, and Avago Technologies, which executed well on a number of fronts. Negligible exposure to poorly performing benchmark component Cree, a maker of light-emitting diode (LED) lights, also lifted performance. Conversely, the biggest relative detractor - and also the fund's largest holding at period end - was Marvell Technology Group, a provider of semiconductors for applications such as wireless communications, data storage and networking. Weak demand for smartphones manufactured by one of the company's primary customers, Research In Motion, weighed on the stock, in addition to lackluster personal computer sales. Underweighting two strong-performing benchmark constituents, chip makers Altera and Atmel, worked against the fund as well. Atmel was not held at period end.
Comments from Stephen Barwikowski and Christopher Lin, Co-Portfolio Managers of Fidelity Advisor® Electronics Fund: For the year, the fund's Institutional Class shares returned 25.38%, handily beating the S&P 500 and the 16.88% gain of the MSCI® U.S. IM Semiconductors & Semiconductor Equipment 25/50 Index. Versus the MSCI index, solid stock picking in the fund's primary category of semiconductors accounted for most of its outperformance. Additionally, out-of-benchmark exposure to electronic manufacturing services, computer storage/peripherals and communications equipment added value, as did security selection in semiconductor equipment. Far and away, the largest individual contributor in both relative and absolute terms was National Semiconductor. In April, the analog chip maker received a takeover bid of $25 per share from Texas Instruments, which represented a healthy premium over where the stock had been trading around $14 a share. Shortly after the takeover bid was announced, we sold our position to lock in profits. Other contributors included Fairchild Semiconductor International, a stock we bought advantageously, and Avago Technologies, which executed well on a number of fronts. Negligible exposure to poorly performing benchmark component Cree, a maker of light-emitting diode (LED) lights, also lifted performance. Conversely, the biggest relative detractor - and also the fund's largest holding at period end - was Marvell Technology Group, a provider of semiconductors for applications such as wireless communications, data storage and networking. Weak demand for smartphones manufactured by one of the company's primary customers, Research In Motion, weighed on the stock, in addition to lackluster personal computer sales. Underweighting two strong-performing benchmark constituents, chip makers Altera and Atmel, worked against the fund as well. Atmel was not held at period end.
The views expressed above reflect those of the portfolio manager(s) only through the end of the period as stated on the cover of this report and do not necessarily represent the views of Fidelity or any other person in the Fidelity organization. Any such views are subject to change at any time based upon market or other conditions and Fidelity disclaims any responsibility to update such views. These views may not be relied on as investment advice and, because investment decisions for a Fidelity fund are based on numerous factors, may not be relied on as an indication of trading intent on behalf of any Fidelity fund.
Annual Report
Fidelity Advisor Electronics Fund
As a shareholder of the Fund, you incur two types of costs: (1) transaction costs, including sales charges (loads) on purchase payments or redemption proceeds, redemption fees, and (2) ongoing costs, including management fees, distribution and/or service (12b-1) fees and other Fund expenses. This Example is intended to help you understand your ongoing costs (in dollars) of investing in the Fund and to compare these costs with the ongoing costs of investing in other mutual funds.
The Example is based on an investment of $1,000 invested at the beginning of the period and held for the entire period (February 1, 2011 to July 31, 2011).
Actual Expenses
The first line of the accompanying table for each class of the Fund provides information about actual account values and actual expenses. You may use the information in this line, together with the amount you invested, to estimate the expenses that you paid over the period. Simply divide your account value by $1,000.00 (for example, an $8,600 account value divided by $1,000.00 = 8.6), then multiply the result by the number in the first line for a class of the Fund under the heading entitled "Expenses Paid During Period" to estimate the expenses you paid on your account during this period. In addition, the Fund, as a shareholder in the underlying Fidelity Central Funds, will indirectly bear its pro-rata share of the fees and expenses incurred by the underlying Fidelity Central Funds. These fees and expenses are not included in the Fund's annualized expense ratio used to calculate the expense estimate in the table below.
Hypothetical Example for Comparison Purposes
The second line of the accompanying table for each class of the Fund provides information about hypothetical account values and hypothetical expenses based on a Class' actual expense ratio and an assumed rate of return of 5% per year before expenses, which is not the Class' actual return. The hypothetical account values and expenses may not be used to estimate the actual ending account balance or expenses you paid for the period. You may use this information to compare the ongoing costs of investing in the Fund and other funds. To do so, compare this 5% hypothetical example with the 5% hypothetical examples that appear in the shareholder reports of the other funds. In addition, the Fund, as a shareholder in the underlying Fidelity Central Funds, will indirectly bear its pro-rata share of the fees and expenses incurred by the underlying Fidelity Central Funds. These fees and expenses are not included in the Fund's annualized expense ratio used to calculate the expense estimate in the table below.
Please note that the expenses shown in the table are meant to highlight your ongoing costs only and do not reflect any transaction costs. Therefore, the second line of the table is useful in comparing ongoing costs only, and will not help you determine the relative total costs of owning different funds. In addition, if these transactional costs were included, your costs would have been higher.
| Annualized
Expense Ratio | Beginning
Account Value
February 1, 2011 | Ending
Account Value
July 31, 2011 | Expenses Paid
During Period*
February 1, 2011 to
July 31, 2011 |
Class A | 1.40% | | | |
Actual | | $ 1,000.00 | $ 927.30 | $ 6.69 |
HypotheticalA | | $ 1,000.00 | $ 1,017.85 | $ 7.00 |
Class T | 1.65% | | | |
Actual | | $ 1,000.00 | $ 925.80 | $ 7.88 |
HypotheticalA | | $ 1,000.00 | $ 1,016.61 | $ 8.25 |
Class B | 2.15% | | | |
Actual | | $ 1,000.00 | $ 922.10 | $ 10.25 |
HypotheticalA | | $ 1,000.00 | $ 1,014.13 | $ 10.74 |
Class C | 2.15% | | | |
Actual | | $ 1,000.00 | $ 923.20 | $ 10.25 |
HypotheticalA | | $ 1,000.00 | $ 1,014.13 | $ 10.74 |
Institutional Class | 1.15% | | | |
Actual | | $ 1,000.00 | $ 928.30 | $ 5.50 |
HypotheticalA | | $ 1,000.00 | $ 1,019.09 | $ 5.76 |
A 5% return per year before expenses
* Expenses are equal to each Class' annualized expense ratio, multiplied by the average account value over the period, multiplied by 181/365 (to reflect the one-half year period).
Annual Report
Fidelity Advisor Electronics Fund
Investment Changes (Unaudited)
Top Ten Stocks as of July 31, 2011 |
| % of fund's
net assets | % of fund's net assets
6 months ago |
Marvell Technology Group Ltd. | 10.6 | 8.7 |
Broadcom Corp. Class A | 9.7 | 5.2 |
Intel Corp. | 7.8 | 11.3 |
Advanced Micro Devices, Inc. | 4.9 | 3.8 |
Micron Technology, Inc. | 4.7 | 4.8 |
Analog Devices, Inc. | 4.0 | 0.5 |
Intersil Corp. Class A | 3.5 | 2.5 |
ON Semiconductor Corp. | 3.4 | 2.4 |
NXP Semiconductors NV | 3.4 | 1.7 |
Freescale Semiconductor Holdings I Ltd. | 3.1 | 0.0 |
| 55.1 | |
Top Industries (% of fund's net assets) |
As of July 31, 2011 |
| Semiconductors & Semiconductor Equipment | 88.2% | |
| Electronic Equipment & Components | 4.0% | |
| Communications Equipment | 3.4% | |
| Computers & Peripherals | 3.0% | |
| Internet Software & Services | 0.3% | |
| All Others* | 1.1% | |

As of January 31, 2011 |
| Semiconductors & Semiconductor Equipment | 81.8% | |
| Electronic Equipment & Components | 6.3% | |
| Communications Equipment | 3.9% | |
| Computers & Peripherals | 1.7% | |
| Internet Software & Services | 0.3% | |
| All Others* | 6.0% | |

* Includes short-term investments and net other assets. |
Annual Report
Fidelity Advisor Electronics Fund
Investments July 31, 2011
Showing Percentage of Net Assets
Common Stocks - 98.9% |
| Shares | | Value |
COMMUNICATIONS EQUIPMENT - 3.4% |
Communications Equipment - 3.4% |
Cisco Systems, Inc. | 15,114 | | $ 241,371 |
Juniper Networks, Inc. (a) | 3,400 | | 79,526 |
QUALCOMM, Inc. | 5,350 | | 293,073 |
| | 613,970 |
COMPUTERS & PERIPHERALS - 3.0% |
Computer Hardware - 1.1% |
Acer, Inc. | 17,000 | | 23,516 |
Hewlett-Packard Co. | 5,000 | | 175,800 |
| | 199,316 |
Computer Storage & Peripherals - 1.9% |
SanDisk Corp. (a) | 4,304 | | 183,049 |
Synaptics, Inc. (a) | 5,400 | | 132,678 |
Western Digital Corp. (a) | 1,030 | | 35,494 |
| | 351,221 |
TOTAL COMPUTERS & PERIPHERALS | | 550,537 |
ELECTRONIC EQUIPMENT & COMPONENTS - 4.0% |
Electronic Components - 0.5% |
Aeroflex Holding Corp. | 1,297 | | 18,547 |
Amphenol Corp. Class A | 120 | | 5,867 |
Corning, Inc. | 3,921 | | 62,383 |
| | 86,797 |
Electronic Manufacturing Services - 3.5% |
Benchmark Electronics, Inc. (a) | 3,721 | | 54,513 |
Fabrinet (a) | 788 | | 12,135 |
Flextronics International Ltd. (a) | 46,406 | | 299,319 |
Jabil Circuit, Inc. | 10,785 | | 197,473 |
SMART Modular Technologies (WWH), Inc. (a) | 2,311 | | 20,799 |
TE Connectivity Ltd. | 1,930 | | 66,450 |
Viasystems Group, Inc. (a) | 12 | | 269 |
| | 650,958 |
TOTAL ELECTRONIC EQUIPMENT & COMPONENTS | | 737,755 |
INTERNET SOFTWARE & SERVICES - 0.3% |
Internet Software & Services - 0.3% |
Google, Inc. Class A (a) | 90 | | 54,332 |
Support.com, Inc. (a) | 200 | | 644 |
| | 54,976 |
LIFE SCIENCES TOOLS & SERVICES - 0.0% |
Life Sciences Tools & Services - 0.0% |
Arrowhead Research Corp. warrants 5/21/17 (a) | 64,879 | | 1 |
SEMICONDUCTORS & SEMICONDUCTOR EQUIPMENT - 88.2% |
Semiconductor Equipment - 12.2% |
Advanced Energy Industries, Inc. (a) | 5 | | 53 |
Amkor Technology, Inc. (a)(d) | 58,542 | | 312,029 |
|
| Shares | | Value |
Applied Materials, Inc. | 34,414 | | $ 423,980 |
ASML Holding NV | 9,500 | | 338,675 |
Cabot Microelectronics Corp. (a) | 50 | | 1,935 |
Cymer, Inc. (a) | 7,092 | | 312,261 |
Entegris, Inc. (a) | 11,191 | | 95,907 |
KLA-Tencor Corp. | 2,230 | | 88,799 |
Lam Research Corp. (a) | 10,798 | | 441,422 |
MEMC Electronic Materials, Inc. (a) | 10,892 | | 80,819 |
Nanometrics, Inc. (a) | 370 | | 6,249 |
Nova Measuring Instruments Ltd. (a) | 250 | | 2,135 |
Novellus Systems, Inc. (a) | 660 | | 20,486 |
Teradyne, Inc. (a) | 1,190 | | 16,053 |
Tessera Technologies, Inc. (a) | 2,813 | | 44,192 |
Tokyo Electron Ltd. | 900 | | 48,645 |
Ultratech, Inc. (a) | 220 | | 5,797 |
| | 2,239,437 |
Semiconductors - 76.0% |
Advanced Micro Devices, Inc. (a)(d) | 122,243 | | 897,264 |
Alpha & Omega Semiconductor Ltd. (a) | 6,332 | | 71,172 |
Altera Corp. | 460 | | 18,805 |
ANADIGICS, Inc. (a) | 2,484 | | 7,800 |
Analog Devices, Inc. | 21,183 | | 728,695 |
Applied Micro Circuits Corp. (a) | 4,922 | | 31,058 |
AuthenTec, Inc. (a) | 4,896 | | 12,730 |
Avago Technologies Ltd. | 10,637 | | 357,722 |
BCD Semiconductor Manufacturing Ltd. ADR (d) | 12,718 | | 87,118 |
Broadcom Corp. Class A | 48,002 | | 1,779,434 |
Cree, Inc. (a)(d) | 2,700 | | 88,722 |
Cypress Semiconductor Corp. | 730 | | 15,023 |
Exar Corp. (a) | 200 | | 1,322 |
Fairchild Semiconductor International, Inc. (a) | 4,066 | | 61,031 |
First Solar, Inc. (a) | 88 | | 10,404 |
Freescale Semiconductor Holdings I Ltd. (d) | 35,302 | | 576,482 |
Himax Technologies, Inc. sponsored ADR | 20,738 | | 36,292 |
Ikanos Communications, Inc. (a) | 13,700 | | 17,262 |
Intel Corp. | 64,330 | | 1,436,489 |
International Rectifier Corp. (a) | 8,589 | | 220,651 |
Intersil Corp. Class A | 53,561 | | 645,410 |
JA Solar Holdings Co. Ltd. ADR (a) | 15,550 | | 74,640 |
Linear Technology Corp. | 15,130 | | 443,309 |
LSI Corp. (a) | 7,957 | | 58,564 |
Marvell Technology Group Ltd. (a) | 131,057 | | 1,942,266 |
Maxim Integrated Products, Inc. | 2,290 | | 52,578 |
Micron Technology, Inc. (a) | 115,622 | | 852,134 |
Motech Industries, Inc. | 1 | | 3 |
NVIDIA Corp. (a) | 31,948 | | 441,841 |
NXP Semiconductors NV | 31,162 | | 616,384 |
ON Semiconductor Corp. (a) | 72,380 | | 628,982 |
PMC-Sierra, Inc. (a) | 50,661 | | 354,120 |
RDA Microelectronics, Inc. sponsored ADR | 2,300 | | 20,861 |
Common Stocks - continued |
| Shares | | Value |
SEMICONDUCTORS & SEMICONDUCTOR EQUIPMENT - CONTINUED |
Semiconductors - continued |
Renesas Electronics Corp. (a)(d) | 6,500 | | $ 56,500 |
Semtech Corp. (a) | 1,146 | | 26,702 |
Skyworks Solutions, Inc. (a) | 9,502 | | 240,496 |
Spansion, Inc. Class A (a) | 4,891 | | 88,918 |
Standard Microsystems Corp. (a) | 4,504 | | 106,565 |
STATS ChipPAC Ltd. | 70,000 | | 36,623 |
STMicroelectronics NV (NY Shares) unit (a) | 6,400 | | 50,624 |
SunPower Corp. Class B (a) | 1,990 | | 30,168 |
Supertex, Inc. (a) | 3,327 | | 64,477 |
Taiwan Semiconductor Manufacturing Co. Ltd. sponsored ADR | 200 | | 2,472 |
Texas Instruments, Inc. (d) | 16,628 | | 494,683 |
Trident Microsystems, Inc. (a) | 35,119 | | 22,827 |
Trina Solar Ltd. (a) | 800 | | 14,328 |
TriQuint Semiconductor, Inc. (a) | 1,295 | | 9,738 |
Volterra Semiconductor Corp. (a) | 2,900 | | 74,733 |
Xilinx, Inc. | 80 | | 2,568 |
| | 13,908,990 |
TOTAL SEMICONDUCTORS & SEMICONDUCTOR EQUIPMENT | | 16,148,427 |
TOTAL COMMON STOCKS (Cost $21,710,283) | 18,105,666 |
Money Market Funds - 9.9% |
| Shares | | Value |
Fidelity Cash Central Fund, 0.14% (b) | 51,892 | | $ 51,892 |
Fidelity Securities Lending Cash Central Fund, 0.15% (b)(c) | 1,752,706 | | 1,752,706 |
TOTAL MONEY MARKET FUNDS (Cost $1,804,598) | 1,804,598 |
TOTAL INVESTMENT PORTFOLIO - 108.8% (Cost $23,514,881) | | 19,910,264 |
NET OTHER ASSETS (LIABILITIES) - (8.8)% | | (1,604,662) |
NET ASSETS - 100% | $ 18,305,602 |
Legend |
(a) Non-income producing |
(b) Affiliated fund that is available only to investment companies and other accounts managed by Fidelity Investments. The rate quoted is the annualized seven-day yield of the fund at period end. A complete unaudited listing of the fund's holdings as of its most recent quarter end is available upon request. In addition, each Fidelity Central Fund's financial statements, which are not covered by the Fund's Report of Independent Registered Public Accounting Firm, are available on the SEC's website or upon request. |
(c) Investment made with cash collateral received from securities on loan. |
(d) Security or a portion of the security is on loan at period end. |
Affiliated Central Funds |
Information regarding fiscal year to date income earned by the Fund from investments in Fidelity Central Funds is as follows: |
Fund | Income earned |
Fidelity Cash Central Fund | $ 744 |
Fidelity Securities Lending Cash Central Fund | 2,276 |
Total | $ 3,020 |
Other Information |
The following is a summary of the inputs used, as of July 31, 2011, involving the Fund's assets and liabilities carried at fair value. The inputs or methodology used for valuing securities may not be an indication of the risk associated with investing in those securities. For more information on valuation inputs, and their aggregation into the levels used in the tables below, please refer to the Security Valuation section in the accompanying Notes to Financial Statements. |
Valuation Inputs at Reporting Date: |
Description | Total | Level 1 | Level 2 | Level 3 |
Investments in Securities: | | | | |
Common Stocks | $ 18,105,666 | $ 18,105,665 | $ - | $ 1 |
Money Market Funds | 1,804,598 | 1,804,598 | - | - |
Total Investments in Securities: | $ 19,910,264 | $ 19,910,263 | $ - | $ 1 |
The following is a reconciliation of Investments in Securities for which Level 3 inputs were used in determining value: |
Investments in Securities: | |
Beginning Balance | $ 1 |
Total Realized Gain (Loss) | - |
Total Unrealized Gain (Loss) | - |
Cost of Purchases | - |
Proceeds of Sales | - |
Amortization/Accretion | - |
Transfers in to Level 3 | - |
Transfers out of Level 3 | - |
Ending Balance | $ 1 |
The change in unrealized gain (loss) for the period attributable to Level 3 securities held at July 31, 2011 | $ - |
The information used in the above reconciliation represents fiscal year to date activity for any Investments in Securities identified as using Level 3 inputs at either the beginning or the end of the current fiscal period. Transfers in or out of Level 3 represent the beginning value of any Security or Instrument where a change in the pricing level occurred from the beginning to the end of the period. The cost of purchases and the proceeds of sales may include securities received or delivered through corporate actions or exchanges. Realized and unrealized gains (losses) disclosed in the reconciliation are included in Net Gain (Loss) on the Fund's Statement of Operations. |
Distribution of investments by country of issue, as a percentage of total net assets, is as follows: (Unaudited) |
United States of America | 74.0% |
Bermuda | 14.1% |
Netherlands | 5.6% |
Singapore | 3.8% |
Cayman Islands | 1.5% |
Others (Individually Less Than 1%) | 1.0% |
| 100.0% |
Income Tax Information |
At July 31, 2011, the Fund had a capital loss carryforward of approximately $7,945,071 of which $2,152,369, $279,201, $310,663 and $5,202,838 will expire in fiscal 2012, 2013, 2016 and 2017, respectively. Capital loss carryforwards are only available to offset future capital gains of the Fund to the extent provided by regulations and may be limited. |
See accompanying notes which are an integral part of the financial statements.
Annual Report
Fidelity Advisor Electronics Fund
Statement of Assets and Liabilities
| July 31, 2011 |
| | |
Assets | | |
Investment in securities, at value (including securities loaned of $1,684,563) - See accompanying schedule: Unaffiliated issuers (cost $21,710,283) | $ 18,105,666 | |
Fidelity Central Funds (cost $1,804,598) | 1,804,598 | |
Total Investments (cost $23,514,881) | | $ 19,910,264 |
Receivable for investments sold | | 822,681 |
Receivable for fund shares sold | | 4,670 |
Dividends receivable | | 3,459 |
Distributions receivable from Fidelity Central Funds | | 287 |
Receivable from investment adviser for expense reductions | | 4,729 |
Other receivables | | 886 |
Total assets | | 20,746,976 |
| | |
Liabilities | | |
Payable to custodian bank | $ 10,088 | |
Payable for investments purchased | 564,062 | |
Payable for fund shares redeemed | 55,976 | |
Accrued management fee | 8,933 | |
Distribution and service plan fees payable | 7,644 | |
Other affiliated payables | 5,392 | |
Other payables and accrued expenses | 36,573 | |
Collateral on securities loaned, at value | 1,752,706 | |
Total liabilities | | 2,441,374 |
| | |
Net Assets | | $ 18,305,602 |
Net Assets consist of: | | |
Paid in capital | | $ 30,187,707 |
Accumulated undistributed net realized gain (loss) on investments and foreign currency transactions | | (8,277,484) |
Net unrealized appreciation (depreciation) on investments and assets and liabilities in foreign currencies | | (3,604,621) |
Net Assets | | $ 18,305,602 |
Statement of Assets and Liabilities - continued
| July 31, 2011 |
| | |
Calculation of Maximum Offering Price Class A:
Net Asset Value and redemption price per share ($7,536,866 ÷ 844,366 shares) | | $ 8.93 |
| | |
Maximum offering price per share (100/94.25 of $8.93) | | $ 9.47 |
Class T:
Net Asset Value and redemption price per share ($4,476,286 ÷ 512,809 shares) | | $ 8.73 |
| | |
Maximum offering price per share (100/96.50 of $8.73) | | $ 9.05 |
Class B:
Net Asset Value and offering price per share ($691,313 ÷ 83,345 shares)A | | $ 8.29 |
| | |
Class C:
Net Asset Value and offering price per share ($3,836,033 ÷ 462,969 shares)A | | $ 8.29 |
| | |
Institutional Class:
Net Asset Value, offering price and redemption price per share ($1,765,104 ÷ 192,137 shares) | | $ 9.19 |
A Redemption price per share is equal to net asset value less any applicable contingent deferred sales charge.
See accompanying notes which are an integral part of the financial statements.
Annual Report
Fidelity Advisor Electronics Fund
Financial Statements - continued
Statement of Operations
| Year ended July 31, 2011 |
| | |
Investment Income | | |
Dividends | | $ 187,941 |
Interest | | 430 |
Income from Fidelity Central Funds | | 3,020 |
Total income | | 191,391 |
| | |
Expenses | | |
Management fee | $ 108,212 | |
Transfer agent fees | 60,274 | |
Distribution and service plan fees | 93,513 | |
Accounting and security lending fees | 7,732 | |
Custodian fees and expenses | 47,642 | |
Independent trustees' compensation | 101 | |
Registration fees | 54,582 | |
Audit | 43,946 | |
Legal | 140 | |
Miscellaneous | 167 | |
Total expenses before reductions | 416,309 | |
Expense reductions | (102,168) | 314,141 |
Net investment income (loss) | | (122,750) |
Realized and Unrealized Gain (Loss) Net realized gain (loss) on: | | |
Investment securities: | | |
Unaffiliated issuers | 4,302,638 | |
Foreign currency transactions | 983 | |
Total net realized gain (loss) | | 4,303,621 |
Change in net unrealized appreciation (depreciation) on: Investment securities | (1,162,020) | |
Assets and liabilities in foreign currencies | (27) | |
Total change in net unrealized appreciation (depreciation) | | (1,162,047) |
Net gain (loss) | | 3,141,574 |
Net increase (decrease) in net assets resulting from operations | | $ 3,018,824 |
Statement of Changes in Net Assets
| Year ended
July 31,
2011 | Year ended
July 31,
2010 |
Increase (Decrease) in Net Assets | | |
Operations | | |
Net investment income (loss) | $ (122,750) | $ (69,345) |
Net realized gain (loss) | 4,303,621 | 2,767,217 |
Change in net unrealized appreciation (depreciation) | (1,162,047) | (1,525,207) |
Net increase (decrease) in net assets resulting from operations | 3,018,824 | 1,172,665 |
Distributions to shareholders from net investment income | - | (30,683) |
Share transactions - net increase (decrease) | 1,054,457 | (1,121,329) |
Redemption fees | 1,863 | 1,611 |
Total increase (decrease) in net assets | 4,075,144 | 22,264 |
| | |
Net Assets | | |
Beginning of period | 14,230,458 | 14,208,194 |
End of period (including undistributed net investment income of $0 and accumulated net investment loss of $688, respectively) | $ 18,305,602 | $ 14,230,458 |
See accompanying notes which are an integral part of the financial statements.
Annual Report
Financial Highlights - Class A
Years ended July 31, | 2011 | 2010 | 2009 | 2008 | 2007 |
Selected Per-Share Data | | | | | |
Net asset value, beginning of period | $ 7.14 | $ 6.59 | $ 6.79 | $ 9.11 | $ 7.38 |
Income from Investment Operations | | | | | |
Net investment income (loss) C | (.04) | (.01) | .04 | - G | (.03) |
Net realized and unrealized gain (loss) | 1.83 | .59 | (.24) | (2.32) | 1.76 |
Total from investment operations | 1.79 | .58 | (.20) | (2.32) | 1.73 |
Distributions from net investment income | - | (.03) | - | - | - |
Redemption fees added to paid in capital C, G | - | - | - | - | - |
Net asset value, end of period | $ 8.93 | $ 7.14 | $ 6.59 | $ 6.79 | $ 9.11 |
Total Return A, B | 25.07% | 8.74% | (2.95)% | (25.47)% | 23.44% |
Ratios to Average Net Assets D, F | | | | | |
Expenses before reductions | 1.89% | 1.97% | 2.44% | 1.72% | 1.60% |
Expenses net of fee waivers, if any | 1.40% | 1.40% | 1.40% | 1.40% | 1.40% |
Expenses net of all reductions | 1.39% | 1.39% | 1.40% | 1.39% | 1.38% |
Net investment income (loss) | (.40)% | (.15)% | .69% | (.02)% | (.35)% |
Supplemental Data | | | | | |
Net assets, end of period (000 omitted) | $ 7,537 | $ 5,394 | $ 5,433 | $ 3,970 | $ 7,551 |
Portfolio turnover rate E | 166% | 87% | 92% | 93% | 97% |
A Total returns would have been lower if certain expenses had not been reduced during the applicable periods shown.
B Total returns do not include the effect of the sales charges.
C Calculated based on average shares outstanding during the period.
D Fees and expenses of any underlying Fidelity Central Funds are not included in the Fund's expense ratio. The Fund indirectly bears its proportionate share of the expenses of any underlying Fidelity Central Funds.
E Amount does not include the portfolio activity of any underlying Fidelity Central Funds.
F Expense ratios reflect operating expenses of the class. Expenses before reductions do not reflect amounts reimbursed by the investment adviser or reductions from brokerage service arrangements or reductions from other expense offset arrangements and do not represent the amount paid by the class during periods when reimbursements or reductions occur. Expenses net of fee waivers reflect expenses after reimbursement by the investment adviser but prior to reductions from brokerage service arrangements or other expense offset arrangements. Expenses net of all reductions represent the net expenses paid by the class.
G Amount represents less than $.01 per share.
Financial Highlights - Class T
Years ended July 31, | 2011 | 2010 | 2009 | 2008 | 2007 |
Selected Per-Share Data | | | | | |
Net asset value, beginning of period | $ 7.00 | $ 6.46 | $ 6.67 | $ 8.98 | $ 7.29 |
Income from Investment Operations | | | | | |
Net investment income (loss) C | (.06) | (.03) | .02 | (.02) | (.05) |
Net realized and unrealized gain (loss) | 1.79 | .58 | (.23) | (2.29) | 1.74 |
Total from investment operations | 1.73 | .55 | (.21) | (2.31) | 1.69 |
Distributions from net investment income | - | (.01) | - | - | - |
Redemption fees added to paid in capital C, G | - | - | - | - | - |
Net asset value, end of period | $ 8.73 | $ 7.00 | $ 6.46 | $ 6.67 | $ 8.98 |
Total Return A, B | 24.71% | 8.50% | (3.15)% | (25.72)% | 23.18% |
Ratios to Average Net Assets D, F | | | | | |
Expenses before reductions | 2.25% | 2.26% | 2.77% | 2.02% | 1.89% |
Expenses net of fee waivers, if any | 1.65% | 1.65% | 1.65% | 1.65% | 1.65% |
Expenses net of all reductions | 1.64% | 1.64% | 1.65% | 1.64% | 1.64% |
Net investment income (loss) | (.65)% | (.40)% | .44% | (.27)% | (.60)% |
Supplemental Data | | | | | |
Net assets, end of period (000 omitted) | $ 4,476 | $ 3,862 | $ 4,195 | $ 4,635 | $ 8,103 |
Portfolio turnover rate E | 166% | 87% | 92% | 93% | 97% |
A Total returns would have been lower if certain expenses had not been reduced during the applicable periods shown.
B Total returns do not include the effect of the sales charges.
C Calculated based on average shares outstanding during the period.
D Fees and expenses of any underlying Fidelity Central Funds are not included in the Fund's expense ratio. The Fund indirectly bears its proportionate share of the expenses of any underlying Fidelity Central Funds.
E Amount does not include the portfolio activity of any underlying Fidelity Central Funds.
F Expense ratios reflect operating expenses of the class. Expenses before reductions do not reflect amounts reimbursed by the investment adviser or reductions from brokerage service arrangements or reductions from other expense offset arrangements and do not represent the amount paid by the class during periods when reimbursements or reductions occur. Expenses net of fee waivers reflect expenses after reimbursement by the investment adviser but prior to reductions from brokerage service arrangements or other expense offset arrangements. Expenses net of all reductions represent the net expenses paid by the class.
G Amount represents less than $.01 per share.
See accompanying notes which are an integral part of the financial statements.
Annual Report
Financial Highlights - Class B
Years ended July 31, | 2011 | 2010 | 2009 | 2008 | 2007 |
Selected Per-Share Data | | | | | |
Net asset value, beginning of period | $ 6.69 | $ 6.19 | $ 6.43 | $ 8.70 | $ 7.10 |
Income from Investment Operations | | | | | |
Net investment income (loss) C | (.09) | (.06) | - G | (.06) | (.09) |
Net realized and unrealized gain (loss) | 1.69 | .56 | (.24) | (2.21) | 1.69 |
Total from investment operations | 1.60 | .50 | (.24) | (2.27) | 1.60 |
Redemption fees added to paid in capital C, G | - | - | - | - | - |
Net asset value, end of period | $ 8.29 | $ 6.69 | $ 6.19 | $ 6.43 | $ 8.70 |
Total Return A, B | 23.92% | 8.08% | (3.73)% | (26.09)% | 22.54% |
Ratios to Average Net Assets D, F | | | | | |
Expenses before reductions | 2.76% | 2.73% | 3.22% | 2.48% | 2.36% |
Expenses net of fee waivers, if any | 2.15% | 2.15% | 2.15% | 2.15% | 2.15% |
Expenses net of all reductions | 2.14% | 2.15% | 2.15% | 2.14% | 2.13% |
Net investment income (loss) | (1.15)% | (.90)% | (.06)% | (.77)% | (1.10)% |
Supplemental Data | | | | | |
Net assets, end of period (000 omitted) | $ 691 | $ 1,073 | $ 1,197 | $ 2,027 | $ 4,572 |
Portfolio turnover rate E | 166% | 87% | 92% | 93% | 97% |
A Total returns would have been lower if certain expenses had not been reduced during the applicable periods shown.
B Total returns do not include the effect of the contingent deferred sales charge.
C Calculated based on average shares outstanding during the period.
D Fees and expenses of any underlying Fidelity Central Funds are not included in the Fund's expense ratio. The Fund indirectly bears its proportionate share of the expenses of any underlying Fidelity Central Funds.
E Amount does not include the portfolio activity of any underlying Fidelity Central Funds.
F Expense ratios reflect operating expenses of the class. Expenses before reductions do not reflect amounts reimbursed by the investment adviser or reductions from brokerage service arrangements or reductions from other expense offset arrangements and do not represent the amount paid by the class during periods when reimbursements or reductions occur. Expenses net of fee waivers reflect expenses after reimbursement by the investment adviser but prior to reductions from brokerage service arrangements or other expense offset arrangements. Expenses net of all reductions represent the net expenses paid by the class.
G Amount represents less than $.01 per share.
Financial Highlights - Class C
Years ended July 31, | 2011 | 2010 | 2009 | 2008 | 2007 |
Selected Per-Share Data | | | | | |
Net asset value, beginning of period | $ 6.68 | $ 6.18 | $ 6.42 | $ 8.69 | $ 7.09 |
Income from Investment Operations | | | | | |
Net investment income (loss) C | (.09) | (.06) | - G | (.06) | (.09) |
Net realized and unrealized gain (loss) | 1.70 | .56 | (.24) | (2.21) | 1.69 |
Total from investment operations | 1.61 | .50 | (.24) | (2.27) | 1.60 |
Redemption fees added to paid in capital C, G | - | - | - | - | - |
Net asset value, end of period | $ 8.29 | $ 6.68 | $ 6.18 | $ 6.42 | $ 8.69 |
Total Return A, B | 24.10% | 8.09% | (3.74)% | (26.12)% | 22.57% |
Ratios to Average Net Assets D, F | | | | | |
Expenses before reductions | 2.70% | 2.72% | 3.21% | 2.47% | 2.34% |
Expenses net of fee waivers, if any | 2.15% | 2.15% | 2.15% | 2.15% | 2.15% |
Expenses net of all reductions | 2.14% | 2.14% | 2.15% | 2.14% | 2.13% |
Net investment income (loss) | (1.15)% | (.90)% | (.06)% | (.77)% | (1.10)% |
Supplemental Data | | | | | |
Net assets, end of period (000 omitted) | $ 3,836 | $ 3,256 | $ 3,016 | $ 3,325 | $ 8,389 |
Portfolio turnover rate E | 166% | 87% | 92% | 93% | 97% |
A Total returns would have been lower if certain expenses had not been reduced during the applicable periods shown.
B Total returns do not include the effect of the contingent deferred sales charge.
C Calculated based on average shares outstanding during the period.
D Fees and expenses of any underlying Fidelity Central Funds are not included in the Fund's expense ratio. The Fund indirectly bears its proportionate share of the expenses of any underlying Fidelity Central Funds.
E Amount does not include the portfolio activity of any underlying Fidelity Central Funds.
F Expense ratios reflect operating expenses of the class. Expenses before reductions do not reflect amounts reimbursed by the investment adviser or reductions from brokerage service arrangements or reductions from other expense offset arrangements and do not represent the amount paid by the class during periods when reimbursements or reductions occur. Expenses net of fee waivers reflect expenses after reimbursement by the investment adviser but prior to reductions from brokerage service arrangements or other expense offset arrangements. Expenses net of all reductions represent the net expenses paid by the class.
G Amount represents less than $.01 per share.
See accompanying notes which are an integral part of the financial statements.
Annual Report
Financial Highlights - Institutional Class
Years ended July 31, | 2011 | 2010 | 2009 | 2008 | 2007 |
Selected Per-Share Data | | | | | |
Net asset value, beginning of period | $ 7.33 | $ 6.75 | $ 6.94 | $ 9.30 | $ 7.51 |
Income from Investment Operations | | | | | |
Net investment income (loss) B | (.01) | .01 | .05 | .02 | (.01) |
Net realized and unrealized gain (loss) | 1.87 | .60 | (.24) | (2.38) | 1.80 |
Total from investment operations | 1.86 | .61 | (.19) | (2.36) | 1.79 |
Distributions from net investment income | - | (.03) | - | - | - |
Redemption fees added to paid in capital B, F | - | - | - | - | - |
Net asset value, end of period | $ 9.19 | $ 7.33 | $ 6.75 | $ 6.94 | $ 9.30 |
Total Return A | 25.38% | 9.10% | (2.74)% | (25.38)% | 23.83% |
Ratios to Average Net Assets C, E | | | | | |
Expenses before reductions | 1.42% | 1.64% | 2.16% | 1.47% | 1.26% |
Expenses net of fee waivers, if any | 1.15% | 1.15% | 1.15% | 1.15% | 1.15% |
Expenses net of all reductions | 1.14% | 1.14% | 1.15% | 1.14% | 1.13% |
Net investment income (loss) | (.15)% | .11% | .94% | .23% | (.10)% |
Supplemental Data | | | | | |
Net assets, end of period (000 omitted) | $ 1,765 | $ 645 | $ 367 | $ 353 | $ 730 |
Portfolio turnover rate D | 166% | 87% | 92% | 93% | 97% |
A Total returns would have been lower if certain expenses had not been reduced during the applicable periods shown.
B Calculated based on average shares outstanding during the period.
C Fees and expenses of any underlying Fidelity Central Funds are not included in the Fund's expense ratio. The Fund indirectly bears its proportionate share of the expenses of any underlying Fidelity Central Funds.
D Amount does not include the portfolio activity of any underlying Fidelity Central Funds.
E Expense ratios reflect operating expenses of the class. Expenses before reductions do not reflect amounts reimbursed by the investment adviser or reductions from brokerage service arrangements or reductions from other expense offset arrangements and do not represent the amount paid by the class during periods when reimbursements or reductions occur. Expenses net of fee waivers reflect expenses after reimbursement by the investment adviser but prior to reductions from brokerage service arrangements or other expense offset arrangements. Expenses net of all reductions represent the net expenses paid by the class.
F Amount represents less than $.01 per share.
See accompanying notes which are an integral part of the financial statements.
Annual Report
Notes to Financial Statements
For the period ended July 31, 2011
1. Organization.
Fidelity Advisor Electronics Fund (the Fund) is a non-diversified fund of Fidelity Advisor Series VII (the Trust) and is authorized to issue an unlimited number of shares. The Trust is registered under the Investment Company Act of 1940, as amended (the 1940 Act), as an open-end management investment company organized as a Massachusetts business trust. The Fund offers Class A, Class T, Class C and Institutional Class shares, each of which, along with Class B shares, has equal rights as to assets and voting privileges. Effective after the close of business on September 1, 2010, Class B shares were closed to new accounts and additional purchases, except for exchanges and reinvestments, by existing shareholders. Each class has exclusive voting rights with respect to matters that affect that class. Class B shares will automatically convert to Class A shares after a holding period of seven years from the initial date of purchase. Investment income, realized and unrealized capital gains and losses, the common expenses of the Fund, and certain fund-level expense reductions, if any, are allocated on a pro-rata basis to each class based on the relative net assets of each class to the total net assets of the Fund. Each class differs with respect to transfer agent and distribution and service plan fees incurred. Certain expense reductions may also differ by class. The Fund's investments in emerging markets can be subject to social, economic, regulatory, and political uncertainties and can be extremely volatile.
2. Investments in Fidelity Central Funds.
The Fund invests in Fidelity Central Funds, which are open-end investment companies available only to other investment companies and accounts managed by Fidelity Management & Research Company (FMR) and its affiliates. The Fund's Schedule of Investments lists each of the Fidelity Central Funds held as of period end, if any, as an investment of the Fund, but does not include the underlying holdings of each Fidelity Central Fund. As an Investing Fund, the Fund indirectly bears its proportionate share of the expenses of the underlying Fidelity Central Funds.
The Money Market Central Funds seek preservation of capital and current income and are managed by Fidelity Investments Money Management, Inc. (FIMM), an affiliate of FMR.
A complete unaudited list of holdings for each Fidelity Central Fund is available upon request or at the Securities and Exchange Commission (the SEC) web site at www.sec.gov. In addition, the financial statements of the Fidelity Central Funds, which are not covered by the Fund's Report of Independent Registered Public Accounting Firm, are available on the SEC web site or upon request.
3. Significant Accounting Policies.
The financial statements have been prepared in conformity with accounting principles generally accepted in the United States of America (GAAP), which require management to make certain estimates and assumptions at the date of the financial statements. Actual results could differ from those estimates. Subsequent events, if any, through the date that the financial statements were issued have been evaluated in the preparation of the financial statements. The following summarizes the significant accounting policies of the Fund:
Security Valuation. Investments are valued as of 4:00 p.m. Eastern time on the last calendar day of the period. The Fund uses independent pricing services approved by the Board of Trustees to value its investments. When current market prices or quotations are not readily available or reliable, valuations may be determined in good faith in accordance with procedures adopted by the Board of Trustees. Factors used in determining value may include market or security specific events. The frequency with which these procedures are used cannot be predicted and they may be utilized to a significant extent. The value used for net asset value (NAV) calculation under these procedures may differ from published prices for the same securities.
The Fund categorizes the inputs to valuation techniques used to value its investments into a disclosure hierarchy consisting of three levels as shown below:
Level 1 - quoted prices in active markets for identical investments
Level 2 - other significant observable inputs (including quoted prices for similar investments, interest rates, prepayment speeds, etc.)
Level 3 - unobservable inputs (including the Fund's own assumptions based on the best information available)
Changes in valuation techniques may result in transfers in or out of an assigned level within the disclosure hierarchy. The aggregate value of investments by input level, as of July 31, 2011, as well as a roll forward of Level 3 securities, is included at the end of the Fund's Schedule of Investments. Valuation techniques used to value the Fund's investments by major category are as follows:
Equity securities, including restricted securities, for which market quotations are readily available, are valued at the last reported sale price or official closing price as reported by an independent pricing service on the primary market or exchange on which they are traded and are categorized as Level 1 in the hierarchy. In the event there were no sales during the day or closing prices are not available, securities are valued at the last quoted bid price or may be valued using the last available price and are generally categorized as Level 2 in the hierarchy. For foreign equity securities, when significant market or security specific events arise, comparisons to the valuation of American Depositary Receipts (ADRs), futures contracts, Exchange-traded
Annual Report
3. Significant Accounting Policies - continued
Security Valuation - continued
funds (ETFs) and certain indexes as well as quoted prices for similar securities are used and are categorized as Level 2 in the hierarchy in these circumstances. Utilizing these techniques may result in transfers between Level 1 and Level 2. For restricted equity securities and private placements where observable inputs are limited, assumptions about market activity and risk are used and are categorized as Level 3 in the hierarchy.
Investments in open-end mutual funds, including the Fidelity Central Funds, are valued at their closing net asset value each business day and are categorized as Level 1 in the hierarchy.
Foreign Currency. The Fund may use foreign currency contracts to facilitate transactions in foreign-denominated securities. Gains and losses from these transactions may arise from changes in the value of the foreign currency or if the counterparties do not perform under the contracts' terms.
Foreign-denominated assets, including investment securities, and liabilities are translated into U.S. dollars at the exchange rate at period end. Purchases and sales of investment securities, income and dividends received and expenses denominated in foreign currencies are translated into U.S. dollars at the exchange rate in effect on the transaction date.
The effects of exchange rate fluctuations on investments are included with the net realized and unrealized gain (loss) on investment securities. Other foreign currency transactions resulting in realized and unrealized gain (loss) are disclosed separately.
Investment Transactions and Income. For financial reporting purposes, the Fund's investment holdings and NAV include trades executed through the end of the last business day of the period. The NAV per share for processing shareholder transactions is calculated as of the close of business of the New York Stock Exchange (NYSE), normally 4:00 p.m. Eastern time and includes trades executed through the end of the prior business day. Gains and losses on securities sold are determined on the basis of identified cost and may include proceeds received from litigation. Dividend income is recorded on the ex-dividend date, except for certain dividends from foreign securities where the ex-dividend date may have passed, which are recorded as soon as the Fund is informed of the ex-dividend date. Non-cash dividends included in dividend income, if any, are recorded at the fair market value of the securities received. Distributions received on securities that represent a return of capital or capital gain are recorded as a reduction of cost of investments and/or as a realized gain. The Fund estimates the components of distributions received that may be considered return of capital distributions or capital gain distributions. Interest income and distributions from the Fidelity Central Funds are accrued as earned. Interest income includes coupon interest and amortization of premium and accretion of discount on debt securities. Investment income is recorded net of foreign taxes withheld where recovery of such taxes is uncertain.
Expenses. Expenses directly attributable to a fund are charged to that fund. Expenses attributable to more than one fund are allocated among the respective funds on the basis of relative net assets or other appropriate methods. Expense estimates are accrued in the period to which they relate and adjustments are made when actual amounts are known.
Income Tax Information and Distributions to Shareholders. Each year, the Fund intends to qualify as a regulated investment company, including distributing substantially all of its taxable income and realized gains under Subchapter M of the Internal Revenue Code and filing its U.S. federal tax return. As a result, no provision for income taxes is required. As of July 31, 2011, the Fund did not have any unrecognized tax benefits in the financial statements. A fund's federal tax return is subject to examination by the Internal Revenue Service (IRS) for a period of three years. Foreign taxes are provided for based on the Fund's understanding of the tax rules and rates that exist in the foreign markets in which it invests.
Distributions are declared and recorded on the ex-dividend date. Income dividends and capital gain distributions are declared separately for each class. Income and capital gain distributions are determined in accordance with income tax regulations, which may differ from GAAP.
Capital accounts within the financial statements are adjusted for permanent book-tax differences. These adjustments have no impact on net assets or the results of operations. Temporary book-tax differences will reverse in a subsequent period.
Book-tax differences are primarily due to foreign currency transactions, net operating losses, capital loss carryforwards, and losses deferred due to wash sales and excise tax regulations.
The federal tax cost of investment securities and unrealized appreciation (depreciation) as of period end were as follows:
Gross unrealized appreciation | $ 164,236 |
Gross unrealized depreciation | (4,101,266) |
Net unrealized appreciation (depreciation) on securities and other investments | $ (3,937,030) |
| |
Tax Cost | $ 23,847,294 |
Annual Report
Notes to Financial Statements - continued
3. Significant Accounting Policies - continued
Income Tax Information and Distributions to Shareholders - continued
The tax-based components of distributable earnings as of period end were as follows:
Capital loss carryforward | $ (7,945,071) |
Net unrealized appreciation (depreciation) | $ (3,937,034) |
Under the recently enacted Regulated Investment Company Modernization Act of 2010 (the Act), the Fund will be permitted to carry forward capital losses incurred in taxable years beginning after December 22, 2010 for an unlimited period. However, any losses incurred during those future taxable years will be required to be utilized prior to any losses incurred in pre-enactment taxable years, which generally expire after eight years from when they are incurred. Additionally, post-enactment capital losses that are carried forward will retain their character as either short-term or long-term capital losses rather than being considered all short-term as under previous law. The Fund's first fiscal year end subject to the Act will be July 31, 2012.
The tax character of distributions paid was as follows:
| July 31, 2011 | July 31, 2010 |
Ordinary Income | $ - | $ 30,683 |
Short-Term Trading (Redemption) Fees. Shares held by investors in the Fund less than 30 days are subject to a redemption fee equal to .75% of the net asset value of shares redeemed. All redemption fees, which reduce the proceeds of the shareholder redemption, are retained by the Fund and accounted for as an addition to paid in capital.
New Accounting Pronouncement. In May 2011, the Financial Accounting Standards Board issued Accounting Standard Update No. 2011-04, Fair Value Measurement (Topic 820) - Amendments to Achieve Common Fair Value Measurement and Disclosure Requirements in U.S. GAAP and IFRSs. The update changes the wording used to describe the requirements in GAAP for measuring fair value and for disclosing information about fair value measurements. The update is effective during interim and annual periods beginning after December 15, 2011. Management is currently evaluating the impact of the update's adoption on the Fund's financial statement disclosures.
4. Purchases and Sales of Investments.
Purchases and sales of securities, other than short-term securities, aggregated $32,264,036 and $31,430,706, respectively.
5. Fees and Other Transactions with Affiliates.
Management Fee. FMR and its affiliates provide the Fund with investment management related services for which the Fund pays a monthly management fee. The management fee is the sum of an individual fund fee rate that is based on an annual rate of .30% of the Fund's average net assets and a group fee rate that averaged .26% during the period. The group fee rate is based upon the average net assets of all the mutual funds advised by FMR. The group fee rate decreases as assets under management increase and increases as assets under management decrease. For the period, the total annual management fee rate was .56% of the Fund's average net assets.
Distribution and Service Plan Fees. In accordance with Rule 12b-1 of the 1940 Act, the Fund has adopted separate Distribution and Service Plans for each class of shares. Certain classes pay Fidelity Distributors Corporation (FDC), an affiliate of FMR, separate Distribution and Service Fees, each of which is based on an annual percentage of each class' average net assets. In addition, FDC may pay financial intermediaries for selling shares of the Fund and providing shareholder support services. For the period, the Distribution and Service Fee rates, total fees and amounts retained by FDC were as follows:
| Distribution
Fee | Service
Fee | Total Fees | Retained
by FDC |
Class A | -% | .25% | $ 20,705 | $ 979 |
Class T | .25% | .25% | 23,040 | 88 |
Class B | .75% | .25% | 9,660 | 7,257 |
Class C | .75% | .25% | 40,108 | 6,336 |
| | | $ 93,513 | $ 14,660 |
Annual Report
5. Fees and Other Transactions with Affiliates - continued
Sales Load. FDC may receive a front-end sales charge of up to 5.75% for selling Class A shares, and 3.50% for selling Class T shares, some of which is paid to financial intermediaries for selling shares of the Fund. Depending on the holding period, FDC may receive contingent deferred sales charges levied on Class A, Class T, Class B, and Class C redemptions. The deferred sales charges range from 5% to 1% for Class B, 1% for Class C, 1.00% for certain purchases of Class A shares and .25% for certain purchases of Class T shares.
For the period, sales charge amounts retained by FDC were as follows:
| Retained
by FDC |
Class A | $ 6,669 |
Class T | 3,453 |
Class B* | 2,680 |
Class C* | 867 |
| $ 13,669 |
* When Class B and Class C shares are initially sold, FDC pays commissions from its own resources to financial intermediaries through which the sales are made.
Transfer Agent Fees. Fidelity Investments Institutional Operations Company, Inc. (FIIOC), an affiliate of FMR, is the transfer, dividend disbursing and shareholder servicing agent for each class of the Fund. FIIOC receives account fees and asset-based fees that vary according to the account size and type of account of the shareholders of the respective classes of the Fund. FIIOC pays for typesetting, printing and mailing of shareholder reports, except proxy statements. For the period, transfer agent fees for each class were as follows:
| Amount | % of
Average
Net Assets |
Class A | $ 25,542 | .31 |
Class T | 16,115 | .35 |
Class B | 2,975 | .31 |
Class C | 12,327 | .31 |
Institutional Class | 3,315 | .21 |
| $ 60,274 | |
Accounting and Security Lending Fees. Fidelity Service Company, Inc. (FSC), an affiliate of FMR, maintains the Fund's accounting records. The accounting fee is based on the level of average net assets for the month. Under a separate contract, FSC administers the security lending program. The security lending fee is based on the number and duration of lending transactions.
Brokerage Commissions. The Fund placed a portion of its portfolio transactions with brokerage firms which are affiliates of the investment adviser. The commissions paid to these affiliated firms were $4,616 for the period.
6. Committed Line of Credit.
The Fund participates with other funds managed by FMR or an affiliate in a $4.0 billion credit facility (the "line of credit") to be utilized for temporary or emergency purposes to fund shareholder redemptions or for other short-term liquidity purposes. The Fund has agreed to pay commitment fees on its pro-rata portion of the line of credit, which amounted to $63 and is reflected in Miscellaneous expenses on the Statement of Operations. During the period, there were no borrowings on this line of credit.
7. Security Lending.
The Fund lends portfolio securities through a lending agent from time to time in order to earn additional income. The lending agent may loan securities to certain qualified borrowers, including Fidelity Capital Markets (FCM), a broker-dealer affiliated with the Fund. On the settlement date of the loan, the Fund receives collateral (in the form of U.S. Treasury obligations, letters of credit and/or cash) against the loaned securities and maintains collateral in an amount not less than 100% of the market value of the loaned securities during the period of the loan. The market value of the loaned securities is determined at the close of business of the Fund and any additional required collateral is delivered to the Fund on the next business day. If the borrower defaults on its obligation to return the securities loaned because of insolvency or other reasons, a fund could experience delays and costs in recovering the securities loaned or in gaining access to the collateral. Any cash collateral received is invested in the Fidelity Securities Lending Cash Central Fund. The value of loaned securities and cash collateral at period end are disclosed on the Fund's Statement of Assets and Liabilities. Security lending income represents the income earned on investing cash collateral, less rebates paid to borrowers and lending agent fees associated with the
Annual Report
Notes to Financial Statements - continued
7. Security Lending - continued
loan, plus any premium payments received for lending certain types of securities. Security lending income is presented in the Statement of Operations as a component of income from Fidelity Central Funds. Total security lending income during the period amounted to $2,276. During the period, there were no securities loaned to FCM.
8. Expense Reductions.
FMR voluntarily agreed to reimburse each class to the extent annual operating expenses exceeded certain levels of average net assets as noted in the table below. Some expenses, for example interest expense, including commitment fees, are excluded from this reimbursement.
The following classes were in reimbursement during the period:
| Expense
Limitations | Reimbursement
from adviser |
Class A | 1.40% | $ 40,772 |
Class T | 1.65% | 27,405 |
Class B | 2.15% | 5,854 |
Class C | 2.15% | 21,804 |
Institutional Class | 1.15% | 4,262 |
| | $ 100,097 |
Many of the brokers with whom FMR places trades on behalf of the Fund provided services to the Fund in addition to trade execution. These services included payments of certain expenses on behalf of the Fund totaling $2,071 for the period.
9. Distributions to Shareholders.
Distributions to shareholders of each class were as follows:
Years ended July 31, | 2011 | 2010 |
From net investment income | | |
Class A | $ - | $ 22,913 |
Class T | - | 5,704 |
Institutional Class | - | 2,066 |
Total | $ - | $ 30,683 |
10. Share Transactions.
Transactions for each class of shares were as follows:
| Shares | Dollars |
Years ended July 31, | 2011 | 2010 | 2011 | 2010 |
Class A | | | | |
Shares sold | 823,348 | 463,925 | $ 7,674,866 | $ 3,450,517 |
Reinvestment of distributions | - | 3,053 | - | 21,642 |
Shares redeemed | (734,519) | (536,272) | (6,789,005) | (3,911,247) |
Net increase (decrease) | 88,829 | (69,294) | $ 885,861 | $ (439,088) |
Class T | | | | |
Shares sold | 227,766 | 149,748 | $ 2,032,968 | $ 1,082,460 |
Reinvestment of distributions | - | 793 | - | 5,519 |
Shares redeemed | (266,704) | (248,392) | (2,292,080) | (1,826,132) |
Net increase (decrease) | (38,938) | (97,851) | $ (259,112) | $ (738,153) |
Class B | | | | |
Shares sold | 17,689 | 71,160 | $ 152,131 | $ 500,056 |
Reinvestment of distributions | - | - | - | - |
Shares redeemed | (94,901) | (103,890) | (767,577) | (717,856) |
Net increase (decrease) | (77,212) | (32,730) | $ (615,446) | $ (217,800) |
Annual Report
10. Share Transactions - continued
| Shares | Dollars |
Years ended July 31, | 2011 | 2010 | 2011 | 2010 |
Class C | | | | |
Shares sold | 179,286 | 184,365 | $ 1,565,088 | $ 1,261,735 |
Reinvestment of distributions | - | - | - | - |
Shares redeemed | (203,889) | (184,552) | (1,673,259) | (1,259,598) |
Net increase (decrease) | (24,603) | (187) | $ (108,171) | $ 2,137 |
Institutional Class | | | | |
Shares sold | 302,052 | 94,039 | $ 3,051,352 | $ 728,440 |
Reinvestment of distributions | - | 194 | - | 1,410 |
Shares redeemed | (197,907) | (60,662) | (1,900,027) | (458,275) |
Net increase (decrease) | 104,145 | 33,571 | $ 1,151,325 | $ 271,575 |
11. Other.
The Fund's organizational documents provide former and current trustees and officers with a limited indemnification against liabilities arising in connection with the performance of their duties to the Fund. In the normal course of business, the Fund may also enter into contracts that provide general indemnifications. The Fund's maximum exposure under these arrangements is unknown as this would be dependent on future claims that may be made against the Fund. The risk of material loss from such claims is considered remote.
Annual Report
Fidelity Advisor Energy Fund - Class A, T, B, and C
Performance: The Bottom Line
Average annual total return reflects the change in the value of an investment, assuming reinvestment of the class' distributions from dividend income and capital gains (the profits earned upon the sale of securities that have grown in value, if any) and assuming a constant rate of performance each year. The $10,000 table and the fund's returns do not reflect the deduction of taxes that a shareholder would pay on fund distributions or the redemption of fund shares. During periods of reimbursement by Fidelity, a fund's total return will be greater than it would be had the reimbursement not occurred. How a fund did yesterday is no guarantee of how it will do tomorrow. Returns reflect the conversion of Class B shares to Class A shares after a maximum of seven years.
Average Annual Total Returns
Periods ended July 31, 2011 | Past 1
year | Past 5
years | Past 10
years |
Class A (incl. 5.75% sales charge) C | 37.10% | 4.13% | 10.80% |
Class T (incl. 3.50% sales charge) C | 40.08% | 4.40% | 10.84% |
Class B (incl. contingent deferred sales charge) A,C | 39.38% | 4.29% | 10.88% |
Class C (incl. contingent deferred sales charge) B,C | 43.38% | 4.60% | 10.67% |
A Class B shares' contingent deferred sales charges included in the past one year, past five years, and past ten years total return figures are 5%, 2%, and 0%, respectively.
B Class C shares' contingent deferred sales charges included in the past one year, past five years, and past ten years total return figures are 1%, 0%, and 0%, respectively.
C Prior to October 1, 2006, Fidelity Advisor Energy Fund operated under certain different investment policies. The historical performance of the fund may not represent its current investment policies.
$10,000 Over 10 Years
Let's say hypothetically that $10,000 was invested in Fidelity Advisor Energy Fund - Class A on July 31, 2001, and the current 5.75% sales charge was paid. The chart shows how the value of your investment would have changed, and also shows how the S&P 500 Index performed over the same period.
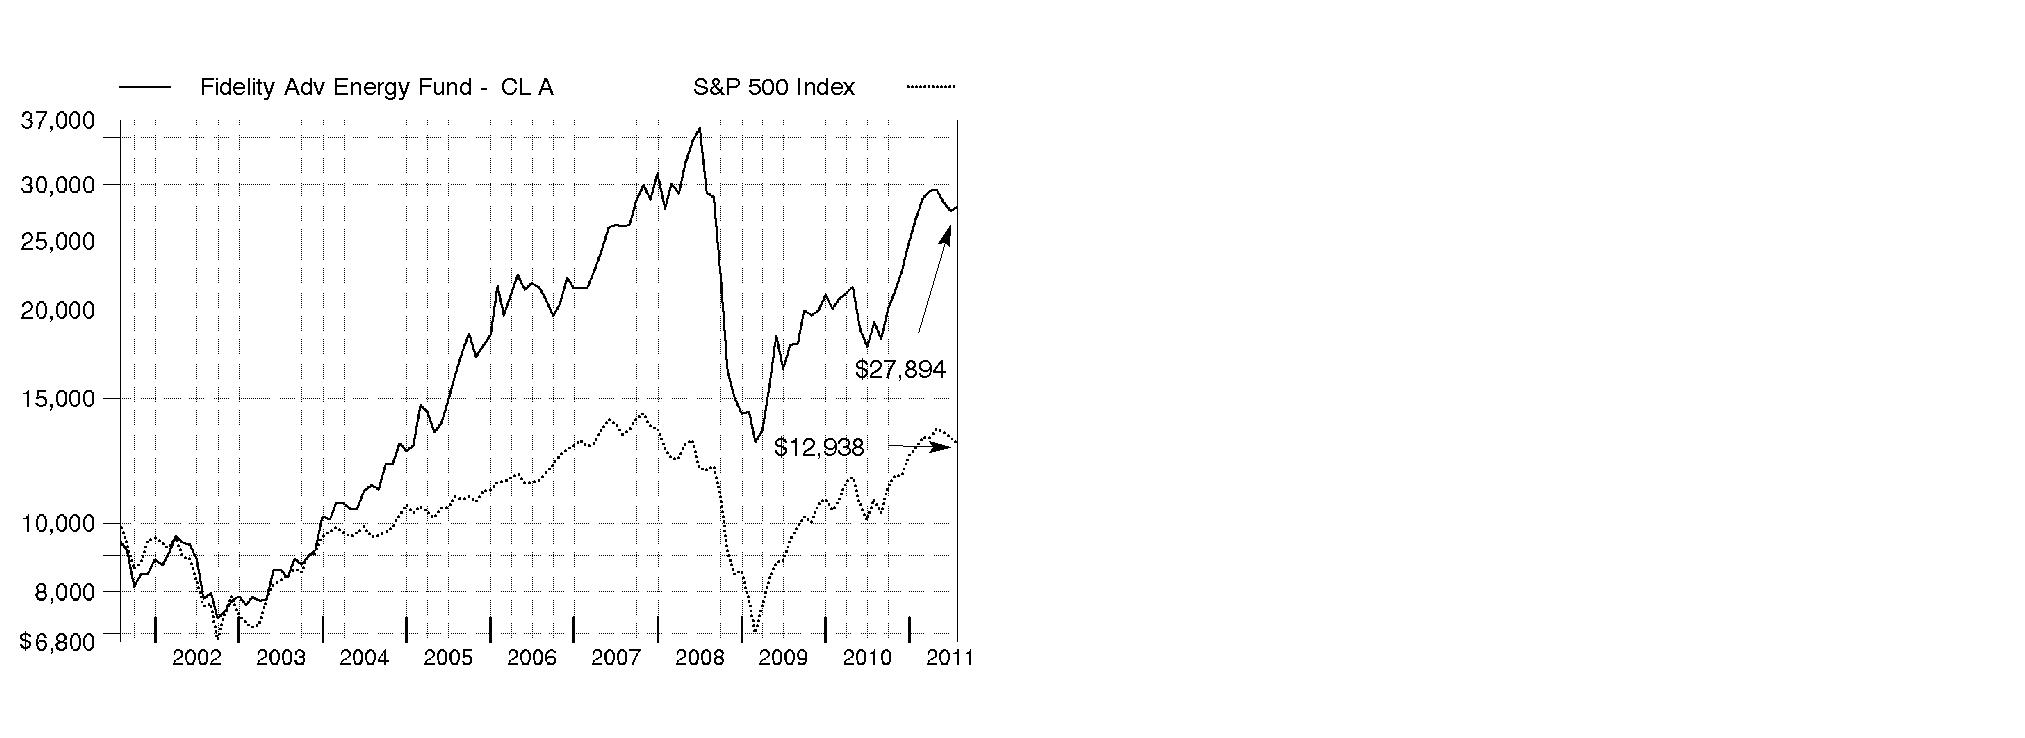
Annual Report
Fidelity Advisor Energy Fund
Market Recap: U.S. stocks registered solid double-digit gains for the 12 months ending July 31, 2011, extending a rally that began more than two years earlier. Despite a rough start in August 2010, markets turned positive in September, as increased demand for capital goods and other upbeat indicators trumped investor worry about a U.S. recessionary relapse. The broad market, as measured by the S&P 500® Index, rose 9% that month, its biggest September gain in 71 years. Seven more monthly advances followed, fueled by encouraging corporate earnings and economic activity. However, volatility picked up in the period's latter months, as markets reacted to continued high U.S. unemployment, nagging debt troubles in Europe and looming legislative battles over the federal debt ceiling. May unemployment rose above 9% for the first time in 2011, contributing to a traditional "June swoon" for stocks. Market uncertainty lingered in July, when the S&P 500® posted its second-biggest monthly loss of the period. For the full year, the S&P 500® climbed 19.65%, while the blue-chip-laden Dow Jones Industrial AverageSM rose a comparable 19.09% and the technology-heavy Nasdaq Composite® Index gained 23.40%. On the capitalization spectrum, stocks of mid-cap companies fared best, with the Russell Midcap® Index rising 24.51% and the small-cap Russell 2000® Index adding 23.92%.
Comments from John Dowd, Portfolio Manager of Fidelity Advisor® Energy Fund: For the year, the fund's Class A, Class T, Class B and Class C shares returned 45.46%, 45.16%, 44.38% and 44.38%, respectively (excluding sales charges), about in line with the 44.78% advance of the MSCI® U.S. IM Energy 25/50 Index and significantly outpacing the broadly based S&P 500. Versus the sector benchmark, performance was bolstered by stock selection and a sizable overweighting in oil/gas refining and marketing, including independent refiner Holly and competitor Frontier Oil, which merged during the period. The new company, HollyFrontier, also contributed. Positioning in oil/gas equipment and services helped, including an overweighting in drill rig equipment provider National Oilwell Varco. Good stock picks in the coal/consumable fuels segment were rewarding, particularly Massey Energy, which was acquired in June by Alpha Natural Resources. Conversely, stock picking in oil/gas drilling and oil/gas exploration and production (E&P) detracted from relative performance. Specifically, an overweighted stake in Transocean hurt, as the company revised earnings downward during the period and was still dealing with costs of its April 2010 Deepwater Horizon oil rig disaster, causing its stock to fall. Untimely ownership of integrated oil/gas provider Hess hurt, as did overweighting underperformer Southwestern Energy, which I sold before period end. I missed out by selling natural gas E&P firm Petrohawk Energy well before its stock jumped in July on a proposed acquisition by Australian firm BHP Billiton. The fund's foreign holdings detracted overall, despite a tail wind from a weaker U.S. dollar.
Comments from John Dowd, Portfolio Manager of Fidelity Advisor® Energy Fund: For the year, the fund's Institutional Class shares returned 45.87%, slightly ahead of the 44.78% advance of the MSCI® U.S. IM Energy 25/50 Index and significantly outpacing the broadly based S&P 500. Versus the sector benchmark, performance was bolstered by stock selection and a sizable overweighting in oil/gas refining and marketing, including independent refiner Holly and competitor Frontier Oil, which merged during the period. The new company, HollyFrontier, also contributed. Positioning in oil/gas equipment and services helped, including an overweighting in drill rig equipment provider National Oilwell Varco. Good stock picks in the coal/consumable fuels segment were rewarding, particularly Massey Energy, which was acquired in June by Alpha Natural Resources. Conversely, stock picking in oil/gas drilling and oil/gas exploration and production (E&P) detracted from relative performance. Specifically, an overweighted stake in Transocean hurt, as the company revised earnings downward during the period and was still dealing with costs of its April 2010 Deepwater Horizon oil rig disaster, causing its stock to fall. Untimely ownership of integrated oil/gas provider Hess hurt, as did overweighting underperformer Southwestern Energy, which I sold before period end. I missed out by selling natural gas E&P firm Petrohawk Energy well before its stock jumped in July on a proposed acquisition by Australian firm BHP Billiton. The fund's foreign holdings detracted overall, despite a tail wind from a weaker U.S. dollar.
The views expressed above reflect those of the portfolio manager(s) only through the end of the period as stated on the cover of this report and do not necessarily represent the views of Fidelity or any other person in the Fidelity organization. Any such views are subject to change at any time based upon market or other conditions and Fidelity disclaims any responsibility to update such views. These views may not be relied on as investment advice and, because investment decisions for a Fidelity fund are based on numerous factors, may not be relied on as an indication of trading intent on behalf of any Fidelity fund.
Annual Report
Fidelity Advisor Energy Fund
As a shareholder of the Fund, you incur two types of costs: (1) transaction costs, including sales charges (loads) on purchase payments or redemption proceeds, redemption fees, and (2) ongoing costs, including management fees, distribution and/or service (12b-1) fees and other Fund expenses. This Example is intended to help you understand your ongoing costs (in dollars) of investing in the Fund and to compare these costs with the ongoing costs of investing in other mutual funds.
The Example is based on an investment of $1,000 invested at the beginning of the period and held for the entire period (February 1, 2011 to July 31, 2011).
Actual Expenses
The first line of the accompanying table for each class of the Fund provides information about actual account values and actual expenses. You may use the information in this line, together with the amount you invested, to estimate the expenses that you paid over the period. Simply divide your account value by $1,000.00 (for example, an $8,600 account value divided by $1,000.00 = 8.6), then multiply the result by the number in the first line for a class of the Fund under the heading entitled "Expenses Paid During Period" to estimate the expenses you paid on your account during this period. In addition, the Fund, as a shareholder in the underlying Fidelity Central Funds, will indirectly bear its pro-rata share of the fees and expenses incurred by the underlying Fidelity Central Funds. These fees and expenses are not included in the Fund's annualized expense ratio used to calculate the expense estimate in the table below.
Hypothetical Example for Comparison Purposes
The second line of the accompanying table for each class of the Fund provides information about hypothetical account values and hypothetical expenses based on a Class' actual expense ratio and an assumed rate of return of 5% per year before expenses, which is not the Class' actual return. The hypothetical account values and expenses may not be used to estimate the actual ending account balance or expenses you paid for the period. You may use this information to compare the ongoing costs of investing in the Fund and other funds. To do so, compare this 5% hypothetical example with the 5% hypothetical examples that appear in the shareholder reports of the other funds. In addition, the Fund, as a shareholder in the underlying Fidelity Central Funds, will indirectly bear its pro-rata share of the fees and expenses incurred by the underlying Fidelity Central Funds. These fees and expenses are not included in the Fund's annualized expense ratio used to calculate the expense estimate in the table below.
Please note that the expenses shown in the table are meant to highlight your ongoing costs only and do not reflect any transaction costs. Therefore, the second line of the table is useful in comparing ongoing costs only, and will not help you determine the relative total costs of owning different funds. In addition, if these transactional costs were included, your costs would have been higher.
| Annualized
Expense Ratio | Beginning
Account Value
February 1, 2011 | Ending
Account Value
July 31, 2011 | Expenses Paid
During Period*
February 1, 2011 to
July 31, 2011 |
Class A | 1.15% | | | |
Actual | | $ 1,000.00 | $ 1,038.80 | $ 5.81 |
HypotheticalA | | $ 1,000.00 | $ 1,019.09 | $ 5.76 |
Class T | 1.35% | | | |
Actual | | $ 1,000.00 | $ 1,037.70 | $ 6.82 |
HypotheticalA | | $ 1,000.00 | $ 1,018.10 | $ 6.76 |
Class B | 1.92% | | | |
Actual | | $ 1,000.00 | $ 1,034.90 | $ 9.69 |
HypotheticalA | | $ 1,000.00 | $ 1,015.27 | $ 9.59 |
Class C | 1.88% | | | |
Actual | | $ 1,000.00 | $ 1,035.00 | $ 9.49 |
HypotheticalA | | $ 1,000.00 | $ 1,015.47 | $ 9.39 |
Institutional Class | .84% | | | |
Actual | | $ 1,000.00 | $ 1,040.40 | $ 4.25 |
HypotheticalA | | $ 1,000.00 | $ 1,020.63 | $ 4.21 |
A 5% return per year before expenses
* Expenses are equal to each Class' annualized expense ratio, multiplied by the average account value over the period, multiplied by 181/365 (to reflect the one-half year period).
Annual Report
Fidelity Advisor Energy Fund
Investment Changes (Unaudited)
Top Ten Stocks as of July 31, 2011 |
| % of fund's
net assets | % of fund's net assets
6 months ago |
Chevron Corp. | 11.1 | 4.4 |
Exxon Mobil Corp. | 10.4 | 17.0 |
Schlumberger Ltd. | 7.1 | 6.3 |
Occidental Petroleum Corp. | 5.3 | 6.2 |
Baker Hughes, Inc. | 5.3 | 4.3 |
HollyFrontier Corp. | 4.9 | 3.6 |
Halliburton Co. | 4.4 | 3.6 |
Ensco International Ltd. ADR | 3.6 | 1.8 |
Hess Corp. | 3.6 | 1.2 |
Marathon Oil Corp. | 3.3 | 4.5 |
| 59.0 | |
Top Industries (% of fund's net assets) |
As of July 31, 2011 |
| Oil, Gas & Consumable Fuels | 62.2% | |
| Energy Equipment & Services | 35.4% | |
| Chemicals | 1.2% | |
| Construction & Engineering | 0.6% | |
| Metals & Mining | 0.6% | |
 | All Others* | 0.0% | |

As of January 31, 2011 |
| Oil, Gas & Consumable Fuels | 68.1% | |
| Energy Equipment & Services | 27.9% | |
| Chemicals | 1.4% | |
| Construction & Engineering | 1.3% | |
| Metals & Mining | 0.9% | |
| All Others* | 0.4% | |

* Includes short-term investments and net other assets. |
Annual Report
Fidelity Advisor Energy Fund
Investments July 31, 2011
Showing Percentage of Net Assets
Common Stocks - 100.0% |
| Shares | | Value |
CHEMICALS - 1.2% |
Specialty Chemicals - 1.2% |
LyondellBasell Industries NV Class A | 259,310 | | $ 10,232,373 |
CONSTRUCTION & ENGINEERING - 0.6% |
Construction & Engineering - 0.6% |
Jacobs Engineering Group, Inc. (a) | 121,124 | | 4,740,793 |
ENERGY EQUIPMENT & SERVICES - 35.4% |
Oil & Gas Drilling - 10.5% |
Discovery Offshore S.A. (a)(e) | 341,100 | | 633,497 |
Ensco International Ltd. ADR | 573,740 | | 30,551,655 |
Nabors Industries Ltd. (a) | 430,000 | | 11,356,300 |
Noble Corp. | 309,264 | | 11,402,564 |
Northern Offshore Ltd. | 405,087 | | 801,236 |
Ocean Rig UDW, Inc. (a) | 206,500 | | 3,489,990 |
Parker Drilling Co. (a) | 475,740 | | 3,016,192 |
Patterson-UTI Energy, Inc. | 358,000 | | 11,645,740 |
Rowan Companies, Inc. (a) | 284,000 | | 11,124,280 |
Transocean Ltd. (United States) | 101,854 | | 6,270,132 |
| | 90,291,586 |
Oil & Gas Equipment & Services - 24.9% |
Aker Drilling ASA (a) | 106,000 | | 322,859 |
Baker Hughes, Inc. | 589,007 | | 45,577,362 |
Basic Energy Services, Inc. (a) | 65,690 | | 2,127,699 |
Cal Dive International, Inc. (a) | 191,730 | | 1,069,853 |
Cameron International Corp. (a) | 69,144 | | 3,867,915 |
Compagnie Generale de Geophysique SA (a) | 129,978 | | 4,364,768 |
Dresser-Rand Group, Inc. (a) | 63,300 | | 3,381,486 |
Halliburton Co. | 685,931 | | 37,541,004 |
ION Geophysical Corp. (a) | 90,100 | | 913,614 |
Key Energy Services, Inc. (a) | 235,100 | | 4,582,099 |
National Oilwell Varco, Inc. | 315,695 | | 25,435,546 |
Oil States International, Inc. (a) | 118,650 | | 9,575,055 |
RPC, Inc. (d) | 37,500 | | 885,750 |
Schlumberger Ltd. | 675,532 | | 61,047,827 |
Schoeller-Bleckmann Oilfield Equipment AG | 24,838 | | 2,425,032 |
Superior Energy Services, Inc. (a) | 68,784 | | 2,853,848 |
Weatherford International Ltd. (a) | 306,829 | | 6,725,692 |
Willbros Group, Inc. (a) | 155,153 | | 1,427,408 |
| | 214,124,817 |
TOTAL ENERGY EQUIPMENT & SERVICES | | 304,416,403 |
METALS & MINING - 0.6% |
Diversified Metals & Mining - 0.6% |
Grande Cache Coal Corp. (a) | 105,069 | | 958,972 |
Walter Energy, Inc. | 34,135 | | 4,183,927 |
| | 5,142,899 |
|
| Shares | | Value |
OIL, GAS & CONSUMABLE FUELS - 62.2% |
Coal & Consumable Fuels - 2.4% |
Alpha Natural Resources, Inc. (a) | 440,111 | | $ 18,797,141 |
Peabody Energy Corp. | 27,905 | | 1,603,700 |
| | 20,400,841 |
Integrated Oil & Gas - 32.5% |
Chevron Corp. | 912,732 | | 94,942,381 |
Ecopetrol SA ADR (d) | 104,300 | | 4,406,675 |
Exxon Mobil Corp. | 1,124,801 | | 89,747,872 |
Hess Corp. | 445,345 | | 30,532,853 |
Occidental Petroleum Corp. | 467,984 | | 45,946,669 |
Royal Dutch Shell PLC Class A sponsored ADR | 186,800 | | 13,741,008 |
| | 279,317,458 |
Oil & Gas Exploration & Production - 14.7% |
Anadarko Petroleum Corp. | 87,258 | | 7,204,020 |
Apache Corp. | 114,439 | | 14,158,393 |
Bankers Petroleum Ltd. (a) | 419,800 | | 2,636,383 |
Berry Petroleum Co. Class A | 119,345 | | 6,844,436 |
Brigham Exploration Co. (a) | 58,800 | | 1,869,840 |
Carrizo Oil & Gas, Inc. (a) | 50,700 | | 1,946,880 |
Cimarex Energy Co. | 33,432 | | 2,946,028 |
Clayton Williams Energy, Inc. (a) | 12,161 | | 806,518 |
Gran Tierra Energy, Inc. (Canada) (a) | 1,091,000 | | 7,605,254 |
Marathon Oil Corp. | 921,626 | | 28,542,757 |
Newfield Exploration Co. (a) | 103,100 | | 6,951,002 |
Niko Resources Ltd. | 14,500 | | 997,273 |
Noble Energy, Inc. | 48,169 | | 4,801,486 |
Northern Oil & Gas, Inc. (a)(d) | 54,747 | | 1,212,099 |
Oasis Petroleum, Inc. (a)(d) | 36,500 | | 1,078,210 |
Pacific Rubiales Energy Corp. | 78,900 | | 2,269,387 |
Painted Pony Petroleum Ltd. Class A (a) | 123,500 | | 1,829,103 |
Petroleum Development Corp. (a) | 47,870 | | 1,738,638 |
Petrominerales Ltd. | 49,372 | | 1,575,108 |
Pioneer Natural Resources Co. | 142,600 | | 13,260,374 |
Stone Energy Corp. (a) | 70,600 | | 2,291,676 |
Talisman Energy, Inc. | 159,500 | | 2,904,857 |
Whiting Petroleum Corp. (a) | 182,080 | | 10,669,888 |
| | 126,139,610 |
Oil & Gas Refining & Marketing - 12.1% |
CVR Energy, Inc. (a) | 351,792 | | 9,445,615 |
HollyFrontier Corp. | 559,450 | | 42,176,936 |
Keyera Corp. | 36,500 | | 1,677,151 |
Marathon Petroleum Corp. | 460,813 | | 20,179,001 |
Tesoro Corp. (a)(d) | 491,500 | | 11,938,535 |
Valero Energy Corp. | 560,225 | | 14,072,852 |
Western Refining, Inc. (a)(d) | 207,134 | | 4,231,748 |
| | 103,721,838 |
Oil & Gas Storage & Transport - 0.5% |
Atlas Energy LP | 19,225 | | 480,817 |
Common Stocks - continued |
| Shares | | Value |
OIL, GAS & CONSUMABLE FUELS - CONTINUED |
Oil & Gas Storage & Transport - continued |
Atlas Pipeline Partners, LP | 41,850 | | $ 1,431,689 |
El Paso Corp. | 131,300 | | 2,698,215 |
| | 4,610,721 |
TOTAL OIL, GAS & CONSUMABLE FUELS | | 534,190,468 |
TOTAL COMMON STOCKS (Cost $732,838,164) | 858,722,936 |
Convertible Bonds - 0.0% |
| Principal
Amount | | |
SEMICONDUCTORS & SEMICONDUCTOR EQUIPMENT - 0.0% |
Semiconductors - 0.0% |
SunPower Corp. 4.75% 4/15/14
(Cost $320,000) | | $ 320,000 | | 332,000 |
Money Market Funds - 2.5% |
| Shares | | |
Fidelity Cash Central Fund, 0.14% (b) | 4,967,940 | | 4,967,940 |
Fidelity Securities Lending Cash Central Fund, 0.15% (b)(c) | 16,669,688 | | 16,669,688 |
TOTAL MONEY MARKET FUNDS (Cost $21,637,628) | 21,637,628 |
TOTAL INVESTMENT PORTFOLIO - 102.5% (Cost $754,795,792) | 880,692,564 |
NET OTHER ASSETS (LIABILITIES) - (2.5)% | | (21,767,323) |
NET ASSETS - 100% | $ 858,925,241 |
Legend |
(a) Non-income producing |
(b) Affiliated fund that is available only to investment companies and other accounts managed by Fidelity Investments. The rate quoted is the annualized seven-day yield of the fund at period end. A complete unaudited listing of the fund's holdings as of its most recent quarter end is available upon request. In addition, each Fidelity Central Fund's financial statements, which are not covered by the Fund's Report of Independent Registered Public Accounting Firm, are available on the SEC's website or upon request. |
(c) Investment made with cash collateral received from securities on loan. |
(d) Security or a portion of the security is on loan at period end. |
(e) Security exempt from registration under Rule 144A of the Securities Act of 1933. These securities may be resold in transactions exempt from registration, normally to qualified institutional buyers. At the end of the period, the value of these securities amounted to $633,497 or 0.1% of net assets. |
Affiliated Central Funds |
Information regarding fiscal year to date income earned by the Fund from investments in Fidelity Central Funds is as follows: |
Fund | Income earned |
Fidelity Cash Central Fund | $ 7,525 |
Fidelity Securities Lending Cash Central Fund | 40,277 |
Total | $ 47,802 |
Other Information |
The following is a summary of the inputs used, as of July 31, 2011, involving the Fund's assets and liabilities carried at fair value. The inputs or methodology used for valuing securities may not be an indication of the risk associated with investing in those securities. For more information on valuation inputs, and their aggregation into the levels used in the table below, please refer to the Security Valuation section in the accompanying Notes to Financial Statements. |
Valuation Inputs at Reporting Date: |
Description | Total | Level 1 | Level 2 | Level 3 |
Investments in Securities: | | | | |
Common Stocks | $ 858,722,936 | $ 854,358,168 | $ 4,364,768 | $ - |
Convertible Bonds | 332,000 | - | 332,000 | - |
Money Market Funds | 21,637,628 | 21,637,628 | - | - |
Total Investments in Securities: | $ 880,692,564 | $ 875,995,796 | $ 4,696,768 | $ - |
Distribution of investments by country of issue, as a percentage of total net assets, is as follows: (Unaudited) |
United States of America | 80.1% |
Curacao | 7.1% |
United Kingdom | 5.2% |
Switzerland | 2.8% |
Canada | 1.7% |
Netherlands | 1.2% |
Others (Individually Less Than 1%) | 1.9% |
| 100.0% |
Income Tax Information |
At July 31, 2011, the Fund had a capital loss carryforward of approximately $5,562,179 of which $2,846,796 and $2,715,383 will expire in fiscal 2017 and 2018, respectively. Capital loss carryforwards are only available to offset future capital gains of the Fund to the extent provided by regulations and may be limited. |
See accompanying notes which are an integral part of the financial statements.
Annual Report
Fidelity Advisor Energy Fund
Statement of Assets and Liabilities
| July 31, 2011 |
| | |
Assets | | |
Investment in securities, at value (including securities loaned of $16,297,784) - See accompanying schedule: Unaffiliated issuers (cost $733,158,164) | $ 859,054,936 | |
Fidelity Central Funds (cost $21,637,628) | 21,637,628 | |
Total Investments (cost $754,795,792) | | $ 880,692,564 |
Receivable for investments sold | | 5,585,316 |
Receivable for fund shares sold | | 973,458 |
Dividends receivable | | 71,847 |
Interest receivable | | 4,433 |
Distributions receivable from Fidelity Central Funds | | 6,558 |
Other receivables | | 18,070 |
Total assets | | 887,352,246 |
| | |
Liabilities | | |
Payable for investments purchased | $ 4,710,220 | |
Payable for fund shares redeemed | 6,041,083 | |
Accrued management fee | 405,646 | |
Distribution and service plan fees payable | 348,741 | |
Other affiliated payables | 211,937 | |
Other payables and accrued expenses | 39,690 | |
Collateral on securities loaned, at value | 16,669,688 | |
Total liabilities | | 28,427,005 |
| | |
Net Assets | | $ 858,925,241 |
Net Assets consist of: | | |
Paid in capital | | $ 747,806,770 |
Accumulated net investment loss | | (187) |
Accumulated undistributed net realized gain (loss) on investments and foreign currency transactions | | (14,776,130) |
Net unrealized appreciation (depreciation) on investments and assets and liabilities in foreign currencies | | 125,894,788 |
Net Assets | | $ 858,925,241 |
Statement of Assets and Liabilities - continued
| July 31, 2011 |
| | |
Calculation of Maximum Offering Price Class A:
Net Asset Value and redemption price per share ($331,120,119 ÷ 8,243,118 shares) | | $ 40.17 |
| | |
Maximum offering price per share (100/94.25 of $40.17) | | $ 42.62 |
Class T:
Net Asset Value and redemption price per share ($290,512,272 ÷ 7,079,193 shares) | | $ 41.04 |
| | |
Maximum offering price per share (100/96.50 of $41.04) | | $ 42.53 |
Class B:
Net Asset Value and offering price per share ($49,792,786 ÷ 1,323,997 shares)A | | $ 37.61 |
| | |
Class C:
Net Asset Value and offering price per share ($133,476,323 ÷ 3,523,472 shares)A | | $ 37.88 |
| | |
Institutional Class:
Net Asset Value, offering price and redemption price per share ($54,023,741 ÷ 1,287,811 shares) | | $ 41.95 |
A Redemption price per share is equal to net asset value less any applicable contingent deferred sales charge.
See accompanying notes which are an integral part of the financial statements.
Annual Report
Statement of Operations
| Year ended July 31, 2011 |
| | |
Investment Income | | |
Dividends | | $ 11,113,867 |
Interest | | 15,257 |
Income from Fidelity Central Funds | | 47,802 |
Total income | | 11,176,926 |
| | |
Expenses | | |
Management fee | $ 4,280,185 | |
Transfer agent fees | 2,101,474 | |
Distribution and service plan fees | 3,754,396 | |
Accounting and security lending fees | 271,534 | |
Custodian fees and expenses | 32,003 | |
Independent trustees' compensation | 4,063 | |
Registration fees | 100,812 | |
Audit | 49,308 | |
Legal | 3,000 | |
Interest | 56 | |
Miscellaneous | 6,189 | |
Total expenses before reductions | 10,603,020 | |
Expense reductions | (35,967) | 10,567,053 |
Net investment income (loss) | | 609,873 |
Realized and Unrealized Gain (Loss) Net realized gain (loss) on: | | |
Investment securities: | | |
Unaffiliated issuers | 108,235,066 | |
Foreign currency transactions | 22,623 | |
Total net realized gain (loss) | | 108,257,689 |
Change in net unrealized appreciation (depreciation) on: Investment securities | 148,374,883 | |
Assets and liabilities in foreign currencies | 32 | |
Total change in net unrealized appreciation (depreciation) | | 148,374,915 |
Net gain (loss) | | 256,632,604 |
Net increase (decrease) in net assets resulting from operations | | $ 257,242,477 |
Statement of Changes in Net Assets
| Year ended
July 31,
2011 | Year ended
July 31,
2010 |
Increase (Decrease) in Net Assets | | |
Operations | | |
Net investment income (loss) | $ 609,873 | $ (2,588,877) |
Net realized gain (loss) | 108,257,689 | 85,218,986 |
Change in net unrealized appreciation (depreciation) | 148,374,915 | (40,712,055) |
Net increase (decrease) in net assets resulting from operations | 257,242,477 | 41,918,054 |
Distributions to shareholders from net investment income | (1,542,989) | - |
Share transactions - net increase (decrease) | 7,476,541 | (40,286,664) |
Redemption fees | 27,523 | 43,053 |
Total increase (decrease) in net assets | 263,203,552 | 1,674,443 |
| | |
Net Assets | | |
Beginning of period | 595,721,689 | 594,047,246 |
End of period (including accumulated net investment loss of $187 and accumulated net investment loss of $116, respectively) | $ 858,925,241 | $ 595,721,689 |
See accompanying notes which are an integral part of the financial statements.
Annual Report
Financial Highlights - Class A
Years ended July 31, | 2011 | 2010 | 2009 | 2008 | 2007 |
Selected Per-Share Data | | | | | |
Net asset value, beginning of period | $ 27.70 | $ 25.82 | $ 50.24 | $ 48.28 | $ 46.39 |
Income from Investment Operations | | | | | |
Net investment income (loss) C | .11 | (.05) | (.04) | (.17) | (.02) F |
Net realized and unrealized gain (loss) | 12.47 | 1.93 | (17.48) | 5.59 | 8.42 |
Total from investment operations | 12.58 | 1.88 | (17.52) | 5.42 | 8.40 |
Distributions from net investment income | (.11) | - | - | - | - |
Distributions from net realized gain | - | - | (6.90) | (3.46) | (6.51) |
Total distributions | (.11) | - | (6.90) | (3.46) | (6.51) |
Redemption fees added to paid in capital C, H | - | - | - | - | - |
Net asset value, end of period | $ 40.17 | $ 27.70 | $ 25.82 | $ 50.24 | $ 48.28 |
Total Return A, B | 45.46% | 7.28% | (38.86)% | 11.52% | 22.08% |
Ratios to Average Net Assets D, G | | | | | |
Expenses before reductions | 1.16% | 1.20% | 1.22% | 1.14% | 1.19% |
Expenses net of fee waivers, if any | 1.16% | 1.20% | 1.22% | 1.14% | 1.19% |
Expenses net of all reductions | 1.16% | 1.19% | 1.21% | 1.14% | 1.19% |
Net investment income (loss) | .30% | (.16)% | (.14)% | (.32)% | (.05)% F |
Supplemental Data | | | | | |
Net assets, end of period (000 omitted) | $ 331,120 | $ 214,407 | $ 216,595 | $ 355,200 | $ 268,108 |
Portfolio turnover rate E | 91% | 103% | 148% | 90% | 80% |
A Total returns would have been lower if certain expenses had not been reduced during the applicable periods shown.
B Total returns do not include the effect of the sales charges.
C Calculated based on average shares outstanding during the period.
D Fees and expenses of any underlying Fidelity Central Funds are not included in the Fund's expense ratio. The Fund indirectly bears its proportionate share of the expenses of any underlying Fidelity Central Funds.
E Amount does not include the portfolio activity of any underlying Fidelity Central Funds.
F Investment income per share reflects a special dividend which amounted to $.05 per share. Excluding the special dividend, the ratio of net investment income (loss) to average net assets would have been (.17)%.
G Expense ratios reflect operating expenses of the class. Expenses before reductions do not reflect amounts reimbursed by the investment adviser or reductions from brokerage service arrangements or reductions from other expense offset arrangements and do not represent the amount paid by the class during periods when reimbursements or reductions occur. Expenses net of fee waivers reflect expenses after reimbursement by the investment adviser but prior to reductions from brokerage service arrangements or other expense offset arrangements. Expenses net of all reductions represent the net expenses paid by the class.
H Amount represents less than $.01 per share.
Financial Highlights - Class T
Years ended July 31, | 2011 | 2010 | 2009 | 2008 | 2007 |
Selected Per-Share Data | | | | | |
Net asset value, beginning of period | $ 28.33 | $ 26.47 | $ 51.40 | $ 49.26 | $ 47.18 |
Income from Investment Operations | | | | | |
Net investment income (loss) C | .03 | (.11) | (.10) | (.29) | (.11) F |
Net realized and unrealized gain (loss) | 12.75 | 1.97 | (17.93) | 5.72 | 8.61 |
Total from investment operations | 12.78 | 1.86 | (18.03) | 5.43 | 8.50 |
Distributions from net investment income | (.07) | - | - | - | - |
Distributions from net realized gain | - | - | (6.90) | (3.29) | (6.42) |
Total distributions | (.07) | - | (6.90) | (3.29) | (6.42) |
Redemption fees added to paid in capital C, H | - | - | - | - | - |
Net asset value, end of period | $ 41.04 | $ 28.33 | $ 26.47 | $ 51.40 | $ 49.26 |
Total Return A, B | 45.16% | 7.03% | (38.99)% | 11.27% | 21.84% |
Ratios to Average Net Assets D, G | | | | | |
Expenses before reductions | 1.37% | 1.41% | 1.45% | 1.36% | 1.40% |
Expenses net of fee waivers, if any | 1.37% | 1.41% | 1.45% | 1.36% | 1.40% |
Expenses net of all reductions | 1.37% | 1.41% | 1.45% | 1.35% | 1.39% |
Net investment income (loss) | .09% | (.37)% | (.38)% | (.54)% | (.26)% F |
Supplemental Data | | | | | |
Net assets, end of period (000 omitted) | $ 290,512 | $ 219,051 | $ 224,376 | $ 407,784 | $ 382,222 |
Portfolio turnover rate E | 91% | 103% | 148% | 90% | 80% |
A Total returns would have been lower if certain expenses had not been reduced during the applicable periods shown.
B Total returns do not include the effect of the sales charges.
C Calculated based on average shares outstanding during the period.
D Fees and expenses of any underlying Fidelity Central Funds are not included in the Fund's expense ratio. The Fund indirectly bears its proportionate share of the expenses of any underlying Fidelity Central Funds.
E Amount does not include the portfolio activity of any underlying Fidelity Central Funds.
F Investment income per share reflects a special dividend which amounted to $.05 per share. Excluding the special dividend, the ratio of net investment income (loss) to average net assets would have been (.37)%.
G Expense ratios reflect operating expenses of the class. Expenses before reductions do not reflect amounts reimbursed by the investment adviser or reductions from brokerage service arrangements or reductions from other expense offset arrangements and do not represent the amount paid by the class during periods when reimbursements or reductions occur. Expenses net of fee waivers reflect expenses after reimbursement by the investment adviser but prior to reductions from brokerage service arrangements or other expense offset arrangements. Expenses net of all reductions represent the net expenses paid by the class.
H Amount represents less than $.01 per share.
See accompanying notes which are an integral part of the financial statements.
Annual Report
Financial Highlights - Class B
Years ended July 31, | 2011 | 2010 | 2009 | 2008 | 2007 |
Selected Per-Share Data | | | | | |
Net asset value, beginning of period | $ 26.06 | $ 24.48 | $ 48.35 | $ 46.64 | $ 45.10 |
Income from Investment Operations | | | | | |
Net investment income (loss) C | (.15) | (.25) | (.22) | (.56) | (.34) F |
Net realized and unrealized gain (loss) | 11.71 | 1.83 | (16.75) | 5.41 | 8.17 |
Total from investment operations | 11.56 | 1.58 | (16.97) | 4.85 | 7.83 |
Distributions from net investment income | (.01) | - | - | - | - |
Distributions from net realized gain | - | - | (6.90) | (3.14) | (6.29) |
Total distributions | (.01) | - | (6.90) | (3.14) | (6.29) |
Redemption fees added to paid in capital C, H | - | - | - | - | - |
Net asset value, end of period | $ 37.61 | $ 26.06 | $ 24.48 | $ 48.35 | $ 46.64 |
Total Return A, B | 44.38% | 6.45% | (39.31)% | 10.62% | 21.18% |
Ratios to Average Net Assets D, G | | | | | |
Expenses before reductions | 1.93% | 1.96% | 1.96% | 1.93% | 1.96% |
Expenses net of fee waivers, if any | 1.93% | 1.96% | 1.96% | 1.93% | 1.96% |
Expenses net of all reductions | 1.92% | 1.95% | 1.96% | 1.93% | 1.95% |
Net investment income (loss) | (.46)% | (.92)% | (.89)% | (1.11)% | (.82)% F |
Supplemental Data | | | | | |
Net assets, end of period (000 omitted) | $ 49,793 | $ 44,330 | $ 47,795 | $ 98,602 | $ 116,487 |
Portfolio turnover rate E | 91% | 103% | 148% | 90% | 80% |
A Total returns would have been lower if certain expenses had not been reduced during the applicable periods shown.
B Total returns do not include the effect of the contingent deferred sales charge.
C Calculated based on average shares outstanding during the period.
D Fees and expenses of any underlying Fidelity Central Funds are not included in the Fund's expense ratio. The Fund indirectly bears its proportionate share of the expenses of any underlying Fidelity Central Funds.
E Amount does not include the portfolio activity of any underlying Fidelity Central Funds.
F Investment income per share reflects a special dividend which amounted to $.05 per share. Excluding the special dividend, the ratio of net investment income (loss) to average net assets would have been (.93)%.
G Expense ratios reflect operating expenses of the class. Expenses before reductions do not reflect amounts reimbursed by the investment adviser or reductions from brokerage service arrangements or reductions from other expense offset arrangements and do not represent the amount paid by the class during periods when reimbursements or reductions occur. Expenses net of fee waivers reflect expenses after reimbursement by the investment adviser but prior to reductions from brokerage service arrangements or other expense offset arrangements. Expenses net of all reductions represent the net expenses paid by the class.
H Amount represents less than $.01 per share.
Financial Highlights - Class C
Years ended July 31, | 2011 | 2010 | 2009 | 2008 | 2007 |
Selected Per-Share Data | | | | | |
Net asset value, beginning of period | $ 26.25 | $ 24.65 | $ 48.63 | $ 46.88 | $ 45.33 |
Income from Investment Operations | | | | | |
Net investment income (loss) C | (.15) | (.25) | (.21) | (.54) | (.32) F |
Net realized and unrealized gain (loss) | 11.80 | 1.85 | (16.87) | 5.45 | 8.20 |
Total from investment operations | 11.65 | 1.60 | (17.08) | 4.91 | 7.88 |
Distributions from net investment income | (.02) | - | - | - | - |
Distributions from net realized gain | - | - | (6.90) | (3.16) | (6.33) |
Total distributions | (.02) | - | (6.90) | (3.16) | (6.33) |
Redemption fees added to paid in capital C, H | - | - | - | - | - |
Net asset value, end of period | $ 37.88 | $ 26.25 | $ 24.65 | $ 48.63 | $ 46.88 |
Total Return A, B | 44.38% | 6.49% | (39.31)% | 10.71% | 21.22% |
Ratios to Average Net Assets D, G | | | | | |
Expenses before reductions | 1.90% | 1.94% | 1.96% | 1.87% | 1.91% |
Expenses net of fee waivers, if any | 1.90% | 1.94% | 1.96% | 1.87% | 1.91% |
Expenses net of all reductions | 1.89% | 1.93% | 1.95% | 1.87% | 1.91% |
Net investment income (loss) | (.43)% | (.90)% | (.88)% | (1.05)% | (.77)% F |
Supplemental Data | | | | | |
Net assets, end of period (000 omitted) | $ 133,476 | $ 90,596 | $ 86,650 | $ 156,393 | $ 135,072 |
Portfolio turnover rate E | 91% | 103% | 148% | 90% | 80% |
A Total returns would have been lower if certain expenses had not been reduced during the applicable periods shown.
B Total returns do not include the effect of the contingent deferred sales charge.
C Calculated based on average shares outstanding during the period.
D Fees and expenses of any underlying Fidelity Central Funds are not included in the Fund's expense ratio. The Fund indirectly bears its proportionate share of the expenses of any underlying Fidelity Central Funds.
E Amount does not include the portfolio activity of any underlying Fidelity Central Funds.
F Investment income per share reflects a special dividend which amounted to $.05 per share. Excluding the special dividend, the ratio of net investment income (loss) to average net assets would have been (.88)%.
G Expense ratios reflect operating expenses of the class. Expenses before reductions do not reflect amounts reimbursed by the investment adviser or reductions from brokerage service arrangements or reductions from other expense offset arrangements and do not represent the amount paid by the class during periods when reimbursements or reductions occur. Expenses net of fee waivers reflect expenses after reimbursement by the investment adviser but prior to reductions from brokerage service arrangements or other expense offset arrangements. Expenses net of all reductions represent the net expenses paid by the class.
H Amount represents less than $.01 per share.
See accompanying notes which are an integral part of the financial statements.
Annual Report
Financial Highlights - Institutional Class
Years ended July 31, | 2011 | 2010 | 2009 | 2008 | 2007 |
Selected Per-Share Data | | | | | |
Net asset value, beginning of period | $ 28.87 | $ 26.83 | $ 51.76 | $ 49.68 | $ 47.48 |
Income from Investment Operations | | | | | |
Net investment income (loss) B | .23 | .04 | .03 | (.02) | .11 E |
Net realized and unrealized gain (loss) | 12.99 | 2.00 | (18.06) | 5.74 | 8.67 |
Total from investment operations | 13.22 | 2.04 | (18.03) | 5.72 | 8.78 |
Distributions from net investment income | (.14) | - | - | - | - |
Distributions from net realized gain | - | - | (6.90) | (3.64) | (6.58) |
Total distributions | (.14) | - | (6.90) | (3.64) | (6.58) |
Redemption fees added to paid in capital B, G | - | - | - | - | - |
Net asset value, end of period | $ 41.95 | $ 28.87 | $ 26.83 | $ 51.76 | $ 49.68 |
Total Return A | 45.87% | 7.60% | (38.68)% | 11.83% | 22.47% |
Ratios to Average Net Assets C, F | | | | | |
Expenses before reductions | .86% | .90% | .95% | .85% | .88% |
Expenses net of fee waivers, if any | .86% | .90% | .95% | .85% | .88% |
Expenses net of all reductions | .85% | .90% | .94% | .85% | .88% |
Net investment income (loss) | .60% | .14% | .13% | (.03)% | .25% E |
Supplemental Data | | | | | |
Net assets, end of period (000 omitted) | $ 54,024 | $ 27,338 | $ 18,631 | $ 22,250 | $ 17,127 |
Portfolio turnover rate D | 91% | 103% | 148% | 90% | 80% |
A Total returns would have been lower if certain expenses had not been reduced during the applicable periods shown.
B Calculated based on average shares outstanding during the period.
C Fees and expenses of any underlying Fidelity Central Funds are not included in the Fund's expense ratio. The Fund indirectly bears its proportionate share of the expenses of any underlying Fidelity Central Funds.
D Amount does not include the portfolio activity of any underlying Fidelity Central Funds.
E Investment income per share reflects a special dividend which amounted to $.05 per share. Excluding the special dividend, the ratio of net investment income (loss) to average net assets would have been .14%.
F Expense ratios reflect operating expenses of the class. Expenses before reductions do not reflect amounts reimbursed by the investment adviser or reductions from brokerage service arrangements or reductions from other expense offset arrangements and do not represent the amount paid by the class during periods when reimbursements or reductions occur. Expenses net of fee waivers reflect expenses after reimbursement by the investment adviser but prior to reductions from brokerage service arrangements or other expense offset arrangements. Expenses net of all reductions represent the net expenses paid by the class.
G Amount represents less than $.01 per share.
See accompanying notes which are an integral part of the financial statements.
Annual Report
Notes to Financial Statements
For the period ended July 31, 2011
1. Organization.
Fidelity Advisor Energy Fund (the Fund) is a non-diversified fund of Fidelity Advisor Series VII (the Trust) and is authorized to issue an unlimited number of shares. The Trust is registered under the Investment Company Act of 1940, as amended (the 1940 Act), as an open-end management investment company organized as a Massachusetts business trust. The Fund offers Class A, Class T, Class C and Institutional Class shares, each of which, along with Class B shares, has equal rights as to assets and voting privileges. Effective after the close of business on September 1, 2010, Class B shares were closed to new accounts and additional purchases, except for exchanges and reinvestments, by existing shareholders. Each class has exclusive voting rights with respect to matters that affect that class. Class B shares will automatically convert to Class A shares after a holding period of seven years from the initial date of purchase. Investment income, realized and unrealized capital gains and losses, the common expenses of the Fund, and certain fund-level expense reductions, if any, are allocated on a pro-rata basis to each class based on the relative net assets of each class to the total net assets of the Fund. Each class differs with respect to transfer agent and distribution and service plan fees incurred. Certain expense reductions may also differ by class.
2. Investments in Fidelity Central Funds.
The Fund invests in Fidelity Central Funds, which are open-end investment companies available only to other investment companies and accounts managed by Fidelity Management & Research Company (FMR) and its affiliates. The Fund's Schedule of Investments lists each of the Fidelity Central Funds held as of period end, if any, as an investment of the Fund, but does not include the underlying holdings of each Fidelity Central Fund. As an Investing Fund, the Fund indirectly bears its proportionate share of the expenses of the underlying Fidelity Central Funds.
The Money Market Central Funds seek preservation of capital and current income and are managed by Fidelity Investments Money Management, Inc. (FIMM), an affiliate of FMR.
A complete unaudited list of holdings for each Fidelity Central Fund is available upon request or at the Securities and Exchange Commission (the SEC) web site at www.sec.gov. In addition, the financial statements of the Fidelity Central Funds, which are not covered by the Fund's Report of Independent Registered Public Accounting Firm, are available on the SEC web site or upon request.
3. Significant Accounting Policies.
The financial statements have been prepared in conformity with accounting principles generally accepted in the United States of America (GAAP), which require management to make certain estimates and assumptions at the date of the financial statements. Actual results could differ from those estimates. Subsequent events, if any, through the date that the financial statements were issued have been evaluated in the preparation of the financial statements. The following summarizes the significant accounting policies of the Fund:
Security Valuation. Investments are valued as of 4:00 p.m. Eastern time on the last calendar day of the period. The Fund uses independent pricing services approved by the Board of Trustees to value its investments. When current market prices or quotations are not readily available or reliable, valuations may be determined in good faith in accordance with procedures adopted by the Board of Trustees. Factors used in determining value may include market or security specific events, changes in interest rates and credit quality. The frequency with which these procedures are used cannot be predicted and they may be utilized to a significant extent. The value used for net asset value (NAV) calculation under these procedures may differ from published prices for the same securities.
The Fund categorizes the inputs to valuation techniques used to value its investments into a disclosure hierarchy consisting of three levels as shown below:
Level 1 - quoted prices in active markets for identical investments
Level 2 - other significant observable inputs (including quoted prices for similar investments, interest rates, prepayment speeds, etc.)
Level 3 - unobservable inputs (including the Fund's own assumptions based on the best information available)
Changes in valuation techniques may result in transfers in or out of an assigned level within the disclosure hierarchy. The aggregate value of investments by input level, as of July 31, 2011, is included at the end of the Fund's Schedule of Investments. Valuation techniques used to value the Fund's investments by major category are as follows:
Equity securities, including restricted securities, for which market quotations are readily available, are valued at the last reported sale price or official closing price as reported by an independent pricing service on the primary market or exchange on which they are traded and are categorized as Level 1 in the hierarchy. In the event there were no sales during the day or closing prices are not available, securities are valued at the last quoted bid price or may be valued using the last available price and are generally categorized as Level 2 in the hierarchy. For foreign equity securities, when significant market or security specific events arise, comparisons to the valuation of American Depositary Receipts (ADRs), futures contracts, Exchange-traded funds (ETFs) and certain indexes as well as quoted prices for similar securities are used and are categorized as Level 2 in the hierarchy in these
Annual Report
3. Significant Accounting Policies - continued
Security Valuation - continued
circumstances. Utilizing these techniques may result in transfers between Level 1 and Level 2. For restricted equity securities and private placements where observable inputs are limited, assumptions about market activity and risk are used and are categorized as Level 3 in the hierarchy.
Debt securities, including restricted securities, are valued based on evaluated prices received from independent pricing services or from dealers who make markets in such securities. For corporate bonds, pricing services utilize matrix pricing which considers yield or price of bonds of comparable quality, coupon, maturity and type as well as dealer supplied prices and are generally categorized as Level 2 in the hierarchy. When independent prices are unavailable or unreliable, debt securities may be valued utilizing pricing matrices which consider similar factors that would be used by independent pricing services. These are generally categorized as Level 2 in the hierarchy but may be Level 3 depending on the circumstances.
Investments in open-end mutual funds, including the Fidelity Central Funds, are valued at their closing net asset value each business day and are categorized as Level 1 in the hierarchy.
Foreign Currency. The Fund may use foreign currency contracts to facilitate transactions in foreign-denominated securities. Gains and losses from these transactions may arise from changes in the value of the foreign currency or if the counterparties do not perform under the contracts' terms.
Foreign-denominated assets, including investment securities, and liabilities are translated into U.S. dollars at the exchange rate at period end. Purchases and sales of investment securities, income and dividends received and expenses denominated in foreign currencies are translated into U.S. dollars at the exchange rate in effect on the transaction date.
The effects of exchange rate fluctuations on investments are included with the net realized and unrealized gain (loss) on investment securities. Other foreign currency transactions resulting in realized and unrealized gain (loss) are disclosed separately.
Investment Transactions and Income. For financial reporting purposes, the Fund's investment holdings and NAV include trades executed through the end of the last business day of the period. The NAV per share for processing shareholder transactions is calculated as of the close of business of the New York Stock Exchange (NYSE), normally 4:00 p.m. Eastern time and includes trades executed through the end of the prior business day. Gains and losses on securities sold are determined on the basis of identified cost and may include proceeds received from litigation. Dividend income is recorded on the ex-dividend date, except for certain dividends from foreign securities where the ex-dividend date may have passed, which are recorded as soon as the Fund is informed of the ex-dividend date. Non-cash dividends included in dividend income, if any, are recorded at the fair market value of the securities received. Distributions received on securities that represent a return of capital or capital gain are recorded as a reduction of cost of investments and/or as a realized gain. The Fund estimates the components of distributions received that may be considered return of capital distributions or capital gain distributions. Interest income and distributions from the Fidelity Central Funds are accrued as earned. Interest income includes coupon interest and amortization of premium and accretion of discount on debt securities. Investment income is recorded net of foreign taxes withheld where recovery of such taxes is uncertain.
Expenses. Expenses directly attributable to a fund are charged to that fund. Expenses attributable to more than one fund are allocated among the respective funds on the basis of relative net assets or other appropriate methods. Expense estimates are accrued in the period to which they relate and adjustments are made when actual amounts are known.
Income Tax Information and Distributions to Shareholders. Each year, the Fund intends to qualify as a regulated investment company, including distributing substantially all of its taxable income and realized gains under Subchapter M of the Internal Revenue Code and filing its U.S. federal tax return. As a result, no provision for income taxes is required. As of July 31, 2011, the Fund did not have any unrecognized tax benefits in the financial statements. A fund's federal tax return is subject to examination by the Internal Revenue Service (IRS) for a period of three years. Foreign taxes are provided for based on the Fund's understanding of the tax rules and rates that exist in the foreign markets in which it invests.
Distributions are declared and recorded on the ex-dividend date. Income dividends and capital gain distributions are declared separately for each class. Income and capital gain distributions are determined in accordance with income tax regulations, which may differ from GAAP.
Capital accounts within the financial statements are adjusted for permanent book-tax differences. These adjustments have no impact on net assets or the results of operations. Temporary book-tax differences will reverse in a subsequent period.
Book-tax differences are primarily due to foreign currency transactions, deferred trustees compensation, passive foreign investment companies (PFIC), capital loss carryforwards, and losses deferred due to wash sales.
Annual Report
Notes to Financial Statements - continued
3. Significant Accounting Policies - continued
Income Tax Information and Distributions to Shareholders - continued
The federal tax cost of investment securities and unrealized appreciation (depreciation) as of period end were as follows:
Gross unrealized appreciation | $ 145,517,723 |
Gross unrealized depreciation | (28,834,902) |
Net unrealized appreciation (depreciation) on securities and other investments | $ 116,682,821 |
| |
Tax Cost | $ 764,009,743 |
The tax-based components of distributable earnings as of period end were as follows:
Capital loss carryforward | $ (5,562,179) |
Net unrealized appreciation (depreciation) | $ 116,680,837 |
Under the recently enacted Regulated Investment Company Modernization Act of 2010 (the Act), the Fund will be permitted to carry forward capital losses incurred in taxable years beginning after December 22, 2010 for an unlimited period. However, any losses incurred during those future taxable years will be required to be utilized prior to any losses incurred in pre-enactment taxable years, which generally expire after eight years from when they are incurred. Additionally, post-enactment capital losses that are carried forward will retain their character as either short-term or long-term capital losses rather than being considered all short-term as under previous law. The Fund's first fiscal year end subject to the Act will be July 31, 2012.
The tax character of distributions paid was as follows:
| July 31, 2011 | July 31, 2010 |
Ordinary Income | $ 1,542,989 | $ - |
Short-Term Trading (Redemption) Fees. Shares held by investors in the Fund less than 30 days are subject to a redemption fee equal to .75% of the net asset value of shares redeemed. All redemption fees, which reduce the proceeds of the shareholder redemption, are retained by the Fund and accounted for as an addition to paid in capital.
New Accounting Pronouncement. In May 2011, the Financial Accounting Standards Board issued Accounting Standard Update No. 2011-04, Fair Value Measurement (Topic 820) - Amendments to Achieve Common Fair Value Measurement and Disclosure Requirements in U.S. GAAP and IFRSs. The update changes the wording used to describe the requirements in GAAP for measuring fair value and for disclosing information about fair value measurements. The update is effective during interim and annual periods beginning after December 15, 2011. Management is currently evaluating the impact of the update's adoption on the Fund's financial statement disclosures.
4. Operating Policies.
Restricted Securities. The Fund may invest in securities that are subject to legal or contractual restrictions on resale. These securities generally may be resold in transactions exempt from registration or to the public if the securities are registered. Disposal of these securities may involve time-consuming negotiations and expense, and prompt sale at an acceptable price may be difficult. Information regarding restricted securities is included at the end of the Fund's Schedule of Investments.
5. Purchases and Sales of Investments.
Purchases and sales of securities, other than short-term securities, aggregated $711,469,261 and $701,277,867, respectively.
6. Fees and Other Transactions with Affiliates.
Management Fee. FMR and its affiliates provide the Fund with investment management related services for which the Fund pays a monthly management fee. The management fee is the sum of an individual fund fee rate that is based on an annual rate of .30% of the Fund's average net assets and a group fee rate that averaged .26% during the period. The group fee rate is based upon the average net assets of all the mutual funds advised by FMR. The group fee rate decreases as assets under management increase and increases as assets under management decrease. For the period, the total annual management fee rate was .56% of the Fund's average net assets.
Annual Report
6. Fees and Other Transactions with Affiliates - continued
Distribution and Service Plan Fees. In accordance with Rule 12b-1 of the 1940 Act, the Fund has adopted separate Distribution and Service Plans for each class of shares. Certain classes pay Fidelity Distributors Corporation (FDC), an affiliate of FMR, separate Distribution and Service Fees, each of which is based on an annual percentage of each class' average net assets. In addition, FDC may pay financial intermediaries for selling shares of the Fund and providing shareholder support services. For the period, the Distribution and Service Fee rates, total fees and amounts retained by FDC were as follows:
| Distribution
Fee | Service
Fee | Total Fees | Retained
by FDC |
Class A | -% | .25% | $ 712,364 | $ 22,409 |
Class T | .25% | .25% | 1,360,694 | 7,336 |
Class B | .75% | .25% | 503,774 | 378,494 |
Class C | .75% | .25% | 1,177,564 | 188,887 |
| | | $ 3,754,396 | $ 597,126 |
Sales Load. FDC may receive a front-end sales charge of up to 5.75% for selling Class A shares, and 3.50% for selling Class T shares, some of which is paid to financial intermediaries for selling shares of the Fund. Depending on the holding period, FDC may receive contingent deferred sales charges levied on Class A, Class T, Class B, and Class C redemptions. The deferred sales charges range from 5% to 1% for Class B, 1% for Class C, 1.00% for certain purchases of Class A shares and .25% for certain purchases of Class T shares.
For the period, sales charge amounts retained by FDC were as follows:
| Retained
by FDC |
Class A | $ 182,783 |
Class T | 37,886 |
Class B* | 85,822 |
Class C* | 13,898 |
| $ 320,389 |
* When Class B and Class C shares are initially sold, FDC pays commissions from its own resources to financial intermediaries through which the sales are made.
Transfer Agent Fees. Fidelity Investments Institutional Operations Company, Inc. (FIIOC), an affiliate of FMR, is the transfer, dividend disbursing and shareholder servicing agent for each class of the Fund. FIIOC receives account fees and asset-based fees that vary according to the account size and type of account of the shareholders of the respective classes of the Fund. FIIOC pays for typesetting, printing and mailing of shareholder reports, except proxy statements. For the period, transfer agent fees for each class were as follows:
| Amount | % of
Average
Net Assets |
Class A | $ 829,962 | .29 |
Class T | 691,834 | .25 |
Class B | 153,142 | .30 |
Class C | 324,366 | .28 |
Institutional Class | 102,170 | .24 |
| $ 2,101,474 | |
Accounting and Security Lending Fees. Fidelity Service Company, Inc. (FSC), an affiliate of FMR, maintains the Fund's accounting records. The accounting fee is based on the level of average net assets for the month. Under a separate contract, FSC administers the security lending program. The security lending fee is based on the number and duration of lending transactions.
Brokerage Commissions. The Fund placed a portion of its portfolio transactions with brokerage firms which are affiliates of the investment adviser. The commissions paid to these affiliated firms were $5,775 for the period.
Interfund Lending Program. Pursuant to an Exemptive Order issued by the SEC, the Fund, along with other registered investment companies having management contracts with FMR, may participate in an interfund lending program. This program provides an alternative credit facility allowing the funds to borrow from, or lend money to, other participating affiliated funds. At period end, there were no interfund loans outstanding.
Annual Report
Notes to Financial Statements - continued
6. Fees and Other Transactions with Affiliates - continued
Interfund Lending Program - continued
The Fund's activity in this program during the period for which loans were outstanding was as follows:
Borrower or Lender | Average Daily
Loan Balance | Weighted Average
Interest Rate | Interest
Expense |
Borrower | $ 5,222,000 | .39% | $ 56 |
7. Committed Line of Credit.
The Fund participates with other funds managed by FMR or an affiliate in a $4.0 billion credit facility (the "line of credit") to be utilized for temporary or emergency purposes to fund shareholder redemptions or for other short-term liquidity purposes. The Fund has agreed to pay commitment fees on its pro-rata portion of the line of credit, which amounted to $2,459 and is reflected in Miscellaneous expenses on the Statement of Operations. During the period, there were no borrowings on this line of credit.
8. Security Lending.
The Fund lends portfolio securities through a lending agent from time to time in order to earn additional income. The lending agent may loan securities to certain qualified borrowers, including Fidelity Capital Markets (FCM), a broker-dealer affiliated with the Fund. On the settlement date of the loan, the Fund receives collateral (in the form of U.S. Treasury obligations, letters of credit and/or cash) against the loaned securities and maintains collateral in an amount not less than 100% of the market value of the loaned securities during the period of the loan. The market value of the loaned securities is determined at the close of business of the Fund and any additional required collateral is delivered to the Fund on the next business day. If the borrower defaults on its obligation to return the securities loaned because of insolvency or other reasons, a fund could experience delays and costs in recovering the securities loaned or in gaining access to the collateral. Any cash collateral received is invested in the Fidelity Securities Lending Cash Central Fund. The value of loaned securities and cash collateral at period end are disclosed on the Fund's Statement of Assets and Liabilities. Security lending income represents the income earned on investing cash collateral, less rebates paid to borrowers and lending agent fees associated with the loan, plus any premium payments received for lending certain types of securities. Security lending income is presented in the Statement of Operations as a component of income from Fidelity Central Funds. Total security lending income during the period amounted to $40,277. During the period, there were no securities loaned to FCM.
9. Expense Reductions.
Many of the brokers with whom FMR places trades on behalf of the Fund provided services to the Fund in addition to trade execution. These services included payments of certain expenses on behalf of the Fund totaling $35,967 for the period.
10. Distributions to Shareholders.
Distributions to shareholders of each class were as follows:
Years ended July 31, | 2011 | 2010 |
From net investment income | | |
Class A | $ 788,179 | $ - |
Class T | 537,026 | - |
Class B | 21,298 | - |
Class C | 59,062 | - |
Institutional Class | 137,424 | - |
Total | $ 1,542,989 | $ - |
Annual Report
11. Share Transactions.
Transactions for each class of shares were as follows:
| Shares | Dollars |
Years ended July 31, | 2011 | 2010 | 2011 | 2010 |
Class A | | | | |
Shares sold | 2,848,824 | 2,475,060 | $ 108,457,523 | $ 72,154,427 |
Reinvestment of distributions | 20,239 | - | 701,079 | - |
Shares redeemed | (2,366,298) | (3,122,404) | (85,322,989) | (89,993,205) |
Net increase (decrease) | 502,765 | (647,344) | $ 23,835,613 | $ (17,838,778) |
Class T | | | | |
Shares sold | 1,191,543 | 1,265,490 | $ 45,538,389 | $ 38,114,553 |
Reinvestment of distributions | 14,153 | - | 502,257 | - |
Shares redeemed | (1,858,422) | (2,010,804) | (68,540,609) | (59,843,042) |
Net increase (decrease) | (652,726) | (745,314) | $ (22,499,963) | $ (21,728,489) |
Class B | | | | |
Shares sold | 118,268 | 320,063 | $ 4,084,617 | $ 8,832,050 |
Reinvestment of distributions | 560 | - | 18,656 | - |
Shares redeemed | (495,702) | (571,409) | (16,527,555) | (15,635,733) |
Net increase (decrease) | (376,874) | (251,346) | $ (12,424,282) | $ (6,803,683) |
Class C | | | | |
Shares sold | 964,253 | 819,751 | $ 34,720,800 | $ 22,984,733 |
Reinvestment of distributions | 1,513 | - | 50,476 | - |
Shares redeemed | (893,659) | (883,306) | (30,160,985) | (24,290,742) |
Net increase (decrease) | 72,107 | (63,555) | $ 4,610,291 | $ (1,306,009) |
Institutional Class | | | | |
Shares sold | 771,369 | 669,423 | $ 30,606,839 | $ 20,180,428 |
Reinvestment of distributions | 3,300 | - | 119,042 | - |
Shares redeemed | (433,932) | (416,730) | (16,770,999) | (12,790,133) |
Net increase (decrease) | 340,737 | 252,693 | $ 13,954,882 | $ 7,390,295 |
12. Other.
The Fund's organizational documents provide former and current trustees and officers with a limited indemnification against liabilities arising in connection with the performance of their duties to the Fund. In the normal course of business, the Fund may also enter into contracts that provide general indemnifications. The Fund's maximum exposure under these arrangements is unknown as this would be dependent on future claims that may be made against the Fund. The risk of material loss from such claims is considered remote.
Annual Report
Fidelity Advisor Financial Services Fund - Class A, T, B, and C
Performance: The Bottom Line
Average annual total return reflects the change in the value of an investment, assuming reinvestment of the class' distributions from dividend income and capital gains (the profits earned upon the sale of securities that have grown in value, if any) and assuming a constant rate of performance each year. The $10,000 table and the fund's returns do not reflect the deduction of taxes that a shareholder would pay on fund distributions or the redemption of fund shares. During periods of reimbursement by Fidelity, a fund's total return will be greater than it would be had the reimbursement not occurred. How a fund did yesterday is no guarantee of how it will do tomorrow. Returns reflect the conversion of Class B shares to Class A shares after a maximum of seven years.
Average Annual Total Returns
Periods ended July 31, 2011 | Past 1
year | Past 5
years | Past 10
years |
Class A (incl. 5.75% sales charge) | -8.39% | -11.87% | -3.10% |
Class T (incl. 3.50% sales charge) | -6.40% | -11.67% | -3.10% |
Class B (incl. contingent deferred sales charge) A | -8.39% | -11.77% | -3.03% |
Class C (incl. contingent deferred sales charge) B | -4.47% | -11.47% | -3.21% |
A Class B shares' contingent deferred sales charges included in the past one year, past five years, and past ten years total return figures are 5%, 2%, and 0%, respectively.
B Class C shares' contingent deferred sales charges included in the past one year, past five years, and past ten years total return figures are 1%, 0%, and 0%, respectively.
$10,000 Over 10 Years
Let's say hypothetically that $10,000 was invested in Fidelity Advisor Financial Services Fund - Class A on July 31, 2001, and the current 5.75% sales charge was paid. The chart shows how the value of your investment would have changed, and also shows how the S&P 500 Index performed over the same period.
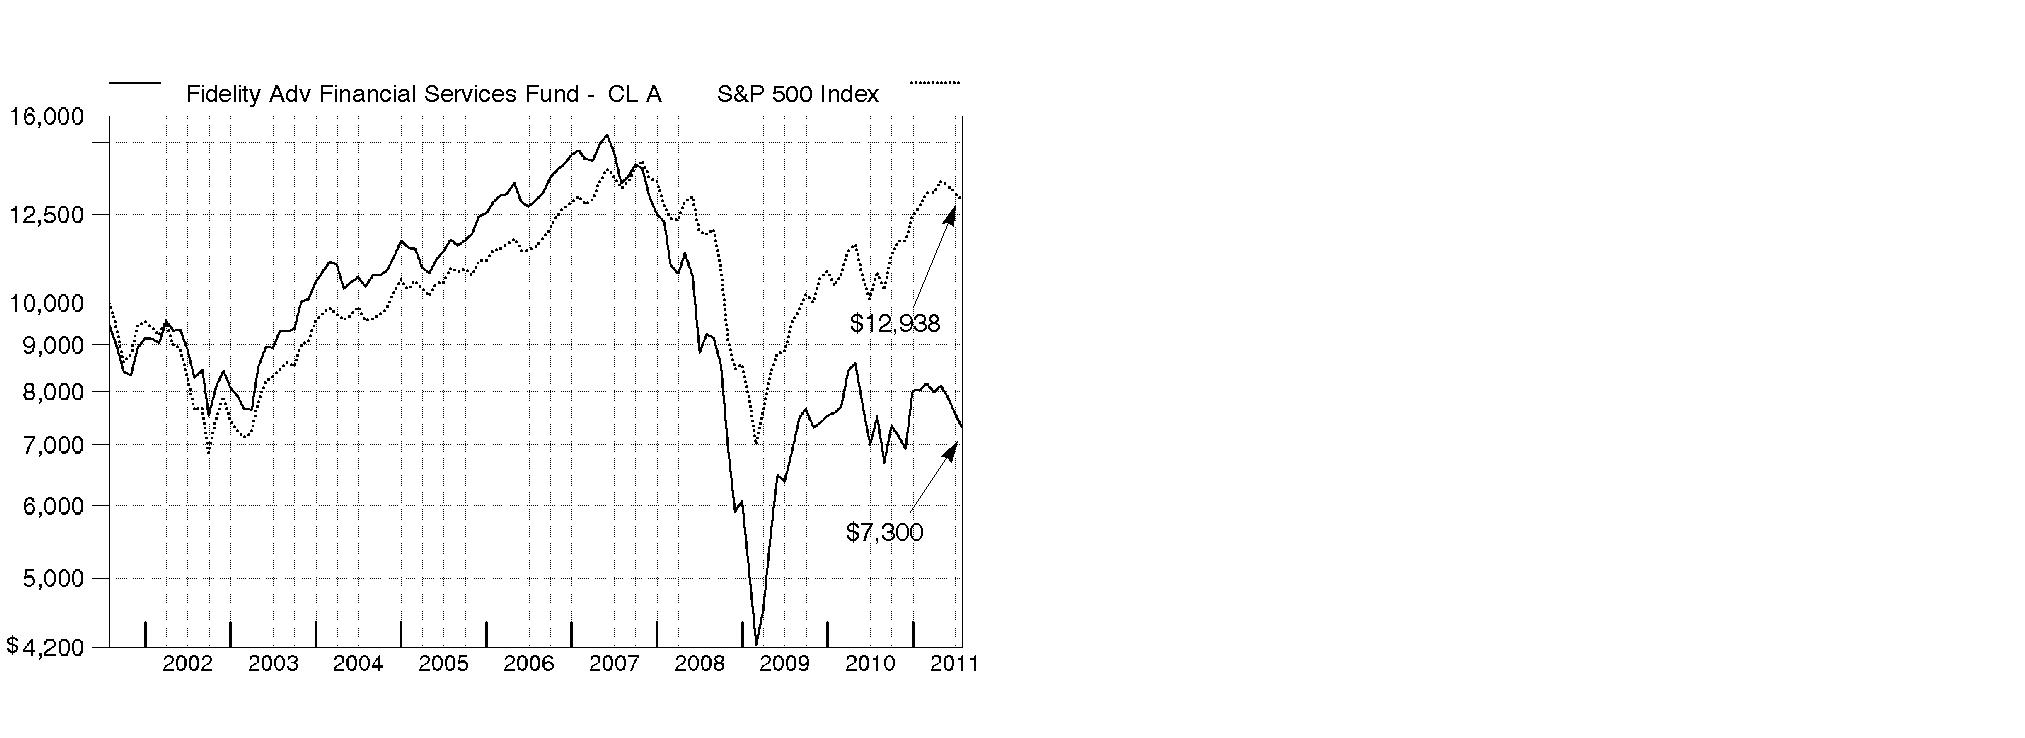
Annual Report
Fidelity Advisor Financial Services Fund
Market Recap: U.S. stocks registered solid double-digit gains for the 12 months ending July 31, 2011, extending a rally that began more than two years earlier. Despite a rough start in August 2010, markets turned positive in September, as increased demand for capital goods and other upbeat indicators trumped investor worry about a U.S. recessionary relapse. The broad market, as measured by the S&P 500® Index, rose 9% that month, its biggest September gain in 71 years. Seven more monthly advances followed, fueled by encouraging corporate earnings and economic activity. However, volatility picked up in the period's latter months, as markets reacted to continued high U.S. unemployment, nagging debt troubles in Europe and looming legislative battles over the federal debt ceiling. May unemployment rose above 9% for the first time in 2011, contributing to a traditional "June swoon" for stocks. Market uncertainty lingered in July, when the S&P 500® posted its second-biggest monthly loss of the period. For the full year, the S&P 500® climbed 19.65%, while the blue-chip-laden Dow Jones Industrial AverageSM rose a comparable 19.09% and the technology-heavy Nasdaq Composite® Index gained 23.40%. On the capitalization spectrum, stocks of mid-cap companies fared best, with the Russell Midcap® Index rising 24.51% and the small-cap Russell 2000® Index adding 23.92%.
Comments from Benjamin Hesse, Portfolio Manager of Fidelity Advisor® Financial Services Fund: For the year, the fund's Class A, Class T, Class B and Class C shares returned -2.80%, -3.00%, -3.57% and -3.50%, respectively (excluding sales charges). These returns lagged the MSCI® U.S. IM Financials 25/50 Index, which rose 4.63%, and the S&P 500. Industry allocations hurt performance relative to the MSCI index, led by sizable overweightings in investment banking/brokerage and regional banks. Overall security selection also hindered performance, especially within regional banks. Individual detractors included Comerica, a large Texas-based diversified bank that was the fund's largest position, on average; Regions Financial, a regional bank serving the Southeast and Texas; and Synovus Financial, a regional bank headquartered in Georgia. All three were pressured by continued low interest rates and slow loan growth. Elsewhere, holdings in life insurer Genworth Financial depreciated due to weakness in the company's mortgage insurance business. On the other hand, strong security selection within data processing/outsourced services and positioning in other diversified financial services aided relative performance. Top individual contributors included out-of-index stakes in credit card processors MasterCard and Visa, which both benefited from fewer consumers defaulting on their credit cards and changes to debit card swipe fees that were less onerous than expected. Within other diversified financial services, underweighting Bank of America aided performance, as low interest rates, mortgage-related problems and concern about the company's capital needs pressured the stock. Some of the names mentioned in this review were sold from the fund before period end.
Comments from Benjamin Hesse, Portfolio Manager of Fidelity Advisor® Financial Services Fund: For the year, the fund's Institutional Class shares returned -2.56%, lagging the MSCI® U.S. IM Financials 25/50 Index, which rose 4.63%, and the S&P 500. Industry allocations hurt performance relative to the MSCI index, led by sizable overweightings in investment banking/brokerage and regional banks. Overall security selection also hindered performance, especially within regional banks. Individual detractors included Comerica, a large Texas-based diversified bank that was the fund's largest position, on average; Regions Financial, a regional bank serving the Southeast and Texas; and Synovus Financial, a regional bank headquartered in Georgia. All three were pressured by continued low interest rates and slow loan growth. Elsewhere, holdings in life insurer Genworth Financial depreciated due to weakness in the company's mortgage insurance business. On the other hand, strong security selection within data processing/outsourced services and positioning in other diversified financial services aided relative performance. Top individual contributors included out-of-index stakes in credit card processors MasterCard and Visa, which both benefited from fewer consumers defaulting on their credit cards and changes to debit card swipe fees that were less onerous than expected. Within other diversified Financial services, underweighting Bank of America aided performance, as low interest rates, mortgage-related problems and concern about the company's capital needs pressured the stock. Some of the names mentioned in this review were sold from the fund before period end.
The views expressed above reflect those of the portfolio manager(s) only through the end of the period as stated on the cover of this report and do not necessarily represent the views of Fidelity or any other person in the Fidelity organization. Any such views are subject to change at any time based upon market or other conditions and Fidelity disclaims any responsibility to update such views. These views may not be relied on as investment advice and, because investment decisions for a Fidelity fund are based on numerous factors, may not be relied on as an indication of trading intent on behalf of any Fidelity fund.
Annual Report
Fidelity Advisor Financial Services Fund
As a shareholder of the Fund, you incur two types of costs: (1) transaction costs, including sales charges (loads) on purchase payments or redemption proceeds, redemption fees, and (2) ongoing costs, including management fees, distribution and/or service (12b-1) fees and other Fund expenses. This Example is intended to help you understand your ongoing costs (in dollars) of investing in the Fund and to compare these costs with the ongoing costs of investing in other mutual funds.
The Example is based on an investment of $1,000 invested at the beginning of the period and held for the entire period (February 1, 2011 to July 31, 2011).
Actual Expenses
The first line of the accompanying table for each class of the Fund provides information about actual account values and actual expenses. You may use the information in this line, together with the amount you invested, to estimate the expenses that you paid over the period. Simply divide your account value by $1,000.00 (for example, an $8,600 account value divided by $1,000.00 = 8.6), then multiply the result by the number in the first line for a class of the Fund under the heading entitled "Expenses Paid During Period" to estimate the expenses you paid on your account during this period. In addition, the Fund, as a shareholder in the underlying Fidelity Central Funds, will indirectly bear its pro-rata share of the fees and expenses incurred by the underlying Fidelity Central Funds. These fees and expenses are not included in the Fund's annualized expense ratio used to calculate the expense estimate in the table below.
Hypothetical Example for Comparison Purposes
The second line of the accompanying table for each class of the Fund provides information about hypothetical account values and hypothetical expenses based on a Class' actual expense ratio and an assumed rate of return of 5% per year before expenses, which is not the Class' actual return. The hypothetical account values and expenses may not be used to estimate the actual ending account balance or expenses you paid for the period. You may use this information to compare the ongoing costs of investing in the Fund and other funds. To do so, compare this 5% hypothetical example with the 5% hypothetical examples that appear in the shareholder reports of the other funds. In addition, the Fund, as a shareholder in the underlying Fidelity Central Funds, will indirectly bear its pro-rata share of the fees and expenses incurred by the underlying Fidelity Central Funds. These fees and expenses are not included in the Fund's annualized expense ratio used to calculate the expense estimate in the table below.
Please note that the expenses shown in the table are meant to highlight your ongoing costs only and do not reflect any transaction costs. Therefore, the second line of the table is useful in comparing ongoing costs only, and will not help you determine the relative total costs of owning different funds. In addition, if these transactional costs were included, your costs would have been higher.
| Annualized
Expense Ratio | Beginning
Account Value
February 1, 2011 | Ending
Account Value
July 31, 2011 | Expenses Paid
During Period*
February 1, 2011 to
July 31, 2011 |
Class A | 1.25% | | | |
Actual | | $ 1,000.00 | $ 908.80 | $ 5.92 |
HypotheticalA | | $ 1,000.00 | $ 1,018.60 | $ 6.26 |
Class T | 1.51% | | | |
Actual | | $ 1,000.00 | $ 908.30 | $ 7.14 |
HypotheticalA | | $ 1,000.00 | $ 1,017.31 | $ 7.55 |
Class B | 2.00% | | | |
Actual | | $ 1,000.00 | $ 906.00 | $ 9.45 |
HypotheticalA | | $ 1,000.00 | $ 1,014.88 | $ 9.99 |
Class C | 2.00% | | | |
Actual | | $ 1,000.00 | $ 906.10 | $ 9.45 |
HypotheticalA | | $ 1,000.00 | $ 1,014.88 | $ 9.99 |
Institutional Class | .94% | | | |
Actual | | $ 1,000.00 | $ 910.50 | $ 4.45 |
HypotheticalA | | $ 1,000.00 | $ 1,020.13 | $ 4.71 |
A 5% return per year before expenses
* Expenses are equal to each Class' annualized expense ratio, multiplied by the average account value over the period, multiplied by 181/365 (to reflect the one-half year period).
Annual Report
Fidelity Advisor Financial Services Fund
Investment Changes (Unaudited)
Top Ten Stocks as of July 31, 2011 |
| % of fund's
net assets | % of fund's net assets
6 months ago |
SLM Corp. | 6.2 | 2.3 |
Citigroup, Inc. | 5.4 | 5.1 |
Morgan Stanley | 4.9 | 4.8 |
CIT Group, Inc. | 4.7 | 2.1 |
JPMorgan Chase & Co. | 4.1 | 4.5 |
MasterCard, Inc. Class A | 4.0 | 4.2 |
E*TRADE Financial Corp. | 3.9 | 2.1 |
Franklin Resources, Inc. | 3.5 | 3.6 |
Invesco Ltd. | 3.3 | 0.5 |
Lazard Ltd. Class A | 2.6 | 0.0 |
| 42.6 | |
Top Industries (% of fund's net assets) |
As of July 31, 2011 |
| Capital Markets | 28.3% | |
| Commercial Banks | 15.3% | |
| Real Estate Investment Trusts | 12.5% | |
 | Diversified Financial Services | 11.6% | |
| Insurance | 10.6% | |
| All Others* | 21.7% | |

As of January 31, 2011 |
| Commercial Banks | 35.9% | |
| Capital Markets | 22.9% | |
| Diversified Financial Services | 16.1% | |
| IT Services | 15.0% | |
| Consumer Finance | 3.4% | |
| All Others* | 6.7% | |

* Includes short-term investments and net other assets. |
Annual Report
Fidelity Advisor Financial Services Fund
Investments July 31, 2011
Showing Percentage of Net Assets
Common Stocks - 98.3% |
| Shares | | Value |
CAPITAL MARKETS - 28.3% |
Asset Management & Custody Banks - 10.7% |
Affiliated Managers Group, Inc. (a) | 3,086 | | $ 321,962 |
Ameriprise Financial, Inc. | 100 | | 5,410 |
Apollo Global Management LLC Class A | 58,513 | | 1,012,860 |
Bank of New York Mellon Corp. | 500 | | 12,555 |
BlackRock, Inc. Class A | 11,249 | | 2,007,497 |
Franklin Resources, Inc. | 35,518 | | 4,509,365 |
Invesco Ltd. | 190,500 | | 4,225,290 |
Legg Mason, Inc. | 853 | | 25,095 |
Northern Trust Corp. | 7,507 | | 337,102 |
State Street Corp. | 31,300 | | 1,298,011 |
The Blackstone Group LP | 7,500 | | 124,575 |
| | 13,879,722 |
Diversified Capital Markets - 0.0% |
HFF, Inc. (a) | 1,000 | | 15,100 |
Investment Banking & Brokerage - 17.6% |
Charles Schwab Corp. | 43,200 | | 644,976 |
E*TRADE Financial Corp. (a) | 317,492 | | 5,041,773 |
Evercore Partners, Inc. Class A | 67,900 | | 1,930,397 |
GFI Group, Inc. | 419,178 | | 1,903,068 |
Goldman Sachs Group, Inc. | 4,971 | | 670,936 |
Investment Technology Group, Inc. (a) | 9,100 | | 110,747 |
Jefferies Group, Inc. | 32,466 | | 613,932 |
Lazard Ltd. Class A | 100,816 | | 3,387,418 |
Macquarie Group Ltd. | 393 | | 11,904 |
MF Global Holdings Ltd. (a) | 297,625 | | 2,193,496 |
Morgan Stanley | 286,496 | | 6,374,536 |
| | 22,883,183 |
TOTAL CAPITAL MARKETS | | 36,778,005 |
COMMERCIAL BANKS - 15.3% |
Diversified Banks - 3.8% |
Banco ABC Brasil SA | 500 | | 3,304 |
Banco Bradesco SA (PN) sponsored ADR | 700 | | 13,461 |
Banco Macro SA sponsored ADR | 400 | | 13,864 |
Banco Pine SA | 200 | | 1,334 |
Banco Santander (Brasil) SA ADR | 35,700 | | 331,296 |
BanColombia SA sponsored ADR (d) | 2,000 | | 132,600 |
Bank of Baroda | 3,531 | | 70,325 |
Barclays PLC sponsored ADR | 1,700 | | 24,752 |
Comerica, Inc. | 20,033 | | 641,657 |
CorpBanca SA sponsored ADR (d) | 1,050 | | 23,100 |
Credicorp Ltd. (NY Shares) | 28 | | 2,736 |
Credit Agricole SA | 200 | | 2,477 |
Grupo Financiero Galicia SA sponsored ADR | 1,100 | | 15,653 |
Guaranty Trust Bank PLC GDR (Reg. S) | 5,300 | | 21,995 |
HSBC Holdings PLC sponsored ADR | 600 | | 29,322 |
Industrial & Commercial Bank of China Ltd. (H Shares) | 1,836,000 | | 1,396,941 |
National Australia Bank Ltd. | 254 | | 6,697 |
|
| Shares | | Value |
Raiffeisen International Bank-Holding AG | 1,300 | | $ 65,255 |
Standard Chartered PLC (United Kingdom) | 535 | | 13,683 |
Sumitomo Mitsui Financial Group, Inc. | 2,100 | | 66,081 |
The Jammu & Kashmir Bank Ltd. | 7,298 | | 143,121 |
U.S. Bancorp | 12,727 | | 331,666 |
UniCredit SpA | 2,100 | | 3,772 |
United Overseas Bank Ltd. | 68,000 | | 1,154,840 |
Wells Fargo & Co. | 18,245 | | 509,765 |
| | 5,019,697 |
Regional Banks - 11.5% |
Banco Daycoval SA (PN) | 28,200 | | 166,706 |
Bancorp New Jersey, Inc. | 100 | | 930 |
BancTrust Financial Group, Inc. (a) | 28,700 | | 68,019 |
Bank of the Ozarks, Inc. | 1,208 | | 62,756 |
BB&T Corp. | 100 | | 2,568 |
Boston Private Financial Holdings, Inc. | 2,200 | | 15,246 |
Bridge Capital Holdings (a) | 48,490 | | 544,058 |
Canadian Western Bank, Edmonton | 2,200 | | 70,117 |
Cape Bancorp, Inc. (a) | 1,400 | | 13,174 |
Cascade Bancorp (a)(d) | 900 | | 9,180 |
CIT Group, Inc. (a) | 152,862 | | 6,074,736 |
Citizens & Northern Corp. | 520 | | 8,559 |
City Holding Co. | 500 | | 15,635 |
City National Corp. | 300 | | 16,104 |
CNB Financial Corp., Pennsylvania | 803 | | 11,089 |
CoBiz, Inc. | 180,800 | | 1,111,920 |
Cullen/Frost Bankers, Inc. | 100 | | 5,388 |
Fifth Third Bancorp | 43,500 | | 550,275 |
First Business Finance Services, Inc. | 200 | | 2,802 |
First Commonwealth Financial Corp. | 25,722 | | 132,211 |
First Horizon National Corp. | 1,400 | | 12,586 |
First Interstate Bancsystem, Inc. | 61,164 | | 818,374 |
First Midwest Bancorp, Inc., Delaware | 600 | | 7,152 |
FNB Corp., Pennsylvania | 11,300 | | 113,000 |
Glacier Bancorp, Inc. | 15,124 | | 198,729 |
Huntington Bancshares, Inc. | 223,630 | | 1,351,843 |
KeyCorp | 3,400 | | 27,336 |
NBT Bancorp, Inc. | 200 | | 4,408 |
Northrim Bancorp, Inc. | 2,269 | | 44,790 |
Pacific Continental Corp. | 3,000 | | 29,520 |
PNC Financial Services Group, Inc. | 3,500 | | 190,015 |
PT Bank Tabungan Negara Tbk | 1,468,500 | | 293,700 |
Regions Financial Corp. | 469 | | 2,856 |
Sandy Spring Bancorp, Inc. | 200 | | 3,574 |
Savannah Bancorp, Inc. (a) | 100 | | 740 |
SunTrust Banks, Inc. | 500 | | 12,245 |
Susquehanna Bancshares, Inc. | 67,014 | | 504,615 |
SVB Financial Group (a) | 2,712 | | 165,486 |
Synovus Financial Corp. (d) | 278,982 | | 510,537 |
TCF Financial Corp. | 50,837 | | 646,647 |
Texas Capital Bancshares, Inc. (a) | 600 | | 16,398 |
Umpqua Holdings Corp. | 100 | | 1,136 |
Common Stocks - continued |
| Shares | | Value |
COMMERCIAL BANKS - CONTINUED |
Regional Banks - continued |
Valley National Bancorp (d) | 4,908 | | $ 64,540 |
Virginia Commerce Bancorp, Inc. (a) | 600 | | 3,822 |
Washington Trust Bancorp, Inc. | 344 | | 7,836 |
Webster Financial Corp. | 26,200 | | 535,004 |
Westamerica Bancorp. | 100 | | 4,693 |
Western Alliance Bancorp. (a) | 29,100 | | 204,573 |
Zions Bancorporation | 11,800 | | 258,420 |
| | 14,916,048 |
TOTAL COMMERCIAL BANKS | | 19,935,745 |
COMMERCIAL SERVICES & SUPPLIES - 0.0% |
Diversified Support Services - 0.0% |
Intrum Justitia AB | 1,000 | | 15,536 |
CONSUMER FINANCE - 7.4% |
Consumer Finance - 7.4% |
Advance America Cash Advance Centers, Inc. | 81,507 | | 574,624 |
American Express Co. | 6,451 | | 322,808 |
Capital One Financial Corp. | 300 | | 14,340 |
EZCORP, Inc. (non-vtg.) Class A (a) | 5,400 | | 179,712 |
First Cash Financial Services, Inc. (a) | 1,590 | | 68,799 |
Green Dot Corp. Class A | 10,000 | | 324,300 |
Nelnet, Inc. Class A | 700 | | 14,112 |
Netspend Holdings, Inc. | 5,031 | | 39,695 |
PT Clipan Finance Indonesia Tbk | 338,000 | | 30,619 |
SLM Corp. | 513,969 | | 8,012,777 |
| | 9,581,786 |
DIVERSIFIED CONSUMER SERVICES - 0.2% |
Specialized Consumer Services - 0.2% |
Sotheby's Class A (Ltd. vtg.) | 7,600 | | 321,860 |
DIVERSIFIED FINANCIAL SERVICES - 11.6% |
Other Diversified Financial Services - 9.5% |
Bank of America Corp. | 6,668 | | 64,746 |
Citigroup, Inc. | 184,209 | | 7,062,573 |
JPMorgan Chase & Co. | 130,133 | | 5,263,880 |
| | 12,391,199 |
Specialized Finance - 2.1% |
CME Group, Inc. | 100 | | 28,919 |
IntercontinentalExchange, Inc. (a) | 584 | | 72,007 |
Moody's Corp. | 200 | | 7,122 |
PHH Corp. (a) | 139,143 | | 2,610,323 |
| | 2,718,371 |
TOTAL DIVERSIFIED FINANCIAL SERVICES | | 15,109,570 |
|
| Shares | | Value |
HOTELS, RESTAURANTS & LEISURE - 0.2% |
Hotels, Resorts & Cruise Lines - 0.2% |
Starwood Hotels & Resorts Worldwide, Inc. | 4,700 | | $ 258,312 |
INDUSTRIAL CONGLOMERATES - 0.8% |
Industrial Conglomerates - 0.8% |
Keppel Corp. Ltd. | 115,000 | | 1,057,219 |
INSURANCE - 10.6% |
Life & Health Insurance - 3.1% |
AFLAC, Inc. | 21,300 | | 981,078 |
Citizens, Inc. Class A (a) | 2,100 | | 14,448 |
CNO Financial Group, Inc. (a) | 1,900 | | 13,965 |
Delphi Financial Group, Inc. Class A | 500 | | 13,460 |
FBL Financial Group, Inc. Class A | 400 | | 12,592 |
Lincoln National Corp. | 500 | | 13,250 |
MetLife, Inc. | 49,247 | | 2,029,469 |
Phoenix Companies, Inc. (a) | 5,700 | | 13,680 |
Ping An Insurance Group Co. China Ltd. (H Shares) | 1,500 | | 14,598 |
Prudential Financial, Inc. | 11,200 | | 657,216 |
Resolution Ltd. | 52,100 | | 236,227 |
StanCorp Financial Group, Inc. | 300 | | 9,978 |
Symetra Financial Corp. | 1,100 | | 13,816 |
Torchmark Corp. | 300 | | 12,117 |
Unum Group | 600 | | 14,634 |
| | 4,050,528 |
Multi-Line Insurance - 0.9% |
American International Group, Inc. (a) | 200 | | 5,740 |
Genworth Financial, Inc. Class A (a) | 41,500 | | 345,280 |
Hartford Financial Services Group, Inc. | 26,600 | | 622,972 |
Loews Corp. | 3,200 | | 127,584 |
| | 1,101,576 |
Property & Casualty Insurance - 5.1% |
ACE Ltd. | 20,500 | | 1,373,090 |
Allstate Corp. | 500 | | 13,860 |
Assured Guaranty Ltd. | 500 | | 7,075 |
Axis Capital Holdings Ltd. | 37,600 | | 1,198,312 |
Berkshire Hathaway, Inc. Class B (a) | 8,900 | | 660,113 |
Fidelity National Financial, Inc. Class A | 900 | | 14,670 |
The Travelers Companies, Inc. | 100 | | 5,513 |
W.R. Berkley Corp. | 4,200 | | 129,318 |
XL Group PLC Class A | 154,172 | | 3,163,609 |
| | 6,565,560 |
Reinsurance - 1.5% |
Arch Capital Group Ltd. (a) | 10,200 | | 344,760 |
Montpelier Re Holdings Ltd. | 700 | | 12,082 |
Platinum Underwriters Holdings Ltd. | 9,300 | | 319,455 |
Validus Holdings Ltd. | 49,500 | | 1,316,205 |
| | 1,992,502 |
TOTAL INSURANCE | | 13,710,166 |
Common Stocks - continued |
| Shares | | Value |
INTERNET SOFTWARE & SERVICES - 0.2% |
Internet Software & Services - 0.2% |
China Finance Online Co. Ltd. ADR (a)(d) | 66,785 | | $ 213,712 |
IT SERVICES - 9.0% |
Data Processing & Outsourced Services - 7.6% |
Alliance Data Systems Corp. (a) | 100 | | 9,834 |
Cielo SA | 10,100 | | 280,628 |
Fiserv, Inc. (a) | 31,928 | | 1,927,174 |
MasterCard, Inc. Class A | 17,181 | | 5,210,138 |
Redecard SA | 122,700 | | 2,111,971 |
The Western Union Co. | 1,400 | | 27,174 |
VeriFone Systems, Inc. (a) | 8,405 | | 330,905 |
| | 9,897,824 |
IT Consulting & Other Services - 1.4% |
Accenture PLC Class A | 8,800 | | 520,432 |
Cognizant Technology Solutions Corp. Class A (a) | 18,400 | | 1,285,608 |
| | 1,806,040 |
TOTAL IT SERVICES | | 11,703,864 |
PROFESSIONAL SERVICES - 0.8% |
Research & Consulting Services - 0.8% |
Equifax, Inc. | 29,685 | | 1,019,977 |
REAL ESTATE INVESTMENT TRUSTS - 12.5% |
Diversified REITs - 0.1% |
American Assets Trust, Inc. | 6,100 | | 134,139 |
Vornado Realty Trust | 700 | | 65,485 |
| | 199,624 |
Industrial REITs - 0.2% |
DCT Industrial Trust, Inc. | 39,100 | | 211,922 |
Mortgage REITs - 3.4% |
American Capital Agency Corp. | 93,103 | | 2,599,436 |
Annaly Capital Management, Inc. | 108,100 | | 1,813,918 |
| | 4,413,354 |
Office REITs - 1.9% |
Corporate Office Properties Trust (SBI) | 400 | | 12,428 |
Douglas Emmett, Inc. | 1,400 | | 28,000 |
Highwoods Properties, Inc. (SBI) | 23,700 | | 815,991 |
Lexington Corporate Properties Trust (d) | 185,200 | | 1,555,680 |
MPG Office Trust, Inc. (a) | 5,300 | | 17,543 |
| | 2,429,642 |
Residential REITs - 2.9% |
American Campus Communities, Inc. | 3,800 | | 141,436 |
Apartment Investment & Management Co. Class A | 52,141 | | 1,423,449 |
AvalonBay Communities, Inc. | 1,000 | | 134,190 |
Camden Property Trust (SBI) | 10,500 | | 704,235 |
Campus Crest Communities, Inc. | 1,100 | | 13,178 |
Essex Property Trust, Inc. | 200 | | 28,072 |
|
| Shares | | Value |
Home Properties, Inc. | 2,200 | | $ 144,144 |
Post Properties, Inc. | 3,300 | | 139,920 |
UDR, Inc. | 38,000 | | 999,780 |
| | 3,728,404 |
Retail REITs - 0.2% |
Federal Realty Investment Trust (SBI) | 1,600 | | 139,744 |
Kimco Realty Corp. | 7,300 | | 138,919 |
Simon Property Group, Inc. | 100 | | 12,051 |
| | 290,714 |
Specialized REITs - 3.8% |
HCP, Inc. | 36,800 | | 1,351,664 |
Host Hotels & Resorts, Inc. | 900 | | 14,265 |
Public Storage | 19,746 | | 2,362,214 |
Strategic Hotel & Resorts, Inc. (a) | 72,657 | | 494,068 |
Sunstone Hotel Investors, Inc. (a) | 14,000 | | 124,740 |
U-Store-It Trust | 12,800 | | 136,320 |
Ventas, Inc. | 3,135 | | 169,698 |
Weyerhaeuser Co. | 13,400 | | 267,866 |
| | 4,920,835 |
TOTAL REAL ESTATE INVESTMENT TRUSTS | | 16,194,495 |
REAL ESTATE MANAGEMENT & DEVELOPMENT - 1.1% |
Diversified Real Estate Activities - 0.0% |
The St. Joe Co. (a) | 100 | | 1,771 |
Real Estate Operating Companies - 0.4% |
Castellum AB | 30,200 | | 438,227 |
Thomas Properties Group, Inc. (a) | 2,262 | | 7,352 |
| | 445,579 |
Real Estate Services - 0.7% |
CB Richard Ellis Group, Inc. Class A (a) | 42,521 | | 926,958 |
TOTAL REAL ESTATE MANAGEMENT & DEVELOPMENT | | 1,374,308 |
SOFTWARE - 0.0% |
Application Software - 0.0% |
Fair Isaac Corp. | 100 | | 2,975 |
SPECIALTY RETAIL - 0.2% |
Home Improvement Retail - 0.2% |
Home Depot, Inc. | 6,600 | | 230,538 |
THRIFTS & MORTGAGE FINANCE - 0.1% |
Thrifts & Mortgage Finance - 0.1% |
Brookline Bancorp, Inc., Delaware | 800 | | 6,840 |
Carver Bancorp, Inc. | 100 | | 56 |
Cheviot Financial Corp. | 8,880 | | 74,059 |
Hudson City Bancorp, Inc. | 800 | | 6,600 |
People's United Financial, Inc. | 1,100 | | 13,948 |
| | 101,503 |
Common Stocks - continued |
| Shares | | Value |
WIRELESS TELECOMMUNICATION SERVICES - 0.0% |
Wireless Telecommunication Services - 0.0% |
American Tower Corp. Class A (a) | 300 | | $ 15,759 |
TOTAL COMMON STOCKS (Cost $134,804,120) | 127,625,330 |
Money Market Funds - 6.0% |
| | | |
Fidelity Cash Central Fund, 0.14% (b) | 5,386,376 | | 5,386,376 |
Fidelity Securities Lending Cash Central Fund, 0.15% (b)(c) | 2,376,248 | | 2,376,248 |
TOTAL MONEY MARKET FUNDS (Cost $7,762,624) | 7,762,624 |
TOTAL INVESTMENT PORTFOLIO - 104.3% (Cost $142,566,744) | | 135,387,954 |
NET OTHER ASSETS (LIABILITIES) - (4.3)% | | (5,576,275) |
NET ASSETS - 100% | $ 129,811,679 |
Legend |
(a) Non-income producing |
(b) Affiliated fund that is available only to investment companies and other accounts managed by Fidelity Investments. The rate quoted is the annualized seven-day yield of the fund at period end. A complete unaudited listing of the fund's holdings as of its most recent quarter end is available upon request. In addition, each Fidelity Central Fund's financial statements, which are not covered by the Fund's Report of Independent Registered Public Accounting Firm, are available on the SEC's website or upon request. |
(c) Investment made with cash collateral received from securities on loan. |
(d) Security or a portion of the security is on loan at period end. |
Affiliated Central Funds |
Information regarding fiscal year to date income earned by the Fund from investments in Fidelity Central Funds is as follows: |
Fund | Income earned |
Fidelity Cash Central Fund | $ 3,845 |
Fidelity Securities Lending Cash Central Fund | 25,052 |
Total | $ 28,897 |
Other Information |
The following is a summary of the inputs used, as of July 31, 2011, involving the Fund's assets and liabilities carried at fair value. The inputs or methodology used for valuing securities may not be an indication of the risk associated with investing in those securities. For more information on valuation inputs, and their aggregation into the levels used in the table below, please refer to the Security Valuation section in the accompanying Notes to Financial Statements. |
Valuation Inputs at Reporting Date: |
Description | Total | Level 1 | Level 2 | Level 3 |
Investments in Securities: | | | | |
Common Stocks | $ 127,625,330 | $ 127,488,924 | $ 136,406 | $ - |
Money Market Funds | 7,762,624 | 7,762,624 | - | - |
Total Investments in Securities: | $ 135,387,954 | $ 135,251,548 | $ 136,406 | $ - |
Distribution of investments by country of issue, as a percentage of total net assets, is as follows: (Unaudited) |
United States of America | 81.3% |
Bermuda | 8.3% |
Ireland | 2.9% |
Brazil | 2.2% |
Singapore | 1.7% |
China | 1.3% |
Switzerland | 1.1% |
Others (Individually Less Than 1%) | 1.2% |
| 100.0% |
Income Tax Information |
At July 31, 2011, the Fund had a capital loss carryforward of approximately $79,374,743 of which $55,672,202, $23,251,884 and $450,657 will expire in fiscal 2017, 2018 and 2019, respectively. Capital loss carryforwards are only available to offset future capital gains of the Fund to the extent provided by regulations and may be limited. |
The Fund intends to elect to defer to its fiscal year ending July 31, 2012 approximately $2,786,796 of losses recognized during the period November 1, 2010, to July 31, 2011. |
See accompanying notes which are an integral part of the financial statements.
Annual Report
Fidelity Advisor Financial Services Fund
Statement of Assets and Liabilities
| July 31, 2011 |
| | |
Assets | | |
Investment in securities, at value (including securities loaned of $2,260,403) - See accompanying schedule: Unaffiliated issuers (cost $134,804,120) | $ 127,625,330 | |
Fidelity Central Funds (cost $7,762,624) | 7,762,624 | |
Total Investments (cost $142,566,744) | | $ 135,387,954 |
Receivable for investments sold | | 9,766,519 |
Receivable for fund shares sold | | 171,966 |
Dividends receivable | | 105,235 |
Distributions receivable from Fidelity Central Funds | | 1,937 |
Other receivables | | 33,601 |
Total assets | | 145,467,212 |
| | |
Liabilities | | |
Payable for investments purchased | $ 12,349,827 | |
Payable for fund shares redeemed | 735,040 | |
Accrued management fee | 62,472 | |
Distribution and service plan fees payable | 51,880 | |
Other affiliated payables | 38,206 | |
Other payables and accrued expenses | 41,860 | |
Collateral on securities loaned, at value | 2,376,248 | |
Total liabilities | | 15,655,533 |
| | |
Net Assets | | $ 129,811,679 |
Net Assets consist of: | | |
Paid in capital | | $ 220,860,111 |
Accumulated net investment loss | | (116,048) |
Accumulated undistributed net realized gain (loss) on investments and foreign currency transactions | | (83,753,065) |
Net unrealized appreciation (depreciation) on investments and assets and liabilities in foreign currencies | | (7,179,319) |
Net Assets | | $ 129,811,679 |
Statement of Assets and Liabilities - continued
| July 31, 2011 |
| | |
Calculation of Maximum Offering Price Class A:
Net Asset Value and redemption price per share ($63,937,051 ÷ 6,352,907 shares) | | $ 10.06 |
| | |
Maximum offering price per share (100/94.25 of $10.06) | | $ 10.67 |
Class T:
Net Asset Value and redemption price per share ($27,037,118 ÷ 2,700,700 shares) | | $ 10.01 |
| | |
Maximum offering price per share (100/96.50 of $10.01) | | $ 10.37 |
Class B:
Net Asset Value and offering price per share ($7,479,552 ÷ 768,438 shares)A | | $ 9.73 |
| | |
Class C:
Net Asset Value and offering price per share ($23,195,919 ÷ 2,404,480 shares)A | | $ 9.65 |
| | |
Institutional Class:
Net Asset Value, offering price and redemption price per share ($8,162,039 ÷ 793,803 shares) | | $ 10.28 |
A Redemption price per share is equal to net asset value less any applicable contingent deferred sales charge.
See accompanying notes which are an integral part of the financial statements.
Annual Report
Statement of Operations
| Year ended July 31, 2011 |
| | |
Investment Income | | |
Dividends | | $ 1,400,049 |
Interest | | 1 |
Income from Fidelity Central Funds | | 28,897 |
Total income | | 1,428,947 |
| | |
Expenses | | |
Management fee | $ 814,992 | |
Transfer agent fees | 439,873 | |
Distribution and service plan fees | 705,505 | |
Accounting and security lending fees | 59,225 | |
Custodian fees and expenses | 39,068 | |
Independent trustees' compensation | 859 | |
Registration fees | 67,268 | |
Audit | 50,338 | |
Legal | 921 | |
Miscellaneous | 1,475 | |
Total expenses before reductions | 2,179,524 | |
Expense reductions | (68,182) | 2,111,342 |
Net investment income (loss) | | (682,395) |
Realized and Unrealized Gain (Loss) Net realized gain (loss) on: | | |
Investment securities: | | |
Unaffiliated issuers (net of foreign taxes of $43) | (792,828) | |
Investment not meeting investment restrictions | 350 | |
Foreign currency transactions | (149,732) | |
Total net realized gain (loss) | | (942,210) |
Change in net unrealized appreciation (depreciation) on: Investment securities | (2,517,330) | |
Assets and liabilities in foreign currencies | (1,509) | |
Total change in net unrealized appreciation (depreciation) | | (2,518,839) |
Net gain (loss) | | (3,461,049) |
Net increase (decrease) in net assets resulting from operations | | $ (4,143,444) |
Statement of Changes in Net Assets
| Year ended
July 31,
2011 | Year ended
July 31,
2010 |
Increase (Decrease) in Net Assets | | |
Operations | | |
Net investment income (loss) | $ (682,395) | $ (567,469) |
Net realized gain (loss) | (942,210) | 36,190,039 |
Change in net unrealized appreciation (depreciation) | (2,518,839) | (22,169,228) |
Net increase (decrease) in net assets resulting from operations | (4,143,444) | 13,453,342 |
Distributions to shareholders from net investment income | - | (1,313,190) |
Share transactions - net increase (decrease) | (16,036,954) | (11,450,926) |
Redemption fees | 4,715 | 4,230 |
Total increase (decrease) in net assets | (20,175,683) | 693,456 |
| | |
Net Assets | | |
Beginning of period | 149,987,362 | 149,293,906 |
End of period (including accumulated net investment loss of $116,048 and undistributed net investment income of $0, respectively). | $ 129,811,679 | $ 149,987,362 |
See accompanying notes which are an integral part of the financial statements.
Annual Report
Financial Highlights - Class A
Years ended July 31, | 2011 | 2010 | 2009 | 2008 | 2007 |
Selected Per-Share Data | | | | | |
Net asset value, beginning of period | $ 10.35 | $ 9.53 | $ 13.18 | $ 21.02 | $ 23.34 |
Income from Investment Operations | | | | | |
Net investment income (loss) C | (.02) | (.01) | .19 | .30 | .23 |
Net realized and unrealized gain (loss) | (.27) | .93 | (3.58) | (6.41) | .92 |
Total from investment operations | (.29) | .92 | (3.39) | (6.11) | 1.15 |
Distributions from net investment income | - | (.10) | (.24) | (.27) | (.22) |
Distributions from net realized gain | - | - | (.02) | (1.46) | (3.25) |
Total distributions | - | (.10) | (.26) | (1.73) | (3.47) H |
Redemption fees added to paid in capital C, G | - | - | - | - | - |
Net asset value, end of period | $ 10.06 | $ 10.35 | $ 9.53 | $ 13.18 | $ 21.02 |
Total Return A, B | (2.80)% | 9.61% | (25.87)% | (31.67)% | 4.54% |
Ratios to Average Net Assets D, F | | | | | |
Expenses before reductions | 1.26% | 1.27% | 1.29% | 1.21% | 1.23% |
Expenses net of fee waivers, if any | 1.26% | 1.27% | 1.29% | 1.21% | 1.23% |
Expenses net of all reductions | 1.21% | 1.22% | 1.28% | 1.21% | 1.22% |
Net investment income (loss) | (.24)% | (.09)% | 2.12% | 1.75% | 1.01% |
Supplemental Data | | | | | |
Net assets, end of period (000 omitted) | $ 63,937 | $ 69,723 | $ 68,245 | $ 90,037 | $ 106,722 |
Portfolio turnover rate E | 260% | 254% | 269% | 48% | 53% |
A Total returns would have been lower if certain expenses had not been reduced during the applicable periods shown.
B Total returns do not include the effect of the sales charges.
C Calculated based on average shares outstanding during the period.
D Fees and expenses of any underlying Fidelity Central Funds are not included in the Fund's expense ratio. The Fund indirectly bears its proportionate share of the expenses of any underlying Fidelity Central Funds.
E Amount does not include the portfolio activity of any underlying Fidelity Central Funds.
F Expense ratios reflect operating expenses of the class. Expenses before reductions do not reflect amounts reimbursed by the investment adviser or reductions from brokerage service arrangements or reductions from other expense offset arrangements and do not represent the amount paid by the class during periods when reimbursements or reductions occur. Expenses net of fee waivers reflect expenses after reimbursement by the investment adviser but prior to reductions from brokerage service arrangements or other expense offset arrangements. Expenses net of all reductions represent the net expenses paid by the class.
G Amount represents less than $.01 per share.
H Total distributions of $3.47 per share is comprised of distributions from net investment income of $.223 and distributions from net realized gain of $3.250 per share.
Financial Highlights - Class T
Years ended July 31, | 2011 | 2010 | 2009 | 2008 | 2007 |
Selected Per-Share Data | | | | | |
Net asset value, beginning of period | $ 10.32 | $ 9.52 | $ 13.14 | $ 20.94 | $ 23.26 |
Income from Investment Operations | | | | | |
Net investment income (loss) C | (.05) | (.04) | .16 | .26 | .18 |
Net realized and unrealized gain (loss) | (.26) | .92 | (3.56) | (6.41) | .91 |
Total from investment operations | (.31) | .88 | (3.40) | (6.15) | 1.09 |
Distributions from net investment income | - | (.08) | (.20) | (.19) | (.16) |
Distributions from net realized gain | - | - | (.02) | (1.46) | (3.25) |
Total distributions | - | (.08) | (.22) | (1.65) | (3.41) H |
Redemption fees added to paid in capital C, G | - | - | - | - | - |
Net asset value, end of period | $ 10.01 | $ 10.32 | $ 9.52 | $ 13.14 | $ 20.94 |
Total Return A, B | (3.00)% | 9.26% | (26.00)% | (31.85)% | 4.25% |
Ratios to Average Net Assets D, F | | | | | |
Expenses before reductions | 1.52% | 1.53% | 1.55% | 1.47% | 1.46% |
Expenses net of fee waivers, if any | 1.52% | 1.53% | 1.55% | 1.47% | 1.46% |
Expenses net of all reductions | 1.47% | 1.47% | 1.54% | 1.47% | 1.46% |
Net investment income (loss) | (.49)% | (.35)% | 1.86% | 1.50% | .77% |
Supplemental Data | | | | | |
Net assets, end of period (000 omitted) | $ 27,037 | $ 33,310 | $ 34,927 | $ 53,526 | $ 95,426 |
Portfolio turnover rate E | 260% | 254% | 269% | 48% | 53% |
A Total returns would have been lower if certain expenses had not been reduced during the applicable periods shown.
B Total returns do not include the effect of the sales charges.
C Calculated based on average shares outstanding during the period.
D Fees and expenses of any underlying Fidelity Central Funds are not included in the Fund's expense ratio. The Fund indirectly bears its proportionate share of the expenses of any underlying Fidelity Central Funds.
E Amount does not include the portfolio activity of any underlying Fidelity Central Funds.
F Expense ratios reflect operating expenses of the class. Expenses before reductions do not reflect amounts reimbursed by the investment adviser or reductions from brokerage service arrangements or reductions from other expense offset arrangements and do not represent the amount paid by the class during periods when reimbursements or reductions occur. Expenses net of fee waivers reflect expenses after reimbursement by the investment adviser but prior to reductions from brokerage service arrangements or other expense offset arrangements. Expenses net of all reductions represent the net expenses paid by the class.
G Amount represents less than $.01 per share.
H Total distributions of $3.41 per share is comprised of distributions from net investment income of $.156 and distributions from net realized gain of $3.250 per share.
See accompanying notes which are an integral part of the financial statements.
Annual Report
Financial Highlights - Class B
Years ended July 31, | 2011 | 2010 | 2009 | 2008 | 2007 |
Selected Per-Share Data | | | | | |
Net asset value, beginning of period | $ 10.09 | $ 9.33 | $ 12.85 | $ 20.44 | $ 22.75 |
Income from Investment Operations | | | | | |
Net investment income (loss) C | (.10) | (.09) | .12 | .18 | .06 |
Net realized and unrealized gain (loss) | (.26) | .91 | (3.50) | (6.29) | .89 |
Total from investment operations | (.36) | .82 | (3.38) | (6.11) | .95 |
Distributions from net investment income | - | (.06) | (.12) | (.04) | (.02) |
Distributions from net realized gain | - | - | (.02) | (1.44) | (3.25) |
Total distributions | - | (.06) | (.14) | (1.48) | (3.26) H |
Redemption fees added to paid in capital C, G | - | - | - | - | - |
Net asset value, end of period | $ 9.73 | $ 10.09 | $ 9.33 | $ 12.85 | $ 20.44 |
Total Return A, B | (3.57)% | 8.78% | (26.35)% | (32.21)% | 3.71% |
Ratios to Average Net Assets D, F | | | | | |
Expenses before reductions | 2.01% | 2.02% | 2.04% | 1.96% | 1.98% |
Expenses net of fee waivers, if any | 2.01% | 2.02% | 2.04% | 1.96% | 1.98% |
Expenses net of all reductions | 1.96% | 1.97% | 2.03% | 1.96% | 1.98% |
Net investment income (loss) | (.98)% | (.85)% | 1.38% | 1.01% | .25% |
Supplemental Data | | | | | |
Net assets, end of period (000 omitted) | $ 7,480 | $ 10,992 | $ 12,477 | $ 20,420 | $ 64,837 |
Portfolio turnover rate E | 260% | 254% | 269% | 48% | 53% |
A Total returns would have been lower if certain expenses had not been reduced during the applicable periods shown.
B Total returns do not include the effect of the contingent deferred sales charge.
C Calculated based on average shares outstanding during the period.
D Fees and expenses of any underlying Fidelity Central Funds are not included in the Fund's expense ratio. The Fund indirectly bears its proportionate share of the expenses of any underlying Fidelity Central Funds.
E Amount does not include the portfolio activity of any underlying Fidelity Central Funds.
F Expense ratios reflect operating expenses of the class. Expenses before reductions do not reflect amounts reimbursed by the investment adviser or reductions from brokerage service arrangements or reductions from other expense offset arrangements and do not represent the amount paid by the class during periods when reimbursements or reductions occur. Expenses net of fee waivers reflect expenses after reimbursement by the investment adviser but prior to reductions from brokerage service arrangements or other expense offset arrangements. Expenses net of all reductions represent the net expenses paid by the class.
G Amount represents less than $.01 per share.
H Total distributions of $3.26 per share is comprised of distributions from net investment income of $.015 and distributions from net realized gain of $3.247 per share.
Financial Highlights - Class C
Years ended July 31, | 2011 | 2010 | 2009 | 2008 | 2007 |
Selected Per-Share Data | | | | | |
Net asset value, beginning of period | $ 10.00 | $ 9.25 | $ 12.78 | $ 20.40 | $ 22.74 |
Income from Investment Operations | | | | | |
Net investment income (loss) C | (.10) | (.09) | .12 | .17 | .06 |
Net realized and unrealized gain (loss) | (.25) | .90 | (3.48) | (6.24) | .90 |
Total from investment operations | (.35) | .81 | (3.36) | (6.07) | .96 |
Distributions from net investment income | - | (.06) | (.15) | (.09) | (.05) |
Distributions from net realized gain | - | - | (.02) | (1.46) | (3.25) |
Total distributions | - | (.06) | (.17) | (1.55) | (3.30) H |
Redemption fees added to paid in capital C, G | - | - | - | - | - |
Net asset value, end of period | $ 9.65 | $ 10.00 | $ 9.25 | $ 12.78 | $ 20.40 |
Total Return A, B | (3.50)% | 8.79% | (26.38)% | (32.18)% | 3.75% |
Ratios to Average Net Assets D, F | | | | | |
Expenses before reductions | 2.01% | 2.02% | 2.04% | 1.96% | 1.94% |
Expenses net of fee waivers, if any | 2.01% | 2.02% | 2.04% | 1.96% | 1.94% |
Expenses net of all reductions | 1.96% | 1.96% | 2.03% | 1.96% | 1.94% |
Net investment income (loss) | (.99)% | (.84)% | 1.37% | 1.01% | .29% |
Supplemental Data | | | | | |
Net assets, end of period (000 omitted) | $ 23,196 | $ 30,804 | $ 29,849 | $ 37,777 | $ 55,219 |
Portfolio turnover rate E | 260% | 254% | 269% | 48% | 53% |
A Total returns would have been lower if certain expenses had not been reduced during the applicable periods shown.
B Total returns do not include the effect of the contingent deferred sales charge.
C Calculated based on average shares outstanding during the period.
D Fees and expenses of any underlying Fidelity Central Funds are not included in the Fund's expense ratio. The Fund indirectly bears its proportionate share of the expenses of any underlying Fidelity Central Funds.
E Amount does not include the portfolio activity of any underlying Fidelity Central Funds.
F Expense ratios reflect operating expenses of the class. Expenses before reductions do not reflect amounts reimbursed by the investment adviser or reductions from brokerage service arrangements or reductions from other expense offset arrangements and do not represent the amount paid by the class during periods when reimbursements or reductions occur. Expenses net of fee waivers reflect expenses after reimbursement by the investment adviser but prior to reductions from brokerage service arrangements or other expense offset arrangements. Expenses net of all reductions represent the net expenses paid by the class.
G Amount represents less than $.01 per share.
H Total distributions of $3.30 per share is comprised of distributions from net investment income of $.049 and distributions from net realized gain of $3.250 per share.
See accompanying notes which are an integral part of the financial statements.
Annual Report
Financial Highlights - Institutional Class
Years ended July 31, | 2011 | 2010 | 2009 | 2008 | 2007 |
Selected Per-Share Data | | | | | |
Net asset value, beginning of period | $ 10.55 | $ 9.69 | $ 13.38 | $ 21.32 | $ 23.63 |
Income from Investment Operations | | | | | |
Net investment income (loss) B | .01 | .02 | .21 | .36 | .31 |
Net realized and unrealized gain (loss) | (.28) | .95 | (3.63) | (6.51) | .93 |
Total from investment operations | (.27) | .97 | (3.42) | (6.15) | 1.24 |
Distributions from net investment income | - | (.11) | (.25) | (.33) | (.30) |
Distributions from net realized gain | - | - | (.02) | (1.46) | (3.25) |
Total distributions | - | (.11) | (.27) | (1.79) | (3.55) G |
Redemption fees added to paid in capital B, F | - | - | - | - | - |
Net asset value, end of period | $ 10.28 | $ 10.55 | $ 9.69 | $ 13.38 | $ 21.32 |
Total Return A | (2.56)% | 9.99% | (25.68)% | (31.47)% | 4.88% |
Ratios to Average Net Assets C, E | | | | | |
Expenses before reductions | .96% | .99% | 1.04% | .93% | .89% |
Expenses net of fee waivers, if any | .96% | .99% | 1.04% | .93% | .89% |
Expenses net of all reductions | .91% | .94% | 1.03% | .92% | .88% |
Net investment income (loss) | .07% | .19% | 2.37% | 2.04% | 1.34% |
Supplemental Data | | | | | |
Net assets, end of period (000 omitted) | $ 8,162 | $ 5,158 | $ 3,797 | $ 5,819 | $ 8,474 |
Portfolio turnover rate D | 260% | 254% | 269% | 48% | 53% |
A Total returns would have been lower if certain expenses had not been reduced during the applicable periods shown.
B Calculated based on average shares outstanding during the period.
C Fees and expenses of any underlying Fidelity Central Funds are not included in the Fund's expense ratio. The Fund indirectly bears its proportionate share of the expenses of any underlying Fidelity Central Funds.
D Amount does not include the portfolio activity of any underlying Fidelity Central Funds.
E Expense ratios reflect operating expenses of the class. Expenses before reductions do not reflect amounts reimbursed by the investment adviser or reductions from brokerage service arrangements or reductions from other expense offset arrangements and do not represent the amount paid by the class during periods when reimbursements or reductions occur. Expenses net of fee waivers reflect expenses after reimbursement by the investment adviser but prior to reductions from brokerage service arrangements or other expense offset arrangements. Expenses net of all reductions represent the net expenses paid by the class.
F Amount represents less than $.01 per share.
G Total distributions of $3.55 per share is comprised of distributions from net investment income of $.298 and distributions from net realized gain of $3.250 per share.
See accompanying notes which are an integral part of the financial statements.
Annual Report
Notes to Financial Statements
For the period ended July 31, 2011
1. Organization.
Fidelity Advisor Financial Services Fund (the Fund) is a fund of Fidelity Advisor Series VII (the Trust) and is authorized to issue an unlimited number of shares. The Trust is registered under the Investment Company Act of 1940, as amended (the 1940 Act), as an open-end management investment company organized as a Massachusetts business trust. The Fund offers Class A, Class T, Class C, and Institutional Class shares, each of which, along with Class B shares, has equal rights as to assets and voting privileges. Effective after the close of business on September 1, 2010, Class B shares were closed to new accounts and additional purchases, except for exchanges and reinvestments, by existing shareholders. Each class has exclusive voting rights with respect to matters that affect that class. Class B shares will automatically convert to Class A shares after a holding period of seven years from the initial date of purchase. Investment income, realized and unrealized capital gains and losses, the common expenses of the Fund, and certain fund-level expense reductions, if any, are allocated on a pro-rata basis to each class based on the relative net assets of each class to the total net assets of the Fund. Each class differs with respect to transfer agent and distribution and service plan fees incurred. Certain expense reductions may also differ by class. The Fund's investments in emerging markets can be subject to social, economic, regulatory, and political uncertainties and can be extremely volatile.
2. Investments in Fidelity Central Funds.
The Fund invests in Fidelity Central Funds, which are open-end investment companies available only to other investment companies and accounts managed by Fidelity Management & Research Company (FMR) and its affiliates. The Fund's Schedule of Investments lists each of the Fidelity Central Funds held as of period end, if any, as an investment of the Fund, but does not include the underlying holdings of each Fidelity Central Fund. As an Investing Fund, the Fund indirectly bears its proportionate share of the expenses of the underlying Fidelity Central Funds.
The Money Market Central Funds seek preservation of capital and current income and are managed by Fidelity Investments Money Management, Inc. (FIMM), an affiliate of FMR.
A complete unaudited list of holdings for each Fidelity Central Fund is available upon request or at the Securities and Exchange Commission (the SEC) web site at www.sec.gov. In addition, the financial statements of the Fidelity Central Funds, which are not covered by the Fund's Report of Independent Registered Public Accounting Firm, are available on the SEC web site or upon request.
3. Significant Accounting Policies.
The financial statements have been prepared in conformity with accounting principles generally accepted in the United States of America (GAAP), which require management to make certain estimates and assumptions at the date of the financial statements. Actual results could differ from those estimates. Subsequent events, if any, through the date that the financial statements were issued have been evaluated in the preparation of the financial statements. The following summarizes the significant accounting policies of the Fund:
Security Valuation. Investments are valued as of 4:00 p.m. Eastern time on the last calendar day of the period. The Fund uses independent pricing services approved by the Board of Trustees to value its investments. When current market prices or quotations are not readily available or reliable, valuations may be determined in good faith in accordance with procedures adopted by the Board of Trustees. Factors used in determining value may include market or security specific events. The frequency with which these procedures are used cannot be predicted and they may be utilized to a significant extent. The value used for net asset value (NAV) calculation under these procedures may differ from published prices for the same securities.
The Fund categorizes the inputs to valuation techniques used to value its investments into a disclosure hierarchy consisting of three levels as shown below:
Level 1 - quoted prices in active markets for identical investments
Level 2 - other significant observable inputs (including quoted prices for similar investments, interest rates, prepayment speeds, etc.)
Level 3 - unobservable inputs (including the Fund's own assumptions based on the best information available)
Changes in valuation techniques may result in transfers in or out of an assigned level within the disclosure hierarchy. The aggregate value of investments by input level, as of July 31, 2011, is included at the end of the Fund's Schedule of Investments. Valuation techniques used to value the Fund's investments by major category are as follows:
Equity securities, including restricted securities, for which market quotations are readily available, are valued at the last reported sale price or official closing price as reported by an independent pricing service on the primary market or exchange on which they are traded and are categorized as Level 1 in the hierarchy. In the event there were no sales during the day or closing prices are not available, securities are valued at the last quoted bid price or may be valued using the last available price and are generally categorized as Level 2 in the hierarchy. For foreign equity securities, when significant market or security specific events arise, comparisons to the valuation of American Depositary Receipts (ADRs), futures contracts, Exchange-traded
Annual Report
3. Significant Accounting Policies - continued
Security Valuation - continued
funds (ETFs) and certain indexes as well as quoted prices for similar securities are used and are categorized as Level 2 in the hierarchy in these circumstances. Utilizing these techniques may result in transfers between Level 1 and Level 2. For restricted equity securities and private placements where observable inputs are limited, assumptions about market activity and risk are used and are categorized as Level 3 in the hierarchy.
Investments in open-end mutual funds, including the Fidelity Central Funds, are valued at their closing net asset value each business day and are categorized as Level 1 in the hierarchy.
Foreign Currency. The Fund may use foreign currency contracts to facilitate transactions in foreign-denominated securities. Gains and losses from these transactions may arise from changes in the value of the foreign currency or if the counterparties do not perform under the contracts' terms.
Foreign-denominated assets, including investment securities, and liabilities are translated into U.S. dollars at the exchange rate at period end. Purchases and sales of investment securities, income and dividends received and expenses denominated in foreign currencies are translated into U.S. dollars at the exchange rate in effect on the transaction date.
The effects of exchange rate fluctuations on investments are included with the net realized and unrealized gain (loss) on investment securities. Other foreign currency transactions resulting in realized and unrealized gain (loss) are disclosed separately.
Investment Transactions and Income. For financial reporting purposes, the Fund's investment holdings and NAV include trades executed through the end of the last business day of the period. The NAV per share for processing shareholder transactions is calculated as of the close of business of the New York Stock Exchange (NYSE), normally 4:00 p.m. Eastern time and includes trades executed through the end of the prior business day. Gains and losses on securities sold are determined on the basis of identified cost and may include proceeds received from litigation. Dividend income is recorded on the ex-dividend date, except for certain dividends from foreign securities where the ex-dividend date may have passed, which are recorded as soon as the Fund is informed of the ex-dividend date. Non-cash dividends included in dividend income, if any, are recorded at the fair market value of the securities received. Distributions received on securities that represent a return of capital or capital gain are recorded as a reduction of cost of investments and/or as a realized gain. The Fund estimates the components of distributions received that may be considered return of capital distributions or capital gain distributions. Interest income and distributions from the Fidelity Central Funds are accrued as earned. Interest income includes coupon interest and amortization of premium and accretion of discount on debt securities. Investment income is recorded net of foreign taxes withheld where recovery of such taxes is uncertain.
Expenses. Expenses directly attributable to a fund are charged to that fund. Expenses attributable to more than one fund are allocated among the respective funds on the basis of relative net assets or other appropriate methods. Expense estimates are accrued in the period to which they relate and adjustments are made when actual amounts are known.
Income Tax Information and Distributions to Shareholders. Each year, the Fund intends to qualify as a regulated investment company, including distributing substantially all of its taxable income and realized gains under Subchapter M of the Internal Revenue Code and filing its U.S. federal tax return. As a result, no provision for income taxes is required. As of July 31, 2011, the Fund did not have any unrecognized tax benefits in the financial statements. A fund's federal tax return is subject to examination by the Internal Revenue Service (IRS) for a period of three years. Foreign taxes are provided for based on the Fund's understanding of the tax rules and rates that exist in the foreign markets in which it invests.
Distributions are declared and recorded on the ex-dividend date. Income dividends and capital gain distributions are declared separately for each class. Income and capital gain distributions are determined in accordance with income tax regulations, which may differ from GAAP.
Capital accounts within the financial statements are adjusted for permanent book-tax differences. These adjustments have no impact on net assets or the results of operations. Temporary book-tax differences will reverse in a subsequent period.
Book-tax differences are primarily due to foreign currency transactions, certain foreign taxes, partnerships, deferred trustees compensation, passive foreign investment companies (PFIC), equity-debt classifications, net operating losses, capital loss carryforwards and losses deferred due to wash sales and excise tax regulations.
The federal tax cost of investment securities and unrealized appreciation (depreciation) as of period end were as follows:
Gross unrealized appreciation | $ 1,798,219 |
Gross unrealized depreciation | (10,684,574) |
Net unrealized appreciation (depreciation) on securities and other investments | $ (8,886,355) |
| |
Tax Cost | $ 144,274,309 |
Annual Report
Notes to Financial Statements - continued
3. Significant Accounting Policies - continued
Income Tax Information and Distributions to Shareholders - continued
The tax-based components of distributable earnings as of period end were as follows:
Capital loss carryforward | $ (79,374,743) |
Net unrealized appreciation (depreciation) | $ (8,886,884) |
The tax character of distributions paid was as follows:
| July 31, 2011 | July 31, 2010 |
Ordinary Income | $ - | $ 1,313,190 |
Under the recently enacted Regulated Investment Company Modernization Act of 2010 (the Act), the Fund will be permitted to carry forward capital losses incurred in taxable years beginning after December 22, 2010 for an unlimited period. However, any losses incurred during those future taxable years will be required to be utilized prior to any losses incurred in pre-enactment taxable years, which generally expire after eight years from when they are incurred. Additionally, post-enactment capital losses that are carried forward will retain their character as either short-term or long-term capital losses rather than being considered all short-term as under previous law. The Fund's first fiscal year end subject to the Act will be July 31, 2012.
Short-Term Trading (Redemption) Fees. Shares held by investors in the Fund less than 30 days are subject to a redemption fee equal to .75% of the net asset value of shares redeemed. All redemption fees, which reduce the proceeds of the shareholder redemption, are retained by the Fund and accounted for as an addition to paid in capital.
New Accounting Pronouncement. In May 2011, the Financial Accounting Standards Board issued Accounting Standard Update No. 2011-04, Fair Value Measurement (Topic 820) - Amendments to Achieve Common Fair Value Measurement and Disclosure Requirements in U.S. GAAP and IFRSs. The update changes the wording used to describe the requirements in GAAP for measuring fair value and for disclosing information about fair value measurements. The update is effective during interim and annual periods beginning after December 15, 2011. Management is currently evaluating the impact of the update's adoption on the Fund's financial statement disclosures.
4. Purchases and Sales of Investments.
Purchases and sales of securities, other than short-term securities, aggregated $369,637,585 and $388,315,677, respectively.
The Fund realized a gain on the sale of an investment not meeting the investment restrictions of the Fund.
5. Fees and Other Transactions with Affiliates.
Management Fee. FMR and its affiliates provide the Fund with investment management related services for which the Fund pays a monthly management fee. The management fee is the sum of an individual fund fee rate that is based on an annual rate of .30% of the Fund's average net assets and a group fee rate that averaged .26% during the period. The group fee rate is based upon the average net assets of all the mutual funds advised by FMR. The group fee rate decreases as assets under management increase and increases as assets under management decrease. For the period, the total annual management fee rate was .56% of the Fund's average net assets.
Annual Report
5. Fees and Other Transactions with Affiliates - continued
Distribution and Service Plan Fees. In accordance with Rule 12b-1 of the 1940 Act, the Fund has adopted separate Distribution and Service Plans for each class of shares. Certain classes pay Fidelity Distributors Corporation (FDC), an affiliate of FMR, separate Distribution and Service Fees, each of which is based on an annual percentage of each class' average net assets. In addition, FDC may pay financial intermediaries for selling shares of the Fund and providing shareholder support services. For the period, the Distribution and Service Fee rates, total fees and amounts retained by FDC were as follows:
| Distribution
Fee | Service
Fee | Total Fees | Retained
by FDC |
Class A | -% | .25% | $ 176,564 | $ 22,382 |
Class T | .25% | .25% | 157,692 | 732 |
Class B | .75% | .25% | 93,556 | 70,295 |
Class C | .75% | .25% | 277,693 | 39,629 |
| | | $ 705,505 | $ 133,038 |
Sales Load. FDC may receive a front-end sales charge of up to 5.75% for selling Class A shares, and 3.50% for selling Class T shares, some of which is paid to financial intermediaries for selling shares of the Fund. Depending on the holding period, FDC may receive contingent deferred sales charges levied on Class A, Class T, Class B, and Class C redemptions. The deferred sales charges range from 5% to 1% for Class B, 1% for Class C, 1.00% for certain purchases of Class A shares and .25% for certain purchases of Class T shares.
For the period, sales charge amounts retained by FDC were as follows:
| Retained
by FDC |
Class A | $ 54,057 |
Class T | 5,686 |
Class B* | 23,237 |
Class C* | 5,433 |
| $ 88,413 |
* When Class B and Class C shares are initially sold, FDC pays commissions from its own resources to financial intermediaries through which the sales are made.
Transfer Agent Fees. Fidelity Investments Institutional Operations Company, Inc. (FIIOC), an affiliate of FMR, is the transfer, dividend disbursing and shareholder servicing agent for each class of the Fund. FIIOC receives account fees and asset-based fees that vary according to the account size and type of account of the shareholders of the respective classes of the Fund. FIIOC pays for typesetting, printing and mailing of shareholder reports, except proxy statements. For the period, transfer agent fees for each class were as follows:
| Amount | % of
Average
Net Assets |
Class A | $ 213,053 | .30 |
Class T | 97,782 | .31 |
Class B | 28,168 | .30 |
Class C | 83,593 | .30 |
Institutional Class | 17,277 | .25 |
| $ 439,873 | |
Accounting and Security Lending Fees. Fidelity Service Company, Inc. (FSC), an affiliate of FMR, maintains the Fund's accounting records. The accounting fee is based on the level of average net assets for the month. Under a separate contract, FSC administers the security lending program. The security lending fee is based on the number and duration of lending transactions.
Brokerage Commissions. The Fund placed a portion of its portfolio transactions with brokerage firms which are affiliates of the investment adviser. The commissions paid to these affiliated firms were $25,705 for the period.
Annual Report
Notes to Financial Statements - continued
6. Committed Line of Credit.
The Fund participates with other funds managed by FMR or an affiliate in a $4.0 billion credit facility (the "line of credit") to be utilized for temporary or emergency purposes to fund shareholder redemptions or for other short-term liquidity purposes. The Fund has agreed to pay commitment fees on its pro-rata portion of the line of credit, which amounted to $498 and is reflected in Miscellaneous expenses on the Statement of Operations. During the period, there were no borrowings on this line of credit.
7. Security Lending.
The Fund lends portfolio securities through a lending agent from time to time in order to earn additional income. The lending agent may loan securities to certain qualified borrowers, including Fidelity Capital Markets (FCM), a broker-dealer affiliated with the Fund. On the settlement date of the loan, the Fund receives collateral (in the form of U.S. Treasury obligations, letters of credit and/or cash) against the loaned securities and maintains collateral in an amount not less than 100% of the market value of the loaned securities during the period of the loan. The market value of the loaned securities is determined at the close of business of the Fund and any additional required collateral is delivered to the Fund on the next business day. If the borrower defaults on its obligation to return the securities loaned because of insolvency or other reasons, a fund could experience delays and costs in recovering the securities loaned or in gaining access to the collateral. Any cash collateral received is invested in the Fidelity Securities Lending Cash Central Fund. The value of loaned securities and cash collateral at period end are disclosed on the Fund's Statement of Assets and Liabilities. Security lending income represents the income earned on investing cash collateral, less rebates paid to borrowers and lending agent fees associated with the loan, plus any premium payments received for lending certain types of securities. Security lending income is presented in the Statement of Operations as a component of income from Fidelity Central Funds. Total security lending income during the period amounted to $25,052. During the period, there were no securities loaned to FCM.
8. Expense Reductions.
Many of the brokers with whom FMR places trades on behalf of the Fund provided services to the Fund in addition to trade execution. These services included payments of certain expenses on behalf of the Fund totaling $68,182 for the period.
9. Distributions to Shareholders.
Distributions to shareholders of each class were as follows:
Years ended July 31, | 2011 | 2010 |
From net investment income | | |
Class A | $ - | $ 686,640 |
Class T | - | 298,090 |
Class B | - | 78,308 |
Class C | - | 206,470 |
Institutional Class | - | 43,682 |
Total | $ - | $ 1,313,190 |
10. Share Transactions.
Transactions for each class of shares were as follows:
| Shares | Dollars |
Years ended July 31, | 2011 | 2010 | 2011 | 2010 |
Class A | | | | |
Shares sold | 2,161,457 | 2,082,714 | $ 22,928,387 | $ 22,402,196 |
Reinvestment of distributions | - | 58,808 | - | 610,428 |
Shares redeemed | (2,543,428) | (2,567,565) | (27,053,427) | (27,335,650) |
Net increase (decrease) | (381,971) | (426,043) | $ (4,125,040) | $ (4,323,026) |
Class T | | | | |
Shares sold | 432,428 | 481,524 | $ 4,608,539 | $ 5,227,941 |
Reinvestment of distributions | - | 27,047 | - | 280,751 |
Shares redeemed | (958,085) | (952,462) | (10,097,220) | (10,134,806) |
Net increase (decrease) | (525,657) | (443,891) | $ (5,488,681) | $ (4,626,114) |
Annual Report
10. Share Transactions - continued
| Shares | Dollars |
Years ended July 31, | 2011 | 2010 | 2011 | 2010 |
Class B | | | | |
Shares sold | 48,520 | 217,909 | $ 510,105 | $ 2,331,426 |
Reinvestment of distributions | - | 6,452 | - | 65,677 |
Shares redeemed | (369,736) | (472,669) | (3,763,785) | (4,904,869) |
Net increase (decrease) | (321,216) | (248,308) | $ (3,253,680) | $ (2,507,766) |
Class C | | | | |
Shares sold | 446,364 | 749,668 | $ 4,631,347 | $ 8,032,665 |
Reinvestment of distributions | - | 17,064 | - | 172,172 |
Shares redeemed | (1,122,959) | (913,840) | (11,383,791) | (9,328,999) |
Net increase (decrease) | (676,595) | (147,108) | $ (6,752,444) | $ (1,124,162) |
Institutional Class | | | | |
Shares sold | 691,657 | 278,977 | $ 7,779,752 | $ 3,114,760 |
Reinvestment of distributions | - | 3,007 | - | 31,721 |
Shares redeemed | (387,007) | (184,671) | (4,196,861) | (2,016,339) |
Net increase (decrease) | 304,650 | 97,313 | $ 3,582,891 | $ 1,130,142 |
11. Other.
The Fund's organizational documents provide former and current trustees and officers with a limited indemnification against liabilities arising in connection with the performance of their duties to the Fund. In the normal course of business, the Fund may also enter into contracts that provide general indemnifications. The Fund's maximum exposure under these arrangements is unknown as this would be dependent on future claims that may be made against the Fund. The risk of material loss from such claims is considered remote.
Annual Report
Fidelity Advisor Health Care Fund - Class A, T, B, and C
Performance: The Bottom Line
Average annual total return reflects the change in the value of an investment, assuming reinvestment of the class' distributions from dividend income and capital gains (the profits earned upon the sale of securities that have grown in value, if any) and assuming a constant rate of performance each year. The $10,000 table and the fund's returns do not reflect the deduction of taxes that a shareholder would pay on fund distributions or the redemption of fund shares. During periods of reimbursement by Fidelity, a fund's total return will be greater than it would be had the reimbursement not occurred. How a fund did yesterday is no guarantee of how it will do tomorrow. Returns reflect the conversion of Class B shares to Class A shares after a maximum of seven years.
Average Annual Total Returns
Periods ended July 31, 2011 | Past 1
year | Past 5
years | Past 10
years |
Class A (incl. 5.75% sales charge) | 26.92% | 5.01% | 4.07% |
Class T (incl. 3.50% sales charge) | 29.64% | 5.24% | 4.05% |
Class B (incl. contingent deferred sales charge) A | 28.66% | 5.14% | 4.14% |
Class C (incl. contingent deferred sales charge) B | 32.66% | 5.49% | 3.95% |
A Class B shares' contingent deferred sales charges included in the past one year, past five years, and past ten years total return figures are 5%, 2%, and 0%, respectively.
B Class C shares' contingent deferred sales charges included in the past one year, past five years, and past ten years total return figures are 1%, 0%, and 0%, respectively.
$10,000 Over 10 Years
Let's say hypothetically that $10,000 was invested in Fidelity Advisor Health Care Fund - Class A on July 31, 2001, and the current 5.75% sales charge was paid. The chart shows how the value of your investment would have changed, and also shows how the S&P 500 Index performed over the same period.
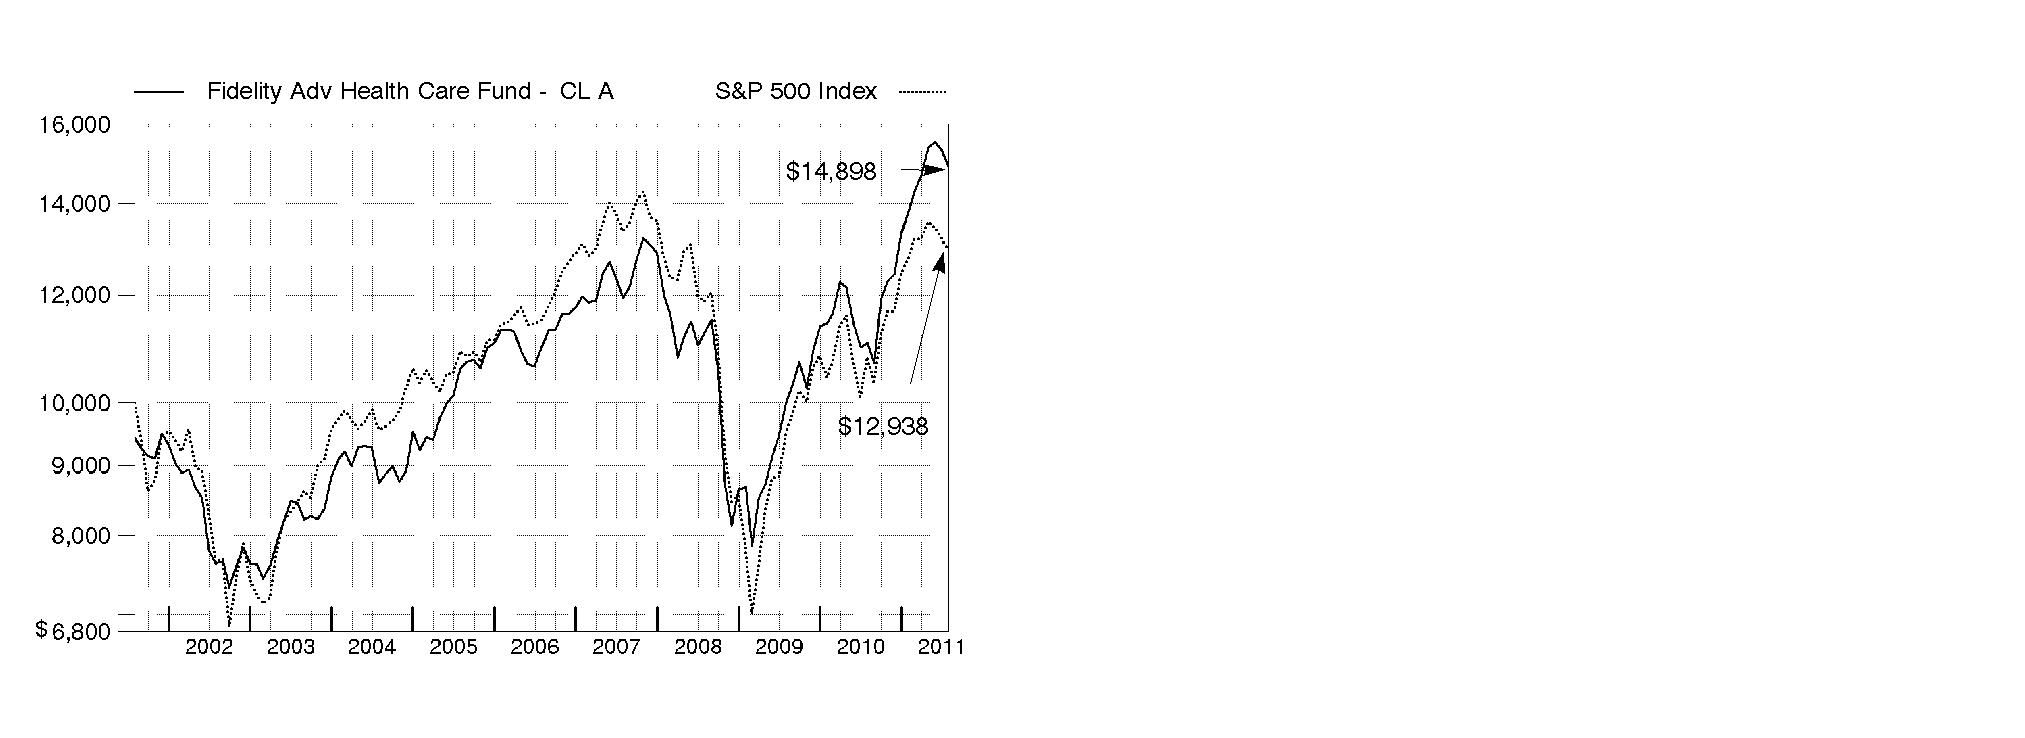
Annual Report
Fidelity Advisor Health Care Fund
Market Recap: U.S. stocks registered solid double-digit gains for the 12 months ending July 31, 2011, extending a rally that began more than two years earlier. Despite a rough start in August 2010, markets turned positive in September, as increased demand for capital goods and other upbeat indicators trumped investor worry about a U.S. recessionary relapse. The broad market, as measured by the S&P 500® Index, rose 9% that month, its biggest September gain in 71 years. Seven more monthly advances followed, fueled by encouraging corporate earnings and economic activity. However, volatility picked up in the period's latter months, as markets reacted to continued high U.S. unemployment, nagging debt troubles in Europe and looming legislative battles over the federal debt ceiling. May unemployment rose above 9% for the first time in 2011, contributing to a traditional "June swoon" for stocks. Market uncertainty lingered in July, when the S&P 500® posted its second-biggest monthly loss of the period. For the full year, the S&P 500® climbed 19.65%, while the blue-chip-laden Dow Jones Industrial AverageSM rose a comparable 19.09% and the technology-heavy Nasdaq Composite® Index gained 23.40%. On the capitalization spectrum, stocks of mid-cap companies fared best, with the Russell Midcap® Index rising 24.51% and the small-cap Russell 2000® Index adding 23.92%.
Comments from Edward Yoon, Portfolio Manager of Fidelity Advisor® Health Care Fund: For the 12 months ending July 31, 2011, the fund's Class A, Class T, Class B and Class C shares returned 34.67%, 34.34%, 33.66% and 33.66%, respectively (excluding sales charges), decisively outperforming both the 23.86% gain of the MSCI® U.S. IM Health Care 25/50 Index and the smaller rise of the broadly based S&P 500® Index. My choices within pharmaceuticals provided a big boost versus the sector benchmark, led by an out-of-benchmark investment in Valeant Pharmaceuticals International and underweightings in weak-performing large-cap names such as Johnson & Johnson and Abbott Laboratories. Positioning in life science tools/services, such as Illumina (genetic analysis technology) and Agilent Technologies (food and water testing), also helped. Good picks in biotechnology - Alexion Pharmaceuticals (blood disease) and ARIAD Pharmaceuticals (cancer) - contributed as well. On the other hand, underweighting the top-performing managed health care industry - including UnitedHealth Group and WellPoint - and large-cap drugmaker Pfizer notably detracted. An untimely overweighting in Community Health Systems (acute care hospitals) also hurt, as did an out-of-index position in WebMD Health (online medical information). I sold some of the above stocks during the period.
Comments from Edward Yoon, Portfolio Manager of Fidelity® Advisor Health Care Fund: For the 12 months ending July 31, 2011, the fund's Institutional Class shares returned 35.00%, decisively outperforming both the 23.86% gain of the MSCI® U.S. IM Health Care 25/50 Index and the smaller advance of the broadly based S&P 500® Index. My choices within pharmaceuticals provided a big boost versus the sector benchmark, led by an out-of-benchmark investment in Valeant Pharmaceuticals International and underweightings in weak-performing large-cap names such as Johnson & Johnson and Abbott Laboratories. Positioning in life science tools/services, such as Illumina (genetic analysis technology) and Agilent Technologies (food and water testing), also helped. Good picks in biotechnology - Alexion Pharmaceuticals (blood disease) and ARIAD Pharmaceuticals (cancer) - contributed as well. On the other hand, underweighting the top-performing managed health care industry - including UnitedHealth Group and WellPoint - and large-cap drugmaker Pfizer notably detracted. An untimely overweighting in Community Health Systems (acute care hospitals) also hurt, as did an out-of-index position in WebMD Health (online medical information). I sold some of the above stocks during the period.
The views expressed above reflect those of the portfolio manager(s) only through the end of the period as stated on the cover of this report and do not necessarily represent the views of Fidelity or any other person in the Fidelity organization. Any such views are subject to change at any time based upon market or other conditions and Fidelity disclaims any responsibility to update such views. These views may not be relied on as investment advice and, because investment decisions for a Fidelity fund are based on numerous factors, may not be relied on as an indication of trading intent on behalf of any Fidelity fund.
Annual Report
Fidelity Advisor Health Care Fund
As a shareholder of the Fund, you incur two types of costs: (1) transaction costs, including sales charges (loads) on purchase payments or redemption proceeds, redemption fees, and (2) ongoing costs, including management fees, distribution and/or service (12b-1) fees and other Fund expenses. This Example is intended to help you understand your ongoing costs (in dollars) of investing in the Fund and to compare these costs with the ongoing costs of investing in other mutual funds.
The Example is based on an investment of $1,000 invested at the beginning of the period and held for the entire period (February 1, 2011 to July 31, 2011).
Actual Expenses
The first line of the accompanying table for each class of the Fund provides information about actual account values and actual expenses. You may use the information in this line, together with the amount you invested, to estimate the expenses that you paid over the period. Simply divide your account value by $1,000.00 (for example, an $8,600 account value divided by $1,000.00 = 8.6), then multiply the result by the number in the first line for a class of the Fund under the heading entitled "Expenses Paid During Period" to estimate the expenses you paid on your account during this period. In addition, the Fund, as a shareholder in the underlying Fidelity Central Funds, will indirectly bear its pro-rata share of the fees and expenses incurred by the underlying Fidelity Central Funds. These fees and expenses are not included in the Fund's annualized expense ratio used to calculate the expense estimate in the table below.
Hypothetical Example for Comparison Purposes
The second line of the accompanying table for each class of the Fund provides information about hypothetical account values and hypothetical expenses based on a Class' actual expense ratio and an assumed rate of return of 5% per year before expenses, which is not the Class' actual return. The hypothetical account values and expenses may not be used to estimate the actual ending account balance or expenses you paid for the period. You may use this information to compare the ongoing costs of investing in the Fund and other funds. To do so, compare this 5% hypothetical example with the 5% hypothetical examples that appear in the shareholder reports of the other funds. In addition, the Fund, as a shareholder in the underlying Fidelity Central Funds, will indirectly bear its pro-rata share of the fees and expenses incurred by the underlying Fidelity Central Funds. These fees and expenses are not included in the Fund's annualized expense ratio used to calculate the expense estimate in the table below.
Please note that the expenses shown in the table are meant to highlight your ongoing costs only and do not reflect any transaction costs. Therefore, the second line of the table is useful in comparing ongoing costs only, and will not help you determine the relative total costs of owning different funds. In addition, if these transactional costs were included, your costs would have been higher.
| Annualized
Expense Ratio | Beginning
Account Value
February 1, 2011 | Ending
Account Value
July 31, 2011 | Expenses Paid
During Period*
February 1, 2011 to July 31, 2011 |
Class A | 1.18% | | | |
Actual | | $ 1,000.00 | $ 1,082.50 | $ 6.09 |
Hypothetical A | | $ 1,000.00 | $ 1,018.94 | $ 5.91 |
Class T | 1.42% | | | |
Actual | | $ 1,000.00 | $ 1,081.60 | $ 7.33 |
Hypothetical A | | $ 1,000.00 | $ 1,017.75 | $ 7.10 |
Class B | 1.93% | | | |
Actual | | $ 1,000.00 | $ 1,078.20 | $ 9.94 |
Hypothetical A | | $ 1,000.00 | $ 1,015.22 | $ 9.64 |
Class C | 1.88% | | | |
Actual | | $ 1,000.00 | $ 1,078.90 | $ 9.69 |
Hypothetical A | | $ 1,000.00 | $ 1,015.47 | $ 9.39 |
Institutional Class | .86% | | | |
Actual | | $ 1,000.00 | $ 1,084.10 | $ 4.44 |
Hypothetical A | | $ 1,000.00 | $ 1,020.53 | $ 4.31 |
A 5% return per year before expenses
* Expenses are equal to each Class' annualized expense ratio, multiplied by the average account value over the period, multiplied by 181/365 (to reflect the one-half year period).
Annual Report
Fidelity Advisor Health Care Fund
Investment Changes (Unaudited)
Top Ten Stocks as of July 31, 2011 |
| % of fund's
net assets | % of fund's net assets
6 months ago |
Covidien PLC | 6.3 | 4.9 |
Baxter International, Inc. | 5.1 | 0.6 |
Amgen, Inc. | 5.0 | 2.5 |
Thermo Fisher Scientific, Inc. | 3.4 | 2.4 |
Medco Health Solutions, Inc. | 2.9 | 6.5 |
Boston Scientific Corp. | 2.8 | 0.9 |
Sanofi-Aventis sponsored ADR | 2.8 | 0.0 |
Valeant Pharmaceuticals International, Inc. (Canada) | 2.8 | 2.9 |
Illumina, Inc. | 2.7 | 6.4 |
Alexion Pharmaceuticals, Inc. | 2.6 | 2.1 |
| 36.4 | |
Top Industries (% of fund's net assets) |
As of July 31, 2011 |
| Health Care Equipment & Supplies | 23.1% | |
| Biotechnology | 21.9% | |
| Health Care Providers & Services | 21.4% | |
| Pharmaceuticals | 15.3% | |
| Life Sciences Tools & Services | 9.7% | |
| All Others* | 8.6% | |

As of January 31, 2011 |
| Health Care Providers & Services | 22.5% | |
| Biotechnology | 19.7% | |
| Health Care Equipment & Supplies | 18.7% | |
| Life Sciences Tools & Services | 16.3% | |
| Pharmaceuticals | 15.3% | |
| All Others* | 7.5% | |

* Includes short-term investments and net other assets. |
Annual Report
Fidelity Advisor Health Care Fund
Investments July 31, 2011
Showing Percentage of Net Assets
Common Stocks - 97.9% |
| Shares | | Value |
BIOTECHNOLOGY - 21.9% |
Biotechnology - 21.9% |
Achillion Pharmaceuticals, Inc. (a) | 269,100 | | $ 1,994,031 |
Acorda Therapeutics, Inc. (a) | 135,027 | | 3,834,767 |
Affymax, Inc. (a) | 103,500 | | 684,135 |
Alexion Pharmaceuticals, Inc. (a) | 224,186 | | 12,733,765 |
AMAG Pharmaceuticals, Inc. (a)(d) | 51,800 | | 767,158 |
Amgen, Inc. | 450,512 | | 24,643,006 |
Anthera Pharmaceuticals, Inc. (a) | 226,988 | | 1,809,094 |
Ardea Biosciences, Inc. (a) | 175,000 | | 4,095,000 |
ARIAD Pharmaceuticals, Inc. (a) | 359,985 | | 4,280,222 |
AVEO Pharmaceuticals, Inc. (a) | 58,354 | | 1,115,145 |
Biogen Idec, Inc. (a) | 73,279 | | 7,464,932 |
BioMarin Pharmaceutical, Inc. (a) | 400,000 | | 12,492,000 |
Chelsea Therapeutics International Ltd. (a) | 222,100 | | 1,114,942 |
Dynavax Technologies Corp. (a)(d) | 650,000 | | 1,820,000 |
Gilead Sciences, Inc. (a) | 145,768 | | 6,174,732 |
Human Genome Sciences, Inc. (a) | 94,000 | | 1,974,940 |
Idenix Pharmaceuticals, Inc. (a) | 1,600 | | 10,688 |
Incyte Corp. (a)(d) | 86,582 | | 1,509,990 |
Inhibitex, Inc. (a) | 267,200 | | 1,106,208 |
Medivir AB (B Shares) (a) | 101,300 | | 2,012,524 |
Micromet, Inc. (a)(d) | 103,300 | | 584,678 |
Neurocrine Biosciences, Inc. (a) | 146,300 | | 1,130,899 |
NPS Pharmaceuticals, Inc. (a) | 129,800 | | 1,253,868 |
Seattle Genetics, Inc. (a)(d) | 101,257 | | 1,724,407 |
Targacept, Inc. (a) | 130,715 | | 2,671,815 |
Theravance, Inc. (a)(d) | 155,400 | | 3,322,452 |
United Therapeutics Corp. (a) | 88,848 | | 5,098,098 |
YM Biosciences, Inc. (a) | 204,900 | | 482,547 |
| | 107,906,043 |
DIVERSIFIED CONSUMER SERVICES - 0.5% |
Specialized Consumer Services - 0.5% |
Carriage Services, Inc. | 222,555 | | 1,270,789 |
Stewart Enterprises, Inc. Class A | 154,043 | | 1,070,599 |
| | 2,341,388 |
FOOD & STAPLES RETAILING - 1.8% |
Drug Retail - 1.8% |
CVS Caremark Corp. | 144,300 | | 5,245,305 |
Droga Raia SA | 21,000 | | 389,215 |
Drogasil SA | 178,800 | | 1,440,820 |
Rite Aid Corp. (a) | 1,332,400 | | 1,732,120 |
| | 8,807,460 |
HEALTH CARE EQUIPMENT & SUPPLIES - 23.1% |
Health Care Equipment - 21.3% |
Baxter International, Inc. | 427,500 | | 24,867,675 |
Boston Scientific Corp. (a) | 1,958,211 | | 14,020,791 |
|
| Shares | | Value |
C. R. Bard, Inc. | 96,910 | | $ 9,563,079 |
Conceptus, Inc. (a) | 155,400 | | 1,770,006 |
Covidien PLC | 607,954 | | 30,877,985 |
Cyberonics, Inc. (a) | 65,720 | | 1,783,641 |
Edwards Lifesciences Corp. (a) | 130,452 | | 9,307,750 |
Genmark Diagnostics, Inc. (a) | 27,400 | | 136,178 |
HeartWare International, Inc. (a) | 29,000 | | 1,926,760 |
Integra LifeSciences Holdings Corp. (a) | 60,101 | | 2,708,752 |
Masimo Corp. | 111,071 | | 3,085,552 |
Orthofix International NV (a) | 43,205 | | 1,824,547 |
William Demant Holding A/S (a) | 31,869 | | 2,796,578 |
| | 104,669,294 |
Health Care Supplies - 1.8% |
Endologix, Inc. (a) | 270,000 | | 2,451,600 |
The Cooper Companies, Inc. | 81,850 | | 6,260,707 |
| | 8,712,307 |
TOTAL HEALTH CARE EQUIPMENT & SUPPLIES | | 113,381,601 |
HEALTH CARE PROVIDERS & SERVICES - 21.4% |
Health Care Distributors & Services - 2.2% |
Amplifon SpA | 269,971 | | 1,732,396 |
McKesson Corp. | 112,591 | | 9,133,382 |
| | 10,865,778 |
Health Care Facilities - 2.8% |
Emeritus Corp. (a) | 95,575 | | 1,878,049 |
Hanger Orthopedic Group, Inc. (a) | 89,965 | | 1,890,165 |
HCA Holdings, Inc. | 122,100 | | 3,257,628 |
HealthSouth Corp. (a) | 133,200 | | 3,250,080 |
LCA-Vision, Inc. (a) | 191,300 | | 805,373 |
Sunrise Senior Living, Inc. (a)(d) | 291,509 | | 2,571,109 |
| | 13,652,404 |
Health Care Services - 10.7% |
Accretive Health, Inc. (a)(d) | 178,045 | | 5,348,472 |
Express Scripts, Inc. (a) | 225,486 | | 12,234,870 |
Fresenius Medical Care AG & Co. KGaA | 73,100 | | 5,610,007 |
Laboratory Corp. of America Holdings (a) | 22,300 | | 2,023,948 |
Medco Health Solutions, Inc. (a) | 224,975 | | 14,146,428 |
MEDNAX, Inc. (a) | 42,600 | | 2,903,616 |
Omnicare, Inc. | 247,500 | | 7,548,750 |
Sun Healthcare Group, Inc. (a) | 72,332 | | 506,324 |
Team Health Holdings, Inc. (a) | 111,000 | | 2,443,110 |
| | 52,765,525 |
Managed Health Care - 5.7% |
CIGNA Corp. | 156,200 | | 7,774,074 |
Humana, Inc. | 32,900 | | 2,453,682 |
UnitedHealth Group, Inc. | 133,967 | | 6,648,782 |
Common Stocks - continued |
| Shares | | Value |
HEALTH CARE PROVIDERS & SERVICES - CONTINUED |
Managed Health Care - continued |
Universal American Spin Corp. (a) | 106,100 | | $ 1,009,011 |
WellPoint, Inc. | 145,600 | | 9,835,280 |
| | 27,720,829 |
TOTAL HEALTH CARE PROVIDERS & SERVICES | | 105,004,536 |
HEALTH CARE TECHNOLOGY - 1.8% |
Health Care Technology - 1.8% |
Allscripts-Misys Healthcare Solutions, Inc. (a) | 261,443 | | 4,745,190 |
athenahealth, Inc. (a) | 68,000 | | 3,997,720 |
| | 8,742,910 |
INTERNET SOFTWARE & SERVICES - 0.8% |
Internet Software & Services - 0.8% |
WebMD Health Corp. (a) | 112,457 | | 3,964,109 |
LIFE SCIENCES TOOLS & SERVICES - 9.7% |
Life Sciences Tools & Services - 9.7% |
Agilent Technologies, Inc. (a) | 112,412 | | 4,739,290 |
Bruker BioSciences Corp. (a) | 233,145 | | 4,014,757 |
Covance, Inc. (a) | 62,193 | | 3,560,549 |
Illumina, Inc. (a)(d) | 209,348 | | 13,073,783 |
QIAGEN NV (a) | 155,886 | | 2,640,709 |
Sequenom, Inc. (a)(d) | 400,000 | | 2,824,000 |
Thermo Fisher Scientific, Inc. (a) | 279,259 | | 16,780,673 |
| | 47,633,761 |
MACHINERY - 0.0% |
Industrial Machinery - 0.0% |
Pall Corp. | 3,700 | | 183,446 |
PERSONAL PRODUCTS - 0.3% |
Personal Products - 0.3% |
Prestige Brands Holdings, Inc. (a) | 138,572 | | 1,693,350 |
PHARMACEUTICALS - 15.2% |
Pharmaceuticals - 15.2% |
Cardiome Pharma Corp. (a) | 279,000 | | 1,387,115 |
Columbia Laboratories, Inc. (a)(d) | 260,000 | | 743,600 |
Elan Corp. PLC sponsored ADR (a) | 222,100 | | 2,456,426 |
Eli Lilly & Co. | 113,500 | | 4,347,050 |
Medicis Pharmaceutical Corp. Class A | 124,103 | | 4,614,150 |
Merck & Co., Inc. | 314,595 | | 10,737,127 |
Optimer Pharmaceuticals, Inc. (a)(d) | 112,454 | | 1,189,763 |
Perrigo Co. | 31,482 | | 2,843,139 |
Pfizer, Inc. | 221,488 | | 4,261,429 |
Sanofi-Aventis sponsored ADR (d) | 360,000 | | 13,950,000 |
Shire PLC sponsored ADR | 116,600 | | 12,126,400 |
Valeant Pharmaceuticals International, Inc. (Canada) (d) | 247,504 | | 13,623,859 |
|
| Shares | | Value |
Watson Pharmaceuticals, Inc. (a) | 22,300 | | $ 1,496,999 |
XenoPort, Inc. (a) | 118,900 | | 843,001 |
| | 74,620,058 |
PROFESSIONAL SERVICES - 0.5% |
Research & Consulting Services - 0.5% |
Qualicorp SA | 261,000 | | 2,439,724 |
SOFTWARE - 0.9% |
Application Software - 0.9% |
Nuance Communications, Inc. (a) | 222,100 | | 4,444,221 |
TOTAL COMMON STOCKS (Cost $400,332,212) | 481,162,607 |
Convertible Preferred Stocks - 0.1% |
| | | |
PHARMACEUTICALS - 0.1% |
Pharmaceuticals - 0.1% |
Merrimack Pharmaceuticals, Inc. Series G (e)
(Cost $562,611) | 80,373 | | 562,611 |
Money Market Funds - 9.1% |
| | | |
Fidelity Cash Central Fund, 0.14% (b) | 8,010,155 | | 8,010,155 |
Fidelity Securities Lending Cash Central Fund, 0.15% (b)(c) | 36,716,410 | | 36,716,410 |
TOTAL MONEY MARKET FUNDS (Cost $44,726,565) | 44,726,565 |
TOTAL INVESTMENT PORTFOLIO - 107.1% (Cost $445,621,388) | | 526,451,783 |
NET OTHER ASSETS (LIABILITIES) - (7.1)% | | (34,785,348) |
NET ASSETS - 100% | $ 491,666,435 |
Legend |
(a) Non-income producing |
(b) Affiliated fund that is available only to investment companies and other accounts managed by Fidelity Investments. The rate quoted is the annualized seven-day yield of the fund at period end. A complete unaudited listing of the fund's holdings as of its most recent quarter end is available upon request. In addition, each Fidelity Central Fund's financial statements, which are not covered by the Fund's Report of Independent Registered Public Accounting Firm, are available on the SEC's website or upon request. |
(c) Investment made with cash collateral received from securities on loan. |
(d) Security or a portion of the security is on loan at period end. |
(e) Restricted securities - Investment in securities not registered under the Securities Act of 1933 (excluding 144A issues). At the end of the period, the value of restricted securities (excluding 144A issues) amounted to $562,611 or 0.1% of net assets. |
Additional information on each restricted holding is as follows: |
Security | Acquisition Date | Acquisition Cost |
Merrimack Pharmaceuticals, Inc. Series G | 3/31/11 | $ 562,611 |
Affiliated Central Funds |
Information regarding fiscal year to date income earned by the Fund from investments in Fidelity Central Funds is as follows: |
Fund | Income earned |
Fidelity Cash Central Fund | $ 14,760 |
Fidelity Securities Lending Cash Central Fund | 136,970 |
Total | $ 151,730 |
Other Information |
The following is a summary of the inputs used, as of July 31, 2011, involving the Fund's assets and liabilities carried at fair value. The inputs or methodology used for valuing securities may not be an indication of the risk associated with investing in those securities. For more information on valuation inputs, and their aggregation into the levels used in the tables below, please refer to the Security Valuation section in the accompanying Notes to Financial Statements. |
Valuation Inputs at Reporting Date: |
Description | Total | Level 1 | Level 2 | Level 3 |
Investments in Securities: | | | | |
Common Stocks | $ 481,162,607 | $ 475,552,600 | $ 5,610,007 | $ - |
Convertible Preferred Stocks | 562,611 | - | - | 562,611 |
Money Market Funds | 44,726,565 | 44,726,565 | - | - |
Total Investments in Securities: | $ 526,451,783 | $ 520,279,165 | $ 5,610,007 | $ 562,611 |
The following is a reconciliation of Investments in Securities for which Level 3 inputs were used in determining value: |
Investments in Securities: | |
Beginning Balance | $ - |
Total Realized Gain (Loss) | - |
Total Unrealized Gain (Loss) | - |
Cost of Purchases | 562,611 |
Proceeds of Sales | - |
Amortization/Accretion | - |
Transfers in to Level 3 | - |
Transfers out of Level 3 | - |
Ending Balance | $ 562,611 |
The change in unrealized gain (loss) for the period attributable to Level 3 securities held at July 31, 2011 | $ - |
The information used in the above reconciliation represents fiscal year to date activity for any Investments in Securities identified as using Level 3 inputs at either the beginning or the end of the current fiscal period. Transfers in or out of Level 3 represent the beginning value of any Security or Instrument where a change in the pricing level occurred from the beginning to the end of the period. The cost of purchases and the proceeds of sales may include securities received or delivered through corporate actions or exchanges. Realized and unrealized gains (losses) disclosed in the reconciliation are included in Net Gain (Loss) on the Fund's Statement of Operations. |
Distribution of investments by country of issue, as a percentage of total net assets, is as follows: (Unaudited) |
United States of America | 80.9% |
Ireland | 6.8% |
Canada | 3.2% |
France | 2.8% |
Bailiwick of Jersey | 2.5% |
Germany | 1.1% |
Others (Individually Less Than 1%) | 2.7% |
| 100.0% |
See accompanying notes which are an integral part of the financial statements.
Annual Report
Fidelity Advisor Health Care Fund
Statement of Assets and Liabilities
| July 31, 2011 |
| | |
Assets | | |
Investment in securities, at value (including securities loaned of $35,901,127) - See accompanying schedule: Unaffiliated issuers (cost $400,894,823) | $ 481,725,218 | |
Fidelity Central Funds (cost $44,726,565) | 44,726,565 | |
Total Investments (cost $445,621,388) | | $ 526,451,783 |
Receivable for investments sold | | 17,083,599 |
Receivable for fund shares sold | | 1,842,936 |
Dividends receivable | | 177,130 |
Distributions receivable from Fidelity Central Funds | | 6,266 |
Other receivables | | 13,596 |
Total assets | | 545,575,310 |
| | |
Liabilities | | |
Payable for investments purchased | $ 13,562,285 | |
Payable for fund shares redeemed | 3,039,923 | |
Accrued management fee | 233,640 | |
Distribution and service plan fees payable | 186,071 | |
Other affiliated payables | 131,421 | |
Other payables and accrued expenses | 39,125 | |
Collateral on securities loaned, at value | 36,716,410 | |
Total liabilities | | 53,908,875 |
| | |
Net Assets | | $ 491,666,435 |
Net Assets consist of: | | |
Paid in capital | | $ 363,569,109 |
Accumulated net investment loss | | (43,728) |
Accumulated undistributed net realized gain (loss) on investments and foreign currency transactions | | 47,307,880 |
Net unrealized appreciation (depreciation) on investments and assets and liabilities in foreign currencies | | 80,833,174 |
Net Assets | | $ 491,666,435 |
Statement of Assets and Liabilities - continued
| July 31, 2011 |
| | |
Calculation of Maximum Offering Price Class A:
Net Asset Value and redemption price per share ($224,703,681 ÷ 8,776,018 shares) | | $ 25.60 |
| | |
Maximum offering price per share (100/94.25 of $25.60) | | $ 27.16 |
Class T:
Net Asset Value and redemption price per share ($123,606,030 ÷ 4,985,098 shares) | | $ 24.80 |
| | |
Maximum offering price per share (100/96.50 of $24.80) | | $ 25.70 |
Class B:
Net Asset Value and offering price per share ($20,364,553 ÷ 879,539 shares)A | | $ 23.15 |
| | |
Class C:
Net Asset Value and offering price per share ($77,749,390 ÷ 3,364,057 shares)A | | $ 23.11 |
| | |
Institutional Class:
Net Asset Value, offering price and redemption price per share ($45,242,781 ÷ 1,694,840 shares) | | $ 26.69 |
A Redemption price per share is equal to net asset value less any applicable contingent deferred sales charge.
See accompanying notes which are an integral part of the financial statements.
Annual Report
Statement of Operations
| Year ended July 31, 2011 |
| | |
Investment Income | | |
Dividends | | $ 3,129,981 |
Interest | | 2,132 |
Income from Fidelity Central Funds | | 151,730 |
Total income | | 3,283,843 |
| | |
Expenses | | |
Management fee | $ 2,465,724 | |
Transfer agent fees | 1,289,266 | |
Distribution and service plan fees | 2,036,212 | |
Accounting and security lending fees | 176,168 | |
Custodian fees and expenses | 36,735 | |
Independent trustees' compensation | 2,425 | |
Registration fees | 69,039 | |
Audit | 53,594 | |
Legal | 2,862 | |
Interest | 331 | |
Miscellaneous | 4,716 | |
Total expenses before reductions | 6,137,072 | |
Expense reductions | (36,903) | 6,100,169 |
Net investment income (loss) | | (2,816,326) |
Realized and Unrealized Gain (Loss) Net realized gain (loss) on: | | |
Investment securities: | | |
Unaffiliated issuers | 84,585,715 | |
Foreign currency transactions | (39,958) | |
Total net realized gain (loss) | | 84,545,757 |
Change in net unrealized appreciation (depreciation) on: Investment securities | 41,590,093 | |
Assets and liabilities in foreign currencies | 7,055 | |
Total change in net unrealized appreciation (depreciation) | | 41,597,148 |
Net gain (loss) | | 126,142,905 |
Net increase (decrease) in net assets resulting from operations | | $ 123,326,579 |
Statement of Changes in Net Assets
| Year ended
July 31,
2011 | Year ended
July 31,
2010 |
Increase (Decrease) in Net Assets | | |
Operations | | |
Net investment income (loss) | $ (2,816,326) | $ (2,420,957) |
Net realized gain (loss) | 84,545,757 | 38,061,892 |
Change in net unrealized appreciation (depreciation) | 41,597,148 | 5,982,346 |
Net increase (decrease) in net assets resulting from operations | 123,326,579 | 41,623,281 |
Share transactions - net increase (decrease) | (10,714,611) | (51,082,260) |
Redemption fees | 9,972 | 6,564 |
Total increase (decrease) in net assets | 112,621,940 | (9,452,415) |
| | |
Net Assets | | |
Beginning of period | 379,044,495 | 388,496,910 |
End of period (including accumulated net investment loss of $43,728 and undistributed net investment income of $0, respectively) | $ 491,666,435 | $ 379,044,495 |
See accompanying notes which are an integral part of the financial statements.
Annual Report
Financial Highlights - Class A
Years ended July 31, | 2011 | 2010 | 2009 | 2008 | 2007 |
Selected Per-Share Data | | | | | |
Net asset value, beginning of period | $ 19.01 | $ 17.15 | $ 19.72 | $ 22.90 | $ 23.77 |
Income from Investment Operations | | | | | |
Net investment income (loss) C | (.10) | (.07) | .02 | (.03) | (.03) |
Net realized and unrealized gain (loss) | 6.69 | 1.93 | (2.22) | (1.08) | 1.91 |
Total from investment operations | 6.59 | 1.86 | (2.20) | (1.11) | 1.88 |
Distributions from net realized gain | - | - | (.37) | (2.07) | (2.75) |
Redemption fees added to paid in capital C, G | - | - | - | - | - |
Net asset value, end of period | $ 25.60 | $ 19.01 | $ 17.15 | $ 19.72 | $ 22.90 |
Total Return A, B | 34.67% | 10.85% | (11.37)% | (5.64)% | 8.54% |
Ratios to Average Net Assets D, F | | | | | |
Expenses before reductions | 1.19% | 1.22% | 1.23% | 1.20% | 1.22% |
Expenses net of fee waivers, if any | 1.19% | 1.22% | 1.23% | 1.20% | 1.22% |
Expenses net of all reductions | 1.18% | 1.21% | 1.23% | 1.19% | 1.21% |
Net investment income (loss) | (.43)% | (.36)% | .11% | (.13)% | (.14)% |
Supplemental Data | | | | | |
Net assets, end of period (000 omitted) | $ 224,704 | $ 179,586 | $ 177,890 | $ 220,888 | $ 234,656 |
Portfolio turnover rate E | 125% | 103% | 172% | 134% | 141% |
A Total returns would have been lower if certain expenses had not been reduced during the applicable periods shown.
B Total returns do not include the effect of the sales charges.
C Calculated based on average shares outstanding during the period.
D Fees and expenses of any underlying Fidelity Central Funds are not included in the Fund's expense ratio. The Fund indirectly bears its proportionate share of the expenses of any underlying Fidelity Central Funds.
E Amount does not include the portfolio activity of any underlying Fidelity Central Funds.
F Expense ratios reflect operating expenses of the class. Expenses before reductions do not reflect amounts reimbursed by the investment adviser or reductions from brokerage service arrangements or reductions from other expense offset arrangements and do not represent the amount paid by the class during periods when reimbursements or reductions occur. Expenses net of fee waivers reflect expenses after reimbursement by the investment adviser but prior to reductions from brokerage service arrangements or other expense offset arrangements. Expenses net of all reductions represent the net expenses paid by the class.
G Amount represents less than $.01 per share.
Financial Highlights - Class T
Years ended July 31, | 2011 | 2010 | 2009 | 2008 | 2007 |
Selected Per-Share Data | | | | | |
Net asset value, beginning of period | $ 18.46 | $ 16.69 | $ 19.26 | $ 22.39 | $ 23.26 |
Income from Investment Operations | | | | | |
Net investment income (loss) C | (.16) | (.12) | (.02) | (.08) | (.09) |
Net realized and unrealized gain (loss) | 6.50 | 1.89 | (2.18) | (1.06) | 1.87 |
Total from investment operations | 6.34 | 1.77 | (2.20) | (1.14) | 1.78 |
Distributions from net realized gain | - | - | (.37) | (1.99) | (2.65) |
Redemption fees added to paid in capital C, G | - | - | - | - | - |
Net asset value, end of period | $ 24.80 | $ 18.46 | $ 16.69 | $ 19.26 | $ 22.39 |
Total Return A, B | 34.34% | 10.61% | (11.65)% | (5.86)% | 8.25% |
Ratios to Average Net Assets D, F | | | | | |
Expenses before reductions | 1.44% | 1.47% | 1.49% | 1.46% | 1.48% |
Expenses net of fee waivers, if any | 1.44% | 1.47% | 1.49% | 1.46% | 1.48% |
Expenses net of all reductions | 1.43% | 1.46% | 1.49% | 1.45% | 1.47% |
Net investment income (loss) | (.69)% | (.62)% | (.15)% | (.40)% | (.40)% |
Supplemental Data | | | | | |
Net assets, end of period (000 omitted) | $ 123,606 | $ 100,883 | $ 103,772 | $ 143,237 | $ 186,628 |
Portfolio turnover rate E | 125% | 103% | 172% | 134% | 141% |
A Total returns would have been lower if certain expenses had not been reduced during the applicable periods shown.
B Total returns do not include the effect of the sales charges.
C Calculated based on average shares outstanding during the period.
D Fees and expenses of any underlying Fidelity Central Funds are not included in the Fund's expense ratio. The Fund indirectly bears its proportionate share of the expenses of any underlying Fidelity Central Funds.
E Amount does not include the portfolio activity of any underlying Fidelity Central Funds.
F Expense ratios reflect operating expenses of the class. Expenses before reductions do not reflect amounts reimbursed by the investment adviser or reductions from brokerage service arrangements or reductions from other expense offset arrangements and do not represent the amount paid by the class during periods when reimbursements or reductions occur. Expenses net of fee waivers reflect expenses after reimbursement by the investment adviser but prior to reductions from brokerage service arrangements or other expense offset arrangements. Expenses net of all reductions represent the net expenses paid by the class.
G Amount represents less than $.01 per share.
See accompanying notes which are an integral part of the financial statements.
Annual Report
Financial Highlights - Class B
Years ended July 31, | 2011 | 2010 | 2009 | 2008 | 2007 |
Selected Per-Share Data | | | | | |
Net asset value, beginning of period | $ 17.32 | $ 15.74 | $ 18.27 | $ 21.29 | $ 22.17 |
Income from Investment Operations | | | | | |
Net investment income (loss) C | (.25) | (.20) | (.09) | (.18) | (.20) |
Net realized and unrealized gain (loss) | 6.08 | 1.78 | (2.07) | (.99) | 1.79 |
Total from investment operations | 5.83 | 1.58 | (2.16) | (1.17) | 1.59 |
Distributions from net realized gain | - | - | (.37) | (1.85) | (2.47) |
Redemption fees added to paid in capital C, G | - | - | - | - | - |
Net asset value, end of period | $ 23.15 | $ 17.32 | $ 15.74 | $ 18.27 | $ 21.29 |
Total Return A, B | 33.66% | 10.04% | (12.07)% | (6.30)% | 7.66% |
Ratios to Average Net Assets D, F | | | | | |
Expenses before reductions | 1.94% | 1.97% | 1.98% | 1.95% | 1.99% |
Expenses net of fee waivers, if any | 1.94% | 1.97% | 1.98% | 1.95% | 1.99% |
Expenses net of all reductions | 1.93% | 1.96% | 1.98% | 1.94% | 1.98% |
Net investment income (loss) | (1.19)% | (1.11)% | (.64)% | (.89)% | (.91)% |
Supplemental Data | | | | | |
Net assets, end of period (000 omitted) | $ 20,365 | $ 23,543 | $ 29,381 | $ 55,589 | $ 113,384 |
Portfolio turnover rate E | 125% | 103% | 172% | 134% | 141% |
A Total returns would have been lower if certain expenses had not been reduced during the applicable periods shown.
B Total returns do not include the effect of the contingent deferred sales charge.
C Calculated based on average shares outstanding during the period.
D Fees and expenses of any underlying Fidelity Central Funds are not included in the Fund's expense ratio. The Fund indirectly bears its proportionate share of the expenses of any underlying Fidelity Central Funds.
E Amount does not include the portfolio activity of any underlying Fidelity Central Funds.
F Expense ratios reflect operating expenses of the class. Expenses before reductions do not reflect amounts reimbursed by the investment adviser or reductions from brokerage service arrangements or reductions from other expense offset arrangements and do not represent the amount paid by the class during periods when reimbursements or reductions occur. Expenses net of fee waivers reflect expenses after reimbursement by the investment adviser but prior to reductions from brokerage service arrangements or other expense offset arrangements. Expenses net of all reductions represent the net expenses paid by the class.
G Amount represents less than $.01 per share.
Financial Highlights - Class C
Years ended July 31, | 2011 | 2010 | 2009 | 2008 | 2007 |
Selected Per-Share Data | | | | | |
Net asset value, beginning of period | $ 17.29 | $ 15.70 | $ 18.23 | $ 21.29 | $ 22.24 |
Income from Investment Operations | | | | | |
Net investment income (loss) C | (.24) | (.19) | (.09) | (.17) | (.19) |
Net realized and unrealized gain (loss) | 6.06 | 1.78 | (2.07) | (1.00) | 1.79 |
Total from investment operations | 5.82 | 1.59 | (2.16) | (1.17) | 1.60 |
Distributions from net realized gain | - | - | (.37) | (1.89) | (2.55) |
Redemption fees added to paid in capital C, G | - | - | - | - | - |
Net asset value, end of period | $ 23.11 | $ 17.29 | $ 15.70 | $ 18.23 | $ 21.29 |
Total Return A, B | 33.66% | 10.13% | (12.09)% | (6.31)% | 7.75% |
Ratios to Average Net Assets D, F | | | | | |
Expenses before reductions | 1.90% | 1.94% | 1.98% | 1.94% | 1.94% |
Expenses net of fee waivers, if any | 1.90% | 1.94% | 1.98% | 1.94% | 1.94% |
Expenses net of all reductions | 1.89% | 1.93% | 1.98% | 1.94% | 1.93% |
Net investment income (loss) | (1.15)% | (1.08)% | (.64)% | (.88)% | (.86)% |
Supplemental Data | | | | | |
Net assets, end of period (000 omitted) | $ 77,749 | $ 60,861 | $ 64,002 | $ 83,133 | $ 105,519 |
Portfolio turnover rate E | 125% | 103% | 172% | 134% | 141% |
A Total returns would have been lower if certain expenses had not been reduced during the applicable periods shown.
B Total returns do not include the effect of the contingent deferred sales charge.
C Calculated based on average shares outstanding during the period.
D Fees and expenses of any underlying Fidelity Central Funds are not included in the Fund's expense ratio. The Fund indirectly bears its proportionate share of the expenses of any underlying Fidelity Central Funds.
E Amount does not include the portfolio activity of any underlying Fidelity Central Funds.
F Expense ratios reflect operating expenses of the class. Expenses before reductions do not reflect amounts reimbursed by the investment adviser or reductions from brokerage service arrangements or reductions from other expense offset arrangements and do not represent the amount paid by the class during periods when reimbursements or reductions occur. Expenses net of fee waivers reflect expenses after reimbursement by the investment adviser but prior to reductions from brokerage service arrangements or other expense offset arrangements. Expenses net of all reductions represent the net expenses paid by the class.
G Amount represents less than $.01 per share.
See accompanying notes which are an integral part of the financial statements.
Annual Report
Financial Highlights - Institutional Class
Years ended July 31, | 2011 | 2010 | 2009 | 2008 | 2007 |
Selected Per-Share Data | | | | | |
Net asset value, beginning of period | $ 19.77 | $ 17.78 | $ 20.39 | $ 23.62 | $ 24.43 |
Income from Investment Operations | | | | | |
Net investment income (loss) B | (.03) | (.02) | .06 | .03 | .05 |
Net realized and unrealized gain (loss) | 6.95 | 2.01 | (2.30) | (1.12) | 1.96 |
Total from investment operations | 6.92 | 1.99 | (2.24) | (1.09) | 2.01 |
Distributions from net realized gain | - | - | (.37) | (2.14) | (2.82) |
Redemption fees added to paid in capital B, F | - | - | - | - | - |
Net asset value, end of period | $ 26.69 | $ 19.77 | $ 17.78 | $ 20.39 | $ 23.62 |
Total Return A | 35.00% | 11.19% | (11.19)% | (5.36)% | 8.90% |
Ratios to Average Net Assets C, E | | | | | |
Expenses before reductions | .89% | .96% | .98% | .93% | .88% |
Expenses net of fee waivers, if any | .89% | .96% | .98% | .93% | .88% |
Expenses net of all reductions | .88% | .95% | .98% | .92% | .87% |
Net investment income (loss) | (.13)% | (.10)% | .36% | .14% | .19% |
Supplemental Data | | | | | |
Net assets, end of period (000 omitted) | $ 45,243 | $ 14,172 | $ 13,452 | $ 18,825 | $ 22,174 |
Portfolio turnover rate D | 125% | 103% | 172% | 134% | 141% |
A Total returns would have been lower if certain expenses had not been reduced during the applicable periods shown.
B Calculated based on average shares outstanding during the period.
C Fees and expenses of any underlying Fidelity Central Funds are not included in the Fund's expense ratio. The Fund indirectly bears its proportionate share of the expenses of any underlying Fidelity Central Funds.
D Amount does not include the portfolio activity of any underlying Fidelity Central Funds.
E Expense ratios reflect operating expenses of the class. Expenses before reductions do not reflect amounts reimbursed by the investment adviser or reductions from brokerage service arrangements or reductions from other expense offset arrangements and do not represent the amount paid by the class during periods when reimbursements or reductions occur. Expenses net of fee waivers reflect expenses after reimbursement by the investment adviser but prior to reductions from brokerage service arrangements or other expense offset arrangements. Expenses net of all reductions represent the net expenses paid by the class.
F Amount represents less than $.01 per share.
See accompanying notes which are an integral part of the financial statements.
Annual Report
Notes to Financial Statements
For the period ended July 31, 2011
1. Organization.
Fidelity Advisor Health Care Fund (the Fund) is a non-diversified fund of Fidelity Advisor Series VII (the Trust) and is authorized to issue an unlimited number of shares. The Trust is registered under the Investment Company Act of 1940, as amended (the 1940 Act), as an open-end management investment company organized as a Massachusetts business trust. The Fund offers Class A, Class T, Class C and Institutional Class shares, each of which, along with Class B shares, has equal rights as to assets and voting privileges. Effective after the close of business on September 1, 2010, Class B shares were closed to new accounts and additional purchases, except for exchanges and reinvestments, by existing shareholders. Each class has exclusive voting rights with respect to matters that affect that class. Class B shares will automatically convert to Class A shares after a holding period of seven years from the initial date of purchase. Investment income, realized and unrealized capital gains and losses, the common expenses of the Fund, and certain fund-level expense reductions, if any, are allocated on a pro-rata basis to each class based on the relative net assets of each class to the total net assets of the Fund. Each class differs with respect to transfer agent and distribution and service plan fees incurred. Certain expense reductions may also differ by class.
2. Investments in Fidelity Central Funds.
The Fund invests in Fidelity Central Funds, which are open-end investment companies available only to other investment companies and accounts managed by Fidelity Management & Research Company (FMR) and its affiliates. The Fund's Schedule of Investments lists each of the Fidelity Central Funds held as of period end, if any, as an investment of the Fund, but does not include the underlying holdings of each Fidelity Central Fund. As an Investing Fund, the Fund indirectly bears its proportionate share of the expenses of the underlying Fidelity Central Funds.
The Money Market Central Funds seek preservation of capital and current income and are managed by Fidelity Investments Money Management, Inc. (FIMM), an affiliate of FMR.
A complete unaudited list of holdings for each Fidelity Central Fund is available upon request or at the Securities and Exchange Commission (the SEC) web site at www.sec.gov. In addition, the financial statements of the Fidelity Central Funds, which are not covered by the Fund's Report of Independent Registered Public Accounting Firm, are available on the SEC web site or upon request.
3. Significant Accounting Policies.
The financial statements have been prepared in conformity with accounting principles generally accepted in the United States of America (GAAP), which require management to make certain estimates and assumptions at the date of the financial statements. Actual results could differ from those estimates. Subsequent events, if any, through the date that the financial statements were issued have been evaluated in the preparation of the financial statements. The following summarizes the significant accounting policies of the Fund:
Security Valuation. Investments are valued as of 4:00 p.m. Eastern time on the last calendar day of the period. The Fund uses independent pricing services approved by the Board of Trustees to value its investments. When current market prices or quotations are not readily available or reliable, valuations may be determined in good faith in accordance with procedures adopted by the Board of Trustees. Factors used in determining value may include market or security specific events. The frequency with which these procedures are used cannot be predicted and they may be utilized to a significant extent. The value used for net asset value (NAV) calculation under these procedures may differ from published prices for the same securities.
The Fund categorizes the inputs to valuation techniques used to value its investments into a disclosure hierarchy consisting of three levels as shown below:
Level 1 - quoted prices in active markets for identical investments
Level 2 - other significant observable inputs (including quoted prices for similar investments, interest rates, prepayment speeds, etc.)
Level 3 - unobservable inputs (including the Fund's own assumptions based on the best information available)
Changes in valuation techniques may result in transfers in or out of an assigned level within the disclosure hierarchy. The aggregate value of investments by input level, as of July 31, 2011, as well as a roll forward of Level 3 securities, is included at the end of the Fund's Schedule of Investments. Valuation techniques used to value the Fund's investments by major category are as follows:
Equity securities, including restricted securities, for which market quotations are readily available, are valued at the last reported sale price or official closing price as reported by an independent pricing service on the primary market or exchange on which they are traded and are categorized as Level 1 in the hierarchy. In the event there were no sales during the day or closing prices are not available, securities are valued at the last quoted bid price or may be valued using the last available price and are generally categorized as Level 2 in the hierarchy. For foreign equity securities, when significant market or security specific events arise, comparisons to the valuation of American Depositary Receipts (ADRs), futures contracts, Exchange-traded funds (ETFs) and certain indexes as well as quoted prices for similar securities are used and are categorized as Level 2 in the hierarchy in these
Annual Report
Notes to Financial Statements - continued
3. Significant Accounting Policies - continued
Security Valuation - continued
circumstances. Utilizing these techniques may result in transfers between Level 1 and Level 2. For restricted equity securities and private placements where observable inputs are limited, assumptions about market activity and risk are used and are categorized as Level 3 in the hierarchy.
Investments in open-end mutual funds, including the Fidelity Central Funds, are valued at their closing net asset value each business day and are categorized as Level 1 in the hierarchy.
Foreign Currency. The Fund may use foreign currency contracts to facilitate transactions in foreign-denominated securities. Gains and losses from these transactions may arise from changes in the value of the foreign currency or if the counterparties do not perform under the contracts' terms.
Foreign-denominated assets, including investment securities, and liabilities are translated into U.S. dollars at the exchange rate at period end. Purchases and sales of investment securities, income and dividends received and expenses denominated in foreign currencies are translated into U.S. dollars at the exchange rate in effect on the transaction date.
The effects of exchange rate fluctuations on investments are included with the net realized and unrealized gain (loss) on investment securities. Other foreign currency transactions resulting in realized and unrealized gain (loss) are disclosed separately.
Investment Transactions and Income. For financial reporting purposes, the Fund's investment holdings and NAV include trades executed through the end of the last business day of the period. The NAV per share for processing shareholder transactions is calculated as of the close of business of the New York Stock Exchange (NYSE), normally 4:00 p.m. Eastern time and includes trades executed through the end of the prior business day. Gains and losses on securities sold are determined on the basis of identified cost and may include proceeds received from litigation. Dividend income is recorded on the ex-dividend date, except for certain dividends from foreign securities where the ex-dividend date may have passed, which are recorded as soon as the Fund is informed of the ex-dividend date. Non-cash dividends included in dividend income, if any, are recorded at the fair market value of the securities received. Distributions received on securities that represent a return of capital or capital gain are recorded as a reduction of cost of investments and/or as a realized gain. The Fund estimates the components of distributions received that may be considered return of capital distributions or capital gain distributions. Interest income includes coupon interest and amortization of premium and accretion of discount on debt securities. Investment income is recorded net of foreign taxes withheld where recovery of such taxes is uncertain.
Expenses. Expenses directly attributable to a fund are charged to that fund. Expenses attributable to more than one fund are allocated among the respective funds on the basis of relative net assets or other appropriate methods. Expense estimates are accrued in the period to which they relate and adjustments are made when actual amounts are known.
Income Tax Information and Distributions to Shareholders. Each year, the Fund intends to qualify as a regulated investment company, including distributing substantially all of its taxable income and realized gains under Subchapter M of the Internal Revenue Code and filing its U.S. federal tax return. As a result, no provision for income taxes is required. As of July 31, 2011, the Fund did not have any unrecognized tax benefits in the financial statements. A fund's federal tax return is subject to examination by the Internal Revenue Service (IRS) for a period of three years. Foreign taxes are provided for based on the Fund's understanding of the tax rules and rates that exist in the foreign markets in which it invests.
Distributions are declared and recorded on the ex-dividend date. Income dividends and capital gain distributions are declared separately for each class. Income and capital gain distributions are determined in accordance with income tax regulations, which may differ from GAAP. In addition, the Fund claimed a portion of the payment made to redeeming shareholders as a distribution for income tax purposes.
Capital accounts within the financial statements are adjusted for permanent book-tax differences. These adjustments have no impact on net assets or the results of operations. Temporary book-tax differences will reverse in a subsequent period.
Book-tax differences are primarily due to foreign currency transactions, deferred trustees compensation, net operating losses, capital loss carryforwards and losses deferred due to wash sales and excise tax regulations.
The federal tax cost of investment securities and unrealized appreciation (depreciation) as of period end were as follows:
Gross unrealized appreciation | $ 92,525,825 |
Gross unrealized depreciation | (12,824,408) |
Net unrealized appreciation (depreciation) on securities and other investments | $ 79,701,417 |
| |
Tax Cost | $ 446,750,366 |
Annual Report
3. Significant Accounting Policies - continued
Income Tax Information and Distributions to Shareholders - continued
The tax-based components of distributable earnings as of period end were as follows:
Undistributed long-term capital gain | $ 48,436,859 |
Net unrealized appreciation (depreciation) | $ 79,704,196 |
Under the recently enacted Regulated Investment Company Modernization Act of 2010 (the Act), the Fund will be permitted to carry forward capital losses incurred in taxable years beginning after December 22, 2010 for an unlimited period. However, any losses incurred during those future taxable years will be required to be utilized prior to any losses incurred in pre-enactment taxable years, which generally expire after eight years from when they are incurred. Additionally, post-enactment capital losses that are carried forward will retain their character as either short-term or long-term capital losses rather than being considered all short-term as under previous law. The Fund's first fiscal year end subject to the Act will be July 31, 2012.
Short-Term Trading (Redemption) Fees. Shares held by investors in the Fund less than 30 days are subject to a redemption fee equal to .75% of the net asset value of shares redeemed. All redemption fees, which reduce the proceeds of the shareholder redemption, are retained by the Fund and accounted for as an addition to paid in capital.
New Accounting Pronouncement. In May 2011, the Financial Accounting Standards Board issued Accounting Standard Update No. 2011-04, Fair Value Measurement (Topic 820) - Amendments to Achieve Common Fair Value Measurement and Disclosure Requirements in U.S. GAAP and IFRSs. The update changes the wording used to describe the requirements in GAAP for measuring fair value and for disclosing information about fair value measurements. The update is effective during interim and annual periods beginning after December 15, 2011. Management is currently evaluating the impact of the update's adoption on the Fund's financial statement disclosures.
4. Operating Policies.
Restricted Securities. The Fund may invest in securities that are subject to legal or contractual restrictions on resale. These securities generally may be resold in transactions exempt from registration or to the public if the securities are registered. Disposal of these securities may involve time-consuming negotiations and expense, and prompt sale at an acceptable price may be difficult. Information regarding restricted securities is included at the end of the Fund's Schedule of Investments.
5. Purchases and Sales of Investments.
Purchases and sales of securities, other than short-term securities, aggregated $537,309,093 and $549,592,335, respectively.
6. Fees and Other Transactions with Affiliates.
Management Fee. FMR and its affiliates provide the Fund with investment management related services for which the Fund pays a monthly management fee. The management fee is the sum of an individual fund fee rate that is based on an annual rate of .30% of the Fund's average net assets and a group fee rate that averaged .26% during the period. The group fee rate is based upon the average net assets of all the mutual funds advised by FMR. The group fee rate decreases as assets under management increase and increases as assets under management decrease. For the period, the total annual management fee rate was .56% of the Fund's average net assets.
Distribution and Service Plan Fees. In accordance with Rule 12b-1 of the 1940 Act, the Fund has adopted separate Distribution and Service Plans for each class of shares. Certain classes pay Fidelity Distributors Corporation (FDC), an affiliate of FMR, separate Distribution and Service Fees, each of which is based on an annual percentage of each class' average net assets. In addition, FDC may pay financial intermediaries for selling shares of the Fund and providing shareholder support services. For the period, the Distribution and Service Fee rates, total fees and amounts retained by FDC were as follows:
| Distribution
Fee | Service
Fee | Total Fees | Retained
by FDC |
Class A | -% | .25% | $ 520,630 | $ 5,536 |
Class T | .25% | .25% | 586,852 | 1,478 |
Class B | .75% | .25% | 225,260 | 169,566 |
Class C | .75% | .25% | 703,470 | 43,391 |
| | | $ 2,036,212 | $ 219,971 |
Annual Report
Notes to Financial Statements - continued
6. Fees and Other Transactions with Affiliates - continued
Sales Load. FDC may receive a front-end sales charge of up to 5.75% for selling Class A shares, and 3.50% for selling Class T shares, some of which is paid to financial intermediaries for selling shares of the Fund. Depending on the holding period, FDC may receive contingent deferred sales charges levied on Class A, Class T, Class B, and Class C redemptions. The deferred sales charges range from 5% to 1% for Class B, 1% for Class C, 1.00% for certain purchases of Class A shares and .25% for certain purchases of Class T shares.
For the period, sales charge amounts retained by FDC were as follows:
| Retained
by FDC |
Class A | $ 44,219 |
Class T | 13,313 |
Class B* | 35,464 |
Class C* | 2,266 |
| $ 95,262 |
* When Class B and Class C shares are initially sold, FDC pays commissions from its own resources to financial intermediaries through which the sales are made.
Transfer Agent Fees. Fidelity Investments Institutional Operations Company, Inc. (FIIOC), an affiliate of FMR, is the transfer, dividend disbursing and shareholder servicing agent for each class of the Fund. FIIOC receives account fees and asset-based fees that vary according to the account size and type of account of the shareholders of the respective classes of the Fund. FIIOC pays for typesetting, printing and mailing of shareholder reports, except proxy statements. For the period, transfer agent fees for each class were as follows:
| Amount | % of
Average
Net Assets |
Class A | $ 622,891 | .30 |
Class T | 353,675 | .30 |
Class B | 67,583 | .30 |
Class C | 185,486 | .26 |
Institutional Class | 59,631 | .25 |
| $ 1,289,266 | |
Accounting and Security Lending Fees. Fidelity Service Company, Inc. (FSC), an affiliate of FMR, maintains the Fund's accounting records. The accounting fee is based on the level of average net assets for the month. Under a separate contract, FSC administers the security lending program. The security lending fee is based on the number and duration of lending transactions.
Brokerage Commissions. The Fund placed a portion of its portfolio transactions with brokerage firms which are affiliates of the investment adviser. The commissions paid to these affiliated firms were $8,768 for the period.
Interfund Lending Program. Pursuant to an Exemptive Order issued by the SEC, the Fund, along with other registered investment companies having management contracts with FMR, may participate in an interfund lending program. This program provides an alternative credit facility allowing the funds to borrow from, or lend money to, other participating affiliated funds. At period end, there were no interfund loans outstanding. The Fund's activity in this program during the period for which loans were outstanding was as follows:
Borrower or Lender | Average Daily
Loan Balance | Weighted Average Interest Rate | Interest
Expense |
Borrower | $ 6,447,400 | .37% | $ 331 |
7. Committed Line of Credit.
The Fund participates with other funds managed by FMR or an affiliate in a $4.0 billion credit facility (the "line of credit") to be utilized for temporary or emergency purposes to fund shareholder redemptions or for other short-term liquidity purposes. The Fund has agreed to pay commitment fees on its pro-rata portion of the line of credit, which amounted to $1,443 and is reflected in Miscellaneous expenses on the Statement of Operations. During the period, there were no borrowings on this line of credit.
8. Security Lending.
The Fund lends portfolio securities through a lending agent from time to time in order to earn additional income. The lending agent may loan securities to certain qualified borrowers, including Fidelity Capital Markets (FCM), a broker-dealer affiliated with the Fund. On the settlement date of the loan,
Annual Report
8. Security Lending - continued
the Fund receives collateral (in the form of U.S. Treasury obligations, letters of credit and/or cash) against the loaned securities and maintains collateral in an amount not less than 100% of the market value of the loaned securities during the period of the loan. The market value of the loaned securities is determined at the close of business of the Fund and any additional required collateral is delivered to the Fund on the next business day. If the borrower defaults on its obligation to return the securities loaned because of insolvency or other reasons, a fund could experience delays and costs in recovering the securities loaned or in gaining access to the collateral. Any cash collateral received is invested in the Fidelity Securities Lending Cash Central Fund. The value of loaned securities and cash collateral at period end are disclosed on the Fund's Statement of Assets and Liabilities. Security lending income represents the income earned on investing cash collateral, less rebates paid to borrowers and lending agent fees associated with the loan, plus any premium payments received for lending certain types of securities. Security lending income is presented in the Statement of Operations as a component of income from Fidelity Central Funds, and includes $25 from securities loaned to FCM. Total security lending income during the period amounted to $136,970.
9. Expense Reductions.
Many of the brokers with whom FMR places trades on behalf of the Fund provided services to the Fund in addition to trade execution. These services included payments of certain expenses on behalf of the Fund totaling $36,903 for the period.
10. Share Transactions.
Transactions for each class of shares were as follows:
| Shares | Dollars |
Years ended July 31, | 2011 | 2010 | 2011 | 2010 |
Class A | | | | |
Shares sold | 2,257,884 | 1,348,328 | $ 55,506,569 | $ 26,342,454 |
Shares redeemed | (2,927,010) | (2,277,034) | (69,236,135) | (43,802,733) |
Net increase (decrease) | (669,126) | (928,706) | $ (13,729,566) | $ (17,460,279) |
Class T | | | | |
Shares sold | 610,720 | 653,249 | $ 14,273,371 | $ 12,596,630 |
Shares redeemed | (1,090,770) | (1,405,398) | (24,737,327) | (26,754,410) |
Net increase (decrease) | (480,050) | (752,149) | $ (10,463,956) | $ (14,157,780) |
Class B | | | | |
Shares sold | 46,091 | 142,178 | $ 1,030,863 | $ 2,538,751 |
Shares redeemed | (525,569) | (649,613) | (10,871,447) | (11,572,231) |
Net increase (decrease) | (479,478) | (507,435) | $ (9,840,584) | $ (9,033,480) |
Class C | | | | |
Shares sold | 524,474 | 307,711 | $ 11,843,311 | $ 5,532,717 |
Shares redeemed | (681,222) | (862,744) | (14,258,065) | (15,167,135) |
Net increase (decrease) | (156,748) | (555,033) | $ (2,414,754) | $ (9,634,418) |
Institutional Class | | | | |
Shares sold | 1,277,086 | 188,384 | $ 33,336,034 | $ 3,842,212 |
Shares redeemed | (299,253) | (227,941) | (7,601,785) | (4,638,515) |
Net increase (decrease) | 977,833 | (39,557) | $ 25,734,249 | $ (796,303) |
11. Other.
The Fund's organizational documents provide former and current trustees and officers with a limited indemnification against liabilities arising in connection with the performance of their duties to the Fund. In the normal course of business, the Fund may also enter into contracts that provide general indemnifications. The Fund's maximum exposure under these arrangements is unknown as this would be dependent on future claims that may be made against the Fund. The risk of material loss from such claims is considered remote.
Annual Report
Fidelity Advisor Industrials Fund - Class A, T, B, and C
Performance: The Bottom Line
Average annual total return reflects the change in the value of an investment, assuming reinvestment of the class' distributions from dividend income and capital gains (the profits earned upon the sale of securities that have grown in value, if any) and assuming a constant rate of performance each year. The $10,000 table and the fund's returns do not reflect the deduction of taxes that a shareholder would pay on fund distributions or the redemption of fund shares. During periods of reimbursement by Fidelity, a fund's total return will be greater than it would be had the reimbursement not occurred. How a fund did yesterday is no guarantee of how it will do tomorrow. Returns reflect the conversion of Class B shares to Class A shares after a maximum of seven years.
Average Annual Total Returns
Periods ended July 31, 2011 | Past 1
year | Past 5
years | Past 10
years |
Class A (incl. 5.75% sales charge)C | 12.72% | 5.94% | 8.03% |
Class T (incl. 3.50% sales charge)C | 15.11% | 6.18% | 8.01% |
Class B (incl. contingent deferred sales charge) A, C | 13.64% | 6.06% | 8.09% |
Class C (incl. contingent deferred sales charge) B, C | 17.69% | 6.41% | 7.87% |
A Class B shares contingent deferred sales charges included in the past one year, past five years, and past ten years total return figures are 5%, 2%, and 0%, respectively.
B Class C shares' contingent deferred sales charges included in the past one year, past five years, and past ten years total return figures are 1%, 0%, and 0%, respectively.
C Prior to October 1, 2006, Fidelity Advisor Industrials Fund operated under certain different investment policies. The historical performance for the fund may not represent its current investment policies.
$10,000 Over 10 Years
Let's say hypothetically that $10,000 was invested in Fidelity Advisor Industrials Fund - Class A on July 31, 2001, and the current 5.75% sales charge was paid. The chart shows how the value of your investment would have changed, and also shows how the S&P 500 Index performed over the same period.
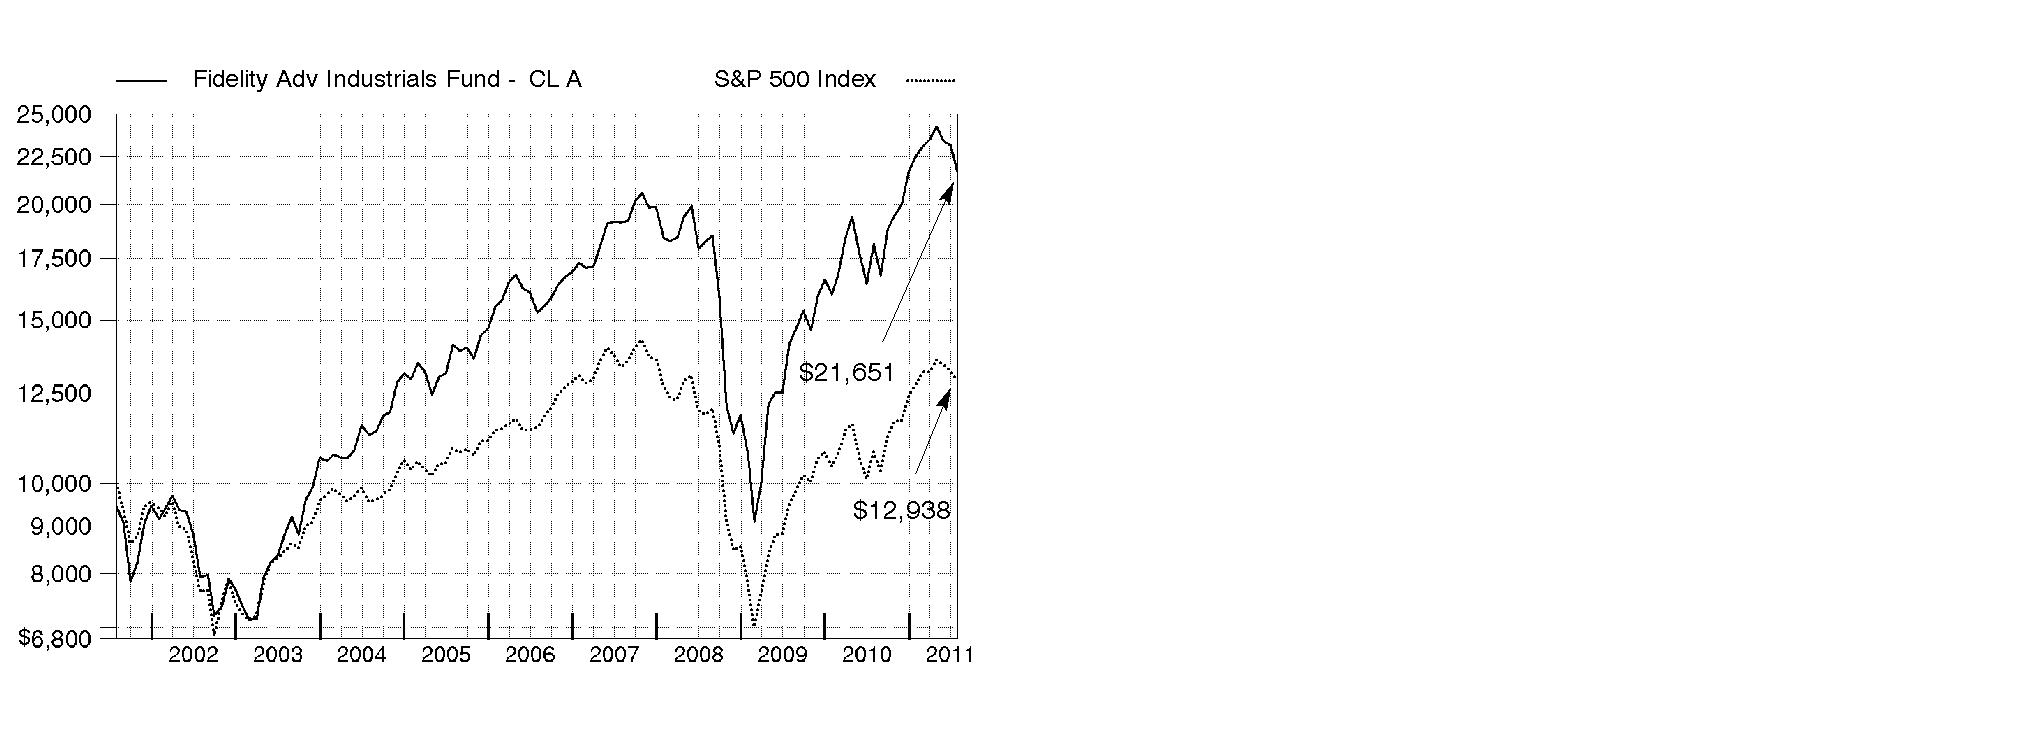
Annual Report
Fidelity Advisor Industrials Fund
Market Recap: U.S. stocks registered solid double-digit gains for the 12 months ending July 31, 2011, extending a rally that began more than two years earlier. Despite a rough start in August 2010, markets turned positive in September, as increased demand for capital goods and other upbeat indicators trumped investor worry about a U.S. recessionary relapse. The broad market, as measured by the S&P 500® Index, rose 9% that month, its biggest September gain in 71 years. Seven more monthly advances followed, fueled by encouraging corporate earnings and economic activity. However, volatility picked up in the period's latter months, as markets reacted to continued high U.S. unemployment, nagging debt troubles in Europe and looming legislative battles over the federal debt ceiling. May unemployment rose above 9% for the first time in 2011, contributing to a traditional "June swoon" for stocks. Market uncertainty lingered in July, when the S&P 500® posted its second-biggest monthly loss of the period. For the full year, the S&P 500® climbed 19.65%, while the blue-chip-laden Dow Jones Industrial AverageSM rose a comparable 19.09% and the technology-heavy Nasdaq Composite® Index gained 23.40%. On the capitalization spectrum, stocks of mid-cap companies fared best, with the Russell Midcap® Index rising 24.51% and the small-cap Russell 2000® Index adding 23.92%.
Comments from Tobias Welo, Portfolio Manager of Fidelity Advisor® Industrials Fund: During the past year, the fund's Class A, Class T, Class B and Class C shares returned 19.59%, 19.28%, 18.64% and 18.69%, respectively (excluding sales charges), ahead of the 17.57% gain of the MSCI® U.S. IM Industrials 25/50 Index but a bit behind the S&P 500. Versus the MSCI index, solid picks in aerospace/defense, where I favored commercial aerospace firms and underweighted defense companies, bolstered performance. Negligible exposure to the weak-performing airline industry also aided performance. A large average underweighting made Boeing the fund's top individual contributor to relative performance, as delays in bringing the company's 787 Dreamliner® aircraft to market caused its stock to underperform. That said, I thought Boeing might be due for a stretch of outperformance, given the Dreamliner's projected completion date in 2012. Consequently, I added to the fund's stake in Boeing, making it our ninth-largest holding by period end. Other contributors included rail carrier Union Pacific, which generated record second-quarter earnings, despite severe flooding in the Midwest. During the period, the company also hiked its dividend and announced a new share repurchase plan. An out-of-index position in Mills Estruturas e Servicos de Engenharia, a Brazilian company providing scaffolding and concrete forms for the construction industry, also aided performance, as did timely ownership of mining equipment manufacturer Bucyrus International, which in November 2010 received a lucrative takeover bid from Caterpillar - a deal that was completed in July. Not owning weak-performing benchmark component Delta Air Lines helped as well. Conversely, security selection in industrial machinery detracted, as did the fund's foreign holdings, despite the tail wind from a weaker U.S. dollar. At the stock level, underweighting and ultimately selling rail carrier Norfolk Southern was a mistake in light of the stock's relatively strong performance. Although I thought its shares were fully valued, the company announced better-than-expected first- and second-quarter financial results, which rallied its stock. A small out-of-index position in China-based SmartHeat, which sells clean technology plate heat exchangers (PHEs) and related systems, detracted and was sold from the fund. Overweighting Ingersoll-Rand, a manufacturer of climate control and refrigeration systems, worked well until the stock fell sharply near period end - partly on concern about a slowing U.S. economy.
Comments from Tobias Welo, Portfolio Manager of Fidelity Advisor® Industrials Fund: During the past year, the fund's Institutional Class shares returned 19.95%, ahead of the 17.57% gain of the MSCI® U.S. IM Industrials 25/50 Index and the S&P 500. Versus the MSCI index, solid picks in aerospace/defense, where I favored commercial aerospace firms and underweighted defense companies, bolstered performance. Negligible exposure to the weak-performing airline industry also aided performance. A large average underweighting made Boeing the fund's top individual contributor to relative performance, as delays in bringing the company's 787 Dreamliner® aircraft to market caused its stock to underperform. That said, I thought Boeing might be due for a stretch of outperformance, given the Dreamliner's projected completion date in 2012. Consequently, I added to the fund's stake in Boeing, making it our ninth-largest holding by period end. Other contributors included rail carrier Union Pacific, which generated record second-quarter earnings, despite severe flooding in the Midwest. During the period, the company also hiked its dividend and announced a new share repurchase plan. An out-of-index position in Mills Estruturas e Servicos de Engenharia, a Brazilian company providing scaffolding and concrete forms for the construction industry, also aided performance, as did timely ownership of mining equipment manufacturer Bucyrus International, which in November 2010 received a lucrative takeover bid from Caterpillar - a deal that was completed in July. Not owning weak-performing benchmark component Delta Air Lines helped as well. Conversely, security selection in industrial machinery detracted, as did the fund's foreign holdings, despite the tail wind from a weaker U.S. dollar. At the stock level, underweighting and ultimately selling rail carrier Norfolk Southern was a mistake in light of the stock's relatively strong performance. Although I thought its shares were fully valued, the company announced better-than-expected first- and second-quarter financial results, which rallied its stock. A small out-of-index position in China-based SmartHeat, which sells clean technology plate heat exchangers (PHEs) and related systems, detracted and was sold from the fund. Overweighting Ingersoll-Rand, a manufacturer of climate control and refrigeration systems, worked well until the stock fell sharply near period end - partly on concern about a slowing U.S. economy.
The views expressed above reflect those of the portfolio manager(s) only through the end of the period as stated on the cover of this report and do not necessarily represent the views of Fidelity or any other person in the Fidelity organization. Any such views are subject to change at any time based upon market or other conditions and Fidelity disclaims any responsibility to update such views. These views may not be relied on as investment advice and, because investment decisions for a Fidelity fund are based on numerous factors, may not be relied on as an indication of trading intent on behalf of any Fidelity fund.
Annual Report
Fidelity Advisor Industrials Fund
As a shareholder of the Fund, you incur two types of costs: (1) transaction costs, including sales charges (loads) on purchase payments or redemption proceeds, redemption fees, and (2) ongoing costs, including management fees, distribution and/or service (12b-1) fees and other Fund expenses. This Example is intended to help you understand your ongoing costs (in dollars) of investing in the Fund and to compare these costs with the ongoing costs of investing in other mutual funds.
The Example is based on an investment of $1,000 invested at the beginning of the period and held for the entire period (February 1, 2011 to July 31, 2011).
Actual Expenses
The first line of the accompanying table for each class of the Fund provides information about actual account values and actual expenses. You may use the information in this line, together with the amount you invested, to estimate the expenses that you paid over the period. Simply divide your account value by $1,000.00 (for example, an $8,600 account value divided by $1,000.00 = 8.6), then multiply the result by the number in the first line for a class of the Fund under the heading entitled "Expenses Paid During Period" to estimate the expenses you paid on your account during this period. In addition, the Fund, as a shareholder in the underlying Fidelity Central Funds, will indirectly bear its pro-rata share of the fees and expenses incurred by the underlying Fidelity Central Funds. These fees and expenses are not included in the Fund's annualized expense ratio used to calculate the expense estimate in the table below.
Hypothetical Example for Comparison Purposes
The second line of the accompanying table for each class of the Fund provides information about hypothetical account values and hypothetical expenses based on a Class' actual expense ratio and an assumed rate of return of 5% per year before expenses, which is not the Class' actual return. The hypothetical account values and expenses may not be used to estimate the actual ending account balance or expenses you paid for the period. You may use this information to compare the ongoing costs of investing in the Fund and other funds. To do so, compare this 5% hypothetical example with the 5% hypothetical examples that appear in the shareholder reports of the other funds. In addition, the Fund, as a shareholder in the underlying Fidelity Central Funds, will indirectly bear its pro-rata share of the fees and expenses incurred by the underlying Fidelity Central Funds. These fees and expenses are not included in the Fund's annualized expense ratio used to calculate the expense estimate in the table below.
Please note that the expenses shown in the table are meant to highlight your ongoing costs only and do not reflect any transaction costs. Therefore, the second line of the table is useful in comparing ongoing costs only, and will not help you determine the relative total costs of owning different funds. In addition, if these transactional costs were included, your costs would have been higher.
| Annualized
Expense Ratio | Beginning
Account Value
February 1, 2011 | Ending
Account Value
July 31, 2011 | Expenses Paid
During Period*
February 1, 2011 to
July 31, 2011 |
Class A | 1.11% | | | |
Actual | | $ 1,000.00 | $ 962.20 | $ 5.40 |
HypotheticalA | | $ 1,000.00 | $ 1,019.29 | $ 5.56 |
Class T | 1.37% | | | |
Actual | | $ 1,000.00 | $ 960.90 | $ 6.66 |
HypotheticalA | | $ 1,000.00 | $ 1,018.00 | $ 6.85 |
Class B | 1.92% | | | |
Actual | | $ 1,000.00 | $ 958.10 | $ 9.32 |
HypotheticalA | | $ 1,000.00 | $ 1,015.27 | $ 9.59 |
Class C | 1.87% | | | |
Actual | | $ 1,000.00 | $ 958.60 | $ 9.08 |
HypotheticalA | | $ 1,000.00 | $ 1,015.52 | $ 9.35 |
Institutional Class | .83% | | | |
Actual | | $ 1,000.00 | $ 963.50 | $ 4.04 |
HypotheticalA | | $ 1,000.00 | $ 1,020.68 | $ 4.16 |
A 5% return per year before expenses
* Expenses are equal to each Class' annualized expense ratio, multiplied by the average account value over the period, multiplied by 181/365 (to reflect the one-half year period).
Annual Report
Fidelity Advisor Industrials Fund
Investment Changes (Unaudited)
Top Ten Stocks as of July 31, 2011 |
| % of fund's
net assets | % of fund's net assets
6 months ago |
General Electric Co. | 13.5 | 13.6 |
United Technologies Corp. | 6.0 | 5.5 |
Union Pacific Corp. | 5.0 | 3.6 |
Emerson Electric Co. | 3.7 | 3.4 |
Danaher Corp. | 3.7 | 2.6 |
Cummins, Inc. | 3.3 | 2.0 |
Honeywell International, Inc. | 3.2 | 3.0 |
Ingersoll-Rand Co. Ltd. | 3.1 | 2.1 |
The Boeing Co. | 2.9 | 2.3 |
Tyco International Ltd. | 2.5 | 1.0 |
| 46.9 | |
Top Industries (% of fund's net assets) |
As of July 31, 2011 |
| Aerospace & Defense | 21.9% | |
| Industrial Conglomerates | 21.8% | |
| Machinery | 16.7% | |
| Electrical Equipment | 11.8% | |
| Construction & Engineering | 6.9% | |
| All Others* | 20.9% | |

As of January 31, 2011 |
| Machinery | 20.2% | |
| Industrial Conglomerates | 19.5% | |
| Aerospace & Defense | 18.7% | |
| Electrical Equipment | 10.2% | |
| Road & Rail | 7.5% | |
| All Others* | 23.9% | |

* Includes short-term investments and net other assets. |
Annual Report
Fidelity Advisor Industrials Fund
Investments July 31, 2011
Showing Percentage of Net Assets
Common Stocks - 98.6% |
| Shares | | Value |
AEROSPACE & DEFENSE - 21.9% |
Aerospace & Defense - 21.9% |
Esterline Technologies Corp. (a) | 57,717 | | $ 4,407,847 |
GeoEye, Inc. (a) | 46,916 | | 1,874,763 |
Goodrich Corp. | 78,500 | | 7,468,490 |
Honeywell International, Inc. | 281,495 | | 14,947,385 |
MTU Aero Engines Holdings AG | 16,274 | | 1,205,175 |
Precision Castparts Corp. | 50,014 | | 8,071,259 |
Rockwell Collins, Inc. | 133,497 | | 7,354,350 |
Textron, Inc. | 514,599 | | 11,902,675 |
The Boeing Co. | 194,284 | | 13,691,193 |
TransDigm Group, Inc. (a) | 39,587 | | 3,565,601 |
United Technologies Corp. | 342,886 | | 28,404,676 |
| | 102,893,414 |
AIR FREIGHT & LOGISTICS - 0.8% |
Air Freight & Logistics - 0.8% |
C.H. Robinson Worldwide, Inc. | 54,146 | | 3,915,297 |
AIRLINES - 0.5% |
Airlines - 0.5% |
Copa Holdings SA Class A | 38,000 | | 2,493,180 |
AUTO COMPONENTS - 0.5% |
Auto Parts & Equipment - 0.5% |
TRW Automotive Holdings Corp. (a) | 45,980 | | 2,320,611 |
BUILDING PRODUCTS - 3.2% |
Building Products - 3.2% |
A.O. Smith Corp. | 68,101 | | 2,824,148 |
Armstrong World Industries, Inc. | 63,500 | | 2,508,250 |
Lennox International, Inc. | 71,900 | | 2,658,862 |
Owens Corning (a) | 151,261 | | 5,381,866 |
Quanex Building Products Corp. | 94,727 | | 1,484,372 |
| | 14,857,498 |
COMMERCIAL SERVICES & SUPPLIES - 3.1% |
Diversified Support Services - 0.6% |
Ritchie Brothers Auctioneers, Inc. (d) | 92,900 | | 2,544,531 |
Environmental & Facility Services - 1.6% |
Republic Services, Inc. | 264,832 | | 7,688,073 |
Office Services & Supplies - 0.4% |
Mine Safety Appliances Co. | 58,930 | | 2,010,692 |
Security & Alarm Services - 0.5% |
The Geo Group, Inc. (a) | 100,641 | | 2,093,333 |
TOTAL COMMERCIAL SERVICES & SUPPLIES | | 14,336,629 |
CONSTRUCTION & ENGINEERING - 6.9% |
Construction & Engineering - 6.9% |
AECOM Technology Corp. (a) | 94,100 | | 2,328,034 |
Aveng Ltd. | 25,100 | | 134,413 |
Dycom Industries, Inc. (a) | 92,300 | | 1,572,792 |
EMCOR Group, Inc. (a) | 202,899 | | 5,664,940 |
|
| Shares | | Value |
Fluor Corp. | 89,060 | | $ 5,657,982 |
Foster Wheeler AG (a) | 212,731 | | 5,765,010 |
Jacobs Engineering Group, Inc. (a) | 102,301 | | 4,004,061 |
MYR Group, Inc. (a) | 40,659 | | 987,607 |
Quanta Services, Inc. (a) | 201,000 | | 3,722,520 |
SNC-Lavalin Group, Inc. | 44,600 | | 2,521,296 |
| | 32,358,655 |
ELECTRICAL EQUIPMENT - 11.6% |
Electrical Components & Equipment - 10.7% |
AMETEK, Inc. | 112,500 | | 4,781,250 |
Cooper Industries PLC Class A | 103,823 | | 5,430,981 |
Emerson Electric Co. | 358,429 | | 17,595,280 |
GrafTech International Ltd. (a) | 361,000 | | 6,952,860 |
Polypore International, Inc. (a) | 26,300 | | 1,788,400 |
Prysmian SpA | 309,376 | | 5,738,842 |
Regal-Beloit Corp. | 43,912 | | 2,662,385 |
Roper Industries, Inc. | 61,400 | | 5,012,082 |
| | 49,962,080 |
Heavy Electrical Equipment - 0.9% |
Alstom SA | 82,064 | | 4,333,917 |
TOTAL ELECTRICAL EQUIPMENT | | 54,295,997 |
ENERGY EQUIPMENT & SERVICES - 0.5% |
Oil & Gas Equipment & Services - 0.5% |
Dresser-Rand Group, Inc. (a) | 44,052 | | 2,353,258 |
INDUSTRIAL CONGLOMERATES - 21.8% |
Industrial Conglomerates - 21.8% |
3M Co. | 52,820 | | 4,602,735 |
Carlisle Companies, Inc. | 83,593 | | 3,613,725 |
Danaher Corp. | 354,282 | | 17,398,789 |
General Electric Co. | 3,529,350 | | 63,210,657 |
Koninklijke Philips Electronics NV | 66,500 | | 1,651,637 |
Tyco International Ltd. | 270,014 | | 11,958,920 |
| | 102,436,463 |
MACHINERY - 16.7% |
Construction & Farm Machinery & Heavy Trucks - 6.5% |
Caterpillar, Inc. | 47,394 | | 4,682,053 |
Cummins, Inc. | 145,524 | | 15,262,557 |
Fiat Industrial SpA (a) | 380,900 | | 5,037,861 |
Jain Irrigation Systems Ltd. | 987,235 | | 3,889,987 |
Sauer-Danfoss, Inc. (a) | 32,200 | | 1,529,500 |
| | 30,401,958 |
Industrial Machinery - 10.2% |
Actuant Corp. Class A | 134,860 | | 3,332,391 |
Charter International PLC | 271,031 | | 3,559,396 |
Flowserve Corp. | 65,100 | | 6,469,638 |
Graco, Inc. | 72,800 | | 3,198,104 |
Ingersoll-Rand Co. Ltd. | 385,641 | | 14,430,686 |
Nordson Corp. | 6,300 | | 321,489 |
Pall Corp. | 85,113 | | 4,219,903 |
Common Stocks - continued |
| Shares | | Value |
MACHINERY - CONTINUED |
Industrial Machinery - continued |
SPX Corp. | 70,300 | | $ 5,289,372 |
Stanley Black & Decker, Inc. | 65,826 | | 4,329,376 |
TriMas Corp. (a) | 16,847 | | 403,823 |
Weg SA | 233,600 | | 2,529,964 |
| | 48,084,142 |
TOTAL MACHINERY | | 78,486,100 |
PROFESSIONAL SERVICES - 2.9% |
Human Resource & Employment Services - 1.3% |
Kforce, Inc. (a) | 75,200 | | 1,036,256 |
Towers Watson & Co. | 79,300 | | 4,849,195 |
| | 5,885,451 |
Research & Consulting Services - 1.6% |
Bureau Veritas SA | 32,600 | | 2,665,271 |
IHS, Inc. Class A (a) | 67,761 | | 4,993,308 |
| | 7,658,579 |
TOTAL PROFESSIONAL SERVICES | | 13,544,030 |
ROAD & RAIL - 5.7% |
Railroads - 5.7% |
Kansas City Southern (a) | 50,631 | | 3,004,950 |
Union Pacific Corp. | 229,749 | | 23,544,678 |
| | 26,549,628 |
TRADING COMPANIES & DISTRIBUTORS - 2.5% |
Trading Companies & Distributors - 2.5% |
Barloworld Ltd. | 106,200 | | 1,025,204 |
Beacon Roofing Supply, Inc. (a) | 61,700 | | 1,319,146 |
Mills Estruturas e Servicos de Engenharia SA | 268,200 | | 3,630,866 |
Rush Enterprises, Inc. Class A (a) | 202,658 | | 4,051,133 |
WESCO International, Inc. (a) | 38,301 | | 1,941,478 |
| | 11,967,827 |
TOTAL COMMON STOCKS (Cost $439,534,849) | 462,808,587 |
Nonconvertible Preferred Stocks - 0.9% |
| | | |
AUTOMOBILES - 0.9% |
Automobile Manufacturers - 0.9% |
Volkswagen AG
(Cost $4,009,213) | 20,900 | | 4,187,707 |
Convertible Bonds - 0.2% |
| Principal
Amount | | Value |
ELECTRICAL EQUIPMENT - 0.2% |
Electrical Components & Equipment - 0.2% |
Aspen Aerogels, Inc. 8% 6/1/14 (e)
(Cost $1,041,431) | | $ 1,041,431 | | $ 1,041,431 |
Money Market Funds - 1.5% |
| Shares | | |
Fidelity Cash Central Fund, 0.14% (b) | 4,165,237 | | 4,165,237 |
Fidelity Securities Lending Cash Central Fund, 0.15% (b)(c) | 2,598,400 | | 2,598,400 |
TOTAL MONEY MARKET FUNDS (Cost $6,763,637) | 6,763,637 |
TOTAL INVESTMENT PORTFOLIO - 101.2% (Cost $451,349,130) | | 474,801,362 |
NET OTHER ASSETS (LIABILITIES) - (1.2)% | | (5,558,497) |
NET ASSETS - 100% | $ 469,242,865 |
Legend |
(a) Non-income producing |
(b) Affiliated fund that is available only to investment companies and other accounts managed by Fidelity Investments. The rate quoted is the annualized seven-day yield of the fund at period end. A complete unaudited listing of the fund's holdings as of its most recent quarter end is available upon request. In addition, each Fidelity Central Fund's financial statements, which are not covered by the Fund's Report of Independent Registered Public Accounting Firm, are available on the SEC's website or upon request. |
(c) Investment made with cash collateral received from securities on loan. |
(d) Security or a portion of the security is on loan at period end. |
(e) Restricted securities - Investment in securities not registered under the Securities Act of 1933 (excluding 144A issues). At the end of the period, the value of restricted securities (excluding 144A issues) amounted to $1,041,431 or 0.2% of net assets. |
Additional information on each restricted holding is as follows: |
Security | Acquisition Date | Acquisition Cost |
Aspen Aerogels, Inc. 8% 6/1/14 | 6/14/11 | $ 1,041,431 |
Affiliated Central Funds |
Information regarding fiscal year to date income earned by the Fund from investments in Fidelity Central Funds is as follows: |
Fund | Income earned |
Fidelity Cash Central Fund | $ 12,060 |
Fidelity Securities Lending Cash Central Fund | 41,246 |
Total | $ 53,306 |
Other Information |
The following is a summary of the inputs used, as of July 31, 2011, involving the Fund's assets and liabilities carried at fair value. The inputs or methodology used for valuing securities may not be an indication of the risk associated with investing in those securities. For more information on valuation inputs, and their aggregation into the levels used in the table below, please refer to the Security Valuation section in the accompanying Notes to Financial Statements. |
Valuation Inputs at Reporting Date: |
Description | Total | Level 1 | Level 2 | Level 3 |
Investments in Securities: | | | | |
Common Stocks | $ 462,808,587 | $ 461,156,950 | $ 1,651,637 | $ - |
Nonconvertible Preferred Stocks | 4,187,707 | 4,187,707 | - | - |
Convertible Bonds | 1,041,431 | - | 1,041,431 | - |
Money Market Funds | 6,763,637 | 6,763,637 | - | - |
Total Investments in Securities: | $ 474,801,362 | $ 472,108,294 | $ 2,693,068 | $ - |
Distribution of investments by country of issue, as a percentage of total net assets, is as follows: (Unaudited) |
United States of America | 82.0% |
Ireland | 4.3% |
Switzerland | 3.7% |
Italy | 2.3% |
France | 1.5% |
Brazil | 1.3% |
Germany | 1.2% |
Canada | 1.2% |
Others (Individually Less Than 1%) | 2.5% |
| 100.0% |
See accompanying notes which are an integral part of the financial statements.
Annual Report
Fidelity Advisor Industrials Fund
Statement of Assets and Liabilities
| July 31, 2011 |
| | |
Assets | | |
Investment in securities, at value (including securities loaned of $2,541,792) - See accompanying schedule: Unaffiliated issuers (cost $444,585,493) | $ 468,037,725 | |
Fidelity Central Funds (cost $6,763,637) | 6,763,637 | |
Total Investments (cost $451,349,130) | | $ 474,801,362 |
Receivable for investments sold | | 7,292,943 |
Receivable for fund shares sold | | 680,496 |
Dividends receivable | | 171,703 |
Interest receivable | | 10,646 |
Distributions receivable from Fidelity Central Funds | | 7,550 |
Other receivables | | 11,005 |
Total assets | | 482,975,705 |
| | |
Liabilities | | |
Payable for investments purchased | $ 6,785,635 | |
Payable for fund shares redeemed | 3,793,352 | |
Accrued management fee | 232,477 | |
Distribution and service plan fees payable | 172,000 | |
Other affiliated payables | 113,992 | |
Other payables and accrued expenses | 36,984 | |
Collateral on securities loaned, at value | 2,598,400 | |
Total liabilities | | 13,732,840 |
| | |
Net Assets | | $ 469,242,865 |
Net Assets consist of: | | |
Paid in capital | | $ 443,517,457 |
Undistributed net investment income | | 259,179 |
Accumulated undistributed net realized gain (loss) on investments and foreign currency transactions | | 2,012,035 |
Net unrealized appreciation (depreciation) on investments and assets and liabilities in foreign currencies | | 23,454,194 |
Net Assets | | $ 469,242,865 |
Statement of Assets and Liabilities - continued
| July 31, 2011 |
| | |
Calculation of Maximum Offering Price Class A:
Net Asset Value and redemption price per share ($228,106,178 ÷ 8,864,567 shares) | | $ 25.73 |
| | |
Maximum offering price per share (100/94.25 of $25.73) | | $ 27.30 |
Class T:
Net Asset Value and redemption price per share ($71,541,725 ÷ 2,823,860 shares) | | $ 25.33 |
| | |
Maximum offering price per share (100/96.50 of $25.33) | | $ 26.25 |
Class B:
Net Asset Value and offering price per share ($28,599,695 ÷ 1,191,983 shares)A | | $ 23.99 |
| | |
Class C:
Net Asset Value and offering price per share ($72,672,551 ÷ 3,018,743 shares)A | | $ 24.07 |
| | |
| | |
Institutional Class:
Net Asset Value, offering price and redemption price per share ($68,322,716 ÷ 2,559,887 shares) | | $ 26.69 |
A Redemption price per share is equal to net asset value less any applicable contingent deferred sales charge.
See accompanying notes which are an integral part of the financial statements.
Annual Report
Fidelity Advisor Industrials Fund
Financial Statements - continued
Statement of Operations
| Year ended July 31, 2011 |
| | |
Investment Income | | |
Dividends | | $ 6,412,124 |
Interest | | 10,646 |
Income from Fidelity Central Funds | | 53,306 |
Total income | | 6,476,076 |
| | |
Expenses | | |
Management fee | $ 2,436,634 | |
Transfer agent fees | 1,068,699 | |
Distribution and service plan fees | 1,862,045 | |
Accounting and security lending fees | 170,298 | |
Custodian fees and expenses | 35,005 | |
Independent trustees' compensation | 2,254 | |
Registration fees | 83,683 | |
Audit | 46,289 | |
Legal | 1,536 | |
Miscellaneous | 4,328 | |
Total expenses before reductions | 5,710,771 | |
Expense reductions | (26,364) | 5,684,407 |
Net investment income (loss) | | 791,669 |
Realized and Unrealized Gain (Loss) Net realized gain (loss) on: | | |
Investment securities: | | |
Unaffiliated issuers | 55,894,214 | |
Foreign currency transactions | (74,490) | |
Total net realized gain (loss) | | 55,819,724 |
Change in net unrealized appreciation (depreciation) on: Investment securities | 3,561,922 | |
Assets and liabilities in foreign currencies | 1,573 | |
Total change in net unrealized appreciation (depreciation) | | 3,563,495 |
Net gain (loss) | | 59,383,219 |
Net increase (decrease) in net assets resulting from operations | | $ 60,174,888 |
Statement of Changes in Net Assets
| Year ended
July 31,
2011 | Year ended
July 31,
2010 |
Increase (Decrease) in Net Assets | | |
Operations | | |
Net investment income (loss) | $ 791,669 | $ 292,700 |
Net realized gain (loss) | 55,819,724 | 53,593,720 |
Change in net unrealized appreciation (depreciation) | 3,563,495 | 14,761,999 |
Net increase (decrease) in net assets resulting from operations | 60,174,888 | 68,648,419 |
Distributions to shareholders from net investment income | (328,907) | (658,116) |
Share transactions - net increase (decrease) | 75,767,831 | 10,867,809 |
Redemption fees | 11,341 | 9,545 |
Total increase (decrease) in net assets | 135,625,153 | 78,867,657 |
| | |
Net Assets | | |
Beginning of period | 333,617,712 | 254,750,055 |
End of period (including undistributed net investment income of $259,179 and distributions in excess of net investment income of $71,000, respectively) | $ 469,242,865 | $ 333,617,712 |
See accompanying notes which are an integral part of the financial statements.
Annual Report
Financial Highlights - Class A
Years ended July 31, | 2011 | 2010 | 2009 | 2008 | 2007 |
Selected Per-Share Data | | | | | |
Net asset value, beginning of period | $ 21.54 | $ 16.87 | $ 21.97 | $ 25.49 | $ 22.16 |
Income from Investment Operations | | | | | |
Net investment income (loss) C | .09 | .06 | .13 | .11 | .09 |
Net realized and unrealized gain (loss) | 4.13 | 4.68 | (5.08) | (1.17) | 5.11 |
Total from investment operations | 4.22 | 4.74 | (4.95) | (1.06) | 5.20 |
Distributions from net investment income | (.03) | (.07) | (.13) | - | (.06) |
Distributions from net realized gain | - | - | (.02) | (2.46) | (1.81) |
Total distributions | (.03) | (.07) | (.15) | (2.46) | (1.87) |
Redemption fees added to paid in capital C, G | - | - | - | - | - |
Net asset value, end of period | $ 25.73 | $ 21.54 | $ 16.87 | $ 21.97 | $ 25.49 |
Total Return A, B | 19.59% | 28.13% | (22.49)% | (4.71)% | 25.13% |
Ratios to Average Net Assets D, F | | | | | |
Expenses before reductions | 1.13% | 1.18% | 1.23% | 1.17% | 1.21% |
Expenses net of fee waivers, if any | 1.13% | 1.18% | 1.23% | 1.17% | 1.21% |
Expenses net of all reductions | 1.13% | 1.17% | 1.23% | 1.16% | 1.21% |
Net investment income (loss) | .36% | .31% | .89% | .46% | .38% |
Supplemental Data | | | | | |
Net assets, end of period (000 omitted) | $ 228,106 | $ 165,029 | $ 130,860 | $ 188,859 | $ 157,451 |
Portfolio turnover rate E | 75% | 110% | 135% | 91% | 130% |
A Total returns would have been lower if certain expenses had not been reduced during the applicable periods shown.
B Total returns do not include the effect of the sales charges.
C Calculated based on average shares outstanding during the period.
D Fees and expenses of any underlying Fidelity Central Funds are not included in the Fund's expense ratio. The Fund indirectly bears its proportionate share of the expenses of any underlying Fidelity Central Funds.
E Amount does not include the portfolio activity of any underlying Fidelity Central Funds.
F Expense ratios reflect operating expenses of the class. Expenses before reductions do not reflect amounts reimbursed by the investment adviser or reductions from brokerage service arrangements or reductions from other expense offset arrangements and do not represent the amount paid by the class during periods when reimbursements or reductions occur. Expenses net of fee waivers reflect expenses after reimbursement by the investment adviser but prior to reductions from brokerage service arrangements or other expense offset arrangements. Expenses net of all reductions represent the net expenses paid by the class.
G Amount represents less than $.01 per share.
Financial Highlights - Class T
Years ended July 31, | 2011 | 2010 | 2009 | 2008 | 2007 |
Selected Per-Share Data | | | | | |
Net asset value, beginning of period | $ 21.24 | $ 16.64 | $ 21.67 | $ 25.17 | $ 21.86 |
Income from Investment Operations | | | | | |
Net investment income (loss) C | .03 | .01 | .10 | .05 | .03 |
Net realized and unrealized gain (loss) | 4.07 | 4.61 | (5.03) | (1.15) | 5.05 |
Total from investment operations | 4.10 | 4.62 | (4.93) | (1.10) | 5.08 |
Distributions from net investment income | (.01) | (.02) | (.08) | - | (.03) |
Distributions from net realized gain | - | - | (.02) | (2.40) | (1.74) |
Total distributions | (.01) | (.02) | (.10) | (2.40) | (1.77) |
Redemption fees added to paid in capital C, G | - | - | - | - | - |
Net asset value, end of period | $ 25.33 | $ 21.24 | $ 16.64 | $ 21.67 | $ 25.17 |
Total Return A, B | 19.28% | 27.80% | (22.68)% | (4.96)% | 24.82% |
Ratios to Average Net Assets D, F | | | | | |
Expenses before reductions | 1.39% | 1.44% | 1.48% | 1.41% | 1.46% |
Expenses net of fee waivers, if any | 1.39% | 1.44% | 1.48% | 1.41% | 1.46% |
Expenses net of all reductions | 1.38% | 1.43% | 1.48% | 1.41% | 1.46% |
Net investment income (loss) | .10% | .06% | .63% | .21% | .13% |
Supplemental Data | | | | | |
Net assets, end of period (000 omitted) | $ 71,542 | $ 58,202 | $ 48,054 | $ 85,025 | $ 75,530 |
Portfolio turnover rate E | 75% | 110% | 135% | 91% | 130% |
A Total returns would have been lower if certain expenses had not been reduced during the applicable periods shown.
B Total returns do not include the effect of the sales charges.
C Calculated based on average shares outstanding during the period.
D Fees and expenses of any underlying Fidelity Central Funds are not included in the Fund's expense ratio. The Fund indirectly bears its proportionate share of the expenses of any underlying Fidelity Central Funds.
E Amount does not include the portfolio activity of any underlying Fidelity Central Funds.
F Expense ratios reflect operating expenses of the class. Expenses before reductions do not reflect amounts reimbursed by the investment adviser or reductions from brokerage service arrangements or reductions from other expense offset arrangements and do not represent the amount paid by the class during periods when reimbursements or reductions occur. Expenses net of fee waivers reflect expenses after reimbursement by the investment adviser but prior to reductions from brokerage service arrangements or other expense offset arrangements. Expenses net of all reductions represent the net expenses paid by the class.
G Amount represents less than $.01 per share.
See accompanying notes which are an integral part of the financial statements.
Annual Report
Financial Highlights - Class B
Years ended July 31, | 2011 | 2010 | 2009 | 2008 | 2007 |
Selected Per-Share Data | | | | | |
Net asset value, beginning of period | $ 20.22 | $ 15.90 | $ 20.74 | $ 24.19 | $ 21.02 |
Income from Investment Operations | | | | | |
Net investment income (loss) C | (.11) | (.09) | .02 | (.07) | (.09) |
Net realized and unrealized gain (loss) | 3.88 | 4.41 | (4.82) | (1.10) | 4.87 |
Total from investment operations | 3.77 | 4.32 | (4.80) | (1.17) | 4.78 |
Distributions from net investment income | - | - | (.04) | - | - |
Distributions from net realized gain | - | - | - | (2.28) | (1.61) |
Total distributions | - | - | (.04) | (2.28) | (1.61) |
Redemption fees added to paid in capital C, G | - | - | - | - | - |
Net asset value, end of period | $ 23.99 | $ 20.22 | $ 15.90 | $ 20.74 | $ 24.19 |
Total Return A, B | 18.64% | 27.17% | (23.10)% | (5.46)% | 24.18% |
Ratios to Average Net Assets D, F | | | | | |
Expenses before reductions | 1.93% | 1.97% | 1.98% | 1.95% | 2.00% |
Expenses net of fee waivers, if any | 1.93% | 1.97% | 1.98% | 1.95% | 2.00% |
Expenses net of all reductions | 1.93% | 1.97% | 1.98% | 1.95% | 2.00% |
Net investment income (loss) | (.44)% | (.48)% | .13% | (.33)% | (.41)% |
Supplemental Data | | | | | |
Net assets, end of period (000 omitted) | $ 28,600 | $ 29,048 | $ 25,212 | $ 39,989 | $ 44,330 |
Portfolio turnover rate E | 75% | 110% | 135% | 91% | 130% |
A Total returns would have been lower if certain expenses had not been reduced during the applicable periods shown.
B Total returns do not include the effect of the contingent deferred sales charge.
C Calculated based on average shares outstanding during the period.
D Fees and expenses of any underlying Fidelity Central Funds are not included in the Fund's expense ratio. The Fund indirectly bears its proportionate share of the expenses of any underlying Fidelity Central Funds.
E Amount does not include the portfolio activity of any underlying Fidelity Central Funds.
F Expense ratios reflect operating expenses of the class. Expenses before reductions do not reflect amounts reimbursed by the investment adviser or reductions from brokerage service arrangements or reductions from other expense offset arrangements and do not represent the amount paid by the class during periods when reimbursements or reductions occur. Expenses net of fee waivers reflect expenses after reimbursement by the investment adviser but prior to reductions from brokerage service arrangements or other expense offset arrangements. Expenses net of all reductions represent the net expenses paid by the class.
G Amount represents less than $.01 per share.
Financial Highlights - Class C
Years ended July 31, | 2011 | 2010 | 2009 | 2008 | 2007 |
Selected Per-Share Data | | | | | |
Net asset value, beginning of period | $ 20.28 | $ 15.94 | $ 20.79 | $ 24.26 | $ 21.16 |
Income from Investment Operations | | | | | |
Net investment income (loss) C | (.09) | (.08) | .02 | (.06) | (.08) |
Net realized and unrealized gain (loss) | 3.88 | 4.42 | (4.83) | (1.11) | 4.88 |
Total from investment operations | 3.79 | 4.34 | (4.81) | (1.17) | 4.80 |
Distributions from net investment income | - | - | (.04) | - | - |
Distributions from net realized gain | - | - | - | (2.30) | (1.70) |
Total distributions | - | - | (.04) | (2.30) | (1.70) |
Redemption fees added to paid in capital C, G | - | - | - | - | - |
Net asset value, end of period | $ 24.07 | $ 20.28 | $ 15.94 | $ 20.79 | $ 24.26 |
Total Return A, B | 18.69% | 27.23% | (23.09)% | (5.44)% | 24.25% |
Ratios to Average Net Assets D, F | | | | | |
Expenses before reductions | 1.89% | 1.93% | 1.98% | 1.91% | 1.94% |
Expenses net of fee waivers, if any | 1.89% | 1.93% | 1.98% | 1.91% | 1.94% |
Expenses net of all reductions | 1.88% | 1.92% | 1.98% | 1.90% | 1.94% |
Net investment income (loss) | (.40)% | (.43)% | .14% | (.28)% | (.35)% |
Supplemental Data | | | | | |
Net assets, end of period (000 omitted) | $ 72,673 | $ 51,760 | $ 37,862 | $ 57,742 | $ 57,862 |
Portfolio turnover rate E | 75% | 110% | 135% | 91% | 130% |
A Total returns would have been lower if certain expenses had not been reduced during the applicable periods shown.
B Total returns do not include the effect of the contingent deferred sales charge.
C Calculated based on average shares outstanding during the period.
D Fees and expenses of any underlying Fidelity Central Funds are not included in the Fund's expense ratio. The Fund indirectly bears its proportionate share of the expenses of any underlying Fidelity Central Funds.
E Amount does not include the portfolio activity of any underlying Fidelity Central Funds.
F Expense ratios reflect operating expenses of the class. Expenses before reductions do not reflect amounts reimbursed by the investment adviser or reductions from brokerage service arrangements or reductions from other expense offset arrangements and do not represent the amount paid by the class during periods when reimbursements or reductions occur. Expenses net of fee waivers reflect expenses after reimbursement by the investment adviser but prior to reductions from brokerage service arrangements or other expense offset arrangements. Expenses net of all reductions represent the net expenses paid by the class.
G Amount represents less than $.01 per share.
See accompanying notes which are an integral part of the financial statements.
Annual Report
Financial Highlights - Institutional Class
Years ended July 31, | 2011 | 2010 | 2009 | 2008 | 2007 |
Selected Per-Share Data | | | | | |
Net asset value, beginning of period | $ 22.30 | $ 17.45 | $ 22.72 | $ 26.26 | $ 22.77 |
Income from Investment Operations | | | | | |
Net investment income (loss) B | .17 | .13 | .19 | .18 | .16 |
Net realized and unrealized gain (loss) | 4.28 | 4.83 | (5.27) | (1.19) | 5.27 |
Total from investment operations | 4.45 | 4.96 | (5.08) | (1.01) | 5.43 |
Distributions from net investment income | (.06) | (.11) | (.17) | - | (.13) |
Distributions from net realized gain | - | - | (.02) | (2.53) | (1.81) |
Total distributions | (.06) | (.11) | (.19) | (2.53) | (1.94) |
Redemption fees added to paid in capital B, F | - | - | - | - | - |
Net asset value, end of period | $ 26.69 | $ 22.30 | $ 17.45 | $ 22.72 | $ 26.26 |
Total Return A | 19.95% | 28.52% | (22.31)% | (4.40)% | 25.53% |
Ratios to Average Net Assets C, E | | | | | |
Expenses before reductions | .85% | .89% | .96% | .88% | .92% |
Expenses net of fee waivers, if any | .85% | .89% | .96% | .88% | .92% |
Expenses net of all reductions | .84% | .88% | .95% | .87% | .91% |
Net investment income (loss) | .65% | .61% | 1.16% | .75% | .67% |
Supplemental Data | | | | | |
Net assets, end of period (000 omitted) | $ 68,323 | $ 29,578 | $ 12,762 | $ 33,642 | $ 19,498 |
Portfolio turnover rate D | 75% | 110% | 135% | 91% | 130% |
A Total returns would have been lower if certain expenses had not been reduced during the applicable periods shown.
B Calculated based on average shares outstanding during the period.
C Fees and expenses of any underlying Fidelity Central Funds are not included in the Fund's expense ratio. The Fund indirectly bears its proportionate share of the expenses of any underlying Fidelity Central Funds.
D Amount does not include the portfolio activity of any underlying Fidelity Central Funds.
E Expense ratios reflect operating expenses of the class. Expenses before reductions do not reflect amounts reimbursed by the investment adviser or reductions from brokerage service arrangements or reductions from other expense offset arrangements and do not represent the amount paid by the class during periods when reimbursements or reductions occur. Expenses net of fee waivers reflect expenses after reimbursement by the investment adviser but prior to reductions from brokerage service arrangements or other expense offset arrangements. Expenses net of all reductions represent the net expenses paid by the class.
F Amount represents less than $.01 per share.
See accompanying notes which are an integral part of the financial statements.
Annual Report
Notes to Financial Statements
For the period ended July 31, 2011
1. Organization.
Fidelity Advisor Industrials Fund (the Fund) is a non-diversified fund of Fidelity Advisor Series VII (the Trust) and is authorized to issue an unlimited number of shares. The Trust is registered under the Investment Company Act of 1940, as amended (the 1940 Act), as an open-end management investment company organized as a Massachusetts business trust. The Fund offers Class A, Class T, Class C and Institutional Class shares, each of which, along with Class B shares, has equal rights as to assets and voting privileges. Effective after the close of business on September 1, 2010, Class B shares were closed to new accounts and additional purchases, except for exchanges and reinvestments, by existing shareholders. Each class has exclusive voting rights with respect to matters that affect that class. Class B shares will automatically convert to Class A shares after a holding period of seven years from the initial date of purchase. Investment income, realized and unrealized capital gains and losses, the common expenses of the Fund, and certain fund-level expense reductions, if any, are allocated on a pro-rata basis to each class based on the relative net assets of each class to the total net assets of the Fund. Each class differs with respect to transfer agent and distribution and service plan fees incurred. Certain expense reductions may also differ by class.
2. Investments in Fidelity Central Funds.
The Fund invests in Fidelity Central Funds, which are open-end investment companies available only to other investment companies and accounts managed by Fidelity Management & Research Company (FMR) and its affiliates. The Fund's Schedule of Investments lists each of the Fidelity Central Funds held as of period end, if any, as an investment of the Fund, but does not include the underlying holdings of each Fidelity Central Fund. As an Investing Fund, the Fund indirectly bears its proportionate share of the expenses of the underlying Fidelity Central Funds.
The Money Market Central Funds seek preservation of capital and current income and are managed by Fidelity Investments Money Management, Inc. (FIMM), an affiliate of FMR.
A complete unaudited list of holdings for each Fidelity Central Fund is available upon request or at the Securities and Exchange Commission (the SEC) web site at www.sec.gov. In addition, the financial statements of the Fidelity Central Funds, which are not covered by the Fund's Report of Independent Registered Public Accounting Firm, are available on the SEC web site or upon request.
3. Significant Accounting Policies.
The financial statements have been prepared in conformity with accounting principles generally accepted in the United States of America (GAAP), which require management to make certain estimates and assumptions at the date of the financial statements. Actual results could differ from those estimates. Subsequent events, if any, through the date that the financial statements were issued have been evaluated in the preparation of the financial statements. The following summarizes the significant accounting policies of the Fund:
Security Valuation. Investments are valued as of 4:00 p.m. Eastern time on the last calendar day of the period. The Fund uses independent pricing services approved by the Board of Trustees to value its investments. When current market prices or quotations are not readily available or reliable, valuations may be determined in good faith in accordance with procedures adopted by the Board of Trustees. Factors used in determining value may include market or security specific events, changes in interest rates and credit quality. The frequency with which these procedures are used cannot be predicted and they may be utilized to a significant extent. The value used for net asset value (NAV) calculation under these procedures may differ from published prices for the same securities.
The Fund categorizes the inputs to valuation techniques used to value its investments into a disclosure hierarchy consisting of three levels as shown below:
Level 1 - quoted prices in active markets for identical investments
Level 2 - other significant observable inputs (including quoted prices for similar investments, interest rates, prepayment speeds, etc.)
Level 3 - unobservable inputs (including the Fund's own assumptions based on the best information available)
Changes in valuation techniques may result in transfers in or out of an assigned level within the disclosure hierarchy. The aggregate value of investments by input level, as of July 31, 2011, is included at the end of the Fund's Schedule of Investments. Valuation techniques used to value the Fund's investments by major category are as follows:
Equity securities, including restricted securities, for which market quotations are readily available, are valued at the last reported sale price or official closing price as reported by an independent pricing service on the primary market or exchange on which they are traded and are categorized as Level 1 in the hierarchy. In the event there were no sales during the day or closing prices are not available, securities are valued at the last quoted bid price or may be valued using the last available price and are generally categorized as Level 2 in the hierarchy. For foreign equity securities, when significant market or security specific events arise, comparisons to the valuation of American Depositary Receipts (ADRs), futures contracts, Exchange-traded funds (ETFs)and certain indexes as well as quoted prices for similar securities are used and are categorized as Level 2 in the hierarchy in these
Annual Report
3. Significant Accounting Policies - continued
Security Valuation - continued
circumstances. Utilizing these techniques may result in transfers between Level 1 and Level 2. For restricted equity securities and private placements where observable inputs are limited, assumptions about market activity and risk are used and are categorized as Level 3 in the hierarchy.
Debt securities, including restricted securities, are valued based on evaluated prices received from independent pricing services or from dealers who make markets in such securities. For corporate bonds, pricing services utilize matrix pricing which considers yield or price of bonds of comparable quality, coupon, maturity and type as well as dealer supplied prices and are generally categorized as Level 2 in the hierarchy. When independent prices are unavailable or unreliable, debt securities may be valued utilizing pricing matrices which consider similar factors that would be used by independent pricing services. These are generally categorized as Level 2 in the hierarchy but may be Level 3 depending on the circumstances.
Investments in open-end mutual funds, including the Fidelity Central Funds, are valued at their closing net asset value each business day and are categorized as Level 1 in the hierarchy.
Foreign Currency. The Fund may use foreign currency contracts to facilitate transactions in foreign-denominated securities. Gains and losses from these transactions may arise from changes in the value of the foreign currency or if the counterparties do not perform under the contracts' terms.
Foreign-denominated assets, including investment securities, and liabilities are translated into U.S. dollars at the exchange rate at period end. Purchases and sales of investment securities, income and dividends received and expenses denominated in foreign currencies are translated into U.S. dollars at the exchange rate in effect on the transaction date.
The effects of exchange rate fluctuations on investments are included with the net realized and unrealized gain (loss) on investment securities. Other foreign currency transactions resulting in realized and unrealized gain (loss) are disclosed separately.
Investment Transactions and Income. For financial reporting purposes, the Fund's investment holdings and NAV include trades executed through the end of the last business day of the period. The NAV per share for processing shareholder transactions is calculated as of the close of business of the New York Stock Exchange (NYSE), normally 4:00 p.m. Eastern time and includes trades executed through the end of the prior business day. Gains and losses on securities sold are determined on the basis of identified cost and may include proceeds received from litigation. Dividend income is recorded on the ex-dividend date, except for certain dividends from foreign securities where the ex-dividend date may have passed, which are recorded as soon as the Fund is informed of the ex-dividend date. Non-cash dividends included in dividend income, if any, are recorded at the fair market value of the securities received. Distributions received on securities that represent a return of capital or capital gain are recorded as a reduction of cost of investments and/or as a realized gain. The Fund estimates the components of distributions received that may be considered return of capital distributions or capital gain distributions. Interest income and distributions from the Fidelity Central Funds are accrued as earned. Interest income includes coupon interest and amortization of premium and accretion of discount on debt securities. Investment income is recorded net of foreign taxes withheld where recovery of such taxes is uncertain.
Expenses. Expenses directly attributable to a fund are charged to that fund. Expenses attributable to more than one fund are allocated among the respective funds on the basis of relative net assets or other appropriate methods. Expense estimates are accrued in the period to which they relate and adjustments are made when actual amounts are known.
Income Tax Information and Distributions to Shareholders. Each year, the Fund intends to qualify as a regulated investment company, including distributing substantially all of its taxable income and realized gains under Subchapter M of the Internal Revenue Code and filing its U.S. federal tax return. As a result, no provision for income taxes is required. As of July 31, 2011, the Fund did not have any unrecognized tax benefits in the financial statements. A fund's federal tax return is subject to examination by the Internal Revenue Service (IRS) for a period of three years. Foreign taxes are provided for based on the Fund's understanding of the tax rules and rates that exist in the foreign markets in which it invests.
Distributions are declared and recorded on the ex-dividend date. Income dividends and capital gain distributions are declared separately for each class. Income and capital gain distributions are determined in accordance with income tax regulations, which may differ from GAAP. In addition, the Fund claimed a portion of the payment made to redeeming shareholders as a distribution for income tax purposes.
Capital accounts within the financial statements are adjusted for permanent book-tax differences. These adjustments have no impact on net assets or the results of operations. Temporary book-tax differences will reverse in a subsequent period.
Book-tax differences are primarily due to foreign currency transactions, deferred trustees compensation, capital loss carryforwards and losses deferred due to wash sales and excise tax regulations.
Annual Report
Notes to Financial Statements - continued
3. Significant Accounting Policies - continued
Income Tax Information and Distributions to Shareholders - continued
The federal tax cost of investment securities and unrealized appreciation (depreciation) as of period end were as follows:
Gross unrealized appreciation | $ 42,394,926 |
Gross unrealized depreciation | (21,141,559) |
Net unrealized appreciation (depreciation) on securities and other investments | $ 21,253,367 |
| |
Tax Cost | $ 453,547,995 |
The tax-based components of distributable earnings as of period end were as follows:
Undistributed ordinary income | $ 259,182 |
Undistributed long-term capital gain | $ 4,210,899 |
Net unrealized appreciation (depreciation) | $ 21,255,329 |
Under the recently enacted Regulated Investment Company Modernization Act of 2010 (the Act), the Fund will be permitted to carry forward capital losses incurred in taxable years beginning after December 22, 2010 for an unlimited period. However, any losses incurred during those future taxable years will be required to be utilized prior to any losses incurred in pre-enactment taxable years, which generally expire after eight years from when they are incurred. Additionally, post-enactment capital losses that are carried forward will retain their character as either short-term or long-term capital losses rather than being considered all short-term as under previous law. The Fund's first fiscal year end subject to the Act will be July 31, 2012.
The tax character of distributions paid was as follows:
| July 31, 2011 | July 31, 2010 |
Ordinary Income | $ 328,907 | $ 658,116 |
Short-Term Trading (Redemption) Fees. Shares held by investors in the Fund less than 30 days are subject to a redemption fee equal to .75% of the net asset value of shares redeemed. All redemption fees, which reduce the proceeds of the shareholder redemption, are retained by the Fund and accounted for as an addition to paid in capital.
New Accounting Pronouncement. In May 2011, the Financial Accounting Standards Board issued Accounting Standard Update No. 2011-04, Fair Value Measurement (Topic 820) - Amendments to Achieve Common Fair Value Measurement and Disclosure Requirements in U.S. GAAP and IFRSs. The update changes the wording used to describe the requirements in GAAP for measuring fair value and for disclosing information about fair value measurements. The update is effective during interim and annual periods beginning after December 15, 2011. Management is currently evaluating the impact of the update's adoption on the Fund's financial statement disclosures.
4. Operating Policies.
Restricted Securities. The Fund may invest in securities that are subject to legal or contractual restrictions on resale. These securities generally may be resold in transactions exempt from registration or to the public if the securities are registered. Disposal of these securities may involve time-consuming negotiations and expense, and prompt sale at an acceptable price may be difficult. Information regarding restricted securities is included at the end of the Fund's Schedule of Investments.
5. Purchases and Sales of Investments.
Purchases and sales of securities, other than short-term securities, aggregated $399,813,106 and $323,316,491, respectively.
6. Fees and Other Transactions with Affiliates.
Management Fee. FMR and its affiliates provide the Fund with investment management related services for which the Fund pays a monthly management fee. The management fee is the sum of an individual fund fee rate that is based on an annual rate of .30% of the Fund's average net assets and a group fee rate that averaged .26% during the period. The group fee rate is based upon the average net assets of all the mutual funds advised by FMR. The group fee rate decreases as assets under management increase and increases as assets under management decrease. For the period, the total annual management fee rate was .56% of the Fund's average net assets.
Annual Report
6. Fees and Other Transactions with Affiliates - continued
Distribution and Service Plan Fees. In accordance with Rule 12b-1 of the 1940 Act, the Fund has adopted separate Distribution and Service Plans for each class of shares. Certain classes pay Fidelity Distributors Corporation (FDC), an affiliate of FMR, separate Distribution and Service Fees, each of which is based on an annual percentage of each class' average net assets. In addition, FDC may pay financial intermediaries for selling shares of the Fund and providing shareholder support services. For the period, the Distribution and Service Fee rates, total fees and amounts retained by FDC were as follows:
| Distribution
Fee | Service
Fee | Total Fees | Retained
by FDC |
Class A | -% | .25% | $ 537,691 | $ 9,245 |
Class T | .25% | .25% | 348,344 | 862 |
Class B | .75% | .25% | 309,966 | 232,697 |
Class C | .75% | .25% | 666,044 | 157,445 |
| | | $ 1,862,045 | $ 400,249 |
Sales Load. FDC may receive a front-end sales charge of up to 5.75% for selling Class A shares, and 3.50% for selling Class T shares, some of which is paid to financial intermediaries for selling shares of the Fund. Depending on the holding period, FDC may receive contingent deferred sales charges levied on Class A, Class T, Class B, and Class C redemptions. The deferred sales charges range from 5% to 1% for Class B, 1% for Class C, 1.00% for certain purchases of Class A shares and .25% for certain purchases of Class T shares.
For the period, sales charge amounts retained by FDC were as follows:
| Retained
by FDC |
Class A | $ 122,726 |
Class T | 14,170 |
Class B* | 58,342 |
Class C* | 8,458 |
| $ 203,696 |
* When Class B and Class C shares are initially sold, FDC pays commissions from its own resources to financial intermediaries through which the sales are made.
Transfer Agent Fees. Fidelity Investments Institutional Operations Company, Inc. (FIIOC), an affiliate of FMR, is the transfer, dividend disbursing and shareholder servicing agent for each class of the Fund. FIIOC receives account fees and asset-based fees that vary according to the account size and type of account of the shareholders of the respective classes of the Fund. FIIOC pays for typesetting, printing and mailing of shareholder reports, except proxy statements. For the period, transfer agent fees for each class were as follows:
| Amount | % of
Average
Net Assets |
Class A | $ 526,436 | .25 |
Class T | 172,939 | .25 |
Class B | 91,737 | .30 |
Class C | 163,663 | .25 |
Institutional Class | 113,924 | .21 |
| $ 1,068,699 | |
Accounting and Security Lending Fees. Fidelity Service Company, Inc. (FSC), an affiliate of FMR, maintains the Fund's accounting records. The accounting fee is based on the level of average net assets for the month. Under a separate contract, FSC administers the security lending program. The security lending fee is based on the number and duration of lending transactions.
Brokerage Commissions. The Fund placed a portion of its portfolio transactions with brokerage firms which are affiliates of the investment adviser. The commissions paid to these affiliated firms were $7,279 for the period.
7. Committed Line of Credit.
The Fund participates with other funds managed by FMR or an affiliate in a $4.0 billion credit facility (the "line of credit") to be utilized for temporary or emergency purposes to fund shareholder redemptions or for other short-term liquidity purposes. The Fund has agreed to pay commitment fees on its pro-rata portion of the line of credit, which amounted to $1,389 and is reflected in Miscellaneous expenses on the Statement of Operations. During the period, there were no borrowings on this line of credit.
Annual Report
Notes to Financial Statements - continued
8. Security Lending.
The Fund lends portfolio securities through a lending agent from time to time in order to earn additional income. The lending agent may loan securities to certain qualified borrowers, including Fidelity Capital Markets (FCM), a broker-dealer affiliated with the Fund. On the settlement date of the loan, the Fund receives collateral (in the form of U.S. Treasury obligations, letters of credit and/or cash) against the loaned securities and maintains collateral in an amount not less than 100% of the market value of the loaned securities during the period of the loan. The market value of the loaned securities is determined at the close of business of the Fund and any additional required collateral is delivered to the Fund on the next business day. If the borrower defaults on its obligation to return the securities loaned because of insolvency or other reasons, a fund could experience delays and costs in recovering the securities loaned or in gaining access to the collateral. Any cash collateral received is invested in the Fidelity Securities Lending Cash Central Fund. The value of loaned securities and cash collateral at period end are disclosed on the Fund's Statement of Assets and Liabilities. Security lending income represents the income earned on investing cash collateral, less rebates paid to borrowers and lending agent fees associated with the loan, plus any premium payments received for lending certain types of securities. Security lending income is presented in the Statement of Operations as a component of income from Fidelity Central Funds. Total security lending income during the period amounted to $41,246. During the period, there were no securities loaned to FCM.
9. Expense Reductions.
Many of the brokers with whom FMR places trades on behalf of the Fund provided services to the Fund in addition to trade execution. These services included payments of certain expenses on behalf of the Fund totaling $26,364 for the period.
10. Distributions to Shareholders.
Distributions to shareholders of each class were as follows:
Years ended July 31, | 2011 | 2010 |
From net investment income | | |
Class A | $ 235,263 | $ 508,657 |
Class T | 13,200 | 67,522 |
Institutional Class | 80,444 | 81,937 |
Total | $ 328,907 | $ 658,116 |
11. Share Transactions.
Transactions for each class of shares were as follows:
| Shares | Dollars |
Years ended July 31, | 2011 | 2010 | 2011 | 2010 |
Class A | | | | |
Shares sold | 3,645,278 | 2,293,002 | $ 95,442,701 | $ 46,751,968 |
Reinvestment of distributions | 8,108 | 24,478 | 205,122 | 465,084 |
Shares redeemed | (2,451,683) | (2,413,077) | (63,502,279) | (48,350,817) |
Net increase (decrease) | 1,201,703 | (95,597) | $ 32,145,544 | $ (1,133,765) |
Class T | | | | |
Shares sold | 757,485 | 640,220 | $ 19,402,949 | $ 12,504,319 |
Reinvestment of distributions | 500 | 3,441 | 12,596 | 64,976 |
Shares redeemed | (674,809) | (791,417) | (16,619,027) | (15,762,597) |
Net increase (decrease) | 83,176 | (147,756) | $ 2,796,518 | $ (3,193,302) |
Class B | | | | |
Shares sold | 89,875 | 230,669 | $ 2,150,821 | $ 4,429,240 |
Reinvestment of distributions | - | - | - | - |
Shares redeemed | (334,639) | (379,173) | (7,838,637) | (7,171,787) |
Net increase (decrease) | (244,764) | (148,504) | $ (5,687,816) | $ (2,742,547) |
Annual Report
11. Share Transactions - continued
| Shares | Dollars |
Years ended July 31, | 2011 | 2010 | 2011 | 2010 |
Class C | | | | |
Shares sold | 1,054,416 | 965,412 | $ 25,772,946 | $ 18,697,081 |
Reinvestment of distributions | - | - | - | - |
Shares redeemed | (588,462) | (787,460) | (13,948,935) | (14,785,582) |
Net increase (decrease) | 465,954 | 177,952 | $ 11,824,011 | $ 3,911,499 |
Institutional Class | | | | |
Shares sold | 2,320,182 | 1,199,584 | $ 63,208,570 | $ 26,360,020 |
Reinvestment of distributions | 2,269 | 3,299 | 59,382 | 64,789 |
Shares redeemed | (1,089,149) | (607,717) | (28,578,378) | (12,398,885) |
Net increase (decrease) | 1,233,302 | 595,166 | $ 34,689,574 | $ 14,025,924 |
12. Other.
The Fund's organizational documents provide former and current trustees and officers with a limited indemnification against liabilities arising in connection with the performance of their duties to the Fund. In the normal course of business, the Fund may also enter into contracts that provide general indemnifications. The Fund's maximum exposure under these arrangements is unknown as this would be dependent on future claims that may be made against the Fund. The risk of material loss from such claims is considered remote.
Annual Report
Fidelity Advisor Technology Fund - Class A, T, B, and C
Performance: The Bottom Line
Average annual total return reflects the change in the value of an investment, assuming reinvestment of the class' distributions from dividend income and capital gains (the profits earned upon the sale of securities that have grown in value, if any) and assuming a constant rate of performance each year. The $10,000 table and the fund's returns do not reflect the deduction of taxes that a shareholder would pay on fund distributions or the redemption of fund shares. During periods of reimbursement by Fidelity, a fund's total return will be greater than it would be had the reimbursement not occurred. How a fund did yesterday is no guarantee of how it will do tomorrow. Returns reflect the conversion of Class B shares to Class A shares after a maximum of seven years.
Average Annual Total Returns
Periods ended July 31, 2011 | Past 1
year | Past 5
years | Past 10
years |
Class A (incl. 5.75% sales charge) | 19.49% | 8.73% | 2.98% |
Class T (incl. 3.50% sales charge) | 22.03% | 8.97% | 2.98% |
Class B (incl. contingent deferred sales charge) A | 20.87% | 8.93% | 3.06% |
Class C (incl. contingent deferred sales charge) B | 24.87% | 9.21% | 2.84% |
A Class B shares' contingent deferred sales charges included in the past one year, past five years and past ten years total return figures are 5%, 2%, and 0%, respectively.
B Class C shares' contingent deferred sales charges included in the past one year, past five years and past ten years total return figures are 1%, 0%, and 0%, respectively.
$10,000 Over 10 Years
Let's say hypothetically that $10,000 was invested in Fidelity Advisor Technology Fund - Class A on July 31, 2001, and the current 5.75% sales charge was paid. The chart shows how the value of your investment would have changed, and also shows how the S&P 500 Index performed over the same period.
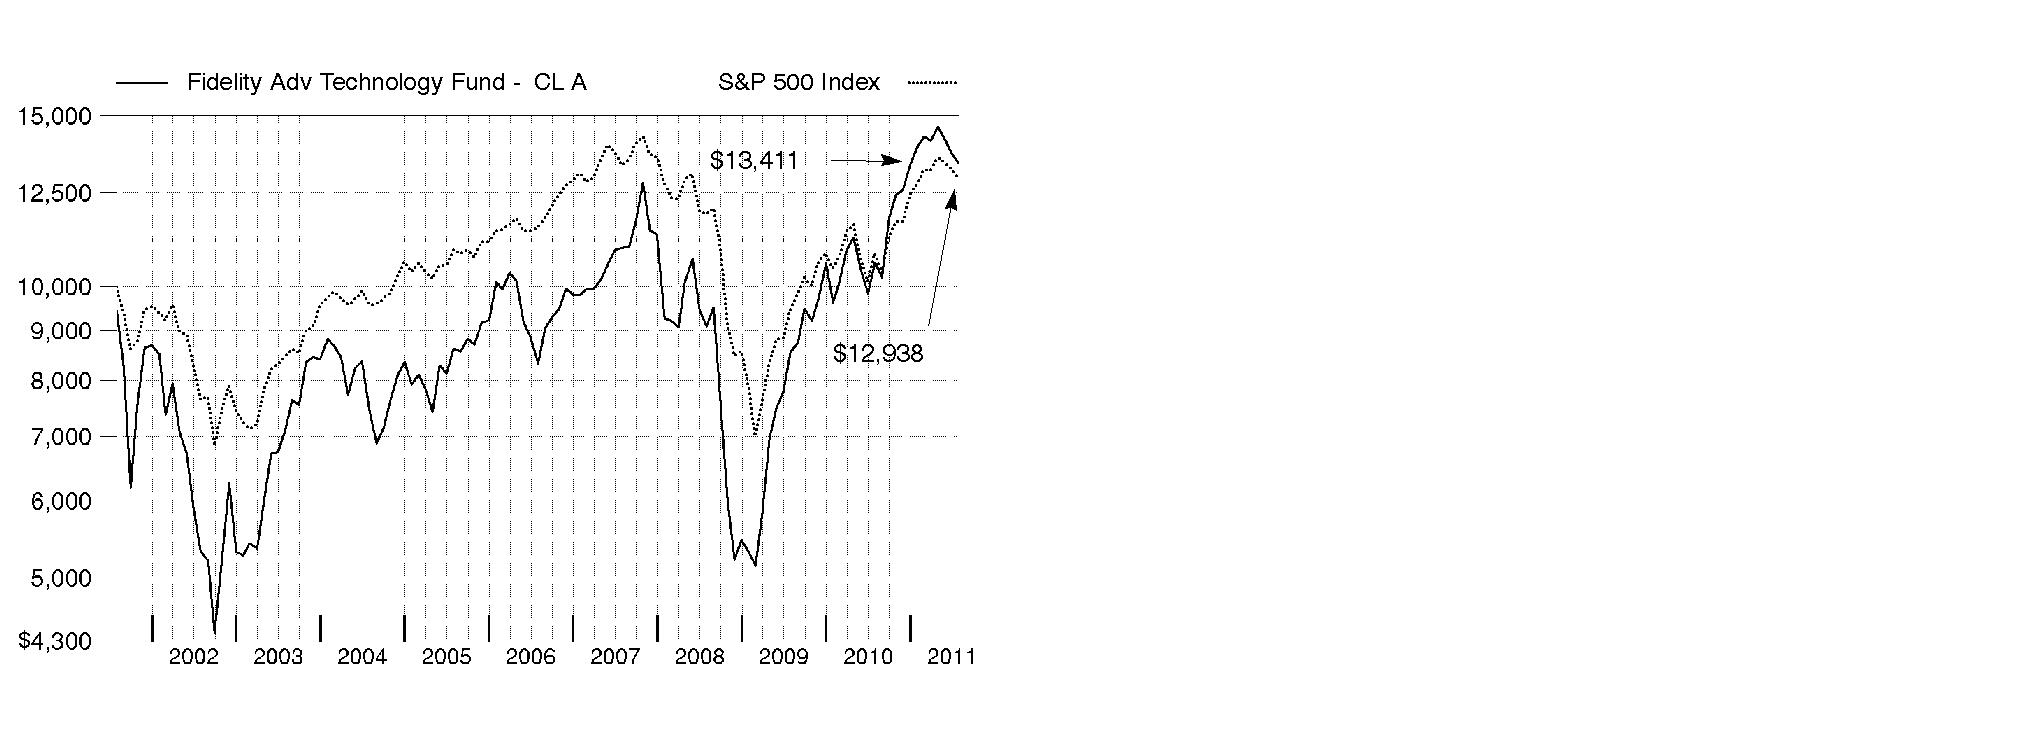
Annual Report
Fidelity Advisor Technology Fund
Market Recap: U.S. stocks registered solid double-digit gains for the 12 months ending July 31, 2011, extending a rally that began more than two years earlier. Despite a rough start in August 2010, markets turned positive in September, as increased demand for capital goods and other upbeat indicators trumped investor worry about a U.S. recessionary relapse. The broad market, as measured by the S&P 500® Index, rose 9% that month, its biggest September gain in 71 years. Seven more monthly advances followed, fueled by encouraging corporate earnings and economic activity. However, volatility picked up in the period's latter months, as markets reacted to continued high U.S. unemployment, nagging debt troubles in Europe and looming legislative battles over the federal debt ceiling. May unemployment rose above 9% for the first time in 2011, contributing to a traditional "June swoon" for stocks. Market uncertainty lingered in July, when the S&P 500® posted its second-biggest monthly loss of the period. For the full year, the S&P 500® climbed 19.65%, while the blue-chip-laden Dow Jones Industrial AverageSM rose a comparable 19.09% and the technology-heavy Nasdaq Composite® Index gained 23.40%. On the capitalization spectrum, stocks of mid-cap companies fared best, with the Russell Midcap® Index rising 24.51% and the small-cap Russell 2000® Index adding 23.92%.
Comments from Charlie Chai, Portfolio Manager of Fidelity Advisor® Technology Fund: For the year, the fund's Class A, Class T, Class B and Class C shares returned 26.78%, 26.46%, 25.87% and 25.87%, respectively (excluding sales charges), handily beating the 20.21% advance of the MSCI® U.S. IM Information Technology 25/50 Index and the S&P 500. Versus the MSCI index, stock picking in a number of groups, most notably communications equipment, semiconductors and systems software, was the main driver of the fund's outperformance. Elsewhere, security selection added value in computer hardware, although the benefit was tempered to some extent by underweighting the strong-performing group. Out-of-index representation in Internet retail was helpful as well. At the stock level, underweighting three weak-performing index heavyweights accounted for a lot of the fund's outperformance: networking equipment maker Cisco Systems, computer/printer provider Hewlett-Packard and software giant Microsoft. I'll also mention two out-of-benchmark positions that did well for the fund. Internet retailer Amazon.com continued to dominate its primary niche and enjoyed rapid growth in its Amazon Web Services segment. Meanwhile, Taiwan-based HTC was one of the beneficiaries of the surging popularity of smartphones incorporating Google's AndroidTM operating system. In absolute terms, computer/consumer electronics maker Apple - the fund's largest holding during the period - was a heavy hitter, adding more than six percentage points to performance. Conversely, a large underweighting and unrewarding stock selection in IT consulting/other services detracted from relative performance. The main problem there was the fund's negligible stake in major index constituent International Business Machines, whose stock gained more than 40% during the period. Underweighting enterprise software provider Oracle also worked against the fund, given the stock's strong advance. Additionally, our results were hampered by a small out-of-benchmark position in Longtop Financial Technologies, a China-based company whose stock stopped trading in May, when it appeared the company had misrepresented its financial condition.
Comments from Charlie Chai, Portfolio Manager of Fidelity® Advisor Technology Fund: For the year, the fund's Institutional Class shares returned 27.18%, handily beating the 20.21% advance of the MSCI® U.S. IM Information Technology 25/50 Index and the S&P 500. Versus the MSCI index, stock picking in a number of groups, most notably communications equipment, semiconductors and systems software, was the main driver of the fund's outperformance. Elsewhere, security selection added value in computer hardware, although the benefit was tempered to some extent by underweighting the strong-performing group. Out-of-index representation in Internet retail was helpful as well. At the stock level, underweighting three weak-performing index heavyweights accounted for a lot of the fund's outperformance: networking equipment maker Cisco Systems, computer/printer provider Hewlett-Packard and software giant Microsoft. I'll also mention two out-of-benchmark positions that did well for the fund. Internet retailer Amazon.com continued to dominate its primary niche and enjoyed rapid growth in its Amazon Web Services segment. Meanwhile, Taiwan-based HTC was one of the beneficiaries of the surging popularity of smartphones incorporating Google's AndroidTM operating system. In absolute terms, computer/consumer electronics maker Apple - the fund's largest holding during the period - was a heavy hitter, adding more than six percentage points to performance. Conversely, a large underweighting and unrewarding stock selection in IT consulting/other services detracted from relative performance. The main problem there was the fund's negligible stake in major index constituent International Business Machines, whose stock gained more than 40% during the period. Underweighting enterprise software provider Oracle also worked against the fund, given the stock's strong advance. Additionally, our results were hampered by a small out-of-benchmark position in Longtop Financial Technologies, a China-based company whose stock stopped trading in May, when it appeared the company had misrepresented its financial condition.
The views expressed above reflect those of the portfolio manager(s) only through the end of the period as stated on the cover of this report and do not necessarily represent the views of Fidelity or any other person in the Fidelity organization. Any such views are subject to change at any time based upon market or other conditions and Fidelity disclaims any responsibility to update such views. These views may not be relied on as investment advice and, because investment decisions for a Fidelity fund are based on numerous factors, may not be relied on as an indication of trading intent on behalf of any Fidelity fund.
Annual Report
Fidelity Advisor Technology Fund
As a shareholder of the Fund, you incur two types of costs: (1) transaction costs, including sales charges (loads) on purchase payments or redemption proceeds, redemption fees, and (2) ongoing costs, including management fees, distribution and/or service (12b-1) fees and other Fund expenses. This Example is intended to help you understand your ongoing costs (in dollars) of investing in the Fund and to compare these costs with the ongoing costs of investing in other mutual funds.
The Example is based on an investment of $1,000 invested at the beginning of the period and held for the entire period (February 1, 2011 to July 31, 2011).
Actual Expenses
The first line of the accompanying table for each class of the Fund provides information about actual account values and actual expenses. You may use the information in this line, together with the amount you invested, to estimate the expenses that you paid over the period. Simply divide your account value by $1,000.00 (for example, an $8,600 account value divided by $1,000.00 = 8.6), then multiply the result by the number in the first line for a class of the Fund under the heading entitled "Expenses Paid During Period" to estimate the expenses you paid on your account during this period. In addition, the Fund, as a shareholder in the underlying Fidelity Central Funds, will indirectly bear its pro-rata share of the fees and expenses incurred by the underlying Fidelity Central Funds. These fees and expenses are not included in the Fund's annualized expense ratio used to calculate the expense estimate in the table below.
Hypothetical Example for Comparison Purposes
The second line of the accompanying table for each class of the Fund provides information about hypothetical account values and hypothetical expenses based on a Class' actual expense ratio and an assumed rate of return of 5% per year before expenses, which is not the Class' actual return. The hypothetical account values and expenses may not be used to estimate the actual ending account balance or expenses you paid for the period. You may use this information to compare the ongoing costs of investing in the Fund and other funds. To do so, compare this 5% hypothetical example with the 5% hypothetical examples that appear in the shareholder reports of the other funds. In addition, the Fund, as a shareholder in the underlying Fidelity Central Funds, will indirectly bear its pro-rata share of the fees and expenses incurred by the underlying Fidelity Central Funds. These fees and expenses are not included in the Fund's annualized expense ratio used to calculate the expense estimate in the table below.
Please note that the expenses shown in the table are meant to highlight your ongoing costs only and do not reflect any transaction costs. Therefore, the second line of the table is useful in comparing ongoing costs only, and will not help you determine the relative total costs of owning different funds. In addition, if these transactional costs were included, your costs would have been higher.
| Annualized
Expense Ratio | Beginning
Account Value
February 1, 2011 | Ending
Account Value
July 31, 2011 | Expenses Paid
During Period*
February 1, 2011 to
July 31, 2011 |
Class A | 1.17% | | | |
Actual | | $ 1,000.00 | $ 964.00 | $ 5.70 |
HypotheticalA | | $ 1,000.00 | $ 1,018.99 | $ 5.86 |
Class T | 1.41% | | | |
Actual | | $ 1,000.00 | $ 962.80 | $ 6.86 |
HypotheticalA | | $ 1,000.00 | $ 1,017.80 | $ 7.05 |
Class B | 1.92% | | | |
Actual | | $ 1,000.00 | $ 960.60 | $ 9.33 |
HypotheticalA | | $ 1,000.00 | $ 1,015.27 | $ 9.59 |
Class C | 1.91% | | | |
Actual | | $ 1,000.00 | $ 960.40 | $ 9.28 |
HypotheticalA | | $ 1,000.00 | $ 1,015.32 | $ 9.54 |
Institutional Class | .86% | | | |
Actual | | $ 1,000.00 | $ 965.80 | $ 4.19 |
HypotheticalA | | $ 1,000.00 | $ 1,020.53 | $ 4.31 |
A 5% return per year before expenses
* Expenses are equal to each Class' annualized expense ratio, multiplied by the average account value over the period, multiplied by 181/365 (to reflect the one-half year period).
Annual Report
Fidelity Advisor Technology Fund
Investment Changes (Unaudited)
Top Ten Stocks as of July 31, 2011 |
| % of fund's
net assets | % of fund's net assets
6 months ago |
Apple, Inc. | 11.0 | 13.7 |
Google, Inc. Class A | 6.0 | 6.3 |
Oracle Corp. | 5.9 | 4.7 |
salesforce.com, Inc. | 3.6 | 1.5 |
Microsoft Corp. | 3.3 | 1.0 |
SanDisk Corp. | 2.8 | 0.7 |
Amazon.com, Inc. | 2.3 | 0.1 |
Accenture PLC Class A | 2.3 | 1.8 |
EMC Corp. | 2.0 | 2.3 |
Cognizant Technology Solutions Corp. Class A | 1.9 | 1.4 |
| 41.1 | |
Top Industries (% of fund's net assets) |
As of July 31, 2011 |
| Software | 29.1% | |
| Computers & Peripherals | 17.9% | |
| Semiconductors & Semiconductor Equipment | 13.7% | |
| Internet Software & Services | 12.3% | |
| IT Services | 8.5% | |
| All Others* | 18.5% | |

As of January 31, 2011 |
| Software | 21.2% | |
| Computers & Peripherals | 20.5% | |
| Semiconductors & Semiconductor Equipment | 15.8% | |
| Internet Software & Services | 10.8% | |
| Communications Equipment | 10.4% | |
| All Others* | 21.3% | |

* Includes short-term investments and net other assets. |
Annual Report
Fidelity Advisor Technology Fund
Investments July 31, 2011
Showing Percentage of Net Assets
Common Stocks - 98.7% |
| Shares | | Value |
AUTOMOBILES - 0.0% |
Automobile Manufacturers - 0.0% |
Tesla Motors, Inc. (a) | 12,300 | | $ 346,491 |
BUILDING PRODUCTS - 0.0% |
Building Products - 0.0% |
Asahi Glass Co. Ltd. | 7,000 | | 81,219 |
CHEMICALS - 0.0% |
Commodity Chemicals - 0.0% |
STR Holdings, Inc. (a)(d) | 14,023 | | 192,956 |
COMMUNICATIONS EQUIPMENT - 4.3% |
Communications Equipment - 4.3% |
Acme Packet, Inc. (a) | 12,352 | | 727,780 |
Alcatel-Lucent SA sponsored ADR (a) | 158,796 | | 643,124 |
Aruba Networks, Inc. (a) | 32,700 | | 750,465 |
Brocade Communications Systems, Inc. (a) | 255,193 | | 1,398,458 |
China Wireless Technologies Ltd. | 208,000 | | 44,569 |
Ciena Corp. (a)(d) | 274,949 | | 4,250,712 |
Cisco Systems, Inc. | 75,685 | | 1,208,689 |
DG FastChannel, Inc. (a) | 31,179 | | 881,119 |
Emulex Corp. (a) | 5,400 | | 45,630 |
Finisar Corp. (a) | 132,897 | | 2,264,565 |
HTC Corp. | 2,015 | | 59,864 |
Infinera Corp. (a) | 70,900 | | 455,887 |
JDS Uniphase Corp. (a) | 5,169 | | 67,972 |
Juniper Networks, Inc. (a) | 5,398 | | 126,259 |
Motorola Mobility Holdings, Inc. | 81,690 | | 1,828,222 |
NETGEAR, Inc. (a) | 49,709 | | 1,635,923 |
Oclaro, Inc. (a) | 113,722 | | 534,493 |
Polycom, Inc. (a) | 247,906 | | 6,700,899 |
QUALCOMM, Inc. | 34,762 | | 1,904,262 |
Riverbed Technology, Inc. (a) | 43,270 | | 1,238,820 |
Sandvine Corp. (a) | 751,600 | | 1,659,497 |
Sandvine Corp. (U.K.) (a) | 554,200 | | 1,241,352 |
Sonus Networks, Inc. (a) | 29,060 | | 86,018 |
Telefonaktiebolaget LM Ericsson (B Shares) sponsored ADR | 246,541 | | 3,081,763 |
ZTE Corp. (H Shares) | 19,920 | | 62,236 |
| | 32,898,578 |
COMPUTERS & PERIPHERALS - 17.9% |
Computer Hardware - 11.4% |
Advantech Co. Ltd. | 87,000 | | 293,715 |
Apple, Inc. (a) | 216,834 | | 84,669,334 |
Foxconn Technology Co. Ltd. | 171,000 | | 787,500 |
Hewlett-Packard Co. | 21,197 | | 745,287 |
Stratasys, Inc. (a)(d) | 56,775 | | 1,447,763 |
| | 87,943,599 |
Computer Storage & Peripherals - 6.5% |
Catcher Technology Co. Ltd. | 251,000 | | 2,190,166 |
EMC Corp. (a) | 599,540 | | 15,636,003 |
|
| Shares | | Value |
Gemalto NV | 45,257 | | $ 2,161,190 |
Imagination Technologies Group PLC (a) | 173,800 | | 1,133,252 |
NetApp, Inc. (a) | 136,438 | | 6,483,534 |
SanDisk Corp. (a) | 510,032 | | 21,691,661 |
Seagate Technology | 5,102 | | 70,867 |
Smart Technologies, Inc. Class A (a) | 26,500 | | 154,760 |
Western Digital Corp. (a) | 2,369 | | 81,636 |
| | 49,603,069 |
TOTAL COMPUTERS & PERIPHERALS | | 137,546,668 |
CONSUMER FINANCE - 0.1% |
Consumer Finance - 0.1% |
Discover Financial Services | 40,000 | | 1,024,400 |
DIVERSIFIED CONSUMER SERVICES - 1.3% |
Education Services - 1.3% |
Educomp Solutions Ltd. | 16,123 | | 126,001 |
New Oriental Education & Technology Group, Inc. sponsored ADR (a) | 80,409 | | 10,270,642 |
| | 10,396,643 |
ELECTRICAL EQUIPMENT - 0.0% |
Electrical Components & Equipment - 0.0% |
A123 Systems, Inc. (a)(d) | 2,200 | | 11,286 |
Acuity Brands, Inc. | 1,582 | | 77,028 |
| | 88,314 |
ELECTRONIC EQUIPMENT & COMPONENTS - 2.4% |
Electronic Components - 0.8% |
Aeroflex Holding Corp. | 12,754 | | 182,382 |
Amphenol Corp. Class A | 1,400 | | 68,446 |
AU Optronics Corp. sponsored ADR (a) | 26,814 | | 147,745 |
Cando Corp. (a) | 1,462,895 | | 987,758 |
Chimei Innolux Corp. (a) | 16,000 | | 8,560 |
Corning, Inc. | 4,622 | | 73,536 |
J Touch Corp. | 32,750 | | 82,215 |
LG Display Co. Ltd. sponsored ADR | 28,532 | | 366,351 |
Omron Corp. | 17,500 | | 493,633 |
Universal Display Corp. (a)(d) | 124,110 | | 3,712,130 |
Vishay Intertechnology, Inc. (a) | 26,704 | | 367,714 |
| | 6,490,470 |
Electronic Equipment & Instruments - 0.4% |
Chroma ATE, Inc. | 485,683 | | 1,219,253 |
Itron, Inc. (a) | 8,068 | | 347,247 |
Keyence Corp. | 1,600 | | 452,569 |
SFA Engineering Corp. | 7,452 | | 457,313 |
SNU Precision Co. Ltd. | 33,961 | | 430,029 |
Test Research, Inc. | 285,155 | | 431,485 |
| | 3,337,896 |
Electronic Manufacturing Services - 0.3% |
Benchmark Electronics, Inc. (a) | 1,200 | | 17,580 |
Flextronics International Ltd. (a) | 62,700 | | 404,415 |
IPG Photonics Corp. (a) | 2,200 | | 132,418 |
Common Stocks - continued |
| Shares | | Value |
ELECTRONIC EQUIPMENT & COMPONENTS - CONTINUED |
Electronic Manufacturing Services - continued |
Jabil Circuit, Inc. | 23,602 | | $ 432,153 |
KEMET Corp. (a) | 27,549 | | 336,098 |
Multi-Fineline Electronix, Inc. (a) | 2,289 | | 46,490 |
TE Connectivity Ltd. | 6,400 | | 220,352 |
Trimble Navigation Ltd. (a) | 10,347 | | 368,146 |
| | 1,957,652 |
Technology Distributors - 0.9% |
Anixter International, Inc. | 1,235 | | 77,089 |
Arrow Electronics, Inc. (a) | 83,700 | | 2,908,575 |
Avnet, Inc. (a) | 38,100 | | 1,116,330 |
Digital China Holdings Ltd. (H Shares) | 1,210,000 | | 2,064,846 |
VST Holdings Ltd. (a) | 2,000,000 | | 508,096 |
WPG Holding Co. Ltd. | 204,565 | | 341,414 |
| | 7,016,350 |
TOTAL ELECTRONIC EQUIPMENT & COMPONENTS | | 18,802,368 |
HEALTH CARE EQUIPMENT & SUPPLIES - 0.6% |
Health Care Equipment - 0.3% |
Biosensors International Group Ltd. (a) | 1,805,000 | | 2,046,111 |
China Kanghui Holdings sponsored ADR (a)(d) | 9,000 | | 196,110 |
China Medical Technologies, Inc. sponsored ADR (a)(d) | 1,900 | | 12,578 |
Microport Scientific Corp. | 158,000 | | 94,267 |
Mingyuan Medicare Development Co. Ltd. | 270,000 | | 16,975 |
| | 2,366,041 |
Health Care Supplies - 0.3% |
Shandong Weigao Group Medical Polymer Co. Ltd. (H Shares) | 1,728,000 | | 2,363,479 |
TOTAL HEALTH CARE EQUIPMENT & SUPPLIES | | 4,729,520 |
HEALTH CARE TECHNOLOGY - 0.2% |
Health Care Technology - 0.2% |
athenahealth, Inc. (a) | 600 | | 35,274 |
So-net M3, Inc. | 128 | | 1,159,176 |
| | 1,194,450 |
HOTELS, RESTAURANTS & LEISURE - 1.2% |
Hotels, Resorts & Cruise Lines - 1.2% |
Ctrip.com International Ltd. sponsored ADR (a) | 194,500 | | 8,966,450 |
HOUSEHOLD DURABLES - 0.2% |
Consumer Electronics - 0.0% |
Skyworth Digital Holdings Ltd. | 640,764 | | 412,717 |
|
| Shares | | Value |
Household Appliances - 0.2% |
Haier Electronics Group Co. Ltd. (a) | 607,000 | | $ 739,104 |
Techtronic Industries Co. Ltd. | 680,500 | | 710,728 |
| | 1,449,832 |
TOTAL HOUSEHOLD DURABLES | | 1,862,549 |
INTERNET & CATALOG RETAIL - 2.7% |
Internet Retail - 2.7% |
Amazon.com, Inc. (a) | 78,254 | | 17,413,080 |
E-Commerce China Dangdang, Inc. ADR | 260 | | 2,938 |
MakeMyTrip Ltd. (d) | 8,300 | | 184,426 |
Priceline.com, Inc. (a) | 2,503 | | 1,345,738 |
Rakuten, Inc. | 1,643 | | 1,671,499 |
| | 20,617,681 |
INTERNET SOFTWARE & SERVICES - 12.3% |
Internet Software & Services - 12.3% |
21Vianet Group, Inc. ADR (d) | 27,900 | | 366,885 |
Akamai Technologies, Inc. (a) | 38,400 | | 930,048 |
Alibaba.com Ltd. | 509,000 | | 709,248 |
Baidu.com, Inc. sponsored ADR (a) | 10,241 | | 1,608,554 |
Bankrate, Inc. (d) | 67,500 | | 1,234,575 |
China Finance Online Co. Ltd. ADR (a) | 86,946 | | 278,227 |
ChinaCache International Holdings Ltd. sponsored ADR (d) | 8,500 | | 65,365 |
Cornerstone Ondemand, Inc. | 27,700 | | 454,280 |
DealerTrack Holdings, Inc. (a) | 12,300 | | 285,237 |
DeNA Co. Ltd. | 39,300 | | 1,963,341 |
eBay, Inc. (a) | 348,226 | | 11,404,402 |
Facebook, Inc. Class B (a)(f) | 37,876 | | 946,900 |
Google, Inc. Class A (a) | 77,068 | | 46,525,181 |
IntraLinks Holdings, Inc. | 4,490 | | 68,607 |
Kakaku.com, Inc. | 36,400 | | 1,440,109 |
LinkedIn Corp. (a) | 1,400 | | 141,442 |
LogMeIn, Inc. (a) | 57,600 | | 2,047,680 |
Mail.ru Group Ltd. GDR (a)(e) | 1,800 | | 64,296 |
Mercadolibre, Inc. | 35,434 | | 2,814,168 |
Open Text Corp. (a) | 1,700 | | 114,751 |
OpenTable, Inc. (a) | 1,147 | | 81,276 |
Opera Software ASA | 90,000 | | 580,009 |
Phoenix New Media Ltd. ADR (d) | 75,044 | | 768,451 |
Qihoo 360 Technology Co. Ltd. ADR (d) | 3,600 | | 82,980 |
Rackspace Hosting, Inc. (a) | 104,988 | | 4,199,520 |
Renren, Inc. ADR (d) | 5,900 | | 63,897 |
Responsys, Inc. | 1,500 | | 21,855 |
RightNow Technologies, Inc. (a) | 15,065 | | 511,306 |
SINA Corp. (a)(d) | 58,615 | | 6,335,695 |
Sohu.com, Inc. (a) | 29,800 | | 2,684,980 |
SouFun Holdings Ltd. ADR (d) | 20,960 | | 435,968 |
Velti PLC (a) | 50,436 | | 832,698 |
VeriSign, Inc. | 80,900 | | 2,524,889 |
VistaPrint Ltd. (a) | 9,217 | | 246,094 |
Vocus, Inc. (a) | 14,700 | | 419,979 |
Common Stocks - continued |
| Shares | | Value |
INTERNET SOFTWARE & SERVICES - CONTINUED |
Internet Software & Services - continued |
XO Group, Inc. (a) | 5,200 | | $ 48,620 |
Yahoo!, Inc. (a) | 117,400 | | 1,537,940 |
YouKu.com, Inc. ADR (a) | 2,129 | | 78,581 |
| | 94,918,034 |
IT SERVICES - 8.5% |
Data Processing & Outsourced Services - 2.9% |
DST Systems, Inc. | 8,904 | | 455,796 |
Fidelity National Information Services, Inc. | 140,263 | | 4,210,695 |
Fiserv, Inc. (a) | 94,205 | | 5,686,214 |
MasterCard, Inc. Class A | 30,430 | | 9,227,898 |
Paychex, Inc. | 25,463 | | 718,820 |
Syntel, Inc. | 7,600 | | 417,772 |
Visa, Inc. Class A | 17,872 | | 1,528,771 |
| | 22,245,966 |
IT Consulting & Other Services - 5.6% |
Accenture PLC Class A | 293,179 | | 17,338,606 |
Atos Origin SA (d) | 41,984 | | 2,318,882 |
Camelot Information Systems, Inc. ADR | 27,000 | | 317,250 |
Cognizant Technology Solutions Corp. Class A (a) | 209,741 | | 14,654,604 |
Digital Garage, Inc. (a)(d) | 39 | | 130,785 |
hiSoft Technology International Ltd. ADR (a) | 11,117 | | 154,193 |
International Business Machines Corp. | 12,821 | | 2,331,499 |
Sapient Corp. (a) | 53,100 | | 739,152 |
Teradata Corp. (a) | 99,167 | | 5,450,218 |
| | 43,435,189 |
TOTAL IT SERVICES | | 65,681,155 |
LEISURE EQUIPMENT & PRODUCTS - 0.0% |
Photographic Products - 0.0% |
Eastman Kodak Co. (a)(d) | 77,700 | | 186,480 |
LIFE SCIENCES TOOLS & SERVICES - 0.2% |
Life Sciences Tools & Services - 0.2% |
Agilent Technologies, Inc. (a) | 2,100 | | 88,536 |
Illumina, Inc. (a) | 13,800 | | 861,810 |
Wuxi Pharmatech Cayman, Inc. sponsored ADR (a) | 16,025 | | 249,670 |
| | 1,200,016 |
MACHINERY - 0.3% |
Industrial Machinery - 0.3% |
Fanuc Corp. | 5,600 | | 1,063,029 |
HIWIN Technologies Corp. | 13,390 | | 161,811 |
Mirle Automation Corp. | 376,950 | | 387,653 |
Sunpower Group Ltd. | 1,280,000 | | 361,417 |
| | 1,973,910 |
|
| Shares | | Value |
MEDIA - 1.5% |
Advertising - 1.0% |
Dentsu, Inc. | 47,800 | | $ 1,495,516 |
Focus Media Holding Ltd. ADR (a)(d) | 120,380 | | 3,959,298 |
ReachLocal, Inc. (a)(d) | 129,213 | | 2,350,384 |
| | 7,805,198 |
Cable & Satellite - 0.4% |
DISH Network Corp. Class A (a) | 71,200 | | 2,109,656 |
Virgin Media, Inc. | 40,700 | | 1,076,922 |
| | 3,186,578 |
Movies & Entertainment - 0.1% |
IMAX Corp. (a) | 23,730 | | 449,921 |
TOTAL MEDIA | | 11,441,697 |
METALS & MINING - 0.0% |
Diversified Metals & Mining - 0.0% |
Timminco Ltd. (a) | 5,600 | | 2,052 |
OFFICE ELECTRONICS - 0.0% |
Office Electronics - 0.0% |
Xerox Corp. | 8,333 | | 77,747 |
PHARMACEUTICALS - 0.1% |
Pharmaceuticals - 0.1% |
China Medical System Holding Ltd. | 671,600 | | 647,145 |
PROFESSIONAL SERVICES - 0.1% |
Human Resource & Employment Services - 0.1% |
51job, Inc. sponsored ADR (a) | 8,400 | | 554,820 |
REAL ESTATE MANAGEMENT & DEVELOPMENT - 0.1% |
Real Estate Services - 0.1% |
China Real Estate Information Corp. ADR (a)(d) | 82,149 | | 532,326 |
SEMICONDUCTORS & SEMICONDUCTOR EQUIPMENT - 13.7% |
Semiconductor Equipment - 2.5% |
Advanced Energy Industries, Inc. (a) | 5,757 | | 61,082 |
Amkor Technology, Inc. (a) | 26,109 | | 139,161 |
Asia Pacific Systems, Inc. (a) | 22,456 | | 345,051 |
ASM International NV unit | 12,900 | | 366,618 |
ASM Pacific Technology Ltd. | 22,100 | | 242,726 |
ASML Holding NV | 125,538 | | 4,475,430 |
Axcelis Technologies, Inc. (a) | 90,509 | | 150,245 |
centrotherm photovoltaics AG | 1,493 | | 51,335 |
Cymer, Inc. (a) | 78,838 | | 3,471,237 |
Entegris, Inc. (a) | 78,494 | | 672,694 |
GCL-Poly Energy Holdings Ltd. | 260,000 | | 146,450 |
KLA-Tencor Corp. | 27,928 | | 1,112,093 |
Lam Research Corp. (a) | 127,928 | | 5,229,697 |
LTX-Credence Corp. (a) | 25,920 | | 186,365 |
MKS Instruments, Inc. | 15,600 | | 389,220 |
Novellus Systems, Inc. (a) | 33,529 | | 1,040,740 |
Sumco Corp. (a) | 200 | | 3,165 |
Common Stocks - continued |
| Shares | | Value |
SEMICONDUCTORS & SEMICONDUCTOR EQUIPMENT - CONTINUED |
Semiconductor Equipment - continued |
Teradyne, Inc. (a) | 85,712 | | $ 1,156,255 |
Tessera Technologies, Inc. (a) | 3,600 | | 56,556 |
| | 19,296,120 |
Semiconductors - 11.2% |
Advanced Micro Devices, Inc. (a) | 100,423 | | 737,105 |
Alpha & Omega Semiconductor Ltd. (a) | 33,538 | | 376,967 |
Altera Corp. | 18,422 | | 753,091 |
Applied Micro Circuits Corp. (a) | 34,350 | | 216,749 |
ARM Holdings PLC sponsored ADR | 134,326 | | 3,867,246 |
Atmel Corp. (a) | 140,586 | | 1,701,091 |
Avago Technologies Ltd. | 11,124 | | 374,100 |
Broadcom Corp. Class A | 284,926 | | 10,562,207 |
Canadian Solar, Inc. (a)(d) | 244,482 | | 2,144,107 |
Cavium, Inc. (a) | 17,351 | | 598,436 |
CSR PLC | 69,154 | | 316,957 |
Cypress Semiconductor Corp. | 22,622 | | 465,561 |
Duksan Hi-Metal Co. Ltd. (a) | 90,603 | | 2,487,867 |
Fairchild Semiconductor International, Inc. (a) | 4,818 | | 72,318 |
First Solar, Inc. (a)(d) | 3,215 | | 380,109 |
Freescale Semiconductor Holdings I Ltd. | 90,100 | | 1,471,333 |
Gintech Energy Corp. | 52,499 | | 114,523 |
Hanwha Solarone Co. Ltd. ADR (a)(d) | 112,702 | | 610,845 |
Hittite Microwave Corp. (a) | 1,279 | | 71,611 |
Hynix Semiconductor, Inc. | 96,280 | | 2,214,541 |
Inphi Corp. | 48,389 | | 614,056 |
International Rectifier Corp. (a) | 27,465 | | 705,576 |
Intersil Corp. Class A | 72,188 | | 869,865 |
JA Solar Holdings Co. Ltd. ADR (a) | 1,195,316 | | 5,737,517 |
Jinkosolar Holdings Co. Ltd. ADR (a)(d) | 315,491 | | 6,846,155 |
MagnaChip Semiconductor Corp. | 51,600 | | 547,476 |
Marvell Technology Group Ltd. (a) | 609,431 | | 9,031,767 |
Melfas, Inc. | 10,451 | | 312,747 |
Micrel, Inc. | 110,633 | | 1,122,925 |
Micron Technology, Inc. (a) | 800,127 | | 5,896,936 |
Microsemi Corp. (a) | 4,100 | | 81,385 |
Monolithic Power Systems, Inc. (a) | 53,832 | | 726,194 |
Motech Industries, Inc. | 78,199 | | 243,424 |
Neo Solar Power Corp. | 126,000 | | 166,662 |
Netlogic Microsystems, Inc. (a) | 33,000 | | 1,140,150 |
NVIDIA Corp. (a) | 167,883 | | 2,321,822 |
NXP Semiconductors NV | 312,135 | | 6,174,030 |
O2Micro International Ltd. sponsored ADR (a) | 38,400 | | 195,072 |
ON Semiconductor Corp. (a) | 42,800 | | 371,932 |
Phison Electronics Corp. | 400,000 | | 2,008,310 |
PMC-Sierra, Inc. (a) | 18,400 | | 128,616 |
Power Integrations, Inc. | 22,085 | | 783,797 |
Radiant Opto-Electronics Corp. | 365 | | 1,428 |
Rambus, Inc. (a) | 35,400 | | 491,352 |
Silicon Laboratories, Inc. (a) | 27,800 | | 984,398 |
|
| Shares | | Value |
Spreadtrum Communications, Inc. ADR (d) | 52,574 | | $ 712,378 |
Standard Microsystems Corp. (a) | 27,967 | | 661,699 |
Suntech Power Holdings Co. Ltd. sponsored ADR (a)(d) | 147,200 | | 1,080,448 |
Trina Solar Ltd. (a)(d) | 311,894 | | 5,586,022 |
Xilinx, Inc. | 2,443 | | 78,420 |
Yingli Green Energy Holding Co. Ltd. ADR (a)(d) | 73,900 | | 535,036 |
YoungTek Electronics Corp. | 33,830 | | 106,597 |
| | 85,800,956 |
TOTAL SEMICONDUCTORS & SEMICONDUCTOR EQUIPMENT | | 105,097,076 |
SOFTWARE - 29.1% |
Application Software - 16.1% |
Adobe Systems, Inc. (a) | 2,752 | | 76,285 |
ANSYS, Inc. (a) | 44,008 | | 2,226,805 |
AsiaInfo-Linkage, Inc. (a)(d) | 374,094 | | 5,716,156 |
Aspen Technology, Inc. (a) | 251,273 | | 3,894,732 |
Autodesk, Inc. (a) | 76,898 | | 2,645,291 |
AutoNavi Holdings Ltd. ADR | 45,521 | | 753,828 |
Autonomy Corp. PLC (a) | 73,343 | | 2,023,922 |
BroadSoft, Inc. (a)(d) | 89,881 | | 2,625,424 |
Cadence Design Systems, Inc. (a) | 39,087 | | 403,769 |
Citrix Systems, Inc. (a) | 154,859 | | 11,156,042 |
Compuware Corp. (a) | 82,341 | | 795,414 |
Concur Technologies, Inc. (a) | 160,875 | | 7,310,160 |
Convio, Inc. (a) | 31,734 | | 322,417 |
Descartes Systems Group, Inc. (a) | 179,500 | | 1,238,125 |
Informatica Corp. (a) | 126,300 | | 6,457,719 |
Intuit, Inc. (a) | 125,795 | | 5,874,627 |
JDA Software Group, Inc. (a) | 2,584 | | 72,249 |
Kenexa Corp. (a) | 15,369 | | 392,985 |
Kingdee International Software Group Co. Ltd. | 8,284,800 | | 4,857,904 |
Longtop Financial Technologies Ltd. ADR (a) | 89,875 | | 170,133 |
Manhattan Associates, Inc. (a) | 2,257 | | 84,186 |
MicroStrategy, Inc. Class A (a) | 29,715 | | 4,735,680 |
Nuance Communications, Inc. (a) | 92,214 | | 1,845,202 |
Parametric Technology Corp. (a) | 343,440 | | 7,140,118 |
Pegasystems, Inc. | 97,459 | | 3,933,445 |
QLIK Technologies, Inc. | 119,687 | | 3,627,713 |
Quest Software, Inc. (a) | 17,300 | | 328,354 |
RealPage, Inc. | 15,200 | | 365,560 |
salesforce.com, Inc. (a) | 191,587 | | 27,724,555 |
SolarWinds, Inc. (a) | 122,564 | | 2,636,352 |
SuccessFactors, Inc. (a) | 132,800 | | 3,585,600 |
Synopsys, Inc. (a) | 15,500 | | 371,535 |
Taleo Corp. Class A (a) | 88,266 | | 2,921,605 |
TIBCO Software, Inc. (a) | 99,689 | | 2,595,902 |
Common Stocks - continued |
| Shares | | Value |
SOFTWARE - CONTINUED |
Application Software - continued |
TiVo, Inc. (a) | 8,000 | | $ 75,200 |
VanceInfo Technologies, Inc. ADR (a)(d) | 137,600 | | 2,783,648 |
| | 123,768,642 |
Home Entertainment Software - 0.1% |
Activision Blizzard, Inc. | 5,800 | | 68,672 |
Kingsoft Corp. Ltd. | 175,000 | | 114,963 |
NCsoft Corp. | 1,069 | | 329,532 |
Perfect World Co. Ltd. sponsored ADR Class B (a) | 4,400 | | 87,076 |
RealD, Inc. (d) | 3,600 | | 55,728 |
| | 655,971 |
Systems Software - 12.9% |
Ariba, Inc. (a) | 194,919 | | 6,445,971 |
BMC Software, Inc. (a) | 5,613 | | 242,594 |
Check Point Software Technologies Ltd. (a) | 27,400 | | 1,579,610 |
CommVault Systems, Inc. (a) | 182,806 | | 7,078,248 |
DemandTec, Inc. (a) | 36,900 | | 264,204 |
Fortinet, Inc. (a) | 94,916 | | 1,928,693 |
Insyde Software Corp. | 14,498 | | 69,779 |
MICROS Systems, Inc. (a) | 15,800 | | 773,726 |
Microsoft Corp. | 911,750 | | 24,981,950 |
NetSuite, Inc. (a) | 24,600 | | 964,566 |
Oracle Corp. | 1,470,791 | | 44,976,789 |
Red Hat, Inc. (a) | 1,763 | | 74,187 |
Rovi Corp. (a) | 54,177 | | 2,869,756 |
VMware, Inc. Class A (a) | 68,199 | | 6,843,088 |
| | 99,093,161 |
TOTAL SOFTWARE | | 223,517,774 |
WIRELESS TELECOMMUNICATION SERVICES - 1.9% |
Wireless Telecommunication Services - 1.9% |
American Tower Corp. Class A (a) | 101,042 | | 5,307,736 |
Crown Castle International Corp. (a) | 101,400 | | 4,400,760 |
SBA Communications Corp. Class A (a) | 110,949 | | 4,234,923 |
SOFTBANK CORP. | 10,100 | | 394,998 |
Sprint Nextel Corp. (a) | 18,461 | | 78,090 |
| | 14,416,507 |
TOTAL COMMON STOCKS (Cost $714,591,960) | 758,995,026 |
Convertible Bonds - 0.2% |
| Principal Amount | | |
COMMUNICATIONS EQUIPMENT - 0.2% |
Communications Equipment - 0.2% |
Ciena Corp. 0.25% 5/1/13
(Cost $1,270,000) | | $ 1,270,000 | | 1,223,645 |
Master Notes - 0.0% |
| Principal
Amount | | Value |
OZ Optics Ltd. 5% 11/5/14 (f)
(Cost $245,923) | | $ 240,883 | | $ 240,883 |
Money Market Funds - 8.5% |
| Shares | | |
Fidelity Cash Central Fund, 0.14% (b) | 20,424,698 | | 20,424,698 |
Fidelity Securities Lending Cash Central Fund, 0.15% (b)(c) | 45,213,159 | | 45,213,159 |
TOTAL MONEY MARKET FUNDS (Cost $65,637,857) | 65,637,857 |
TOTAL INVESTMENT PORTFOLIO - 107.4% (Cost $781,745,740) | | 826,097,411 |
NET OTHER ASSETS (LIABILITIES) - (7.4)% | | (56,897,771) |
NET ASSETS - 100% | $ 769,199,640 |
Legend |
(a) Non-income producing |
(b) Affiliated fund that is available only to investment companies and other accounts managed by Fidelity Investments. The rate quoted is the annualized seven-day yield of the fund at period end. A complete unaudited listing of the fund's holdings as of its most recent quarter end is available upon request. In addition, each Fidelity Central Fund's financial statements, which are not covered by the Fund's Report of Independent Registered Public Accounting Firm, are available on the SEC's website or upon request. |
(c) Investment made with cash collateral received from securities on loan. |
(d) Security or a portion of the security is on loan at period end. |
(e) Security exempt from registration under Rule 144A of the Securities Act of 1933. These securities may be resold in transactions exempt from registration, normally to qualified institutional buyers. At the end of the period, the value of these securities amounted to $64,296 or 0.0% of net assets. |
(f) Restricted securities - Investment in securities not registered under the Securities Act of 1933 (excluding 144A issues). At the end of the period, the value of restricted securities (excluding 144A issues) amounted to $1,187,783 or 0.2% of net assets. |
Additional information on each restricted holding is as follows: |
Security | Acquisition Date | Acquisition Cost |
Facebook, Inc. Class B | 3/31/11 - 5/19/11 | $ 947,157 |
OZ Optics Ltd. 5% 11/5/14 | 11/5/10 | $ 246,969 |
Affiliated Central Funds |
Information regarding fiscal year to date income earned by the Fund from investments in Fidelity Central Funds is as follows: |
Fund | Income earned |
Fidelity Cash Central Fund | $ 28,772 |
Fidelity Securities Lending Cash Central Fund | 555,506 |
Total | $ 584,278 |
Other Information |
The following is a summary of the inputs used, as of July 31, 2011, involving the Fund's assets and liabilities carried at fair value. The inputs or methodology used for valuing securities may not be an indication of the risk associated with investing in those securities. For more information on valuation inputs, and their aggregation into the levels used in the tables below, please refer to the Security Valuation section in the accompanying Notes to Financial Statements. |
Valuation Inputs at Reporting Date: |
Description | Total | Level 1 | Level 2 | Level 3 |
Investments in Securities: | | | | |
Common Stocks | $ 758,995,026 | $ 757,877,993 | $ - | $ 1,117,033 |
Convertible Bonds | 1,223,645 | - | 1,223,645 | - |
Master Notes | 240,883 | - | - | 240,883 |
Money Market Funds | 65,637,857 | 65,637,857 | - | - |
Total Investments in Securities: | $ 826,097,411 | $ 823,515,850 | $ 1,223,645 | $ 1,357,916 |
The following is a reconciliation of Investments in Securities for which Level 3 inputs were used in determining value: |
Investments in Securities: | |
Beginning Balance | $ 301,240 |
Total Realized Gain (Loss) | (592,968) |
Total Unrealized Gain (Loss) | (2,435,484) |
Cost of Purchases | 2,876,807 |
Proceeds of Sales | (773,768) |
Amortization/Accretion | (1,046) |
Transfers in to Level 3 | 1,983,135 |
Transfers out of Level 3 | - |
Ending Balance | $ 1,357,916 |
The change in unrealized gain (loss) for the period attributable to Level 3 securities held at July 31, 2011 | $ (3,137,923) |
The information used in the above reconciliation represents fiscal year to date activity for any Investments in Securities identified as using Level 3 inputs at either the beginning or the end of the current fiscal period. Transfers in or out of Level 3 represent the beginning value of any Security or Instrument where a change in the pricing level occurred from the beginning to the end of the period. The cost of purchases and the proceeds of sales may include securities received or delivered through corporate actions or exchanges. Realized and unrealized gains (losses) disclosed in the reconciliation are included in Net Gain (Loss) on the Fund's Statement of Operations. |
Distribution of investments by country of issue, as a percentage of total net assets, is as follows: (Unaudited) |
United States of America | 77.8% |
Cayman Islands | 7.0% |
Ireland | 2.3% |
China | 2.2% |
Bermuda | 2.0% |
Netherlands | 1.8% |
Japan | 1.5% |
Taiwan | 1.1% |
United Kingdom | 1.0% |
Canada | 1.0% |
Others (Individually Less Than 1%) | 2.3% |
| 100.0% |
Income Tax Information |
At July 31, 2011, the Fund had a capital loss carryforward of approximately $132,837,596 all of which will expire in fiscal 2017. Capital loss carryforwards are only available to offset future capital gains of the Fund to the extent provided by regulations and may be limited. |
See accompanying notes which are an integral part of the financial statements.
Annual Report
Fidelity Advisor Technology Fund
Statement of Assets and Liabilities
| July 31, 2011 |
| | |
Assets | | |
Investment in securities, at value (including securities loaned of $43,545,111) - See accompanying schedule: Unaffiliated issuers (cost $716,107,883) | $ 760,459,554 | |
Fidelity Central Funds (cost $65,637,857) | 65,637,857 | |
Total Investments (cost $781,745,740) | | $ 826,097,411 |
Foreign currency held at value (cost $1,003,875) | | 1,002,950 |
Receivable for investments sold | | 29,147,803 |
Receivable for fund shares sold | | 578,440 |
Dividends receivable | | 250,309 |
Interest receivable | | 9,628 |
Distributions receivable from Fidelity Central Funds | | 280,720 |
Other receivables | | 51,440 |
Total assets | | 857,418,701 |
| | |
Liabilities | | |
Payable for investments purchased | $ 38,459,650 | |
Payable for fund shares redeemed | 3,652,279 | |
Accrued management fee | 370,920 | |
Distribution and service plan fees payable | 266,273 | |
Other affiliated payables | 213,637 | |
Other payables and accrued expenses | 43,143 | |
Collateral on securities loaned, at value | 45,213,159 | |
Total liabilities | | 88,219,061 |
| | |
Net Assets | | $ 769,199,640 |
Net Assets consist of: | | |
Paid in capital | | $ 863,606,296 |
Accumulated net investment loss | | (24) |
Accumulated undistributed net realized gain (loss) on investments and foreign currency transactions | | (138,761,313) |
Net unrealized appreciation (depreciation) on investments and assets and liabilities in foreign currencies | | 44,354,681 |
Net Assets | | $ 769,199,640 |
Statement of Assets and Liabilities - continued
| July 31, 2011 |
| | |
Calculation of Maximum Offering Price Class A:
Net Asset Value and redemption price per share ($375,609,390 ÷ 14,938,629 shares) | | $ 25.14 |
| | |
Maximum offering price per share (100/94.25 of $25.14) | | $ 26.67 |
Class T:
Net Asset Value and redemption price per share ($196,913,324 ÷ 8,092,001 shares) | | $ 24.33 |
| | |
Maximum offering price per share (100/96.50 of $24.33) | | $ 25.21 |
Class B:
Net Asset Value and offering price per share ($25,508,200 ÷ 1,124,989 shares)A | | $ 22.67 |
| | |
Class C:
Net Asset Value and offering price per share ($89,819,193 ÷ 3,943,773 shares)A | | $ 22.77 |
| | |
Institutional Class:
Net Asset Value, offering price and redemption price per share ($81,349,533 ÷ 3,093,086 shares) | | $ 26.30 |
A Redemption price per share is equal to net asset value less any applicable contingent deferred sales charge.
See accompanying notes which are an integral part of the financial statements.
Annual Report
Fidelity Advisor Technology Fund
Financial Statements - continued
Statement of Operations
| Year ended July 31, 2011 |
| | |
Investment Income | | |
Dividends | | $ 2,679,664 |
Interest | | 11,489 |
Income from Fidelity Central Funds (including $555,506 from security lending) | | 584,278 |
Total income | | 3,275,431 |
| | |
Expenses | | |
Management fee | $ 4,334,829 | |
Transfer agent fees | 2,282,624 | |
Distribution and service plan fees | 3,147,500 | |
Accounting and security lending fees | 276,385 | |
Custodian fees and expenses | 93,479 | |
Independent trustees' compensation | 4,220 | |
Registration fees | 89,940 | |
Audit | 57,366 | |
Legal | 4,149 | |
Miscellaneous | 7,662 | |
Total expenses before reductions | 10,298,154 | |
Expense reductions | (165,087) | 10,133,067 |
Net investment income (loss) | | (6,857,636) |
Realized and Unrealized Gain (Loss) Net realized gain (loss) on: | | |
Investment securities: | | |
Unaffiliated issuers | 189,025,050 | |
Foreign currency transactions | 58,356 | |
Total net realized gain (loss) | | 189,083,406 |
Change in net unrealized appreciation (depreciation) on: Investment securities | (20,612,691) | |
Assets and liabilities in foreign currencies | 7,245 | |
Total change in net unrealized appreciation (depreciation) | | (20,605,446) |
Net gain (loss) | | 168,477,960 |
Net increase (decrease) in net assets resulting from operations | | $ 161,620,324 |
Statement of Changes in Net Assets
| Year ended
July 31,
2011 | Year ended
July 31,
2010 |
Increase (Decrease) in Net Assets | | |
Operations | | |
Net investment income (loss) | $ (6,857,636) | $ (6,176,617) |
Net realized gain (loss) | 189,083,406 | 117,224,365 |
Change in net unrealized appreciation (depreciation) | (20,605,446) | 9,231,846 |
Net increase (decrease) in net assets resulting from operations | 161,620,324 | 120,279,594 |
Share transactions - net increase (decrease) | (15,631,022) | (19,248,670) |
Redemption fees | 32,306 | 34,453 |
Total increase (decrease) in net assets | 146,021,608 | 101,065,377 |
| | |
Net Assets | | |
Beginning of period | 623,178,032 | 522,112,655 |
End of period (including accumulated net investment loss of $24 and undistributed net investment income of $0, respectively) | $ 769,199,640 | $ 623,178,032 |
See accompanying notes which are an integral part of the financial statements.
Annual Report
Financial Highlights - Class A
Years ended July 31, | 2011 | 2010 | 2009 | 2008 | 2007 |
Selected Per-Share Data | | | | | |
Net asset value, beginning of period | $ 19.83 | $ 16.03 | $ 17.04 | $ 20.55 | $ 15.59 |
Income from Investment Operations | | | | | |
Net investment income (loss) C | (.18) | (.16) | .02 F | (.10) | (.17) |
Net realized and unrealized gain (loss) | 5.49 | 3.96 | (1.03) | (3.41) | 5.13 |
Total from investment operations | 5.31 | 3.80 | (1.01) | (3.51) | 4.96 |
Redemption fees added to paid in capital C,H | - | - | - | - | - |
Net asset value, end of period | $ 25.14 | $ 19.83 | $ 16.03 | $ 17.04 | $ 20.55 |
Total Return A,B | 26.78% | 23.71% | (5.93)% | (17.08)% | 31.82% |
Ratios to Average Net Assets D,G | | | | | |
Expenses before reductions | 1.18% | 1.21% | 1.23% | 1.21% | 1.25% |
Expenses net of fee waivers, if any | 1.18% | 1.21% | 1.23% | 1.21% | 1.25% |
Expenses net of all reductions | 1.16% | 1.18% | 1.22% | 1.19% | 1.24% |
Net investment income (loss) | (.73)% | (.83)% | .17% F | (.49)% | (.91)% |
Supplemental Data | | | | | |
Net assets, end of period (000 omitted) | $ 375,609 | $ 312,659 | $ 258,433 | $ 275,117 | $ 309,105 |
Portfolio turnover rate E | 167% | 115% | 225% | 214% | 208% |
A Total returns would have been lower if certain expenses had not been reduced during the applicable periods shown.
B Total returns do not include the effect of the sales charges.
C Calculated based on average shares outstanding during the period.
D Fees and expenses of any underlying Fidelity Central Funds are not included in the Fund's expense ratio. The Fund indirectly bears its proportionate share of the expenses of any underlying Fidelity Central Funds.
E Amount does not include the portfolio activity of any underlying Fidelity Central Funds.
F Investment income per share reflects a special dividend which amounted to $.04 per share. Excluding the special dividend, the ratio of net investment income (loss) to average net assets would have been (.18)%.
G Expense ratios reflect operating expenses of the class. Expenses before reductions do not reflect amounts reimbursed by the investment adviser or reductions from brokerage service arrangements or reductions from other expense offset arrangements and do not represent the amount paid by the class during periods when reimbursements or reductions occur. Expenses net of fee waivers reflect expenses after reimbursement by the investment adviser but prior to reductions from brokerage service arrangements or other expense offset arrangements. Expenses net of all reductions represent the net expenses paid by the class.
H Amount represents less than $.01 per share.
Financial Highlights - Class T
Years ended July 31, | 2011 | 2010 | 2009 | 2008 | 2007 |
Selected Per-Share Data | | | | | |
Net asset value, beginning of period | $ 19.24 | $ 15.59 | $ 16.62 | $ 20.09 | $ 15.28 |
Income from Investment Operations | | | | | |
Net investment income (loss) C | (.23) | (.20) | (.01) F | (.14) | (.21) |
Net realized and unrealized gain (loss) | 5.32 | 3.85 | (1.02) | (3.33) | 5.02 |
Total from investment operations | 5.09 | 3.65 | (1.03) | (3.47) | 4.81 |
Redemption fees added to paid in capital C,H | - | - | - | - | - |
Net asset value, end of period | $ 24.33 | $ 19.24 | $ 15.59 | $ 16.62 | $ 20.09 |
Total Return A,B | 26.46% | 23.41% | (6.20)% | (17.27)% | 31.48% |
Ratios to Average Net Assets D,G | | | | | |
Expenses before reductions | 1.43% | 1.46% | 1.49% | 1.46% | 1.51% |
Expenses net of fee waivers, if any | 1.43% | 1.46% | 1.49% | 1.46% | 1.51% |
Expenses net of all reductions | 1.40% | 1.44% | 1.48% | 1.45% | 1.49% |
Net investment income (loss) | (.98)% | (1.09)% | (.09)% F | (.74)% | (1.16)% |
Supplemental Data | | | | | |
Net assets, end of period (000 omitted) | $ 196,913 | $ 169,049 | $ 151,170 | $ 173,917 | $ 260,339 |
Portfolio turnover rate E | 167% | 115% | 225% | 214% | 208% |
A Total returns would have been lower if certain expenses had not been reduced during the applicable periods shown.
B Total returns do not include the effect of the sales charges.
C Calculated based on average shares outstanding during the period.
D Fees and expenses of any underlying Fidelity Central Funds are not included in the Fund's expense ratio. The Fund indirectly bears its proportionate share of the expenses of any underlying Fidelity Central Funds.
E Amount does not include the portfolio activity of any underlying Fidelity Central Funds.
F Investment income per share reflects a special dividend which amounted to $.04 per share. Excluding the special dividend, the ratio of net investment income (loss) to average net assets would have been (.44)%.
G Expense ratios reflect operating expenses of the class. Expenses before reductions do not reflect amounts reimbursed by the investment adviser or reductions from brokerage service arrangements or reductions from other expense offset arrangements and do not represent the amount paid by the class during periods when reimbursements or reductions occur. Expenses net of fee waivers reflect expenses after reimbursement by the investment adviser but prior to reductions from brokerage service arrangements or other expense offset arrangements. Expenses net of all reductions represent the net expenses paid by the class.
H Amount represents less than $.01 per share.
See accompanying notes which are an integral part of the financial statements.
Annual Report
Financial Highlights - Class B
Years ended July 31, | 2011 | 2010 | 2009 | 2008 | 2007 |
Selected Per-Share Data | | | | | |
Net asset value, beginning of period | $ 18.01 | $ 14.67 | $ 15.72 | $ 19.10 | $ 14.59 |
Income from Investment Operations | | | | | |
Net investment income (loss) C | (.33) | (.27) | (.07) F | (.23) | (.28) |
Net realized and unrealized gain (loss) | 4.99 | 3.61 | (.98) | (3.15) | 4.79 |
Total from investment operations | 4.66 | 3.34 | (1.05) | (3.38) | 4.51 |
Redemption fees added to paid in capital C,H | - | - | - | - | - |
Net asset value, end of period | $ 22.67 | $ 18.01 | $ 14.67 | $ 15.72 | $ 19.10 |
Total Return A,B | 25.87% | 22.77% | (6.68)% | (17.70)% | 30.91% |
Ratios to Average Net Assets D,G | | | | | |
Expenses before reductions | 1.93% | 1.96% | 1.98% | 1.96% | 2.01% |
Expenses net of fee waivers, if any | 1.93% | 1.96% | 1.98% | 1.96% | 2.01% |
Expenses net of all reductions | 1.91% | 1.94% | 1.97% | 1.94% | 2.00% |
Net investment income (loss) | (1.49)% | (1.59)% | (.58)% F | (1.24)% | (1.67)% |
Supplemental Data | | | | | |
Net assets, end of period (000 omitted) | $ 25,508 | $ 29,176 | $ 30,580 | $ 47,294 | $ 102,655 |
Portfolio turnover rate E | 167% | 115% | 225% | 214% | 208% |
A Total returns would have been lower if certain expenses had not been reduced during the applicable periods shown.
B Total returns do not include the effect of the contingent deferred sales charge.
C Calculated based on average shares outstanding during the period.
D Fees and expenses of any underlying Fidelity Central Funds are not included in the Fund's expense ratio. The Fund indirectly bears its proportionate share of the expenses of any underlying Fidelity Central Funds.
E Amount does not include the portfolio activity of any underlying Fidelity Central Funds.
F Investment income per share reflects a special dividend which amounted to $.04 per share. Excluding the special dividend, the ratio of net investment income (loss) to average net assets would have been (.93)%.
G Expense ratios reflect operating expenses of the class. Expenses before reductions do not reflect amounts reimbursed by the investment adviser or reductions from brokerage service arrangements or reductions from other expense offset arrangements and do not represent the amount paid by the class during periods when reimbursements or reductions occur. Expenses net of fee waivers reflect expenses after reimbursement by the investment adviser but prior to reductions from brokerage service arrangements or other expense offset arrangements. Expenses net of all reductions represent the net expenses paid by the class.
H Amount represents less than $.01 per share.
Financial Highlights - Class C
Years ended July 31, | 2011 | 2010 | 2009 | 2008 | 2007 |
Selected Per-Share Data | | | | | |
Net asset value, beginning of period | $ 18.09 | $ 14.74 | $ 15.79 | $ 19.18 | $ 14.66 |
Income from Investment Operations | | | | | |
Net investment income (loss) C | (.33) | (.28) | (.07) F | (.23) | (.29) |
Net realized and unrealized gain (loss) | 5.01 | 3.63 | (.98) | (3.16) | 4.81 |
Total from investment operations | 4.68 | 3.35 | (1.05) | (3.39) | 4.52 |
Redemption fees added to paid in capital C,H | - | - | - | - | - |
Net asset value, end of period | $ 22.77 | $ 18.09 | $ 14.74 | $ 15.79 | $ 19.18 |
Total Return A,B | 25.87% | 22.73% | (6.65)% | (17.67)% | 30.83% |
Ratios to Average Net Assets D,G | | | | | |
Expenses before reductions | 1.92% | 1.96% | 1.98% | 1.96% | 2.01% |
Expenses net of fee waivers, if any | 1.92% | 1.96% | 1.98% | 1.96% | 2.01% |
Expenses net of all reductions | 1.90% | 1.93% | 1.97% | 1.94% | 1.99% |
Net investment income (loss) | (1.48)% | (1.58)% | (.58)% F | (1.24)% | (1.66)% |
Supplemental Data | | | | | |
Net assets, end of period (000 omitted) | $ 89,819 | $ 70,017 | $ 55,645 | $ 63,590 | $ 86,974 |
Portfolio turnover rate E | 167% | 115% | 225% | 214% | 208% |
A Total returns would have been lower if certain expenses had not been reduced during the applicable periods shown.
B Total returns do not include the effect of the contingent deferred sales charge.
C Calculated based on average shares outstanding during the period.
D Fees and expenses of any underlying Fidelity Central Funds are not included in the Fund's expense ratio. The Fund indirectly bears its proportionate share of the expenses of any underlying Fidelity Central Funds.
E Amount does not include the portfolio activity of any underlying Fidelity Central Funds.
F Investment income per share reflects a special dividend which amounted to $.04 per share. Excluding the special dividend, the ratio of net investment income (loss) to average net assets would have been (.93)%.
G Expense ratios reflect operating expenses of the class. Expenses before reductions do not reflect amounts reimbursed by the investment adviser or reductions from brokerage service arrangements or reductions from other expense offset arrangements and do not represent the amount paid by the class during periods when reimbursements or reductions occur. Expenses net of fee waivers reflect expenses after reimbursement by the investment adviser but prior to reductions from brokerage service arrangements or other expense offset arrangements. Expenses net of all reductions represent the net expenses paid by the class.
H Amount represents less than $.01 per share.
See accompanying notes which are an integral part of the financial statements.
Annual Report
Financial Highlights - Institutional Class
Years ended July 31, | 2011 | 2010 | 2009 | 2008 | 2007 |
Selected Per-Share Data | | | | | |
Net asset value, beginning of period | $ 20.68 | $ 16.67 | $ 17.68 | $ 21.26 | $ 16.07 |
Income from Investment Operations | | | | | |
Net investment income (loss) B | (.11) | (.11) | .06 E | (.04) | (.11) |
Net realized and unrealized gain (loss) | 5.73 | 4.12 | (1.07) | (3.54) | 5.30 |
Total from investment operations | 5.62 | 4.01 | (1.01) | (3.58) | 5.19 |
Redemption fees added to paid in capital B,G | - | - | - | - | - |
Net asset value, end of period | $ 26.30 | $ 20.68 | $ 16.67 | $ 17.68 | $ 21.26 |
Total Return A | 27.18% | 24.06% | (5.71)% | (16.84)% | 32.30% |
Ratios to Average Net Assets C,F | | | | | |
Expenses before reductions | .87% | .92% | .98% | .94% | .93% |
Expenses net of fee waivers, if any | .87% | .92% | .98% | .94% | .93% |
Expenses net of all reductions | .85% | .90% | .97% | .92% | .92% |
Net investment income (loss) | (.43)% | (.55)% | .42% E | (.22)% | (.59)% |
Supplemental Data | | | | | |
Net assets, end of period (000 omitted) | $ 81,350 | $ 42,277 | $ 26,285 | $ 22,021 | $ 21,111 |
Portfolio turnover rate D | 167% | 115% | 225% | 214% | 208% |
A Total returns would have been lower if certain expenses had not been reduced during the applicable periods shown.
B Calculated based on average shares outstanding during the period.
C Fees and expenses of any underlying Fidelity Central Funds are not included in the Fund's expense ratio. The Fund indirectly bears its proportionate share of the expenses of any underlying Fidelity Central Funds.
D Amount does not include the portfolio activity of any underlying Fidelity Central Funds.
E Investment income per share reflects a special dividend which amounted to $.04 per share. Excluding the special dividend, the ratio of net investment income (loss) to average net assets would have been .07%.
F Expense ratios reflect operating expenses of the class. Expenses before reductions do not reflect amounts reimbursed by the investment adviser or reductions from brokerage service arrangements or reductions from other expense offset arrangements and do not represent the amount paid by the class during periods when reimbursements or reductions occur. Expenses net of fee waivers reflect expenses after reimbursement by the investment adviser but prior to reductions from brokerage service arrangements or other expense offset arrangements. Expenses net of all reductions represent the net expenses paid by the class.
G Amount represents less than $.01 per share.
See accompanying notes which are an integral part of the financial statements.
Annual Report
Notes to Financial Statements
For the period ended July 31, 2011
1. Organization.
Fidelity Advisor Technology Fund (the Fund) is a non-diversified fund of Fidelity Advisor Series VII (the Trust) and is authorized to issue an unlimited number of shares. The Trust is registered under the Investment Company Act of 1940, as amended (the 1940 Act), as an open-end management investment company organized as a Massachusetts business trust. The Fund offers Class A, Class T, Class C and Institutional Class shares, each of which, along with Class B shares, has equal rights as to assets and voting privileges. Effective after the close of business on September 1, 2010, Class B shares were closed to new accounts and additional purchases, except for exchanges and reinvestments, by existing shareholders. Each class has exclusive voting rights with respect to matters that affect that class. Class B shares will automatically convert to Class A shares after a holding period of seven years from the initial date of purchase. Investment income, realized and unrealized capital gains and losses, the common expenses of the Fund, and certain fund-level expense reductions, if any, are allocated on a pro-rata basis to each class based on the relative net assets of each class to the total net assets of the Fund. Each class differs with respect to transfer agent and distribution and service plan fees incurred. Certain expense reductions may also differ by class. The Fund's investments in emerging markets can be subject to social, economic, regulatory and political uncertainties and can be extremely volatile.
2. Investments in Fidelity Central Funds.
The Fund invests in Fidelity Central Funds, which are open-end investment companies available only to other investment companies and accounts managed by Fidelity Management & Research Company (FMR) and its affiliates. The Fund's Schedule of Investments lists each of the Fidelity Central Funds held as of period end, if any, as an investment of the Fund, but does not include the underlying holdings of each Fidelity Central Fund. As an Investing Fund, the Fund indirectly bears its proportionate share of the expenses of the underlying Fidelity Central Funds.
The Money Market Central Funds seek preservation of capital and current income and are managed by Fidelity Investments Money Management, Inc. (FIMM), an affiliate of FMR.
A complete unaudited list of holdings for each Fidelity Central Fund is available upon request or at the Securities and Exchange Commission (the SEC) web site at www.sec.gov. In addition, the financial statements of the Fidelity Central Funds, which are not covered by the Fund's Report of Independent Registered Public Accounting Firm, are available on the SEC web site or upon request.
3. Significant Accounting Policies.
The financial statements have been prepared in conformity with accounting principles generally accepted in the United States of America (GAAP), which require management to make certain estimates and assumptions at the date of the financial statements. Actual results could differ from those estimates. Subsequent events, if any, through the date that the financial statements were issued have been evaluated in the preparation of the financial statements. The following summarizes the significant accounting policies of the Fund:
Security Valuation. Investments are valued as of 4:00 p.m. Eastern time on the last calendar day of the period. The Fund uses independent pricing services approved by the Board of Trustees to value its investments. When current market prices or quotations are not readily available or reliable, valuations may be determined in good faith in accordance with procedures adopted by the Board of Trustees. Factors used in determining value may include market or security specific events, changes in interest rates and credit quality. The frequency with which these procedures are used cannot be predicted and they may be utilized to a significant extent. The value used for net asset value (NAV) calculation under these procedures may differ from published prices for the same securities.
The Fund categorizes the inputs to valuation techniques used to value its investments into a disclosure hierarchy consisting of three levels as shown below:
Level 1 - quoted prices in active markets for identical investments
Level 2 - other significant observable inputs (including quoted prices for similar investments, interest rates, prepayment speeds, etc.)
Level 3 - unobservable inputs (including the Fund's own assumptions based on the best information available)
Changes in valuation techniques may result in transfers in or out of an assigned level within the disclosure hierarchy. The aggregate value of investments by input level, as of July 31, 2011, as well as a roll forward of Level 3 securities, is included at the end of the Fund's Schedule of Investments. Valuation techniques used to value the Fund's investments by major category are as follows:
Equity securities, including restricted securities, for which market quotations are readily available, are valued at the last reported sale price or official closing price as reported by an independent pricing service on the primary market or exchange on which they are traded and are categorized as Level 1 in the hierarchy. In the event there were no sales during the day or closing prices are not available, securities are valued at the last quoted bid price or may be valued using the last available price and are generally categorized as Level 2 in the hierarchy. For foreign equity securities, when significant market or security specific events arise, comparisons to the valuation of American Depositary Receipts (ADRs), futures contracts, Exchange-traded
Annual Report
3. Significant Accounting Policies - continued
Security Valuation - continued
funds (ETFs) and certain indexes as well as quoted prices for similar securities are used and are categorized as Level 2 in the hierarchy in these circumstances. Utilizing these techniques may result in transfers between Level 1 and Level 2. For restricted equity securities and private placements where observable inputs are limited, assumptions about market activity and risk are used and are categorized as Level 3 in the hierarchy.
Debt securities, including restricted securities, are valued based on evaluated prices received from independent pricing services or from dealers who make markets in such securities. For corporate bonds and master notes, pricing services utilize matrix pricing which considers yield or price of bonds of comparable quality, coupon, maturity and type as well as dealer supplied prices and are generally categorized as Level 2 in the hierarchy. When independent prices are unavailable or unreliable, debt securities may be valued utilizing pricing matrices which consider similar factors that would be used by independent pricing services. These are generally categorized as Level 2 in the hierarchy but may be Level 3 depending on the circumstances.
Investments in open-end mutual funds, including the Fidelity Central Funds, are valued at their closing net asset value each business day and are categorized as Level 1 in the hierarchy.
Foreign Currency. The Fund may use foreign currency contracts to facilitate transactions in foreign-denominated securities. Gains and losses from these transactions may arise from changes in the value of the foreign currency or if the counterparties do not perform under the contracts' terms.
Foreign-denominated assets, including investment securities, and liabilities are translated into U.S. dollars at the exchange rate at period end. Purchases and sales of investment securities, income and dividends received and expenses denominated in foreign currencies are translated into U.S. dollars at the exchange rate in effect on the transaction date.
The effects of exchange rate fluctuations on investments are included with the net realized and unrealized gain (loss) on investment securities. Other foreign currency transactions resulting in realized and unrealized gain (loss) are disclosed separately.
Investment Transactions and Income. For financial reporting purposes, the Fund's investment holdings and NAV include trades executed through the end of the last business day of the period. The NAV per share for processing shareholder transactions is calculated as of the close of business of the New York Stock Exchange (NYSE), normally 4:00 p.m. Eastern time and includes trades executed through the end of the prior business day. Gains and losses on securities sold are determined on the basis of identified cost and may include proceeds received from litigation. Dividend income is recorded on the ex-dividend date, except for certain dividends from foreign securities where the ex-dividend date may have passed, which are recorded as soon as the Fund is informed of the ex-dividend date. Non-cash dividends included in dividend income, if any, are recorded at the fair market value of the securities received. Distributions received on securities that represent a return of capital or capital gain are recorded as a reduction of cost of investments and/or as a realized gain. The Fund estimates the components of distributions received that may be considered return of capital distributions or capital gain distributions. Interest income and distributions from the Fidelity Central Funds are accrued as earned. Interest income includes coupon interest and amortization of premium and accretion of discount on debt securities. Investment income is recorded net of foreign taxes withheld where recovery of such taxes is uncertain.
Expenses. Expenses directly attributable to a fund are charged to that fund. Expenses attributable to more than one fund are allocated among the respective funds on the basis of relative net assets or other appropriate methods. Expense estimates are accrued in the period to which they relate and adjustments are made when actual amounts are known.
Income Tax Information and Distributions to Shareholders. Each year, the Fund intends to qualify as a regulated investment company, including distributing substantially all of its taxable income and realized gains under Subchapter M of the Internal Revenue Code and filing its U.S. federal tax return. As a result, no provision for income taxes is required. As of July 31, 2011, the Fund did not have any unrecognized tax benefits in the financial statements. A fund's federal tax return is subject to examination by the Internal Revenue Service (IRS) for a period of three years. Foreign taxes are provided for based on the Fund's understanding of the tax rules and rates that exist in the foreign markets in which it invests.
Distributions are declared and recorded on the ex-dividend date. Income dividends and capital gain distributions are declared separately for each class. Income and capital gain distributions are determined in accordance with income tax regulations, which may differ from GAAP.
Capital accounts within the financial statements are adjusted for permanent book-tax differences. These adjustments have no impact on net assets or the results of operations. Temporary book-tax differences will reverse in a subsequent period.
Book-tax differences are primarily due to foreign currency transactions, deferred trustees compensation, net operating losses, capital loss carryforwards, expiring capital loss carryforwards and losses deferred due to wash sales.
Annual Report
Notes to Financial Statements - continued
3. Significant Accounting Policies - continued
Income Tax Information and Distributions to Shareholders - continued
The federal tax cost of investment securities and unrealized appreciation (depreciation) as of period end were as follows:
Gross unrealized appreciation | $ 88,068,332 |
Gross unrealized depreciation | (49,640,378) |
Net unrealized appreciation (depreciation) on securities and other investments | $ 38,427,954 |
| |
Tax Cost | $ 787,669,457 |
The tax-based components of distributable earnings as of period end were as follows:
Capital loss carryforward | $ (132,837,596) |
Net unrealized appreciation (depreciation) | $ 38,430,964 |
Under the recently enacted Regulated Investment Company Modernization Act of 2010 (the Act), the Fund will be permitted to carry forward capital losses incurred in taxable years beginning after December 22, 2010 for an unlimited period. However, any losses incurred during those future taxable years will be required to be utilized prior to any losses incurred in pre-enactment taxable years, which generally expire after eight years from when they are incurred. Additionally, post-enactment capital losses that are carried forward will retain their character as either short-term or long-term capital losses rather than being considered all short-term as under previous law. The Fund's first fiscal year end subject to the Act will be July 31, 2012.
Short-Term Trading (Redemption) Fees. Shares held by investors in the Fund less than 30 days are subject to a redemption fee equal to .75% of the net asset value of shares redeemed. All redemption fees, which reduce the proceeds of the shareholder redemption, are retained by the Fund and accounted for as an addition to paid in capital.
New Accounting Pronouncement. In May 2011, the Financial Accounting Standards Board issued Accounting Standard Update No. 2011-04, Fair Value Measurement (Topic 820) - Amendments to Achieve Common Fair Value Measurement and Disclosure Requirements in U.S. GAAP and IFRSs. The update changes the wording used to describe the requirements in GAAP for measuring fair value and for disclosing information about fair value measurements. The update is effective during interim and annual periods beginning after December 15, 2011. Management is currently evaluating the impact of the update's adoption on the Fund's financial statement disclosures.
4. Operating Policies.
Restricted Securities. The Fund may invest in securities that are subject to legal or contractual restrictions on resale. These securities generally may be resold in transactions exempt from registration or to the public if the securities are registered. Disposal of these securities may involve time-consuming negotiations and expense, and prompt sale at an acceptable price may be difficult. Information regarding restricted securities is included at the end of the Fund's Schedule of Investments.
5. Purchases and Sales of Investments.
Purchases and sales of securities, other than short-term securities, aggregated $1,264,195,844 and $1,272,881,806, respectively.
6. Fees and Other Transactions with Affiliates.
Management Fee. FMR and its affiliates provide the Fund with investment management related services for which the Fund pays a monthly management fee. The management fee is the sum of an individual fund fee rate that is based on an annual rate of .30% of the Fund's average net assets and a group fee rate that averaged .26% during the period. The group fee rate is based upon the average net assets of all the mutual funds advised by FMR. The group fee rate decreases as assets under management increase and increases as assets under management decrease. For the period, the total annual management fee rate was .56% of the Fund's average net assets.
Annual Report
6. Fees and Other Transactions with Affiliates - continued
Distribution and Service Plan Fees. In accordance with Rule 12b-1 of the 1940 Act, the Fund has adopted separate Distribution and Service Plans for each class of shares. Certain classes pay Fidelity Distributors Corporation (FDC), an affiliate of FMR, separate Distribution and Service Fees, each of which is based on an annual percentage of each class' average net assets. In addition, FDC may pay financial intermediaries for selling shares of the Fund and providing shareholder support services. For the period, the Distribution and Service Fee rates, total fees and amounts retained by FDC were as follows:
| Distribution
Fee | Service
Fee | Total Fees | Retained
by FDC |
Class A | -% | .25% | $ 955,142 | $ 11,370 |
Class T | .25% | .25% | 1,011,486 | 5,192 |
Class B | .75% | .25% | 300,223 | 225,888 |
Class C | .75% | .25% | 880,649 | 140,768 |
| | | $ 3,147,500 | $ 383,218 |
Sales Load. FDC may receive a front-end sales charge of up to 5.75% for selling Class A shares, and 3.50% for selling Class T shares, some of which is paid to financial intermediaries for selling shares of the Fund. Depending on the holding period, FDC may receive contingent deferred sales charges levied on Class A, Class T, Class B, and Class C redemptions. The deferred sales charges range from 5% to 1% for Class B, 1% for Class C, 1.00% for certain purchases of Class A shares and .25% for certain purchases of Class T shares.
For the period, sales charge amounts retained by FDC were as follows:
| Retained
by FDC |
Class A | $ 83,277 |
Class T | 22,985 |
Class B* | 46,432 |
Class C* | 12,381 |
| $ 165,075 |
* When Class B and Class C shares are initially sold, FDC pays commissions from its own resources to financial intermediaries through which the sales are made.
Transfer Agent Fees. Fidelity Investments Institutional Operations Company, Inc. (FIIOC), an affiliate of FMR, is the transfer, dividend disbursing and shareholder servicing agent for each class of the Fund. FIIOC receives account fees and asset-based fees that vary according to the account size and type of account of the shareholders of the respective classes of the Fund. FIIOC pays for typesetting, printing and mailing of shareholder reports, except proxy statements. For the period, transfer agent fees for each class were as follows:
| Amount | % of
Average
Net Assets |
Class A | $ 1,145,307 | .30 |
Class T | 601,218 | .30 |
Class B | 90,243 | .30 |
Class C | 259,744 | .30 |
Institutional Class | 186,112 | .25 |
| $ 2,282,624 | |
Accounting and Security Lending Fees. Fidelity Service Company, Inc. (FSC), an affiliate of FMR, maintains the Fund's accounting records. The accounting fee is based on the level of average net assets for the month. Under a separate contract, FSC administers the security lending program. The security lending fee is based on the number and duration of lending transactions.
Brokerage Commissions. The Fund placed a portion of its portfolio transactions with brokerage firms which are affiliates of the investment adviser. The commissions paid to these affiliated firms were $38,932 for the period.
7. Committed Line of Credit.
The Fund participates with other funds managed by FMR or an affiliate in a $4.0 billion credit facility (the "line of credit") to be utilized for temporary or emergency purposes to fund shareholder redemptions or for other short-term liquidity purposes. The Fund has agreed to pay commitment fees on its pro-rata portion of the line of credit, which amounted to $2,547 and is reflected in Miscellaneous expenses on the Statement of Operations. During the period, there were no borrowings on this line of credit.
Annual Report
Notes to Financial Statements - continued
8. Security Lending.
The Fund lends portfolio securities through a lending agent from time to time in order to earn additional income. The lending agent may loan securities to certain qualified borrowers, including Fidelity Capital Markets (FCM), a broker-dealer affiliated with the Fund. On the settlement date of the loan, the Fund receives collateral (in the form of U.S. Treasury obligations, letters of credit and/or cash) against the loaned securities and maintains collateral in an amount not less than 100% of the market value of the loaned securities during the period of the loan. The market value of the loaned securities is determined at the close of business of the Fund and any additional required collateral is delivered to the Fund on the next business day. If the borrower defaults on its obligation to return the securities loaned because of insolvency or other reasons, a fund could experience delays and costs in recovering the securities loaned or in gaining access to the collateral. Any cash collateral received is invested in the Fidelity Securities Lending Cash Central Fund. The value of loaned securities and cash collateral at period end are disclosed on the Fund's Statement of Assets and Liabilities. Security lending income represents the income earned on investing cash collateral, less rebates paid to borrowers and lending agent fees associated with the loan, plus any premium payments received for lending certain types of securities. Security lending income is presented in the Statement of Operations as a component of income from Fidelity Central Funds, and includes $1,829 from securities loaned to FCM.
9. Expense Reductions.
Many of the brokers with whom FMR places trades on behalf of the Fund provided services to the Fund in addition to trade execution. These services included payments of certain expenses on behalf of the Fund totaling $164,981 for the period. In addition, through arrangements with the Fund's custodian, credits realized as a result of uninvested cash balances were used to reduce the Fund's expenses. During the period, these credits reduced the Fund's custody expenses by $106.
10. Share Transactions.
Transactions for each class of shares were as follows:
| Shares | Dollars |
Years ended July 31, | 2011 | 2010 | 2011 | 2010 |
Class A | | | | |
Shares sold | 3,825,268 | 4,395,059 | $ 95,895,792 | $ 83,404,216 |
Shares redeemed | (4,656,846) | (4,747,519) | (115,935,925) | (89,682,006) |
Net increase (decrease) | (831,578) | (352,460) | $ (20,040,133) | $ (6,277,790) |
Class T | | | | |
Shares sold | 1,318,401 | 1,549,777 | $ 31,818,569 | $ 28,544,536 |
Shares redeemed | (2,014,796) | (2,457,153) | (47,878,372) | (44,605,674) |
Net increase (decrease) | (696,395) | (907,376) | $ (16,059,803) | $ (16,061,138) |
Class B | | | | |
Shares sold | 98,795 | 364,834 | $ 2,198,114 | $ 6,301,624 |
Shares redeemed | (593,453) | (829,145) | (13,054,972) | (14,327,782) |
Net increase (decrease) | (494,658) | (464,311) | $ (10,856,858) | $ (8,026,158) |
Class C | | | | |
Shares sold | 982,784 | 985,847 | $ 22,502,223 | $ 17,180,918 |
Shares redeemed | (908,933) | (891,510) | (20,073,701) | (15,514,588) |
Net increase (decrease) | 73,851 | 94,337 | $ 2,428,522 | $ 1,666,330 |
Institutional Class | | | | |
Shares sold | 2,740,439 | 1,270,106 | $ 73,729,514 | $ 25,258,423 |
Shares redeemed | (1,692,072) | (802,290) | (44,832,264) | (15,808,337) |
Net increase (decrease) | 1,048,367 | 467,816 | $ 28,897,250 | $ 9,450,086 |
11. Other.
The Fund's organizational documents provide former and current trustees and officers with a limited indemnification against liabilities arising in connection with the performance of their duties to the Fund. In the normal course of business, the Fund may also enter into contracts that provide general indemnifications. The Fund's maximum exposure under these arrangements is unknown as this would be dependent on future claims that may be made against the Fund. The risk of material loss from such claims is considered remote.
Annual Report
Fidelity Advisor Utilities Fund - Class A, T, B, and C
Performance: The Bottom Line
Average annual total return reflects the change in the value of an investment, assuming reinvestment of the class' distributions from dividend income and capital gains (the profits earned upon the sale of securities that have grown in value, if any) and assuming a constant rate of performance each year. The $10,000 table and the fund's returns do not reflect the deduction of taxes that a shareholder would pay on fund distributions or the redemption of fund shares. During periods of reimbursement by Fidelity, a fund's total return will be greater than it would be had the reimbursement not occurred. How a fund did yesterday is no guarantee of how it will do tomorrow. Returns reflect the conversion of Class B shares to Class A shares after a maximum of seven years.
Average Annual Total Returns
Periods ended July 31, 2011 | Past 1
year | Past 5
years | Past 10
years |
Class A (incl. 5.75% sales charge) C | 10.94% | 2.77% | 3.31% |
Class T (incl. 3.50% sales charge) C | 13.28% | 2.97% | 3.29% |
Class B (incl. contingent deferred sales charge) A,C | 11.87% | 2.86% | 3.39% |
Class C (incl. contingent deferred sales charge) B,C | 15.85% | 3.22% | 3.20% |
A Class B shares' contingent deferred sales charges included in the past one year, past five years and past ten years total return figures are 5%, 2%, and 0%, respectively.
B Class C shares' contingent deferred sales charges included in the past one year, past five years and past ten years total return figures are 1%, 0%, and 0%, respectively.
C Prior to October 1, 2006, Fidelity Advisor Utilities Fund operated under certain different investment policies. The historical performance for the fund may not represent its current investment policies.
$10,000 Over 10 Years
Let's say hypothetically that $10,000 was invested in Fidelity Advisor Utilities Fund - Class A on July 31, 2001, and the current 5.75% sales charge was paid. The chart shows how the value of your investment would have changed, and also shows how the S&P 500 Index performed over the same period.
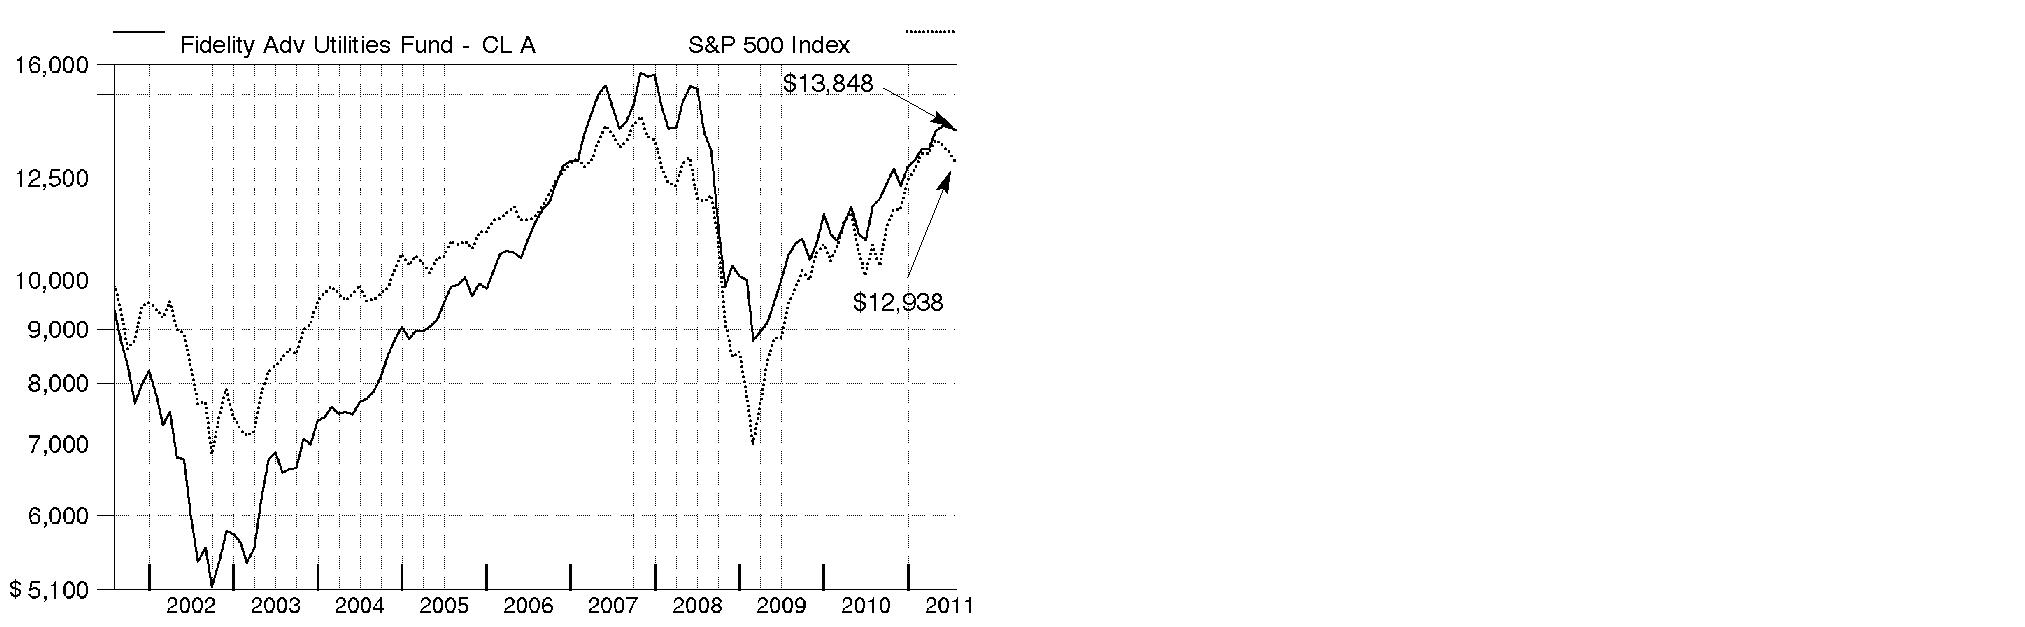
Annual Report
Fidelity Advisor Utilities Fund
Market Recap: U.S. stocks registered solid double-digit gains for the 12 months ending July 31, 2011, extending a rally that began more than two years earlier. Despite a rough start in August 2010, markets turned positive in September, as increased demand for capital goods and other upbeat indicators trumped investor worry about a U.S. recessionary relapse. The broad market, as measured by the S&P 500® Index, rose 9% that month, its biggest September gain in 71 years. Seven more monthly advances followed, fueled by encouraging corporate earnings and economic activity. However, volatility picked up in the period's latter months, as markets reacted to continued high U.S. unemployment, nagging debt troubles in Europe and looming legislative battles over the federal debt ceiling. May unemployment rose above 9% for the first time in 2011, contributing to a traditional "June swoon" for stocks. Market uncertainty lingered in July, when the S&P 500® posted its second-biggest monthly loss of the period. For the full year, the S&P 500® climbed 19.65%, while the blue-chip-laden Dow Jones Industrial AverageSM rose a comparable 19.09% and the technology-heavy Nasdaq Composite® Index gained 23.40%. On the capitalization spectrum, stocks of mid-cap companies fared best, with the Russell Midcap® Index rising 24.51% and the small-cap Russell 2000® Index adding 23.92%.
Comments from Douglas Simmons, Portfolio Manager of Fidelity Advisor® Utilities Fund: For the year ending July 31, 2011, the fund's Class A, Class T, Class B and Class C shares returned 17.71%, 17.39%, 16.87% and 16.85%, respectively (excluding sales charges), outperforming the 15.37% gain of the MSCI® U.S. IM Utilities 25/50 Index, but underperforming the S&P 500. Stock selection in gas utilities helped the most, along with solid positioning in independent power/energy trade and multi-utilities. I significantly changed the make-up of the fund, decreasing its allocation to regulated utilities and moving assets into deregulated power producers. This led to a reduction in the fund's stake in multi-utilities and an increase in the independent power/energy trade group. Top individual contributors included gas utilities ONEOK and National Fuel Gas, Maryland-based independent power producer Constellation Energy Group, Chicago-based electric utility Exelon and an underweighting in New Orleans-based electric utility Entergy, which we no longer own. On the down side, poor stock selection in electric utilities hurt, with the largest five detractors coming from this group, including untimely ownership of PPL in Pennsylvania - no longer held - and FirstEnergy in Ohio; an out-of-benchmark position in Tokyo Electric Power, since sold; and a sizable overweighting in Florida's NextEra Energy, which posted a positive return but lagged the index.
Comments from Douglas Simmons, Portfolio Manager of Fidelity Advisor® Utilities Fund: For the year ending July 31, 2011, the fund's Institutional Class shares returned 18.05%, outperforming the 15.37% gain of the MSCI® U.S. IM Utilities 25/50 Index, but underperforming the S&P 500. Stock selection in gas utilities helped the most, along with solid positioning in independent power/energy trade and multi-utilities. I significantly changed the make-up of the fund, decreasing its allocation to regulated utilities and moving assets into deregulated power producers. This led to a reduction in the fund's stake in multi-utilities and an increase in the independent power/energy trade group. Top individual contributors included gas utilities ONEOK and National Fuel Gas, Maryland-based independent power producer Constellation Energy Group, Chicago-based electric utility Exelon and an underweighting in New Orleans-based electric utility Entergy, which we no longer own. On the down side, poor stock selection in electric utilities hurt, with the largest five detractors coming from this group, including untimely ownership of PPL in Pennsylvania - no longer held - and FirstEnergy in Ohio; an out-of-benchmark position in Tokyo Electric Power, since sold; and a sizable overweighting in Florida's NextEra Energy, which posted a positive return but lagged the index.
The views expressed above reflect those of the portfolio manager(s) only through the end of the period as stated on the cover of this report and do not necessarily represent the views of Fidelity or any other person in the Fidelity organization. Any such views are subject to change at any time based upon market or other conditions and Fidelity disclaims any responsibility to update such views. These views may not be relied on as investment advice and, because investment decisions for a Fidelity fund are based on numerous factors, may not be relied on as an indication of trading intent on behalf of any Fidelity fund.
Annual Report
Fidelity Advisor Utilities Fund
As a shareholder of the Fund, you incur two types of costs: (1) transaction costs, including sales charges (loads) on purchase payments or redemption proceeds, redemption fees, and (2) ongoing costs, including management fees, distribution and/or service (12b-1) fees and other Fund expenses. This Example is intended to help you understand your ongoing costs (in dollars) of investing in the Fund and to compare these costs with the ongoing costs of investing in other mutual funds.
The Example is based on an investment of $1,000 invested at the beginning of the period and held for the entire period (February 1, 2011 to July 31, 2011).
Actual Expenses
The first line of the accompanying table for each class of the Fund provides information about actual account values and actual expenses. You may use the information in this line, together with the amount you invested, to estimate the expenses that you paid over the period. Simply divide your account value by $1,000.00 (for example, an $8,600 account value divided by $1,000.00 = 8.6), then multiply the result by the number in the first line for a class of the Fund under the heading entitled "Expenses Paid During Period" to estimate the expenses you paid on your account during this period. In addition, the Fund, as a shareholder in the underlying Fidelity Central Funds, will indirectly bear its pro-rata share of the fees and expenses incurred by the underlying Fidelity Central Funds. These fees and expenses are not included in the Fund's annualized expense ratio used to calculate the expense estimate in the table below.
Hypothetical Example for Comparison Purposes
The second line of the accompanying table for each class of the Fund provides information about hypothetical account values and hypothetical expenses based on a Class' actual expense ratio and an assumed rate of return of 5% per year before expenses, which is not the Class' actual return. The hypothetical account values and expenses may not be used to estimate the actual ending account balance or expenses you paid for the period. You may use this information to compare the ongoing costs of investing in the Fund and other funds. To do so, compare this 5% hypothetical example with the 5% hypothetical examples that appear in the shareholder reports of the other funds. In addition, the Fund, as a shareholder in the underlying Fidelity Central Funds, will indirectly bear its pro-rata share of the fees and expenses incurred by the underlying Fidelity Central Funds. These fees and expenses are not included in the Fund's annualized expense ratio used to calculate the expense estimate in the table below.
Please note that the expenses shown in the table are meant to highlight your ongoing costs only and do not reflect any transaction costs. Therefore, the second line of the table is useful in comparing ongoing costs only, and will not help you determine the relative total costs of owning different funds. In addition, if these transactional costs were included, your costs would have been higher.
| Annualized
Expense Ratio | Beginning
Account Value
February 1, 2011 | Ending
Account Value
July 31, 2011 | Expenses Paid
During Period*
February 1, 2011 to
July 31, 2011 |
Class A | 1.21% | | | |
Actual | | $ 1,000.00 | $ 1,065.30 | $ 6.20 |
HypotheticalA | | $ 1,000.00 | $ 1,018.79 | $ 6.06 |
Class T | 1.47% | | | |
Actual | | $ 1,000.00 | $ 1,064.10 | $ 7.52 |
HypotheticalA | | $ 1,000.00 | $ 1,017.50 | $ 7.35 |
Class B | 1.96% | | | |
Actual | | $ 1,000.00 | $ 1,061.90 | $ 10.02 |
HypotheticalA | | $ 1,000.00 | $ 1,015.08 | $ 9.79 |
Class C | 1.95% | | | |
Actual | | $ 1,000.00 | $ 1,061.70 | $ 9.97 |
HypotheticalA | | $ 1,000.00 | $ 1,015.12 | $ 9.74 |
Institutional Class | .95% | | | |
Actual | | $ 1,000.00 | $ 1,066.50 | $ 4.87 |
HypotheticalA | | $ 1,000.00 | $ 1,020.08 | $ 4.76 |
A 5% return per year before expenses
* Expenses are equal to each Class' annualized expense ratio, multiplied by the average account value over the period, multiplied by 181/365 (to reflect the one-half year period).
Annual Report
Fidelity Advisor Utilities Fund
Investment Changes (Unaudited)
Top Ten Stocks as of July 31, 2011 |
| % of fund's
net assets | % of fund's net assets
6 months ago |
Exelon Corp. | 11.6 | 0.0 |
NextEra Energy, Inc. | 10.0 | 12.0 |
Public Service Enterprise Group, Inc. | 8.2 | 4.4 |
Edison International | 7.1 | 6.2 |
FirstEnergy Corp. | 7.1 | 2.4 |
The AES Corp. | 5.7 | 2.7 |
Constellation Energy Group, Inc. | 4.9 | 3.3 |
American Electric Power Co., Inc. | 4.9 | 0.0 |
Calpine Corp. | 4.8 | 1.5 |
PG&E Corp. | 4.8 | 4.7 |
| 69.1 | |
Top Industries (% of fund's net assets) |
As of July 31, 2011 |
| Electric Utilities | 47.6% | |
| Multi-Utilities | 22.1% | |
| Independent Power Producers & Energy Traders | 21.2% | |
| Gas Utilities | 5.8% | |
| Oil, Gas &
Consumable Fuels | 2.1% | |
| All Others* | 1.2% | |

As of January 31, 2011 |
| Electric Utilities | 46.3% | |
| Multi-Utilities | 29.3% | |
| Gas Utilities | 11.0% | |
| Independent Power Producers & Energy Traders | 8.5% | |
| Oil, Gas &
Consumable Fuels | 3.2% | |
| All Others* | 1.7% | |

* Includes short-term investments and net other assets. |
Annual Report
Fidelity Advisor Utilities Fund
Investments July 31, 2011
Showing Percentage of Net Assets
Common Stocks - 98.8% |
| Shares | | Value |
ELECTRIC UTILITIES - 47.6% |
Electric Utilities - 47.6% |
American Electric Power Co., Inc. | 210,014 | | $ 7,741,116 |
Edison International | 297,796 | | 11,337,094 |
Exelon Corp. | 418,811 | | 18,457,001 |
FirstEnergy Corp. | 253,700 | | 11,327,705 |
ITC Holdings Corp. | 100,610 | | 7,068,859 |
NextEra Energy, Inc. | 288,720 | | 15,951,780 |
NV Energy, Inc. | 272,657 | | 4,046,230 |
| | 75,929,785 |
GAS UTILITIES - 5.8% |
Gas Utilities - 5.8% |
National Fuel Gas Co. | 46,512 | | 3,366,539 |
ONEOK, Inc. | 81,121 | | 5,904,798 |
| | 9,271,337 |
INDEPENDENT POWER PRODUCERS & ENERGY TRADERS - 21.2% |
Independent Power Producers & Energy Traders - 21.2% |
Calpine Corp. (a) | 473,521 | | 7,694,716 |
Constellation Energy Group, Inc. | 201,682 | | 7,831,312 |
GenOn Energy, Inc. (a) | 1,131,271 | | 4,400,644 |
NRG Energy, Inc. (a) | 197,762 | | 4,849,124 |
The AES Corp. (a) | 734,600 | | 9,042,926 |
| | 33,818,722 |
MULTI-UTILITIES - 22.1% |
Multi-Utilities - 22.1% |
CenterPoint Energy, Inc. | 166,574 | | 3,261,519 |
OGE Energy Corp. | 91,756 | | 4,591,470 |
|
| Shares | | Value |
PG&E Corp. | 183,732 | | $ 7,612,017 |
Public Service Enterprise Group, Inc. | 400,131 | | 13,104,290 |
Sempra Energy | 132,831 | | 6,733,203 |
| | 35,302,499 |
OIL, GAS & CONSUMABLE FUELS - 2.1% |
Oil & Gas Storage & Transport - 2.1% |
Williams Companies, Inc. | 109,082 | | 3,457,899 |
TOTAL COMMON STOCKS (Cost $148,103,799) | 157,780,242 |
Money Market Funds - 0.8% |
| | | |
Fidelity Cash Central Fund, 0.14% (b)
(Cost $1,268,029) | 1,268,029 | | 1,268,029 |
TOTAL INVESTMENT PORTFOLIO - 99.6% (Cost $149,371,828) | | 159,048,271 |
NET OTHER ASSETS (LIABILITIES) - 0.4% | | 567,432 |
NET ASSETS - 100% | $ 159,615,703 |
Legend |
(a) Non-income producing |
(b) Affiliated fund that is available only to investment companies and other accounts managed by Fidelity Investments. The rate quoted is the annualized seven-day yield of the fund at period end. A complete unaudited listing of the fund's holdings as of its most recent quarter end is available upon request. In addition, each Fidelity Central Fund's financial statements, which are not covered by the Fund's Report of Independent Registered Public Accounting Firm, are available on the SEC's website or upon request. |
Affiliated Central Funds |
Information regarding fiscal year to date income earned by the Fund from investments in Fidelity Central Funds is as follows: |
Fund | Income earned |
Fidelity Cash Central Fund | $ 2,378 |
Fidelity Securities Lending Cash Central Fund | 7,142 |
Total | $ 9,520 |
Other Information |
All investments are categorized as Level 1 under the Fair Value Hierarchy. The inputs or methodology used for valuing securities may not be an indication of the risk associated with investing in those securities. For more information on valuation inputs, please refer to the Security Valuation section in the accompanying Notes to Financial Statements. |
Income Tax Information |
At July 31, 2011, the Fund had a capital loss carryforward of approximately $41,949,952 of which $13,867,918 and $28,082,034 will expire in fiscal 2017 and 2018, respectively. Capital loss carryforwards are only available to offset future capital gains of the Fund to the extent provided by regulations and may be limited. |
See accompanying notes which are an integral part of the financial statements.
Annual Report
Fidelity Advisor Utilities Fund
Statement of Assets and Liabilities
| July 31, 2011 |
| | |
Assets | | |
Investment in securities, at value - See accompanying schedule: Unaffiliated issuers (cost $148,103,799) | $ 157,780,242 | |
Fidelity Central Funds (cost $1,268,029) | 1,268,029 | |
Total Investments (cost $149,371,828) | | $ 159,048,271 |
Cash | | 10,686 |
Receivable for investments sold | | 860,652 |
Receivable for fund shares sold | | 244,461 |
Dividends receivable | | 140,306 |
Distributions receivable from Fidelity Central Funds | | 120 |
Other receivables | | 21,969 |
Total assets | | 160,326,465 |
| | |
Liabilities | | |
Payable for investments purchased | $ 225,198 | |
Payable for fund shares redeemed | 272,589 | |
Accrued management fee | 74,636 | |
Transfer agent fee payable | 38,529 | |
Distribution and service plan fees payable | 60,841 | |
Other affiliated payables | 5,219 | |
Other payables and accrued expenses | 33,750 | |
Total liabilities | | 710,762 |
| | |
Net Assets | | $ 159,615,703 |
Net Assets consist of: | | |
Paid in capital | | $ 192,506,368 |
Undistributed net investment income | | 1,305,339 |
Accumulated undistributed net realized gain (loss) on investments and foreign currency transactions | | (43,872,447) |
Net unrealized appreciation (depreciation) on investments | | 9,676,443 |
Net Assets | | $ 159,615,703 |
Statement of Assets and Liabilities - continued
| July 31, 2011 |
| | |
Calculation of Maximum Offering Price Class A:
Net Asset Value and redemption price per share ($78,312,171 ÷ 4,102,036 shares) | | $ 19.09 |
| | |
Maximum offering price per share (100/94.25 of $19.09) | | $ 20.25 |
Class T:
Net Asset Value and redemption price per share ($35,700,818 ÷ 1,869,718 shares) | | $ 19.09 |
| | |
Maximum offering price per share (100/96.50 of $19.09) | | $ 19.78 |
Class B:
Net Asset Value and offering price per share ($7,773,240 ÷ 412,234 shares)A | | $ 18.86 |
| | |
Class C:
Net Asset Value and offering price per share ($26,915,407 ÷ 1,435,547 shares)A | | $ 18.75 |
| | |
Institutional Class:
Net Asset Value, offering price and redemption price per share ($10,914,067 ÷ 562,473 shares) | | $ 19.40 |
A Redemption price per share is equal to net asset value less any applicable contingent deferred sales charge.
See accompanying notes which are an integral part of the financial statements.
Annual Report
Statement of Operations
| Year ended July 31, 2011 |
| | |
Investment Income | | |
Dividends | | $ 4,971,306 |
Interest | | 1 |
Income from Fidelity Central Funds | | 9,520 |
Total income | | 4,980,827 |
| | |
Expenses | | |
Management fee | $ 822,413 | |
Transfer agent fees | 447,886 | |
Distribution and service plan fees | 681,232 | |
Accounting and security lending fees | 57,753 | |
Custodian fees and expenses | 15,402 | |
Independent trustees' compensation | 808 | |
Registration fees | 60,541 | |
Audit | 47,893 | |
Legal | 2,571 | |
Miscellaneous | 1,519 | |
Total expenses before reductions | 2,138,018 | |
Expense reductions | (56,520) | 2,081,498 |
Net investment income (loss) | | 2,899,329 |
Realized and Unrealized Gain (Loss) Net realized gain (loss) on: | | |
Investment securities: | | |
Unaffiliated issuers | 15,549,835 | |
Foreign currency transactions | (15,716) | |
Total net realized gain (loss) | | 15,534,119 |
Change in net unrealized appreciation (depreciation) on: Investment securities | 4,882,261 | |
Assets and liabilities in foreign currencies | 3,458 | |
Total change in net unrealized appreciation (depreciation) | | 4,885,719 |
Net gain (loss) | | 20,419,838 |
Net increase (decrease) in net assets resulting from operations | | $ 23,319,167 |
Statement of Changes in Net Assets
| Year ended
July 31,
2011 | Year ended
July 31,
2010 |
Increase (Decrease) in Net Assets | | |
Operations | | |
Net investment income (loss) | $ 2,899,329 | $ 3,071,475 |
Net realized gain (loss) | 15,534,119 | 6,308,221 |
Change in net unrealized appreciation (depreciation) | 4,885,719 | 4,895,678 |
Net increase (decrease) in net assets resulting from operations | 23,319,167 | 14,275,374 |
Distributions to shareholders from net investment income | (2,864,390) | (3,192,017) |
Share transactions - net increase (decrease) | 3,898,632 | (13,238,224) |
Redemption fees | 2,026 | 1,956 |
Total increase (decrease) in net assets | 24,355,435 | (2,152,911) |
| | |
Net Assets | | |
Beginning of period | 135,260,268 | 137,413,179 |
End of period (including undistributed net investment income of $1,305,339 and undistributed net investment income of $1,286,115, respectively) | $ 159,615,703 | $ 135,260,268 |
See accompanying notes which are an integral part of the financial statements.
Annual Report
Financial Highlights - Class A
Years ended July 31, | 2011 | 2010 | 2009 | 2008 | 2007 |
Selected Per-Share Data | | | | | |
Net asset value, beginning of period | $ 16.59 | $ 15.27 | $ 20.28 | $ 20.74 | $ 17.20 |
Income from Investment Operations | | | | | |
Net investment income (loss) C | .39 | .40 | .35 | .24 | .21 |
Net realized and unrealized gain (loss) | 2.50 | 1.32 | (5.10) | (.38) | 3.56 |
Total from investment operations | 2.89 | 1.72 | (4.75) | (.14) | 3.77 |
Distributions from net investment income | (.39) | (.40) | (.26) | (.32) | (.23) |
Redemption fees added to paid in capital C, G | - | - | - | - | - |
Net asset value, end of period | $ 19.09 | $ 16.59 | $ 15.27 | $ 20.28 | $ 20.74 |
Total Return A, B | 17.71% | 11.42% | (23.44)% | (.82)% | 22.14% |
Ratios to Average Net Assets D, F | | | | | |
Expenses before reductions | 1.24% | 1.26% | 1.26% | 1.21% | 1.27% |
Expenses net of fee waivers, if any | 1.24% | 1.26% | 1.26% | 1.21% | 1.27% |
Expenses net of all reductions | 1.20% | 1.22% | 1.26% | 1.21% | 1.26% |
Net investment income (loss) | 2.18% | 2.49% | 2.37% | 1.11% | 1.04% |
Supplemental Data | | | | | |
Net assets, end of period (000 omitted) | $ 78,312 | $ 64,890 | $ 66,064 | $ 105,219 | $ 94,842 |
Portfolio turnover rate E | 201% | 216% | 247% | 77% | 118% |
A Total returns would have been lower if certain expenses had not been reduced during the applicable periods shown.
B Total returns do not include the effect of the sales charges.
C Calculated based on average shares outstanding during the period.
D Fees and expenses of any underlying Fidelity Central Funds are not included in the Fund's expense ratio. The Fund indirectly bears its proportionate share of the expenses of any underlying Fidelity Central Funds.
E Amount does not include the portfolio activity of any underlying Fidelity Central Funds.
F Expense ratios reflect operating expenses of the class. Expenses before reductions do not reflect amounts reimbursed by the investment adviser or reductions from brokerage service arrangements or reductions from other expense offset arrangements and do not represent the amount paid by the class during periods when reimbursements or reductions occur. Expenses net of fee waivers reflect expenses after reimbursement by the investment adviser but prior to reductions from brokerage service arrangements or other expense offset arrangements. Expenses net of all reductions represent the net expenses paid by the class.
G Amount represents less than $.01 per share.
Financial Highlights - Class T
Years ended July 31, | 2011 | 2010 | 2009 | 2008 | 2007 |
Selected Per-Share Data | | | | | |
Net asset value, beginning of period | $ 16.59 | $ 15.27 | $ 20.26 | $ 20.71 | $ 17.18 |
Income from Investment Operations | | | | | |
Net investment income (loss) C | .35 | .35 | .31 | .18 | .15 |
Net realized and unrealized gain (loss) | 2.50 | 1.33 | (5.10) | (.39) | 3.56 |
Total from investment operations | 2.85 | 1.68 | (4.79) | (.21) | 3.71 |
Distributions from net investment income | (.35) | (.36) | (.20) | (.24) | (.18) |
Redemption fees added to paid in capital C, G | - | - | - | - | - |
Net asset value, end of period | $ 19.09 | $ 16.59 | $ 15.27 | $ 20.26 | $ 20.71 |
Total Return A, B | 17.39% | 11.13% | (23.61)% | (1.11)% | 21.74% |
Ratios to Average Net Assets D, F | | | | | |
Expenses before reductions | 1.50% | 1.52% | 1.52% | 1.47% | 1.54% |
Expenses net of fee waivers, if any | 1.50% | 1.52% | 1.52% | 1.47% | 1.54% |
Expenses net of all reductions | 1.46% | 1.49% | 1.52% | 1.47% | 1.54% |
Net investment income (loss) | 1.92% | 2.23% | 2.11% | .84% | .76% |
Supplemental Data | | | | | |
Net assets, end of period (000 omitted) | $ 35,701 | $ 33,651 | $ 33,989 | $ 54,346 | $ 62,592 |
Portfolio turnover rate E | 201% | 216% | 247% | 77% | 118% |
A Total returns would have been lower if certain expenses had not been reduced during the applicable periods shown.
B Total returns do not include the effect of the sales charges.
C Calculated based on average shares outstanding during the period.
D Fees and expenses of any underlying Fidelity Central Funds are not included in the Fund's expense ratio. The Fund indirectly bears its proportionate share of the expenses of any underlying Fidelity Central Funds.
E Amount does not include the portfolio activity of any underlying Fidelity Central Funds.
F Expense ratios reflect operating expenses of the class. Expenses before reductions do not reflect amounts reimbursed by the investment adviser or reductions from brokerage service arrangements or reductions from other expense offset arrangements and do not represent the amount paid by the class during periods when reimbursements or reductions occur. Expenses net of fee waivers reflect expenses after reimbursement by the investment adviser but prior to reductions from brokerage service arrangements or other expense offset arrangements. Expenses net of all reductions represent the net expenses paid by the class.
G Amount represents less than $.01 per share.
See accompanying notes which are an integral part of the financial statements.
Annual Report
Financial Highlights - Class B
Years ended July 31, | 2011 | 2010 | 2009 | 2008 | 2007 |
Selected Per-Share Data | | | | | |
Net asset value, beginning of period | $ 16.38 | $ 15.08 | $ 20.01 | $ 20.40 | $ 16.90 |
Income from Investment Operations | | | | | |
Net investment income (loss) C | .25 | .27 | .24 | .08 | .05 |
Net realized and unrealized gain (loss) | 2.49 | 1.31 | (5.04) | (.39) | 3.52 |
Total from investment operations | 2.74 | 1.58 | (4.80) | (.31) | 3.57 |
Distributions from net investment income | (.26) | (.28) | (.13) | (.08) | (.07) |
Redemption fees added to paid in capital C, G | - | - | - | - | - |
Net asset value, end of period | $ 18.86 | $ 16.38 | $ 15.08 | $ 20.01 | $ 20.40 |
Total Return A, B | 16.87% | 10.56% | (23.97)% | (1.59)% | 21.18% |
Ratios to Average Net Assets D, F | | | | | |
Expenses before reductions | 1.99% | 2.01% | 2.01% | 1.96% | 2.04% |
Expenses net of fee waivers, if any | 1.99% | 2.01% | 2.01% | 1.96% | 2.04% |
Expenses net of all reductions | 1.95% | 1.98% | 2.01% | 1.95% | 2.03% |
Net investment income (loss) | 1.43% | 1.74% | 1.62% | .36% | .27% |
Supplemental Data | | | | | |
Net assets, end of period (000 omitted) | $ 7,773 | $ 8,794 | $ 10,634 | $ 20,747 | $ 43,845 |
Portfolio turnover rate E | 201% | 216% | 247% | 77% | 118% |
A Total returns would have been lower if certain expenses had not been reduced during the applicable periods shown.
B Total returns do not include the effect of the contingent deferred sales charge.
C Calculated based on average shares outstanding during the period.
D Fees and expenses of any underlying Fidelity Central Funds are not included in the Fund's expense ratio. The Fund indirectly bears its proportionate share of the expenses of any underlying Fidelity Central Funds.
E Amount does not include the portfolio activity of any underlying Fidelity Central Funds.
F Expense ratios reflect operating expenses of the class. Expenses before reductions do not reflect amounts reimbursed by the investment adviser or reductions from brokerage service arrangements or reductions from other expense offset arrangements and do not represent the amount paid by the class during periods when reimbursements or reductions occur. Expenses net of fee waivers reflect expenses after reimbursement by the investment adviser but prior to reductions from brokerage service arrangements or other expense offset arrangements. Expenses net of all reductions represent the net expenses paid by the class.
G Amount represents less than $.01 per share.
Financial Highlights - Class C
Years ended July 31, | 2011 | 2010 | 2009 | 2008 | 2007 |
Selected Per-Share Data | | | | | |
Net asset value, beginning of period | $ 16.30 | $ 15.02 | $ 19.93 | $ 20.38 | $ 16.91 |
Income from Investment Operations | | | | | |
Net investment income (loss) C | .26 | .27 | .24 | .08 | .06 |
Net realized and unrealized gain (loss) | 2.46 | 1.30 | (5.02) | (.39) | 3.51 |
Total from investment operations | 2.72 | 1.57 | (4.78) | (.31) | 3.57 |
Distributions from net investment income | (.27) | (.29) | (.13) | (.14) | (.10) |
Redemption fees added to paid in capital C, G | - | - | - | - | - |
Net asset value, end of period | $ 18.75 | $ 16.30 | $ 15.02 | $ 19.93 | $ 20.38 |
Total Return A, B | 16.85% | 10.54% | (23.96)% | (1.58)% | 21.23% |
Ratios to Average Net Assets D, F | | | | | |
Expenses before reductions | 1.98% | 2.01% | 2.01% | 1.95% | 1.99% |
Expenses net of fee waivers, if any | 1.98% | 2.01% | 2.01% | 1.95% | 1.99% |
Expenses net of all reductions | 1.94% | 1.97% | 2.01% | 1.95% | 1.99% |
Net investment income (loss) | 1.43% | 1.74% | 1.62% | .36% | .32% |
Supplemental Data | | | | | |
Net assets, end of period (000 omitted) | $ 26,915 | $ 21,415 | $ 22,352 | $ 37,387 | $ 43,292 |
Portfolio turnover rate E | 201% | 216% | 247% | 77% | 118% |
A Total returns would have been lower if certain expenses had not been reduced during the applicable periods shown.
B Total returns do not include the effect of the contingent deferred sales charge.
C Calculated based on average shares outstanding during the period.
D Fees and expenses of any underlying Fidelity Central Funds are not included in the Fund's expense ratio. The Fund indirectly bears its proportionate share of the expenses of any underlying Fidelity Central Funds.
E Amount does not include the portfolio activity of any underlying Fidelity Central Funds.
F Expense ratios reflect operating expenses of the class. Expenses before reductions do not reflect amounts reimbursed by the investment adviser or reductions from brokerage service arrangements or reductions from other expense offset arrangements and do not represent the amount paid by the class during periods when reimbursements or reductions occur. Expenses net of fee waivers reflect expenses after reimbursement by the investment adviser but prior to reductions from brokerage service arrangements or other expense offset arrangements. Expenses net of all reductions represent the net expenses paid by the class.
G Amount represents less than $.01 per share.
See accompanying notes which are an integral part of the financial statements.
Annual Report
Financial Highlights - Institutional Class
Years ended July 31, | 2011 | 2010 | 2009 | 2008 | 2007 |
Selected Per-Share Data | | | | | |
Net asset value, beginning of period | $ 16.85 | $ 15.51 | $ 20.52 | $ 20.95 | $ 17.38 |
Income from Investment Operations | | | | | |
Net investment income (loss) B | .45 | .44 | .39 | .31 | .29 |
Net realized and unrealized gain (loss) | 2.54 | 1.35 | (5.17) | (.38) | 3.58 |
Total from investment operations | 2.99 | 1.79 | (4.78) | (.07) | 3.87 |
Distributions from net investment income | (.44) | (.45) | (.23) | (.36) | (.30) |
Redemption fees added to paid in capital B, F | - | - | - | - | - |
Net asset value, end of period | $ 19.40 | $ 16.85 | $ 15.51 | $ 20.52 | $ 20.95 |
Total Return A | 18.05% | 11.66% | (23.24)% | (.49)% | 22.54% |
Ratios to Average Net Assets C, E | | | | | |
Expenses before reductions | .98% | 1.00% | 1.00% | .91% | .92% |
Expenses net of fee waivers, if any | .98% | 1.00% | 1.00% | .91% | .92% |
Expenses net of all reductions | .94% | .97% | 1.00% | .90% | .92% |
Net investment income (loss) | 2.44% | 2.75% | 2.63% | 1.41% | 1.39% |
Supplemental Data | | | | | |
Net assets, end of period (000 omitted) | $ 10,914 | $ 6,511 | $ 4,373 | $ 5,704 | $ 12,822 |
Portfolio turnover rate D | 201% | 216% | 247% | 77% | 118% |
A Total returns would have been lower if certain expenses had not been reduced during the applicable periods shown.
B Calculated based on average shares outstanding during the period.
C Fees and expenses of any underlying Fidelity Central Funds are not included in the Fund's expense ratio. The Fund indirectly bears its proportionate share of the expenses of any underlying Fidelity Central Funds.
D Amount does not include the portfolio activity of any underlying Fidelity Central Funds.
E Expense ratios reflect operating expenses of the class. Expenses before reductions do not reflect amounts reimbursed by the investment adviser or reductions from brokerage service arrangements or reductions from other expense offset arrangements and do not represent the amount paid by the class during periods when reimbursements or reductions occur. Expenses net of fee waivers reflect expenses after reimbursement by the investment adviser but prior to reductions from brokerage service arrangements or other expense offset arrangements. Expenses net of all reductions represent the net expenses paid by the class.
F Amount represents less than $.01 per share.
See accompanying notes which are an integral part of the financial statements.
Annual Report
Notes to Financial Statements
For the period ended July 31, 2011
1. Organization.
Fidelity Advisor Utilities Fund (the Fund) is a non-diversified fund of Fidelity Advisor Series VII (the Trust) and is authorized to issue an unlimited number of shares. The Trust is registered under the Investment Company Act of 1940, as amended (the 1940 Act), as an open-end management investment company organized as a Massachusetts business trust. The Fund offers Class A, Class T, Class C and Institutional Class shares, each of which, along with Class B shares, has equal rights as to assets and voting privileges. Effective after the close of business on September 1, 2010, Class B shares were closed to new accounts and additional purchases, except for exchanges and reinvestments, by existing shareholders. Each class has exclusive voting rights with respect to matters that affect that class. Class B shares will automatically convert to Class A shares after a holding period of seven years from the initial date of purchase. Investment income, realized and unrealized capital gains and losses, the common expenses of the Fund, and certain fund-level expense reductions, if any, are allocated on a pro-rata basis to each class based on the relative net assets of each class to the total net assets of the Fund. Each class differs with respect to transfer agent and distribution and service plan fees incurred. Certain expense reductions may also differ by class.
2. Investments in Fidelity Central Funds.
The Fund invests in Fidelity Central Funds, which are open-end investment companies available only to other investment companies and accounts managed by Fidelity Management & Research Company (FMR) and its affiliates. The Fund's Schedule of Investments lists each of the Fidelity Central Funds held as of period end, if any, as an investment of the Fund, but does not include the underlying holdings of each Fidelity Central Fund. As an Investing Fund, the Fund indirectly bears its proportionate share of the expenses of the underlying Fidelity Central Funds.
The Money Market Central Funds seek preservation of capital and current income and are managed by Fidelity Investments Money Management, Inc. (FIMM), an affiliate of FMR.
A complete unaudited list of holdings for each Fidelity Central Fund is available upon request or at the Securities and Exchange Commission (the SEC) web site at www.sec.gov. In addition, the financial statements of the Fidelity Central Funds, which are not covered by the Fund's Report of Independent Registered Public Accounting Firm, are available on the SEC web site or upon request.
3. Significant Accounting Policies.
The financial statements have been prepared in conformity with accounting principles generally accepted in the United States of America (GAAP), which require management to make certain estimates and assumptions at the date of the financial statements. Actual results could differ from those estimates. Subsequent events, if any, through the date that the financial statements were issued have been evaluated in the preparation of the financial statements. The following summarizes the significant accounting policies of the Fund:
Security Valuation. Investments are valued as of 4:00 p.m. Eastern time on the last calendar day of the period. The Fund uses independent pricing services approved by the Board of Trustees to value its investments. When current market prices or quotations are not readily available or reliable, valuations may be determined in good faith in accordance with procedures adopted by the Board of Trustees. Factors used in determining value may include market or security specific events. The frequency with which these procedures are used cannot be predicted and they may be utilized to a significant extent. The value used for net asset value (NAV) calculation under these procedures may differ from published prices for the same securities.
The Fund categorizes the inputs to valuation techniques used to value its investments into a disclosure hierarchy consisting of three levels as shown below:
Level 1 - quoted prices in active markets for identical investments
Level 2 - other significant observable inputs (including quoted prices for similar investments, interest rates, prepayment speeds, etc.)
Level 3 - unobservable inputs (including the Fund's own assumptions based on the best information available)
Changes in valuation techniques may result in transfers in or out of an assigned level within the disclosure hierarchy. Valuation techniques used to value the Fund's investments by major category are as follows:
Equity securities, including restricted securities, for which market quotations are readily available, are valued at the last reported sale price or official closing price as reported by an independent pricing service on the primary market or exchange on which they are traded and are categorized as Level 1 in the hierarchy. In the event there were no sales during the day or closing prices are not available, securities are valued at the last quoted bid price or may be valued using the last available price and are generally categorized as Level 2 in the hierarchy. For foreign equity securities, when significant market or security specific events arise, comparisons to the valuation of American Depositary Receipts (ADRs), futures contracts, Exchange-traded funds (ETFs) and certain indexes as well as quoted prices for similar securities are used and are categorized as Level 2 in the hierarchy in these
Annual Report
Notes to Financial Statements - continued
3. Significant Accounting Policies - continued
Security Valuation - continued
circumstances. Utilizing these techniques may result in transfers between Level 1 and Level 2. For restricted equity securities and private placements where observable inputs are limited, assumptions about market activity and risk are used and are categorized as Level 3 in the hierarchy.
Investments in open-end mutual funds, including the Fidelity Central Funds, are valued at their closing net asset value each business day and are categorized as Level 1 in the hierarchy.
Foreign Currency. The Fund may use foreign currency contracts to facilitate transactions in foreign-denominated securities. Gains and losses from these transactions may arise from changes in the value of the foreign currency or if the counterparties do not perform under the contracts' terms.
Foreign-denominated assets, including investment securities, and liabilities are translated into U.S. dollars at the exchange rate at period end. Purchases and sales of investment securities, income and dividends received and expenses denominated in foreign currencies are translated into U.S. dollars at the exchange rate in effect on the transaction date.
The effects of exchange rate fluctuations on investments are included with the net realized and unrealized gain (loss) on investment securities. Other foreign currency transactions resulting in realized and unrealized gain (loss) are disclosed separately.
Investment Transactions and Income. For financial reporting purposes, the Fund's investment holdings and NAV include trades executed through the end of the last business day of the period. The NAV per share for processing shareholder transactions is calculated as of the close of business of the New York Stock Exchange (NYSE), normally 4:00 p.m. Eastern time and includes trades executed through the end of the prior business day. Gains and losses on securities sold are determined on the basis of identified cost and may include proceeds received from litigation. Dividend income is recorded on the ex-dividend date, except for certain dividends from foreign securities where the ex-dividend date may have passed, which are recorded as soon as the Fund is informed of the ex-dividend date. Non-cash dividends included in dividend income, if any, are recorded at the fair market value of the securities received. Distributions received on securities that represent a return of capital or capital gain are recorded as a reduction of cost of investments and/or as a realized gain. The Fund estimates the components of distributions received that may be considered return of capital distributions or capital gain distributions. Interest income and distributions from the Fidelity Central Funds are accrued as earned. Interest income includes coupon interest and amortization of premium and accretion of discount on debt securities. Investment income is recorded net of foreign taxes withheld where recovery of such taxes is uncertain.
Expenses. Expenses directly attributable to a fund are charged to that fund. Expenses attributable to more than one fund are allocated among the respective funds on the basis of relative net assets or other appropriate methods. Expense estimates are accrued in the period to which they relate and adjustments are made when actual amounts are known.
Income Tax Information and Distributions to Shareholders. Each year, the Fund intends to qualify as a regulated investment company, including distributing substantially all of its taxable income and realized gains under Subchapter M of the Internal Revenue Code and filing its U.S. federal tax return. As a result, no provision for income taxes is required. As of July 31, 2011, the Fund did not have any unrecognized tax benefits in the financial statements. A fund's federal tax return is subject to examination by the Internal Revenue Service (IRS) for a period of three years. Foreign taxes are provided for based on the Fund's understanding of the tax rules and rates that exist in the foreign markets in which it invests.
Distributions are declared and recorded on the ex-dividend date. Income dividends and capital gain distributions are declared separately for each class. Income and capital gain distributions are determined in accordance with income tax regulations, which may differ from GAAP.
Capital accounts within the financial statements are adjusted for permanent book-tax differences. These adjustments have no impact on net assets or the results of operations. Temporary book-tax differences will reverse in a subsequent period.
Book-tax differences are primarily due to deferred trustees compensation, foreign currency transactions, capital loss carryforwards, expiring capital loss carryforwards and losses deferred due to wash sales and excise tax regulations.
The federal tax cost of investment securities and unrealized appreciation (depreciation) as of period end were as follows:
Gross unrealized appreciation | $ 10,454,055 |
Gross unrealized depreciation | (2,700,107) |
Net unrealized appreciation (depreciation) on securities and other investments | $ 7,753,948 |
| |
Tax Cost | $ 151,294,323 |
Annual Report
3. Significant Accounting Policies - continued
Income Tax Information and Distributions to Shareholders - continued
The tax-based components of distributable earnings as of period end were as follows:
Undistributed ordinary income | $ 1,305,344 |
Capital loss carryforward | $ (41,949,952) |
Net unrealized appreciation (depreciation) | $ 7,753,948 |
Under the recently enacted Regulated Investment Company Modernization Act of 2010 (the Act), the Fund will be permitted to carry forward capital losses incurred in taxable years beginning after December 22, 2010 for an unlimited period. However, any losses incurred during those future taxable years will be required to be utilized prior to any losses incurred in pre-enactment taxable years, which generally expire after eight years from when they are incurred. Additionally, post-enactment capital losses that are carried forward will retain their character as either short-term or long-term capital losses rather than being considered all short-term as under previous law. The Fund's first fiscal year end subject to the Act will be July 31, 2012.
The tax character of distributions paid was as follows:
| July 31, 2011 | July 31, 2010 |
Ordinary Income | $ 2,864,390 | $ 3,192,017 |
Short-Term Trading (Redemption) Fees. Shares held by investors in the Fund less than 30 days are subject to a redemption fee equal to .75% of the net asset value of shares redeemed. All redemption fees, which reduce the proceeds of the shareholder redemption, are retained by the Fund and accounted for as an addition to paid in capital.
New Accounting Pronouncement. In May 2011, the Financial Accounting Standards Board issued Accounting Standard Update No. 2011-04, Fair Value Measurement (Topic 820) - Amendments to Achieve Common Fair Value Measurement and Disclosure Requirements in U.S. GAAP and IFRSs. The update changes the wording used to describe the requirements in GAAP for measuring fair value and for disclosing information about fair value measurements. The update is effective during interim and annual periods beginning after December 15, 2011. Management is currently evaluating the impact of the update's adoption on the Fund's financial statement disclosures.
4. Purchases and Sales of Investments.
Purchases and sales of securities, other than short-term securities, aggregated $296,867,090 and $293,312,976, respectively.
5. Fees and Other Transactions with Affiliates.
Management Fee. FMR and its affiliates provide the Fund with investment management related services for which the Fund pays a monthly management fee. The management fee is the sum of an individual fund fee rate that is based on an annual rate of .30% of the Fund's average net assets and a group fee rate that averaged .26% during the period. The group fee rate is based upon the average net assets of all the mutual funds advised by FMR. The group fee rate decreases as assets under management increase and increases as assets under management decrease. For the period, the total annual management fee rate was .56% of the Fund's average net assets.
Distribution and Service Plan Fees. In accordance with Rule 12b-1 of the 1940 Act, the Fund has adopted separate Distribution and Service Plans for each class of shares. Certain classes pay Fidelity Distributors Corporation (FDC), an affiliate of FMR, separate Distribution and Service Fees, each of which is based on an annual percentage of each class' average net assets. In addition, FDC may pay financial intermediaries for selling shares of the Fund and providing shareholder support services. For the period, the Distribution and Service Fee rates, total fees and amounts retained by FDC were as follows:
| Distribution
Fee | Service
Fee | Total Fees | Retained
by FDC |
Class A | -% | .25% | $ 180,035 | $ 2,562 |
Class T | .25% | .25% | 175,580 | 1,064 |
Class B | .75% | .25% | 84,340 | 63,353 |
Class C | .75% | .25% | 241,277 | 33,336 |
| | | $ 681,232 | $ 100,315 |
Annual Report
Notes to Financial Statements - continued
5. Fees and Other Transactions with Affiliates - continued
Sales Load. FDC may receive a front-end sales charge of up to 5.75% for selling Class A shares, and 3.50% for selling Class T shares, some of which is paid to financial intermediaries for selling shares of the Fund. Depending on the holding period, FDC may receive contingent deferred sales charges levied on Class A, Class T, Class B, and Class C redemptions. The deferred sales charges range from 5% to 1% for Class B, 1% for Class C, 1.00% for certain purchases of Class A shares and .25% for certain purchases of Class T shares.
For the period, sales charge amounts retained by FDC were as follows:
| Retained
by FDC |
Class A | $ 29,950 |
Class T | 7,728 |
Class B* | 15,575 |
Class C* | 835 |
| $ 54,088 |
* When Class B and Class C shares are initially sold, FDC pays commissions from its own resources to financial intermediaries through which the sales are made.
Transfer Agent Fees. Fidelity Investments Institutional Operations Company, Inc. (FIIOC), an affiliate of FMR, is the transfer, dividend disbursing and shareholder servicing agent for each class of the Fund. FIIOC receives account fees and asset-based fees that vary according to the account size and type of account of the shareholders of the respective classes of the Fund. FIIOC pays for typesetting, printing and mailing of shareholder reports, except proxy statements. For the period, transfer agent fees for each class were as follows:
| Amount | % of
Average
Net Assets |
Class A | $ 217,350 | .30 |
Class T | 110,481 | .31 |
Class B | 25,521 | .30 |
Class C | 71,490 | .30 |
Institutional Class | 23,044 | .29 |
| $ 447,886 | |
Accounting and Security Lending Fees. Fidelity Service Company, Inc. (FSC), an affiliate of FMR, maintains the Fund's accounting records. The accounting fee is based on the level of average net assets for the month. Under a separate contract, FSC administers the security lending program. The security lending fee is based on the number and duration of lending transactions.
Brokerage Commissions. The Fund placed a portion of its portfolio transactions with brokerage firms which are affiliates of the investment adviser. The commissions paid to these affiliated firms were $8,095 for the period.
6. Committed Line of Credit.
The Fund participates with other funds managed by FMR or an affiliate in a $4.0 billion credit facility (the "line of credit") to be utilized for temporary or emergency purposes to fund shareholder redemptions or for other short-term liquidity purposes. The Fund has agreed to pay commitment fees on its pro-rata portion of the line of credit, which amounted to $488 and is reflected in Miscellaneous expenses on the Statement of Operations. During the period, there were no borrowings on this line of credit.
7. Security Lending.
The Fund lends portfolio securities through a lending agent from time to time in order to earn additional income. The lending agent may loan securities to certain qualified borrowers, including Fidelity Capital Markets (FCM), a broker-dealer affiliated with the Fund. On the settlement date of the loan, the Fund receives collateral (in the form of U.S. Treasury obligations, letters of credit and/or cash) against the loaned securities and maintains collateral in an amount not less than 100% of the market value of the loaned securities during the period of the loan. The market value of the loaned securities is determined at the close of business of the Fund and any additional required collateral is delivered to the Fund on the next business day. If the borrower defaults on its obligation to return the securities loaned because of insolvency or other reasons, a fund could experience delays and costs in recovering the securities loaned or in gaining access to the collateral. Any cash collateral received is invested in the Fidelity Securities Lending Cash Central Fund. At period end, there were no security loans outstanding. Security lending income represents the income earned on investing cash
Annual Report
7. Security Lending - continued
collateral, less rebates paid to borrowers and lending agent fees associated with the loan, plus any premium payments received for lending certain types of securities. Security lending income is presented in the Statement of Operations as a component of income from Fidelity Central Funds. Total security lending income during the period amounted to $7,142. During the period, there were no securities loaned to FCM.
8. Expense Reductions.
Many of the brokers with whom FMR places trades on behalf of the Fund provided services to the Fund in addition to trade execution. These services included payments of certain expenses on behalf of the Fund totaling $56,520 for the period.
9. Distributions to Shareholders.
Distributions to shareholders of each class were as follows:
Years ended July 31, | 2011 | 2010 |
From net investment income | | |
Class A | $ 1,536,373 | $ 1,700,301 |
Class T | 680,070 | 782,544 |
Class B | 128,700 | 184,067 |
Class C | 350,529 | 413,366 |
Institutional Class | 168,718 | 111,739 |
Total | $ 2,864,390 | $ 3,192,017 |
10. Share Transactions.
Transactions for each class of shares were as follows:
| Shares | Dollars |
Years ended July 31, | 2011 | 2010 | 2011 | 2010 |
Class A | | | | |
Shares sold | 951,835 | 582,593 | $ 17,339,635 | $ 9,269,210 |
Reinvestment of distributions | 78,008 | 96,455 | 1,339,641 | 1,532,370 |
Shares redeemed | (840,008) | (1,092,389) | (15,213,828) | (17,388,823) |
Net increase (decrease) | 189,835 | (413,341) | $ 3,465,448 | $ (6,587,243) |
Class T | | | | |
Shares sold | 251,762 | 214,231 | $ 4,579,718 | $ 3,421,542 |
Reinvestment of distributions | 37,445 | 46,549 | 644,378 | 741,068 |
Shares redeemed | (448,193) | (457,353) | (8,103,122) | (7,262,506) |
Net increase (decrease) | (158,986) | (196,573) | $ (2,879,026) | $ (3,099,896) |
Class B | | | | |
Shares sold | 39,073 | 89,148 | $ 679,580 | $ 1,411,608 |
Reinvestment of distributions | 6,858 | 10,582 | 116,904 | 167,069 |
Shares redeemed | (170,627) | (267,950) | (3,021,254) | (4,203,072) |
Net increase (decrease) | (124,696) | (168,220) | $ (2,224,770) | $ (2,624,395) |
Class C | | | | |
Shares sold | 405,545 | 188,570 | $ 7,271,889 | $ 2,992,972 |
Reinvestment of distributions | 15,668 | 20,486 | 265,763 | 322,145 |
Shares redeemed | (299,716) | (383,514) | (5,335,908) | (5,996,156) |
Net increase (decrease) | 121,497 | (174,458) | $ 2,201,744 | $ (2,681,039) |
Institutional Class | | | | |
Shares sold | 343,779 | 287,925 | $ 6,436,483 | $ 4,699,845 |
Reinvestment of distributions | 7,398 | 5,221 | 128,959 | 84,041 |
Shares redeemed | (175,049) | (188,687) | (3,230,206) | (3,029,537) |
Net increase (decrease) | 176,128 | 104,459 | $ 3,335,236 | $ 1,754,349 |
Annual Report
Notes to Financial Statements - continued
11. Other.
The Fund's organizational documents provide former and current trustees and officers with a limited indemnification against liabilities arising in connection with the performance of their duties to the Fund. In the normal course of business, the Fund may also enter into contracts that provide general indemnifications. The Fund's maximum exposure under these arrangements is unknown as this would be dependent on future claims that may be made against the Fund. The risk of material loss from such claims is considered remote.
Annual Report
Report of Independent Registered Public Accounting Firm
To the Trustees of Advisor Series VII and the Shareholders of Fidelity Advisor Biotechnology Fund, Fidelity Advisor Communications Equipment Fund, Fidelity Advisor Consumer Discretionary Fund, Fidelity Advisor Electronics Fund, Fidelity Advisor Energy Fund, Fidelity Advisor Financial Services Fund, Fidelity Advisor Health Care Fund, Fidelity Advisor Industrials Fund, Fidelity Advisor Technology Fund, and Fidelity Advisor Utilities Fund:
We have audited the accompanying statements of assets and liabilities of Fidelity Advisor Biotechnology Fund, Fidelity Advisor Communications Equipment Fund, Fidelity Advisor Consumer Discretionary Fund, Fidelity Advisor Electronics Fund, Fidelity Advisor Energy Fund, Fidelity Advisor Financial Services Fund, Fidelity Advisor Health Care Fund, Fidelity Advisor Industrials Fund, Fidelity Advisor Technology Fund, and Fidelity Advisor Utilities Fund (collectively, the "Funds"), including the schedules of investments, as of July 31, 2011, and the related statements of operations for the year then ended, the statements of changes in net assets for each of the two years in the period then ended, and the financial highlights for each of the five years in the period then ended. These financial statements and financial highlights are the responsibility of the Funds' management. Our responsibility is to express an opinion on these financial statements and financial highlights based on our audits.
We conducted our audits in accordance with the standards of the Public Company Accounting Oversight Board (United States). Those standards require that we plan and perform the audit to obtain reasonable assurance about whether the financial statements and financial highlights are free of material misstatement. The Funds are not required to have, nor were we engaged to perform, an audit of their internal control over financial reporting. Our audits included consideration of internal control over financial reporting as a basis for designing audit procedures that are appropriate in the circumstances, but not for the purpose of expressing an opinion on the effectiveness of the Funds' internal control over financial reporting. Accordingly, we express no such opinion. An audit also includes examining, on a test basis, evidence supporting the amounts and disclosures in the financial statements, assessing the accounting principles used and significant estimates made by management, as well as evaluating the overall financial statement presentation. Our procedures included confirmation of securities owned as of July 31, 2011, by correspondence with the custodians and brokers; where replies were not received from brokers, we performed other auditing procedures. We believe that our audits provide a reasonable basis for our opinion.
In our opinion, the financial statements and financial highlights referred to above present fairly, in all material respects, the financial position of Fidelity Advisor Biotechnology Fund, Fidelity Advisor Communications Equipment Fund, Fidelity Advisor Consumer Discretionary Fund, Fidelity Advisor Electronics Fund, Fidelity Advisor Energy Fund, Fidelity Advisor Financial Services Fund, Fidelity Advisor Health Care Fund, Fidelity Advisor Industrials Fund, Fidelity Advisor Technology Fund, and Fidelity Advisor Utilities Fund as of July 31, 2011, the results of their operations for the year then ended, the changes in their net assets for each of the two years in the period then ended, and the financial highlights for each of the five years in the period then ended, in conformity with accounting principles generally accepted in the United States of America.
/s/ Deloitte & Touche LLP
DELOITTE & TOUCHE LLP
Boston, Massachusetts
September 19, 2011
Annual Report
The Trustees, Members of the Advisory Board, and executive officers of the trust and funds, as applicable, are listed below. The Board of Trustees governs each fund and is responsible for protecting the interests of shareholders. The Trustees are experienced executives who meet periodically throughout the year to oversee each fund's activities, review contractual arrangements with companies that provide services to each fund, oversee management of the risks associated with such activities and contractual arrangements, and review each fund's performance. Except for James C. Curvey, each of the Trustees oversees 221 funds advised by FMR or an affiliate. Mr. Curvey oversees 419 funds advised by FMR or an affiliate.
The Trustees hold office without limit in time except that (a) any Trustee may resign; (b) any Trustee may be removed by written instrument, signed by at least two-thirds of the number of Trustees prior to such removal; (c) any Trustee who requests to be retired or who has become incapacitated by illness or injury may be retired by written instrument signed by a majority of the other Trustees; and (d) any Trustee may be removed at any special meeting of shareholders by a two-thirds vote of the outstanding voting securities of the trust. Each Trustee who is not an interested person (as defined in the 1940 Act) (Independent Trustee), shall retire not later than the last day of the calendar year in which his or her 75th birthday occurs. The Independent Trustees may waive this mandatory retirement age policy with respect to individual Trustees. The executive officers and Advisory Board Members hold office without limit in time, except that any officer and Advisory Board Member may resign or may be removed by a vote of a majority of the Trustees at any regular meeting or any special meeting of the Trustees. Except as indicated, each individual has held the office shown or other offices in the same company for the past five years.
Experience, Skills, Attributes, and Qualifications of the Funds' Trustees. The Governance and Nominating Committee has adopted a statement of policy that describes the experience, qualifications, attributes, and skills that are necessary and desirable for potential Independent Trustee candidates (Statement of Policy). The Board believes that each Trustee satisfied at the time he or she was initially elected or appointed a Trustee, and continues to satisfy, the standards contemplated by the Statement of Policy. The Governance and Nominating Committee also engages professional search firms to help identify potential Independent Trustee candidates who have the experience, qualifications, attributes, and skills consistent with the Statement of Policy. From time to time, additional criteria based on the composition and skills of the current Independent Trustees, as well as experience or skills that may be appropriate in light of future changes to board composition, business conditions, and regulatory or other developments, have also been considered by the professional search firms and the Governance and Nominating Committee. In addition, the Board takes into account the Trustees' commitment and participation in Board and committee meetings, as well as their leadership of standing and ad hoc committees throughout their tenure.
In determining that a particular Trustee was and continues to be qualified to serve as a Trustee, the Board has considered a variety of criteria, none of which, in isolation, was controlling. The Board believes that, collectively, the Trustees have balanced and diverse experience, qualifications, attributes, and skills, which allow the Board to operate effectively in governing each fund and protecting the interests of shareholders. Information about the specific experience, skills, attributes, and qualifications of each Trustee, which in each case led to the Board's conclusion that the Trustee should serve (or continue to serve) as a trustee of the funds, is provided below.
Board Structure and Oversight Function. James C. Curvey is an interested person (as defined in the 1940 Act) and currently serves as Acting Chairman. The Trustees have determined that an interested Chairman is appropriate and benefits shareholders because an interested Chairman has a personal and professional stake in the quality and continuity of services provided to the funds. Independent Trustees exercise their informed business judgment to appoint an individual of their choosing to serve as Chairman, regardless of whether the Trustee happens to be independent or a member of management. The Independent Trustees have determined that they can act independently and effectively without having an Independent Trustee serve as Chairman and that a key structural component for assuring that they are in a position to do so is for the Independent Trustees to constitute a substantial majority for the Board. The Independent Trustees also regularly meet in executive session. Ned C. Lautenbach serves as Chairman of the Independent Trustees and as such (i) acts as a liaison between the Independent Trustees and management with respect to matters important to the Independent Trustees and (ii) with management prepares agendas for Board meetings.
Fidelity funds are overseen by different Boards of Trustees. The funds' Board oversees Fidelity's equity and high income funds and another Board oversees Fidelity's investment-grade bond, money market, and asset allocation funds. The asset allocation funds may invest in Fidelity funds overseen by the funds' Board. The use of separate Boards, each with its own committee structure, allows the Trustees of each group of Fidelity funds to focus on the unique issues of the funds they oversee, including common research, investment, and operational issues. On occasion, the separate Boards establish joint committees to address issues of overlapping consequences for the Fidelity funds overseen by each Board.
The Trustees operate using a system of committees to facilitate the timely and efficient consideration of all matters of importance to the Trustees, each fund, and fund shareholders and to facilitate compliance with legal and regulatory requirements and oversight of the funds' activities and associated risks. The Board, acting through its committees, has charged FMR and its affiliates with (i) identifying events or circumstances the occurrence of which could have demonstrably adverse effects on the funds' business and/or reputation; (ii) implementing processes and controls to lessen the possibility that such events or circumstances occur or to mitigate the effects of such events or circumstances if they do occur; and (iii) creating and maintaining a system designed to evaluate continuously business and market conditions in order to facilitate the identification and implementation processes described in (i) and (ii) above. Because the day-to-day operations and activities of the funds are carried out by or through FMR, its affiliates and other service providers, the funds' exposure to risks is mitigated but not eliminated by the processes overseen by the Trustees. While each of the Board's committees has responsibility for overseeing different aspects of the funds' activities, oversight is exercised primarily through the Operations, Audit, and Compliance Committees. Appropriate personnel, including but not limited to the funds' Chief Compliance Officer (CCO), FMR's internal auditor, the independent accountants, the funds' Treasurer and portfolio management personnel, make periodic reports to the Board's committees, as appropriate. The responsibilities of each committee, including their oversight responsibilities, are described further under "Standing Committees of the Funds' Trustees."
Annual Report
Trustees and Officers - continued
The fund's Statement of Additional Information (SAI) includes more information about the Trustees. To request a free copy, call Fidelity at 1-800-208-0098.
Interested Trustees*:
Correspondence intended for each Trustee who is an interested person may be sent to Fidelity Investments, 82 Devonshire Street, Boston, Massachusetts 02109.
Name, Age; Principal Occupations and Other Relevant Experience+ |
James C. Curvey (76) |
| Year of Election or Appointment: 2007
Mr. Curvey is Trustee and Acting Chairman of the Board of Trustees of certain Trusts. Mr. Curvey also serves as Trustee (2007-present) of other investment companies advised by FMR. Mr. Curvey is a Director of Fidelity Investments Money Management, Inc. (2009-present), Director of Fidelity Research & Analysis Co. (2009-present) and Director of FMR and FMR Co., Inc. (2007-present). Mr. Curvey is also Vice Chairman (2007-present) and Director of FMR LLC. In addition, Mr. Curvey serves as an Overseer for the Boston Symphony Orchestra and a member of the Trustees of Villanova University. Previously, Mr. Curvey was the Vice Chairman (2006-2007) and Director (2000-2007) of FMR Corp. |
Ronald P. O'Hanley (54) |
| Year of Election or Appointment: 2011
Mr. O'Hanley is Director of FMR Co., Inc. (2010-present), Director of Fidelity Investments Money Management, Inc. (2010-present), Director of Fidelity Research & Analysis Company (2010-present), President of Fidelity Asset Management and Corporate Services and a member of Fidelity's Executive Committee (2010-present). Previously, Mr. O'Hanley served as President and Chief Executive Officer of BNY Mellon Asset Management (2007-2010). Mr. O'Hanley also served as Vice Chairman of Bank New York Mellon Corp. and a member of that firm's Executive Committee. Prior to the 2007 merger of The Bank of New York and Mellon Financial Corporation, he was Vice Chairman of Mellon Financial Corporation and President and Chief Executive Officer of Mellon Asset Management. He joined Mellon in February 1997. Mr. O'Hanley currently serves as Chairman of the Boston Public Library Foundation Board of Directors and sits on the Board of Directors of Beth Israel Deaconess Medical Center, the Board of Trustees of the Marine Biological Laboratory and the Advisory Board of the Maxwell School of Citizenship and Public Administration at Syracuse University. Mr. O'Hanley also chairs the Council on Asset Management for the Financial Services Roundtable and is a member of the Board of Directors of Institutional Investor's U.S. Institute. |
* Trustees have been determined to be "Interested Trustees" by virtue of, among other things, their affiliation with the trust or various entities under common control with FMR.
+ The information above includes each Trustee's principal occupation during the last five years and other information relating to the experience, attributes, and skills relevant to each Trustee's qualifications to serve as a Trustee, which led to the conclusion that each Trustee should serve as a Trustee for each fund.
Independent Trustees:
Correspondence intended for each Independent Trustee (that is, the Trustees other than the Interested Trustees) may be sent to Fidelity Investments, P.O. Box 55235, Boston, Massachusetts 02205-5235.
Name, Age; Principal Occupations and Other Relevant Experience+ |
Dennis J. Dirks (63) |
| Year of Election or Appointment: 2005 Prior to his retirement in May 2003, Mr. Dirks was Chief Operating Officer and a member of the Board of The Depository Trust & Clearing Corporation (DTCC). He also served as President, Chief Operating Officer, and Board member of The Depository Trust Company (DTC) and President and Board member of the National Securities Clearing Corporation (NSCC). In addition, Mr. Dirks served as Chief Executive Officer and Board member of the Government Securities Clearing Corporation, Chief Executive Officer and Board member of the Mortgage-Backed Securities Clearing Corporation, as a Trustee and a member of the Finance Committee of Manhattan College (2005-2008), and as a Trustee and a member of the Finance Committee of AHRC of Nassau County (2006-2008). Mr. Dirks is a member of the Independent Directors Council (IDC) Governing Council (2010-Present) and Board of Directors for The Brookville Center for Children's Services, Inc. (2009-present). |
Alan J. Lacy (57) |
| Year of Election or Appointment: 2008 Mr. Lacy serves as Senior Adviser (2007-present) of Oak Hill Capital Partners, L.P. (private equity). Mr. Lacy also served as Chief Executive Officer (2000-2005) and Vice Chairman (2005-2006) of Sears Holdings Corporation and Sears, Roebuck and Co. (retail). In addition, Mr. Lacy serves as a member of the Board of Directors of Dave & Buster's, Inc. (restaurant and entertainment complexes, 2010-present), The Hillman Companies, Inc. (hardware wholesalers, 2010-present), and Bristol-Myers Squibb Company (global pharmaceuticals, 2007-present). Mr. Lacy is a member of the Board of Trustees of The National Parks Conservation Association (2006-Present). Previously, Mr. Lacy served as Chairman of the Board of Trustees of the National Parks Conservation Association (2008-2011) and as a member of the Board of Directors for the Western Union Company (global money transfer, 2006-2011). |
Ned C. Lautenbach (67) |
| Year of Election or Appointment: 2000 Mr. Lautenbach is Chairman of the Independent Trustees of the Equity and High Income Funds (2006-present). Mr. Lautenbach currently serves as the Lead Director of the Eaton Corporation Board of Directors (diversified industrial, 1997-present). Mr. Lautenbach is also a member of the Board of Directors of the Philharmonic Center for the Arts in Naples, Florida (1999-present); a member of the Board of Trustees of Fairfield University (2005-present); and a member of the Council on Foreign Relations (1994-present). Previously, Mr. Lautenbach was a Partner/Advisory Partner at Clayton, Dubilier & Rice, LLC (private equity investment, 1998-2010), as well as a Director of Sony Corporation (2006-2007). |
Joseph Mauriello (66) |
| Year of Election or Appointment: 2008 Prior to his retirement in January 2006, Mr. Mauriello served in numerous senior management positions including Deputy Chairman and Chief Operating Officer (2004-2005), and Vice Chairman of Financial Services (2002-2004) of KPMG LLP US (professional services, 1965-2005). Mr. Mauriello currently serves as a member of the Board of Directors of XL Group plc. (global insurance and re-insurance, 2006-present) and of Arcadia Resources Inc. (health care services and products, 2007-present). Previously, Mr. Mauriello served as a Director of the Hamilton Funds of the Bank of New York (2006-2007). |
Robert W. Selander (60) |
| Year of Election or Appointment: 2011 Previously, Mr. Selander served as a Member of the Advisory Board of Fidelity's Equity and High Income Funds (2011), Executive Vice Chairman (2010), Chief Executive Officer (2009-2010), and President and Chief Executive Officer (1997-2009) of Mastercard, Inc. |
Cornelia M. Small (67) |
| Year of Election or Appointment: 2005 Ms. Small is a member of the Board of Directors of the Teagle Foundation (2009-present). Ms. Small is also a member of the Investment Committee, and Chair (2008-present) and a member of the Board of Trustees of Smith College. In addition, Ms. Small serves on the Investment Committee of the Berkshire Taconic Community Foundation (2008-present). Previously, Ms. Small served as Chairperson of the Investment Committee (2002-2008) of Smith College. In addition, Ms. Small served as Chief Investment Officer, Director of Global Equity Investments, and a member of the Board of Directors of Scudder, Stevens & Clark and Scudder Kemper Investments. |
William S. Stavropoulos (72) |
| Year of Election or Appointment: 2001 Mr. Stavropoulos is Vice Chairman of the Independent Trustees of the Equity and High Income Funds (2006-present). Mr. Stavropoulos serves as President and Founder of the Michigan Baseball Foundation, the Great Lakes Loons (2007-present). Mr. Stavropoulos is Chairman Emeritus of the Board of Directors of The Dow Chemical Company, where he previously served in numerous senior management positions, including President, CEO (1995-2000; 2002-2004), Chairman of the Executive Committee (2000-2006), and as a member of the Board of Directors (1990-2006). Currently, Mr. Stavropoulos is Chairman of Univar (global distributor of commodity and specialty chemicals, 2010-present), a Director of Teradata Corporation (data warehousing and technology solutions, 2008-present), Chemical Financial Corporation, Maersk Inc. (industrial conglomerate), Tyco International, Inc. (multinational manufacturing and services, 2007-present), and a member of the Advisory Board for Metalmark Capital (private equity investment, 2005-present). Mr. Stavropoulos is a special advisor to Clayton, Dubilier & Rice, LLC (private equity investment). In addition, Mr. Stavropoulos is a member of the University of Notre Dame Advisory Council for the College of Science. |
David M. Thomas (62) |
| Year of Election or Appointment: 2008 Previously, Mr. Thomas served as Executive Chairman (2005-2006) and Chairman and Chief Executive Officer (2000-2005) of IMS Health, Inc. (pharmaceutical and healthcare information solutions). In addition, Mr. Thomas serves as a member of the Board of Directors of Fortune Brands, Inc. (consumer products), and Interpublic Group of Companies, Inc. (marketing communication, 2004-present). |
Michael E. Wiley (60) |
| Year of Election or Appointment: 2008 Mr. Wiley also serves as a Director of Asia Pacific Exploration Consolidated (international oil and gas exploration and production, 2008-present). Mr. Wiley serves as a Director of Tesoro Corporation (independent oil refiner and marketer, 2005-present), and a Director of Bill Barrett Corporation (exploration and production, 2005-present). In addition, Mr. Wiley also serves as a Director of Post Oak Bank (privately-held bank, 2004-present). Previously, Mr. Wiley served as a member of the Board of Trustees of the University of Tulsa (2000-2006; 2007-2010), as a Senior Energy Advisor of Katzenbach Partners, LLC (consulting, 2006-2007), as an Advisory Director of Riverstone Holdings (private investment), Chairman, President, and CEO of Baker Hughes, Inc. (oilfield services, 2000-2004), and as Director of Spinnaker Exploration Company (exploration and production, 2001-2005). |
+ The information above includes each Trustee's principal occupation during the last five years and other information relating to the experience, attributes, and skills relevant to each Trustee's qualifications to serve as a Trustee, which led to the conclusion that each Trustee should serve as a Trustee for each fund.
Advisory Board Members and Executive Officers:
Correspondence intended for each executive officer, Edward C. Johnson 3d, and Peter S. Lynch may be sent to Fidelity Investments, 82 Devonshire Street, Boston, Massachusetts 02109.
Name, Age; Principal Occupation |
Edward C. Johnson 3d (81) |
| Year of Election or Appointment: 2011 Member of the Advisory Board of Fidelity's Equity and High Income Funds. Mr. Johnson serves as Chief Executive Officer, Chairman, and a Director of FMR LLC, and also serves as Chairman and Director of FIL Limited. Previously, Mr. Johnson served as a Trustee and Chairman of the Board of certain Fidelity Trusts, Chairman and a Director of FMR, Chairman and a Director of FMR Co., Inc., and President of FMR LLC (2006-2007). |
Peter S. Lynch (67) |
| Year of Election or Appointment: 2003 Member of the Advisory Board of Fidelity's Equity and High Income Funds. Mr. Lynch is Vice Chairman and a Director of FMR and FMR Co., Inc. In addition, Mr. Lynch serves as a Trustee of Boston College and as the Chairman of the Inner-City Scholarship Fund. Previously, Mr. Lynch served on the Special Olympics International Board of Directors (1997-2006). |
Kenneth B. Robins (41) |
| Year of Election or Appointment: 2008 President and Treasurer of Fidelity's Equity and High Income Funds. Mr. Robins also serves as President and Treasurer (2010-present) and Assistant Treasurer (2009-present) of other Fidelity funds and is an employee of Fidelity Investments (2004-present). Previously, Mr. Robins served as Deputy Treasurer of the Fidelity funds (2005-2008) and Treasurer and Chief Financial Officer of The North Carolina Capital Management Trust: Cash and Term Portfolios (2006-2008). |
Brian B. Hogan (46) |
| Year of Election or Appointment: 2009 Vice President of Equity and High Income Funds. Mr. Hogan also serves as President of FMR's Equity Division (2009-present). Previously, Mr. Hogan served as Senior Vice President, Equity Research of FMR (2006-2009) and as a portfolio manager. |
Christopher S. Bartel (39) |
| Year of Election or Appointment: 2009 Vice President of Fidelity's Sector and Real Estate Equity Funds. Mr. Bartel also serves as Senior Vice President of Equity Research (2009-present). Previously, Mr. Bartel served as Managing Director of Research (2006-2009) and an analyst and portfolio manager (2000-2006). |
Scott C. Goebel (43) |
| Year of Election or Appointment: 2008 Secretary and Chief Legal Officer (CLO) of the Fidelity funds. Mr. Goebel also serves as Secretary of Fidelity Investments Money Management, Inc. (FIMM) (2010-present) and Fidelity Research and Analysis Company (FRAC) (2010-present); Secretary and CLO of The North Carolina Capital Management Trust: Cash and Term Portfolios (2008-present); General Counsel, Secretary, and Senior Vice President of FMR (2008-present) and FMR Co., Inc. (2008-present); employed by FMR LLC or an affiliate (2001-present); Chief Legal Officer of Fidelity Management & Research (Hong Kong) Limited (2008-present) and Assistant Secretary of Fidelity Management & Research (Japan) Inc. (2008-present), and Fidelity Management & Research (U.K.) Inc. (2008-present). Previously, Mr. Goebel served as Assistant Secretary of FIMM (2008-2010), FRAC (2008-2010), and the Funds (2007-2008) and as Vice President and Secretary of Fidelity Distributors Corporation (FDC) (2005-2007). |
William C. Coffey (42) |
| Year of Election or Appointment: 2009 Assistant Secretary of Fidelity's Equity and High Income Funds. Mr. Coffey also serves as Senior Vice President and Deputy General Counsel of FMR LLC (2010-present), and is an employee of Fidelity Investments. Previously, Mr. Coffey served as Vice President and Associate General Counsel of FMR LLC (2005-2009). |
Holly C. Laurent (57) |
| Year of Election or Appointment: 2008 Anti-Money Laundering (AML) Officer of the Fidelity funds. Ms. Laurent also serves as AML Officer of The North Carolina Capital Management Trust: Cash and Term Portfolios (2008-present) and is an employee of Fidelity Investments. Previously, Ms. Laurent was Senior Vice President and Head of Legal for Fidelity Business Services India Pvt. Ltd. (2006-2008), and Senior Vice President, Deputy General Counsel and Group Head for FMR LLC (2005-2006). |
Christine Reynolds (52) |
| Year of Election or Appointment: 2008 Chief Financial Officer of the Fidelity funds. Ms. Reynolds became President of Fidelity Pricing and Cash Management Services (FPCMS) in August 2008. Ms. Reynolds served as Chief Operating Officer of FPCMS (2007-2008). Previously, Ms. Reynolds served as President, Treasurer, and Anti-Money Laundering officer of the Fidelity funds (2004-2007). |
Kenneth A. Rathgeber (64) |
| Year of Election or Appointment: 2004 Chief Compliance Officer of Fidelity's Equity and High Income Funds. Mr. Rathgeber is Chief Compliance Officer of Fidelity Management & Research (Hong Kong) Limited (2008-present), Fidelity Management & Research (Japan) Inc. (2008-present), FMR (2005-present), FMR Co., Inc. (2005-present), Fidelity Management & Research (U.K.) Inc. (2005-present), Fidelity Research & Analysis Company (2005-present), Fidelity Investments Money Management, Inc. (2005-present), Pyramis Global Advisors, LLC (2005-present), and Strategic Advisers, Inc. (2005-present). |
Jeffrey S. Christian (49) |
| Year of Election or Appointment: 2009 Deputy Treasurer of the Fidelity funds. Mr. Christian is an employee of Fidelity Investments. Previously, Mr. Christian served as Chief Financial Officer (2008-2009) of certain Fidelity funds and Senior Vice President of Fidelity Pricing and Cash Management Services (FPCMS) (2004-2009). |
Bryan A. Mehrmann (50) |
| Year of Election or Appointment: 2005 Deputy Treasurer of the Fidelity funds. Mr. Mehrmann is an employee of Fidelity Investments. |
Adrien E. Deberghes (43) |
| Year of Election or Appointment: 2008 Deputy Treasurer of Fidelity's Equity and High Income Funds. Mr. Deberghes also serves as Vice President and Assistant Treasurer of Fidelity Rutland Square Trust II and Fidelity Commonwealth Trust II (2011-present), Assistant Treasurer of other Fidelity funds (2010-present), and is an employee of Fidelity Investments (2008-present). Previously, Mr. Deberghes served as Senior Vice President of Mutual Fund Administration at State Street Corporation (2007-2008), Senior Director of Mutual Fund Administration at Investors Bank & Trust (2005-2007), and Director of Finance for Dunkin' Brands (2000-2005). |
Stephanie J. Dorsey (42) |
| Year of Election or Appointment: 2010 Assistant Treasurer of Fidelity's Equity and High Income Funds. Ms. Dorsey also serves as Deputy Treasurer of other Fidelity funds (2008-present) and is an employee of Fidelity Investments (2008-present). Previously, Ms. Dorsey served as Treasurer (2004-2008) of the JPMorgan Mutual Funds and Vice President (2004-2008) of JPMorgan Chase Bank. |
John R. Hebble (53) |
| Year of Election or Appointment: 2009 Assistant Treasurer of Fidelity's Equity and High Income Funds. Mr. Hebble also serves as President (2011-present), Treasurer, and Chief Financial Officer of The North Carolina Capital Management Trust: Cash and Term Portfolios (2008-present), President and Treasurer of other Fidelity funds (2008-present) and is an employee of Fidelity Investments. |
Gary W. Ryan (52) |
| Year of Election or Appointment: 2005 Assistant Treasurer of the Fidelity funds. Mr. Ryan is an employee of Fidelity Investments. Previously, Mr. Ryan served as Vice President of Fund Reporting in Fidelity Pricing and Cash Management Services (FPCMS) (1999-2005). |
Jonathan Davis (43) |
| Year of Election or Appointment: 2010 Assistant Treasurer of the Fidelity funds. Mr. Davis is an employee of Fidelity Investments. Previously, Mr. Davis served as Vice President and Associate General Counsel of FMR LLC (2003-2010). |
Annual Report
The Board of Trustees of each fund voted to pay to shareholders of record at the opening of business on record date the following distributions per share derived from capital gains realized from sales of portfolio securities and dividends derived from net investment income:
| Pay Date | Record Date | Dividends | Capital Gains |
Fidelity Advisor Communications Equipment Fund | | | | |
Class A | 09/12/11 | 09/09/11 | $0.00 | $0.199 |
Class T | 09/12/11 | 09/09/11 | $0.00 | $0.199 |
Class B | 09/12/11 | 09/09/11 | $0.00 | $0.199 |
Class C | 09/12/11 | 09/09/11 | $0.00 | $0.199 |
Fidelity Advisor Consumer Discretionary Fund | | | | |
Class A | 09/12/11 | 09/09/11 | $0.00 | $0.831 |
Class T | 09/12/11 | 09/09/11 | $0.00 | $0.831 |
Class B | 09/12/11 | 09/09/11 | $0.00 | $0.831 |
Class C | 09/12/11 | 09/09/11 | $0.00 | $0.831 |
Fidelity Advisor Health Care Fund | | | | |
Class A | 09/12/11 | 09/09/11 | $0.00 | $2.565 |
Class T | 09/12/11 | 09/09/11 | $0.00 | $2.565 |
Class B | 09/12/11 | 09/09/11 | $0.00 | $2.565 |
Class C | 09/12/11 | 09/09/11 | $0.00 | $2.565 |
Fidelity Advisor Industrials Fund | | | | |
Class A | 09/12/11 | 09/09/11 | $0.021 | $0.252 |
Class T | 09/12/11 | 09/09/11 | $0.00 | $0.252 |
Class B | 09/12/11 | 09/09/11 | $0.00 | $0.252 |
Class C | 09/12/11 | 09/09/11 | $0.00 | $0.252 |
Fidelity Advisor Utilities Fund | | | | |
Class A | 09/12/11 | 09/09/11 | $0.178 | $0.00 |
Class T | 09/12/11 | 09/09/11 | $0.147 | $0.00 |
Class B | 09/12/11 | 09/09/11 | $0.084 | $0.00 |
Class C | 09/12/11 | 09/09/11 | $0.107 | $0.00 |
The funds hereby designate as capital gain dividend the amounts noted below for the taxable year ended July 31, 2011, or, if subsequently determined to be different, the net capital gain of such year.
Fidelity Advisor Communications Equipment Fund | $399,014 |
Fidelity Advisor Consumer Discretionary Fund | $2,778,143 |
Fidelity Advisor Health Care Fund | $49,894,902 |
Fidelity Advisor Industrials Fund | $4,316,295 |
A percentage of the dividends distributed during the fiscal year for the following funds qualify for the dividends-received deduction for corporate shareholders:
| September 2010 | December 2010 |
Fidelity Advisor Energy Fund | | |
Class A | 0% | 100% |
Class T | 0% | 100% |
Class B | 0% | 100% |
Class C | 0% | 100% |
Fidelity Advisor Industrials Fund | | |
Class A | 0% | 100% |
Class T | 0% | 100% |
Class B | 0% | 0% |
Class C | 0% | 0% |
| September 2010 | December 2010 |
Fidelity Advisor Utilities Fund | | |
Class A | 100% | 100% |
Class T | 100% | 100% |
Class B | 100% | 100% |
Class C | 100% | 100% |
A percentage of the dividends distributed during the fiscal year for the following funds may be taken into account as a dividend for purposes of the maximum rate under section 1(h)(11) of the Internal Revenue Code.
| September 2010 | December 2010 |
Fidelity Advisor Energy Fund | | |
Class A | 0% | 100% |
Class T | 0% | 100% |
Class B | 0% | 100% |
Class C | 0% | 100% |
Fidelity Advisor Industrials Fund | | |
Class A | 0% | 100% |
Class T | 0% | 100% |
Class B | 0% | 0% |
Class C | 0% | 0% |
Fidelity Advisor Utilities Fund | | |
Class A | 100% | 100% |
Class T | 100% | 100% |
Class B | 100% | 100% |
Class C | 100% | 100% |
The funds will notify shareholders in January 2012 of amounts for use in preparing 2011 income tax returns.
Annual Report
Board Approval of Investment Advisory Contracts and Management Fees
Fidelity Advisor Focus Funds
Each year, the Board of Trustees, including the Independent Trustees (together, the Board), votes on the renewal of the management contract and sub-advisory agreements (together, the Advisory Contracts) for each fund. The Board, assisted by the advice of fund counsel and Independent Trustees' counsel, requests and considers a broad range of information relevant to the renewal of the Advisory Contracts throughout the year.
The Board meets regularly and considers at each of its meetings factors that are relevant to its annual consideration of the renewal of each fund's Advisory Contracts, including the services and support provided to each fund and its shareholders. The Board has established various standing committees, each composed of Independent Trustees with varying backgrounds, to which the Board has assigned specific subject matter responsibilities in order to enhance effective decision-making by the Board. The Board, acting directly and through its Committees, requests and receives information concerning the annual consideration of the renewal of each fund's Advisory Contracts. The Board also meets as needed to consider matters specifically related to the Board's annual consideration of the renewal of Advisory Contracts. Members of the Board may also meet with trustees of other Fidelity funds through ad hoc joint committees to discuss certain matters relevant to the Fidelity funds.
At its July 2011 meeting, the Board of Trustees, including the Independent Trustees, unanimously determined to renew each fund's Advisory Contracts. In reaching its determination, the Board considered all factors it believed relevant, including (i) the nature, extent, and quality of the services to be provided to each fund and its shareholders (including the investment performance of each fund); (ii) the competitiveness of each fund's management fee and total expense ratio; (iii) the total costs of the services to be provided by and the profits to be realized by Fidelity from its relationship with each fund; (iv) the extent to which economies of scale would be realized as each fund grows; and (v) whether fee levels reflect these economies of scale, if any, for the benefit of fund shareholders.
In considering whether to renew the Advisory Contracts for each fund, the Board reached a determination, with the assistance of fund counsel and Independent Trustees' counsel and through the exercise of its business judgment, that the renewal of the Advisory Contracts is in the best interests of each fund and its shareholders and that the compensation payable under the Advisory Contracts is fair and reasonable. The Board's decision to renew the Advisory Contracts was not based on any single factor, but rather was based on a comprehensive consideration of all the information provided to the Board at its meetings throughout the year. The Board, in reaching its determination to renew the Advisory Contracts, is aware that shareholders in each fund have a broad range of investment choices available to them, including a wide choice among mutual funds offered by Fidelity's competitors, and that each fund's shareholders, who have the opportunity to review and weigh the disclosure provided by the fund in its prospectus and other public disclosures, have chosen to invest in that fund, managed by Fidelity.
Nature, Extent, and Quality of Services Provided. The Board considered the staffing within the investment adviser, FMR, and the sub-advisers (together, the Investment Advisers), including the backgrounds of the funds' investment personnel and the funds' investment objectives and disciplines. The Independent Trustees also had discussions with senior management of Fidelity's investment operations and investment groups. The Board considered the structure of the portfolio manager compensation program and whether this structure provides appropriate incentives to act in the best interests of each fund.
Resources Dedicated to Investment Management and Support Services. The Board and the Fund Oversight and Research Committees reviewed the general qualifications and capabilities of the Investment Advisers' investment staff, including its size, education, experience, and resources, as well as the Investment Advisers' approach to recruiting, training, managing, and compensating investment personnel. The Board also noted that FMR has devoted increased resources to non-U.S. offices. The Board noted that Fidelity's analysts have extensive resources, tools and capabilities which allow them to conduct sophisticated quantitative and fundamental analysis, as well as credit analysis of issuers, counterparties and enhancers. The Board also believes that Fidelity's investment professionals have sufficient access to global information and data so as to provide competitive investment results over time, and that those professionals also have access to sophisticated tools which permit them to assess portfolio construction and risk and performance attribution characteristics continuously, as well as to transmit new information and research conclusions rapidly around the world. Additionally, in their deliberations, the Board considered the Investment Advisers' trading capabilities and resources which are an integral part of the investment management process.
Shareholder and Administrative Services. The Board considered (i) the nature, extent, quality, and cost of advisory, administrative, and shareholder services performed by the Investment Advisers and their affiliates under the Advisory Contracts and under separate agreements covering transfer agency, pricing and bookkeeping, and securities lending services for each fund; (ii) the nature and extent of the investment adviser's supervision of third party service providers, principally custodians and subcustodians; and (iii) the resources devoted to, and the record of compliance with, each fund's compliance policies and procedures. The Board also reviewed the allocation of fund brokerage, including allocations to brokers affiliated with the Investment Advisers, the use of brokerage commissions to pay fund expenses, and the use of "soft" commission dollars to pay for research services.
The Board noted that the growth of fund assets over time across the complex allows Fidelity to reinvest in the development of services designed to enhance the value or convenience of the Fidelity funds as investment vehicles. These services include 24-hour access to account information and market information through telephone representatives and over the Internet, investor education materials and asset allocation tools, and the expanded availability of Fidelity Investor Centers, with 35 new branches opening since 2010.
Annual Report
Board Approval of Investment Advisory Contracts and Management Fees - continued
Investment in a Large Fund Family. The Board considered the benefits to shareholders of investing in a Fidelity fund, including the benefits of investing in a fund that is part of a large family of funds offering a variety of investment disciplines and providing a large variety of mutual fund investor services. The Board noted that Fidelity had taken, or had made recommendations that resulted in the Fidelity funds taking, a number of actions over the previous year that benefited particular funds, including (i) continuing to dedicate additional resources to investment research and support of the senior management team that oversees asset management; (ii) rationalizing product lines through the mergers of six funds into other funds; (iii) continuing to migrate the Freedom Funds to dedicated lower cost underlying funds; (iv) obtaining shareholder approval to broaden the investment strategies for Fidelity Consumer Finance Portfolio, Fidelity Emerging Asia Fund, and Fidelity Environment and Alternative Energy Portfolio; (v) contractually agreeing to reduce the management fees and impose other expense limitations on Spartan 500 Index Fund and U.S. Bond Index Fund in connection with launching new institutional classes of these funds; (vi) changing the name, primary and supplemental benchmarks, and investment policies of Fidelity Global Strategies Fund to support the fund's flexible investment mandate and global orientation; and (vii) reducing the transfer agency account fee rates on certain accounts.
Investment Performance. The Board considered whether each fund has operated in accordance with its investment objective, as well as its record of compliance with its investment restrictions. It also reviewed each fund's absolute investment performance for each class, as well as each fund's relative investment performance for each class measured over multiple periods against a third-party-sponsored index that reflects the market sector in which the fund invests. The Board noted that FMR does not believe that a meaningful peer group exists against which to compare any of the funds' performance.
For each of Advisor Communications Equipment, Advisor Consumer Discretionary, Advisor Electronics, Advisor Energy, Advisor Financial Services, Advisor Health Care, Advisor Industrials, and Advisor Utilities, the following charts considered by the Board show, over the one-, three-, and five-year periods ended December 31, 2010, the cumulative total returns of Institutional Class (Class I) and Class B of the fund and the cumulative total returns of a third-party-sponsored index ("benchmark"). The returns of Institutional Class (Class I) and Class B show the performance of the highest and lowest performing classes, respectively (based on five-year performance).
For each of Advisor Biotechnology and Advisor Technology, the following charts considered by the Board show, over the one-, three-, and five-year periods ended December 31, 2010, the cumulative total returns of Institutional Class (Class I) and Class C of the fund and the cumulative total returns of a third-party-sponsored index ("benchmark"). The returns of Institutional Class (Class I) and Class C show the performance of the highest and lowest performing classes, respectively (based on five-year performance).
Fidelity Advisor Biotechnology Fund
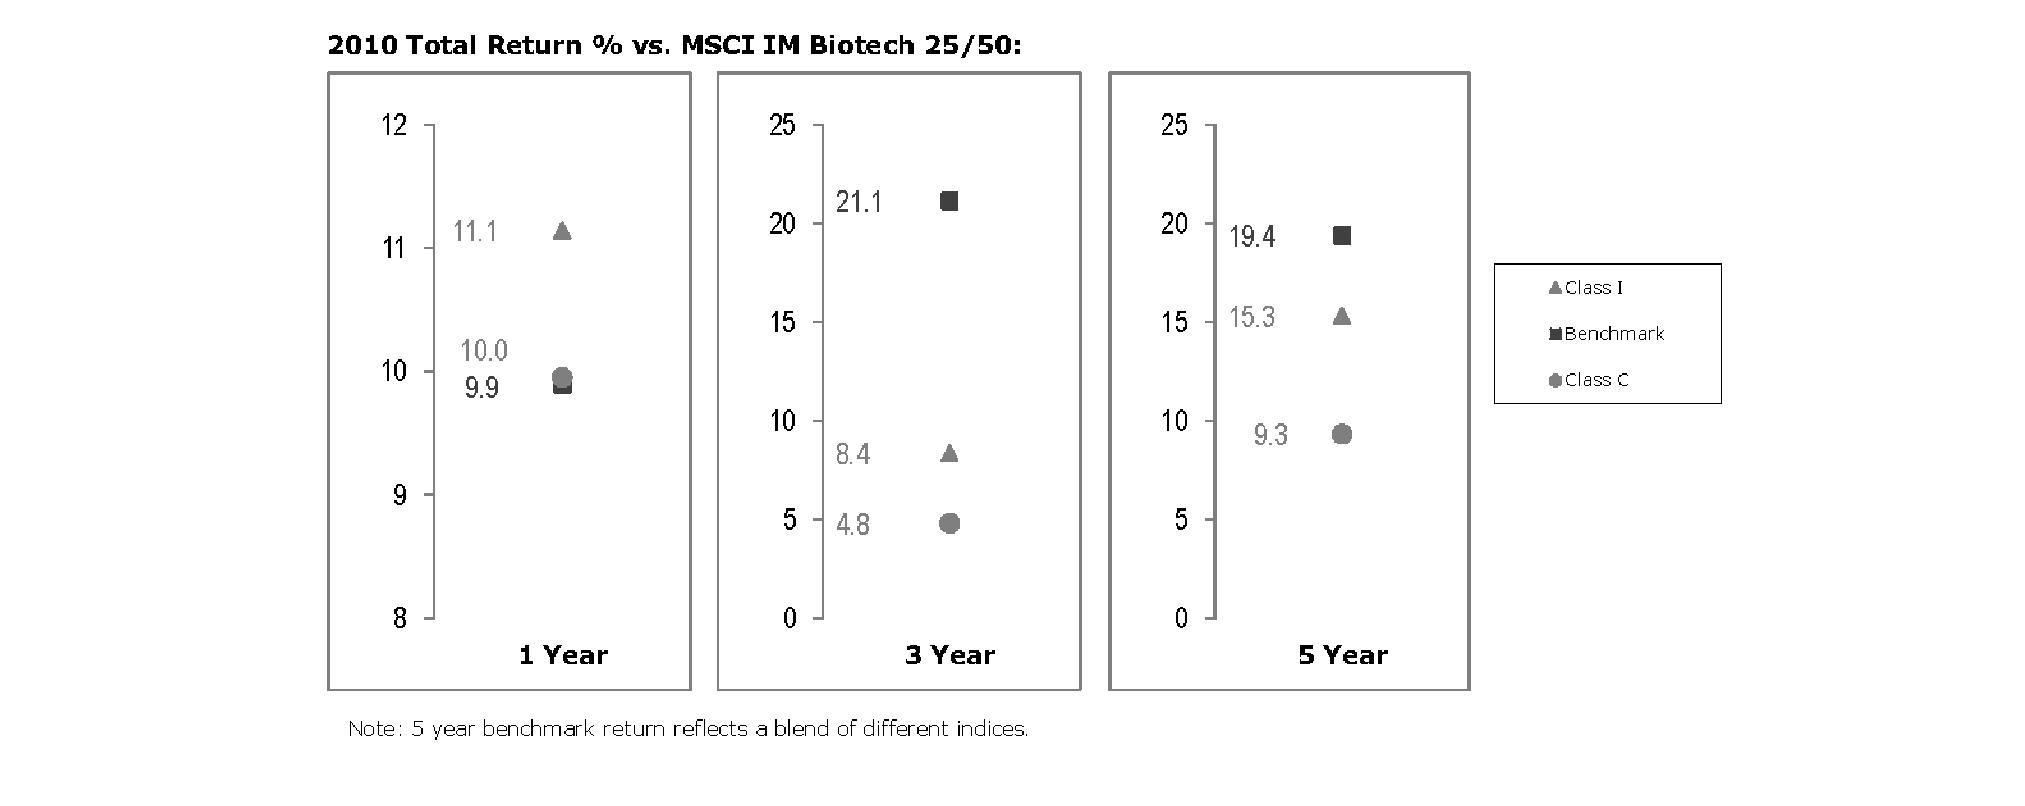
The Board noted that the investment performance of the fund was lower than its benchmark for the three- and five-year periods, although the one-year total return of Institutional Class (Class I) compared favorably to its benchmark. The Board considered that the variations in performance among the fund's classes reflect the variations in class expenses, which result in lower performance for higher expense classes. The Board also reviewed the fund's performance since inception as well as performance in the current year.
Annual Report
Fidelity Advisor Communications Equipment Fund
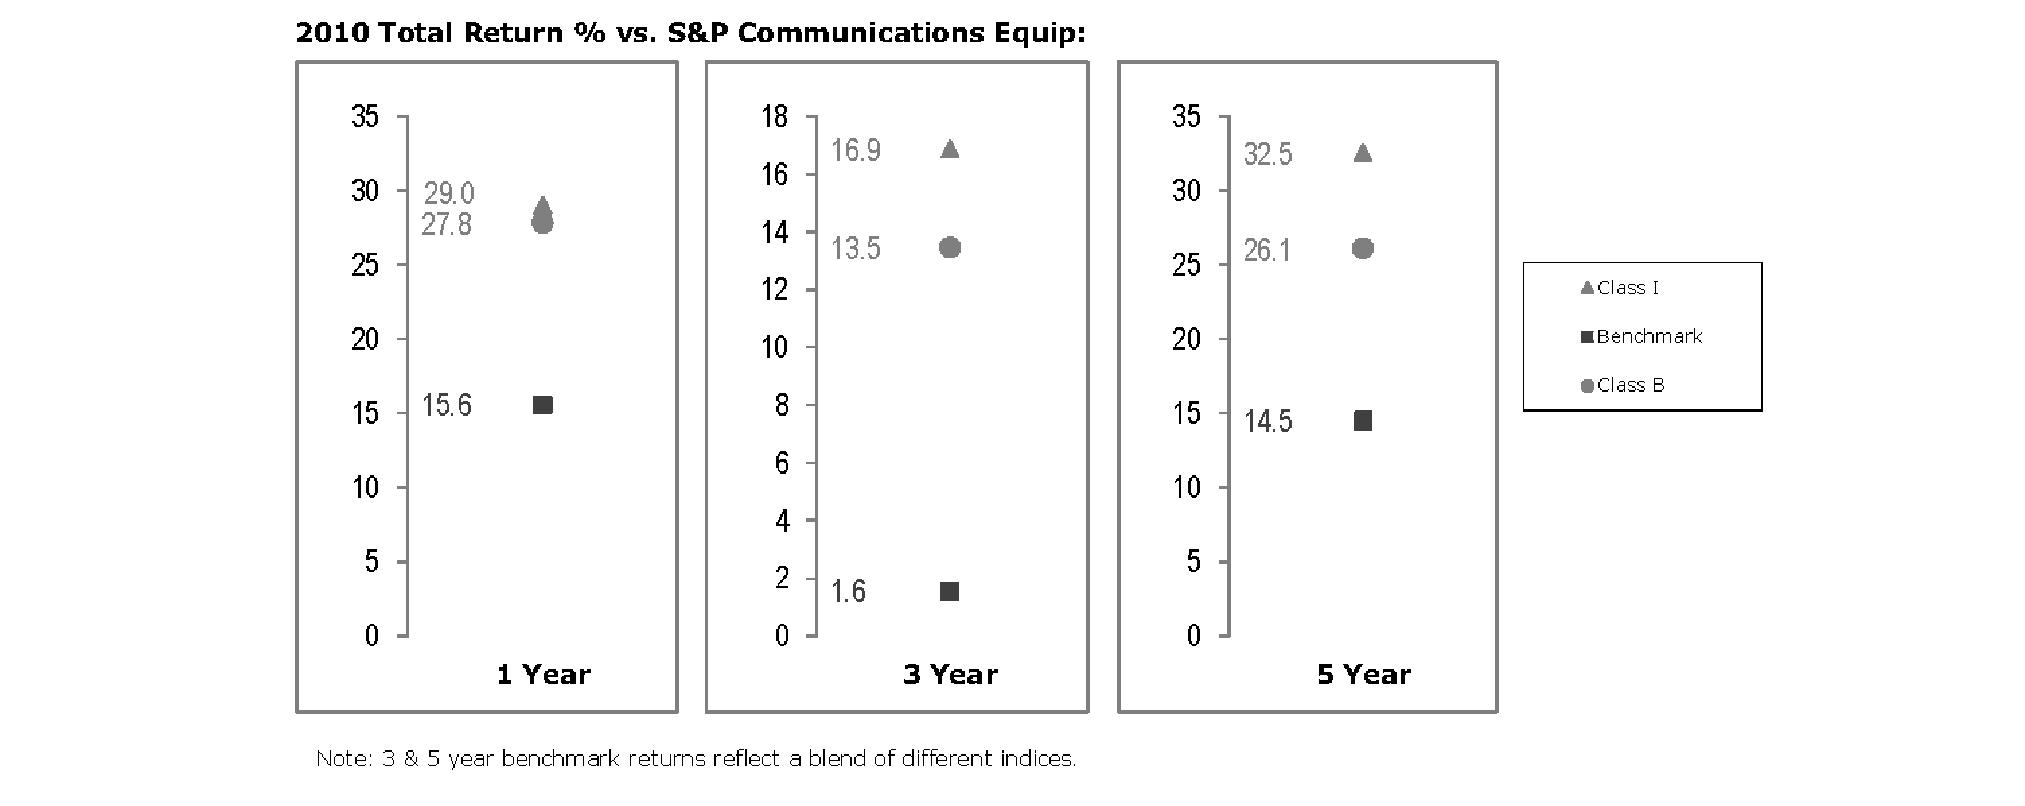
The Board noted that the investment performance of Institutional Class (Class I) of the fund compared favorably to its benchmark for all the periods shown. The Board considered that the variations in performance among the fund's classes reflect the variations in class expenses, which result in lower performance for higher expense classes. The Board also reviewed the fund's performance since inception as well as performance in the current year.
Fidelity Advisor Consumer Discretionary Fund

The Board noted that the investment performance of the fund was lower than its benchmark for the three- and five-year periods, although the one-year total return of Institutional Class (Class I) compared favorably to its benchmark. The Board considered that the variations in performance among the fund's classes reflect the variations in class expenses, which result in lower performance for higher expense classes. The Board also reviewed the fund's performance since inception as well as performance in the current year.
Annual Report
Board Approval of Investment Advisory Contracts and Management Fees - continued
Fidelity Advisor Electronics Fund
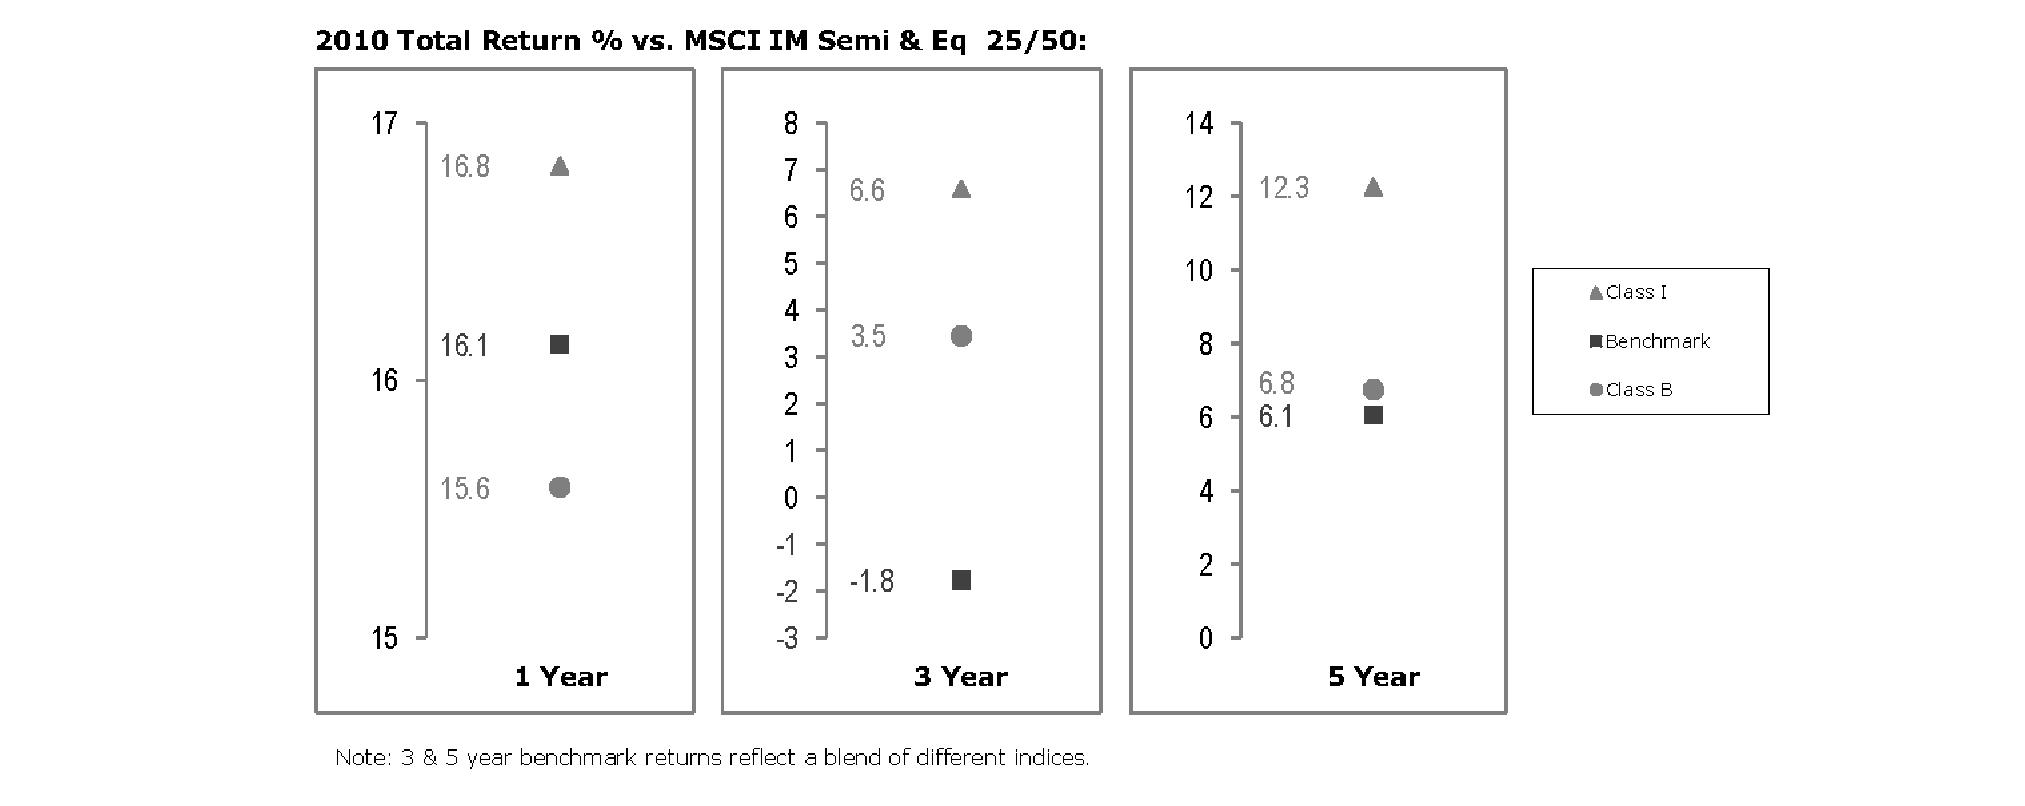
The Board noted that the investment performance of Institutional Class (Class I) of the fund compared favorably to its benchmark for all the periods shown. The Board considered that the variations in performance among the fund's classes reflect the variations in class expenses, which result in lower performance for higher expense classes. The Board also reviewed the fund's performance since inception as well as performance in the current year.
Fidelity Advisor Energy Fund
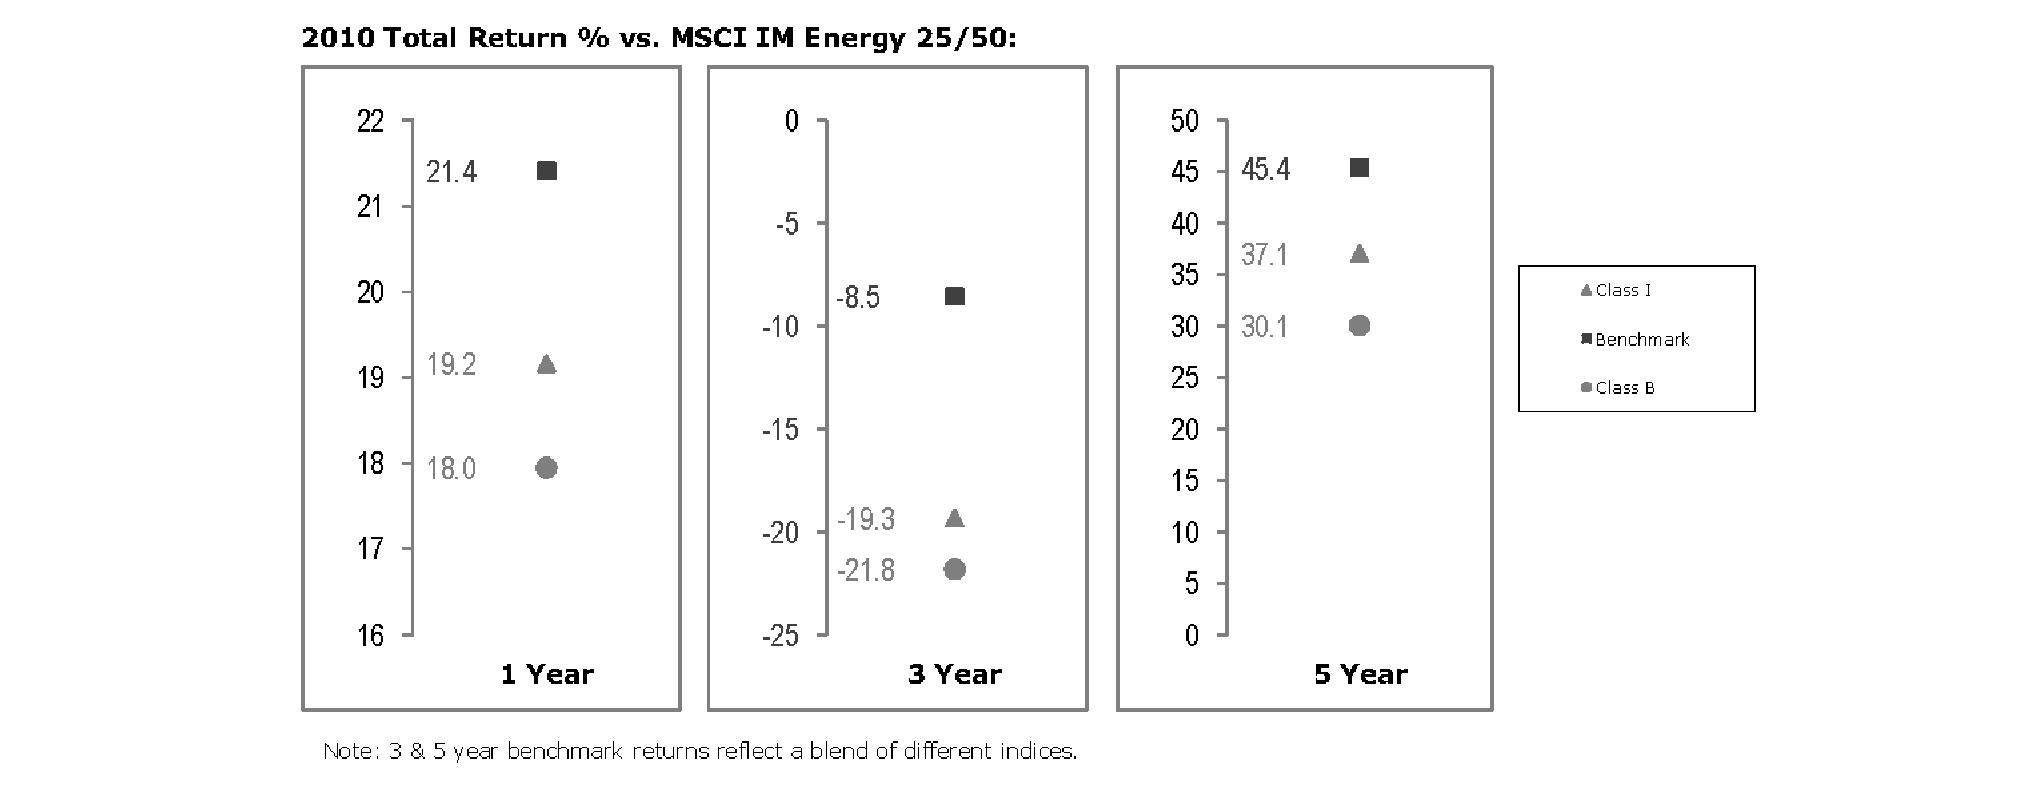
The Board noted that the investment performance of the fund was lower than its benchmark for all the periods shown. The Board considered that the variations in performance among the fund's classes reflect the variations in class expenses, which result in lower performance for higher expense classes. The Board discussed with FMR actions that have been taken by FMR to improve the fund's below-benchmark performance. The Board also reviewed the fund's performance since inception as well as performance in the current year. The Board will continue to closely monitor the performance of the fund in the coming year and discuss with FMR other appropriate actions to address the performance of the fund.
Annual Report
Fidelity Advisor Financial Services Fund
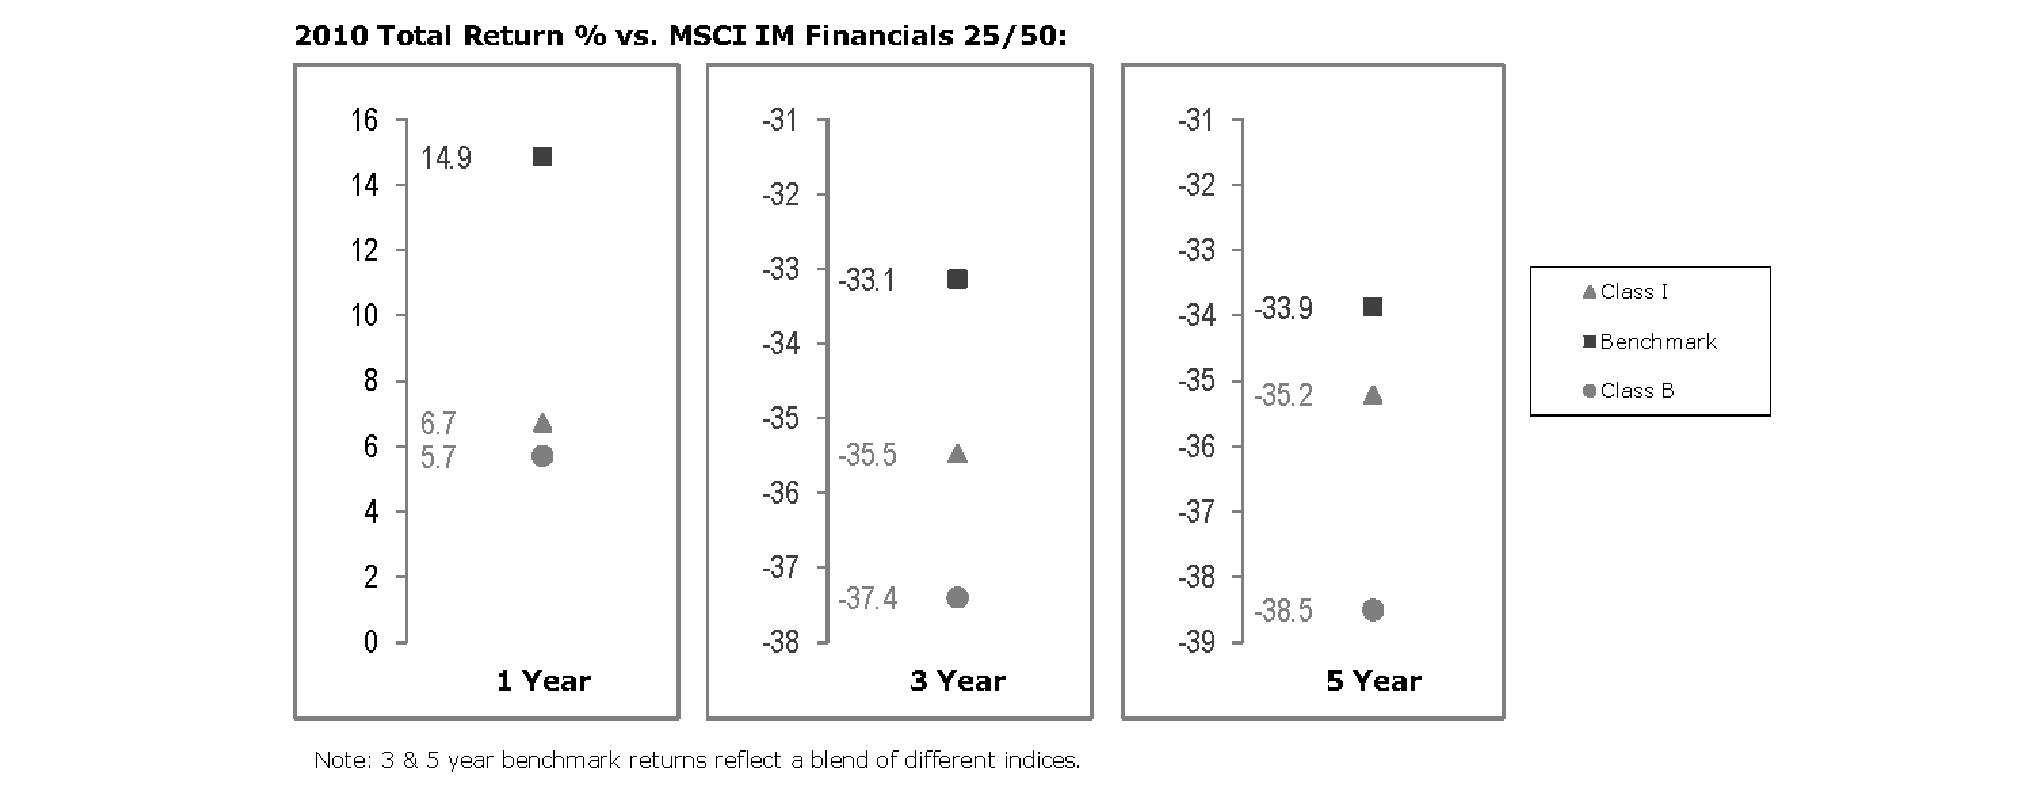
The Board noted that the investment performance of the fund was lower than its benchmark for all the periods shown. The Board considered that the variations in performance among the fund's classes reflect the variations in class expenses, which result in lower performance for higher expense classes. The Board discussed with FMR actions that have been taken by FMR to improve the fund's below-benchmark performance. The Board also reviewed the fund's performance since inception as well as performance in the current year. The Board will continue to closely monitor the performance of the fund in the coming year and discuss with FMR other appropriate actions to address the performance of the fund.
Fidelity Advisor Health Care Fund

The Board noted that the investment performance of Institutional Class (Class I) of the fund compared favorably to its benchmark for all the periods shown. The Board considered that the variations in performance among the fund's classes reflect the variations in class expenses, which result in lower performance for higher expense classes. The Board also reviewed the fund's performance since inception as well as performance in the current year.
Annual Report
Board Approval of Investment Advisory Contracts and Management Fees - continued
Fidelity Advisor Industrials Fund
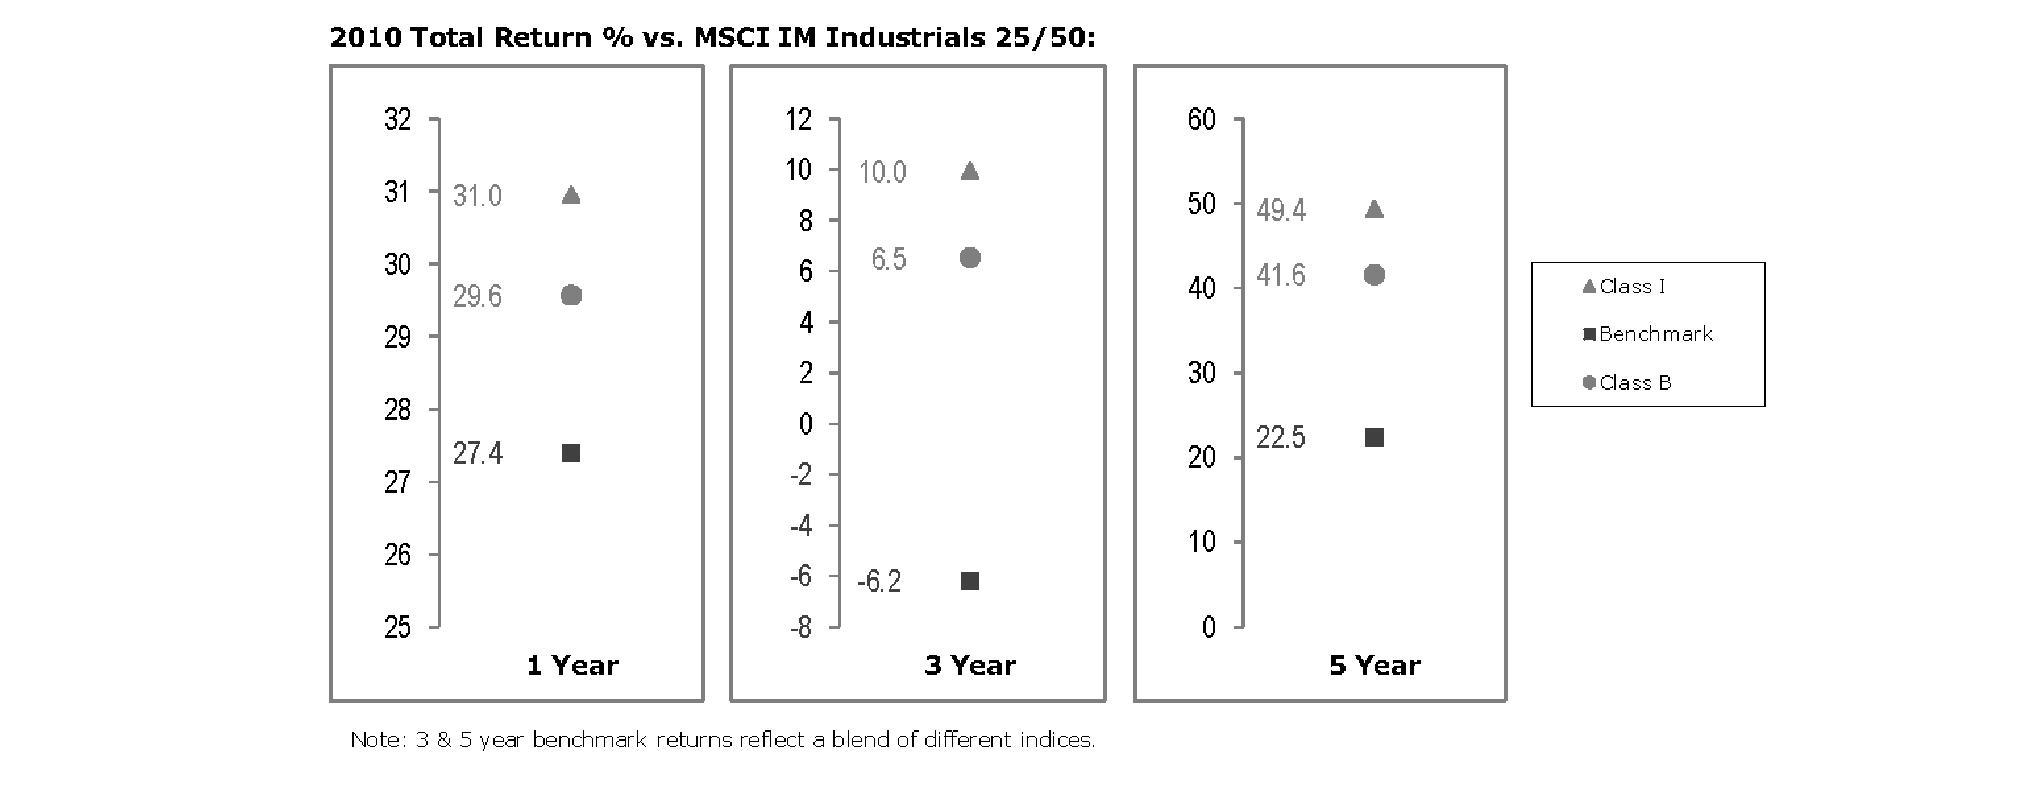
The Board noted that the investment performance of Institutional Class (Class I) of the fund compared favorably to its benchmark for all the periods shown. The Board considered that the variations in performance among the fund's classes reflect the variations in class expenses, which result in lower performance for higher expense classes. The Board also reviewed the fund's performance since inception as well as performance in the current year.
Fidelity Advisor Technology Fund
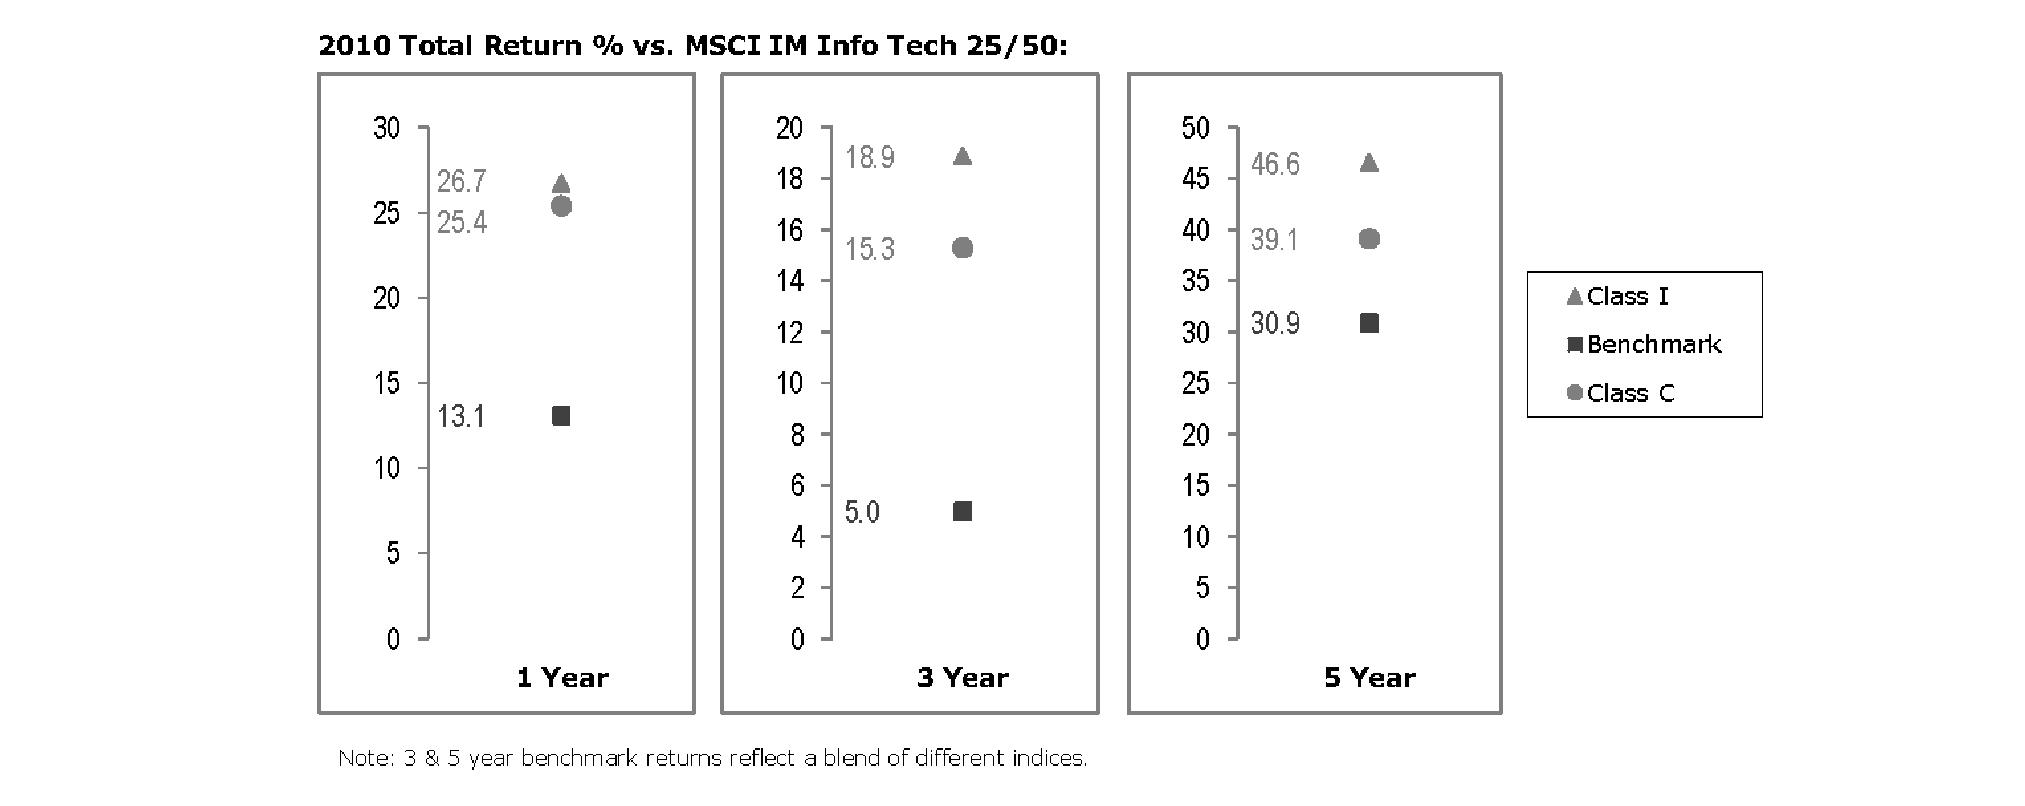
The Board noted that the investment performance of Institutional Class (Class I) of the fund compared favorably to its benchmark for all the periods shown. The Board considered that the variations in performance among the fund's classes reflect the variations in class expenses, which result in lower performance for higher expense classes. The Board also reviewed the fund's performance since inception as well as performance in the current year.
Annual Report
Fidelity Advisor Utilities Fund

The Board noted that the investment performance of Institutional Class (Class I) of the fund compared favorably to its benchmark for the one- and five-year periods, although the fund's three-year cumulative total return was lower than its benchmark. The Board considered that the variations in performance among the fund's classes reflect the variations in class expenses, which result in lower performance for higher expense classes. The Board also reviewed the fund's performance since inception as well as performance in the current year.
Based on its review, the Board concluded that the nature, extent, and quality of services provided to each fund under the Advisory Contracts should benefit each fund's shareholders.
Competitiveness of Management Fee and Total Expense Ratio. The Board considered each fund's management fee and total expense ratio compared to "mapped groups" of competitive funds and classes. Fidelity creates "mapped groups" by combining similar Lipper investment objective categories that have comparable management fee characteristics. Combining Lipper investment objective categories aids the Board's management fee and total expense ratio comparisons by broadening the competitive group used for comparison and by reducing the number of universes to which various Fidelity funds are compared.
Management Fee. The Board considered two proprietary management fee comparisons for the 12-month periods shown in the charts below. The group of Lipper funds used by the Board for management fee comparisons is referred to below as the "Total Mapped Group." The Total Mapped Group comparison focuses on a fund's standing relative to the total universe of comparable funds available to investors in terms of gross management fees before expense reimbursements or caps. "TMG %" represents the percentage of funds in the Total Mapped Group that had management fees that were lower than a fund's. For example, a TMG % of 6% means that 94% of the funds in the Total Mapped Group had higher management fees than a fund. The "Asset-Size Peer Group" (ASPG) comparison focuses on a fund's standing relative to non-Fidelity funds similar in size to the fund within the Total Mapped Group. The ASPG represents at least 15% of the funds in the Total Mapped Group with comparable asset size and management fee characteristics, subject to a minimum of 50 funds (or all funds in the Total Mapped Group if fewer than 50). Additional information, such as the ASPG quartile in which a fund's management fee ranked, is also included in the charts and considered by the Board.
Annual Report
Board Approval of Investment Advisory Contracts and Management Fees - continued
Fidelity Advisor Biotechnology Fund
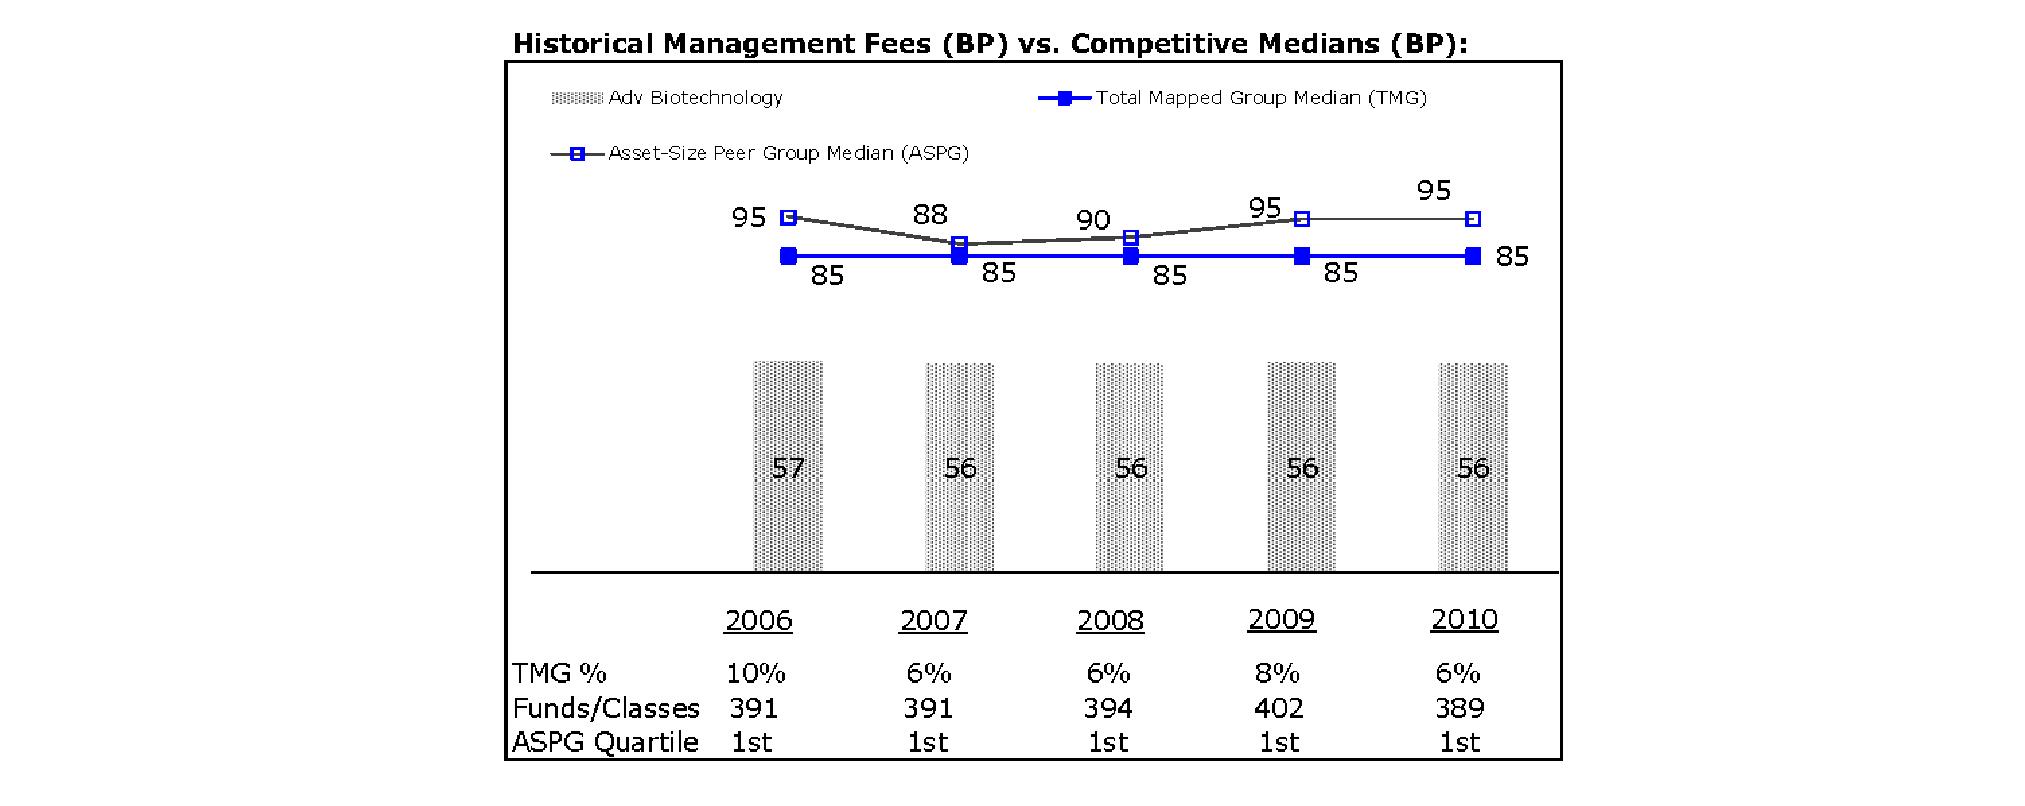
Fidelity Advisor Communications Equipment Fund
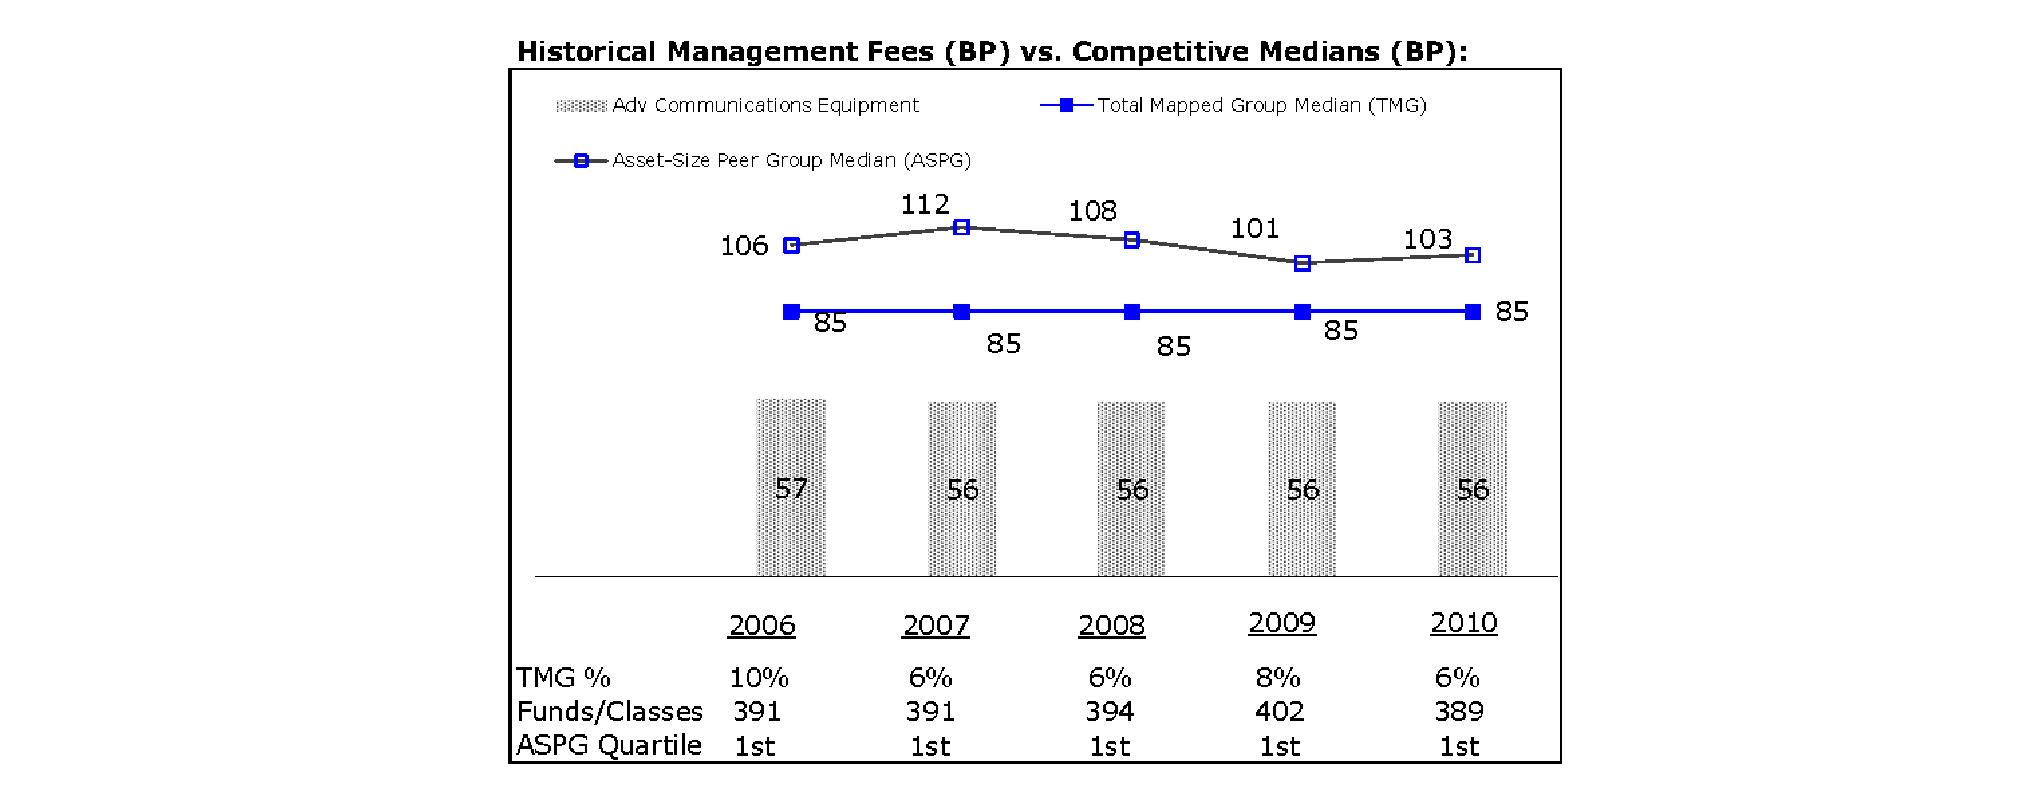
Annual Report
Fidelity Advisor Consumer Discretionary Fund

Fidelity Advisor Electronics Fund

Annual Report
Board Approval of Investment Advisory Contracts and Management Fees - continued
Fidelity Advisor Energy Fund
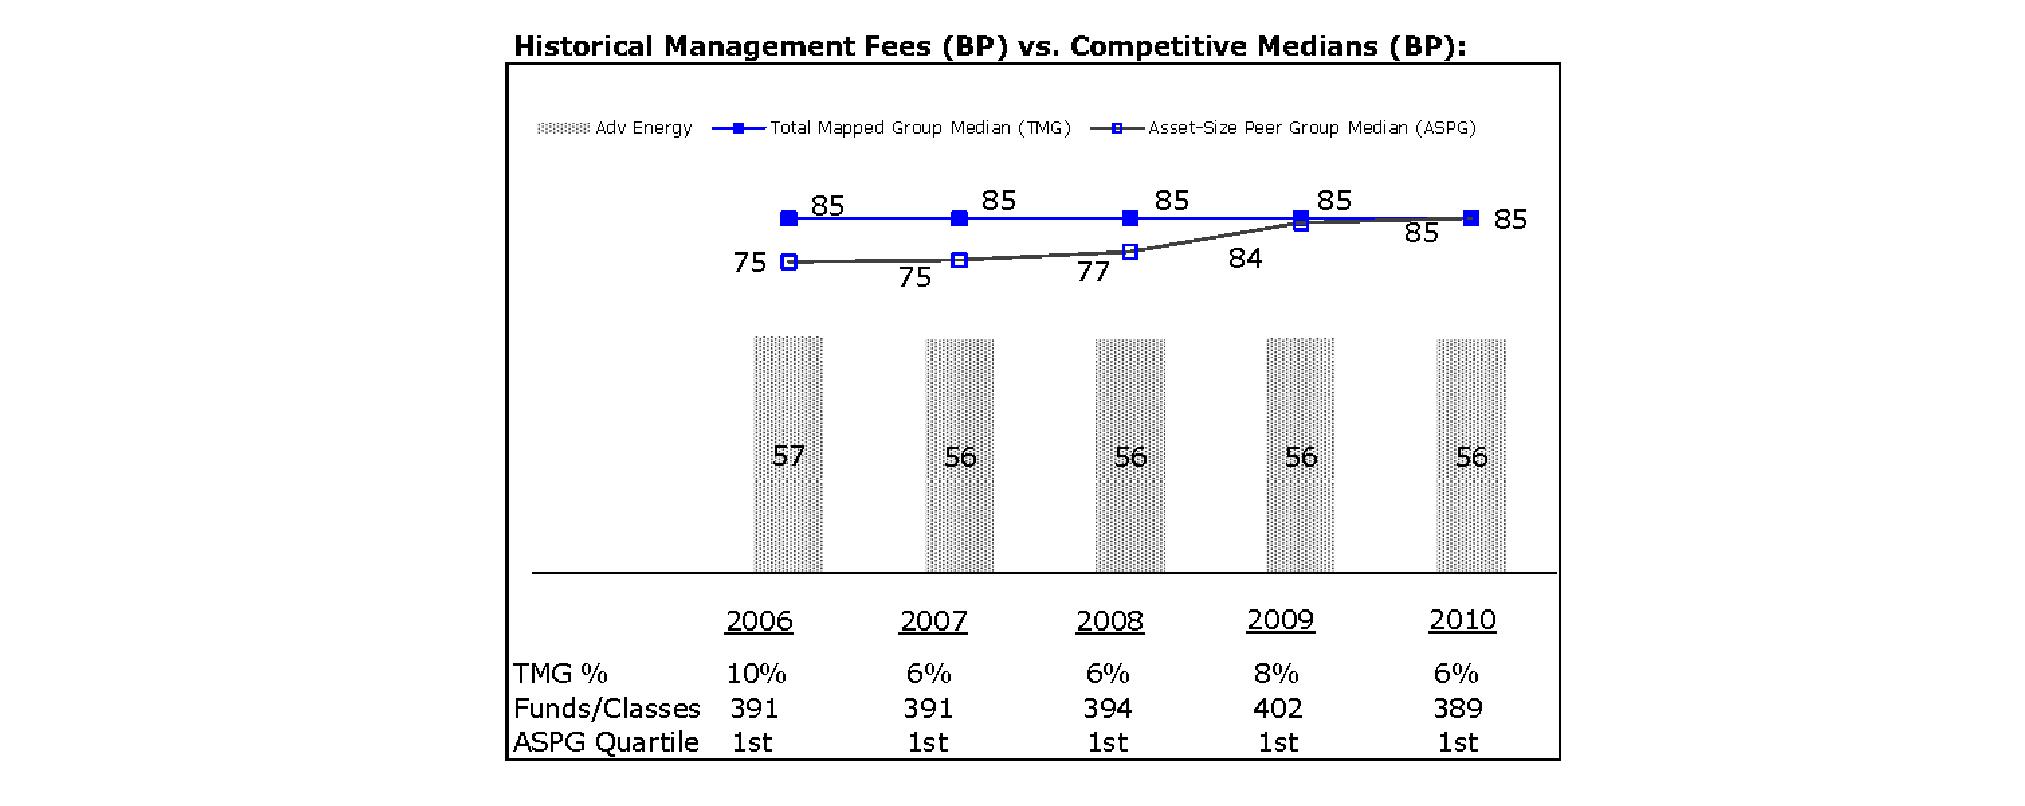
Fidelity Advisor Financial Services Fund

Annual Report
Fidelity Advisor Health Care Fund

Fidelity Advisor Industrials Fund
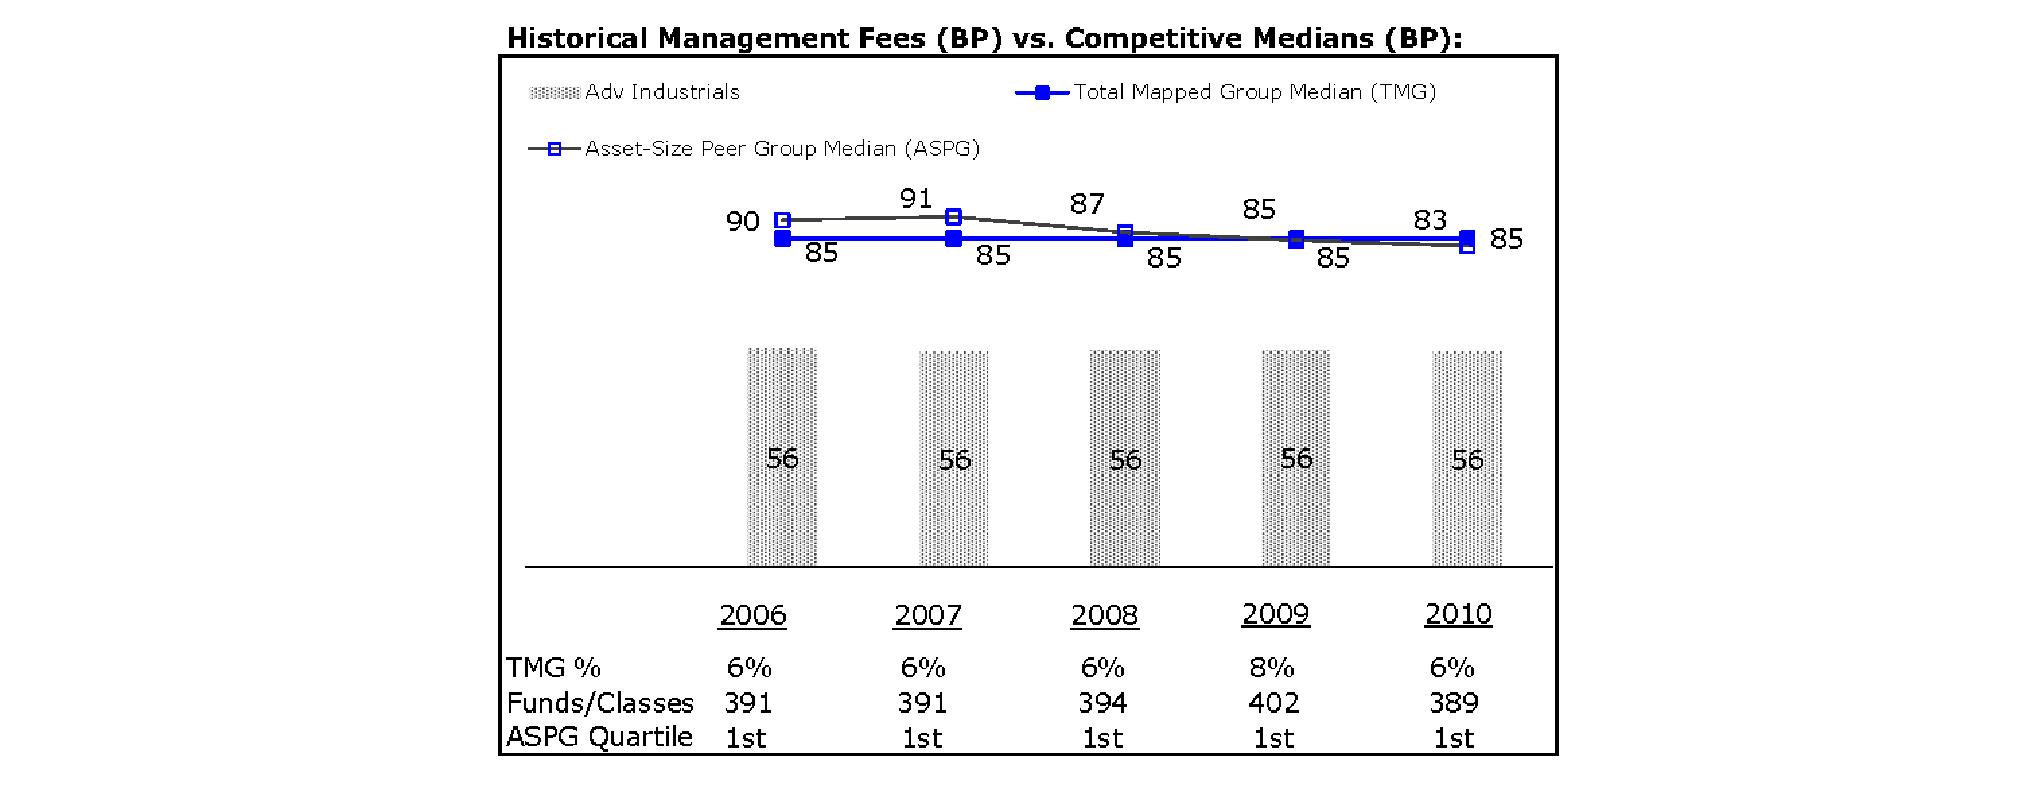
Annual Report
Board Approval of Investment Advisory Contracts and Management Fees - continued
Fidelity Advisor Technology Fund

Fidelity Advisor Utilities Fund

The Board noted that each fund's management fee ranked below the median of its Total Mapped Group and below the median of its ASPG for 2010.
Based on its review, the Board concluded that each fund's management fee is fair and reasonable in light of the services that the fund receives and the other factors considered.
Total Expense Ratio. In its review of the total expense ratio of each class of each fund, the Board considered the fund's management fee as well as other fund or class expenses, as applicable, such as transfer agent fees, pricing and bookkeeping fees, fund-paid 12b-1 fees, and custodial, legal, and audit fees. The Board also noted the effects of any waivers and reimbursements on fees and expenses. As part of its review, the Board also considered the current and historical total expense ratios of each class of each fund compared to competitive fund median expenses. Each class of each fund is compared to those funds and classes in the Total Mapped Group (used by the Board for management fee comparisons) that have a similar sales load structure.
The Board noted that each fund offers multiple classes, each of which has a different sales load and 12b-1 fee structure, and that the multiple structures are intended to offer a range of pricing options for the intermediary market. The Board also noted that the total expense ratios of the classes of each fund vary primarily by the level of their 12b-1 fees, although differences in transfer agent fees may also cause expenses to vary from class to class.
Annual Report
For Advisor Biotechnology, Advisor Consumer Discretionary, Advisor Financial Services, and Advisor Utilities, the Board noted that the total expense ratio of each of Class A, Class B, Class C, and Institutional Class ranked below its competitive median for 2010 and the total expense ratio of Class T ranked above its competitive median for 2010. The Board considered that various factors, including 12b-1 fees, positive or negative performance adjustments, and relatively higher other expenses in the case of small fund size, can affect total expense ratios. The Board noted that the total expense ratio of Class T was above the competitive median primarily because of higher 12b-1 fees on Class T. Class T has a higher 12b-1 fee, but a lower front-end sales charge, than traditionally priced front-end sales charge classes.
For Advisor Communications Equipment and Advisor Electronics, the Board noted that the total expense ratio of each of Class A, Class B, and Class C ranked below its competitive median for 2010, the total expense ratio of Institutional Class ranked equal to its competitive median for 2010, and the total expense ratio of Class T ranked above its competitive median for 2010. The Board considered that various factors, including 12b-1 fees, positive or negative performance adjustments, and relatively higher other expenses in the case of small fund size, can affect total expense ratios. The Board noted that the total expense ratio of Class T was above the competitive median primarily because of higher 12b-1 fees on Class T. Class T has a higher 12b-1 fee, but a lower front-end sales charge, than traditionally priced front-end sales charge classes.
For Advisor Energy, Advisor Health Care, Advisor Industrials, and Advisor Technology, the Board noted that the total expense ratio of each class ranked below its competitive median for 2010. The Board considered that various factors, including 12b-1 fees, positive or negative performance adjustments, and relatively higher other expenses in the case of small fund size, can affect total expense ratios.
Fees Charged to Other Fidelity Clients. The Board also considered Fidelity fee structures and other information with respect to clients of FMR and its affiliates, such as other mutual funds advised or subadvised by FMR or its affiliates, pension plan clients, and other institutional clients. In March 2010, the Board created an ad hoc joint committee with the board of other Fidelity funds (the Committee) to review and compare Fidelity's institutional investment advisory business with its business of providing services to the Fidelity funds, including the differences in services provided, fees charged, and costs incurred, as well as competition in their respective marketplaces.
Based on its review of total expense ratios and fees charged to other Fidelity clients, the Board concluded that the total expense ratio of each class of each fund was reasonable, although in some cases above the median of the universe presented for comparison, in light of the services that the fund and its shareholders receive and the other factors considered, including the findings of the Committee.
Costs of the Services and Profitability. The Board considered the revenues earned and the expenses incurred by Fidelity in conducting the business of developing, marketing, distributing, managing, administering and servicing each fund and its shareholders. The Board also considered the level of Fidelity's profits in respect of all the Fidelity funds.
On an annual basis, FMR presents to the Board Fidelity's profitability for each fund. Fidelity calculates the profitability for each fund, as well as aggregate profitability for groups of Fidelity funds and all Fidelity funds, using a series of detailed revenue and cost allocation methodologies which originate with the books and records of Fidelity on which Fidelity's audited financial statements are based. The Audit Committee of the Board reviews any significant changes from the prior year's methodologies.
PricewaterhouseCoopers LLP (PwC), independent registered public accounting firm and auditor to Fidelity and certain Fidelity funds, has been engaged annually by the Board as part of the Board's assessment of Fidelity's profitability analysis. PwC's engagement includes the review and assessment of Fidelity's methodologies used in determining the revenues and expenses attributable to Fidelity's mutual fund business, and completion of agreed-upon procedures surrounding the mathematical accuracy of fund profitability and its conformity to allocation methodologies. After considering PwC's reports issued under the engagement and information provided by Fidelity, the Board concluded that while other allocation methods may also be reasonable, Fidelity's profitability methodologies are reasonable in all material respects.
The Board also reviewed Fidelity's non-fund businesses and fall-out benefits related to the mutual fund business as well as cases where Fidelity's affiliates may benefit from or be related to the funds' business.
The Board considered the costs of the services provided by and the profits realized by Fidelity in connection with the operation of each fund and was satisfied that the profitability was not excessive in the circumstances.
Economies of Scale. The Board considered whether there have been economies of scale in respect of the management of the Fidelity funds, whether the Fidelity funds (including each fund) have appropriately benefited from any such economies of scale, and whether there is potential for realization of any further economies of scale. The Board considered the extent to which each fund will benefit from economies of scale through increased services to the fund, through waivers or reimbursements, or through fee or expense reductions. The Board also noted that in 2009, it and the board of other Fidelity funds created an ad hoc committee (the Economies of Scale Committee) to analyze whether FMR attains economies of scale in respect of the management and servicing of the Fidelity funds, whether the Fidelity funds have appropriately benefited from such economies of scale, and whether there is potential for realization of any further economies of scale.
The Board recognized that each fund's management contract incorporates a "group fee" structure, which provides for lower group fee rates as total fund assets under FMR's management increase, and for higher group fee rates as total fund assets under FMR's management decrease. FMR calculates the group fee rates based on a tiered asset "breakpoint" schedule that varies based on asset class. The Board considered that the group fee is designed to deliver the benefits of economies of scale to fund shareholders when total Fidelity fund assets increase, even if assets of any particular fund are unchanged or have declined, because some portion of Fidelity's costs are attributable to services provided to all Fidelity funds, and all funds benefit if those costs can be allocated among more assets. The Board concluded that, given the group fee structure, fund shareholders will benefit from lower management fees as assets under FMR's management increase at the fund complex level, regardless of whether Fidelity achieves any such economies of scale.
Annual Report
Board Approval of Investment Advisory Contracts and Management Fees - continued
The Board concluded, taking into account the analysis of the Economies of Scale Committee, that any potential economies of scale are being appropriately shared between fund shareholders and Fidelity.
Additional Information Requested by the Board. In order to develop fully the factual basis for consideration of the Fidelity funds' Advisory Contracts, the Board requested and received additional information on certain topics, including (i) fund performance trends, actions to be taken by FMR to improve certain funds' overall performance, and Fidelity's long-term strategies for certain funds; (ii) portfolio manager changes that have occurred during the past year and length of portfolio manager tenure for different categories of funds over time; (iii) Fidelity's compensation structure for portfolio managers and other key personnel and strategies for attracting and retaining non-investment personnel; (iv) the amount of the investment that each portfolio manager has made in the Fidelity fund(s) that he or she manages; (v) historical trends in Fidelity's realization of fall-out benefits; (vi) Fidelity's group fee structures and the rationale for the individual fee rates of certain funds; (vii) fund profitability methodology and the impact of certain factors on fund profitability results; (viii) trends regarding industry use of performance fee structures and Fidelity's compliance practices with respect to performance adjustment calculations; (ix) the fee structures in place for certain other Fidelity clients; and (x) explanations regarding the relative total expense ratios of certain funds and classes, total expense competitive trends, and actions that might be taken by FMR to reduce total expense ratios for certain funds and classes.
Based on its evaluation of all of the conclusions noted above, and after considering all factors it believed relevant, the Board ultimately concluded that the advisory fee structures are fair and reasonable, and that each fund's Advisory Contracts should be renewed.
Annual Report
Investment Adviser
Fidelity Management & Research Company
Boston, MA
Investment Sub-Advisers
FMR Co., Inc.
Fidelity Management & Research (U.K.) Inc.
Fidelity Management & Research
(Hong Kong) Limited
Fidelity Management & Research
(Japan) Inc.
General Distributor
Fidelity Distributors Corporation
Boston, MA
Transfer and Service Agents
Fidelity Investments Institutional Operations Company, Inc.
Boston, MA
Fidelity Service Company, Inc.
Boston, MA
Custodians
JPMorgan Chase Bank
New York, NY
Brown Brothers Harriman & Co. †
Boston, MA
State Street Bank and Trust ††
Quincy, MA
† Custodian for Fidelity Advisor Energy Fund only.
†† Custodian for Fidelity Advisor Biotechnology Fund, Fidelity Advisor
Communications Equipment Fund, and Fidelity Advisor Electronics Fund only.
AFOC-UANNPRO-0911
1.789241.107
Fidelity Advisor
Focus Funds®
Institutional Class
Fidelity Advisor® Biotechnology Fund
Fidelity Advisor Communications Equipment Fund
Fidelity Advisor Consumer Discretionary Fund
Fidelity Advisor Electronics Fund
Fidelity Advisor Energy Fund
Fidelity Advisor Financial Services Fund
Fidelity Advisor Health Care Fund
Fidelity Advisor Industrials Fund
Fidelity Advisor Technology Fund
Fidelity Advisor Utilities Fund
Annual Report
July 31, 2011
(2_fidelity_logos) (Registered_Trademark)
Contents
To view a fund's proxy voting guidelines and proxy voting record for the 12-month period ended June 30, visit http://www.fidelity.com/proxyvotingresults or visit the Securities and Exchange Commission's (SEC) web site at http://www.sec.gov. You may also call 1-877-208-0098 to request a free copy of the proxy voting guidelines.
Standard & Poor's, S&P and S&P 500 are registered service marks of The McGraw-Hill Companies, Inc. and have been licensed for use by Fidelity Distributors Corporation.
Other third party marks appearing herein are the property of their respective owners.
All other marks appearing herein are registered or unregistered trademarks or service marks of FMR LLC or an affiliated company.
This report and the financial statements contained herein are submitted for the general information of the shareholders of the funds. This report is not authorized for distribution to prospective investors in the funds unless preceded or accompanied by an effective prospectus.
A fund files its complete schedule of portfolio holdings with the SEC for the first and third quarters of each fiscal year on Form N-Q. Forms N-Q are available on the SEC's web site at http://www.sec.gov. A fund's Forms N-Q may be reviewed and copied at the SEC's Public Reference Room in Washington, DC. Information regarding the operation of the SEC's Public Reference Room may be obtained by calling 1-800-SEC-0330. For a complete list of a fund's portfolio holdings, view the most recent holdings listing, semiannual report, or annual report on Fidelity's web site at http://www.fidelity.com, http://www.advisor.fidelity.com, or http://www.401k.com, as applicable.
NOT FDIC INSURED • MAY LOSE VALUE • NO BANK GUARANTEE
Neither the funds nor Fidelity Distributors Corporation is a bank.
Annual Report
(photo_of_James_C_Curvey)
Dear Shareholder:
The second half of 2011 began with U.S. equities continuing to give back some of the gains achieved earlier in the year. In the days leading up to July 31, markets were shaken by a political stalemate in which Congress struggled to address the debt ceiling issue before an early-August deadline. The resulting uncertainty held back markets in July, the third consecutive monthly decline for equities, effectively reversing the positive momentum seen through the end of April. Financial markets are always unpredictable, of course, but there are several time-tested investment principles that can help put the odds in your favor.
One of the basic tenets is to invest for the long term. Over time, riding out the markets' inevitable ups and downs has proven much more effective than selling into panic or chasing the hottest trend. Even missing only a few of the markets' best days can significantly diminish investor returns. Patience also affords the benefits of compounding - of earning interest on additional income or reinvested dividends and capital gains. There can be tax advantages and cost benefits to consider as well. While staying the course doesn't eliminate risk, it can considerably lessen the effect of short-term declines.
You can further manage your investing risk through diversification. And today, more than ever, geographic diversification should be taken into account. Studies indicate that asset allocation is the single most important determinant of a portfolio's long-term success. The right mix of stocks, bonds and cash - aligned to your particular risk tolerance and investment objective - is very important. Age-appropriate rebalancing is also an essential aspect of asset allocation. For younger investors, an emphasis on equities - which historically have been the best-performing asset class over time - is encouraged. As investors near their specific goal, such as retirement or sending a child to college, consideration may be given to replacing volatile assets (e.g. common stocks) with more-stable fixed investments (bonds or savings plans).
A third principle - investing regularly - can help lower the average cost of your purchases. Investing a certain amount of money each month or quarter helps ensure you won't pay for all your shares at market highs. This strategy - known as dollar cost averaging - also reduces "emotion" from investing, helping shareholders avoid selling weak performers just prior to an upswing, or chasing a hot performer just before a correction.
We invite you to contact us via the Internet, through our Investor Centers or by phone. It is our privilege to provide you the information you need to make the investments that are right for you.
Sincerely,
(The acting chairman's signature appears here.)
James C. Curvey
Acting Chairman
Annual Report
Fidelity Advisor Biotechnology Fund - Institutional Class
Performance: The Bottom Line
Average annual total return reflects the change in the value of an investment, assuming reinvestment of the class' distributions from dividend income and capital gains (the profits earned upon the sale of securities that have grown in value, if any) and assuming a constant rate of performance each year. The $10,000 table and the fund's returns do not reflect the deduction of taxes that a shareholder would pay on fund distributions or the redemption of fund shares. During periods of reimbursement by Fidelity, a fund's total return will be greater than it would be had the reimbursement not occurred. How a fund did yesterday is no guarantee of how it will do tomorrow.
Average Annual Total Returns
Periods ended July 31, 2011 | Past 1
year | Past 5
years | Past 10
years |
Institutional Class | 32.46% | 7.14% | 3.24% |
$10,000 Over 10 Years
Let's say hypothetically that $10,000 was invested in Fidelity Advisor® Biotechnology Fund - Institutional Class on July 31, 2001. The chart shows how the value of your investment would have changed, and also shows how the S&P 500® Index performed over the same period.
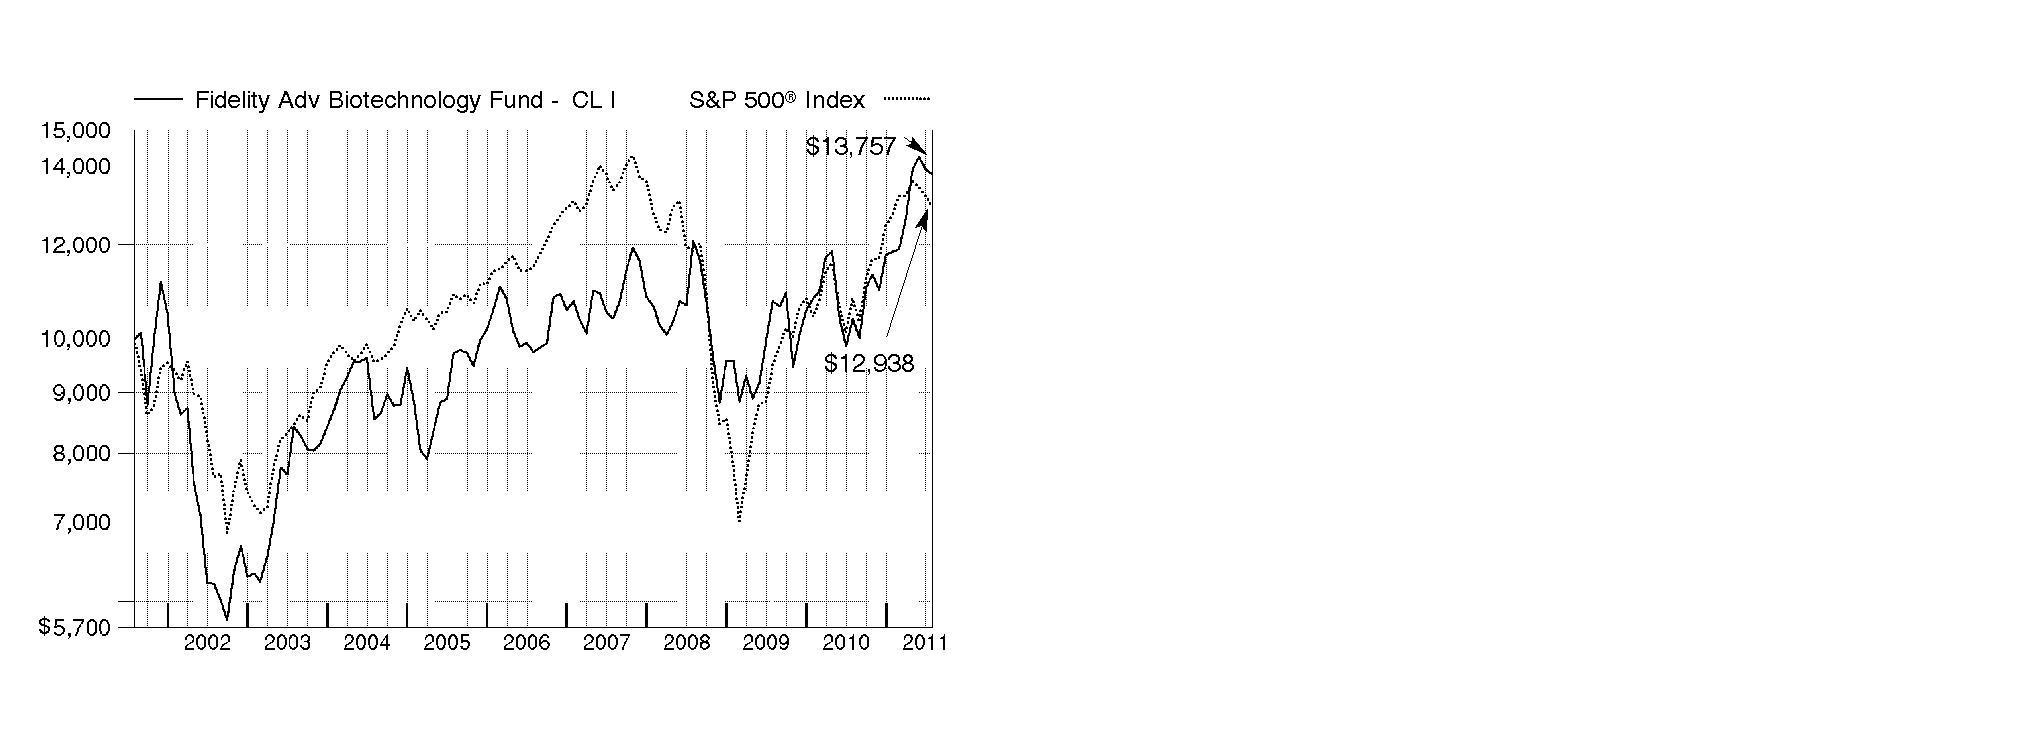
Annual Report
Fidelity Advisor Biotechnology Fund
Market Recap: U.S. stocks registered solid double-digit gains for the 12 months ending July 31, 2011, extending a rally that began more than two years earlier. Despite a rough start in August 2010, markets turned positive in September, as increased demand for capital goods and other upbeat indicators trumped investor worry about a U.S. recessionary relapse. The broad market, as measured by the S&P 500® Index, rose 9% that month, its biggest September gain in 71 years. Seven more monthly advances followed, fueled by encouraging corporate earnings and economic activity. However, volatility picked up in the period's latter months, as markets reacted to continued high U.S. unemployment, nagging debt troubles in Europe and looming legislative battles over the federal debt ceiling. May unemployment rose above 9% for the first time in 2011, contributing to a traditional "June swoon" for stocks. Market uncertainty lingered in July, when the S&P 500® posted its second-biggest monthly loss of the period. For the full year, the S&P 500® climbed 19.65%, while the blue-chip-laden Dow Jones Industrial AverageSM rose a comparable 19.09% and the technology-heavy Nasdaq Composite® Index gained 23.40%. On the capitalization spectrum, stocks of mid-cap companies fared best, with the Russell Midcap® Index rising 24.51% and the small-cap Russell 2000® Index adding 23.92%.
Comments from Rajiv Kaul, Portfolio Manager of Fidelity Advisor® Biotechnology Fund: For the year, the fund's Class A, Class T, Class B and Class C shares returned 32.08%, 31.69%, 31.12% and 31.07%, respectively (excluding sales charges), well ahead of the S&P 500 and the 23.75% advance of the MSCI® U.S. IM Biotechnology 25/50 Index. Versus the MSCI index, stock selection in biotechnology aided relative performance, as did out-of-benchmark exposure to pharmaceuticals. The fund's emphasis on mid- and small-cap stocks was particularly beneficial. Alexion Pharmaceuticals was the fund's top individual contributor, fueled by the success of the company's Soliris® medication. Other contributors included Questcor Pharmaceuticals, which was an out-of-benchmark position, and three notable underweightings: Celgene, Gilead Sciences and Amgen. Conversely, Acorda Therapeutics was the fund's largest relative detractor, as sales of AMPYRA®, the company's multiple sclerosis medication, were disappointing. Out-of-index positions in vaccine developer Antigenics, which in January changed its name to Agenus, and in Auxilium Pharmaceuticals also performed poorly. Largely avoiding ZymoGenetics, an index component whose stock price nearly doubled following news of the company's acquisition by Bristol-Myers Squibb during the fourth quarter of 2010, also dampened performance.
Comments from Rajiv Kaul, Portfolio Manager of Fidelity® Advisor Biotechnology Fund: For the year, the fund's Institutional Class shares returned 32.46%, well ahead of the S&P 500 and the 23.75% advance of the MSCI® U.S. IM Biotechnology 25/50 Index. Versus the MSCI index, stock selection in biotechnology aided relative performance, as did out-of-benchmark exposure to pharmaceuticals. The fund's emphasis on mid- and small-cap stocks was particularly beneficial. Alexion Pharmaceuticals was the fund's top individual contributor, fueled by the success of the company's Soliris® medication. Other contributors included Questcor Pharmaceuticals, which was an out-of-benchmark position, and three notable underweightings: Celgene, Gilead Sciences and Amgen. Conversely, Acorda Therapeutics was the fund's largest relative detractor, as sales of AMPYRA®, the company's multiple sclerosis medication, were disappointing. Out-of-index positions in vaccine developer Antigenics, which in January changed its name to Agenus, and in Auxilium Pharmaceuticals also performed poorly. Largely avoiding ZymoGenetics, an index component whose stock price nearly doubled following news of the company's acquisition by Bristol-Myers Squibb during the fourth quarter of 2010, also dampened performance.
The views expressed above reflect those of the portfolio manager(s) only through the end of the period as stated on the cover of this report and do not necessarily represent the views of Fidelity or any other person in the Fidelity organization. Any such views are subject to change at any time based upon market or other conditions and Fidelity disclaims any responsibility to update such views. These views may not be relied on as investment advice and, because investment decisions for a Fidelity fund are based on numerous factors, may not be relied on as an indication of trading intent on behalf of any Fidelity fund.
Annual Report
Fidelity Advisor Biotechnology Fund
As a shareholder of the Fund, you incur two types of costs: (1) transaction costs, including sales charges (loads) on purchase payments or redemption proceeds, redemption fees, and (2) ongoing costs, including management fees, distribution and/or service (12b-1) fees and other Fund expenses. This Example is intended to help you understand your ongoing costs (in dollars) of investing in the Fund and to compare these costs with the ongoing costs of investing in other mutual funds.
The Example is based on an investment of $1,000 invested at the beginning of the period and held for the entire period (February 1, 2011 to July 31, 2011).
Actual Expenses
The first line of the accompanying table for each class of the Fund provides information about actual account values and actual expenses. You may use the information in this line, together with the amount you invested, to estimate the expenses that you paid over the period. Simply divide your account value by $1,000.00 (for example, an $8,600 account value divided by $1,000.00 = 8.6), then multiply the result by the number in the first line for a class of the Fund under the heading entitled "Expenses Paid During Period" to estimate the expenses you paid on your account during this period. In addition, the Fund, as a shareholder in the underlying Fidelity Central Funds, will indirectly bear its pro-rata share of the fees and expenses incurred by the underlying Fidelity Central Funds. These fees and expenses are not included in the Fund's annualized expense ratio used to calculate the expense estimate in the table below.
Hypothetical Example for Comparison Purposes
The second line of the accompanying table for each class of the Fund provides information about hypothetical account values and hypothetical expenses based on a Class' actual expense ratio and an assumed rate of return of 5% per year before expenses, which is not the Class' actual return. The hypothetical account values and expenses may not be used to estimate the actual ending account balance or expenses you paid for the period. You may use this information to compare the ongoing costs of investing in the Fund and other funds. To do so, compare this 5% hypothetical example with the 5% hypothetical examples that appear in the shareholder reports of the other funds. In addition, the Fund, as a shareholder in the underlying Fidelity Central Funds, will indirectly bear its pro-rata share of the fees and expenses incurred by the underlying Fidelity Central Funds. These fees and expenses are not included in the Fund's annualized expense ratio used to calculate the expense estimate in the table below.
Please note that the expenses shown in the table are meant to highlight your ongoing costs only and do not reflect any transaction costs. Therefore, the second line of the table is useful in comparing ongoing costs only, and will not help you determine the relative total costs of owning different funds. In addition, if these transactional costs were included, your costs would have been higher.
| Annualized
Expense Ratio | Beginning
Account Value
February 1, 2011 | Ending
Account Value
July 31, 2011 | Expenses Paid
During Period*
February 1, 2011 to
July 31, 2011 |
Class A | 1.30% | | | |
Actual | | $ 1,000.00 | $ 1,160.70 | $ 6.96 |
HypotheticalA | | $ 1,000.00 | $ 1,018.35 | $ 6.51 |
Class T | 1.64% | | | |
Actual | | $ 1,000.00 | $ 1,159.90 | $ 8.78 |
HypotheticalA | | $ 1,000.00 | $ 1,016.66 | $ 8.20 |
Class B | 2.04% | | | |
Actual | | $ 1,000.00 | $ 1,155.70 | $ 10.90 |
HypotheticalA | | $ 1,000.00 | $ 1,014.68 | $ 10.19 |
Class C | 2.05% | | | |
Actual | | $ 1,000.00 | $ 1,157.10 | $ 10.96 |
HypotheticalA | | $ 1,000.00 | $ 1,014.63 | $ 10.24 |
Institutional Class | .97% | | | |
Actual | | $ 1,000.00 | $ 1,162.20 | $ 5.20 |
HypotheticalA | | $ 1,000.00 | $ 1,019.98 | $ 4.86 |
A 5% return per year before expenses
* Expenses are equal to each Class' annualized expense ratio, multiplied by the average account value over the period, multiplied by 181/365 (to reflect the one-half year period).
Annual Report
Fidelity Advisor Biotechnology Fund
Investment Changes (Unaudited)
Top Ten Stocks as of July 31, 2011 |
| % of fund's
net assets | % of fund's net assets
6 months ago |
Amgen, Inc. | 15.7 | 18.4 |
Gilead Sciences, Inc. | 9.8 | 2.8 |
Biogen Idec, Inc. | 5.6 | 3.2 |
Alexion Pharmaceuticals, Inc. | 5.2 | 6.7 |
Vertex Pharmaceuticals, Inc. | 4.4 | 6.1 |
BioMarin Pharmaceutical, Inc. | 3.8 | 2.6 |
Celgene Corp. | 3.5 | 0.0 |
InterMune, Inc. | 2.6 | 2.7 |
Pharmasset, Inc. | 2.5 | 1.5 |
United Therapeutics Corp. | 2.1 | 4.4 |
| 55.2 | |
Top Industries (% of fund's net assets) |
As of July 31, 2011 |
 | Biotechnology | 89.6% | |
 | Pharmaceuticals | 7.0% | |
 | Health Care Equipment & Supplies | 0.1% | |
 | All Others* | 3.3% | |

As of January 31, 2011 |
| Biotechnology | 91.7% | |
| Pharmaceuticals | 7.8% | |
| Health Care Equipment & Supplies | 0.0% | |
| All Others* | 0.5% | |

* Includes short-term investments and net other assets. |
Annual Report
Fidelity Advisor Biotechnology Fund
Investments July 31, 2011
Showing Percentage of Net Assets
Common Stocks - 96.7% |
| Shares | | Value |
BIOTECHNOLOGY - 89.6% |
Biotechnology - 89.6% |
Acadia Pharmaceuticals, Inc. (a) | 59,446 | | $ 96,897 |
Acorda Therapeutics, Inc. (a) | 36,779 | | 1,044,524 |
ADVENTRX Pharmaceuticals, Inc. (a)(d) | 37,232 | | 109,834 |
Affymax, Inc. (a) | 4,506 | | 29,785 |
Agenus, Inc. (a)(d) | 21,100 | | 16,142 |
Agenus, Inc. warrants 1/9/18 (a) | 452,000 | | 45,605 |
Alexion Pharmaceuticals, Inc. (a) | 67,890 | | 3,856,152 |
Alkermes, Inc. (a) | 37,961 | | 654,448 |
Allos Therapeutics, Inc. (a) | 55,750 | | 103,695 |
Alnylam Pharmaceuticals, Inc. (a) | 13,498 | | 126,611 |
AMAG Pharmaceuticals, Inc. (a)(d) | 39,471 | | 584,566 |
Amarin Corp. PLC ADR (a) | 8,900 | | 120,506 |
Amgen, Inc. | 213,776 | | 11,693,545 |
Amylin Pharmaceuticals, Inc. (a) | 53,384 | | 635,803 |
Ardea Biosciences, Inc. (a) | 3,300 | | 77,220 |
ARIAD Pharmaceuticals, Inc. (a)(d) | 69,106 | | 821,670 |
ArQule, Inc. (a) | 24,866 | | 139,250 |
AVEO Pharmaceuticals, Inc. (a) | 10,500 | | 200,655 |
Biogen Idec, Inc. (a) | 41,126 | | 4,189,506 |
BioInvent International AB (a) | 28,800 | | 88,343 |
BioMarin Pharmaceutical, Inc. (a)(d) | 91,134 | | 2,846,115 |
Bionovo, Inc. (a) | 73,900 | | 57,642 |
Bionovo, Inc. warrants 1/21/16 (a) | 56,850 | | 18,008 |
Catalyst Pharmaceutical Partners, Inc. (a) | 82,595 | | 128,022 |
Celgene Corp. (a) | 43,718 | | 2,592,477 |
Cell Therapeutics, Inc. (a) | 185,219 | | 250,046 |
Cell Therapeutics, Inc. warrants 7/6/16 (a) | 46,404 | | 41,468 |
Cepheid, Inc. (a) | 23,300 | | 879,808 |
Chelsea Therapeutics International Ltd. (a) | 11,860 | | 59,537 |
China Biologic Products, Inc. (a)(d) | 4,867 | | 45,750 |
Codexis, Inc. (a) | 12,700 | | 114,300 |
Cubist Pharmaceuticals, Inc. (a) | 24,792 | | 842,184 |
Dendreon Corp. (a) | 40,933 | | 1,510,428 |
Dynavax Technologies Corp. (a) | 50,600 | | 141,680 |
Enzon Pharmaceuticals, Inc. (a)(d) | 26,034 | | 253,050 |
Exelixis, Inc. (a) | 63,245 | | 486,987 |
Genomic Health, Inc. (a) | 11,428 | | 306,842 |
Geron Corp. (a)(d) | 64,461 | | 248,175 |
Gilead Sciences, Inc. (a) | 172,043 | | 7,287,741 |
Halozyme Therapeutics, Inc. (a) | 42,400 | | 294,256 |
Horizon Pharma, Inc. | 29,700 | | 268,488 |
Human Genome Sciences, Inc. (a)(d) | 60,208 | | 1,264,970 |
Idenix Pharmaceuticals, Inc. (a) | 129,831 | | 867,271 |
ImmunoGen, Inc. (a) | 16,200 | | 219,186 |
Incyte Corp. (a)(d) | 47,838 | | 834,295 |
Inhibitex, Inc. (a) | 29,900 | | 123,786 |
InterMune, Inc. (a) | 57,331 | | 1,913,709 |
Ironwood Pharmaceuticals, Inc. Class A (a) | 12,732 | | 190,343 |
|
| Shares | | Value |
Isis Pharmaceuticals, Inc. (a) | 500 | | $ 4,320 |
Keryx Biopharmaceuticals, Inc. (a)(d) | 34,100 | | 150,381 |
Lexicon Pharmaceuticals, Inc. (a) | 200,961 | | 337,614 |
Ligand Pharmaceuticals, Inc. Class B (a) | 9,614 | | 130,943 |
Medivation, Inc. (a) | 23,213 | | 492,580 |
Metabolix, Inc. (a) | 17,330 | | 118,364 |
Micromet, Inc. (a)(d) | 17,700 | | 100,182 |
Momenta Pharmaceuticals, Inc. (a)(d) | 22,829 | | 403,160 |
Myrexis, Inc. (a) | 302 | | 1,024 |
Neurocrine Biosciences, Inc. (a) | 37,106 | | 286,829 |
NPS Pharmaceuticals, Inc. (a) | 95,000 | | 917,700 |
Oncothyreon, Inc. (a)(d) | 4,574 | | 36,638 |
ONYX Pharmaceuticals, Inc. (a) | 24,501 | | 808,043 |
Opko Health, Inc. (a) | 81,400 | | 354,090 |
OREXIGEN Therapeutics, Inc. (a) | 30,600 | | 50,490 |
PDL BioPharma, Inc. (d) | 55,288 | | 342,233 |
Pharmacyclics, Inc. (a) | 8,300 | | 103,833 |
Pharmasset, Inc. (a) | 15,417 | | 1,871,315 |
PolyMedix, Inc. (a) | 327,666 | | 229,366 |
PolyMedix, Inc. warrants 4/10/16 (a) | 163,833 | | 54,248 |
Progenics Pharmaceuticals, Inc. (a) | 53,400 | | 291,564 |
Protalix BioTherapeutics, Inc. (a)(d) | 20,990 | | 135,176 |
Protox Therapeutics, Inc. (a) | 138,000 | | 72,221 |
Regeneron Pharmaceuticals, Inc. (a) | 20,047 | | 1,063,694 |
Rigel Pharmaceuticals, Inc. (a) | 46,170 | | 401,217 |
Sangamo Biosciences, Inc. (a)(d) | 23,828 | | 129,148 |
Savient Pharmaceuticals, Inc. (a)(d) | 9,755 | | 68,285 |
Seattle Genetics, Inc. (a)(d) | 43,481 | | 740,481 |
SIGA Technologies, Inc. (a)(d) | 23,912 | | 181,970 |
Spectrum Pharmaceuticals, Inc. (a)(d) | 104,676 | | 1,109,566 |
Synta Pharmaceuticals Corp. (a) | 18,783 | | 87,717 |
Targacept, Inc. (a) | 14,300 | | 292,292 |
Theravance, Inc. (a)(d) | 29,078 | | 621,688 |
Threshold Pharmaceuticals, Inc. (a) | 87,866 | | 146,736 |
Threshold Pharmaceuticals, Inc. warrants 3/16/16 (a) | 35,146 | | 30,640 |
United Therapeutics Corp. (a) | 26,752 | | 1,535,030 |
Vertex Pharmaceuticals, Inc. (a) | 63,815 | | 3,309,446 |
Vical, Inc. (a) | 94,477 | | 454,434 |
ZIOPHARM Oncology, Inc. (a)(d) | 80,500 | | 437,920 |
Zogenix, Inc. | 47,489 | | 241,244 |
| | 66,865,143 |
HEALTH CARE EQUIPMENT & SUPPLIES - 0.1% |
Health Care Equipment - 0.1% |
Alsius Corp. (a) | 14,200 | | 0 |
Aradigm Corp. (a) | 21,800 | | 3,989 |
Aradigm Corp. (e) | 329,640 | | 54,292 |
| | 58,281 |
PHARMACEUTICALS - 7.0% |
Pharmaceuticals - 7.0% |
AcelRx Pharmaceuticals, Inc. | 58,400 | | 241,776 |
Adolor Corp. (a) | 199,599 | | 443,110 |
Common Stocks - continued |
| Shares | | Value |
PHARMACEUTICALS - CONTINUED |
Pharmaceuticals - continued |
Aegerion Pharmaceuticals, Inc. | 8,900 | | $ 139,819 |
Akorn, Inc. (a) | 15,479 | | 107,269 |
Auxilium Pharmaceuticals, Inc. (a)(d) | 42,158 | | 790,041 |
AVANIR Pharmaceuticals Class A (a)(d) | 113,980 | | 427,425 |
Columbia Laboratories, Inc. (a) | 6,400 | | 18,304 |
Corcept Therapeutics, Inc. (a) | 64,600 | | 231,268 |
Elan Corp. PLC sponsored ADR (a) | 82,050 | | 907,473 |
Jazz Pharmaceuticals, Inc. (a) | 3,943 | | 159,573 |
NuPathe, Inc. | 900 | | 6,210 |
Optimer Pharmaceuticals, Inc. (a)(d) | 27,915 | | 295,341 |
Pacira Pharmaceuticals, Inc. | 16,732 | | 167,655 |
Questcor Pharmaceuticals, Inc. (a) | 16,116 | | 500,402 |
Ventrus Biosciences, Inc. | 38,695 | | 467,823 |
XenoPort, Inc. (a) | 46,025 | | 326,317 |
| | 5,229,806 |
TOTAL COMMON STOCKS (Cost $57,275,134) | 72,153,230 |
Money Market Funds - 13.9% |
| Shares | | Value |
Fidelity Cash Central Fund, 0.14% (b) | 2,191,523 | | $ 2,191,523 |
Fidelity Securities Lending Cash Central Fund, 0.15% (b)(c) | 8,211,549 | | 8,211,549 |
TOTAL MONEY MARKET FUNDS (Cost $10,403,072) | 10,403,072 |
TOTAL INVESTMENT PORTFOLIO - 110.6% (Cost $67,678,206) | 82,556,302 |
NET OTHER ASSETS (LIABILITIES) - (10.6)% | | (7,923,162) |
NET ASSETS - 100% | $ 74,633,140 |
Legend |
(a) Non-income producing |
(b) Affiliated fund that is available only to investment companies and other accounts managed by Fidelity Investments. The rate quoted is the annualized seven-day yield of the fund at period end. A complete unaudited listing of the fund's holdings as of its most recent quarter end is available upon request. In addition, each Fidelity Central Fund's financial statements, which are not covered by the Fund's Report of Independent Registered Public Accounting Firm, are available on the SEC's website or upon request. |
(c) Investment made with cash collateral received from securities on loan. |
(d) Security or a portion of the security is on loan at period end. |
(e) Restricted securities - Investment in securities not registered under the Securities Act of 1933 (excluding 144A issues). At the end of the period, the value of restricted securities (excluding 144A issues) amounted to $54,292 or 0.1% of net assets. |
Additional information on each restricted holding is as follows: |
Security | Acquisition Date | Acquisition Cost |
Aradigm Corp. | 7/6/11 | $ 62,632 |
Affiliated Central Funds |
Information regarding fiscal year to date income earned by the Fund from investments in Fidelity Central Funds is as follows: |
Fund | Income earned |
Fidelity Cash Central Fund | $ 1,208 |
Fidelity Securities Lending Cash Central Fund | 145,035 |
Total | $ 146,243 |
Other Information |
The following is a summary of the inputs used, as of July 31, 2011, involving the Fund's assets and liabilities carried at fair value. The inputs or methodology used for valuing securities may not be an indication of the risk associated with investing in those securities. For more information on valuation inputs, and their aggregation into the levels used in the table below, please refer to the Security Valuation section in the accompanying Notes to Financial Statements. |
Valuation Inputs at Reporting Date: |
Description | Total | Level 1 | Level 2 | Level 3 |
Investments in Securities: | | | | |
Common Stocks | $ 72,153,230 | $ 71,908,969 | $ 244,261 | $ - |
Money Market Funds | 10,403,072 | 10,403,072 | - | - |
Total Investments in Securities: | $ 82,556,302 | $ 82,312,041 | $ 244,261 | $ - |
Income Tax Information |
At July 31, 2011, the fund had a capital loss carryforward of approximately $1,530,367 all of which will expire in fiscal year 2017. Capital loss carryforward are only available to offset future capital gains of the Fund to the extent provided by regulations and may be limited. |
See accompanying notes which are an integral part of the financial statements.
Annual Report
Fidelity Advisor Biotechnology Fund
Statement of Assets and Liabilities
| July 31, 2011 |
| | |
Assets | | |
Investment in securities, at value (including securities loaned of $8,120,986) - See accompanying schedule: Unaffiliated issuers (cost $57,275,134) | $ 72,153,230 | |
Fidelity Central Funds (cost $10,403,072) | 10,403,072 | |
Total Investments (cost $67,678,206) | | $ 82,556,302 |
Receivable for investments sold | | 1,746,646 |
Receivable for fund shares sold | | 203,081 |
Distributions receivable from Fidelity Central Funds | | 17,106 |
Other receivables | | 1,757 |
Total assets | | 84,524,892 |
| | |
Liabilities | | |
Payable to custodian bank | $ 64,757 | |
Payable for investments purchased | 1,233,043 | |
Payable for fund shares redeemed | 262,107 | |
Accrued management fee | 35,339 | |
Distribution and service plan fees payable | 31,330 | |
Other affiliated payables | 19,582 | |
Other payables and accrued expenses | 34,045 | |
Collateral on securities loaned, at value | 8,211,549 | |
Total liabilities | | 9,891,752 |
| | |
Net Assets | | $ 74,633,140 |
Net Assets consist of: | | |
Paid in capital | | $ 62,179,088 |
Accumulated net investment loss | | (755) |
Accumulated undistributed net realized gain (loss) on investments and foreign currency transactions | | (2,423,289) |
Net unrealized appreciation (depreciation) on investments | | 14,878,096 |
Net Assets | | $ 74,633,140 |
Statement of Assets and Liabilities - continued
| July 31, 2011 |
| | |
Calculation of Maximum Offering Price Class A:
Net Asset Value and redemption price per share ($30,639,078 ÷ 3,478,612 shares) | | $ 8.81 |
| | |
Maximum offering price per share (100/94.25 of $8.81) | | $ 9.35 |
Class T:
Net Asset Value and redemption price per share ($16,454,237 ÷ 1,923,088 shares) | | $ 8.56 |
| | |
Maximum offering price per share (100/96.50 of $8.56) | | $ 8.87 |
Class B:
Net Asset Value and offering price per share ($5,849,306 ÷ 722,750 shares)A | | $ 8.09 |
| | |
Class C:
Net Asset Value and offering price per share ($15,787,398 ÷ 1,950,090 shares)A | | $ 8.10 |
| | |
Institutional Class:
Net Asset Value, offering price and redemption price per share ($5,903,121 ÷ 648,673 shares) | | $ 9.10 |
A Redemption price per share is equal to net asset value less any applicable contingent deferred sales charge.
See accompanying notes which are an integral part of the financial statements.
Annual Report
Statement of Operations
| Year ended July 31, 2011 |
| | |
Investment Income | | |
Dividends | | $ 31,001 |
Special dividends | | 76,944 |
Interest | | 1 |
Income from Fidelity Central Funds (including $145,035 from security lending) | | 146,243 |
Total income | | 254,189 |
| | |
Expenses | | |
Management fee | $ 330,558 | |
Transfer agent fees | 181,956 | |
Distribution and service plan fees | 312,037 | |
Accounting and security lending fees | 24,080 | |
Custodian fees and expenses | 15,889 | |
Independent trustees' compensation | 309 | |
Registration fees | 56,448 | |
Audit | 43,969 | |
Legal | 281 | |
Miscellaneous | 585 | |
Total expenses before reductions | 966,112 | |
Expense reductions | (3,845) | 962,267 |
Net investment income (loss) | | (708,078) |
Realized and Unrealized Gain (Loss) Net realized gain (loss) on: | | |
Investment securities: | | |
Unaffiliated issuers | 5,234,979 | |
Foreign currency transactions | (777) | |
Total net realized gain (loss) | | 5,234,202 |
Change in net unrealized appreciation (depreciation) on investment securities | | 11,018,770 |
Net gain (loss) | | 16,252,972 |
Net increase (decrease) in net assets resulting from operations | | $ 15,544,894 |
Statement of Changes in Net Assets
| Year ended
July 31,
2011 | Year ended
July 31,
2010 |
Increase (Decrease) in Net Assets | | |
Operations | | |
Net investment income (loss) | $ (708,078) | $ (784,049) |
Net realized gain (loss) | 5,234,202 | (2,345,490) |
Change in net unrealized appreciation (depreciation) | 11,018,770 | 88,127 |
Net increase (decrease) in net assets resulting from operations | 15,544,894 | (3,041,412) |
Share transactions - net increase (decrease) | 6,522,296 | 684,738 |
Redemption fees | 3,193 | 1,690 |
Total increase (decrease) in net assets | 22,070,383 | (2,354,984) |
| | |
Net Assets | | |
Beginning of period | 52,562,757 | 54,917,741 |
End of period (including accumulated net investment loss of $755 and undistributed net investment income of $0, respectively) | $ 74,633,140 | $ 52,562,757 |
See accompanying notes which are an integral part of the financial statements.
Annual Report
Financial Highlights - Class A
Years ended July 31, | 2011 | 2010 | 2009 | 2008 | 2007 |
Selected Per-Share Data | | | | | |
Net asset value, beginning of period | $ 6.67 | $ 6.94 | $ 7.81 | $ 7.23 | $ 6.81 |
Income from Investment Operations | | | | | |
Net investment income (loss) C | (.07) F | (.08) G | (.08) | (.09) H | (.09) |
Net realized and unrealized gain (loss) | 2.21 | (.19) | (.79) | 1.20 | .51 |
Total from investment operations | 2.14 | (.27) | (.87) | 1.11 | .42 |
Distributions from net realized gain | - | - | - | (.53) | - |
Redemption fees added to paid in capital C, J | - | - | - | - | - |
Net asset value, end of period | $ 8.81 | $ 6.67 | $ 6.94 | $ 7.81 | $ 7.23 |
Total Return A, B | 32.08% | (3.89)% | (11.14)% | 15.95% | 6.17% |
Ratios to Average Net Assets D, I | | | | | |
Expenses before reductions | 1.35% | 1.39% | 1.40% | 1.37% | 1.42% |
Expenses net of fee waivers, if any | 1.35% | 1.39% | 1.40% | 1.37% | 1.40% |
Expenses net of all reductions | 1.34% | 1.38% | 1.40% | 1.37% | 1.40% |
Net investment income (loss) | (.91)% F | (1.15)% G | (1.27)% | (1.24)% H | (1.25)% |
Supplemental Data | | | | | |
Net assets, end of period (000 omitted) | $ 30,639 | $ 20,154 | $ 19,858 | $ 18,249 | $ 13,081 |
Portfolio turnover rate E | 99% | 130% | 73% | 132% | 120% |
A Total returns would have been lower if certain expenses had not been reduced during the applicable periods shown.
B Total returns do not include the effect of the sales charges.
C Calculated based on average shares outstanding during the period.
D Fees and expenses of any underlying Fidelity Central Funds are not included in the Fund's expense ratio. The Fund indirectly bears its proportionate share of the expenses of any underlying Fidelity Central Funds.
E Amount does not include the portfolio activity of any underlying Fidelity Central Funds.
F Investment income per share reflects a special dividend which amounted to $.01 per share. Excluding the special dividend, the ratio of net investment income (loss) to average net assets would have been (1.04)%.
G Investment income per share reflects a special dividend which amounted to $.01 per share. Excluding the special dividend, the ratio of net investment income (loss) to average net assets would have been (1.29)%.
H Investment income per share reflects a special dividend which amounted to $.01 per share. Excluding the special dividend, the ratio of net investment income (loss) to average net assets would have been (1.33)%.
I Expense ratios reflect operating expenses of the class. Expenses before reductions do not reflect amounts reimbursed by the investment adviser or reductions from brokerage service arrangements or reductions from other expense offset arrangements and do not represent the amount paid by the class during periods when reimbursements or reductions occur. Expenses net of fee waivers reflect expenses after reimbursement by the investment adviser but prior to reductions from brokerage service arrangements or other expense offset arrangements. Expenses net of all reductions represent the net expenses paid by the class.
J Amount represents less than $.01 per share.
Financial Highlights - Class T
Years ended July 31, | 2011 | 2010 | 2009 | 2008 | 2007 |
Selected Per-Share Data | | | | | |
Net asset value, beginning of period | $ 6.50 | $ 6.78 | $ 7.65 | $ 7.11 | $ 6.71 |
Income from Investment Operations | | | | | |
Net investment income (loss) C | (.09) F | (.09) G | (.09) | (.11) H | (.11) |
Net realized and unrealized gain (loss) | 2.15 | (.19) | (.78) | 1.18 | .51 |
Total from investment operations | 2.06 | (.28) | (.87) | 1.07 | .40 |
Distributions from net realized gain | - | - | - | (.53) | - |
Redemption fees added to paid in capital C, J | - | - | - | - | - |
Net asset value, end of period | $ 8.56 | $ 6.50 | $ 6.78 | $ 7.65 | $ 7.11 |
Total Return A, B | 31.69% | (4.13)% | (11.37)% | 15.64% | 5.96% |
Ratios to Average Net Assets D, I | | | | | |
Expenses before reductions | 1.64% | 1.69% | 1.71% | 1.69% | 1.75% |
Expenses net of fee waivers, if any | 1.64% | 1.65% | 1.65% | 1.65% | 1.65% |
Expenses net of all reductions | 1.64% | 1.64% | 1.65% | 1.65% | 1.65% |
Net investment income (loss) | (1.21)% F | (1.41)% G | (1.52)% | (1.53)% H | (1.49)% |
Supplemental Data | | | | | |
Net assets, end of period (000 omitted) | $ 16,454 | $ 11,684 | $ 13,356 | $ 15,123 | $ 13,008 |
Portfolio turnover rate E | 99% | 130% | 73% | 132% | 120% |
A Total returns would have been lower if certain expenses had not been reduced during the applicable periods shown.
B Total returns do not include the effect of the sales charges.
C Calculated based on average shares outstanding during the period.
D Fees and expenses of any underlying Fidelity Central Funds are not included in the Fund's expense ratio. The Fund indirectly bears its proportionate share of the expenses of any underlying Fidelity Central Funds.
E Amount does not include the portfolio activity of any underlying Fidelity Central Funds.
F Investment income per share reflects a special dividend which amounted to $.01 per share. Excluding the special dividend, the ratio of net investment income (loss) to average net assets would have been (1.34)%.
G Investment income per share reflects a special dividend which amounted to $.01 per share. Excluding the special dividend, the ratio of net investment income (loss) to average net assets would have been (1.55)%.
H Investment income per share reflects a special dividend which amounted to $.01 per share. Excluding the special dividend, the ratio of net investment income (loss) to average net assets would have been (1.61)%.
I Expense ratios reflect operating expenses of the class. Expenses before reductions do not reflect amounts reimbursed by the investment adviser or reductions from brokerage service arrangements or reductions from other expense offset arrangements and do not represent the amount paid by the class during periods when reimbursements or reductions occur. Expenses net of fee waivers reflect expenses after reimbursement by the investment adviser but prior to reductions from brokerage service arrangements or other expense offset arrangements. Expenses net of all reductions represent the net expenses paid by the class.
J Amount represents less than $.01 per share.
See accompanying notes which are an integral part of the financial statements.
Annual Report
Financial Highlights - Class B
Years ended July 31, | 2011 | 2010 | 2009 | 2008 | 2007 |
Selected Per-Share Data | | | | | |
Net asset value, beginning of period | $ 6.17 | $ 6.47 | $ 7.34 | $ 6.88 | $ 6.52 |
Income from Investment Operations | | | | | |
Net investment income (loss) C | (.12) F | (.12) G | (.12) | (.14) H | (.14) |
Net realized and unrealized gain (loss) | 2.04 | (.18) | (.75) | 1.13 | .50 |
Total from investment operations | 1.92 | (.30) | (.87) | .99 | .36 |
Distributions from net realized gain | - | - | - | (.53) | - |
Redemption fees added to paid in capital C, J | - | - | - | - | - |
Net asset value, end of period | $ 8.09 | $ 6.17 | $ 6.47 | $ 7.34 | $ 6.88 |
Total Return A, B | 31.12% | (4.64)% | (11.85)% | 14.96% | 5.52% |
Ratios to Average Net Assets D, I | | | | | |
Expenses before reductions | 2.10% | 2.14% | 2.15% | 2.12% | 2.17% |
Expenses net of fee waivers, if any | 2.10% | 2.14% | 2.15% | 2.12% | 2.15% |
Expenses net of all reductions | 2.09% | 2.13% | 2.15% | 2.12% | 2.15% |
Net investment income (loss) | (1.66)% F | (1.90)% G | (2.02)% | (2.00)% H | (1.99)% |
Supplemental Data | | | | | |
Net assets, end of period (000 omitted) | $ 5,849 | $ 6,297 | $ 7,377 | $ 11,044 | $ 12,656 |
Portfolio turnover rate E | 99% | 130% | 73% | 132% | 120% |
A Total returns would have been lower if certain expenses had not been reduced during the applicable periods shown.
B Total returns do not include the effect of the contingent deferred sales charge.
C Calculated based on average shares outstanding during the period.
D Fees and expenses of any underlying Fidelity Central Funds are not included in the Fund's expense ratio. The Fund indirectly bears its proportionate share of the expenses of any underlying Fidelity Central Funds.
E Amount does not include the portfolio activity of any underlying Fidelity Central Funds.
F Investment income per share reflects a special dividend which amounted to $.01 per share. Excluding the special dividend, the ratio of net investment income (loss) to average net assets would have been (1.79)%.
G Investment income per share reflects a special dividend which amounted to $.01 per share. Excluding the special dividend, the ratio of net investment income (loss) to average net assets would have been (2.04)%.
H Investment income per share reflects a special dividend which amounted to $.01 per share. Excluding the special dividend, the ratio of net investment income (loss) to average net assets would have been (2.08)%.
I Expense ratios reflect operating expenses of the class. Expenses before reductions do not reflect amounts reimbursed by the investment adviser or reductions from brokerage service arrangements or reductions from other expense offset arrangements and do not represent the amount paid by the class during periods when reimbursements or reductions occur. Expenses net of fee waivers reflect expenses after reimbursement by the investment adviser but prior to reductions from brokerage service arrangements or other expense offset arrangements. Expenses net of all reductions represent the net expenses paid by the class.
J Amount represents less than $.01 per share.
Financial Highlights - Class C
Years ended July 31, | 2011 | 2010 | 2009 | 2008 | 2007 |
Selected Per-Share Data | | | | | |
Net asset value, beginning of period | $ 6.18 | $ 6.47 | $ 7.34 | $ 6.88 | $ 6.52 |
Income from Investment Operations | | | | | |
Net investment income (loss) C | (.12) F | (.12) G | (.12) | (.13) H | (.14) |
Net realized and unrealized gain (loss) | 2.04 | (.17) | (.75) | 1.12 | .50 |
Total from investment operations | 1.92 | (.29) | (.87) | .99 | .36 |
Distributions from net realized gain | - | - | - | (.53) | - |
Redemption fees added to paid in capital C, J | - | - | - | - | - |
Net asset value, end of period | $ 8.10 | $ 6.18 | $ 6.47 | $ 7.34 | $ 6.88 |
Total Return A, B | 31.07% | (4.48)% | (11.85)% | 14.96% | 5.52% |
Ratios to Average Net Assets D, I | | | | | |
Expenses before reductions | 2.10% | 2.14% | 2.15% | 2.12% | 2.16% |
Expenses net of fee waivers, if any | 2.10% | 2.14% | 2.15% | 2.12% | 2.15% |
Expenses net of all reductions | 2.09% | 2.13% | 2.15% | 2.12% | 2.15% |
Net investment income (loss) | (1.66)% F | (1.90)% G | (2.02)% | (2.00)% H | (1.99)% |
Supplemental Data | | | | | |
Net assets, end of period (000 omitted) | $ 15,787 | $ 11,421 | $ 12,426 | $ 13,323 | $ 11,813 |
Portfolio turnover rate E | 99% | 130% | 73% | 132% | 120% |
A Total returns would have been lower if certain expenses had not been reduced during the applicable periods shown.
B Total returns do not include the effect of the contingent deferred sales charge.
C Calculated based on average shares outstanding during the period.
D Fees and expenses of any underlying Fidelity Central Funds are not included in the Fund's expense ratio. The Fund indirectly bears its proportionate share of the expenses of any underlying Fidelity Central Funds.
E Amount does not include the portfolio activity of any underlying Fidelity Central Funds.
F Investment income per share reflects a special dividend which amounted to $.01 per share. Excluding the special dividend, the ratio of net investment income (loss) to average net assets would have been (1.79)%.
G Investment income per share reflects a special dividend which amounted to $.01 per share. Excluding the special dividend, the ratio of net investment income (loss) to average net assets would have been (2.04)%.
H Investment income per share reflects a special dividend which amounted to $.01 per share. Excluding the special dividend, the ratio of net investment income (loss) to average net assets would have been (2.08)%.
I Expense ratios reflect operating expenses of the class. Expenses before reductions do not reflect amounts reimbursed by the investment adviser or reductions from brokerage service arrangements or reductions from other expense offset arrangements and do not represent the amount paid by the class during periods when reimbursements or reductions occur. Expenses net of fee waivers reflect expenses after reimbursement by the investment adviser but prior to reductions from brokerage service arrangements or other expense offset arrangements. Expenses net of all reductions represent the net expenses paid by the class.
J Amount represents less than $.01 per share.
See accompanying notes which are an integral part of the financial statements.
Annual Report
Financial Highlights - Institutional Class
Years ended July 31, | 2011 | 2010 | 2009 | 2008 | 2007 |
Selected Per-Share Data | | | | | |
Net asset value, beginning of period | $ 6.87 | $ 7.12 | $ 8.00 | $ 7.37 | $ 6.91 |
Income from Investment Operations | | | | | |
Net investment income (loss) B | (.05) E | (.06) F | (.06) | (.07) G | (.07) |
Net realized and unrealized gain (loss) | 2.28 | (.19) | (.82) | 1.23 | .53 |
Total from investment operations | 2.23 | (.25) | (.88) | 1.16 | .46 |
Distributions from net realized gain | - | - | - | (.53) | - |
Redemption fees added to paid in capital B, I | - | - | - | - | - |
Net asset value, end of period | $ 9.10 | $ 6.87 | $ 7.12 | $ 8.00 | $ 7.37 |
Total Return A | 32.46% | (3.51)% | (11.00)% | 16.35% | 6.66% |
Ratios to Average Net Assets C, H | | | | | |
Expenses before reductions | 1.04% | 1.07% | 1.11% | 1.06% | 1.06% |
Expenses net of fee waivers, if any | 1.04% | 1.07% | 1.11% | 1.06% | 1.06% |
Expenses net of all reductions | 1.03% | 1.06% | 1.11% | 1.06% | 1.06% |
Net investment income (loss) | (.60)% E | (.83)% F | (.98)% | (.94)% G | (.91)% |
Supplemental Data | | | | | |
Net assets, end of period (000 omitted) | $ 5,903 | $ 3,008 | $ 1,901 | $ 1,117 | $ 991 |
Portfolio turnover rate D | 99% | 130% | 73% | 132% | 120% |
A Total returns would have been lower if certain expenses had not been reduced during the applicable periods shown.
B Calculated based on average shares outstanding during the period.
C Fees and expenses of any underlying Fidelity Central Funds are not included in the Fund's expense ratio. The Fund indirectly bears its proportionate share of the expenses of any underlying Fidelity Central Funds.
D Amount does not include the portfolio activity of any underlying Fidelity Central Funds.
E Investment income per share reflects a special dividend which amounted to $.01 per share. Excluding the special dividend, the ratio of net investment income (loss) to average net assets would have been (.73)%.
F Investment income per share reflects a special dividend which amounted to $.01 per share. Excluding the special dividend, the ratio of net investment income (loss) to average net assets would have been (.97)%.
G Investment income per share reflects a special dividend which amounted to $.01 per share. Excluding the special dividend, the ratio of net investment income (loss) to average net assets would have been (1.02)%.
H Expense ratios reflect operating expenses of the class. Expenses before reductions do not reflect amounts reimbursed by the investment adviser or reductions from brokerage service arrangements or reductions from other expense offset arrangements and do not represent the amount paid by the class during periods when reimbursements or reductions occur. Expenses net of fee waivers reflect expenses after reimbursement by the investment adviser but prior to reductions from brokerage service arrangements or other expense offset arrangements. Expenses net of all reductions represent the net expenses paid by the class.
I Amount represents less than $.01 per share.
See accompanying notes which are an integral part of the financial statements.
Annual Report
Notes to Financial Statements
For the period ended July 31, 2011
1. Organization.
Fidelity Advisor Biotechnology Fund (the Fund) is a non-diversified fund of Fidelity Advisor Series VII (the Trust) and is authorized to issue an unlimited number of shares. The Trust is registered under the Investment Company Act of 1940, as amended (the 1940 Act), as an open-end management investment company organized as a Massachusetts business trust. The Fund offers Class A, Class T, Class C and Institutional Class shares, each of which, along with Class B shares, has equal rights as to assets and voting privileges. Effective after the close of business on September 1, 2010, Class B shares were closed to new accounts and additional purchases, except for exchanges and reinvestments, by existing shareholders. Each class has exclusive voting rights with respect to matters that affect that class. Class B shares will automatically convert to Class A shares after a holding period of seven years from the initial date of purchase. Investment income, realized and unrealized capital gains and losses, the common expenses of the Fund, and certain fund-level expense reductions, if any, are allocated on a pro-rata basis to each class based on the relative net assets of each class to the total net assets of the Fund. Each class differs with respect to transfer agent and distribution and service plan fees incurred. Certain expense reductions may also differ by class.
2. Investments in Fidelity Central Funds.
The Fund invests in Fidelity Central Funds, which are open-end investment companies available only to other investment companies and accounts managed by Fidelity Management & Research Company (FMR) and its affiliates. The Fund's Schedule of Investments lists each of the Fidelity Central Funds held as of period end, if any, as an investment of the Fund, but does not include the underlying holdings of each Fidelity Central Fund. As an Investing Fund, the Fund indirectly bears its proportionate share of the expenses of the underlying Fidelity Central Funds.
The Money Market Central Funds seek preservation of capital and current income and are managed by Fidelity Investments Money Management, Inc. (FIMM), an affiliate of FMR.
A complete unaudited list of holdings for each Fidelity Central Fund is available upon request or at the Securities and Exchange Commission (the SEC) web site at www.sec.gov. In addition, the financial statements of the Fidelity Central Funds, which are not covered by the Fund's Report of Independent Registered Public Accounting Firm, are available on the SEC web site or upon request.
3. Significant Accounting Policies.
The financial statements have been prepared in conformity with accounting principles generally accepted in the United States of America (GAAP), which require management to make certain estimates and assumptions at the date of the financial statements. Actual results could differ from those estimates. Subsequent events, if any, through the date that the financial statements were issued have been evaluated in the preparation of the financial statements. The following summarizes the significant accounting policies of the Fund:
Security Valuation. Investments are valued as of 4:00 p.m. Eastern time on the last calendar day of the period. The Fund uses independent pricing services approved by the Board of Trustees to value its investments. When current market prices or quotations are not readily available or reliable, valuations may be determined in good faith in accordance with procedures adopted by the Board of Trustees. Factors used in determining value may include market or security specific events. The frequency with which these procedures are used cannot be predicted and they may be utilized to a significant extent. The value used for net asset value (NAV) calculation under these procedures may differ from published prices for the same securities.
The Fund categorizes the inputs to valuation techniques used to value its investments into a disclosure hierarchy consisting of three levels as shown below:
Level 1 - quoted prices in active markets for identical investments
Level 2 - other significant observable inputs (including quoted prices for similar investments, interest rates, prepayment speeds, etc.)
Level 3 - unobservable inputs (including the Fund's own assumptions based on the best information available)
Changes in valuation techniques may result in transfers in or out of an assigned level within the disclosure hierarchy. The aggregate value of investments by input level, as of July 31, 2011, is included at the end of the Fund's Schedule of Investments. Valuation techniques used to value the Fund's investments by major category are as follows:
Equity securities, including restricted securities, for which market quotations are readily available, are valued at the last reported sale price or official closing price as reported by an independent pricing service on the primary market or exchange on which they are traded and are categorized as Level 1 in the hierarchy. In the event there were no sales during the day or closing prices are not available, securities are valued at the last quoted bid price or may be valued using the last available price and are generally categorized as Level 2 in the hierarchy. For foreign equity securities, when significant market or security specific events arise, comparisons to the valuation of American Depositary Receipts (ADRs), futures contracts, Exchange-traded funds (ETFs) and certain indexes as well as quoted prices for similar securities are used and are categorized as Level 2 in the hierarchy in these
Annual Report
Notes to Financial Statements - continued
3. Significant Accounting Policies - continued
Security Valuation - continued
circumstances. Utilizing these techniques may result in transfers between Level 1 and Level 2. For restricted equity securities and private placements where observable inputs are limited, assumptions about market activity and risk are used and are categorized as Level 3 in the hierarchy.
Investments in open-end mutual funds, including the Fidelity Central Funds, are valued at their closing net asset value each business day and are categorized as Level 1 in the hierarchy.
Foreign Currency. The Fund may use foreign currency contracts to facilitate transactions in foreign-denominated securities. Gains and losses from these transactions may arise from changes in the value of the foreign currency or if the counterparties do not perform under the contracts' terms.
Foreign-denominated assets, including investment securities, and liabilities are translated into U.S. dollars at the exchange rate at period end. Purchases and sales of investment securities, income and dividends received and expenses denominated in foreign currencies are translated into U.S. dollars at the exchange rate in effect on the transaction date.
The effects of exchange rate fluctuations on investments are included with the net realized and unrealized gain (loss) on investment securities. Other foreign currency transactions resulting in realized and unrealized gain (loss) are disclosed separately.
Investment Transactions and Income. For financial reporting purposes, the Fund's investment holdings and NAV include trades executed through the end of the last business day of the period. The NAV per share for processing shareholder transactions is calculated as of the close of business of the New York Stock Exchange (NYSE), normally 4:00 p.m. Eastern time and includes trades executed through the end of the prior business day. Gains and losses on securities sold are determined on the basis of identified cost and may include proceeds received from litigation. Dividend income is recorded on the ex-dividend date, except for certain dividends from foreign securities where the ex-dividend date may have passed, which are recorded as soon as the Fund is informed of the ex-dividend date. Non-cash dividends included in dividend income, if any, are recorded at the fair market value of the securities received. Distributions received on securities that represent a return of capital or capital gain are recorded as a reduction of cost of investments and/or as a realized gain. The Fund estimates the components of distributions received that may be considered return of capital distributions or capital gain distributions. Large, non-recurring dividends recognized by the Fund are presented separately on the Statement of Operations as "Special Dividends" and the impact of these dividends is presented in the Financial Highlights. Interest income and distributions from the Fidelity Central Funds are accrued as earned. Interest income includes coupon interest and amortization of premium and accretion of discount on debt securities. Investment income is recorded net of foreign taxes withheld where recovery of such taxes is uncertain.
Expenses. Expenses directly attributable to a fund are charged to that fund. Expenses attributable to more than one fund are allocated among the respective funds on the basis of relative net assets or other appropriate methods. Expense estimates are accrued in the period to which they relate and adjustments are made when actual amounts are known.
Income Tax Information and Distributions to Shareholders. Each year, the Fund intends to qualify as a regulated investment company, including distributing substantially all of its taxable income and realized gains under Subchapter M of the Internal Revenue Code and filing its U.S. federal tax return. As a result, no provision for income taxes is required. As of July 31, 2011, the Fund did not have any unrecognized tax benefits in the financial statements. A fund's federal tax return is subject to examination by the Internal Revenue Service (IRS) for a period of three years. Foreign taxes are provided for based on the Fund's understanding of the tax rules and rates that exist in the foreign markets in which it invests.
Distributions are declared and recorded on the ex-dividend date. Income dividends and capital gain distributions are declared separately for each class. Income and capital gain distributions are determined in accordance with income tax regulations, which may differ from GAAP.
Capital accounts within the financial statements are adjusted for permanent book-tax differences. These adjustments have no impact on net assets or the results of operations. Temporary book-tax differences will reverse in a subsequent period.
Book-tax differences are primarily due to foreign currency transactions, net operating losses, capital loss carryforwards, and losses deferred due to wash sales and excise tax regulations.
The federal tax cost of investment securities and unrealized appreciation (depreciation) as of period end were as follows:
Gross unrealized appreciation | $ 17,373,315 |
Gross unrealized depreciation | (3,388,141) |
Net unrealized appreciation (depreciation) on securities and other investments | $ 13,985,174 |
| |
Tax Cost | $ 68,571,128 |
Annual Report
3. Significant Accounting Policies - continued
Income Tax Information and Distributions to Shareholders - continued
The tax-based components of distributable earnings as of period end were as follows:
Capital loss carryforward | $ (1,530,367) |
Net unrealized appreciation (depreciation) | $ 13,985,174 |
Under the recently enacted Regulated Investment Company Modernization Act of 2010 (the Act), the Fund will be permitted to carry forward capital losses incurred in taxable years beginning after December 22, 2010 for an unlimited period. However, any losses incurred during those future taxable years will be required to be utilized prior to any losses incurred in pre-enactment taxable years, which generally expire after eight years from when they are incurred. Additionally, post-enactment capital losses that are carried forward will retain their character as either short-term or long-term capital losses rather than being considered all short-term as under previous law. The Fund's first fiscal year end subject to the Act will be July 31, 2012.
Short-Term Trading (Redemption) Fees. Shares held by investors in the Fund less than 30 days are subject to a redemption fee equal to .75% of the net asset value of shares redeemed. All redemption fees, which reduce the proceeds of the shareholder redemption, are retained by the Fund and accounted for as an addition to paid in capital.
New Accounting Pronouncement. In May 2011, the Financial Accounting Standards Board issued Accounting Standard Update No. 2011-04, Fair Value Measurement (Topic 820) - Amendments to Achieve Common Fair Value Measurement and Disclosure Requirements in U.S. GAAP and IFRSs. The update changes the wording used to describe the requirements in GAAP for measuring fair value and for disclosing information about fair value measurements. The update is effective during interim and annual periods beginning after December 15, 2011. Management is currently evaluating the impact of the update's adoption on the Fund's financial statement disclosures.
4. Operating Policies.
Restricted Securities. The Fund may invest in securities that are subject to legal or contractual restrictions on resale. These securities generally may be resold in transactions exempt from registration or to the public if the securities are registered. Disposal of these securities may involve time-consuming negotiations and expense, and prompt sale at an acceptable price may be difficult. Information regarding securities is included at the end of the Fund's Schedule of Investments.
5. Purchases and Sales of Investments.
Purchases and sales of securities, other than short-term securities, aggregated $62,081,587 and $58,253,150, respectively.
6. Fees and Other Transactions with Affiliates.
Management Fee. FMR and its affiliates provide the Fund with investment management related services for which the Fund pays a monthly management fee. The management fee is the sum of an individual fund fee rate that is based on an annual rate of .30% of the Fund's average net assets and a group fee rate that averaged .26% during the period. The group fee rate is based upon the average net assets of all the mutual funds advised by FMR. The group fee rate decreases as assets under management increase and increases as assets under management decrease. For the period, the total annual management fee rate was .56% of the Fund's average net assets.
Distribution and Service Plan Fees. In accordance with Rule 12b-1 of the 1940 Act, the Fund has adopted separate Distribution and Service Plans for each class of shares. Certain classes pay Fidelity Distributors Corporation (FDC), an affiliate of FMR, separate Distribution and Service Fees, each of which is based on an annual percentage of each class' average net assets. In addition, FDC may pay financial intermediaries for selling shares of the Fund and providing shareholder support services.
For the period, the Distribution and Service Fee rates, total fees and amounts retained by FDC were as follows:
| Distribution
Fee | Service
Fee | Total Fees | Retained
by FDC |
Class A | -% | .25% | $ 58,447 | $ 603 |
Class T | .25% | .25% | 68,378 | 324 |
Class B | .75% | .25% | 58,357 | 43,808 |
Class C | .75% | .25% | 126,855 | 18,450 |
| | | $ 312,037 | $ 63,185 |
Annual Report
Notes to Financial Statements - continued
6. Fees and Other Transactions with Affiliates - continued
Sales Load. FDC may receive a front-end sales charge of up to 5.75% for selling Class A shares, and 3.50% for selling Class T shares, some of which is paid to financial intermediaries for selling shares of the Fund. Depending on the holding period, FDC may receive contingent deferred sales charges levied on Class A, Class T, Class B, and Class C redemptions. The deferred sales charges range from 5% to 1% for Class B, 1% for Class C, 1.00% for certain purchases of Class A shares and .25% for certain purchases of Class T shares.
For the period, sales charge amounts retained by FDC were as follows:
| Retained
by FDC |
Class A | $ 17,148 |
Class T | 6,533 |
Class B* | 12,854 |
Class C* | 572 |
| $ 37,107 |
* When Class B and Class C shares are initially sold, FDC pays commissions from its own resources to financial intermediaries through which the sales are made.
Transfer Agent Fees. Fidelity Investments Institutional Operations Company, Inc. (FIIOC), an affiliate of FMR, is the transfer, dividend disbursing and shareholder servicing agent for each class of the Fund. FIIOC receives account fees and asset-based fees that vary according to the account size and type of account of the shareholders of the respective classes of the Fund. FIIOC pays for typesetting, printing and mailing of shareholder reports, except proxy statements. For the period, transfer agent fees for each class were as follows:
| Amount | % of
Average
Net Assets |
Class A | $ 70,163 | .30 |
Class T | 47,123 | .35 |
Class B | 17,595 | .30 |
Class C | 38,036 | .30 |
Institutional Class | 9,039 | .24 |
| $ 181,956 | |
Accounting and Security Lending Fees. Fidelity Service Company, Inc. (FSC), an affiliate of FMR, maintains the Fund's accounting records. The accounting fee is based on the level of average net assets for the month. Under a separate contract, FSC administers the security lending program. The security lending fee is based on the number and duration of lending transactions.
Brokerage Commissions. The Fund placed a portion of its portfolio transactions with brokerage firms which are affiliates of the investment adviser. The commissions paid to these affiliated firms were $1,659 for the period.
7. Committed Line of Credit.
The Fund participates with other funds managed by FMR or an affiliate in a $4.0 billion credit facility (the "line of credit") to be utilized for temporary or emergency purposes to fund shareholder redemptions or for other short-term liquidity purposes. The Fund has agreed to pay commitment fees on its pro-rata portion of the line of credit, which amounted to $191 and is reflected in Miscellaneous expenses on the Statement of Operations. During the period, there were no borrowings on this line of credit.
8. Security Lending.
The Fund lends portfolio securities through a lending agent from time to time in order to earn additional income. The lending agent may loan securities to certain qualified borrowers, including Fidelity Capital Markets (FCM), a broker-dealer affiliated with the Fund. On the settlement date of the loan, the Fund receives collateral (in the form of U.S. Treasury obligations, letters of credit and/or cash) against the loaned securities and maintains collateral in an amount not less than 100% of the market value of the loaned securities during the period of the loan. The market value of the loaned securities is determined at the close of business of the Fund and any additional required collateral is delivered to the Fund on the next business day. If the borrower defaults on its obligation to return the securities loaned because of insolvency or other reasons, a fund could experience delays and costs in recovering the securities loaned or in gaining access to the collateral. Any cash collateral received is invested in the Fidelity Securities Lending Cash Central Fund. The value of loaned securities and cash collateral at period end are disclosed on the Fund's Statement of Assets and Liabilities. Security
Annual Report
8. Security Lending - continued
lending income represents the income earned on investing cash collateral, less rebates paid to borrowers and lending agent fees associated with the loan, plus any premium payments received for lending certain types of securities. Security lending income is presented in the Statement of Operations as a component of income from Fidelity Central Funds, and includes $128 from securities loaned to FCM.
9. Expense Reductions.
Many of the brokers with whom FMR places trades on behalf of the Fund provided services to the Fund in addition to trade execution. These services included payments of certain expenses on behalf of the Fund totaling $3,845 for the period.
10. Share Transactions.
Transactions for each class of shares were as follows:
| Shares | Dollars |
Years ended July 31, | 2011 | 2010 | 2011 | 2010 |
Class A | | | | |
Shares sold | 1,294,694 | 1,118,865 | $ 10,912,748 | $ 7,975,997 |
Shares redeemed | (838,372) | (959,085) | (6,529,914) | (6,583,930) |
Net increase (decrease) | 456,322 | 159,780 | $ 4,382,834 | $ 1,392,067 |
Class T | | | | |
Shares sold | 489,230 | 412,827 | $ 3,897,385 | $ 2,848,621 |
Shares redeemed | (364,605) | (585,419) | (2,767,714) | (3,906,373) |
Net increase (decrease) | 124,625 | (172,592) | $ 1,129,671 | $ (1,057,752) |
Class B | | | | |
Shares sold | 84,075 | 304,652 | $ 609,091 | $ 1,993,007 |
Shares redeemed | (381,301) | (424,638) | (2,636,098) | (2,696,945) |
Net increase (decrease) | (297,226) | (119,986) | $ (2,027,007) | $ (703,938) |
Class C | | | | |
Shares sold | 539,125 | 489,582 | $ 4,217,149 | $ 3,216,700 |
Shares redeemed | (438,419) | (559,923) | (3,130,462) | (3,577,484) |
Net increase (decrease) | 100,706 | (70,341) | $ 1,086,687 | $ (360,784) |
Institutional Class | | | | |
Shares sold | 436,761 | 453,122 | $ 3,719,527 | $ 3,410,559 |
Shares redeemed | (225,982) | (282,175) | (1,769,416) | (1,995,414) |
Net increase (decrease) | 210,779 | 170,947 | $ 1,950,111 | $ 1,415,145 |
11. Other.
The Fund's organizational documents provide former and current trustees and officers with a limited indemnification against liabilities arising in connection with the performance of their duties to the Fund. In the normal course of business, the Fund may also enter into contracts that provide general indemnifications. The Fund's maximum exposure under these arrangements is unknown as this would be dependent on future claims that may be made against the Fund. The risk of material loss from such claims is considered remote.
Annual Report
Fidelity Advisor Communications Equipment Fund - Institutional Class
Performance: The Bottom Line
Average annual total return reflects the change in the value of an investment, assuming reinvestment of the class' distributions from dividend income and capital gains (the profits earned upon the sale of securities that have grown in value, if any) and assuming a constant rate of performance each year. The $10,000 table and the fund's returns do not reflect the deduction of taxes that a shareholder would pay on fund distributions or the redemption of fund shares. During periods of reimbursement by Fidelity, a fund's total return will be greater than it would be had the reimbursement not occurred. How a fund did yesterday is no guarantee of how it will do tomorrow.
Average Annual Total Returns
Periods ended July 31, 2011 | Past 1
year | Past 5
years | Past 10
years |
Institutional Class A | 12.61% | 6.53% | 1.88% |
A Prior to October 1, 2006, Fidelity Advisor Communications Eqipment Fund operated under certain different investment policies. The historical performance for the fund may not represent its current investment policies.
$10,000 Over 10 Years
Let's say hypothetically that $10,000 was invested in Fidelity Advisor Communications Equipment Fund - Institutional Class on July 31, 2001. The chart shows how the value of your investment would have changed, and also shows how the S&P 500 Index performed over the same period.
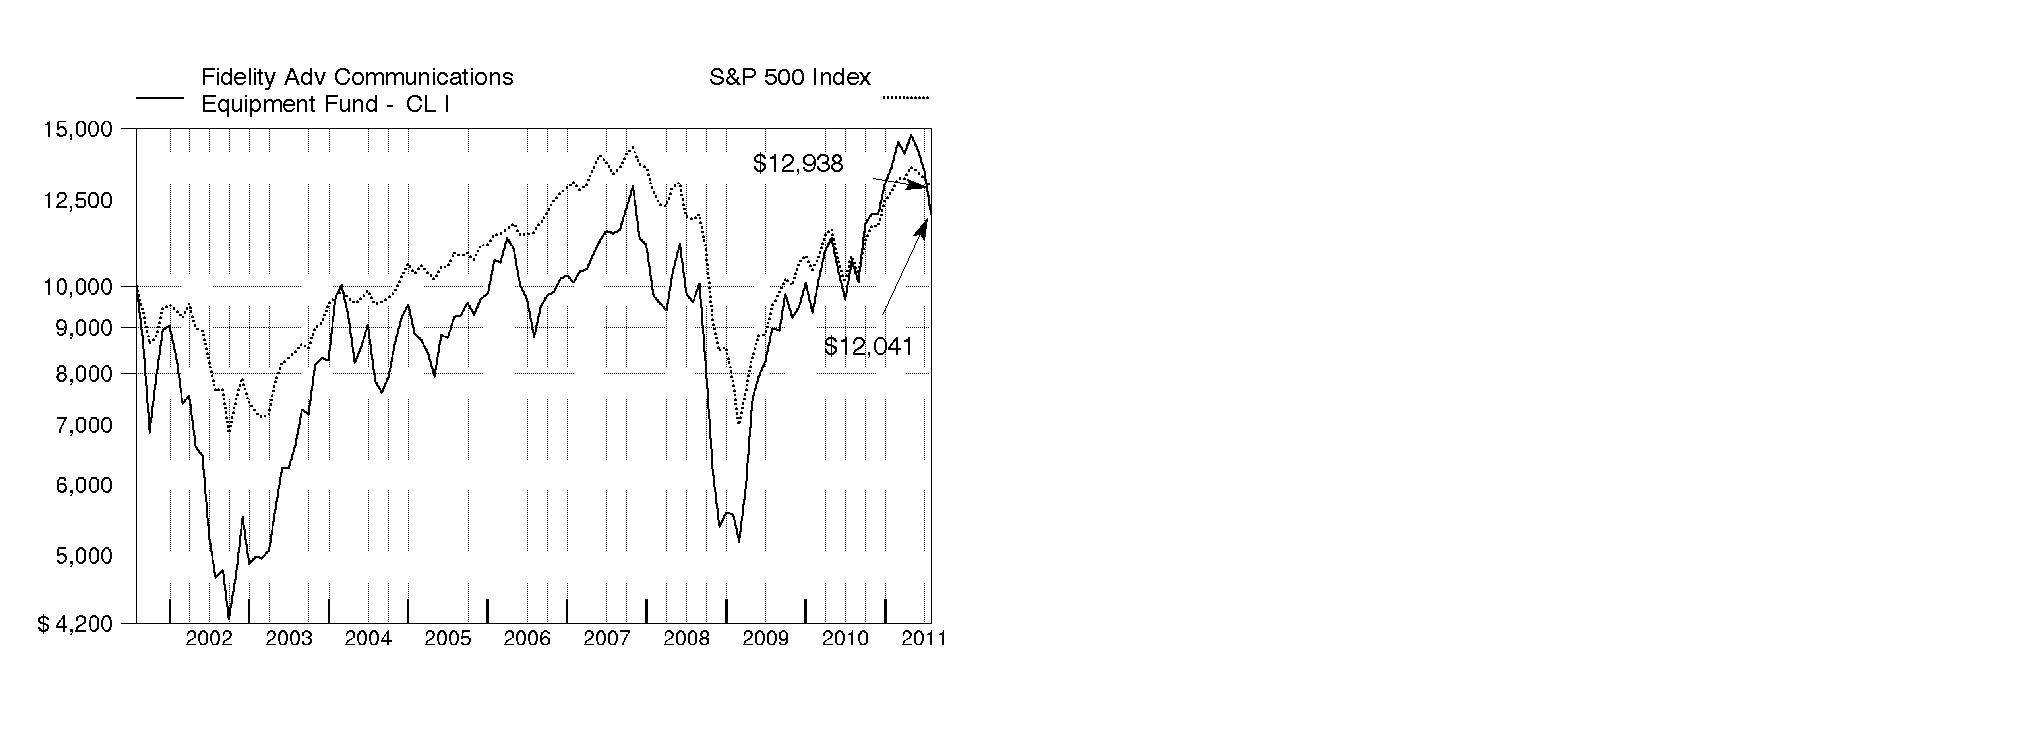
Annual Report
Fidelity Advisor Communications Equipment Fund
Market Recap: U.S. stocks registered solid double-digit gains for the 12 months ending July 31, 2011, extending a rally that began more than two years earlier. Despite a rough start in August 2010, markets turned positive in September, as increased demand for capital goods and other upbeat indicators trumped investor worry about a U.S. recessionary relapse. The broad market, as measured by the S&P 500® Index, rose 9% that month, its biggest September gain in 71 years. Seven more monthly advances followed, fueled by encouraging corporate earnings and economic activity. However, volatility picked up in the period's latter months, as markets reacted to continued high U.S. unemployment, nagging debt troubles in Europe and looming legislative battles over the federal debt ceiling. May unemployment rose above 9% for the first time in 2011, contributing to a traditional "June swoon" for stocks. Market uncertainty lingered in July, when the S&P 500® posted its second-biggest monthly loss of the period. For the full year, the S&P 500® climbed 19.65%, while the blue-chip-laden Dow Jones Industrial AverageSM rose a comparable 19.09% and the technology-heavy Nasdaq Composite® Index gained 23.40%. On the capitalization spectrum, stocks of mid-cap companies fared best, with the Russell Midcap® Index rising 24.51% and the small-cap Russell 2000® Index adding 23.92%.
Comments from Charlie Chai, Portfolio Manager of Fidelity Advisor® Communications Equipment Fund: During the past year, the fund's Class A, Class T, Class B and Class C shares returned 12.23%, 12.06%, 11.54% and 11.41%, respectively (excluding sales charges), well ahead of the 3.14% advance of the S&P® Custom Communications Equipment Index but lagging the S&P 500. Versus its industry benchmark, stock picking in communications equipment, which represented the vast majority of the fund's net assets during the period, was primarily responsible for its outperformance. Out-of-benchmark exposure to a variety of groups, especially wireless telecommunication services, systems software, application software and electronic manufacturing services, also bolstered the fund's results. Three of the four largest individual contributors were weak-performing benchmark components in which the fund had relatively light exposure. Large underweightings in Canadian smartphone maker Research In Motion - which I sold - and Finnish handset manufacturer Nokia were particularly beneficial, jointly accounting for more than six percentage points of outperformance for the fund. Underweighting networking equipment provider Cisco Systems, a major benchmark component, also proved beneficial, as the company's size and lack of strategic focus began to catch up with it, resulting in slowing growth and poor stock performance. I'll also mention an out-of-index position in Taiwan-based HTC, one of the smartphone makers using Google's AndroidTM operating system that "ate the lunch" of less well-positioned rivals. Acme Packet, which makes session-border-control equipment used to integrate Internet Protocol (IP) capabilities with corporate phone systems, was a success story from the first half of the period, and I sold some of the position to lock in profits. Conversely, not owning benchmark constituent InterDigital, a provider of products that enable wireless communications, worked against the fund's relative performance, as the stock surged in July amid rumors the company might be bought by Google. Underweighting communications equipment firm Motorola, known as Motorola Solutions as of January 4, 2011, also detracted. Meanwhile, a slight average overweighting in Finisar, a maker of optical subsystems and components for local area networks, hampered results. The stock took a big hit in March, when the company reduced its financial outlook.
Comments from Charlie Chai, Portfolio Manager of Fidelity Advisor® Communications Equipment Fund: During the past year, the fund's Institutional Class shares returned 12.61%, well ahead of the 3.14% advance of the S&P® Custom Communications Equipment Index but lagging the S&P 500. Versus its industry benchmark, stock picking in communications equipment, which represented the vast majority of the fund's net assets during the period, was primarily responsible for its outperformance. Out-of-benchmark exposure to a variety of groups, especially wireless telecommunication services, systems software, application software and electronic manufacturing services, also bolstered the fund's results. Three of the four largest individual contributors were weak-performing benchmark components in which the fund had relatively light exposure. Large underweightings in Canadian smartphone maker Research In Motion - which I sold - and Finnish handset manufacturer Nokia were particularly beneficial, jointly accounting for more than six percentage points of outperformance for the fund. Underweighting networking equipment provider Cisco Systems, a major benchmark component, also proved beneficial, as the company's size and lack of strategic focus began to catch up with it, resulting in slowing growth and poor stock performance. I'll also mention an out-of-index position in Taiwan-based HTC, one of the smartphone makers using Google's AndroidTM operating system that "ate the lunch" of less well-positioned rivals. Acme Packet, which makes session-border-control equipment used to integrate Internet Protocol (IP) capabilities with corporate phone systems, was a success story from the first half of the period, and I sold some of the position to lock in profits. Conversely, not owning benchmark constituent InterDigital, a provider of products that enable wireless communications, worked against the fund's relative performance, as the stock surged in July amid rumors the company might be bought by Google. Underweighting communications equipment firm Motorola, known as Motorola Solutions as of January 4, 2011, also detracted. Meanwhile, a slight average overweighting in Finisar, a maker of optical subsystems and components for local area networks, hampered results. The stock took a big hit in March, when the company reduced its financial outlook.
The views expressed above reflect those of the portfolio manager(s) only through the end of the period as stated on the cover of this report and do not necessarily represent the views of Fidelity or any other person in the Fidelity organization. Any such views are subject to change at any time based upon market or other conditions and Fidelity disclaims any responsibility to update such views. These views may not be relied on as investment advice and, because investment decisions for a Fidelity fund are based on numerous factors, may not be relied on as an indication of trading intent on behalf of any Fidelity fund.
Annual Report
Fidelity Advisor Communications Equipment Fund
As a shareholder of the Fund, you incur two types of costs: (1) transaction costs, including sales charges (loads) on purchase payments or redemption proceeds, redemption fees, and (2) ongoing costs, including management fees, distribution and/or service (12b-1) fees and other Fund expenses. This Example is intended to help you understand your ongoing costs (in dollars) of investing in the Fund and to compare these costs with the ongoing costs of investing in other mutual funds.
The Example is based on an investment of $1,000 invested at the beginning of the period and held for the entire period (February 1, 2011 to July 31, 2011).
Actual Expenses
The first line of the accompanying table for each class of the Fund provides information about actual account values and actual expenses. You may use the information in this line, together with the amount you invested, to estimate the expenses that you paid over the period. Simply divide your account value by $1,000.00 (for example, an $8,600 account value divided by $1,000.00 = 8.6), then multiply the result by the number in the first line for a class of the Fund under the heading entitled "Expenses Paid During Period" to estimate the expenses you paid on your account during this period. In addition, the Fund, as a shareholder in the underlying Fidelity Central Funds, will indirectly bear its pro-rata share of the fees and expenses incurred by the underlying Fidelity Central Funds. These fees and expenses are not included in the Fund's annualized expense ratio used to calculate the expense estimate in the table below.
Hypothetical Example for Comparison Purposes
The second line of the accompanying table for each class of the Fund provides information about hypothetical account values and hypothetical expenses based on a Class' actual expense ratio and an assumed rate of return of 5% per year before expenses, which is not the Class' actual return. The hypothetical account values and expenses may not be used to estimate the actual ending account balance or expenses you paid for the period. You may use this information to compare the ongoing costs of investing in the Fund and other funds. To do so, compare this 5% hypothetical example with the 5% hypothetical examples that appear in the shareholder reports of the other funds. In addition, the Fund, as a shareholder in the underlying Fidelity Central Funds, will indirectly bear its pro-rata share of the fees and expenses incurred by the underlying Fidelity Central Funds. These fees and expenses are not included in the Fund's annualized expense ratio used to calculate the expense estimate in the table below.
Please note that the expenses shown in the table are meant to highlight your ongoing costs only and do not reflect any transaction costs. Therefore, the second line of the table is useful in comparing ongoing costs only, and will not help you determine the relative total costs of owning different funds. In addition, if these transactional costs were included, your costs would have been higher.
| Annualized
Expense Ratio | Beginning
Account Value
February 1, 2011 | Ending
Account Value
July 31, 2011 | Expenses Paid
During Period*
February 1, 2011 to
July 31, 2011 |
Class A | 1.40% | | | |
Actual | | $ 1,000.00 | $ 885.40 | $ 6.54 |
HypotheticalA | | $ 1,000.00 | $ 1,017.85 | $ 7.00 |
Class T | 1.65% | | | |
Actual | | $ 1,000.00 | $ 884.30 | $ 7.71 |
HypotheticalA | | $ 1,000.00 | $ 1,016.61 | $ 8.25 |
Class B | 2.15% | | | |
Actual | | $ 1,000.00 | $ 882.20 | $ 10.03 |
HypotheticalA | | $ 1,000.00 | $ 1,014.13 | $ 10.74 |
Class C | 2.15% | | | |
Actual | | $ 1,000.00 | $ 882.10 | $ 10.03 |
HypotheticalA | | $ 1,000.00 | $ 1,014.13 | $ 10.74 |
Institutional Class | 1.15% | | | |
Actual | | $ 1,000.00 | $ 886.50 | $ 5.38 |
HypotheticalA | | $ 1,000.00 | $ 1,019.09 | $ 5.76 |
A 5% return per year before expenses
* Expenses are equal to each Class' annualized expense ratio, multiplied by the average account value over the period, multiplied by 181/365 (to reflect the one-half year period).
Annual Report
Fidelity Advisor Communications Equipment Fund
Investment Changes (Unaudited)
Top Ten Stocks as of July 31, 2011 |
| % of fund's
net assets | % of fund's net assets
6 months ago |
Cisco Systems, Inc. | 12.9 | 16.3 |
Telefonaktiebolaget LM Ericsson (B Shares) sponsored ADR | 10.9 | 7.5 |
QUALCOMM, Inc. | 9.9 | 13.2 |
AsiaInfo-Linkage, Inc. | 3.7 | 0.3 |
Polycom, Inc. | 3.5 | 1.4 |
Alcatel-Lucent SA sponsored ADR | 3.0 | 2.5 |
Ciena Corp. | 3.0 | 2.6 |
American Tower Corp. Class A | 2.8 | 0.6 |
SBA Communications Corp. Class A | 2.6 | 0.6 |
Crown Castle International Corp. | 2.4 | 0.5 |
| 54.7 | |
Top Industries (% of fund's net assets) |
As of July 31, 2011 |
| Communications Equipment | 75.0% | |
 | Software | 8.5% | |
 | Wireless Telecommunication Services | 7.9% | |
 | Semiconductors & Semiconductor Equipment | 2.4% | |
 | Computers & Peripherals | 1.1% | |
| All Others* | 5.1% | |

As of January 31, 2011 |
| Communications Equipment | 81.3% | |
| Semiconductors & Semiconductor Equipment | 4.5% | |
| Electronic Equipment & Components | 3.4% | |
| Software | 3.3% | |
| Computers & Peripherals | 2.7% | |
| All Others* | 4.8% | |

* Includes short-term investments and net other assets. |
Annual Report
Fidelity Advisor Communications Equipment Fund
Investments July 31, 2011
Showing Percentage of Net Assets
Common Stocks - 97.2% |
| Shares | | Value |
COMMUNICATIONS EQUIPMENT - 74.9% |
Communications Equipment - 74.9% |
Acme Packet, Inc. (a) | 6,171 | | $ 363,595 |
ADTRAN, Inc. | 10,079 | | 333,514 |
ADVA AG Optical Networking (a) | 34,256 | | 211,255 |
Alcatel-Lucent SA sponsored ADR (a) | 172,557 | | 698,856 |
Arris Group, Inc. (a) | 18,971 | | 227,652 |
Aruba Networks, Inc. (a)(d) | 17,140 | | 393,363 |
Aviat Networks, Inc. (a) | 10,867 | | 42,055 |
BigBand Networks, Inc. (a) | 29,453 | | 57,433 |
Brocade Communications Systems, Inc. (a) | 89,459 | | 490,235 |
Calix Networks, Inc. (a)(d) | 10,300 | | 188,902 |
Ceragon Networks Ltd. (a) | 5,515 | | 68,772 |
Ciena Corp. (a)(d) | 45,109 | | 697,385 |
Cisco Systems, Inc. | 189,774 | | 3,030,689 |
Comba Telecom Systems Holdings Ltd. | 58,850 | | 54,064 |
Comtech Telecommunications Corp. | 2,300 | | 61,985 |
Comverse Technology, Inc. (a) | 906 | | 6,795 |
DG FastChannel, Inc. (a) | 2,700 | | 76,302 |
Digi International, Inc. (a) | 2,700 | | 38,583 |
DragonWave, Inc. (a) | 18,300 | | 93,473 |
EchoStar Holding Corp. Class A (a) | 2,120 | | 70,935 |
EMCORE Corp. (a)(d) | 4,600 | | 12,052 |
Emulex Corp. (a) | 7,600 | | 64,220 |
Extreme Networks, Inc. (a) | 5,400 | | 18,306 |
F5 Networks, Inc. (a) | 746 | | 69,736 |
Finisar Corp. (a) | 29,759 | | 507,093 |
Harmonic, Inc. (a) | 11,860 | | 64,400 |
Harris Corp. | 6,700 | | 267,129 |
HTC Corp. | 2,520 | | 74,867 |
Infinera Corp. (a) | 2,800 | | 18,004 |
Ixia (a) | 16,496 | | 164,960 |
JDS Uniphase Corp. (a) | 13,664 | | 179,682 |
Juniper Networks, Inc. (a) | 14,688 | | 343,552 |
Motorola Mobility Holdings, Inc. | 11,341 | | 253,812 |
Motorola Solutions, Inc. | 147 | | 6,599 |
NETGEAR, Inc. (a) | 7,933 | | 261,075 |
Nokia Corp. sponsored ADR | 5 | | 29 |
Oclaro, Inc. (a)(d) | 18,075 | | 84,953 |
Oplink Communications, Inc. (a) | 1,854 | | 31,296 |
Opnext, Inc. (a) | 44,255 | | 83,642 |
Polycom, Inc. (a) | 30,000 | | 810,900 |
Powerwave Technologies, Inc. (a) | 30,200 | | 65,534 |
QUALCOMM, Inc. | 42,281 | | 2,316,153 |
Riverbed Technology, Inc. (a) | 15,758 | | 451,152 |
Sandvine Corp. (a) | 56,400 | | 124,529 |
Sandvine Corp. (U.K.) (a) | 65,330 | | 146,333 |
ShoreTel, Inc. (a) | 27,054 | | 230,500 |
Sierra Wireless, Inc. (a) | 17,900 | | 192,977 |
Sonus Networks, Inc. (a) | 44,300 | | 131,128 |
Sycamore Networks, Inc. | 5,600 | | 110,320 |
Tekelec (a) | 14,913 | | 117,067 |
|
| Shares | | Value |
Telefonaktiebolaget LM Ericsson (B Shares) sponsored ADR | 204,520 | | $ 2,556,500 |
Tellabs, Inc. | 6,000 | | 24,840 |
ViaSat, Inc. (a) | 11,300 | | 507,709 |
ZTE Corp. (H Shares) | 19,260 | | 60,174 |
| | 17,557,066 |
COMPUTERS & PERIPHERALS - 1.1% |
Computer Storage & Peripherals - 1.1% |
Gemalto NV | 2,573 | | 122,870 |
Novatel Wireless, Inc. (a) | 25,198 | | 129,266 |
| | 252,136 |
ELECTRICAL EQUIPMENT - 0.0% |
Electrical Components & Equipment - 0.0% |
A123 Systems, Inc. (a) | 100 | | 513 |
ELECTRONIC EQUIPMENT & COMPONENTS - 0.8% |
Electronic Components - 0.5% |
E Ink Holdings, Inc. | 16,000 | | 33,186 |
Universal Display Corp. (a) | 2,800 | | 83,748 |
| | 116,934 |
Electronic Manufacturing Services - 0.3% |
NeoPhotonics Corp. | 8,200 | | 60,516 |
TOTAL ELECTRONIC EQUIPMENT & COMPONENTS | | 177,450 |
INTERNET SOFTWARE & SERVICES - 0.7% |
Internet Software & Services - 0.7% |
Equinix, Inc. (a) | 300 | | 31,341 |
Keynote Systems, Inc. | 4,300 | | 102,985 |
Rackspace Hosting, Inc. (a) | 600 | | 24,000 |
| | 158,326 |
IT SERVICES - 0.1% |
Data Processing & Outsourced Services - 0.1% |
NeuStar, Inc. Class A (a) | 700 | | 18,228 |
IT Consulting & Other Services - 0.0% |
Yucheng Technologies Ltd. (a) | 1,200 | | 4,392 |
TOTAL IT SERVICES | | 22,620 |
MEDIA - 0.8% |
Advertising - 0.3% |
Focus Media Holding Ltd. ADR (a)(d) | 2,200 | | 72,358 |
Broadcasting - 0.2% |
Television Broadcasts Ltd. | 5,000 | | 34,226 |
Cable & Satellite - 0.3% |
Virgin Media, Inc. | 3,050 | | 80,703 |
TOTAL MEDIA | | 187,287 |
SEMICONDUCTORS & SEMICONDUCTOR EQUIPMENT - 2.4% |
Semiconductors - 2.4% |
Cavium, Inc. (a) | 2,499 | | 86,191 |
Common Stocks - continued |
| Shares | | Value |
SEMICONDUCTORS & SEMICONDUCTOR EQUIPMENT - CONTINUED |
Semiconductors - continued |
CSR PLC | 2,483 | | $ 11,380 |
Entropic Communications, Inc. (a) | 200 | | 1,336 |
Exar Corp. (a) | 143 | | 945 |
Ikanos Communications, Inc. (a) | 3,985 | | 5,021 |
Inphi Corp. | 2,400 | | 30,456 |
Marvell Technology Group Ltd. (a) | 2,300 | | 34,086 |
Netlogic Microsystems, Inc. (a) | 2,102 | | 72,624 |
ON Semiconductor Corp. (a) | 4,298 | | 37,350 |
Pericom Semiconductor Corp. (a) | 1,700 | | 13,906 |
Phison Electronics Corp. | 17,000 | | 85,353 |
Pixelplus Co. Ltd. ADR (a) | 900 | | 2,160 |
PLX Technology, Inc. (a) | 900 | | 3,069 |
PMC-Sierra, Inc. (a) | 3,100 | | 21,669 |
Spreadtrum Communications, Inc. ADR (d) | 8,830 | | 119,647 |
Standard Microsystems Corp. (a) | 1,200 | | 28,392 |
| | 553,585 |
SOFTWARE - 8.5% |
Application Software - 7.0% |
AsiaInfo-Linkage, Inc. (a)(d) | 55,700 | | 851,096 |
AutoNavi Holdings Ltd. ADR | 8,800 | | 145,728 |
BroadSoft, Inc. (a)(d) | 12,700 | | 370,967 |
KongZhong Corp. sponsored ADR (a) | 100 | | 493 |
NetScout Systems, Inc. (a) | 2,393 | | 36,493 |
SolarWinds, Inc. (a) | 5,729 | | 123,231 |
Synchronoss Technologies, Inc. (a) | 3,447 | | 100,825 |
Taleo Corp. Class A (a) | 100 | | 3,310 |
TeleNav, Inc. (a) | 300 | | 3,009 |
| | 1,635,152 |
Home Entertainment Software - 0.0% |
Giant Interactive Group, Inc. ADR (d) | 2,000 | | 15,380 |
Systems Software - 1.5% |
Allot Communications Ltd. (a) | 5,400 | | 80,028 |
Fortinet, Inc. (a) | 3,900 | | 79,248 |
Opnet Technologies, Inc. | 1,653 | | 56,714 |
Rovi Corp. (a) | 1,800 | | 95,346 |
TeleCommunication Systems, Inc. Class A (a) | 6,977 | | 35,443 |
| | 346,779 |
TOTAL SOFTWARE | | 1,997,311 |
|
| Shares | | Value |
WIRELESS TELECOMMUNICATION SERVICES - 7.9% |
Wireless Telecommunication Services - 7.9% |
American Tower Corp. Class A (a) | 12,490 | | $ 656,100 |
Crown Castle International Corp. (a) | 12,800 | | 555,520 |
Leap Wireless International, Inc. (a) | 300 | | 4,038 |
SBA Communications Corp. Class A (a) | 16,177 | | 617,476 |
SOFTBANK CORP. | 700 | | 27,376 |
| | 1,860,510 |
TOTAL COMMON STOCKS (Cost $22,160,300) | 22,766,804 |
Convertible Bonds - 0.1% |
| Principal
Amount | | |
COMMUNICATIONS EQUIPMENT - 0.1% |
Communications Equipment - 0.1% |
Ciena Corp. 0.25% 5/1/13
(Cost $20,000) | | $ 20,000 | | 19,270 |
Money Market Funds - 6.6% |
| Shares | | |
Fidelity Securities Lending Cash Central Fund, 0.15% (b)(c)
(Cost $1,558,200) | 1,558,200 | | 1,558,200 |
TOTAL INVESTMENT PORTFOLIO - 103.9% (Cost $23,738,500) | 24,344,274 |
NET OTHER ASSETS (LIABILITIES) - (3.9)% | | (913,710) |
NET ASSETS - 100% | $ 23,430,564 |
Legend |
(a) Non-income producing |
(b) Affiliated fund that is available only to investment companies and other accounts managed by Fidelity Investments. The rate quoted is the annualized seven-day yield of the fund at period end. A complete unaudited listing of the fund's holdings as of its most recent quarter end is available upon request. In addition, each Fidelity Central Fund's financial statements, which are not covered by the Fund's Report of Independent Registered Public Accounting Firm, are available on the SEC's website or upon request. |
(c) Investment made with cash collateral received from securities on loan. |
(d) Security or a portion of the security is on loan at period end. |
Affiliated Central Funds |
Information regarding fiscal year to date income earned by the Fund from investments in Fidelity Central Funds is as follows: |
Fund | Income earned |
Fidelity Cash Central Fund | $ 1,169 |
Fidelity Securities Lending Cash Central Fund | 26,436 |
Total | $ 27,605 |
Other Information |
The following is a summary of the inputs used, as of July 31, 2011, involving the Fund's assets and liabilities carried at fair value. The inputs or methodology used for valuing securities may not be an indication of the risk associated with investing in those securities. For more information on valuation inputs, and their aggregation into the levels used in the table below, please refer to the Security Valuation section in the accompanying Notes to Financial Statements. |
Valuation Inputs at Reporting Date: |
Description | Total | Level 1 | Level 2 | Level 3 |
Investments in Securities: | | | | |
Common Stocks | $ 22,766,804 | $ 22,766,804 | $ - | $ - |
Convertible Bonds | 19,270 | - | 19,270 | - |
Money Market Funds | 1,558,200 | 1,558,200 | - | - |
Total Investments in Securities: | $ 24,344,274 | $ 24,325,004 | $ 19,270 | $ - |
Distribution of investments by country of issue, as a percentage of total net assets, is as follows: (Unaudited) |
United States of America | 78.7% |
Sweden | 10.9% |
France | 3.0% |
Canada | 2.3% |
Cayman Islands | 1.1% |
Others (Individually Less Than 1%) | 4.0% |
| 100.0% |
See accompanying notes which are an integral part of the financial statements.
Annual Report
Fidelity Advisor Communications Equipment Fund
Statement of Assets and Liabilities
| July 31, 2011 |
| | |
Assets | | |
Investment in securities, at value (including securities loaned of $1,466,754) - See accompanying schedule: Unaffiliated issuers (cost $22,180,300) | $ 22,786,074 | |
Fidelity Central Funds (cost $1,558,200) | 1,558,200 | |
Total Investments (cost $23,738,500) | | $ 24,344,274 |
Receivable for investments sold | | 895,752 |
Receivable for fund shares sold | | 30,429 |
Dividends receivable | | 5,112 |
Interest receivable | | 12 |
Distributions receivable from Fidelity Central Funds | | 12,626 |
Other receivables | | 1,381 |
Total assets | | 25,289,586 |
| | |
Liabilities | | |
Payable to custodian bank | $ 18,570 | |
Payable for fund shares redeemed | 215,750 | |
Accrued management fee | 13,407 | |
Distribution and service plan fees payable | 10,804 | |
Other affiliated payables | 7,641 | |
Other payables and accrued expenses | 34,650 | |
Collateral on securities loaned, at value | 1,558,200 | |
Total liabilities | | 1,859,022 |
| | |
Net Assets | | $ 23,430,564 |
Net Assets consist of: | | |
Paid in capital | | $ 22,606,837 |
Accumulated net investment loss | | (2,793) |
Accumulated undistributed net realized gain (loss) on investments and foreign currency transactions | | 220,746 |
Net unrealized appreciation (depreciation) on investments | | 605,774 |
Net Assets | | $ 23,430,564 |
Statement of Assets and Liabilities - continued
| July 31, 2011 |
| | |
Calculation of Maximum Offering Price Class A:
Net Asset Value and redemption price per share ($8,786,662 ÷ 902,731 shares) | | $ 9.73 |
| | |
Maximum offering price per share (100/94.25 of $9.73) | | $ 10.32 |
Class T:
Net Asset Value and redemption price per share ($4,607,079 ÷ 485,940 shares) | | $ 9.48 |
| | |
Maximum offering price per share (100/96.50 of $9.48) | | $ 9.82 |
Class B:
Net Asset Value and offering price per share ($1,316,181 ÷ 146,463 shares)A | | $ 8.99 |
| | |
Class C:
Net Asset Value and offering price per share ($5,865,756 ÷ 653,028 shares)A | | $ 8.98 |
| | |
Institutional Class:
Net Asset Value, offering price and redemption price per share ($2,854,886 ÷ 285,476 shares) | | $ 10.00 |
A Redemption price per share is equal to net asset value less any applicable contingent deferred sales charge.
See accompanying notes which are an integral part of the financial statements.
Annual Report
Fidelity Advisor Communications Equipment Fund
Financial Statements - continued
Statement of Operations
| Year ended July 31, 2011 |
| | |
Investment Income | | |
Dividends | | $ 156,198 |
Interest | | 54 |
Income from Fidelity Central Funds (including $26,436 from security lending) | | 27,605 |
Total income | | 183,857 |
| | |
Expenses | | |
Management fee | $ 130,244 | |
Transfer agent fees | 70,336 | |
Distribution and service plan fees | 109,324 | |
Accounting and security lending fees | 9,461 | |
Custodian fees and expenses | 11,775 | |
Independent trustees' compensation | 118 | |
Registration fees | 54,576 | |
Audit | 46,085 | |
Legal | 85 | |
Miscellaneous | 171 | |
Total expenses before reductions | 432,175 | |
Expense reductions | (57,777) | 374,398 |
Net investment income (loss) | | (190,541) |
Realized and Unrealized Gain (Loss) Net realized gain (loss) on: | | |
Investment securities: | | |
Unaffiliated issuers | 1,594,195 | |
Foreign currency transactions | (3,915) | |
Total net realized gain (loss) | | 1,590,280 |
Change in net unrealized appreciation (depreciation) on: Investment securities | (1,230,505) | |
Assets and liabilities in foreign currencies | (5) | |
Total change in net unrealized appreciation (depreciation) | | (1,230,510) |
Net gain (loss) | | 359,770 |
Net increase (decrease) in net assets resulting from operations | | $ 169,229 |
Statement of Changes in Net Assets
| Year ended
July 31,
2011 | Year ended
July 31,
2010 |
Increase (Decrease) in Net Assets | | |
Operations | | |
Net investment income (loss) | $ (190,541) | $ (225,209) |
Net realized gain (loss) | 1,590,280 | 955,330 |
Change in net unrealized appreciation (depreciation) | (1,230,510) | 1,311,875 |
Net increase (decrease) in net assets resulting from operations | 169,229 | 2,041,996 |
Share transactions - net increase (decrease) | 8,972,466 | 1,341,807 |
Redemption fees | 1,851 | 1,464 |
Total increase (decrease) in net assets | 9,143,546 | 3,385,267 |
| | |
Net Assets | | |
Beginning of period | 14,287,018 | 10,901,751 |
End of period (including accumulated net investment loss of $2,793 and undistributed net investment income of $0, respectively) | $ 23,430,564 | $ 14,287,018 |
See accompanying notes which are an integral part of the financial statements.
Annual Report
Financial Highlights - Class A
Years ended July 31, | 2011 | 2010 | 2009 | 2008 | 2007 |
Selected Per-Share Data | | | | | |
Net asset value, beginning of period | $ 8.67 | $ 7.28 | $ 7.82 | $ 9.49 | $ 7.29 |
Income from Investment Operations | | | | | |
Net investment income (loss) C | (.06) | (.11) | .02 F | (.08) | (.09) |
Net realized and unrealized gain (loss) | 1.12 | 1.50 | (.56) | (1.45) | 2.29 |
Total from investment operations | 1.06 | 1.39 | (.54) | (1.53) | 2.20 |
Distributions from net realized gain | - | - | - | (.14) | - |
Redemption fees added to paid in capital C, H | - | - | - | - | - |
Net asset value, end of period | $ 9.73 | $ 8.67 | $ 7.28 | $ 7.82 | $ 9.49 |
Total Return A, B | 12.23% | 19.09% | (6.91)% | (16.43)% | 30.18% |
Ratios to Average Net Assets D, G | | | | | |
Expenses before reductions | 1.64% | 1.90% | 3.15% | 2.25% | 2.24% |
Expenses net of fee waivers, if any | 1.40% | 1.40% | 1.40% | 1.40% | 1.40% |
Expenses net of all reductions | 1.39% | 1.38% | 1.40% | 1.39% | 1.40% |
Net investment income (loss) | (.60)% | (1.32)% | .26% F | (.91)% | (1.00)% |
Supplemental Data | | | | | |
Net assets, end of period (000 omitted) | $ 8,787 | $ 4,860 | $ 3,476 | $ 2,459 | $ 2,825 |
Portfolio turnover rate E | 101% | 106% | 97% | 63% | 58% |
A Total returns would have been lower if certain expenses had not been reduced during the applicable periods shown.
B Total returns do not include the effect of the sales charges.
C Calculated based on average shares outstanding during the period.
D Fees and expenses of any underlying Fidelity Central Funds are not included in the Fund's expense ratio. The Fund indirectly bears its proportionate share of the expenses of any underlying Fidelity Central Funds.
E Amount does not include the portfolio activity of any underlying Fidelity Central Funds.
F Investment income per share reflects a special dividend which amounted to $.07 per share. Excluding the special dividend, the ratio of net investment income (loss) to average net assets would have been (.88)%.
G Expense ratios reflect operating expenses of the class. Expenses before reductions do not reflect amounts reimbursed by the investment adviser or reductions from brokerage service arrangements or reductions from other expense offset arrangements and do not represent the amount paid by the class during periods when reimbursements or reductions occur. Expenses net of fee waivers reflect expenses after reimbursement by the investment adviser but prior to reductions from brokerage service arrangements or other expense offset arrangements. Expenses net of all reductions represent the net expenses paid by the class.
H Amount represents less than $.01 per share.
Financial Highlights - Class T
Years ended July 31, | 2011 | 2010 | 2009 | 2008 | 2007 |
Selected Per-Share Data | | | | | |
Net asset value, beginning of period | $ 8.46 | $ 7.13 | $ 7.68 | $ 9.34 | $ 7.19 |
Income from Investment Operations | | | | | |
Net investment income (loss) C | (.09) | (.13) | - F, H | (.10) | (.11) |
Net realized and unrealized gain (loss) | 1.11 | 1.46 | (.55) | (1.42) | 2.26 |
Total from investment operations | 1.02 | 1.33 | (.55) | (1.52) | 2.15 |
Distributions from net realized gain | - | - | - | (.14) | - |
Redemption fees added to paid in capital C, H | - | - | - | - | - |
Net asset value, end of period | $ 9.48 | $ 8.46 | $ 7.13 | $ 7.68 | $ 9.34 |
Total Return A, B | 12.06% | 18.65% | (7.16)% | (16.59)% | 29.90% |
Ratios to Average Net Assets D, G | | | | | |
Expenses before reductions | 1.97% | 2.20% | 3.52% | 2.62% | 2.57% |
Expenses net of fee waivers, if any | 1.65% | 1.65% | 1.65% | 1.65% | 1.65% |
Expenses net of all reductions | 1.64% | 1.63% | 1.65% | 1.65% | 1.64% |
Net investment income (loss) | (.85)% | (1.57)% | .01% F | (1.16)% | (1.25)% |
Supplemental Data | | | | | |
Net assets, end of period (000 omitted) | $ 4,607 | $ 3,273 | $ 2,396 | $ 2,138 | $ 3,271 |
Portfolio turnover rate E | 101% | 106% | 97% | 63% | 58% |
A Total returns would have been lower if certain expenses had not been reduced during the applicable periods shown.
B Total returns do not include the effect of the sales charges.
C Calculated based on average shares outstanding during the period.
D Fees and expenses of any underlying Fidelity Central Funds are not included in the Fund's expense ratio. The Fund indirectly bears its proportionate share of the expenses of any underlying Fidelity Central Funds.
E Amount does not include the portfolio activity of any underlying Fidelity Central Funds.
F Investment income per share reflects a special dividend which amounted to $.06 per share. Excluding the special dividend, the ratio of net investment income (loss) to average net assets would have been (1.13)%.
G Expense ratios reflect operating expenses of the class. Expenses before reductions do not reflect amounts reimbursed by the investment adviser or reductions from brokerage service arrangements or reductions from other expense offset arrangements and do not represent the amount paid by the class during periods when reimbursements or reductions occur. Expenses net of fee waivers reflect expenses after reimbursement by the investment adviser but prior to reductions from brokerage service arrangements or other expense offset arrangements. Expenses net of all reductions represent the net expenses paid by the class.
H Amount represents less than $.01 per share.
See accompanying notes which are an integral part of the financial statements.
Annual Report
Financial Highlights - Class B
Years ended July 31, | 2011 | 2010 | 2009 | 2008 | 2007 |
Selected Per-Share Data | | | | | |
Net asset value, beginning of period | $ 8.06 | $ 6.83 | $ 7.39 | $ 9.03 | $ 6.99 |
Income from Investment Operations | | | | | |
Net investment income (loss) C | (.13) | (.16) | (.03) F | (.14) | (.14) |
Net realized and unrealized gain (loss) | 1.06 | 1.39 | (.53) | (1.36) | 2.18 |
Total from investment operations | .93 | 1.23 | (.56) | (1.50) | 2.04 |
Distributions from net realized gain | - | - | - | (.14) | - |
Redemption fees added to paid in capital C, H | - | - | - | - | - |
Net asset value, end of period | $ 8.99 | $ 8.06 | $ 6.83 | $ 7.39 | $ 9.03 |
Total Return A, B | 11.54% | 18.01% | (7.58)% | (16.94)% | 29.18% |
Ratios to Average Net Assets D, G | | | | | |
Expenses before reductions | 2.47% | 2.68% | 3.98% | 3.03% | 3.00% |
Expenses net of fee waivers, if any | 2.15% | 2.15% | 2.15% | 2.15% | 2.15% |
Expenses net of all reductions | 2.14% | 2.13% | 2.15% | 2.15% | 2.15% |
Net investment income (loss) | (1.35)% | (2.07)% | (.49)% F | (1.67)% | (1.75)% |
Supplemental Data | | | | | |
Net assets, end of period (000 omitted) | $ 1,316 | $ 1,408 | $ 1,281 | $ 1,219 | $ 2,225 |
Portfolio turnover rate E | 101% | 106% | 97% | 63% | 58% |
A Total returns would have been lower if certain expenses had not been reduced during the applicable periods shown.
B Total returns do not include the effect of the contingent deferred sales charge.
C Calculated based on average shares outstanding during the period.
D Fees and expenses of any underlying Fidelity Central Funds are not included in the Fund's expense ratio. The Fund indirectly bears its proportionate share of the expenses of any underlying Fidelity Central Funds.
E Amount does not include the portfolio activity of any underlying Fidelity Central Funds.
F Investment income per share reflects a special dividend which amounted to $.06 per share. Excluding the special dividend, the ratio of net investment income (loss) to average net assets would have been (1.63)%.
G Expense ratios reflect operating expenses of the class. Expenses before reductions do not reflect amounts reimbursed by the investment adviser or reductions from brokerage service arrangements or reductions from other expense offset arrangements and do not represent the amount paid by the class during periods when reimbursements or reductions occur. Expenses net of fee waivers reflect expenses after reimbursement by the investment adviser but prior to reductions from brokerage service arrangements or other expense offset arrangements. Expenses net of all reductions represent the net expenses paid by the class.
H Amount represents less than $.01 per share.
Financial Highlights - Class C
Years ended July 31, | 2011 | 2010 | 2009 | 2008 | 2007 |
Selected Per-Share Data | | | | | |
Net asset value, beginning of period | $ 8.06 | $ 6.82 | $ 7.38 | $ 9.03 | $ 6.99 |
Income from Investment Operations | | | | | |
Net investment income (loss) C | (.13) | (.16) | (.03) F | (.14) | (.14) |
Net realized and unrealized gain (loss) | 1.05 | 1.40 | (.53) | (1.37) | 2.18 |
Total from investment operations | .92 | 1.24 | (.56) | (1.51) | 2.04 |
Distributions from net realized gain | - | - | - | (.14) | - |
Redemption fees added to paid in capital C, H | - | - | - | - | - |
Net asset value, end of period | $ 8.98 | $ 8.06 | $ 6.82 | $ 7.38 | $ 9.03 |
Total Return A, B | 11.41% | 18.18% | (7.59)% | (17.06)% | 29.18% |
Ratios to Average Net Assets D, G | | | | | |
Expenses before reductions | 2.40% | 2.67% | 3.63% | 3.02% | 2.98% |
Expenses net of fee waivers, if any | 2.15% | 2.15% | 2.15% | 2.15% | 2.15% |
Expenses net of all reductions | 2.14% | 2.13% | 2.15% | 2.15% | 2.15% |
Net investment income (loss) | (1.35)% | (2.07)% | (.49)% F | (1.67)% | (1.75)% |
Supplemental Data | | | | | |
Net assets, end of period (000 omitted) | $ 5,866 | $ 3,029 | $ 2,792 | $ 1,097 | $ 1,745 |
Portfolio turnover rate E | 101% | 106% | 97% | 63% | 58% |
A Total returns would have been lower if certain expenses had not been reduced during the applicable periods shown.
B Total returns do not include the effect of the contingent deferred sales charge.
C Calculated based on average shares outstanding during the period.
D Fees and expenses of any underlying Fidelity Central Funds are not included in the Fund's expense ratio. The Fund indirectly bears its proportionate share of the expenses of any underlying Fidelity Central Funds.
E Amount does not include the portfolio activity of any underlying Fidelity Central Funds.
F Investment income per share reflects a special dividend which amounted to $.06 per share. Excluding the special dividend, the ratio of net investment income (loss) to average net assets would have been (1.63)%.
G Expense ratios reflect operating expenses of the class. Expenses before reductions do not reflect amounts reimbursed by the investment adviser or reductions from brokerage service arrangements or reductions from other expense offset arrangements and do not represent the amount paid by the class during periods when reimbursements or reductions occur. Expenses net of fee waivers reflect expenses after reimbursement by the investment adviser but prior to reductions from brokerage service arrangements or other expense offset arrangements. Expenses net of all reductions represent the net expenses paid by the class.
H Amount represents less than $.01 per share.
See accompanying notes which are an integral part of the financial statements.
Annual Report
Financial Highlights - Institutional Class
Years ended July 31, | 2011 | 2010 | 2009 | 2008 | 2007 |
Selected Per-Share Data | | | | | |
Net asset value, beginning of period | $ 8.88 | $ 7.45 | $ 7.98 | $ 9.65 | $ 7.39 |
Income from Investment Operations | | | | | |
Net investment income (loss) B | (.04) | (.09) | .03 E | (.06) | (.07) |
Net realized and unrealized gain (loss) | 1.16 | 1.52 | (.56) | (1.47) | 2.33 |
Total from investment operations | 1.12 | 1.43 | (.53) | (1.53) | 2.26 |
Distributions from net realized gain | - | - | - | (.14) | - |
Redemption fees added to paid in capital B, G | - | - | - | - | - |
Net asset value, end of period | $ 10.00 | $ 8.88 | $ 7.45 | $ 7.98 | $ 9.65 |
Total Return A | 12.61% | 19.19% | (6.64)% | (16.16)% | 30.58% |
Ratios to Average Net Assets C, F | | | | | |
Expenses before reductions | 1.22% | 1.54% | 2.44% | 1.94% | 1.87% |
Expenses net of fee waivers, if any | 1.15% | 1.15% | 1.15% | 1.15% | 1.15% |
Expenses net of all reductions | 1.14% | 1.13% | 1.15% | 1.14% | 1.15% |
Net investment income (loss) | (.35)% | (1.07)% | .51% E | (.66)% | (.75)% |
Supplemental Data | | | | | |
Net assets, end of period (000 omitted) | $ 2,855 | $ 1,717 | $ 957 | $ 229 | $ 324 |
Portfolio turnover rate D | 101% | 106% | 97% | 63% | 58% |
A Total returns would have been lower if certain expenses had not been reduced during the applicable periods shown.
B Calculated based on average shares outstanding during the period.
C Fees and expenses of any underlying Fidelity Central Funds are not included in the Fund's expense ratio. The Fund indirectly bears its proportionate share of the expenses of any underlying Fidelity Central Funds.
D Amount does not include the portfolio activity of any underlying Fidelity Central Funds.
E Investment income per share reflects a special dividend which amounted to $.07 per share. Excluding the special dividend, the ratio of net investment income (loss) to average net assets would have been (.63)%.
F Expense ratios reflect operating expenses of the class. Expenses before reductions do not reflect amounts reimbursed by the investment adviser or reductions from brokerage service arrangements or reductions from other expense offset arrangements and do not represent the amount paid by the class during periods when reimbursements or reductions occur. Expenses net of fee waivers reflect expenses after reimbursement by the investment adviser but prior to reductions from brokerage service arrangements or other expense offset arrangements. Expenses net of all reductions represent the net expenses paid by the class.
G Amount represents less than $.01 per share.
See accompanying notes which are an integral part of the financial statements.
Annual Report
Notes to Financial Statements
For the period ended July 31, 2011
1. Organization.
Fidelity Advisor Communications Equipment Fund (the Fund) is a non-diversified fund of Fidelity Advisor Series VII (the Trust) and is authorized to issue an unlimited number of shares. The Trust is registered under the Investment Company Act of 1940, as amended (the 1940 Act), as an open-end management investment company organized as a Massachusetts business trust. The Fund offers Class A, Class T, Class C and Institutional Class shares, each of which, along with Class B shares, has equal rights as to assets and voting privileges. Effective after the close of business on September 1, 2010, Class B shares were closed to new accounts and additional purchases, except for exchanges and reinvestments, by existing shareholders. Each class has exclusive voting rights with respect to matters that affect that class. Class B shares will automatically convert to Class A shares after a holding period of seven years from the initial date of purchase. Investment income, realized and unrealized capital gains and losses, the common expenses of the Fund, and certain fund-level expense reductions, if any, are allocated on a pro-rata basis to each class based on the relative net assets of each class to the total net assets of the Fund. Each class differs with respect to transfer agent and distribution and service plan fees incurred. Certain expense reductions may also differ by class.
2. Investments in Fidelity Central Funds.
The Fund invests in Fidelity Central Funds, which are open-end investment companies available only to other investment companies and accounts managed by Fidelity Management & Research Company (FMR) and its affiliates. The Fund's Schedule of Investments lists each of the Fidelity Central Funds held as of period end, if any, as an investment of the Fund, but does not include the underlying holdings of each Fidelity Central Fund. As an Investing Fund, the Fund indirectly bears its proportionate share of the expenses of the underlying Fidelity Central Funds.
The Money Market Central Funds seek preservation of capital and current income and are managed by Fidelity Investments Money Management, Inc. (FIMM), an affiliate of FMR.
A complete unaudited list of holdings for each Fidelity Central Fund is available upon request or at the Securities and Exchange Commission (the SEC) web site at www.sec.gov. In addition, the financial statements of the Fidelity Central Funds, which are not covered by the Fund's Report of Independent Registered Public Accounting Firm, are available on the SEC web site or upon request.
3. Significant Accounting Policies.
The financial statements have been prepared in conformity with accounting principles generally accepted in the United States of America (GAAP), which require management to make certain estimates and assumptions at the date of the financial statements. Actual results could differ from those estimates. Subsequent events, if any, through the date that the financial statements were issued have been evaluated in the preparation of the financial statements. The following summarizes the significant accounting policies of the Fund:
Security Valuation. Investments are valued as of 4:00 p.m. Eastern time on the last calendar day of the period. The Fund uses independent pricing services approved by the Board of Trustees to value its investments. When current market prices or quotations are not readily available or reliable, valuations may be determined in good faith in accordance with procedures adopted by the Board of Trustees. Factors used in determining value may include market or security specific events, changes in interest rates and credit quality. The frequency with which these procedures are used cannot be predicted and they may be utilized to a significant extent. The value used for net asset value (NAV) calculation under these procedures may differ from published prices for the same securities.
The Fund categorizes the inputs to valuation techniques used to value its investments into a disclosure hierarchy consisting of three levels as shown below:
Level 1 - quoted prices in active markets for identical investments
Level 2 - other significant observable inputs (including quoted prices for similar investments, interest rates, prepayment speeds, etc.)
Level 3 - unobservable inputs (including the Fund's own assumptions based on the best information available)
Changes in valuation techniques may result in transfers in or out of an assigned level within the disclosure hierarchy. The aggregate value of investments by input level, as of July 31, 2011, is included at the end of the Fund's Schedule of Investments. Valuation techniques used to value the Fund's investments by major category are as follows:
Equity securities, including restricted securities, for which market quotations are readily available, are valued at the last reported sale price or official closing price as reported by an independent pricing service on the primary market or exchange on which they are traded and are categorized as Level 1 in the hierarchy. In the event there were no sales during the day or closing prices are not available, securities are valued at the last quoted bid price or may be valued using the last available price and are generally categorized as Level 2 in the hierarchy. For foreign equity securities, when significant market or security specific events arise, comparisons to the valuation of American Depositary Receipts (ADRs), futures contracts, Exchange-traded funds (ETFs) and certain indexes as well as quoted prices for similar securities are used and are categorized as Level 2 in the hierarchy in these
Annual Report
3. Significant Accounting Policies - continued
Security Valuation - continued
circumstances. Utilizing these techniques may result in transfers between Level 1 and Level 2. For restricted equity securities and private placements where observable inputs are limited, assumptions about market activity and risk are used and are categorized as Level 3 in the hierarchy.
Debt securities, including restricted securities, are valued based on evaluated prices received from independent pricing services or from dealers who make markets in such securities. For corporate bonds, pricing services utilize matrix pricing which considers yield or price of bonds of comparable quality, coupon, maturity and type as well as dealer supplied prices and are generally categorized as Level 2 in the hierarchy. When independent prices are unavailable or unreliable, debt securities may be valued utilizing pricing matrices which consider similar factors that would be used by independent pricing services. These are generally categorized as Level 2 in the hierarchy but may be Level 3 depending on the circumstances.
Investments in open-end mutual funds, including the Fidelity Central Funds, are valued at their closing net asset value each business day and are categorized as Level 1 in the hierarchy.
Foreign Currency. The Fund may use foreign currency contracts to facilitate transactions in foreign-denominated securities. Gains and losses from these transactions may arise from changes in the value of the foreign currency or if the counterparties do not perform under the contracts' terms.
Foreign-denominated assets, including investment securities, and liabilities are translated into U.S. dollars at the exchange rate at period end. Purchases and sales of investment securities, income and dividends received and expenses denominated in foreign currencies are translated into U.S. dollars at the exchange rate in effect on the transaction date.
The effects of exchange rate fluctuations on investments are included with the net realized and unrealized gain (loss) on investment securities. Other foreign currency transactions resulting in realized and unrealized gain (loss) are disclosed separately.
Investment Transactions and Income. For financial reporting purposes, the Fund's investment holdings and NAV include trades executed through the end of the last business day of the period. The NAV per share for processing shareholder transactions is calculated as of the close of business of the New York Stock Exchange (NYSE), normally 4:00 p.m. Eastern time and includes trades executed through the end of the prior business day. Gains and losses on securities sold are determined on the basis of identified cost and may include proceeds received from litigation. Dividend income is recorded on the ex-dividend date, except for certain dividends from foreign securities where the ex-dividend date may have passed, which are recorded as soon as the Fund is informed of the ex-dividend date. Non-cash dividends included in dividend income, if any, are recorded at the fair market value of the securities received. Distributions received on securities that represent a return of capital or capital gain are recorded as a reduction of cost of investments and/or as a realized gain. The Fund estimates the components of distributions received that may be considered return of capital distributions or capital gain distributions. Interest income and distributions from the Fidelity Central Funds are accrued as earned. Interest income includes coupon interest and amortization of premium and accretion of discount on debt securities. Investment income is recorded net of foreign taxes withheld where recovery of such taxes is uncertain.
Expenses. Expenses directly attributable to a fund are charged to that fund. Expenses attributable to more than one fund are allocated among the respective funds on the basis of relative net assets or other appropriate methods. Expense estimates are accrued in the period to which they relate and adjustments are made when actual amounts are known.
Income Tax Information and Distributions to Shareholders. Each year, the Fund intends to qualify as a regulated investment company, including distributing substantially all of its taxable income and realized gains under Subchapter M of the Internal Revenue Code and filing its U.S. federal tax return. As a result, no provision for income taxes is required. As of July 31, 2011, the Fund did not have any unrecognized tax benefits in the financial statements. A fund's federal tax return is subject to examination by the Internal Revenue Service (IRS) for a period of three years. Foreign taxes are provided for based on the Fund's understanding of the tax rules and rates that exist in the foreign markets in which it invests.
Distributions are declared and recorded on the ex-dividend date. Income dividends and capital gain distributions are declared separately for each class. Income and capital gain distributions are determined in accordance with income tax regulations, which may differ from GAAP.
Capital accounts within the financial statements are adjusted for permanent book-tax differences. These adjustments have no impact on net assets or the results of operations. Temporary book-tax differences will reverse in a subsequent period.
Book-tax differences are primarily due to foreign currency transactions, net operating losses, capital loss carryforwards and losses deferred due to wash sales and excise tax regulations.
Annual Report
Notes to Financial Statements - continued
3. Significant Accounting Policies - continued
Income Tax Information and Distributions to Shareholders - continued
The federal tax cost of investment securities and unrealized appreciation (depreciation) as of period end were as follows:
Gross unrealized appreciation | $ 3,005,143 |
Gross unrealized depreciation | (2,577,638) |
Net unrealized appreciation (depreciation) on securities and other investments | $ 427,505 |
| |
Tax Cost | $ 23,916,769 |
The tax-based components of distributable earnings as of period end were as follows:
Undistributed long-term capital gain | $ 399,015 |
Net unrealized appreciation (depreciation) | $ 427,505 |
Under the recently enacted Regulated Investment Company Modernization Act of 2010 (the Act), the Fund will be permitted to carry forward capital losses incurred in taxable years beginning after December 22, 2010 for an unlimited period. However, any losses incurred during those future taxable years will be required to be utilized prior to any losses incurred in pre-enactment taxable years, which generally expire after eight years from when they are incurred. Additionally, post-enactment capital losses that are carried forward will retain their character as either short-term or long-term capital losses rather than being considered all short-term as under previous law. The Fund's first fiscal year end subject to the Act will be July 31, 2012.
Short-Term Trading (Redemption) Fees. Shares held by investors in the Fund less than 30 days are subject to a redemption fee equal to .75% of the net asset value of shares redeemed. All redemption fees, which reduce the proceeds of the shareholder redemption, are retained by the Fund and accounted for as an addition to paid in capital.
New Accounting Pronouncement. In May 2011, the Financial Accounting Standards Board issued Accounting Standard Update No. 2011-04, Fair Value Measurement (Topic 820) - Amendments to Achieve Common Fair Value Measurement and Disclosure Requirements in U.S. GAAP and IFRSs. The update changes the wording used to describe the requirements in GAAP for measuring fair value and for disclosing information about fair value measurements. The update is effective during interim and annual periods beginning after December 15, 2011. Management is currently evaluating the impact of the update's adoption on the Fund's financial statement disclosures.
4. Purchases and Sales of Investments.
Purchases and sales of securities, other than short-term securities, aggregated $30,828,844 and $22,744,085, respectively.
5. Fees and Other Transactions with Affiliates.
Management Fee. FMR and its affiliates provide the Fund with investment management related services for which the Fund pays a monthly management fee. The management fee is the sum of an individual fund fee rate that is based on an annual rate of .30% of the Fund's average net assets and a group fee rate that averaged .26% during the period. The group fee rate is based upon the average net assets of all the mutual funds advised by FMR. The group fee rate decreases as assets under management increase and increases as assets under management decrease. For the period, the total annual management fee rate was .56% of the Fund's average net assets.
Distribution and Service Plan Fees. In accordance with Rule 12b-1 of the 1940 Act, the Fund has adopted separate Distribution and Service Plans for each class of shares. Certain classes pay Fidelity Distributors Corporation (FDC), an affiliate of FMR, separate Distribution and Service Fees, each of which is based on an annual percentage of each class' average net assets. In addition, FDC may pay financial intermediaries for selling shares of the Fund and providing shareholder support services.
For the period, the Distribution and Service Fee rates, total fees and amounts retained by FDC were as follows:
| Distribution
Fee | Service
Fee | Total Fees | Retained
by FDC |
Class A | -% | .25% | $ 21,251 | $ 768 |
Class T | .25% | .25% | 23,038 | 8 |
Class B | .75% | .25% | 16,676 | 12,520 |
Class C | .75% | .25% | 48,359 | 11,948 |
| | | $ 109,324 | $ 25,244 |
Annual Report
5. Fees and Other Transactions with Affiliates - continued
Sales Load. FDC may receive a front-end sales charge of up to 5.75% for selling Class A shares, and 3.50% for selling Class T shares, some of which is paid to financial intermediaries for selling shares of the Fund. Depending on the holding period, FDC may receive contingent deferred sales charges levied on Class A, Class T, Class B, and Class C redemptions. The deferred sales charges range from 5% to 1% for Class B, 1% for Class C, 1.00% for certain purchases of Class A shares and .25% for certain purchases of Class T shares.
For the period, sales charge amounts retained by FDC were as follows:
| Retained
by FDC |
Class A | $ 11,855 |
Class T | 4,778 |
Class B* | 1,900 |
Class C* | 1,087 |
| $ 19,620 |
* When Class B and Class C shares are initially sold, FDC pays commissions from its own resources to financial intermediaries through which the sales are made.
Transfer Agent Fees. Fidelity Investments Institutional Operations Company, Inc. (FIIOC), an affiliate of FMR, is the transfer, dividend disbursing and shareholder servicing agent for each class of the Fund. FIIOC receives account fees and asset-based fees that vary according to the account size and type of account of the shareholders of the respective classes of the Fund. FIIOC pays for typesetting, printing and mailing of shareholder reports, except proxy statements. For the period, transfer agent fees for each class were as follows:
| Amount | % of
Average
Net Assets |
Class A | $ 26,251 | .31 |
Class T | 15,840 | .34 |
Class B | 5,116 | .31 |
Class C | 14,796 | .31 |
Institutional Class | 8,333 | .22 |
| $ 70,336 | |
Accounting and Security Lending Fees. Fidelity Service Company, Inc. (FSC), an affiliate of FMR, maintains the Fund's accounting records. The accounting fee is based on the level of average net assets for the month. Under a separate contract, FSC administers the security lending program. The security lending fee is based on the number and duration of lending transactions.
Brokerage Commissions. The Fund placed a portion of its portfolio transactions with brokerage firms which are affiliates of the investment adviser. The commissions paid to these affiliated firms were $1,794 for the period.
6. Committed Line of Credit.
The Fund participates with other funds managed by FMR or an affiliate in a $4.0 billion credit facility (the "line of credit") to be utilized for temporary or emergency purposes to fund shareholder redemptions or for other short-term liquidity purposes. The Fund has agreed to pay commitment fees on its pro-rata portion of the line of credit, which amounted to $72 and is reflected in Miscellaneous expenses on the Statement of Operations. During the period, there were no borrowings on this line of credit.
7. Security Lending.
The Fund lends portfolio securities through a lending agent from time to time in order to earn additional income. The lending agent may loan securities to certain qualified borrowers, including Fidelity Capital Markets (FCM), a broker-dealer affiliated with the Fund. On the settlement date of the loan, the Fund receives collateral (in the form of U.S. Treasury obligations, letters of credit and/or cash) against the loaned securities and maintains collateral in an amount not less than 100% of the market value of the loaned securities during the period of the loan. The market value of the loaned securities is determined at the close of business of the Fund and any additional required collateral is delivered to the Fund on the next business day. If the borrower defaults on its obligation to return the securities loaned because of insolvency or other reasons, a fund could experience delays and costs in recovering the securities loaned or in gaining access to the collateral. Any cash collateral received is invested in the Fidelity Securities Lending Cash Central Fund. The value of loaned securities and cash collateral at period end are disclosed on the Fund's Statement of Assets and Liabilities. Security
Annual Report
Notes to Financial Statements - continued
7. Security Lending - continued
lending income represents the income earned on investing cash collateral, less rebates paid to borrowers and lending agent fees associated with the loan, plus any premium payments received for lending certain types of securities. Security lending income is presented in the Statement of Operations as a component of income from Fidelity Central Funds. During the period, there were no securities loaned to FCM.
8. Expense Reductions.
FMR voluntarily agreed to reimburse each class to the extent annual operating expenses exceeded certain levels of average net assets as noted in the table below. Some expenses, for example interest expense, including commitment fees, are excluded from this reimbursement.
The following classes were in reimbursement during the period:
| Expense
Limitations | Reimbursement
from adviser |
Class A | 1.40% | $ 20,101 |
Class T | 1.65% | 14,755 |
Class B | 2.15% | 5,389 |
Class C | 2.15% | 11,901 |
Institutional Class | 1.15% | 2,808 |
| | $ 54,954 |
Many of the brokers with whom FMR places trades on behalf of the Fund provided services to the Fund in addition to trade execution. These services included payments of certain expenses on behalf of the Fund totaling $2,823 for the period.
9. Share Transactions.
Transactions for each class of shares were as follows:
| Shares | Dollars |
Years ended July 31, | 2011 | 2010 | 2011 | 2010 |
Class A | | | | |
Shares sold | 848,465 | 379,066 | $ 9,277,193 | $ 3,104,413 |
Shares redeemed | (506,493) | (295,518) | (5,495,871) | (2,391,964) |
Net increase (decrease) | 341,972 | 83,548 | $ 3,781,322 | $ 712,449 |
Class T | | | | |
Shares sold | 222,009 | 156,340 | $ 2,346,633 | $ 1,239,925 |
Shares redeemed | (122,895) | (105,545) | (1,276,707) | (829,604) |
Net increase (decrease) | 99,114 | 50,795 | $ 1,069,926 | $ 410,321 |
Class B | | | | |
Shares sold | 48,553 | 104,878 | $ 469,014 | $ 798,141 |
Shares redeemed | (76,689) | (117,849) | (748,333) | (896,172) |
Net increase (decrease) | (28,136) | (12,971) | $ (279,319) | $ (98,031) |
Class C | | | | |
Shares sold | 468,878 | 234,346 | $ 4,767,947 | $ 1,790,479 |
Shares redeemed | (191,799) | (267,515) | (1,863,160) | (1,967,047) |
Net increase (decrease) | 277,079 | (33,169) | $ 2,904,787 | $ (176,568) |
Institutional Class | | | | |
Shares sold | 497,180 | 263,129 | $ 5,828,732 | $ 2,147,225 |
Shares redeemed | (405,041) | (198,313) | (4,332,982) | (1,653,589) |
Net increase (decrease) | 92,139 | 64,816 | $ 1,495,750 | $ 493,636 |
10. Other.
The Fund's organizational documents provide former and current trustees and officers with a limited indemnification against liabilities arising in connection with the performance of their duties to the Fund. In the normal course of business, the Fund may also enter into contracts that provide general indemnifications. The Fund's maximum exposure under these arrangements is unknown as this would be dependent on future claims that may be made against the Fund. The risk of material loss from such claims is considered remote.
Annual Report
Fidelity Advisor Consumer Discretionary Fund - Institutional Class
Performance: The Bottom Line
Average annual total return reflects the change in the value of an investment, assuming reinvestment of the class' distributions from dividend income and capital gains (the profits earned upon the sale of securities that have grown in value, if any) and assuming a constant rate of performance each year. The $10,000 table and the fund's returns do not reflect the deduction of taxes that a shareholder would pay on fund distributions or the redemption of fund shares. During periods of reimbursement by Fidelity, a fund's total return will be greater than it would be had the reimbursement not occurred. How a fund did yesterday is no guarantee of how it will do tomorrow.
Average Annual Total Returns
Periods ended July 31, 2011 | Past 1
year | Past 5
years | Past 10
years |
Institutional Class A | 26.00% | 4.65% | 3.91% |
A Prior to October 1, 2006, Fidelity Advisor Consumer Discretionary Fund operated under certain different investment policies. The historical performance for the fund may not represent its current investment policies.
$10,000 Over 10 Years
Let's say hypothetically that $10,000 was invested in Fidelity Advisor Consumer Discretionary Fund - Institutional Class on July 31, 2001. The chart shows how the value of your investment would have changed, and also shows how the S&P 500 Index performed over the same period.
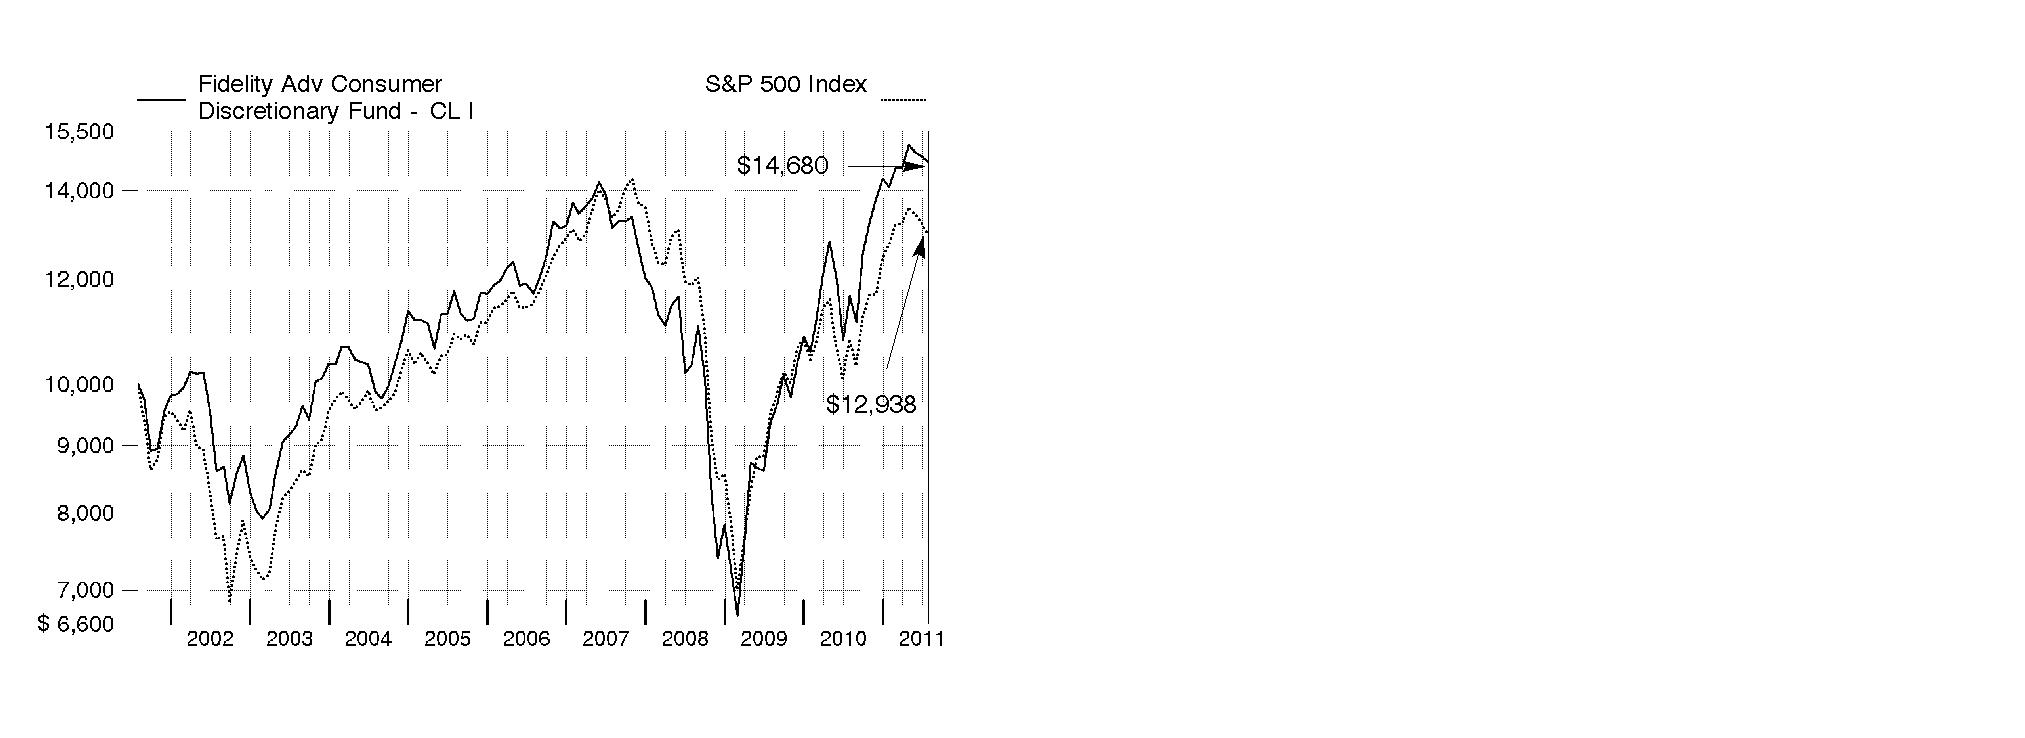
Annual Report
Fidelity Advisor Consumer Discretionary Fund
Market Recap: U.S. stocks registered solid double-digit gains for the 12 months ending July 31, 2011, extending a rally that began more than two years earlier. Despite a rough start in August 2010, markets turned positive in September, as increased demand for capital goods and other upbeat indicators trumped investor worry about a U.S. recessionary relapse. The broad market, as measured by the S&P 500® Index, rose 9% that month, its biggest September gain in 71 years. Seven more monthly advances followed, fueled by encouraging corporate earnings and economic activity. However, volatility picked up in the period's latter months, as markets reacted to continued high U.S. unemployment, nagging debt troubles in Europe and looming legislative battles over the federal debt ceiling. May unemployment rose above 9% for the first time in 2011, contributing to a traditional "June swoon" for stocks. Market uncertainty lingered in July, when the S&P 500® posted its second-biggest monthly loss of the period. For the full year, the S&P 500® climbed 19.65%, while the blue-chip-laden Dow Jones Industrial AverageSM rose a comparable 19.09% and the technology-heavy Nasdaq Composite® Index gained 23.40%. On the capitalization spectrum, stocks of mid-cap companies fared best, with the Russell Midcap® Index rising 24.51% and the small-cap Russell 2000® Index adding 23.92%.
Comments from John Harris, Portfolio Manager of Fidelity® Advisor Consumer Discretionary Fund: For the 12 months ending July 31, 2011, the fund's Class A, Class T, Class B and Class C shares returned 25.49%, 25.24%, 24.61% and 24.65%, respectively (excluding sales charges), underperforming the 29.36% gain of the MSCI® U.S. IM Consumer Discretionary 25/50 Index but outpacing the 19.65% advance of the broadly based S&P 500® Index. Positioning in home improvement retail hurt performance versus the sector benchmark, as did stock picking in apparel retail, Internet retail, automotive retail, and hotels, resorts and cruise lines. On an individual security basis, overweightings in home improvement chains Lowe's Companies and Lumber Liquidators Holdings were major detractors, along with off-price apparel retailer Citi Trends, office supplies retailer OfficeMax, and WMS Industries, which manufactures and distributes slot machines. Not owning movie subscription service and index component Netflix for most of the period also hurt, as its share price climbed sharply. On the other hand, we were well-positioned in automobile manufacturers, where we underweighted the stock of Ford Motor, which lost ground, and held an out-of benchmark position in strong-performing German automaker BMW. Stock selection in homefurnishings also helped, as did an overweighting in casinos and gaming, and an out-of-benchmark position in Internet software and services. Other individual contributors included overweightings in casino company Las Vegas Sands, premium bed manufacturer Tempur-Pedic International and specialty rural retailer Tractor Supply. Some of the positions I've mentioned were sold by period end.
Comments from John Harris, Portfolio Manager of Fidelity® Advisor Consumer Discretionary Fund: For the 12 months ending July 31, 2011, the fund's Institutional Class shares returned 26.00%, underperforming the 29.36% gain of the MSCI® U.S. IM Consumer Discretionary 25/50 Index but outpacing the 19.65% advance of the broadly based S&P 500® Index. Positioning in home improvement retail hurt performance versus the sector benchmark, as did stock picking in apparel retail, Internet retail, automotive retail, and hotels, resorts and cruise lines. On an individual security basis, overweightings in home improvement chains Lowe's Companies and Lumber Liquidators Holdings were major detractors, along with off-price apparel retailer Citi Trends, office supplies retailer OfficeMax, and WMS Industries, which manufactures and distributes slot machines. Not owning movie subscription service and index component Netflix for most of the period also hurt, as its share price climbed sharply. On the other hand, we were well-positioned in automobile manufacturers, where we underweighted the stock of Ford Motor, which lost ground, and held an out-of benchmark position in strong-performing German automaker BMW. Stock selection in homefurnishings also helped, as did an overweighting in casinos and gaming, and an out-of-benchmark position in Internet software and services. Other individual contributors included overweightings in casino company Las Vegas Sands, premium bed manufacturer Tempur-Pedic International and specialty rural retailer Tractor Supply. Some of the positions I've mentioned were sold by period end.
The views expressed above reflect those of the portfolio manager(s) only through the end of the period as stated on the cover of this report and do not necessarily represent the views of Fidelity or any other person in the Fidelity organization. Any such views are subject to change at any time based upon market or other conditions and Fidelity disclaims any responsibility to update such views. These views may not be relied on as investment advice and, because investment decisions for a Fidelity fund are based on numerous factors, may not be relied on as an indication of trading intent on behalf of any Fidelity fund.
Annual Report
Fidelity Advisor Consumer Discretionary Fund
As a shareholder of the Fund, you incur two types of costs: (1) transaction costs, including sales charges (loads) on purchase payments or redemption proceeds, redemption fees, and (2) ongoing costs, including management fees, distribution and/or service (12b-1) fees and other Fund expenses. This Example is intended to help you understand your ongoing costs (in dollars) of investing in the Fund and to compare these costs with the ongoing costs of investing in other mutual funds.
The Example is based on an investment of $1,000 invested at the beginning of the period and held for the entire period (February 1, 2011 to July 31, 2011).
Actual Expenses
The first line of the accompanying table for each class of the Fund provides information about actual account values and actual expenses. You may use the information in this line, together with the amount you invested, to estimate the expenses that you paid over the period. Simply divide your account value by $1,000.00 (for example, an $8,600 account value divided by $1,000.00 = 8.6), then multiply the result by the number in the first line for a class of the Fund under the heading entitled "Expenses Paid During Period" to estimate the expenses you paid on your account during this period. In addition, the Fund, as a shareholder in the underlying Fidelity Central Funds, will indirectly bear its pro-rata share of the fees and expenses incurred by the underlying Fidelity Central Funds. These fees and expenses are not included in the Fund's annualized expense ratio used to calculate the expense estimate in the table below.
Hypothetical Example for Comparison Purposes
The second line of the accompanying table for each class of the Fund provides information about hypothetical account values and hypothetical expenses based on a Class' actual expense ratio and an assumed rate of return of 5% per year before expenses, which is not the Class' actual return. The hypothetical account values and expenses may not be used to estimate the actual ending account balance or expenses you paid for the period. You may use this information to compare the ongoing costs of investing in the Fund and other funds. To do so, compare this 5% hypothetical example with the 5% hypothetical examples that appear in the shareholder reports of the other funds. In addition, the Fund, as a shareholder in the underlying Fidelity Central Funds, will indirectly bear its pro-rata share of the fees and expenses incurred by the underlying Fidelity Central Funds. These fees and expenses are not included in the Fund's annualized expense ratio used to calculate the expense estimate in the table below.
Please note that the expenses shown in the table are meant to highlight your ongoing costs only and do not reflect any transaction costs. Therefore, the second line of the table is useful in comparing ongoing costs only, and will not help you determine the relative total costs of owning different funds. In addition, if these transactional costs were included, your costs would have been higher.
| Annualized
Expense Ratio | Beginning
Account Value
February 1, 2011 | Ending
Account Value
July 31, 2011 | Expenses Paid
During Period*
February 1, 2011 to July 31, 2011 |
Class A | 1.39% | | | |
Actual | | $ 1,000.00 | $ 1,041.00 | $ 7.03 |
Hypothetical A | | $ 1,000.00 | $ 1,017.90 | $ 6.95 |
Class T | 1.65% | | | |
Actual | | $ 1,000.00 | $ 1,039.80 | $ 8.35 |
Hypothetical A | | $ 1,000.00 | $ 1,016.61 | $ 8.25 |
Class B | 2.14% | | | |
Actual | | $ 1,000.00 | $ 1,037.20 | $ 10.81 |
Hypothetical A | | $ 1,000.00 | $ 1,014.18 | $ 10.69 |
Class C | 2.06% | | | |
Actual | | $ 1,000.00 | $ 1,037.80 | $ 10.41 |
Hypothetical A | | $ 1,000.00 | $ 1,014.58 | $ 10.29 |
Institutional Class | .99% | | | |
Actual | | $ 1,000.00 | $ 1,043.00 | $ 5.01 |
Hypothetical A | | $ 1,000.00 | $ 1,019.89 | $ 4.96 |
A 5% return per year before expenses
* Expenses are equal to each Class' annualized expense ratio, multiplied by the average account value over the period, multiplied by 181/365 (to reflect the one-half year period).
Annual Report
Fidelity Advisor Consumer Discretionary Fund
Investment Changes (Unaudited)
Top Ten Stocks as of July 31, 2011 |
| % of fund's
net assets | % of fund's net assets
6 months ago |
Amazon.com, Inc. | 5.8 | 3.3 |
Lowe's Companies, Inc. | 5.3 | 5.7 |
McDonald's Corp. | 4.9 | 4.3 |
DIRECTV | 3.9 | 2.9 |
Time Warner, Inc. | 3.8 | 0.0 |
Target Corp. | 3.5 | 3.6 |
The Walt Disney Co. | 3.1 | 5.5 |
Bed Bath & Beyond, Inc. | 2.9 | 2.8 |
TJX Companies, Inc. | 2.8 | 2.6 |
Starbucks Corp. | 2.8 | 2.2 |
| 38.8 | |
Top Industries (% of fund's net assets) |
As of July 31, 2011 |
| Hotels, Restaurants & Leisure | 22.8% | |
| Specialty Retail | 20.8% | |
 | Media | 20.0% | |
| Internet & Catalog Retail | 9.6% | |
 | Textiles, Apparel & Luxury Goods | 5.3% | |
| All Others* | 21.5% | |

As of January 31, 2011 |
| Specialty Retail | 24.6% | |
| Media | 24.1% | |
| Hotels, Restaurants & Leisure | 19.4% | |
| Textiles, Apparel & Luxury Goods | 4.5% | |
| Automobiles | 4.5% | |
| All Others* | 22.9% | |

* Includes short-term investments and net other assets. |
Annual Report
Fidelity Advisor Consumer Discretionary Fund
Investments July 31, 2011
Showing Percentage of Net Assets
Common Stocks - 99.1% |
| Shares | | Value |
AUTO COMPONENTS - 3.1% |
Auto Parts & Equipment - 3.1% |
Autoliv, Inc. | 10,745 | | $ 710,889 |
Gentex Corp. | 18,490 | | 524,007 |
TRW Automotive Holdings Corp. (a) | 8,401 | | 423,998 |
| | 1,658,894 |
AUTOMOBILES - 2.9% |
Automobile Manufacturers - 1.8% |
Bayerische Motoren Werke AG (BMW) | 4,201 | | 421,448 |
Honda Motor Co. Ltd. | 14,000 | | 555,608 |
| | 977,056 |
Motorcycle Manufacturers - 1.1% |
Harley-Davidson, Inc. | 13,476 | | 584,724 |
TOTAL AUTOMOBILES | | 1,561,780 |
DIVERSIFIED CONSUMER SERVICES - 4.4% |
Education Services - 1.2% |
DeVry, Inc. | 10,468 | | 650,482 |
Specialized Consumer Services - 3.2% |
Sotheby's Class A (Ltd. vtg.) | 14,106 | | 597,389 |
Steiner Leisure Ltd. (a) | 9,505 | | 462,133 |
Weight Watchers International, Inc. | 8,085 | | 624,081 |
| | 1,683,603 |
TOTAL DIVERSIFIED CONSUMER SERVICES | | 2,334,085 |
FOOD & STAPLES RETAILING - 0.5% |
Hypermarkets & Super Centers - 0.5% |
Costco Wholesale Corp. | 3,329 | | 260,494 |
HOTELS, RESTAURANTS & LEISURE - 22.8% |
Casinos & Gaming - 4.7% |
Las Vegas Sands Corp. (a) | 24,271 | | 1,145,106 |
Las Vegas Sands Corp. unit | 810 | | 643,496 |
MGM Mirage, Inc. (a) | 46,900 | | 708,659 |
| | 2,497,261 |
Hotels, Resorts & Cruise Lines - 4.1% |
InterContinental Hotel Group PLC | 11,000 | | 217,077 |
Royal Caribbean Cruises Ltd. | 19,000 | | 581,780 |
Starwood Hotels & Resorts Worldwide, Inc. | 25,331 | | 1,392,192 |
| | 2,191,049 |
Restaurants - 14.0% |
Ajisen (China) Holdings Ltd. | 128,000 | | 251,934 |
Arcos Dorados Holdings, Inc. | 6,000 | | 140,760 |
BJ's Restaurants, Inc. (a) | 8,510 | | 394,609 |
Bravo Brio Restaurant Group, Inc. | 6,500 | | 145,275 |
Darden Restaurants, Inc. | 14,563 | | 739,800 |
Dunkin' Brands Group, Inc. | 5,000 | | 144,650 |
Einstein Noah Restaurant Group, Inc. | 3,579 | | 56,119 |
McDonald's Corp. | 30,061 | | 2,599,675 |
|
| Shares | | Value |
Panera Bread Co. Class A (a) | 3,343 | | $ 385,481 |
Ruth's Hospitality Group, Inc. (a) | 69,163 | | 397,687 |
Starbucks Corp. | 37,718 | | 1,512,115 |
Texas Roadhouse, Inc. Class A | 43,025 | | 710,773 |
| | 7,478,878 |
TOTAL HOTELS, RESTAURANTS & LEISURE | | 12,167,188 |
HOUSEHOLD DURABLES - 2.9% |
Home Furnishings - 1.3% |
Tempur-Pedic International, Inc. (a) | 9,908 | | 713,475 |
Homebuilding - 1.6% |
Lennar Corp. Class A | 35,811 | | 633,497 |
Toll Brothers, Inc. (a) | 9,600 | | 191,616 |
| | 825,113 |
TOTAL HOUSEHOLD DURABLES | | 1,538,588 |
INTERNET & CATALOG RETAIL - 9.6% |
Internet Retail - 9.6% |
Amazon.com, Inc. (a) | 13,963 | | 3,107,044 |
Blue Nile, Inc. (a)(d) | 6,100 | | 258,396 |
Netflix, Inc. (a) | 500 | | 132,995 |
Ocado Group PLC (a)(d) | 42,100 | | 117,697 |
Priceline.com, Inc. (a) | 2,587 | | 1,390,901 |
Start Today Co. Ltd. | 5,100 | | 126,697 |
| | 5,133,730 |
INTERNET SOFTWARE & SERVICES - 1.0% |
Internet Software & Services - 1.0% |
Google, Inc. Class A (a) | 898 | | 542,114 |
LEISURE EQUIPMENT & PRODUCTS - 0.9% |
Leisure Products - 0.9% |
Hasbro, Inc. | 11,600 | | 458,896 |
MEDIA - 20.0% |
Advertising - 1.0% |
National CineMedia, Inc. | 35,298 | | 519,940 |
Broadcasting - 0.7% |
Discovery Communications, Inc. (a) | 9,800 | | 390,040 |
Cable & Satellite - 8.9% |
DIRECTV (a) | 40,882 | | 2,071,900 |
Sirius XM Radio, Inc. (a) | 246,800 | | 520,748 |
Time Warner Cable, Inc. | 18,139 | | 1,329,770 |
Virgin Media, Inc. | 29,667 | | 784,989 |
| | 4,707,407 |
Movies & Entertainment - 9.4% |
The Walt Disney Co. | 42,768 | | 1,651,700 |
Time Warner, Inc. | 57,117 | | 2,008,234 |
Viacom, Inc. Class B (non-vtg.) | 27,874 | | 1,349,659 |
| | 5,009,593 |
TOTAL MEDIA | | 10,626,980 |
Common Stocks - continued |
| Shares | | Value |
MULTILINE RETAIL - 4.9% |
Department Stores - 0.4% |
Marisa Lojas SA | 13,800 | | $ 193,940 |
General Merchandise Stores - 4.5% |
Dollar Tree, Inc. (a) | 7,739 | | 512,554 |
Target Corp. | 36,644 | | 1,886,800 |
| | 2,399,354 |
TOTAL MULTILINE RETAIL | | 2,593,294 |
SPECIALTY RETAIL - 20.8% |
Apparel Retail - 7.2% |
Body Central Corp. | 4,000 | | 85,960 |
Chico's FAS, Inc. | 30,489 | | 460,079 |
Foot Locker, Inc. | 11,157 | | 242,442 |
Foschini Ltd. | 4,500 | | 59,194 |
Inditex SA | 3,238 | | 293,760 |
Limited Brands, Inc. | 15,500 | | 586,830 |
TJX Companies, Inc. | 27,434 | | 1,517,100 |
Urban Outfitters, Inc. (a) | 16,678 | | 542,702 |
Workman Co. Ltd. | 1,000 | | 27,545 |
| | 3,815,612 |
Automotive Retail - 2.4% |
Advance Auto Parts, Inc. | 18,320 | | 1,007,050 |
Penske Automotive Group, Inc. | 13,600 | | 300,968 |
| | 1,308,018 |
Computer & Electronics Retail - 1.2% |
Best Buy Co., Inc. | 24,100 | | 665,160 |
Home Improvement Retail - 5.8% |
Lowe's Companies, Inc. | 130,853 | | 2,823,808 |
Lumber Liquidators Holdings, Inc. (a)(d) | 15,625 | | 245,469 |
| | 3,069,277 |
Homefurnishing Retail - 2.9% |
Bed Bath & Beyond, Inc. (a) | 26,045 | | 1,523,372 |
Specialty Stores - 1.3% |
OfficeMax, Inc. (a) | 20,710 | | 146,627 |
Tractor Supply Co. | 8,179 | | 539,160 |
| | 685,787 |
TOTAL SPECIALTY RETAIL | | 11,067,226 |
TEXTILES, APPAREL & LUXURY GOODS - 5.3% |
Apparel, Accessories & Luxury Goods - 4.4% |
Polo Ralph Lauren Corp. Class A | 1,092 | | 147,496 |
|
| Shares | | Value |
PVH Corp. | 10,098 | | $ 722,512 |
Titan Industries Ltd. | 32,060 | | 165,521 |
Trinity Ltd. | 124,000 | | 137,463 |
Vera Bradley, Inc. | 3,600 | | 130,572 |
VF Corp. | 8,700 | | 1,016,160 |
| | 2,319,724 |
Footwear - 0.9% |
NIKE, Inc. Class B | 5,468 | | 492,940 |
TOTAL TEXTILES, APPAREL & LUXURY GOODS | | 2,812,664 |
TOTAL COMMON STOCKS (Cost $46,030,345) | 52,755,933 |
Nonconvertible Preferred Stocks - 1.0% |
| | | |
AUTOMOBILES - 1.0% |
Automobile Manufacturers - 1.0% |
Volkswagen AG
(Cost $506,549) | 2,600 | | 520,959 |
Money Market Funds - 1.9% |
| | | |
Fidelity Cash Central Fund, 0.14% (b) | 397,268 | | 397,268 |
Fidelity Securities Lending Cash Central Fund, 0.15% (b)(c) | 634,000 | | 634,000 |
TOTAL MONEY MARKET FUNDS (Cost $1,031,268) | 1,031,268 |
TOTAL INVESTMENT PORTFOLIO - 102.0% (Cost $47,568,162) | | 54,308,160 |
NET OTHER ASSETS (LIABILITIES) - (2.0)% | | (1,047,193) |
NET ASSETS - 100% | $ 53,260,967 |
Legend |
(a) Non-income producing |
(b) Affiliated fund that is available only to investment companies and other accounts managed by Fidelity Investments. The rate quoted is the annualized seven-day yield of the fund at period end. A complete unaudited listing of the fund's holdings as of its most recent quarter end is available upon request. In addition, each Fidelity Central Fund's financial statements, which are not covered by the Fund's Report of Independent Registered Public Accounting Firm, are available on the SEC's website or upon request. |
(c) Investment made with cash collateral received from securities on loan. |
(d) Security or a portion of the security is on loan at period end. |
Affiliated Central Funds |
Information regarding fiscal year to date income earned by the Fund from investments in Fidelity Central Funds is as follows: |
Fund | Income earned |
Fidelity Cash Central Fund | $ 958 |
Fidelity Securities Lending Cash Central Fund | 11,911 |
Total | $ 12,869 |
Other Information |
The following is a summary of the inputs used, as of July 31, 2011, involving the Fund's assets and liabilities carried at fair value. The inputs or methodology used for valuing securities may not be an indication of the risk associated with investing in those securities. For more information on valuation inputs, and their aggregation into the levels used in the table below, please refer to the Security Valuation section in the accompanying Notes to Financial Statements. |
Valuation Inputs at Reporting Date: |
Description | Total | Level 1 | Level 2 | Level 3 |
Investments in Securities: | | | | |
Common Stocks | $ 52,755,933 | $ 51,339,752 | $ 1,416,181 | $ - |
Nonconvertible Preferred Stocks | 520,959 | 520,959 | - | - |
Money Market Funds | 1,031,268 | 1,031,268 | - | - |
Total Investments in Securities: | $ 54,308,160 | $ 52,891,979 | $ 1,416,181 | $ - |
See accompanying notes which are an integral part of the financial statements.
Annual Report
Fidelity Advisor Consumer Discretionary Fund
Statement of Assets and Liabilities
| July 31, 2011 |
| | |
Assets | | |
Investment in securities, at value (including securities loaned of $617,038) - See accompanying schedule: Unaffiliated issuers (cost $46,536,894) | $ 53,276,892 | |
Fidelity Central Funds (cost $1,031,268) | 1,031,268 | |
Total Investments (cost $47,568,162) | | $ 54,308,160 |
Cash | | 6,593 |
Receivable for investments sold | | 1,571,172 |
Receivable for fund shares sold | | 26,043 |
Dividends receivable | | 34,533 |
Distributions receivable from Fidelity Central Funds | | 893 |
Other receivables | | 3,374 |
Total assets | | 55,950,768 |
| | |
Liabilities | | |
Payable for investments purchased | $ 1,554,764 | |
Payable for fund shares redeemed | 401,297 | |
Accrued management fee | 26,175 | |
Distribution and service plan fees payable | 18,413 | |
Other affiliated payables | 14,109 | |
Other payables and accrued expenses | 41,043 | |
Collateral on securities loaned, at value | 634,000 | |
Total liabilities | | 2,689,801 |
| | |
Net Assets | | $ 53,260,967 |
Net Assets consist of: | | |
Paid in capital | | $ 44,087,434 |
Accumulated net investment loss | | (8,467) |
Accumulated undistributed net realized gain (loss) on investments and foreign currency transactions | | 2,449,058 |
Net unrealized appreciation (depreciation) on investments and assets and liabilities in foreign currencies | | 6,732,942 |
Net Assets | | $ 53,260,967 |
Statement of Assets and Liabilities - continued
| July 31, 2011 |
| | |
Calculation of Maximum Offering Price Class A:
Net Asset Value and redemption price per share ($23,446,652 ÷ 1,465,157 shares) | | $ 16.00 |
| | |
Maximum offering price per share (100/94.25 of $16.00) | | $ 16.98 |
Class T:
Net Asset Value and redemption price per share ($9,896,793 ÷ 641,521 shares) | | $ 15.43 |
| | |
Maximum offering price per share (100/96.50 of $15.43) | | $ 15.99 |
Class B:
Net Asset Value and offering price per share ($3,170,478 ÷ 222,797 shares)A | | $ 14.23 |
| | |
Class C:
Net Asset Value and offering price per share ($7,341,284 ÷ 514,748 shares)A | | $ 14.26 |
| | |
Institutional Class:
Net Asset Value, offering price and redemption price per share ($9,405,760 ÷ 562,581 shares) | | $ 16.72 |
A Redemption price per share is equal to net asset value less any applicable contingent deferred sales charge.
See accompanying notes which are an integral part of the financial statements.
Annual Report
Fidelity Advisor Consumer Discretionary Fund
Financial Statements - continued
Statement of Operations
| Year ended July 31, 2011 |
| | |
Investment Income | | |
Dividends | | $ 683,074 |
Interest | | 2 |
Income from Fidelity Central Funds | | 12,869 |
Total income | | 695,945 |
| | |
Expenses | | |
Management fee | $ 315,315 | |
Transfer agent fees | 155,696 | |
Distribution and service plan fees | 253,840 | |
Accounting and security lending fees | 22,469 | |
Custodian fees and expenses | 26,410 | |
Independent trustees' compensation | 305 | |
Registration fees | 58,540 | |
Audit | 52,544 | |
Legal | 229 | |
Miscellaneous | 546 | |
Total expenses before reductions | 885,894 | |
Expense reductions | (9,785) | 876,109 |
Net investment income (loss) | | (180,164) |
Realized and Unrealized Gain (Loss) Net realized gain (loss) on: | | |
Investment securities: | | |
Unaffiliated issuers (net of foreign taxes of $9,649) | 5,903,900 | |
Foreign currency transactions | (8,319) | |
Total net realized gain (loss) | | 5,895,581 |
Change in net unrealized appreciation (depreciation) on: Investment securities (net of increase in deferred foreign taxes of $6,492) | 6,053,577 | |
Assets and liabilities in foreign currencies | (569) | |
Total change in net unrealized appreciation (depreciation) | | 6,053,008 |
Net gain (loss) | | 11,948,589 |
Net increase (decrease) in net assets resulting from operations | | $ 11,768,425 |
Statement of Changes in Net Assets
| Year ended
July 31,
2011 | Year ended
July 31,
2010 |
Increase (Decrease) in Net Assets | | |
Operations | | |
Net investment income (loss) | $ (180,164) | $ (139,360) |
Net realized gain (loss) | 5,895,581 | 6,027,146 |
Change in net unrealized appreciation (depreciation) | 6,053,008 | 1,905,033 |
Net increase (decrease) in net assets resulting from operations | 11,768,425 | 7,792,819 |
Distributions to shareholders from net investment income | - | (6,476) |
Share transactions - net increase (decrease) | (7,894,650) | 9,354,979 |
Redemption fees | 1,559 | 1,671 |
Total increase (decrease) in net assets | 3,875,334 | 17,142,993 |
| | |
Net Assets | | |
Beginning of period | 49,385,633 | 32,242,640 |
End of period (including accumulated net investment loss of $8,467 and undistributed net investment income of $0, respectively) | $ 53,260,967 | $ 49,385,633 |
See accompanying notes which are an integral part of the financial statements.
Annual Report
Financial Highlights - Class A
Years ended July 31, | 2011 | 2010 | 2009 | 2008 | 2007 |
Selected Per-Share Data | | | | | |
Net asset value, beginning of period | $ 12.75 | $ 10.26 | $ 11.41 | $ 15.89 | $ 16.39 |
Income from Investment Operations | | | | | |
Net investment income (loss) C | (.02) | (.02) | .04 | .02 | .02 F |
Net realized and unrealized gain (loss) | 3.27 | 2.51 | (1.16) | (3.09) | 1.83 |
Total from investment operations | 3.25 | 2.49 | (1.12) | (3.07) | 1.85 |
Distributions from net investment income | - | - | (.03) | - | (.05) |
Distributions from net realized gain | - | - | - | (1.41) | (2.30) |
Total distributions | - | - | (.03) | (1.41) | (2.35) |
Redemption fees added to paid in capital C,H | - | - | - | - | - |
Net asset value, end of period | $ 16.00 | $ 12.75 | $ 10.26 | $ 11.41 | $ 15.89 |
Total Return A,B | 25.49% | 24.27% | (9.81)% | (21.24)% | 11.67% |
Ratios to Average Net Assets D,G | | | | | |
Expenses before reductions | 1.39% | 1.44% | 1.62% | 1.40% | 1.42% |
Expenses net of fee waivers, if any | 1.39% | 1.40% | 1.40% | 1.40% | 1.40% |
Expenses net of all reductions | 1.38% | 1.39% | 1.40% | 1.40% | 1.39% |
Net investment income (loss) | (.15)% | (.15)% | .42% | .15% | .11% F |
Supplemental Data | | | | | |
Net assets, end of period (000 omitted) | $ 23,447 | $ 19,423 | $ 13,010 | $ 11,899 | $ 19,708 |
Portfolio turnover rate E | 179% | 163% | 99% | 63% | 164% |
A Total returns would have been lower if certain expenses had not been reduced during the applicable periods shown.
B Total returns do not include the effect of the sales charges.
C Calculated based on average shares outstanding during the period.
D Fees and expenses of any underlying Fidelity Central Funds are not included in the Fund's expense ratio. The Fund indirectly bears its proportionate share of the expenses of any underlying Fidelity Central Funds.
E Amount does not include the portfolio activity of any underlying Fidelity Central Funds.
F Investment income per share reflects a special dividend which amounted to $.07 per share. Excluding the special dividend, the ratio of net investment income (loss) to average net assets would have been (.32)%.
G Expense ratios reflect operating expenses of the class. Expenses before reductions do not reflect amounts reimbursed by the investment adviser or reductions from brokerage service arrangements or reductions from other expense offset arrangements and do not represent the amount paid by the class during periods when reimbursements or reductions occur. Expenses net of fee waivers reflect expenses after reimbursement by the investment adviser but prior to reductions from brokerage service arrangements or other expense offset arrangements. Expenses net of all reductions represent the net expenses paid by the class.
H Amount represents less than $.01 per share.
Financial Highlights - Class T
Years ended July 31, | 2011 | 2010 | 2009 | 2008 | 2007 |
Selected Per-Share Data | | | | | |
Net asset value, beginning of period | $ 12.32 | $ 9.94 | $ 11.07 | $ 15.47 | $ 16.03 |
Income from Investment Operations | | | | | |
Net investment income (loss) C | (.06) | (.05) | .01 | (.01) | (.02) F |
Net realized and unrealized gain (loss) | 3.17 | 2.43 | (1.12) | (3.00) | 1.79 |
Total from investment operations | 3.11 | 2.38 | (1.11) | (3.01) | 1.77 |
Distributions from net investment income | - | - | (.02) | - | (.03) |
Distributions from net realized gain | - | - | - | (1.39) | (2.30) |
Total distributions | - | - | (.02) | (1.39) | (2.33) |
Redemption fees added to paid in capital C,H | - | - | - | - | - |
Net asset value, end of period | $ 15.43 | $ 12.32 | $ 9.94 | $ 11.07 | $ 15.47 |
Total Return A,B | 25.24% | 23.94% | (10.04)% | (21.41)% | 11.43% |
Ratios to Average Net Assets D,G | | | | | |
Expenses before reductions | 1.66% | 1.71% | 1.89% | 1.64% | 1.69% |
Expenses net of fee waivers, if any | 1.65% | 1.65% | 1.65% | 1.64% | 1.65% |
Expenses net of all reductions | 1.64% | 1.64% | 1.65% | 1.62% | 1.61% |
Net investment income (loss) | (.40)% | (.40)% | .17% | (.08)% | (.10)% F |
Supplemental Data | | | | | |
Net assets, end of period (000 omitted) | $ 9,897 | $ 8,018 | $ 6,738 | $ 9,095 | $ 14,787 |
Portfolio turnover rate E | 179% | 163% | 99% | 63% | 164% |
A Total returns would have been lower if certain expenses had not been reduced during the applicable periods shown.
B Total returns do not include the effect of the sales charges.
C Calculated based on average shares outstanding during the period.
D Fees and expenses of any underlying Fidelity Central Funds are not included in the Fund's expense ratio. The Fund indirectly bears its proportionate share of the expenses of any underlying Fidelity Central Funds.
E Amount does not include the portfolio activity of any underlying Fidelity Central Funds.
F Investment income per share reflects a special dividend which amounted to $.07 per share. Excluding the special dividend, the ratio of net investment income (loss) to average net assets would have been (.53)%.
G Expense ratios reflect operating expenses of the class. Expenses before reductions do not reflect amounts reimbursed by the investment adviser or reductions from brokerage service arrangements or reductions from other expense offset arrangements and do not represent the amount paid by the class during periods when reimbursements or reductions occur. Expenses net of fee waivers reflect expenses after reimbursement by the investment adviser but prior to reductions from brokerage service arrangements or other expense offset arrangements. Expenses net of all reductions represent the net expenses paid by the class.
H Amount represents less than $.01 per share.
See accompanying notes which are an integral part of the financial statements.
Annual Report
Financial Highlights - Class B
Years ended July 31, | 2011 | 2010 | 2009 | 2008 | 2007 |
Selected Per-Share Data | | | | | |
Net asset value, beginning of period | $ 11.42 | $ 9.26 | $ 10.35 | $ 14.56 | $ 15.26 |
Income from Investment Operations | | | | | |
Net investment income (loss) C | (.12) | (.10) | (.03) | (.07) | (.10) F |
Net realized and unrealized gain (loss) | 2.93 | 2.26 | (1.06) | (2.81) | 1.70 |
Total from investment operations | 2.81 | 2.16 | (1.09) | (2.88) | 1.60 |
Distributions from net realized gain | - | - | - | (1.33) | (2.30) |
Redemption fees added to paid in capital C,H | - | - | - | - | - |
Net asset value, end of period | $ 14.23 | $ 11.42 | $ 9.26 | $ 10.35 | $ 14.56 |
Total Return A,B | 24.61% | 23.33% | (10.53)% | (21.80)% | 10.82% |
Ratios to Average Net Assets D,G | | | | | |
Expenses before reductions | 2.15% | 2.21% | 2.38% | 2.14% | 2.20% |
Expenses net of fee waivers, if any | 2.15% | 2.15% | 2.15% | 2.14% | 2.15% |
Expenses net of all reductions | 2.13% | 2.14% | 2.15% | 2.14% | 2.15% |
Net investment income (loss) | (.90)% | (.90)% | (.33)% | (.60)% | (.64)% F |
Supplemental Data | | | | | |
Net assets, end of period (000 omitted) | $ 3,170 | $ 3,643 | $ 3,550 | $ 5,090 | $ 11,081 |
Portfolio turnover rate E | 179% | 163% | 99% | 63% | 164% |
A Total returns would have been lower if certain expenses had not been reduced during the applicable periods shown.
B Total returns do not include the effect of the contingent deferred sales charge.
C Calculated based on average shares outstanding during the period.
D Fees and expenses of any underlying Fidelity Central Funds are not included in the Fund's expense ratio. The Fund indirectly bears its proportionate share of the expenses of any underlying Fidelity Central Funds.
E Amount does not include the portfolio activity of any underlying Fidelity Central Funds.
F Investment income per share reflects a special dividend which amounted to $.07 per share. Excluding the special dividend, the ratio of net investment income (loss) to average net assets would have been (1.07)%.
G Expense ratios reflect operating expenses of the class. Expenses before reductions do not reflect amounts reimbursed by the investment adviser or reductions from brokerage service arrangements or reductions from other expense offset arrangements and do not represent the amount paid by the class during periods when reimbursements or reductions occur. Expenses net of fee waivers reflect expenses after reimbursement by the investment adviser but prior to reductions from brokerage service arrangements or other expense offset arrangements. Expenses net of all reductions represent the net expenses paid by the class.
H Amount represents less than $.01 per share.
Financial Highlights - Class C
Years ended July 31, | 2011 | 2010 | 2009 | 2008 | 2007 |
Selected Per-Share Data | | | | | |
Net asset value, beginning of period | $ 11.44 | $ 9.27 | $ 10.37 | $ 14.59 | $ 15.28 |
Income from Investment Operations | | | | | |
Net investment income (loss) C | (.12) | (.10) | (.03) | (.07) | (.10) F |
Net realized and unrealized gain (loss) | 2.94 | 2.27 | (1.07) | (2.81) | 1.71 |
Total from investment operations | 2.82 | 2.17 | (1.10) | (2.88) | 1.61 |
Distributions from net realized gain | - | - | - | (1.34) | (2.30) |
Redemption fees added to paid in capital C,H | - | - | - | - | - |
Net asset value, end of period | $ 14.26 | $ 11.44 | $ 9.27 | $ 10.37 | $ 14.59 |
Total Return A,B | 24.65% | 23.41% | (10.61)% | (21.77)% | 10.88% |
Ratios to Average Net Assets D,G | | | | | |
Expenses before reductions | 2.11% | 2.12% | 2.38% | 2.15% | 2.16% |
Expenses net of fee waivers, if any | 2.11% | 2.12% | 2.15% | 2.15% | 2.15% |
Expenses net of all reductions | 2.09% | 2.11% | 2.15% | 2.14% | 2.15% |
Net investment income (loss) | (.86)% | (.87)% | (.33)% | (.60)% | (.64)% F |
Supplemental Data | | | | | |
Net assets, end of period (000 omitted) | $ 7,341 | $ 9,288 | $ 2,955 | $ 3,430 | $ 8,051 |
Portfolio turnover rate E | 179% | 163% | 99% | 63% | 164% |
A Total returns would have been lower if certain expenses had not been reduced during the applicable periods shown.
B Total returns do not include the effect of the contingent deferred sales charge.
C Calculated based on average shares outstanding during the period.
D Fees and expenses of any underlying Fidelity Central Funds are not included in the Fund's expense ratio. The Fund indirectly bears its proportionate share of the expenses of any underlying Fidelity Central Funds.
E Amount does not include the portfolio activity of any underlying Fidelity Central Funds.
F Investment income per share reflects a special dividend which amounted to $.07 per share. Excluding the special dividend, the ratio of net investment income (loss) to average net assets would have been (1.07)%.
G Expense ratios reflect operating expenses of the class. Expenses before reductions do not reflect amounts reimbursed by the investment adviser or reductions from brokerage service arrangements or reductions from other expense offset arrangements and do not represent the amount paid by the class during periods when reimbursements or reductions occur. Expenses net of fee waivers reflect expenses after reimbursement by the investment adviser but prior to reductions from brokerage service arrangements or other expense offset arrangements. Expenses net of all reductions represent the net expenses paid by the class.
H Amount represents less than $.01 per share.
See accompanying notes which are an integral part of the financial statements.
Annual Report
Financial Highlights - Institutional Class
Years ended July 31, | 2011 | 2010 | 2009 | 2008 | 2007 |
Selected Per-Share Data | | | | | |
Net asset value, beginning of period | $ 13.27 | $ 10.66 | $ 11.84 | $ 16.41 | $ 16.82 |
Income from Investment Operations | | | | | |
Net investment income (loss) B | .03 | .02 | .06 | .06 | .06 E |
Net realized and unrealized gain (loss) | 3.42 | 2.60 | (1.20) | (3.22) | 1.89 |
Total from investment operations | 3.45 | 2.62 | (1.14) | (3.16) | 1.95 |
Distributions from net investment income | - | (.01) | (.04) | - | (.06) |
Distributions from net realized gain | - | - | - | (1.41) | (2.30) |
Total distributions | - | (.01) | (.04) | (1.41) | (2.36) |
Redemption fees added to paid in capital B,G | - | - | - | - | - |
Net asset value, end of period | $ 16.72 | $ 13.27 | $ 10.66 | $ 11.84 | $ 16.41 |
Total Return A | 26.00% | 24.62% | (9.59)% | (21.09)% | 12.04% |
Ratios to Average Net Assets C,F | | | | | |
Expenses before reductions | 1.03% | 1.09% | 1.15% | 1.14% | 1.15% |
Expenses net of fee waivers, if any | 1.03% | 1.09% | 1.15% | 1.14% | 1.15% |
Expenses net of all reductions | 1.01% | 1.08% | 1.15% | 1.14% | 1.14% |
Net investment income (loss) | .22% | .16% | .67% | .40% | .36% E |
Supplemental Data | | | | | |
Net assets, end of period (000 omitted) | $ 9,406 | $ 9,013 | $ 5,990 | $ 398 | $ 1,385 |
Portfolio turnover rate D | 179% | 163% | 99% | 63% | 164% |
A Total returns would have been lower if certain expenses had not been reduced during the applicable periods shown.
B Calculated based on average shares outstanding during the period.
C Fees and expenses of any underlying Fidelity Central Funds are not included in the Fund's expense ratio. The Fund indirectly bears its proportionate share of the expenses of any underlying Fidelity Central Funds.
D Amount does not include the portfolio activity of any underlying Fidelity Central Funds.
E Investment income per share reflects a special dividend which amounted to $.07 per share. Excluding the special dividend, the ratio of net investment income (loss) to average net assets would have been (.07)%.
F Expense ratios reflect operating expenses of the class. Expenses before reductions do not reflect amounts reimbursed by the investment adviser or reductions from brokerage service arrangements or reductions from other expense offset arrangements and do not represent the amount paid by the class during periods when reimbursements or reductions occur. Expenses net of fee waivers reflect expenses after reimbursement by the investment adviser but prior to reductions from brokerage service arrangements or other expense offset arrangements. Expenses net of all reductions represent the net expenses paid by the class.
G Amount represents less than $.01 per share.
See accompanying notes which are an integral part of the financial statements.
Annual Report
Notes to Financial Statements
For the period ended July 31, 2011
1. Organization.
Fidelity Advisor Consumer Discretionary Fund (the Fund) is a non-diversified fund of Fidelity Advisor Series VII (the Trust) and is authorized to issue an unlimited number of shares. The Trust is registered under the Investment Company Act of 1940, as amended (the 1940 Act), as an open-end management investment company organized as a Massachusetts business trust. The Fund offers Class A, Class T, Class C and Institutional Class shares, each of which, along with Class B shares, has equal rights as to assets and voting privileges. Effective after the close of business on September 1, 2010, Class B shares were closed to new accounts and additional purchases, except for exchanges and reinvestments, by existing shareholders. Each class has exclusive voting rights with respect to matters that affect that class. Class B shares will automatically convert to Class A shares after a holding period of seven years from the initial date of purchase. Investment income, realized and unrealized capital gains and losses, the common expenses of the Fund, and certain fund-level expense reductions, if any, are allocated on a pro-rata basis to each class based on the relative net assets of each class to the total net assets of the Fund. Each class differs with respect to transfer agent and distribution and service plan fees incurred. Certain expense reductions may also differ by class.
2. Investments in Fidelity Central Funds.
The Fund invests in Fidelity Central Funds, which are open-end investment companies available only to other investment companies and accounts managed by Fidelity Management & Research Company (FMR) and its affiliates. The Fund's Schedule of Investments lists each of the Fidelity Central Funds held as of period end, if any, as an investment of the Fund, but does not include the underlying holdings of each Fidelity Central Fund. As an Investing Fund, the Fund indirectly bears its proportionate share of the expenses of the underlying Fidelity Central Funds.
The Money Market Central Funds seek preservation of capital and current income and are managed by Fidelity Investments Money Management, Inc. (FIMM), an affiliate of FMR.
A complete unaudited list of holdings for each Fidelity Central Fund is available upon request or at the Securities and Exchange Commission (the SEC) web site at www.sec.gov. In addition, the financial statements of the Fidelity Central Funds, which are not covered by the Fund's Report of Independent Registered Public Accounting Firm, are available on the SEC web site or upon request.
3. Significant Accounting Policies.
The financial statements have been prepared in conformity with accounting principles generally accepted in the United States of America (GAAP), which require management to make certain estimates and assumptions at the date of the financial statements. Actual results could differ from those estimates. Subsequent events, if any, through the date that the financial statements were issued have been evaluated in the preparation of the financial statements. The following summarizes the significant accounting policies of the Fund:
Security Valuation. Investments are valued as of 4:00 p.m. Eastern time on the last calendar day of the period. The Fund uses independent pricing services approved by the Board of Trustees to value its investments. When current market prices or quotations are not readily available or reliable, valuations may be determined in good faith in accordance with procedures adopted by the Board of Trustees. Factors used in determining value may include market or security specific events. The frequency with which these procedures are used cannot be predicted and they may be utilized to a significant extent. The value used for net asset value (NAV) calculation under these procedures may differ from published prices for the same securities.
The Fund categorizes the inputs to valuation techniques used to value its investments into a disclosure hierarchy consisting of three levels as shown below:
Level 1 - quoted prices in active markets for identical investments
Level 2 - other significant observable inputs (including quoted prices for similar investments, interest rates, prepayment speeds, etc.)
Level 3 - unobservable inputs (including the Fund's own assumptions based on the best information available)
Changes in valuation techniques may result in transfers in or out of an assigned level within the disclosure hierarchy. The aggregate value of investments by input level, as of July 31, 2011, is included at the end of the Fund's Schedule of Investments. Valuation techniques used to value the Fund's investments by major category are as follows:
Equity securities, including restricted securities, for which market quotations are readily available, are valued at the last reported sale price or official closing price as reported by an independent pricing service on the primary market or exchange on which they are traded and are categorized as Level 1 in the hierarchy. In the event there were no sales during the day or closing prices are not available, securities are valued at the last quoted bid price or may be valued using the last available price and are generally categorized as Level 2 in the hierarchy. For foreign equity securities, when significant market or security specific events arise, comparisons to the valuation of American Depositary Receipts (ADRs), futures contracts, Exchange-traded funds (ETFs) and certain indexes as well as quoted prices for similar securities are used and are categorized as Level 2 in the hierarchy in these
Annual Report
3. Significant Accounting Policies - continued
Security Valuation - continued
circumstances. Utilizing these techniques may result in transfers between Level 1 and Level 2. For restricted equity securities and private placements where observable inputs are limited, assumptions about market activity and risk are used and are categorized as Level 3 in the hierarchy.
Investments in open-end mutual funds, including the Fidelity Central Funds, are valued at their closing net asset value each business day and are categorized as Level 1 in the hierarchy.
Foreign Currency. The Fund may use foreign currency contracts to facilitate transactions in foreign-denominated securities. Gains and losses from these transactions may arise from changes in the value of the foreign currency or if the counterparties do not perform under the contracts' terms.
Foreign-denominated assets, including investment securities, and liabilities are translated into U.S. dollars at the exchange rate at period end. Purchases and sales of investment securities, income and dividends received and expenses denominated in foreign currencies are translated into U.S. dollars at the exchange rate in effect on the transaction date.
The effects of exchange rate fluctuations on investments are included with the net realized and unrealized gain (loss) on investment securities. Other foreign currency transactions resulting in realized and unrealized gain (loss) are disclosed separately.
Investment Transactions and Income. For financial reporting purposes, the Fund's investment holdings and NAV include trades executed through the end of the last business day of the period. The NAV per share for processing shareholder transactions is calculated as of the close of business of the New York Stock Exchange (NYSE), normally 4:00 p.m. Eastern time and includes trades executed through the end of the prior business day. Gains and losses on securities sold are determined on the basis of identified cost and may include proceeds received from litigation. Dividend income is recorded on the ex-dividend date, except for certain dividends from foreign securities where the ex-dividend date may have passed, which are recorded as soon as the Fund is informed of the ex-dividend date. Non-cash dividends included in dividend income, if any, are recorded at the fair market value of the securities received. Distributions received on securities that represent a return of capital or capital gain are recorded as a reduction of cost of investments and/or as a realized gain. The Fund estimates the components of distributions received that may be considered return of capital distributions or capital gain distributions. Interest income and distributions from the Fidelity Central Funds are accrued as earned. Interest income includes coupon interest and amortization of premium and accretion of discount on debt securities. Investment income is recorded net of foreign taxes withheld where recovery of such taxes is uncertain.
Expenses. Expenses directly attributable to a fund are charged to that fund. Expenses attributable to more than one fund are allocated among the respective funds on the basis of relative net assets or other appropriate methods. Expense estimates are accrued in the period to which they relate and adjustments are made when actual amounts are known.
Income Tax Information and Distributions to Shareholders. Each year, the Fund intends to qualify as a regulated investment company, including distributing substantially all of its taxable income and realized gains under Subchapter M of the Internal Revenue Code and filing its U.S. federal tax return. As a result, no provision for income taxes is required. As of July 31, 2011, the Fund did not have any unrecognized tax benefits in the financial statements. A fund's federal tax return is subject to examination by the Internal Revenue Service (IRS) for a period of three years. Foreign taxes are provided for based on the Fund's understanding of the tax rules and rates that exist in the foreign markets in which it invests. The Fund is subject to a tax imposed on realized short term capital gains on securities of certain issuers domiciled in India. An estimated deferred tax liability for net unrealized gains on these securities is included in Other payables and accrued expenses on the Statement of Assets & Liabilities.
Distributions are declared and recorded on the ex-dividend date. Income dividends and capital gain distributions are declared separately for each class. Income and capital gain distributions are determined in accordance with income tax regulations, which may differ from GAAP. In addition, the fund claimed a portion of the payment made to redeeming shareholders as a distribution for income tax purposes.
Capital accounts within the financial statements are adjusted for permanent book-tax differences. These adjustments have no impact on net assets or the results of operations. Temporary book-tax differences will reverse in a subsequent period.
Book-tax differences are primarily due to foreign currency transactions, certain foreign taxes, deferred trustees compensation, net operating losses, capital loss carryforwards and losses deferred due to wash sales and excise tax regulations.
The federal tax cost of investment securities and unrealized appreciation (depreciation) as of period end were as follows:
Gross unrealized appreciation | $ 8,208,614 |
Gross unrealized depreciation | (1,732,825) |
Net unrealized appreciation (depreciation) on securities and other investments | $ 6,475,789 |
| |
Tax Cost | $ 47,832,371 |
Annual Report
Notes to Financial Statements - continued
3. Significant Accounting Policies - continued
Income Tax Information and Distributions to Shareholders - continued
The tax-based components of distributable earnings as of period end were as follows:
Undistributed long-term capital gain | $ 2,713,267 |
Net unrealized appreciation (depreciation) | $ 6,475,225 |
The tax character of distributions paid was as follows:
| July 31, 2011 | July 31, 2010 |
Ordinary Income | $ - | $ 6,476 |
Under the recently enacted Regulated Investment Company Modernization Act of 2010 (the Act), the Fund will be permitted to carry forward capital losses incurred in taxable years beginning after December 22, 2010 for an unlimited period. However, any losses incurred during those future taxable years will be required to be utilized prior to any losses incurred in pre-enactment taxable years, which generally expire after eight years from when they are incurred. Additionally, post-enactment capital losses that are carried forward will retain their character as either short-term or long-term capital losses rather than being considered all short-term as under previous law. The Fund's first fiscal year end subject to the Act will be July 31, 2012.
Short-Term Trading (Redemption) Fees. Shares held by investors in the Fund less than 30 days are subject to a redemption fee equal to .75% of the net asset value of shares redeemed. All redemption fees, which reduce the proceeds of the shareholder redemption, are retained by the Fund and accounted for as an addition to paid in capital.
New Accounting Pronouncement. In May 2011, the Financial Accounting Standards Board issued Accounting Standard Update No. 2011-04, Fair Value Measurement (Topic 820) - Amendments to Achieve Common Fair Value Measurement and Disclosure Requirements in U.S. GAAP and IFRSs. The update changes the wording used to describe the requirements in GAAP for measuring fair value and for disclosing information about fair value measurements. The update is effective during interim and annual periods beginning after December 15, 2011. Management is currently evaluating the impact of the update's adoption on the Fund's financial statement disclosures.
4. Purchases and Sales of Investments.
Purchases and sales of securities, other than short-term securities, aggregated $99,818,524 and $107,421,190, respectively.
5. Fees and Other Transactions with Affiliates.
Management Fee. FMR and its affiliates provide the Fund with investment management related services for which the Fund pays a monthly management fee. The management fee is the sum of an individual fund fee rate that is based on an annual rate of .30% of the Fund's average net assets and a group fee rate that averaged .26% during the period. The group fee rate is based upon the average net assets of all the mutual funds advised by FMR. The group fee rate decreases as assets under management increase and increases as assets under management decrease. For the period, the total annual management fee rate was .56% of the Fund's average net assets.
Distribution and Service Plan Fees. In accordance with Rule 12b-1 of the 1940 Act, the Fund has adopted separate Distribution and Service Plans for each class of shares. Certain classes pay Fidelity Distributors Corporation (FDC), an affiliate of FMR, separate Distribution and Service Fees, each of which is based on an annual percentage of each class' average net assets. In addition, FDC may pay financial intermediaries for selling shares of the Fund and providing shareholder support services. For the period, the Distribution and Service Fee rates, total fees and amounts retained by FDC were as follows:
| Distribution
Fee | Service
Fee | Total Fees | Retained
by FDC |
Class A | -% | .25% | $ 57,507 | $ 1,875 |
Class T | .25% | .25% | 48,950 | - |
Class B | .75% | .25% | 36,668 | 27,501 |
Class C | .75% | .25% | 110,715 | 16,330 |
| | | $ 253,840 | $ 45,706 |
Annual Report
5. Fees and Other Transactions with Affiliates - continued
Sales Load. FDC may receive a front-end sales charge of up to 5.75% for selling Class A shares, and 3.50% for selling Class T shares, some of which is paid to financial intermediaries for selling shares of the Fund. Depending on the holding period, FDC may receive contingent deferred sales charges levied on Class A, Class T, Class B, and Class C redemptions. The deferred sales charges range from 5% to 1% for Class B, 1% for Class C, 1.00% for certain purchases of Class A shares and .25% for certain purchases of Class T shares.
For the period, sales charge amounts retained by FDC were as follows:
| Retained
by FDC |
Class A | $ 17,684 |
Class T | 5,544 |
Class B* | 4,769 |
Class C* | 2,153 |
| $ 30,150 |
* When Class B and Class C shares are initially sold, FDC pays commissions from its own resources to financial intermediaries through which the sales are made.
Transfer Agent Fees. Fidelity Investments Institutional Operations Company, Inc. (FIIOC), an affiliate of FMR, is the transfer, dividend disbursing and shareholder servicing agent for each class of the Fund. FIIOC receives account fees and asset-based fees that vary according to the account size and type of account of the shareholders of the respective classes of the Fund. FIIOC pays for typesetting, printing and mailing of shareholder reports, except proxy statements. For the period, transfer agent fees for each class were as follows:
| Amount | % of
Average
Net Assets |
Class A | $ 68,923 | .30 |
Class T | 30,589 | .31 |
Class B | 11,042 | .30 |
Class C | 28,544 | .26 |
Institutional Class | 16,598 | .18 |
| $ 155,696 | |
Accounting and Security Lending Fees. Fidelity Service Company, Inc. (FSC), an affiliate of FMR, maintains the Fund's accounting records. The accounting fee is based on the level of average net assets for the month. Under a separate contract, FSC administers the security lending program. The security lending fee is based on the number and duration of lending transactions.
Brokerage Commissions. The Fund placed a portion of its portfolio transactions with brokerage firms which are affiliates of the investment adviser. The commissions paid to these affiliated firms were $5,609 for the period.
6. Committed Line of Credit.
The Fund participates with other funds managed by FMR or an affiliate in a $4.0 billion credit facility (the "line of credit") to be utilized for temporary or emergency purposes to fund shareholder redemptions or for other short-term liquidity purposes. The Fund has agreed to pay commitment fees on its pro-rata portion of the line of credit, which amounted to $188 and is reflected in Miscellaneous expenses on the Statement of Operations. During the period, there were no borrowings on this line of credit.
7. Security Lending.
The Fund lends portfolio securities through a lending agent from time to time in order to earn additional income. The lending agent may loan securities to certain qualified borrowers, including Fidelity Capital Markets (FCM), a broker-dealer affiliated with the Fund. On the settlement date of the loan, the Fund receives collateral (in the form of U.S. Treasury obligations, letters of credit and/or cash) against the loaned securities and maintains collateral in an amount not less than 100% of the market value of the loaned securities during the period of the loan. The market value of the loaned securities is determined at the close of business of the Fund and any additional required collateral is delivered to the Fund on the next business day. If the borrower defaults on its obligation to return the securities loaned because of insolvency or other reasons, a fund could experience delays and costs in recovering the securities loaned or in gaining access to the collateral. Any cash collateral received is invested in the Fidelity Securities Lending Cash Central Fund. The value of loaned securities and cash collateral at period end are disclosed on the Fund's Statement of Assets and Liabilities. Security lending income represents the income earned on investing cash collateral, less rebates paid to borrowers and lending agent fees associated with the loan, plus any premium payments received for lending certain types of securities. Security lending income is presented in the Statement of Operations
Annual Report
Notes to Financial Statements - continued
7. Security Lending - continued
as a component of income from Fidelity Central Funds, and includes $613 from securities loaned to FCM. Total security lending income during the period amounted to $11,911.
8. Expense Reductions.
FMR voluntarily agreed to reimburse each class to the extent annual operating expenses exceeded certain levels of average net assets as noted in the table below. Some expenses, for example interest expense, including commitment fees, are excluded from this reimbursement.
The following classes were in reimbursement during the period:
| Expense
Limitations | Reimbursement
from adviser |
Class T | 1.65% | $ 442 |
Many of the brokers with whom FMR places trades on behalf of the Fund provided services to the Fund in addition to trade execution. These services included payments of certain expenses on behalf of the Fund totaling $9,343 for the period.
9. Distributions to Shareholders.
Distributions to shareholders of each class were as follows:
Years ended July 31, | 2011 | 2010 |
From net investment income | | |
Institutional Class | $ - | $ 6,476 |
10. Share Transactions.
Transactions for each class of shares were as follows:
| Shares | Dollars |
Years ended July 31, | 2011 | 2010 | 2011 | 2010 |
Class A | | | | |
Shares sold | 665,093 | 790,157 | $ 10,095,802 | $ 9,916,430 |
Shares redeemed | (723,296) | (535,046) | (10,778,369) | (6,621,987) |
Net increase (decrease) | (58,203) | 255,111 | $ (682,567) | $ 3,294,443 |
Class T | | | | |
Shares sold | 187,572 | 124,293 | $ 2,764,268 | $ 1,532,286 |
Shares redeemed | (196,717) | (151,532) | (2,907,152) | (1,774,930) |
Net increase (decrease) | (9,145) | (27,239) | $ (142,884) | $ (242,644) |
Class B | | | | |
Shares sold | 40,939 | 84,992 | $ 519,870 | $ 960,028 |
Shares redeemed | (137,051) | (149,463) | (1,818,569) | (1,626,686) |
Net increase (decrease) | (96,112) | (64,471) | $ (1,298,699) | $ (666,658) |
Class C | | | | |
Shares sold | 588,992 | 651,335 | $ 8,103,013 | $ 6,961,979 |
Shares redeemed | (885,890) | (158,268) | (12,399,353) | (1,769,753) |
Net increase (decrease) | (296,898) | 493,067 | $ (4,296,340) | $ 5,192,226 |
Institutional Class | | | | |
Shares sold | 346,649 | 718,370 | $ 5,583,185 | $ 9,586,550 |
Reinvestment of distributions | - | 555 | - | 6,322 |
Shares redeemed | (463,053) | (601,861) | (7,057,345) | (7,815,260) |
Net increase (decrease) | (116,404) | 117,064 | $ (1,474,160) | $ 1,777,612 |
11. Other.
The Fund's organizational documents provide former and current trustees and officers with a limited indemnification against liabilities arising in connection with the performance of their duties to the Fund. In the normal course of business, the Fund may also enter into contracts that provide general indemnifications. The Fund's maximum exposure under these arrangements is unknown as this would be dependent on future claims that may be made against the Fund. The risk of material loss from such claims is considered remote.
Annual Report
Fidelity Advisor Electronics Fund - Institutional Class
Performance: The Bottom Line
Average annual total return reflects the change in the value of an investment, assuming reinvestment of the class' distributions from dividend income and capital gains (the profits earned upon the sale of securities that have grown in value, if any) and assuming a constant rate of performance each year. The $10,000 table and the fund's returns do not reflect the deduction of taxes that a shareholder would pay on fund distributions or the redemption of fund shares. During periods of reimbursement by Fidelity, a fund's total return will be greater than it would be had the reimbursement not occurred. How a fund did yesterday is no guarantee of how it will do tomorrow.
Average Annual Total Returns
Periods ended July 31, 2011 | Past 1
year | Past 5
years | Past 10
years |
Institutional Class | 25.38% | 4.22% | -0.43% |
$10,000 Over 10 Years
Let's say hypothetically that $10,000 was invested in Fidelity Advisor Electronics Fund - Institutional Class on July 31, 2001. The chart shows how the value of your investment would have changed, and also shows how the S&P 500 Index performed over the same period.
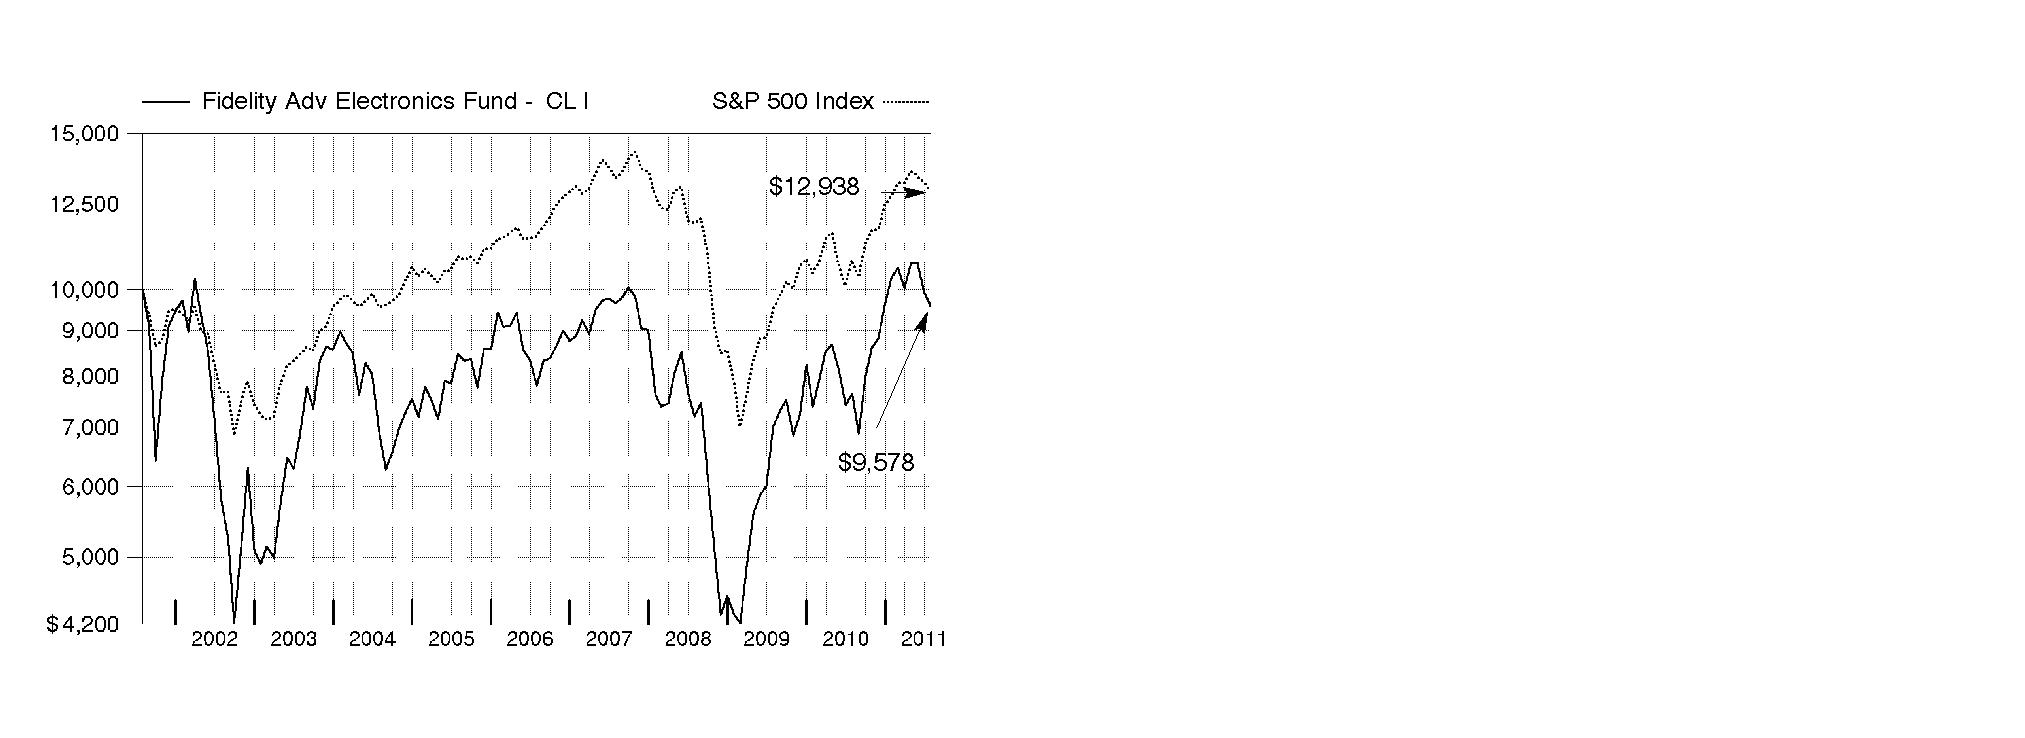
Annual Report
Fidelity Advisor Electronics Fund
Market Recap: U.S. stocks registered solid double-digit gains for the 12 months ending July 31, 2011, extending a rally that began more than two years earlier. Despite a rough start in August 2010, markets turned positive in September, as increased demand for capital goods and other upbeat indicators trumped investor worry about a U.S. recessionary relapse. The broad market, as measured by the S&P 500® Index, rose 9% that month, its biggest September gain in 71 years. Seven more monthly advances followed, fueled by encouraging corporate earnings and economic activity. However, volatility picked up in the period's latter months, as markets reacted to continued high U.S. unemployment, nagging debt troubles in Europe and looming legislative battles over the federal debt ceiling. May unemployment rose above 9% for the first time in 2011, contributing to a traditional "June swoon" for stocks. Market uncertainty lingered in July, when the S&P 500® posted its second-biggest monthly loss of the period. For the full year, the S&P 500® climbed 19.65%, while the blue-chip-laden Dow Jones Industrial AverageSM rose a comparable 19.09% and the technology-heavy Nasdaq Composite® Index gained 23.40%. On the capitalization spectrum, stocks of mid-cap companies fared best, with the Russell Midcap® Index rising 24.51% and the small-cap Russell 2000® Index adding 23.92%.
Comments from Stephen Barwikowski and Christopher Lin, Co-Portfolio Managers of Fidelity Advisor® Electronics Fund: For the year, the fund's Class A, Class T, Class B and Class C shares returned 25.07%, 24.71%, 23.92% and 24.10%, respectively (excluding sales charges), handily beating the S&P 500 and the 16.88% gain of the MSCI® U.S. IM Semiconductors & Semiconductor Equipment 25/50 Index. Versus the MSCI index, solid stock picking in the fund's primary category of semiconductors accounted for most of its outperformance. Additionally, out-of-benchmark exposure to electronic manufacturing services, computer storage/peripherals and communications equipment added value, as did security selection in semiconductor equipment. Far and away, the largest individual contributor in both relative and absolute terms was National Semiconductor. In April, the analog chip maker received a takeover bid of $25 per share from Texas Instruments, which represented a healthy premium over where the stock had been trading around $14 a share. Shortly after the takeover bid was announced, we sold our position to lock in profits. Other contributors included Fairchild Semiconductor International, a stock we bought advantageously, and Avago Technologies, which executed well on a number of fronts. Negligible exposure to poorly performing benchmark component Cree, a maker of light-emitting diode (LED) lights, also lifted performance. Conversely, the biggest relative detractor - and also the fund's largest holding at period end - was Marvell Technology Group, a provider of semiconductors for applications such as wireless communications, data storage and networking. Weak demand for smartphones manufactured by one of the company's primary customers, Research In Motion, weighed on the stock, in addition to lackluster personal computer sales. Underweighting two strong-performing benchmark constituents, chip makers Altera and Atmel, worked against the fund as well. Atmel was not held at period end.
Comments from Stephen Barwikowski and Christopher Lin, Co-Portfolio Managers of Fidelity Advisor® Electronics Fund: For the year, the fund's Institutional Class shares returned 25.38%, handily beating the S&P 500 and the 16.88% gain of the MSCI® U.S. IM Semiconductors & Semiconductor Equipment 25/50 Index. Versus the MSCI index, solid stock picking in the fund's primary category of semiconductors accounted for most of its outperformance. Additionally, out-of-benchmark exposure to electronic manufacturing services, computer storage/peripherals and communications equipment added value, as did security selection in semiconductor equipment. Far and away, the largest individual contributor in both relative and absolute terms was National Semiconductor. In April, the analog chip maker received a takeover bid of $25 per share from Texas Instruments, which represented a healthy premium over where the stock had been trading around $14 a share. Shortly after the takeover bid was announced, we sold our position to lock in profits. Other contributors included Fairchild Semiconductor International, a stock we bought advantageously, and Avago Technologies, which executed well on a number of fronts. Negligible exposure to poorly performing benchmark component Cree, a maker of light-emitting diode (LED) lights, also lifted performance. Conversely, the biggest relative detractor - and also the fund's largest holding at period end - was Marvell Technology Group, a provider of semiconductors for applications such as wireless communications, data storage and networking. Weak demand for smartphones manufactured by one of the company's primary customers, Research In Motion, weighed on the stock, in addition to lackluster personal computer sales. Underweighting two strong-performing benchmark constituents, chip makers Altera and Atmel, worked against the fund as well. Atmel was not held at period end.
The views expressed above reflect those of the portfolio manager(s) only through the end of the period as stated on the cover of this report and do not necessarily represent the views of Fidelity or any other person in the Fidelity organization. Any such views are subject to change at any time based upon market or other conditions and Fidelity disclaims any responsibility to update such views. These views may not be relied on as investment advice and, because investment decisions for a Fidelity fund are based on numerous factors, may not be relied on as an indication of trading intent on behalf of any Fidelity fund.
Annual Report
Fidelity Advisor Electronics Fund
As a shareholder of the Fund, you incur two types of costs: (1) transaction costs, including sales charges (loads) on purchase payments or redemption proceeds, redemption fees, and (2) ongoing costs, including management fees, distribution and/or service (12b-1) fees and other Fund expenses. This Example is intended to help you understand your ongoing costs (in dollars) of investing in the Fund and to compare these costs with the ongoing costs of investing in other mutual funds.
The Example is based on an investment of $1,000 invested at the beginning of the period and held for the entire period (February 1, 2011 to July 31, 2011).
Actual Expenses
The first line of the accompanying table for each class of the Fund provides information about actual account values and actual expenses. You may use the information in this line, together with the amount you invested, to estimate the expenses that you paid over the period. Simply divide your account value by $1,000.00 (for example, an $8,600 account value divided by $1,000.00 = 8.6), then multiply the result by the number in the first line for a class of the Fund under the heading entitled "Expenses Paid During Period" to estimate the expenses you paid on your account during this period. In addition, the Fund, as a shareholder in the underlying Fidelity Central Funds, will indirectly bear its pro-rata share of the fees and expenses incurred by the underlying Fidelity Central Funds. These fees and expenses are not included in the Fund's annualized expense ratio used to calculate the expense estimate in the table below.
Hypothetical Example for Comparison Purposes
The second line of the accompanying table for each class of the Fund provides information about hypothetical account values and hypothetical expenses based on a Class' actual expense ratio and an assumed rate of return of 5% per year before expenses, which is not the Class' actual return. The hypothetical account values and expenses may not be used to estimate the actual ending account balance or expenses you paid for the period. You may use this information to compare the ongoing costs of investing in the Fund and other funds. To do so, compare this 5% hypothetical example with the 5% hypothetical examples that appear in the shareholder reports of the other funds. In addition, the Fund, as a shareholder in the underlying Fidelity Central Funds, will indirectly bear its pro-rata share of the fees and expenses incurred by the underlying Fidelity Central Funds. These fees and expenses are not included in the Fund's annualized expense ratio used to calculate the expense estimate in the table below.
Please note that the expenses shown in the table are meant to highlight your ongoing costs only and do not reflect any transaction costs. Therefore, the second line of the table is useful in comparing ongoing costs only, and will not help you determine the relative total costs of owning different funds. In addition, if these transactional costs were included, your costs would have been higher.
| Annualized
Expense Ratio | Beginning
Account Value
February 1, 2011 | Ending
Account Value
July 31, 2011 | Expenses Paid
During Period*
February 1, 2011 to
July 31, 2011 |
Class A | 1.40% | | | |
Actual | | $ 1,000.00 | $ 927.30 | $ 6.69 |
HypotheticalA | | $ 1,000.00 | $ 1,017.85 | $ 7.00 |
Class T | 1.65% | | | |
Actual | | $ 1,000.00 | $ 925.80 | $ 7.88 |
HypotheticalA | | $ 1,000.00 | $ 1,016.61 | $ 8.25 |
Class B | 2.15% | | | |
Actual | | $ 1,000.00 | $ 922.10 | $ 10.25 |
HypotheticalA | | $ 1,000.00 | $ 1,014.13 | $ 10.74 |
Class C | 2.15% | | | |
Actual | | $ 1,000.00 | $ 923.20 | $ 10.25 |
HypotheticalA | | $ 1,000.00 | $ 1,014.13 | $ 10.74 |
Institutional Class | 1.15% | | | |
Actual | | $ 1,000.00 | $ 928.30 | $ 5.50 |
HypotheticalA | | $ 1,000.00 | $ 1,019.09 | $ 5.76 |
A 5% return per year before expenses
* Expenses are equal to each Class' annualized expense ratio, multiplied by the average account value over the period, multiplied by 181/365 (to reflect the one-half year period).
Annual Report
Fidelity Advisor Electronics Fund
Investment Changes (Unaudited)
Top Ten Stocks as of July 31, 2011 |
| % of fund's
net assets | % of fund's net assets
6 months ago |
Marvell Technology Group Ltd. | 10.6 | 8.7 |
Broadcom Corp. Class A | 9.7 | 5.2 |
Intel Corp. | 7.8 | 11.3 |
Advanced Micro Devices, Inc. | 4.9 | 3.8 |
Micron Technology, Inc. | 4.7 | 4.8 |
Analog Devices, Inc. | 4.0 | 0.5 |
Intersil Corp. Class A | 3.5 | 2.5 |
ON Semiconductor Corp. | 3.4 | 2.4 |
NXP Semiconductors NV | 3.4 | 1.7 |
Freescale Semiconductor Holdings I Ltd. | 3.1 | 0.0 |
| 55.1 | |
Top Industries (% of fund's net assets) |
As of July 31, 2011 |
| Semiconductors & Semiconductor Equipment | 88.2% | |
| Electronic Equipment & Components | 4.0% | |
| Communications Equipment | 3.4% | |
| Computers & Peripherals | 3.0% | |
| Internet Software & Services | 0.3% | |
| All Others* | 1.1% | |

As of January 31, 2011 |
| Semiconductors & Semiconductor Equipment | 81.8% | |
| Electronic Equipment & Components | 6.3% | |
| Communications Equipment | 3.9% | |
| Computers & Peripherals | 1.7% | |
| Internet Software & Services | 0.3% | |
| All Others* | 6.0% | |

* Includes short-term investments and net other assets. |
Annual Report
Fidelity Advisor Electronics Fund
Investments July 31, 2011
Showing Percentage of Net Assets
Common Stocks - 98.9% |
| Shares | | Value |
COMMUNICATIONS EQUIPMENT - 3.4% |
Communications Equipment - 3.4% |
Cisco Systems, Inc. | 15,114 | | $ 241,371 |
Juniper Networks, Inc. (a) | 3,400 | | 79,526 |
QUALCOMM, Inc. | 5,350 | | 293,073 |
| | 613,970 |
COMPUTERS & PERIPHERALS - 3.0% |
Computer Hardware - 1.1% |
Acer, Inc. | 17,000 | | 23,516 |
Hewlett-Packard Co. | 5,000 | | 175,800 |
| | 199,316 |
Computer Storage & Peripherals - 1.9% |
SanDisk Corp. (a) | 4,304 | | 183,049 |
Synaptics, Inc. (a) | 5,400 | | 132,678 |
Western Digital Corp. (a) | 1,030 | | 35,494 |
| | 351,221 |
TOTAL COMPUTERS & PERIPHERALS | | 550,537 |
ELECTRONIC EQUIPMENT & COMPONENTS - 4.0% |
Electronic Components - 0.5% |
Aeroflex Holding Corp. | 1,297 | | 18,547 |
Amphenol Corp. Class A | 120 | | 5,867 |
Corning, Inc. | 3,921 | | 62,383 |
| | 86,797 |
Electronic Manufacturing Services - 3.5% |
Benchmark Electronics, Inc. (a) | 3,721 | | 54,513 |
Fabrinet (a) | 788 | | 12,135 |
Flextronics International Ltd. (a) | 46,406 | | 299,319 |
Jabil Circuit, Inc. | 10,785 | | 197,473 |
SMART Modular Technologies (WWH), Inc. (a) | 2,311 | | 20,799 |
TE Connectivity Ltd. | 1,930 | | 66,450 |
Viasystems Group, Inc. (a) | 12 | | 269 |
| | 650,958 |
TOTAL ELECTRONIC EQUIPMENT & COMPONENTS | | 737,755 |
INTERNET SOFTWARE & SERVICES - 0.3% |
Internet Software & Services - 0.3% |
Google, Inc. Class A (a) | 90 | | 54,332 |
Support.com, Inc. (a) | 200 | | 644 |
| | 54,976 |
LIFE SCIENCES TOOLS & SERVICES - 0.0% |
Life Sciences Tools & Services - 0.0% |
Arrowhead Research Corp. warrants 5/21/17 (a) | 64,879 | | 1 |
SEMICONDUCTORS & SEMICONDUCTOR EQUIPMENT - 88.2% |
Semiconductor Equipment - 12.2% |
Advanced Energy Industries, Inc. (a) | 5 | | 53 |
Amkor Technology, Inc. (a)(d) | 58,542 | | 312,029 |
|
| Shares | | Value |
Applied Materials, Inc. | 34,414 | | $ 423,980 |
ASML Holding NV | 9,500 | | 338,675 |
Cabot Microelectronics Corp. (a) | 50 | | 1,935 |
Cymer, Inc. (a) | 7,092 | | 312,261 |
Entegris, Inc. (a) | 11,191 | | 95,907 |
KLA-Tencor Corp. | 2,230 | | 88,799 |
Lam Research Corp. (a) | 10,798 | | 441,422 |
MEMC Electronic Materials, Inc. (a) | 10,892 | | 80,819 |
Nanometrics, Inc. (a) | 370 | | 6,249 |
Nova Measuring Instruments Ltd. (a) | 250 | | 2,135 |
Novellus Systems, Inc. (a) | 660 | | 20,486 |
Teradyne, Inc. (a) | 1,190 | | 16,053 |
Tessera Technologies, Inc. (a) | 2,813 | | 44,192 |
Tokyo Electron Ltd. | 900 | | 48,645 |
Ultratech, Inc. (a) | 220 | | 5,797 |
| | 2,239,437 |
Semiconductors - 76.0% |
Advanced Micro Devices, Inc. (a)(d) | 122,243 | | 897,264 |
Alpha & Omega Semiconductor Ltd. (a) | 6,332 | | 71,172 |
Altera Corp. | 460 | | 18,805 |
ANADIGICS, Inc. (a) | 2,484 | | 7,800 |
Analog Devices, Inc. | 21,183 | | 728,695 |
Applied Micro Circuits Corp. (a) | 4,922 | | 31,058 |
AuthenTec, Inc. (a) | 4,896 | | 12,730 |
Avago Technologies Ltd. | 10,637 | | 357,722 |
BCD Semiconductor Manufacturing Ltd. ADR (d) | 12,718 | | 87,118 |
Broadcom Corp. Class A | 48,002 | | 1,779,434 |
Cree, Inc. (a)(d) | 2,700 | | 88,722 |
Cypress Semiconductor Corp. | 730 | | 15,023 |
Exar Corp. (a) | 200 | | 1,322 |
Fairchild Semiconductor International, Inc. (a) | 4,066 | | 61,031 |
First Solar, Inc. (a) | 88 | | 10,404 |
Freescale Semiconductor Holdings I Ltd. (d) | 35,302 | | 576,482 |
Himax Technologies, Inc. sponsored ADR | 20,738 | | 36,292 |
Ikanos Communications, Inc. (a) | 13,700 | | 17,262 |
Intel Corp. | 64,330 | | 1,436,489 |
International Rectifier Corp. (a) | 8,589 | | 220,651 |
Intersil Corp. Class A | 53,561 | | 645,410 |
JA Solar Holdings Co. Ltd. ADR (a) | 15,550 | | 74,640 |
Linear Technology Corp. | 15,130 | | 443,309 |
LSI Corp. (a) | 7,957 | | 58,564 |
Marvell Technology Group Ltd. (a) | 131,057 | | 1,942,266 |
Maxim Integrated Products, Inc. | 2,290 | | 52,578 |
Micron Technology, Inc. (a) | 115,622 | | 852,134 |
Motech Industries, Inc. | 1 | | 3 |
NVIDIA Corp. (a) | 31,948 | | 441,841 |
NXP Semiconductors NV | 31,162 | | 616,384 |
ON Semiconductor Corp. (a) | 72,380 | | 628,982 |
PMC-Sierra, Inc. (a) | 50,661 | | 354,120 |
RDA Microelectronics, Inc. sponsored ADR | 2,300 | | 20,861 |
Common Stocks - continued |
| Shares | | Value |
SEMICONDUCTORS & SEMICONDUCTOR EQUIPMENT - CONTINUED |
Semiconductors - continued |
Renesas Electronics Corp. (a)(d) | 6,500 | | $ 56,500 |
Semtech Corp. (a) | 1,146 | | 26,702 |
Skyworks Solutions, Inc. (a) | 9,502 | | 240,496 |
Spansion, Inc. Class A (a) | 4,891 | | 88,918 |
Standard Microsystems Corp. (a) | 4,504 | | 106,565 |
STATS ChipPAC Ltd. | 70,000 | | 36,623 |
STMicroelectronics NV (NY Shares) unit (a) | 6,400 | | 50,624 |
SunPower Corp. Class B (a) | 1,990 | | 30,168 |
Supertex, Inc. (a) | 3,327 | | 64,477 |
Taiwan Semiconductor Manufacturing Co. Ltd. sponsored ADR | 200 | | 2,472 |
Texas Instruments, Inc. (d) | 16,628 | | 494,683 |
Trident Microsystems, Inc. (a) | 35,119 | | 22,827 |
Trina Solar Ltd. (a) | 800 | | 14,328 |
TriQuint Semiconductor, Inc. (a) | 1,295 | | 9,738 |
Volterra Semiconductor Corp. (a) | 2,900 | | 74,733 |
Xilinx, Inc. | 80 | | 2,568 |
| | 13,908,990 |
TOTAL SEMICONDUCTORS & SEMICONDUCTOR EQUIPMENT | | 16,148,427 |
TOTAL COMMON STOCKS (Cost $21,710,283) | 18,105,666 |
Money Market Funds - 9.9% |
| Shares | | Value |
Fidelity Cash Central Fund, 0.14% (b) | 51,892 | | $ 51,892 |
Fidelity Securities Lending Cash Central Fund, 0.15% (b)(c) | 1,752,706 | | 1,752,706 |
TOTAL MONEY MARKET FUNDS (Cost $1,804,598) | 1,804,598 |
TOTAL INVESTMENT PORTFOLIO - 108.8% (Cost $23,514,881) | | 19,910,264 |
NET OTHER ASSETS (LIABILITIES) - (8.8)% | | (1,604,662) |
NET ASSETS - 100% | $ 18,305,602 |
Legend |
(a) Non-income producing |
(b) Affiliated fund that is available only to investment companies and other accounts managed by Fidelity Investments. The rate quoted is the annualized seven-day yield of the fund at period end. A complete unaudited listing of the fund's holdings as of its most recent quarter end is available upon request. In addition, each Fidelity Central Fund's financial statements, which are not covered by the Fund's Report of Independent Registered Public Accounting Firm, are available on the SEC's website or upon request. |
(c) Investment made with cash collateral received from securities on loan. |
(d) Security or a portion of the security is on loan at period end. |
Affiliated Central Funds |
Information regarding fiscal year to date income earned by the Fund from investments in Fidelity Central Funds is as follows: |
Fund | Income earned |
Fidelity Cash Central Fund | $ 744 |
Fidelity Securities Lending Cash Central Fund | 2,276 |
Total | $ 3,020 |
Other Information |
The following is a summary of the inputs used, as of July 31, 2011, involving the Fund's assets and liabilities carried at fair value. The inputs or methodology used for valuing securities may not be an indication of the risk associated with investing in those securities. For more information on valuation inputs, and their aggregation into the levels used in the tables below, please refer to the Security Valuation section in the accompanying Notes to Financial Statements. |
Valuation Inputs at Reporting Date: |
Description | Total | Level 1 | Level 2 | Level 3 |
Investments in Securities: | | | | |
Common Stocks | $ 18,105,666 | $ 18,105,665 | $ - | $ 1 |
Money Market Funds | 1,804,598 | 1,804,598 | - | - |
Total Investments in Securities: | $ 19,910,264 | $ 19,910,263 | $ - | $ 1 |
The following is a reconciliation of Investments in Securities for which Level 3 inputs were used in determining value: |
Investments in Securities: | |
Beginning Balance | $ 1 |
Total Realized Gain (Loss) | - |
Total Unrealized Gain (Loss) | - |
Cost of Purchases | - |
Proceeds of Sales | - |
Amortization/Accretion | - |
Transfers in to Level 3 | - |
Transfers out of Level 3 | - |
Ending Balance | $ 1 |
The change in unrealized gain (loss) for the period attributable to Level 3 securities held at July 31, 2011 | $ - |
The information used in the above reconciliation represents fiscal year to date activity for any Investments in Securities identified as using Level 3 inputs at either the beginning or the end of the current fiscal period. Transfers in or out of Level 3 represent the beginning value of any Security or Instrument where a change in the pricing level occurred from the beginning to the end of the period. The cost of purchases and the proceeds of sales may include securities received or delivered through corporate actions or exchanges. Realized and unrealized gains (losses) disclosed in the reconciliation are included in Net Gain (Loss) on the Fund's Statement of Operations. |
Distribution of investments by country of issue, as a percentage of total net assets, is as follows: (Unaudited) |
United States of America | 74.0% |
Bermuda | 14.1% |
Netherlands | 5.6% |
Singapore | 3.8% |
Cayman Islands | 1.5% |
Others (Individually Less Than 1%) | 1.0% |
| 100.0% |
Income Tax Information |
At July 31, 2011, the Fund had a capital loss carryforward of approximately $7,945,071 of which $2,152,369, $279,201, $310,663 and $5,202,838 will expire in fiscal 2012, 2013, 2016 and 2017, respectively. Capital loss carryforwards are only available to offset future capital gains of the Fund to the extent provided by regulations and may be limited. |
See accompanying notes which are an integral part of the financial statements.
Annual Report
Fidelity Advisor Electronics Fund
Statement of Assets and Liabilities
| July 31, 2011 |
| | |
Assets | | |
Investment in securities, at value (including securities loaned of $1,684,563) - See accompanying schedule: Unaffiliated issuers (cost $21,710,283) | $ 18,105,666 | |
Fidelity Central Funds (cost $1,804,598) | 1,804,598 | |
Total Investments (cost $23,514,881) | | $ 19,910,264 |
Receivable for investments sold | | 822,681 |
Receivable for fund shares sold | | 4,670 |
Dividends receivable | | 3,459 |
Distributions receivable from Fidelity Central Funds | | 287 |
Receivable from investment adviser for expense reductions | | 4,729 |
Other receivables | | 886 |
Total assets | | 20,746,976 |
| | |
Liabilities | | |
Payable to custodian bank | $ 10,088 | |
Payable for investments purchased | 564,062 | |
Payable for fund shares redeemed | 55,976 | |
Accrued management fee | 8,933 | |
Distribution and service plan fees payable | 7,644 | |
Other affiliated payables | 5,392 | |
Other payables and accrued expenses | 36,573 | |
Collateral on securities loaned, at value | 1,752,706 | |
Total liabilities | | 2,441,374 |
| | |
Net Assets | | $ 18,305,602 |
Net Assets consist of: | | |
Paid in capital | | $ 30,187,707 |
Accumulated undistributed net realized gain (loss) on investments and foreign currency transactions | | (8,277,484) |
Net unrealized appreciation (depreciation) on investments and assets and liabilities in foreign currencies | | (3,604,621) |
Net Assets | | $ 18,305,602 |
Statement of Assets and Liabilities - continued
| July 31, 2011 |
| | |
Calculation of Maximum Offering Price Class A:
Net Asset Value and redemption price per share ($7,536,866 ÷ 844,366 shares) | | $ 8.93 |
| | |
Maximum offering price per share (100/94.25 of $8.93) | | $ 9.47 |
Class T:
Net Asset Value and redemption price per share ($4,476,286 ÷ 512,809 shares) | | $ 8.73 |
| | |
Maximum offering price per share (100/96.50 of $8.73) | | $ 9.05 |
Class B:
Net Asset Value and offering price per share ($691,313 ÷ 83,345 shares)A | | $ 8.29 |
| | |
Class C:
Net Asset Value and offering price per share ($3,836,033 ÷ 462,969 shares)A | | $ 8.29 |
| | |
Institutional Class:
Net Asset Value, offering price and redemption price per share ($1,765,104 ÷ 192,137 shares) | | $ 9.19 |
A Redemption price per share is equal to net asset value less any applicable contingent deferred sales charge.
See accompanying notes which are an integral part of the financial statements.
Annual Report
Statement of Operations
| Year ended July 31, 2011 |
| | |
Investment Income | | |
Dividends | | $ 187,941 |
Interest | | 430 |
Income from Fidelity Central Funds | | 3,020 |
Total income | | 191,391 |
| | |
Expenses | | |
Management fee | $ 108,212 | |
Transfer agent fees | 60,274 | |
Distribution and service plan fees | 93,513 | |
Accounting and security lending fees | 7,732 | |
Custodian fees and expenses | 47,642 | |
Independent trustees' compensation | 101 | |
Registration fees | 54,582 | |
Audit | 43,946 | |
Legal | 140 | |
Miscellaneous | 167 | |
Total expenses before reductions | 416,309 | |
Expense reductions | (102,168) | 314,141 |
Net investment income (loss) | | (122,750) |
Realized and Unrealized Gain (Loss) Net realized gain (loss) on: | | |
Investment securities: | | |
Unaffiliated issuers | 4,302,638 | |
Foreign currency transactions | 983 | |
Total net realized gain (loss) | | 4,303,621 |
Change in net unrealized appreciation (depreciation) on: Investment securities | (1,162,020) | |
Assets and liabilities in foreign currencies | (27) | |
Total change in net unrealized appreciation (depreciation) | | (1,162,047) |
Net gain (loss) | | 3,141,574 |
Net increase (decrease) in net assets resulting from operations | | $ 3,018,824 |
Statement of Changes in Net Assets
| Year ended
July 31,
2011 | Year ended
July 31,
2010 |
Increase (Decrease) in Net Assets | | |
Operations | | |
Net investment income (loss) | $ (122,750) | $ (69,345) |
Net realized gain (loss) | 4,303,621 | 2,767,217 |
Change in net unrealized appreciation (depreciation) | (1,162,047) | (1,525,207) |
Net increase (decrease) in net assets resulting from operations | 3,018,824 | 1,172,665 |
Distributions to shareholders from net investment income | - | (30,683) |
Share transactions - net increase (decrease) | 1,054,457 | (1,121,329) |
Redemption fees | 1,863 | 1,611 |
Total increase (decrease) in net assets | 4,075,144 | 22,264 |
| | |
Net Assets | | |
Beginning of period | 14,230,458 | 14,208,194 |
End of period (including undistributed net investment income of $0 and accumulated net investment loss of $688, respectively) | $ 18,305,602 | $ 14,230,458 |
See accompanying notes which are an integral part of the financial statements.
Annual Report
Financial Highlights - Class A
Years ended July 31, | 2011 | 2010 | 2009 | 2008 | 2007 |
Selected Per-Share Data | | | | | |
Net asset value, beginning of period | $ 7.14 | $ 6.59 | $ 6.79 | $ 9.11 | $ 7.38 |
Income from Investment Operations | | | | | |
Net investment income (loss) C | (.04) | (.01) | .04 | - G | (.03) |
Net realized and unrealized gain (loss) | 1.83 | .59 | (.24) | (2.32) | 1.76 |
Total from investment operations | 1.79 | .58 | (.20) | (2.32) | 1.73 |
Distributions from net investment income | - | (.03) | - | - | - |
Redemption fees added to paid in capital C, G | - | - | - | - | - |
Net asset value, end of period | $ 8.93 | $ 7.14 | $ 6.59 | $ 6.79 | $ 9.11 |
Total Return A, B | 25.07% | 8.74% | (2.95)% | (25.47)% | 23.44% |
Ratios to Average Net Assets D, F | | | | | |
Expenses before reductions | 1.89% | 1.97% | 2.44% | 1.72% | 1.60% |
Expenses net of fee waivers, if any | 1.40% | 1.40% | 1.40% | 1.40% | 1.40% |
Expenses net of all reductions | 1.39% | 1.39% | 1.40% | 1.39% | 1.38% |
Net investment income (loss) | (.40)% | (.15)% | .69% | (.02)% | (.35)% |
Supplemental Data | | | | | |
Net assets, end of period (000 omitted) | $ 7,537 | $ 5,394 | $ 5,433 | $ 3,970 | $ 7,551 |
Portfolio turnover rate E | 166% | 87% | 92% | 93% | 97% |
A Total returns would have been lower if certain expenses had not been reduced during the applicable periods shown.
B Total returns do not include the effect of the sales charges.
C Calculated based on average shares outstanding during the period.
D Fees and expenses of any underlying Fidelity Central Funds are not included in the Fund's expense ratio. The Fund indirectly bears its proportionate share of the expenses of any underlying Fidelity Central Funds.
E Amount does not include the portfolio activity of any underlying Fidelity Central Funds.
F Expense ratios reflect operating expenses of the class. Expenses before reductions do not reflect amounts reimbursed by the investment adviser or reductions from brokerage service arrangements or reductions from other expense offset arrangements and do not represent the amount paid by the class during periods when reimbursements or reductions occur. Expenses net of fee waivers reflect expenses after reimbursement by the investment adviser but prior to reductions from brokerage service arrangements or other expense offset arrangements. Expenses net of all reductions represent the net expenses paid by the class.
G Amount represents less than $.01 per share.
Financial Highlights - Class T
Years ended July 31, | 2011 | 2010 | 2009 | 2008 | 2007 |
Selected Per-Share Data | | | | | |
Net asset value, beginning of period | $ 7.00 | $ 6.46 | $ 6.67 | $ 8.98 | $ 7.29 |
Income from Investment Operations | | | | | |
Net investment income (loss) C | (.06) | (.03) | .02 | (.02) | (.05) |
Net realized and unrealized gain (loss) | 1.79 | .58 | (.23) | (2.29) | 1.74 |
Total from investment operations | 1.73 | .55 | (.21) | (2.31) | 1.69 |
Distributions from net investment income | - | (.01) | - | - | - |
Redemption fees added to paid in capital C, G | - | - | - | - | - |
Net asset value, end of period | $ 8.73 | $ 7.00 | $ 6.46 | $ 6.67 | $ 8.98 |
Total Return A, B | 24.71% | 8.50% | (3.15)% | (25.72)% | 23.18% |
Ratios to Average Net Assets D, F | | | | | |
Expenses before reductions | 2.25% | 2.26% | 2.77% | 2.02% | 1.89% |
Expenses net of fee waivers, if any | 1.65% | 1.65% | 1.65% | 1.65% | 1.65% |
Expenses net of all reductions | 1.64% | 1.64% | 1.65% | 1.64% | 1.64% |
Net investment income (loss) | (.65)% | (.40)% | .44% | (.27)% | (.60)% |
Supplemental Data | | | | | |
Net assets, end of period (000 omitted) | $ 4,476 | $ 3,862 | $ 4,195 | $ 4,635 | $ 8,103 |
Portfolio turnover rate E | 166% | 87% | 92% | 93% | 97% |
A Total returns would have been lower if certain expenses had not been reduced during the applicable periods shown.
B Total returns do not include the effect of the sales charges.
C Calculated based on average shares outstanding during the period.
D Fees and expenses of any underlying Fidelity Central Funds are not included in the Fund's expense ratio. The Fund indirectly bears its proportionate share of the expenses of any underlying Fidelity Central Funds.
E Amount does not include the portfolio activity of any underlying Fidelity Central Funds.
F Expense ratios reflect operating expenses of the class. Expenses before reductions do not reflect amounts reimbursed by the investment adviser or reductions from brokerage service arrangements or reductions from other expense offset arrangements and do not represent the amount paid by the class during periods when reimbursements or reductions occur. Expenses net of fee waivers reflect expenses after reimbursement by the investment adviser but prior to reductions from brokerage service arrangements or other expense offset arrangements. Expenses net of all reductions represent the net expenses paid by the class.
G Amount represents less than $.01 per share.
See accompanying notes which are an integral part of the financial statements.
Annual Report
Financial Highlights - Class B
Years ended July 31, | 2011 | 2010 | 2009 | 2008 | 2007 |
Selected Per-Share Data | | | | | |
Net asset value, beginning of period | $ 6.69 | $ 6.19 | $ 6.43 | $ 8.70 | $ 7.10 |
Income from Investment Operations | | | | | |
Net investment income (loss) C | (.09) | (.06) | - G | (.06) | (.09) |
Net realized and unrealized gain (loss) | 1.69 | .56 | (.24) | (2.21) | 1.69 |
Total from investment operations | 1.60 | .50 | (.24) | (2.27) | 1.60 |
Redemption fees added to paid in capital C, G | - | - | - | - | - |
Net asset value, end of period | $ 8.29 | $ 6.69 | $ 6.19 | $ 6.43 | $ 8.70 |
Total Return A, B | 23.92% | 8.08% | (3.73)% | (26.09)% | 22.54% |
Ratios to Average Net Assets D, F | | | | | |
Expenses before reductions | 2.76% | 2.73% | 3.22% | 2.48% | 2.36% |
Expenses net of fee waivers, if any | 2.15% | 2.15% | 2.15% | 2.15% | 2.15% |
Expenses net of all reductions | 2.14% | 2.15% | 2.15% | 2.14% | 2.13% |
Net investment income (loss) | (1.15)% | (.90)% | (.06)% | (.77)% | (1.10)% |
Supplemental Data | | | | | |
Net assets, end of period (000 omitted) | $ 691 | $ 1,073 | $ 1,197 | $ 2,027 | $ 4,572 |
Portfolio turnover rate E | 166% | 87% | 92% | 93% | 97% |
A Total returns would have been lower if certain expenses had not been reduced during the applicable periods shown.
B Total returns do not include the effect of the contingent deferred sales charge.
C Calculated based on average shares outstanding during the period.
D Fees and expenses of any underlying Fidelity Central Funds are not included in the Fund's expense ratio. The Fund indirectly bears its proportionate share of the expenses of any underlying Fidelity Central Funds.
E Amount does not include the portfolio activity of any underlying Fidelity Central Funds.
F Expense ratios reflect operating expenses of the class. Expenses before reductions do not reflect amounts reimbursed by the investment adviser or reductions from brokerage service arrangements or reductions from other expense offset arrangements and do not represent the amount paid by the class during periods when reimbursements or reductions occur. Expenses net of fee waivers reflect expenses after reimbursement by the investment adviser but prior to reductions from brokerage service arrangements or other expense offset arrangements. Expenses net of all reductions represent the net expenses paid by the class.
G Amount represents less than $.01 per share.
Financial Highlights - Class C
Years ended July 31, | 2011 | 2010 | 2009 | 2008 | 2007 |
Selected Per-Share Data | | | | | |
Net asset value, beginning of period | $ 6.68 | $ 6.18 | $ 6.42 | $ 8.69 | $ 7.09 |
Income from Investment Operations | | | | | |
Net investment income (loss) C | (.09) | (.06) | - G | (.06) | (.09) |
Net realized and unrealized gain (loss) | 1.70 | .56 | (.24) | (2.21) | 1.69 |
Total from investment operations | 1.61 | .50 | (.24) | (2.27) | 1.60 |
Redemption fees added to paid in capital C, G | - | - | - | - | - |
Net asset value, end of period | $ 8.29 | $ 6.68 | $ 6.18 | $ 6.42 | $ 8.69 |
Total Return A, B | 24.10% | 8.09% | (3.74)% | (26.12)% | 22.57% |
Ratios to Average Net Assets D, F | | | | | |
Expenses before reductions | 2.70% | 2.72% | 3.21% | 2.47% | 2.34% |
Expenses net of fee waivers, if any | 2.15% | 2.15% | 2.15% | 2.15% | 2.15% |
Expenses net of all reductions | 2.14% | 2.14% | 2.15% | 2.14% | 2.13% |
Net investment income (loss) | (1.15)% | (.90)% | (.06)% | (.77)% | (1.10)% |
Supplemental Data | | | | | |
Net assets, end of period (000 omitted) | $ 3,836 | $ 3,256 | $ 3,016 | $ 3,325 | $ 8,389 |
Portfolio turnover rate E | 166% | 87% | 92% | 93% | 97% |
A Total returns would have been lower if certain expenses had not been reduced during the applicable periods shown.
B Total returns do not include the effect of the contingent deferred sales charge.
C Calculated based on average shares outstanding during the period.
D Fees and expenses of any underlying Fidelity Central Funds are not included in the Fund's expense ratio. The Fund indirectly bears its proportionate share of the expenses of any underlying Fidelity Central Funds.
E Amount does not include the portfolio activity of any underlying Fidelity Central Funds.
F Expense ratios reflect operating expenses of the class. Expenses before reductions do not reflect amounts reimbursed by the investment adviser or reductions from brokerage service arrangements or reductions from other expense offset arrangements and do not represent the amount paid by the class during periods when reimbursements or reductions occur. Expenses net of fee waivers reflect expenses after reimbursement by the investment adviser but prior to reductions from brokerage service arrangements or other expense offset arrangements. Expenses net of all reductions represent the net expenses paid by the class.
G Amount represents less than $.01 per share.
See accompanying notes which are an integral part of the financial statements.
Annual Report
Financial Highlights - Institutional Class
Years ended July 31, | 2011 | 2010 | 2009 | 2008 | 2007 |
Selected Per-Share Data | | | | | |
Net asset value, beginning of period | $ 7.33 | $ 6.75 | $ 6.94 | $ 9.30 | $ 7.51 |
Income from Investment Operations | | | | | |
Net investment income (loss) B | (.01) | .01 | .05 | .02 | (.01) |
Net realized and unrealized gain (loss) | 1.87 | .60 | (.24) | (2.38) | 1.80 |
Total from investment operations | 1.86 | .61 | (.19) | (2.36) | 1.79 |
Distributions from net investment income | - | (.03) | - | - | - |
Redemption fees added to paid in capital B, F | - | - | - | - | - |
Net asset value, end of period | $ 9.19 | $ 7.33 | $ 6.75 | $ 6.94 | $ 9.30 |
Total Return A | 25.38% | 9.10% | (2.74)% | (25.38)% | 23.83% |
Ratios to Average Net Assets C, E | | | | | |
Expenses before reductions | 1.42% | 1.64% | 2.16% | 1.47% | 1.26% |
Expenses net of fee waivers, if any | 1.15% | 1.15% | 1.15% | 1.15% | 1.15% |
Expenses net of all reductions | 1.14% | 1.14% | 1.15% | 1.14% | 1.13% |
Net investment income (loss) | (.15)% | .11% | .94% | .23% | (.10)% |
Supplemental Data | | | | | |
Net assets, end of period (000 omitted) | $ 1,765 | $ 645 | $ 367 | $ 353 | $ 730 |
Portfolio turnover rate D | 166% | 87% | 92% | 93% | 97% |
A Total returns would have been lower if certain expenses had not been reduced during the applicable periods shown.
B Calculated based on average shares outstanding during the period.
C Fees and expenses of any underlying Fidelity Central Funds are not included in the Fund's expense ratio. The Fund indirectly bears its proportionate share of the expenses of any underlying Fidelity Central Funds.
D Amount does not include the portfolio activity of any underlying Fidelity Central Funds.
E Expense ratios reflect operating expenses of the class. Expenses before reductions do not reflect amounts reimbursed by the investment adviser or reductions from brokerage service arrangements or reductions from other expense offset arrangements and do not represent the amount paid by the class during periods when reimbursements or reductions occur. Expenses net of fee waivers reflect expenses after reimbursement by the investment adviser but prior to reductions from brokerage service arrangements or other expense offset arrangements. Expenses net of all reductions represent the net expenses paid by the class.
F Amount represents less than $.01 per share.
See accompanying notes which are an integral part of the financial statements.
Annual Report
Notes to Financial Statements
For the period ended July 31, 2011
1. Organization.
Fidelity Advisor Electronics Fund (the Fund) is a non-diversified fund of Fidelity Advisor Series VII (the Trust) and is authorized to issue an unlimited number of shares. The Trust is registered under the Investment Company Act of 1940, as amended (the 1940 Act), as an open-end management investment company organized as a Massachusetts business trust. The Fund offers Class A, Class T, Class C and Institutional Class shares, each of which, along with Class B shares, has equal rights as to assets and voting privileges. Effective after the close of business on September 1, 2010, Class B shares were closed to new accounts and additional purchases, except for exchanges and reinvestments, by existing shareholders. Each class has exclusive voting rights with respect to matters that affect that class. Class B shares will automatically convert to Class A shares after a holding period of seven years from the initial date of purchase. Investment income, realized and unrealized capital gains and losses, the common expenses of the Fund, and certain fund-level expense reductions, if any, are allocated on a pro-rata basis to each class based on the relative net assets of each class to the total net assets of the Fund. Each class differs with respect to transfer agent and distribution and service plan fees incurred. Certain expense reductions may also differ by class. The Fund's investments in emerging markets can be subject to social, economic, regulatory, and political uncertainties and can be extremely volatile.
2. Investments in Fidelity Central Funds.
The Fund invests in Fidelity Central Funds, which are open-end investment companies available only to other investment companies and accounts managed by Fidelity Management & Research Company (FMR) and its affiliates. The Fund's Schedule of Investments lists each of the Fidelity Central Funds held as of period end, if any, as an investment of the Fund, but does not include the underlying holdings of each Fidelity Central Fund. As an Investing Fund, the Fund indirectly bears its proportionate share of the expenses of the underlying Fidelity Central Funds.
The Money Market Central Funds seek preservation of capital and current income and are managed by Fidelity Investments Money Management, Inc. (FIMM), an affiliate of FMR.
A complete unaudited list of holdings for each Fidelity Central Fund is available upon request or at the Securities and Exchange Commission (the SEC) web site at www.sec.gov. In addition, the financial statements of the Fidelity Central Funds, which are not covered by the Fund's Report of Independent Registered Public Accounting Firm, are available on the SEC web site or upon request.
3. Significant Accounting Policies.
The financial statements have been prepared in conformity with accounting principles generally accepted in the United States of America (GAAP), which require management to make certain estimates and assumptions at the date of the financial statements. Actual results could differ from those estimates. Subsequent events, if any, through the date that the financial statements were issued have been evaluated in the preparation of the financial statements. The following summarizes the significant accounting policies of the Fund:
Security Valuation. Investments are valued as of 4:00 p.m. Eastern time on the last calendar day of the period. The Fund uses independent pricing services approved by the Board of Trustees to value its investments. When current market prices or quotations are not readily available or reliable, valuations may be determined in good faith in accordance with procedures adopted by the Board of Trustees. Factors used in determining value may include market or security specific events. The frequency with which these procedures are used cannot be predicted and they may be utilized to a significant extent. The value used for net asset value (NAV) calculation under these procedures may differ from published prices for the same securities.
The Fund categorizes the inputs to valuation techniques used to value its investments into a disclosure hierarchy consisting of three levels as shown below:
Level 1 - quoted prices in active markets for identical investments
Level 2 - other significant observable inputs (including quoted prices for similar investments, interest rates, prepayment speeds, etc.)
Level 3 - unobservable inputs (including the Fund's own assumptions based on the best information available)
Changes in valuation techniques may result in transfers in or out of an assigned level within the disclosure hierarchy. The aggregate value of investments by input level, as of July 31, 2011, as well as a roll forward of Level 3 securities, is included at the end of the Fund's Schedule of Investments. Valuation techniques used to value the Fund's investments by major category are as follows:
Equity securities, including restricted securities, for which market quotations are readily available, are valued at the last reported sale price or official closing price as reported by an independent pricing service on the primary market or exchange on which they are traded and are categorized as Level 1 in the hierarchy. In the event there were no sales during the day or closing prices are not available, securities are valued at the last quoted bid price or may be valued using the last available price and are generally categorized as Level 2 in the hierarchy. For foreign equity securities, when significant market or security specific events arise, comparisons to the valuation of American Depositary Receipts (ADRs), futures contracts, Exchange-traded
Annual Report
Notes to Financial Statements - continued
3. Significant Accounting Policies - continued
Security Valuation - continued
funds (ETFs) and certain indexes as well as quoted prices for similar securities are used and are categorized as Level 2 in the hierarchy in these circumstances. Utilizing these techniques may result in transfers between Level 1 and Level 2. For restricted equity securities and private placements where observable inputs are limited, assumptions about market activity and risk are used and are categorized as Level 3 in the hierarchy.
Investments in open-end mutual funds, including the Fidelity Central Funds, are valued at their closing net asset value each business day and are categorized as Level 1 in the hierarchy.
Foreign Currency. The Fund may use foreign currency contracts to facilitate transactions in foreign-denominated securities. Gains and losses from these transactions may arise from changes in the value of the foreign currency or if the counterparties do not perform under the contracts' terms.
Foreign-denominated assets, including investment securities, and liabilities are translated into U.S. dollars at the exchange rate at period end. Purchases and sales of investment securities, income and dividends received and expenses denominated in foreign currencies are translated into U.S. dollars at the exchange rate in effect on the transaction date.
The effects of exchange rate fluctuations on investments are included with the net realized and unrealized gain (loss) on investment securities. Other foreign currency transactions resulting in realized and unrealized gain (loss) are disclosed separately.
Investment Transactions and Income. For financial reporting purposes, the Fund's investment holdings and NAV include trades executed through the end of the last business day of the period. The NAV per share for processing shareholder transactions is calculated as of the close of business of the New York Stock Exchange (NYSE), normally 4:00 p.m. Eastern time and includes trades executed through the end of the prior business day. Gains and losses on securities sold are determined on the basis of identified cost and may include proceeds received from litigation. Dividend income is recorded on the ex-dividend date, except for certain dividends from foreign securities where the ex-dividend date may have passed, which are recorded as soon as the Fund is informed of the ex-dividend date. Non-cash dividends included in dividend income, if any, are recorded at the fair market value of the securities received. Distributions received on securities that represent a return of capital or capital gain are recorded as a reduction of cost of investments and/or as a realized gain. The Fund estimates the components of distributions received that may be considered return of capital distributions or capital gain distributions. Interest income and distributions from the Fidelity Central Funds are accrued as earned. Interest income includes coupon interest and amortization of premium and accretion of discount on debt securities. Investment income is recorded net of foreign taxes withheld where recovery of such taxes is uncertain.
Expenses. Expenses directly attributable to a fund are charged to that fund. Expenses attributable to more than one fund are allocated among the respective funds on the basis of relative net assets or other appropriate methods. Expense estimates are accrued in the period to which they relate and adjustments are made when actual amounts are known.
Income Tax Information and Distributions to Shareholders. Each year, the Fund intends to qualify as a regulated investment company, including distributing substantially all of its taxable income and realized gains under Subchapter M of the Internal Revenue Code and filing its U.S. federal tax return. As a result, no provision for income taxes is required. As of July 31, 2011, the Fund did not have any unrecognized tax benefits in the financial statements. A fund's federal tax return is subject to examination by the Internal Revenue Service (IRS) for a period of three years. Foreign taxes are provided for based on the Fund's understanding of the tax rules and rates that exist in the foreign markets in which it invests.
Distributions are declared and recorded on the ex-dividend date. Income dividends and capital gain distributions are declared separately for each class. Income and capital gain distributions are determined in accordance with income tax regulations, which may differ from GAAP.
Capital accounts within the financial statements are adjusted for permanent book-tax differences. These adjustments have no impact on net assets or the results of operations. Temporary book-tax differences will reverse in a subsequent period.
Book-tax differences are primarily due to foreign currency transactions, net operating losses, capital loss carryforwards, and losses deferred due to wash sales and excise tax regulations.
The federal tax cost of investment securities and unrealized appreciation (depreciation) as of period end were as follows:
Gross unrealized appreciation | $ 164,236 |
Gross unrealized depreciation | (4,101,266) |
Net unrealized appreciation (depreciation) on securities and other investments | $ (3,937,030) |
| |
Tax Cost | $ 23,847,294 |
Annual Report
3. Significant Accounting Policies - continued
Income Tax Information and Distributions to Shareholders - continued
The tax-based components of distributable earnings as of period end were as follows:
Capital loss carryforward | $ (7,945,071) |
Net unrealized appreciation (depreciation) | $ (3,937,034) |
Under the recently enacted Regulated Investment Company Modernization Act of 2010 (the Act), the Fund will be permitted to carry forward capital losses incurred in taxable years beginning after December 22, 2010 for an unlimited period. However, any losses incurred during those future taxable years will be required to be utilized prior to any losses incurred in pre-enactment taxable years, which generally expire after eight years from when they are incurred. Additionally, post-enactment capital losses that are carried forward will retain their character as either short-term or long-term capital losses rather than being considered all short-term as under previous law. The Fund's first fiscal year end subject to the Act will be July 31, 2012.
The tax character of distributions paid was as follows:
| July 31, 2011 | July 31, 2010 |
Ordinary Income | $ - | $ 30,683 |
Short-Term Trading (Redemption) Fees. Shares held by investors in the Fund less than 30 days are subject to a redemption fee equal to .75% of the net asset value of shares redeemed. All redemption fees, which reduce the proceeds of the shareholder redemption, are retained by the Fund and accounted for as an addition to paid in capital.
New Accounting Pronouncement. In May 2011, the Financial Accounting Standards Board issued Accounting Standard Update No. 2011-04, Fair Value Measurement (Topic 820) - Amendments to Achieve Common Fair Value Measurement and Disclosure Requirements in U.S. GAAP and IFRSs. The update changes the wording used to describe the requirements in GAAP for measuring fair value and for disclosing information about fair value measurements. The update is effective during interim and annual periods beginning after December 15, 2011. Management is currently evaluating the impact of the update's adoption on the Fund's financial statement disclosures.
4. Purchases and Sales of Investments.
Purchases and sales of securities, other than short-term securities, aggregated $32,264,036 and $31,430,706, respectively.
5. Fees and Other Transactions with Affiliates.
Management Fee. FMR and its affiliates provide the Fund with investment management related services for which the Fund pays a monthly management fee. The management fee is the sum of an individual fund fee rate that is based on an annual rate of .30% of the Fund's average net assets and a group fee rate that averaged .26% during the period. The group fee rate is based upon the average net assets of all the mutual funds advised by FMR. The group fee rate decreases as assets under management increase and increases as assets under management decrease. For the period, the total annual management fee rate was .56% of the Fund's average net assets.
Distribution and Service Plan Fees. In accordance with Rule 12b-1 of the 1940 Act, the Fund has adopted separate Distribution and Service Plans for each class of shares. Certain classes pay Fidelity Distributors Corporation (FDC), an affiliate of FMR, separate Distribution and Service Fees, each of which is based on an annual percentage of each class' average net assets. In addition, FDC may pay financial intermediaries for selling shares of the Fund and providing shareholder support services. For the period, the Distribution and Service Fee rates, total fees and amounts retained by FDC were as follows:
| Distribution
Fee | Service
Fee | Total Fees | Retained
by FDC |
Class A | -% | .25% | $ 20,705 | $ 979 |
Class T | .25% | .25% | 23,040 | 88 |
Class B | .75% | .25% | 9,660 | 7,257 |
Class C | .75% | .25% | 40,108 | 6,336 |
| | | $ 93,513 | $ 14,660 |
Annual Report
Notes to Financial Statements - continued
5. Fees and Other Transactions with Affiliates - continued
Sales Load. FDC may receive a front-end sales charge of up to 5.75% for selling Class A shares, and 3.50% for selling Class T shares, some of which is paid to financial intermediaries for selling shares of the Fund. Depending on the holding period, FDC may receive contingent deferred sales charges levied on Class A, Class T, Class B, and Class C redemptions. The deferred sales charges range from 5% to 1% for Class B, 1% for Class C, 1.00% for certain purchases of Class A shares and .25% for certain purchases of Class T shares.
For the period, sales charge amounts retained by FDC were as follows:
| Retained
by FDC |
Class A | $ 6,669 |
Class T | 3,453 |
Class B* | 2,680 |
Class C* | 867 |
| $ 13,669 |
* When Class B and Class C shares are initially sold, FDC pays commissions from its own resources to financial intermediaries through which the sales are made.
Transfer Agent Fees. Fidelity Investments Institutional Operations Company, Inc. (FIIOC), an affiliate of FMR, is the transfer, dividend disbursing and shareholder servicing agent for each class of the Fund. FIIOC receives account fees and asset-based fees that vary according to the account size and type of account of the shareholders of the respective classes of the Fund. FIIOC pays for typesetting, printing and mailing of shareholder reports, except proxy statements. For the period, transfer agent fees for each class were as follows:
| Amount | % of
Average
Net Assets |
Class A | $ 25,542 | .31 |
Class T | 16,115 | .35 |
Class B | 2,975 | .31 |
Class C | 12,327 | .31 |
Institutional Class | 3,315 | .21 |
| $ 60,274 | |
Accounting and Security Lending Fees. Fidelity Service Company, Inc. (FSC), an affiliate of FMR, maintains the Fund's accounting records. The accounting fee is based on the level of average net assets for the month. Under a separate contract, FSC administers the security lending program. The security lending fee is based on the number and duration of lending transactions.
Brokerage Commissions. The Fund placed a portion of its portfolio transactions with brokerage firms which are affiliates of the investment adviser. The commissions paid to these affiliated firms were $4,616 for the period.
6. Committed Line of Credit.
The Fund participates with other funds managed by FMR or an affiliate in a $4.0 billion credit facility (the "line of credit") to be utilized for temporary or emergency purposes to fund shareholder redemptions or for other short-term liquidity purposes. The Fund has agreed to pay commitment fees on its pro-rata portion of the line of credit, which amounted to $63 and is reflected in Miscellaneous expenses on the Statement of Operations. During the period, there were no borrowings on this line of credit.
7. Security Lending.
The Fund lends portfolio securities through a lending agent from time to time in order to earn additional income. The lending agent may loan securities to certain qualified borrowers, including Fidelity Capital Markets (FCM), a broker-dealer affiliated with the Fund. On the settlement date of the loan, the Fund receives collateral (in the form of U.S. Treasury obligations, letters of credit and/or cash) against the loaned securities and maintains collateral in an amount not less than 100% of the market value of the loaned securities during the period of the loan. The market value of the loaned securities is determined at the close of business of the Fund and any additional required collateral is delivered to the Fund on the next business day. If the borrower defaults on its obligation to return the securities loaned because of insolvency or other reasons, a fund could experience delays and costs in recovering the securities loaned or in gaining access to the collateral. Any cash collateral received is invested in the Fidelity Securities Lending Cash Central Fund. The value of loaned securities and cash collateral at period end are disclosed on the Fund's Statement of Assets and Liabilities. Security lending income represents the income earned on investing cash collateral, less rebates paid to borrowers and lending agent fees associated with the
Annual Report
7. Security Lending - continued
loan, plus any premium payments received for lending certain types of securities. Security lending income is presented in the Statement of Operations as a component of income from Fidelity Central Funds. Total security lending income during the period amounted to $2,276. During the period, there were no securities loaned to FCM.
8. Expense Reductions.
FMR voluntarily agreed to reimburse each class to the extent annual operating expenses exceeded certain levels of average net assets as noted in the table below. Some expenses, for example interest expense, including commitment fees, are excluded from this reimbursement.
The following classes were in reimbursement during the period:
| Expense
Limitations | Reimbursement
from adviser |
Class A | 1.40% | $ 40,772 |
Class T | 1.65% | 27,405 |
Class B | 2.15% | 5,854 |
Class C | 2.15% | 21,804 |
Institutional Class | 1.15% | 4,262 |
| | $ 100,097 |
Many of the brokers with whom FMR places trades on behalf of the Fund provided services to the Fund in addition to trade execution. These services included payments of certain expenses on behalf of the Fund totaling $2,071 for the period.
9. Distributions to Shareholders.
Distributions to shareholders of each class were as follows:
Years ended July 31, | 2011 | 2010 |
From net investment income | | |
Class A | $ - | $ 22,913 |
Class T | - | 5,704 |
Institutional Class | - | 2,066 |
Total | $ - | $ 30,683 |
10. Share Transactions.
Transactions for each class of shares were as follows:
| Shares | Dollars |
Years ended July 31, | 2011 | 2010 | 2011 | 2010 |
Class A | | | | |
Shares sold | 823,348 | 463,925 | $ 7,674,866 | $ 3,450,517 |
Reinvestment of distributions | - | 3,053 | - | 21,642 |
Shares redeemed | (734,519) | (536,272) | (6,789,005) | (3,911,247) |
Net increase (decrease) | 88,829 | (69,294) | $ 885,861 | $ (439,088) |
Class T | | | | |
Shares sold | 227,766 | 149,748 | $ 2,032,968 | $ 1,082,460 |
Reinvestment of distributions | - | 793 | - | 5,519 |
Shares redeemed | (266,704) | (248,392) | (2,292,080) | (1,826,132) |
Net increase (decrease) | (38,938) | (97,851) | $ (259,112) | $ (738,153) |
Class B | | | | |
Shares sold | 17,689 | 71,160 | $ 152,131 | $ 500,056 |
Reinvestment of distributions | - | - | - | - |
Shares redeemed | (94,901) | (103,890) | (767,577) | (717,856) |
Net increase (decrease) | (77,212) | (32,730) | $ (615,446) | $ (217,800) |
Annual Report
Notes to Financial Statements - continued
10. Share Transactions - continued
| Shares | Dollars |
Years ended July 31, | 2011 | 2010 | 2011 | 2010 |
Class C | | | | |
Shares sold | 179,286 | 184,365 | $ 1,565,088 | $ 1,261,735 |
Reinvestment of distributions | - | - | - | - |
Shares redeemed | (203,889) | (184,552) | (1,673,259) | (1,259,598) |
Net increase (decrease) | (24,603) | (187) | $ (108,171) | $ 2,137 |
Institutional Class | | | | |
Shares sold | 302,052 | 94,039 | $ 3,051,352 | $ 728,440 |
Reinvestment of distributions | - | 194 | - | 1,410 |
Shares redeemed | (197,907) | (60,662) | (1,900,027) | (458,275) |
Net increase (decrease) | 104,145 | 33,571 | $ 1,151,325 | $ 271,575 |
11. Other.
The Fund's organizational documents provide former and current trustees and officers with a limited indemnification against liabilities arising in connection with the performance of their duties to the Fund. In the normal course of business, the Fund may also enter into contracts that provide general indemnifications. The Fund's maximum exposure under these arrangements is unknown as this would be dependent on future claims that may be made against the Fund. The risk of material loss from such claims is considered remote.
Annual Report
Fidelity Advisor Energy Fund - Institutional Class
Performance: The Bottom Line
Average annual total return reflects the change in the value of an investment, assuming reinvestment of the class' distributions from dividend income and capital gains (the profits earned upon the sale of securities that have grown in value, if any) and assuming a constant rate of performance each year. The $10,000 table and the fund's returns do not reflect the deduction of taxes that a shareholder would pay on fund distributions or the redemption of fund shares. During periods of reimbursement by Fidelity, a fund's total return will be greater than it would be had the reimbursement not occurred. How a fund did yesterday is no guarantee of how it will do tomorrow.
Average Annual Total Returns
Periods ended July 31, 2011 | | Past 1
year | Past 5
years | Past 10
years |
Institutional Class A | | 45.87% | 5.68% | 11.83% |
A Prior to October 1, 2006, Fidelity Advisor Energy Fund operated under certain different investment policies. The historical performance for the fund may not represent its current investment policies.
$10,000 Over 10 Years
Let's say hypothetically that $10,000 was invested in Fidelity Advisor Energy Fund - Institutional Class on July 31, 2001. The chart shows how the value of your investment would have changed, and also shows how the S&P 500 Index performed over the same period.
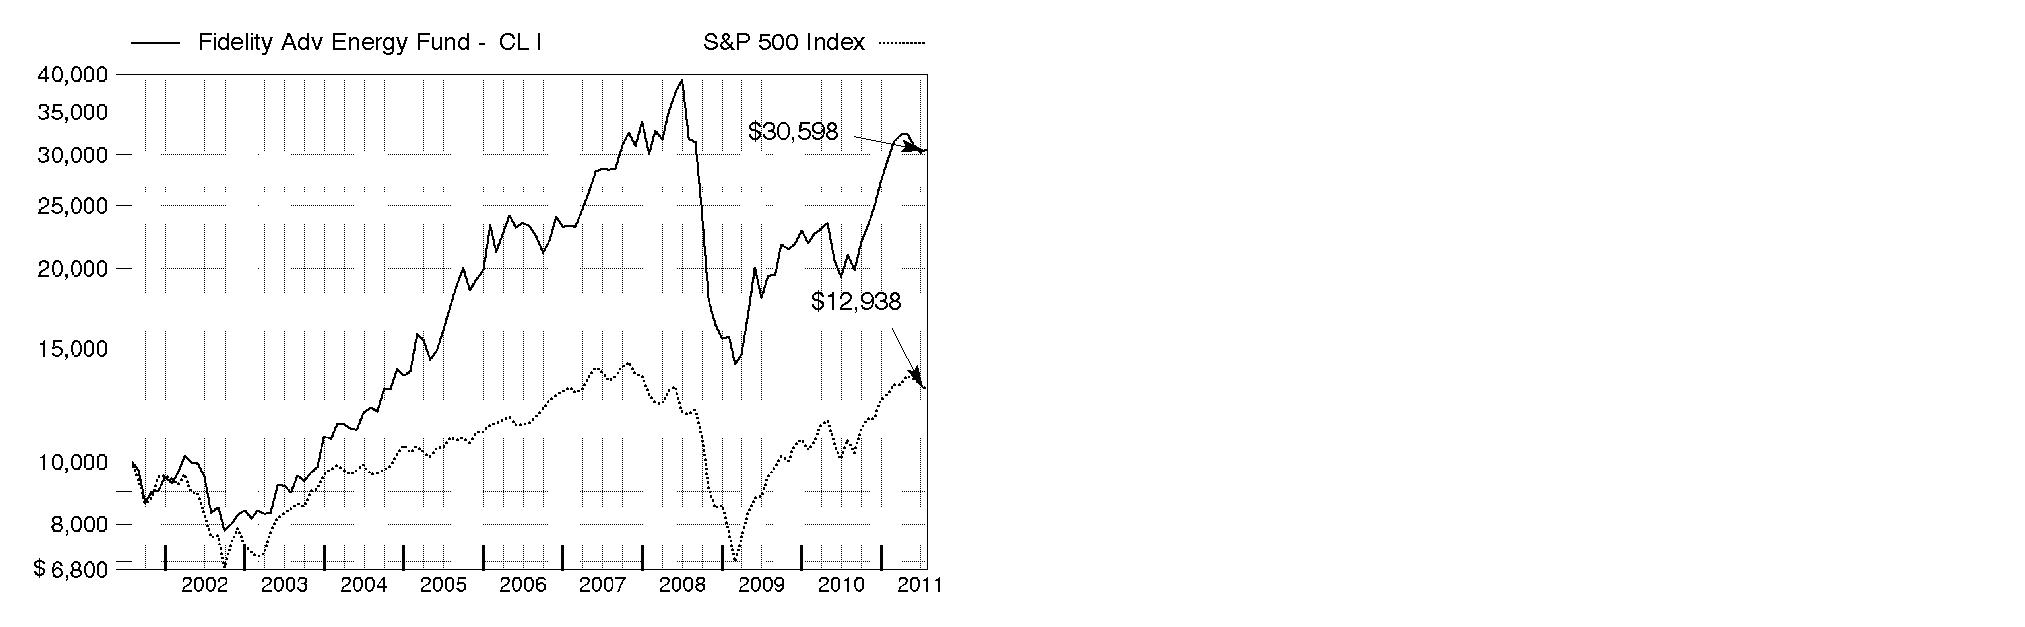
Energy
Fidelity Advisor Energy Fund
Market Recap: U.S. stocks registered solid double-digit gains for the 12 months ending July 31, 2011, extending a rally that began more than two years earlier. Despite a rough start in August 2010, markets turned positive in September, as increased demand for capital goods and other upbeat indicators trumped investor worry about a U.S. recessionary relapse. The broad market, as measured by the S&P 500® Index, rose 9% that month, its biggest September gain in 71 years. Seven more monthly advances followed, fueled by encouraging corporate earnings and economic activity. However, volatility picked up in the period's latter months, as markets reacted to continued high U.S. unemployment, nagging debt troubles in Europe and looming legislative battles over the federal debt ceiling. May unemployment rose above 9% for the first time in 2011, contributing to a traditional "June swoon" for stocks. Market uncertainty lingered in July, when the S&P 500® posted its second-biggest monthly loss of the period. For the full year, the S&P 500® climbed 19.65%, while the blue-chip-laden Dow Jones Industrial AverageSM rose a comparable 19.09% and the technology-heavy Nasdaq Composite® Index gained 23.40%. On the capitalization spectrum, stocks of mid-cap companies fared best, with the Russell Midcap® Index rising 24.51% and the small-cap Russell 2000® Index adding 23.92%.
Comments from John Dowd, Portfolio Manager of Fidelity Advisor® Energy Fund: For the year, the fund's Class A, Class T, Class B and Class C shares returned 45.46%, 45.16%, 44.38% and 44.38%, respectively (excluding sales charges), about in line with the 44.78% advance of the MSCI® U.S. IM Energy 25/50 Index and significantly outpacing the broadly based S&P 500. Versus the sector benchmark, performance was bolstered by stock selection and a sizable overweighting in oil/gas refining and marketing, including independent refiner Holly and competitor Frontier Oil, which merged during the period. The new company, HollyFrontier, also contributed. Positioning in oil/gas equipment and services helped, including an overweighting in drill rig equipment provider National Oilwell Varco. Good stock picks in the coal/consumable fuels segment were rewarding, particularly Massey Energy, which was acquired in June by Alpha Natural Resources. Conversely, stock picking in oil/gas drilling and oil/gas exploration and production (E&P) detracted from relative performance. Specifically, an overweighted stake in Transocean hurt, as the company revised earnings downward during the period and was still dealing with costs of its April 2010 Deepwater Horizon oil rig disaster, causing its stock to fall. Untimely ownership of integrated oil/gas provider Hess hurt, as did overweighting underperformer Southwestern Energy, which I sold before period end. I missed out by selling natural gas E&P firm Petrohawk Energy well before its stock jumped in July on a proposed acquisition by Australian firm BHP Billiton. The fund's foreign holdings detracted overall, despite a tail wind from a weaker U.S. dollar.
Comments from John Dowd, Portfolio Manager of Fidelity Advisor® Energy Fund: For the year, the fund's Institutional Class shares returned 45.87%, slightly ahead of the 44.78% advance of the MSCI® U.S. IM Energy 25/50 Index and significantly outpacing the broadly based S&P 500. Versus the sector benchmark, performance was bolstered by stock selection and a sizable overweighting in oil/gas refining and marketing, including independent refiner Holly and competitor Frontier Oil, which merged during the period. The new company, HollyFrontier, also contributed. Positioning in oil/gas equipment and services helped, including an overweighting in drill rig equipment provider National Oilwell Varco. Good stock picks in the coal/consumable fuels segment were rewarding, particularly Massey Energy, which was acquired in June by Alpha Natural Resources. Conversely, stock picking in oil/gas drilling and oil/gas exploration and production (E&P) detracted from relative performance. Specifically, an overweighted stake in Transocean hurt, as the company revised earnings downward during the period and was still dealing with costs of its April 2010 Deepwater Horizon oil rig disaster, causing its stock to fall. Untimely ownership of integrated oil/gas provider Hess hurt, as did overweighting underperformer Southwestern Energy, which I sold before period end. I missed out by selling natural gas E&P firm Petrohawk Energy well before its stock jumped in July on a proposed acquisition by Australian firm BHP Billiton. The fund's foreign holdings detracted overall, despite a tail wind from a weaker U.S. dollar.
The views expressed above reflect those of the portfolio manager(s) only through the end of the period as stated on the cover of this report and do not necessarily represent the views of Fidelity or any other person in the Fidelity organization. Any such views are subject to change at any time based upon market or other conditions and Fidelity disclaims any responsibility to update such views. These views may not be relied on as investment advice and, because investment decisions for a Fidelity fund are based on numerous factors, may not be relied on as an indication of trading intent on behalf of any Fidelity fund.
Annual Report
Fidelity Advisor Energy Fund
As a shareholder of the Fund, you incur two types of costs: (1) transaction costs, including sales charges (loads) on purchase payments or redemption proceeds, redemption fees, and (2) ongoing costs, including management fees, distribution and/or service (12b-1) fees and other Fund expenses. This Example is intended to help you understand your ongoing costs (in dollars) of investing in the Fund and to compare these costs with the ongoing costs of investing in other mutual funds.
The Example is based on an investment of $1,000 invested at the beginning of the period and held for the entire period (February 1, 2011 to July 31, 2011).
Actual Expenses
The first line of the accompanying table for each class of the Fund provides information about actual account values and actual expenses. You may use the information in this line, together with the amount you invested, to estimate the expenses that you paid over the period. Simply divide your account value by $1,000.00 (for example, an $8,600 account value divided by $1,000.00 = 8.6), then multiply the result by the number in the first line for a class of the Fund under the heading entitled "Expenses Paid During Period" to estimate the expenses you paid on your account during this period. In addition, the Fund, as a shareholder in the underlying Fidelity Central Funds, will indirectly bear its pro-rata share of the fees and expenses incurred by the underlying Fidelity Central Funds. These fees and expenses are not included in the Fund's annualized expense ratio used to calculate the expense estimate in the table below.
Hypothetical Example for Comparison Purposes
The second line of the accompanying table for each class of the Fund provides information about hypothetical account values and hypothetical expenses based on a Class' actual expense ratio and an assumed rate of return of 5% per year before expenses, which is not the Class' actual return. The hypothetical account values and expenses may not be used to estimate the actual ending account balance or expenses you paid for the period. You may use this information to compare the ongoing costs of investing in the Fund and other funds. To do so, compare this 5% hypothetical example with the 5% hypothetical examples that appear in the shareholder reports of the other funds. In addition, the Fund, as a shareholder in the underlying Fidelity Central Funds, will indirectly bear its pro-rata share of the fees and expenses incurred by the underlying Fidelity Central Funds. These fees and expenses are not included in the Fund's annualized expense ratio used to calculate the expense estimate in the table below.
Please note that the expenses shown in the table are meant to highlight your ongoing costs only and do not reflect any transaction costs. Therefore, the second line of the table is useful in comparing ongoing costs only, and will not help you determine the relative total costs of owning different funds. In addition, if these transactional costs were included, your costs would have been higher.
| Annualized
Expense Ratio | Beginning
Account Value
February 1, 2011 | Ending
Account Value
July 31, 2011 | Expenses Paid
During Period*
February 1, 2011 to
July 31, 2011 |
Class A | 1.15% | | | |
Actual | | $ 1,000.00 | $ 1,038.80 | $ 5.81 |
HypotheticalA | | $ 1,000.00 | $ 1,019.09 | $ 5.76 |
Class T | 1.35% | | | |
Actual | | $ 1,000.00 | $ 1,037.70 | $ 6.82 |
HypotheticalA | | $ 1,000.00 | $ 1,018.10 | $ 6.76 |
Class B | 1.92% | | | |
Actual | | $ 1,000.00 | $ 1,034.90 | $ 9.69 |
HypotheticalA | | $ 1,000.00 | $ 1,015.27 | $ 9.59 |
Class C | 1.88% | | | |
Actual | | $ 1,000.00 | $ 1,035.00 | $ 9.49 |
HypotheticalA | | $ 1,000.00 | $ 1,015.47 | $ 9.39 |
Institutional Class | .84% | | | |
Actual | | $ 1,000.00 | $ 1,040.40 | $ 4.25 |
HypotheticalA | | $ 1,000.00 | $ 1,020.63 | $ 4.21 |
A 5% return per year before expenses
* Expenses are equal to each Class' annualized expense ratio, multiplied by the average account value over the period, multiplied by 181/365 (to reflect the one-half year period).
Annual Report
Fidelity Advisor Energy Fund
Investment Changes (Unaudited)
Top Ten Stocks as of July 31, 2011 |
| % of fund's
net assets | % of fund's net assets
6 months ago |
Chevron Corp. | 11.1 | 4.4 |
Exxon Mobil Corp. | 10.4 | 17.0 |
Schlumberger Ltd. | 7.1 | 6.3 |
Occidental Petroleum Corp. | 5.3 | 6.2 |
Baker Hughes, Inc. | 5.3 | 4.3 |
HollyFrontier Corp. | 4.9 | 3.6 |
Halliburton Co. | 4.4 | 3.6 |
Ensco International Ltd. ADR | 3.6 | 1.8 |
Hess Corp. | 3.6 | 1.2 |
Marathon Oil Corp. | 3.3 | 4.5 |
| 59.0 | |
Top Industries (% of fund's net assets) |
As of July 31, 2011 |
| Oil, Gas & Consumable Fuels | 62.2% | |
| Energy Equipment & Services | 35.4% | |
| Chemicals | 1.2% | |
| Construction & Engineering | 0.6% | |
| Metals & Mining | 0.6% | |
 | All Others* | 0.0% | |

As of January 31, 2011 |
| Oil, Gas & Consumable Fuels | 68.1% | |
| Energy Equipment & Services | 27.9% | |
| Chemicals | 1.4% | |
| Construction & Engineering | 1.3% | |
| Metals & Mining | 0.9% | |
| All Others* | 0.4% | |

* Includes short-term investments and net other assets. |
Annual Report
Fidelity Advisor Energy Fund
Investments July 31, 2011
Showing Percentage of Net Assets
Common Stocks - 100.0% |
| Shares | | Value |
CHEMICALS - 1.2% |
Specialty Chemicals - 1.2% |
LyondellBasell Industries NV Class A | 259,310 | | $ 10,232,373 |
CONSTRUCTION & ENGINEERING - 0.6% |
Construction & Engineering - 0.6% |
Jacobs Engineering Group, Inc. (a) | 121,124 | | 4,740,793 |
ENERGY EQUIPMENT & SERVICES - 35.4% |
Oil & Gas Drilling - 10.5% |
Discovery Offshore S.A. (a)(e) | 341,100 | | 633,497 |
Ensco International Ltd. ADR | 573,740 | | 30,551,655 |
Nabors Industries Ltd. (a) | 430,000 | | 11,356,300 |
Noble Corp. | 309,264 | | 11,402,564 |
Northern Offshore Ltd. | 405,087 | | 801,236 |
Ocean Rig UDW, Inc. (a) | 206,500 | | 3,489,990 |
Parker Drilling Co. (a) | 475,740 | | 3,016,192 |
Patterson-UTI Energy, Inc. | 358,000 | | 11,645,740 |
Rowan Companies, Inc. (a) | 284,000 | | 11,124,280 |
Transocean Ltd. (United States) | 101,854 | | 6,270,132 |
| | 90,291,586 |
Oil & Gas Equipment & Services - 24.9% |
Aker Drilling ASA (a) | 106,000 | | 322,859 |
Baker Hughes, Inc. | 589,007 | | 45,577,362 |
Basic Energy Services, Inc. (a) | 65,690 | | 2,127,699 |
Cal Dive International, Inc. (a) | 191,730 | | 1,069,853 |
Cameron International Corp. (a) | 69,144 | | 3,867,915 |
Compagnie Generale de Geophysique SA (a) | 129,978 | | 4,364,768 |
Dresser-Rand Group, Inc. (a) | 63,300 | | 3,381,486 |
Halliburton Co. | 685,931 | | 37,541,004 |
ION Geophysical Corp. (a) | 90,100 | | 913,614 |
Key Energy Services, Inc. (a) | 235,100 | | 4,582,099 |
National Oilwell Varco, Inc. | 315,695 | | 25,435,546 |
Oil States International, Inc. (a) | 118,650 | | 9,575,055 |
RPC, Inc. (d) | 37,500 | | 885,750 |
Schlumberger Ltd. | 675,532 | | 61,047,827 |
Schoeller-Bleckmann Oilfield Equipment AG | 24,838 | | 2,425,032 |
Superior Energy Services, Inc. (a) | 68,784 | | 2,853,848 |
Weatherford International Ltd. (a) | 306,829 | | 6,725,692 |
Willbros Group, Inc. (a) | 155,153 | | 1,427,408 |
| | 214,124,817 |
TOTAL ENERGY EQUIPMENT & SERVICES | | 304,416,403 |
METALS & MINING - 0.6% |
Diversified Metals & Mining - 0.6% |
Grande Cache Coal Corp. (a) | 105,069 | | 958,972 |
Walter Energy, Inc. | 34,135 | | 4,183,927 |
| | 5,142,899 |
|
| Shares | | Value |
OIL, GAS & CONSUMABLE FUELS - 62.2% |
Coal & Consumable Fuels - 2.4% |
Alpha Natural Resources, Inc. (a) | 440,111 | | $ 18,797,141 |
Peabody Energy Corp. | 27,905 | | 1,603,700 |
| | 20,400,841 |
Integrated Oil & Gas - 32.5% |
Chevron Corp. | 912,732 | | 94,942,381 |
Ecopetrol SA ADR (d) | 104,300 | | 4,406,675 |
Exxon Mobil Corp. | 1,124,801 | | 89,747,872 |
Hess Corp. | 445,345 | | 30,532,853 |
Occidental Petroleum Corp. | 467,984 | | 45,946,669 |
Royal Dutch Shell PLC Class A sponsored ADR | 186,800 | | 13,741,008 |
| | 279,317,458 |
Oil & Gas Exploration & Production - 14.7% |
Anadarko Petroleum Corp. | 87,258 | | 7,204,020 |
Apache Corp. | 114,439 | | 14,158,393 |
Bankers Petroleum Ltd. (a) | 419,800 | | 2,636,383 |
Berry Petroleum Co. Class A | 119,345 | | 6,844,436 |
Brigham Exploration Co. (a) | 58,800 | | 1,869,840 |
Carrizo Oil & Gas, Inc. (a) | 50,700 | | 1,946,880 |
Cimarex Energy Co. | 33,432 | | 2,946,028 |
Clayton Williams Energy, Inc. (a) | 12,161 | | 806,518 |
Gran Tierra Energy, Inc. (Canada) (a) | 1,091,000 | | 7,605,254 |
Marathon Oil Corp. | 921,626 | | 28,542,757 |
Newfield Exploration Co. (a) | 103,100 | | 6,951,002 |
Niko Resources Ltd. | 14,500 | | 997,273 |
Noble Energy, Inc. | 48,169 | | 4,801,486 |
Northern Oil & Gas, Inc. (a)(d) | 54,747 | | 1,212,099 |
Oasis Petroleum, Inc. (a)(d) | 36,500 | | 1,078,210 |
Pacific Rubiales Energy Corp. | 78,900 | | 2,269,387 |
Painted Pony Petroleum Ltd. Class A (a) | 123,500 | | 1,829,103 |
Petroleum Development Corp. (a) | 47,870 | | 1,738,638 |
Petrominerales Ltd. | 49,372 | | 1,575,108 |
Pioneer Natural Resources Co. | 142,600 | | 13,260,374 |
Stone Energy Corp. (a) | 70,600 | | 2,291,676 |
Talisman Energy, Inc. | 159,500 | | 2,904,857 |
Whiting Petroleum Corp. (a) | 182,080 | | 10,669,888 |
| | 126,139,610 |
Oil & Gas Refining & Marketing - 12.1% |
CVR Energy, Inc. (a) | 351,792 | | 9,445,615 |
HollyFrontier Corp. | 559,450 | | 42,176,936 |
Keyera Corp. | 36,500 | | 1,677,151 |
Marathon Petroleum Corp. | 460,813 | | 20,179,001 |
Tesoro Corp. (a)(d) | 491,500 | | 11,938,535 |
Valero Energy Corp. | 560,225 | | 14,072,852 |
Western Refining, Inc. (a)(d) | 207,134 | | 4,231,748 |
| | 103,721,838 |
Oil & Gas Storage & Transport - 0.5% |
Atlas Energy LP | 19,225 | | 480,817 |
Common Stocks - continued |
| Shares | | Value |
OIL, GAS & CONSUMABLE FUELS - CONTINUED |
Oil & Gas Storage & Transport - continued |
Atlas Pipeline Partners, LP | 41,850 | | $ 1,431,689 |
El Paso Corp. | 131,300 | | 2,698,215 |
| | 4,610,721 |
TOTAL OIL, GAS & CONSUMABLE FUELS | | 534,190,468 |
TOTAL COMMON STOCKS (Cost $732,838,164) | 858,722,936 |
Convertible Bonds - 0.0% |
| Principal
Amount | | |
SEMICONDUCTORS & SEMICONDUCTOR EQUIPMENT - 0.0% |
Semiconductors - 0.0% |
SunPower Corp. 4.75% 4/15/14
(Cost $320,000) | | $ 320,000 | | 332,000 |
Money Market Funds - 2.5% |
| Shares | | |
Fidelity Cash Central Fund, 0.14% (b) | 4,967,940 | | 4,967,940 |
Fidelity Securities Lending Cash Central Fund, 0.15% (b)(c) | 16,669,688 | | 16,669,688 |
TOTAL MONEY MARKET FUNDS (Cost $21,637,628) | 21,637,628 |
TOTAL INVESTMENT PORTFOLIO - 102.5% (Cost $754,795,792) | 880,692,564 |
NET OTHER ASSETS (LIABILITIES) - (2.5)% | | (21,767,323) |
NET ASSETS - 100% | $ 858,925,241 |
Legend |
(a) Non-income producing |
(b) Affiliated fund that is available only to investment companies and other accounts managed by Fidelity Investments. The rate quoted is the annualized seven-day yield of the fund at period end. A complete unaudited listing of the fund's holdings as of its most recent quarter end is available upon request. In addition, each Fidelity Central Fund's financial statements, which are not covered by the Fund's Report of Independent Registered Public Accounting Firm, are available on the SEC's website or upon request. |
(c) Investment made with cash collateral received from securities on loan. |
(d) Security or a portion of the security is on loan at period end. |
(e) Security exempt from registration under Rule 144A of the Securities Act of 1933. These securities may be resold in transactions exempt from registration, normally to qualified institutional buyers. At the end of the period, the value of these securities amounted to $633,497 or 0.1% of net assets. |
Affiliated Central Funds |
Information regarding fiscal year to date income earned by the Fund from investments in Fidelity Central Funds is as follows: |
Fund | Income earned |
Fidelity Cash Central Fund | $ 7,525 |
Fidelity Securities Lending Cash Central Fund | 40,277 |
Total | $ 47,802 |
Other Information |
The following is a summary of the inputs used, as of July 31, 2011, involving the Fund's assets and liabilities carried at fair value. The inputs or methodology used for valuing securities may not be an indication of the risk associated with investing in those securities. For more information on valuation inputs, and their aggregation into the levels used in the table below, please refer to the Security Valuation section in the accompanying Notes to Financial Statements. |
Valuation Inputs at Reporting Date: |
Description | Total | Level 1 | Level 2 | Level 3 |
Investments in Securities: | | | | |
Common Stocks | $ 858,722,936 | $ 854,358,168 | $ 4,364,768 | $ - |
Convertible Bonds | 332,000 | - | 332,000 | - |
Money Market Funds | 21,637,628 | 21,637,628 | - | - |
Total Investments in Securities: | $ 880,692,564 | $ 875,995,796 | $ 4,696,768 | $ - |
Distribution of investments by country of issue, as a percentage of total net assets, is as follows: (Unaudited) |
United States of America | 80.1% |
Curacao | 7.1% |
United Kingdom | 5.2% |
Switzerland | 2.8% |
Canada | 1.7% |
Netherlands | 1.2% |
Others (Individually Less Than 1%) | 1.9% |
| 100.0% |
Income Tax Information |
At July 31, 2011, the Fund had a capital loss carryforward of approximately $5,562,179 of which $2,846,796 and $2,715,383 will expire in fiscal 2017 and 2018, respectively. Capital loss carryforwards are only available to offset future capital gains of the Fund to the extent provided by regulations and may be limited. |
See accompanying notes which are an integral part of the financial statements.
Annual Report
Fidelity Advisor Energy Fund
Statement of Assets and Liabilities
| July 31, 2011 |
| | |
Assets | | |
Investment in securities, at value (including securities loaned of $16,297,784) - See accompanying schedule: Unaffiliated issuers (cost $733,158,164) | $ 859,054,936 | |
Fidelity Central Funds (cost $21,637,628) | 21,637,628 | |
Total Investments (cost $754,795,792) | | $ 880,692,564 |
Receivable for investments sold | | 5,585,316 |
Receivable for fund shares sold | | 973,458 |
Dividends receivable | | 71,847 |
Interest receivable | | 4,433 |
Distributions receivable from Fidelity Central Funds | | 6,558 |
Other receivables | | 18,070 |
Total assets | | 887,352,246 |
| | |
Liabilities | | |
Payable for investments purchased | $ 4,710,220 | |
Payable for fund shares redeemed | 6,041,083 | |
Accrued management fee | 405,646 | |
Distribution and service plan fees payable | 348,741 | |
Other affiliated payables | 211,937 | |
Other payables and accrued expenses | 39,690 | |
Collateral on securities loaned, at value | 16,669,688 | |
Total liabilities | | 28,427,005 |
| | |
Net Assets | | $ 858,925,241 |
Net Assets consist of: | | |
Paid in capital | | $ 747,806,770 |
Accumulated net investment loss | | (187) |
Accumulated undistributed net realized gain (loss) on investments and foreign currency transactions | | (14,776,130) |
Net unrealized appreciation (depreciation) on investments and assets and liabilities in foreign currencies | | 125,894,788 |
Net Assets | | $ 858,925,241 |
Statement of Assets and Liabilities - continued
| July 31, 2011 |
| | |
Calculation of Maximum Offering Price Class A:
Net Asset Value and redemption price per share ($331,120,119 ÷ 8,243,118 shares) | | $ 40.17 |
| | |
Maximum offering price per share (100/94.25 of $40.17) | | $ 42.62 |
Class T:
Net Asset Value and redemption price per share ($290,512,272 ÷ 7,079,193 shares) | | $ 41.04 |
| | |
Maximum offering price per share (100/96.50 of $41.04) | | $ 42.53 |
Class B:
Net Asset Value and offering price per share ($49,792,786 ÷ 1,323,997 shares)A | | $ 37.61 |
| | |
Class C:
Net Asset Value and offering price per share ($133,476,323 ÷ 3,523,472 shares)A | | $ 37.88 |
| | |
Institutional Class:
Net Asset Value, offering price and redemption price per share ($54,023,741 ÷ 1,287,811 shares) | | $ 41.95 |
A Redemption price per share is equal to net asset value less any applicable contingent deferred sales charge.
See accompanying notes which are an integral part of the financial statements.
Annual Report
Statement of Operations
| Year ended July 31, 2011 |
| | |
Investment Income | | |
Dividends | | $ 11,113,867 |
Interest | | 15,257 |
Income from Fidelity Central Funds | | 47,802 |
Total income | | 11,176,926 |
| | |
Expenses | | |
Management fee | $ 4,280,185 | |
Transfer agent fees | 2,101,474 | |
Distribution and service plan fees | 3,754,396 | |
Accounting and security lending fees | 271,534 | |
Custodian fees and expenses | 32,003 | |
Independent trustees' compensation | 4,063 | |
Registration fees | 100,812 | |
Audit | 49,308 | |
Legal | 3,000 | |
Interest | 56 | |
Miscellaneous | 6,189 | |
Total expenses before reductions | 10,603,020 | |
Expense reductions | (35,967) | 10,567,053 |
Net investment income (loss) | | 609,873 |
Realized and Unrealized Gain (Loss) Net realized gain (loss) on: | | |
Investment securities: | | |
Unaffiliated issuers | 108,235,066 | |
Foreign currency transactions | 22,623 | |
Total net realized gain (loss) | | 108,257,689 |
Change in net unrealized appreciation (depreciation) on: Investment securities | 148,374,883 | |
Assets and liabilities in foreign currencies | 32 | |
Total change in net unrealized appreciation (depreciation) | | 148,374,915 |
Net gain (loss) | | 256,632,604 |
Net increase (decrease) in net assets resulting from operations | | $ 257,242,477 |
Statement of Changes in Net Assets
| Year ended
July 31,
2011 | Year ended
July 31,
2010 |
Increase (Decrease) in Net Assets | | |
Operations | | |
Net investment income (loss) | $ 609,873 | $ (2,588,877) |
Net realized gain (loss) | 108,257,689 | 85,218,986 |
Change in net unrealized appreciation (depreciation) | 148,374,915 | (40,712,055) |
Net increase (decrease) in net assets resulting from operations | 257,242,477 | 41,918,054 |
Distributions to shareholders from net investment income | (1,542,989) | - |
Share transactions - net increase (decrease) | 7,476,541 | (40,286,664) |
Redemption fees | 27,523 | 43,053 |
Total increase (decrease) in net assets | 263,203,552 | 1,674,443 |
| | |
Net Assets | | |
Beginning of period | 595,721,689 | 594,047,246 |
End of period (including accumulated net investment loss of $187 and accumulated net investment loss of $116, respectively) | $ 858,925,241 | $ 595,721,689 |
See accompanying notes which are an integral part of the financial statements.
Annual Report
Financial Highlights - Class A
Years ended July 31, | 2011 | 2010 | 2009 | 2008 | 2007 |
Selected Per-Share Data | | | | | |
Net asset value, beginning of period | $ 27.70 | $ 25.82 | $ 50.24 | $ 48.28 | $ 46.39 |
Income from Investment Operations | | | | | |
Net investment income (loss) C | .11 | (.05) | (.04) | (.17) | (.02) F |
Net realized and unrealized gain (loss) | 12.47 | 1.93 | (17.48) | 5.59 | 8.42 |
Total from investment operations | 12.58 | 1.88 | (17.52) | 5.42 | 8.40 |
Distributions from net investment income | (.11) | - | - | - | - |
Distributions from net realized gain | - | - | (6.90) | (3.46) | (6.51) |
Total distributions | (.11) | - | (6.90) | (3.46) | (6.51) |
Redemption fees added to paid in capital C, H | - | - | - | - | - |
Net asset value, end of period | $ 40.17 | $ 27.70 | $ 25.82 | $ 50.24 | $ 48.28 |
Total Return A, B | 45.46% | 7.28% | (38.86)% | 11.52% | 22.08% |
Ratios to Average Net Assets D, G | | | | | |
Expenses before reductions | 1.16% | 1.20% | 1.22% | 1.14% | 1.19% |
Expenses net of fee waivers, if any | 1.16% | 1.20% | 1.22% | 1.14% | 1.19% |
Expenses net of all reductions | 1.16% | 1.19% | 1.21% | 1.14% | 1.19% |
Net investment income (loss) | .30% | (.16)% | (.14)% | (.32)% | (.05)% F |
Supplemental Data | | | | | |
Net assets, end of period (000 omitted) | $ 331,120 | $ 214,407 | $ 216,595 | $ 355,200 | $ 268,108 |
Portfolio turnover rate E | 91% | 103% | 148% | 90% | 80% |
A Total returns would have been lower if certain expenses had not been reduced during the applicable periods shown.
B Total returns do not include the effect of the sales charges.
C Calculated based on average shares outstanding during the period.
D Fees and expenses of any underlying Fidelity Central Funds are not included in the Fund's expense ratio. The Fund indirectly bears its proportionate share of the expenses of any underlying Fidelity Central Funds.
E Amount does not include the portfolio activity of any underlying Fidelity Central Funds.
F Investment income per share reflects a special dividend which amounted to $.05 per share. Excluding the special dividend, the ratio of net investment income (loss) to average net assets would have been (.17)%.
G Expense ratios reflect operating expenses of the class. Expenses before reductions do not reflect amounts reimbursed by the investment adviser or reductions from brokerage service arrangements or reductions from other expense offset arrangements and do not represent the amount paid by the class during periods when reimbursements or reductions occur. Expenses net of fee waivers reflect expenses after reimbursement by the investment adviser but prior to reductions from brokerage service arrangements or other expense offset arrangements. Expenses net of all reductions represent the net expenses paid by the class.
H Amount represents less than $.01 per share.
Financial Highlights - Class T
Years ended July 31, | 2011 | 2010 | 2009 | 2008 | 2007 |
Selected Per-Share Data | | | | | |
Net asset value, beginning of period | $ 28.33 | $ 26.47 | $ 51.40 | $ 49.26 | $ 47.18 |
Income from Investment Operations | | | | | |
Net investment income (loss) C | .03 | (.11) | (.10) | (.29) | (.11) F |
Net realized and unrealized gain (loss) | 12.75 | 1.97 | (17.93) | 5.72 | 8.61 |
Total from investment operations | 12.78 | 1.86 | (18.03) | 5.43 | 8.50 |
Distributions from net investment income | (.07) | - | - | - | - |
Distributions from net realized gain | - | - | (6.90) | (3.29) | (6.42) |
Total distributions | (.07) | - | (6.90) | (3.29) | (6.42) |
Redemption fees added to paid in capital C, H | - | - | - | - | - |
Net asset value, end of period | $ 41.04 | $ 28.33 | $ 26.47 | $ 51.40 | $ 49.26 |
Total Return A, B | 45.16% | 7.03% | (38.99)% | 11.27% | 21.84% |
Ratios to Average Net Assets D, G | | | | | |
Expenses before reductions | 1.37% | 1.41% | 1.45% | 1.36% | 1.40% |
Expenses net of fee waivers, if any | 1.37% | 1.41% | 1.45% | 1.36% | 1.40% |
Expenses net of all reductions | 1.37% | 1.41% | 1.45% | 1.35% | 1.39% |
Net investment income (loss) | .09% | (.37)% | (.38)% | (.54)% | (.26)% F |
Supplemental Data | | | | | |
Net assets, end of period (000 omitted) | $ 290,512 | $ 219,051 | $ 224,376 | $ 407,784 | $ 382,222 |
Portfolio turnover rate E | 91% | 103% | 148% | 90% | 80% |
A Total returns would have been lower if certain expenses had not been reduced during the applicable periods shown.
B Total returns do not include the effect of the sales charges.
C Calculated based on average shares outstanding during the period.
D Fees and expenses of any underlying Fidelity Central Funds are not included in the Fund's expense ratio. The Fund indirectly bears its proportionate share of the expenses of any underlying Fidelity Central Funds.
E Amount does not include the portfolio activity of any underlying Fidelity Central Funds.
F Investment income per share reflects a special dividend which amounted to $.05 per share. Excluding the special dividend, the ratio of net investment income (loss) to average net assets would have been (.37)%.
G Expense ratios reflect operating expenses of the class. Expenses before reductions do not reflect amounts reimbursed by the investment adviser or reductions from brokerage service arrangements or reductions from other expense offset arrangements and do not represent the amount paid by the class during periods when reimbursements or reductions occur. Expenses net of fee waivers reflect expenses after reimbursement by the investment adviser but prior to reductions from brokerage service arrangements or other expense offset arrangements. Expenses net of all reductions represent the net expenses paid by the class.
H Amount represents less than $.01 per share.
See accompanying notes which are an integral part of the financial statements.
Annual Report
Financial Highlights - Class B
Years ended July 31, | 2011 | 2010 | 2009 | 2008 | 2007 |
Selected Per-Share Data | | | | | |
Net asset value, beginning of period | $ 26.06 | $ 24.48 | $ 48.35 | $ 46.64 | $ 45.10 |
Income from Investment Operations | | | | | |
Net investment income (loss) C | (.15) | (.25) | (.22) | (.56) | (.34) F |
Net realized and unrealized gain (loss) | 11.71 | 1.83 | (16.75) | 5.41 | 8.17 |
Total from investment operations | 11.56 | 1.58 | (16.97) | 4.85 | 7.83 |
Distributions from net investment income | (.01) | - | - | - | - |
Distributions from net realized gain | - | - | (6.90) | (3.14) | (6.29) |
Total distributions | (.01) | - | (6.90) | (3.14) | (6.29) |
Redemption fees added to paid in capital C, H | - | - | - | - | - |
Net asset value, end of period | $ 37.61 | $ 26.06 | $ 24.48 | $ 48.35 | $ 46.64 |
Total Return A, B | 44.38% | 6.45% | (39.31)% | 10.62% | 21.18% |
Ratios to Average Net Assets D, G | | | | | |
Expenses before reductions | 1.93% | 1.96% | 1.96% | 1.93% | 1.96% |
Expenses net of fee waivers, if any | 1.93% | 1.96% | 1.96% | 1.93% | 1.96% |
Expenses net of all reductions | 1.92% | 1.95% | 1.96% | 1.93% | 1.95% |
Net investment income (loss) | (.46)% | (.92)% | (.89)% | (1.11)% | (.82)% F |
Supplemental Data | | | | | |
Net assets, end of period (000 omitted) | $ 49,793 | $ 44,330 | $ 47,795 | $ 98,602 | $ 116,487 |
Portfolio turnover rate E | 91% | 103% | 148% | 90% | 80% |
A Total returns would have been lower if certain expenses had not been reduced during the applicable periods shown.
B Total returns do not include the effect of the contingent deferred sales charge.
C Calculated based on average shares outstanding during the period.
D Fees and expenses of any underlying Fidelity Central Funds are not included in the Fund's expense ratio. The Fund indirectly bears its proportionate share of the expenses of any underlying Fidelity Central Funds.
E Amount does not include the portfolio activity of any underlying Fidelity Central Funds.
F Investment income per share reflects a special dividend which amounted to $.05 per share. Excluding the special dividend, the ratio of net investment income (loss) to average net assets would have been (.93)%.
G Expense ratios reflect operating expenses of the class. Expenses before reductions do not reflect amounts reimbursed by the investment adviser or reductions from brokerage service arrangements or reductions from other expense offset arrangements and do not represent the amount paid by the class during periods when reimbursements or reductions occur. Expenses net of fee waivers reflect expenses after reimbursement by the investment adviser but prior to reductions from brokerage service arrangements or other expense offset arrangements. Expenses net of all reductions represent the net expenses paid by the class.
H Amount represents less than $.01 per share.
Financial Highlights - Class C
Years ended July 31, | 2011 | 2010 | 2009 | 2008 | 2007 |
Selected Per-Share Data | | | | | |
Net asset value, beginning of period | $ 26.25 | $ 24.65 | $ 48.63 | $ 46.88 | $ 45.33 |
Income from Investment Operations | | | | | |
Net investment income (loss) C | (.15) | (.25) | (.21) | (.54) | (.32) F |
Net realized and unrealized gain (loss) | 11.80 | 1.85 | (16.87) | 5.45 | 8.20 |
Total from investment operations | 11.65 | 1.60 | (17.08) | 4.91 | 7.88 |
Distributions from net investment income | (.02) | - | - | - | - |
Distributions from net realized gain | - | - | (6.90) | (3.16) | (6.33) |
Total distributions | (.02) | - | (6.90) | (3.16) | (6.33) |
Redemption fees added to paid in capital C, H | - | - | - | - | - |
Net asset value, end of period | $ 37.88 | $ 26.25 | $ 24.65 | $ 48.63 | $ 46.88 |
Total Return A, B | 44.38% | 6.49% | (39.31)% | 10.71% | 21.22% |
Ratios to Average Net Assets D, G | | | | | |
Expenses before reductions | 1.90% | 1.94% | 1.96% | 1.87% | 1.91% |
Expenses net of fee waivers, if any | 1.90% | 1.94% | 1.96% | 1.87% | 1.91% |
Expenses net of all reductions | 1.89% | 1.93% | 1.95% | 1.87% | 1.91% |
Net investment income (loss) | (.43)% | (.90)% | (.88)% | (1.05)% | (.77)% F |
Supplemental Data | | | | | |
Net assets, end of period (000 omitted) | $ 133,476 | $ 90,596 | $ 86,650 | $ 156,393 | $ 135,072 |
Portfolio turnover rate E | 91% | 103% | 148% | 90% | 80% |
A Total returns would have been lower if certain expenses had not been reduced during the applicable periods shown.
B Total returns do not include the effect of the contingent deferred sales charge.
C Calculated based on average shares outstanding during the period.
D Fees and expenses of any underlying Fidelity Central Funds are not included in the Fund's expense ratio. The Fund indirectly bears its proportionate share of the expenses of any underlying Fidelity Central Funds.
E Amount does not include the portfolio activity of any underlying Fidelity Central Funds.
F Investment income per share reflects a special dividend which amounted to $.05 per share. Excluding the special dividend, the ratio of net investment income (loss) to average net assets would have been (.88)%.
G Expense ratios reflect operating expenses of the class. Expenses before reductions do not reflect amounts reimbursed by the investment adviser or reductions from brokerage service arrangements or reductions from other expense offset arrangements and do not represent the amount paid by the class during periods when reimbursements or reductions occur. Expenses net of fee waivers reflect expenses after reimbursement by the investment adviser but prior to reductions from brokerage service arrangements or other expense offset arrangements. Expenses net of all reductions represent the net expenses paid by the class.
H Amount represents less than $.01 per share.
See accompanying notes which are an integral part of the financial statements.
Annual Report
Financial Highlights - Institutional Class
Years ended July 31, | 2011 | 2010 | 2009 | 2008 | 2007 |
Selected Per-Share Data | | | | | |
Net asset value, beginning of period | $ 28.87 | $ 26.83 | $ 51.76 | $ 49.68 | $ 47.48 |
Income from Investment Operations | | | | | |
Net investment income (loss) B | .23 | .04 | .03 | (.02) | .11 E |
Net realized and unrealized gain (loss) | 12.99 | 2.00 | (18.06) | 5.74 | 8.67 |
Total from investment operations | 13.22 | 2.04 | (18.03) | 5.72 | 8.78 |
Distributions from net investment income | (.14) | - | - | - | - |
Distributions from net realized gain | - | - | (6.90) | (3.64) | (6.58) |
Total distributions | (.14) | - | (6.90) | (3.64) | (6.58) |
Redemption fees added to paid in capital B, G | - | - | - | - | - |
Net asset value, end of period | $ 41.95 | $ 28.87 | $ 26.83 | $ 51.76 | $ 49.68 |
Total Return A | 45.87% | 7.60% | (38.68)% | 11.83% | 22.47% |
Ratios to Average Net Assets C, F | | | | | |
Expenses before reductions | .86% | .90% | .95% | .85% | .88% |
Expenses net of fee waivers, if any | .86% | .90% | .95% | .85% | .88% |
Expenses net of all reductions | .85% | .90% | .94% | .85% | .88% |
Net investment income (loss) | .60% | .14% | .13% | (.03)% | .25% E |
Supplemental Data | | | | | |
Net assets, end of period (000 omitted) | $ 54,024 | $ 27,338 | $ 18,631 | $ 22,250 | $ 17,127 |
Portfolio turnover rate D | 91% | 103% | 148% | 90% | 80% |
A Total returns would have been lower if certain expenses had not been reduced during the applicable periods shown.
B Calculated based on average shares outstanding during the period.
C Fees and expenses of any underlying Fidelity Central Funds are not included in the Fund's expense ratio. The Fund indirectly bears its proportionate share of the expenses of any underlying Fidelity Central Funds.
D Amount does not include the portfolio activity of any underlying Fidelity Central Funds.
E Investment income per share reflects a special dividend which amounted to $.05 per share. Excluding the special dividend, the ratio of net investment income (loss) to average net assets would have been .14%.
F Expense ratios reflect operating expenses of the class. Expenses before reductions do not reflect amounts reimbursed by the investment adviser or reductions from brokerage service arrangements or reductions from other expense offset arrangements and do not represent the amount paid by the class during periods when reimbursements or reductions occur. Expenses net of fee waivers reflect expenses after reimbursement by the investment adviser but prior to reductions from brokerage service arrangements or other expense offset arrangements. Expenses net of all reductions represent the net expenses paid by the class.
G Amount represents less than $.01 per share.
See accompanying notes which are an integral part of the financial statements.
Annual Report
Notes to Financial Statements
For the period ended July 31, 2011
1. Organization.
Fidelity Advisor Energy Fund (the Fund) is a non-diversified fund of Fidelity Advisor Series VII (the Trust) and is authorized to issue an unlimited number of shares. The Trust is registered under the Investment Company Act of 1940, as amended (the 1940 Act), as an open-end management investment company organized as a Massachusetts business trust. The Fund offers Class A, Class T, Class C and Institutional Class shares, each of which, along with Class B shares, has equal rights as to assets and voting privileges. Effective after the close of business on September 1, 2010, Class B shares were closed to new accounts and additional purchases, except for exchanges and reinvestments, by existing shareholders. Each class has exclusive voting rights with respect to matters that affect that class. Class B shares will automatically convert to Class A shares after a holding period of seven years from the initial date of purchase. Investment income, realized and unrealized capital gains and losses, the common expenses of the Fund, and certain fund-level expense reductions, if any, are allocated on a pro-rata basis to each class based on the relative net assets of each class to the total net assets of the Fund. Each class differs with respect to transfer agent and distribution and service plan fees incurred. Certain expense reductions may also differ by class.
2. Investments in Fidelity Central Funds.
The Fund invests in Fidelity Central Funds, which are open-end investment companies available only to other investment companies and accounts managed by Fidelity Management & Research Company (FMR) and its affiliates. The Fund's Schedule of Investments lists each of the Fidelity Central Funds held as of period end, if any, as an investment of the Fund, but does not include the underlying holdings of each Fidelity Central Fund. As an Investing Fund, the Fund indirectly bears its proportionate share of the expenses of the underlying Fidelity Central Funds.
The Money Market Central Funds seek preservation of capital and current income and are managed by Fidelity Investments Money Management, Inc. (FIMM), an affiliate of FMR.
A complete unaudited list of holdings for each Fidelity Central Fund is available upon request or at the Securities and Exchange Commission (the SEC) web site at www.sec.gov. In addition, the financial statements of the Fidelity Central Funds, which are not covered by the Fund's Report of Independent Registered Public Accounting Firm, are available on the SEC web site or upon request.
3. Significant Accounting Policies.
The financial statements have been prepared in conformity with accounting principles generally accepted in the United States of America (GAAP), which require management to make certain estimates and assumptions at the date of the financial statements. Actual results could differ from those estimates. Subsequent events, if any, through the date that the financial statements were issued have been evaluated in the preparation of the financial statements. The following summarizes the significant accounting policies of the Fund:
Security Valuation. Investments are valued as of 4:00 p.m. Eastern time on the last calendar day of the period. The Fund uses independent pricing services approved by the Board of Trustees to value its investments. When current market prices or quotations are not readily available or reliable, valuations may be determined in good faith in accordance with procedures adopted by the Board of Trustees. Factors used in determining value may include market or security specific events, changes in interest rates and credit quality. The frequency with which these procedures are used cannot be predicted and they may be utilized to a significant extent. The value used for net asset value (NAV) calculation under these procedures may differ from published prices for the same securities.
The Fund categorizes the inputs to valuation techniques used to value its investments into a disclosure hierarchy consisting of three levels as shown below:
Level 1 - quoted prices in active markets for identical investments
Level 2 - other significant observable inputs (including quoted prices for similar investments, interest rates, prepayment speeds, etc.)
Level 3 - unobservable inputs (including the Fund's own assumptions based on the best information available)
Changes in valuation techniques may result in transfers in or out of an assigned level within the disclosure hierarchy. The aggregate value of investments by input level, as of July 31, 2011, is included at the end of the Fund's Schedule of Investments. Valuation techniques used to value the Fund's investments by major category are as follows:
Equity securities, including restricted securities, for which market quotations are readily available, are valued at the last reported sale price or official closing price as reported by an independent pricing service on the primary market or exchange on which they are traded and are categorized as Level 1 in the hierarchy. In the event there were no sales during the day or closing prices are not available, securities are valued at the last quoted bid price or may be valued using the last available price and are generally categorized as Level 2 in the hierarchy. For foreign equity securities, when significant market or security specific events arise, comparisons to the valuation of American Depositary Receipts (ADRs), futures contracts, Exchange-traded funds (ETFs) and certain indexes as well as quoted prices for similar securities are used and are categorized as Level 2 in the hierarchy in these
Annual Report
3. Significant Accounting Policies - continued
Security Valuation - continued
circumstances. Utilizing these techniques may result in transfers between Level 1 and Level 2. For restricted equity securities and private placements where observable inputs are limited, assumptions about market activity and risk are used and are categorized as Level 3 in the hierarchy.
Debt securities, including restricted securities, are valued based on evaluated prices received from independent pricing services or from dealers who make markets in such securities. For corporate bonds, pricing services utilize matrix pricing which considers yield or price of bonds of comparable quality, coupon, maturity and type as well as dealer supplied prices and are generally categorized as Level 2 in the hierarchy. When independent prices are unavailable or unreliable, debt securities may be valued utilizing pricing matrices which consider similar factors that would be used by independent pricing services. These are generally categorized as Level 2 in the hierarchy but may be Level 3 depending on the circumstances.
Investments in open-end mutual funds, including the Fidelity Central Funds, are valued at their closing net asset value each business day and are categorized as Level 1 in the hierarchy.
Foreign Currency. The Fund may use foreign currency contracts to facilitate transactions in foreign-denominated securities. Gains and losses from these transactions may arise from changes in the value of the foreign currency or if the counterparties do not perform under the contracts' terms.
Foreign-denominated assets, including investment securities, and liabilities are translated into U.S. dollars at the exchange rate at period end. Purchases and sales of investment securities, income and dividends received and expenses denominated in foreign currencies are translated into U.S. dollars at the exchange rate in effect on the transaction date.
The effects of exchange rate fluctuations on investments are included with the net realized and unrealized gain (loss) on investment securities. Other foreign currency transactions resulting in realized and unrealized gain (loss) are disclosed separately.
Investment Transactions and Income. For financial reporting purposes, the Fund's investment holdings and NAV include trades executed through the end of the last business day of the period. The NAV per share for processing shareholder transactions is calculated as of the close of business of the New York Stock Exchange (NYSE), normally 4:00 p.m. Eastern time and includes trades executed through the end of the prior business day. Gains and losses on securities sold are determined on the basis of identified cost and may include proceeds received from litigation. Dividend income is recorded on the ex-dividend date, except for certain dividends from foreign securities where the ex-dividend date may have passed, which are recorded as soon as the Fund is informed of the ex-dividend date. Non-cash dividends included in dividend income, if any, are recorded at the fair market value of the securities received. Distributions received on securities that represent a return of capital or capital gain are recorded as a reduction of cost of investments and/or as a realized gain. The Fund estimates the components of distributions received that may be considered return of capital distributions or capital gain distributions. Interest income and distributions from the Fidelity Central Funds are accrued as earned. Interest income includes coupon interest and amortization of premium and accretion of discount on debt securities. Investment income is recorded net of foreign taxes withheld where recovery of such taxes is uncertain.
Expenses. Expenses directly attributable to a fund are charged to that fund. Expenses attributable to more than one fund are allocated among the respective funds on the basis of relative net assets or other appropriate methods. Expense estimates are accrued in the period to which they relate and adjustments are made when actual amounts are known.
Income Tax Information and Distributions to Shareholders. Each year, the Fund intends to qualify as a regulated investment company, including distributing substantially all of its taxable income and realized gains under Subchapter M of the Internal Revenue Code and filing its U.S. federal tax return. As a result, no provision for income taxes is required. As of July 31, 2011, the Fund did not have any unrecognized tax benefits in the financial statements. A fund's federal tax return is subject to examination by the Internal Revenue Service (IRS) for a period of three years. Foreign taxes are provided for based on the Fund's understanding of the tax rules and rates that exist in the foreign markets in which it invests.
Distributions are declared and recorded on the ex-dividend date. Income dividends and capital gain distributions are declared separately for each class. Income and capital gain distributions are determined in accordance with income tax regulations, which may differ from GAAP.
Capital accounts within the financial statements are adjusted for permanent book-tax differences. These adjustments have no impact on net assets or the results of operations. Temporary book-tax differences will reverse in a subsequent period.
Book-tax differences are primarily due to foreign currency transactions, deferred trustees compensation, passive foreign investment companies (PFIC), capital loss carryforwards, and losses deferred due to wash sales.
Annual Report
Notes to Financial Statements - continued
3. Significant Accounting Policies - continued
Income Tax Information and Distributions to Shareholders - continued
The federal tax cost of investment securities and unrealized appreciation (depreciation) as of period end were as follows:
Gross unrealized appreciation | $ 145,517,723 |
Gross unrealized depreciation | (28,834,902) |
Net unrealized appreciation (depreciation) on securities and other investments | $ 116,682,821 |
| |
Tax Cost | $ 764,009,743 |
The tax-based components of distributable earnings as of period end were as follows:
Capital loss carryforward | $ (5,562,179) |
Net unrealized appreciation (depreciation) | $ 116,680,837 |
Under the recently enacted Regulated Investment Company Modernization Act of 2010 (the Act), the Fund will be permitted to carry forward capital losses incurred in taxable years beginning after December 22, 2010 for an unlimited period. However, any losses incurred during those future taxable years will be required to be utilized prior to any losses incurred in pre-enactment taxable years, which generally expire after eight years from when they are incurred. Additionally, post-enactment capital losses that are carried forward will retain their character as either short-term or long-term capital losses rather than being considered all short-term as under previous law. The Fund's first fiscal year end subject to the Act will be July 31, 2012.
The tax character of distributions paid was as follows:
| July 31, 2011 | July 31, 2010 |
Ordinary Income | $ 1,542,989 | $ - |
Short-Term Trading (Redemption) Fees. Shares held by investors in the Fund less than 30 days are subject to a redemption fee equal to .75% of the net asset value of shares redeemed. All redemption fees, which reduce the proceeds of the shareholder redemption, are retained by the Fund and accounted for as an addition to paid in capital.
New Accounting Pronouncement. In May 2011, the Financial Accounting Standards Board issued Accounting Standard Update No. 2011-04, Fair Value Measurement (Topic 820) - Amendments to Achieve Common Fair Value Measurement and Disclosure Requirements in U.S. GAAP and IFRSs. The update changes the wording used to describe the requirements in GAAP for measuring fair value and for disclosing information about fair value measurements. The update is effective during interim and annual periods beginning after December 15, 2011. Management is currently evaluating the impact of the update's adoption on the Fund's financial statement disclosures.
4. Operating Policies.
Restricted Securities. The Fund may invest in securities that are subject to legal or contractual restrictions on resale. These securities generally may be resold in transactions exempt from registration or to the public if the securities are registered. Disposal of these securities may involve time-consuming negotiations and expense, and prompt sale at an acceptable price may be difficult. Information regarding restricted securities is included at the end of the Fund's Schedule of Investments.
5. Purchases and Sales of Investments.
Purchases and sales of securities, other than short-term securities, aggregated $711,469,261 and $701,277,867, respectively.
6. Fees and Other Transactions with Affiliates.
Management Fee. FMR and its affiliates provide the Fund with investment management related services for which the Fund pays a monthly management fee. The management fee is the sum of an individual fund fee rate that is based on an annual rate of .30% of the Fund's average net assets and a group fee rate that averaged .26% during the period. The group fee rate is based upon the average net assets of all the mutual funds advised by FMR. The group fee rate decreases as assets under management increase and increases as assets under management decrease. For the period, the total annual management fee rate was .56% of the Fund's average net assets.
Annual Report
6. Fees and Other Transactions with Affiliates - continued
Distribution and Service Plan Fees. In accordance with Rule 12b-1 of the 1940 Act, the Fund has adopted separate Distribution and Service Plans for each class of shares. Certain classes pay Fidelity Distributors Corporation (FDC), an affiliate of FMR, separate Distribution and Service Fees, each of which is based on an annual percentage of each class' average net assets. In addition, FDC may pay financial intermediaries for selling shares of the Fund and providing shareholder support services. For the period, the Distribution and Service Fee rates, total fees and amounts retained by FDC were as follows:
| Distribution
Fee | Service
Fee | Total Fees | Retained
by FDC |
Class A | -% | .25% | $ 712,364 | $ 22,409 |
Class T | .25% | .25% | 1,360,694 | 7,336 |
Class B | .75% | .25% | 503,774 | 378,494 |
Class C | .75% | .25% | 1,177,564 | 188,887 |
| | | $ 3,754,396 | $ 597,126 |
Sales Load. FDC may receive a front-end sales charge of up to 5.75% for selling Class A shares, and 3.50% for selling Class T shares, some of which is paid to financial intermediaries for selling shares of the Fund. Depending on the holding period, FDC may receive contingent deferred sales charges levied on Class A, Class T, Class B, and Class C redemptions. The deferred sales charges range from 5% to 1% for Class B, 1% for Class C, 1.00% for certain purchases of Class A shares and .25% for certain purchases of Class T shares.
For the period, sales charge amounts retained by FDC were as follows:
| Retained
by FDC |
Class A | $ 182,783 |
Class T | 37,886 |
Class B* | 85,822 |
Class C* | 13,898 |
| $ 320,389 |
* When Class B and Class C shares are initially sold, FDC pays commissions from its own resources to financial intermediaries through which the sales are made.
Transfer Agent Fees. Fidelity Investments Institutional Operations Company, Inc. (FIIOC), an affiliate of FMR, is the transfer, dividend disbursing and shareholder servicing agent for each class of the Fund. FIIOC receives account fees and asset-based fees that vary according to the account size and type of account of the shareholders of the respective classes of the Fund. FIIOC pays for typesetting, printing and mailing of shareholder reports, except proxy statements. For the period, transfer agent fees for each class were as follows:
| Amount | % of
Average
Net Assets |
Class A | $ 829,962 | .29 |
Class T | 691,834 | .25 |
Class B | 153,142 | .30 |
Class C | 324,366 | .28 |
Institutional Class | 102,170 | .24 |
| $ 2,101,474 | |
Accounting and Security Lending Fees. Fidelity Service Company, Inc. (FSC), an affiliate of FMR, maintains the Fund's accounting records. The accounting fee is based on the level of average net assets for the month. Under a separate contract, FSC administers the security lending program. The security lending fee is based on the number and duration of lending transactions.
Brokerage Commissions. The Fund placed a portion of its portfolio transactions with brokerage firms which are affiliates of the investment adviser. The commissions paid to these affiliated firms were $5,775 for the period.
Interfund Lending Program. Pursuant to an Exemptive Order issued by the SEC, the Fund, along with other registered investment companies having management contracts with FMR, may participate in an interfund lending program. This program provides an alternative credit facility allowing the funds to borrow from, or lend money to, other participating affiliated funds. At period end, there were no interfund loans outstanding.
Annual Report
Notes to Financial Statements - continued
6. Fees and Other Transactions with Affiliates - continued
Interfund Lending Program - continued
The Fund's activity in this program during the period for which loans were outstanding was as follows:
Borrower or Lender | Average Daily
Loan Balance | Weighted Average
Interest Rate | Interest
Expense |
Borrower | $ 5,222,000 | .39% | $ 56 |
7. Committed Line of Credit.
The Fund participates with other funds managed by FMR or an affiliate in a $4.0 billion credit facility (the "line of credit") to be utilized for temporary or emergency purposes to fund shareholder redemptions or for other short-term liquidity purposes. The Fund has agreed to pay commitment fees on its pro-rata portion of the line of credit, which amounted to $2,459 and is reflected in Miscellaneous expenses on the Statement of Operations. During the period, there were no borrowings on this line of credit.
8. Security Lending.
The Fund lends portfolio securities through a lending agent from time to time in order to earn additional income. The lending agent may loan securities to certain qualified borrowers, including Fidelity Capital Markets (FCM), a broker-dealer affiliated with the Fund. On the settlement date of the loan, the Fund receives collateral (in the form of U.S. Treasury obligations, letters of credit and/or cash) against the loaned securities and maintains collateral in an amount not less than 100% of the market value of the loaned securities during the period of the loan. The market value of the loaned securities is determined at the close of business of the Fund and any additional required collateral is delivered to the Fund on the next business day. If the borrower defaults on its obligation to return the securities loaned because of insolvency or other reasons, a fund could experience delays and costs in recovering the securities loaned or in gaining access to the collateral. Any cash collateral received is invested in the Fidelity Securities Lending Cash Central Fund. The value of loaned securities and cash collateral at period end are disclosed on the Fund's Statement of Assets and Liabilities. Security lending income represents the income earned on investing cash collateral, less rebates paid to borrowers and lending agent fees associated with the loan, plus any premium payments received for lending certain types of securities. Security lending income is presented in the Statement of Operations as a component of income from Fidelity Central Funds. Total security lending income during the period amounted to $40,277. During the period, there were no securities loaned to FCM.
9. Expense Reductions.
Many of the brokers with whom FMR places trades on behalf of the Fund provided services to the Fund in addition to trade execution. These services included payments of certain expenses on behalf of the Fund totaling $35,967 for the period.
10. Distributions to Shareholders.
Distributions to shareholders of each class were as follows:
Years ended July 31, | 2011 | 2010 |
From net investment income | | |
Class A | $ 788,179 | $ - |
Class T | 537,026 | - |
Class B | 21,298 | - |
Class C | 59,062 | - |
Institutional Class | 137,424 | - |
Total | $ 1,542,989 | $ - |
Annual Report
11. Share Transactions.
Transactions for each class of shares were as follows:
| Shares | Dollars |
Years ended July 31, | 2011 | 2010 | 2011 | 2010 |
Class A | | | | |
Shares sold | 2,848,824 | 2,475,060 | $ 108,457,523 | $ 72,154,427 |
Reinvestment of distributions | 20,239 | - | 701,079 | - |
Shares redeemed | (2,366,298) | (3,122,404) | (85,322,989) | (89,993,205) |
Net increase (decrease) | 502,765 | (647,344) | $ 23,835,613 | $ (17,838,778) |
Class T | | | | |
Shares sold | 1,191,543 | 1,265,490 | $ 45,538,389 | $ 38,114,553 |
Reinvestment of distributions | 14,153 | - | 502,257 | - |
Shares redeemed | (1,858,422) | (2,010,804) | (68,540,609) | (59,843,042) |
Net increase (decrease) | (652,726) | (745,314) | $ (22,499,963) | $ (21,728,489) |
Class B | | | | |
Shares sold | 118,268 | 320,063 | $ 4,084,617 | $ 8,832,050 |
Reinvestment of distributions | 560 | - | 18,656 | - |
Shares redeemed | (495,702) | (571,409) | (16,527,555) | (15,635,733) |
Net increase (decrease) | (376,874) | (251,346) | $ (12,424,282) | $ (6,803,683) |
Class C | | | | |
Shares sold | 964,253 | 819,751 | $ 34,720,800 | $ 22,984,733 |
Reinvestment of distributions | 1,513 | - | 50,476 | - |
Shares redeemed | (893,659) | (883,306) | (30,160,985) | (24,290,742) |
Net increase (decrease) | 72,107 | (63,555) | $ 4,610,291 | $ (1,306,009) |
Institutional Class | | | | |
Shares sold | 771,369 | 669,423 | $ 30,606,839 | $ 20,180,428 |
Reinvestment of distributions | 3,300 | - | 119,042 | - |
Shares redeemed | (433,932) | (416,730) | (16,770,999) | (12,790,133) |
Net increase (decrease) | 340,737 | 252,693 | $ 13,954,882 | $ 7,390,295 |
12. Other.
The Fund's organizational documents provide former and current trustees and officers with a limited indemnification against liabilities arising in connection with the performance of their duties to the Fund. In the normal course of business, the Fund may also enter into contracts that provide general indemnifications. The Fund's maximum exposure under these arrangements is unknown as this would be dependent on future claims that may be made against the Fund. The risk of material loss from such claims is considered remote.
Annual Report
Fidelity Advisor Financial Services Fund - Institutional Class
Performance: The Bottom Line
Average annual total return reflects the change in the value of an investment, assuming reinvestment of the class' distributions from dividend income and capital gains (the profits earned upon the sale of securities that have grown in value, if any) and assuming a constant rate of performance each year. The $10,000 table and the fund's returns do not reflect the deduction of taxes that a shareholder would pay on fund distributions or the redemption of fund shares. During periods of reimbursement by Fidelity, a fund's total return will be greater than it would be had the reimbursement not occurred. How a fund did yesterday is no guarantee of how it will do tomorrow.
Average Annual Total Returns
Periods ended July 31, 2011 | Past 1
year | Past 5
years | Past 10
years |
Institutional Class | -2.56% | -10.55% | -2.18% |
$10,000 Over 10 Years
Let's say hypothetically that $10,000 was invested in Fidelity Advisor Financial Services Fund - Institutional Class on July 31, 2001. The chart shows how the value of your investment would have changed, and also shows how the S&P 500 Index performed over the same period.
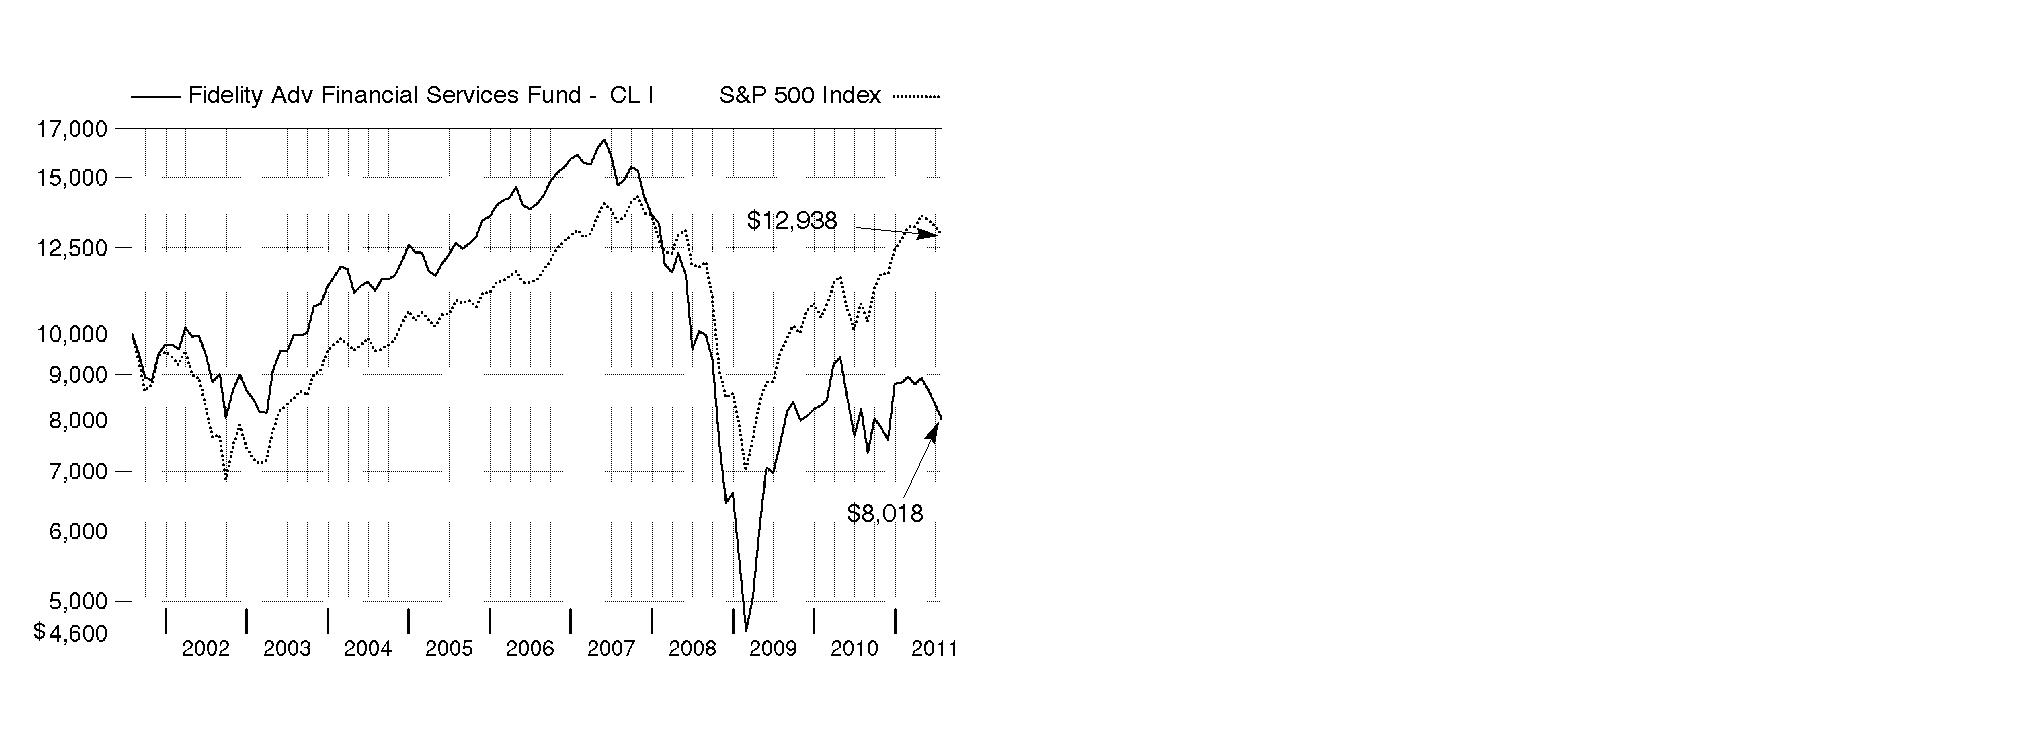
Annual Report
Fidelity Advisor Financial Services Fund
Market Recap: U.S. stocks registered solid double-digit gains for the 12 months ending July 31, 2011, extending a rally that began more than two years earlier. Despite a rough start in August 2010, markets turned positive in September, as increased demand for capital goods and other upbeat indicators trumped investor worry about a U.S. recessionary relapse. The broad market, as measured by the S&P 500® Index, rose 9% that month, its biggest September gain in 71 years. Seven more monthly advances followed, fueled by encouraging corporate earnings and economic activity. However, volatility picked up in the period's latter months, as markets reacted to continued high U.S. unemployment, nagging debt troubles in Europe and looming legislative battles over the federal debt ceiling. May unemployment rose above 9% for the first time in 2011, contributing to a traditional "June swoon" for stocks. Market uncertainty lingered in July, when the S&P 500® posted its second-biggest monthly loss of the period. For the full year, the S&P 500® climbed 19.65%, while the blue-chip-laden Dow Jones Industrial AverageSM rose a comparable 19.09% and the technology-heavy Nasdaq Composite® Index gained 23.40%. On the capitalization spectrum, stocks of mid-cap companies fared best, with the Russell Midcap® Index rising 24.51% and the small-cap Russell 2000® Index adding 23.92%.
Comments from Benjamin Hesse, Portfolio Manager of Fidelity Advisor® Financial Services Fund: For the year, the fund's Class A, Class T, Class B and Class C shares returned -2.80%, -3.00%, -3.57% and -3.50%, respectively (excluding sales charges). These returns lagged the MSCI® U.S. IM Financials 25/50 Index, which rose 4.63%, and the S&P 500. Industry allocations hurt performance relative to the MSCI index, led by sizable overweightings in investment banking/brokerage and regional banks. Overall security selection also hindered performance, especially within regional banks. Individual detractors included Comerica, a large Texas-based diversified bank that was the fund's largest position, on average; Regions Financial, a regional bank serving the Southeast and Texas; and Synovus Financial, a regional bank headquartered in Georgia. All three were pressured by continued low interest rates and slow loan growth. Elsewhere, holdings in life insurer Genworth Financial depreciated due to weakness in the company's mortgage insurance business. On the other hand, strong security selection within data processing/outsourced services and positioning in other diversified financial services aided relative performance. Top individual contributors included out-of-index stakes in credit card processors MasterCard and Visa, which both benefited from fewer consumers defaulting on their credit cards and changes to debit card swipe fees that were less onerous than expected. Within other diversified financial services, underweighting Bank of America aided performance, as low interest rates, mortgage-related problems and concern about the company's capital needs pressured the stock. Some of the names mentioned in this review were sold from the fund before period end.
Comments from Benjamin Hesse, Portfolio Manager of Fidelity Advisor® Financial Services Fund: For the year, the fund's Institutional Class shares returned -2.56%, lagging the MSCI® U.S. IM Financials 25/50 Index, which rose 4.63%, and the S&P 500. Industry allocations hurt performance relative to the MSCI index, led by sizable overweightings in investment banking/brokerage and regional banks. Overall security selection also hindered performance, especially within regional banks. Individual detractors included Comerica, a large Texas-based diversified bank that was the fund's largest position, on average; Regions Financial, a regional bank serving the Southeast and Texas; and Synovus Financial, a regional bank headquartered in Georgia. All three were pressured by continued low interest rates and slow loan growth. Elsewhere, holdings in life insurer Genworth Financial depreciated due to weakness in the company's mortgage insurance business. On the other hand, strong security selection within data processing/outsourced services and positioning in other diversified financial services aided relative performance. Top individual contributors included out-of-index stakes in credit card processors MasterCard and Visa, which both benefited from fewer consumers defaulting on their credit cards and changes to debit card swipe fees that were less onerous than expected. Within other diversified Financial services, underweighting Bank of America aided performance, as low interest rates, mortgage-related problems and concern about the company's capital needs pressured the stock. Some of the names mentioned in this review were sold from the fund before period end.
The views expressed above reflect those of the portfolio manager(s) only through the end of the period as stated on the cover of this report and do not necessarily represent the views of Fidelity or any other person in the Fidelity organization. Any such views are subject to change at any time based upon market or other conditions and Fidelity disclaims any responsibility to update such views. These views may not be relied on as investment advice and, because investment decisions for a Fidelity fund are based on numerous factors, may not be relied on as an indication of trading intent on behalf of any Fidelity fund.
Annual Report
Fidelity Advisor Financial Services Fund
As a shareholder of the Fund, you incur two types of costs: (1) transaction costs, including sales charges (loads) on purchase payments or redemption proceeds, redemption fees, and (2) ongoing costs, including management fees, distribution and/or service (12b-1) fees and other Fund expenses. This Example is intended to help you understand your ongoing costs (in dollars) of investing in the Fund and to compare these costs with the ongoing costs of investing in other mutual funds.
The Example is based on an investment of $1,000 invested at the beginning of the period and held for the entire period (February 1, 2011 to July 31, 2011).
Actual Expenses
The first line of the accompanying table for each class of the Fund provides information about actual account values and actual expenses. You may use the information in this line, together with the amount you invested, to estimate the expenses that you paid over the period. Simply divide your account value by $1,000.00 (for example, an $8,600 account value divided by $1,000.00 = 8.6), then multiply the result by the number in the first line for a class of the Fund under the heading entitled "Expenses Paid During Period" to estimate the expenses you paid on your account during this period. In addition, the Fund, as a shareholder in the underlying Fidelity Central Funds, will indirectly bear its pro-rata share of the fees and expenses incurred by the underlying Fidelity Central Funds. These fees and expenses are not included in the Fund's annualized expense ratio used to calculate the expense estimate in the table below.
Hypothetical Example for Comparison Purposes
The second line of the accompanying table for each class of the Fund provides information about hypothetical account values and hypothetical expenses based on a Class' actual expense ratio and an assumed rate of return of 5% per year before expenses, which is not the Class' actual return. The hypothetical account values and expenses may not be used to estimate the actual ending account balance or expenses you paid for the period. You may use this information to compare the ongoing costs of investing in the Fund and other funds. To do so, compare this 5% hypothetical example with the 5% hypothetical examples that appear in the shareholder reports of the other funds. In addition, the Fund, as a shareholder in the underlying Fidelity Central Funds, will indirectly bear its pro-rata share of the fees and expenses incurred by the underlying Fidelity Central Funds. These fees and expenses are not included in the Fund's annualized expense ratio used to calculate the expense estimate in the table below.
Please note that the expenses shown in the table are meant to highlight your ongoing costs only and do not reflect any transaction costs. Therefore, the second line of the table is useful in comparing ongoing costs only, and will not help you determine the relative total costs of owning different funds. In addition, if these transactional costs were included, your costs would have been higher.
| Annualized
Expense Ratio | Beginning
Account Value
February 1, 2011 | Ending
Account Value
July 31, 2011 | Expenses Paid
During Period*
February 1, 2011 to
July 31, 2011 |
Class A | 1.25% | | | |
Actual | | $ 1,000.00 | $ 908.80 | $ 5.92 |
HypotheticalA | | $ 1,000.00 | $ 1,018.60 | $ 6.26 |
Class T | 1.51% | | | |
Actual | | $ 1,000.00 | $ 908.30 | $ 7.14 |
HypotheticalA | | $ 1,000.00 | $ 1,017.31 | $ 7.55 |
Class B | 2.00% | | | |
Actual | | $ 1,000.00 | $ 906.00 | $ 9.45 |
HypotheticalA | | $ 1,000.00 | $ 1,014.88 | $ 9.99 |
Class C | 2.00% | | | |
Actual | | $ 1,000.00 | $ 906.10 | $ 9.45 |
HypotheticalA | | $ 1,000.00 | $ 1,014.88 | $ 9.99 |
Institutional Class | .94% | | | |
Actual | | $ 1,000.00 | $ 910.50 | $ 4.45 |
HypotheticalA | | $ 1,000.00 | $ 1,020.13 | $ 4.71 |
A 5% return per year before expenses
* Expenses are equal to each Class' annualized expense ratio, multiplied by the average account value over the period, multiplied by 181/365 (to reflect the one-half year period).
Annual Report
Fidelity Advisor Financial Services Fund
Investment Changes (Unaudited)
Top Ten Stocks as of July 31, 2011 |
| % of fund's
net assets | % of fund's net assets
6 months ago |
SLM Corp. | 6.2 | 2.3 |
Citigroup, Inc. | 5.4 | 5.1 |
Morgan Stanley | 4.9 | 4.8 |
CIT Group, Inc. | 4.7 | 2.1 |
JPMorgan Chase & Co. | 4.1 | 4.5 |
MasterCard, Inc. Class A | 4.0 | 4.2 |
E*TRADE Financial Corp. | 3.9 | 2.1 |
Franklin Resources, Inc. | 3.5 | 3.6 |
Invesco Ltd. | 3.3 | 0.5 |
Lazard Ltd. Class A | 2.6 | 0.0 |
| 42.6 | |
Top Industries (% of fund's net assets) |
As of July 31, 2011 |
| Capital Markets | 28.3% | |
| Commercial Banks | 15.3% | |
| Real Estate Investment Trusts | 12.5% | |
| Diversified Financial Services | 11.6% | |
| Insurance | 10.6% | |
| All Others* | 21.7% | |

As of January 31, 2011 |
| Commercial Banks | 35.9% | |
| Capital Markets | 22.9% | |
| Diversified Financial Services | 16.1% | |
| IT Services | 15.0% | |
| Consumer Finance | 3.4% | |
| All Others* | 6.7% | |

* Includes short-term investments and net other assets. |
Annual Report
Fidelity Advisor Financial Services Fund
Investments July 31, 2011
Showing Percentage of Net Assets
Common Stocks - 98.3% |
| Shares | | Value |
CAPITAL MARKETS - 28.3% |
Asset Management & Custody Banks - 10.7% |
Affiliated Managers Group, Inc. (a) | 3,086 | | $ 321,962 |
Ameriprise Financial, Inc. | 100 | | 5,410 |
Apollo Global Management LLC Class A | 58,513 | | 1,012,860 |
Bank of New York Mellon Corp. | 500 | | 12,555 |
BlackRock, Inc. Class A | 11,249 | | 2,007,497 |
Franklin Resources, Inc. | 35,518 | | 4,509,365 |
Invesco Ltd. | 190,500 | | 4,225,290 |
Legg Mason, Inc. | 853 | | 25,095 |
Northern Trust Corp. | 7,507 | | 337,102 |
State Street Corp. | 31,300 | | 1,298,011 |
The Blackstone Group LP | 7,500 | | 124,575 |
| | 13,879,722 |
Diversified Capital Markets - 0.0% |
HFF, Inc. (a) | 1,000 | | 15,100 |
Investment Banking & Brokerage - 17.6% |
Charles Schwab Corp. | 43,200 | | 644,976 |
E*TRADE Financial Corp. (a) | 317,492 | | 5,041,773 |
Evercore Partners, Inc. Class A | 67,900 | | 1,930,397 |
GFI Group, Inc. | 419,178 | | 1,903,068 |
Goldman Sachs Group, Inc. | 4,971 | | 670,936 |
Investment Technology Group, Inc. (a) | 9,100 | | 110,747 |
Jefferies Group, Inc. | 32,466 | | 613,932 |
Lazard Ltd. Class A | 100,816 | | 3,387,418 |
Macquarie Group Ltd. | 393 | | 11,904 |
MF Global Holdings Ltd. (a) | 297,625 | | 2,193,496 |
Morgan Stanley | 286,496 | | 6,374,536 |
| | 22,883,183 |
TOTAL CAPITAL MARKETS | | 36,778,005 |
COMMERCIAL BANKS - 15.3% |
Diversified Banks - 3.8% |
Banco ABC Brasil SA | 500 | | 3,304 |
Banco Bradesco SA (PN) sponsored ADR | 700 | | 13,461 |
Banco Macro SA sponsored ADR | 400 | | 13,864 |
Banco Pine SA | 200 | | 1,334 |
Banco Santander (Brasil) SA ADR | 35,700 | | 331,296 |
BanColombia SA sponsored ADR (d) | 2,000 | | 132,600 |
Bank of Baroda | 3,531 | | 70,325 |
Barclays PLC sponsored ADR | 1,700 | | 24,752 |
Comerica, Inc. | 20,033 | | 641,657 |
CorpBanca SA sponsored ADR (d) | 1,050 | | 23,100 |
Credicorp Ltd. (NY Shares) | 28 | | 2,736 |
Credit Agricole SA | 200 | | 2,477 |
Grupo Financiero Galicia SA sponsored ADR | 1,100 | | 15,653 |
Guaranty Trust Bank PLC GDR (Reg. S) | 5,300 | | 21,995 |
HSBC Holdings PLC sponsored ADR | 600 | | 29,322 |
Industrial & Commercial Bank of China Ltd. (H Shares) | 1,836,000 | | 1,396,941 |
National Australia Bank Ltd. | 254 | | 6,697 |
|
| Shares | | Value |
Raiffeisen International Bank-Holding AG | 1,300 | | $ 65,255 |
Standard Chartered PLC (United Kingdom) | 535 | | 13,683 |
Sumitomo Mitsui Financial Group, Inc. | 2,100 | | 66,081 |
The Jammu & Kashmir Bank Ltd. | 7,298 | | 143,121 |
U.S. Bancorp | 12,727 | | 331,666 |
UniCredit SpA | 2,100 | | 3,772 |
United Overseas Bank Ltd. | 68,000 | | 1,154,840 |
Wells Fargo & Co. | 18,245 | | 509,765 |
| | 5,019,697 |
Regional Banks - 11.5% |
Banco Daycoval SA (PN) | 28,200 | | 166,706 |
Bancorp New Jersey, Inc. | 100 | | 930 |
BancTrust Financial Group, Inc. (a) | 28,700 | | 68,019 |
Bank of the Ozarks, Inc. | 1,208 | | 62,756 |
BB&T Corp. | 100 | | 2,568 |
Boston Private Financial Holdings, Inc. | 2,200 | | 15,246 |
Bridge Capital Holdings (a) | 48,490 | | 544,058 |
Canadian Western Bank, Edmonton | 2,200 | | 70,117 |
Cape Bancorp, Inc. (a) | 1,400 | | 13,174 |
Cascade Bancorp (a)(d) | 900 | | 9,180 |
CIT Group, Inc. (a) | 152,862 | | 6,074,736 |
Citizens & Northern Corp. | 520 | | 8,559 |
City Holding Co. | 500 | | 15,635 |
City National Corp. | 300 | | 16,104 |
CNB Financial Corp., Pennsylvania | 803 | | 11,089 |
CoBiz, Inc. | 180,800 | | 1,111,920 |
Cullen/Frost Bankers, Inc. | 100 | | 5,388 |
Fifth Third Bancorp | 43,500 | | 550,275 |
First Business Finance Services, Inc. | 200 | | 2,802 |
First Commonwealth Financial Corp. | 25,722 | | 132,211 |
First Horizon National Corp. | 1,400 | | 12,586 |
First Interstate Bancsystem, Inc. | 61,164 | | 818,374 |
First Midwest Bancorp, Inc., Delaware | 600 | | 7,152 |
FNB Corp., Pennsylvania | 11,300 | | 113,000 |
Glacier Bancorp, Inc. | 15,124 | | 198,729 |
Huntington Bancshares, Inc. | 223,630 | | 1,351,843 |
KeyCorp | 3,400 | | 27,336 |
NBT Bancorp, Inc. | 200 | | 4,408 |
Northrim Bancorp, Inc. | 2,269 | | 44,790 |
Pacific Continental Corp. | 3,000 | | 29,520 |
PNC Financial Services Group, Inc. | 3,500 | | 190,015 |
PT Bank Tabungan Negara Tbk | 1,468,500 | | 293,700 |
Regions Financial Corp. | 469 | | 2,856 |
Sandy Spring Bancorp, Inc. | 200 | | 3,574 |
Savannah Bancorp, Inc. (a) | 100 | | 740 |
SunTrust Banks, Inc. | 500 | | 12,245 |
Susquehanna Bancshares, Inc. | 67,014 | | 504,615 |
SVB Financial Group (a) | 2,712 | | 165,486 |
Synovus Financial Corp. (d) | 278,982 | | 510,537 |
TCF Financial Corp. | 50,837 | | 646,647 |
Texas Capital Bancshares, Inc. (a) | 600 | | 16,398 |
Umpqua Holdings Corp. | 100 | | 1,136 |
Common Stocks - continued |
| Shares | | Value |
COMMERCIAL BANKS - CONTINUED |
Regional Banks - continued |
Valley National Bancorp (d) | 4,908 | | $ 64,540 |
Virginia Commerce Bancorp, Inc. (a) | 600 | | 3,822 |
Washington Trust Bancorp, Inc. | 344 | | 7,836 |
Webster Financial Corp. | 26,200 | | 535,004 |
Westamerica Bancorp. | 100 | | 4,693 |
Western Alliance Bancorp. (a) | 29,100 | | 204,573 |
Zions Bancorporation | 11,800 | | 258,420 |
| | 14,916,048 |
TOTAL COMMERCIAL BANKS | | 19,935,745 |
COMMERCIAL SERVICES & SUPPLIES - 0.0% |
Diversified Support Services - 0.0% |
Intrum Justitia AB | 1,000 | | 15,536 |
CONSUMER FINANCE - 7.4% |
Consumer Finance - 7.4% |
Advance America Cash Advance Centers, Inc. | 81,507 | | 574,624 |
American Express Co. | 6,451 | | 322,808 |
Capital One Financial Corp. | 300 | | 14,340 |
EZCORP, Inc. (non-vtg.) Class A (a) | 5,400 | | 179,712 |
First Cash Financial Services, Inc. (a) | 1,590 | | 68,799 |
Green Dot Corp. Class A | 10,000 | | 324,300 |
Nelnet, Inc. Class A | 700 | | 14,112 |
Netspend Holdings, Inc. | 5,031 | | 39,695 |
PT Clipan Finance Indonesia Tbk | 338,000 | | 30,619 |
SLM Corp. | 513,969 | | 8,012,777 |
| | 9,581,786 |
DIVERSIFIED CONSUMER SERVICES - 0.2% |
Specialized Consumer Services - 0.2% |
Sotheby's Class A (Ltd. vtg.) | 7,600 | | 321,860 |
DIVERSIFIED FINANCIAL SERVICES - 11.6% |
Other Diversified Financial Services - 9.5% |
Bank of America Corp. | 6,668 | | 64,746 |
Citigroup, Inc. | 184,209 | | 7,062,573 |
JPMorgan Chase & Co. | 130,133 | | 5,263,880 |
| | 12,391,199 |
Specialized Finance - 2.1% |
CME Group, Inc. | 100 | | 28,919 |
IntercontinentalExchange, Inc. (a) | 584 | | 72,007 |
Moody's Corp. | 200 | | 7,122 |
PHH Corp. (a) | 139,143 | | 2,610,323 |
| | 2,718,371 |
TOTAL DIVERSIFIED FINANCIAL SERVICES | | 15,109,570 |
|
| Shares | | Value |
HOTELS, RESTAURANTS & LEISURE - 0.2% |
Hotels, Resorts & Cruise Lines - 0.2% |
Starwood Hotels & Resorts Worldwide, Inc. | 4,700 | | $ 258,312 |
INDUSTRIAL CONGLOMERATES - 0.8% |
Industrial Conglomerates - 0.8% |
Keppel Corp. Ltd. | 115,000 | | 1,057,219 |
INSURANCE - 10.6% |
Life & Health Insurance - 3.1% |
AFLAC, Inc. | 21,300 | | 981,078 |
Citizens, Inc. Class A (a) | 2,100 | | 14,448 |
CNO Financial Group, Inc. (a) | 1,900 | | 13,965 |
Delphi Financial Group, Inc. Class A | 500 | | 13,460 |
FBL Financial Group, Inc. Class A | 400 | | 12,592 |
Lincoln National Corp. | 500 | | 13,250 |
MetLife, Inc. | 49,247 | | 2,029,469 |
Phoenix Companies, Inc. (a) | 5,700 | | 13,680 |
Ping An Insurance Group Co. China Ltd. (H Shares) | 1,500 | | 14,598 |
Prudential Financial, Inc. | 11,200 | | 657,216 |
Resolution Ltd. | 52,100 | | 236,227 |
StanCorp Financial Group, Inc. | 300 | | 9,978 |
Symetra Financial Corp. | 1,100 | | 13,816 |
Torchmark Corp. | 300 | | 12,117 |
Unum Group | 600 | | 14,634 |
| | 4,050,528 |
Multi-Line Insurance - 0.9% |
American International Group, Inc. (a) | 200 | | 5,740 |
Genworth Financial, Inc. Class A (a) | 41,500 | | 345,280 |
Hartford Financial Services Group, Inc. | 26,600 | | 622,972 |
Loews Corp. | 3,200 | | 127,584 |
| | 1,101,576 |
Property & Casualty Insurance - 5.1% |
ACE Ltd. | 20,500 | | 1,373,090 |
Allstate Corp. | 500 | | 13,860 |
Assured Guaranty Ltd. | 500 | | 7,075 |
Axis Capital Holdings Ltd. | 37,600 | | 1,198,312 |
Berkshire Hathaway, Inc. Class B (a) | 8,900 | | 660,113 |
Fidelity National Financial, Inc. Class A | 900 | | 14,670 |
The Travelers Companies, Inc. | 100 | | 5,513 |
W.R. Berkley Corp. | 4,200 | | 129,318 |
XL Group PLC Class A | 154,172 | | 3,163,609 |
| | 6,565,560 |
Reinsurance - 1.5% |
Arch Capital Group Ltd. (a) | 10,200 | | 344,760 |
Montpelier Re Holdings Ltd. | 700 | | 12,082 |
Platinum Underwriters Holdings Ltd. | 9,300 | | 319,455 |
Validus Holdings Ltd. | 49,500 | | 1,316,205 |
| | 1,992,502 |
TOTAL INSURANCE | | 13,710,166 |
Common Stocks - continued |
| Shares | | Value |
INTERNET SOFTWARE & SERVICES - 0.2% |
Internet Software & Services - 0.2% |
China Finance Online Co. Ltd. ADR (a)(d) | 66,785 | | $ 213,712 |
IT SERVICES - 9.0% |
Data Processing & Outsourced Services - 7.6% |
Alliance Data Systems Corp. (a) | 100 | | 9,834 |
Cielo SA | 10,100 | | 280,628 |
Fiserv, Inc. (a) | 31,928 | | 1,927,174 |
MasterCard, Inc. Class A | 17,181 | | 5,210,138 |
Redecard SA | 122,700 | | 2,111,971 |
The Western Union Co. | 1,400 | | 27,174 |
VeriFone Systems, Inc. (a) | 8,405 | | 330,905 |
| | 9,897,824 |
IT Consulting & Other Services - 1.4% |
Accenture PLC Class A | 8,800 | | 520,432 |
Cognizant Technology Solutions Corp. Class A (a) | 18,400 | | 1,285,608 |
| | 1,806,040 |
TOTAL IT SERVICES | | 11,703,864 |
PROFESSIONAL SERVICES - 0.8% |
Research & Consulting Services - 0.8% |
Equifax, Inc. | 29,685 | | 1,019,977 |
REAL ESTATE INVESTMENT TRUSTS - 12.5% |
Diversified REITs - 0.1% |
American Assets Trust, Inc. | 6,100 | | 134,139 |
Vornado Realty Trust | 700 | | 65,485 |
| | 199,624 |
Industrial REITs - 0.2% |
DCT Industrial Trust, Inc. | 39,100 | | 211,922 |
Mortgage REITs - 3.4% |
American Capital Agency Corp. | 93,103 | | 2,599,436 |
Annaly Capital Management, Inc. | 108,100 | | 1,813,918 |
| | 4,413,354 |
Office REITs - 1.9% |
Corporate Office Properties Trust (SBI) | 400 | | 12,428 |
Douglas Emmett, Inc. | 1,400 | | 28,000 |
Highwoods Properties, Inc. (SBI) | 23,700 | | 815,991 |
Lexington Corporate Properties Trust (d) | 185,200 | | 1,555,680 |
MPG Office Trust, Inc. (a) | 5,300 | | 17,543 |
| | 2,429,642 |
Residential REITs - 2.9% |
American Campus Communities, Inc. | 3,800 | | 141,436 |
Apartment Investment & Management Co. Class A | 52,141 | | 1,423,449 |
AvalonBay Communities, Inc. | 1,000 | | 134,190 |
Camden Property Trust (SBI) | 10,500 | | 704,235 |
Campus Crest Communities, Inc. | 1,100 | | 13,178 |
Essex Property Trust, Inc. | 200 | | 28,072 |
|
| Shares | | Value |
Home Properties, Inc. | 2,200 | | $ 144,144 |
Post Properties, Inc. | 3,300 | | 139,920 |
UDR, Inc. | 38,000 | | 999,780 |
| | 3,728,404 |
Retail REITs - 0.2% |
Federal Realty Investment Trust (SBI) | 1,600 | | 139,744 |
Kimco Realty Corp. | 7,300 | | 138,919 |
Simon Property Group, Inc. | 100 | | 12,051 |
| | 290,714 |
Specialized REITs - 3.8% |
HCP, Inc. | 36,800 | | 1,351,664 |
Host Hotels & Resorts, Inc. | 900 | | 14,265 |
Public Storage | 19,746 | | 2,362,214 |
Strategic Hotel & Resorts, Inc. (a) | 72,657 | | 494,068 |
Sunstone Hotel Investors, Inc. (a) | 14,000 | | 124,740 |
U-Store-It Trust | 12,800 | | 136,320 |
Ventas, Inc. | 3,135 | | 169,698 |
Weyerhaeuser Co. | 13,400 | | 267,866 |
| | 4,920,835 |
TOTAL REAL ESTATE INVESTMENT TRUSTS | | 16,194,495 |
REAL ESTATE MANAGEMENT & DEVELOPMENT - 1.1% |
Diversified Real Estate Activities - 0.0% |
The St. Joe Co. (a) | 100 | | 1,771 |
Real Estate Operating Companies - 0.4% |
Castellum AB | 30,200 | | 438,227 |
Thomas Properties Group, Inc. (a) | 2,262 | | 7,352 |
| | 445,579 |
Real Estate Services - 0.7% |
CB Richard Ellis Group, Inc. Class A (a) | 42,521 | | 926,958 |
TOTAL REAL ESTATE MANAGEMENT & DEVELOPMENT | | 1,374,308 |
SOFTWARE - 0.0% |
Application Software - 0.0% |
Fair Isaac Corp. | 100 | | 2,975 |
SPECIALTY RETAIL - 0.2% |
Home Improvement Retail - 0.2% |
Home Depot, Inc. | 6,600 | | 230,538 |
THRIFTS & MORTGAGE FINANCE - 0.1% |
Thrifts & Mortgage Finance - 0.1% |
Brookline Bancorp, Inc., Delaware | 800 | | 6,840 |
Carver Bancorp, Inc. | 100 | | 56 |
Cheviot Financial Corp. | 8,880 | | 74,059 |
Hudson City Bancorp, Inc. | 800 | | 6,600 |
People's United Financial, Inc. | 1,100 | | 13,948 |
| | 101,503 |
Common Stocks - continued |
| Shares | | Value |
WIRELESS TELECOMMUNICATION SERVICES - 0.0% |
Wireless Telecommunication Services - 0.0% |
American Tower Corp. Class A (a) | 300 | | $ 15,759 |
TOTAL COMMON STOCKS (Cost $134,804,120) | 127,625,330 |
Money Market Funds - 6.0% |
| | | |
Fidelity Cash Central Fund, 0.14% (b) | 5,386,376 | | 5,386,376 |
Fidelity Securities Lending Cash Central Fund, 0.15% (b)(c) | 2,376,248 | | 2,376,248 |
TOTAL MONEY MARKET FUNDS (Cost $7,762,624) | 7,762,624 |
TOTAL INVESTMENT PORTFOLIO - 104.3% (Cost $142,566,744) | | 135,387,954 |
NET OTHER ASSETS (LIABILITIES) - (4.3)% | | (5,576,275) |
NET ASSETS - 100% | $ 129,811,679 |
Legend |
(a) Non-income producing |
(b) Affiliated fund that is available only to investment companies and other accounts managed by Fidelity Investments. The rate quoted is the annualized seven-day yield of the fund at period end. A complete unaudited listing of the fund's holdings as of its most recent quarter end is available upon request. In addition, each Fidelity Central Fund's financial statements, which are not covered by the Fund's Report of Independent Registered Public Accounting Firm, are available on the SEC's website or upon request. |
(c) Investment made with cash collateral received from securities on loan. |
(d) Security or a portion of the security is on loan at period end. |
Affiliated Central Funds |
Information regarding fiscal year to date income earned by the Fund from investments in Fidelity Central Funds is as follows: |
Fund | Income earned |
Fidelity Cash Central Fund | $ 3,845 |
Fidelity Securities Lending Cash Central Fund | 25,052 |
Total | $ 28,897 |
Other Information |
The following is a summary of the inputs used, as of July 31, 2011, involving the Fund's assets and liabilities carried at fair value. The inputs or methodology used for valuing securities may not be an indication of the risk associated with investing in those securities. For more information on valuation inputs, and their aggregation into the levels used in the table below, please refer to the Security Valuation section in the accompanying Notes to Financial Statements. |
Valuation Inputs at Reporting Date: |
Description | Total | Level 1 | Level 2 | Level 3 |
Investments in Securities: | | | | |
Common Stocks | $ 127,625,330 | $ 127,488,924 | $ 136,406 | $ - |
Money Market Funds | 7,762,624 | 7,762,624 | - | - |
Total Investments in Securities: | $ 135,387,954 | $ 135,251,548 | $ 136,406 | $ - |
Distribution of investments by country of issue, as a percentage of total net assets, is as follows: (Unaudited) |
United States of America | 81.3% |
Bermuda | 8.3% |
Ireland | 2.9% |
Brazil | 2.2% |
Singapore | 1.7% |
China | 1.3% |
Switzerland | 1.1% |
Others (Individually Less Than 1%) | 1.2% |
| 100.0% |
Income Tax Information |
At July 31, 2011, the Fund had a capital loss carryforward of approximately $79,374,743 of which $55,672,202, $23,251,884 and $450,657 will expire in fiscal 2017, 2018 and 2019, respectively. Capital loss carryforwards are only available to offset future capital gains of the Fund to the extent provided by regulations and may be limited. |
The Fund intends to elect to defer to its fiscal year ending July 31, 2012 approximately $2,786,796 of losses recognized during the period November 1, 2010, to July 31, 2011. |
See accompanying notes which are an integral part of the financial statements.
Annual Report
Fidelity Advisor Financial Services Fund
Statement of Assets and Liabilities
| July 31, 2011 |
| | |
Assets | | |
Investment in securities, at value (including securities loaned of $2,260,403) - See accompanying schedule: Unaffiliated issuers (cost $134,804,120) | $ 127,625,330 | |
Fidelity Central Funds (cost $7,762,624) | 7,762,624 | |
Total Investments (cost $142,566,744) | | $ 135,387,954 |
Receivable for investments sold | | 9,766,519 |
Receivable for fund shares sold | | 171,966 |
Dividends receivable | | 105,235 |
Distributions receivable from Fidelity Central Funds | | 1,937 |
Other receivables | | 33,601 |
Total assets | | 145,467,212 |
| | |
Liabilities | | |
Payable for investments purchased | $ 12,349,827 | |
Payable for fund shares redeemed | 735,040 | |
Accrued management fee | 62,472 | |
Distribution and service plan fees payable | 51,880 | |
Other affiliated payables | 38,206 | |
Other payables and accrued expenses | 41,860 | |
Collateral on securities loaned, at value | 2,376,248 | |
Total liabilities | | 15,655,533 |
| | |
Net Assets | | $ 129,811,679 |
Net Assets consist of: | | |
Paid in capital | | $ 220,860,111 |
Accumulated net investment loss | | (116,048) |
Accumulated undistributed net realized gain (loss) on investments and foreign currency transactions | | (83,753,065) |
Net unrealized appreciation (depreciation) on investments and assets and liabilities in foreign currencies | | (7,179,319) |
Net Assets | | $ 129,811,679 |
Statement of Assets and Liabilities - continued
| July 31, 2011 |
| | |
Calculation of Maximum Offering Price Class A:
Net Asset Value and redemption price per share ($63,937,051 ÷ 6,352,907 shares) | | $ 10.06 |
| | |
Maximum offering price per share (100/94.25 of $10.06) | | $ 10.67 |
Class T:
Net Asset Value and redemption price per share ($27,037,118 ÷ 2,700,700 shares) | | $ 10.01 |
| | |
Maximum offering price per share (100/96.50 of $10.01) | | $ 10.37 |
Class B:
Net Asset Value and offering price per share ($7,479,552 ÷ 768,438 shares)A | | $ 9.73 |
| | |
Class C:
Net Asset Value and offering price per share ($23,195,919 ÷ 2,404,480 shares)A | | $ 9.65 |
| | |
Institutional Class:
Net Asset Value, offering price and redemption price per share ($8,162,039 ÷ 793,803 shares) | | $ 10.28 |
A Redemption price per share is equal to net asset value less any applicable contingent deferred sales charge.
See accompanying notes which are an integral part of the financial statements.
Annual Report
Statement of Operations
| Year ended July 31, 2011 |
| | |
Investment Income | | |
Dividends | | $ 1,400,049 |
Interest | | 1 |
Income from Fidelity Central Funds | | 28,897 |
Total income | | 1,428,947 |
| | |
Expenses | | |
Management fee | $ 814,992 | |
Transfer agent fees | 439,873 | |
Distribution and service plan fees | 705,505 | |
Accounting and security lending fees | 59,225 | |
Custodian fees and expenses | 39,068 | |
Independent trustees' compensation | 859 | |
Registration fees | 67,268 | |
Audit | 50,338 | |
Legal | 921 | |
Miscellaneous | 1,475 | |
Total expenses before reductions | 2,179,524 | |
Expense reductions | (68,182) | 2,111,342 |
Net investment income (loss) | | (682,395) |
Realized and Unrealized Gain (Loss) Net realized gain (loss) on: | | |
Investment securities: | | |
Unaffiliated issuers (net of foreign taxes of $43) | (792,828) | |
Investment not meeting investment restrictions | 350 | |
Foreign currency transactions | (149,732) | |
Total net realized gain (loss) | | (942,210) |
Change in net unrealized appreciation (depreciation) on: Investment securities | (2,517,330) | |
Assets and liabilities in foreign currencies | (1,509) | |
Total change in net unrealized appreciation (depreciation) | | (2,518,839) |
Net gain (loss) | | (3,461,049) |
Net increase (decrease) in net assets resulting from operations | | $ (4,143,444) |
Statement of Changes in Net Assets
| Year ended
July 31,
2011 | Year ended
July 31,
2010 |
Increase (Decrease) in Net Assets | | |
Operations | | |
Net investment income (loss) | $ (682,395) | $ (567,469) |
Net realized gain (loss) | (942,210) | 36,190,039 |
Change in net unrealized appreciation (depreciation) | (2,518,839) | (22,169,228) |
Net increase (decrease) in net assets resulting from operations | (4,143,444) | 13,453,342 |
Distributions to shareholders from net investment income | - | (1,313,190) |
Share transactions - net increase (decrease) | (16,036,954) | (11,450,926) |
Redemption fees | 4,715 | 4,230 |
Total increase (decrease) in net assets | (20,175,683) | 693,456 |
| | |
Net Assets | | |
Beginning of period | 149,987,362 | 149,293,906 |
End of period (including accumulated net investment loss of $116,048 and undistributed net investment income of $0, respectively). | $ 129,811,679 | $ 149,987,362 |
See accompanying notes which are an integral part of the financial statements.
Annual Report
Financial Highlights - Class A
Years ended July 31, | 2011 | 2010 | 2009 | 2008 | 2007 |
Selected Per-Share Data | | | | | |
Net asset value, beginning of period | $ 10.35 | $ 9.53 | $ 13.18 | $ 21.02 | $ 23.34 |
Income from Investment Operations | | | | | |
Net investment income (loss) C | (.02) | (.01) | .19 | .30 | .23 |
Net realized and unrealized gain (loss) | (.27) | .93 | (3.58) | (6.41) | .92 |
Total from investment operations | (.29) | .92 | (3.39) | (6.11) | 1.15 |
Distributions from net investment income | - | (.10) | (.24) | (.27) | (.22) |
Distributions from net realized gain | - | - | (.02) | (1.46) | (3.25) |
Total distributions | - | (.10) | (.26) | (1.73) | (3.47) H |
Redemption fees added to paid in capital C, G | - | - | - | - | - |
Net asset value, end of period | $ 10.06 | $ 10.35 | $ 9.53 | $ 13.18 | $ 21.02 |
Total Return A, B | (2.80)% | 9.61% | (25.87)% | (31.67)% | 4.54% |
Ratios to Average Net Assets D, F | | | | | |
Expenses before reductions | 1.26% | 1.27% | 1.29% | 1.21% | 1.23% |
Expenses net of fee waivers, if any | 1.26% | 1.27% | 1.29% | 1.21% | 1.23% |
Expenses net of all reductions | 1.21% | 1.22% | 1.28% | 1.21% | 1.22% |
Net investment income (loss) | (.24)% | (.09)% | 2.12% | 1.75% | 1.01% |
Supplemental Data | | | | | |
Net assets, end of period (000 omitted) | $ 63,937 | $ 69,723 | $ 68,245 | $ 90,037 | $ 106,722 |
Portfolio turnover rate E | 260% | 254% | 269% | 48% | 53% |
A Total returns would have been lower if certain expenses had not been reduced during the applicable periods shown.
B Total returns do not include the effect of the sales charges.
C Calculated based on average shares outstanding during the period.
D Fees and expenses of any underlying Fidelity Central Funds are not included in the Fund's expense ratio. The Fund indirectly bears its proportionate share of the expenses of any underlying Fidelity Central Funds.
E Amount does not include the portfolio activity of any underlying Fidelity Central Funds.
F Expense ratios reflect operating expenses of the class. Expenses before reductions do not reflect amounts reimbursed by the investment adviser or reductions from brokerage service arrangements or reductions from other expense offset arrangements and do not represent the amount paid by the class during periods when reimbursements or reductions occur. Expenses net of fee waivers reflect expenses after reimbursement by the investment adviser but prior to reductions from brokerage service arrangements or other expense offset arrangements. Expenses net of all reductions represent the net expenses paid by the class.
G Amount represents less than $.01 per share.
H Total distributions of $3.47 per share is comprised of distributions from net investment income of $.223 and distributions from net realized gain of $3.250 per share.
Financial Highlights - Class T
Years ended July 31, | 2011 | 2010 | 2009 | 2008 | 2007 |
Selected Per-Share Data | | | | | |
Net asset value, beginning of period | $ 10.32 | $ 9.52 | $ 13.14 | $ 20.94 | $ 23.26 |
Income from Investment Operations | | | | | |
Net investment income (loss) C | (.05) | (.04) | .16 | .26 | .18 |
Net realized and unrealized gain (loss) | (.26) | .92 | (3.56) | (6.41) | .91 |
Total from investment operations | (.31) | .88 | (3.40) | (6.15) | 1.09 |
Distributions from net investment income | - | (.08) | (.20) | (.19) | (.16) |
Distributions from net realized gain | - | - | (.02) | (1.46) | (3.25) |
Total distributions | - | (.08) | (.22) | (1.65) | (3.41) H |
Redemption fees added to paid in capital C, G | - | - | - | - | - |
Net asset value, end of period | $ 10.01 | $ 10.32 | $ 9.52 | $ 13.14 | $ 20.94 |
Total Return A, B | (3.00)% | 9.26% | (26.00)% | (31.85)% | 4.25% |
Ratios to Average Net Assets D, F | | | | | |
Expenses before reductions | 1.52% | 1.53% | 1.55% | 1.47% | 1.46% |
Expenses net of fee waivers, if any | 1.52% | 1.53% | 1.55% | 1.47% | 1.46% |
Expenses net of all reductions | 1.47% | 1.47% | 1.54% | 1.47% | 1.46% |
Net investment income (loss) | (.49)% | (.35)% | 1.86% | 1.50% | .77% |
Supplemental Data | | | | | |
Net assets, end of period (000 omitted) | $ 27,037 | $ 33,310 | $ 34,927 | $ 53,526 | $ 95,426 |
Portfolio turnover rate E | 260% | 254% | 269% | 48% | 53% |
A Total returns would have been lower if certain expenses had not been reduced during the applicable periods shown.
B Total returns do not include the effect of the sales charges.
C Calculated based on average shares outstanding during the period.
D Fees and expenses of any underlying Fidelity Central Funds are not included in the Fund's expense ratio. The Fund indirectly bears its proportionate share of the expenses of any underlying Fidelity Central Funds.
E Amount does not include the portfolio activity of any underlying Fidelity Central Funds.
F Expense ratios reflect operating expenses of the class. Expenses before reductions do not reflect amounts reimbursed by the investment adviser or reductions from brokerage service arrangements or reductions from other expense offset arrangements and do not represent the amount paid by the class during periods when reimbursements or reductions occur. Expenses net of fee waivers reflect expenses after reimbursement by the investment adviser but prior to reductions from brokerage service arrangements or other expense offset arrangements. Expenses net of all reductions represent the net expenses paid by the class.
G Amount represents less than $.01 per share.
H Total distributions of $3.41 per share is comprised of distributions from net investment income of $.156 and distributions from net realized gain of $3.250 per share.
See accompanying notes which are an integral part of the financial statements.
Annual Report
Financial Highlights - Class B
Years ended July 31, | 2011 | 2010 | 2009 | 2008 | 2007 |
Selected Per-Share Data | | | | | |
Net asset value, beginning of period | $ 10.09 | $ 9.33 | $ 12.85 | $ 20.44 | $ 22.75 |
Income from Investment Operations | | | | | |
Net investment income (loss) C | (.10) | (.09) | .12 | .18 | .06 |
Net realized and unrealized gain (loss) | (.26) | .91 | (3.50) | (6.29) | .89 |
Total from investment operations | (.36) | .82 | (3.38) | (6.11) | .95 |
Distributions from net investment income | - | (.06) | (.12) | (.04) | (.02) |
Distributions from net realized gain | - | - | (.02) | (1.44) | (3.25) |
Total distributions | - | (.06) | (.14) | (1.48) | (3.26) H |
Redemption fees added to paid in capital C, G | - | - | - | - | - |
Net asset value, end of period | $ 9.73 | $ 10.09 | $ 9.33 | $ 12.85 | $ 20.44 |
Total Return A, B | (3.57)% | 8.78% | (26.35)% | (32.21)% | 3.71% |
Ratios to Average Net Assets D, F | | | | | |
Expenses before reductions | 2.01% | 2.02% | 2.04% | 1.96% | 1.98% |
Expenses net of fee waivers, if any | 2.01% | 2.02% | 2.04% | 1.96% | 1.98% |
Expenses net of all reductions | 1.96% | 1.97% | 2.03% | 1.96% | 1.98% |
Net investment income (loss) | (.98)% | (.85)% | 1.38% | 1.01% | .25% |
Supplemental Data | | | | | |
Net assets, end of period (000 omitted) | $ 7,480 | $ 10,992 | $ 12,477 | $ 20,420 | $ 64,837 |
Portfolio turnover rate E | 260% | 254% | 269% | 48% | 53% |
A Total returns would have been lower if certain expenses had not been reduced during the applicable periods shown.
B Total returns do not include the effect of the contingent deferred sales charge.
C Calculated based on average shares outstanding during the period.
D Fees and expenses of any underlying Fidelity Central Funds are not included in the Fund's expense ratio. The Fund indirectly bears its proportionate share of the expenses of any underlying Fidelity Central Funds.
E Amount does not include the portfolio activity of any underlying Fidelity Central Funds.
F Expense ratios reflect operating expenses of the class. Expenses before reductions do not reflect amounts reimbursed by the investment adviser or reductions from brokerage service arrangements or reductions from other expense offset arrangements and do not represent the amount paid by the class during periods when reimbursements or reductions occur. Expenses net of fee waivers reflect expenses after reimbursement by the investment adviser but prior to reductions from brokerage service arrangements or other expense offset arrangements. Expenses net of all reductions represent the net expenses paid by the class.
G Amount represents less than $.01 per share.
H Total distributions of $3.26 per share is comprised of distributions from net investment income of $.015 and distributions from net realized gain of $3.247 per share.
Financial Highlights - Class C
Years ended July 31, | 2011 | 2010 | 2009 | 2008 | 2007 |
Selected Per-Share Data | | | | | |
Net asset value, beginning of period | $ 10.00 | $ 9.25 | $ 12.78 | $ 20.40 | $ 22.74 |
Income from Investment Operations | | | | | |
Net investment income (loss) C | (.10) | (.09) | .12 | .17 | .06 |
Net realized and unrealized gain (loss) | (.25) | .90 | (3.48) | (6.24) | .90 |
Total from investment operations | (.35) | .81 | (3.36) | (6.07) | .96 |
Distributions from net investment income | - | (.06) | (.15) | (.09) | (.05) |
Distributions from net realized gain | - | - | (.02) | (1.46) | (3.25) |
Total distributions | - | (.06) | (.17) | (1.55) | (3.30) H |
Redemption fees added to paid in capital C, G | - | - | - | - | - |
Net asset value, end of period | $ 9.65 | $ 10.00 | $ 9.25 | $ 12.78 | $ 20.40 |
Total Return A, B | (3.50)% | 8.79% | (26.38)% | (32.18)% | 3.75% |
Ratios to Average Net Assets D, F | | | | | |
Expenses before reductions | 2.01% | 2.02% | 2.04% | 1.96% | 1.94% |
Expenses net of fee waivers, if any | 2.01% | 2.02% | 2.04% | 1.96% | 1.94% |
Expenses net of all reductions | 1.96% | 1.96% | 2.03% | 1.96% | 1.94% |
Net investment income (loss) | (.99)% | (.84)% | 1.37% | 1.01% | .29% |
Supplemental Data | | | | | |
Net assets, end of period (000 omitted) | $ 23,196 | $ 30,804 | $ 29,849 | $ 37,777 | $ 55,219 |
Portfolio turnover rate E | 260% | 254% | 269% | 48% | 53% |
A Total returns would have been lower if certain expenses had not been reduced during the applicable periods shown.
B Total returns do not include the effect of the contingent deferred sales charge.
C Calculated based on average shares outstanding during the period.
D Fees and expenses of any underlying Fidelity Central Funds are not included in the Fund's expense ratio. The Fund indirectly bears its proportionate share of the expenses of any underlying Fidelity Central Funds.
E Amount does not include the portfolio activity of any underlying Fidelity Central Funds.
F Expense ratios reflect operating expenses of the class. Expenses before reductions do not reflect amounts reimbursed by the investment adviser or reductions from brokerage service arrangements or reductions from other expense offset arrangements and do not represent the amount paid by the class during periods when reimbursements or reductions occur. Expenses net of fee waivers reflect expenses after reimbursement by the investment adviser but prior to reductions from brokerage service arrangements or other expense offset arrangements. Expenses net of all reductions represent the net expenses paid by the class.
G Amount represents less than $.01 per share.
H Total distributions of $3.30 per share is comprised of distributions from net investment income of $.049 and distributions from net realized gain of $3.250 per share.
See accompanying notes which are an integral part of the financial statements.
Annual Report
Financial Highlights - Institutional Class
Years ended July 31, | 2011 | 2010 | 2009 | 2008 | 2007 |
Selected Per-Share Data | | | | | |
Net asset value, beginning of period | $ 10.55 | $ 9.69 | $ 13.38 | $ 21.32 | $ 23.63 |
Income from Investment Operations | | | | | |
Net investment income (loss) B | .01 | .02 | .21 | .36 | .31 |
Net realized and unrealized gain (loss) | (.28) | .95 | (3.63) | (6.51) | .93 |
Total from investment operations | (.27) | .97 | (3.42) | (6.15) | 1.24 |
Distributions from net investment income | - | (.11) | (.25) | (.33) | (.30) |
Distributions from net realized gain | - | - | (.02) | (1.46) | (3.25) |
Total distributions | - | (.11) | (.27) | (1.79) | (3.55) G |
Redemption fees added to paid in capital B, F | - | - | - | - | - |
Net asset value, end of period | $ 10.28 | $ 10.55 | $ 9.69 | $ 13.38 | $ 21.32 |
Total Return A | (2.56)% | 9.99% | (25.68)% | (31.47)% | 4.88% |
Ratios to Average Net Assets C, E | | | | | |
Expenses before reductions | .96% | .99% | 1.04% | .93% | .89% |
Expenses net of fee waivers, if any | .96% | .99% | 1.04% | .93% | .89% |
Expenses net of all reductions | .91% | .94% | 1.03% | .92% | .88% |
Net investment income (loss) | .07% | .19% | 2.37% | 2.04% | 1.34% |
Supplemental Data | | | | | |
Net assets, end of period (000 omitted) | $ 8,162 | $ 5,158 | $ 3,797 | $ 5,819 | $ 8,474 |
Portfolio turnover rate D | 260% | 254% | 269% | 48% | 53% |
A Total returns would have been lower if certain expenses had not been reduced during the applicable periods shown.
B Calculated based on average shares outstanding during the period.
C Fees and expenses of any underlying Fidelity Central Funds are not included in the Fund's expense ratio. The Fund indirectly bears its proportionate share of the expenses of any underlying Fidelity Central Funds.
D Amount does not include the portfolio activity of any underlying Fidelity Central Funds.
E Expense ratios reflect operating expenses of the class. Expenses before reductions do not reflect amounts reimbursed by the investment adviser or reductions from brokerage service arrangements or reductions from other expense offset arrangements and do not represent the amount paid by the class during periods when reimbursements or reductions occur. Expenses net of fee waivers reflect expenses after reimbursement by the investment adviser but prior to reductions from brokerage service arrangements or other expense offset arrangements. Expenses net of all reductions represent the net expenses paid by the class.
F Amount represents less than $.01 per share.
G Total distributions of $3.55 per share is comprised of distributions from net investment income of $.298 and distributions from net realized gain of $3.250 per share.
See accompanying notes which are an integral part of the financial statements.
Annual Report
Notes to Financial Statements
For the period ended July 31, 2011
1. Organization.
Fidelity Advisor Financial Services Fund (the Fund) is a fund of Fidelity Advisor Series VII (the Trust) and is authorized to issue an unlimited number of shares. The Trust is registered under the Investment Company Act of 1940, as amended (the 1940 Act), as an open-end management investment company organized as a Massachusetts business trust. The Fund offers Class A, Class T, Class C, and Institutional Class shares, each of which, along with Class B shares, has equal rights as to assets and voting privileges. Effective after the close of business on September 1, 2010, Class B shares were closed to new accounts and additional purchases, except for exchanges and reinvestments, by existing shareholders. Each class has exclusive voting rights with respect to matters that affect that class. Class B shares will automatically convert to Class A shares after a holding period of seven years from the initial date of purchase. Investment income, realized and unrealized capital gains and losses, the common expenses of the Fund, and certain fund-level expense reductions, if any, are allocated on a pro-rata basis to each class based on the relative net assets of each class to the total net assets of the Fund. Each class differs with respect to transfer agent and distribution and service plan fees incurred. Certain expense reductions may also differ by class. The Fund's investments in emerging markets can be subject to social, economic, regulatory, and political uncertainties and can be extremely volatile.
2. Investments in Fidelity Central Funds.
The Fund invests in Fidelity Central Funds, which are open-end investment companies available only to other investment companies and accounts managed by Fidelity Management & Research Company (FMR) and its affiliates. The Fund's Schedule of Investments lists each of the Fidelity Central Funds held as of period end, if any, as an investment of the Fund, but does not include the underlying holdings of each Fidelity Central Fund. As an Investing Fund, the Fund indirectly bears its proportionate share of the expenses of the underlying Fidelity Central Funds.
The Money Market Central Funds seek preservation of capital and current income and are managed by Fidelity Investments Money Management, Inc. (FIMM), an affiliate of FMR.
A complete unaudited list of holdings for each Fidelity Central Fund is available upon request or at the Securities and Exchange Commission (the SEC) web site at www.sec.gov. In addition, the financial statements of the Fidelity Central Funds, which are not covered by the Fund's Report of Independent Registered Public Accounting Firm, are available on the SEC web site or upon request.
3. Significant Accounting Policies.
The financial statements have been prepared in conformity with accounting principles generally accepted in the United States of America (GAAP), which require management to make certain estimates and assumptions at the date of the financial statements. Actual results could differ from those estimates. Subsequent events, if any, through the date that the financial statements were issued have been evaluated in the preparation of the financial statements. The following summarizes the significant accounting policies of the Fund:
Security Valuation. Investments are valued as of 4:00 p.m. Eastern time on the last calendar day of the period. The Fund uses independent pricing services approved by the Board of Trustees to value its investments. When current market prices or quotations are not readily available or reliable, valuations may be determined in good faith in accordance with procedures adopted by the Board of Trustees. Factors used in determining value may include market or security specific events. The frequency with which these procedures are used cannot be predicted and they may be utilized to a significant extent. The value used for net asset value (NAV) calculation under these procedures may differ from published prices for the same securities.
The Fund categorizes the inputs to valuation techniques used to value its investments into a disclosure hierarchy consisting of three levels as shown below:
Level 1 - quoted prices in active markets for identical investments
Level 2 - other significant observable inputs (including quoted prices for similar investments, interest rates, prepayment speeds, etc.)
Level 3 - unobservable inputs (including the Fund's own assumptions based on the best information available)
Changes in valuation techniques may result in transfers in or out of an assigned level within the disclosure hierarchy. The aggregate value of investments by input level, as of July 31, 2011, is included at the end of the Fund's Schedule of Investments. Valuation techniques used to value the Fund's investments by major category are as follows:
Equity securities, including restricted securities, for which market quotations are readily available, are valued at the last reported sale price or official closing price as reported by an independent pricing service on the primary market or exchange on which they are traded and are categorized as Level 1 in the hierarchy. In the event there were no sales during the day or closing prices are not available, securities are valued at the last quoted bid price or may be valued using the last available price and are generally categorized as Level 2 in the hierarchy. For foreign equity securities, when significant market or security specific events arise, comparisons to the valuation of American Depositary Receipts (ADRs), futures contracts, Exchange-traded
Annual Report
3. Significant Accounting Policies - continued
Security Valuation - continued
funds (ETFs) and certain indexes as well as quoted prices for similar securities are used and are categorized as Level 2 in the hierarchy in these circumstances. Utilizing these techniques may result in transfers between Level 1 and Level 2. For restricted equity securities and private placements where observable inputs are limited, assumptions about market activity and risk are used and are categorized as Level 3 in the hierarchy.
Investments in open-end mutual funds, including the Fidelity Central Funds, are valued at their closing net asset value each business day and are categorized as Level 1 in the hierarchy.
Foreign Currency. The Fund may use foreign currency contracts to facilitate transactions in foreign-denominated securities. Gains and losses from these transactions may arise from changes in the value of the foreign currency or if the counterparties do not perform under the contracts' terms.
Foreign-denominated assets, including investment securities, and liabilities are translated into U.S. dollars at the exchange rate at period end. Purchases and sales of investment securities, income and dividends received and expenses denominated in foreign currencies are translated into U.S. dollars at the exchange rate in effect on the transaction date.
The effects of exchange rate fluctuations on investments are included with the net realized and unrealized gain (loss) on investment securities. Other foreign currency transactions resulting in realized and unrealized gain (loss) are disclosed separately.
Investment Transactions and Income. For financial reporting purposes, the Fund's investment holdings and NAV include trades executed through the end of the last business day of the period. The NAV per share for processing shareholder transactions is calculated as of the close of business of the New York Stock Exchange (NYSE), normally 4:00 p.m. Eastern time and includes trades executed through the end of the prior business day. Gains and losses on securities sold are determined on the basis of identified cost and may include proceeds received from litigation. Dividend income is recorded on the ex-dividend date, except for certain dividends from foreign securities where the ex-dividend date may have passed, which are recorded as soon as the Fund is informed of the ex-dividend date. Non-cash dividends included in dividend income, if any, are recorded at the fair market value of the securities received. Distributions received on securities that represent a return of capital or capital gain are recorded as a reduction of cost of investments and/or as a realized gain. The Fund estimates the components of distributions received that may be considered return of capital distributions or capital gain distributions. Interest income and distributions from the Fidelity Central Funds are accrued as earned. Interest income includes coupon interest and amortization of premium and accretion of discount on debt securities. Investment income is recorded net of foreign taxes withheld where recovery of such taxes is uncertain.
Expenses. Expenses directly attributable to a fund are charged to that fund. Expenses attributable to more than one fund are allocated among the respective funds on the basis of relative net assets or other appropriate methods. Expense estimates are accrued in the period to which they relate and adjustments are made when actual amounts are known.
Income Tax Information and Distributions to Shareholders. Each year, the Fund intends to qualify as a regulated investment company, including distributing substantially all of its taxable income and realized gains under Subchapter M of the Internal Revenue Code and filing its U.S. federal tax return. As a result, no provision for income taxes is required. As of July 31, 2011, the Fund did not have any unrecognized tax benefits in the financial statements. A fund's federal tax return is subject to examination by the Internal Revenue Service (IRS) for a period of three years. Foreign taxes are provided for based on the Fund's understanding of the tax rules and rates that exist in the foreign markets in which it invests.
Distributions are declared and recorded on the ex-dividend date. Income dividends and capital gain distributions are declared separately for each class. Income and capital gain distributions are determined in accordance with income tax regulations, which may differ from GAAP.
Capital accounts within the financial statements are adjusted for permanent book-tax differences. These adjustments have no impact on net assets or the results of operations. Temporary book-tax differences will reverse in a subsequent period.
Book-tax differences are primarily due to foreign currency transactions, certain foreign taxes, partnerships, deferred trustees compensation, passive foreign investment companies (PFIC), equity-debt classifications, net operating losses, capital loss carryforwards and losses deferred due to wash sales and excise tax regulations.
The federal tax cost of investment securities and unrealized appreciation (depreciation) as of period end were as follows:
Gross unrealized appreciation | $ 1,798,219 |
Gross unrealized depreciation | (10,684,574) |
Net unrealized appreciation (depreciation) on securities and other investments | $ (8,886,355) |
| |
Tax Cost | $ 144,274,309 |
Annual Report
Notes to Financial Statements - continued
3. Significant Accounting Policies - continued
Income Tax Information and Distributions to Shareholders - continued
The tax-based components of distributable earnings as of period end were as follows:
Capital loss carryforward | $ (79,374,743) |
Net unrealized appreciation (depreciation) | $ (8,886,884) |
The tax character of distributions paid was as follows:
| July 31, 2011 | July 31, 2010 |
Ordinary Income | $ - | $ 1,313,190 |
Under the recently enacted Regulated Investment Company Modernization Act of 2010 (the Act), the Fund will be permitted to carry forward capital losses incurred in taxable years beginning after December 22, 2010 for an unlimited period. However, any losses incurred during those future taxable years will be required to be utilized prior to any losses incurred in pre-enactment taxable years, which generally expire after eight years from when they are incurred. Additionally, post-enactment capital losses that are carried forward will retain their character as either short-term or long-term capital losses rather than being considered all short-term as under previous law. The Fund's first fiscal year end subject to the Act will be July 31, 2012.
Short-Term Trading (Redemption) Fees. Shares held by investors in the Fund less than 30 days are subject to a redemption fee equal to .75% of the net asset value of shares redeemed. All redemption fees, which reduce the proceeds of the shareholder redemption, are retained by the Fund and accounted for as an addition to paid in capital.
New Accounting Pronouncement. In May 2011, the Financial Accounting Standards Board issued Accounting Standard Update No. 2011-04, Fair Value Measurement (Topic 820) - Amendments to Achieve Common Fair Value Measurement and Disclosure Requirements in U.S. GAAP and IFRSs. The update changes the wording used to describe the requirements in GAAP for measuring fair value and for disclosing information about fair value measurements. The update is effective during interim and annual periods beginning after December 15, 2011. Management is currently evaluating the impact of the update's adoption on the Fund's financial statement disclosures.
4. Purchases and Sales of Investments.
Purchases and sales of securities, other than short-term securities, aggregated $369,637,585 and $388,315,677, respectively.
The Fund realized a gain on the sale of an investment not meeting the investment restrictions of the Fund.
5. Fees and Other Transactions with Affiliates.
Management Fee. FMR and its affiliates provide the Fund with investment management related services for which the Fund pays a monthly management fee. The management fee is the sum of an individual fund fee rate that is based on an annual rate of .30% of the Fund's average net assets and a group fee rate that averaged .26% during the period. The group fee rate is based upon the average net assets of all the mutual funds advised by FMR. The group fee rate decreases as assets under management increase and increases as assets under management decrease. For the period, the total annual management fee rate was .56% of the Fund's average net assets.
Annual Report
5. Fees and Other Transactions with Affiliates - continued
Distribution and Service Plan Fees. In accordance with Rule 12b-1 of the 1940 Act, the Fund has adopted separate Distribution and Service Plans for each class of shares. Certain classes pay Fidelity Distributors Corporation (FDC), an affiliate of FMR, separate Distribution and Service Fees, each of which is based on an annual percentage of each class' average net assets. In addition, FDC may pay financial intermediaries for selling shares of the Fund and providing shareholder support services. For the period, the Distribution and Service Fee rates, total fees and amounts retained by FDC were as follows:
| Distribution
Fee | Service
Fee | Total Fees | Retained
by FDC |
Class A | -% | .25% | $ 176,564 | $ 22,382 |
Class T | .25% | .25% | 157,692 | 732 |
Class B | .75% | .25% | 93,556 | 70,295 |
Class C | .75% | .25% | 277,693 | 39,629 |
| | | $ 705,505 | $ 133,038 |
Sales Load. FDC may receive a front-end sales charge of up to 5.75% for selling Class A shares, and 3.50% for selling Class T shares, some of which is paid to financial intermediaries for selling shares of the Fund. Depending on the holding period, FDC may receive contingent deferred sales charges levied on Class A, Class T, Class B, and Class C redemptions. The deferred sales charges range from 5% to 1% for Class B, 1% for Class C, 1.00% for certain purchases of Class A shares and .25% for certain purchases of Class T shares.
For the period, sales charge amounts retained by FDC were as follows:
| Retained
by FDC |
Class A | $ 54,057 |
Class T | 5,686 |
Class B* | 23,237 |
Class C* | 5,433 |
| $ 88,413 |
* When Class B and Class C shares are initially sold, FDC pays commissions from its own resources to financial intermediaries through which the sales are made.
Transfer Agent Fees. Fidelity Investments Institutional Operations Company, Inc. (FIIOC), an affiliate of FMR, is the transfer, dividend disbursing and shareholder servicing agent for each class of the Fund. FIIOC receives account fees and asset-based fees that vary according to the account size and type of account of the shareholders of the respective classes of the Fund. FIIOC pays for typesetting, printing and mailing of shareholder reports, except proxy statements. For the period, transfer agent fees for each class were as follows:
| Amount | % of
Average
Net Assets |
Class A | $ 213,053 | .30 |
Class T | 97,782 | .31 |
Class B | 28,168 | .30 |
Class C | 83,593 | .30 |
Institutional Class | 17,277 | .25 |
| $ 439,873 | |
Accounting and Security Lending Fees. Fidelity Service Company, Inc. (FSC), an affiliate of FMR, maintains the Fund's accounting records. The accounting fee is based on the level of average net assets for the month. Under a separate contract, FSC administers the security lending program. The security lending fee is based on the number and duration of lending transactions.
Brokerage Commissions. The Fund placed a portion of its portfolio transactions with brokerage firms which are affiliates of the investment adviser. The commissions paid to these affiliated firms were $25,705 for the period.
Annual Report
Notes to Financial Statements - continued
6. Committed Line of Credit.
The Fund participates with other funds managed by FMR or an affiliate in a $4.0 billion credit facility (the "line of credit") to be utilized for temporary or emergency purposes to fund shareholder redemptions or for other short-term liquidity purposes. The Fund has agreed to pay commitment fees on its pro-rata portion of the line of credit, which amounted to $498 and is reflected in Miscellaneous expenses on the Statement of Operations. During the period, there were no borrowings on this line of credit.
7. Security Lending.
The Fund lends portfolio securities through a lending agent from time to time in order to earn additional income. The lending agent may loan securities to certain qualified borrowers, including Fidelity Capital Markets (FCM), a broker-dealer affiliated with the Fund. On the settlement date of the loan, the Fund receives collateral (in the form of U.S. Treasury obligations, letters of credit and/or cash) against the loaned securities and maintains collateral in an amount not less than 100% of the market value of the loaned securities during the period of the loan. The market value of the loaned securities is determined at the close of business of the Fund and any additional required collateral is delivered to the Fund on the next business day. If the borrower defaults on its obligation to return the securities loaned because of insolvency or other reasons, a fund could experience delays and costs in recovering the securities loaned or in gaining access to the collateral. Any cash collateral received is invested in the Fidelity Securities Lending Cash Central Fund. The value of loaned securities and cash collateral at period end are disclosed on the Fund's Statement of Assets and Liabilities. Security lending income represents the income earned on investing cash collateral, less rebates paid to borrowers and lending agent fees associated with the loan, plus any premium payments received for lending certain types of securities. Security lending income is presented in the Statement of Operations as a component of income from Fidelity Central Funds. Total security lending income during the period amounted to $25,052. During the period, there were no securities loaned to FCM.
8. Expense Reductions.
Many of the brokers with whom FMR places trades on behalf of the Fund provided services to the Fund in addition to trade execution. These services included payments of certain expenses on behalf of the Fund totaling $68,182 for the period.
9. Distributions to Shareholders.
Distributions to shareholders of each class were as follows:
Years ended July 31, | 2011 | 2010 |
From net investment income | | |
Class A | $ - | $ 686,640 |
Class T | - | 298,090 |
Class B | - | 78,308 |
Class C | - | 206,470 |
Institutional Class | - | 43,682 |
Total | $ - | $ 1,313,190 |
10. Share Transactions.
Transactions for each class of shares were as follows:
| Shares | Dollars |
Years ended July 31, | 2011 | 2010 | 2011 | 2010 |
Class A | | | | |
Shares sold | 2,161,457 | 2,082,714 | $ 22,928,387 | $ 22,402,196 |
Reinvestment of distributions | - | 58,808 | - | 610,428 |
Shares redeemed | (2,543,428) | (2,567,565) | (27,053,427) | (27,335,650) |
Net increase (decrease) | (381,971) | (426,043) | $ (4,125,040) | $ (4,323,026) |
Class T | | | | |
Shares sold | 432,428 | 481,524 | $ 4,608,539 | $ 5,227,941 |
Reinvestment of distributions | - | 27,047 | - | 280,751 |
Shares redeemed | (958,085) | (952,462) | (10,097,220) | (10,134,806) |
Net increase (decrease) | (525,657) | (443,891) | $ (5,488,681) | $ (4,626,114) |
Annual Report
10. Share Transactions - continued
| Shares | Dollars |
Years ended July 31, | 2011 | 2010 | 2011 | 2010 |
Class B | | | | |
Shares sold | 48,520 | 217,909 | $ 510,105 | $ 2,331,426 |
Reinvestment of distributions | - | 6,452 | - | 65,677 |
Shares redeemed | (369,736) | (472,669) | (3,763,785) | (4,904,869) |
Net increase (decrease) | (321,216) | (248,308) | $ (3,253,680) | $ (2,507,766) |
Class C | | | | |
Shares sold | 446,364 | 749,668 | $ 4,631,347 | $ 8,032,665 |
Reinvestment of distributions | - | 17,064 | - | 172,172 |
Shares redeemed | (1,122,959) | (913,840) | (11,383,791) | (9,328,999) |
Net increase (decrease) | (676,595) | (147,108) | $ (6,752,444) | $ (1,124,162) |
Institutional Class | | | | |
Shares sold | 691,657 | 278,977 | $ 7,779,752 | $ 3,114,760 |
Reinvestment of distributions | - | 3,007 | - | 31,721 |
Shares redeemed | (387,007) | (184,671) | (4,196,861) | (2,016,339) |
Net increase (decrease) | 304,650 | 97,313 | $ 3,582,891 | $ 1,130,142 |
11. Other.
The Fund's organizational documents provide former and current trustees and officers with a limited indemnification against liabilities arising in connection with the performance of their duties to the Fund. In the normal course of business, the Fund may also enter into contracts that provide general indemnifications. The Fund's maximum exposure under these arrangements is unknown as this would be dependent on future claims that may be made against the Fund. The risk of material loss from such claims is considered remote.
Annual Report
Fidelity Advisor Health Care Fund - Institutional Class
Performance: The Bottom Line
Average annual total return reflects the change in the value of an investment, assuming reinvestment of the class' distributions from dividend income and capital gains (the profits earned upon the sale of securities that have grown in value, if any) and assuming a constant rate of performance each year. The $10,000 table and the fund's returns do not reflect the deduction of taxes that a shareholder would pay on fund distributions or the redemption of fund shares. During periods of reimbursement by Fidelity, a fund's total return will be greater than it would be had the reimbursement not occurred. How a fund did yesterday is no guarantee of how it will do tomorrow.
Average Annual Total Returns
Periods ended July 31, 2011 | | Past 1
year | Past 5
years | Past 10
years |
Institutional Class | | 35.00% | 6.56% | 5.03% |
$10,000 Over 10 Years
Let's say hypothetically that $10,000 was invested in Fidelity Advisor Health Care Fund - Institutional Class on July 31, 2001. The chart shows how the value of your investment would have changed, and also shows how the S&P 500 Index performed over the same period.
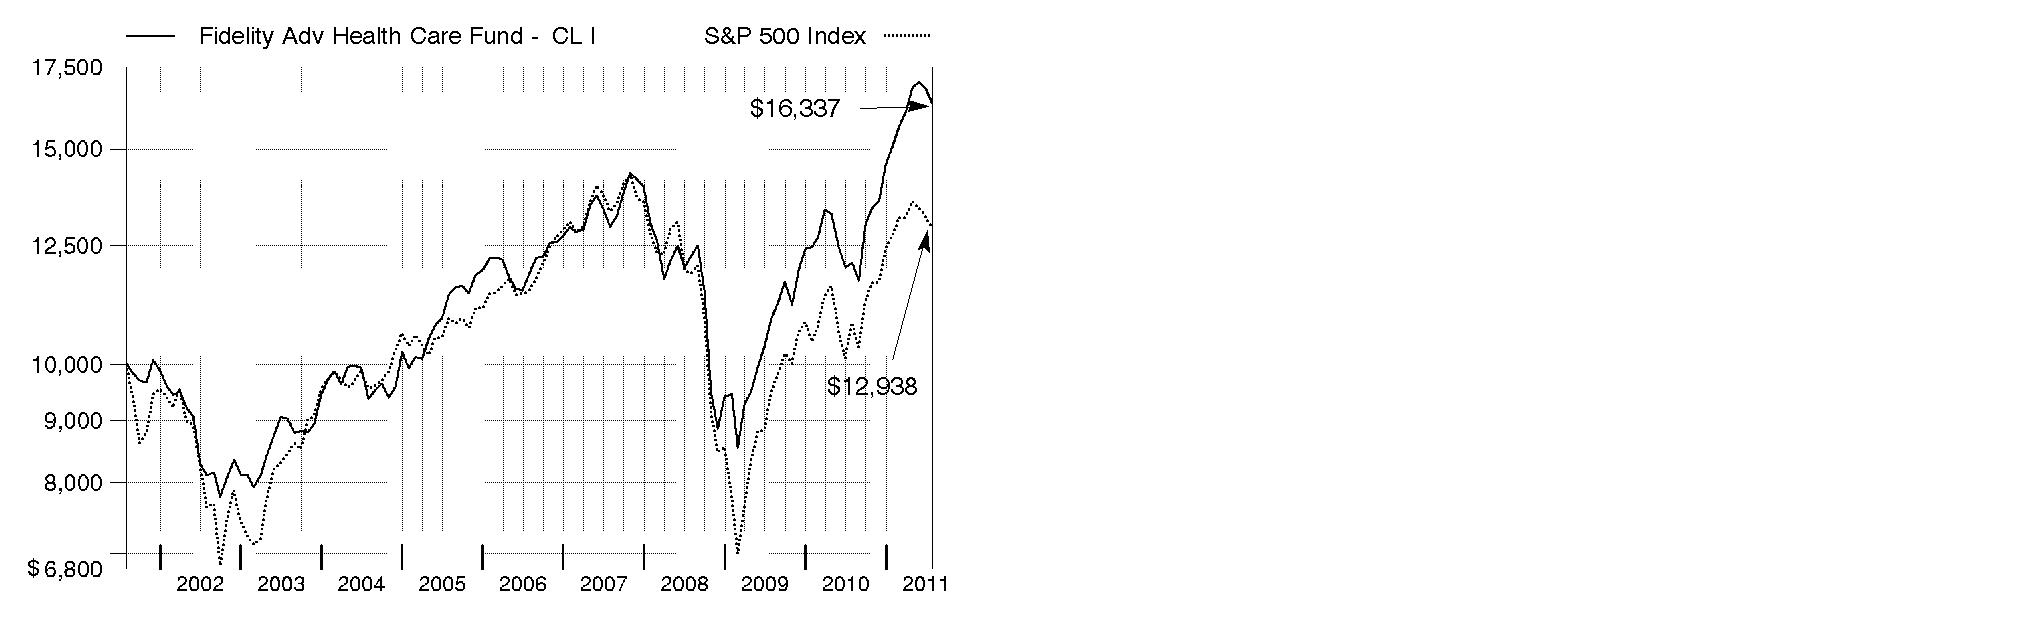
Annual Report
Fidelity Advisor Health Care Fund
Market Recap: U.S. stocks registered solid double-digit gains for the 12 months ending July 31, 2011, extending a rally that began more than two years earlier. Despite a rough start in August 2010, markets turned positive in September, as increased demand for capital goods and other upbeat indicators trumped investor worry about a U.S. recessionary relapse. The broad market, as measured by the S&P 500® Index, rose 9% that month, its biggest September gain in 71 years. Seven more monthly advances followed, fueled by encouraging corporate earnings and economic activity. However, volatility picked up in the period's latter months, as markets reacted to continued high U.S. unemployment, nagging debt troubles in Europe and looming legislative battles over the federal debt ceiling. May unemployment rose above 9% for the first time in 2011, contributing to a traditional "June swoon" for stocks. Market uncertainty lingered in July, when the S&P 500® posted its second-biggest monthly loss of the period. For the full year, the S&P 500® climbed 19.65%, while the blue-chip-laden Dow Jones Industrial AverageSM rose a comparable 19.09% and the technology-heavy Nasdaq Composite® Index gained 23.40%. On the capitalization spectrum, stocks of mid-cap companies fared best, with the Russell Midcap® Index rising 24.51% and the small-cap Russell 2000® Index adding 23.92%.
Comments from Edward Yoon, Portfolio Manager of Fidelity Advisor® Health Care Fund: For the 12 months ending July 31, 2011, the fund's Class A, Class T, Class B and Class C shares returned 34.67%, 34.34%, 33.66% and 33.66%, respectively (excluding sales charges), decisively outperforming both the 23.86% gain of the MSCI® U.S. IM Health Care 25/50 Index and the smaller rise of the broadly based S&P 500® Index. My choices within pharmaceuticals provided a big boost versus the sector benchmark, led by an out-of-benchmark investment in Valeant Pharmaceuticals International and underweightings in weak-performing large-cap names such as Johnson & Johnson and Abbott Laboratories. Positioning in life science tools/services, such as Illumina (genetic analysis technology) and Agilent Technologies (food and water testing), also helped. Good picks in biotechnology - Alexion Pharmaceuticals (blood disease) and ARIAD Pharmaceuticals (cancer) - contributed as well. On the other hand, underweighting the top-performing managed health care industry - including UnitedHealth Group and WellPoint - and large-cap drugmaker Pfizer notably detracted. An untimely overweighting in Community Health Systems (acute care hospitals) also hurt, as did an out-of-index position in WebMD Health (online medical information). I sold some of the above stocks during the period.
Comments from Edward Yoon, Portfolio Manager of Fidelity® Advisor Health Care Fund: For the 12 months ending July 31, 2011, the fund's Institutional Class shares returned 35.00%, decisively outperforming both the 23.86% gain of the MSCI® U.S. IM Health Care 25/50 Index and the smaller advance of the broadly based S&P 500® Index. My choices within pharmaceuticals provided a big boost versus the sector benchmark, led by an out-of-benchmark investment in Valeant Pharmaceuticals International and underweightings in weak-performing large-cap names such as Johnson & Johnson and Abbott Laboratories. Positioning in life science tools/services, such as Illumina (genetic analysis technology) and Agilent Technologies (food and water testing), also helped. Good picks in biotechnology - Alexion Pharmaceuticals (blood disease) and ARIAD Pharmaceuticals (cancer) - contributed as well. On the other hand, underweighting the top-performing managed health care industry - including UnitedHealth Group and WellPoint - and large-cap drugmaker Pfizer notably detracted. An untimely overweighting in Community Health Systems (acute care hospitals) also hurt, as did an out-of-index position in WebMD Health (online medical information). I sold some of the above stocks during the period.
The views expressed above reflect those of the portfolio manager(s) only through the end of the period as stated on the cover of this report and do not necessarily represent the views of Fidelity or any other person in the Fidelity organization. Any such views are subject to change at any time based upon market or other conditions and Fidelity disclaims any responsibility to update such views. These views may not be relied on as investment advice and, because investment decisions for a Fidelity fund are based on numerous factors, may not be relied on as an indication of trading intent on behalf of any Fidelity fund.
Annual Report
Fidelity Advisor Health Care Fund
As a shareholder of the Fund, you incur two types of costs: (1) transaction costs, including sales charges (loads) on purchase payments or redemption proceeds, redemption fees, and (2) ongoing costs, including management fees, distribution and/or service (12b-1) fees and other Fund expenses. This Example is intended to help you understand your ongoing costs (in dollars) of investing in the Fund and to compare these costs with the ongoing costs of investing in other mutual funds.
The Example is based on an investment of $1,000 invested at the beginning of the period and held for the entire period (February 1, 2011 to July 31, 2011).
Actual Expenses
The first line of the accompanying table for each class of the Fund provides information about actual account values and actual expenses. You may use the information in this line, together with the amount you invested, to estimate the expenses that you paid over the period. Simply divide your account value by $1,000.00 (for example, an $8,600 account value divided by $1,000.00 = 8.6), then multiply the result by the number in the first line for a class of the Fund under the heading entitled "Expenses Paid During Period" to estimate the expenses you paid on your account during this period. In addition, the Fund, as a shareholder in the underlying Fidelity Central Funds, will indirectly bear its pro-rata share of the fees and expenses incurred by the underlying Fidelity Central Funds. These fees and expenses are not included in the Fund's annualized expense ratio used to calculate the expense estimate in the table below.
Hypothetical Example for Comparison Purposes
The second line of the accompanying table for each class of the Fund provides information about hypothetical account values and hypothetical expenses based on a Class' actual expense ratio and an assumed rate of return of 5% per year before expenses, which is not the Class' actual return. The hypothetical account values and expenses may not be used to estimate the actual ending account balance or expenses you paid for the period. You may use this information to compare the ongoing costs of investing in the Fund and other funds. To do so, compare this 5% hypothetical example with the 5% hypothetical examples that appear in the shareholder reports of the other funds. In addition, the Fund, as a shareholder in the underlying Fidelity Central Funds, will indirectly bear its pro-rata share of the fees and expenses incurred by the underlying Fidelity Central Funds. These fees and expenses are not included in the Fund's annualized expense ratio used to calculate the expense estimate in the table below.
Please note that the expenses shown in the table are meant to highlight your ongoing costs only and do not reflect any transaction costs. Therefore, the second line of the table is useful in comparing ongoing costs only, and will not help you determine the relative total costs of owning different funds. In addition, if these transactional costs were included, your costs would have been higher.
| Annualized
Expense Ratio | Beginning
Account Value
February 1, 2011 | Ending
Account Value
July 31, 2011 | Expenses Paid
During Period*
February 1, 2011 to July 31, 2011 |
Class A | 1.18% | | | |
Actual | | $ 1,000.00 | $ 1,082.50 | $ 6.09 |
Hypothetical A | | $ 1,000.00 | $ 1,018.94 | $ 5.91 |
Class T | 1.42% | | | |
Actual | | $ 1,000.00 | $ 1,081.60 | $ 7.33 |
Hypothetical A | | $ 1,000.00 | $ 1,017.75 | $ 7.10 |
Class B | 1.93% | | | |
Actual | | $ 1,000.00 | $ 1,078.20 | $ 9.94 |
Hypothetical A | | $ 1,000.00 | $ 1,015.22 | $ 9.64 |
Class C | 1.88% | | | |
Actual | | $ 1,000.00 | $ 1,078.90 | $ 9.69 |
Hypothetical A | | $ 1,000.00 | $ 1,015.47 | $ 9.39 |
Institutional Class | .86% | | | |
Actual | | $ 1,000.00 | $ 1,084.10 | $ 4.44 |
Hypothetical A | | $ 1,000.00 | $ 1,020.53 | $ 4.31 |
A 5% return per year before expenses
* Expenses are equal to each Class' annualized expense ratio, multiplied by the average account value over the period, multiplied by 181/365 (to reflect the one-half year period).
Annual Report
Fidelity Advisor Health Care Fund
Investment Changes (Unaudited)
Top Ten Stocks as of July 31, 2011 |
| % of fund's
net assets | % of fund's net assets
6 months ago |
Covidien PLC | 6.3 | 4.9 |
Baxter International, Inc. | 5.1 | 0.6 |
Amgen, Inc. | 5.0 | 2.5 |
Thermo Fisher Scientific, Inc. | 3.4 | 2.4 |
Medco Health Solutions, Inc. | 2.9 | 6.5 |
Boston Scientific Corp. | 2.8 | 0.9 |
Sanofi-Aventis sponsored ADR | 2.8 | 0.0 |
Valeant Pharmaceuticals International, Inc. (Canada) | 2.8 | 2.9 |
Illumina, Inc. | 2.7 | 6.4 |
Alexion Pharmaceuticals, Inc. | 2.6 | 2.1 |
| 36.4 | |
Top Industries (% of fund's net assets) |
As of July 31, 2011 |
| Health Care Equipment & Supplies | 23.1% | |
| Biotechnology | 21.9% | |
| Health Care Providers & Services | 21.4% | |
| Pharmaceuticals | 15.3% | |
| Life Sciences Tools & Services | 9.7% | |
| All Others* | 8.6% | |

As of January 31, 2011 |
 | Health Care Providers & Services | 22.5% | |
| Biotechnology | 19.7% | |
| Health Care Equipment & Supplies | 18.7% | |
| Life Sciences Tools & Services | 16.3% | |
| Pharmaceuticals | 15.3% | |
| All Others* | 7.5% | |

* Includes short-term investments and net other assets. |
Annual Report
Fidelity Advisor Health Care Fund
Investments July 31, 2011
Showing Percentage of Net Assets
Common Stocks - 97.9% |
| Shares | | Value |
BIOTECHNOLOGY - 21.9% |
Biotechnology - 21.9% |
Achillion Pharmaceuticals, Inc. (a) | 269,100 | | $ 1,994,031 |
Acorda Therapeutics, Inc. (a) | 135,027 | | 3,834,767 |
Affymax, Inc. (a) | 103,500 | | 684,135 |
Alexion Pharmaceuticals, Inc. (a) | 224,186 | | 12,733,765 |
AMAG Pharmaceuticals, Inc. (a)(d) | 51,800 | | 767,158 |
Amgen, Inc. | 450,512 | | 24,643,006 |
Anthera Pharmaceuticals, Inc. (a) | 226,988 | | 1,809,094 |
Ardea Biosciences, Inc. (a) | 175,000 | | 4,095,000 |
ARIAD Pharmaceuticals, Inc. (a) | 359,985 | | 4,280,222 |
AVEO Pharmaceuticals, Inc. (a) | 58,354 | | 1,115,145 |
Biogen Idec, Inc. (a) | 73,279 | | 7,464,932 |
BioMarin Pharmaceutical, Inc. (a) | 400,000 | | 12,492,000 |
Chelsea Therapeutics International Ltd. (a) | 222,100 | | 1,114,942 |
Dynavax Technologies Corp. (a)(d) | 650,000 | | 1,820,000 |
Gilead Sciences, Inc. (a) | 145,768 | | 6,174,732 |
Human Genome Sciences, Inc. (a) | 94,000 | | 1,974,940 |
Idenix Pharmaceuticals, Inc. (a) | 1,600 | | 10,688 |
Incyte Corp. (a)(d) | 86,582 | | 1,509,990 |
Inhibitex, Inc. (a) | 267,200 | | 1,106,208 |
Medivir AB (B Shares) (a) | 101,300 | | 2,012,524 |
Micromet, Inc. (a)(d) | 103,300 | | 584,678 |
Neurocrine Biosciences, Inc. (a) | 146,300 | | 1,130,899 |
NPS Pharmaceuticals, Inc. (a) | 129,800 | | 1,253,868 |
Seattle Genetics, Inc. (a)(d) | 101,257 | | 1,724,407 |
Targacept, Inc. (a) | 130,715 | | 2,671,815 |
Theravance, Inc. (a)(d) | 155,400 | | 3,322,452 |
United Therapeutics Corp. (a) | 88,848 | | 5,098,098 |
YM Biosciences, Inc. (a) | 204,900 | | 482,547 |
| | 107,906,043 |
DIVERSIFIED CONSUMER SERVICES - 0.5% |
Specialized Consumer Services - 0.5% |
Carriage Services, Inc. | 222,555 | | 1,270,789 |
Stewart Enterprises, Inc. Class A | 154,043 | | 1,070,599 |
| | 2,341,388 |
FOOD & STAPLES RETAILING - 1.8% |
Drug Retail - 1.8% |
CVS Caremark Corp. | 144,300 | | 5,245,305 |
Droga Raia SA | 21,000 | | 389,215 |
Drogasil SA | 178,800 | | 1,440,820 |
Rite Aid Corp. (a) | 1,332,400 | | 1,732,120 |
| | 8,807,460 |
HEALTH CARE EQUIPMENT & SUPPLIES - 23.1% |
Health Care Equipment - 21.3% |
Baxter International, Inc. | 427,500 | | 24,867,675 |
Boston Scientific Corp. (a) | 1,958,211 | | 14,020,791 |
|
| Shares | | Value |
C. R. Bard, Inc. | 96,910 | | $ 9,563,079 |
Conceptus, Inc. (a) | 155,400 | | 1,770,006 |
Covidien PLC | 607,954 | | 30,877,985 |
Cyberonics, Inc. (a) | 65,720 | | 1,783,641 |
Edwards Lifesciences Corp. (a) | 130,452 | | 9,307,750 |
Genmark Diagnostics, Inc. (a) | 27,400 | | 136,178 |
HeartWare International, Inc. (a) | 29,000 | | 1,926,760 |
Integra LifeSciences Holdings Corp. (a) | 60,101 | | 2,708,752 |
Masimo Corp. | 111,071 | | 3,085,552 |
Orthofix International NV (a) | 43,205 | | 1,824,547 |
William Demant Holding A/S (a) | 31,869 | | 2,796,578 |
| | 104,669,294 |
Health Care Supplies - 1.8% |
Endologix, Inc. (a) | 270,000 | | 2,451,600 |
The Cooper Companies, Inc. | 81,850 | | 6,260,707 |
| | 8,712,307 |
TOTAL HEALTH CARE EQUIPMENT & SUPPLIES | | 113,381,601 |
HEALTH CARE PROVIDERS & SERVICES - 21.4% |
Health Care Distributors & Services - 2.2% |
Amplifon SpA | 269,971 | | 1,732,396 |
McKesson Corp. | 112,591 | | 9,133,382 |
| | 10,865,778 |
Health Care Facilities - 2.8% |
Emeritus Corp. (a) | 95,575 | | 1,878,049 |
Hanger Orthopedic Group, Inc. (a) | 89,965 | | 1,890,165 |
HCA Holdings, Inc. | 122,100 | | 3,257,628 |
HealthSouth Corp. (a) | 133,200 | | 3,250,080 |
LCA-Vision, Inc. (a) | 191,300 | | 805,373 |
Sunrise Senior Living, Inc. (a)(d) | 291,509 | | 2,571,109 |
| | 13,652,404 |
Health Care Services - 10.7% |
Accretive Health, Inc. (a)(d) | 178,045 | | 5,348,472 |
Express Scripts, Inc. (a) | 225,486 | | 12,234,870 |
Fresenius Medical Care AG & Co. KGaA | 73,100 | | 5,610,007 |
Laboratory Corp. of America Holdings (a) | 22,300 | | 2,023,948 |
Medco Health Solutions, Inc. (a) | 224,975 | | 14,146,428 |
MEDNAX, Inc. (a) | 42,600 | | 2,903,616 |
Omnicare, Inc. | 247,500 | | 7,548,750 |
Sun Healthcare Group, Inc. (a) | 72,332 | | 506,324 |
Team Health Holdings, Inc. (a) | 111,000 | | 2,443,110 |
| | 52,765,525 |
Managed Health Care - 5.7% |
CIGNA Corp. | 156,200 | | 7,774,074 |
Humana, Inc. | 32,900 | | 2,453,682 |
UnitedHealth Group, Inc. | 133,967 | | 6,648,782 |
Common Stocks - continued |
| Shares | | Value |
HEALTH CARE PROVIDERS & SERVICES - CONTINUED |
Managed Health Care - continued |
Universal American Spin Corp. (a) | 106,100 | | $ 1,009,011 |
WellPoint, Inc. | 145,600 | | 9,835,280 |
| | 27,720,829 |
TOTAL HEALTH CARE PROVIDERS & SERVICES | | 105,004,536 |
HEALTH CARE TECHNOLOGY - 1.8% |
Health Care Technology - 1.8% |
Allscripts-Misys Healthcare Solutions, Inc. (a) | 261,443 | | 4,745,190 |
athenahealth, Inc. (a) | 68,000 | | 3,997,720 |
| | 8,742,910 |
INTERNET SOFTWARE & SERVICES - 0.8% |
Internet Software & Services - 0.8% |
WebMD Health Corp. (a) | 112,457 | | 3,964,109 |
LIFE SCIENCES TOOLS & SERVICES - 9.7% |
Life Sciences Tools & Services - 9.7% |
Agilent Technologies, Inc. (a) | 112,412 | | 4,739,290 |
Bruker BioSciences Corp. (a) | 233,145 | | 4,014,757 |
Covance, Inc. (a) | 62,193 | | 3,560,549 |
Illumina, Inc. (a)(d) | 209,348 | | 13,073,783 |
QIAGEN NV (a) | 155,886 | | 2,640,709 |
Sequenom, Inc. (a)(d) | 400,000 | | 2,824,000 |
Thermo Fisher Scientific, Inc. (a) | 279,259 | | 16,780,673 |
| | 47,633,761 |
MACHINERY - 0.0% |
Industrial Machinery - 0.0% |
Pall Corp. | 3,700 | | 183,446 |
PERSONAL PRODUCTS - 0.3% |
Personal Products - 0.3% |
Prestige Brands Holdings, Inc. (a) | 138,572 | | 1,693,350 |
PHARMACEUTICALS - 15.2% |
Pharmaceuticals - 15.2% |
Cardiome Pharma Corp. (a) | 279,000 | | 1,387,115 |
Columbia Laboratories, Inc. (a)(d) | 260,000 | | 743,600 |
Elan Corp. PLC sponsored ADR (a) | 222,100 | | 2,456,426 |
Eli Lilly & Co. | 113,500 | | 4,347,050 |
Medicis Pharmaceutical Corp. Class A | 124,103 | | 4,614,150 |
Merck & Co., Inc. | 314,595 | | 10,737,127 |
Optimer Pharmaceuticals, Inc. (a)(d) | 112,454 | | 1,189,763 |
Perrigo Co. | 31,482 | | 2,843,139 |
Pfizer, Inc. | 221,488 | | 4,261,429 |
Sanofi-Aventis sponsored ADR (d) | 360,000 | | 13,950,000 |
Shire PLC sponsored ADR | 116,600 | | 12,126,400 |
Valeant Pharmaceuticals International, Inc. (Canada) (d) | 247,504 | | 13,623,859 |
|
| Shares | | Value |
Watson Pharmaceuticals, Inc. (a) | 22,300 | | $ 1,496,999 |
XenoPort, Inc. (a) | 118,900 | | 843,001 |
| | 74,620,058 |
PROFESSIONAL SERVICES - 0.5% |
Research & Consulting Services - 0.5% |
Qualicorp SA | 261,000 | | 2,439,724 |
SOFTWARE - 0.9% |
Application Software - 0.9% |
Nuance Communications, Inc. (a) | 222,100 | | 4,444,221 |
TOTAL COMMON STOCKS (Cost $400,332,212) | 481,162,607 |
Convertible Preferred Stocks - 0.1% |
| | | |
PHARMACEUTICALS - 0.1% |
Pharmaceuticals - 0.1% |
Merrimack Pharmaceuticals, Inc. Series G (e)
(Cost $562,611) | 80,373 | | 562,611 |
Money Market Funds - 9.1% |
| | | |
Fidelity Cash Central Fund, 0.14% (b) | 8,010,155 | | 8,010,155 |
Fidelity Securities Lending Cash Central Fund, 0.15% (b)(c) | 36,716,410 | | 36,716,410 |
TOTAL MONEY MARKET FUNDS (Cost $44,726,565) | 44,726,565 |
TOTAL INVESTMENT PORTFOLIO - 107.1% (Cost $445,621,388) | | 526,451,783 |
NET OTHER ASSETS (LIABILITIES) - (7.1)% | | (34,785,348) |
NET ASSETS - 100% | $ 491,666,435 |
Legend |
(a) Non-income producing |
(b) Affiliated fund that is available only to investment companies and other accounts managed by Fidelity Investments. The rate quoted is the annualized seven-day yield of the fund at period end. A complete unaudited listing of the fund's holdings as of its most recent quarter end is available upon request. In addition, each Fidelity Central Fund's financial statements, which are not covered by the Fund's Report of Independent Registered Public Accounting Firm, are available on the SEC's website or upon request. |
(c) Investment made with cash collateral received from securities on loan. |
(d) Security or a portion of the security is on loan at period end. |
(e) Restricted securities - Investment in securities not registered under the Securities Act of 1933 (excluding 144A issues). At the end of the period, the value of restricted securities (excluding 144A issues) amounted to $562,611 or 0.1% of net assets. |
Additional information on each restricted holding is as follows: |
Security | Acquisition Date | Acquisition Cost |
Merrimack Pharmaceuticals, Inc. Series G | 3/31/11 | $ 562,611 |
Affiliated Central Funds |
Information regarding fiscal year to date income earned by the Fund from investments in Fidelity Central Funds is as follows: |
Fund | Income earned |
Fidelity Cash Central Fund | $ 14,760 |
Fidelity Securities Lending Cash Central Fund | 136,970 |
Total | $ 151,730 |
Other Information |
The following is a summary of the inputs used, as of July 31, 2011, involving the Fund's assets and liabilities carried at fair value. The inputs or methodology used for valuing securities may not be an indication of the risk associated with investing in those securities. For more information on valuation inputs, and their aggregation into the levels used in the tables below, please refer to the Security Valuation section in the accompanying Notes to Financial Statements. |
Valuation Inputs at Reporting Date: |
Description | Total | Level 1 | Level 2 | Level 3 |
Investments in Securities: | | | | |
Common Stocks | $ 481,162,607 | $ 475,552,600 | $ 5,610,007 | $ - |
Convertible Preferred Stocks | 562,611 | - | - | 562,611 |
Money Market Funds | 44,726,565 | 44,726,565 | - | - |
Total Investments in Securities: | $ 526,451,783 | $ 520,279,165 | $ 5,610,007 | $ 562,611 |
The following is a reconciliation of Investments in Securities for which Level 3 inputs were used in determining value: |
Investments in Securities: | |
Beginning Balance | $ - |
Total Realized Gain (Loss) | - |
Total Unrealized Gain (Loss) | - |
Cost of Purchases | 562,611 |
Proceeds of Sales | - |
Amortization/Accretion | - |
Transfers in to Level 3 | - |
Transfers out of Level 3 | - |
Ending Balance | $ 562,611 |
The change in unrealized gain (loss) for the period attributable to Level 3 securities held at July 31, 2011 | $ - |
The information used in the above reconciliation represents fiscal year to date activity for any Investments in Securities identified as using Level 3 inputs at either the beginning or the end of the current fiscal period. Transfers in or out of Level 3 represent the beginning value of any Security or Instrument where a change in the pricing level occurred from the beginning to the end of the period. The cost of purchases and the proceeds of sales may include securities received or delivered through corporate actions or exchanges. Realized and unrealized gains (losses) disclosed in the reconciliation are included in Net Gain (Loss) on the Fund's Statement of Operations. |
Distribution of investments by country of issue, as a percentage of total net assets, is as follows: (Unaudited) |
United States of America | 80.9% |
Ireland | 6.8% |
Canada | 3.2% |
France | 2.8% |
Bailiwick of Jersey | 2.5% |
Germany | 1.1% |
Others (Individually Less Than 1%) | 2.7% |
| 100.0% |
See accompanying notes which are an integral part of the financial statements.
Annual Report
Fidelity Advisor Health Care Fund
Statement of Assets and Liabilities
| July 31, 2011 |
| | |
Assets | | |
Investment in securities, at value (including securities loaned of $35,901,127) - See accompanying schedule: Unaffiliated issuers (cost $400,894,823) | $ 481,725,218 | |
Fidelity Central Funds (cost $44,726,565) | 44,726,565 | |
Total Investments (cost $445,621,388) | | $ 526,451,783 |
Receivable for investments sold | | 17,083,599 |
Receivable for fund shares sold | | 1,842,936 |
Dividends receivable | | 177,130 |
Distributions receivable from Fidelity Central Funds | | 6,266 |
Other receivables | | 13,596 |
Total assets | | 545,575,310 |
| | |
Liabilities | | |
Payable for investments purchased | $ 13,562,285 | |
Payable for fund shares redeemed | 3,039,923 | |
Accrued management fee | 233,640 | |
Distribution and service plan fees payable | 186,071 | |
Other affiliated payables | 131,421 | |
Other payables and accrued expenses | 39,125 | |
Collateral on securities loaned, at value | 36,716,410 | |
Total liabilities | | 53,908,875 |
| | |
Net Assets | | $ 491,666,435 |
Net Assets consist of: | | |
Paid in capital | | $ 363,569,109 |
Accumulated net investment loss | | (43,728) |
Accumulated undistributed net realized gain (loss) on investments and foreign currency transactions | | 47,307,880 |
Net unrealized appreciation (depreciation) on investments and assets and liabilities in foreign currencies | | 80,833,174 |
Net Assets | | $ 491,666,435 |
Statement of Assets and Liabilities - continued
| July 31, 2011 |
| | |
Calculation of Maximum Offering Price Class A:
Net Asset Value and redemption price per share ($224,703,681 ÷ 8,776,018 shares) | | $ 25.60 |
| | |
Maximum offering price per share (100/94.25 of $25.60) | | $ 27.16 |
Class T:
Net Asset Value and redemption price per share ($123,606,030 ÷ 4,985,098 shares) | | $ 24.80 |
| | |
Maximum offering price per share (100/96.50 of $24.80) | | $ 25.70 |
Class B:
Net Asset Value and offering price per share ($20,364,553 ÷ 879,539 shares)A | | $ 23.15 |
| | |
Class C:
Net Asset Value and offering price per share ($77,749,390 ÷ 3,364,057 shares)A | | $ 23.11 |
| | |
Institutional Class:
Net Asset Value, offering price and redemption price per share ($45,242,781 ÷ 1,694,840 shares) | | $ 26.69 |
A Redemption price per share is equal to net asset value less any applicable contingent deferred sales charge.
See accompanying notes which are an integral part of the financial statements.
Annual Report
Statement of Operations
| Year ended July 31, 2011 |
| | |
Investment Income | | |
Dividends | | $ 3,129,981 |
Interest | | 2,132 |
Income from Fidelity Central Funds | | 151,730 |
Total income | | 3,283,843 |
| | |
Expenses | | |
Management fee | $ 2,465,724 | |
Transfer agent fees | 1,289,266 | |
Distribution and service plan fees | 2,036,212 | |
Accounting and security lending fees | 176,168 | |
Custodian fees and expenses | 36,735 | |
Independent trustees' compensation | 2,425 | |
Registration fees | 69,039 | |
Audit | 53,594 | |
Legal | 2,862 | |
Interest | 331 | |
Miscellaneous | 4,716 | |
Total expenses before reductions | 6,137,072 | |
Expense reductions | (36,903) | 6,100,169 |
Net investment income (loss) | | (2,816,326) |
Realized and Unrealized Gain (Loss) Net realized gain (loss) on: | | |
Investment securities: | | |
Unaffiliated issuers | 84,585,715 | |
Foreign currency transactions | (39,958) | |
Total net realized gain (loss) | | 84,545,757 |
Change in net unrealized appreciation (depreciation) on: Investment securities | 41,590,093 | |
Assets and liabilities in foreign currencies | 7,055 | |
Total change in net unrealized appreciation (depreciation) | | 41,597,148 |
Net gain (loss) | | 126,142,905 |
Net increase (decrease) in net assets resulting from operations | | $ 123,326,579 |
Statement of Changes in Net Assets
| Year ended
July 31,
2011 | Year ended
July 31,
2010 |
Increase (Decrease) in Net Assets | | |
Operations | | |
Net investment income (loss) | $ (2,816,326) | $ (2,420,957) |
Net realized gain (loss) | 84,545,757 | 38,061,892 |
Change in net unrealized appreciation (depreciation) | 41,597,148 | 5,982,346 |
Net increase (decrease) in net assets resulting from operations | 123,326,579 | 41,623,281 |
Share transactions - net increase (decrease) | (10,714,611) | (51,082,260) |
Redemption fees | 9,972 | 6,564 |
Total increase (decrease) in net assets | 112,621,940 | (9,452,415) |
| | |
Net Assets | | |
Beginning of period | 379,044,495 | 388,496,910 |
End of period (including accumulated net investment loss of $43,728 and undistributed net investment income of $0, respectively) | $ 491,666,435 | $ 379,044,495 |
See accompanying notes which are an integral part of the financial statements.
Annual Report
Financial Highlights - Class A
Years ended July 31, | 2011 | 2010 | 2009 | 2008 | 2007 |
Selected Per-Share Data | | | | | |
Net asset value, beginning of period | $ 19.01 | $ 17.15 | $ 19.72 | $ 22.90 | $ 23.77 |
Income from Investment Operations | | | | | |
Net investment income (loss) C | (.10) | (.07) | .02 | (.03) | (.03) |
Net realized and unrealized gain (loss) | 6.69 | 1.93 | (2.22) | (1.08) | 1.91 |
Total from investment operations | 6.59 | 1.86 | (2.20) | (1.11) | 1.88 |
Distributions from net realized gain | - | - | (.37) | (2.07) | (2.75) |
Redemption fees added to paid in capital C, G | - | - | - | - | - |
Net asset value, end of period | $ 25.60 | $ 19.01 | $ 17.15 | $ 19.72 | $ 22.90 |
Total Return A, B | 34.67% | 10.85% | (11.37)% | (5.64)% | 8.54% |
Ratios to Average Net Assets D, F | | | | | |
Expenses before reductions | 1.19% | 1.22% | 1.23% | 1.20% | 1.22% |
Expenses net of fee waivers, if any | 1.19% | 1.22% | 1.23% | 1.20% | 1.22% |
Expenses net of all reductions | 1.18% | 1.21% | 1.23% | 1.19% | 1.21% |
Net investment income (loss) | (.43)% | (.36)% | .11% | (.13)% | (.14)% |
Supplemental Data | | | | | |
Net assets, end of period (000 omitted) | $ 224,704 | $ 179,586 | $ 177,890 | $ 220,888 | $ 234,656 |
Portfolio turnover rate E | 125% | 103% | 172% | 134% | 141% |
A Total returns would have been lower if certain expenses had not been reduced during the applicable periods shown.
B Total returns do not include the effect of the sales charges.
C Calculated based on average shares outstanding during the period.
D Fees and expenses of any underlying Fidelity Central Funds are not included in the Fund's expense ratio. The Fund indirectly bears its proportionate share of the expenses of any underlying Fidelity Central Funds.
E Amount does not include the portfolio activity of any underlying Fidelity Central Funds.
F Expense ratios reflect operating expenses of the class. Expenses before reductions do not reflect amounts reimbursed by the investment adviser or reductions from brokerage service arrangements or reductions from other expense offset arrangements and do not represent the amount paid by the class during periods when reimbursements or reductions occur. Expenses net of fee waivers reflect expenses after reimbursement by the investment adviser but prior to reductions from brokerage service arrangements or other expense offset arrangements. Expenses net of all reductions represent the net expenses paid by the class.
G Amount represents less than $.01 per share.
Financial Highlights - Class T
Years ended July 31, | 2011 | 2010 | 2009 | 2008 | 2007 |
Selected Per-Share Data | | | | | |
Net asset value, beginning of period | $ 18.46 | $ 16.69 | $ 19.26 | $ 22.39 | $ 23.26 |
Income from Investment Operations | | | | | |
Net investment income (loss) C | (.16) | (.12) | (.02) | (.08) | (.09) |
Net realized and unrealized gain (loss) | 6.50 | 1.89 | (2.18) | (1.06) | 1.87 |
Total from investment operations | 6.34 | 1.77 | (2.20) | (1.14) | 1.78 |
Distributions from net realized gain | - | - | (.37) | (1.99) | (2.65) |
Redemption fees added to paid in capital C, G | - | - | - | - | - |
Net asset value, end of period | $ 24.80 | $ 18.46 | $ 16.69 | $ 19.26 | $ 22.39 |
Total Return A, B | 34.34% | 10.61% | (11.65)% | (5.86)% | 8.25% |
Ratios to Average Net Assets D, F | | | | | |
Expenses before reductions | 1.44% | 1.47% | 1.49% | 1.46% | 1.48% |
Expenses net of fee waivers, if any | 1.44% | 1.47% | 1.49% | 1.46% | 1.48% |
Expenses net of all reductions | 1.43% | 1.46% | 1.49% | 1.45% | 1.47% |
Net investment income (loss) | (.69)% | (.62)% | (.15)% | (.40)% | (.40)% |
Supplemental Data | | | | | |
Net assets, end of period (000 omitted) | $ 123,606 | $ 100,883 | $ 103,772 | $ 143,237 | $ 186,628 |
Portfolio turnover rate E | 125% | 103% | 172% | 134% | 141% |
A Total returns would have been lower if certain expenses had not been reduced during the applicable periods shown.
B Total returns do not include the effect of the sales charges.
C Calculated based on average shares outstanding during the period.
D Fees and expenses of any underlying Fidelity Central Funds are not included in the Fund's expense ratio. The Fund indirectly bears its proportionate share of the expenses of any underlying Fidelity Central Funds.
E Amount does not include the portfolio activity of any underlying Fidelity Central Funds.
F Expense ratios reflect operating expenses of the class. Expenses before reductions do not reflect amounts reimbursed by the investment adviser or reductions from brokerage service arrangements or reductions from other expense offset arrangements and do not represent the amount paid by the class during periods when reimbursements or reductions occur. Expenses net of fee waivers reflect expenses after reimbursement by the investment adviser but prior to reductions from brokerage service arrangements or other expense offset arrangements. Expenses net of all reductions represent the net expenses paid by the class.
G Amount represents less than $.01 per share.
See accompanying notes which are an integral part of the financial statements.
Annual Report
Financial Highlights - Class B
Years ended July 31, | 2011 | 2010 | 2009 | 2008 | 2007 |
Selected Per-Share Data | | | | | |
Net asset value, beginning of period | $ 17.32 | $ 15.74 | $ 18.27 | $ 21.29 | $ 22.17 |
Income from Investment Operations | | | | | |
Net investment income (loss) C | (.25) | (.20) | (.09) | (.18) | (.20) |
Net realized and unrealized gain (loss) | 6.08 | 1.78 | (2.07) | (.99) | 1.79 |
Total from investment operations | 5.83 | 1.58 | (2.16) | (1.17) | 1.59 |
Distributions from net realized gain | - | - | (.37) | (1.85) | (2.47) |
Redemption fees added to paid in capital C, G | - | - | - | - | - |
Net asset value, end of period | $ 23.15 | $ 17.32 | $ 15.74 | $ 18.27 | $ 21.29 |
Total Return A, B | 33.66% | 10.04% | (12.07)% | (6.30)% | 7.66% |
Ratios to Average Net Assets D, F | | | | | |
Expenses before reductions | 1.94% | 1.97% | 1.98% | 1.95% | 1.99% |
Expenses net of fee waivers, if any | 1.94% | 1.97% | 1.98% | 1.95% | 1.99% |
Expenses net of all reductions | 1.93% | 1.96% | 1.98% | 1.94% | 1.98% |
Net investment income (loss) | (1.19)% | (1.11)% | (.64)% | (.89)% | (.91)% |
Supplemental Data | | | | | |
Net assets, end of period (000 omitted) | $ 20,365 | $ 23,543 | $ 29,381 | $ 55,589 | $ 113,384 |
Portfolio turnover rate E | 125% | 103% | 172% | 134% | 141% |
A Total returns would have been lower if certain expenses had not been reduced during the applicable periods shown.
B Total returns do not include the effect of the contingent deferred sales charge.
C Calculated based on average shares outstanding during the period.
D Fees and expenses of any underlying Fidelity Central Funds are not included in the Fund's expense ratio. The Fund indirectly bears its proportionate share of the expenses of any underlying Fidelity Central Funds.
E Amount does not include the portfolio activity of any underlying Fidelity Central Funds.
F Expense ratios reflect operating expenses of the class. Expenses before reductions do not reflect amounts reimbursed by the investment adviser or reductions from brokerage service arrangements or reductions from other expense offset arrangements and do not represent the amount paid by the class during periods when reimbursements or reductions occur. Expenses net of fee waivers reflect expenses after reimbursement by the investment adviser but prior to reductions from brokerage service arrangements or other expense offset arrangements. Expenses net of all reductions represent the net expenses paid by the class.
G Amount represents less than $.01 per share.
Financial Highlights - Class C
Years ended July 31, | 2011 | 2010 | 2009 | 2008 | 2007 |
Selected Per-Share Data | | | | | |
Net asset value, beginning of period | $ 17.29 | $ 15.70 | $ 18.23 | $ 21.29 | $ 22.24 |
Income from Investment Operations | | | | | |
Net investment income (loss) C | (.24) | (.19) | (.09) | (.17) | (.19) |
Net realized and unrealized gain (loss) | 6.06 | 1.78 | (2.07) | (1.00) | 1.79 |
Total from investment operations | 5.82 | 1.59 | (2.16) | (1.17) | 1.60 |
Distributions from net realized gain | - | - | (.37) | (1.89) | (2.55) |
Redemption fees added to paid in capital C, G | - | - | - | - | - |
Net asset value, end of period | $ 23.11 | $ 17.29 | $ 15.70 | $ 18.23 | $ 21.29 |
Total Return A, B | 33.66% | 10.13% | (12.09)% | (6.31)% | 7.75% |
Ratios to Average Net Assets D, F | | | | | |
Expenses before reductions | 1.90% | 1.94% | 1.98% | 1.94% | 1.94% |
Expenses net of fee waivers, if any | 1.90% | 1.94% | 1.98% | 1.94% | 1.94% |
Expenses net of all reductions | 1.89% | 1.93% | 1.98% | 1.94% | 1.93% |
Net investment income (loss) | (1.15)% | (1.08)% | (.64)% | (.88)% | (.86)% |
Supplemental Data | | | | | |
Net assets, end of period (000 omitted) | $ 77,749 | $ 60,861 | $ 64,002 | $ 83,133 | $ 105,519 |
Portfolio turnover rate E | 125% | 103% | 172% | 134% | 141% |
A Total returns would have been lower if certain expenses had not been reduced during the applicable periods shown.
B Total returns do not include the effect of the contingent deferred sales charge.
C Calculated based on average shares outstanding during the period.
D Fees and expenses of any underlying Fidelity Central Funds are not included in the Fund's expense ratio. The Fund indirectly bears its proportionate share of the expenses of any underlying Fidelity Central Funds.
E Amount does not include the portfolio activity of any underlying Fidelity Central Funds.
F Expense ratios reflect operating expenses of the class. Expenses before reductions do not reflect amounts reimbursed by the investment adviser or reductions from brokerage service arrangements or reductions from other expense offset arrangements and do not represent the amount paid by the class during periods when reimbursements or reductions occur. Expenses net of fee waivers reflect expenses after reimbursement by the investment adviser but prior to reductions from brokerage service arrangements or other expense offset arrangements. Expenses net of all reductions represent the net expenses paid by the class.
G Amount represents less than $.01 per share.
See accompanying notes which are an integral part of the financial statements.
Annual Report
Financial Highlights - Institutional Class
Years ended July 31, | 2011 | 2010 | 2009 | 2008 | 2007 |
Selected Per-Share Data | | | | | |
Net asset value, beginning of period | $ 19.77 | $ 17.78 | $ 20.39 | $ 23.62 | $ 24.43 |
Income from Investment Operations | | | | | |
Net investment income (loss) B | (.03) | (.02) | .06 | .03 | .05 |
Net realized and unrealized gain (loss) | 6.95 | 2.01 | (2.30) | (1.12) | 1.96 |
Total from investment operations | 6.92 | 1.99 | (2.24) | (1.09) | 2.01 |
Distributions from net realized gain | - | - | (.37) | (2.14) | (2.82) |
Redemption fees added to paid in capital B, F | - | - | - | - | - |
Net asset value, end of period | $ 26.69 | $ 19.77 | $ 17.78 | $ 20.39 | $ 23.62 |
Total Return A | 35.00% | 11.19% | (11.19)% | (5.36)% | 8.90% |
Ratios to Average Net Assets C, E | | | | | |
Expenses before reductions | .89% | .96% | .98% | .93% | .88% |
Expenses net of fee waivers, if any | .89% | .96% | .98% | .93% | .88% |
Expenses net of all reductions | .88% | .95% | .98% | .92% | .87% |
Net investment income (loss) | (.13)% | (.10)% | .36% | .14% | .19% |
Supplemental Data | | | | | |
Net assets, end of period (000 omitted) | $ 45,243 | $ 14,172 | $ 13,452 | $ 18,825 | $ 22,174 |
Portfolio turnover rate D | 125% | 103% | 172% | 134% | 141% |
A Total returns would have been lower if certain expenses had not been reduced during the applicable periods shown.
B Calculated based on average shares outstanding during the period.
C Fees and expenses of any underlying Fidelity Central Funds are not included in the Fund's expense ratio. The Fund indirectly bears its proportionate share of the expenses of any underlying Fidelity Central Funds.
D Amount does not include the portfolio activity of any underlying Fidelity Central Funds.
E Expense ratios reflect operating expenses of the class. Expenses before reductions do not reflect amounts reimbursed by the investment adviser or reductions from brokerage service arrangements or reductions from other expense offset arrangements and do not represent the amount paid by the class during periods when reimbursements or reductions occur. Expenses net of fee waivers reflect expenses after reimbursement by the investment adviser but prior to reductions from brokerage service arrangements or other expense offset arrangements. Expenses net of all reductions represent the net expenses paid by the class.
F Amount represents less than $.01 per share.
See accompanying notes which are an integral part of the financial statements.
Annual Report
Notes to Financial Statements
For the period ended July 31, 2011
1. Organization.
Fidelity Advisor Health Care Fund (the Fund) is a non-diversified fund of Fidelity Advisor Series VII (the Trust) and is authorized to issue an unlimited number of shares. The Trust is registered under the Investment Company Act of 1940, as amended (the 1940 Act), as an open-end management investment company organized as a Massachusetts business trust. The Fund offers Class A, Class T, Class C and Institutional Class shares, each of which, along with Class B shares, has equal rights as to assets and voting privileges. Effective after the close of business on September 1, 2010, Class B shares were closed to new accounts and additional purchases, except for exchanges and reinvestments, by existing shareholders. Each class has exclusive voting rights with respect to matters that affect that class. Class B shares will automatically convert to Class A shares after a holding period of seven years from the initial date of purchase. Investment income, realized and unrealized capital gains and losses, the common expenses of the Fund, and certain fund-level expense reductions, if any, are allocated on a pro-rata basis to each class based on the relative net assets of each class to the total net assets of the Fund. Each class differs with respect to transfer agent and distribution and service plan fees incurred. Certain expense reductions may also differ by class.
2. Investments in Fidelity Central Funds.
The Fund invests in Fidelity Central Funds, which are open-end investment companies available only to other investment companies and accounts managed by Fidelity Management & Research Company (FMR) and its affiliates. The Fund's Schedule of Investments lists each of the Fidelity Central Funds held as of period end, if any, as an investment of the Fund, but does not include the underlying holdings of each Fidelity Central Fund. As an Investing Fund, the Fund indirectly bears its proportionate share of the expenses of the underlying Fidelity Central Funds.
The Money Market Central Funds seek preservation of capital and current income and are managed by Fidelity Investments Money Management, Inc. (FIMM), an affiliate of FMR.
A complete unaudited list of holdings for each Fidelity Central Fund is available upon request or at the Securities and Exchange Commission (the SEC) web site at www.sec.gov. In addition, the financial statements of the Fidelity Central Funds, which are not covered by the Fund's Report of Independent Registered Public Accounting Firm, are available on the SEC web site or upon request.
3. Significant Accounting Policies.
The financial statements have been prepared in conformity with accounting principles generally accepted in the United States of America (GAAP), which require management to make certain estimates and assumptions at the date of the financial statements. Actual results could differ from those estimates. Subsequent events, if any, through the date that the financial statements were issued have been evaluated in the preparation of the financial statements. The following summarizes the significant accounting policies of the Fund:
Security Valuation. Investments are valued as of 4:00 p.m. Eastern time on the last calendar day of the period. The Fund uses independent pricing services approved by the Board of Trustees to value its investments. When current market prices or quotations are not readily available or reliable, valuations may be determined in good faith in accordance with procedures adopted by the Board of Trustees. Factors used in determining value may include market or security specific events. The frequency with which these procedures are used cannot be predicted and they may be utilized to a significant extent. The value used for net asset value (NAV) calculation under these procedures may differ from published prices for the same securities.
The Fund categorizes the inputs to valuation techniques used to value its investments into a disclosure hierarchy consisting of three levels as shown below:
Level 1 - quoted prices in active markets for identical investments
Level 2 - other significant observable inputs (including quoted prices for similar investments, interest rates, prepayment speeds, etc.)
Level 3 - unobservable inputs (including the Fund's own assumptions based on the best information available)
Changes in valuation techniques may result in transfers in or out of an assigned level within the disclosure hierarchy. The aggregate value of investments by input level, as of July 31, 2011, as well as a roll forward of Level 3 securities, is included at the end of the Fund's Schedule of Investments. Valuation techniques used to value the Fund's investments by major category are as follows:
Equity securities, including restricted securities, for which market quotations are readily available, are valued at the last reported sale price or official closing price as reported by an independent pricing service on the primary market or exchange on which they are traded and are categorized as Level 1 in the hierarchy. In the event there were no sales during the day or closing prices are not available, securities are valued at the last quoted bid price or may be valued using the last available price and are generally categorized as Level 2 in the hierarchy. For foreign equity securities, when significant market or security specific events arise, comparisons to the valuation of American Depositary Receipts (ADRs), futures contracts, Exchange-traded funds (ETFs) and certain indexes as well as quoted prices for similar securities are used and are categorized as Level 2 in the hierarchy in these
Annual Report
Notes to Financial Statements - continued
3. Significant Accounting Policies - continued
Security Valuation - continued
circumstances. Utilizing these techniques may result in transfers between Level 1 and Level 2. For restricted equity securities and private placements where observable inputs are limited, assumptions about market activity and risk are used and are categorized as Level 3 in the hierarchy.
Investments in open-end mutual funds, including the Fidelity Central Funds, are valued at their closing net asset value each business day and are categorized as Level 1 in the hierarchy.
Foreign Currency. The Fund may use foreign currency contracts to facilitate transactions in foreign-denominated securities. Gains and losses from these transactions may arise from changes in the value of the foreign currency or if the counterparties do not perform under the contracts' terms.
Foreign-denominated assets, including investment securities, and liabilities are translated into U.S. dollars at the exchange rate at period end. Purchases and sales of investment securities, income and dividends received and expenses denominated in foreign currencies are translated into U.S. dollars at the exchange rate in effect on the transaction date.
The effects of exchange rate fluctuations on investments are included with the net realized and unrealized gain (loss) on investment securities. Other foreign currency transactions resulting in realized and unrealized gain (loss) are disclosed separately.
Investment Transactions and Income. For financial reporting purposes, the Fund's investment holdings and NAV include trades executed through the end of the last business day of the period. The NAV per share for processing shareholder transactions is calculated as of the close of business of the New York Stock Exchange (NYSE), normally 4:00 p.m. Eastern time and includes trades executed through the end of the prior business day. Gains and losses on securities sold are determined on the basis of identified cost and may include proceeds received from litigation. Dividend income is recorded on the ex-dividend date, except for certain dividends from foreign securities where the ex-dividend date may have passed, which are recorded as soon as the Fund is informed of the ex-dividend date. Non-cash dividends included in dividend income, if any, are recorded at the fair market value of the securities received. Distributions received on securities that represent a return of capital or capital gain are recorded as a reduction of cost of investments and/or as a realized gain. The Fund estimates the components of distributions received that may be considered return of capital distributions or capital gain distributions. Interest income includes coupon interest and amortization of premium and accretion of discount on debt securities. Investment income is recorded net of foreign taxes withheld where recovery of such taxes is uncertain.
Expenses. Expenses directly attributable to a fund are charged to that fund. Expenses attributable to more than one fund are allocated among the respective funds on the basis of relative net assets or other appropriate methods. Expense estimates are accrued in the period to which they relate and adjustments are made when actual amounts are known.
Income Tax Information and Distributions to Shareholders. Each year, the Fund intends to qualify as a regulated investment company, including distributing substantially all of its taxable income and realized gains under Subchapter M of the Internal Revenue Code and filing its U.S. federal tax return. As a result, no provision for income taxes is required. As of July 31, 2011, the Fund did not have any unrecognized tax benefits in the financial statements. A fund's federal tax return is subject to examination by the Internal Revenue Service (IRS) for a period of three years. Foreign taxes are provided for based on the Fund's understanding of the tax rules and rates that exist in the foreign markets in which it invests.
Distributions are declared and recorded on the ex-dividend date. Income dividends and capital gain distributions are declared separately for each class. Income and capital gain distributions are determined in accordance with income tax regulations, which may differ from GAAP. In addition, the Fund claimed a portion of the payment made to redeeming shareholders as a distribution for income tax purposes.
Capital accounts within the financial statements are adjusted for permanent book-tax differences. These adjustments have no impact on net assets or the results of operations. Temporary book-tax differences will reverse in a subsequent period.
Book-tax differences are primarily due to foreign currency transactions, deferred trustees compensation, net operating losses, capital loss carryforwards and losses deferred due to wash sales and excise tax regulations.
The federal tax cost of investment securities and unrealized appreciation (depreciation) as of period end were as follows:
Gross unrealized appreciation | $ 92,525,825 |
Gross unrealized depreciation | (12,824,408) |
Net unrealized appreciation (depreciation) on securities and other investments | $ 79,701,417 |
| |
Tax Cost | $ 446,750,366 |
Annual Report
3. Significant Accounting Policies - continued
Income Tax Information and Distributions to Shareholders - continued
The tax-based components of distributable earnings as of period end were as follows:
Undistributed long-term capital gain | $ 48,436,859 |
Net unrealized appreciation (depreciation) | $ 79,704,196 |
Under the recently enacted Regulated Investment Company Modernization Act of 2010 (the Act), the Fund will be permitted to carry forward capital losses incurred in taxable years beginning after December 22, 2010 for an unlimited period. However, any losses incurred during those future taxable years will be required to be utilized prior to any losses incurred in pre-enactment taxable years, which generally expire after eight years from when they are incurred. Additionally, post-enactment capital losses that are carried forward will retain their character as either short-term or long-term capital losses rather than being considered all short-term as under previous law. The Fund's first fiscal year end subject to the Act will be July 31, 2012.
Short-Term Trading (Redemption) Fees. Shares held by investors in the Fund less than 30 days are subject to a redemption fee equal to .75% of the net asset value of shares redeemed. All redemption fees, which reduce the proceeds of the shareholder redemption, are retained by the Fund and accounted for as an addition to paid in capital.
New Accounting Pronouncement. In May 2011, the Financial Accounting Standards Board issued Accounting Standard Update No. 2011-04, Fair Value Measurement (Topic 820) - Amendments to Achieve Common Fair Value Measurement and Disclosure Requirements in U.S. GAAP and IFRSs. The update changes the wording used to describe the requirements in GAAP for measuring fair value and for disclosing information about fair value measurements. The update is effective during interim and annual periods beginning after December 15, 2011. Management is currently evaluating the impact of the update's adoption on the Fund's financial statement disclosures.
4. Operating Policies.
Restricted Securities. The Fund may invest in securities that are subject to legal or contractual restrictions on resale. These securities generally may be resold in transactions exempt from registration or to the public if the securities are registered. Disposal of these securities may involve time-consuming negotiations and expense, and prompt sale at an acceptable price may be difficult. Information regarding restricted securities is included at the end of the Fund's Schedule of Investments.
5. Purchases and Sales of Investments.
Purchases and sales of securities, other than short-term securities, aggregated $537,309,093 and $549,592,335, respectively.
6. Fees and Other Transactions with Affiliates.
Management Fee. FMR and its affiliates provide the Fund with investment management related services for which the Fund pays a monthly management fee. The management fee is the sum of an individual fund fee rate that is based on an annual rate of .30% of the Fund's average net assets and a group fee rate that averaged .26% during the period. The group fee rate is based upon the average net assets of all the mutual funds advised by FMR. The group fee rate decreases as assets under management increase and increases as assets under management decrease. For the period, the total annual management fee rate was .56% of the Fund's average net assets.
Distribution and Service Plan Fees. In accordance with Rule 12b-1 of the 1940 Act, the Fund has adopted separate Distribution and Service Plans for each class of shares. Certain classes pay Fidelity Distributors Corporation (FDC), an affiliate of FMR, separate Distribution and Service Fees, each of which is based on an annual percentage of each class' average net assets. In addition, FDC may pay financial intermediaries for selling shares of the Fund and providing shareholder support services. For the period, the Distribution and Service Fee rates, total fees and amounts retained by FDC were as follows:
| Distribution
Fee | Service
Fee | Total Fees | Retained
by FDC |
Class A | -% | .25% | $ 520,630 | $ 5,536 |
Class T | .25% | .25% | 586,852 | 1,478 |
Class B | .75% | .25% | 225,260 | 169,566 |
Class C | .75% | .25% | 703,470 | 43,391 |
| | | $ 2,036,212 | $ 219,971 |
Annual Report
Notes to Financial Statements - continued
6. Fees and Other Transactions with Affiliates - continued
Sales Load. FDC may receive a front-end sales charge of up to 5.75% for selling Class A shares, and 3.50% for selling Class T shares, some of which is paid to financial intermediaries for selling shares of the Fund. Depending on the holding period, FDC may receive contingent deferred sales charges levied on Class A, Class T, Class B, and Class C redemptions. The deferred sales charges range from 5% to 1% for Class B, 1% for Class C, 1.00% for certain purchases of Class A shares and .25% for certain purchases of Class T shares.
For the period, sales charge amounts retained by FDC were as follows:
| Retained
by FDC |
Class A | $ 44,219 |
Class T | 13,313 |
Class B* | 35,464 |
Class C* | 2,266 |
| $ 95,262 |
* When Class B and Class C shares are initially sold, FDC pays commissions from its own resources to financial intermediaries through which the sales are made.
Transfer Agent Fees. Fidelity Investments Institutional Operations Company, Inc. (FIIOC), an affiliate of FMR, is the transfer, dividend disbursing and shareholder servicing agent for each class of the Fund. FIIOC receives account fees and asset-based fees that vary according to the account size and type of account of the shareholders of the respective classes of the Fund. FIIOC pays for typesetting, printing and mailing of shareholder reports, except proxy statements. For the period, transfer agent fees for each class were as follows:
| Amount | % of
Average
Net Assets |
Class A | $ 622,891 | .30 |
Class T | 353,675 | .30 |
Class B | 67,583 | .30 |
Class C | 185,486 | .26 |
Institutional Class | 59,631 | .25 |
| $ 1,289,266 | |
Accounting and Security Lending Fees. Fidelity Service Company, Inc. (FSC), an affiliate of FMR, maintains the Fund's accounting records. The accounting fee is based on the level of average net assets for the month. Under a separate contract, FSC administers the security lending program. The security lending fee is based on the number and duration of lending transactions.
Brokerage Commissions. The Fund placed a portion of its portfolio transactions with brokerage firms which are affiliates of the investment adviser. The commissions paid to these affiliated firms were $8,768 for the period.
Interfund Lending Program. Pursuant to an Exemptive Order issued by the SEC, the Fund, along with other registered investment companies having management contracts with FMR, may participate in an interfund lending program. This program provides an alternative credit facility allowing the funds to borrow from, or lend money to, other participating affiliated funds. At period end, there were no interfund loans outstanding. The Fund's activity in this program during the period for which loans were outstanding was as follows:
Borrower or Lender | Average Daily
Loan Balance | Weighted Average Interest Rate | Interest
Expense |
Borrower | $ 6,447,400 | .37% | $ 331 |
7. Committed Line of Credit.
The Fund participates with other funds managed by FMR or an affiliate in a $4.0 billion credit facility (the "line of credit") to be utilized for temporary or emergency purposes to fund shareholder redemptions or for other short-term liquidity purposes. The Fund has agreed to pay commitment fees on its pro-rata portion of the line of credit, which amounted to $1,443 and is reflected in Miscellaneous expenses on the Statement of Operations. During the period, there were no borrowings on this line of credit.
8. Security Lending.
The Fund lends portfolio securities through a lending agent from time to time in order to earn additional income. The lending agent may loan securities to certain qualified borrowers, including Fidelity Capital Markets (FCM), a broker-dealer affiliated with the Fund. On the settlement date of the loan,
Annual Report
8. Security Lending - continued
the Fund receives collateral (in the form of U.S. Treasury obligations, letters of credit and/or cash) against the loaned securities and maintains collateral in an amount not less than 100% of the market value of the loaned securities during the period of the loan. The market value of the loaned securities is determined at the close of business of the Fund and any additional required collateral is delivered to the Fund on the next business day. If the borrower defaults on its obligation to return the securities loaned because of insolvency or other reasons, a fund could experience delays and costs in recovering the securities loaned or in gaining access to the collateral. Any cash collateral received is invested in the Fidelity Securities Lending Cash Central Fund. The value of loaned securities and cash collateral at period end are disclosed on the Fund's Statement of Assets and Liabilities. Security lending income represents the income earned on investing cash collateral, less rebates paid to borrowers and lending agent fees associated with the loan, plus any premium payments received for lending certain types of securities. Security lending income is presented in the Statement of Operations as a component of income from Fidelity Central Funds, and includes $25 from securities loaned to FCM. Total security lending income during the period amounted to $136,970.
9. Expense Reductions.
Many of the brokers with whom FMR places trades on behalf of the Fund provided services to the Fund in addition to trade execution. These services included payments of certain expenses on behalf of the Fund totaling $36,903 for the period.
10. Share Transactions.
Transactions for each class of shares were as follows:
| Shares | Dollars |
Years ended July 31, | 2011 | 2010 | 2011 | 2010 |
Class A | | | | |
Shares sold | 2,257,884 | 1,348,328 | $ 55,506,569 | $ 26,342,454 |
Shares redeemed | (2,927,010) | (2,277,034) | (69,236,135) | (43,802,733) |
Net increase (decrease) | (669,126) | (928,706) | $ (13,729,566) | $ (17,460,279) |
Class T | | | | |
Shares sold | 610,720 | 653,249 | $ 14,273,371 | $ 12,596,630 |
Shares redeemed | (1,090,770) | (1,405,398) | (24,737,327) | (26,754,410) |
Net increase (decrease) | (480,050) | (752,149) | $ (10,463,956) | $ (14,157,780) |
Class B | | | | |
Shares sold | 46,091 | 142,178 | $ 1,030,863 | $ 2,538,751 |
Shares redeemed | (525,569) | (649,613) | (10,871,447) | (11,572,231) |
Net increase (decrease) | (479,478) | (507,435) | $ (9,840,584) | $ (9,033,480) |
Class C | | | | |
Shares sold | 524,474 | 307,711 | $ 11,843,311 | $ 5,532,717 |
Shares redeemed | (681,222) | (862,744) | (14,258,065) | (15,167,135) |
Net increase (decrease) | (156,748) | (555,033) | $ (2,414,754) | $ (9,634,418) |
Institutional Class | | | | |
Shares sold | 1,277,086 | 188,384 | $ 33,336,034 | $ 3,842,212 |
Shares redeemed | (299,253) | (227,941) | (7,601,785) | (4,638,515) |
Net increase (decrease) | 977,833 | (39,557) | $ 25,734,249 | $ (796,303) |
11. Other.
The Fund's organizational documents provide former and current trustees and officers with a limited indemnification against liabilities arising in connection with the performance of their duties to the Fund. In the normal course of business, the Fund may also enter into contracts that provide general indemnifications. The Fund's maximum exposure under these arrangements is unknown as this would be dependent on future claims that may be made against the Fund. The risk of material loss from such claims is considered remote.
Annual Report
Fidelity Advisor Industrials Fund - Institutional Class
Performance: The Bottom Line
Average annual total return reflects the change in the value of an investment, assuming reinvestment of the class' distributions from dividend income and capital gains (the profits earned upon the sale of securities that have grown in value, if any) and assuming a constant rate of performance each year. The $10,000 table and the fund's returns do not reflect the deduction of taxes that a shareholder would pay on fund distributions or the redemption of fund shares. During periods of reimbursement by Fidelity, a fund's total return will be greater than it would be had the reimbursement not occurred. How a fund did yesterday is no guarantee of how it will do tomorrow.
Average Annual Total Returns
Periods ended July 31, 2011 | Past 1
year | Past 5
years | Past 10
years |
Institutional Class A | 19.95% | 7.52% | 8.98% |
A Prior to October 1, 2006, Fidelity Advisor Industrials Fund operated under certain different investment policies. The historical performance for the fund may not represent its current investment policies.
$10,000 Over 10 Years
Let's say hypothetically that $10,000 was invested in Fidelity Advisor Industrials Fund - Institutional Class on July 31, 2001. The chart shows how the value of your investment would have changed, and also shows how the S&P 500 Index performed over the same period.
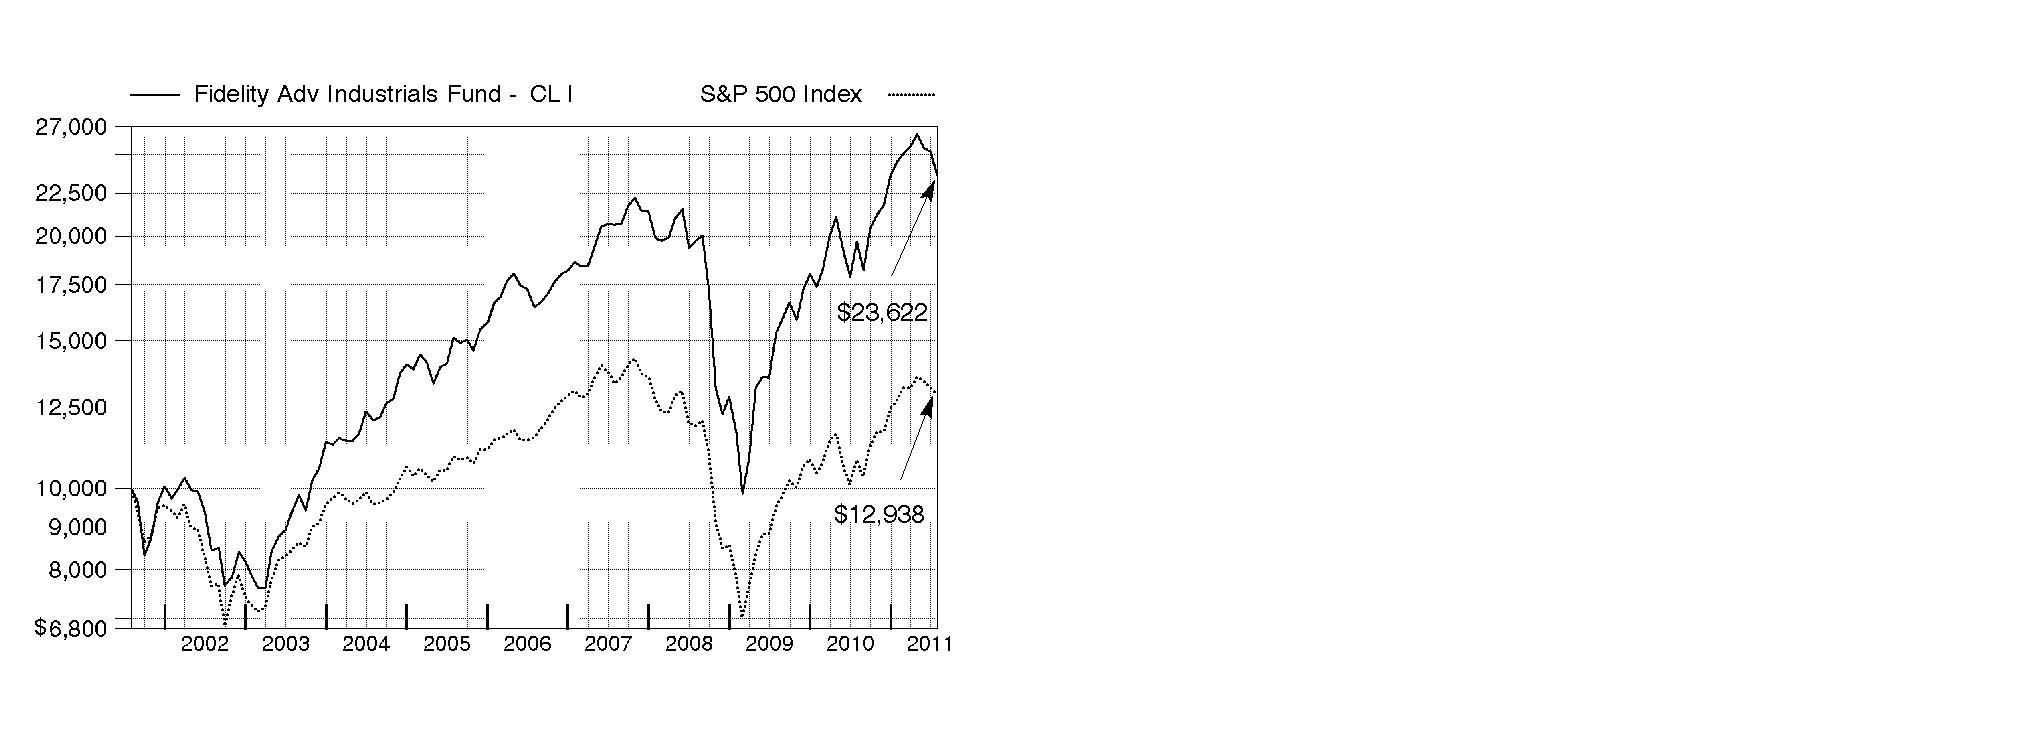
Annual Report
Fidelity Advisor Industrials Fund
Market Recap: U.S. stocks registered solid double-digit gains for the 12 months ending July 31, 2011, extending a rally that began more than two years earlier. Despite a rough start in August 2010, markets turned positive in September, as increased demand for capital goods and other upbeat indicators trumped investor worry about a U.S. recessionary relapse. The broad market, as measured by the S&P 500® Index, rose 9% that month, its biggest September gain in 71 years. Seven more monthly advances followed, fueled by encouraging corporate earnings and economic activity. However, volatility picked up in the period's latter months, as markets reacted to continued high U.S. unemployment, nagging debt troubles in Europe and looming legislative battles over the federal debt ceiling. May unemployment rose above 9% for the first time in 2011, contributing to a traditional "June swoon" for stocks. Market uncertainty lingered in July, when the S&P 500® posted its second-biggest monthly loss of the period. For the full year, the S&P 500® climbed 19.65%, while the blue-chip-laden Dow Jones Industrial AverageSM rose a comparable 19.09% and the technology-heavy Nasdaq Composite® Index gained 23.40%. On the capitalization spectrum, stocks of mid-cap companies fared best, with the Russell Midcap® Index rising 24.51% and the small-cap Russell 2000® Index adding 23.92%.
Comments from Tobias Welo, Portfolio Manager of Fidelity Advisor® Industrials Fund: During the past year, the fund's Class A, Class T, Class B and Class C shares returned 19.59%, 19.28%, 18.64% and 18.69%, respectively (excluding sales charges), ahead of the 17.57% gain of the MSCI® U.S. IM Industrials 25/50 Index but a bit behind the S&P 500. Versus the MSCI index, solid picks in aerospace/defense, where I favored commercial aerospace firms and underweighted defense companies, bolstered performance. Negligible exposure to the weak-performing airline industry also aided performance. A large average underweighting made Boeing the fund's top individual contributor to relative performance, as delays in bringing the company's 787 Dreamliner® aircraft to market caused its stock to underperform. That said, I thought Boeing might be due for a stretch of outperformance, given the Dreamliner's projected completion date in 2012. Consequently, I added to the fund's stake in Boeing, making it our ninth-largest holding by period end. Other contributors included rail carrier Union Pacific, which generated record second-quarter earnings, despite severe flooding in the Midwest. During the period, the company also hiked its dividend and announced a new share repurchase plan. An out-of-index position in Mills Estruturas e Servicos de Engenharia, a Brazilian company providing scaffolding and concrete forms for the construction industry, also aided performance, as did timely ownership of mining equipment manufacturer Bucyrus International, which in November 2010 received a lucrative takeover bid from Caterpillar - a deal that was completed in July. Not owning weak-performing benchmark component Delta Air Lines helped as well. Conversely, security selection in industrial machinery detracted, as did the fund's foreign holdings, despite the tail wind from a weaker U.S. dollar. At the stock level, underweighting and ultimately selling rail carrier Norfolk Southern was a mistake in light of the stock's relatively strong performance. Although I thought its shares were fully valued, the company announced better-than-expected first- and second-quarter financial results, which rallied its stock. A small out-of-index position in China-based SmartHeat, which sells clean technology plate heat exchangers (PHEs) and related systems, detracted and was sold from the fund. Overweighting Ingersoll-Rand, a manufacturer of climate control and refrigeration systems, worked well until the stock fell sharply near period end - partly on concern about a slowing U.S. economy.
Comments from Tobias Welo, Portfolio Manager of Fidelity Advisor® Industrials Fund: During the past year, the fund's Institutional Class shares returned 19.95%, ahead of the 17.57% gain of the MSCI® U.S. IM Industrials 25/50 Index and the S&P 500. Versus the MSCI index, solid picks in aerospace/defense, where I favored commercial aerospace firms and underweighted defense companies, bolstered performance. Negligible exposure to the weak-performing airline industry also aided performance. A large average underweighting made Boeing the fund's top individual contributor to relative performance, as delays in bringing the company's 787 Dreamliner® aircraft to market caused its stock to underperform. That said, I thought Boeing might be due for a stretch of outperformance, given the Dreamliner's projected completion date in 2012. Consequently, I added to the fund's stake in Boeing, making it our ninth-largest holding by period end. Other contributors included rail carrier Union Pacific, which generated record second-quarter earnings, despite severe flooding in the Midwest. During the period, the company also hiked its dividend and announced a new share repurchase plan. An out-of-index position in Mills Estruturas e Servicos de Engenharia, a Brazilian company providing scaffolding and concrete forms for the construction industry, also aided performance, as did timely ownership of mining equipment manufacturer Bucyrus International, which in November 2010 received a lucrative takeover bid from Caterpillar - a deal that was completed in July. Not owning weak-performing benchmark component Delta Air Lines helped as well. Conversely, security selection in industrial machinery detracted, as did the fund's foreign holdings, despite the tail wind from a weaker U.S. dollar. At the stock level, underweighting and ultimately selling rail carrier Norfolk Southern was a mistake in light of the stock's relatively strong performance. Although I thought its shares were fully valued, the company announced better-than-expected first- and second-quarter financial results, which rallied its stock. A small out-of-index position in China-based SmartHeat, which sells clean technology plate heat exchangers (PHEs) and related systems, detracted and was sold from the fund. Overweighting Ingersoll-Rand, a manufacturer of climate control and refrigeration systems, worked well until the stock fell sharply near period end - partly on concern about a slowing U.S. economy.
The views expressed above reflect those of the portfolio manager(s) only through the end of the period as stated on the cover of this report and do not necessarily represent the views of Fidelity or any other person in the Fidelity organization. Any such views are subject to change at any time based upon market or other conditions and Fidelity disclaims any responsibility to update such views. These views may not be relied on as investment advice and, because investment decisions for a Fidelity fund are based on numerous factors, may not be relied on as an indication of trading intent on behalf of any Fidelity fund.
Annual Report
Fidelity Advisor Industrials Fund
As a shareholder of the Fund, you incur two types of costs: (1) transaction costs, including sales charges (loads) on purchase payments or redemption proceeds, redemption fees, and (2) ongoing costs, including management fees, distribution and/or service (12b-1) fees and other Fund expenses. This Example is intended to help you understand your ongoing costs (in dollars) of investing in the Fund and to compare these costs with the ongoing costs of investing in other mutual funds.
The Example is based on an investment of $1,000 invested at the beginning of the period and held for the entire period (February 1, 2011 to July 31, 2011).
Actual Expenses
The first line of the accompanying table for each class of the Fund provides information about actual account values and actual expenses. You may use the information in this line, together with the amount you invested, to estimate the expenses that you paid over the period. Simply divide your account value by $1,000.00 (for example, an $8,600 account value divided by $1,000.00 = 8.6), then multiply the result by the number in the first line for a class of the Fund under the heading entitled "Expenses Paid During Period" to estimate the expenses you paid on your account during this period. In addition, the Fund, as a shareholder in the underlying Fidelity Central Funds, will indirectly bear its pro-rata share of the fees and expenses incurred by the underlying Fidelity Central Funds. These fees and expenses are not included in the Fund's annualized expense ratio used to calculate the expense estimate in the table below.
Hypothetical Example for Comparison Purposes
The second line of the accompanying table for each class of the Fund provides information about hypothetical account values and hypothetical expenses based on a Class' actual expense ratio and an assumed rate of return of 5% per year before expenses, which is not the Class' actual return. The hypothetical account values and expenses may not be used to estimate the actual ending account balance or expenses you paid for the period. You may use this information to compare the ongoing costs of investing in the Fund and other funds. To do so, compare this 5% hypothetical example with the 5% hypothetical examples that appear in the shareholder reports of the other funds. In addition, the Fund, as a shareholder in the underlying Fidelity Central Funds, will indirectly bear its pro-rata share of the fees and expenses incurred by the underlying Fidelity Central Funds. These fees and expenses are not included in the Fund's annualized expense ratio used to calculate the expense estimate in the table below.
Please note that the expenses shown in the table are meant to highlight your ongoing costs only and do not reflect any transaction costs. Therefore, the second line of the table is useful in comparing ongoing costs only, and will not help you determine the relative total costs of owning different funds. In addition, if these transactional costs were included, your costs would have been higher.
| Annualized
Expense Ratio | Beginning
Account Value
February 1, 2011 | Ending
Account Value
July 31, 2011 | Expenses Paid
During Period*
February 1, 2011 to
July 31, 2011 |
Class A | 1.11% | | | |
Actual | | $ 1,000.00 | $ 962.20 | $ 5.40 |
HypotheticalA | | $ 1,000.00 | $ 1,019.29 | $ 5.56 |
Class T | 1.37% | | | |
Actual | | $ 1,000.00 | $ 960.90 | $ 6.66 |
HypotheticalA | | $ 1,000.00 | $ 1,018.00 | $ 6.85 |
Class B | 1.92% | | | |
Actual | | $ 1,000.00 | $ 958.10 | $ 9.32 |
HypotheticalA | | $ 1,000.00 | $ 1,015.27 | $ 9.59 |
Class C | 1.87% | | | |
Actual | | $ 1,000.00 | $ 958.60 | $ 9.08 |
HypotheticalA | | $ 1,000.00 | $ 1,015.52 | $ 9.35 |
Institutional Class | .83% | | | |
Actual | | $ 1,000.00 | $ 963.50 | $ 4.04 |
HypotheticalA | | $ 1,000.00 | $ 1,020.68 | $ 4.16 |
A 5% return per year before expenses
* Expenses are equal to each Class' annualized expense ratio, multiplied by the average account value over the period, multiplied by 181/365 (to reflect the one-half year period).
Annual Report
Fidelity Advisor Industrials Fund
Investment Changes (Unaudited)
Top Ten Stocks as of July 31, 2011 |
| % of fund's
net assets | % of fund's net assets
6 months ago |
General Electric Co. | 13.5 | 13.6 |
United Technologies Corp. | 6.0 | 5.5 |
Union Pacific Corp. | 5.0 | 3.6 |
Emerson Electric Co. | 3.7 | 3.4 |
Danaher Corp. | 3.7 | 2.6 |
Cummins, Inc. | 3.3 | 2.0 |
Honeywell International, Inc. | 3.2 | 3.0 |
Ingersoll-Rand Co. Ltd. | 3.1 | 2.1 |
The Boeing Co. | 2.9 | 2.3 |
Tyco International Ltd. | 2.5 | 1.0 |
| 46.9 | |
Top Industries (% of fund's net assets) |
As of July 31, 2011 |
| Aerospace & Defense | 21.9% | |
| Industrial Conglomerates | 21.8% | |
| Machinery | 16.7% | |
| Electrical Equipment | 11.8% | |
| Construction & Engineering | 6.9% | |
| All Others* | 20.9% | |

As of January 31, 2011 |
| Machinery | 20.2% | |
| Industrial Conglomerates | 19.5% | |
| Aerospace & Defense | 18.7% | |
| Electrical Equipment | 10.2% | |
| Road & Rail | 7.5% | |
| All Others* | 23.9% | |

* Includes short-term investments and net other assets. |
Annual Report
Fidelity Advisor Industrials Fund
Investments July 31, 2011
Showing Percentage of Net Assets
Common Stocks - 98.6% |
| Shares | | Value |
AEROSPACE & DEFENSE - 21.9% |
Aerospace & Defense - 21.9% |
Esterline Technologies Corp. (a) | 57,717 | | $ 4,407,847 |
GeoEye, Inc. (a) | 46,916 | | 1,874,763 |
Goodrich Corp. | 78,500 | | 7,468,490 |
Honeywell International, Inc. | 281,495 | | 14,947,385 |
MTU Aero Engines Holdings AG | 16,274 | | 1,205,175 |
Precision Castparts Corp. | 50,014 | | 8,071,259 |
Rockwell Collins, Inc. | 133,497 | | 7,354,350 |
Textron, Inc. | 514,599 | | 11,902,675 |
The Boeing Co. | 194,284 | | 13,691,193 |
TransDigm Group, Inc. (a) | 39,587 | | 3,565,601 |
United Technologies Corp. | 342,886 | | 28,404,676 |
| | 102,893,414 |
AIR FREIGHT & LOGISTICS - 0.8% |
Air Freight & Logistics - 0.8% |
C.H. Robinson Worldwide, Inc. | 54,146 | | 3,915,297 |
AIRLINES - 0.5% |
Airlines - 0.5% |
Copa Holdings SA Class A | 38,000 | | 2,493,180 |
AUTO COMPONENTS - 0.5% |
Auto Parts & Equipment - 0.5% |
TRW Automotive Holdings Corp. (a) | 45,980 | | 2,320,611 |
BUILDING PRODUCTS - 3.2% |
Building Products - 3.2% |
A.O. Smith Corp. | 68,101 | | 2,824,148 |
Armstrong World Industries, Inc. | 63,500 | | 2,508,250 |
Lennox International, Inc. | 71,900 | | 2,658,862 |
Owens Corning (a) | 151,261 | | 5,381,866 |
Quanex Building Products Corp. | 94,727 | | 1,484,372 |
| | 14,857,498 |
COMMERCIAL SERVICES & SUPPLIES - 3.1% |
Diversified Support Services - 0.6% |
Ritchie Brothers Auctioneers, Inc. (d) | 92,900 | | 2,544,531 |
Environmental & Facility Services - 1.6% |
Republic Services, Inc. | 264,832 | | 7,688,073 |
Office Services & Supplies - 0.4% |
Mine Safety Appliances Co. | 58,930 | | 2,010,692 |
Security & Alarm Services - 0.5% |
The Geo Group, Inc. (a) | 100,641 | | 2,093,333 |
TOTAL COMMERCIAL SERVICES & SUPPLIES | | 14,336,629 |
CONSTRUCTION & ENGINEERING - 6.9% |
Construction & Engineering - 6.9% |
AECOM Technology Corp. (a) | 94,100 | | 2,328,034 |
Aveng Ltd. | 25,100 | | 134,413 |
Dycom Industries, Inc. (a) | 92,300 | | 1,572,792 |
EMCOR Group, Inc. (a) | 202,899 | | 5,664,940 |
|
| Shares | | Value |
Fluor Corp. | 89,060 | | $ 5,657,982 |
Foster Wheeler AG (a) | 212,731 | | 5,765,010 |
Jacobs Engineering Group, Inc. (a) | 102,301 | | 4,004,061 |
MYR Group, Inc. (a) | 40,659 | | 987,607 |
Quanta Services, Inc. (a) | 201,000 | | 3,722,520 |
SNC-Lavalin Group, Inc. | 44,600 | | 2,521,296 |
| | 32,358,655 |
ELECTRICAL EQUIPMENT - 11.6% |
Electrical Components & Equipment - 10.7% |
AMETEK, Inc. | 112,500 | | 4,781,250 |
Cooper Industries PLC Class A | 103,823 | | 5,430,981 |
Emerson Electric Co. | 358,429 | | 17,595,280 |
GrafTech International Ltd. (a) | 361,000 | | 6,952,860 |
Polypore International, Inc. (a) | 26,300 | | 1,788,400 |
Prysmian SpA | 309,376 | | 5,738,842 |
Regal-Beloit Corp. | 43,912 | | 2,662,385 |
Roper Industries, Inc. | 61,400 | | 5,012,082 |
| | 49,962,080 |
Heavy Electrical Equipment - 0.9% |
Alstom SA | 82,064 | | 4,333,917 |
TOTAL ELECTRICAL EQUIPMENT | | 54,295,997 |
ENERGY EQUIPMENT & SERVICES - 0.5% |
Oil & Gas Equipment & Services - 0.5% |
Dresser-Rand Group, Inc. (a) | 44,052 | | 2,353,258 |
INDUSTRIAL CONGLOMERATES - 21.8% |
Industrial Conglomerates - 21.8% |
3M Co. | 52,820 | | 4,602,735 |
Carlisle Companies, Inc. | 83,593 | | 3,613,725 |
Danaher Corp. | 354,282 | | 17,398,789 |
General Electric Co. | 3,529,350 | | 63,210,657 |
Koninklijke Philips Electronics NV | 66,500 | | 1,651,637 |
Tyco International Ltd. | 270,014 | | 11,958,920 |
| | 102,436,463 |
MACHINERY - 16.7% |
Construction & Farm Machinery & Heavy Trucks - 6.5% |
Caterpillar, Inc. | 47,394 | | 4,682,053 |
Cummins, Inc. | 145,524 | | 15,262,557 |
Fiat Industrial SpA (a) | 380,900 | | 5,037,861 |
Jain Irrigation Systems Ltd. | 987,235 | | 3,889,987 |
Sauer-Danfoss, Inc. (a) | 32,200 | | 1,529,500 |
| | 30,401,958 |
Industrial Machinery - 10.2% |
Actuant Corp. Class A | 134,860 | | 3,332,391 |
Charter International PLC | 271,031 | | 3,559,396 |
Flowserve Corp. | 65,100 | | 6,469,638 |
Graco, Inc. | 72,800 | | 3,198,104 |
Ingersoll-Rand Co. Ltd. | 385,641 | | 14,430,686 |
Nordson Corp. | 6,300 | | 321,489 |
Pall Corp. | 85,113 | | 4,219,903 |
Common Stocks - continued |
| Shares | | Value |
MACHINERY - CONTINUED |
Industrial Machinery - continued |
SPX Corp. | 70,300 | | $ 5,289,372 |
Stanley Black & Decker, Inc. | 65,826 | | 4,329,376 |
TriMas Corp. (a) | 16,847 | | 403,823 |
Weg SA | 233,600 | | 2,529,964 |
| | 48,084,142 |
TOTAL MACHINERY | | 78,486,100 |
PROFESSIONAL SERVICES - 2.9% |
Human Resource & Employment Services - 1.3% |
Kforce, Inc. (a) | 75,200 | | 1,036,256 |
Towers Watson & Co. | 79,300 | | 4,849,195 |
| | 5,885,451 |
Research & Consulting Services - 1.6% |
Bureau Veritas SA | 32,600 | | 2,665,271 |
IHS, Inc. Class A (a) | 67,761 | | 4,993,308 |
| | 7,658,579 |
TOTAL PROFESSIONAL SERVICES | | 13,544,030 |
ROAD & RAIL - 5.7% |
Railroads - 5.7% |
Kansas City Southern (a) | 50,631 | | 3,004,950 |
Union Pacific Corp. | 229,749 | | 23,544,678 |
| | 26,549,628 |
TRADING COMPANIES & DISTRIBUTORS - 2.5% |
Trading Companies & Distributors - 2.5% |
Barloworld Ltd. | 106,200 | | 1,025,204 |
Beacon Roofing Supply, Inc. (a) | 61,700 | | 1,319,146 |
Mills Estruturas e Servicos de Engenharia SA | 268,200 | | 3,630,866 |
Rush Enterprises, Inc. Class A (a) | 202,658 | | 4,051,133 |
WESCO International, Inc. (a) | 38,301 | | 1,941,478 |
| | 11,967,827 |
TOTAL COMMON STOCKS (Cost $439,534,849) | 462,808,587 |
Nonconvertible Preferred Stocks - 0.9% |
| | | |
AUTOMOBILES - 0.9% |
Automobile Manufacturers - 0.9% |
Volkswagen AG
(Cost $4,009,213) | 20,900 | | 4,187,707 |
Convertible Bonds - 0.2% |
| Principal
Amount | | Value |
ELECTRICAL EQUIPMENT - 0.2% |
Electrical Components & Equipment - 0.2% |
Aspen Aerogels, Inc. 8% 6/1/14 (e)
(Cost $1,041,431) | | $ 1,041,431 | | $ 1,041,431 |
Money Market Funds - 1.5% |
| Shares | | |
Fidelity Cash Central Fund, 0.14% (b) | 4,165,237 | | 4,165,237 |
Fidelity Securities Lending Cash Central Fund, 0.15% (b)(c) | 2,598,400 | | 2,598,400 |
TOTAL MONEY MARKET FUNDS (Cost $6,763,637) | 6,763,637 |
TOTAL INVESTMENT PORTFOLIO - 101.2% (Cost $451,349,130) | | 474,801,362 |
NET OTHER ASSETS (LIABILITIES) - (1.2)% | | (5,558,497) |
NET ASSETS - 100% | $ 469,242,865 |
Legend |
(a) Non-income producing |
(b) Affiliated fund that is available only to investment companies and other accounts managed by Fidelity Investments. The rate quoted is the annualized seven-day yield of the fund at period end. A complete unaudited listing of the fund's holdings as of its most recent quarter end is available upon request. In addition, each Fidelity Central Fund's financial statements, which are not covered by the Fund's Report of Independent Registered Public Accounting Firm, are available on the SEC's website or upon request. |
(c) Investment made with cash collateral received from securities on loan. |
(d) Security or a portion of the security is on loan at period end. |
(e) Restricted securities - Investment in securities not registered under the Securities Act of 1933 (excluding 144A issues). At the end of the period, the value of restricted securities (excluding 144A issues) amounted to $1,041,431 or 0.2% of net assets. |
Additional information on each restricted holding is as follows: |
Security | Acquisition Date | Acquisition Cost |
Aspen Aerogels, Inc. 8% 6/1/14 | 6/14/11 | $ 1,041,431 |
Affiliated Central Funds |
Information regarding fiscal year to date income earned by the Fund from investments in Fidelity Central Funds is as follows: |
Fund | Income earned |
Fidelity Cash Central Fund | $ 12,060 |
Fidelity Securities Lending Cash Central Fund | 41,246 |
Total | $ 53,306 |
Other Information |
The following is a summary of the inputs used, as of July 31, 2011, involving the Fund's assets and liabilities carried at fair value. The inputs or methodology used for valuing securities may not be an indication of the risk associated with investing in those securities. For more information on valuation inputs, and their aggregation into the levels used in the table below, please refer to the Security Valuation section in the accompanying Notes to Financial Statements. |
Valuation Inputs at Reporting Date: |
Description | Total | Level 1 | Level 2 | Level 3 |
Investments in Securities: | | | | |
Common Stocks | $ 462,808,587 | $ 461,156,950 | $ 1,651,637 | $ - |
Nonconvertible Preferred Stocks | 4,187,707 | 4,187,707 | - | - |
Convertible Bonds | 1,041,431 | - | 1,041,431 | - |
Money Market Funds | 6,763,637 | 6,763,637 | - | - |
Total Investments in Securities: | $ 474,801,362 | $ 472,108,294 | $ 2,693,068 | $ - |
Distribution of investments by country of issue, as a percentage of total net assets, is as follows: (Unaudited) |
United States of America | 82.0% |
Ireland | 4.3% |
Switzerland | 3.7% |
Italy | 2.3% |
France | 1.5% |
Brazil | 1.3% |
Germany | 1.2% |
Canada | 1.2% |
Others (Individually Less Than 1%) | 2.5% |
| 100.0% |
See accompanying notes which are an integral part of the financial statements.
Annual Report
Fidelity Advisor Industrials Fund
Statement of Assets and Liabilities
| July 31, 2011 |
| | |
Assets | | |
Investment in securities, at value (including securities loaned of $2,541,792) - See accompanying schedule: Unaffiliated issuers (cost $444,585,493) | $ 468,037,725 | |
Fidelity Central Funds (cost $6,763,637) | 6,763,637 | |
Total Investments (cost $451,349,130) | | $ 474,801,362 |
Receivable for investments sold | | 7,292,943 |
Receivable for fund shares sold | | 680,496 |
Dividends receivable | | 171,703 |
Interest receivable | | 10,646 |
Distributions receivable from Fidelity Central Funds | | 7,550 |
Other receivables | | 11,005 |
Total assets | | 482,975,705 |
| | |
Liabilities | | |
Payable for investments purchased | $ 6,785,635 | |
Payable for fund shares redeemed | 3,793,352 | |
Accrued management fee | 232,477 | |
Distribution and service plan fees payable | 172,000 | |
Other affiliated payables | 113,992 | |
Other payables and accrued expenses | 36,984 | |
Collateral on securities loaned, at value | 2,598,400 | |
Total liabilities | | 13,732,840 |
| | |
Net Assets | | $ 469,242,865 |
Net Assets consist of: | | |
Paid in capital | | $ 443,517,457 |
Undistributed net investment income | | 259,179 |
Accumulated undistributed net realized gain (loss) on investments and foreign currency transactions | | 2,012,035 |
Net unrealized appreciation (depreciation) on investments and assets and liabilities in foreign currencies | | 23,454,194 |
Net Assets | | $ 469,242,865 |
Statement of Assets and Liabilities - continued
| July 31, 2011 |
| | |
Calculation of Maximum Offering Price Class A:
Net Asset Value and redemption price per share ($228,106,178 ÷ 8,864,567 shares) | | $ 25.73 |
| | |
Maximum offering price per share (100/94.25 of $25.73) | | $ 27.30 |
Class T:
Net Asset Value and redemption price per share ($71,541,725 ÷ 2,823,860 shares) | | $ 25.33 |
| | |
Maximum offering price per share (100/96.50 of $25.33) | | $ 26.25 |
Class B:
Net Asset Value and offering price per share ($28,599,695 ÷ 1,191,983 shares)A | | $ 23.99 |
| | |
Class C:
Net Asset Value and offering price per share ($72,672,551 ÷ 3,018,743 shares)A | | $ 24.07 |
| | |
| | |
Institutional Class:
Net Asset Value, offering price and redemption price per share ($68,322,716 ÷ 2,559,887 shares) | | $ 26.69 |
A Redemption price per share is equal to net asset value less any applicable contingent deferred sales charge.
See accompanying notes which are an integral part of the financial statements.
Annual Report
Fidelity Advisor Industrials Fund
Financial Statements - continued
Statement of Operations
| Year ended July 31, 2011 |
| | |
Investment Income | | |
Dividends | | $ 6,412,124 |
Interest | | 10,646 |
Income from Fidelity Central Funds | | 53,306 |
Total income | | 6,476,076 |
| | |
Expenses | | |
Management fee | $ 2,436,634 | |
Transfer agent fees | 1,068,699 | |
Distribution and service plan fees | 1,862,045 | |
Accounting and security lending fees | 170,298 | |
Custodian fees and expenses | 35,005 | |
Independent trustees' compensation | 2,254 | |
Registration fees | 83,683 | |
Audit | 46,289 | |
Legal | 1,536 | |
Miscellaneous | 4,328 | |
Total expenses before reductions | 5,710,771 | |
Expense reductions | (26,364) | 5,684,407 |
Net investment income (loss) | | 791,669 |
Realized and Unrealized Gain (Loss) Net realized gain (loss) on: | | |
Investment securities: | | |
Unaffiliated issuers | 55,894,214 | |
Foreign currency transactions | (74,490) | |
Total net realized gain (loss) | | 55,819,724 |
Change in net unrealized appreciation (depreciation) on: Investment securities | 3,561,922 | |
Assets and liabilities in foreign currencies | 1,573 | |
Total change in net unrealized appreciation (depreciation) | | 3,563,495 |
Net gain (loss) | | 59,383,219 |
Net increase (decrease) in net assets resulting from operations | | $ 60,174,888 |
Statement of Changes in Net Assets
| Year ended
July 31,
2011 | Year ended
July 31,
2010 |
Increase (Decrease) in Net Assets | | |
Operations | | |
Net investment income (loss) | $ 791,669 | $ 292,700 |
Net realized gain (loss) | 55,819,724 | 53,593,720 |
Change in net unrealized appreciation (depreciation) | 3,563,495 | 14,761,999 |
Net increase (decrease) in net assets resulting from operations | 60,174,888 | 68,648,419 |
Distributions to shareholders from net investment income | (328,907) | (658,116) |
Share transactions - net increase (decrease) | 75,767,831 | 10,867,809 |
Redemption fees | 11,341 | 9,545 |
Total increase (decrease) in net assets | 135,625,153 | 78,867,657 |
| | |
Net Assets | | |
Beginning of period | 333,617,712 | 254,750,055 |
End of period (including undistributed net investment income of $259,179 and distributions in excess of net investment income of $71,000, respectively) | $ 469,242,865 | $ 333,617,712 |
See accompanying notes which are an integral part of the financial statements.
Annual Report
Financial Highlights - Class A
Years ended July 31, | 2011 | 2010 | 2009 | 2008 | 2007 |
Selected Per-Share Data | | | | | |
Net asset value, beginning of period | $ 21.54 | $ 16.87 | $ 21.97 | $ 25.49 | $ 22.16 |
Income from Investment Operations | | | | | |
Net investment income (loss) C | .09 | .06 | .13 | .11 | .09 |
Net realized and unrealized gain (loss) | 4.13 | 4.68 | (5.08) | (1.17) | 5.11 |
Total from investment operations | 4.22 | 4.74 | (4.95) | (1.06) | 5.20 |
Distributions from net investment income | (.03) | (.07) | (.13) | - | (.06) |
Distributions from net realized gain | - | - | (.02) | (2.46) | (1.81) |
Total distributions | (.03) | (.07) | (.15) | (2.46) | (1.87) |
Redemption fees added to paid in capital C, G | - | - | - | - | - |
Net asset value, end of period | $ 25.73 | $ 21.54 | $ 16.87 | $ 21.97 | $ 25.49 |
Total Return A, B | 19.59% | 28.13% | (22.49)% | (4.71)% | 25.13% |
Ratios to Average Net Assets D, F | | | | | |
Expenses before reductions | 1.13% | 1.18% | 1.23% | 1.17% | 1.21% |
Expenses net of fee waivers, if any | 1.13% | 1.18% | 1.23% | 1.17% | 1.21% |
Expenses net of all reductions | 1.13% | 1.17% | 1.23% | 1.16% | 1.21% |
Net investment income (loss) | .36% | .31% | .89% | .46% | .38% |
Supplemental Data | | | | | |
Net assets, end of period (000 omitted) | $ 228,106 | $ 165,029 | $ 130,860 | $ 188,859 | $ 157,451 |
Portfolio turnover rate E | 75% | 110% | 135% | 91% | 130% |
A Total returns would have been lower if certain expenses had not been reduced during the applicable periods shown.
B Total returns do not include the effect of the sales charges.
C Calculated based on average shares outstanding during the period.
D Fees and expenses of any underlying Fidelity Central Funds are not included in the Fund's expense ratio. The Fund indirectly bears its proportionate share of the expenses of any underlying Fidelity Central Funds.
E Amount does not include the portfolio activity of any underlying Fidelity Central Funds.
F Expense ratios reflect operating expenses of the class. Expenses before reductions do not reflect amounts reimbursed by the investment adviser or reductions from brokerage service arrangements or reductions from other expense offset arrangements and do not represent the amount paid by the class during periods when reimbursements or reductions occur. Expenses net of fee waivers reflect expenses after reimbursement by the investment adviser but prior to reductions from brokerage service arrangements or other expense offset arrangements. Expenses net of all reductions represent the net expenses paid by the class.
G Amount represents less than $.01 per share.
Financial Highlights - Class T
Years ended July 31, | 2011 | 2010 | 2009 | 2008 | 2007 |
Selected Per-Share Data | | | | | |
Net asset value, beginning of period | $ 21.24 | $ 16.64 | $ 21.67 | $ 25.17 | $ 21.86 |
Income from Investment Operations | | | | | |
Net investment income (loss) C | .03 | .01 | .10 | .05 | .03 |
Net realized and unrealized gain (loss) | 4.07 | 4.61 | (5.03) | (1.15) | 5.05 |
Total from investment operations | 4.10 | 4.62 | (4.93) | (1.10) | 5.08 |
Distributions from net investment income | (.01) | (.02) | (.08) | - | (.03) |
Distributions from net realized gain | - | - | (.02) | (2.40) | (1.74) |
Total distributions | (.01) | (.02) | (.10) | (2.40) | (1.77) |
Redemption fees added to paid in capital C, G | - | - | - | - | - |
Net asset value, end of period | $ 25.33 | $ 21.24 | $ 16.64 | $ 21.67 | $ 25.17 |
Total Return A, B | 19.28% | 27.80% | (22.68)% | (4.96)% | 24.82% |
Ratios to Average Net Assets D, F | | | | | |
Expenses before reductions | 1.39% | 1.44% | 1.48% | 1.41% | 1.46% |
Expenses net of fee waivers, if any | 1.39% | 1.44% | 1.48% | 1.41% | 1.46% |
Expenses net of all reductions | 1.38% | 1.43% | 1.48% | 1.41% | 1.46% |
Net investment income (loss) | .10% | .06% | .63% | .21% | .13% |
Supplemental Data | | | | | |
Net assets, end of period (000 omitted) | $ 71,542 | $ 58,202 | $ 48,054 | $ 85,025 | $ 75,530 |
Portfolio turnover rate E | 75% | 110% | 135% | 91% | 130% |
A Total returns would have been lower if certain expenses had not been reduced during the applicable periods shown.
B Total returns do not include the effect of the sales charges.
C Calculated based on average shares outstanding during the period.
D Fees and expenses of any underlying Fidelity Central Funds are not included in the Fund's expense ratio. The Fund indirectly bears its proportionate share of the expenses of any underlying Fidelity Central Funds.
E Amount does not include the portfolio activity of any underlying Fidelity Central Funds.
F Expense ratios reflect operating expenses of the class. Expenses before reductions do not reflect amounts reimbursed by the investment adviser or reductions from brokerage service arrangements or reductions from other expense offset arrangements and do not represent the amount paid by the class during periods when reimbursements or reductions occur. Expenses net of fee waivers reflect expenses after reimbursement by the investment adviser but prior to reductions from brokerage service arrangements or other expense offset arrangements. Expenses net of all reductions represent the net expenses paid by the class.
G Amount represents less than $.01 per share.
See accompanying notes which are an integral part of the financial statements.
Annual Report
Financial Highlights - Class B
Years ended July 31, | 2011 | 2010 | 2009 | 2008 | 2007 |
Selected Per-Share Data | | | | | |
Net asset value, beginning of period | $ 20.22 | $ 15.90 | $ 20.74 | $ 24.19 | $ 21.02 |
Income from Investment Operations | | | | | |
Net investment income (loss) C | (.11) | (.09) | .02 | (.07) | (.09) |
Net realized and unrealized gain (loss) | 3.88 | 4.41 | (4.82) | (1.10) | 4.87 |
Total from investment operations | 3.77 | 4.32 | (4.80) | (1.17) | 4.78 |
Distributions from net investment income | - | - | (.04) | - | - |
Distributions from net realized gain | - | - | - | (2.28) | (1.61) |
Total distributions | - | - | (.04) | (2.28) | (1.61) |
Redemption fees added to paid in capital C, G | - | - | - | - | - |
Net asset value, end of period | $ 23.99 | $ 20.22 | $ 15.90 | $ 20.74 | $ 24.19 |
Total Return A, B | 18.64% | 27.17% | (23.10)% | (5.46)% | 24.18% |
Ratios to Average Net Assets D, F | | | | | |
Expenses before reductions | 1.93% | 1.97% | 1.98% | 1.95% | 2.00% |
Expenses net of fee waivers, if any | 1.93% | 1.97% | 1.98% | 1.95% | 2.00% |
Expenses net of all reductions | 1.93% | 1.97% | 1.98% | 1.95% | 2.00% |
Net investment income (loss) | (.44)% | (.48)% | .13% | (.33)% | (.41)% |
Supplemental Data | | | | | |
Net assets, end of period (000 omitted) | $ 28,600 | $ 29,048 | $ 25,212 | $ 39,989 | $ 44,330 |
Portfolio turnover rate E | 75% | 110% | 135% | 91% | 130% |
A Total returns would have been lower if certain expenses had not been reduced during the applicable periods shown.
B Total returns do not include the effect of the contingent deferred sales charge.
C Calculated based on average shares outstanding during the period.
D Fees and expenses of any underlying Fidelity Central Funds are not included in the Fund's expense ratio. The Fund indirectly bears its proportionate share of the expenses of any underlying Fidelity Central Funds.
E Amount does not include the portfolio activity of any underlying Fidelity Central Funds.
F Expense ratios reflect operating expenses of the class. Expenses before reductions do not reflect amounts reimbursed by the investment adviser or reductions from brokerage service arrangements or reductions from other expense offset arrangements and do not represent the amount paid by the class during periods when reimbursements or reductions occur. Expenses net of fee waivers reflect expenses after reimbursement by the investment adviser but prior to reductions from brokerage service arrangements or other expense offset arrangements. Expenses net of all reductions represent the net expenses paid by the class.
G Amount represents less than $.01 per share.
Financial Highlights - Class C
Years ended July 31, | 2011 | 2010 | 2009 | 2008 | 2007 |
Selected Per-Share Data | | | | | |
Net asset value, beginning of period | $ 20.28 | $ 15.94 | $ 20.79 | $ 24.26 | $ 21.16 |
Income from Investment Operations | | | | | |
Net investment income (loss) C | (.09) | (.08) | .02 | (.06) | (.08) |
Net realized and unrealized gain (loss) | 3.88 | 4.42 | (4.83) | (1.11) | 4.88 |
Total from investment operations | 3.79 | 4.34 | (4.81) | (1.17) | 4.80 |
Distributions from net investment income | - | - | (.04) | - | - |
Distributions from net realized gain | - | - | - | (2.30) | (1.70) |
Total distributions | - | - | (.04) | (2.30) | (1.70) |
Redemption fees added to paid in capital C, G | - | - | - | - | - |
Net asset value, end of period | $ 24.07 | $ 20.28 | $ 15.94 | $ 20.79 | $ 24.26 |
Total Return A, B | 18.69% | 27.23% | (23.09)% | (5.44)% | 24.25% |
Ratios to Average Net Assets D, F | | | | | |
Expenses before reductions | 1.89% | 1.93% | 1.98% | 1.91% | 1.94% |
Expenses net of fee waivers, if any | 1.89% | 1.93% | 1.98% | 1.91% | 1.94% |
Expenses net of all reductions | 1.88% | 1.92% | 1.98% | 1.90% | 1.94% |
Net investment income (loss) | (.40)% | (.43)% | .14% | (.28)% | (.35)% |
Supplemental Data | | | | | |
Net assets, end of period (000 omitted) | $ 72,673 | $ 51,760 | $ 37,862 | $ 57,742 | $ 57,862 |
Portfolio turnover rate E | 75% | 110% | 135% | 91% | 130% |
A Total returns would have been lower if certain expenses had not been reduced during the applicable periods shown.
B Total returns do not include the effect of the contingent deferred sales charge.
C Calculated based on average shares outstanding during the period.
D Fees and expenses of any underlying Fidelity Central Funds are not included in the Fund's expense ratio. The Fund indirectly bears its proportionate share of the expenses of any underlying Fidelity Central Funds.
E Amount does not include the portfolio activity of any underlying Fidelity Central Funds.
F Expense ratios reflect operating expenses of the class. Expenses before reductions do not reflect amounts reimbursed by the investment adviser or reductions from brokerage service arrangements or reductions from other expense offset arrangements and do not represent the amount paid by the class during periods when reimbursements or reductions occur. Expenses net of fee waivers reflect expenses after reimbursement by the investment adviser but prior to reductions from brokerage service arrangements or other expense offset arrangements. Expenses net of all reductions represent the net expenses paid by the class.
G Amount represents less than $.01 per share.
See accompanying notes which are an integral part of the financial statements.
Annual Report
Financial Highlights - Institutional Class
Years ended July 31, | 2011 | 2010 | 2009 | 2008 | 2007 |
Selected Per-Share Data | | | | | |
Net asset value, beginning of period | $ 22.30 | $ 17.45 | $ 22.72 | $ 26.26 | $ 22.77 |
Income from Investment Operations | | | | | |
Net investment income (loss) B | .17 | .13 | .19 | .18 | .16 |
Net realized and unrealized gain (loss) | 4.28 | 4.83 | (5.27) | (1.19) | 5.27 |
Total from investment operations | 4.45 | 4.96 | (5.08) | (1.01) | 5.43 |
Distributions from net investment income | (.06) | (.11) | (.17) | - | (.13) |
Distributions from net realized gain | - | - | (.02) | (2.53) | (1.81) |
Total distributions | (.06) | (.11) | (.19) | (2.53) | (1.94) |
Redemption fees added to paid in capital B, F | - | - | - | - | - |
Net asset value, end of period | $ 26.69 | $ 22.30 | $ 17.45 | $ 22.72 | $ 26.26 |
Total Return A | 19.95% | 28.52% | (22.31)% | (4.40)% | 25.53% |
Ratios to Average Net Assets C, E | | | | | |
Expenses before reductions | .85% | .89% | .96% | .88% | .92% |
Expenses net of fee waivers, if any | .85% | .89% | .96% | .88% | .92% |
Expenses net of all reductions | .84% | .88% | .95% | .87% | .91% |
Net investment income (loss) | .65% | .61% | 1.16% | .75% | .67% |
Supplemental Data | | | | | |
Net assets, end of period (000 omitted) | $ 68,323 | $ 29,578 | $ 12,762 | $ 33,642 | $ 19,498 |
Portfolio turnover rate D | 75% | 110% | 135% | 91% | 130% |
A Total returns would have been lower if certain expenses had not been reduced during the applicable periods shown.
B Calculated based on average shares outstanding during the period.
C Fees and expenses of any underlying Fidelity Central Funds are not included in the Fund's expense ratio. The Fund indirectly bears its proportionate share of the expenses of any underlying Fidelity Central Funds.
D Amount does not include the portfolio activity of any underlying Fidelity Central Funds.
E Expense ratios reflect operating expenses of the class. Expenses before reductions do not reflect amounts reimbursed by the investment adviser or reductions from brokerage service arrangements or reductions from other expense offset arrangements and do not represent the amount paid by the class during periods when reimbursements or reductions occur. Expenses net of fee waivers reflect expenses after reimbursement by the investment adviser but prior to reductions from brokerage service arrangements or other expense offset arrangements. Expenses net of all reductions represent the net expenses paid by the class.
F Amount represents less than $.01 per share.
See accompanying notes which are an integral part of the financial statements.
Annual Report
Notes to Financial Statements
For the period ended July 31, 2011
1. Organization.
Fidelity Advisor Industrials Fund (the Fund) is a non-diversified fund of Fidelity Advisor Series VII (the Trust) and is authorized to issue an unlimited number of shares. The Trust is registered under the Investment Company Act of 1940, as amended (the 1940 Act), as an open-end management investment company organized as a Massachusetts business trust. The Fund offers Class A, Class T, Class C and Institutional Class shares, each of which, along with Class B shares, has equal rights as to assets and voting privileges. Effective after the close of business on September 1, 2010, Class B shares were closed to new accounts and additional purchases, except for exchanges and reinvestments, by existing shareholders. Each class has exclusive voting rights with respect to matters that affect that class. Class B shares will automatically convert to Class A shares after a holding period of seven years from the initial date of purchase. Investment income, realized and unrealized capital gains and losses, the common expenses of the Fund, and certain fund-level expense reductions, if any, are allocated on a pro-rata basis to each class based on the relative net assets of each class to the total net assets of the Fund. Each class differs with respect to transfer agent and distribution and service plan fees incurred. Certain expense reductions may also differ by class.
2. Investments in Fidelity Central Funds.
The Fund invests in Fidelity Central Funds, which are open-end investment companies available only to other investment companies and accounts managed by Fidelity Management & Research Company (FMR) and its affiliates. The Fund's Schedule of Investments lists each of the Fidelity Central Funds held as of period end, if any, as an investment of the Fund, but does not include the underlying holdings of each Fidelity Central Fund. As an Investing Fund, the Fund indirectly bears its proportionate share of the expenses of the underlying Fidelity Central Funds.
The Money Market Central Funds seek preservation of capital and current income and are managed by Fidelity Investments Money Management, Inc. (FIMM), an affiliate of FMR.
A complete unaudited list of holdings for each Fidelity Central Fund is available upon request or at the Securities and Exchange Commission (the SEC) web site at www.sec.gov. In addition, the financial statements of the Fidelity Central Funds, which are not covered by the Fund's Report of Independent Registered Public Accounting Firm, are available on the SEC web site or upon request.
3. Significant Accounting Policies.
The financial statements have been prepared in conformity with accounting principles generally accepted in the United States of America (GAAP), which require management to make certain estimates and assumptions at the date of the financial statements. Actual results could differ from those estimates. Subsequent events, if any, through the date that the financial statements were issued have been evaluated in the preparation of the financial statements. The following summarizes the significant accounting policies of the Fund:
Security Valuation. Investments are valued as of 4:00 p.m. Eastern time on the last calendar day of the period. The Fund uses independent pricing services approved by the Board of Trustees to value its investments. When current market prices or quotations are not readily available or reliable, valuations may be determined in good faith in accordance with procedures adopted by the Board of Trustees. Factors used in determining value may include market or security specific events, changes in interest rates and credit quality. The frequency with which these procedures are used cannot be predicted and they may be utilized to a significant extent. The value used for net asset value (NAV) calculation under these procedures may differ from published prices for the same securities.
The Fund categorizes the inputs to valuation techniques used to value its investments into a disclosure hierarchy consisting of three levels as shown below:
Level 1 - quoted prices in active markets for identical investments
Level 2 - other significant observable inputs (including quoted prices for similar investments, interest rates, prepayment speeds, etc.)
Level 3 - unobservable inputs (including the Fund's own assumptions based on the best information available)
Changes in valuation techniques may result in transfers in or out of an assigned level within the disclosure hierarchy. The aggregate value of investments by input level, as of July 31, 2011, is included at the end of the Fund's Schedule of Investments. Valuation techniques used to value the Fund's investments by major category are as follows:
Equity securities, including restricted securities, for which market quotations are readily available, are valued at the last reported sale price or official closing price as reported by an independent pricing service on the primary market or exchange on which they are traded and are categorized as Level 1 in the hierarchy. In the event there were no sales during the day or closing prices are not available, securities are valued at the last quoted bid price or may be valued using the last available price and are generally categorized as Level 2 in the hierarchy. For foreign equity securities, when significant market or security specific events arise, comparisons to the valuation of American Depositary Receipts (ADRs), futures contracts, Exchange-traded funds (ETFs)and certain indexes as well as quoted prices for similar securities are used and are categorized as Level 2 in the hierarchy in these
Annual Report
3. Significant Accounting Policies - continued
Security Valuation - continued
circumstances. Utilizing these techniques may result in transfers between Level 1 and Level 2. For restricted equity securities and private placements where observable inputs are limited, assumptions about market activity and risk are used and are categorized as Level 3 in the hierarchy.
Debt securities, including restricted securities, are valued based on evaluated prices received from independent pricing services or from dealers who make markets in such securities. For corporate bonds, pricing services utilize matrix pricing which considers yield or price of bonds of comparable quality, coupon, maturity and type as well as dealer supplied prices and are generally categorized as Level 2 in the hierarchy. When independent prices are unavailable or unreliable, debt securities may be valued utilizing pricing matrices which consider similar factors that would be used by independent pricing services. These are generally categorized as Level 2 in the hierarchy but may be Level 3 depending on the circumstances.
Investments in open-end mutual funds, including the Fidelity Central Funds, are valued at their closing net asset value each business day and are categorized as Level 1 in the hierarchy.
Foreign Currency. The Fund may use foreign currency contracts to facilitate transactions in foreign-denominated securities. Gains and losses from these transactions may arise from changes in the value of the foreign currency or if the counterparties do not perform under the contracts' terms.
Foreign-denominated assets, including investment securities, and liabilities are translated into U.S. dollars at the exchange rate at period end. Purchases and sales of investment securities, income and dividends received and expenses denominated in foreign currencies are translated into U.S. dollars at the exchange rate in effect on the transaction date.
The effects of exchange rate fluctuations on investments are included with the net realized and unrealized gain (loss) on investment securities. Other foreign currency transactions resulting in realized and unrealized gain (loss) are disclosed separately.
Investment Transactions and Income. For financial reporting purposes, the Fund's investment holdings and NAV include trades executed through the end of the last business day of the period. The NAV per share for processing shareholder transactions is calculated as of the close of business of the New York Stock Exchange (NYSE), normally 4:00 p.m. Eastern time and includes trades executed through the end of the prior business day. Gains and losses on securities sold are determined on the basis of identified cost and may include proceeds received from litigation. Dividend income is recorded on the ex-dividend date, except for certain dividends from foreign securities where the ex-dividend date may have passed, which are recorded as soon as the Fund is informed of the ex-dividend date. Non-cash dividends included in dividend income, if any, are recorded at the fair market value of the securities received. Distributions received on securities that represent a return of capital or capital gain are recorded as a reduction of cost of investments and/or as a realized gain. The Fund estimates the components of distributions received that may be considered return of capital distributions or capital gain distributions. Interest income and distributions from the Fidelity Central Funds are accrued as earned. Interest income includes coupon interest and amortization of premium and accretion of discount on debt securities. Investment income is recorded net of foreign taxes withheld where recovery of such taxes is uncertain.
Expenses. Expenses directly attributable to a fund are charged to that fund. Expenses attributable to more than one fund are allocated among the respective funds on the basis of relative net assets or other appropriate methods. Expense estimates are accrued in the period to which they relate and adjustments are made when actual amounts are known.
Income Tax Information and Distributions to Shareholders. Each year, the Fund intends to qualify as a regulated investment company, including distributing substantially all of its taxable income and realized gains under Subchapter M of the Internal Revenue Code and filing its U.S. federal tax return. As a result, no provision for income taxes is required. As of July 31, 2011, the Fund did not have any unrecognized tax benefits in the financial statements. A fund's federal tax return is subject to examination by the Internal Revenue Service (IRS) for a period of three years. Foreign taxes are provided for based on the Fund's understanding of the tax rules and rates that exist in the foreign markets in which it invests.
Distributions are declared and recorded on the ex-dividend date. Income dividends and capital gain distributions are declared separately for each class. Income and capital gain distributions are determined in accordance with income tax regulations, which may differ from GAAP. In addition, the Fund claimed a portion of the payment made to redeeming shareholders as a distribution for income tax purposes.
Capital accounts within the financial statements are adjusted for permanent book-tax differences. These adjustments have no impact on net assets or the results of operations. Temporary book-tax differences will reverse in a subsequent period.
Book-tax differences are primarily due to foreign currency transactions, deferred trustees compensation, capital loss carryforwards and losses deferred due to wash sales and excise tax regulations.
Annual Report
Notes to Financial Statements - continued
3. Significant Accounting Policies - continued
Income Tax Information and Distributions to Shareholders - continued
The federal tax cost of investment securities and unrealized appreciation (depreciation) as of period end were as follows:
Gross unrealized appreciation | $ 42,394,926 |
Gross unrealized depreciation | (21,141,559) |
Net unrealized appreciation (depreciation) on securities and other investments | $ 21,253,367 |
| |
Tax Cost | $ 453,547,995 |
The tax-based components of distributable earnings as of period end were as follows:
Undistributed ordinary income | $ 259,182 |
Undistributed long-term capital gain | $ 4,210,899 |
Net unrealized appreciation (depreciation) | $ 21,255,329 |
Under the recently enacted Regulated Investment Company Modernization Act of 2010 (the Act), the Fund will be permitted to carry forward capital losses incurred in taxable years beginning after December 22, 2010 for an unlimited period. However, any losses incurred during those future taxable years will be required to be utilized prior to any losses incurred in pre-enactment taxable years, which generally expire after eight years from when they are incurred. Additionally, post-enactment capital losses that are carried forward will retain their character as either short-term or long-term capital losses rather than being considered all short-term as under previous law. The Fund's first fiscal year end subject to the Act will be July 31, 2012.
The tax character of distributions paid was as follows:
| July 31, 2011 | July 31, 2010 |
Ordinary Income | $ 328,907 | $ 658,116 |
Short-Term Trading (Redemption) Fees. Shares held by investors in the Fund less than 30 days are subject to a redemption fee equal to .75% of the net asset value of shares redeemed. All redemption fees, which reduce the proceeds of the shareholder redemption, are retained by the Fund and accounted for as an addition to paid in capital.
New Accounting Pronouncement. In May 2011, the Financial Accounting Standards Board issued Accounting Standard Update No. 2011-04, Fair Value Measurement (Topic 820) - Amendments to Achieve Common Fair Value Measurement and Disclosure Requirements in U.S. GAAP and IFRSs. The update changes the wording used to describe the requirements in GAAP for measuring fair value and for disclosing information about fair value measurements. The update is effective during interim and annual periods beginning after December 15, 2011. Management is currently evaluating the impact of the update's adoption on the Fund's financial statement disclosures.
4. Operating Policies.
Restricted Securities. The Fund may invest in securities that are subject to legal or contractual restrictions on resale. These securities generally may be resold in transactions exempt from registration or to the public if the securities are registered. Disposal of these securities may involve time-consuming negotiations and expense, and prompt sale at an acceptable price may be difficult. Information regarding restricted securities is included at the end of the Fund's Schedule of Investments.
5. Purchases and Sales of Investments.
Purchases and sales of securities, other than short-term securities, aggregated $399,813,106 and $323,316,491, respectively.
6. Fees and Other Transactions with Affiliates.
Management Fee. FMR and its affiliates provide the Fund with investment management related services for which the Fund pays a monthly management fee. The management fee is the sum of an individual fund fee rate that is based on an annual rate of .30% of the Fund's average net assets and a group fee rate that averaged .26% during the period. The group fee rate is based upon the average net assets of all the mutual funds advised by FMR. The group fee rate decreases as assets under management increase and increases as assets under management decrease. For the period, the total annual management fee rate was .56% of the Fund's average net assets.
Annual Report
6. Fees and Other Transactions with Affiliates - continued
Distribution and Service Plan Fees. In accordance with Rule 12b-1 of the 1940 Act, the Fund has adopted separate Distribution and Service Plans for each class of shares. Certain classes pay Fidelity Distributors Corporation (FDC), an affiliate of FMR, separate Distribution and Service Fees, each of which is based on an annual percentage of each class' average net assets. In addition, FDC may pay financial intermediaries for selling shares of the Fund and providing shareholder support services. For the period, the Distribution and Service Fee rates, total fees and amounts retained by FDC were as follows:
| Distribution
Fee | Service
Fee | Total Fees | Retained
by FDC |
Class A | -% | .25% | $ 537,691 | $ 9,245 |
Class T | .25% | .25% | 348,344 | 862 |
Class B | .75% | .25% | 309,966 | 232,697 |
Class C | .75% | .25% | 666,044 | 157,445 |
| | | $ 1,862,045 | $ 400,249 |
Sales Load. FDC may receive a front-end sales charge of up to 5.75% for selling Class A shares, and 3.50% for selling Class T shares, some of which is paid to financial intermediaries for selling shares of the Fund. Depending on the holding period, FDC may receive contingent deferred sales charges levied on Class A, Class T, Class B, and Class C redemptions. The deferred sales charges range from 5% to 1% for Class B, 1% for Class C, 1.00% for certain purchases of Class A shares and .25% for certain purchases of Class T shares.
For the period, sales charge amounts retained by FDC were as follows:
| Retained
by FDC |
Class A | $ 122,726 |
Class T | 14,170 |
Class B* | 58,342 |
Class C* | 8,458 |
| $ 203,696 |
* When Class B and Class C shares are initially sold, FDC pays commissions from its own resources to financial intermediaries through which the sales are made.
Transfer Agent Fees. Fidelity Investments Institutional Operations Company, Inc. (FIIOC), an affiliate of FMR, is the transfer, dividend disbursing and shareholder servicing agent for each class of the Fund. FIIOC receives account fees and asset-based fees that vary according to the account size and type of account of the shareholders of the respective classes of the Fund. FIIOC pays for typesetting, printing and mailing of shareholder reports, except proxy statements. For the period, transfer agent fees for each class were as follows:
| Amount | % of
Average
Net Assets |
Class A | $ 526,436 | .25 |
Class T | 172,939 | .25 |
Class B | 91,737 | .30 |
Class C | 163,663 | .25 |
Institutional Class | 113,924 | .21 |
| $ 1,068,699 | |
Accounting and Security Lending Fees. Fidelity Service Company, Inc. (FSC), an affiliate of FMR, maintains the Fund's accounting records. The accounting fee is based on the level of average net assets for the month. Under a separate contract, FSC administers the security lending program. The security lending fee is based on the number and duration of lending transactions.
Brokerage Commissions. The Fund placed a portion of its portfolio transactions with brokerage firms which are affiliates of the investment adviser. The commissions paid to these affiliated firms were $7,279 for the period.
7. Committed Line of Credit.
The Fund participates with other funds managed by FMR or an affiliate in a $4.0 billion credit facility (the "line of credit") to be utilized for temporary or emergency purposes to fund shareholder redemptions or for other short-term liquidity purposes. The Fund has agreed to pay commitment fees on its pro-rata portion of the line of credit, which amounted to $1,389 and is reflected in Miscellaneous expenses on the Statement of Operations. During the period, there were no borrowings on this line of credit.
Annual Report
Notes to Financial Statements - continued
8. Security Lending.
The Fund lends portfolio securities through a lending agent from time to time in order to earn additional income. The lending agent may loan securities to certain qualified borrowers, including Fidelity Capital Markets (FCM), a broker-dealer affiliated with the Fund. On the settlement date of the loan, the Fund receives collateral (in the form of U.S. Treasury obligations, letters of credit and/or cash) against the loaned securities and maintains collateral in an amount not less than 100% of the market value of the loaned securities during the period of the loan. The market value of the loaned securities is determined at the close of business of the Fund and any additional required collateral is delivered to the Fund on the next business day. If the borrower defaults on its obligation to return the securities loaned because of insolvency or other reasons, a fund could experience delays and costs in recovering the securities loaned or in gaining access to the collateral. Any cash collateral received is invested in the Fidelity Securities Lending Cash Central Fund. The value of loaned securities and cash collateral at period end are disclosed on the Fund's Statement of Assets and Liabilities. Security lending income represents the income earned on investing cash collateral, less rebates paid to borrowers and lending agent fees associated with the loan, plus any premium payments received for lending certain types of securities. Security lending income is presented in the Statement of Operations as a component of income from Fidelity Central Funds. Total security lending income during the period amounted to $41,246. During the period, there were no securities loaned to FCM.
9. Expense Reductions.
Many of the brokers with whom FMR places trades on behalf of the Fund provided services to the Fund in addition to trade execution. These services included payments of certain expenses on behalf of the Fund totaling $26,364 for the period.
10. Distributions to Shareholders.
Distributions to shareholders of each class were as follows:
Years ended July 31, | 2011 | 2010 |
From net investment income | | |
Class A | $ 235,263 | $ 508,657 |
Class T | 13,200 | 67,522 |
Institutional Class | 80,444 | 81,937 |
Total | $ 328,907 | $ 658,116 |
11. Share Transactions.
Transactions for each class of shares were as follows:
| Shares | Dollars |
Years ended July 31, | 2011 | 2010 | 2011 | 2010 |
Class A | | | | |
Shares sold | 3,645,278 | 2,293,002 | $ 95,442,701 | $ 46,751,968 |
Reinvestment of distributions | 8,108 | 24,478 | 205,122 | 465,084 |
Shares redeemed | (2,451,683) | (2,413,077) | (63,502,279) | (48,350,817) |
Net increase (decrease) | 1,201,703 | (95,597) | $ 32,145,544 | $ (1,133,765) |
Class T | | | | |
Shares sold | 757,485 | 640,220 | $ 19,402,949 | $ 12,504,319 |
Reinvestment of distributions | 500 | 3,441 | 12,596 | 64,976 |
Shares redeemed | (674,809) | (791,417) | (16,619,027) | (15,762,597) |
Net increase (decrease) | 83,176 | (147,756) | $ 2,796,518 | $ (3,193,302) |
Class B | | | | |
Shares sold | 89,875 | 230,669 | $ 2,150,821 | $ 4,429,240 |
Reinvestment of distributions | - | - | - | - |
Shares redeemed | (334,639) | (379,173) | (7,838,637) | (7,171,787) |
Net increase (decrease) | (244,764) | (148,504) | $ (5,687,816) | $ (2,742,547) |
Annual Report
11. Share Transactions - continued
| Shares | Dollars |
Years ended July 31, | 2011 | 2010 | 2011 | 2010 |
Class C | | | | |
Shares sold | 1,054,416 | 965,412 | $ 25,772,946 | $ 18,697,081 |
Reinvestment of distributions | - | - | - | - |
Shares redeemed | (588,462) | (787,460) | (13,948,935) | (14,785,582) |
Net increase (decrease) | 465,954 | 177,952 | $ 11,824,011 | $ 3,911,499 |
Institutional Class | | | | |
Shares sold | 2,320,182 | 1,199,584 | $ 63,208,570 | $ 26,360,020 |
Reinvestment of distributions | 2,269 | 3,299 | 59,382 | 64,789 |
Shares redeemed | (1,089,149) | (607,717) | (28,578,378) | (12,398,885) |
Net increase (decrease) | 1,233,302 | 595,166 | $ 34,689,574 | $ 14,025,924 |
12. Other.
The Fund's organizational documents provide former and current trustees and officers with a limited indemnification against liabilities arising in connection with the performance of their duties to the Fund. In the normal course of business, the Fund may also enter into contracts that provide general indemnifications. The Fund's maximum exposure under these arrangements is unknown as this would be dependent on future claims that may be made against the Fund. The risk of material loss from such claims is considered remote.
Annual Report
Fidelity Advisor Technology Fund - Institutional Class
Performance: The Bottom Line
Average annual total return reflects the change in the value of an investment, assuming reinvestment of the class' distributions from dividend income and capital gains (the profits earned upon the sale of securities that have grown in value, if any) and assuming a constant rate of performance each year. The $10,000 table and the fund's returns do not reflect the deduction of taxes that a shareholder would pay on fund distributions or the redemption of fund shares. During periods of reimbursement by Fidelity, a fund's total return will be greater than it would be had the reimbursement not occurred. How a fund did yesterday is no guarantee of how it will do tomorrow.
Average Annual Total Returns
Periods ended July 31, 2011 | Past 1
year | Past 5
years | Past 10
years |
Institutional Class | 27.18% | 10.35% | 4.00% |
$10,000 Over 10 Years
Let's say hypothetically that $10,000 was invested in Fidelity Advisor Technology Fund - Institutional Class on July 31, 2001. The chart shows how the value of your investment would have changed, and also shows how the S&P 500 Index performed over the same period.
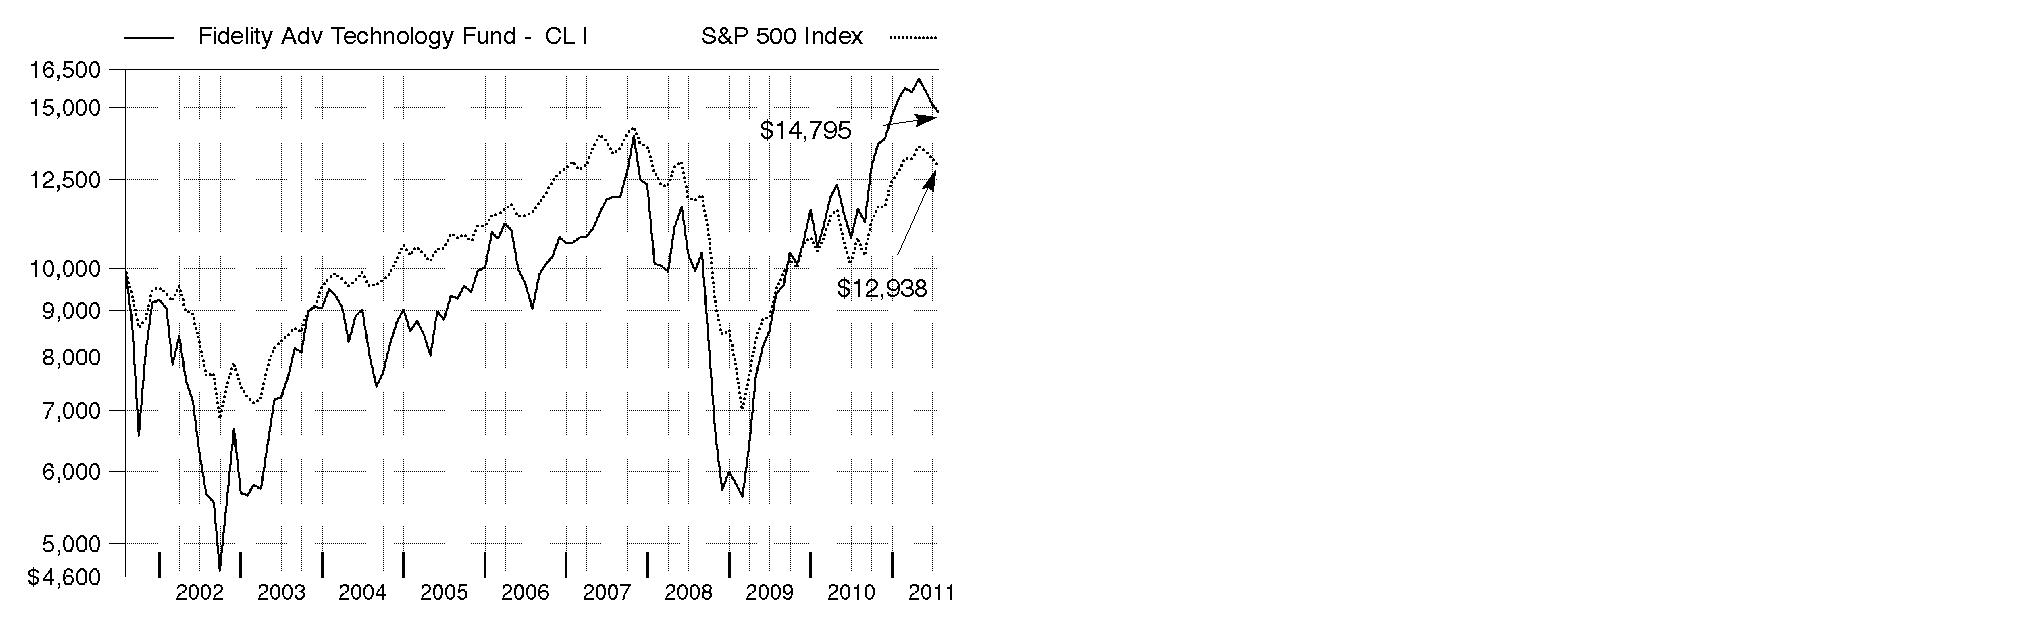
Annual Report
Fidelity Advisor Technology Fund
Market Recap: U.S. stocks registered solid double-digit gains for the 12 months ending July 31, 2011, extending a rally that began more than two years earlier. Despite a rough start in August 2010, markets turned positive in September, as increased demand for capital goods and other upbeat indicators trumped investor worry about a U.S. recessionary relapse. The broad market, as measured by the S&P 500® Index, rose 9% that month, its biggest September gain in 71 years. Seven more monthly advances followed, fueled by encouraging corporate earnings and economic activity. However, volatility picked up in the period's latter months, as markets reacted to continued high U.S. unemployment, nagging debt troubles in Europe and looming legislative battles over the federal debt ceiling. May unemployment rose above 9% for the first time in 2011, contributing to a traditional "June swoon" for stocks. Market uncertainty lingered in July, when the S&P 500® posted its second-biggest monthly loss of the period. For the full year, the S&P 500® climbed 19.65%, while the blue-chip-laden Dow Jones Industrial AverageSM rose a comparable 19.09% and the technology-heavy Nasdaq Composite® Index gained 23.40%. On the capitalization spectrum, stocks of mid-cap companies fared best, with the Russell Midcap® Index rising 24.51% and the small-cap Russell 2000® Index adding 23.92%.
Comments from Charlie Chai, Portfolio Manager of Fidelity Advisor® Technology Fund: For the year, the fund's Class A, Class T, Class B and Class C shares returned 26.78%, 26.46%, 25.87% and 25.87%, respectively (excluding sales charges), handily beating the 20.21% advance of the MSCI® U.S. IM Information Technology 25/50 Index and the S&P 500. Versus the MSCI index, stock picking in a number of groups, most notably communications equipment, semiconductors and systems software, was the main driver of the fund's outperformance. Elsewhere, security selection added value in computer hardware, although the benefit was tempered to some extent by underweighting the strong-performing group. Out-of-index representation in Internet retail was helpful as well. At the stock level, underweighting three weak-performing index heavyweights accounted for a lot of the fund's outperformance: networking equipment maker Cisco Systems, computer/printer provider Hewlett-Packard and software giant Microsoft. I'll also mention two out-of-benchmark positions that did well for the fund. Internet retailer Amazon.com continued to dominate its primary niche and enjoyed rapid growth in its Amazon Web Services segment. Meanwhile, Taiwan-based HTC was one of the beneficiaries of the surging popularity of smartphones incorporating Google's AndroidTM operating system. In absolute terms, computer/consumer electronics maker Apple - the fund's largest holding during the period - was a heavy hitter, adding more than six percentage points to performance. Conversely, a large underweighting and unrewarding stock selection in IT consulting/other services detracted from relative performance. The main problem there was the fund's negligible stake in major index constituent International Business Machines, whose stock gained more than 40% during the period. Underweighting enterprise software provider Oracle also worked against the fund, given the stock's strong advance. Additionally, our results were hampered by a small out-of-benchmark position in Longtop Financial Technologies, a China-based company whose stock stopped trading in May, when it appeared the company had misrepresented its financial condition.
Comments from Charlie Chai, Portfolio Manager of Fidelity® Advisor Technology Fund: For the year, the fund's Institutional Class shares returned 27.18%, handily beating the 20.21% advance of the MSCI® U.S. IM Information Technology 25/50 Index and the S&P 500. Versus the MSCI index, stock picking in a number of groups, most notably communications equipment, semiconductors and systems software, was the main driver of the fund's outperformance. Elsewhere, security selection added value in computer hardware, although the benefit was tempered to some extent by underweighting the strong-performing group. Out-of-index representation in Internet retail was helpful as well. At the stock level, underweighting three weak-performing index heavyweights accounted for a lot of the fund's outperformance: networking equipment maker Cisco Systems, computer/printer provider Hewlett-Packard and software giant Microsoft. I'll also mention two out-of-benchmark positions that did well for the fund. Internet retailer Amazon.com continued to dominate its primary niche and enjoyed rapid growth in its Amazon Web Services segment. Meanwhile, Taiwan-based HTC was one of the beneficiaries of the surging popularity of smartphones incorporating Google's AndroidTM operating system. In absolute terms, computer/consumer electronics maker Apple - the fund's largest holding during the period - was a heavy hitter, adding more than six percentage points to performance. Conversely, a large underweighting and unrewarding stock selection in IT consulting/other services detracted from relative performance. The main problem there was the fund's negligible stake in major index constituent International Business Machines, whose stock gained more than 40% during the period. Underweighting enterprise software provider Oracle also worked against the fund, given the stock's strong advance. Additionally, our results were hampered by a small out-of-benchmark position in Longtop Financial Technologies, a China-based company whose stock stopped trading in May, when it appeared the company had misrepresented its financial condition.
The views expressed above reflect those of the portfolio manager(s) only through the end of the period as stated on the cover of this report and do not necessarily represent the views of Fidelity or any other person in the Fidelity organization. Any such views are subject to change at any time based upon market or other conditions and Fidelity disclaims any responsibility to update such views. These views may not be relied on as investment advice and, because investment decisions for a Fidelity fund are based on numerous factors, may not be relied on as an indication of trading intent on behalf of any Fidelity fund.
Annual Report
Fidelity Advisor Technology Fund
As a shareholder of the Fund, you incur two types of costs: (1) transaction costs, including sales charges (loads) on purchase payments or redemption proceeds, redemption fees, and (2) ongoing costs, including management fees, distribution and/or service (12b-1) fees and other Fund expenses. This Example is intended to help you understand your ongoing costs (in dollars) of investing in the Fund and to compare these costs with the ongoing costs of investing in other mutual funds.
The Example is based on an investment of $1,000 invested at the beginning of the period and held for the entire period (February 1, 2011 to July 31, 2011).
Actual Expenses
The first line of the accompanying table for each class of the Fund provides information about actual account values and actual expenses. You may use the information in this line, together with the amount you invested, to estimate the expenses that you paid over the period. Simply divide your account value by $1,000.00 (for example, an $8,600 account value divided by $1,000.00 = 8.6), then multiply the result by the number in the first line for a class of the Fund under the heading entitled "Expenses Paid During Period" to estimate the expenses you paid on your account during this period. In addition, the Fund, as a shareholder in the underlying Fidelity Central Funds, will indirectly bear its pro-rata share of the fees and expenses incurred by the underlying Fidelity Central Funds. These fees and expenses are not included in the Fund's annualized expense ratio used to calculate the expense estimate in the table below.
Hypothetical Example for Comparison Purposes
The second line of the accompanying table for each class of the Fund provides information about hypothetical account values and hypothetical expenses based on a Class' actual expense ratio and an assumed rate of return of 5% per year before expenses, which is not the Class' actual return. The hypothetical account values and expenses may not be used to estimate the actual ending account balance or expenses you paid for the period. You may use this information to compare the ongoing costs of investing in the Fund and other funds. To do so, compare this 5% hypothetical example with the 5% hypothetical examples that appear in the shareholder reports of the other funds. In addition, the Fund, as a shareholder in the underlying Fidelity Central Funds, will indirectly bear its pro-rata share of the fees and expenses incurred by the underlying Fidelity Central Funds. These fees and expenses are not included in the Fund's annualized expense ratio used to calculate the expense estimate in the table below.
Please note that the expenses shown in the table are meant to highlight your ongoing costs only and do not reflect any transaction costs. Therefore, the second line of the table is useful in comparing ongoing costs only, and will not help you determine the relative total costs of owning different funds. In addition, if these transactional costs were included, your costs would have been higher.
| Annualized
Expense Ratio | Beginning
Account Value
February 1, 2011 | Ending
Account Value
July 31, 2011 | Expenses Paid
During Period*
February 1, 2011 to
July 31, 2011 |
Class A | 1.17% | | | |
Actual | | $ 1,000.00 | $ 964.00 | $ 5.70 |
HypotheticalA | | $ 1,000.00 | $ 1,018.99 | $ 5.86 |
Class T | 1.41% | | | |
Actual | | $ 1,000.00 | $ 962.80 | $ 6.86 |
HypotheticalA | | $ 1,000.00 | $ 1,017.80 | $ 7.05 |
Class B | 1.92% | | | |
Actual | | $ 1,000.00 | $ 960.60 | $ 9.33 |
HypotheticalA | | $ 1,000.00 | $ 1,015.27 | $ 9.59 |
Class C | 1.91% | | | |
Actual | | $ 1,000.00 | $ 960.40 | $ 9.28 |
HypotheticalA | | $ 1,000.00 | $ 1,015.32 | $ 9.54 |
Institutional Class | .86% | | | |
Actual | | $ 1,000.00 | $ 965.80 | $ 4.19 |
HypotheticalA | | $ 1,000.00 | $ 1,020.53 | $ 4.31 |
A 5% return per year before expenses
* Expenses are equal to each Class' annualized expense ratio, multiplied by the average account value over the period, multiplied by 181/365 (to reflect the one-half year period).
Annual Report
Fidelity Advisor Technology Fund
Investment Changes (Unaudited)
Top Ten Stocks as of July 31, 2011 |
| % of fund's
net assets | % of fund's net assets
6 months ago |
Apple, Inc. | 11.0 | 13.7 |
Google, Inc. Class A | 6.0 | 6.3 |
Oracle Corp. | 5.9 | 4.7 |
salesforce.com, Inc. | 3.6 | 1.5 |
Microsoft Corp. | 3.3 | 1.0 |
SanDisk Corp. | 2.8 | 0.7 |
Amazon.com, Inc. | 2.3 | 0.1 |
Accenture PLC Class A | 2.3 | 1.8 |
EMC Corp. | 2.0 | 2.3 |
Cognizant Technology Solutions Corp. Class A | 1.9 | 1.4 |
| 41.1 | |
Top Industries (% of fund's net assets) |
As of July 31, 2011 |
| Software | 29.1% | |
| Computers & Peripherals | 17.9% | |
| Semiconductors & Semiconductor Equipment | 13.7% | |
| Internet Software & Services | 12.3% | |
| IT Services | 8.5% | |
| All Others* | 18.5% | |

As of January 31, 2011 |
| Software | 21.2% | |
| Computers & Peripherals | 20.5% | |
| Semiconductors & Semiconductor Equipment | 15.8% | |
| Internet Software & Services | 10.8% | |
| Communications Equipment | 10.4% | |
| All Others* | 21.3% | |

* Includes short-term investments and net other assets. |
Annual Report
Fidelity Advisor Technology Fund
Investments July 31, 2011
Showing Percentage of Net Assets
Common Stocks - 98.7% |
| Shares | | Value |
AUTOMOBILES - 0.0% |
Automobile Manufacturers - 0.0% |
Tesla Motors, Inc. (a) | 12,300 | | $ 346,491 |
BUILDING PRODUCTS - 0.0% |
Building Products - 0.0% |
Asahi Glass Co. Ltd. | 7,000 | | 81,219 |
CHEMICALS - 0.0% |
Commodity Chemicals - 0.0% |
STR Holdings, Inc. (a)(d) | 14,023 | | 192,956 |
COMMUNICATIONS EQUIPMENT - 4.3% |
Communications Equipment - 4.3% |
Acme Packet, Inc. (a) | 12,352 | | 727,780 |
Alcatel-Lucent SA sponsored ADR (a) | 158,796 | | 643,124 |
Aruba Networks, Inc. (a) | 32,700 | | 750,465 |
Brocade Communications Systems, Inc. (a) | 255,193 | | 1,398,458 |
China Wireless Technologies Ltd. | 208,000 | | 44,569 |
Ciena Corp. (a)(d) | 274,949 | | 4,250,712 |
Cisco Systems, Inc. | 75,685 | | 1,208,689 |
DG FastChannel, Inc. (a) | 31,179 | | 881,119 |
Emulex Corp. (a) | 5,400 | | 45,630 |
Finisar Corp. (a) | 132,897 | | 2,264,565 |
HTC Corp. | 2,015 | | 59,864 |
Infinera Corp. (a) | 70,900 | | 455,887 |
JDS Uniphase Corp. (a) | 5,169 | | 67,972 |
Juniper Networks, Inc. (a) | 5,398 | | 126,259 |
Motorola Mobility Holdings, Inc. | 81,690 | | 1,828,222 |
NETGEAR, Inc. (a) | 49,709 | | 1,635,923 |
Oclaro, Inc. (a) | 113,722 | | 534,493 |
Polycom, Inc. (a) | 247,906 | | 6,700,899 |
QUALCOMM, Inc. | 34,762 | | 1,904,262 |
Riverbed Technology, Inc. (a) | 43,270 | | 1,238,820 |
Sandvine Corp. (a) | 751,600 | | 1,659,497 |
Sandvine Corp. (U.K.) (a) | 554,200 | | 1,241,352 |
Sonus Networks, Inc. (a) | 29,060 | | 86,018 |
Telefonaktiebolaget LM Ericsson (B Shares) sponsored ADR | 246,541 | | 3,081,763 |
ZTE Corp. (H Shares) | 19,920 | | 62,236 |
| | 32,898,578 |
COMPUTERS & PERIPHERALS - 17.9% |
Computer Hardware - 11.4% |
Advantech Co. Ltd. | 87,000 | | 293,715 |
Apple, Inc. (a) | 216,834 | | 84,669,334 |
Foxconn Technology Co. Ltd. | 171,000 | | 787,500 |
Hewlett-Packard Co. | 21,197 | | 745,287 |
Stratasys, Inc. (a)(d) | 56,775 | | 1,447,763 |
| | 87,943,599 |
Computer Storage & Peripherals - 6.5% |
Catcher Technology Co. Ltd. | 251,000 | | 2,190,166 |
EMC Corp. (a) | 599,540 | | 15,636,003 |
|
| Shares | | Value |
Gemalto NV | 45,257 | | $ 2,161,190 |
Imagination Technologies Group PLC (a) | 173,800 | | 1,133,252 |
NetApp, Inc. (a) | 136,438 | | 6,483,534 |
SanDisk Corp. (a) | 510,032 | | 21,691,661 |
Seagate Technology | 5,102 | | 70,867 |
Smart Technologies, Inc. Class A (a) | 26,500 | | 154,760 |
Western Digital Corp. (a) | 2,369 | | 81,636 |
| | 49,603,069 |
TOTAL COMPUTERS & PERIPHERALS | | 137,546,668 |
CONSUMER FINANCE - 0.1% |
Consumer Finance - 0.1% |
Discover Financial Services | 40,000 | | 1,024,400 |
DIVERSIFIED CONSUMER SERVICES - 1.3% |
Education Services - 1.3% |
Educomp Solutions Ltd. | 16,123 | | 126,001 |
New Oriental Education & Technology Group, Inc. sponsored ADR (a) | 80,409 | | 10,270,642 |
| | 10,396,643 |
ELECTRICAL EQUIPMENT - 0.0% |
Electrical Components & Equipment - 0.0% |
A123 Systems, Inc. (a)(d) | 2,200 | | 11,286 |
Acuity Brands, Inc. | 1,582 | | 77,028 |
| | 88,314 |
ELECTRONIC EQUIPMENT & COMPONENTS - 2.4% |
Electronic Components - 0.8% |
Aeroflex Holding Corp. | 12,754 | | 182,382 |
Amphenol Corp. Class A | 1,400 | | 68,446 |
AU Optronics Corp. sponsored ADR (a) | 26,814 | | 147,745 |
Cando Corp. (a) | 1,462,895 | | 987,758 |
Chimei Innolux Corp. (a) | 16,000 | | 8,560 |
Corning, Inc. | 4,622 | | 73,536 |
J Touch Corp. | 32,750 | | 82,215 |
LG Display Co. Ltd. sponsored ADR | 28,532 | | 366,351 |
Omron Corp. | 17,500 | | 493,633 |
Universal Display Corp. (a)(d) | 124,110 | | 3,712,130 |
Vishay Intertechnology, Inc. (a) | 26,704 | | 367,714 |
| | 6,490,470 |
Electronic Equipment & Instruments - 0.4% |
Chroma ATE, Inc. | 485,683 | | 1,219,253 |
Itron, Inc. (a) | 8,068 | | 347,247 |
Keyence Corp. | 1,600 | | 452,569 |
SFA Engineering Corp. | 7,452 | | 457,313 |
SNU Precision Co. Ltd. | 33,961 | | 430,029 |
Test Research, Inc. | 285,155 | | 431,485 |
| | 3,337,896 |
Electronic Manufacturing Services - 0.3% |
Benchmark Electronics, Inc. (a) | 1,200 | | 17,580 |
Flextronics International Ltd. (a) | 62,700 | | 404,415 |
IPG Photonics Corp. (a) | 2,200 | | 132,418 |
Common Stocks - continued |
| Shares | | Value |
ELECTRONIC EQUIPMENT & COMPONENTS - CONTINUED |
Electronic Manufacturing Services - continued |
Jabil Circuit, Inc. | 23,602 | | $ 432,153 |
KEMET Corp. (a) | 27,549 | | 336,098 |
Multi-Fineline Electronix, Inc. (a) | 2,289 | | 46,490 |
TE Connectivity Ltd. | 6,400 | | 220,352 |
Trimble Navigation Ltd. (a) | 10,347 | | 368,146 |
| | 1,957,652 |
Technology Distributors - 0.9% |
Anixter International, Inc. | 1,235 | | 77,089 |
Arrow Electronics, Inc. (a) | 83,700 | | 2,908,575 |
Avnet, Inc. (a) | 38,100 | | 1,116,330 |
Digital China Holdings Ltd. (H Shares) | 1,210,000 | | 2,064,846 |
VST Holdings Ltd. (a) | 2,000,000 | | 508,096 |
WPG Holding Co. Ltd. | 204,565 | | 341,414 |
| | 7,016,350 |
TOTAL ELECTRONIC EQUIPMENT & COMPONENTS | | 18,802,368 |
HEALTH CARE EQUIPMENT & SUPPLIES - 0.6% |
Health Care Equipment - 0.3% |
Biosensors International Group Ltd. (a) | 1,805,000 | | 2,046,111 |
China Kanghui Holdings sponsored ADR (a)(d) | 9,000 | | 196,110 |
China Medical Technologies, Inc. sponsored ADR (a)(d) | 1,900 | | 12,578 |
Microport Scientific Corp. | 158,000 | | 94,267 |
Mingyuan Medicare Development Co. Ltd. | 270,000 | | 16,975 |
| | 2,366,041 |
Health Care Supplies - 0.3% |
Shandong Weigao Group Medical Polymer Co. Ltd. (H Shares) | 1,728,000 | | 2,363,479 |
TOTAL HEALTH CARE EQUIPMENT & SUPPLIES | | 4,729,520 |
HEALTH CARE TECHNOLOGY - 0.2% |
Health Care Technology - 0.2% |
athenahealth, Inc. (a) | 600 | | 35,274 |
So-net M3, Inc. | 128 | | 1,159,176 |
| | 1,194,450 |
HOTELS, RESTAURANTS & LEISURE - 1.2% |
Hotels, Resorts & Cruise Lines - 1.2% |
Ctrip.com International Ltd. sponsored ADR (a) | 194,500 | | 8,966,450 |
HOUSEHOLD DURABLES - 0.2% |
Consumer Electronics - 0.0% |
Skyworth Digital Holdings Ltd. | 640,764 | | 412,717 |
|
| Shares | | Value |
Household Appliances - 0.2% |
Haier Electronics Group Co. Ltd. (a) | 607,000 | | $ 739,104 |
Techtronic Industries Co. Ltd. | 680,500 | | 710,728 |
| | 1,449,832 |
TOTAL HOUSEHOLD DURABLES | | 1,862,549 |
INTERNET & CATALOG RETAIL - 2.7% |
Internet Retail - 2.7% |
Amazon.com, Inc. (a) | 78,254 | | 17,413,080 |
E-Commerce China Dangdang, Inc. ADR | 260 | | 2,938 |
MakeMyTrip Ltd. (d) | 8,300 | | 184,426 |
Priceline.com, Inc. (a) | 2,503 | | 1,345,738 |
Rakuten, Inc. | 1,643 | | 1,671,499 |
| | 20,617,681 |
INTERNET SOFTWARE & SERVICES - 12.3% |
Internet Software & Services - 12.3% |
21Vianet Group, Inc. ADR (d) | 27,900 | | 366,885 |
Akamai Technologies, Inc. (a) | 38,400 | | 930,048 |
Alibaba.com Ltd. | 509,000 | | 709,248 |
Baidu.com, Inc. sponsored ADR (a) | 10,241 | | 1,608,554 |
Bankrate, Inc. (d) | 67,500 | | 1,234,575 |
China Finance Online Co. Ltd. ADR (a) | 86,946 | | 278,227 |
ChinaCache International Holdings Ltd. sponsored ADR (d) | 8,500 | | 65,365 |
Cornerstone Ondemand, Inc. | 27,700 | | 454,280 |
DealerTrack Holdings, Inc. (a) | 12,300 | | 285,237 |
DeNA Co. Ltd. | 39,300 | | 1,963,341 |
eBay, Inc. (a) | 348,226 | | 11,404,402 |
Facebook, Inc. Class B (a)(f) | 37,876 | | 946,900 |
Google, Inc. Class A (a) | 77,068 | | 46,525,181 |
IntraLinks Holdings, Inc. | 4,490 | | 68,607 |
Kakaku.com, Inc. | 36,400 | | 1,440,109 |
LinkedIn Corp. (a) | 1,400 | | 141,442 |
LogMeIn, Inc. (a) | 57,600 | | 2,047,680 |
Mail.ru Group Ltd. GDR (a)(e) | 1,800 | | 64,296 |
Mercadolibre, Inc. | 35,434 | | 2,814,168 |
Open Text Corp. (a) | 1,700 | | 114,751 |
OpenTable, Inc. (a) | 1,147 | | 81,276 |
Opera Software ASA | 90,000 | | 580,009 |
Phoenix New Media Ltd. ADR (d) | 75,044 | | 768,451 |
Qihoo 360 Technology Co. Ltd. ADR (d) | 3,600 | | 82,980 |
Rackspace Hosting, Inc. (a) | 104,988 | | 4,199,520 |
Renren, Inc. ADR (d) | 5,900 | | 63,897 |
Responsys, Inc. | 1,500 | | 21,855 |
RightNow Technologies, Inc. (a) | 15,065 | | 511,306 |
SINA Corp. (a)(d) | 58,615 | | 6,335,695 |
Sohu.com, Inc. (a) | 29,800 | | 2,684,980 |
SouFun Holdings Ltd. ADR (d) | 20,960 | | 435,968 |
Velti PLC (a) | 50,436 | | 832,698 |
VeriSign, Inc. | 80,900 | | 2,524,889 |
VistaPrint Ltd. (a) | 9,217 | | 246,094 |
Vocus, Inc. (a) | 14,700 | | 419,979 |
Common Stocks - continued |
| Shares | | Value |
INTERNET SOFTWARE & SERVICES - CONTINUED |
Internet Software & Services - continued |
XO Group, Inc. (a) | 5,200 | | $ 48,620 |
Yahoo!, Inc. (a) | 117,400 | | 1,537,940 |
YouKu.com, Inc. ADR (a) | 2,129 | | 78,581 |
| | 94,918,034 |
IT SERVICES - 8.5% |
Data Processing & Outsourced Services - 2.9% |
DST Systems, Inc. | 8,904 | | 455,796 |
Fidelity National Information Services, Inc. | 140,263 | | 4,210,695 |
Fiserv, Inc. (a) | 94,205 | | 5,686,214 |
MasterCard, Inc. Class A | 30,430 | | 9,227,898 |
Paychex, Inc. | 25,463 | | 718,820 |
Syntel, Inc. | 7,600 | | 417,772 |
Visa, Inc. Class A | 17,872 | | 1,528,771 |
| | 22,245,966 |
IT Consulting & Other Services - 5.6% |
Accenture PLC Class A | 293,179 | | 17,338,606 |
Atos Origin SA (d) | 41,984 | | 2,318,882 |
Camelot Information Systems, Inc. ADR | 27,000 | | 317,250 |
Cognizant Technology Solutions Corp. Class A (a) | 209,741 | | 14,654,604 |
Digital Garage, Inc. (a)(d) | 39 | | 130,785 |
hiSoft Technology International Ltd. ADR (a) | 11,117 | | 154,193 |
International Business Machines Corp. | 12,821 | | 2,331,499 |
Sapient Corp. (a) | 53,100 | | 739,152 |
Teradata Corp. (a) | 99,167 | | 5,450,218 |
| | 43,435,189 |
TOTAL IT SERVICES | | 65,681,155 |
LEISURE EQUIPMENT & PRODUCTS - 0.0% |
Photographic Products - 0.0% |
Eastman Kodak Co. (a)(d) | 77,700 | | 186,480 |
LIFE SCIENCES TOOLS & SERVICES - 0.2% |
Life Sciences Tools & Services - 0.2% |
Agilent Technologies, Inc. (a) | 2,100 | | 88,536 |
Illumina, Inc. (a) | 13,800 | | 861,810 |
Wuxi Pharmatech Cayman, Inc. sponsored ADR (a) | 16,025 | | 249,670 |
| | 1,200,016 |
MACHINERY - 0.3% |
Industrial Machinery - 0.3% |
Fanuc Corp. | 5,600 | | 1,063,029 |
HIWIN Technologies Corp. | 13,390 | | 161,811 |
Mirle Automation Corp. | 376,950 | | 387,653 |
Sunpower Group Ltd. | 1,280,000 | | 361,417 |
| | 1,973,910 |
|
| Shares | | Value |
MEDIA - 1.5% |
Advertising - 1.0% |
Dentsu, Inc. | 47,800 | | $ 1,495,516 |
Focus Media Holding Ltd. ADR (a)(d) | 120,380 | | 3,959,298 |
ReachLocal, Inc. (a)(d) | 129,213 | | 2,350,384 |
| | 7,805,198 |
Cable & Satellite - 0.4% |
DISH Network Corp. Class A (a) | 71,200 | | 2,109,656 |
Virgin Media, Inc. | 40,700 | | 1,076,922 |
| | 3,186,578 |
Movies & Entertainment - 0.1% |
IMAX Corp. (a) | 23,730 | | 449,921 |
TOTAL MEDIA | | 11,441,697 |
METALS & MINING - 0.0% |
Diversified Metals & Mining - 0.0% |
Timminco Ltd. (a) | 5,600 | | 2,052 |
OFFICE ELECTRONICS - 0.0% |
Office Electronics - 0.0% |
Xerox Corp. | 8,333 | | 77,747 |
PHARMACEUTICALS - 0.1% |
Pharmaceuticals - 0.1% |
China Medical System Holding Ltd. | 671,600 | | 647,145 |
PROFESSIONAL SERVICES - 0.1% |
Human Resource & Employment Services - 0.1% |
51job, Inc. sponsored ADR (a) | 8,400 | | 554,820 |
REAL ESTATE MANAGEMENT & DEVELOPMENT - 0.1% |
Real Estate Services - 0.1% |
China Real Estate Information Corp. ADR (a)(d) | 82,149 | | 532,326 |
SEMICONDUCTORS & SEMICONDUCTOR EQUIPMENT - 13.7% |
Semiconductor Equipment - 2.5% |
Advanced Energy Industries, Inc. (a) | 5,757 | | 61,082 |
Amkor Technology, Inc. (a) | 26,109 | | 139,161 |
Asia Pacific Systems, Inc. (a) | 22,456 | | 345,051 |
ASM International NV unit | 12,900 | | 366,618 |
ASM Pacific Technology Ltd. | 22,100 | | 242,726 |
ASML Holding NV | 125,538 | | 4,475,430 |
Axcelis Technologies, Inc. (a) | 90,509 | | 150,245 |
centrotherm photovoltaics AG | 1,493 | | 51,335 |
Cymer, Inc. (a) | 78,838 | | 3,471,237 |
Entegris, Inc. (a) | 78,494 | | 672,694 |
GCL-Poly Energy Holdings Ltd. | 260,000 | | 146,450 |
KLA-Tencor Corp. | 27,928 | | 1,112,093 |
Lam Research Corp. (a) | 127,928 | | 5,229,697 |
LTX-Credence Corp. (a) | 25,920 | | 186,365 |
MKS Instruments, Inc. | 15,600 | | 389,220 |
Novellus Systems, Inc. (a) | 33,529 | | 1,040,740 |
Sumco Corp. (a) | 200 | | 3,165 |
Common Stocks - continued |
| Shares | | Value |
SEMICONDUCTORS & SEMICONDUCTOR EQUIPMENT - CONTINUED |
Semiconductor Equipment - continued |
Teradyne, Inc. (a) | 85,712 | | $ 1,156,255 |
Tessera Technologies, Inc. (a) | 3,600 | | 56,556 |
| | 19,296,120 |
Semiconductors - 11.2% |
Advanced Micro Devices, Inc. (a) | 100,423 | | 737,105 |
Alpha & Omega Semiconductor Ltd. (a) | 33,538 | | 376,967 |
Altera Corp. | 18,422 | | 753,091 |
Applied Micro Circuits Corp. (a) | 34,350 | | 216,749 |
ARM Holdings PLC sponsored ADR | 134,326 | | 3,867,246 |
Atmel Corp. (a) | 140,586 | | 1,701,091 |
Avago Technologies Ltd. | 11,124 | | 374,100 |
Broadcom Corp. Class A | 284,926 | | 10,562,207 |
Canadian Solar, Inc. (a)(d) | 244,482 | | 2,144,107 |
Cavium, Inc. (a) | 17,351 | | 598,436 |
CSR PLC | 69,154 | | 316,957 |
Cypress Semiconductor Corp. | 22,622 | | 465,561 |
Duksan Hi-Metal Co. Ltd. (a) | 90,603 | | 2,487,867 |
Fairchild Semiconductor International, Inc. (a) | 4,818 | | 72,318 |
First Solar, Inc. (a)(d) | 3,215 | | 380,109 |
Freescale Semiconductor Holdings I Ltd. | 90,100 | | 1,471,333 |
Gintech Energy Corp. | 52,499 | | 114,523 |
Hanwha Solarone Co. Ltd. ADR (a)(d) | 112,702 | | 610,845 |
Hittite Microwave Corp. (a) | 1,279 | | 71,611 |
Hynix Semiconductor, Inc. | 96,280 | | 2,214,541 |
Inphi Corp. | 48,389 | | 614,056 |
International Rectifier Corp. (a) | 27,465 | | 705,576 |
Intersil Corp. Class A | 72,188 | | 869,865 |
JA Solar Holdings Co. Ltd. ADR (a) | 1,195,316 | | 5,737,517 |
Jinkosolar Holdings Co. Ltd. ADR (a)(d) | 315,491 | | 6,846,155 |
MagnaChip Semiconductor Corp. | 51,600 | | 547,476 |
Marvell Technology Group Ltd. (a) | 609,431 | | 9,031,767 |
Melfas, Inc. | 10,451 | | 312,747 |
Micrel, Inc. | 110,633 | | 1,122,925 |
Micron Technology, Inc. (a) | 800,127 | | 5,896,936 |
Microsemi Corp. (a) | 4,100 | | 81,385 |
Monolithic Power Systems, Inc. (a) | 53,832 | | 726,194 |
Motech Industries, Inc. | 78,199 | | 243,424 |
Neo Solar Power Corp. | 126,000 | | 166,662 |
Netlogic Microsystems, Inc. (a) | 33,000 | | 1,140,150 |
NVIDIA Corp. (a) | 167,883 | | 2,321,822 |
NXP Semiconductors NV | 312,135 | | 6,174,030 |
O2Micro International Ltd. sponsored ADR (a) | 38,400 | | 195,072 |
ON Semiconductor Corp. (a) | 42,800 | | 371,932 |
Phison Electronics Corp. | 400,000 | | 2,008,310 |
PMC-Sierra, Inc. (a) | 18,400 | | 128,616 |
Power Integrations, Inc. | 22,085 | | 783,797 |
Radiant Opto-Electronics Corp. | 365 | | 1,428 |
Rambus, Inc. (a) | 35,400 | | 491,352 |
Silicon Laboratories, Inc. (a) | 27,800 | | 984,398 |
|
| Shares | | Value |
Spreadtrum Communications, Inc. ADR (d) | 52,574 | | $ 712,378 |
Standard Microsystems Corp. (a) | 27,967 | | 661,699 |
Suntech Power Holdings Co. Ltd. sponsored ADR (a)(d) | 147,200 | | 1,080,448 |
Trina Solar Ltd. (a)(d) | 311,894 | | 5,586,022 |
Xilinx, Inc. | 2,443 | | 78,420 |
Yingli Green Energy Holding Co. Ltd. ADR (a)(d) | 73,900 | | 535,036 |
YoungTek Electronics Corp. | 33,830 | | 106,597 |
| | 85,800,956 |
TOTAL SEMICONDUCTORS & SEMICONDUCTOR EQUIPMENT | | 105,097,076 |
SOFTWARE - 29.1% |
Application Software - 16.1% |
Adobe Systems, Inc. (a) | 2,752 | | 76,285 |
ANSYS, Inc. (a) | 44,008 | | 2,226,805 |
AsiaInfo-Linkage, Inc. (a)(d) | 374,094 | | 5,716,156 |
Aspen Technology, Inc. (a) | 251,273 | | 3,894,732 |
Autodesk, Inc. (a) | 76,898 | | 2,645,291 |
AutoNavi Holdings Ltd. ADR | 45,521 | | 753,828 |
Autonomy Corp. PLC (a) | 73,343 | | 2,023,922 |
BroadSoft, Inc. (a)(d) | 89,881 | | 2,625,424 |
Cadence Design Systems, Inc. (a) | 39,087 | | 403,769 |
Citrix Systems, Inc. (a) | 154,859 | | 11,156,042 |
Compuware Corp. (a) | 82,341 | | 795,414 |
Concur Technologies, Inc. (a) | 160,875 | | 7,310,160 |
Convio, Inc. (a) | 31,734 | | 322,417 |
Descartes Systems Group, Inc. (a) | 179,500 | | 1,238,125 |
Informatica Corp. (a) | 126,300 | | 6,457,719 |
Intuit, Inc. (a) | 125,795 | | 5,874,627 |
JDA Software Group, Inc. (a) | 2,584 | | 72,249 |
Kenexa Corp. (a) | 15,369 | | 392,985 |
Kingdee International Software Group Co. Ltd. | 8,284,800 | | 4,857,904 |
Longtop Financial Technologies Ltd. ADR (a) | 89,875 | | 170,133 |
Manhattan Associates, Inc. (a) | 2,257 | | 84,186 |
MicroStrategy, Inc. Class A (a) | 29,715 | | 4,735,680 |
Nuance Communications, Inc. (a) | 92,214 | | 1,845,202 |
Parametric Technology Corp. (a) | 343,440 | | 7,140,118 |
Pegasystems, Inc. | 97,459 | | 3,933,445 |
QLIK Technologies, Inc. | 119,687 | | 3,627,713 |
Quest Software, Inc. (a) | 17,300 | | 328,354 |
RealPage, Inc. | 15,200 | | 365,560 |
salesforce.com, Inc. (a) | 191,587 | | 27,724,555 |
SolarWinds, Inc. (a) | 122,564 | | 2,636,352 |
SuccessFactors, Inc. (a) | 132,800 | | 3,585,600 |
Synopsys, Inc. (a) | 15,500 | | 371,535 |
Taleo Corp. Class A (a) | 88,266 | | 2,921,605 |
TIBCO Software, Inc. (a) | 99,689 | | 2,595,902 |
Common Stocks - continued |
| Shares | | Value |
SOFTWARE - CONTINUED |
Application Software - continued |
TiVo, Inc. (a) | 8,000 | | $ 75,200 |
VanceInfo Technologies, Inc. ADR (a)(d) | 137,600 | | 2,783,648 |
| | 123,768,642 |
Home Entertainment Software - 0.1% |
Activision Blizzard, Inc. | 5,800 | | 68,672 |
Kingsoft Corp. Ltd. | 175,000 | | 114,963 |
NCsoft Corp. | 1,069 | | 329,532 |
Perfect World Co. Ltd. sponsored ADR Class B (a) | 4,400 | | 87,076 |
RealD, Inc. (d) | 3,600 | | 55,728 |
| | 655,971 |
Systems Software - 12.9% |
Ariba, Inc. (a) | 194,919 | | 6,445,971 |
BMC Software, Inc. (a) | 5,613 | | 242,594 |
Check Point Software Technologies Ltd. (a) | 27,400 | | 1,579,610 |
CommVault Systems, Inc. (a) | 182,806 | | 7,078,248 |
DemandTec, Inc. (a) | 36,900 | | 264,204 |
Fortinet, Inc. (a) | 94,916 | | 1,928,693 |
Insyde Software Corp. | 14,498 | | 69,779 |
MICROS Systems, Inc. (a) | 15,800 | | 773,726 |
Microsoft Corp. | 911,750 | | 24,981,950 |
NetSuite, Inc. (a) | 24,600 | | 964,566 |
Oracle Corp. | 1,470,791 | | 44,976,789 |
Red Hat, Inc. (a) | 1,763 | | 74,187 |
Rovi Corp. (a) | 54,177 | | 2,869,756 |
VMware, Inc. Class A (a) | 68,199 | | 6,843,088 |
| | 99,093,161 |
TOTAL SOFTWARE | | 223,517,774 |
WIRELESS TELECOMMUNICATION SERVICES - 1.9% |
Wireless Telecommunication Services - 1.9% |
American Tower Corp. Class A (a) | 101,042 | | 5,307,736 |
Crown Castle International Corp. (a) | 101,400 | | 4,400,760 |
SBA Communications Corp. Class A (a) | 110,949 | | 4,234,923 |
SOFTBANK CORP. | 10,100 | | 394,998 |
Sprint Nextel Corp. (a) | 18,461 | | 78,090 |
| | 14,416,507 |
TOTAL COMMON STOCKS (Cost $714,591,960) | 758,995,026 |
Convertible Bonds - 0.2% |
| Principal Amount | | |
COMMUNICATIONS EQUIPMENT - 0.2% |
Communications Equipment - 0.2% |
Ciena Corp. 0.25% 5/1/13
(Cost $1,270,000) | | $ 1,270,000 | | 1,223,645 |
Master Notes - 0.0% |
| Principal
Amount | | Value |
OZ Optics Ltd. 5% 11/5/14 (f)
(Cost $245,923) | | $ 240,883 | | $ 240,883 |
Money Market Funds - 8.5% |
| Shares | | |
Fidelity Cash Central Fund, 0.14% (b) | 20,424,698 | | 20,424,698 |
Fidelity Securities Lending Cash Central Fund, 0.15% (b)(c) | 45,213,159 | | 45,213,159 |
TOTAL MONEY MARKET FUNDS (Cost $65,637,857) | 65,637,857 |
TOTAL INVESTMENT PORTFOLIO - 107.4% (Cost $781,745,740) | | 826,097,411 |
NET OTHER ASSETS (LIABILITIES) - (7.4)% | | (56,897,771) |
NET ASSETS - 100% | $ 769,199,640 |
Legend |
(a) Non-income producing |
(b) Affiliated fund that is available only to investment companies and other accounts managed by Fidelity Investments. The rate quoted is the annualized seven-day yield of the fund at period end. A complete unaudited listing of the fund's holdings as of its most recent quarter end is available upon request. In addition, each Fidelity Central Fund's financial statements, which are not covered by the Fund's Report of Independent Registered Public Accounting Firm, are available on the SEC's website or upon request. |
(c) Investment made with cash collateral received from securities on loan. |
(d) Security or a portion of the security is on loan at period end. |
(e) Security exempt from registration under Rule 144A of the Securities Act of 1933. These securities may be resold in transactions exempt from registration, normally to qualified institutional buyers. At the end of the period, the value of these securities amounted to $64,296 or 0.0% of net assets. |
(f) Restricted securities - Investment in securities not registered under the Securities Act of 1933 (excluding 144A issues). At the end of the period, the value of restricted securities (excluding 144A issues) amounted to $1,187,783 or 0.2% of net assets. |
Additional information on each restricted holding is as follows: |
Security | Acquisition Date | Acquisition Cost |
Facebook, Inc. Class B | 3/31/11 - 5/19/11 | $ 947,157 |
OZ Optics Ltd. 5% 11/5/14 | 11/5/10 | $ 246,969 |
Affiliated Central Funds |
Information regarding fiscal year to date income earned by the Fund from investments in Fidelity Central Funds is as follows: |
Fund | Income earned |
Fidelity Cash Central Fund | $ 28,772 |
Fidelity Securities Lending Cash Central Fund | 555,506 |
Total | $ 584,278 |
Other Information |
The following is a summary of the inputs used, as of July 31, 2011, involving the Fund's assets and liabilities carried at fair value. The inputs or methodology used for valuing securities may not be an indication of the risk associated with investing in those securities. For more information on valuation inputs, and their aggregation into the levels used in the tables below, please refer to the Security Valuation section in the accompanying Notes to Financial Statements. |
Valuation Inputs at Reporting Date: |
Description | Total | Level 1 | Level 2 | Level 3 |
Investments in Securities: | | | | |
Common Stocks | $ 758,995,026 | $ 757,877,993 | $ - | $ 1,117,033 |
Convertible Bonds | 1,223,645 | - | 1,223,645 | - |
Master Notes | 240,883 | - | - | 240,883 |
Money Market Funds | 65,637,857 | 65,637,857 | - | - |
Total Investments in Securities: | $ 826,097,411 | $ 823,515,850 | $ 1,223,645 | $ 1,357,916 |
The following is a reconciliation of Investments in Securities for which Level 3 inputs were used in determining value: |
Investments in Securities: | |
Beginning Balance | $ 301,240 |
Total Realized Gain (Loss) | (592,968) |
Total Unrealized Gain (Loss) | (2,435,484) |
Cost of Purchases | 2,876,807 |
Proceeds of Sales | (773,768) |
Amortization/Accretion | (1,046) |
Transfers in to Level 3 | 1,983,135 |
Transfers out of Level 3 | - |
Ending Balance | $ 1,357,916 |
The change in unrealized gain (loss) for the period attributable to Level 3 securities held at July 31, 2011 | $ (3,137,923) |
The information used in the above reconciliation represents fiscal year to date activity for any Investments in Securities identified as using Level 3 inputs at either the beginning or the end of the current fiscal period. Transfers in or out of Level 3 represent the beginning value of any Security or Instrument where a change in the pricing level occurred from the beginning to the end of the period. The cost of purchases and the proceeds of sales may include securities received or delivered through corporate actions or exchanges. Realized and unrealized gains (losses) disclosed in the reconciliation are included in Net Gain (Loss) on the Fund's Statement of Operations. |
Distribution of investments by country of issue, as a percentage of total net assets, is as follows: (Unaudited) |
United States of America | 77.8% |
Cayman Islands | 7.0% |
Ireland | 2.3% |
China | 2.2% |
Bermuda | 2.0% |
Netherlands | 1.8% |
Japan | 1.5% |
Taiwan | 1.1% |
United Kingdom | 1.0% |
Canada | 1.0% |
Others (Individually Less Than 1%) | 2.3% |
| 100.0% |
Income Tax Information |
At July 31, 2011, the Fund had a capital loss carryforward of approximately $132,837,596 all of which will expire in fiscal 2017. Capital loss carryforwards are only available to offset future capital gains of the Fund to the extent provided by regulations and may be limited. |
See accompanying notes which are an integral part of the financial statements.
Annual Report
Fidelity Advisor Technology Fund
Statement of Assets and Liabilities
| July 31, 2011 |
| | |
Assets | | |
Investment in securities, at value (including securities loaned of $43,545,111) - See accompanying schedule: Unaffiliated issuers (cost $716,107,883) | $ 760,459,554 | |
Fidelity Central Funds (cost $65,637,857) | 65,637,857 | |
Total Investments (cost $781,745,740) | | $ 826,097,411 |
Foreign currency held at value (cost $1,003,875) | | 1,002,950 |
Receivable for investments sold | | 29,147,803 |
Receivable for fund shares sold | | 578,440 |
Dividends receivable | | 250,309 |
Interest receivable | | 9,628 |
Distributions receivable from Fidelity Central Funds | | 280,720 |
Other receivables | | 51,440 |
Total assets | | 857,418,701 |
| | |
Liabilities | | |
Payable for investments purchased | $ 38,459,650 | |
Payable for fund shares redeemed | 3,652,279 | |
Accrued management fee | 370,920 | |
Distribution and service plan fees payable | 266,273 | |
Other affiliated payables | 213,637 | |
Other payables and accrued expenses | 43,143 | |
Collateral on securities loaned, at value | 45,213,159 | |
Total liabilities | | 88,219,061 |
| | |
Net Assets | | $ 769,199,640 |
Net Assets consist of: | | |
Paid in capital | | $ 863,606,296 |
Accumulated net investment loss | | (24) |
Accumulated undistributed net realized gain (loss) on investments and foreign currency transactions | | (138,761,313) |
Net unrealized appreciation (depreciation) on investments and assets and liabilities in foreign currencies | | 44,354,681 |
Net Assets | | $ 769,199,640 |
Statement of Assets and Liabilities - continued
| July 31, 2011 |
| | |
Calculation of Maximum Offering Price Class A:
Net Asset Value and redemption price per share ($375,609,390 ÷ 14,938,629 shares) | | $ 25.14 |
| | |
Maximum offering price per share (100/94.25 of $25.14) | | $ 26.67 |
Class T:
Net Asset Value and redemption price per share ($196,913,324 ÷ 8,092,001 shares) | | $ 24.33 |
| | |
Maximum offering price per share (100/96.50 of $24.33) | | $ 25.21 |
Class B:
Net Asset Value and offering price per share ($25,508,200 ÷ 1,124,989 shares)A | | $ 22.67 |
| | |
Class C:
Net Asset Value and offering price per share ($89,819,193 ÷ 3,943,773 shares)A | | $ 22.77 |
| | |
Institutional Class:
Net Asset Value, offering price and redemption price per share ($81,349,533 ÷ 3,093,086 shares) | | $ 26.30 |
A Redemption price per share is equal to net asset value less any applicable contingent deferred sales charge.
See accompanying notes which are an integral part of the financial statements.
Annual Report
Statement of Operations
| Year ended July 31, 2011 |
| | |
Investment Income | | |
Dividends | | $ 2,679,664 |
Interest | | 11,489 |
Income from Fidelity Central Funds (including $555,506 from security lending) | | 584,278 |
Total income | | 3,275,431 |
| | |
Expenses | | |
Management fee | $ 4,334,829 | |
Transfer agent fees | 2,282,624 | |
Distribution and service plan fees | 3,147,500 | |
Accounting and security lending fees | 276,385 | |
Custodian fees and expenses | 93,479 | |
Independent trustees' compensation | 4,220 | |
Registration fees | 89,940 | |
Audit | 57,366 | |
Legal | 4,149 | |
Miscellaneous | 7,662 | |
Total expenses before reductions | 10,298,154 | |
Expense reductions | (165,087) | 10,133,067 |
Net investment income (loss) | | (6,857,636) |
Realized and Unrealized Gain (Loss) Net realized gain (loss) on: | | |
Investment securities: | | |
Unaffiliated issuers | 189,025,050 | |
Foreign currency transactions | 58,356 | |
Total net realized gain (loss) | | 189,083,406 |
Change in net unrealized appreciation (depreciation) on: Investment securities | (20,612,691) | |
Assets and liabilities in foreign currencies | 7,245 | |
Total change in net unrealized appreciation (depreciation) | | (20,605,446) |
Net gain (loss) | | 168,477,960 |
Net increase (decrease) in net assets resulting from operations | | $ 161,620,324 |
Statement of Changes in Net Assets
| Year ended
July 31,
2011 | Year ended
July 31,
2010 |
Increase (Decrease) in Net Assets | | |
Operations | | |
Net investment income (loss) | $ (6,857,636) | $ (6,176,617) |
Net realized gain (loss) | 189,083,406 | 117,224,365 |
Change in net unrealized appreciation (depreciation) | (20,605,446) | 9,231,846 |
Net increase (decrease) in net assets resulting from operations | 161,620,324 | 120,279,594 |
Share transactions - net increase (decrease) | (15,631,022) | (19,248,670) |
Redemption fees | 32,306 | 34,453 |
Total increase (decrease) in net assets | 146,021,608 | 101,065,377 |
| | |
Net Assets | | |
Beginning of period | 623,178,032 | 522,112,655 |
End of period (including accumulated net investment loss of $24 and undistributed net investment income of $0, respectively) | $ 769,199,640 | $ 623,178,032 |
See accompanying notes which are an integral part of the financial statements.
Annual Report
Financial Highlights - Class A
Years ended July 31, | 2011 | 2010 | 2009 | 2008 | 2007 |
Selected Per-Share Data | | | | | |
Net asset value, beginning of period | $ 19.83 | $ 16.03 | $ 17.04 | $ 20.55 | $ 15.59 |
Income from Investment Operations | | | | | |
Net investment income (loss) C | (.18) | (.16) | .02 F | (.10) | (.17) |
Net realized and unrealized gain (loss) | 5.49 | 3.96 | (1.03) | (3.41) | 5.13 |
Total from investment operations | 5.31 | 3.80 | (1.01) | (3.51) | 4.96 |
Redemption fees added to paid in capital C,H | - | - | - | - | - |
Net asset value, end of period | $ 25.14 | $ 19.83 | $ 16.03 | $ 17.04 | $ 20.55 |
Total Return A,B | 26.78% | 23.71% | (5.93)% | (17.08)% | 31.82% |
Ratios to Average Net Assets D,G | | | | | |
Expenses before reductions | 1.18% | 1.21% | 1.23% | 1.21% | 1.25% |
Expenses net of fee waivers, if any | 1.18% | 1.21% | 1.23% | 1.21% | 1.25% |
Expenses net of all reductions | 1.16% | 1.18% | 1.22% | 1.19% | 1.24% |
Net investment income (loss) | (.73)% | (.83)% | .17% F | (.49)% | (.91)% |
Supplemental Data | | | | | |
Net assets, end of period (000 omitted) | $ 375,609 | $ 312,659 | $ 258,433 | $ 275,117 | $ 309,105 |
Portfolio turnover rate E | 167% | 115% | 225% | 214% | 208% |
A Total returns would have been lower if certain expenses had not been reduced during the applicable periods shown.
B Total returns do not include the effect of the sales charges.
C Calculated based on average shares outstanding during the period.
D Fees and expenses of any underlying Fidelity Central Funds are not included in the Fund's expense ratio. The Fund indirectly bears its proportionate share of the expenses of any underlying Fidelity Central Funds.
E Amount does not include the portfolio activity of any underlying Fidelity Central Funds.
F Investment income per share reflects a special dividend which amounted to $.04 per share. Excluding the special dividend, the ratio of net investment income (loss) to average net assets would have been (.18)%.
G Expense ratios reflect operating expenses of the class. Expenses before reductions do not reflect amounts reimbursed by the investment adviser or reductions from brokerage service arrangements or reductions from other expense offset arrangements and do not represent the amount paid by the class during periods when reimbursements or reductions occur. Expenses net of fee waivers reflect expenses after reimbursement by the investment adviser but prior to reductions from brokerage service arrangements or other expense offset arrangements. Expenses net of all reductions represent the net expenses paid by the class.
H Amount represents less than $.01 per share.
Financial Highlights - Class T
Years ended July 31, | 2011 | 2010 | 2009 | 2008 | 2007 |
Selected Per-Share Data | | | | | |
Net asset value, beginning of period | $ 19.24 | $ 15.59 | $ 16.62 | $ 20.09 | $ 15.28 |
Income from Investment Operations | | | | | |
Net investment income (loss) C | (.23) | (.20) | (.01) F | (.14) | (.21) |
Net realized and unrealized gain (loss) | 5.32 | 3.85 | (1.02) | (3.33) | 5.02 |
Total from investment operations | 5.09 | 3.65 | (1.03) | (3.47) | 4.81 |
Redemption fees added to paid in capital C,H | - | - | - | - | - |
Net asset value, end of period | $ 24.33 | $ 19.24 | $ 15.59 | $ 16.62 | $ 20.09 |
Total Return A,B | 26.46% | 23.41% | (6.20)% | (17.27)% | 31.48% |
Ratios to Average Net Assets D,G | | | | | |
Expenses before reductions | 1.43% | 1.46% | 1.49% | 1.46% | 1.51% |
Expenses net of fee waivers, if any | 1.43% | 1.46% | 1.49% | 1.46% | 1.51% |
Expenses net of all reductions | 1.40% | 1.44% | 1.48% | 1.45% | 1.49% |
Net investment income (loss) | (.98)% | (1.09)% | (.09)% F | (.74)% | (1.16)% |
Supplemental Data | | | | | |
Net assets, end of period (000 omitted) | $ 196,913 | $ 169,049 | $ 151,170 | $ 173,917 | $ 260,339 |
Portfolio turnover rate E | 167% | 115% | 225% | 214% | 208% |
A Total returns would have been lower if certain expenses had not been reduced during the applicable periods shown.
B Total returns do not include the effect of the sales charges.
C Calculated based on average shares outstanding during the period.
D Fees and expenses of any underlying Fidelity Central Funds are not included in the Fund's expense ratio. The Fund indirectly bears its proportionate share of the expenses of any underlying Fidelity Central Funds.
E Amount does not include the portfolio activity of any underlying Fidelity Central Funds.
F Investment income per share reflects a special dividend which amounted to $.04 per share. Excluding the special dividend, the ratio of net investment income (loss) to average net assets would have been (.44)%.
G Expense ratios reflect operating expenses of the class. Expenses before reductions do not reflect amounts reimbursed by the investment adviser or reductions from brokerage service arrangements or reductions from other expense offset arrangements and do not represent the amount paid by the class during periods when reimbursements or reductions occur. Expenses net of fee waivers reflect expenses after reimbursement by the investment adviser but prior to reductions from brokerage service arrangements or other expense offset arrangements. Expenses net of all reductions represent the net expenses paid by the class.
H Amount represents less than $.01 per share.
See accompanying notes which are an integral part of the financial statements.
Annual Report
Financial Highlights - Class B
Years ended July 31, | 2011 | 2010 | 2009 | 2008 | 2007 |
Selected Per-Share Data | | | | | |
Net asset value, beginning of period | $ 18.01 | $ 14.67 | $ 15.72 | $ 19.10 | $ 14.59 |
Income from Investment Operations | | | | | |
Net investment income (loss) C | (.33) | (.27) | (.07) F | (.23) | (.28) |
Net realized and unrealized gain (loss) | 4.99 | 3.61 | (.98) | (3.15) | 4.79 |
Total from investment operations | 4.66 | 3.34 | (1.05) | (3.38) | 4.51 |
Redemption fees added to paid in capital C,H | - | - | - | - | - |
Net asset value, end of period | $ 22.67 | $ 18.01 | $ 14.67 | $ 15.72 | $ 19.10 |
Total Return A,B | 25.87% | 22.77% | (6.68)% | (17.70)% | 30.91% |
Ratios to Average Net Assets D,G | | | | | |
Expenses before reductions | 1.93% | 1.96% | 1.98% | 1.96% | 2.01% |
Expenses net of fee waivers, if any | 1.93% | 1.96% | 1.98% | 1.96% | 2.01% |
Expenses net of all reductions | 1.91% | 1.94% | 1.97% | 1.94% | 2.00% |
Net investment income (loss) | (1.49)% | (1.59)% | (.58)% F | (1.24)% | (1.67)% |
Supplemental Data | | | | | |
Net assets, end of period (000 omitted) | $ 25,508 | $ 29,176 | $ 30,580 | $ 47,294 | $ 102,655 |
Portfolio turnover rate E | 167% | 115% | 225% | 214% | 208% |
A Total returns would have been lower if certain expenses had not been reduced during the applicable periods shown.
B Total returns do not include the effect of the contingent deferred sales charge.
C Calculated based on average shares outstanding during the period.
D Fees and expenses of any underlying Fidelity Central Funds are not included in the Fund's expense ratio. The Fund indirectly bears its proportionate share of the expenses of any underlying Fidelity Central Funds.
E Amount does not include the portfolio activity of any underlying Fidelity Central Funds.
F Investment income per share reflects a special dividend which amounted to $.04 per share. Excluding the special dividend, the ratio of net investment income (loss) to average net assets would have been (.93)%.
G Expense ratios reflect operating expenses of the class. Expenses before reductions do not reflect amounts reimbursed by the investment adviser or reductions from brokerage service arrangements or reductions from other expense offset arrangements and do not represent the amount paid by the class during periods when reimbursements or reductions occur. Expenses net of fee waivers reflect expenses after reimbursement by the investment adviser but prior to reductions from brokerage service arrangements or other expense offset arrangements. Expenses net of all reductions represent the net expenses paid by the class.
H Amount represents less than $.01 per share.
Financial Highlights - Class C
Years ended July 31, | 2011 | 2010 | 2009 | 2008 | 2007 |
Selected Per-Share Data | | | | | |
Net asset value, beginning of period | $ 18.09 | $ 14.74 | $ 15.79 | $ 19.18 | $ 14.66 |
Income from Investment Operations | | | | | |
Net investment income (loss) C | (.33) | (.28) | (.07) F | (.23) | (.29) |
Net realized and unrealized gain (loss) | 5.01 | 3.63 | (.98) | (3.16) | 4.81 |
Total from investment operations | 4.68 | 3.35 | (1.05) | (3.39) | 4.52 |
Redemption fees added to paid in capital C,H | - | - | - | - | - |
Net asset value, end of period | $ 22.77 | $ 18.09 | $ 14.74 | $ 15.79 | $ 19.18 |
Total Return A,B | 25.87% | 22.73% | (6.65)% | (17.67)% | 30.83% |
Ratios to Average Net Assets D,G | | | | | |
Expenses before reductions | 1.92% | 1.96% | 1.98% | 1.96% | 2.01% |
Expenses net of fee waivers, if any | 1.92% | 1.96% | 1.98% | 1.96% | 2.01% |
Expenses net of all reductions | 1.90% | 1.93% | 1.97% | 1.94% | 1.99% |
Net investment income (loss) | (1.48)% | (1.58)% | (.58)% F | (1.24)% | (1.66)% |
Supplemental Data | | | | | |
Net assets, end of period (000 omitted) | $ 89,819 | $ 70,017 | $ 55,645 | $ 63,590 | $ 86,974 |
Portfolio turnover rate E | 167% | 115% | 225% | 214% | 208% |
A Total returns would have been lower if certain expenses had not been reduced during the applicable periods shown.
B Total returns do not include the effect of the contingent deferred sales charge.
C Calculated based on average shares outstanding during the period.
D Fees and expenses of any underlying Fidelity Central Funds are not included in the Fund's expense ratio. The Fund indirectly bears its proportionate share of the expenses of any underlying Fidelity Central Funds.
E Amount does not include the portfolio activity of any underlying Fidelity Central Funds.
F Investment income per share reflects a special dividend which amounted to $.04 per share. Excluding the special dividend, the ratio of net investment income (loss) to average net assets would have been (.93)%.
G Expense ratios reflect operating expenses of the class. Expenses before reductions do not reflect amounts reimbursed by the investment adviser or reductions from brokerage service arrangements or reductions from other expense offset arrangements and do not represent the amount paid by the class during periods when reimbursements or reductions occur. Expenses net of fee waivers reflect expenses after reimbursement by the investment adviser but prior to reductions from brokerage service arrangements or other expense offset arrangements. Expenses net of all reductions represent the net expenses paid by the class.
H Amount represents less than $.01 per share.
See accompanying notes which are an integral part of the financial statements.
Annual Report
Financial Highlights - Institutional Class
Years ended July 31, | 2011 | 2010 | 2009 | 2008 | 2007 |
Selected Per-Share Data | | | | | |
Net asset value, beginning of period | $ 20.68 | $ 16.67 | $ 17.68 | $ 21.26 | $ 16.07 |
Income from Investment Operations | | | | | |
Net investment income (loss) B | (.11) | (.11) | .06 E | (.04) | (.11) |
Net realized and unrealized gain (loss) | 5.73 | 4.12 | (1.07) | (3.54) | 5.30 |
Total from investment operations | 5.62 | 4.01 | (1.01) | (3.58) | 5.19 |
Redemption fees added to paid in capital B,G | - | - | - | - | - |
Net asset value, end of period | $ 26.30 | $ 20.68 | $ 16.67 | $ 17.68 | $ 21.26 |
Total Return A | 27.18% | 24.06% | (5.71)% | (16.84)% | 32.30% |
Ratios to Average Net Assets C,F | | | | | |
Expenses before reductions | .87% | .92% | .98% | .94% | .93% |
Expenses net of fee waivers, if any | .87% | .92% | .98% | .94% | .93% |
Expenses net of all reductions | .85% | .90% | .97% | .92% | .92% |
Net investment income (loss) | (.43)% | (.55)% | .42% E | (.22)% | (.59)% |
Supplemental Data | | | | | |
Net assets, end of period (000 omitted) | $ 81,350 | $ 42,277 | $ 26,285 | $ 22,021 | $ 21,111 |
Portfolio turnover rate D | 167% | 115% | 225% | 214% | 208% |
A Total returns would have been lower if certain expenses had not been reduced during the applicable periods shown.
B Calculated based on average shares outstanding during the period.
C Fees and expenses of any underlying Fidelity Central Funds are not included in the Fund's expense ratio. The Fund indirectly bears its proportionate share of the expenses of any underlying Fidelity Central Funds.
D Amount does not include the portfolio activity of any underlying Fidelity Central Funds.
E Investment income per share reflects a special dividend which amounted to $.04 per share. Excluding the special dividend, the ratio of net investment income (loss) to average net assets would have been .07%.
F Expense ratios reflect operating expenses of the class. Expenses before reductions do not reflect amounts reimbursed by the investment adviser or reductions from brokerage service arrangements or reductions from other expense offset arrangements and do not represent the amount paid by the class during periods when reimbursements or reductions occur. Expenses net of fee waivers reflect expenses after reimbursement by the investment adviser but prior to reductions from brokerage service arrangements or other expense offset arrangements. Expenses net of all reductions represent the net expenses paid by the class.
G Amount represents less than $.01 per share.
See accompanying notes which are an integral part of the financial statements.
Annual Report
Notes to Financial Statements
For the period ended July 31, 2011
1. Organization.
Fidelity Advisor Technology Fund (the Fund) is a non-diversified fund of Fidelity Advisor Series VII (the Trust) and is authorized to issue an unlimited number of shares. The Trust is registered under the Investment Company Act of 1940, as amended (the 1940 Act), as an open-end management investment company organized as a Massachusetts business trust. The Fund offers Class A, Class T, Class C and Institutional Class shares, each of which, along with Class B shares, has equal rights as to assets and voting privileges. Effective after the close of business on September 1, 2010, Class B shares were closed to new accounts and additional purchases, except for exchanges and reinvestments, by existing shareholders. Each class has exclusive voting rights with respect to matters that affect that class. Class B shares will automatically convert to Class A shares after a holding period of seven years from the initial date of purchase. Investment income, realized and unrealized capital gains and losses, the common expenses of the Fund, and certain fund-level expense reductions, if any, are allocated on a pro-rata basis to each class based on the relative net assets of each class to the total net assets of the Fund. Each class differs with respect to transfer agent and distribution and service plan fees incurred. Certain expense reductions may also differ by class. The Fund's investments in emerging markets can be subject to social, economic, regulatory and political uncertainties and can be extremely volatile.
2. Investments in Fidelity Central Funds.
The Fund invests in Fidelity Central Funds, which are open-end investment companies available only to other investment companies and accounts managed by Fidelity Management & Research Company (FMR) and its affiliates. The Fund's Schedule of Investments lists each of the Fidelity Central Funds held as of period end, if any, as an investment of the Fund, but does not include the underlying holdings of each Fidelity Central Fund. As an Investing Fund, the Fund indirectly bears its proportionate share of the expenses of the underlying Fidelity Central Funds.
The Money Market Central Funds seek preservation of capital and current income and are managed by Fidelity Investments Money Management, Inc. (FIMM), an affiliate of FMR.
A complete unaudited list of holdings for each Fidelity Central Fund is available upon request or at the Securities and Exchange Commission (the SEC) web site at www.sec.gov. In addition, the financial statements of the Fidelity Central Funds, which are not covered by the Fund's Report of Independent Registered Public Accounting Firm, are available on the SEC web site or upon request.
3. Significant Accounting Policies.
The financial statements have been prepared in conformity with accounting principles generally accepted in the United States of America (GAAP), which require management to make certain estimates and assumptions at the date of the financial statements. Actual results could differ from those estimates. Subsequent events, if any, through the date that the financial statements were issued have been evaluated in the preparation of the financial statements. The following summarizes the significant accounting policies of the Fund:
Security Valuation. Investments are valued as of 4:00 p.m. Eastern time on the last calendar day of the period. The Fund uses independent pricing services approved by the Board of Trustees to value its investments. When current market prices or quotations are not readily available or reliable, valuations may be determined in good faith in accordance with procedures adopted by the Board of Trustees. Factors used in determining value may include market or security specific events, changes in interest rates and credit quality. The frequency with which these procedures are used cannot be predicted and they may be utilized to a significant extent. The value used for net asset value (NAV) calculation under these procedures may differ from published prices for the same securities.
The Fund categorizes the inputs to valuation techniques used to value its investments into a disclosure hierarchy consisting of three levels as shown below:
Level 1 - quoted prices in active markets for identical investments
Level 2 - other significant observable inputs (including quoted prices for similar investments, interest rates, prepayment speeds, etc.)
Level 3 - unobservable inputs (including the Fund's own assumptions based on the best information available)
Changes in valuation techniques may result in transfers in or out of an assigned level within the disclosure hierarchy. The aggregate value of investments by input level, as of July 31, 2011, as well as a roll forward of Level 3 securities, is included at the end of the Fund's Schedule of Investments. Valuation techniques used to value the Fund's investments by major category are as follows:
Equity securities, including restricted securities, for which market quotations are readily available, are valued at the last reported sale price or official closing price as reported by an independent pricing service on the primary market or exchange on which they are traded and are categorized as Level 1 in the hierarchy. In the event there were no sales during the day or closing prices are not available, securities are valued at the last quoted bid price or may be valued using the last available price and are generally categorized as Level 2 in the hierarchy. For foreign equity securities, when significant market or security specific events arise, comparisons to the valuation of American Depositary Receipts (ADRs), futures contracts, Exchange-traded
Annual Report
Notes to Financial Statements - continued
3. Significant Accounting Policies - continued
Security Valuation - continued
funds (ETFs) and certain indexes as well as quoted prices for similar securities are used and are categorized as Level 2 in the hierarchy in these circumstances. Utilizing these techniques may result in transfers between Level 1 and Level 2. For restricted equity securities and private placements where observable inputs are limited, assumptions about market activity and risk are used and are categorized as Level 3 in the hierarchy.
Debt securities, including restricted securities, are valued based on evaluated prices received from independent pricing services or from dealers who make markets in such securities. For corporate bonds and master notes, pricing services utilize matrix pricing which considers yield or price of bonds of comparable quality, coupon, maturity and type as well as dealer supplied prices and are generally categorized as Level 2 in the hierarchy. When independent prices are unavailable or unreliable, debt securities may be valued utilizing pricing matrices which consider similar factors that would be used by independent pricing services. These are generally categorized as Level 2 in the hierarchy but may be Level 3 depending on the circumstances.
Investments in open-end mutual funds, including the Fidelity Central Funds, are valued at their closing net asset value each business day and are categorized as Level 1 in the hierarchy.
Foreign Currency. The Fund may use foreign currency contracts to facilitate transactions in foreign-denominated securities. Gains and losses from these transactions may arise from changes in the value of the foreign currency or if the counterparties do not perform under the contracts' terms.
Foreign-denominated assets, including investment securities, and liabilities are translated into U.S. dollars at the exchange rate at period end. Purchases and sales of investment securities, income and dividends received and expenses denominated in foreign currencies are translated into U.S. dollars at the exchange rate in effect on the transaction date.
The effects of exchange rate fluctuations on investments are included with the net realized and unrealized gain (loss) on investment securities. Other foreign currency transactions resulting in realized and unrealized gain (loss) are disclosed separately.
Investment Transactions and Income. For financial reporting purposes, the Fund's investment holdings and NAV include trades executed through the end of the last business day of the period. The NAV per share for processing shareholder transactions is calculated as of the close of business of the New York Stock Exchange (NYSE), normally 4:00 p.m. Eastern time and includes trades executed through the end of the prior business day. Gains and losses on securities sold are determined on the basis of identified cost and may include proceeds received from litigation. Dividend income is recorded on the ex-dividend date, except for certain dividends from foreign securities where the ex-dividend date may have passed, which are recorded as soon as the Fund is informed of the ex-dividend date. Non-cash dividends included in dividend income, if any, are recorded at the fair market value of the securities received. Distributions received on securities that represent a return of capital or capital gain are recorded as a reduction of cost of investments and/or as a realized gain. The Fund estimates the components of distributions received that may be considered return of capital distributions or capital gain distributions. Interest income and distributions from the Fidelity Central Funds are accrued as earned. Interest income includes coupon interest and amortization of premium and accretion of discount on debt securities. Investment income is recorded net of foreign taxes withheld where recovery of such taxes is uncertain.
Expenses. Expenses directly attributable to a fund are charged to that fund. Expenses attributable to more than one fund are allocated among the respective funds on the basis of relative net assets or other appropriate methods. Expense estimates are accrued in the period to which they relate and adjustments are made when actual amounts are known.
Income Tax Information and Distributions to Shareholders. Each year, the Fund intends to qualify as a regulated investment company, including distributing substantially all of its taxable income and realized gains under Subchapter M of the Internal Revenue Code and filing its U.S. federal tax return. As a result, no provision for income taxes is required. As of July 31, 2011, the Fund did not have any unrecognized tax benefits in the financial statements. A fund's federal tax return is subject to examination by the Internal Revenue Service (IRS) for a period of three years. Foreign taxes are provided for based on the Fund's understanding of the tax rules and rates that exist in the foreign markets in which it invests.
Distributions are declared and recorded on the ex-dividend date. Income dividends and capital gain distributions are declared separately for each class. Income and capital gain distributions are determined in accordance with income tax regulations, which may differ from GAAP.
Capital accounts within the financial statements are adjusted for permanent book-tax differences. These adjustments have no impact on net assets or the results of operations. Temporary book-tax differences will reverse in a subsequent period.
Book-tax differences are primarily due to foreign currency transactions, deferred trustees compensation, net operating losses, capital loss carryforwards, expiring capital loss carryforwards and losses deferred due to wash sales.
Annual Report
3. Significant Accounting Policies - continued
Income Tax Information and Distributions to Shareholders - continued
The federal tax cost of investment securities and unrealized appreciation (depreciation) as of period end were as follows:
Gross unrealized appreciation | $ 88,068,332 |
Gross unrealized depreciation | (49,640,378) |
Net unrealized appreciation (depreciation) on securities and other investments | $ 38,427,954 |
| |
Tax Cost | $ 787,669,457 |
The tax-based components of distributable earnings as of period end were as follows:
Capital loss carryforward | $ (132,837,596) |
Net unrealized appreciation (depreciation) | $ 38,430,964 |
Under the recently enacted Regulated Investment Company Modernization Act of 2010 (the Act), the Fund will be permitted to carry forward capital losses incurred in taxable years beginning after December 22, 2010 for an unlimited period. However, any losses incurred during those future taxable years will be required to be utilized prior to any losses incurred in pre-enactment taxable years, which generally expire after eight years from when they are incurred. Additionally, post-enactment capital losses that are carried forward will retain their character as either short-term or long-term capital losses rather than being considered all short-term as under previous law. The Fund's first fiscal year end subject to the Act will be July 31, 2012.
Short-Term Trading (Redemption) Fees. Shares held by investors in the Fund less than 30 days are subject to a redemption fee equal to .75% of the net asset value of shares redeemed. All redemption fees, which reduce the proceeds of the shareholder redemption, are retained by the Fund and accounted for as an addition to paid in capital.
New Accounting Pronouncement. In May 2011, the Financial Accounting Standards Board issued Accounting Standard Update No. 2011-04, Fair Value Measurement (Topic 820) - Amendments to Achieve Common Fair Value Measurement and Disclosure Requirements in U.S. GAAP and IFRSs. The update changes the wording used to describe the requirements in GAAP for measuring fair value and for disclosing information about fair value measurements. The update is effective during interim and annual periods beginning after December 15, 2011. Management is currently evaluating the impact of the update's adoption on the Fund's financial statement disclosures.
4. Operating Policies.
Restricted Securities. The Fund may invest in securities that are subject to legal or contractual restrictions on resale. These securities generally may be resold in transactions exempt from registration or to the public if the securities are registered. Disposal of these securities may involve time-consuming negotiations and expense, and prompt sale at an acceptable price may be difficult. Information regarding restricted securities is included at the end of the Fund's Schedule of Investments.
5. Purchases and Sales of Investments.
Purchases and sales of securities, other than short-term securities, aggregated $1,264,195,844 and $1,272,881,806, respectively.
6. Fees and Other Transactions with Affiliates.
Management Fee. FMR and its affiliates provide the Fund with investment management related services for which the Fund pays a monthly management fee. The management fee is the sum of an individual fund fee rate that is based on an annual rate of .30% of the Fund's average net assets and a group fee rate that averaged .26% during the period. The group fee rate is based upon the average net assets of all the mutual funds advised by FMR. The group fee rate decreases as assets under management increase and increases as assets under management decrease. For the period, the total annual management fee rate was .56% of the Fund's average net assets.
Annual Report
Notes to Financial Statements - continued
6. Fees and Other Transactions with Affiliates - continued
Distribution and Service Plan Fees. In accordance with Rule 12b-1 of the 1940 Act, the Fund has adopted separate Distribution and Service Plans for each class of shares. Certain classes pay Fidelity Distributors Corporation (FDC), an affiliate of FMR, separate Distribution and Service Fees, each of which is based on an annual percentage of each class' average net assets. In addition, FDC may pay financial intermediaries for selling shares of the Fund and providing shareholder support services. For the period, the Distribution and Service Fee rates, total fees and amounts retained by FDC were as follows:
| Distribution
Fee | Service
Fee | Total Fees | Retained
by FDC |
Class A | -% | .25% | $ 955,142 | $ 11,370 |
Class T | .25% | .25% | 1,011,486 | 5,192 |
Class B | .75% | .25% | 300,223 | 225,888 |
Class C | .75% | .25% | 880,649 | 140,768 |
| | | $ 3,147,500 | $ 383,218 |
Sales Load. FDC may receive a front-end sales charge of up to 5.75% for selling Class A shares, and 3.50% for selling Class T shares, some of which is paid to financial intermediaries for selling shares of the Fund. Depending on the holding period, FDC may receive contingent deferred sales charges levied on Class A, Class T, Class B, and Class C redemptions. The deferred sales charges range from 5% to 1% for Class B, 1% for Class C, 1.00% for certain purchases of Class A shares and .25% for certain purchases of Class T shares.
For the period, sales charge amounts retained by FDC were as follows:
| Retained
by FDC |
Class A | $ 83,277 |
Class T | 22,985 |
Class B* | 46,432 |
Class C* | 12,381 |
| $ 165,075 |
* When Class B and Class C shares are initially sold, FDC pays commissions from its own resources to financial intermediaries through which the sales are made.
Transfer Agent Fees. Fidelity Investments Institutional Operations Company, Inc. (FIIOC), an affiliate of FMR, is the transfer, dividend disbursing and shareholder servicing agent for each class of the Fund. FIIOC receives account fees and asset-based fees that vary according to the account size and type of account of the shareholders of the respective classes of the Fund. FIIOC pays for typesetting, printing and mailing of shareholder reports, except proxy statements. For the period, transfer agent fees for each class were as follows:
| Amount | % of
Average
Net Assets |
Class A | $ 1,145,307 | .30 |
Class T | 601,218 | .30 |
Class B | 90,243 | .30 |
Class C | 259,744 | .30 |
Institutional Class | 186,112 | .25 |
| $ 2,282,624 | |
Accounting and Security Lending Fees. Fidelity Service Company, Inc. (FSC), an affiliate of FMR, maintains the Fund's accounting records. The accounting fee is based on the level of average net assets for the month. Under a separate contract, FSC administers the security lending program. The security lending fee is based on the number and duration of lending transactions.
Brokerage Commissions. The Fund placed a portion of its portfolio transactions with brokerage firms which are affiliates of the investment adviser. The commissions paid to these affiliated firms were $38,932 for the period.
7. Committed Line of Credit.
The Fund participates with other funds managed by FMR or an affiliate in a $4.0 billion credit facility (the "line of credit") to be utilized for temporary or emergency purposes to fund shareholder redemptions or for other short-term liquidity purposes. The Fund has agreed to pay commitment fees on its pro-rata portion of the line of credit, which amounted to $2,547 and is reflected in Miscellaneous expenses on the Statement of Operations. During the period, there were no borrowings on this line of credit.
Annual Report
8. Security Lending.
The Fund lends portfolio securities through a lending agent from time to time in order to earn additional income. The lending agent may loan securities to certain qualified borrowers, including Fidelity Capital Markets (FCM), a broker-dealer affiliated with the Fund. On the settlement date of the loan, the Fund receives collateral (in the form of U.S. Treasury obligations, letters of credit and/or cash) against the loaned securities and maintains collateral in an amount not less than 100% of the market value of the loaned securities during the period of the loan. The market value of the loaned securities is determined at the close of business of the Fund and any additional required collateral is delivered to the Fund on the next business day. If the borrower defaults on its obligation to return the securities loaned because of insolvency or other reasons, a fund could experience delays and costs in recovering the securities loaned or in gaining access to the collateral. Any cash collateral received is invested in the Fidelity Securities Lending Cash Central Fund. The value of loaned securities and cash collateral at period end are disclosed on the Fund's Statement of Assets and Liabilities. Security lending income represents the income earned on investing cash collateral, less rebates paid to borrowers and lending agent fees associated with the loan, plus any premium payments received for lending certain types of securities. Security lending income is presented in the Statement of Operations as a component of income from Fidelity Central Funds, and includes $1,829 from securities loaned to FCM.
9. Expense Reductions.
Many of the brokers with whom FMR places trades on behalf of the Fund provided services to the Fund in addition to trade execution. These services included payments of certain expenses on behalf of the Fund totaling $164,981 for the period. In addition, through arrangements with the Fund's custodian, credits realized as a result of uninvested cash balances were used to reduce the Fund's expenses. During the period, these credits reduced the Fund's custody expenses by $106.
10. Share Transactions.
Transactions for each class of shares were as follows:
| Shares | Dollars |
Years ended July 31, | 2011 | 2010 | 2011 | 2010 |
Class A | | | | |
Shares sold | 3,825,268 | 4,395,059 | $ 95,895,792 | $ 83,404,216 |
Shares redeemed | (4,656,846) | (4,747,519) | (115,935,925) | (89,682,006) |
Net increase (decrease) | (831,578) | (352,460) | $ (20,040,133) | $ (6,277,790) |
Class T | | | | |
Shares sold | 1,318,401 | 1,549,777 | $ 31,818,569 | $ 28,544,536 |
Shares redeemed | (2,014,796) | (2,457,153) | (47,878,372) | (44,605,674) |
Net increase (decrease) | (696,395) | (907,376) | $ (16,059,803) | $ (16,061,138) |
Class B | | | | |
Shares sold | 98,795 | 364,834 | $ 2,198,114 | $ 6,301,624 |
Shares redeemed | (593,453) | (829,145) | (13,054,972) | (14,327,782) |
Net increase (decrease) | (494,658) | (464,311) | $ (10,856,858) | $ (8,026,158) |
Class C | | | | |
Shares sold | 982,784 | 985,847 | $ 22,502,223 | $ 17,180,918 |
Shares redeemed | (908,933) | (891,510) | (20,073,701) | (15,514,588) |
Net increase (decrease) | 73,851 | 94,337 | $ 2,428,522 | $ 1,666,330 |
Institutional Class | | | | |
Shares sold | 2,740,439 | 1,270,106 | $ 73,729,514 | $ 25,258,423 |
Shares redeemed | (1,692,072) | (802,290) | (44,832,264) | (15,808,337) |
Net increase (decrease) | 1,048,367 | 467,816 | $ 28,897,250 | $ 9,450,086 |
11. Other.
The Fund's organizational documents provide former and current trustees and officers with a limited indemnification against liabilities arising in connection with the performance of their duties to the Fund. In the normal course of business, the Fund may also enter into contracts that provide general indemnifications. The Fund's maximum exposure under these arrangements is unknown as this would be dependent on future claims that may be made against the Fund. The risk of material loss from such claims is considered remote.
Annual Report
Fidelity Advisor Utilities Fund - Institutional Class
Performance: The Bottom Line
Average annual total return reflects the change in the value of an investment, assuming reinvestment of the class' distributions from dividend income and capital gains (the profits earned upon the sale of securities that have grown in value, if any) and assuming a constant rate of performance each year. The $10,000 table and the fund's returns do not reflect the deduction of taxes that a shareholder would pay on fund distributions or the redemption of fund shares. During periods of reimbursement by Fidelity, a fund's total return will be greater than it would be had the reimbursement not occurred. How a fund did yesterday is no guarantee of how it will do tomorrow.
Average Annual Total Returns
Periods ended July 31, 2011 | | Past 1
year | Past 5
years | Past 10
years |
Institutional Class A | | 18.05% | 4.29% | 4.31% |
A Prior to October 1, 2006, Fidelity Advisor Utilities Fund operated under certain different investment policies. The historical performance for the fund may not represent its current investment policies.
$10,000 Over 10 Years
Let's say hypothetically that $10,000 was invested in Fidelity Advisor Utilities Fund - Institutional Class on July 31, 2001. The chart shows how the value of your investment would have changed, and also shows how the S&P 500 Index performed over the same period.
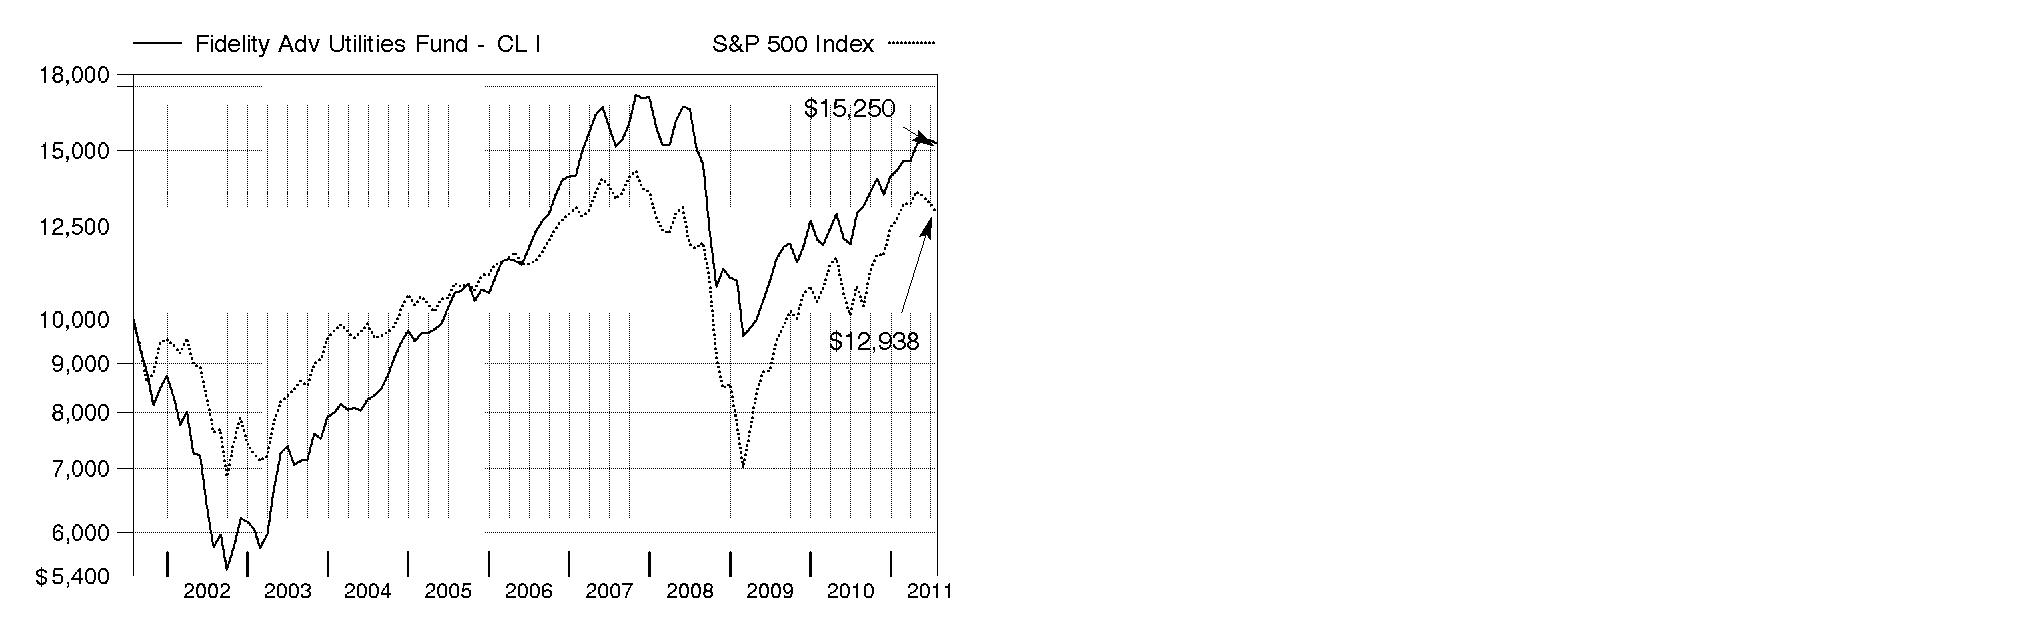
Annual Report
Fidelity Advisor Utilities Fund
Market Recap: U.S. stocks registered solid double-digit gains for the 12 months ending July 31, 2011, extending a rally that began more than two years earlier. Despite a rough start in August 2010, markets turned positive in September, as increased demand for capital goods and other upbeat indicators trumped investor worry about a U.S. recessionary relapse. The broad market, as measured by the S&P 500® Index, rose 9% that month, its biggest September gain in 71 years. Seven more monthly advances followed, fueled by encouraging corporate earnings and economic activity. However, volatility picked up in the period's latter months, as markets reacted to continued high U.S. unemployment, nagging debt troubles in Europe and looming legislative battles over the federal debt ceiling. May unemployment rose above 9% for the first time in 2011, contributing to a traditional "June swoon" for stocks. Market uncertainty lingered in July, when the S&P 500® posted its second-biggest monthly loss of the period. For the full year, the S&P 500® climbed 19.65%, while the blue-chip-laden Dow Jones Industrial AverageSM rose a comparable 19.09% and the technology-heavy Nasdaq Composite® Index gained 23.40%. On the capitalization spectrum, stocks of mid-cap companies fared best, with the Russell Midcap® Index rising 24.51% and the small-cap Russell 2000® Index adding 23.92%.
Comments from Douglas Simmons, Portfolio Manager of Fidelity Advisor® Utilities Fund: For the year ending July 31, 2011, the fund's Class A, Class T, Class B and Class C shares returned 17.71%, 17.39%, 16.87% and 16.85%, respectively (excluding sales charges), outperforming the 15.37% gain of the MSCI® U.S. IM Utilities 25/50 Index, but underperforming the S&P 500. Stock selection in gas utilities helped the most, along with solid positioning in independent power/energy trade and multi-utilities. I significantly changed the make-up of the fund, decreasing its allocation to regulated utilities and moving assets into deregulated power producers. This led to a reduction in the fund's stake in multi-utilities and an increase in the independent power/energy trade group. Top individual contributors included gas utilities ONEOK and National Fuel Gas, Maryland-based independent power producer Constellation Energy Group, Chicago-based electric utility Exelon and an underweighting in New Orleans-based electric utility Entergy, which we no longer own. On the down side, poor stock selection in electric utilities hurt, with the largest five detractors coming from this group, including untimely ownership of PPL in Pennsylvania - no longer held - and FirstEnergy in Ohio; an out-of-benchmark position in Tokyo Electric Power, since sold; and a sizable overweighting in Florida's NextEra Energy, which posted a positive return but lagged the index.
Comments from Douglas Simmons, Portfolio Manager of Fidelity Advisor® Utilities Fund: For the year ending July 31, 2011, the fund's Institutional Class shares returned 18.05%, outperforming the 15.37% gain of the MSCI® U.S. IM Utilities 25/50 Index, but underperforming the S&P 500. Stock selection in gas utilities helped the most, along with solid positioning in independent power/energy trade and multi-utilities. I significantly changed the make-up of the fund, decreasing its allocation to regulated utilities and moving assets into deregulated power producers. This led to a reduction in the fund's stake in multi-utilities and an increase in the independent power/energy trade group. Top individual contributors included gas utilities ONEOK and National Fuel Gas, Maryland-based independent power producer Constellation Energy Group, Chicago-based electric utility Exelon and an underweighting in New Orleans-based electric utility Entergy, which we no longer own. On the down side, poor stock selection in electric utilities hurt, with the largest five detractors coming from this group, including untimely ownership of PPL in Pennsylvania - no longer held - and FirstEnergy in Ohio; an out-of-benchmark position in Tokyo Electric Power, since sold; and a sizable overweighting in Florida's NextEra Energy, which posted a positive return but lagged the index.
The views expressed above reflect those of the portfolio manager(s) only through the end of the period as stated on the cover of this report and do not necessarily represent the views of Fidelity or any other person in the Fidelity organization. Any such views are subject to change at any time based upon market or other conditions and Fidelity disclaims any responsibility to update such views. These views may not be relied on as investment advice and, because investment decisions for a Fidelity fund are based on numerous factors, may not be relied on as an indication of trading intent on behalf of any Fidelity fund.
Annual Report
Fidelity Advisor Utilities Fund
As a shareholder of the Fund, you incur two types of costs: (1) transaction costs, including sales charges (loads) on purchase payments or redemption proceeds, redemption fees, and (2) ongoing costs, including management fees, distribution and/or service (12b-1) fees and other Fund expenses. This Example is intended to help you understand your ongoing costs (in dollars) of investing in the Fund and to compare these costs with the ongoing costs of investing in other mutual funds.
The Example is based on an investment of $1,000 invested at the beginning of the period and held for the entire period (February 1, 2011 to July 31, 2011).
Actual Expenses
The first line of the accompanying table for each class of the Fund provides information about actual account values and actual expenses. You may use the information in this line, together with the amount you invested, to estimate the expenses that you paid over the period. Simply divide your account value by $1,000.00 (for example, an $8,600 account value divided by $1,000.00 = 8.6), then multiply the result by the number in the first line for a class of the Fund under the heading entitled "Expenses Paid During Period" to estimate the expenses you paid on your account during this period. In addition, the Fund, as a shareholder in the underlying Fidelity Central Funds, will indirectly bear its pro-rata share of the fees and expenses incurred by the underlying Fidelity Central Funds. These fees and expenses are not included in the Fund's annualized expense ratio used to calculate the expense estimate in the table below.
Hypothetical Example for Comparison Purposes
The second line of the accompanying table for each class of the Fund provides information about hypothetical account values and hypothetical expenses based on a Class' actual expense ratio and an assumed rate of return of 5% per year before expenses, which is not the Class' actual return. The hypothetical account values and expenses may not be used to estimate the actual ending account balance or expenses you paid for the period. You may use this information to compare the ongoing costs of investing in the Fund and other funds. To do so, compare this 5% hypothetical example with the 5% hypothetical examples that appear in the shareholder reports of the other funds. In addition, the Fund, as a shareholder in the underlying Fidelity Central Funds, will indirectly bear its pro-rata share of the fees and expenses incurred by the underlying Fidelity Central Funds. These fees and expenses are not included in the Fund's annualized expense ratio used to calculate the expense estimate in the table below.
Please note that the expenses shown in the table are meant to highlight your ongoing costs only and do not reflect any transaction costs. Therefore, the second line of the table is useful in comparing ongoing costs only, and will not help you determine the relative total costs of owning different funds. In addition, if these transactional costs were included, your costs would have been higher.
| Annualized
Expense Ratio | Beginning
Account Value
February 1, 2011 | Ending
Account Value
July 31, 2011 | Expenses Paid
During Period*
February 1, 2011 to
July 31, 2011 |
Class A | 1.21% | | | |
Actual | | $ 1,000.00 | $ 1,065.30 | $ 6.20 |
HypotheticalA | | $ 1,000.00 | $ 1,018.79 | $ 6.06 |
Class T | 1.47% | | | |
Actual | | $ 1,000.00 | $ 1,064.10 | $ 7.52 |
HypotheticalA | | $ 1,000.00 | $ 1,017.50 | $ 7.35 |
Class B | 1.96% | | | |
Actual | | $ 1,000.00 | $ 1,061.90 | $ 10.02 |
HypotheticalA | | $ 1,000.00 | $ 1,015.08 | $ 9.79 |
Class C | 1.95% | | | |
Actual | | $ 1,000.00 | $ 1,061.70 | $ 9.97 |
HypotheticalA | | $ 1,000.00 | $ 1,015.12 | $ 9.74 |
Institutional Class | .95% | | | |
Actual | | $ 1,000.00 | $ 1,066.50 | $ 4.87 |
HypotheticalA | | $ 1,000.00 | $ 1,020.08 | $ 4.76 |
A 5% return per year before expenses
* Expenses are equal to each Class' annualized expense ratio, multiplied by the average account value over the period, multiplied by 181/365 (to reflect the one-half year period).
Annual Report
Fidelity Advisor Utilities Fund
Investment Changes (Unaudited)
Top Ten Stocks as of July 31, 2011 |
| % of fund's
net assets | % of fund's net assets
6 months ago |
Exelon Corp. | 11.6 | 0.0 |
NextEra Energy, Inc. | 10.0 | 12.0 |
Public Service Enterprise Group, Inc. | 8.2 | 4.4 |
Edison International | 7.1 | 6.2 |
FirstEnergy Corp. | 7.1 | 2.4 |
The AES Corp. | 5.7 | 2.7 |
Constellation Energy Group, Inc. | 4.9 | 3.3 |
American Electric Power Co., Inc. | 4.9 | 0.0 |
Calpine Corp. | 4.8 | 1.5 |
PG&E Corp. | 4.8 | 4.7 |
| 69.1 | |
Top Industries (% of fund's net assets) |
As of July 31, 2011 |
| Electric Utilities | 47.6% | |
| Multi-Utilities | 22.1% | |
| Independent Power Producers & Energy Traders | 21.2% | |
| Gas Utilities | 5.8% | |
| Oil, Gas &
Consumable Fuels | 2.1% | |
| All Others* | 1.2% | |

As of January 31, 2011 |
| Electric Utilities | 46.3% | |
| Multi-Utilities | 29.3% | |
| Gas Utilities | 11.0% | |
| Independent Power Producers & Energy Traders | 8.5% | |
| Oil, Gas &
Consumable Fuels | 3.2% | |
| All Others* | 1.7% | |

* Includes short-term investments and net other assets. |
Annual Report
Fidelity Advisor Utilities Fund
Investments July 31, 2011
Showing Percentage of Net Assets
Common Stocks - 98.8% |
| Shares | | Value |
ELECTRIC UTILITIES - 47.6% |
Electric Utilities - 47.6% |
American Electric Power Co., Inc. | 210,014 | | $ 7,741,116 |
Edison International | 297,796 | | 11,337,094 |
Exelon Corp. | 418,811 | | 18,457,001 |
FirstEnergy Corp. | 253,700 | | 11,327,705 |
ITC Holdings Corp. | 100,610 | | 7,068,859 |
NextEra Energy, Inc. | 288,720 | | 15,951,780 |
NV Energy, Inc. | 272,657 | | 4,046,230 |
| | 75,929,785 |
GAS UTILITIES - 5.8% |
Gas Utilities - 5.8% |
National Fuel Gas Co. | 46,512 | | 3,366,539 |
ONEOK, Inc. | 81,121 | | 5,904,798 |
| | 9,271,337 |
INDEPENDENT POWER PRODUCERS & ENERGY TRADERS - 21.2% |
Independent Power Producers & Energy Traders - 21.2% |
Calpine Corp. (a) | 473,521 | | 7,694,716 |
Constellation Energy Group, Inc. | 201,682 | | 7,831,312 |
GenOn Energy, Inc. (a) | 1,131,271 | | 4,400,644 |
NRG Energy, Inc. (a) | 197,762 | | 4,849,124 |
The AES Corp. (a) | 734,600 | | 9,042,926 |
| | 33,818,722 |
MULTI-UTILITIES - 22.1% |
Multi-Utilities - 22.1% |
CenterPoint Energy, Inc. | 166,574 | | 3,261,519 |
OGE Energy Corp. | 91,756 | | 4,591,470 |
|
| Shares | | Value |
PG&E Corp. | 183,732 | | $ 7,612,017 |
Public Service Enterprise Group, Inc. | 400,131 | | 13,104,290 |
Sempra Energy | 132,831 | | 6,733,203 |
| | 35,302,499 |
OIL, GAS & CONSUMABLE FUELS - 2.1% |
Oil & Gas Storage & Transport - 2.1% |
Williams Companies, Inc. | 109,082 | | 3,457,899 |
TOTAL COMMON STOCKS (Cost $148,103,799) | 157,780,242 |
Money Market Funds - 0.8% |
| | | |
Fidelity Cash Central Fund, 0.14% (b)
(Cost $1,268,029) | 1,268,029 | | 1,268,029 |
TOTAL INVESTMENT PORTFOLIO - 99.6% (Cost $149,371,828) | | 159,048,271 |
NET OTHER ASSETS (LIABILITIES) - 0.4% | | 567,432 |
NET ASSETS - 100% | $ 159,615,703 |
Legend |
(a) Non-income producing |
(b) Affiliated fund that is available only to investment companies and other accounts managed by Fidelity Investments. The rate quoted is the annualized seven-day yield of the fund at period end. A complete unaudited listing of the fund's holdings as of its most recent quarter end is available upon request. In addition, each Fidelity Central Fund's financial statements, which are not covered by the Fund's Report of Independent Registered Public Accounting Firm, are available on the SEC's website or upon request. |
Affiliated Central Funds |
Information regarding fiscal year to date income earned by the Fund from investments in Fidelity Central Funds is as follows: |
Fund | Income earned |
Fidelity Cash Central Fund | $ 2,378 |
Fidelity Securities Lending Cash Central Fund | 7,142 |
Total | $ 9,520 |
Other Information |
All investments are categorized as Level 1 under the Fair Value Hierarchy. The inputs or methodology used for valuing securities may not be an indication of the risk associated with investing in those securities. For more information on valuation inputs, please refer to the Security Valuation section in the accompanying Notes to Financial Statements. |
Income Tax Information |
At July 31, 2011, the Fund had a capital loss carryforward of approximately $41,949,952 of which $13,867,918 and $28,082,034 will expire in fiscal 2017 and 2018, respectively. Capital loss carryforwards are only available to offset future capital gains of the Fund to the extent provided by regulations and may be limited. |
See accompanying notes which are an integral part of the financial statements.
Annual Report
Fidelity Advisor Utilities Fund
Statement of Assets and Liabilities
| July 31, 2011 |
| | |
Assets | | |
Investment in securities, at value - See accompanying schedule: Unaffiliated issuers (cost $148,103,799) | $ 157,780,242 | |
Fidelity Central Funds (cost $1,268,029) | 1,268,029 | |
Total Investments (cost $149,371,828) | | $ 159,048,271 |
Cash | | 10,686 |
Receivable for investments sold | | 860,652 |
Receivable for fund shares sold | | 244,461 |
Dividends receivable | | 140,306 |
Distributions receivable from Fidelity Central Funds | | 120 |
Other receivables | | 21,969 |
Total assets | | 160,326,465 |
| | |
Liabilities | | |
Payable for investments purchased | $ 225,198 | |
Payable for fund shares redeemed | 272,589 | |
Accrued management fee | 74,636 | |
Transfer agent fee payable | 38,529 | |
Distribution and service plan fees payable | 60,841 | |
Other affiliated payables | 5,219 | |
Other payables and accrued expenses | 33,750 | |
Total liabilities | | 710,762 |
| | |
Net Assets | | $ 159,615,703 |
Net Assets consist of: | | |
Paid in capital | | $ 192,506,368 |
Undistributed net investment income | | 1,305,339 |
Accumulated undistributed net realized gain (loss) on investments and foreign currency transactions | | (43,872,447) |
Net unrealized appreciation (depreciation) on investments | | 9,676,443 |
Net Assets | | $ 159,615,703 |
Statement of Assets and Liabilities - continued
| July 31, 2011 |
| | |
Calculation of Maximum Offering Price Class A:
Net Asset Value and redemption price per share ($78,312,171 ÷ 4,102,036 shares) | | $ 19.09 |
| | |
Maximum offering price per share (100/94.25 of $19.09) | | $ 20.25 |
Class T:
Net Asset Value and redemption price per share ($35,700,818 ÷ 1,869,718 shares) | | $ 19.09 |
| | |
Maximum offering price per share (100/96.50 of $19.09) | | $ 19.78 |
Class B:
Net Asset Value and offering price per share ($7,773,240 ÷ 412,234 shares)A | | $ 18.86 |
| | |
Class C:
Net Asset Value and offering price per share ($26,915,407 ÷ 1,435,547 shares)A | | $ 18.75 |
| | |
Institutional Class:
Net Asset Value, offering price and redemption price per share ($10,914,067 ÷ 562,473 shares) | | $ 19.40 |
A Redemption price per share is equal to net asset value less any applicable contingent deferred sales charge.
See accompanying notes which are an integral part of the financial statements.
Annual Report
Fidelity Advisor Utilities Fund
Financial Statements - continued
Statement of Operations
| Year ended July 31, 2011 |
| | |
Investment Income | | |
Dividends | | $ 4,971,306 |
Interest | | 1 |
Income from Fidelity Central Funds | | 9,520 |
Total income | | 4,980,827 |
| | |
Expenses | | |
Management fee | $ 822,413 | |
Transfer agent fees | 447,886 | |
Distribution and service plan fees | 681,232 | |
Accounting and security lending fees | 57,753 | |
Custodian fees and expenses | 15,402 | |
Independent trustees' compensation | 808 | |
Registration fees | 60,541 | |
Audit | 47,893 | |
Legal | 2,571 | |
Miscellaneous | 1,519 | |
Total expenses before reductions | 2,138,018 | |
Expense reductions | (56,520) | 2,081,498 |
Net investment income (loss) | | 2,899,329 |
Realized and Unrealized Gain (Loss) Net realized gain (loss) on: | | |
Investment securities: | | |
Unaffiliated issuers | 15,549,835 | |
Foreign currency transactions | (15,716) | |
Total net realized gain (loss) | | 15,534,119 |
Change in net unrealized appreciation (depreciation) on: Investment securities | 4,882,261 | |
Assets and liabilities in foreign currencies | 3,458 | |
Total change in net unrealized appreciation (depreciation) | | 4,885,719 |
Net gain (loss) | | 20,419,838 |
Net increase (decrease) in net assets resulting from operations | | $ 23,319,167 |
Statement of Changes in Net Assets
| Year ended
July 31,
2011 | Year ended
July 31,
2010 |
Increase (Decrease) in Net Assets | | |
Operations | | |
Net investment income (loss) | $ 2,899,329 | $ 3,071,475 |
Net realized gain (loss) | 15,534,119 | 6,308,221 |
Change in net unrealized appreciation (depreciation) | 4,885,719 | 4,895,678 |
Net increase (decrease) in net assets resulting from operations | 23,319,167 | 14,275,374 |
Distributions to shareholders from net investment income | (2,864,390) | (3,192,017) |
Share transactions - net increase (decrease) | 3,898,632 | (13,238,224) |
Redemption fees | 2,026 | 1,956 |
Total increase (decrease) in net assets | 24,355,435 | (2,152,911) |
| | |
Net Assets | | |
Beginning of period | 135,260,268 | 137,413,179 |
End of period (including undistributed net investment income of $1,305,339 and undistributed net investment income of $1,286,115, respectively) | $ 159,615,703 | $ 135,260,268 |
See accompanying notes which are an integral part of the financial statements.
Annual Report
Financial Highlights - Class A
Years ended July 31, | 2011 | 2010 | 2009 | 2008 | 2007 |
Selected Per-Share Data | | | | | |
Net asset value, beginning of period | $ 16.59 | $ 15.27 | $ 20.28 | $ 20.74 | $ 17.20 |
Income from Investment Operations | | | | | |
Net investment income (loss) C | .39 | .40 | .35 | .24 | .21 |
Net realized and unrealized gain (loss) | 2.50 | 1.32 | (5.10) | (.38) | 3.56 |
Total from investment operations | 2.89 | 1.72 | (4.75) | (.14) | 3.77 |
Distributions from net investment income | (.39) | (.40) | (.26) | (.32) | (.23) |
Redemption fees added to paid in capital C, G | - | - | - | - | - |
Net asset value, end of period | $ 19.09 | $ 16.59 | $ 15.27 | $ 20.28 | $ 20.74 |
Total Return A, B | 17.71% | 11.42% | (23.44)% | (.82)% | 22.14% |
Ratios to Average Net Assets D, F | | | | | |
Expenses before reductions | 1.24% | 1.26% | 1.26% | 1.21% | 1.27% |
Expenses net of fee waivers, if any | 1.24% | 1.26% | 1.26% | 1.21% | 1.27% |
Expenses net of all reductions | 1.20% | 1.22% | 1.26% | 1.21% | 1.26% |
Net investment income (loss) | 2.18% | 2.49% | 2.37% | 1.11% | 1.04% |
Supplemental Data | | | | | |
Net assets, end of period (000 omitted) | $ 78,312 | $ 64,890 | $ 66,064 | $ 105,219 | $ 94,842 |
Portfolio turnover rate E | 201% | 216% | 247% | 77% | 118% |
A Total returns would have been lower if certain expenses had not been reduced during the applicable periods shown.
B Total returns do not include the effect of the sales charges.
C Calculated based on average shares outstanding during the period.
D Fees and expenses of any underlying Fidelity Central Funds are not included in the Fund's expense ratio. The Fund indirectly bears its proportionate share of the expenses of any underlying Fidelity Central Funds.
E Amount does not include the portfolio activity of any underlying Fidelity Central Funds.
F Expense ratios reflect operating expenses of the class. Expenses before reductions do not reflect amounts reimbursed by the investment adviser or reductions from brokerage service arrangements or reductions from other expense offset arrangements and do not represent the amount paid by the class during periods when reimbursements or reductions occur. Expenses net of fee waivers reflect expenses after reimbursement by the investment adviser but prior to reductions from brokerage service arrangements or other expense offset arrangements. Expenses net of all reductions represent the net expenses paid by the class.
G Amount represents less than $.01 per share.
Financial Highlights - Class T
Years ended July 31, | 2011 | 2010 | 2009 | 2008 | 2007 |
Selected Per-Share Data | | | | | |
Net asset value, beginning of period | $ 16.59 | $ 15.27 | $ 20.26 | $ 20.71 | $ 17.18 |
Income from Investment Operations | | | | | |
Net investment income (loss) C | .35 | .35 | .31 | .18 | .15 |
Net realized and unrealized gain (loss) | 2.50 | 1.33 | (5.10) | (.39) | 3.56 |
Total from investment operations | 2.85 | 1.68 | (4.79) | (.21) | 3.71 |
Distributions from net investment income | (.35) | (.36) | (.20) | (.24) | (.18) |
Redemption fees added to paid in capital C, G | - | - | - | - | - |
Net asset value, end of period | $ 19.09 | $ 16.59 | $ 15.27 | $ 20.26 | $ 20.71 |
Total Return A, B | 17.39% | 11.13% | (23.61)% | (1.11)% | 21.74% |
Ratios to Average Net Assets D, F | | | | | |
Expenses before reductions | 1.50% | 1.52% | 1.52% | 1.47% | 1.54% |
Expenses net of fee waivers, if any | 1.50% | 1.52% | 1.52% | 1.47% | 1.54% |
Expenses net of all reductions | 1.46% | 1.49% | 1.52% | 1.47% | 1.54% |
Net investment income (loss) | 1.92% | 2.23% | 2.11% | .84% | .76% |
Supplemental Data | | | | | |
Net assets, end of period (000 omitted) | $ 35,701 | $ 33,651 | $ 33,989 | $ 54,346 | $ 62,592 |
Portfolio turnover rate E | 201% | 216% | 247% | 77% | 118% |
A Total returns would have been lower if certain expenses had not been reduced during the applicable periods shown.
B Total returns do not include the effect of the sales charges.
C Calculated based on average shares outstanding during the period.
D Fees and expenses of any underlying Fidelity Central Funds are not included in the Fund's expense ratio. The Fund indirectly bears its proportionate share of the expenses of any underlying Fidelity Central Funds.
E Amount does not include the portfolio activity of any underlying Fidelity Central Funds.
F Expense ratios reflect operating expenses of the class. Expenses before reductions do not reflect amounts reimbursed by the investment adviser or reductions from brokerage service arrangements or reductions from other expense offset arrangements and do not represent the amount paid by the class during periods when reimbursements or reductions occur. Expenses net of fee waivers reflect expenses after reimbursement by the investment adviser but prior to reductions from brokerage service arrangements or other expense offset arrangements. Expenses net of all reductions represent the net expenses paid by the class.
G Amount represents less than $.01 per share.
See accompanying notes which are an integral part of the financial statements.
Annual Report
Financial Highlights - Class B
Years ended July 31, | 2011 | 2010 | 2009 | 2008 | 2007 |
Selected Per-Share Data | | | | | |
Net asset value, beginning of period | $ 16.38 | $ 15.08 | $ 20.01 | $ 20.40 | $ 16.90 |
Income from Investment Operations | | | | | |
Net investment income (loss) C | .25 | .27 | .24 | .08 | .05 |
Net realized and unrealized gain (loss) | 2.49 | 1.31 | (5.04) | (.39) | 3.52 |
Total from investment operations | 2.74 | 1.58 | (4.80) | (.31) | 3.57 |
Distributions from net investment income | (.26) | (.28) | (.13) | (.08) | (.07) |
Redemption fees added to paid in capital C, G | - | - | - | - | - |
Net asset value, end of period | $ 18.86 | $ 16.38 | $ 15.08 | $ 20.01 | $ 20.40 |
Total Return A, B | 16.87% | 10.56% | (23.97)% | (1.59)% | 21.18% |
Ratios to Average Net Assets D, F | | | | | |
Expenses before reductions | 1.99% | 2.01% | 2.01% | 1.96% | 2.04% |
Expenses net of fee waivers, if any | 1.99% | 2.01% | 2.01% | 1.96% | 2.04% |
Expenses net of all reductions | 1.95% | 1.98% | 2.01% | 1.95% | 2.03% |
Net investment income (loss) | 1.43% | 1.74% | 1.62% | .36% | .27% |
Supplemental Data | | | | | |
Net assets, end of period (000 omitted) | $ 7,773 | $ 8,794 | $ 10,634 | $ 20,747 | $ 43,845 |
Portfolio turnover rate E | 201% | 216% | 247% | 77% | 118% |
A Total returns would have been lower if certain expenses had not been reduced during the applicable periods shown.
B Total returns do not include the effect of the contingent deferred sales charge.
C Calculated based on average shares outstanding during the period.
D Fees and expenses of any underlying Fidelity Central Funds are not included in the Fund's expense ratio. The Fund indirectly bears its proportionate share of the expenses of any underlying Fidelity Central Funds.
E Amount does not include the portfolio activity of any underlying Fidelity Central Funds.
F Expense ratios reflect operating expenses of the class. Expenses before reductions do not reflect amounts reimbursed by the investment adviser or reductions from brokerage service arrangements or reductions from other expense offset arrangements and do not represent the amount paid by the class during periods when reimbursements or reductions occur. Expenses net of fee waivers reflect expenses after reimbursement by the investment adviser but prior to reductions from brokerage service arrangements or other expense offset arrangements. Expenses net of all reductions represent the net expenses paid by the class.
G Amount represents less than $.01 per share.
Financial Highlights - Class C
Years ended July 31, | 2011 | 2010 | 2009 | 2008 | 2007 |
Selected Per-Share Data | | | | | |
Net asset value, beginning of period | $ 16.30 | $ 15.02 | $ 19.93 | $ 20.38 | $ 16.91 |
Income from Investment Operations | | | | | |
Net investment income (loss) C | .26 | .27 | .24 | .08 | .06 |
Net realized and unrealized gain (loss) | 2.46 | 1.30 | (5.02) | (.39) | 3.51 |
Total from investment operations | 2.72 | 1.57 | (4.78) | (.31) | 3.57 |
Distributions from net investment income | (.27) | (.29) | (.13) | (.14) | (.10) |
Redemption fees added to paid in capital C, G | - | - | - | - | - |
Net asset value, end of period | $ 18.75 | $ 16.30 | $ 15.02 | $ 19.93 | $ 20.38 |
Total Return A, B | 16.85% | 10.54% | (23.96)% | (1.58)% | 21.23% |
Ratios to Average Net Assets D, F | | | | | |
Expenses before reductions | 1.98% | 2.01% | 2.01% | 1.95% | 1.99% |
Expenses net of fee waivers, if any | 1.98% | 2.01% | 2.01% | 1.95% | 1.99% |
Expenses net of all reductions | 1.94% | 1.97% | 2.01% | 1.95% | 1.99% |
Net investment income (loss) | 1.43% | 1.74% | 1.62% | .36% | .32% |
Supplemental Data | | | | | |
Net assets, end of period (000 omitted) | $ 26,915 | $ 21,415 | $ 22,352 | $ 37,387 | $ 43,292 |
Portfolio turnover rate E | 201% | 216% | 247% | 77% | 118% |
A Total returns would have been lower if certain expenses had not been reduced during the applicable periods shown.
B Total returns do not include the effect of the contingent deferred sales charge.
C Calculated based on average shares outstanding during the period.
D Fees and expenses of any underlying Fidelity Central Funds are not included in the Fund's expense ratio. The Fund indirectly bears its proportionate share of the expenses of any underlying Fidelity Central Funds.
E Amount does not include the portfolio activity of any underlying Fidelity Central Funds.
F Expense ratios reflect operating expenses of the class. Expenses before reductions do not reflect amounts reimbursed by the investment adviser or reductions from brokerage service arrangements or reductions from other expense offset arrangements and do not represent the amount paid by the class during periods when reimbursements or reductions occur. Expenses net of fee waivers reflect expenses after reimbursement by the investment adviser but prior to reductions from brokerage service arrangements or other expense offset arrangements. Expenses net of all reductions represent the net expenses paid by the class.
G Amount represents less than $.01 per share.
See accompanying notes which are an integral part of the financial statements.
Annual Report
Financial Highlights - Institutional Class
Years ended July 31, | 2011 | 2010 | 2009 | 2008 | 2007 |
Selected Per-Share Data | | | | | |
Net asset value, beginning of period | $ 16.85 | $ 15.51 | $ 20.52 | $ 20.95 | $ 17.38 |
Income from Investment Operations | | | | | |
Net investment income (loss) B | .45 | .44 | .39 | .31 | .29 |
Net realized and unrealized gain (loss) | 2.54 | 1.35 | (5.17) | (.38) | 3.58 |
Total from investment operations | 2.99 | 1.79 | (4.78) | (.07) | 3.87 |
Distributions from net investment income | (.44) | (.45) | (.23) | (.36) | (.30) |
Redemption fees added to paid in capital B, F | - | - | - | - | - |
Net asset value, end of period | $ 19.40 | $ 16.85 | $ 15.51 | $ 20.52 | $ 20.95 |
Total Return A | 18.05% | 11.66% | (23.24)% | (.49)% | 22.54% |
Ratios to Average Net Assets C, E | | | | | |
Expenses before reductions | .98% | 1.00% | 1.00% | .91% | .92% |
Expenses net of fee waivers, if any | .98% | 1.00% | 1.00% | .91% | .92% |
Expenses net of all reductions | .94% | .97% | 1.00% | .90% | .92% |
Net investment income (loss) | 2.44% | 2.75% | 2.63% | 1.41% | 1.39% |
Supplemental Data | | | | | |
Net assets, end of period (000 omitted) | $ 10,914 | $ 6,511 | $ 4,373 | $ 5,704 | $ 12,822 |
Portfolio turnover rate D | 201% | 216% | 247% | 77% | 118% |
A Total returns would have been lower if certain expenses had not been reduced during the applicable periods shown.
B Calculated based on average shares outstanding during the period.
C Fees and expenses of any underlying Fidelity Central Funds are not included in the Fund's expense ratio. The Fund indirectly bears its proportionate share of the expenses of any underlying Fidelity Central Funds.
D Amount does not include the portfolio activity of any underlying Fidelity Central Funds.
E Expense ratios reflect operating expenses of the class. Expenses before reductions do not reflect amounts reimbursed by the investment adviser or reductions from brokerage service arrangements or reductions from other expense offset arrangements and do not represent the amount paid by the class during periods when reimbursements or reductions occur. Expenses net of fee waivers reflect expenses after reimbursement by the investment adviser but prior to reductions from brokerage service arrangements or other expense offset arrangements. Expenses net of all reductions represent the net expenses paid by the class.
F Amount represents less than $.01 per share.
See accompanying notes which are an integral part of the financial statements.
Annual Report
Notes to Financial Statements
For the period ended July 31, 2011
1. Organization.
Fidelity Advisor Utilities Fund (the Fund) is a non-diversified fund of Fidelity Advisor Series VII (the Trust) and is authorized to issue an unlimited number of shares. The Trust is registered under the Investment Company Act of 1940, as amended (the 1940 Act), as an open-end management investment company organized as a Massachusetts business trust. The Fund offers Class A, Class T, Class C and Institutional Class shares, each of which, along with Class B shares, has equal rights as to assets and voting privileges. Effective after the close of business on September 1, 2010, Class B shares were closed to new accounts and additional purchases, except for exchanges and reinvestments, by existing shareholders. Each class has exclusive voting rights with respect to matters that affect that class. Class B shares will automatically convert to Class A shares after a holding period of seven years from the initial date of purchase. Investment income, realized and unrealized capital gains and losses, the common expenses of the Fund, and certain fund-level expense reductions, if any, are allocated on a pro-rata basis to each class based on the relative net assets of each class to the total net assets of the Fund. Each class differs with respect to transfer agent and distribution and service plan fees incurred. Certain expense reductions may also differ by class.
2. Investments in Fidelity Central Funds.
The Fund invests in Fidelity Central Funds, which are open-end investment companies available only to other investment companies and accounts managed by Fidelity Management & Research Company (FMR) and its affiliates. The Fund's Schedule of Investments lists each of the Fidelity Central Funds held as of period end, if any, as an investment of the Fund, but does not include the underlying holdings of each Fidelity Central Fund. As an Investing Fund, the Fund indirectly bears its proportionate share of the expenses of the underlying Fidelity Central Funds.
The Money Market Central Funds seek preservation of capital and current income and are managed by Fidelity Investments Money Management, Inc. (FIMM), an affiliate of FMR.
A complete unaudited list of holdings for each Fidelity Central Fund is available upon request or at the Securities and Exchange Commission (the SEC) web site at www.sec.gov. In addition, the financial statements of the Fidelity Central Funds, which are not covered by the Fund's Report of Independent Registered Public Accounting Firm, are available on the SEC web site or upon request.
3. Significant Accounting Policies.
The financial statements have been prepared in conformity with accounting principles generally accepted in the United States of America (GAAP), which require management to make certain estimates and assumptions at the date of the financial statements. Actual results could differ from those estimates. Subsequent events, if any, through the date that the financial statements were issued have been evaluated in the preparation of the financial statements. The following summarizes the significant accounting policies of the Fund:
Security Valuation. Investments are valued as of 4:00 p.m. Eastern time on the last calendar day of the period. The Fund uses independent pricing services approved by the Board of Trustees to value its investments. When current market prices or quotations are not readily available or reliable, valuations may be determined in good faith in accordance with procedures adopted by the Board of Trustees. Factors used in determining value may include market or security specific events. The frequency with which these procedures are used cannot be predicted and they may be utilized to a significant extent. The value used for net asset value (NAV) calculation under these procedures may differ from published prices for the same securities.
The Fund categorizes the inputs to valuation techniques used to value its investments into a disclosure hierarchy consisting of three levels as shown below:
Level 1 - quoted prices in active markets for identical investments
Level 2 - other significant observable inputs (including quoted prices for similar investments, interest rates, prepayment speeds, etc.)
Level 3 - unobservable inputs (including the Fund's own assumptions based on the best information available)
Changes in valuation techniques may result in transfers in or out of an assigned level within the disclosure hierarchy. Valuation techniques used to value the Fund's investments by major category are as follows:
Equity securities, including restricted securities, for which market quotations are readily available, are valued at the last reported sale price or official closing price as reported by an independent pricing service on the primary market or exchange on which they are traded and are categorized as Level 1 in the hierarchy. In the event there were no sales during the day or closing prices are not available, securities are valued at the last quoted bid price or may be valued using the last available price and are generally categorized as Level 2 in the hierarchy. For foreign equity securities, when significant market or security specific events arise, comparisons to the valuation of American Depositary Receipts (ADRs), futures contracts, Exchange-traded funds (ETFs) and certain indexes as well as quoted prices for similar securities are used and are categorized as Level 2 in the hierarchy in these
Annual Report
3. Significant Accounting Policies - continued
Security Valuation - continued
circumstances. Utilizing these techniques may result in transfers between Level 1 and Level 2. For restricted equity securities and private placements where observable inputs are limited, assumptions about market activity and risk are used and are categorized as Level 3 in the hierarchy.
Investments in open-end mutual funds, including the Fidelity Central Funds, are valued at their closing net asset value each business day and are categorized as Level 1 in the hierarchy.
Foreign Currency. The Fund may use foreign currency contracts to facilitate transactions in foreign-denominated securities. Gains and losses from these transactions may arise from changes in the value of the foreign currency or if the counterparties do not perform under the contracts' terms.
Foreign-denominated assets, including investment securities, and liabilities are translated into U.S. dollars at the exchange rate at period end. Purchases and sales of investment securities, income and dividends received and expenses denominated in foreign currencies are translated into U.S. dollars at the exchange rate in effect on the transaction date.
The effects of exchange rate fluctuations on investments are included with the net realized and unrealized gain (loss) on investment securities. Other foreign currency transactions resulting in realized and unrealized gain (loss) are disclosed separately.
Investment Transactions and Income. For financial reporting purposes, the Fund's investment holdings and NAV include trades executed through the end of the last business day of the period. The NAV per share for processing shareholder transactions is calculated as of the close of business of the New York Stock Exchange (NYSE), normally 4:00 p.m. Eastern time and includes trades executed through the end of the prior business day. Gains and losses on securities sold are determined on the basis of identified cost and may include proceeds received from litigation. Dividend income is recorded on the ex-dividend date, except for certain dividends from foreign securities where the ex-dividend date may have passed, which are recorded as soon as the Fund is informed of the ex-dividend date. Non-cash dividends included in dividend income, if any, are recorded at the fair market value of the securities received. Distributions received on securities that represent a return of capital or capital gain are recorded as a reduction of cost of investments and/or as a realized gain. The Fund estimates the components of distributions received that may be considered return of capital distributions or capital gain distributions. Interest income and distributions from the Fidelity Central Funds are accrued as earned. Interest income includes coupon interest and amortization of premium and accretion of discount on debt securities. Investment income is recorded net of foreign taxes withheld where recovery of such taxes is uncertain.
Expenses. Expenses directly attributable to a fund are charged to that fund. Expenses attributable to more than one fund are allocated among the respective funds on the basis of relative net assets or other appropriate methods. Expense estimates are accrued in the period to which they relate and adjustments are made when actual amounts are known.
Income Tax Information and Distributions to Shareholders. Each year, the Fund intends to qualify as a regulated investment company, including distributing substantially all of its taxable income and realized gains under Subchapter M of the Internal Revenue Code and filing its U.S. federal tax return. As a result, no provision for income taxes is required. As of July 31, 2011, the Fund did not have any unrecognized tax benefits in the financial statements. A fund's federal tax return is subject to examination by the Internal Revenue Service (IRS) for a period of three years. Foreign taxes are provided for based on the Fund's understanding of the tax rules and rates that exist in the foreign markets in which it invests.
Distributions are declared and recorded on the ex-dividend date. Income dividends and capital gain distributions are declared separately for each class. Income and capital gain distributions are determined in accordance with income tax regulations, which may differ from GAAP.
Capital accounts within the financial statements are adjusted for permanent book-tax differences. These adjustments have no impact on net assets or the results of operations. Temporary book-tax differences will reverse in a subsequent period.
Book-tax differences are primarily due to deferred trustees compensation, foreign currency transactions, capital loss carryforwards, expiring capital loss carryforwards and losses deferred due to wash sales and excise tax regulations.
The federal tax cost of investment securities and unrealized appreciation (depreciation) as of period end were as follows:
Gross unrealized appreciation | $ 10,454,055 |
Gross unrealized depreciation | (2,700,107) |
Net unrealized appreciation (depreciation) on securities and other investments | $ 7,753,948 |
| |
Tax Cost | $ 151,294,323 |
Annual Report
Notes to Financial Statements - continued
3. Significant Accounting Policies - continued
Income Tax Information and Distributions to Shareholders - continued
The tax-based components of distributable earnings as of period end were as follows:
Undistributed ordinary income | $ 1,305,344 |
Capital loss carryforward | $ (41,949,952) |
Net unrealized appreciation (depreciation) | $ 7,753,948 |
Under the recently enacted Regulated Investment Company Modernization Act of 2010 (the Act), the Fund will be permitted to carry forward capital losses incurred in taxable years beginning after December 22, 2010 for an unlimited period. However, any losses incurred during those future taxable years will be required to be utilized prior to any losses incurred in pre-enactment taxable years, which generally expire after eight years from when they are incurred. Additionally, post-enactment capital losses that are carried forward will retain their character as either short-term or long-term capital losses rather than being considered all short-term as under previous law. The Fund's first fiscal year end subject to the Act will be July 31, 2012.
The tax character of distributions paid was as follows:
| July 31, 2011 | July 31, 2010 |
Ordinary Income | $ 2,864,390 | $ 3,192,017 |
Short-Term Trading (Redemption) Fees. Shares held by investors in the Fund less than 30 days are subject to a redemption fee equal to .75% of the net asset value of shares redeemed. All redemption fees, which reduce the proceeds of the shareholder redemption, are retained by the Fund and accounted for as an addition to paid in capital.
New Accounting Pronouncement. In May 2011, the Financial Accounting Standards Board issued Accounting Standard Update No. 2011-04, Fair Value Measurement (Topic 820) - Amendments to Achieve Common Fair Value Measurement and Disclosure Requirements in U.S. GAAP and IFRSs. The update changes the wording used to describe the requirements in GAAP for measuring fair value and for disclosing information about fair value measurements. The update is effective during interim and annual periods beginning after December 15, 2011. Management is currently evaluating the impact of the update's adoption on the Fund's financial statement disclosures.
4. Purchases and Sales of Investments.
Purchases and sales of securities, other than short-term securities, aggregated $296,867,090 and $293,312,976, respectively.
5. Fees and Other Transactions with Affiliates.
Management Fee. FMR and its affiliates provide the Fund with investment management related services for which the Fund pays a monthly management fee. The management fee is the sum of an individual fund fee rate that is based on an annual rate of .30% of the Fund's average net assets and a group fee rate that averaged .26% during the period. The group fee rate is based upon the average net assets of all the mutual funds advised by FMR. The group fee rate decreases as assets under management increase and increases as assets under management decrease. For the period, the total annual management fee rate was .56% of the Fund's average net assets.
Distribution and Service Plan Fees. In accordance with Rule 12b-1 of the 1940 Act, the Fund has adopted separate Distribution and Service Plans for each class of shares. Certain classes pay Fidelity Distributors Corporation (FDC), an affiliate of FMR, separate Distribution and Service Fees, each of which is based on an annual percentage of each class' average net assets. In addition, FDC may pay financial intermediaries for selling shares of the Fund and providing shareholder support services. For the period, the Distribution and Service Fee rates, total fees and amounts retained by FDC were as follows:
| Distribution
Fee | Service
Fee | Total Fees | Retained
by FDC |
Class A | -% | .25% | $ 180,035 | $ 2,562 |
Class T | .25% | .25% | 175,580 | 1,064 |
Class B | .75% | .25% | 84,340 | 63,353 |
Class C | .75% | .25% | 241,277 | 33,336 |
| | | $ 681,232 | $ 100,315 |
Annual Report
5. Fees and Other Transactions with Affiliates - continued
Sales Load. FDC may receive a front-end sales charge of up to 5.75% for selling Class A shares, and 3.50% for selling Class T shares, some of which is paid to financial intermediaries for selling shares of the Fund. Depending on the holding period, FDC may receive contingent deferred sales charges levied on Class A, Class T, Class B, and Class C redemptions. The deferred sales charges range from 5% to 1% for Class B, 1% for Class C, 1.00% for certain purchases of Class A shares and .25% for certain purchases of Class T shares.
For the period, sales charge amounts retained by FDC were as follows:
| Retained
by FDC |
Class A | $ 29,950 |
Class T | 7,728 |
Class B* | 15,575 |
Class C* | 835 |
| $ 54,088 |
* When Class B and Class C shares are initially sold, FDC pays commissions from its own resources to financial intermediaries through which the sales are made.
Transfer Agent Fees. Fidelity Investments Institutional Operations Company, Inc. (FIIOC), an affiliate of FMR, is the transfer, dividend disbursing and shareholder servicing agent for each class of the Fund. FIIOC receives account fees and asset-based fees that vary according to the account size and type of account of the shareholders of the respective classes of the Fund. FIIOC pays for typesetting, printing and mailing of shareholder reports, except proxy statements. For the period, transfer agent fees for each class were as follows:
| Amount | % of
Average
Net Assets |
Class A | $ 217,350 | .30 |
Class T | 110,481 | .31 |
Class B | 25,521 | .30 |
Class C | 71,490 | .30 |
Institutional Class | 23,044 | .29 |
| $ 447,886 | |
Accounting and Security Lending Fees. Fidelity Service Company, Inc. (FSC), an affiliate of FMR, maintains the Fund's accounting records. The accounting fee is based on the level of average net assets for the month. Under a separate contract, FSC administers the security lending program. The security lending fee is based on the number and duration of lending transactions.
Brokerage Commissions. The Fund placed a portion of its portfolio transactions with brokerage firms which are affiliates of the investment adviser. The commissions paid to these affiliated firms were $8,095 for the period.
6. Committed Line of Credit.
The Fund participates with other funds managed by FMR or an affiliate in a $4.0 billion credit facility (the "line of credit") to be utilized for temporary or emergency purposes to fund shareholder redemptions or for other short-term liquidity purposes. The Fund has agreed to pay commitment fees on its pro-rata portion of the line of credit, which amounted to $488 and is reflected in Miscellaneous expenses on the Statement of Operations. During the period, there were no borrowings on this line of credit.
7. Security Lending.
The Fund lends portfolio securities through a lending agent from time to time in order to earn additional income. The lending agent may loan securities to certain qualified borrowers, including Fidelity Capital Markets (FCM), a broker-dealer affiliated with the Fund. On the settlement date of the loan, the Fund receives collateral (in the form of U.S. Treasury obligations, letters of credit and/or cash) against the loaned securities and maintains collateral in an amount not less than 100% of the market value of the loaned securities during the period of the loan. The market value of the loaned securities is determined at the close of business of the Fund and any additional required collateral is delivered to the Fund on the next business day. If the borrower defaults on its obligation to return the securities loaned because of insolvency or other reasons, a fund could experience delays and costs in recovering the securities loaned or in gaining access to the collateral. Any cash collateral received is invested in the Fidelity Securities Lending Cash Central Fund. At period end, there were no security loans outstanding. Security lending income represents the income earned on investing cash
Annual Report
Notes to Financial Statements - continued
7. Security Lending - continued
collateral, less rebates paid to borrowers and lending agent fees associated with the loan, plus any premium payments received for lending certain types of securities. Security lending income is presented in the Statement of Operations as a component of income from Fidelity Central Funds. Total security lending income during the period amounted to $7,142. During the period, there were no securities loaned to FCM.
8. Expense Reductions.
Many of the brokers with whom FMR places trades on behalf of the Fund provided services to the Fund in addition to trade execution. These services included payments of certain expenses on behalf of the Fund totaling $56,520 for the period.
9. Distributions to Shareholders.
Distributions to shareholders of each class were as follows:
Years ended July 31, | 2011 | 2010 |
From net investment income | | |
Class A | $ 1,536,373 | $ 1,700,301 |
Class T | 680,070 | 782,544 |
Class B | 128,700 | 184,067 |
Class C | 350,529 | 413,366 |
Institutional Class | 168,718 | 111,739 |
Total | $ 2,864,390 | $ 3,192,017 |
10. Share Transactions.
Transactions for each class of shares were as follows:
| Shares | Dollars |
Years ended July 31, | 2011 | 2010 | 2011 | 2010 |
Class A | | | | |
Shares sold | 951,835 | 582,593 | $ 17,339,635 | $ 9,269,210 |
Reinvestment of distributions | 78,008 | 96,455 | 1,339,641 | 1,532,370 |
Shares redeemed | (840,008) | (1,092,389) | (15,213,828) | (17,388,823) |
Net increase (decrease) | 189,835 | (413,341) | $ 3,465,448 | $ (6,587,243) |
Class T | | | | |
Shares sold | 251,762 | 214,231 | $ 4,579,718 | $ 3,421,542 |
Reinvestment of distributions | 37,445 | 46,549 | 644,378 | 741,068 |
Shares redeemed | (448,193) | (457,353) | (8,103,122) | (7,262,506) |
Net increase (decrease) | (158,986) | (196,573) | $ (2,879,026) | $ (3,099,896) |
Class B | | | | |
Shares sold | 39,073 | 89,148 | $ 679,580 | $ 1,411,608 |
Reinvestment of distributions | 6,858 | 10,582 | 116,904 | 167,069 |
Shares redeemed | (170,627) | (267,950) | (3,021,254) | (4,203,072) |
Net increase (decrease) | (124,696) | (168,220) | $ (2,224,770) | $ (2,624,395) |
Class C | | | | |
Shares sold | 405,545 | 188,570 | $ 7,271,889 | $ 2,992,972 |
Reinvestment of distributions | 15,668 | 20,486 | 265,763 | 322,145 |
Shares redeemed | (299,716) | (383,514) | (5,335,908) | (5,996,156) |
Net increase (decrease) | 121,497 | (174,458) | $ 2,201,744 | $ (2,681,039) |
Institutional Class | | | | |
Shares sold | 343,779 | 287,925 | $ 6,436,483 | $ 4,699,845 |
Reinvestment of distributions | 7,398 | 5,221 | 128,959 | 84,041 |
Shares redeemed | (175,049) | (188,687) | (3,230,206) | (3,029,537) |
Net increase (decrease) | 176,128 | 104,459 | $ 3,335,236 | $ 1,754,349 |
Annual Report
11. Other.
The Fund's organizational documents provide former and current trustees and officers with a limited indemnification against liabilities arising in connection with the performance of their duties to the Fund. In the normal course of business, the Fund may also enter into contracts that provide general indemnifications. The Fund's maximum exposure under these arrangements is unknown as this would be dependent on future claims that may be made against the Fund. The risk of material loss from such claims is considered remote.
Annual Report
Report of Independent Registered Public Accounting Firm
To the Trustees of Advisor Series VII and the Shareholders of Fidelity Advisor Biotechnology Fund, Fidelity Advisor Communications Equipment Fund, Fidelity Advisor Consumer Discretionary Fund, Fidelity Advisor Electronics Fund, Fidelity Advisor Energy Fund, Fidelity Advisor Financial Services Fund, Fidelity Advisor Health Care Fund, Fidelity Advisor Industrials Fund, Fidelity Advisor Technology Fund, and Fidelity Advisor Utilities Fund:
We have audited the accompanying statements of assets and liabilities of Fidelity Advisor Biotechnology Fund, Fidelity Advisor Communications Equipment Fund, Fidelity Advisor Consumer Discretionary Fund, Fidelity Advisor Electronics Fund, Fidelity Advisor Energy Fund, Fidelity Advisor Financial Services Fund, Fidelity Advisor Health Care Fund, Fidelity Advisor Industrials Fund, Fidelity Advisor Technology Fund, and Fidelity Advisor Utilities Fund (collectively, the "Funds"), including the schedules of investments, as of July 31, 2011, and the related statements of operations for the year then ended, the statements of changes in net assets for each of the two years in the period then ended, and the financial highlights for each of the five years in the period then ended. These financial statements and financial highlights are the responsibility of the Funds' management. Our responsibility is to express an opinion on these financial statements and financial highlights based on our audits.
We conducted our audits in accordance with the standards of the Public Company Accounting Oversight Board (United States). Those standards require that we plan and perform the audit to obtain reasonable assurance about whether the financial statements and financial highlights are free of material misstatement. The Funds are not required to have, nor were we engaged to perform, an audit of their internal control over financial reporting. Our audits included consideration of internal control over financial reporting as a basis for designing audit procedures that are appropriate in the circumstances, but not for the purpose of expressing an opinion on the effectiveness of the Funds' internal control over financial reporting. Accordingly, we express no such opinion. An audit also includes examining, on a test basis, evidence supporting the amounts and disclosures in the financial statements, assessing the accounting principles used and significant estimates made by management, as well as evaluating the overall financial statement presentation. Our procedures included confirmation of securities owned as of July 31, 2011, by correspondence with the custodians and brokers; where replies were not received from brokers, we performed other auditing procedures. We believe that our audits provide a reasonable basis for our opinion.
In our opinion, the financial statements and financial highlights referred to above present fairly, in all material respects, the financial position of Fidelity Advisor Biotechnology Fund, Fidelity Advisor Communications Equipment Fund, Fidelity Advisor Consumer Discretionary Fund, Fidelity Advisor Electronics Fund, Fidelity Advisor Energy Fund, Fidelity Advisor Financial Services Fund, Fidelity Advisor Health Care Fund, Fidelity Advisor Industrials Fund, Fidelity Advisor Technology Fund, and Fidelity Advisor Utilities Fund as of July 31, 2011, the results of their operations for the year then ended, the changes in their net assets for each of the two years in the period then ended, and the financial highlights for each of the five years in the period then ended, in conformity with accounting principles generally accepted in the United States of America.
/s/ Deloitte & Touche LLP
DELOITTE & TOUCHE LLP
Boston, Massachusetts
September 19, 2011
Annual Report
The Trustees, Members of the Advisory Board, and executive officers of the trust and funds, as applicable, are listed below. The Board of Trustees governs each fund and is responsible for protecting the interests of shareholders. The Trustees are experienced executives who meet periodically throughout the year to oversee each fund's activities, review contractual arrangements with companies that provide services to each fund, oversee management of the risks associated with such activities and contractual arrangements, and review each fund's performance. Except for James C. Curvey, each of the Trustees oversees 221 funds advised by FMR or an affiliate. Mr. Curvey oversees 419 funds advised by FMR or an affiliate.
The Trustees hold office without limit in time except that (a) any Trustee may resign; (b) any Trustee may be removed by written instrument, signed by at least two-thirds of the number of Trustees prior to such removal; (c) any Trustee who requests to be retired or who has become incapacitated by illness or injury may be retired by written instrument signed by a majority of the other Trustees; and (d) any Trustee may be removed at any special meeting of shareholders by a two-thirds vote of the outstanding voting securities of the trust. Each Trustee who is not an interested person (as defined in the 1940 Act) (Independent Trustee), shall retire not later than the last day of the calendar year in which his or her 75th birthday occurs. The Independent Trustees may waive this mandatory retirement age policy with respect to individual Trustees. The executive officers and Advisory Board Members hold office without limit in time, except that any officer and Advisory Board Member may resign or may be removed by a vote of a majority of the Trustees at any regular meeting or any special meeting of the Trustees. Except as indicated, each individual has held the office shown or other offices in the same company for the past five years.
Experience, Skills, Attributes, and Qualifications of the Funds' Trustees. The Governance and Nominating Committee has adopted a statement of policy that describes the experience, qualifications, attributes, and skills that are necessary and desirable for potential Independent Trustee candidates (Statement of Policy). The Board believes that each Trustee satisfied at the time he or she was initially elected or appointed a Trustee, and continues to satisfy, the standards contemplated by the Statement of Policy. The Governance and Nominating Committee also engages professional search firms to help identify potential Independent Trustee candidates who have the experience, qualifications, attributes, and skills consistent with the Statement of Policy. From time to time, additional criteria based on the composition and skills of the current Independent Trustees, as well as experience or skills that may be appropriate in light of future changes to board composition, business conditions, and regulatory or other developments, have also been considered by the professional search firms and the Governance and Nominating Committee. In addition, the Board takes into account the Trustees' commitment and participation in Board and committee meetings, as well as their leadership of standing and ad hoc committees throughout their tenure.
In determining that a particular Trustee was and continues to be qualified to serve as a Trustee, the Board has considered a variety of criteria, none of which, in isolation, was controlling. The Board believes that, collectively, the Trustees have balanced and diverse experience, qualifications, attributes, and skills, which allow the Board to operate effectively in governing each fund and protecting the interests of shareholders. Information about the specific experience, skills, attributes, and qualifications of each Trustee, which in each case led to the Board's conclusion that the Trustee should serve (or continue to serve) as a trustee of the funds, is provided below.
Board Structure and Oversight Function. James C. Curvey is an interested person (as defined in the 1940 Act) and currently serves as Acting Chairman. The Trustees have determined that an interested Chairman is appropriate and benefits shareholders because an interested Chairman has a personal and professional stake in the quality and continuity of services provided to the funds. Independent Trustees exercise their informed business judgment to appoint an individual of their choosing to serve as Chairman, regardless of whether the Trustee happens to be independent or a member of management. The Independent Trustees have determined that they can act independently and effectively without having an Independent Trustee serve as Chairman and that a key structural component for assuring that they are in a position to do so is for the Independent Trustees to constitute a substantial majority for the Board. The Independent Trustees also regularly meet in executive session. Ned C. Lautenbach serves as Chairman of the Independent Trustees and as such (i) acts as a liaison between the Independent Trustees and management with respect to matters important to the Independent Trustees and (ii) with management prepares agendas for Board meetings.
Fidelity funds are overseen by different Boards of Trustees. The funds' Board oversees Fidelity's equity and high income funds and another Board oversees Fidelity's investment-grade bond, money market, and asset allocation funds. The asset allocation funds may invest in Fidelity funds overseen by the funds' Board. The use of separate Boards, each with its own committee structure, allows the Trustees of each group of Fidelity funds to focus on the unique issues of the funds they oversee, including common research, investment, and operational issues. On occasion, the separate Boards establish joint committees to address issues of overlapping consequences for the Fidelity funds overseen by each Board.
The Trustees operate using a system of committees to facilitate the timely and efficient consideration of all matters of importance to the Trustees, each fund, and fund shareholders and to facilitate compliance with legal and regulatory requirements and oversight of the funds' activities and associated risks. The Board, acting through its committees, has charged FMR and its affiliates with (i) identifying events or circumstances the occurrence of which could have demonstrably adverse effects on the funds' business and/or reputation; (ii) implementing processes and controls to lessen the possibility that such events or circumstances occur or to mitigate the effects of such events or circumstances if they do occur; and (iii) creating and maintaining a system designed to evaluate continuously business and market conditions in order to facilitate the identification and implementation processes described in (i) and (ii) above. Because the day-to-day operations and activities of the funds are carried out by or through FMR, its affiliates and other service providers, the funds' exposure to risks is mitigated but not eliminated by the processes overseen by the Trustees. While each of the Board's committees has responsibility for overseeing different aspects of the funds' activities, oversight is exercised primarily through the Operations, Audit, and Compliance Committees. Appropriate personnel, including but not limited to the funds' Chief Compliance Officer (CCO), FMR's internal auditor, the independent accountants, the funds' Treasurer and portfolio management personnel, make periodic reports to the Board's committees, as appropriate. The responsibilities of each committee, including their oversight responsibilities, are described further under "Standing Committees of the Funds' Trustees."
Annual Report
The fund's Statement of Additional Information (SAI) includes more information about the Trustees. To request a free copy, call Fidelity at 1-800-208-0098.
Interested Trustees*:
Correspondence intended for each Trustee who is an interested person may be sent to Fidelity Investments, 82 Devonshire Street, Boston, Massachusetts 02109.
Name, Age; Principal Occupations and Other Relevant Experience+ |
James C. Curvey (76) |
| Year of Election or Appointment: 2007
Mr. Curvey is Trustee and Acting Chairman of the Board of Trustees of certain Trusts. Mr. Curvey also serves as Trustee (2007-present) of other investment companies advised by FMR. Mr. Curvey is a Director of Fidelity Investments Money Management, Inc. (2009-present), Director of Fidelity Research & Analysis Co. (2009-present) and Director of FMR and FMR Co., Inc. (2007-present). Mr. Curvey is also Vice Chairman (2007-present) and Director of FMR LLC. In addition, Mr. Curvey serves as an Overseer for the Boston Symphony Orchestra and a member of the Trustees of Villanova University. Previously, Mr. Curvey was the Vice Chairman (2006-2007) and Director (2000-2007) of FMR Corp. |
Ronald P. O'Hanley (54) |
| Year of Election or Appointment: 2011
Mr. O'Hanley is Director of FMR Co., Inc. (2010-present), Director of Fidelity Investments Money Management, Inc. (2010-present), Director of Fidelity Research & Analysis Company (2010-present), President of Fidelity Asset Management and Corporate Services and a member of Fidelity's Executive Committee (2010-present). Previously, Mr. O'Hanley served as President and Chief Executive Officer of BNY Mellon Asset Management (2007-2010). Mr. O'Hanley also served as Vice Chairman of Bank New York Mellon Corp. and a member of that firm's Executive Committee. Prior to the 2007 merger of The Bank of New York and Mellon Financial Corporation, he was Vice Chairman of Mellon Financial Corporation and President and Chief Executive Officer of Mellon Asset Management. He joined Mellon in February 1997. Mr. O'Hanley currently serves as Chairman of the Boston Public Library Foundation Board of Directors and sits on the Board of Directors of Beth Israel Deaconess Medical Center, the Board of Trustees of the Marine Biological Laboratory and the Advisory Board of the Maxwell School of Citizenship and Public Administration at Syracuse University. Mr. O'Hanley also chairs the Council on Asset Management for the Financial Services Roundtable and is a member of the Board of Directors of Institutional Investor's U.S. Institute. |
* Trustees have been determined to be "Interested Trustees" by virtue of, among other things, their affiliation with the trust or various entities under common control with FMR.
+ The information above includes each Trustee's principal occupation during the last five years and other information relating to the experience, attributes, and skills relevant to each Trustee's qualifications to serve as a Trustee, which led to the conclusion that each Trustee should serve as a Trustee for each fund.
Independent Trustees:
Correspondence intended for each Independent Trustee (that is, the Trustees other than the Interested Trustees) may be sent to Fidelity Investments, P.O. Box 55235, Boston, Massachusetts 02205-5235.
Name, Age; Principal Occupations and Other Relevant Experience+ |
Dennis J. Dirks (63) |
| Year of Election or Appointment: 2005 Prior to his retirement in May 2003, Mr. Dirks was Chief Operating Officer and a member of the Board of The Depository Trust & Clearing Corporation (DTCC). He also served as President, Chief Operating Officer, and Board member of The Depository Trust Company (DTC) and President and Board member of the National Securities Clearing Corporation (NSCC). In addition, Mr. Dirks served as Chief Executive Officer and Board member of the Government Securities Clearing Corporation, Chief Executive Officer and Board member of the Mortgage-Backed Securities Clearing Corporation, as a Trustee and a member of the Finance Committee of Manhattan College (2005-2008), and as a Trustee and a member of the Finance Committee of AHRC of Nassau County (2006-2008). Mr. Dirks is a member of the Independent Directors Council (IDC) Governing Council (2010-Present) and Board of Directors for The Brookville Center for Children's Services, Inc. (2009-present). |
Alan J. Lacy (57) |
| Year of Election or Appointment: 2008 Mr. Lacy serves as Senior Adviser (2007-present) of Oak Hill Capital Partners, L.P. (private equity). Mr. Lacy also served as Chief Executive Officer (2000-2005) and Vice Chairman (2005-2006) of Sears Holdings Corporation and Sears, Roebuck and Co. (retail). In addition, Mr. Lacy serves as a member of the Board of Directors of Dave & Buster's, Inc. (restaurant and entertainment complexes, 2010-present), The Hillman Companies, Inc. (hardware wholesalers, 2010-present), and Bristol-Myers Squibb Company (global pharmaceuticals, 2007-present). Mr. Lacy is a member of the Board of Trustees of The National Parks Conservation Association (2006-Present). Previously, Mr. Lacy served as Chairman of the Board of Trustees of the National Parks Conservation Association (2008-2011) and as a member of the Board of Directors for the Western Union Company (global money transfer, 2006-2011). |
Ned C. Lautenbach (67) |
| Year of Election or Appointment: 2000 Mr. Lautenbach is Chairman of the Independent Trustees of the Equity and High Income Funds (2006-present). Mr. Lautenbach currently serves as the Lead Director of the Eaton Corporation Board of Directors (diversified industrial, 1997-present). Mr. Lautenbach is also a member of the Board of Directors of the Philharmonic Center for the Arts in Naples, Florida (1999-present); a member of the Board of Trustees of Fairfield University (2005-present); and a member of the Council on Foreign Relations (1994-present). Previously, Mr. Lautenbach was a Partner/Advisory Partner at Clayton, Dubilier & Rice, LLC (private equity investment, 1998-2010), as well as a Director of Sony Corporation (2006-2007). |
Joseph Mauriello (66) |
| Year of Election or Appointment: 2008 Prior to his retirement in January 2006, Mr. Mauriello served in numerous senior management positions including Deputy Chairman and Chief Operating Officer (2004-2005), and Vice Chairman of Financial Services (2002-2004) of KPMG LLP US (professional services, 1965-2005). Mr. Mauriello currently serves as a member of the Board of Directors of XL Group plc. (global insurance and re-insurance, 2006-present) and of Arcadia Resources Inc. (health care services and products, 2007-present). Previously, Mr. Mauriello served as a Director of the Hamilton Funds of the Bank of New York (2006-2007). |
Robert W. Selander (60) |
| Year of Election or Appointment: 2011 Previously, Mr. Selander served as a Member of the Advisory Board of Fidelity's Equity and High Income Funds (2011), Executive Vice Chairman (2010), Chief Executive Officer (2009-2010), and President and Chief Executive Officer (1997-2009) of Mastercard, Inc. |
Cornelia M. Small (67) |
| Year of Election or Appointment: 2005 Ms. Small is a member of the Board of Directors of the Teagle Foundation (2009-present). Ms. Small is also a member of the Investment Committee, and Chair (2008-present) and a member of the Board of Trustees of Smith College. In addition, Ms. Small serves on the Investment Committee of the Berkshire Taconic Community Foundation (2008-present). Previously, Ms. Small served as Chairperson of the Investment Committee (2002-2008) of Smith College. In addition, Ms. Small served as Chief Investment Officer, Director of Global Equity Investments, and a member of the Board of Directors of Scudder, Stevens & Clark and Scudder Kemper Investments. |
William S. Stavropoulos (72) |
| Year of Election or Appointment: 2001 Mr. Stavropoulos is Vice Chairman of the Independent Trustees of the Equity and High Income Funds (2006-present). Mr. Stavropoulos serves as President and Founder of the Michigan Baseball Foundation, the Great Lakes Loons (2007-present). Mr. Stavropoulos is Chairman Emeritus of the Board of Directors of The Dow Chemical Company, where he previously served in numerous senior management positions, including President, CEO (1995-2000; 2002-2004), Chairman of the Executive Committee (2000-2006), and as a member of the Board of Directors (1990-2006). Currently, Mr. Stavropoulos is Chairman of Univar (global distributor of commodity and specialty chemicals, 2010-present), a Director of Teradata Corporation (data warehousing and technology solutions, 2008-present), Chemical Financial Corporation, Maersk Inc. (industrial conglomerate), Tyco International, Inc. (multinational manufacturing and services, 2007-present), and a member of the Advisory Board for Metalmark Capital (private equity investment, 2005-present). Mr. Stavropoulos is a special advisor to Clayton, Dubilier & Rice, LLC (private equity investment). In addition, Mr. Stavropoulos is a member of the University of Notre Dame Advisory Council for the College of Science. |
David M. Thomas (62) |
| Year of Election or Appointment: 2008 Previously, Mr. Thomas served as Executive Chairman (2005-2006) and Chairman and Chief Executive Officer (2000-2005) of IMS Health, Inc. (pharmaceutical and healthcare information solutions). In addition, Mr. Thomas serves as a member of the Board of Directors of Fortune Brands, Inc. (consumer products), and Interpublic Group of Companies, Inc. (marketing communication, 2004-present). |
Michael E. Wiley (60) |
| Year of Election or Appointment: 2008 Mr. Wiley also serves as a Director of Asia Pacific Exploration Consolidated (international oil and gas exploration and production, 2008-present). Mr. Wiley serves as a Director of Tesoro Corporation (independent oil refiner and marketer, 2005-present), and a Director of Bill Barrett Corporation (exploration and production, 2005-present). In addition, Mr. Wiley also serves as a Director of Post Oak Bank (privately-held bank, 2004-present). Previously, Mr. Wiley served as a member of the Board of Trustees of the University of Tulsa (2000-2006; 2007-2010), as a Senior Energy Advisor of Katzenbach Partners, LLC (consulting, 2006-2007), as an Advisory Director of Riverstone Holdings (private investment), Chairman, President, and CEO of Baker Hughes, Inc. (oilfield services, 2000-2004), and as Director of Spinnaker Exploration Company (exploration and production, 2001-2005). |
+ The information above includes each Trustee's principal occupation during the last five years and other information relating to the experience, attributes, and skills relevant to each Trustee's qualifications to serve as a Trustee, which led to the conclusion that each Trustee should serve as a Trustee for each fund.
Advisory Board Members and Executive Officers:
Correspondence intended for each executive officer, Edward C. Johnson 3d, and Peter S. Lynch may be sent to Fidelity Investments, 82 Devonshire Street, Boston, Massachusetts 02109.
Name, Age; Principal Occupation |
Edward C. Johnson 3d (81) |
| Year of Election or Appointment: 2011 Member of the Advisory Board of Fidelity's Equity and High Income Funds. Mr. Johnson serves as Chief Executive Officer, Chairman, and a Director of FMR LLC, and also serves as Chairman and Director of FIL Limited. Previously, Mr. Johnson served as a Trustee and Chairman of the Board of certain Fidelity Trusts, Chairman and a Director of FMR, Chairman and a Director of FMR Co., Inc., and President of FMR LLC (2006-2007). |
Peter S. Lynch (67) |
| Year of Election or Appointment: 2003 Member of the Advisory Board of Fidelity's Equity and High Income Funds. Mr. Lynch is Vice Chairman and a Director of FMR and FMR Co., Inc. In addition, Mr. Lynch serves as a Trustee of Boston College and as the Chairman of the Inner-City Scholarship Fund. Previously, Mr. Lynch served on the Special Olympics International Board of Directors (1997-2006). |
Kenneth B. Robins (41) |
| Year of Election or Appointment: 2008 President and Treasurer of Fidelity's Equity and High Income Funds. Mr. Robins also serves as President and Treasurer (2010-present) and Assistant Treasurer (2009-present) of other Fidelity funds and is an employee of Fidelity Investments (2004-present). Previously, Mr. Robins served as Deputy Treasurer of the Fidelity funds (2005-2008) and Treasurer and Chief Financial Officer of The North Carolina Capital Management Trust: Cash and Term Portfolios (2006-2008). |
Brian B. Hogan (46) |
| Year of Election or Appointment: 2009 Vice President of Equity and High Income Funds. Mr. Hogan also serves as President of FMR's Equity Division (2009-present). Previously, Mr. Hogan served as Senior Vice President, Equity Research of FMR (2006-2009) and as a portfolio manager. |
Christopher S. Bartel (39) |
| Year of Election or Appointment: 2009 Vice President of Fidelity's Sector and Real Estate Equity Funds. Mr. Bartel also serves as Senior Vice President of Equity Research (2009-present). Previously, Mr. Bartel served as Managing Director of Research (2006-2009) and an analyst and portfolio manager (2000-2006). |
Scott C. Goebel (43) |
| Year of Election or Appointment: 2008 Secretary and Chief Legal Officer (CLO) of the Fidelity funds. Mr. Goebel also serves as Secretary of Fidelity Investments Money Management, Inc. (FIMM) (2010-present) and Fidelity Research and Analysis Company (FRAC) (2010-present); Secretary and CLO of The North Carolina Capital Management Trust: Cash and Term Portfolios (2008-present); General Counsel, Secretary, and Senior Vice President of FMR (2008-present) and FMR Co., Inc. (2008-present); employed by FMR LLC or an affiliate (2001-present); Chief Legal Officer of Fidelity Management & Research (Hong Kong) Limited (2008-present) and Assistant Secretary of Fidelity Management & Research (Japan) Inc. (2008-present), and Fidelity Management & Research (U.K.) Inc. (2008-present). Previously, Mr. Goebel served as Assistant Secretary of FIMM (2008-2010), FRAC (2008-2010), and the Funds (2007-2008) and as Vice President and Secretary of Fidelity Distributors Corporation (FDC) (2005-2007). |
William C. Coffey (42) |
| Year of Election or Appointment: 2009 Assistant Secretary of Fidelity's Equity and High Income Funds. Mr. Coffey also serves as Senior Vice President and Deputy General Counsel of FMR LLC (2010-present), and is an employee of Fidelity Investments. Previously, Mr. Coffey served as Vice President and Associate General Counsel of FMR LLC (2005-2009). |
Holly C. Laurent (57) |
| Year of Election or Appointment: 2008 Anti-Money Laundering (AML) Officer of the Fidelity funds. Ms. Laurent also serves as AML Officer of The North Carolina Capital Management Trust: Cash and Term Portfolios (2008-present) and is an employee of Fidelity Investments. Previously, Ms. Laurent was Senior Vice President and Head of Legal for Fidelity Business Services India Pvt. Ltd. (2006-2008), and Senior Vice President, Deputy General Counsel and Group Head for FMR LLC (2005-2006). |
Christine Reynolds (52) |
| Year of Election or Appointment: 2008 Chief Financial Officer of the Fidelity funds. Ms. Reynolds became President of Fidelity Pricing and Cash Management Services (FPCMS) in August 2008. Ms. Reynolds served as Chief Operating Officer of FPCMS (2007-2008). Previously, Ms. Reynolds served as President, Treasurer, and Anti-Money Laundering officer of the Fidelity funds (2004-2007). |
Kenneth A. Rathgeber (64) |
| Year of Election or Appointment: 2004 Chief Compliance Officer of Fidelity's Equity and High Income Funds. Mr. Rathgeber is Chief Compliance Officer of Fidelity Management & Research (Hong Kong) Limited (2008-present), Fidelity Management & Research (Japan) Inc. (2008-present), FMR (2005-present), FMR Co., Inc. (2005-present), Fidelity Management & Research (U.K.) Inc. (2005-present), Fidelity Research & Analysis Company (2005-present), Fidelity Investments Money Management, Inc. (2005-present), Pyramis Global Advisors, LLC (2005-present), and Strategic Advisers, Inc. (2005-present). |
Jeffrey S. Christian (49) |
| Year of Election or Appointment: 2009 Deputy Treasurer of the Fidelity funds. Mr. Christian is an employee of Fidelity Investments. Previously, Mr. Christian served as Chief Financial Officer (2008-2009) of certain Fidelity funds and Senior Vice President of Fidelity Pricing and Cash Management Services (FPCMS) (2004-2009). |
Bryan A. Mehrmann (50) |
| Year of Election or Appointment: 2005 Deputy Treasurer of the Fidelity funds. Mr. Mehrmann is an employee of Fidelity Investments. |
Adrien E. Deberghes (43) |
| Year of Election or Appointment: 2008 Deputy Treasurer of Fidelity's Equity and High Income Funds. Mr. Deberghes also serves as Vice President and Assistant Treasurer of Fidelity Rutland Square Trust II and Fidelity Commonwealth Trust II (2011-present), Assistant Treasurer of other Fidelity funds (2010-present), and is an employee of Fidelity Investments (2008-present). Previously, Mr. Deberghes served as Senior Vice President of Mutual Fund Administration at State Street Corporation (2007-2008), Senior Director of Mutual Fund Administration at Investors Bank & Trust (2005-2007), and Director of Finance for Dunkin' Brands (2000-2005). |
Stephanie J. Dorsey (42) |
| Year of Election or Appointment: 2010 Assistant Treasurer of Fidelity's Equity and High Income Funds. Ms. Dorsey also serves as Deputy Treasurer of other Fidelity funds (2008-present) and is an employee of Fidelity Investments (2008-present). Previously, Ms. Dorsey served as Treasurer (2004-2008) of the JPMorgan Mutual Funds and Vice President (2004-2008) of JPMorgan Chase Bank. |
John R. Hebble (53) |
| Year of Election or Appointment: 2009 Assistant Treasurer of Fidelity's Equity and High Income Funds. Mr. Hebble also serves as President (2011-present), Treasurer, and Chief Financial Officer of The North Carolina Capital Management Trust: Cash and Term Portfolios (2008-present), President and Treasurer of other Fidelity funds (2008-present) and is an employee of Fidelity Investments. |
Gary W. Ryan (52) |
| Year of Election or Appointment: 2005 Assistant Treasurer of the Fidelity funds. Mr. Ryan is an employee of Fidelity Investments. Previously, Mr. Ryan served as Vice President of Fund Reporting in Fidelity Pricing and Cash Management Services (FPCMS) (1999-2005). |
Jonathan Davis (43) |
| Year of Election or Appointment: 2010 Assistant Treasurer of the Fidelity funds. Mr. Davis is an employee of Fidelity Investments. Previously, Mr. Davis served as Vice President and Associate General Counsel of FMR LLC (2003-2010). |
Annual Report
The Board of Trustees of each fund voted to pay to shareholders of record at the opening of business on record date the following distributions per share derived from capital gains realized from sales of portfolio securities and dividends derived from net investment income:
| Pay Date | Record Date | Dividends | Capital Gains |
Fidelity Advisor Communications Equipment Fund | | | | |
Institutional Class | 09/12/11 | 09/09/11 | $0.00 | $0.199 |
Fidelity Advisor Consumer Discretionary Fund | | | | |
Institutional Class | 09/12/11 | 09/09/11 | $0.00 | $0.831 |
Fidelity Advisor Health Care Fund | | | | |
Institutional Class | 09/12/11 | 09/09/11 | $0.00 | $2.565 |
Fidelity Advisor Industrials Fund | | | | |
Institutional Class | 09/12/11 | 09/09/11 | $0.056 | $0.252 |
Fidelity Advisor Utilities Fund | | | | |
Institutional Class | 09/12/11 | 09/09/11 | $0.213 | $0.00 |
The funds hereby designate as capital gain dividend the amounts noted below for the taxable year ended July 31, 2011, or, if subsequently determined to be different, the net capital gain of such year.
Fidelity Advisor Communications Equipment Fund | $399,014 |
Fidelity Advisor Consumer Discretionary Fund | $2,778,143 |
Fidelity Advisor Health Care Fund | $49,894,902 |
Fidelity Advisor Industrials Fund | $4,316,295 |
A percentage of the dividends distributed during the fiscal year for the following funds qualify for the dividends-received deduction for corporate shareholders:
| September 2010 | December 2010 |
Fidelity Advisor Energy Fund | | |
Institutional Class | 0% | 100% |
Fidelity Advisor Industrials Fund | | |
Institutional Class | 0% | 100% |
Fidelity Advisor Utilities Fund | | |
Institutional Class | 100% | 100% |
A percentage of the dividends distributed during the fiscal year for the following funds may be taken into account as a dividend for purposes of the maximum rate under section 1(h)(11) of the Internal Revenue Code.
| September 2010 | December 2010 |
Fidelity Advisor Energy Fund | | |
Institutional Class | 0% | 100% |
Fidelity Advisor Industrials Fund | | |
Institutional Class | 0% | 100% |
Fidelity Advisor Utilities Fund | | |
Institutional Class | 100% | 100% |
The funds will notify shareholders in January 2012 of amounts for use in preparing 2011 income tax returns.
Annual Report
Board Approval of Investment Advisory Contracts and Management Fees
Fidelity Advisor Focus Funds
Each year, the Board of Trustees, including the Independent Trustees (together, the Board), votes on the renewal of the management contract and sub-advisory agreements (together, the Advisory Contracts) for each fund. The Board, assisted by the advice of fund counsel and Independent Trustees' counsel, requests and considers a broad range of information relevant to the renewal of the Advisory Contracts throughout the year.
The Board meets regularly and considers at each of its meetings factors that are relevant to its annual consideration of the renewal of each fund's Advisory Contracts, including the services and support provided to each fund and its shareholders. The Board has established various standing committees, each composed of Independent Trustees with varying backgrounds, to which the Board has assigned specific subject matter responsibilities in order to enhance effective decision-making by the Board. The Board, acting directly and through its Committees, requests and receives information concerning the annual consideration of the renewal of each fund's Advisory Contracts. The Board also meets as needed to consider matters specifically related to the Board's annual consideration of the renewal of Advisory Contracts. Members of the Board may also meet with trustees of other Fidelity funds through ad hoc joint committees to discuss certain matters relevant to the Fidelity funds.
At its July 2011 meeting, the Board of Trustees, including the Independent Trustees, unanimously determined to renew each fund's Advisory Contracts. In reaching its determination, the Board considered all factors it believed relevant, including (i) the nature, extent, and quality of the services to be provided to each fund and its shareholders (including the investment performance of each fund); (ii) the competitiveness of each fund's management fee and total expense ratio; (iii) the total costs of the services to be provided by and the profits to be realized by Fidelity from its relationship with each fund; (iv) the extent to which economies of scale would be realized as each fund grows; and (v) whether fee levels reflect these economies of scale, if any, for the benefit of fund shareholders.
In considering whether to renew the Advisory Contracts for each fund, the Board reached a determination, with the assistance of fund counsel and Independent Trustees' counsel and through the exercise of its business judgment, that the renewal of the Advisory Contracts is in the best interests of each fund and its shareholders and that the compensation payable under the Advisory Contracts is fair and reasonable. The Board's decision to renew the Advisory Contracts was not based on any single factor, but rather was based on a comprehensive consideration of all the information provided to the Board at its meetings throughout the year. The Board, in reaching its determination to renew the Advisory Contracts, is aware that shareholders in each fund have a broad range of investment choices available to them, including a wide choice among mutual funds offered by Fidelity's competitors, and that each fund's shareholders, who have the opportunity to review and weigh the disclosure provided by the fund in its prospectus and other public disclosures, have chosen to invest in that fund, managed by Fidelity.
Nature, Extent, and Quality of Services Provided. The Board considered the staffing within the investment adviser, FMR, and the sub-advisers (together, the Investment Advisers), including the backgrounds of the funds' investment personnel and the funds' investment objectives and disciplines. The Independent Trustees also had discussions with senior management of Fidelity's investment operations and investment groups. The Board considered the structure of the portfolio manager compensation program and whether this structure provides appropriate incentives to act in the best interests of each fund.
Resources Dedicated to Investment Management and Support Services. The Board and the Fund Oversight and Research Committees reviewed the general qualifications and capabilities of the Investment Advisers' investment staff, including its size, education, experience, and resources, as well as the Investment Advisers' approach to recruiting, training, managing, and compensating investment personnel. The Board also noted that FMR has devoted increased resources to non-U.S. offices. The Board noted that Fidelity's analysts have extensive resources, tools and capabilities which allow them to conduct sophisticated quantitative and fundamental analysis, as well as credit analysis of issuers, counterparties and enhancers. The Board also believes that Fidelity's investment professionals have sufficient access to global information and data so as to provide competitive investment results over time, and that those professionals also have access to sophisticated tools which permit them to assess portfolio construction and risk and performance attribution characteristics continuously, as well as to transmit new information and research conclusions rapidly around the world. Additionally, in their deliberations, the Board considered the Investment Advisers' trading capabilities and resources which are an integral part of the investment management process.
Shareholder and Administrative Services. The Board considered (i) the nature, extent, quality, and cost of advisory, administrative, and shareholder services performed by the Investment Advisers and their affiliates under the Advisory Contracts and under separate agreements covering transfer agency, pricing and bookkeeping, and securities lending services for each fund; (ii) the nature and extent of the investment adviser's supervision of third party service providers, principally custodians and subcustodians; and (iii) the resources devoted to, and the record of compliance with, each fund's compliance policies and procedures. The Board also reviewed the allocation of fund brokerage, including allocations to brokers affiliated with the Investment Advisers, the use of brokerage commissions to pay fund expenses, and the use of "soft" commission dollars to pay for research services.
The Board noted that the growth of fund assets over time across the complex allows Fidelity to reinvest in the development of services designed to enhance the value or convenience of the Fidelity funds as investment vehicles. These services include 24-hour access to account information and market information through telephone representatives and over the Internet, investor education materials and asset allocation tools, and the expanded availability of Fidelity Investor Centers, with 35 new branches opening since 2010.
Annual Report
Board Approval of Investment Advisory Contracts and Management Fees - continued
Investment in a Large Fund Family. The Board considered the benefits to shareholders of investing in a Fidelity fund, including the benefits of investing in a fund that is part of a large family of funds offering a variety of investment disciplines and providing a large variety of mutual fund investor services. The Board noted that Fidelity had taken, or had made recommendations that resulted in the Fidelity funds taking, a number of actions over the previous year that benefited particular funds, including (i) continuing to dedicate additional resources to investment research and support of the senior management team that oversees asset management; (ii) rationalizing product lines through the mergers of six funds into other funds; (iii) continuing to migrate the Freedom Funds to dedicated lower cost underlying funds; (iv) obtaining shareholder approval to broaden the investment strategies for Fidelity Consumer Finance Portfolio, Fidelity Emerging Asia Fund, and Fidelity Environment and Alternative Energy Portfolio; (v) contractually agreeing to reduce the management fees and impose other expense limitations on Spartan 500 Index Fund and U.S. Bond Index Fund in connection with launching new institutional classes of these funds; (vi) changing the name, primary and supplemental benchmarks, and investment policies of Fidelity Global Strategies Fund to support the fund's flexible investment mandate and global orientation; and (vii) reducing the transfer agency account fee rates on certain accounts.
Investment Performance. The Board considered whether each fund has operated in accordance with its investment objective, as well as its record of compliance with its investment restrictions. It also reviewed each fund's absolute investment performance for each class, as well as each fund's relative investment performance for each class measured over multiple periods against a third-party-sponsored index that reflects the market sector in which the fund invests. The Board noted that FMR does not believe that a meaningful peer group exists against which to compare any of the funds' performance.
For each of Advisor Communications Equipment, Advisor Consumer Discretionary, Advisor Electronics, Advisor Energy, Advisor Financial Services, Advisor Health Care, Advisor Industrials, and Advisor Utilities, the following charts considered by the Board show, over the one-, three-, and five-year periods ended December 31, 2010, the cumulative total returns of Institutional Class (Class I) and Class B of the fund and the cumulative total returns of a third-party-sponsored index ("benchmark"). The returns of Institutional Class (Class I) and Class B show the performance of the highest and lowest performing classes, respectively (based on five-year performance).
For each of Advisor Biotechnology and Advisor Technology, the following charts considered by the Board show, over the one-, three-, and five-year periods ended December 31, 2010, the cumulative total returns of Institutional Class (Class I) and Class C of the fund and the cumulative total returns of a third-party-sponsored index ("benchmark"). The returns of Institutional Class (Class I) and Class C show the performance of the highest and lowest performing classes, respectively (based on five-year performance).
Fidelity Advisor Biotechnology Fund

The Board noted that the investment performance of the fund was lower than its benchmark for the three- and five-year periods, although the one-year total return of Institutional Class (Class I) compared favorably to its benchmark. The Board considered that the variations in performance among the fund's classes reflect the variations in class expenses, which result in lower performance for higher expense classes. The Board also reviewed the fund's performance since inception as well as performance in the current year.
Annual Report
Fidelity Advisor Communications Equipment Fund

The Board noted that the investment performance of Institutional Class (Class I) of the fund compared favorably to its benchmark for all the periods shown. The Board considered that the variations in performance among the fund's classes reflect the variations in class expenses, which result in lower performance for higher expense classes. The Board also reviewed the fund's performance since inception as well as performance in the current year.
Fidelity Advisor Consumer Discretionary Fund
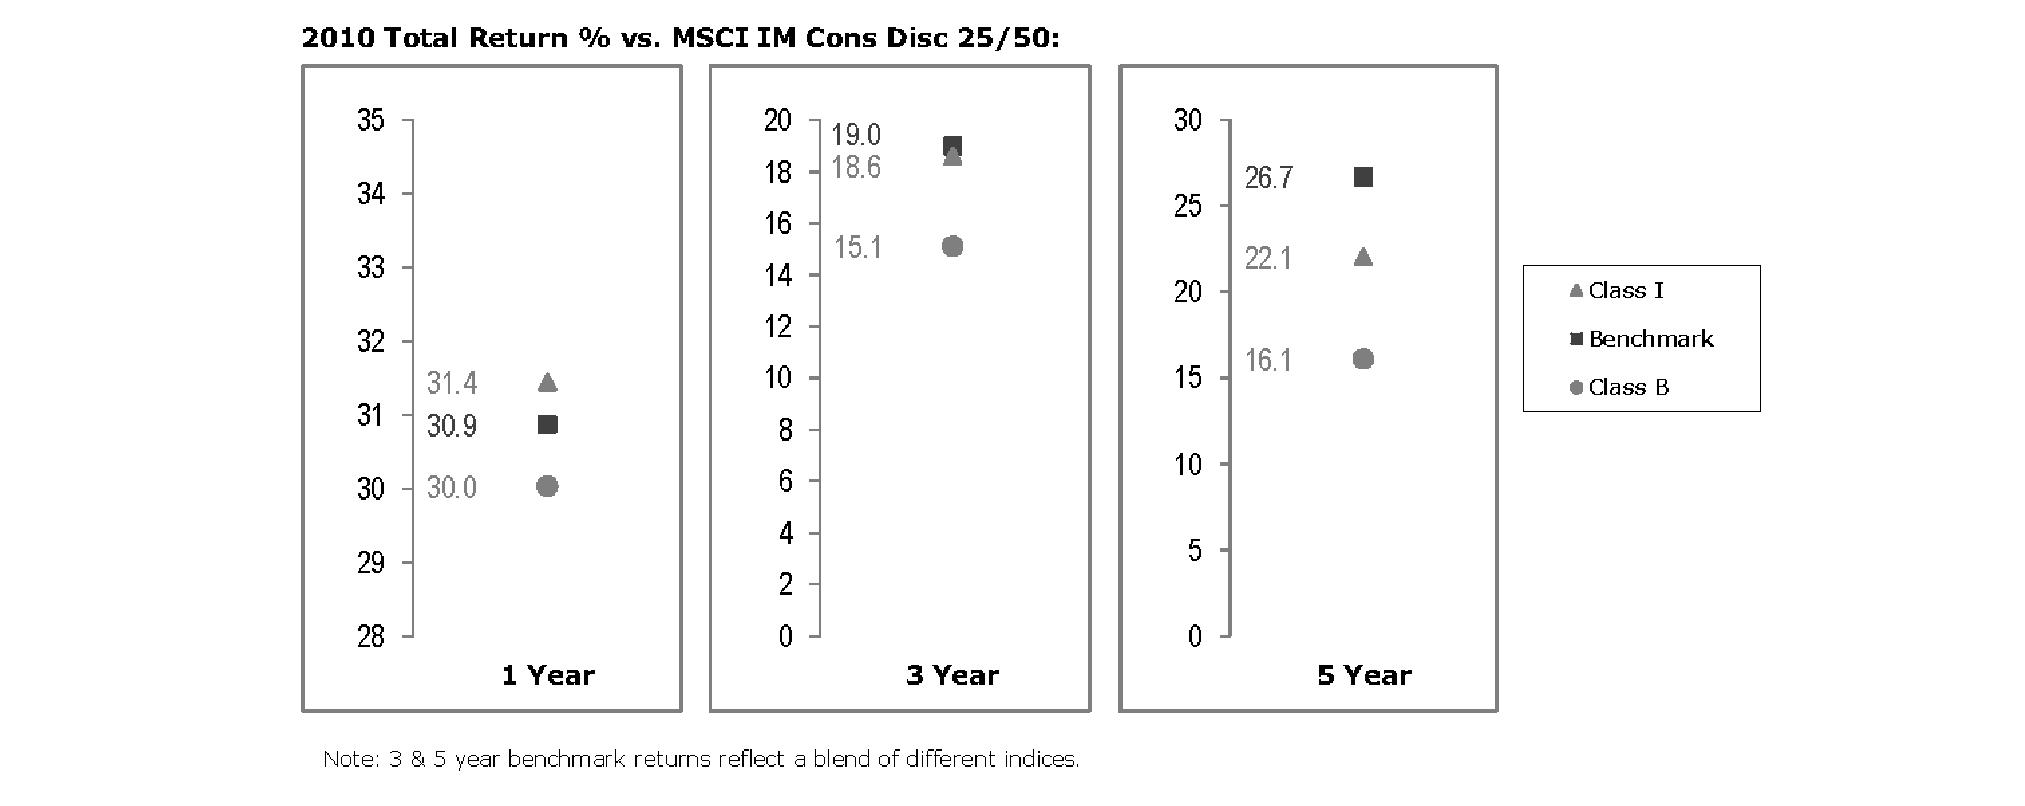
The Board noted that the investment performance of the fund was lower than its benchmark for the three- and five-year periods, although the one-year total return of Institutional Class (Class I) compared favorably to its benchmark. The Board considered that the variations in performance among the fund's classes reflect the variations in class expenses, which result in lower performance for higher expense classes. The Board also reviewed the fund's performance since inception as well as performance in the current year.
Annual Report
Board Approval of Investment Advisory Contracts and Management Fees - continued
Fidelity Advisor Electronics Fund

The Board noted that the investment performance of Institutional Class (Class I) of the fund compared favorably to its benchmark for all the periods shown. The Board considered that the variations in performance among the fund's classes reflect the variations in class expenses, which result in lower performance for higher expense classes. The Board also reviewed the fund's performance since inception as well as performance in the current year.
Fidelity Advisor Energy Fund

The Board noted that the investment performance of the fund was lower than its benchmark for all the periods shown. The Board considered that the variations in performance among the fund's classes reflect the variations in class expenses, which result in lower performance for higher expense classes. The Board discussed with FMR actions that have been taken by FMR to improve the fund's below-benchmark performance. The Board also reviewed the fund's performance since inception as well as performance in the current year. The Board will continue to closely monitor the performance of the fund in the coming year and discuss with FMR other appropriate actions to address the performance of the fund.
Annual Report
Fidelity Advisor Financial Services Fund

The Board noted that the investment performance of the fund was lower than its benchmark for all the periods shown. The Board considered that the variations in performance among the fund's classes reflect the variations in class expenses, which result in lower performance for higher expense classes. The Board discussed with FMR actions that have been taken by FMR to improve the fund's below-benchmark performance. The Board also reviewed the fund's performance since inception as well as performance in the current year. The Board will continue to closely monitor the performance of the fund in the coming year and discuss with FMR other appropriate actions to address the performance of the fund.
Fidelity Advisor Health Care Fund
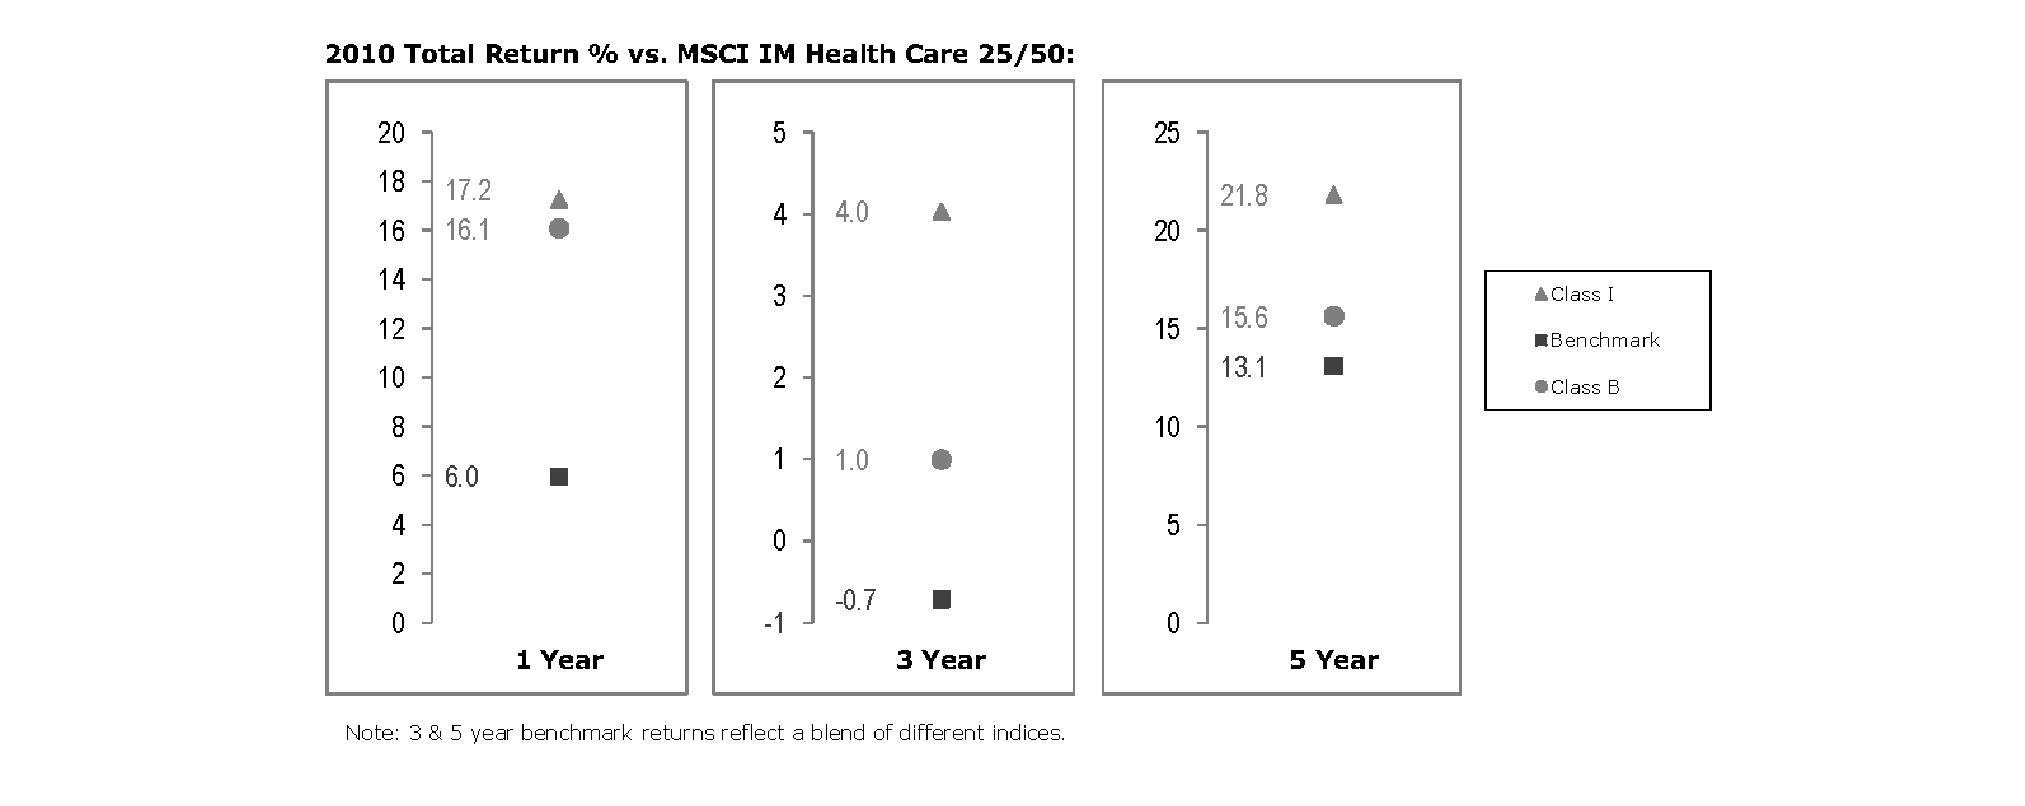
The Board noted that the investment performance of Institutional Class (Class I) of the fund compared favorably to its benchmark for all the periods shown. The Board considered that the variations in performance among the fund's classes reflect the variations in class expenses, which result in lower performance for higher expense classes. The Board also reviewed the fund's performance since inception as well as performance in the current year.
Annual Report
Board Approval of Investment Advisory Contracts and Management Fees - continued
Fidelity Advisor Industrials Fund

The Board noted that the investment performance of Institutional Class (Class I) of the fund compared favorably to its benchmark for all the periods shown. The Board considered that the variations in performance among the fund's classes reflect the variations in class expenses, which result in lower performance for higher expense classes. The Board also reviewed the fund's performance since inception as well as performance in the current year.
Fidelity Advisor Technology Fund

The Board noted that the investment performance of Institutional Class (Class I) of the fund compared favorably to its benchmark for all the periods shown. The Board considered that the variations in performance among the fund's classes reflect the variations in class expenses, which result in lower performance for higher expense classes. The Board also reviewed the fund's performance since inception as well as performance in the current year.
Annual Report
Fidelity Advisor Utilities Fund
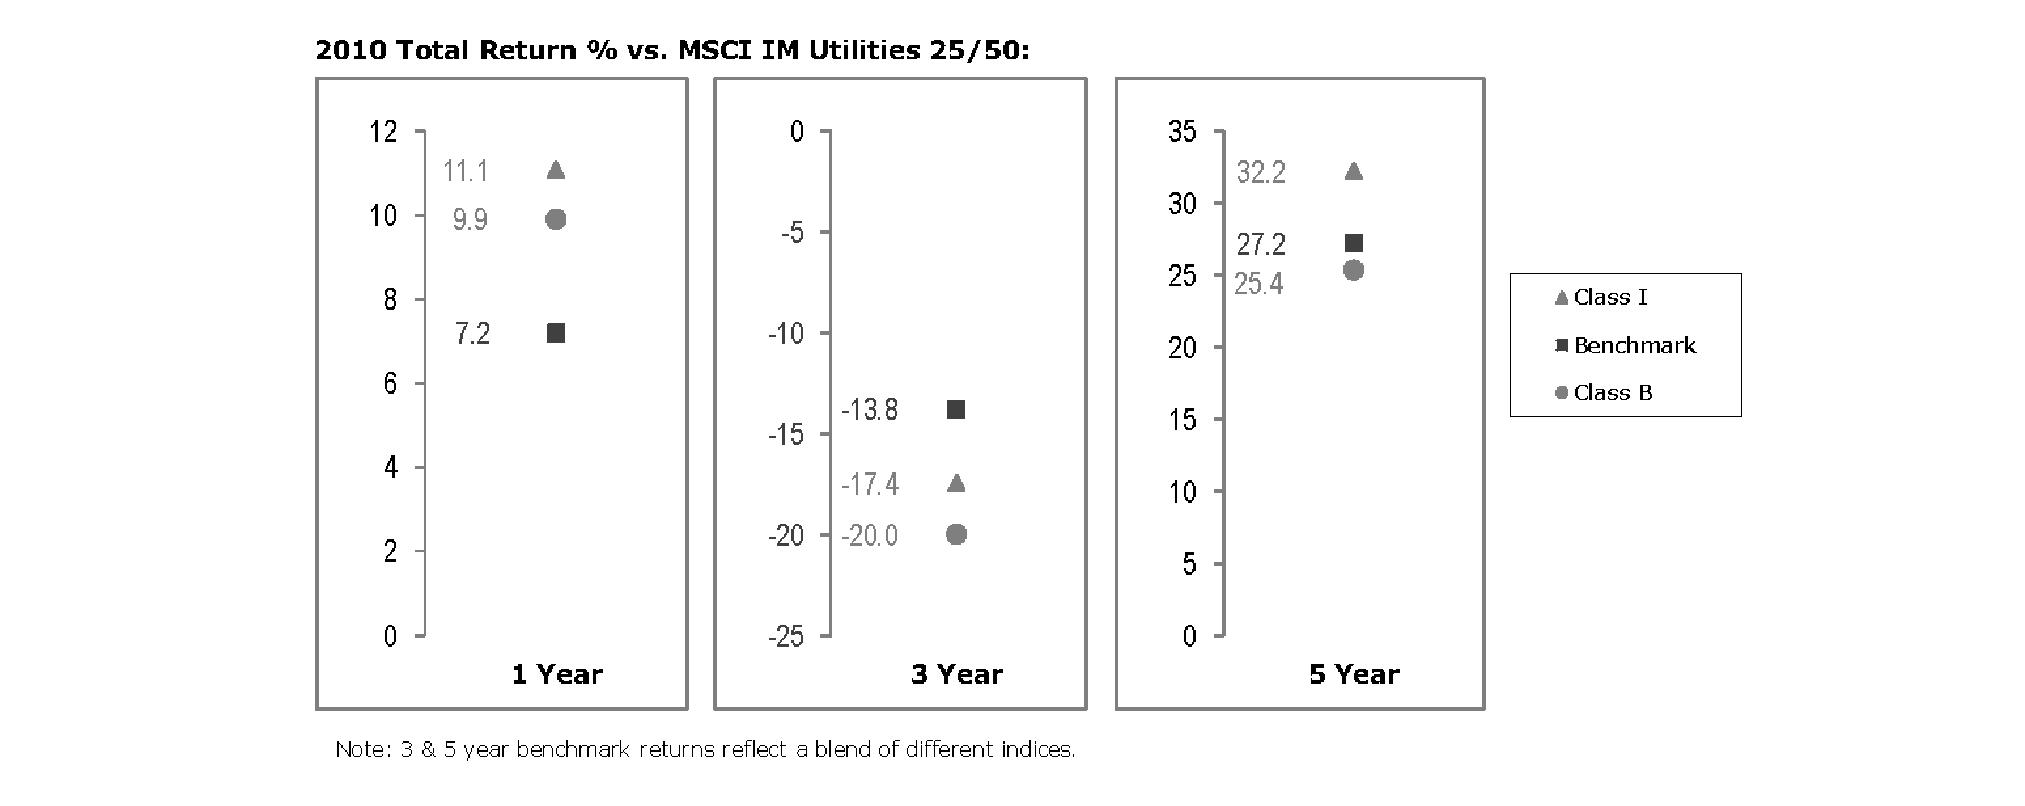
The Board noted that the investment performance of Institutional Class (Class I) of the fund compared favorably to its benchmark for the one- and five-year periods, although the fund's three-year cumulative total return was lower than its benchmark. The Board considered that the variations in performance among the fund's classes reflect the variations in class expenses, which result in lower performance for higher expense classes. The Board also reviewed the fund's performance since inception as well as performance in the current year.
Based on its review, the Board concluded that the nature, extent, and quality of services provided to each fund under the Advisory Contracts should benefit each fund's shareholders.
Competitiveness of Management Fee and Total Expense Ratio. The Board considered each fund's management fee and total expense ratio compared to "mapped groups" of competitive funds and classes. Fidelity creates "mapped groups" by combining similar Lipper investment objective categories that have comparable management fee characteristics. Combining Lipper investment objective categories aids the Board's management fee and total expense ratio comparisons by broadening the competitive group used for comparison and by reducing the number of universes to which various Fidelity funds are compared.
Management Fee. The Board considered two proprietary management fee comparisons for the 12-month periods shown in the charts below. The group of Lipper funds used by the Board for management fee comparisons is referred to below as the "Total Mapped Group." The Total Mapped Group comparison focuses on a fund's standing relative to the total universe of comparable funds available to investors in terms of gross management fees before expense reimbursements or caps. "TMG %" represents the percentage of funds in the Total Mapped Group that had management fees that were lower than a fund's. For example, a TMG % of 6% means that 94% of the funds in the Total Mapped Group had higher management fees than a fund. The "Asset-Size Peer Group" (ASPG) comparison focuses on a fund's standing relative to non-Fidelity funds similar in size to the fund within the Total Mapped Group. The ASPG represents at least 15% of the funds in the Total Mapped Group with comparable asset size and management fee characteristics, subject to a minimum of 50 funds (or all funds in the Total Mapped Group if fewer than 50). Additional information, such as the ASPG quartile in which a fund's management fee ranked, is also included in the charts and considered by the Board.
Annual Report
Board Approval of Investment Advisory Contracts and Management Fees - continued
Fidelity Advisor Biotechnology Fund

Fidelity Advisor Communications Equipment Fund

Annual Report
Fidelity Advisor Consumer Discretionary Fund
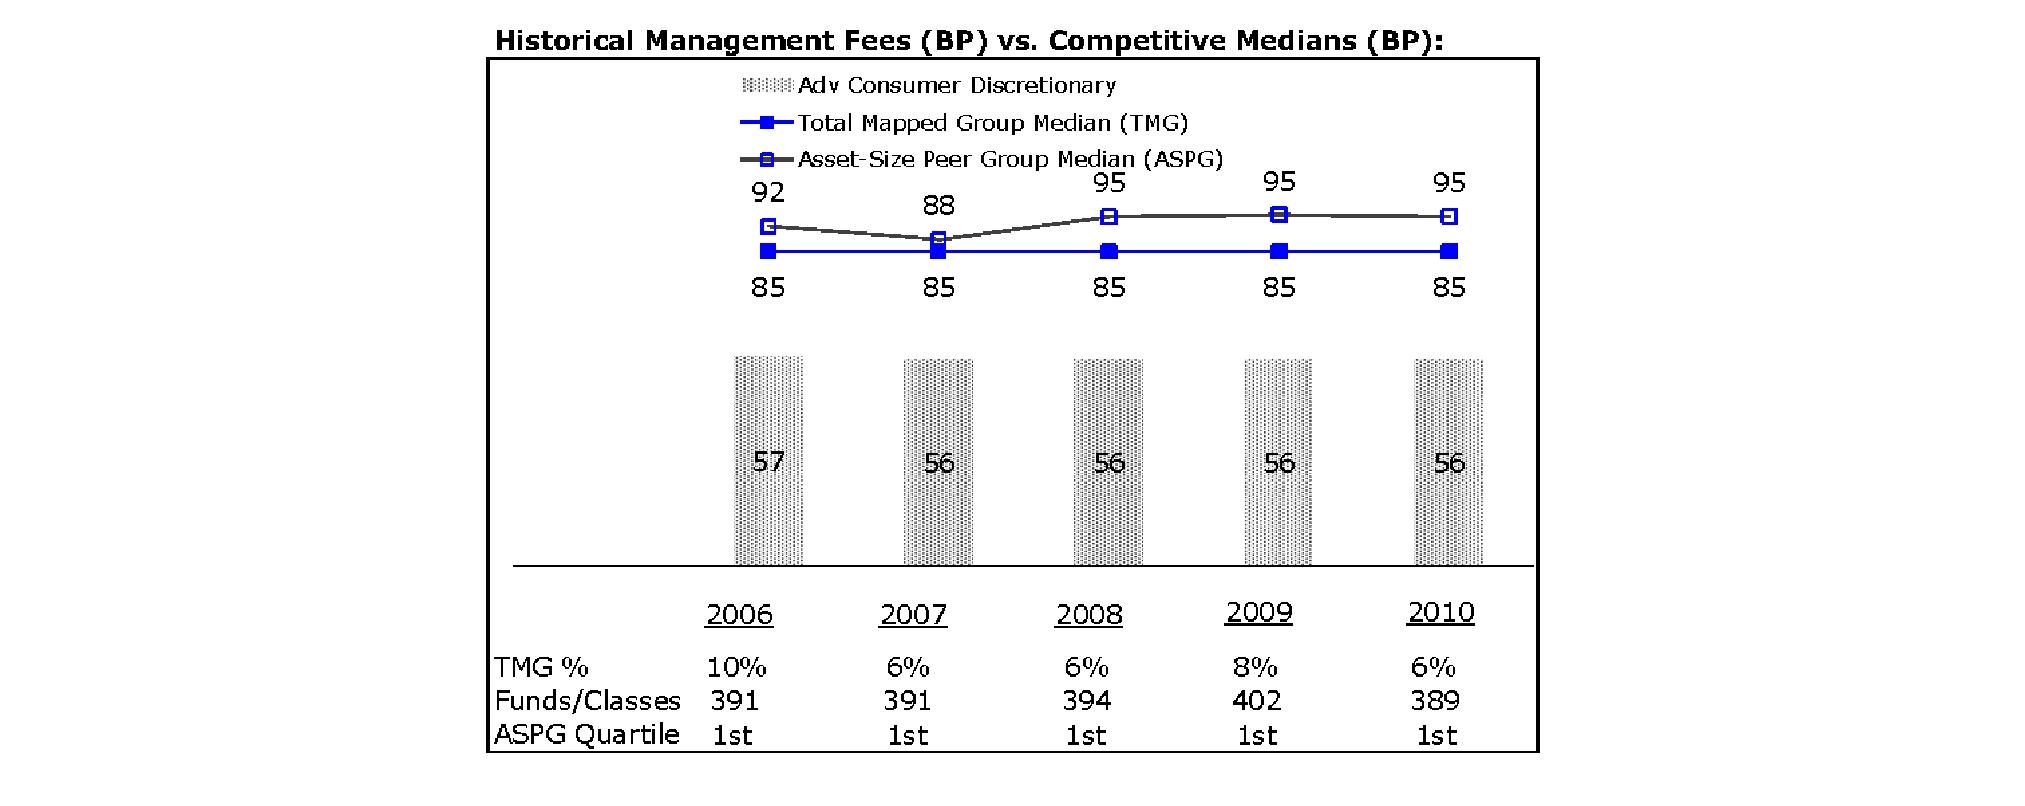
Fidelity Advisor Electronics Fund
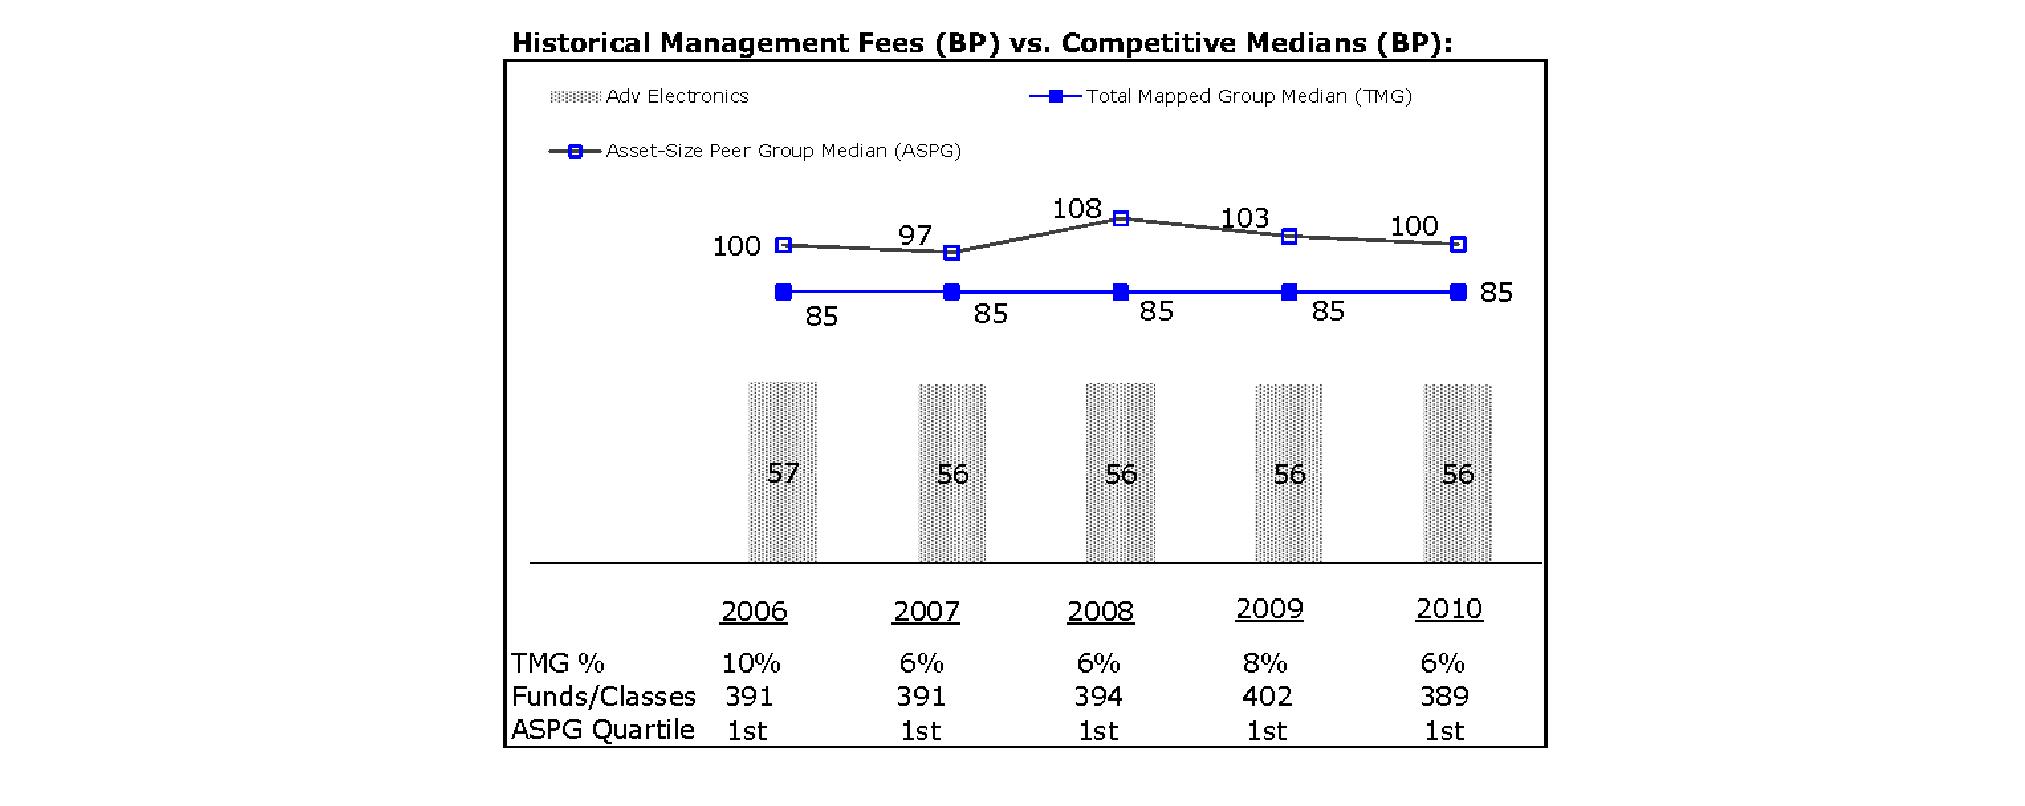
Annual Report
Board Approval of Investment Advisory Contracts and Management Fees - continued
Fidelity Advisor Energy Fund

Fidelity Advisor Financial Services Fund
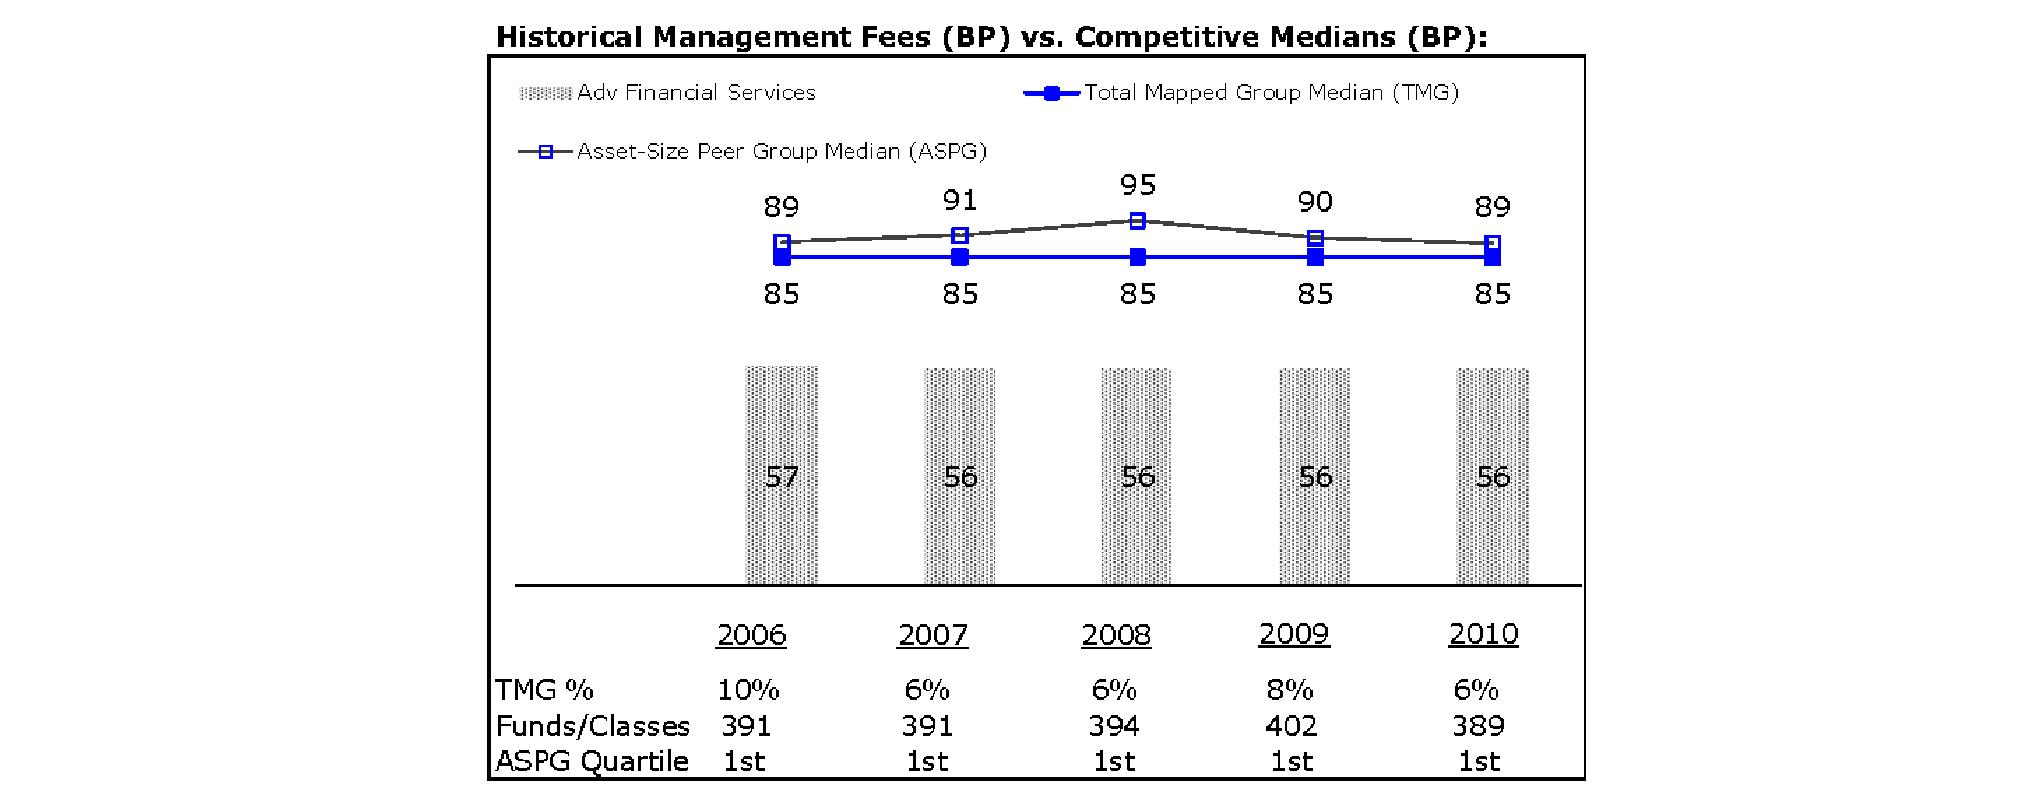
Annual Report
Fidelity Advisor Health Care Fund
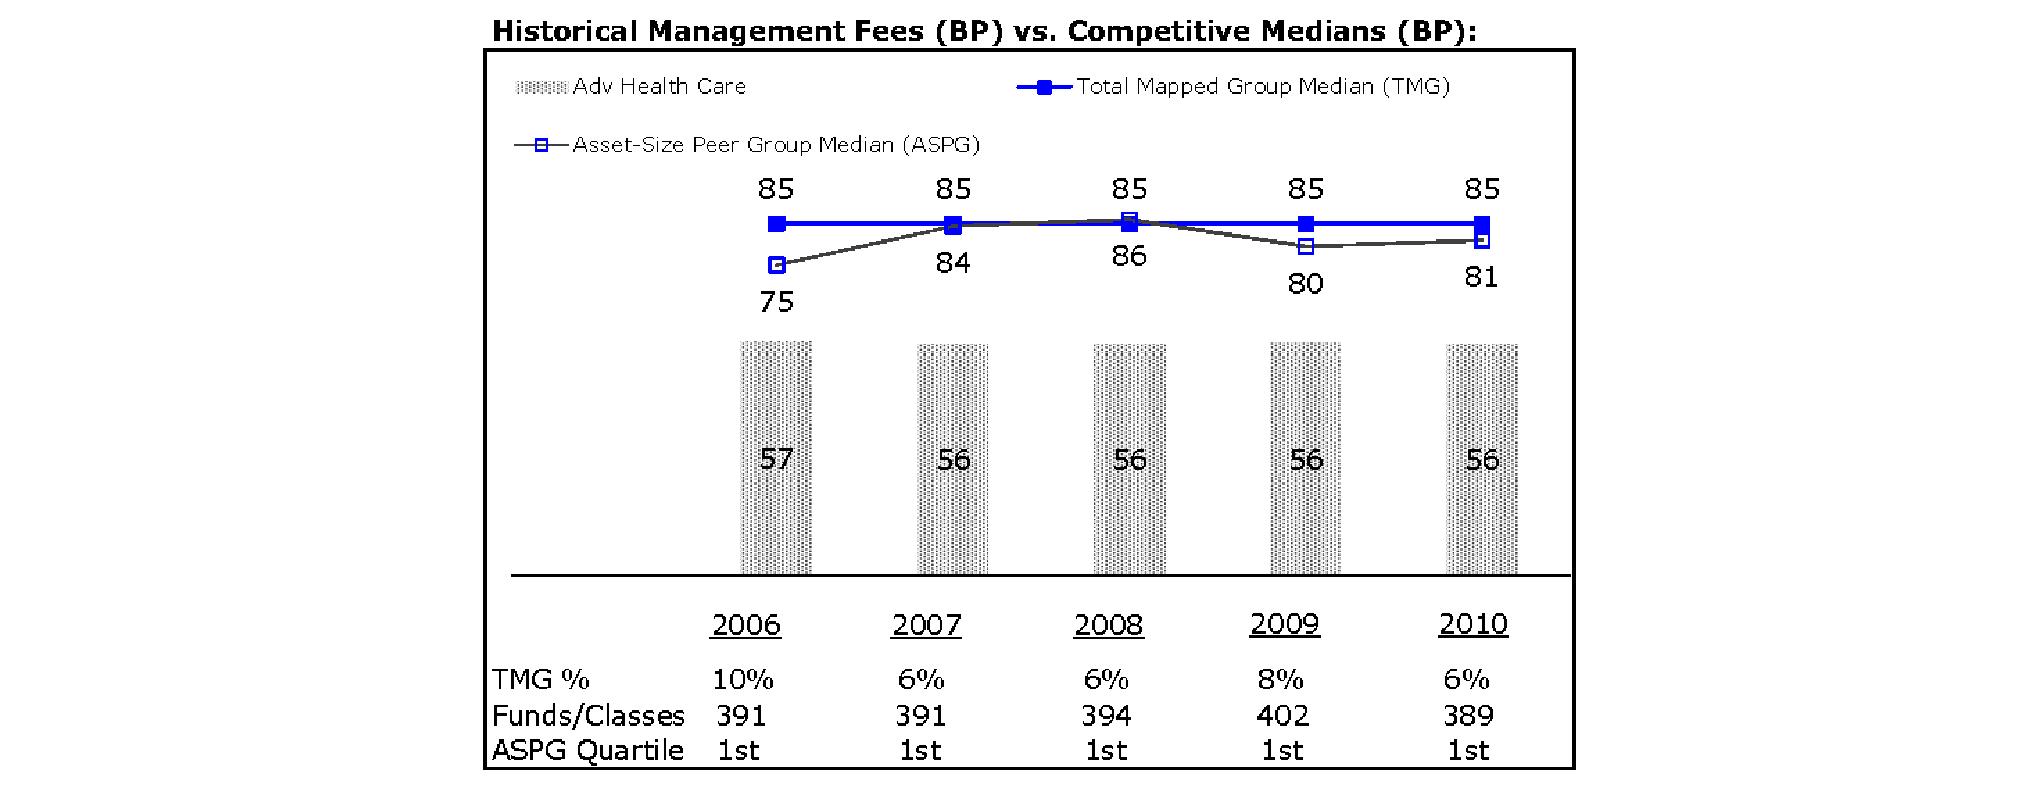
Fidelity Advisor Industrials Fund

Annual Report
Board Approval of Investment Advisory Contracts and Management Fees - continued
Fidelity Advisor Technology Fund
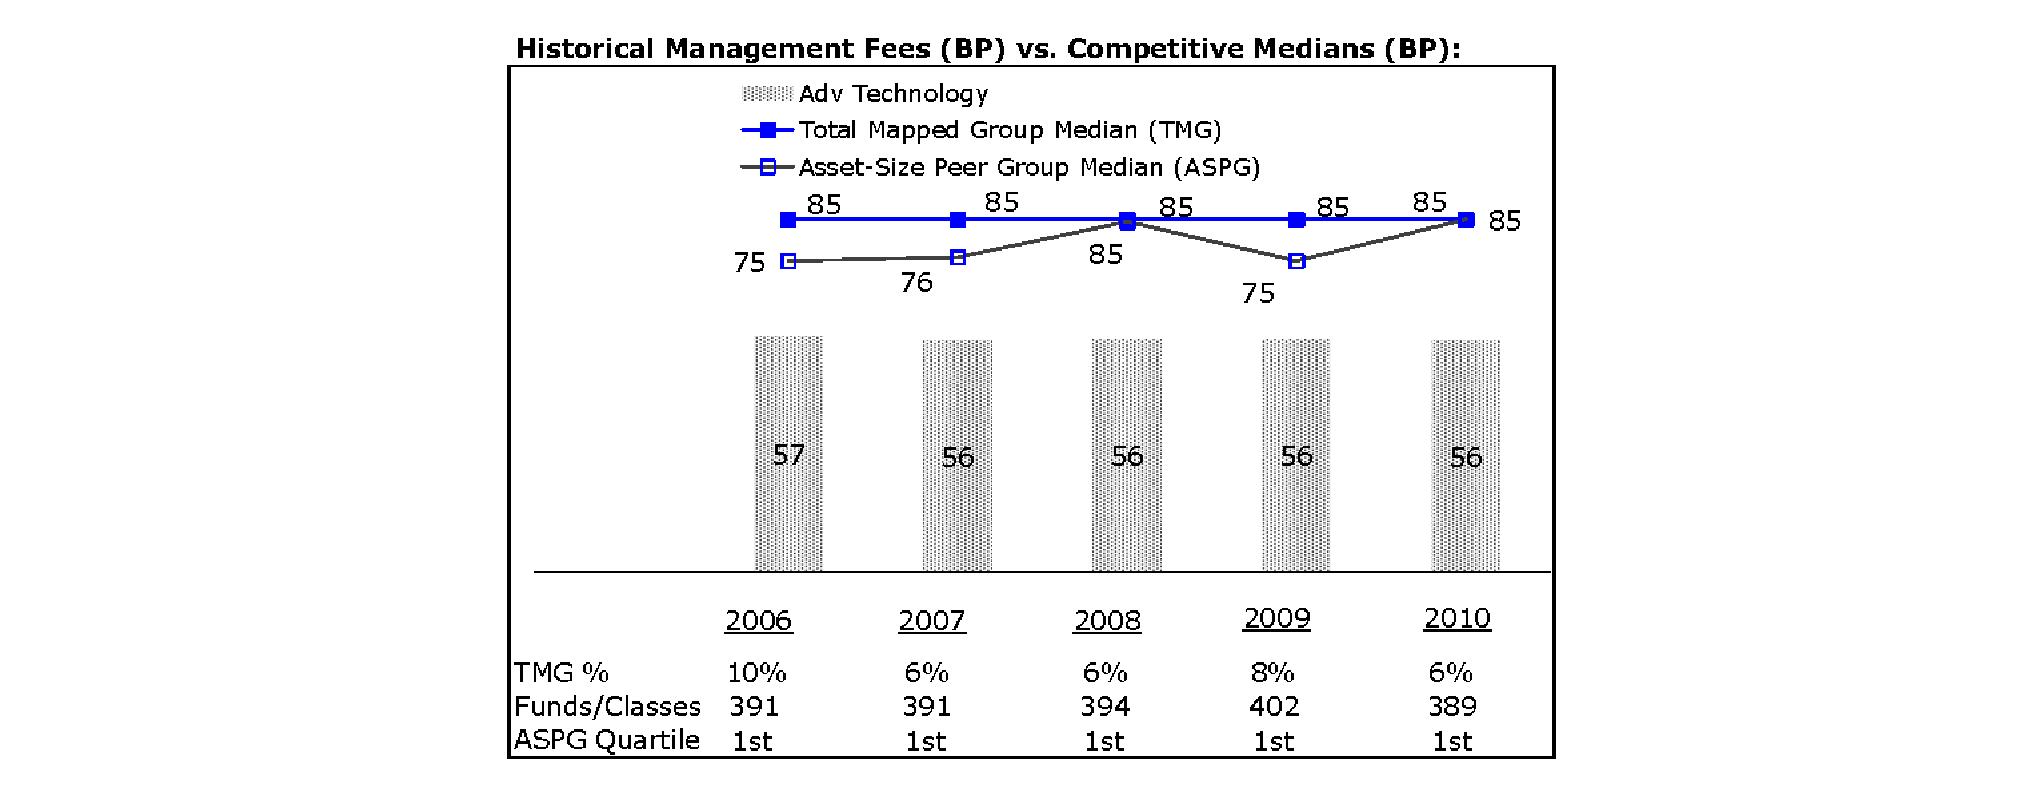
Fidelity Advisor Utilities Fund

The Board noted that each fund's management fee ranked below the median of its Total Mapped Group and below the median of its ASPG for 2010.
Based on its review, the Board concluded that each fund's management fee is fair and reasonable in light of the services that the fund receives and the other factors considered.
Total Expense Ratio. In its review of the total expense ratio of each class of each fund, the Board considered the fund's management fee as well as other fund or class expenses, as applicable, such as transfer agent fees, pricing and bookkeeping fees, fund-paid 12b-1 fees, and custodial, legal, and audit fees. The Board also noted the effects of any waivers and reimbursements on fees and expenses. As part of its review, the Board also considered the current and historical total expense ratios of each class of each fund compared to competitive fund median expenses. Each class of each fund is compared to those funds and classes in the Total Mapped Group (used by the Board for management fee comparisons) that have a similar sales load structure.
The Board noted that each fund offers multiple classes, each of which has a different sales load and 12b-1 fee structure, and that the multiple structures are intended to offer a range of pricing options for the intermediary market. The Board also noted that the total expense ratios of the classes of each fund vary primarily by the level of their 12b-1 fees, although differences in transfer agent fees may also cause expenses to vary from class to class.
Annual Report
For Advisor Biotechnology, Advisor Consumer Discretionary, Advisor Financial Services, and Advisor Utilities, the Board noted that the total expense ratio of each of Class A, Class B, Class C, and Institutional Class ranked below its competitive median for 2010 and the total expense ratio of Class T ranked above its competitive median for 2010. The Board considered that various factors, including 12b-1 fees, positive or negative performance adjustments, and relatively higher other expenses in the case of small fund size, can affect total expense ratios. The Board noted that the total expense ratio of Class T was above the competitive median primarily because of higher 12b-1 fees on Class T. Class T has a higher 12b-1 fee, but a lower front-end sales charge, than traditionally priced front-end sales charge classes.
For Advisor Communications Equipment and Advisor Electronics, the Board noted that the total expense ratio of each of Class A, Class B, and Class C ranked below its competitive median for 2010, the total expense ratio of Institutional Class ranked equal to its competitive median for 2010, and the total expense ratio of Class T ranked above its competitive median for 2010. The Board considered that various factors, including 12b-1 fees, positive or negative performance adjustments, and relatively higher other expenses in the case of small fund size, can affect total expense ratios. The Board noted that the total expense ratio of Class T was above the competitive median primarily because of higher 12b-1 fees on Class T. Class T has a higher 12b-1 fee, but a lower front-end sales charge, than traditionally priced front-end sales charge classes.
For Advisor Energy, Advisor Health Care, Advisor Industrials, and Advisor Technology, the Board noted that the total expense ratio of each class ranked below its competitive median for 2010. The Board considered that various factors, including 12b-1 fees, positive or negative performance adjustments, and relatively higher other expenses in the case of small fund size, can affect total expense ratios.
Fees Charged to Other Fidelity Clients. The Board also considered Fidelity fee structures and other information with respect to clients of FMR and its affiliates, such as other mutual funds advised or subadvised by FMR or its affiliates, pension plan clients, and other institutional clients. In March 2010, the Board created an ad hoc joint committee with the board of other Fidelity funds (the Committee) to review and compare Fidelity's institutional investment advisory business with its business of providing services to the Fidelity funds, including the differences in services provided, fees charged, and costs incurred, as well as competition in their respective marketplaces.
Based on its review of total expense ratios and fees charged to other Fidelity clients, the Board concluded that the total expense ratio of each class of each fund was reasonable, although in some cases above the median of the universe presented for comparison, in light of the services that the fund and its shareholders receive and the other factors considered, including the findings of the Committee.
Costs of the Services and Profitability. The Board considered the revenues earned and the expenses incurred by Fidelity in conducting the business of developing, marketing, distributing, managing, administering and servicing each fund and its shareholders. The Board also considered the level of Fidelity's profits in respect of all the Fidelity funds.
On an annual basis, FMR presents to the Board Fidelity's profitability for each fund. Fidelity calculates the profitability for each fund, as well as aggregate profitability for groups of Fidelity funds and all Fidelity funds, using a series of detailed revenue and cost allocation methodologies which originate with the books and records of Fidelity on which Fidelity's audited financial statements are based. The Audit Committee of the Board reviews any significant changes from the prior year's methodologies.
PricewaterhouseCoopers LLP (PwC), independent registered public accounting firm and auditor to Fidelity and certain Fidelity funds, has been engaged annually by the Board as part of the Board's assessment of Fidelity's profitability analysis. PwC's engagement includes the review and assessment of Fidelity's methodologies used in determining the revenues and expenses attributable to Fidelity's mutual fund business, and completion of agreed-upon procedures surrounding the mathematical accuracy of fund profitability and its conformity to allocation methodologies. After considering PwC's reports issued under the engagement and information provided by Fidelity, the Board concluded that while other allocation methods may also be reasonable, Fidelity's profitability methodologies are reasonable in all material respects.
The Board also reviewed Fidelity's non-fund businesses and fall-out benefits related to the mutual fund business as well as cases where Fidelity's affiliates may benefit from or be related to the funds' business.
The Board considered the costs of the services provided by and the profits realized by Fidelity in connection with the operation of each fund and was satisfied that the profitability was not excessive in the circumstances.
Economies of Scale. The Board considered whether there have been economies of scale in respect of the management of the Fidelity funds, whether the Fidelity funds (including each fund) have appropriately benefited from any such economies of scale, and whether there is potential for realization of any further economies of scale. The Board considered the extent to which each fund will benefit from economies of scale through increased services to the fund, through waivers or reimbursements, or through fee or expense reductions. The Board also noted that in 2009, it and the board of other Fidelity funds created an ad hoc committee (the Economies of Scale Committee) to analyze whether FMR attains economies of scale in respect of the management and servicing of the Fidelity funds, whether the Fidelity funds have appropriately benefited from such economies of scale, and whether there is potential for realization of any further economies of scale.
The Board recognized that each fund's management contract incorporates a "group fee" structure, which provides for lower group fee rates as total fund assets under FMR's management increase, and for higher group fee rates as total fund assets under FMR's management decrease. FMR calculates the group fee rates based on a tiered asset "breakpoint" schedule that varies based on asset class. The Board considered that the group fee is designed to deliver the benefits of economies of scale to fund shareholders when total Fidelity fund assets increase, even if assets of any particular fund are unchanged or have declined, because some portion of Fidelity's costs are attributable to services provided to all Fidelity funds, and all funds benefit if those costs can be allocated among more assets. The Board concluded that, given the group fee structure, fund shareholders will benefit from lower management fees as assets under FMR's management increase at the fund complex level, regardless of whether Fidelity achieves any such economies of scale.
Annual Report
Board Approval of Investment Advisory Contracts and Management Fees - continued
The Board concluded, taking into account the analysis of the Economies of Scale Committee, that any potential economies of scale are being appropriately shared between fund shareholders and Fidelity.
Additional Information Requested by the Board. In order to develop fully the factual basis for consideration of the Fidelity funds' Advisory Contracts, the Board requested and received additional information on certain topics, including (i) fund performance trends, actions to be taken by FMR to improve certain funds' overall performance, and Fidelity's long-term strategies for certain funds; (ii) portfolio manager changes that have occurred during the past year and length of portfolio manager tenure for different categories of funds over time; (iii) Fidelity's compensation structure for portfolio managers and other key personnel and strategies for attracting and retaining non-investment personnel; (iv) the amount of the investment that each portfolio manager has made in the Fidelity fund(s) that he or she manages; (v) historical trends in Fidelity's realization of fall-out benefits; (vi) Fidelity's group fee structures and the rationale for the individual fee rates of certain funds; (vii) fund profitability methodology and the impact of certain factors on fund profitability results; (viii) trends regarding industry use of performance fee structures and Fidelity's compliance practices with respect to performance adjustment calculations; (ix) the fee structures in place for certain other Fidelity clients; and (x) explanations regarding the relative total expense ratios of certain funds and classes, total expense competitive trends, and actions that might be taken by FMR to reduce total expense ratios for certain funds and classes.
Based on its evaluation of all of the conclusions noted above, and after considering all factors it believed relevant, the Board ultimately concluded that the advisory fee structures are fair and reasonable, and that each fund's Advisory Contracts should be renewed.
Annual Report
Investment Adviser
Fidelity Management & Research Company
Boston, MA
Investment Sub-Advisers
FMR Co., Inc.
Fidelity Management & Research (U.K.) Inc.
Fidelity Management & Research
(Hong Kong) Limited
Fidelity Management & Research
(Japan) Inc.
General Distributor
Fidelity Distributors Corporation
Boston, MA
Transfer and Service Agents
Fidelity Investments Institutional Operations Company, Inc.
Boston, MA
Fidelity Service Company, Inc.
Boston, MA
Custodians
JPMorgan Chase Bank
New York, NY
Brown Brothers Harriman & Co. †
Boston, MA
State Street Bank and Trust ††
Quincy, MA
† Custodian for Fidelity Advisor Energy Fund only.
†† Custodian for Fidelity Advisor Biotechnology Fund, Fidelity Advisor
Communications Equipment Fund, and Fidelity Advisor Electronics Fund only.
AFOCI-UANNPRO-0911
1.789242.107
(Fidelity Investment logo)(registered trademark)
Fidelity Advisor®
Real Estate
Fund - Class A, Class T, Class B
and Class C
Annual Report
July 31, 2011
(2_fidelity_logos) (Registered_Trademark)
Contents
Chairman's Message | <Click Here> | The Chairman's message to shareholders. |
Performance | <Click Here> | How the fund has done over time. |
Management's Discussion of Fund Performance | <Click Here> | The Portfolio Manager's review of fund performance and strategy. |
Shareholder Expense Example | <Click Here> | An example of shareholder expenses. |
Investment Changes | <Click Here> | A summary of major shifts in the fund's investments over the past six months. |
Investments | <Click Here> | A complete list of the fund's investments with their market values. |
Financial Statements | <Click Here> | Statements of assets and liabilities, operations, and changes in net assets, as well as financial highlights. |
Notes | <Click Here> | Notes to financial statements. |
Report of Independent Registered Public Accounting Firm | <Click Here> | |
Trustees and Officers | <Click Here> | |
Distributions | <Click Here> | |
Board Approval of Investment Advisory Contracts and Management Fees | <Click Here> | |
To view a fund's proxy voting guidelines and proxy voting record for the 12-month period ended June 30, visit http://www.fidelity.com/proxyvotingresults or visit the Securities and Exchange Commission's (SEC) web site at http://www.sec.gov. You may also call 1-877-208-0098 to request a free copy of the proxy voting guidelines.
Standard & Poor's, S&P and S&P 500 are registered service marks of The McGraw-Hill Companies, Inc. and have been licensed for use by Fidelity Distributors Corporation.
Other third party marks appearing herein are the property of their respective owners.
All other marks appearing herein are registered or unregistered trademarks or service marks of FMR LLC or an affiliated company.
Annual Report
This report and the financial statements contained herein are submitted for the general information of the shareholders of the fund. This report is not authorized for distribution to prospective investors in the fund unless preceded or accompanied by an effective prospectus.
A fund files its complete schedule of portfolio holdings with the SEC for the first and third quarters of each fiscal year on Form N-Q. Forms N-Q are available on the SEC's web site at http://www.sec.gov. A fund's Forms N-Q may be reviewed and copied at the SEC's Public Reference Room in Washington, DC. Information regarding the operation of the SEC's Public Reference Room may be obtained by calling 1-800-SEC-0330. For a complete list of a fund's portfolio holdings, view the most recent holdings listing, semiannual report, or annual report on Fidelity's web site at http://www.fidelity.com, http://www.advisor.fidelity.com, or http://www.401k.com, as applicable.
NOT FDIC INSURED • MAY LOSE VALUE • NO BANK GUARANTEE
Neither the fund nor Fidelity Distributors Corporation is a bank.
Annual Report
(photo_of_James_C_Curvey)
Dear Shareholder:
The second half of 2011 began with U.S. equities continuing to give back some of the gains achieved earlier in the year. In the days leading up to July 31, markets were shaken by a political stalemate in which Congress struggled to address the debt ceiling issue before an early-August deadline. The resulting uncertainty held back markets in July, the third consecutive monthly decline for equities, effectively reversing the positive momentum seen through the end of April. Financial markets are always unpredictable, of course, but there are several time-tested investment principles that can help put the odds in your favor.
One of the basic tenets is to invest for the long term. Over time, riding out the markets' inevitable ups and downs has proven much more effective than selling into panic or chasing the hottest trend. Even missing only a few of the markets' best days can significantly diminish investor returns. Patience also affords the benefits of compounding - of earning interest on additional income or reinvested dividends and capital gains. There can be tax advantages and cost benefits to consider as well. While staying the course doesn't eliminate risk, it can considerably lessen the effect of short-term declines.
You can further manage your investing risk through diversification. And today, more than ever, geographic diversification should be taken into account. Studies indicate that asset allocation is the single most important determinant of a portfolio's long-term success. The right mix of stocks, bonds and cash - aligned to your particular risk tolerance and investment objective - is very important. Age-appropriate rebalancing is also an essential aspect of asset allocation. For younger investors, an emphasis on equities - which historically have been the best-performing asset class over time - is encouraged. As investors near their specific goal, such as retirement or sending a child to college, consideration may be given to replacing volatile assets (e.g. common stocks) with more-stable fixed investments (bonds or savings plans).
A third principle - investing regularly - can help lower the average cost of your purchases. Investing a certain amount of money each month or quarter helps ensure you won't pay for all your shares at market highs. This strategy - known as dollar cost averaging - also reduces "emotion" from investing, helping shareholders avoid selling weak performers just prior to an upswing, or chasing a hot performer just before a correction.
We invite you to contact us via the Internet, through our Investor Centers or by phone. It is our privilege to provide you the information you need to make the investments that are right for you.
Sincerely,
(The acting chairman's signature appears here.)
James C. Curvey
Acting Chairman
Annual Report
Average annual total return reflects the change in the value of an investment, assuming reinvestment of the class' distributions from dividend income and capital gains (the profits earned upon the sale of securities that have grown in value, if any) and assuming a constant rate of performance each year. The $10,000 table and the fund's returns do not reflect the deduction of taxes that a shareholder would pay on fund distributions or the redemption of fund shares. During periods of reimbursement by Fidelity, a fund's total return will be greater than it would be had the reimbursement not occurred. How a fund did yesterday is no guarantee of how it will do tomorrow. Returns reflect the conversion of Class B shares to Class A shares after a maximum of seven years.
Average Annual Total Returns
Periods ended July 31, 2011 | Past 1
year | Past 5
years | Life of
fund A |
Class A (incl. 5.75% sales charge) | 16.52% | 0.94% | 10.88% |
Class T (incl. 3.50% sales charge) | 18.97% | 1.16% | 10.88% |
Class B (incl. contingent deferred sales charge) B | 17.69% | 1.02% | 10.95% |
Class C (incl. contingent deferred sales charge) C | 21.69% | 1.37% | 10.79% |
A From September 12, 2002.
B Class B shares' contingent deferred sales charges included in the past one year, past five years, and life of fund total return figures are 5%, 2%, and 0%, respectively.
C Class C shares' contingent deferred sales charges included in the past one year, past five years, and life of fund total return figures are 1%, 0%, and 0%, respectively.
Annual Report
$10,000 Over Life of Fund
Let's say hypothetically that $10,000 was invested in Fidelity Advisor® Real Estate Fund - Class A on September 12, 2002, when the fund started, and the current 5.75% sales charge was paid. The chart shows how the value of your investment would have changed, and also shows how the S&P 500® Index performed over the same period. See the previous page for additional information regarding the performance of Class A.
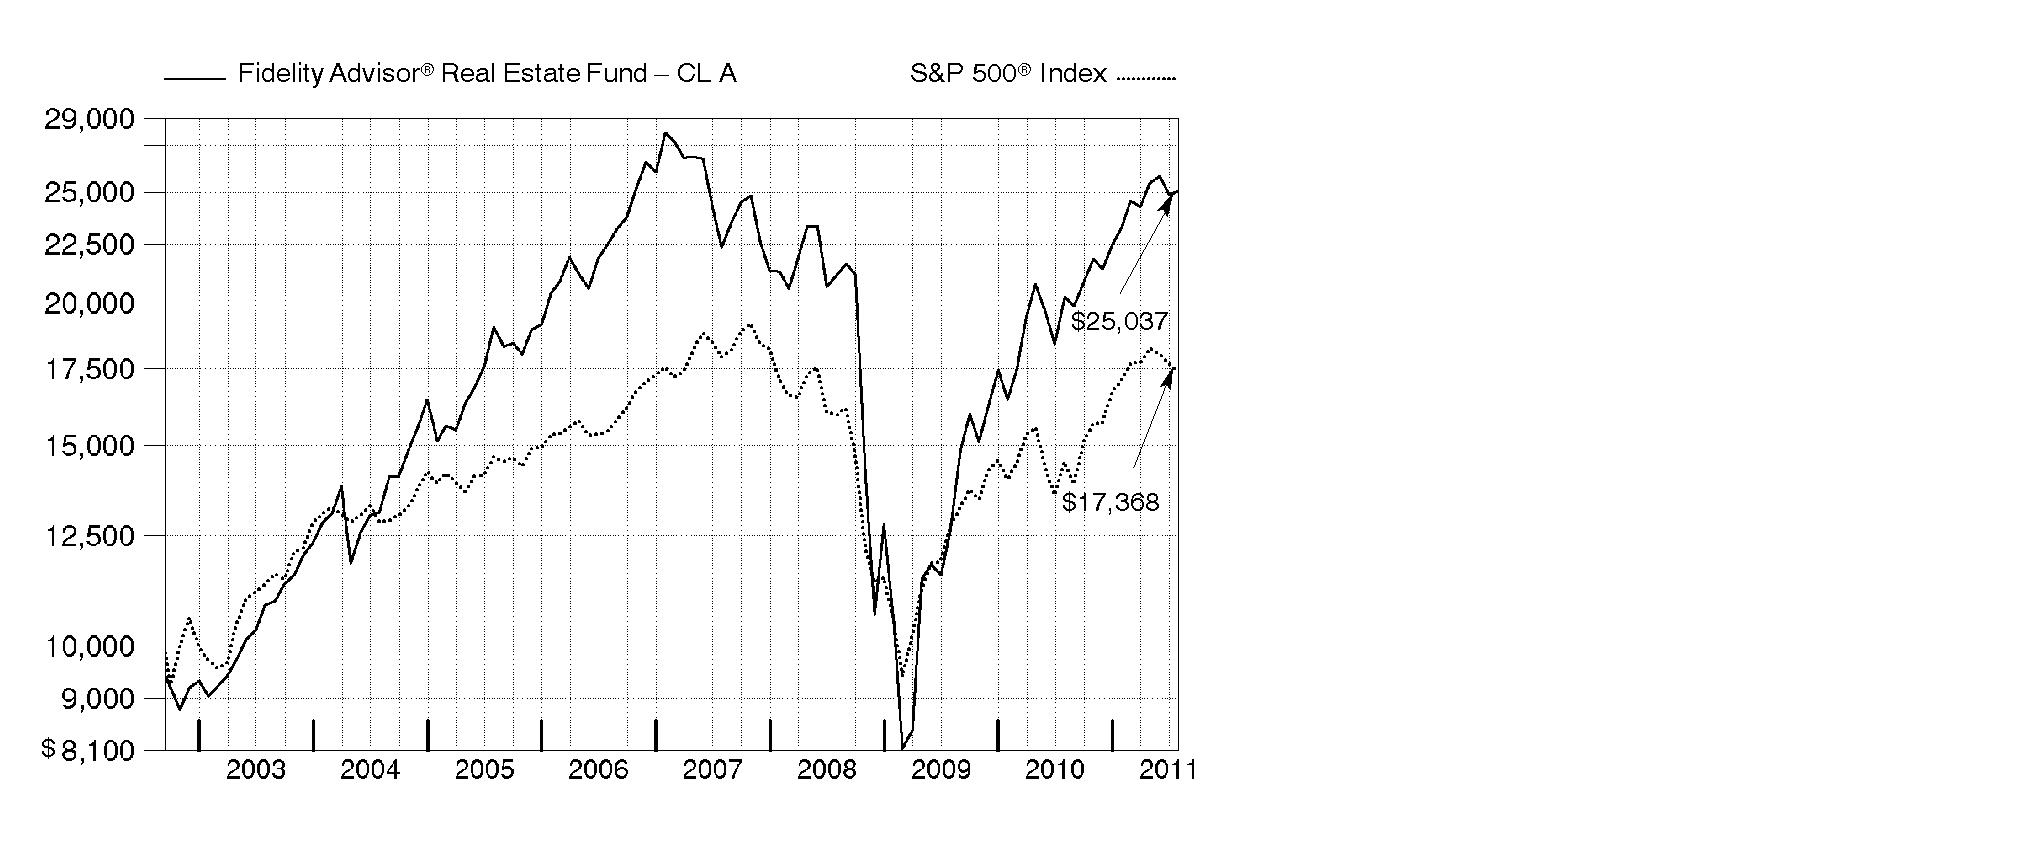
Annual Report
Market Recap: U.S. stocks registered solid double-digit gains for the 12 months ending July 31, 2011, extending a rally that began more than two years earlier. Despite a rough start in August 2010, markets turned positive in September, as increased demand for capital goods and other upbeat indicators trumped investor worry about a U.S. recessionary relapse. The broad market, as measured by the S&P 500® Index, rose 9% that month, its biggest September gain in 71 years. Seven more monthly advances followed, fueled by encouraging corporate earnings and economic activity. However, volatility picked up in the period's latter months, as markets reacted to continued high U.S. unemployment, nagging debt troubles in Europe and looming legislative battles over the federal debt ceiling. May unemployment rose above 9% for the first time in 2011, contributing to a traditional "June swoon" for stocks. Market uncertainty lingered in July, when the S&P 500® posted its second-biggest monthly loss of the period. For the full year, the S&P 500® climbed 19.65%, while the blue-chip-laden Dow Jones Industrial AverageSM rose a comparable 19.09% and the technology-heavy Nasdaq Composite® Index gained 23.40%. On the capitalization spectrum, stocks of mid-cap companies fared best, with the Russell Midcap® Index rising 24.51% and the small-cap Russell 2000® Index adding 23.92%.
Comments from Samuel Wald, Portfolio Manager of Fidelity Advisor® Real Estate Fund: For the year, the fund's Class A, Class T, Class B and Class C shares gained 23.63%, 23.28%, 22.69% and 22.69%, respectively (excluding sales charges), beating the S&P 500 but trailing the 25.23% return of the Dow Jones U.S. Select Real Estate Securities IndexSM. The biggest individual detractor versus the sector benchmark was Digital Realty Trust, an owner and operator of data centers. Digital Realty's shares were flat during a strong market, weighed down by investors' concern about too much supply of data center space. Sunstone Hotel Investors also hurt. The stock was part of a so-called pairs trade with other hotel stocks, meaning I chose to emphasize certain hotels while underweighting others whose performance prospects struck me as more limited. As a group, hotels generally trailed, so overweighting Sunstone hampered the fund's results. Health care-related property companies lagged as a group, and Healthcare Realty Trust and Ventas were notable detractors in the portfolio. On the positive side, industrial REIT ProLogis was a top contributor. The company merged with AMB Property in June 2011. Also, several out-of-benchmark stocks continued to gain significant ground since the depths of the financial crisis in 2008 - including commercial real estate services company CB Richard Ellis Group and Sunrise Senior Living, which operates housing facilities for seniors.
Comments from Samuel Wald, Portfolio Manager of Fidelity Advisor® Real Estate Fund: For the year, the fund's Institutional Class shares gained 23.92%, beating the S&P 500 but trailing the 25.23% return of the Dow Jones U.S. Select Real Estate Securities IndexSM. The biggest individual detractor versus the sector benchmark was Digital Realty Trust, an owner and operator of data centers. Digital Realty's shares were flat during a strong market, weighed down by investors' concern about too much supply of data center space. Sunstone Hotel Investors also hurt. The stock was part of a so-called pairs trade with other hotel stocks, meaning I chose to emphasize certain hotels while underweighting others whose performance prospects struck me as more limited. As a group, hotels generally trailed, so overweighting Sunstone hampered the fund's results. Health care-related property companies lagged as a group, and Healthcare Realty Trust and Ventas were notable detractors in the portfolio. On the positive side, industrial REIT ProLogis was a top contributor. The company merged with AMB Property in June 2011. Also, several out-of-benchmark stocks continued to gain significant ground since the depths of the financial crisis in 2008 - including commercial services real estate company CB Richard Ellis Group, a real estate services company no longer in the portfolio at period end, and Sunrise Senior Living, which operates housing facilities for seniors.
Annual Report
The views expressed above reflect those of the portfolio manager(s) only through the end of the period as stated on the cover of this report and do not necessarily represent the views of Fidelity or any other person in the Fidelity organization. Any such views are subject to change at any time based upon market or other conditions and Fidelity disclaims any responsibility to update such views. These views may not be relied on as investment advice and, because investment decisions for a Fidelity fund are based on numerous factors, may not be relied on as an indication of trading intent on behalf of any Fidelity fund.
Annual Report
Shareholder Expense Example
As a shareholder of the Fund, you incur two types of costs: (1) transaction costs, including sales charges (loads) on purchase payments or redemption proceeds, and (2) ongoing costs, including management fees, distribution and/or service (12b-1) fees and other Fund expenses. This Example is intended to help you understand your ongoing costs (in dollars) of investing in the Fund and to compare these costs with the ongoing costs of investing in other mutual funds.
The Example is based on an investment of $1,000 invested at the beginning of the period and held for the entire period (February 1, 2011 to July 31, 2011).
Actual Expenses
The first line of the accompanying table for each class of the Fund provides information about actual account values and actual expenses. You may use the information in this line, together with the amount you invested, to estimate the expenses that you paid over the period. Simply divide your account value by $1,000.00 (for example, an $8,600 account value divided by $1,000.00 = 8.6), then multiply the result by the number in the first line for a class of the Fund under the heading entitled "Expenses Paid During Period" to estimate the expenses you paid on your account during this period. In addition, the Fund, as a shareholder in the underlying Fidelity Central Funds, will indirectly bear its pro-rata share of the fees and expenses incurred by the underlying Fidelity Central Funds. These fees and expenses are not included in the Fund's annualized expense ratio used to calculate the expense estimate in the table below.
Hypothetical Example for Comparison Purposes
The second line of the accompanying table for each class of the Fund provides information about hypothetical account values and hypothetical expenses based on a Class' actual expense ratio and an assumed rate of return of 5% per year before expenses, which is not the Class' actual return. The hypothetical account values and expenses may not be used to estimate the actual ending account balance or expenses you paid for the period. You may use this information to compare the ongoing costs of investing in the Fund and other funds. To do so, compare this 5% hypothetical example with the 5% hypothetical examples that appear in the shareholder reports of the other funds. In addition, the Fund, as a shareholder in the underlying Fidelity Central Funds, will indirectly bear its pro-rata share of the fees and expenses incurred by the underlying Fidelity Central Funds. These fees and expenses are not included in the Fund's annualized expense ratio used to calculate the expense estimate in the table below.
Please note that the expenses shown in the table are meant to highlight your ongoing costs only and do not reflect any transaction costs. Therefore, the second line of the table is useful in comparing ongoing costs only, and will not help you determine the relative total costs of owning different funds. In addition, if these transactional costs were included, your costs would have been higher.
Annual Report
| Annualized
Expense Ratio | Beginning
Account Value
February 1, 2011 | Ending
Account Value
July 31, 2011 | Expenses Paid
During Period*
February 1, 2011 to July 31, 2011 |
Class A | 1.17% | | | |
Actual | | $ 1,000.00 | $ 1,074.80 | $ 6.02 |
Hypothetical A | | $ 1,000.00 | $ 1,018.99 | $ 5.86 |
Class T | 1.43% | | | |
Actual | | $ 1,000.00 | $ 1,073.60 | $ 7.35 |
Hypothetical A | | $ 1,000.00 | $ 1,017.70 | $ 7.15 |
Class B | 1.92% | | | |
Actual | | $ 1,000.00 | $ 1,071.20 | $ 9.86 |
Hypothetical A | | $ 1,000.00 | $ 1,015.27 | $ 9.59 |
Class C | 1.92% | | | |
Actual | | $ 1,000.00 | $ 1,071.30 | $ 9.86 |
Hypothetical A | | $ 1,000.00 | $ 1,015.27 | $ 9.59 |
Institutional Class | .90% | | | |
Actual | | $ 1,000.00 | $ 1,076.20 | $ 4.63 |
Hypothetical A | | $ 1,000.00 | $ 1,020.33 | $ 4.51 |
A 5% return per year before expenses
* Expenses are equal to each Class' annualized expense ratio, multiplied by the average account value over the period, multiplied by 181/365 (to reflect the one-half year period).
Annual Report
Investment Changes (Unaudited)
Top Ten Stocks as of July 31, 2011 |
| % of fund's
net assets | % of fund's net assets
6 months ago |
Simon Property Group, Inc. | 9.4 | 10.0 |
Public Storage | 7.3 | 7.4 |
Ventas, Inc. | 6.8 | 5.5 |
Prologis, Inc. | 5.0 | 5.4 |
Boston Properties, Inc. | 4.7 | 4.0 |
SL Green Realty Corp. | 4.5 | 4.3 |
Alexandria Real Estate Equities, Inc. | 4.0 | 3.7 |
Essex Property Trust, Inc. | 3.9 | 2.9 |
Equity Residential (SBI) | 3.6 | 3.1 |
Mid-America Apartment Communities, Inc. | 3.4 | 3.2 |
| 52.6 | |
Top Five REIT Sectors as of July 31, 2011 |
| % of fund's
net assets | % of fund's net assets
6 months ago |
REITs - Office Buildings | 18.1 | 15.2 |
REITs - Apartments | 15.8 | 14.7 |
REITs - Malls | 15.2 | 14.9 |
REITs - Industrial Buildings | 13.5 | 13.6 |
REITs - Health Care Facilities | 11.0 | 10.6 |
Asset Allocation (% of fund's net assets) |
As of July 31, 2011* | As of January 31, 2011** |
 | Stocks 97.3% | | | Stocks 97.6% | |
 | Convertible
Securities 0.1% | | | Convertible
Securities 0.2% | |
 | Short-Term
Investments and
Net Other Assets 2.6% | | | Short-Term
Investments and
Net Other Assets 2.2% | |
* Foreign investments | 1.1% | | ** Foreign investments | 1.2% | |

Annual Report
Investments July 31, 2011
Showing Percentage of Net Assets
Common Stocks - 97.3% |
| Shares | | Value |
COMMERCIAL SERVICES & SUPPLIES - 1.0% |
Security & Alarm Services - 1.0% |
The Geo Group, Inc. (a) | 245,678 | | $ 5,110,102 |
HEALTH CARE PROVIDERS & SERVICES - 3.6% |
Health Care Facilities - 3.6% |
Brookdale Senior Living, Inc. (a) | 294,151 | | 6,291,890 |
Capital Senior Living Corp. (a) | 231,550 | | 2,035,325 |
Emeritus Corp. (a)(d) | 344,465 | | 6,768,737 |
Sunrise Senior Living, Inc. (a)(d) | 287,892 | | 2,539,207 |
TOTAL HEALTH CARE FACILITIES | | 17,635,159 |
REAL ESTATE INVESTMENT TRUSTS - 89.3% |
REITs - Apartments - 15.8% |
AvalonBay Communities, Inc. | 32,223 | | 4,324,004 |
Camden Property Trust (SBI) | 21,664 | | 1,453,004 |
Education Realty Trust, Inc. | 1,029,911 | | 9,042,619 |
Equity Residential (SBI) | 281,355 | | 17,393,366 |
Essex Property Trust, Inc. (d) | 137,464 | | 19,294,447 |
Mid-America Apartment Communities, Inc. | 234,802 | | 16,621,634 |
Post Properties, Inc. | 213,982 | | 9,072,837 |
TOTAL REITS - APARTMENTS | | 77,201,911 |
REITs - Health Care Facilities - 11.0% |
HCP, Inc. | 259,711 | | 9,539,185 |
Health Care REIT, Inc. (d) | 42,900 | | 2,264,262 |
Healthcare Realty Trust, Inc. | 443,169 | | 8,686,112 |
Ventas, Inc. | 616,833 | | 33,389,170 |
TOTAL REITS - HEALTH CARE FACILITIES | | 53,878,729 |
REITs - Hotels - 5.6% |
Chesapeake Lodging Trust | 395,498 | | 6,525,717 |
DiamondRock Hospitality Co. | 703,806 | | 7,192,897 |
Host Hotels & Resorts, Inc. | 295,853 | | 4,689,270 |
Summit Hotel Properties, Inc. | 66,000 | | 744,480 |
Sunstone Hotel Investors, Inc. (a) | 922,357 | | 8,218,201 |
TOTAL REITS - HOTELS | | 27,370,565 |
Common Stocks - continued |
| Shares | | Value |
REAL ESTATE INVESTMENT TRUSTS - CONTINUED |
REITs - Industrial Buildings - 13.5% |
DCT Industrial Trust, Inc. | 715,400 | | $ 3,877,468 |
Prologis, Inc. | 681,034 | | 24,265,241 |
Public Storage | 300,541 | | 35,953,720 |
Stag Industrial, Inc. | 151,500 | | 1,861,935 |
TOTAL REITS - INDUSTRIAL BUILDINGS | | 65,958,364 |
REITs - Malls - 15.2% |
CBL & Associates Properties, Inc. | 752,440 | | 13,363,334 |
Simon Property Group, Inc. | 381,812 | | 46,012,165 |
The Macerich Co. | 285,293 | | 15,157,617 |
TOTAL REITS - MALLS | | 74,533,116 |
REITs - Management/Investment - 3.0% |
Digital Realty Trust, Inc. (d) | 214,150 | | 13,108,122 |
Lexington Corporate Properties Trust | 206,500 | | 1,734,600 |
TOTAL REITS - MANAGEMENT/INVESTMENT | | 14,842,722 |
REITs - Office Buildings - 18.1% |
Alexandria Real Estate Equities, Inc. | 238,460 | | 19,553,720 |
Boston Properties, Inc. | 214,649 | | 23,044,717 |
Brandywine Realty Trust (SBI) | 400,100 | | 4,797,199 |
Douglas Emmett, Inc. | 541,700 | | 10,834,000 |
Highwoods Properties, Inc. (SBI) | 234,356 | | 8,068,877 |
SL Green Realty Corp. | 267,766 | | 21,962,167 |
TOTAL REITS - OFFICE BUILDINGS | | 88,260,680 |
REITs - Shopping Centers - 7.1% |
Acadia Realty Trust (SBI) | 474,500 | | 9,959,755 |
Developers Diversified Realty Corp. | 182,900 | | 2,672,169 |
Excel Trust, Inc. | 179,400 | | 2,057,718 |
Glimcher Realty Trust | 230,082 | | 2,266,308 |
Kimco Realty Corp. | 278,311 | | 5,296,258 |
Common Stocks - continued |
| Shares | | Value |
REAL ESTATE INVESTMENT TRUSTS - CONTINUED |
REITs - Shopping Centers - continued |
Kite Realty Group Trust | 396,646 | | $ 1,800,773 |
Vornado Realty Trust | 115,088 | | 10,766,482 |
TOTAL REITS - SHOPPING CENTERS | | 34,819,463 |
TOTAL REAL ESTATE INVESTMENT TRUSTS | | 436,865,550 |
REAL ESTATE MANAGEMENT & DEVELOPMENT - 3.4% |
Diversified Real Estate Activities - 0.6% |
The St. Joe Co. (a)(d) | 155,098 | | 2,746,786 |
Real Estate Operating Companies - 2.1% |
Brookfield Properties Corp. | 290,130 | | 5,511,680 |
Forest City Enterprises, Inc. Class A (a) | 275,367 | | 4,959,360 |
TOTAL REAL ESTATE OPERATING COMPANIES | | 10,471,040 |
Real Estate Services - 0.7% |
Jones Lang LaSalle, Inc. | 41,100 | | 3,498,432 |
TOTAL REAL ESTATE MANAGEMENT & DEVELOPMENT | | 16,716,258 |
TOTAL COMMON STOCKS (Cost $407,650,085) | 476,327,069 |
Convertible Preferred Stocks - 0.1% |
| | | |
REAL ESTATE MANAGEMENT & DEVELOPMENT - 0.1% |
Real Estate Services - 0.1% |
Grubb & Ellis Co.: | | | |
12.00% (e) (Cost $800,000) | 8,000 | | 421,200 |
Money Market Funds - 7.0% |
| Shares | | Value |
Fidelity Cash Central Fund, 0.14% (b) | 11,317,362 | | $ 11,317,362 |
Fidelity Securities Lending Cash Central Fund, 0.15% (b)(c) | 22,777,989 | | 22,777,989 |
TOTAL MONEY MARKET FUNDS (Cost $34,095,351) | 34,095,351 |
TOTAL INVESTMENT PORTFOLIO - 104.4% (Cost $442,545,436) | | 510,843,620 |
NET OTHER ASSETS (LIABILITIES) - (4.4)% | | (21,477,548) |
NET ASSETS - 100% | $ 489,366,072 |
Legend |
(a) Non-income producing |
(b) Affiliated fund that is available only to investment companies and other accounts managed by Fidelity Investments. The rate quoted is the annualized seven-day yield of the fund at period end. A complete unaudited listing of the fund's holdings as of its most recent quarter end is available upon request. In addition, each Fidelity Central Fund's financial statements, which are not covered by the Fund's Report of Independent Registered Public Accounting Firm, are available on the SEC's website or upon request. |
(c) Investment made with cash collateral received from securities on loan. |
(d) Security or a portion of the security is on loan at period end. |
(e) Security exempt from registration under Rule 144A of the Securities Act of 1933. These securities may be resold in transactions exempt from registration, normally to qualified institutional buyers. At the end of the period, the value of these securities amounted to $421,200 or 0.1% of net assets. |
Affiliated Central Funds |
Information regarding fiscal year to date income earned by the Fund from investments in Fidelity Central Funds is as follows: |
Fund | Income earned |
Fidelity Cash Central Fund | $ 18,847 |
Fidelity Securities Lending Cash Central Fund | 260,883 |
Total | $ 279,730 |
Other Information |
The following is a summary of the inputs used, as of July 31, 2011, involving the Fund's assets and liabilities carried at fair value. The inputs or methodology used for valuing securities may not be an indication of the risk associated with investing in those securities. For more information on valuation inputs, and their aggregation into the levels used in the table below, please refer to the Security Valuation section in the accompanying Notes to Financial Statements. |
Valuation Inputs at Reporting Date: |
Description | Total | Level 1 | Level 2 | Level 3 |
Investments in Securities: | | | | |
Common Stocks | $ 476,327,069 | $ 476,327,069 | $ - | $ - |
Convertible Preferred Stocks | 421,200 | - | 421,200 | - |
Money Market Funds | 34,095,351 | 34,095,351 | - | - |
Total Investments in Securities: | $ 510,843,620 | $ 510,422,420 | $ 421,200 | $ - |
See accompanying notes which are an integral part of the financial statements.
Annual Report
Statement of Assets and Liabilities
| July 31, 2011 |
| | |
Assets | | |
Investment in securities, at value (including securities loaned of $22,368,418) - See accompanying schedule: Unaffiliated issuers (cost $408,450,085) | $ 476,748,269 | |
Fidelity Central Funds (cost $34,095,351) | 34,095,351 | |
Total Investments (cost $442,545,436) | | $ 510,843,620 |
Receivable for investments sold | | 5,004,229 |
Receivable for fund shares sold | | 719,046 |
Dividends receivable | | 72,514 |
Distributions receivable from Fidelity Central Funds | | 41,804 |
Other receivables | | 14,051 |
Total assets | | 516,695,264 |
| | |
Liabilities | | |
Payable for investments purchased | $ 2,281,382 | |
Payable for fund shares redeemed | 1,745,017 | |
Accrued management fee | 231,429 | |
Distribution and service plan fees payable | 120,136 | |
Other affiliated payables | 133,251 | |
Other payables and accrued expenses | 39,988 | |
Collateral on securities loaned, at value | 22,777,989 | |
Total liabilities | | 27,329,192 |
| | |
Net Assets | | $ 489,366,072 |
Net Assets consist of: | | |
Paid in capital | | $ 419,209,155 |
Undistributed net investment income | | 48,238 |
Accumulated undistributed net realized gain (loss) on investments and foreign currency transactions | | 1,810,495 |
Net unrealized appreciation (depreciation) on investments | | 68,298,184 |
Net Assets | | $ 489,366,072 |
See accompanying notes which are an integral part of the financial statements.
Annual Report
Statement of Assets and Liabilities - continued
| July 31, 2011 |
| | |
Calculation of Maximum Offering Price Class A:
Net Asset Value and redemption price per share ($178,977,617 ÷ 9,810,123 shares) | | $ 18.24 |
| | |
Maximum offering price per share (100/94.25 of $18.24) | | $ 19.35 |
Class T:
Net Asset Value and redemption price per share ($76,785,097 ÷ 4,209,422 shares) | | $ 18.24 |
| | |
Maximum offering price per share (100/96.50 of $18.24) | | $ 18.90 |
Class B:
Net Asset Value and offering price per share ($11,542,016 ÷ 639,326 shares)A | | $ 18.05 |
| | |
Class C:
Net Asset Value and offering price per share ($47,406,461 ÷ 2,629,781 shares)A | | $ 18.03 |
| | |
Institutional Class:
Net Asset Value, offering price and redemption price per share ($174,654,881 ÷ 9,511,305 shares) | | $ 18.36 |
A Redemption price per share is equal to net asset value less any applicable contingent deferred sales charge.
See accompanying notes which are an integral part of the financial statements.
Annual Report
Financial Statements - continued
Statement of Operations
| Year ended July 31, 2011 |
| | |
Investment Income | | |
Dividends | | $ 8,066,250 |
Interest | | 18,082 |
Income from Fidelity Central Funds | | 279,730 |
Total income | | 8,364,062 |
| | |
Expenses | | |
Management fee | $ 2,499,250 | |
Transfer agent fees | 1,333,250 | |
Distribution and service plan fees | 1,243,792 | |
Accounting and security lending fees | 179,190 | |
Custodian fees and expenses | 32,852 | |
Independent trustees' compensation | 2,343 | |
Registration fees | 91,738 | |
Audit | 47,710 | |
Legal | 1,623 | |
Interest | 94 | |
Miscellaneous | 4,692 | |
Total expenses before reductions | 5,436,534 | |
Expense reductions | (31,298) | 5,405,236 |
Net investment income (loss) | | 2,958,826 |
Realized and Unrealized Gain (Loss) Net realized gain (loss) on: | | |
Investment securities: | | |
Unaffiliated issuers | 54,421,902 | |
Foreign currency transactions | (7,617) | |
Total net realized gain (loss) | | 54,414,285 |
Change in net unrealized appreciation (depreciation) on investment securities | | 34,015,366 |
Net gain (loss) | | 88,429,651 |
Net increase (decrease) in net assets resulting from operations | | $ 91,388,477 |
See accompanying notes which are an integral part of the financial statements.
Annual Report
Statement of Changes in Net Assets
| Year ended
July 31,
2011 | Year ended
July 31,
2010 |
Increase (Decrease) in Net Assets | | |
Operations | | |
Net investment income (loss) | $ 2,958,826 | $ 3,902,914 |
Net realized gain (loss) | 54,414,285 | 36,224,187 |
Change in net unrealized appreciation (depreciation) | 34,015,366 | 74,426,342 |
Net increase (decrease) in net assets resulting
from operations | 91,388,477 | 114,553,443 |
Distributions to shareholders from net investment income | (3,454,847) | (3,478,958) |
Share transactions - net increase (decrease) | 12,993,567 | 98,330,995 |
Total increase (decrease) in net assets | 100,927,197 | 209,405,480 |
| | |
Net Assets | | |
Beginning of period | 388,438,875 | 179,033,395 |
End of period (including undistributed net investment income of $48,238 and undistributed net investment income of $744,500, respectively) | $ 489,366,072 | $ 388,438,875 |
See accompanying notes which are an integral part of the financial statements.
Annual Report
Financial Highlights - Class A
Years ended July 31, | 2011 | 2010 | 2009 | 2008 | 2007 |
Selected Per-Share Data | | | | | |
Net asset value, beginning of period | $ 14.88 | $ 9.41 | $ 16.39 | $ 18.67 | $ 20.34 |
Income from Investment Operations | | | | | |
Net investment income (loss) C | .12 | .19 | .27 | .30 | .18 |
Net realized and unrealized gain (loss) | 3.37 | 5.46 | (6.86) | (1.24) | (.17) |
Total from investment operations | 3.49 | 5.65 | (6.59) | (.94) | .01 |
Distributions from net investment income | (.13) | (.18) | (.36) | (.26) | (.18) |
Distributions from net realized gain | - | - | (.03) | (1.09) | (1.50) |
Total distributions | (.13) | (.18) | (.39) | (1.34) G | (1.68) |
Net asset value, end of period | $ 18.24 | $ 14.88 | $ 9.41 | $ 16.39 | $ 18.67 |
Total Return A,B | 23.63% | 60.38% | (40.19)% | (5.66)% | (.65)% |
Ratios to Average Net Assets D,F | | | | |
Expenses before reductions | 1.19% | 1.23% | 1.27% | 1.22% | 1.25% |
Expenses net of fee waivers, if any | 1.19% | 1.23% | 1.25% | 1.22% | 1.25% |
Expenses net of all reductions | 1.18% | 1.22% | 1.25% | 1.21% | 1.25% |
Net investment income (loss) | .69% | 1.45% | 2.73% | 1.71% | .81% |
Supplemental Data | | | | | |
Net assets, end of period (000 omitted) | $ 178,978 | $ 117,929 | $ 62,422 | $ 109,442 | $ 117,831 |
Portfolio turnover rate E | 63% | 60% | 98% | 86% | 84% |
A Total returns would have been lower if certain expenses had not been reduced during the applicable periods shown.
B Total returns do not include the effect of the sales charges.
C Calculated based on average shares outstanding during the period.
D Fees and expenses of any underlying Fidelity Central Funds are not included in the Fund's expense ratio. The Fund indirectly bears its proportionate share of the expenses of any underlying Fidelity Central Funds.
E Amount does not include the portfolio activity of any underlying Fidelity Central Funds.
F Expense ratios reflect operating expenses of the class. Expenses before reductions do not reflect amounts reimbursed by the investment adviser or reductions from brokerage service arrangements or reductions from other expense offset arrangements and do not represent the amount paid by the class during periods when reimbursements or reductions occur. Expenses net of fee waivers reflect expenses after reimbursement by the investment adviser but prior to reductions from brokerage service arrangements or other expense offset arrangements. Expenses net of all reductions represent the net expenses paid by the class.
G Total distributions of $1.34 per share is comprised of distributions from net investment income of $.256 and distributions from net realized gain of $1.085 per share.
See accompanying notes which are an integral part of the financial statements.
Annual Report
Financial Highlights - Class T
Years ended July 31, | 2011 | 2010 | 2009 | 2008 | 2007 |
Selected Per-Share Data | | | | | |
Net asset value, beginning of period | $ 14.90 | $ 9.42 | $ 16.40 | $ 18.64 | $ 20.31 |
Income from Investment Operations | | | | | |
Net investment income (loss) C | .07 | .15 | .25 | .26 | .12 |
Net realized and unrealized gain (loss) | 3.38 | 5.47 | (6.87) | (1.24) | (.16) |
Total from investment operations | 3.45 | 5.62 | (6.62) | (.98) | (.04) |
Distributions from net investment income | (.11) | (.14) | (.33) | (.17) | (.13) |
Distributions from net realized gain | - | - | (.03) | (1.09) | (1.50) |
Total distributions | (.11) | (.14) | (.36) | (1.26) G | (1.63) |
Net asset value, end of period | $ 18.24 | $ 14.90 | $ 9.42 | $ 16.40 | $ 18.64 |
Total Return A,B | 23.28% | 60.02% | (40.33)% | (5.88)% | (.89)% |
Ratios to Average Net Assets D,F | | | | | |
Expenses before reductions | 1.44% | 1.49% | 1.54% | 1.47% | 1.50% |
Expenses net of fee waivers, if any | 1.44% | 1.49% | 1.50% | 1.47% | 1.50% |
Expenses net of all reductions | 1.44% | 1.48% | 1.50% | 1.47% | 1.49% |
Net investment income (loss) | .43% | 1.19% | 2.48% | 1.45% | .57% |
Supplemental Data | | | | | |
Net assets, end of period (000 omitted) | $ 76,785 | $ 59,529 | $ 40,276 | $ 81,938 | $ 100,621 |
Portfolio turnover rate E | 63% | 60% | 98% | 86% | 84% |
A Total returns would have been lower if certain expenses had not been reduced during the applicable periods shown.
B Total returns do not include the effect of the sales charges.
C Calculated based on average shares outstanding during the period.
D Fees and expenses of any underlying Fidelity Central Funds are not included in the Fund's expense ratio. The Fund indirectly bears its proportionate share of the expenses of any underlying Fidelity Central Funds.
E Amount does not include the portfolio activity of any underlying Fidelity Central Funds.
F Expense ratios reflect operating expenses of the class. Expenses before reductions do not reflect amounts reimbursed by the investment adviser or reductions from brokerage service arrangements or reductions from other expense offset arrangements and do not represent the amount paid by the class during periods when reimbursements or reductions occur. Expenses net of fee waivers reflect expenses after reimbursement by the investment adviser but prior to reductions from brokerage service arrangements or other expense offset arrangements. Expenses net of all reductions represent the net expenses paid by the class.
G Total distributions of $1.26 per share is comprised of distributions from net investment income of $.173 and distributions from net realized gain of $1.085 per share.
See accompanying notes which are an integral part of the financial statements.
Annual Report
Financial Highlights - Class B
Years ended July 31, | 2011 | 2010 | 2009 | 2008 | 2007 |
Selected Per-Share Data | | | | | |
Net asset value, beginning of period | $ 14.77 | $ 9.35 | $ 16.26 | $ 18.51 | $ 20.19 |
Income from Investment Operations | | | | | |
Net investment income (loss) C | (.01) | .09 | .20 | .17 | .01 |
Net realized and unrealized gain (loss) | 3.35 | 5.42 | (6.81) | (1.23) | (.16) |
Total from investment operations | 3.34 | 5.51 | (6.61) | (1.06) | (.15) |
Distributions from net investment income | (.06) | (.09) | (.27) | (.10) | (.05) |
Distributions from net realized gain | - | - | (.03) | (1.09) | (1.48) |
Total distributions | (.06) | (.09) | (.30) | (1.19) G | (1.53) |
Net asset value, end of period | $ 18.05 | $ 14.77 | $ 9.35 | $ 16.26 | $ 18.51 |
Total Return A,B | 22.69% | 59.14% | (40.60)% | (6.37)% | (1.45)% |
Ratios to Average Net Assets D,F | | | | | |
Expenses before reductions | 1.94% | 1.98% | 2.04% | 1.96% | 2.02% |
Expenses net of fee waivers, if any | 1.94% | 1.98% | 2.00% | 1.96% | 2.00% |
Expenses net of all reductions | 1.93% | 1.97% | 2.00% | 1.96% | 2.00% |
Net investment income (loss) | (.07)% | .70% | 1.98% | .96% | .07% |
Supplemental Data | | | | | |
Net assets, end of period (000 omitted) | $ 11,542 | $ 12,078 | $ 7,933 | $ 16,879 | $ 25,114 |
Portfolio turnover rate E | 63% | 60% | 98% | 86% | 84% |
A Total returns would have been lower if certain expenses had not been reduced during the applicable periods shown.
B Total returns do not include the effect of the contingent deferred sales charge.
C Calculated based on average shares outstanding during the period.
D Fees and expenses of any underlying Fidelity Central Funds are not included in the Fund's expense ratio. The Fund indirectly bears its proportionate share of the expenses of any underlying Fidelity Central Funds.
E Amount does not include the portfolio activity of any underlying Fidelity Central Funds.
F Expense ratios reflect operating expenses of the class. Expenses before reductions do not reflect amounts reimbursed by the investment adviser or reductions from brokerage service arrangements or reductions from other expense offset arrangements and do not represent the amount paid by the class during periods when reimbursements or reductions occur. Expenses net of fee waivers reflect expenses after reimbursement by the investment adviser but prior to reductions from brokerage service arrangements or other expense offset arrangements. Expenses net of all reductions represent the net expenses paid by the class.
G Total distributions of $1.19 per share is comprised of distributions from net investment income of $.102 and distributions from net realized gain of $1.085 per share.
See accompanying notes which are an integral part of the financial statements.
Annual Report
Financial Highlights - Class C
Years ended July 31, | 2011 | 2010 | 2009 | 2008 | 2007 |
Selected Per-Share Data | | | | | |
Net asset value, beginning of period | $ 14.76 | $ 9.34 | $ 16.26 | $ 18.51 | $ 20.21 |
Income from Investment Operations | | | | | |
Net investment income (loss) C | (.01) | .09 | .19 | .17 | .01 |
Net realized and unrealized gain (loss) | 3.35 | 5.43 | (6.81) | (1.23) | (.16) |
Total from investment operations | 3.34 | 5.52 | (6.62) | (1.06) | (.15) |
Distributions from net investment income | (.07) | (.10) | (.27) | (.11) | (.05) |
Distributions from net realized gain | - | - | (.03) | (1.09) | (1.50) |
Total distributions | (.07) | (.10) | (.30) | (1.19) G | (1.55) |
Net asset value, end of period | $ 18.03 | $ 14.76 | $ 9.34 | $ 16.26 | $ 18.51 |
Total Return A,B | 22.69% | 59.28% | (40.64)% | (6.35)% | (1.45)% |
Ratios to Average Net Assets D,F | | | | | |
Expenses before reductions | 1.94% | 1.98% | 2.01% | 1.96% | 2.01% |
Expenses net of fee waivers, if any | 1.94% | 1.98% | 2.00% | 1.96% | 2.00% |
Expenses net of all reductions | 1.93% | 1.97% | 2.00% | 1.96% | 2.00% |
Net investment income (loss) | (.07)% | .71% | 1.98% | .96% | .06% |
Supplemental Data | | | | | |
Net assets, end of period (000 omitted) | $ 47,406 | $ 31,204 | $ 13,226 | $ 24,984 | $ 36,854 |
Portfolio turnover rate E | 63% | 60% | 98% | 86% | 84% |
A Total returns would have been lower if certain expenses had not been reduced during the applicable periods shown.
B Total returns do not include the effect of the contingent deferred sales charge.
C Calculated based on average shares outstanding during the period.
D Fees and expenses of any underlying Fidelity Central Funds are not included in the Fund's expense ratio. The Fund indirectly bears its proportionate share of the expenses of any underlying Fidelity Central Funds.
E Amount does not include the portfolio activity of any underlying Fidelity Central Funds.
F Expense ratios reflect operating expenses of the class. Expenses before reductions do not reflect amounts reimbursed by the investment adviser or reductions from brokerage service arrangements or reductions from other expense offset arrangements and do not represent the amount paid by the class during periods when reimbursements or reductions occur. Expenses net of fee waivers reflect expenses after reimbursement by the investment adviser but prior to reductions from brokerage service arrangements or other expense offset arrangements. Expenses net of all reductions represent the net expenses paid by the class.
G Total distributions of $1.19 per share is comprised of distributions from net investment income of $.106 and distributions from net realized gain of $1.085 per share.
See accompanying notes which are an integral part of the financial statements.
Annual Report
Financial Highlights - Institutional Class
Years ended July 31, | 2011 | 2010 | 2009 | 2008 | 2007 |
Selected Per-Share Data | | | | | |
Net asset value, beginning of period | $ 14.96 | $ 9.46 | $ 16.47 | $ 18.80 | $ 20.47 |
Income from Investment Operations | | | | | |
Net investment income (loss) B | .16 | .23 | .30 | .34 | .24 |
Net realized and unrealized gain (loss) | 3.39 | 5.47 | (6.90) | (1.23) | (.17) |
Total from investment operations | 3.55 | 5.70 | (6.60) | (.89) | .07 |
Distributions from net investment income | (.15) | (.20) | (.38) | (.35) | (.24) |
Distributions from net realized gain | - | - | (.03) | (1.09) | (1.50) |
Total distributions | (.15) | (.20) | (.41) | (1.44) F | (1.74) |
Net asset value, end of period | $ 18.36 | $ 14.96 | $ 9.46 | $ 16.47 | $ 18.80 |
Total Return A | 23.92% | 60.75% | (40.03)% | (5.39)% | (.37)% |
Ratios to Average Net Assets C,E | | | | | |
Expenses before reductions | .93% | .97% | 1.01% | .95% | .98% |
Expenses net of fee waivers, if any | .93% | .97% | 1.00% | .95% | .98% |
Expenses net of all reductions | .92% | .96% | 1.00% | .95% | .97% |
Net investment income (loss) | .94% | 1.71% | 2.98% | 1.97% | 1.09% |
Supplemental Data | | | | | |
Net assets, end of period (000 omitted) | $ 174,655 | $ 167,699 | $ 55,177 | $ 72,780 | $ 12,259 |
Portfolio turnover rate D | 63% | 60% | 98% | 86% | 84% |
A Total returns would have been lower if certain expenses had not been reduced during the applicable periods shown.
B Calculated based on average shares outstanding during the period.
C Fees and expenses of any underlying Fidelity Central Funds are not included in the Fund's expense ratio. The Fund indirectly bears its proportionate share of the expenses of any underlying Fidelity Central Funds.
D Amount does not include the portfolio activity of any underlying Fidelity Central Funds.
E Expense ratios reflect operating expenses of the class. Expenses before reductions do not reflect amounts reimbursed by the investment adviser or reductions from brokerage service arrangements or reductions from other expense offset arrangements and do not represent the amount paid by the class during periods when reimbursements or reductions occur. Expenses net of fee waivers reflect expenses after reimbursement by the investment adviser but prior to reductions from brokerage service arrangements or other expense offset arrangements. Expenses net of all reductions represent the net expenses paid by the class.
F Total distributions of $1.44 per share is comprised of distributions from net investment income of $.352 and distributions from net realized gain of $1.085 per share.
See accompanying notes which are an integral part of the financial statements.
Annual Report
Notes to Financial Statements
For the period ended July 31, 2011
1. Organization.
Fidelity Advisor Real Estate Fund (the Fund) is a non-diversified fund of Fidelity Advisor Series VII (the Trust) and is authorized to issue an unlimited number of shares. The Trust is registered under the Investment Company Act of 1940, as amended (the 1940 Act), as an open-end management investment company organized as a Massachusetts business trust. The Fund offers Class A, Class T, Class C, and Institutional Class shares, each of which, along with Class B shares, has equal rights as to assets and voting privileges. Effective after the close of business on September 1, 2010, Class B shares were closed to new accounts and additional purchases, except for exchanges and reinvestments, by existing shareholders. Each class has exclusive voting rights with respect to matters that affect that class. Class B shares will automatically convert to Class A shares after a holding period of seven years from the initial date of purchase. Investment income, realized and unrealized capital gains and losses, the common expenses of the Fund, and certain fund-level expense reductions, if any, are allocated on a pro-rata basis to each class based on the relative net assets of each class to the total net assets of the Fund. Each class differs with respect to transfer agent and distribution and service plan fees incurred. Certain expense reductions may also differ by class.
2. Investments in Fidelity Central Funds.
The Fund invests in Fidelity Central Funds, which are open-end investment companies available only to other investment companies and accounts managed by Fidelity Management & Research Company (FMR) and its affiliates. The Fund's Schedule of Investments lists each of the Fidelity Central Funds held as of period end, if any, as an investment of the Fund, but does not include the underlying holdings of each Fidelity Central Fund. As an Investing Fund, the Fund indirectly bears its proportionate share of the expenses of the underlying Fidelity Central Funds.
The Money Market Central Funds seek preservation of capital and current income and are managed by Fidelity Investments Money Management, Inc. (FIMM), an affiliate of FMR.
A complete unaudited list of holdings for each Fidelity Central Fund is available upon request or at the Securities and Exchange Commission (the SEC) web site at www.sec.gov. In addition, the financial statements of the Fidelity Central Funds, which are not covered by the Fund's Report of Independent Registered Public Accounting Firm, are available on the SEC web site or upon request.
3. Significant Accounting Policies.
The financial statements have been prepared in conformity with accounting principles generally accepted in the United States of America (GAAP), which require management to make certain estimates and assumptions at the date of the financial statements.
Annual Report
Notes to Financial Statements - continued
3. Significant Accounting Policies - continued
Actual results could differ from those estimates. Subsequent events, if any, through the date that the financial statements were issued have been evaluated in the preparation of the financial statements. The following summarizes the significant accounting policies of the Fund:
Security Valuation. Investments are valued as of 4:00 p.m. Eastern time on the last calendar day of the period. The Fund uses independent pricing services approved by the Board of Trustees to value its investments. When current market prices or quotations are not readily available or reliable, valuations may be determined in good faith in accordance with procedures adopted by the Board of Trustees. Factors used in determining value may include market or security specific events. The frequency with which these procedures are used cannot be predicted and they may be utilized to a significant extent. The value used for net asset value (NAV) calculation under these procedures may differ from published prices for the same securities.
The Fund categorizes the inputs to valuation techniques used to value its investments into a disclosure hierarchy consisting of three levels as shown below:
Level 1 - quoted prices in active markets for identical investments
Level 2 - other significant observable inputs (including quoted prices for similar investments, interest rates, prepayment speeds, etc.)
Level 3 - unobservable inputs (including the Fund's own assumptions based on the best information available)
Changes in valuation techniques may result in transfers in or out of an assigned level within the disclosure hierarchy. The aggregate value of investments by input level, as of July 31, 2011, is included at the end of the Fund's Schedule of Investments. Valuation techniques used to value the Fund's investments by major category are as follows:
Equity securities, including restricted securities, for which market quotations are readily available, are valued at the last reported sale price or official closing price as reported by an independent pricing service on the primary market or exchange on which they are traded and are categorized as Level 1 in the hierarchy. In the event there were no sales during the day or closing prices are not available, securities are valued at the last quoted bid price or may be valued using the last available price and are generally categorized as Level 2 in the hierarchy. For foreign equity securities, when significant market or security specific events arise, comparisons to the valuation of American Depositary Receipts (ADRs), futures contracts, Exchange-traded funds (ETFs) and certain indexes as well as quoted prices for similar securities are used and are categorized as Level 2 in the hierarchy in these circumstances. Utilizing these techniques may result in transfers between
Annual Report
3. Significant Accounting Policies - continued
Security Valuation - continued
Level 1 and Level 2. For restricted equity securities and private placements where observable inputs are limited, assumptions about market activity and risk are used and are categorized as Level 3 in the hierarchy.
Investments in open-end mutual funds, including other Fidelity Central Funds, are valued at their closing net asset value each business day and are categorized as Level 1 in the hierarchy.
Foreign Currency. The Fund may use foreign currency contracts to facilitate transactions in foreign-denominated securities. Gains and losses from these transactions may arise from changes in the value of the foreign currency or if the counterparties do not perform under the contracts' terms.
Foreign-denominated assets, including investment securities, and liabilities are translated into U.S. dollars at the exchange rate at period end. Purchases and sales of investment securities, income and dividends received and expenses denominated in foreign currencies are translated into U.S. dollars at the exchange rate in effect on the transaction date.
The effects of exchange rate fluctuations on investments are included with the net realized and unrealized gain (loss) on investment securities. Other foreign currency transactions resulting in realized and unrealized gain (loss) are disclosed separately.
Investment Transactions and Income. For financial reporting purposes, the Fund's investment holdings and NAV include trades executed through the end of the last business day of the period. The NAV per share for processing shareholder transactions is calculated as of the close of business of the New York Stock Exchange (NYSE), normally 4:00 p.m. Eastern time and includes trades executed through the end of the prior business day. Gains and losses on securities sold are determined on the basis of identified cost and may include proceeds received from litigation. Dividend income is recorded on the ex-dividend date, except for certain dividends from foreign securities where the ex-dividend date may have passed, which are recorded as soon as the Fund is informed of the ex-dividend date. Non-cash dividends included in dividend income, if any, are recorded at the fair market value of the securities received. Distributions received on securities that represent a return of capital or capital gain are recorded as a reduction of cost of investments and/or as a realized gain. The Fund estimates the components of distributions received that may be considered return of capital distributions or capital gain distributions. Interest income and distributions from the Fidelity Central Funds are accrued as earned. Interest income includes coupon interest and amortization of premium and accretion of discount on debt securities. Investment income is recorded net of foreign taxes withheld where recovery of such taxes is uncertain.
Annual Report
Notes to Financial Statements - continued
3. Significant Accounting Policies - continued
Expenses. Expenses directly attributable to a fund are charged to that fund. Expenses attributable to more than one fund are allocated among the respective funds on the basis of relative net assets or other appropriate methods. Expense estimates are accrued in the period to which they relate and adjustments are made when actual amounts are known.
Income Tax Information and Distributions to Shareholders. Each year, the Fund intends to qualify as a regulated investment company, including distributing substantially all of its taxable income and realized gains under Subchapter M of the Internal Revenue Code and filing its U.S. federal tax return. As a result, no provision for income taxes is required. As of July 31, 2011, the Fund did not have any unrecognized tax benefits in the financial statements. A fund's federal tax return is subject to examination by the Internal Revenue Service (IRS) for a period of three years. Foreign taxes are provided for based on the Fund's understanding of the tax rules and rates that exist in the foreign markets in which it invests.
Distributions are declared and recorded on the ex-dividend date. Income dividends and capital gain distributions are declared separately for each class. Income and capital gain distributions are determined in accordance with income tax regulations, which may differ from GAAP. In addition, the fund claimed a portion of the payment made to redeeming shareholders as a distribution for income tax purposes.
Capital accounts within the financial statements are adjusted for permanent book-tax differences. These adjustments have no impact on net assets or the results of operations. Temporary book-tax differences will reverse in a subsequent period.
Book-tax differences are primarily due to foreign currency transactions, capital loss carryforwards and losses deferred due to wash sales and excise tax regulations.
The federal tax cost of investment securities and unrealized appreciation (depreciation) as of period end were as follows:
Gross unrealized appreciation | $ 73,182,534 |
Gross unrealized depreciation | (15,372,090) |
Net unrealized appreciation (depreciation) on securities and other investments | $ 57,810,444 |
| |
Tax Cost | $ 453,033,176 |
The tax-based components of distributable earnings as of period end were as follows:
Undistributed ordinary income | $ 48,237 |
Undistributed Gains | $ 12,298,236 |
Net unrealized appreciation (depreciation) | $ 57,810,444 |
Annual Report
3. Significant Accounting Policies - continued
Income Tax Information and Distributions to Shareholders - continued
Under the recently enacted Regulated Investment Company Modernization Act of 2010 (the Act), the Fund will be permitted to carry forward capital losses incurred in taxable years beginning after December 22, 2010 for an unlimited period. However, any losses incurred during those future taxable years will be required to be utilized prior to any losses incurred in pre-enactment taxable years, which generally expire after eight years from when they are incurred. Additionally, post-enactment capital losses that are carried forward will retain their character as either short-term or long-term capital losses rather than being considered all short-term as under previous law. The Fund's first fiscal year end subject to the Act will be July 31, 2012.
The tax character of distributions paid was as follows:
| July 31, 2011 | July 31, 2010 |
Ordinary Income | $ 3,454,847 | $ 3,478,958 |
New Accounting Pronouncement. In May 2011, the Financial Accounting Standards Board issued Accounting Standard Update No. 2011-04, Fair Value Measurement (Topic 820) - Amendments to Achieve Common Fair Value Measurement and Disclosure Requirements in U.S. GAAP and IFRSs. The update changes the wording used to describe the requirements in GAAP for measuring fair value and for disclosing information about fair value measurements. The update is effective during interim and annual periods beginning after December 15, 2011. Management is currently evaluating the impact of the update's adoption on the Fund's financial statement disclosures.
4. Operating Policies.
Restricted Securities. The Fund may invest in securities that are subject to legal or contractual restrictions on resale. These securities generally may be resold in transactions exempt from registration or to the public if the securities are registered. Disposal of these securities may involve time-consuming negotiations and expense, and prompt sale at an acceptable price may be difficult. Information regarding restricted securities is included at the end of the Fund's Schedule of Investments.
5. Purchases and Sales of Investments.
Purchases and sales of securities, other than short-term securities, aggregated $292,273,582 and $278,032,856, respectively.
Annual Report
Notes to Financial Statements - continued
6. Fees and Other Transactions with Affiliates.
Management Fee. FMR and its affiliates provide the Fund with investment management related services for which the Fund pays a monthly management fee. The management fee is the sum of an individual fund fee rate that is based on an annual rate of .30% of the Fund's average net assets and a group fee rate that averaged .26% during the period. The group fee rate is based upon the average net assets of all the mutual funds advised by FMR. The group fee rate decreases as assets under management increase and increases as assets under management decrease. For the period, the total annual management fee rate was .56% of the Fund's average net assets.
Distribution and Service Plan Fees. In accordance with Rule 12b-1 of the 1940 Act, the Fund has adopted separate Distribution and Service Plans for each class of shares. Certain classes pay Fidelity Distributors Corporation (FDC), an affiliate of FMR, separate Distribution and Service Fees, each of which is based on an annual percentage of each class' average net assets. In addition, FDC may pay financial intermediaries for selling shares of the Fund and providing shareholder support services. For the period, the Distribution and Service Fee rates, total fees and amounts retained by FDC were as follows:
| Distribution
Fee | Service
Fee | Total Fees | Retained
by FDC |
Class A | -% | .25% | $ 373,427 | $ 9,804 |
Class T | .25% | .25% | 351,180 | 1,158 |
Class B | .75% | .25% | 122,425 | 91,896 |
Class C | .75% | .25% | 396,760 | 93,561 |
| | | $ 1,243,792 | $ 196,419 |
Sales Load. FDC may receive a front-end sales charge of up to 5.75% for selling Class A shares, and 3.50% for selling Class T shares, some of which is paid to financial intermediaries for selling shares of the Fund. Depending on the holding period, FDC may receive contingent deferred sales charges levied on Class A, Class T, Class B, and Class C redemptions. The deferred sales charges range from 5% to 1% for Class B, 1% for Class C, 1.00% for certain purchases of Class A shares and .25% for certain purchases of Class T shares.
For the period, sales charge amounts retained by FDC were as follows:
| Retained
by FDC |
Class A | $ 60,413 |
Class T | 10,427 |
Class B* | 28,145 |
Class C* | 3,930 |
| $ 102,915 |
* When Class B and Class C shares are initially sold, FDC pays commissions from its own resources to financial intermediaries through which the sales are made.
Annual Report
6. Fees and Other Transactions with Affiliates - continued
Transfer Agent Fees. Fidelity Investments Institutional Operations Company, Inc. (FIIOC), an affiliate of FMR, is the transfer, dividend disbursing and shareholder servicing agent for each class of the Fund. FIIOC receives account fees and asset-based fees that vary according to the account size and type of account of the shareholders of the respective classes of the Fund. FIIOC pays for typesetting, printing and mailing of shareholder reports, except proxy statements. For the period, transfer agent fees for each class were as follows:
| Amount | % of
Average
Net Assets |
Class A | $ 446,263 | .30 |
Class T | 214,263 | .31 |
Class B | 36,784 | .30 |
Class C | 118,916 | .30 |
Institutional Class | 517,024 | .29 |
| $ 1,333,250 | |
Accounting and Security Lending Fees. Fidelity Service Company, Inc. (FSC), an affiliate of FMR, maintains the Fund's accounting records. The accounting fee is based on the level of average net assets for the month. Under a separate contract, FSC administers the security lending program. The security lending fee is based on the number and duration of lending transactions.
Brokerage Commissions. The Fund placed a portion of its portfolio transactions with brokerage firms which are affiliates of the investment adviser. The commissions paid to these affiliated firms were $11,166 for the period.
Interfund Lending Program. Pursuant to an Exemptive Order issued by the SEC, the Fund, along with other registered investment companies having management contracts with FMR, may participate in an interfund lending program. This program provides an alternative credit facility allowing the funds to borrow from, or lend money to, other participating affiliated funds. At period end, there were no interfund loans outstanding. The Fund's activity in this program during the period for which loans were outstanding was as follows:
Borrower or Lender | Average Daily
Loan Balance | Weighted Average Interest Rate | Interest
Expense |
Borrower | $ 5,038,000 | .34% | $ 94 |
Annual Report
Notes to Financial Statements - continued
7. Committed Line of Credit.
The Fund participates with other funds managed by FMR or an affiliate in a $4.0 billion credit facility (the "line of credit") to be utilized for temporary or emergency purposes to fund shareholder redemptions or for other short-term liquidity purposes. The Fund has agreed to pay commitment fees on its pro-rata portion of the line of credit, which amounted to $1,463 and is reflected in Miscellaneous expenses on the Statement of Operations. During the period, there were no borrowings on this line of credit.
8. Security Lending.
The Fund lends portfolio securities through a lending agent from time to time in order to earn additional income. The lending agent may loan securities to certain qualified borrowers, including Fidelity Capital Markets (FCM), a broker-dealer affiliated with the Fund. On the settlement date of the loan, the Fund receives collateral (in the form of U.S. Treasury obligations, letters of credit and/or cash) against the loaned securities and maintains collateral in an amount not less than 100% of the market value of the loaned securities during the period of the loan. The market value of the loaned securities is determined at the close of business of the Fund and any additional required collateral is delivered to the Fund on the next business day. If the borrower defaults on its obligation to return the securities loaned because of insolvency or other reasons, a fund could experience delays and costs in recovering the securities loaned or in gaining access to the collateral. Any cash collateral received is the Fidelity Securities Lending Cash Central Fund. The value of loaned securities and cash collateral at period end are disclosed on the Fund's Statement of Assets and Liabilities. The value of securities loaned to FCM at period end was $624,342. Security lending income represents the income earned on investing cash collateral, less rebates paid to borrowers and lending agent fees associated with the loan, plus any premium payments received for lending certain types of securities. Security lending income is presented in the Statement of Operations as a component of income from Fidelity Central Funds. Total security lending income during the period amounted to $260,883, including $17,521 from securities loaned to FCM.
9. Expense Reductions.
Many of the brokers with whom FMR places trades on behalf of the Fund provided services in addition to trade execution. These services included payments of certain expenses on behalf of the Fund totaling $31,298 for the period.
Annual Report
10. Distributions to Shareholders.
Distributions to shareholders of each class were as follows:
Years ended July 31, | 2011 | 2010 |
From net investment income | | |
Class A | $ 1,134,674 | $ 1,234,313 |
Class T | 470,285 | 586,319 |
Class B | 48,095 | 73,937 |
Class C | 150,722 | 151,383 |
Institutional Class | 1,651,071 | 1,433,006 |
Total | $ 3,454,847 | $ 3,478,958 |
11. Share Transactions.
Transactions for each class of shares were as follows:
| Shares | Dollars |
Years ended July 31, | 2011 | 2010 | 2011 | 2010 |
Class A | | | | |
Shares sold | 4,653,877 | 3,838,345 | $ 78,524,629 | $ 50,713,463 |
Reinvestment of distributions | 65,899 | 94,331 | 1,031,857 | 1,168,282 |
Shares redeemed | (2,832,440) | (2,642,928) | (47,536,681) | (33,936,194) |
Net increase (decrease) | 1,887,336 | 1,289,748 | $ 32,019,805 | $ 17,945,551 |
Class T | | | | |
Shares sold | 1,651,686 | 1,600,698 | $ 27,537,800 | $ 21,094,229 |
Reinvestment of distributions | 29,190 | 46,490 | 457,660 | 571,730 |
Shares redeemed | (1,467,042) | (1,927,214) | (24,575,305) | (25,063,300) |
Net increase (decrease) | 213,834 | (280,026) | $ 3,420,155 | $ (3,397,341) |
Class B | | | | |
Shares sold | 93,823 | 214,509 | $ 1,516,799 | $ 2,825,349 |
Reinvestment of distributions | 2,787 | 5,594 | 43,338 | 67,395 |
Shares redeemed | (274,854) | (251,258) | (4,557,495) | (3,248,064) |
Net increase (decrease) | (178,244) | (31,155) | $ (2,997,358) | $ (355,320) |
Class C | | | | |
Shares sold | 1,010,530 | 1,050,192 | $ 16,785,045 | $ 14,008,372 |
Reinvestment of distributions | 8,844 | 11,301 | 137,459 | 138,548 |
Shares redeemed | (504,158) | (362,839) | (8,281,154) | (4,691,785) |
Net increase (decrease) | 515,216 | 698,654 | $ 8,641,350 | $ 9,455,135 |
Institutional Class | | | | |
Shares sold | 4,421,526 | 7,306,218 | $ 73,745,390 | $ 99,355,047 |
Reinvestment of distributions | 72,024 | 57,970 | 1,131,385 | 738,990 |
Shares redeemed | (6,191,578) | (1,990,258) | (102,967,160) | (25,411,067) |
Net increase (decrease) | (1,698,028) | 5,373,930 | $ (28,090,385) | $ 74,682,970 |
Annual Report
Notes to Financial Statements - continued
12. Other.
The Fund's organizational documents provide former and current trustees and officers with a limited indemnification against liabilities arising in connection with the performance of their duties to the Fund. In the normal course of business, the Fund may also enter into contracts that provide general indemnifications. The Fund's maximum exposure under these arrangements is unknown as this would be dependent on future claims that may be made against the Fund. The risk of material loss from such claims is considered remote.
Annual Report
To the Trustees of Fidelity Advisor Series VII and Shareholders of Fidelity Advisor Real Estate Fund:
We have audited the accompanying statement of assets and liabilities of Fidelity Advisor Real Estate Fund (the Fund), a fund of Fidelity Advisor Series VII, including the schedule of investments, as of July 31, 2011, and the related statement of operations for the year then ended, the statement of changes in net assets for each of the two years in the period then ended, and the financial highlights for each of the five years in the period then ended. These financial statements and financial highlights are the responsibility of the Fund's management. Our responsibility is to express an opinion on these financial statements and financial highlights based on our audits.
We conducted our audits in accordance with the standards of the Public Company Accounting Oversight Board (United States). Those standards require that we plan and perform the audit to obtain reasonable assurance about whether the financial statements and financial highlights are free of material misstatement. The Fund is not required to have, nor were we engaged to perform, an audit of its internal control over financial reporting. Our audits included consideration of internal control over financial reporting as a basis for designing audit procedures that are appropriate in the circumstances, but not for the purpose of expressing an opinion on the effectiveness of the Fund's internal control over financial reporting. Accordingly, we express no such opinion. An audit also includes examining, on a test basis, evidence supporting the amounts and disclosures in the financial statements, assessing the accounting principles used and significant estimates made by management, as well as evaluating the overall financial statement presentation. Our procedures included confirmation of securities owned as of July 31, 2011, by correspondence with the custodians and brokers; where replies were not received from brokers, we performed other auditing procedures. We believe that our audits provide a reasonable basis for our opinion.
In our opinion, the financial statements and financial highlights referred to above present fairly, in all material respects, the financial position of Fidelity Advisor Real Estate Fund as of July 31, 2011, the results of its operations for the year then ended, the changes in its net assets for each of the two years in the period then ended, and the financial highlights for each of the five years in the period then ended, in conformity with accounting principles generally accepted in the United States of America.
/s/ Deloitte & Touche LLP
DELOITTE & TOUCHE LLP
Boston, Massachusetts
September 13, 2011
Annual Report
The Trustees, Members of the Advisory Board, and executive officers of the trust and fund, as applicable, are listed below. The Board of Trustees governs the fund and is responsible for protecting the interests of shareholders. The Trustees are experienced executives who meet periodically throughout the year to oversee the fund's activities, review contractual arrangements with companies that provide services to the fund, oversee management of the risks associated with such activities and contractual arrangements, and review the fund's performance. Except for James C. Curvey, each of the Trustees oversees 221 funds advised by FMR or an affiliate. Mr. Curvey oversees 419 funds advised by FMR or an affiliate.
The Trustees hold office without limit in time except that (a) any Trustee may resign; (b) any Trustee may be removed by written instrument, signed by at least two-thirds of the number of Trustees prior to such removal; (c) any Trustee who requests to be retired or who has become incapacitated by illness or injury may be retired by written instrument signed by a majority of the other Trustees; and (d) any Trustee may be removed at any special meeting of shareholders by a two-thirds vote of the outstanding voting securities of the trust. Each Trustee who is not an interested person (as defined in the 1940 Act) (Independent Trustee), shall retire not later than the last day of the calendar year in which his or her 75th birthday occurs. The Independent Trustees may waive this mandatory retirement age policy with respect to individual Trustees. The executive officers and Advisory Board Members hold office without limit in time, except that any officer and Advisory Board Member may resign or may be removed by a vote of a majority of the Trustees at any regular meeting or any special meeting of the Trustees. Except as indicated, each individual has held the office shown or other offices in the same company for the past five years.
Experience, Skills, Attributes, and Qualifications of the Fund's Trustees. The Governance and Nominating Committee has adopted a statement of policy that describes the experience, qualifications, attributes, and skills that are necessary and desirable for potential Independent Trustee candidates (Statement of Policy). The Board believes that each Trustee satisfied at the time he or she was initially elected or appointed a Trustee, and continues to satisfy, the standards contemplated by the Statement of Policy. The Governance and Nominating Committee also engages professional search firms to help identify potential Independent Trustee candidates who have the experience, qualifications, attributes, and skills consistent with the Statement of Policy. From time to time, additional criteria based on the composition and skills of the current Independent Trustees, as well as experience or skills that may be appropriate in light of future changes to board composition, business conditions, and regulatory or other developments, have also been considered by the professional search firms and the Governance and Nominating Committee. In addition, the Board takes into account the Trustees' commitment and participation in Board and committee meetings, as well as their leadership of standing and ad hoc committees throughout their tenure.
In determining that a particular Trustee was and continues to be qualified to serve as a Trustee, the Board has considered a variety of criteria, none of which, in isolation, was controlling. The Board believes that, collectively, the Trustees have balanced and diverse experience, qualifications, attributes, and skills, which allow the Board to operate effectively in governing the fund and protecting the interests of shareholders. Information about the specific experience, skills, attributes, and qualifications of each Trustee, which in each case led to the Board's conclusion that the Trustee should serve (or continue to serve) as a trustee of the fund, is provided below.
Annual Report
Board Structure and Oversight Function. James C. Curvey is an interested person (as defined in the 1940 Act) and currently serves as Acting Chairman. The Trustees have determined that an interested Chairman is appropriate and benefits shareholders because an interested Chairman has a personal and professional stake in the quality and continuity of services provided to the fund. Independent Trustees exercise their informed business judgment to appoint an individual of their choosing to serve as Chairman, regardless of whether the Trustee happens to be independent or a member of management. The Independent Trustees have determined that they can act independently and effectively without having an Independent Trustee serve as Chairman and that a key structural component for assuring that they are in a position to do so is for the Independent Trustees to constitute a substantial majority for the Board. The Independent Trustees also regularly meet in executive session. Ned C. Lautenbach serves as Chairman of the Independent Trustees and as such (i) acts as a liaison between the Independent Trustees and management with respect to matters important to the Independent Trustees and (ii) with management prepares agendas for Board meetings.
Fidelity funds are overseen by different Boards of Trustees. The fund's Board oversees Fidelity's equity and high income funds and another Board oversees Fidelity's investment-grade bond, money market, and asset allocation funds. The asset allocation funds may invest in Fidelity funds overseen by the fund's Board. The use of separate Boards, each with its own committee structure, allows the Trustees of each group of Fidelity funds to focus on the unique issues of the funds they oversee, including common research, investment, and operational issues. On occasion, the separate Boards establish joint committees to address issues of overlapping consequences for the Fidelity funds overseen by each Board.
The Trustees operate using a system of committees to facilitate the timely and efficient consideration of all matters of importance to the Trustees, the fund, and fund shareholders and to facilitate compliance with legal and regulatory requirements and oversight of the fund's activities and associated risks. The Board, acting through its committees, has charged FMR and its affiliates with (i) identifying events or circumstances the occurrence of which could have demonstrably adverse effects on the fund's business and/or reputation; (ii) implementing processes and controls to lessen the possibility that such events or circumstances occur or to mitigate the effects of such events or circumstances if they do occur; and (iii) creating and maintaining a system designed to evaluate continuously business and market conditions in order to facilitate the identification and implementation processes described in (i) and (ii) above. Because the day-to-day operations and activities of the fund are carried out by or through FMR, its affiliates and other service providers, the fund's exposure to risks is mitigated but not eliminated by the processes overseen by the Trustees. While each of the Board's committees has responsibility for overseeing different aspects of the fund's activities, oversight is exercised primarily through the Operations, Audit, and Compliance Committees. Appropriate personnel, including but not limited to the fund's Chief Compliance Officer (CCO), FMR's internal auditor, the independent accountants, the fund's Treasurer and portfolio management personnel, make periodic reports to the Board's committees, as appropriate. The responsibilities of each committee, including their oversight responsibilities, are described further under "Standing Committees of the Fund's Trustees."
Annual Report
Trustees and Officers - continued
The fund's Statement of Additional Information (SAI) includes more information about the Trustees. To request a free copy, call Fidelity at 1-877-208-0098.
Interested Trustees*:
Correspondence intended for each Trustee who is an interested person may be sent to Fidelity Investments, 82 Devonshire Street, Boston, Massachusetts 02109.
Name, Age; Principal Occupations and Other Relevant Experience+ |
James C. Curvey (76) |
| Year of Election or Appointment: 2007 Mr. Curvey is Trustee and Acting Chairman of the Board of Trustees of certain Trusts. Mr. Curvey also serves as Trustee (2007-present) of other investment companies advised by FMR. Mr. Curvey is a Director of Fidelity Investments Money Management, Inc. (2009-present), Director of Fidelity Research & Analysis Co. (2009-present) and Director of FMR and FMR Co., Inc. (2007-present). Mr. Curvey is also Vice Chairman (2007-present) and Director of FMR LLC. In addition, Mr. Curvey serves as an Overseer for the Boston Symphony Orchestra and a member of the Trustees of Villanova University. Previously, Mr. Curvey was the Vice Chairman (2006-2007) and Director (2000-2007) of FMR Corp. |
Ronald P. O'Hanley (54) |
| Year of Election or Appointment: 2011 Mr. O'Hanley is Director of FMR Co., Inc. (2010-present), Director of Fidelity Investments Money Management, Inc. (2010-present), Director of Fidelity Research & Analysis Company (2010-present), President of Fidelity Asset Management and Corporate Services and a member of Fidelity's Executive Committee (2010-present). Previously, Mr. O'Hanley served as President and Chief Executive Officer of BNY Mellon Asset Management (2007-2010). Mr. O'Hanley also served as Vice Chairman of Bank New York Mellon Corp. and a member of that firm's Executive Committee. Prior to the 2007 merger of The Bank of New York and Mellon Financial Corporation, he was Vice Chairman of Mellon Financial Corporation and President and Chief Executive Officer of Mellon Asset Management. He joined Mellon in February 1997. Mr. O'Hanley currently serves as Chairman of the Boston Public Library Foundation Board of Directors and sits on the Board of Directors of Beth Israel Deaconess Medical Center, the Board of Trustees of the Marine Biological Laboratory and the Advisory Board of the Maxwell School of Citizenship and Public Administration at Syracuse University. Mr. O'Hanley also chairs the Council on Asset Management for the Financial Services Roundtable and is a member of the Board of Directors of Institutional Investor's U.S. Institute. |
* Trustees have been determined to be "Interested Trustees" by virtue of, among other things, their affiliation with the trust or various entities under common control with FMR.
+ The information above includes each Trustee's principal occupation during the last five years and other information relating to the experience, attributes, and skills relevant to each Trustee's qualifications to serve as a Trustee, which led to the conclusion that each Trustee should serve as a Trustee for the fund.
Annual Report
Trustees and Officers - continued
Independent Trustees:
Correspondence intended for each Independent Trustee (that is, the Trustees other than the Interested Trustees) may be sent to Fidelity Investments, P.O. Box 55235, Boston, Massachusetts 02205-5235.
Name, Age; Principal Occupations and Other Relevant Experience+ |
Dennis J. Dirks (63) |
| Year of Election or Appointment: 2005 Prior to his retirement in May 2003, Mr. Dirks was Chief Operating Officer and a member of the Board of The Depository Trust & Clearing Corporation (DTCC). He also served as President, Chief Operating Officer, and Board member of The Depository Trust Company (DTC) and President and Board member of the National Securities Clearing Corporation (NSCC). In addition, Mr. Dirks served as Chief Executive Officer and Board member of the Government Securities Clearing Corporation, Chief Executive Officer and Board member of the Mortgage-Backed Securities Clearing Corporation, as a Trustee and a member of the Finance Committee of Manhattan College (2005-2008), and as a Trustee and a member of the Finance Committee of AHRC of Nassau County (2006-2008). Mr. Dirks is a member of the Independent Directors Council (IDC) Governing Council (2010-Present) and Board of Directors for The Brookville Center for Children's Services, Inc. (2009-present). |
Alan J. Lacy (57) |
| Year of Election or Appointment: 2008 Mr. Lacy serves as Senior Adviser (2007-present) of Oak Hill Capital Partners, L.P. (private equity). Mr. Lacy also served as Chief Executive Officer (2000-2005) and Vice Chairman (2005-2006) of Sears Holdings Corporation and Sears, Roebuck and Co. (retail). In addition, Mr. Lacy serves as a member of the Board of Directors of Dave & Buster's, Inc. (restaurant and entertainment complexes, 2010-present), The Hillman Companies, Inc. (hardware wholesalers, 2010-present), and Bristol-Myers Squibb Company (global pharmaceuticals, 2007-present). Mr. Lacy is a member of the Board of Trustees of The National Parks Conservation Association (2006-Present). Previously, Mr. Lacy served as Chairman of the Board of Trustees of the National Parks Conservation Association (2008-2011) and as a member of the Board of Directors for the Western Union Company (global money transfer, 2006-2011). |
Ned C. Lautenbach (67) |
| Year of Election or Appointment: 2000 Mr. Lautenbach is Chairman of the Independent Trustees of the Equity and High Income Funds (2006-present). Mr. Lautenbach currently serves as the Lead Director of the Eaton Corporation Board of Directors (diversified industrial, 1997-present). Mr. Lautenbach is also a member of the Board of Directors of the Philharmonic Center for the Arts in Naples, Florida (1999-present); a member of the Board of Trustees of Fairfield University (2005-present); and a member of the Council on Foreign Relations (1994-present). Previously, Mr. Lautenbach was a Partner/Advisory Partner at Clayton, Dubilier & Rice, LLC (private equity investment, 1998-2010), as well as a Director of Sony Corporation (2006-2007). |
Joseph Mauriello (66) |
| Year of Election or Appointment: 2008 Prior to his retirement in January 2006, Mr. Mauriello served in numerous senior management positions including Deputy Chairman and Chief Operating Officer (2004-2005), and Vice Chairman of Financial Services (2002-2004) of KPMG LLP US (professional services, 1965-2005). Mr. Mauriello currently serves as a member of the Board of Directors of XL Group plc. (global insurance and re-insurance, 2006-present) and of Arcadia Resources Inc. (health care services and products, 2007-present). Previously, Mr. Mauriello served as a Director of the Hamilton Funds of the Bank of New York (2006-2007). |
Robert W. Selander (60) |
| Year of Election or Appointment: 2011 Previously, Mr. Selander served as a Member of the Advisory Board of Fidelity's Equity and High Income Funds (2011), Executive Vice Chairman (2010), Chief Executive Officer (2009-2010), and President and Chief Executive Officer (1997-2009) of Mastercard, Inc. |
Cornelia M. Small (67) |
| Year of Election or Appointment: 2005 Ms. Small is a member of the Board of Directors of the Teagle Foundation (2009-present). Ms. Small is also a member of the Investment Committee, and Chair (2008-present) and a member of the Board of Trustees of Smith College. In addition, Ms. Small serves on the Investment Committee of the Berkshire Taconic Community Foundation (2008-present). Previously, Ms. Small served as Chairperson of the Investment Committee (2002-2008) of Smith College. In addition, Ms. Small served as Chief Investment Officer, Director of Global Equity Investments, and a member of the Board of Directors of Scudder, Stevens & Clark and Scudder Kemper Investments. |
William S. Stavropoulos (72) |
| Year of Election or Appointment: 2001 Mr. Stavropoulos is Vice Chairman of the Independent Trustees of the Equity and High Income Funds (2006-present). Mr. Stavropoulos serves as President and Founder of the Michigan Baseball Foundation, the Great Lakes Loons (2007-present). Mr. Stavropoulos is Chairman Emeritus of the Board of Directors of The Dow Chemical Company, where he previously served in numerous senior management positions, including President, CEO (1995-2000; 2002-2004), Chairman of the Executive Committee (2000-2006), and as a member of the Board of Directors (1990-2006). Currently, Mr. Stavropoulos is Chairman of Univar (global distributor of commodity and specialty chemicals, 2010-present), a Director of Teradata Corporation (data warehousing and technology solutions, 2008-present), Chemical Financial Corporation, Maersk Inc. (industrial conglomerate), Tyco International, Inc. (multinational manufacturing and services, 2007-present), and a member of the Advisory Board for Metalmark Capital (private equity investment, 2005-present). Mr. Stavropoulos is a special advisor to Clayton, Dubilier & Rice, LLC (private equity investment). In addition, Mr. Stavropoulos is a member of the University of Notre Dame Advisory Council for the College of Science. |
David M. Thomas (62) |
| Year of Election or Appointment: 2008 Previously, Mr. Thomas served as Executive Chairman (2005-2006) and Chairman and Chief Executive Officer (2000-2005) of IMS Health, Inc. (pharmaceutical and healthcare information solutions). In addition, Mr. Thomas serves as a member of the Board of Directors of Fortune Brands, Inc. (consumer products), and Interpublic Group of Companies, Inc. (marketing communication, 2004-present). |
Michael E. Wiley (60) |
| Year of Election or Appointment: 2008 Mr. Wiley also serves as a Director of Asia Pacific Exploration Consolidated (international oil and gas exploration and production, 2008-present). Mr. Wiley serves as a Director of Tesoro Corporation (independent oil refiner and marketer, 2005-present), and a Director of Bill Barrett Corporation (exploration and production, 2005-present). In addition, Mr. Wiley also serves as a Director of Post Oak Bank (privately-held bank, 2004-present). Previously, Mr. Wiley served as a member of the Board of Trustees of the University of Tulsa (2000-2006; 2007-2010), as a Senior Energy Advisor of Katzenbach Partners, LLC (consulting, 2006-2007), as an Advisory Director of Riverstone Holdings (private investment), Chairman, President, and CEO of Baker Hughes, Inc. (oilfield services, 2000-2004), and as Director of Spinnaker Exploration Company (exploration and production, 2001-2005). |
Annual Report
+ The information above includes each Trustee's principal occupation during the last five years and other information relating to the experience, attributes, and skills relevant to each Trustee's qualifications to serve as a Trustee, which led to the conclusion that each Trustee should serve as a Trustee for the fund.
Advisory Board Members and Executive Officers:
Correspondence intended for each executive officer, Peter S. Lynch, and Edward C. Johnson 3d may be sent to Fidelity Investments, 82 Devonshire Street, Boston, Massachusetts 02109.
Name, Age; Principal Occupation |
Edward C. Johnson 3d (81) |
| Year of Election or Appointment: 2011 Member of the Advisory Board of Fidelity's Equity and High Income Funds. Mr. Johnson serves as Chief Executive Officer, Chairman, and a Director of FMR LLC, and also serves as Chairman and Director of FIL Limited. Previously, Mr. Johnson served as a Trustee and Chairman of the Board of certain Fidelity Trusts, Chairman and a Director of FMR, Chairman and a Director of FMR Co., Inc., and President of FMR LLC (2006-2007). |
Peter S. Lynch (67) |
| Year of Election or Appointment: 2003 Member of the Advisory Board of Fidelity's Equity and High Income Funds. Mr. Lynch is Vice Chairman and a Director of FMR and FMR Co., Inc. In addition, Mr. Lynch serves as a Trustee of Boston College and as the Chairman of the Inner-City Scholarship Fund. Previously, Mr. Lynch served on the Special Olympics International Board of Directors (1997-2006). |
Kenneth B. Robins (41) |
| Year of Election or Appointment: 2008 President and Treasurer of Fidelity's Equity and High Income Funds. Mr. Robins also serves as President and Treasurer (2010-present) and Assistant Treasurer (2009-present) of other Fidelity funds and is an employee of Fidelity Investments (2004-present). Previously, Mr. Robins served as Deputy Treasurer of the Fidelity funds (2005-2008) and Treasurer and Chief Financial Officer of The North Carolina Capital Management Trust: Cash and Term Portfolios (2006-2008). |
Brian B. Hogan (46) |
| Year of Election or Appointment: 2009 Vice President of Equity and High Income Funds. Mr. Hogan also serves as President of FMR's Equity Division (2009-present). Previously, Mr. Hogan served as Senior Vice President, Equity Research of FMR (2006-2009) and as a portfolio manager. |
Christopher S. Bartel (39) |
| Year of Election or Appointment: 2009 Vice President of Fidelity's Sector and Real Estate Equity Funds. Mr. Bartel also serves as Senior Vice President of Equity Research (2009-present). Previously, Mr. Bartel served as Managing Director of Research (2006-2009) and an analyst and portfolio manager (2000-2006). |
Scott C. Goebel (43) |
| Year of Election or Appointment: 2008 Secretary and Chief Legal Officer (CLO) of the Fidelity funds. Mr. Goebel also serves as Secretary of Fidelity Investments Money Management, Inc. (FIMM) (2010-present) and Fidelity Research and Analysis Company (FRAC) (2010-present); Secretary and CLO of The North Carolina Capital Management Trust: Cash and Term Portfolios (2008-present); General Counsel, Secretary, and Senior Vice President of FMR (2008-present) and FMR Co., Inc. (2008-present); employed by FMR LLC or an affiliate (2001-present); Chief Legal Officer of Fidelity Management & Research (Hong Kong) Limited (2008-present) and Assistant Secretary of Fidelity Management & Research (Japan) Inc. (2008-present), and Fidelity Management & Research (U.K.) Inc. (2008-present). Previously, Mr. Goebel served as Assistant Secretary of FIMM (2008-2010), FRAC (2008-2010), and the Funds (2007-2008) and as Vice President and Secretary of Fidelity Distributors Corporation (FDC) (2005-2007). |
William C. Coffey (42) |
| Year of Election or Appointment: 2009 Assistant Secretary of Fidelity's Equity and High Income Funds. Mr. Coffey also serves as Senior Vice President and Deputy General Counsel of FMR LLC (2010-present), and is an employee of Fidelity Investments. Previously, Mr. Coffey served as Vice President and Associate General Counsel of FMR LLC (2005-2009). |
Holly C. Laurent (57) |
| Year of Election or Appointment: 2008 Anti-Money Laundering (AML) Officer of the Fidelity funds. Ms. Laurent also serves as AML Officer of The North Carolina Capital Management Trust: Cash and Term Portfolios (2008-present) and is an employee of Fidelity Investments. Previously, Ms. Laurent was Senior Vice President and Head of Legal for Fidelity Business Services India Pvt. Ltd. (2006-2008), and Senior Vice President, Deputy General Counsel and Group Head for FMR LLC (2005-2006). |
Christine Reynolds (52) |
| Year of Election or Appointment: 2008 Chief Financial Officer of the Fidelity funds. Ms. Reynolds became President of Fidelity Pricing and Cash Management Services (FPCMS) in August 2008. Ms. Reynolds served as Chief Operating Officer of FPCMS (2007-2008). Previously, Ms. Reynolds served as President, Treasurer, and Anti-Money Laundering officer of the Fidelity funds (2004-2007). |
Kenneth A. Rathgeber (64) |
| Year of Election or Appointment: 2004 Chief Compliance Officer of Fidelity's Equity and High Income Funds. Mr. Rathgeber is Chief Compliance Officer of Fidelity Management & Research (Hong Kong) Limited (2008-present), Fidelity Management & Research (Japan) Inc. (2008-present), FMR (2005-present), FMR Co., Inc. (2005-present), Fidelity Management & Research (U.K.) Inc. (2005-present), Fidelity Research & Analysis Company (2005-present), Fidelity Investments Money Management, Inc. (2005-present), Pyramis Global Advisors, LLC (2005-present), and Strategic Advisers, Inc. (2005-present). |
Jeffrey S. Christian (49) |
| Year of Election or Appointment: 2009 Deputy Treasurer of the Fidelity funds. Mr. Christian is an employee of Fidelity Investments. Previously, Mr. Christian served as Chief Financial Officer (2008-2009) of certain Fidelity funds and Senior Vice President of Fidelity Pricing and Cash Management Services (FPCMS) (2004-2009). |
Bryan A. Mehrmann (50) |
| Year of Election or Appointment: 2005 Deputy Treasurer of the Fidelity funds. Mr. Mehrmann is an employee of Fidelity Investments. |
Adrien E. Deberghes (43) |
| Year of Election or Appointment: 2008 Deputy Treasurer of Fidelity's Equity and High Income Funds. Mr. Deberghes also serves as Assistant Treasurer of other Fidelity funds (2010-present) and is an employee of Fidelity Investments (2008-present). Previously, Mr. Deberghes served as Senior Vice President of Mutual Fund Administration at State Street Corporation (2007-2008), Senior Director of Mutual Fund Administration at Investors Bank & Trust (2005-2007), and Director of Finance for Dunkin' Brands (2000-2005). |
Stephanie J. Dorsey (42) |
| Year of Election or Appointment: 2010 Assistant Treasurer of Fidelity's Equity and High Income Funds. Ms. Dorsey also serves as Deputy Treasurer of other Fidelity funds (2008-present) and is an employee of Fidelity Investments (2008-present). Previously, Ms. Dorsey served as Treasurer (2004-2008) of the JPMorgan Mutual Funds and Vice President (2004-2008) of JPMorgan Chase Bank. |
John R. Hebble (53) |
| Year of Election or Appointment: 2009 Assistant Treasurer of Fidelity's Equity and High Income Funds. Mr. Hebble also serves as President (2011-present), Treasurer, and Chief Financial Officer of The North Carolina Capital Management Trust: Cash and Term Portfolios (2008-present), President and Treasurer of other Fidelity funds (2008-present) and is an employee of Fidelity Investments. |
Gary W. Ryan (52) |
| Year of Election or Appointment: 2005 Assistant Treasurer of the Fidelity funds. Mr. Ryan is an employee of Fidelity Investments. Previously, Mr. Ryan served as Vice President of Fund Reporting in Fidelity Pricing and Cash Management Services (FPCMS) (1999-2005). |
Jonathan Davis (43) |
| Year of Election or Appointment: 2010 Assistant Treasurer of the Fidelity funds. Mr. Davis is an employee of Fidelity Investments. Previously, Mr. Davis served as Vice President and Associate General Counsel of FMR LLC (2003-2010). |
Annual Report
The Board of Trustees of Fidelity Advisor Real Estate Fund voted to pay to shareholders of record at the opening of business on record date, the following distributions per share derived from capital gains realized from sales of portfolio securities, and dividends derived from net investment income:
| Pay Date | Record Date | Dividends | Capital Gains |
Class A | 09/06/11 | 09/02/11 | $0.000 | $0.470 |
Class T | 09/06/11 | 09/02/11 | $0.000 | $0.470 |
Class B | 09/06/11 | 09/02/11 | $0.000 | $0.470 |
Class C | 09/06/11 | 09/02/11 | $0.000 | $0.470 |
The fund hereby designates as a capital gain dividend with respect to the taxable year ended July 31, 2011, $13,712,128, or, if subsequently determined to be different, the net capital gain of such year.
A total of 0.05% of the dividends distributed during the fiscal year was derived from interest on U.S. Government securities which is generally exempt from state income tax.
The fund will notify shareholders in January 2012 of amounts for use in preparing 2011 income tax returns.
Annual Report
Board Approval of Investment Advisory Contracts and Management Fees
Fidelity Advisor Real Estate Fund
Each year, the Board of Trustees, including the Independent Trustees (together, the Board), votes on the renewal of the management contract and sub-advisory agreements (together, the Advisory Contracts) for the fund. The Board, assisted by the advice of fund counsel and Independent Trustees' counsel, requests and considers a broad range of information relevant to the renewal of the Advisory Contracts throughout the year.
The Board meets regularly and considers at each of its meetings factors that are relevant to its annual consideration of the renewal of the fund's Advisory Contracts, including the services and support provided to the fund and its shareholders. The Board has established various standing committees, each composed of Independent Trustees with varying backgrounds, to which the Board has assigned specific subject matter responsibilities in order to enhance effective decision-making by the Board. The Board, acting directly and through its Committees, requests and receives information concerning the annual consideration of the renewal of the fund's Advisory Contracts. The Board also meets as needed to consider matters specifically related to the Board's annual consideration of the renewal of Advisory Contracts. Members of the Board may also meet with trustees of other Fidelity funds through ad hoc joint committees to discuss certain matters relevant to the Fidelity funds.
At its July 2011 meeting, the Board of Trustees, including the Independent Trustees, unanimously determined to renew the fund's Advisory Contracts. In reaching its determination, the Board considered all factors it believed relevant, including (i) the nature, extent, and quality of the services to be provided to the fund and its shareholders (including the investment performance of the fund); (ii) the competitiveness of the fund's management fee and total expense ratio; (iii) the total costs of the services to be provided by and the profits to be realized by Fidelity from its relationship with the fund; (iv) the extent to which economies of scale would be realized as the fund grows; and (v) whether fee levels reflect these economies of scale, if any, for the benefit of fund shareholders.
In considering whether to renew the Advisory Contracts for the fund, the Board reached a determination, with the assistance of fund counsel and Independent Trustees' counsel and through the exercise of its business judgment, that the renewal of the Advisory Contracts is in the best interests of the fund and its shareholders and that the compensation payable under the Advisory Contracts is fair and reasonable. The Board's decision to renew the Advisory Contracts was not based on any single factor, but rather was based on a comprehensive consideration of all the information provided to the Board at its meetings throughout the year. The Board, in reaching its determination to renew the Advisory Contracts, is aware that shareholders in the fund have a broad range of investment choices available to them, including a wide choice among mutual funds offered by Fidelity's competitors, and that the fund's shareholders, who have the opportunity to review and weigh the disclosure provided by the fund in its prospectus and other public disclosures, have chosen to invest in this fund, managed by Fidelity.
Annual Report
Nature, Extent, and Quality of Services Provided. The Board considered the staffing within the investment adviser, FMR, and the sub-advisers (together, the Investment Advisers), including the backgrounds of the fund's investment personnel and the fund's investment objective and discipline. The Independent Trustees also had discussions with senior management of Fidelity's investment operations and investment groups. The Board considered the structure of the portfolio manager compensation program and whether this structure provides appropriate incentives to act in the best interests of the fund.
Resources Dedicated to Investment Management and Support Services. The Board and the Fund Oversight and Research Committees reviewed the general qualifications and capabilities of the Investment Advisers' investment staff, including its size, education, experience, and resources, as well as the Investment Advisers' approach to recruiting, training, managing, and compensating investment personnel. The Board also noted that FMR has devoted increased resources to non-U.S. offices. The Board noted that Fidelity's analysts have extensive resources, tools and capabilities which allow them to conduct sophisticated quantitative and fundamental analysis, as well as credit analysis of issuers, counterparties and enhancers. The Board also believes that Fidelity's investment professionals have sufficient access to global information and data so as to provide competitive investment results over time, and that those professionals also have access to sophisticated tools which permit them to assess portfolio construction and risk and performance attribution characteristics continuously, as well as to transmit new information and research conclusions rapidly around the world. Additionally, in their deliberations, the Board considered the Investment Advisers' trading capabilities and resources which are an integral part of the investment management process.
Shareholder and Administrative Services. The Board considered (i) the nature, extent, quality, and cost of advisory, administrative, and shareholder services performed by the Investment Advisers and their affiliates under the Advisory Contracts and under separate agreements covering transfer agency, pricing and bookkeeping, and securities lending services for the fund; (ii) the nature and extent of the investment adviser's supervision of third party service providers, principally custodians and subcustodians; and (iii) the resources devoted to, and the record of compliance with, the fund's compliance policies and procedures. The Board also reviewed the allocation of fund brokerage, including allocations to brokers affiliated with the Investment Advisers, the use of brokerage commissions to pay fund expenses, and the use of "soft" commission dollars to pay for research services.
The Board noted that the growth of fund assets over time across the complex allows Fidelity to reinvest in the development of services designed to enhance the value or convenience of the Fidelity funds as investment vehicles. These services include 24-hour access to account information and market information through telephone representatives and over the Internet, investor education materials and asset allocation tools, and the expanded availability of Fidelity Investor Centers, with 35 new branches opening since 2010.
Annual Report
Board Approval of Investment Advisory Contracts and
Management Fees - continued
Investment in a Large Fund Family. The Board considered the benefits to shareholders of investing in a Fidelity fund, including the benefits of investing in a fund that is part of a large family of funds offering a variety of investment disciplines and providing a large variety of mutual fund investor services. The Board noted that Fidelity had taken, or had made recommendations that resulted in the Fidelity funds taking, a number of actions over the previous year that benefited particular funds, including (i) continuing to dedicate additional resources to investment research and support of the senior management team that oversees asset management; (ii) rationalizing product lines through the mergers of six funds into other funds; (iii) continuing to migrate the Freedom Funds to dedicated lower cost underlying funds; (iv) obtaining shareholder approval to broaden the investment strategies for Fidelity Consumer Finance Portfolio, Fidelity Emerging Asia Fund, and Fidelity Environment and Alternative Energy Portfolio; (v) contractually agreeing to reduce the management fees and impose other expense limitations on Spartan® 500 Index Fund and U.S. Bond Index Fund in connection with launching new institutional classes of these funds; (vi) changing the name, primary and supplemental benchmarks, and investment policies of Fidelity Global Strategies Fund to support the fund's flexible investment mandate and global orientation; and (vii) reducing the transfer agency account fee rates on certain accounts.
Investment Performance. The Board considered whether the fund has operated in accordance with its investment objective, as well as its record of compliance with its investment restrictions. It also reviewed the fund's absolute investment performance for each class, as well as the fund's relative investment performance for each class measured over multiple periods against a broad-based securities market index. The Board noted that FMR does not believe that a meaningful peer group exists against which to compare the fund's performance. The following charts considered by the Board show, over the one-, three-, and five-year periods ended December 31, 2010, the cumulative total returns of Institutional Class (Class I) and Class B of the fund and the cumulative total returns of a broad-based securities market index ("benchmark"). The returns of Institutional Class (Class I) and Class B show the performance of the highest and lowest performing classes, respectively (based on five-year performance).
Annual Report
Fidelity Advisor Real Estate Fund
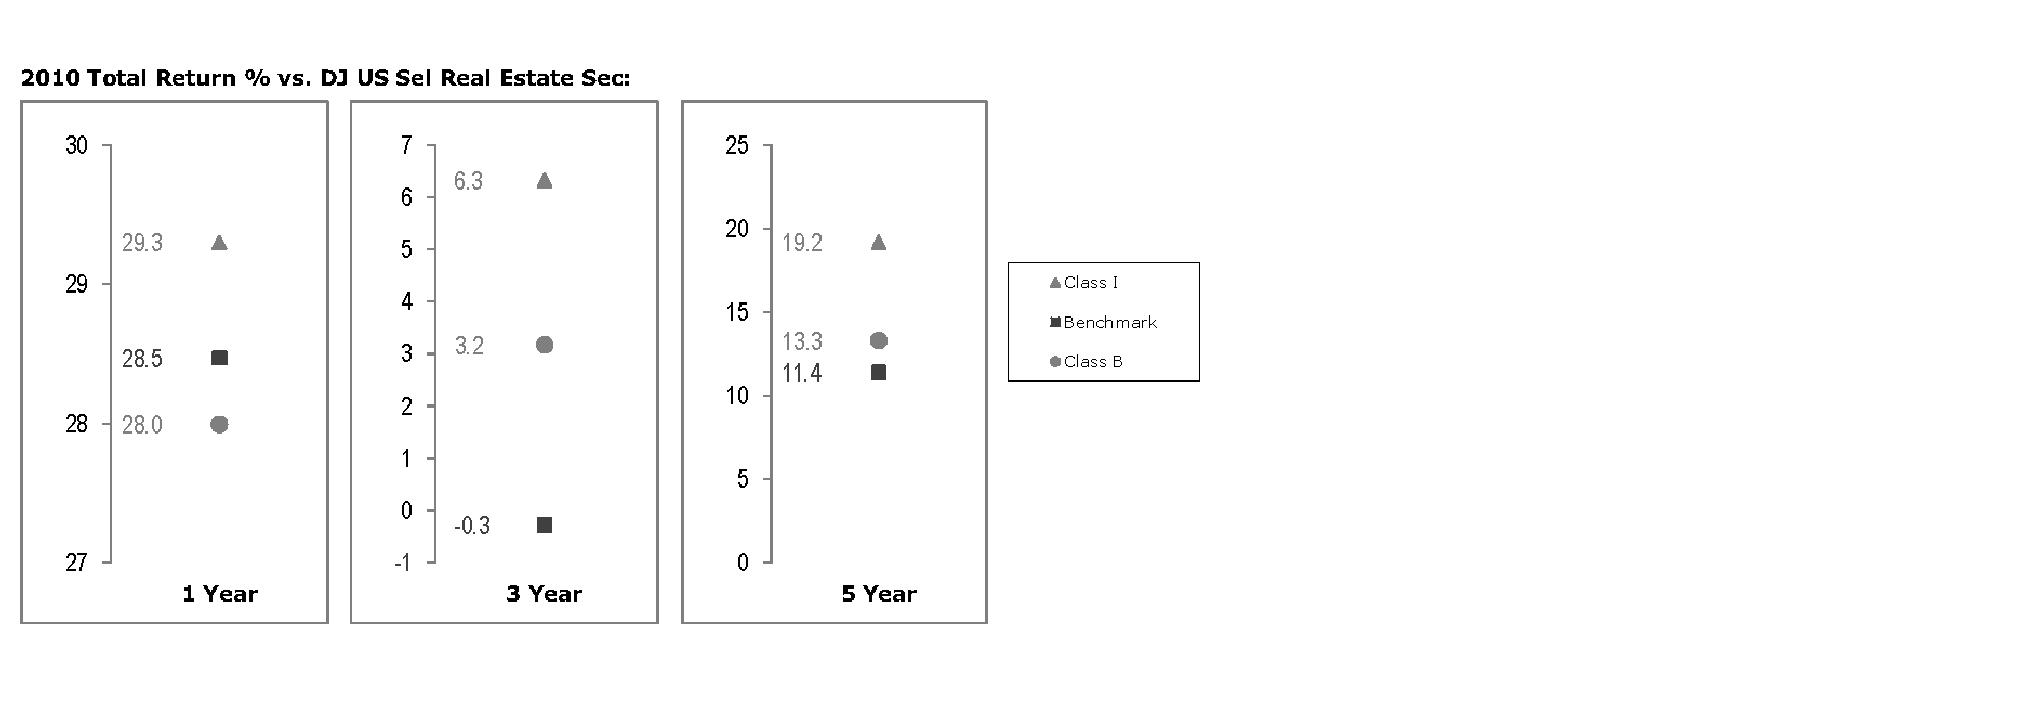
The Board noted that the investment performance of Institutional Class (Class I) of the fund compared favorably to its benchmark for all the periods shown. The Board considered that the variations in performance among the fund's classes reflect the variations in class expenses, which result in lower performance for higher expense classes. The Board also reviewed the fund's performance since inception as well as performance in the current year.
Based on its review, the Board concluded that the nature, extent, and quality of services provided to the fund under the Advisory Contracts should benefit the fund's shareholders.
Competitiveness of Management Fee and Total Expense Ratio. The Board considered the fund's management fee and total expense ratio compared to "mapped groups" of competitive funds and classes. Fidelity creates "mapped groups" by combining similar Lipper investment objective categories that have comparable management fee characteristics. Combining Lipper investment objective categories aids the Board's management fee and total expense ratio comparisons by broadening the competitive group used for comparison and by reducing the number of universes to which various Fidelity funds are compared.
Management Fee. The Board considered two proprietary management fee comparisons for the 12-month periods shown in the chart below. The group of Lipper funds used by the Board for management fee comparisons is referred to below as the "Total Mapped Group." The Total Mapped Group comparison focuses on a fund's standing relative to the total universe of comparable funds available to investors in terms of gross management fees before expense reimbursements or caps. "TMG %" represents the percentage of funds in the Total Mapped Group that had management fees that were lower than the fund's. For example, a TMG % of 6% means that 94% of the funds in the Total Mapped Group had higher management fees than the fund. The "Asset-Size Peer Group" (ASPG) comparison focuses on a fund's standing relative to non-Fidelity funds similar in size to the fund within the Total Mapped Group. The ASPG represents at least 15% of the funds in the Total Mapped Group with comparable asset size and management fee characteristics, subject to a minimum of 50 funds (or all funds in the Total Mapped Group if fewer than 50). Additional information, such as the ASPG quartile in which the fund's management fee ranked, is also included in the chart and considered by the Board.
Annual Report
Board Approval of Investment Advisory Contracts and
Management Fees - continued
Fidelity Advisor Real Estate Fund
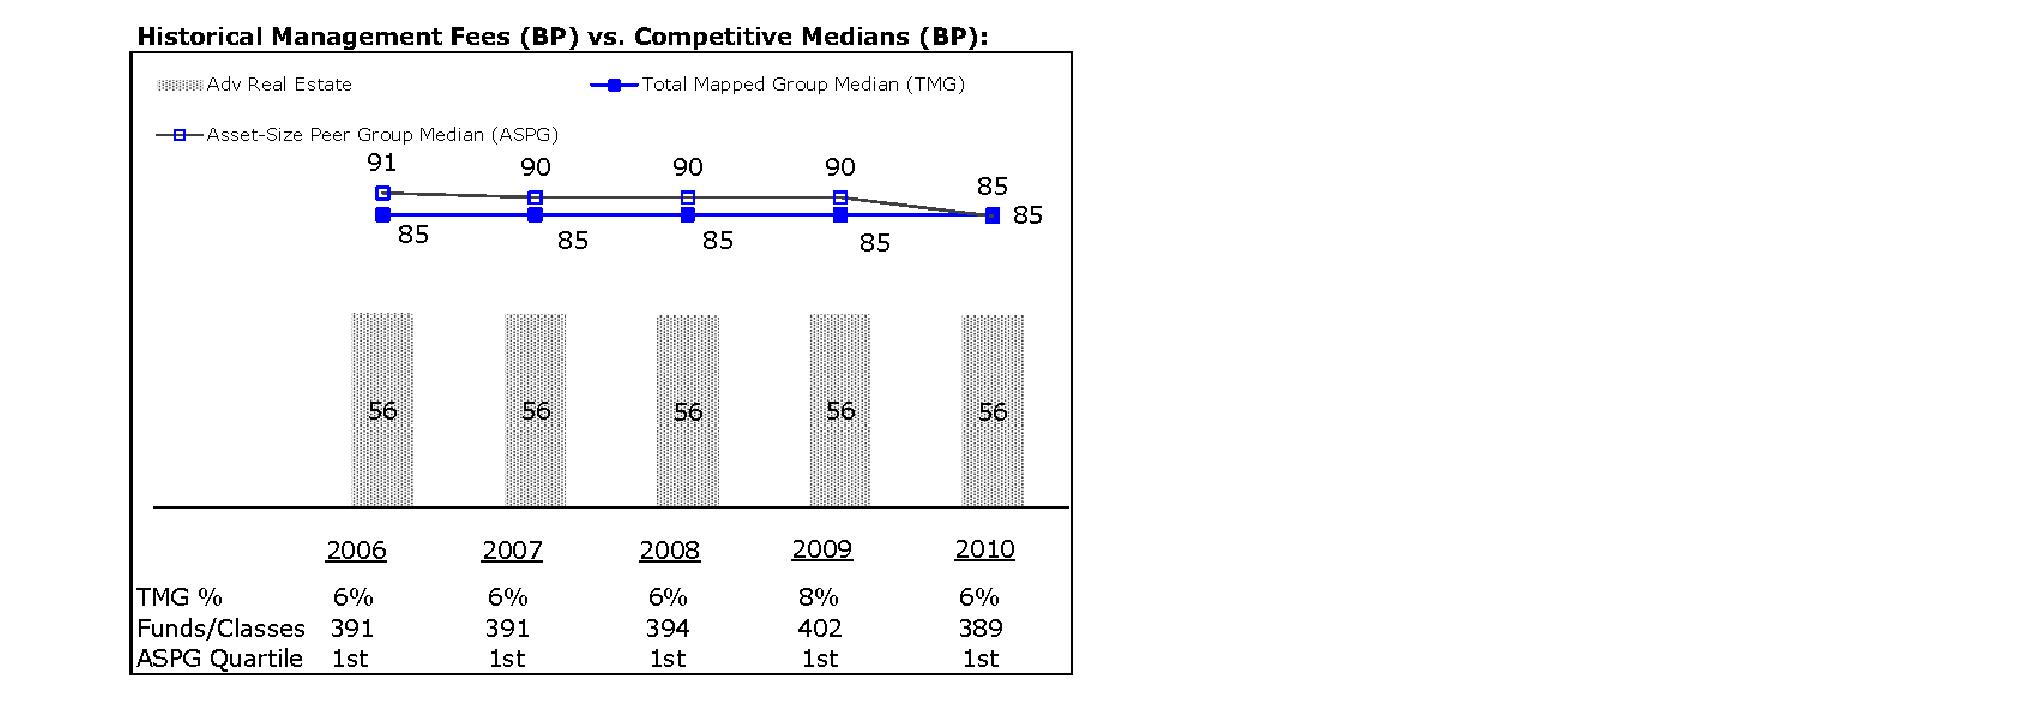
The Board noted that the fund's management fee ranked below the median of its Total Mapped Group and below the median of its ASPG for 2010.
Based on its review, the Board concluded that the fund's management fee is fair and reasonable in light of the services that the fund receives and the other factors considered.
Total Expense Ratio. In its review of each class's total expense ratio, the Board considered the fund's management fee as well as other fund or class expenses, as applicable, such as transfer agent fees, pricing and bookkeeping fees, fund-paid 12b-1 fees, and custodial, legal, and audit fees. The Board also noted the effects of any waivers and reimbursements on fees and expenses. As part of its review, the Board also considered the current and historical total expense ratios of each class of the fund compared to competitive fund median expenses. Each class of the fund is compared to those funds and classes in the Total Mapped Group (used by the Board for management fee comparisons) that have a similar sales load structure.
Annual Report
The Board noted that the total expense ratio of each class ranked below its competitive median for 2010. The Board considered that various factors, including 12b-1 fees, positive or negative performance adjustments, and relatively higher other expenses in the case of small fund size, can affect total expense ratios.
Fees Charged to Other Fidelity Clients. The Board also considered Fidelity fee structures and other information with respect to clients of FMR and its affiliates, such as other mutual funds advised or subadvised by FMR or its affiliates, pension plan clients, and other institutional clients. In March 2010, the Board created an ad hoc joint committee with the board of other Fidelity funds (the Committee) to review and compare Fidelity's institutional investment advisory business with its business of providing services to the Fidelity funds, including the differences in services provided, fees charged, and costs incurred, as well as competition in their respective marketplaces.
Based on its review of total expense ratios and fees charged to other Fidelity clients, the Board concluded that the total expense ratio of each class of the fund was reasonable in light of the services that the fund and its shareholders receive and the other factors considered, including the findings of the Committee.
Costs of the Services and Profitability. The Board considered the revenues earned and the expenses incurred by Fidelity in conducting the business of developing, marketing, distributing, managing, administering and servicing the fund and its shareholders. The Board also considered the level of Fidelity's profits in respect of all the Fidelity funds.
On an annual basis, FMR presents to the Board Fidelity's profitability for the fund. Fidelity calculates the profitability for each fund, as well as aggregate profitability for groups of Fidelity funds and all Fidelity funds, using a series of detailed revenue and cost allocation methodologies which originate with the books and records of Fidelity on which Fidelity's audited financial statements are based. The Audit Committee of the Board reviews any significant changes from the prior year's methodologies.
PricewaterhouseCoopers LLP (PwC), independent registered public accounting firm and auditor to Fidelity and certain Fidelity funds, has been engaged annually by the Board as part of the Board's assessment of Fidelity's profitability analysis. PwC's engagement includes the review and assessment of Fidelity's methodologies used in determining the revenues and expenses attributable to Fidelity's mutual fund business, and completion of agreed-upon procedures surrounding the mathematical accuracy of fund profitability and its conformity to allocation methodologies. After considering PwC's reports issued under the engagement and information provided by Fidelity, the Board concluded that while other allocation methods may also be reasonable, Fidelity's profitability methodologies are reasonable in all material respects.
Annual Report
Board Approval of Investment Advisory Contracts and
Management Fees - continued
The Board also reviewed Fidelity's non-fund businesses and fall-out benefits related to the mutual fund business as well as cases where Fidelity's affiliates may benefit from or be related to the fund's business.
The Board considered the costs of the services provided by and the profits realized by Fidelity in connection with the operation of the fund and was satisfied that the profitability was not excessive in the circumstances.
Economies of Scale. The Board considered whether there have been economies of scale in respect of the management of the Fidelity funds, whether the Fidelity funds (including the fund) have appropriately benefited from any such economies of scale, and whether there is potential for realization of any further economies of scale. The Board considered the extent to which the fund will benefit from economies of scale through increased services to the fund, through waivers or reimbursements, or through fee or expense reductions. The Board also noted that in 2009, it and the board of other Fidelity funds created an ad hoc committee (the Economies of Scale Committee) to analyze whether FMR attains economies of scale in respect of the management and servicing of the Fidelity funds, whether the Fidelity funds have appropriately benefited from such economies of scale, and whether there is potential for realization of any further economies of scale.
The Board recognized that the fund's management contract incorporates a "group fee" structure, which provides for lower group fee rates as total fund assets under FMR's management increase, and for higher group fee rates as total fund assets under FMR's management decrease. FMR calculates the group fee rates based on a tiered asset "breakpoint" schedule that varies based on asset class. The Board considered that the group fee is designed to deliver the benefits of economies of scale to fund shareholders when total Fidelity fund assets increase, even if assets of any particular fund are unchanged or have declined, because some portion of Fidelity's costs are attributable to services provided to all Fidelity funds, and all funds benefit if those costs can be allocated among more assets. The Board concluded that, given the group fee structure, fund shareholders will benefit from lower management fees as assets under FMR's management increase at the fund complex level, regardless of whether Fidelity achieves any such economies of scale.
The Board concluded, taking into account the analysis of the Economies of Scale Committee, that any potential economies of scale are being appropriately shared between fund shareholders and Fidelity.
Additional Information Requested by the Board. In order to develop fully the factual basis for consideration of the Fidelity funds' Advisory Contracts, the Board requested and received additional information on certain topics, including (i) fund performance trends, actions to be taken by FMR to improve certain funds' overall performance, and Fidelity's long-term strategies for certain funds; (ii) portfolio manager changes that have occurred during the past year and length of portfolio manager tenure for different categories of funds over time; (iii) Fidelity's compensation structure for portfolio managers and other key personnel and strategies for attracting and retaining non-investment personnel; (iv) the amount of the investment that each portfolio manager has made in the Fidelity fund(s) that he or she manages; (v) historical trends in Fidelity's realization of fall-out benefits; (vi) Fidelity's group fee structures and the rationale for the individual fee rates of certain funds; (vii) fund profitability methodology and the impact of certain factors on fund profitability results; (viii) trends regarding industry use of performance fee structures and Fidelity's compliance practices with respect to performance adjustment calculations; (ix) the fee structures in place for certain other Fidelity clients; and (x) explanations regarding the relative total expense ratios of certain funds and classes, total expense competitive trends, and actions that might be taken by FMR to reduce total expense ratios for certain funds and classes.
Annual Report
Based on its evaluation of all of the conclusions noted above, and after considering all factors it believed relevant, the Board ultimately concluded that the advisory fee structures are fair and reasonable, and that the fund's Advisory Contracts should be renewed.
Annual Report
Investment Adviser
Fidelity Management & Research Company
Boston, MA
Investment Sub-Advisers
FMR Co., Inc.
Fidelity Management & Research
(Hong Kong) Limited
Fidelity Management & Research
(Japan) Inc.
Fidelity Management & Research
(U.K.) Inc.
General Distributor
Fidelity Distributors Corporation
Boston, MA
Transfer and Service Agents
Fidelity Investments Institutional Operations Company, Inc.
Boston, MA
Fidelity Service Company, Inc.
Boston, MA
Custodian
The Bank of New York Mellon
New York, NY
ARE-UANN-0911
1.789707.108

(Fidelity Investment logo)(registered trademark)
Fidelity Advisor®
Real Estate
Fund - Institutional Class
Annual Report
July 31, 2011
(2_fidelity_logos) (Registered_Trademark)
Contents
Chairman's Message | <Click Here> | The Chairman's message to shareholders. |
Performance | <Click Here> | How the fund has done over time. |
Management's Discussion of Fund Performance | <Click Here> | The Portfolio Manager's review of fund performance and strategy. |
Shareholder Expense Example | <Click Here> | An example of shareholder expenses. |
Investment Changes | <Click Here> | A summary of major shifts in the fund's investments over the past six months. |
Investments | <Click Here> | A complete list of the fund's investments with their market values. |
Financial Statements | <Click Here> | Statements of assets and liabilities, operations, and changes in net assets, as well as financial highlights. |
Notes | <Click Here> | Notes to financial statements. |
Report of Independent Registered Public Accounting Firm | <Click Here> | |
Trustees and Officers | <Click Here> | |
Distributions | <Click Here> | |
Board Approval of Investment Advisory Contracts and Management Fees | <Click Here> | |
To view a fund's proxy voting guidelines and proxy voting record for the 12-month period ended June 30, visit http://www.fidelity.com/proxyvotingresults or visit the Securities and Exchange Commission's (SEC) web site at http://www.sec.gov. You may also call 1-877-208-0098 to request a free copy of the proxy voting guidelines.
Standard & Poor's, S&P and S&P 500 are registered service marks of The McGraw-Hill Companies, Inc. and have been licensed for use by Fidelity Distributors Corporation.
Other third party marks appearing herein are the property of their respective owners.
All other marks appearing herein are registered or unregistered trademarks or service marks of FMR LLC or an affiliated company.
Annual Report
This report and the financial statements contained herein are submitted for the general information of the shareholders of the fund. This report is not authorized for distribution to prospective investors in the fund unless preceded or accompanied by an effective prospectus.
A fund files its complete schedule of portfolio holdings with the SEC for the first and third quarters of each fiscal year on Form N-Q. Forms N-Q are available on the SEC's web site at http://www.sec.gov. A fund's Forms N-Q may be reviewed and copied at the SEC's Public Reference Room in Washington, DC. Information regarding the operation of the SEC's Public Reference Room may be obtained by calling 1-800-SEC-0330. For a complete list of a fund's portfolio holdings, view the most recent holdings listing, semiannual report, or annual report on Fidelity's web site at http://www.fidelity.com, http://www.advisor.fidelity.com, or http://www.401k.com, as applicable.
NOT FDIC INSURED • MAY LOSE VALUE • NO BANK GUARANTEE
Neither the fund nor Fidelity Distributors Corporation is a bank.
Annual Report
(photo_of_James_C_Curvey)
Dear Shareholder:
The second half of 2011 began with U.S. equities continuing to give back some of the gains achieved earlier in the year. In the days leading up to July 31, markets were shaken by a political stalemate in which Congress struggled to address the debt ceiling issue before an early-August deadline. The resulting uncertainty held back markets in July, the third consecutive monthly decline for equities, effectively reversing the positive momentum seen through the end of April. Financial markets are always unpredictable, of course, but there are several time-tested investment principles that can help put the odds in your favor.
One of the basic tenets is to invest for the long term. Over time, riding out the markets' inevitable ups and downs has proven much more effective than selling into panic or chasing the hottest trend. Even missing only a few of the markets' best days can significantly diminish investor returns. Patience also affords the benefits of compounding - of earning interest on additional income or reinvested dividends and capital gains. There can be tax advantages and cost benefits to consider as well. While staying the course doesn't eliminate risk, it can considerably lessen the effect of short-term declines.
You can further manage your investing risk through diversification. And today, more than ever, geographic diversification should be taken into account. Studies indicate that asset allocation is the single most important determinant of a portfolio's long-term success. The right mix of stocks, bonds and cash - aligned to your particular risk tolerance and investment objective - is very important. Age-appropriate rebalancing is also an essential aspect of asset allocation. For younger investors, an emphasis on equities - which historically have been the best-performing asset class over time - is encouraged. As investors near their specific goal, such as retirement or sending a child to college, consideration may be given to replacing volatile assets (e.g. common stocks) with more-stable fixed investments (bonds or savings plans).
A third principle - investing regularly - can help lower the average cost of your purchases. Investing a certain amount of money each month or quarter helps ensure you won't pay for all your shares at market highs. This strategy - known as dollar cost averaging - also reduces "emotion" from investing, helping shareholders avoid selling weak performers just prior to an upswing, or chasing a hot performer just before a correction.
We invite you to contact us via the Internet, through our Investor Centers or by phone. It is our privilege to provide you the information you need to make the investments that are right for you.
Sincerely,
(The acting chairman's signature appears here.)
James C. Curvey
Acting Chairman
Annual Report
Average annual total return reflects the change in the value of an investment, assuming reinvestment of the class' distributions from dividend income and capital gains (the profits earned upon the sale of securities that have grown in value, if any) and assuming a constant rate of performance each year. The $10,000 table and the fund's returns do not reflect the deduction of taxes that a shareholder would pay on fund distributions or the redemption of fund shares. During periods of reimbursement by Fidelity, a fund's total return will be greater than it would be had the reimbursement not occurred. How a fund did yesterday is no guarantee of how it will do tomorrow.
Average Annual Total Returns
Periods ended July 31, 2011 | Past 1
year | Past 5
years | Life of
fund A |
Institutional Class | 23.92% | 2.40% | 11.94% |
A From September 12, 2002.
$10,000 Over Life of Fund
Let's say hypothetically that $10,000 was invested in Fidelity Advisor® Real Estate Fund - Institutional Class on September 12, 2002, when the fund started. The chart shows how the value of your investment would have changed, and also shows how the S&P 500® Index performed over the same period. See above for additional information regarding the performance of Institutional Class.
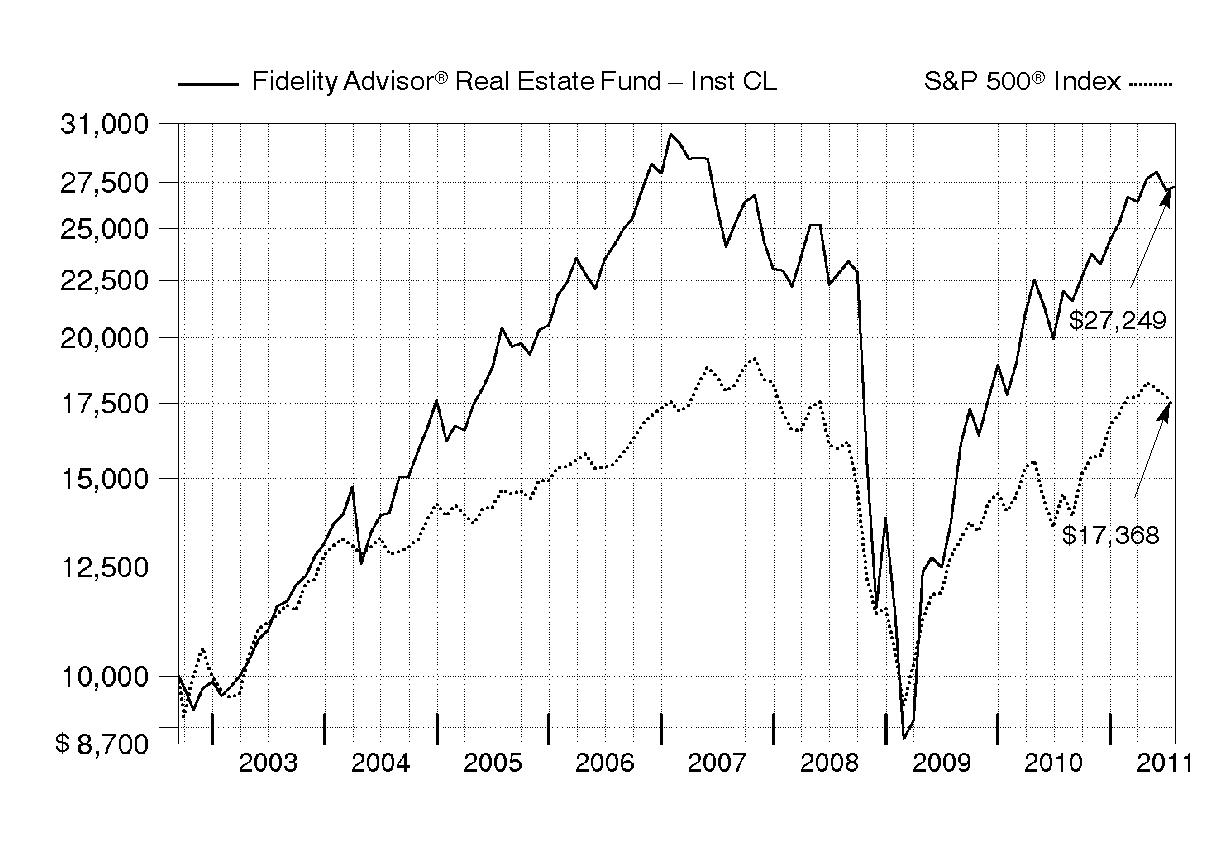
Annual Report
Market Recap: U.S. stocks registered solid double-digit gains for the 12 months ending July 31, 2011, extending a rally that began more than two years earlier. Despite a rough start in August 2010, markets turned positive in September, as increased demand for capital goods and other upbeat indicators trumped investor worry about a U.S. recessionary relapse. The broad market, as measured by the S&P 500® Index, rose 9% that month, its biggest September gain in 71 years. Seven more monthly advances followed, fueled by encouraging corporate earnings and economic activity. However, volatility picked up in the period's latter months, as markets reacted to continued high U.S. unemployment, nagging debt troubles in Europe and looming legislative battles over the federal debt ceiling. May unemployment rose above 9% for the first time in 2011, contributing to a traditional "June swoon" for stocks. Market uncertainty lingered in July, when the S&P 500® posted its second-biggest monthly loss of the period. For the full year, the S&P 500® climbed 19.65%, while the blue-chip-laden Dow Jones Industrial AverageSM rose a comparable 19.09% and the technology-heavy Nasdaq Composite® Index gained 23.40%. On the capitalization spectrum, stocks of mid-cap companies fared best, with the Russell Midcap® Index rising 24.51% and the small-cap Russell 2000® Index adding 23.92%.
Comments from Samuel Wald, Portfolio Manager of Fidelity Advisor® Real Estate Fund: For the year, the fund's Class A, Class T, Class B and Class C shares gained 23.63%, 23.28%, 22.69% and 22.69%, respectively (excluding sales charges), beating the S&P 500 but trailing the 25.23% return of the Dow Jones U.S. Select Real Estate Securities IndexSM. The biggest individual detractor versus the sector benchmark was Digital Realty Trust, an owner and operator of data centers. Digital Realty's shares were flat during a strong market, weighed down by investors' concern about too much supply of data center space. Sunstone Hotel Investors also hurt. The stock was part of a so-called pairs trade with other hotel stocks, meaning I chose to emphasize certain hotels while underweighting others whose performance prospects struck me as more limited. As a group, hotels generally trailed, so overweighting Sunstone hampered the fund's results. Health care-related property companies lagged as a group, and Healthcare Realty Trust and Ventas were notable detractors in the portfolio. On the positive side, industrial REIT ProLogis was a top contributor. The company merged with AMB Property in June 2011. Also, several out-of-benchmark stocks continued to gain significant ground since the depths of the financial crisis in 2008 - including commercial real estate services company CB Richard Ellis Group and Sunrise Senior Living, which operates housing facilities for seniors.
Comments from Samuel Wald, Portfolio Manager of Fidelity Advisor® Real Estate Fund: For the year, the fund's Institutional Class shares gained 23.92%, beating the S&P 500 but trailing the 25.23% return of the Dow Jones U.S. Select Real Estate Securities IndexSM. The biggest individual detractor versus the sector benchmark was Digital Realty Trust, an owner and operator of data centers. Digital Realty's shares were flat during a strong market, weighed down by investors' concern about too much supply of data center space. Sunstone Hotel Investors also hurt. The stock was part of a so-called pairs trade with other hotel stocks, meaning I chose to emphasize certain hotels while underweighting others whose performance prospects struck me as more limited. As a group, hotels generally trailed, so overweighting Sunstone hampered the fund's results. Health care-related property companies lagged as a group, and Healthcare Realty Trust and Ventas were notable detractors in the portfolio. On the positive side, industrial REIT ProLogis was a top contributor. The company merged with AMB Property in June 2011. Also, several out-of-benchmark stocks continued to gain significant ground since the depths of the financial crisis in 2008 - including commercial services real estate company CB Richard Ellis Group, a real estate services company no longer in the portfolio at period end, and Sunrise Senior Living, which operates housing facilities for seniors.
Annual Report
The views expressed above reflect those of the portfolio manager(s) only through the end of the period as stated on the cover of this report and do not necessarily represent the views of Fidelity or any other person in the Fidelity organization. Any such views are subject to change at any time based upon market or other conditions and Fidelity disclaims any responsibility to update such views. These views may not be relied on as investment advice and, because investment decisions for a Fidelity fund are based on numerous factors, may not be relied on as an indication of trading intent on behalf of any Fidelity fund.
Annual Report
Shareholder Expense Example
As a shareholder of the Fund, you incur two types of costs: (1) transaction costs, including sales charges (loads) on purchase payments or redemption proceeds, and (2) ongoing costs, including management fees, distribution and/or service (12b-1) fees and other Fund expenses. This Example is intended to help you understand your ongoing costs (in dollars) of investing in the Fund and to compare these costs with the ongoing costs of investing in other mutual funds.
The Example is based on an investment of $1,000 invested at the beginning of the period and held for the entire period (February 1, 2011 to July 31, 2011).
Actual Expenses
The first line of the accompanying table for each class of the Fund provides information about actual account values and actual expenses. You may use the information in this line, together with the amount you invested, to estimate the expenses that you paid over the period. Simply divide your account value by $1,000.00 (for example, an $8,600 account value divided by $1,000.00 = 8.6), then multiply the result by the number in the first line for a class of the Fund under the heading entitled "Expenses Paid During Period" to estimate the expenses you paid on your account during this period. In addition, the Fund, as a shareholder in the underlying Fidelity Central Funds, will indirectly bear its pro-rata share of the fees and expenses incurred by the underlying Fidelity Central Funds. These fees and expenses are not included in the Fund's annualized expense ratio used to calculate the expense estimate in the table below.
Hypothetical Example for Comparison Purposes
The second line of the accompanying table for each class of the Fund provides information about hypothetical account values and hypothetical expenses based on a Class' actual expense ratio and an assumed rate of return of 5% per year before expenses, which is not the Class' actual return. The hypothetical account values and expenses may not be used to estimate the actual ending account balance or expenses you paid for the period. You may use this information to compare the ongoing costs of investing in the Fund and other funds. To do so, compare this 5% hypothetical example with the 5% hypothetical examples that appear in the shareholder reports of the other funds. In addition, the Fund, as a shareholder in the underlying Fidelity Central Funds, will indirectly bear its pro-rata share of the fees and expenses incurred by the underlying Fidelity Central Funds. These fees and expenses are not included in the Fund's annualized expense ratio used to calculate the expense estimate in the table below.
Please note that the expenses shown in the table are meant to highlight your ongoing costs only and do not reflect any transaction costs. Therefore, the second line of the table is useful in comparing ongoing costs only, and will not help you determine the relative total costs of owning different funds. In addition, if these transactional costs were included, your costs would have been higher.
Annual Report
| Annualized
Expense Ratio | Beginning
Account Value
February 1, 2011 | Ending
Account Value
July 31, 2011 | Expenses Paid
During Period*
February 1, 2011 to July 31, 2011 |
Class A | 1.17% | | | |
Actual | | $ 1,000.00 | $ 1,074.80 | $ 6.02 |
Hypothetical A | | $ 1,000.00 | $ 1,018.99 | $ 5.86 |
Class T | 1.43% | | | |
Actual | | $ 1,000.00 | $ 1,073.60 | $ 7.35 |
Hypothetical A | | $ 1,000.00 | $ 1,017.70 | $ 7.15 |
Class B | 1.92% | | | |
Actual | | $ 1,000.00 | $ 1,071.20 | $ 9.86 |
Hypothetical A | | $ 1,000.00 | $ 1,015.27 | $ 9.59 |
Class C | 1.92% | | | |
Actual | | $ 1,000.00 | $ 1,071.30 | $ 9.86 |
Hypothetical A | | $ 1,000.00 | $ 1,015.27 | $ 9.59 |
Institutional Class | .90% | | | |
Actual | | $ 1,000.00 | $ 1,076.20 | $ 4.63 |
Hypothetical A | | $ 1,000.00 | $ 1,020.33 | $ 4.51 |
A 5% return per year before expenses
* Expenses are equal to each Class' annualized expense ratio, multiplied by the average account value over the period, multiplied by 181/365 (to reflect the one-half year period).
Annual Report
Investment Changes (Unaudited)
Top Ten Stocks as of July 31, 2011 |
| % of fund's
net assets | % of fund's net assets
6 months ago |
Simon Property Group, Inc. | 9.4 | 10.0 |
Public Storage | 7.3 | 7.4 |
Ventas, Inc. | 6.8 | 5.5 |
Prologis, Inc. | 5.0 | 5.4 |
Boston Properties, Inc. | 4.7 | 4.0 |
SL Green Realty Corp. | 4.5 | 4.3 |
Alexandria Real Estate Equities, Inc. | 4.0 | 3.7 |
Essex Property Trust, Inc. | 3.9 | 2.9 |
Equity Residential (SBI) | 3.6 | 3.1 |
Mid-America Apartment Communities, Inc. | 3.4 | 3.2 |
| 52.6 | |
Top Five REIT Sectors as of July 31, 2011 |
| % of fund's
net assets | % of fund's net assets
6 months ago |
REITs - Office Buildings | 18.1 | 15.2 |
REITs - Apartments | 15.8 | 14.7 |
REITs - Malls | 15.2 | 14.9 |
REITs - Industrial Buildings | 13.5 | 13.6 |
REITs - Health Care Facilities | 11.0 | 10.6 |
Asset Allocation (% of fund's net assets) |
As of July 31, 2011* | As of January 31, 2011** |
| Stocks 97.3% | | | Stocks 97.6% | |
| Convertible
Securities 0.1% | | | Convertible
Securities 0.2% | |
| Short-Term
Investments and
Net Other Assets 2.6% | | | Short-Term
Investments and
Net Other Assets 2.2% | |
* Foreign investments | 1.1% | | ** Foreign investments | 1.2% | |

Annual Report
Investments July 31, 2011
Showing Percentage of Net Assets
Common Stocks - 97.3% |
| Shares | | Value |
COMMERCIAL SERVICES & SUPPLIES - 1.0% |
Security & Alarm Services - 1.0% |
The Geo Group, Inc. (a) | 245,678 | | $ 5,110,102 |
HEALTH CARE PROVIDERS & SERVICES - 3.6% |
Health Care Facilities - 3.6% |
Brookdale Senior Living, Inc. (a) | 294,151 | | 6,291,890 |
Capital Senior Living Corp. (a) | 231,550 | | 2,035,325 |
Emeritus Corp. (a)(d) | 344,465 | | 6,768,737 |
Sunrise Senior Living, Inc. (a)(d) | 287,892 | | 2,539,207 |
TOTAL HEALTH CARE FACILITIES | | 17,635,159 |
REAL ESTATE INVESTMENT TRUSTS - 89.3% |
REITs - Apartments - 15.8% |
AvalonBay Communities, Inc. | 32,223 | | 4,324,004 |
Camden Property Trust (SBI) | 21,664 | | 1,453,004 |
Education Realty Trust, Inc. | 1,029,911 | | 9,042,619 |
Equity Residential (SBI) | 281,355 | | 17,393,366 |
Essex Property Trust, Inc. (d) | 137,464 | | 19,294,447 |
Mid-America Apartment Communities, Inc. | 234,802 | | 16,621,634 |
Post Properties, Inc. | 213,982 | | 9,072,837 |
TOTAL REITS - APARTMENTS | | 77,201,911 |
REITs - Health Care Facilities - 11.0% |
HCP, Inc. | 259,711 | | 9,539,185 |
Health Care REIT, Inc. (d) | 42,900 | | 2,264,262 |
Healthcare Realty Trust, Inc. | 443,169 | | 8,686,112 |
Ventas, Inc. | 616,833 | | 33,389,170 |
TOTAL REITS - HEALTH CARE FACILITIES | | 53,878,729 |
REITs - Hotels - 5.6% |
Chesapeake Lodging Trust | 395,498 | | 6,525,717 |
DiamondRock Hospitality Co. | 703,806 | | 7,192,897 |
Host Hotels & Resorts, Inc. | 295,853 | | 4,689,270 |
Summit Hotel Properties, Inc. | 66,000 | | 744,480 |
Sunstone Hotel Investors, Inc. (a) | 922,357 | | 8,218,201 |
TOTAL REITS - HOTELS | | 27,370,565 |
Common Stocks - continued |
| Shares | | Value |
REAL ESTATE INVESTMENT TRUSTS - CONTINUED |
REITs - Industrial Buildings - 13.5% |
DCT Industrial Trust, Inc. | 715,400 | | $ 3,877,468 |
Prologis, Inc. | 681,034 | | 24,265,241 |
Public Storage | 300,541 | | 35,953,720 |
Stag Industrial, Inc. | 151,500 | | 1,861,935 |
TOTAL REITS - INDUSTRIAL BUILDINGS | | 65,958,364 |
REITs - Malls - 15.2% |
CBL & Associates Properties, Inc. | 752,440 | | 13,363,334 |
Simon Property Group, Inc. | 381,812 | | 46,012,165 |
The Macerich Co. | 285,293 | | 15,157,617 |
TOTAL REITS - MALLS | | 74,533,116 |
REITs - Management/Investment - 3.0% |
Digital Realty Trust, Inc. (d) | 214,150 | | 13,108,122 |
Lexington Corporate Properties Trust | 206,500 | | 1,734,600 |
TOTAL REITS - MANAGEMENT/INVESTMENT | | 14,842,722 |
REITs - Office Buildings - 18.1% |
Alexandria Real Estate Equities, Inc. | 238,460 | | 19,553,720 |
Boston Properties, Inc. | 214,649 | | 23,044,717 |
Brandywine Realty Trust (SBI) | 400,100 | | 4,797,199 |
Douglas Emmett, Inc. | 541,700 | | 10,834,000 |
Highwoods Properties, Inc. (SBI) | 234,356 | | 8,068,877 |
SL Green Realty Corp. | 267,766 | | 21,962,167 |
TOTAL REITS - OFFICE BUILDINGS | | 88,260,680 |
REITs - Shopping Centers - 7.1% |
Acadia Realty Trust (SBI) | 474,500 | | 9,959,755 |
Developers Diversified Realty Corp. | 182,900 | | 2,672,169 |
Excel Trust, Inc. | 179,400 | | 2,057,718 |
Glimcher Realty Trust | 230,082 | | 2,266,308 |
Kimco Realty Corp. | 278,311 | | 5,296,258 |
Common Stocks - continued |
| Shares | | Value |
REAL ESTATE INVESTMENT TRUSTS - CONTINUED |
REITs - Shopping Centers - continued |
Kite Realty Group Trust | 396,646 | | $ 1,800,773 |
Vornado Realty Trust | 115,088 | | 10,766,482 |
TOTAL REITS - SHOPPING CENTERS | | 34,819,463 |
TOTAL REAL ESTATE INVESTMENT TRUSTS | | 436,865,550 |
REAL ESTATE MANAGEMENT & DEVELOPMENT - 3.4% |
Diversified Real Estate Activities - 0.6% |
The St. Joe Co. (a)(d) | 155,098 | | 2,746,786 |
Real Estate Operating Companies - 2.1% |
Brookfield Properties Corp. | 290,130 | | 5,511,680 |
Forest City Enterprises, Inc. Class A (a) | 275,367 | | 4,959,360 |
TOTAL REAL ESTATE OPERATING COMPANIES | | 10,471,040 |
Real Estate Services - 0.7% |
Jones Lang LaSalle, Inc. | 41,100 | | 3,498,432 |
TOTAL REAL ESTATE MANAGEMENT & DEVELOPMENT | | 16,716,258 |
TOTAL COMMON STOCKS (Cost $407,650,085) | 476,327,069 |
Convertible Preferred Stocks - 0.1% |
| | | |
REAL ESTATE MANAGEMENT & DEVELOPMENT - 0.1% |
Real Estate Services - 0.1% |
Grubb & Ellis Co.: | | | |
12.00% (e) (Cost $800,000) | 8,000 | | 421,200 |
Money Market Funds - 7.0% |
| Shares | | Value |
Fidelity Cash Central Fund, 0.14% (b) | 11,317,362 | | $ 11,317,362 |
Fidelity Securities Lending Cash Central Fund, 0.15% (b)(c) | 22,777,989 | | 22,777,989 |
TOTAL MONEY MARKET FUNDS (Cost $34,095,351) | 34,095,351 |
TOTAL INVESTMENT PORTFOLIO - 104.4% (Cost $442,545,436) | | 510,843,620 |
NET OTHER ASSETS (LIABILITIES) - (4.4)% | | (21,477,548) |
NET ASSETS - 100% | $ 489,366,072 |
Legend |
(a) Non-income producing |
(b) Affiliated fund that is available only to investment companies and other accounts managed by Fidelity Investments. The rate quoted is the annualized seven-day yield of the fund at period end. A complete unaudited listing of the fund's holdings as of its most recent quarter end is available upon request. In addition, each Fidelity Central Fund's financial statements, which are not covered by the Fund's Report of Independent Registered Public Accounting Firm, are available on the SEC's website or upon request. |
(c) Investment made with cash collateral received from securities on loan. |
(d) Security or a portion of the security is on loan at period end. |
(e) Security exempt from registration under Rule 144A of the Securities Act of 1933. These securities may be resold in transactions exempt from registration, normally to qualified institutional buyers. At the end of the period, the value of these securities amounted to $421,200 or 0.1% of net assets. |
Affiliated Central Funds |
Information regarding fiscal year to date income earned by the Fund from investments in Fidelity Central Funds is as follows: |
Fund | Income earned |
Fidelity Cash Central Fund | $ 18,847 |
Fidelity Securities Lending Cash Central Fund | 260,883 |
Total | $ 279,730 |
Other Information |
The following is a summary of the inputs used, as of July 31, 2011, involving the Fund's assets and liabilities carried at fair value. The inputs or methodology used for valuing securities may not be an indication of the risk associated with investing in those securities. For more information on valuation inputs, and their aggregation into the levels used in the table below, please refer to the Security Valuation section in the accompanying Notes to Financial Statements. |
Valuation Inputs at Reporting Date: |
Description | Total | Level 1 | Level 2 | Level 3 |
Investments in Securities: | | | | |
Common Stocks | $ 476,327,069 | $ 476,327,069 | $ - | $ - |
Convertible Preferred Stocks | 421,200 | - | 421,200 | - |
Money Market Funds | 34,095,351 | 34,095,351 | - | - |
Total Investments in Securities: | $ 510,843,620 | $ 510,422,420 | $ 421,200 | $ - |
See accompanying notes which are an integral part of the financial statements.
Annual Report
Statement of Assets and Liabilities
| July 31, 2011 |
| | |
Assets | | |
Investment in securities, at value (including securities loaned of $22,368,418) - See accompanying schedule: Unaffiliated issuers (cost $408,450,085) | $ 476,748,269 | |
Fidelity Central Funds (cost $34,095,351) | 34,095,351 | |
Total Investments (cost $442,545,436) | | $ 510,843,620 |
Receivable for investments sold | | 5,004,229 |
Receivable for fund shares sold | | 719,046 |
Dividends receivable | | 72,514 |
Distributions receivable from Fidelity Central Funds | | 41,804 |
Other receivables | | 14,051 |
Total assets | | 516,695,264 |
| | |
Liabilities | | |
Payable for investments purchased | $ 2,281,382 | |
Payable for fund shares redeemed | 1,745,017 | |
Accrued management fee | 231,429 | |
Distribution and service plan fees payable | 120,136 | |
Other affiliated payables | 133,251 | |
Other payables and accrued expenses | 39,988 | |
Collateral on securities loaned, at value | 22,777,989 | |
Total liabilities | | 27,329,192 |
| | |
Net Assets | | $ 489,366,072 |
Net Assets consist of: | | |
Paid in capital | | $ 419,209,155 |
Undistributed net investment income | | 48,238 |
Accumulated undistributed net realized gain (loss) on investments and foreign currency transactions | | 1,810,495 |
Net unrealized appreciation (depreciation) on investments | | 68,298,184 |
Net Assets | | $ 489,366,072 |
See accompanying notes which are an integral part of the financial statements.
Annual Report
Statement of Assets and Liabilities - continued
| July 31, 2011 |
| | |
Calculation of Maximum Offering Price Class A:
Net Asset Value and redemption price per share ($178,977,617 ÷ 9,810,123 shares) | | $ 18.24 |
| | |
Maximum offering price per share (100/94.25 of $18.24) | | $ 19.35 |
Class T:
Net Asset Value and redemption price per share ($76,785,097 ÷ 4,209,422 shares) | | $ 18.24 |
| | |
Maximum offering price per share (100/96.50 of $18.24) | | $ 18.90 |
Class B:
Net Asset Value and offering price per share ($11,542,016 ÷ 639,326 shares)A | | $ 18.05 |
| | |
Class C:
Net Asset Value and offering price per share ($47,406,461 ÷ 2,629,781 shares)A | | $ 18.03 |
| | |
Institutional Class:
Net Asset Value, offering price and redemption price per share ($174,654,881 ÷ 9,511,305 shares) | | $ 18.36 |
A Redemption price per share is equal to net asset value less any applicable contingent deferred sales charge.
See accompanying notes which are an integral part of the financial statements.
Annual Report
Financial Statements - continued
Statement of Operations
| Year ended July 31, 2011 |
| | |
Investment Income | | |
Dividends | | $ 8,066,250 |
Interest | | 18,082 |
Income from Fidelity Central Funds | | 279,730 |
Total income | | 8,364,062 |
| | |
Expenses | | |
Management fee | $ 2,499,250 | |
Transfer agent fees | 1,333,250 | |
Distribution and service plan fees | 1,243,792 | |
Accounting and security lending fees | 179,190 | |
Custodian fees and expenses | 32,852 | |
Independent trustees' compensation | 2,343 | |
Registration fees | 91,738 | |
Audit | 47,710 | |
Legal | 1,623 | |
Interest | 94 | |
Miscellaneous | 4,692 | |
Total expenses before reductions | 5,436,534 | |
Expense reductions | (31,298) | 5,405,236 |
Net investment income (loss) | | 2,958,826 |
Realized and Unrealized Gain (Loss) Net realized gain (loss) on: | | |
Investment securities: | | |
Unaffiliated issuers | 54,421,902 | |
Foreign currency transactions | (7,617) | |
Total net realized gain (loss) | | 54,414,285 |
Change in net unrealized appreciation (depreciation) on investment securities | | 34,015,366 |
Net gain (loss) | | 88,429,651 |
Net increase (decrease) in net assets resulting from operations | | $ 91,388,477 |
See accompanying notes which are an integral part of the financial statements.
Annual Report
Statement of Changes in Net Assets
| Year ended
July 31,
2011 | Year ended
July 31,
2010 |
Increase (Decrease) in Net Assets | | |
Operations | | |
Net investment income (loss) | $ 2,958,826 | $ 3,902,914 |
Net realized gain (loss) | 54,414,285 | 36,224,187 |
Change in net unrealized appreciation (depreciation) | 34,015,366 | 74,426,342 |
Net increase (decrease) in net assets resulting
from operations | 91,388,477 | 114,553,443 |
Distributions to shareholders from net investment income | (3,454,847) | (3,478,958) |
Share transactions - net increase (decrease) | 12,993,567 | 98,330,995 |
Total increase (decrease) in net assets | 100,927,197 | 209,405,480 |
| | |
Net Assets | | |
Beginning of period | 388,438,875 | 179,033,395 |
End of period (including undistributed net investment income of $48,238 and undistributed net investment income of $744,500, respectively) | $ 489,366,072 | $ 388,438,875 |
See accompanying notes which are an integral part of the financial statements.
Annual Report
Financial Highlights - Class A
Years ended July 31, | 2011 | 2010 | 2009 | 2008 | 2007 |
Selected Per-Share Data | | | | | |
Net asset value, beginning of period | $ 14.88 | $ 9.41 | $ 16.39 | $ 18.67 | $ 20.34 |
Income from Investment Operations | | | | | |
Net investment income (loss) C | .12 | .19 | .27 | .30 | .18 |
Net realized and unrealized gain (loss) | 3.37 | 5.46 | (6.86) | (1.24) | (.17) |
Total from investment operations | 3.49 | 5.65 | (6.59) | (.94) | .01 |
Distributions from net investment income | (.13) | (.18) | (.36) | (.26) | (.18) |
Distributions from net realized gain | - | - | (.03) | (1.09) | (1.50) |
Total distributions | (.13) | (.18) | (.39) | (1.34) G | (1.68) |
Net asset value, end of period | $ 18.24 | $ 14.88 | $ 9.41 | $ 16.39 | $ 18.67 |
Total Return A,B | 23.63% | 60.38% | (40.19)% | (5.66)% | (.65)% |
Ratios to Average Net Assets D,F | | | | |
Expenses before reductions | 1.19% | 1.23% | 1.27% | 1.22% | 1.25% |
Expenses net of fee waivers, if any | 1.19% | 1.23% | 1.25% | 1.22% | 1.25% |
Expenses net of all reductions | 1.18% | 1.22% | 1.25% | 1.21% | 1.25% |
Net investment income (loss) | .69% | 1.45% | 2.73% | 1.71% | .81% |
Supplemental Data | | | | | |
Net assets, end of period (000 omitted) | $ 178,978 | $ 117,929 | $ 62,422 | $ 109,442 | $ 117,831 |
Portfolio turnover rate E | 63% | 60% | 98% | 86% | 84% |
A Total returns would have been lower if certain expenses had not been reduced during the applicable periods shown.
B Total returns do not include the effect of the sales charges.
C Calculated based on average shares outstanding during the period.
D Fees and expenses of any underlying Fidelity Central Funds are not included in the Fund's expense ratio. The Fund indirectly bears its proportionate share of the expenses of any underlying Fidelity Central Funds.
E Amount does not include the portfolio activity of any underlying Fidelity Central Funds.
F Expense ratios reflect operating expenses of the class. Expenses before reductions do not reflect amounts reimbursed by the investment adviser or reductions from brokerage service arrangements or reductions from other expense offset arrangements and do not represent the amount paid by the class during periods when reimbursements or reductions occur. Expenses net of fee waivers reflect expenses after reimbursement by the investment adviser but prior to reductions from brokerage service arrangements or other expense offset arrangements. Expenses net of all reductions represent the net expenses paid by the class.
G Total distributions of $1.34 per share is comprised of distributions from net investment income of $.256 and distributions from net realized gain of $1.085 per share.
See accompanying notes which are an integral part of the financial statements.
Annual Report
Financial Highlights - Class T
Years ended July 31, | 2011 | 2010 | 2009 | 2008 | 2007 |
Selected Per-Share Data | | | | | |
Net asset value, beginning of period | $ 14.90 | $ 9.42 | $ 16.40 | $ 18.64 | $ 20.31 |
Income from Investment Operations | | | | | |
Net investment income (loss) C | .07 | .15 | .25 | .26 | .12 |
Net realized and unrealized gain (loss) | 3.38 | 5.47 | (6.87) | (1.24) | (.16) |
Total from investment operations | 3.45 | 5.62 | (6.62) | (.98) | (.04) |
Distributions from net investment income | (.11) | (.14) | (.33) | (.17) | (.13) |
Distributions from net realized gain | - | - | (.03) | (1.09) | (1.50) |
Total distributions | (.11) | (.14) | (.36) | (1.26) G | (1.63) |
Net asset value, end of period | $ 18.24 | $ 14.90 | $ 9.42 | $ 16.40 | $ 18.64 |
Total Return A,B | 23.28% | 60.02% | (40.33)% | (5.88)% | (.89)% |
Ratios to Average Net Assets D,F | | | | | |
Expenses before reductions | 1.44% | 1.49% | 1.54% | 1.47% | 1.50% |
Expenses net of fee waivers, if any | 1.44% | 1.49% | 1.50% | 1.47% | 1.50% |
Expenses net of all reductions | 1.44% | 1.48% | 1.50% | 1.47% | 1.49% |
Net investment income (loss) | .43% | 1.19% | 2.48% | 1.45% | .57% |
Supplemental Data | | | | | |
Net assets, end of period (000 omitted) | $ 76,785 | $ 59,529 | $ 40,276 | $ 81,938 | $ 100,621 |
Portfolio turnover rate E | 63% | 60% | 98% | 86% | 84% |
A Total returns would have been lower if certain expenses had not been reduced during the applicable periods shown.
B Total returns do not include the effect of the sales charges.
C Calculated based on average shares outstanding during the period.
D Fees and expenses of any underlying Fidelity Central Funds are not included in the Fund's expense ratio. The Fund indirectly bears its proportionate share of the expenses of any underlying Fidelity Central Funds.
E Amount does not include the portfolio activity of any underlying Fidelity Central Funds.
F Expense ratios reflect operating expenses of the class. Expenses before reductions do not reflect amounts reimbursed by the investment adviser or reductions from brokerage service arrangements or reductions from other expense offset arrangements and do not represent the amount paid by the class during periods when reimbursements or reductions occur. Expenses net of fee waivers reflect expenses after reimbursement by the investment adviser but prior to reductions from brokerage service arrangements or other expense offset arrangements. Expenses net of all reductions represent the net expenses paid by the class.
G Total distributions of $1.26 per share is comprised of distributions from net investment income of $.173 and distributions from net realized gain of $1.085 per share.
See accompanying notes which are an integral part of the financial statements.
Annual Report
Financial Highlights - Class B
Years ended July 31, | 2011 | 2010 | 2009 | 2008 | 2007 |
Selected Per-Share Data | | | | | |
Net asset value, beginning of period | $ 14.77 | $ 9.35 | $ 16.26 | $ 18.51 | $ 20.19 |
Income from Investment Operations | | | | | |
Net investment income (loss) C | (.01) | .09 | .20 | .17 | .01 |
Net realized and unrealized gain (loss) | 3.35 | 5.42 | (6.81) | (1.23) | (.16) |
Total from investment operations | 3.34 | 5.51 | (6.61) | (1.06) | (.15) |
Distributions from net investment income | (.06) | (.09) | (.27) | (.10) | (.05) |
Distributions from net realized gain | - | - | (.03) | (1.09) | (1.48) |
Total distributions | (.06) | (.09) | (.30) | (1.19) G | (1.53) |
Net asset value, end of period | $ 18.05 | $ 14.77 | $ 9.35 | $ 16.26 | $ 18.51 |
Total Return A,B | 22.69% | 59.14% | (40.60)% | (6.37)% | (1.45)% |
Ratios to Average Net Assets D,F | | | | | |
Expenses before reductions | 1.94% | 1.98% | 2.04% | 1.96% | 2.02% |
Expenses net of fee waivers, if any | 1.94% | 1.98% | 2.00% | 1.96% | 2.00% |
Expenses net of all reductions | 1.93% | 1.97% | 2.00% | 1.96% | 2.00% |
Net investment income (loss) | (.07)% | .70% | 1.98% | .96% | .07% |
Supplemental Data | | | | | |
Net assets, end of period (000 omitted) | $ 11,542 | $ 12,078 | $ 7,933 | $ 16,879 | $ 25,114 |
Portfolio turnover rate E | 63% | 60% | 98% | 86% | 84% |
A Total returns would have been lower if certain expenses had not been reduced during the applicable periods shown.
B Total returns do not include the effect of the contingent deferred sales charge.
C Calculated based on average shares outstanding during the period.
D Fees and expenses of any underlying Fidelity Central Funds are not included in the Fund's expense ratio. The Fund indirectly bears its proportionate share of the expenses of any underlying Fidelity Central Funds.
E Amount does not include the portfolio activity of any underlying Fidelity Central Funds.
F Expense ratios reflect operating expenses of the class. Expenses before reductions do not reflect amounts reimbursed by the investment adviser or reductions from brokerage service arrangements or reductions from other expense offset arrangements and do not represent the amount paid by the class during periods when reimbursements or reductions occur. Expenses net of fee waivers reflect expenses after reimbursement by the investment adviser but prior to reductions from brokerage service arrangements or other expense offset arrangements. Expenses net of all reductions represent the net expenses paid by the class.
G Total distributions of $1.19 per share is comprised of distributions from net investment income of $.102 and distributions from net realized gain of $1.085 per share.
See accompanying notes which are an integral part of the financial statements.
Annual Report
Financial Highlights - Class C
Years ended July 31, | 2011 | 2010 | 2009 | 2008 | 2007 |
Selected Per-Share Data | | | | | |
Net asset value, beginning of period | $ 14.76 | $ 9.34 | $ 16.26 | $ 18.51 | $ 20.21 |
Income from Investment Operations | | | | | |
Net investment income (loss) C | (.01) | .09 | .19 | .17 | .01 |
Net realized and unrealized gain (loss) | 3.35 | 5.43 | (6.81) | (1.23) | (.16) |
Total from investment operations | 3.34 | 5.52 | (6.62) | (1.06) | (.15) |
Distributions from net investment income | (.07) | (.10) | (.27) | (.11) | (.05) |
Distributions from net realized gain | - | - | (.03) | (1.09) | (1.50) |
Total distributions | (.07) | (.10) | (.30) | (1.19) G | (1.55) |
Net asset value, end of period | $ 18.03 | $ 14.76 | $ 9.34 | $ 16.26 | $ 18.51 |
Total Return A,B | 22.69% | 59.28% | (40.64)% | (6.35)% | (1.45)% |
Ratios to Average Net Assets D,F | | | | | |
Expenses before reductions | 1.94% | 1.98% | 2.01% | 1.96% | 2.01% |
Expenses net of fee waivers, if any | 1.94% | 1.98% | 2.00% | 1.96% | 2.00% |
Expenses net of all reductions | 1.93% | 1.97% | 2.00% | 1.96% | 2.00% |
Net investment income (loss) | (.07)% | .71% | 1.98% | .96% | .06% |
Supplemental Data | | | | | |
Net assets, end of period (000 omitted) | $ 47,406 | $ 31,204 | $ 13,226 | $ 24,984 | $ 36,854 |
Portfolio turnover rate E | 63% | 60% | 98% | 86% | 84% |
A Total returns would have been lower if certain expenses had not been reduced during the applicable periods shown.
B Total returns do not include the effect of the contingent deferred sales charge.
C Calculated based on average shares outstanding during the period.
D Fees and expenses of any underlying Fidelity Central Funds are not included in the Fund's expense ratio. The Fund indirectly bears its proportionate share of the expenses of any underlying Fidelity Central Funds.
E Amount does not include the portfolio activity of any underlying Fidelity Central Funds.
F Expense ratios reflect operating expenses of the class. Expenses before reductions do not reflect amounts reimbursed by the investment adviser or reductions from brokerage service arrangements or reductions from other expense offset arrangements and do not represent the amount paid by the class during periods when reimbursements or reductions occur. Expenses net of fee waivers reflect expenses after reimbursement by the investment adviser but prior to reductions from brokerage service arrangements or other expense offset arrangements. Expenses net of all reductions represent the net expenses paid by the class.
G Total distributions of $1.19 per share is comprised of distributions from net investment income of $.106 and distributions from net realized gain of $1.085 per share.
See accompanying notes which are an integral part of the financial statements.
Annual Report
Financial Highlights - Institutional Class
Years ended July 31, | 2011 | 2010 | 2009 | 2008 | 2007 |
Selected Per-Share Data | | | | | |
Net asset value, beginning of period | $ 14.96 | $ 9.46 | $ 16.47 | $ 18.80 | $ 20.47 |
Income from Investment Operations | | | | | |
Net investment income (loss) B | .16 | .23 | .30 | .34 | .24 |
Net realized and unrealized gain (loss) | 3.39 | 5.47 | (6.90) | (1.23) | (.17) |
Total from investment operations | 3.55 | 5.70 | (6.60) | (.89) | .07 |
Distributions from net investment income | (.15) | (.20) | (.38) | (.35) | (.24) |
Distributions from net realized gain | - | - | (.03) | (1.09) | (1.50) |
Total distributions | (.15) | (.20) | (.41) | (1.44) F | (1.74) |
Net asset value, end of period | $ 18.36 | $ 14.96 | $ 9.46 | $ 16.47 | $ 18.80 |
Total Return A | 23.92% | 60.75% | (40.03)% | (5.39)% | (.37)% |
Ratios to Average Net Assets C,E | | | | | |
Expenses before reductions | .93% | .97% | 1.01% | .95% | .98% |
Expenses net of fee waivers, if any | .93% | .97% | 1.00% | .95% | .98% |
Expenses net of all reductions | .92% | .96% | 1.00% | .95% | .97% |
Net investment income (loss) | .94% | 1.71% | 2.98% | 1.97% | 1.09% |
Supplemental Data | | | | | |
Net assets, end of period (000 omitted) | $ 174,655 | $ 167,699 | $ 55,177 | $ 72,780 | $ 12,259 |
Portfolio turnover rate D | 63% | 60% | 98% | 86% | 84% |
A Total returns would have been lower if certain expenses had not been reduced during the applicable periods shown.
B Calculated based on average shares outstanding during the period.
C Fees and expenses of any underlying Fidelity Central Funds are not included in the Fund's expense ratio. The Fund indirectly bears its proportionate share of the expenses of any underlying Fidelity Central Funds.
D Amount does not include the portfolio activity of any underlying Fidelity Central Funds.
E Expense ratios reflect operating expenses of the class. Expenses before reductions do not reflect amounts reimbursed by the investment adviser or reductions from brokerage service arrangements or reductions from other expense offset arrangements and do not represent the amount paid by the class during periods when reimbursements or reductions occur. Expenses net of fee waivers reflect expenses after reimbursement by the investment adviser but prior to reductions from brokerage service arrangements or other expense offset arrangements. Expenses net of all reductions represent the net expenses paid by the class.
F Total distributions of $1.44 per share is comprised of distributions from net investment income of $.352 and distributions from net realized gain of $1.085 per share.
See accompanying notes which are an integral part of the financial statements.
Annual Report
Notes to Financial Statements
For the period ended July 31, 2011
1. Organization.
Fidelity Advisor Real Estate Fund (the Fund) is a non-diversified fund of Fidelity Advisor Series VII (the Trust) and is authorized to issue an unlimited number of shares. The Trust is registered under the Investment Company Act of 1940, as amended (the 1940 Act), as an open-end management investment company organized as a Massachusetts business trust. The Fund offers Class A, Class T, Class C, and Institutional Class shares, each of which, along with Class B shares, has equal rights as to assets and voting privileges. Effective after the close of business on September 1, 2010, Class B shares were closed to new accounts and additional purchases, except for exchanges and reinvestments, by existing shareholders. Each class has exclusive voting rights with respect to matters that affect that class. Class B shares will automatically convert to Class A shares after a holding period of seven years from the initial date of purchase. Investment income, realized and unrealized capital gains and losses, the common expenses of the Fund, and certain fund-level expense reductions, if any, are allocated on a pro-rata basis to each class based on the relative net assets of each class to the total net assets of the Fund. Each class differs with respect to transfer agent and distribution and service plan fees incurred. Certain expense reductions may also differ by class.
2. Investments in Fidelity Central Funds.
The Fund invests in Fidelity Central Funds, which are open-end investment companies available only to other investment companies and accounts managed by Fidelity Management & Research Company (FMR) and its affiliates. The Fund's Schedule of Investments lists each of the Fidelity Central Funds held as of period end, if any, as an investment of the Fund, but does not include the underlying holdings of each Fidelity Central Fund. As an Investing Fund, the Fund indirectly bears its proportionate share of the expenses of the underlying Fidelity Central Funds.
The Money Market Central Funds seek preservation of capital and current income and are managed by Fidelity Investments Money Management, Inc. (FIMM), an affiliate of FMR.
A complete unaudited list of holdings for each Fidelity Central Fund is available upon request or at the Securities and Exchange Commission (the SEC) web site at www.sec.gov. In addition, the financial statements of the Fidelity Central Funds, which are not covered by the Fund's Report of Independent Registered Public Accounting Firm, are available on the SEC web site or upon request.
3. Significant Accounting Policies.
The financial statements have been prepared in conformity with accounting principles generally accepted in the United States of America (GAAP), which require management to make certain estimates and assumptions at the date of the financial statements.
Annual Report
Notes to Financial Statements - continued
3. Significant Accounting Policies - continued
Actual results could differ from those estimates. Subsequent events, if any, through the date that the financial statements were issued have been evaluated in the preparation of the financial statements. The following summarizes the significant accounting policies of the Fund:
Security Valuation. Investments are valued as of 4:00 p.m. Eastern time on the last calendar day of the period. The Fund uses independent pricing services approved by the Board of Trustees to value its investments. When current market prices or quotations are not readily available or reliable, valuations may be determined in good faith in accordance with procedures adopted by the Board of Trustees. Factors used in determining value may include market or security specific events. The frequency with which these procedures are used cannot be predicted and they may be utilized to a significant extent. The value used for net asset value (NAV) calculation under these procedures may differ from published prices for the same securities.
The Fund categorizes the inputs to valuation techniques used to value its investments into a disclosure hierarchy consisting of three levels as shown below:
Level 1 - quoted prices in active markets for identical investments
Level 2 - other significant observable inputs (including quoted prices for similar investments, interest rates, prepayment speeds, etc.)
Level 3 - unobservable inputs (including the Fund's own assumptions based on the best information available)
Changes in valuation techniques may result in transfers in or out of an assigned level within the disclosure hierarchy. The aggregate value of investments by input level, as of July 31, 2011, is included at the end of the Fund's Schedule of Investments. Valuation techniques used to value the Fund's investments by major category are as follows:
Equity securities, including restricted securities, for which market quotations are readily available, are valued at the last reported sale price or official closing price as reported by an independent pricing service on the primary market or exchange on which they are traded and are categorized as Level 1 in the hierarchy. In the event there were no sales during the day or closing prices are not available, securities are valued at the last quoted bid price or may be valued using the last available price and are generally categorized as Level 2 in the hierarchy. For foreign equity securities, when significant market or security specific events arise, comparisons to the valuation of American Depositary Receipts (ADRs), futures contracts, Exchange-traded funds (ETFs) and certain indexes as well as quoted prices for similar securities are used and are categorized as Level 2 in the hierarchy in these circumstances. Utilizing these techniques may result in transfers between
Annual Report
3. Significant Accounting Policies - continued
Security Valuation - continued
Level 1 and Level 2. For restricted equity securities and private placements where observable inputs are limited, assumptions about market activity and risk are used and are categorized as Level 3 in the hierarchy.
Investments in open-end mutual funds, including other Fidelity Central Funds, are valued at their closing net asset value each business day and are categorized as Level 1 in the hierarchy.
Foreign Currency. The Fund may use foreign currency contracts to facilitate transactions in foreign-denominated securities. Gains and losses from these transactions may arise from changes in the value of the foreign currency or if the counterparties do not perform under the contracts' terms.
Foreign-denominated assets, including investment securities, and liabilities are translated into U.S. dollars at the exchange rate at period end. Purchases and sales of investment securities, income and dividends received and expenses denominated in foreign currencies are translated into U.S. dollars at the exchange rate in effect on the transaction date.
The effects of exchange rate fluctuations on investments are included with the net realized and unrealized gain (loss) on investment securities. Other foreign currency transactions resulting in realized and unrealized gain (loss) are disclosed separately.
Investment Transactions and Income. For financial reporting purposes, the Fund's investment holdings and NAV include trades executed through the end of the last business day of the period. The NAV per share for processing shareholder transactions is calculated as of the close of business of the New York Stock Exchange (NYSE), normally 4:00 p.m. Eastern time and includes trades executed through the end of the prior business day. Gains and losses on securities sold are determined on the basis of identified cost and may include proceeds received from litigation. Dividend income is recorded on the ex-dividend date, except for certain dividends from foreign securities where the ex-dividend date may have passed, which are recorded as soon as the Fund is informed of the ex-dividend date. Non-cash dividends included in dividend income, if any, are recorded at the fair market value of the securities received. Distributions received on securities that represent a return of capital or capital gain are recorded as a reduction of cost of investments and/or as a realized gain. The Fund estimates the components of distributions received that may be considered return of capital distributions or capital gain distributions. Interest income and distributions from the Fidelity Central Funds are accrued as earned. Interest income includes coupon interest and amortization of premium and accretion of discount on debt securities. Investment income is recorded net of foreign taxes withheld where recovery of such taxes is uncertain.
Annual Report
Notes to Financial Statements - continued
3. Significant Accounting Policies - continued
Expenses. Expenses directly attributable to a fund are charged to that fund. Expenses attributable to more than one fund are allocated among the respective funds on the basis of relative net assets or other appropriate methods. Expense estimates are accrued in the period to which they relate and adjustments are made when actual amounts are known.
Income Tax Information and Distributions to Shareholders. Each year, the Fund intends to qualify as a regulated investment company, including distributing substantially all of its taxable income and realized gains under Subchapter M of the Internal Revenue Code and filing its U.S. federal tax return. As a result, no provision for income taxes is required. As of July 31, 2011, the Fund did not have any unrecognized tax benefits in the financial statements. A fund's federal tax return is subject to examination by the Internal Revenue Service (IRS) for a period of three years. Foreign taxes are provided for based on the Fund's understanding of the tax rules and rates that exist in the foreign markets in which it invests.
Distributions are declared and recorded on the ex-dividend date. Income dividends and capital gain distributions are declared separately for each class. Income and capital gain distributions are determined in accordance with income tax regulations, which may differ from GAAP. In addition, the fund claimed a portion of the payment made to redeeming shareholders as a distribution for income tax purposes.
Capital accounts within the financial statements are adjusted for permanent book-tax differences. These adjustments have no impact on net assets or the results of operations. Temporary book-tax differences will reverse in a subsequent period.
Book-tax differences are primarily due to foreign currency transactions, capital loss carryforwards and losses deferred due to wash sales and excise tax regulations.
The federal tax cost of investment securities and unrealized appreciation (depreciation) as of period end were as follows:
Gross unrealized appreciation | $ 73,182,534 |
Gross unrealized depreciation | (15,372,090) |
Net unrealized appreciation (depreciation) on securities and other investments | $ 57,810,444 |
| |
Tax Cost | $ 453,033,176 |
The tax-based components of distributable earnings as of period end were as follows:
Undistributed ordinary income | $ 48,237 |
Undistributed Gains | $ 12,298,236 |
Net unrealized appreciation (depreciation) | $ 57,810,444 |
Annual Report
3. Significant Accounting Policies - continued
Income Tax Information and Distributions to Shareholders - continued
Under the recently enacted Regulated Investment Company Modernization Act of 2010 (the Act), the Fund will be permitted to carry forward capital losses incurred in taxable years beginning after December 22, 2010 for an unlimited period. However, any losses incurred during those future taxable years will be required to be utilized prior to any losses incurred in pre-enactment taxable years, which generally expire after eight years from when they are incurred. Additionally, post-enactment capital losses that are carried forward will retain their character as either short-term or long-term capital losses rather than being considered all short-term as under previous law. The Fund's first fiscal year end subject to the Act will be July 31, 2012.
The tax character of distributions paid was as follows:
| July 31, 2011 | July 31, 2010 |
Ordinary Income | $ 3,454,847 | $ 3,478,958 |
New Accounting Pronouncement. In May 2011, the Financial Accounting Standards Board issued Accounting Standard Update No. 2011-04, Fair Value Measurement (Topic 820) - Amendments to Achieve Common Fair Value Measurement and Disclosure Requirements in U.S. GAAP and IFRSs. The update changes the wording used to describe the requirements in GAAP for measuring fair value and for disclosing information about fair value measurements. The update is effective during interim and annual periods beginning after December 15, 2011. Management is currently evaluating the impact of the update's adoption on the Fund's financial statement disclosures.
4. Operating Policies.
Restricted Securities. The Fund may invest in securities that are subject to legal or contractual restrictions on resale. These securities generally may be resold in transactions exempt from registration or to the public if the securities are registered. Disposal of these securities may involve time-consuming negotiations and expense, and prompt sale at an acceptable price may be difficult. Information regarding restricted securities is included at the end of the Fund's Schedule of Investments.
5. Purchases and Sales of Investments.
Purchases and sales of securities, other than short-term securities, aggregated $292,273,582 and $278,032,856, respectively.
Annual Report
Notes to Financial Statements - continued
6. Fees and Other Transactions with Affiliates.
Management Fee. FMR and its affiliates provide the Fund with investment management related services for which the Fund pays a monthly management fee. The management fee is the sum of an individual fund fee rate that is based on an annual rate of .30% of the Fund's average net assets and a group fee rate that averaged .26% during the period. The group fee rate is based upon the average net assets of all the mutual funds advised by FMR. The group fee rate decreases as assets under management increase and increases as assets under management decrease. For the period, the total annual management fee rate was .56% of the Fund's average net assets.
Distribution and Service Plan Fees. In accordance with Rule 12b-1 of the 1940 Act, the Fund has adopted separate Distribution and Service Plans for each class of shares. Certain classes pay Fidelity Distributors Corporation (FDC), an affiliate of FMR, separate Distribution and Service Fees, each of which is based on an annual percentage of each class' average net assets. In addition, FDC may pay financial intermediaries for selling shares of the Fund and providing shareholder support services. For the period, the Distribution and Service Fee rates, total fees and amounts retained by FDC were as follows:
| Distribution
Fee | Service
Fee | Total Fees | Retained
by FDC |
Class A | -% | .25% | $ 373,427 | $ 9,804 |
Class T | .25% | .25% | 351,180 | 1,158 |
Class B | .75% | .25% | 122,425 | 91,896 |
Class C | .75% | .25% | 396,760 | 93,561 |
| | | $ 1,243,792 | $ 196,419 |
Sales Load. FDC may receive a front-end sales charge of up to 5.75% for selling Class A shares, and 3.50% for selling Class T shares, some of which is paid to financial intermediaries for selling shares of the Fund. Depending on the holding period, FDC may receive contingent deferred sales charges levied on Class A, Class T, Class B, and Class C redemptions. The deferred sales charges range from 5% to 1% for Class B, 1% for Class C, 1.00% for certain purchases of Class A shares and .25% for certain purchases of Class T shares.
For the period, sales charge amounts retained by FDC were as follows:
| Retained
by FDC |
Class A | $ 60,413 |
Class T | 10,427 |
Class B* | 28,145 |
Class C* | 3,930 |
| $ 102,915 |
* When Class B and Class C shares are initially sold, FDC pays commissions from its own resources to financial intermediaries through which the sales are made.
Annual Report
6. Fees and Other Transactions with Affiliates - continued
Transfer Agent Fees. Fidelity Investments Institutional Operations Company, Inc. (FIIOC), an affiliate of FMR, is the transfer, dividend disbursing and shareholder servicing agent for each class of the Fund. FIIOC receives account fees and asset-based fees that vary according to the account size and type of account of the shareholders of the respective classes of the Fund. FIIOC pays for typesetting, printing and mailing of shareholder reports, except proxy statements. For the period, transfer agent fees for each class were as follows:
| Amount | % of
Average
Net Assets |
Class A | $ 446,263 | .30 |
Class T | 214,263 | .31 |
Class B | 36,784 | .30 |
Class C | 118,916 | .30 |
Institutional Class | 517,024 | .29 |
| $ 1,333,250 | |
Accounting and Security Lending Fees. Fidelity Service Company, Inc. (FSC), an affiliate of FMR, maintains the Fund's accounting records. The accounting fee is based on the level of average net assets for the month. Under a separate contract, FSC administers the security lending program. The security lending fee is based on the number and duration of lending transactions.
Brokerage Commissions. The Fund placed a portion of its portfolio transactions with brokerage firms which are affiliates of the investment adviser. The commissions paid to these affiliated firms were $11,166 for the period.
Interfund Lending Program. Pursuant to an Exemptive Order issued by the SEC, the Fund, along with other registered investment companies having management contracts with FMR, may participate in an interfund lending program. This program provides an alternative credit facility allowing the funds to borrow from, or lend money to, other participating affiliated funds. At period end, there were no interfund loans outstanding. The Fund's activity in this program during the period for which loans were outstanding was as follows:
Borrower or Lender | Average Daily
Loan Balance | Weighted Average Interest Rate | Interest
Expense |
Borrower | $ 5,038,000 | .34% | $ 94 |
Annual Report
Notes to Financial Statements - continued
7. Committed Line of Credit.
The Fund participates with other funds managed by FMR or an affiliate in a $4.0 billion credit facility (the "line of credit") to be utilized for temporary or emergency purposes to fund shareholder redemptions or for other short-term liquidity purposes. The Fund has agreed to pay commitment fees on its pro-rata portion of the line of credit, which amounted to $1,463 and is reflected in Miscellaneous expenses on the Statement of Operations. During the period, there were no borrowings on this line of credit.
8. Security Lending.
The Fund lends portfolio securities through a lending agent from time to time in order to earn additional income. The lending agent may loan securities to certain qualified borrowers, including Fidelity Capital Markets (FCM), a broker-dealer affiliated with the Fund. On the settlement date of the loan, the Fund receives collateral (in the form of U.S. Treasury obligations, letters of credit and/or cash) against the loaned securities and maintains collateral in an amount not less than 100% of the market value of the loaned securities during the period of the loan. The market value of the loaned securities is determined at the close of business of the Fund and any additional required collateral is delivered to the Fund on the next business day. If the borrower defaults on its obligation to return the securities loaned because of insolvency or other reasons, a fund could experience delays and costs in recovering the securities loaned or in gaining access to the collateral. Any cash collateral received is the Fidelity Securities Lending Cash Central Fund. The value of loaned securities and cash collateral at period end are disclosed on the Fund's Statement of Assets and Liabilities. The value of securities loaned to FCM at period end was $624,342. Security lending income represents the income earned on investing cash collateral, less rebates paid to borrowers and lending agent fees associated with the loan, plus any premium payments received for lending certain types of securities. Security lending income is presented in the Statement of Operations as a component of income from Fidelity Central Funds. Total security lending income during the period amounted to $260,883, including $17,521 from securities loaned to FCM.
9. Expense Reductions.
Many of the brokers with whom FMR places trades on behalf of the Fund provided services in addition to trade execution. These services included payments of certain expenses on behalf of the Fund totaling $31,298 for the period.
Annual Report
10. Distributions to Shareholders.
Distributions to shareholders of each class were as follows:
Years ended July 31, | 2011 | 2010 |
From net investment income | | |
Class A | $ 1,134,674 | $ 1,234,313 |
Class T | 470,285 | 586,319 |
Class B | 48,095 | 73,937 |
Class C | 150,722 | 151,383 |
Institutional Class | 1,651,071 | 1,433,006 |
Total | $ 3,454,847 | $ 3,478,958 |
11. Share Transactions.
Transactions for each class of shares were as follows:
| Shares | Dollars |
Years ended July 31, | 2011 | 2010 | 2011 | 2010 |
Class A | | | | |
Shares sold | 4,653,877 | 3,838,345 | $ 78,524,629 | $ 50,713,463 |
Reinvestment of distributions | 65,899 | 94,331 | 1,031,857 | 1,168,282 |
Shares redeemed | (2,832,440) | (2,642,928) | (47,536,681) | (33,936,194) |
Net increase (decrease) | 1,887,336 | 1,289,748 | $ 32,019,805 | $ 17,945,551 |
Class T | | | | |
Shares sold | 1,651,686 | 1,600,698 | $ 27,537,800 | $ 21,094,229 |
Reinvestment of distributions | 29,190 | 46,490 | 457,660 | 571,730 |
Shares redeemed | (1,467,042) | (1,927,214) | (24,575,305) | (25,063,300) |
Net increase (decrease) | 213,834 | (280,026) | $ 3,420,155 | $ (3,397,341) |
Class B | | | | |
Shares sold | 93,823 | 214,509 | $ 1,516,799 | $ 2,825,349 |
Reinvestment of distributions | 2,787 | 5,594 | 43,338 | 67,395 |
Shares redeemed | (274,854) | (251,258) | (4,557,495) | (3,248,064) |
Net increase (decrease) | (178,244) | (31,155) | $ (2,997,358) | $ (355,320) |
Class C | | | | |
Shares sold | 1,010,530 | 1,050,192 | $ 16,785,045 | $ 14,008,372 |
Reinvestment of distributions | 8,844 | 11,301 | 137,459 | 138,548 |
Shares redeemed | (504,158) | (362,839) | (8,281,154) | (4,691,785) |
Net increase (decrease) | 515,216 | 698,654 | $ 8,641,350 | $ 9,455,135 |
Institutional Class | | | | |
Shares sold | 4,421,526 | 7,306,218 | $ 73,745,390 | $ 99,355,047 |
Reinvestment of distributions | 72,024 | 57,970 | 1,131,385 | 738,990 |
Shares redeemed | (6,191,578) | (1,990,258) | (102,967,160) | (25,411,067) |
Net increase (decrease) | (1,698,028) | 5,373,930 | $ (28,090,385) | $ 74,682,970 |
Annual Report
Notes to Financial Statements - continued
12. Other.
The Fund's organizational documents provide former and current trustees and officers with a limited indemnification against liabilities arising in connection with the performance of their duties to the Fund. In the normal course of business, the Fund may also enter into contracts that provide general indemnifications. The Fund's maximum exposure under these arrangements is unknown as this would be dependent on future claims that may be made against the Fund. The risk of material loss from such claims is considered remote.
Annual Report
To the Trustees of Fidelity Advisor Series VII and Shareholders of Fidelity Advisor Real Estate Fund:
We have audited the accompanying statement of assets and liabilities of Fidelity Advisor Real Estate Fund (the Fund), a fund of Fidelity Advisor Series VII, including the schedule of investments, as of July 31, 2011, and the related statement of operations for the year then ended, the statement of changes in net assets for each of the two years in the period then ended, and the financial highlights for each of the five years in the period then ended. These financial statements and financial highlights are the responsibility of the Fund's management. Our responsibility is to express an opinion on these financial statements and financial highlights based on our audits.
We conducted our audits in accordance with the standards of the Public Company Accounting Oversight Board (United States). Those standards require that we plan and perform the audit to obtain reasonable assurance about whether the financial statements and financial highlights are free of material misstatement. The Fund is not required to have, nor were we engaged to perform, an audit of its internal control over financial reporting. Our audits included consideration of internal control over financial reporting as a basis for designing audit procedures that are appropriate in the circumstances, but not for the purpose of expressing an opinion on the effectiveness of the Fund's internal control over financial reporting. Accordingly, we express no such opinion. An audit also includes examining, on a test basis, evidence supporting the amounts and disclosures in the financial statements, assessing the accounting principles used and significant estimates made by management, as well as evaluating the overall financial statement presentation. Our procedures included confirmation of securities owned as of July 31, 2011, by correspondence with the custodians and brokers; where replies were not received from brokers, we performed other auditing procedures. We believe that our audits provide a reasonable basis for our opinion.
In our opinion, the financial statements and financial highlights referred to above present fairly, in all material respects, the financial position of Fidelity Advisor Real Estate Fund as of July 31, 2011, the results of its operations for the year then ended, the changes in its net assets for each of the two years in the period then ended, and the financial highlights for each of the five years in the period then ended, in conformity with accounting principles generally accepted in the United States of America.
/s/ Deloitte & Touche LLP
DELOITTE & TOUCHE LLP
Boston, Massachusetts
September 13, 2011
Annual Report
The Trustees, Members of the Advisory Board, and executive officers of the trust and fund, as applicable, are listed below. The Board of Trustees governs the fund and is responsible for protecting the interests of shareholders. The Trustees are experienced executives who meet periodically throughout the year to oversee the fund's activities, review contractual arrangements with companies that provide services to the fund, oversee management of the risks associated with such activities and contractual arrangements, and review the fund's performance. Except for James C. Curvey, each of the Trustees oversees 221 funds advised by FMR or an affiliate. Mr. Curvey oversees 419 funds advised by FMR or an affiliate.
The Trustees hold office without limit in time except that (a) any Trustee may resign; (b) any Trustee may be removed by written instrument, signed by at least two-thirds of the number of Trustees prior to such removal; (c) any Trustee who requests to be retired or who has become incapacitated by illness or injury may be retired by written instrument signed by a majority of the other Trustees; and (d) any Trustee may be removed at any special meeting of shareholders by a two-thirds vote of the outstanding voting securities of the trust. Each Trustee who is not an interested person (as defined in the 1940 Act) (Independent Trustee), shall retire not later than the last day of the calendar year in which his or her 75th birthday occurs. The Independent Trustees may waive this mandatory retirement age policy with respect to individual Trustees. The executive officers and Advisory Board Members hold office without limit in time, except that any officer and Advisory Board Member may resign or may be removed by a vote of a majority of the Trustees at any regular meeting or any special meeting of the Trustees. Except as indicated, each individual has held the office shown or other offices in the same company for the past five years.
Experience, Skills, Attributes, and Qualifications of the Fund's Trustees. The Governance and Nominating Committee has adopted a statement of policy that describes the experience, qualifications, attributes, and skills that are necessary and desirable for potential Independent Trustee candidates (Statement of Policy). The Board believes that each Trustee satisfied at the time he or she was initially elected or appointed a Trustee, and continues to satisfy, the standards contemplated by the Statement of Policy. The Governance and Nominating Committee also engages professional search firms to help identify potential Independent Trustee candidates who have the experience, qualifications, attributes, and skills consistent with the Statement of Policy. From time to time, additional criteria based on the composition and skills of the current Independent Trustees, as well as experience or skills that may be appropriate in light of future changes to board composition, business conditions, and regulatory or other developments, have also been considered by the professional search firms and the Governance and Nominating Committee. In addition, the Board takes into account the Trustees' commitment and participation in Board and committee meetings, as well as their leadership of standing and ad hoc committees throughout their tenure.
In determining that a particular Trustee was and continues to be qualified to serve as a Trustee, the Board has considered a variety of criteria, none of which, in isolation, was controlling. The Board believes that, collectively, the Trustees have balanced and diverse experience, qualifications, attributes, and skills, which allow the Board to operate effectively in governing the fund and protecting the interests of shareholders. Information about the specific experience, skills, attributes, and qualifications of each Trustee, which in each case led to the Board's conclusion that the Trustee should serve (or continue to serve) as a trustee of the fund, is provided below.
Annual Report
Board Structure and Oversight Function. James C. Curvey is an interested person (as defined in the 1940 Act) and currently serves as Acting Chairman. The Trustees have determined that an interested Chairman is appropriate and benefits shareholders because an interested Chairman has a personal and professional stake in the quality and continuity of services provided to the fund. Independent Trustees exercise their informed business judgment to appoint an individual of their choosing to serve as Chairman, regardless of whether the Trustee happens to be independent or a member of management. The Independent Trustees have determined that they can act independently and effectively without having an Independent Trustee serve as Chairman and that a key structural component for assuring that they are in a position to do so is for the Independent Trustees to constitute a substantial majority for the Board. The Independent Trustees also regularly meet in executive session. Ned C. Lautenbach serves as Chairman of the Independent Trustees and as such (i) acts as a liaison between the Independent Trustees and management with respect to matters important to the Independent Trustees and (ii) with management prepares agendas for Board meetings.
Fidelity funds are overseen by different Boards of Trustees. The fund's Board oversees Fidelity's equity and high income funds and another Board oversees Fidelity's investment-grade bond, money market, and asset allocation funds. The asset allocation funds may invest in Fidelity funds overseen by the fund's Board. The use of separate Boards, each with its own committee structure, allows the Trustees of each group of Fidelity funds to focus on the unique issues of the funds they oversee, including common research, investment, and operational issues. On occasion, the separate Boards establish joint committees to address issues of overlapping consequences for the Fidelity funds overseen by each Board.
The Trustees operate using a system of committees to facilitate the timely and efficient consideration of all matters of importance to the Trustees, the fund, and fund shareholders and to facilitate compliance with legal and regulatory requirements and oversight of the fund's activities and associated risks. The Board, acting through its committees, has charged FMR and its affiliates with (i) identifying events or circumstances the occurrence of which could have demonstrably adverse effects on the fund's business and/or reputation; (ii) implementing processes and controls to lessen the possibility that such events or circumstances occur or to mitigate the effects of such events or circumstances if they do occur; and (iii) creating and maintaining a system designed to evaluate continuously business and market conditions in order to facilitate the identification and implementation processes described in (i) and (ii) above. Because the day-to-day operations and activities of the fund are carried out by or through FMR, its affiliates and other service providers, the fund's exposure to risks is mitigated but not eliminated by the processes overseen by the Trustees. While each of the Board's committees has responsibility for overseeing different aspects of the fund's activities, oversight is exercised primarily through the Operations, Audit, and Compliance Committees. Appropriate personnel, including but not limited to the fund's Chief Compliance Officer (CCO), FMR's internal auditor, the independent accountants, the fund's Treasurer and portfolio management personnel, make periodic reports to the Board's committees, as appropriate. The responsibilities of each committee, including their oversight responsibilities, are described further under "Standing Committees of the Fund's Trustees."
Annual Report
Trustees and Officers - continued
The fund's Statement of Additional Information (SAI) includes more information about the Trustees. To request a free copy, call Fidelity at 1-877-208-0098.
Interested Trustees*:
Correspondence intended for each Trustee who is an interested person may be sent to Fidelity Investments, 82 Devonshire Street, Boston, Massachusetts 02109.
Name, Age; Principal Occupations and Other Relevant Experience+ |
James C. Curvey (76) |
| Year of Election or Appointment: 2007 Mr. Curvey is Trustee and Acting Chairman of the Board of Trustees of certain Trusts. Mr. Curvey also serves as Trustee (2007-present) of other investment companies advised by FMR. Mr. Curvey is a Director of Fidelity Investments Money Management, Inc. (2009-present), Director of Fidelity Research & Analysis Co. (2009-present) and Director of FMR and FMR Co., Inc. (2007-present). Mr. Curvey is also Vice Chairman (2007-present) and Director of FMR LLC. In addition, Mr. Curvey serves as an Overseer for the Boston Symphony Orchestra and a member of the Trustees of Villanova University. Previously, Mr. Curvey was the Vice Chairman (2006-2007) and Director (2000-2007) of FMR Corp. |
Ronald P. O'Hanley (54) |
| Year of Election or Appointment: 2011 Mr. O'Hanley is Director of FMR Co., Inc. (2010-present), Director of Fidelity Investments Money Management, Inc. (2010-present), Director of Fidelity Research & Analysis Company (2010-present), President of Fidelity Asset Management and Corporate Services and a member of Fidelity's Executive Committee (2010-present). Previously, Mr. O'Hanley served as President and Chief Executive Officer of BNY Mellon Asset Management (2007-2010). Mr. O'Hanley also served as Vice Chairman of Bank New York Mellon Corp. and a member of that firm's Executive Committee. Prior to the 2007 merger of The Bank of New York and Mellon Financial Corporation, he was Vice Chairman of Mellon Financial Corporation and President and Chief Executive Officer of Mellon Asset Management. He joined Mellon in February 1997. Mr. O'Hanley currently serves as Chairman of the Boston Public Library Foundation Board of Directors and sits on the Board of Directors of Beth Israel Deaconess Medical Center, the Board of Trustees of the Marine Biological Laboratory and the Advisory Board of the Maxwell School of Citizenship and Public Administration at Syracuse University. Mr. O'Hanley also chairs the Council on Asset Management for the Financial Services Roundtable and is a member of the Board of Directors of Institutional Investor's U.S. Institute. |
* Trustees have been determined to be "Interested Trustees" by virtue of, among other things, their affiliation with the trust or various entities under common control with FMR.
+ The information above includes each Trustee's principal occupation during the last five years and other information relating to the experience, attributes, and skills relevant to each Trustee's qualifications to serve as a Trustee, which led to the conclusion that each Trustee should serve as a Trustee for the fund.
Annual Report
Trustees and Officers - continued
Independent Trustees:
Correspondence intended for each Independent Trustee (that is, the Trustees other than the Interested Trustees) may be sent to Fidelity Investments, P.O. Box 55235, Boston, Massachusetts 02205-5235.
Name, Age; Principal Occupations and Other Relevant Experience+ |
Dennis J. Dirks (63) |
| Year of Election or Appointment: 2005 Prior to his retirement in May 2003, Mr. Dirks was Chief Operating Officer and a member of the Board of The Depository Trust & Clearing Corporation (DTCC). He also served as President, Chief Operating Officer, and Board member of The Depository Trust Company (DTC) and President and Board member of the National Securities Clearing Corporation (NSCC). In addition, Mr. Dirks served as Chief Executive Officer and Board member of the Government Securities Clearing Corporation, Chief Executive Officer and Board member of the Mortgage-Backed Securities Clearing Corporation, as a Trustee and a member of the Finance Committee of Manhattan College (2005-2008), and as a Trustee and a member of the Finance Committee of AHRC of Nassau County (2006-2008). Mr. Dirks is a member of the Independent Directors Council (IDC) Governing Council (2010-Present) and Board of Directors for The Brookville Center for Children's Services, Inc. (2009-present). |
Alan J. Lacy (57) |
| Year of Election or Appointment: 2008 Mr. Lacy serves as Senior Adviser (2007-present) of Oak Hill Capital Partners, L.P. (private equity). Mr. Lacy also served as Chief Executive Officer (2000-2005) and Vice Chairman (2005-2006) of Sears Holdings Corporation and Sears, Roebuck and Co. (retail). In addition, Mr. Lacy serves as a member of the Board of Directors of Dave & Buster's, Inc. (restaurant and entertainment complexes, 2010-present), The Hillman Companies, Inc. (hardware wholesalers, 2010-present), and Bristol-Myers Squibb Company (global pharmaceuticals, 2007-present). Mr. Lacy is a member of the Board of Trustees of The National Parks Conservation Association (2006-Present). Previously, Mr. Lacy served as Chairman of the Board of Trustees of the National Parks Conservation Association (2008-2011) and as a member of the Board of Directors for the Western Union Company (global money transfer, 2006-2011). |
Ned C. Lautenbach (67) |
| Year of Election or Appointment: 2000 Mr. Lautenbach is Chairman of the Independent Trustees of the Equity and High Income Funds (2006-present). Mr. Lautenbach currently serves as the Lead Director of the Eaton Corporation Board of Directors (diversified industrial, 1997-present). Mr. Lautenbach is also a member of the Board of Directors of the Philharmonic Center for the Arts in Naples, Florida (1999-present); a member of the Board of Trustees of Fairfield University (2005-present); and a member of the Council on Foreign Relations (1994-present). Previously, Mr. Lautenbach was a Partner/Advisory Partner at Clayton, Dubilier & Rice, LLC (private equity investment, 1998-2010), as well as a Director of Sony Corporation (2006-2007). |
Joseph Mauriello (66) |
| Year of Election or Appointment: 2008 Prior to his retirement in January 2006, Mr. Mauriello served in numerous senior management positions including Deputy Chairman and Chief Operating Officer (2004-2005), and Vice Chairman of Financial Services (2002-2004) of KPMG LLP US (professional services, 1965-2005). Mr. Mauriello currently serves as a member of the Board of Directors of XL Group plc. (global insurance and re-insurance, 2006-present) and of Arcadia Resources Inc. (health care services and products, 2007-present). Previously, Mr. Mauriello served as a Director of the Hamilton Funds of the Bank of New York (2006-2007). |
Robert W. Selander (60) |
| Year of Election or Appointment: 2011 Previously, Mr. Selander served as a Member of the Advisory Board of Fidelity's Equity and High Income Funds (2011), Executive Vice Chairman (2010), Chief Executive Officer (2009-2010), and President and Chief Executive Officer (1997-2009) of Mastercard, Inc. |
Cornelia M. Small (67) |
| Year of Election or Appointment: 2005 Ms. Small is a member of the Board of Directors of the Teagle Foundation (2009-present). Ms. Small is also a member of the Investment Committee, and Chair (2008-present) and a member of the Board of Trustees of Smith College. In addition, Ms. Small serves on the Investment Committee of the Berkshire Taconic Community Foundation (2008-present). Previously, Ms. Small served as Chairperson of the Investment Committee (2002-2008) of Smith College. In addition, Ms. Small served as Chief Investment Officer, Director of Global Equity Investments, and a member of the Board of Directors of Scudder, Stevens & Clark and Scudder Kemper Investments. |
William S. Stavropoulos (72) |
| Year of Election or Appointment: 2001 Mr. Stavropoulos is Vice Chairman of the Independent Trustees of the Equity and High Income Funds (2006-present). Mr. Stavropoulos serves as President and Founder of the Michigan Baseball Foundation, the Great Lakes Loons (2007-present). Mr. Stavropoulos is Chairman Emeritus of the Board of Directors of The Dow Chemical Company, where he previously served in numerous senior management positions, including President, CEO (1995-2000; 2002-2004), Chairman of the Executive Committee (2000-2006), and as a member of the Board of Directors (1990-2006). Currently, Mr. Stavropoulos is Chairman of Univar (global distributor of commodity and specialty chemicals, 2010-present), a Director of Teradata Corporation (data warehousing and technology solutions, 2008-present), Chemical Financial Corporation, Maersk Inc. (industrial conglomerate), Tyco International, Inc. (multinational manufacturing and services, 2007-present), and a member of the Advisory Board for Metalmark Capital (private equity investment, 2005-present). Mr. Stavropoulos is a special advisor to Clayton, Dubilier & Rice, LLC (private equity investment). In addition, Mr. Stavropoulos is a member of the University of Notre Dame Advisory Council for the College of Science. |
David M. Thomas (62) |
| Year of Election or Appointment: 2008 Previously, Mr. Thomas served as Executive Chairman (2005-2006) and Chairman and Chief Executive Officer (2000-2005) of IMS Health, Inc. (pharmaceutical and healthcare information solutions). In addition, Mr. Thomas serves as a member of the Board of Directors of Fortune Brands, Inc. (consumer products), and Interpublic Group of Companies, Inc. (marketing communication, 2004-present). |
Michael E. Wiley (60) |
| Year of Election or Appointment: 2008 Mr. Wiley also serves as a Director of Asia Pacific Exploration Consolidated (international oil and gas exploration and production, 2008-present). Mr. Wiley serves as a Director of Tesoro Corporation (independent oil refiner and marketer, 2005-present), and a Director of Bill Barrett Corporation (exploration and production, 2005-present). In addition, Mr. Wiley also serves as a Director of Post Oak Bank (privately-held bank, 2004-present). Previously, Mr. Wiley served as a member of the Board of Trustees of the University of Tulsa (2000-2006; 2007-2010), as a Senior Energy Advisor of Katzenbach Partners, LLC (consulting, 2006-2007), as an Advisory Director of Riverstone Holdings (private investment), Chairman, President, and CEO of Baker Hughes, Inc. (oilfield services, 2000-2004), and as Director of Spinnaker Exploration Company (exploration and production, 2001-2005). |
Annual Report
+ The information above includes each Trustee's principal occupation during the last five years and other information relating to the experience, attributes, and skills relevant to each Trustee's qualifications to serve as a Trustee, which led to the conclusion that each Trustee should serve as a Trustee for the fund.
Advisory Board Members and Executive Officers:
Correspondence intended for each executive officer, Peter S. Lynch, and Edward C. Johnson 3d may be sent to Fidelity Investments, 82 Devonshire Street, Boston, Massachusetts 02109.
Name, Age; Principal Occupation |
Edward C. Johnson 3d (81) |
| Year of Election or Appointment: 2011 Member of the Advisory Board of Fidelity's Equity and High Income Funds. Mr. Johnson serves as Chief Executive Officer, Chairman, and a Director of FMR LLC, and also serves as Chairman and Director of FIL Limited. Previously, Mr. Johnson served as a Trustee and Chairman of the Board of certain Fidelity Trusts, Chairman and a Director of FMR, Chairman and a Director of FMR Co., Inc., and President of FMR LLC (2006-2007). |
Peter S. Lynch (67) |
| Year of Election or Appointment: 2003 Member of the Advisory Board of Fidelity's Equity and High Income Funds. Mr. Lynch is Vice Chairman and a Director of FMR and FMR Co., Inc. In addition, Mr. Lynch serves as a Trustee of Boston College and as the Chairman of the Inner-City Scholarship Fund. Previously, Mr. Lynch served on the Special Olympics International Board of Directors (1997-2006). |
Kenneth B. Robins (41) |
| Year of Election or Appointment: 2008 President and Treasurer of Fidelity's Equity and High Income Funds. Mr. Robins also serves as President and Treasurer (2010-present) and Assistant Treasurer (2009-present) of other Fidelity funds and is an employee of Fidelity Investments (2004-present). Previously, Mr. Robins served as Deputy Treasurer of the Fidelity funds (2005-2008) and Treasurer and Chief Financial Officer of The North Carolina Capital Management Trust: Cash and Term Portfolios (2006-2008). |
Brian B. Hogan (46) |
| Year of Election or Appointment: 2009 Vice President of Equity and High Income Funds. Mr. Hogan also serves as President of FMR's Equity Division (2009-present). Previously, Mr. Hogan served as Senior Vice President, Equity Research of FMR (2006-2009) and as a portfolio manager. |
Christopher S. Bartel (39) |
| Year of Election or Appointment: 2009 Vice President of Fidelity's Sector and Real Estate Equity Funds. Mr. Bartel also serves as Senior Vice President of Equity Research (2009-present). Previously, Mr. Bartel served as Managing Director of Research (2006-2009) and an analyst and portfolio manager (2000-2006). |
Scott C. Goebel (43) |
| Year of Election or Appointment: 2008 Secretary and Chief Legal Officer (CLO) of the Fidelity funds. Mr. Goebel also serves as Secretary of Fidelity Investments Money Management, Inc. (FIMM) (2010-present) and Fidelity Research and Analysis Company (FRAC) (2010-present); Secretary and CLO of The North Carolina Capital Management Trust: Cash and Term Portfolios (2008-present); General Counsel, Secretary, and Senior Vice President of FMR (2008-present) and FMR Co., Inc. (2008-present); employed by FMR LLC or an affiliate (2001-present); Chief Legal Officer of Fidelity Management & Research (Hong Kong) Limited (2008-present) and Assistant Secretary of Fidelity Management & Research (Japan) Inc. (2008-present), and Fidelity Management & Research (U.K.) Inc. (2008-present). Previously, Mr. Goebel served as Assistant Secretary of FIMM (2008-2010), FRAC (2008-2010), and the Funds (2007-2008) and as Vice President and Secretary of Fidelity Distributors Corporation (FDC) (2005-2007). |
William C. Coffey (42) |
| Year of Election or Appointment: 2009 Assistant Secretary of Fidelity's Equity and High Income Funds. Mr. Coffey also serves as Senior Vice President and Deputy General Counsel of FMR LLC (2010-present), and is an employee of Fidelity Investments. Previously, Mr. Coffey served as Vice President and Associate General Counsel of FMR LLC (2005-2009). |
Holly C. Laurent (57) |
| Year of Election or Appointment: 2008 Anti-Money Laundering (AML) Officer of the Fidelity funds. Ms. Laurent also serves as AML Officer of The North Carolina Capital Management Trust: Cash and Term Portfolios (2008-present) and is an employee of Fidelity Investments. Previously, Ms. Laurent was Senior Vice President and Head of Legal for Fidelity Business Services India Pvt. Ltd. (2006-2008), and Senior Vice President, Deputy General Counsel and Group Head for FMR LLC (2005-2006). |
Christine Reynolds (52) |
| Year of Election or Appointment: 2008 Chief Financial Officer of the Fidelity funds. Ms. Reynolds became President of Fidelity Pricing and Cash Management Services (FPCMS) in August 2008. Ms. Reynolds served as Chief Operating Officer of FPCMS (2007-2008). Previously, Ms. Reynolds served as President, Treasurer, and Anti-Money Laundering officer of the Fidelity funds (2004-2007). |
Kenneth A. Rathgeber (64) |
| Year of Election or Appointment: 2004 Chief Compliance Officer of Fidelity's Equity and High Income Funds. Mr. Rathgeber is Chief Compliance Officer of Fidelity Management & Research (Hong Kong) Limited (2008-present), Fidelity Management & Research (Japan) Inc. (2008-present), FMR (2005-present), FMR Co., Inc. (2005-present), Fidelity Management & Research (U.K.) Inc. (2005-present), Fidelity Research & Analysis Company (2005-present), Fidelity Investments Money Management, Inc. (2005-present), Pyramis Global Advisors, LLC (2005-present), and Strategic Advisers, Inc. (2005-present). |
Jeffrey S. Christian (49) |
| Year of Election or Appointment: 2009 Deputy Treasurer of the Fidelity funds. Mr. Christian is an employee of Fidelity Investments. Previously, Mr. Christian served as Chief Financial Officer (2008-2009) of certain Fidelity funds and Senior Vice President of Fidelity Pricing and Cash Management Services (FPCMS) (2004-2009). |
Bryan A. Mehrmann (50) |
| Year of Election or Appointment: 2005 Deputy Treasurer of the Fidelity funds. Mr. Mehrmann is an employee of Fidelity Investments. |
Adrien E. Deberghes (43) |
| Year of Election or Appointment: 2008 Deputy Treasurer of Fidelity's Equity and High Income Funds. Mr. Deberghes also serves as Assistant Treasurer of other Fidelity funds (2010-present) and is an employee of Fidelity Investments (2008-present). Previously, Mr. Deberghes served as Senior Vice President of Mutual Fund Administration at State Street Corporation (2007-2008), Senior Director of Mutual Fund Administration at Investors Bank & Trust (2005-2007), and Director of Finance for Dunkin' Brands (2000-2005). |
Stephanie J. Dorsey (42) |
| Year of Election or Appointment: 2010 Assistant Treasurer of Fidelity's Equity and High Income Funds. Ms. Dorsey also serves as Deputy Treasurer of other Fidelity funds (2008-present) and is an employee of Fidelity Investments (2008-present). Previously, Ms. Dorsey served as Treasurer (2004-2008) of the JPMorgan Mutual Funds and Vice President (2004-2008) of JPMorgan Chase Bank. |
John R. Hebble (53) |
| Year of Election or Appointment: 2009 Assistant Treasurer of Fidelity's Equity and High Income Funds. Mr. Hebble also serves as President (2011-present), Treasurer, and Chief Financial Officer of The North Carolina Capital Management Trust: Cash and Term Portfolios (2008-present), President and Treasurer of other Fidelity funds (2008-present) and is an employee of Fidelity Investments. |
Gary W. Ryan (52) |
| Year of Election or Appointment: 2005 Assistant Treasurer of the Fidelity funds. Mr. Ryan is an employee of Fidelity Investments. Previously, Mr. Ryan served as Vice President of Fund Reporting in Fidelity Pricing and Cash Management Services (FPCMS) (1999-2005). |
Jonathan Davis (43) |
| Year of Election or Appointment: 2010 Assistant Treasurer of the Fidelity funds. Mr. Davis is an employee of Fidelity Investments. Previously, Mr. Davis served as Vice President and Associate General Counsel of FMR LLC (2003-2010). |
Annual Report
The Board of Trustees of Fidelity Advisor Real Estate Fund voted to pay to shareholders of record at the opening of business on record date, the following distributions per share derived from capital gains realized from sales of portfolio securities, and dividends derived from net investment income:
| Pay Date | Record Date | Dividends | Capital Gains |
Institutional Class | 09/06/11 | 09/02/11 | $0.006 | $0.470 |
The fund hereby designates as a capital gain dividend with respect to the taxable year ended July 31, 2011, $13,712,128, or, if subsequently determined to be different, the net capital gain of such year.
A total of 0.05% of the dividends distributed during the fiscal year was derived from interest on U.S. Government securities which is generally exempt from state income tax.
The fund will notify shareholders in January 2012 of amounts for use in preparing 2011 income tax returns.
Annual Report
Board Approval of Investment Advisory Contracts and Management Fees
Fidelity Advisor Real Estate Fund
Each year, the Board of Trustees, including the Independent Trustees (together, the Board), votes on the renewal of the management contract and sub-advisory agreements (together, the Advisory Contracts) for the fund. The Board, assisted by the advice of fund counsel and Independent Trustees' counsel, requests and considers a broad range of information relevant to the renewal of the Advisory Contracts throughout the year.
The Board meets regularly and considers at each of its meetings factors that are relevant to its annual consideration of the renewal of the fund's Advisory Contracts, including the services and support provided to the fund and its shareholders. The Board has established various standing committees, each composed of Independent Trustees with varying backgrounds, to which the Board has assigned specific subject matter responsibilities in order to enhance effective decision-making by the Board. The Board, acting directly and through its Committees, requests and receives information concerning the annual consideration of the renewal of the fund's Advisory Contracts. The Board also meets as needed to consider matters specifically related to the Board's annual consideration of the renewal of Advisory Contracts. Members of the Board may also meet with trustees of other Fidelity funds through ad hoc joint committees to discuss certain matters relevant to the Fidelity funds.
At its July 2011 meeting, the Board of Trustees, including the Independent Trustees, unanimously determined to renew the fund's Advisory Contracts. In reaching its determination, the Board considered all factors it believed relevant, including (i) the nature, extent, and quality of the services to be provided to the fund and its shareholders (including the investment performance of the fund); (ii) the competitiveness of the fund's management fee and total expense ratio; (iii) the total costs of the services to be provided by and the profits to be realized by Fidelity from its relationship with the fund; (iv) the extent to which economies of scale would be realized as the fund grows; and (v) whether fee levels reflect these economies of scale, if any, for the benefit of fund shareholders.
In considering whether to renew the Advisory Contracts for the fund, the Board reached a determination, with the assistance of fund counsel and Independent Trustees' counsel and through the exercise of its business judgment, that the renewal of the Advisory Contracts is in the best interests of the fund and its shareholders and that the compensation payable under the Advisory Contracts is fair and reasonable. The Board's decision to renew the Advisory Contracts was not based on any single factor, but rather was based on a comprehensive consideration of all the information provided to the Board at its meetings throughout the year. The Board, in reaching its determination to renew the Advisory Contracts, is aware that shareholders in the fund have a broad range of investment choices available to them, including a wide choice among mutual funds offered by Fidelity's competitors, and that the fund's shareholders, who have the opportunity to review and weigh the disclosure provided by the fund in its prospectus and other public disclosures, have chosen to invest in this fund, managed by Fidelity.
Annual Report
Nature, Extent, and Quality of Services Provided. The Board considered the staffing within the investment adviser, FMR, and the sub-advisers (together, the Investment Advisers), including the backgrounds of the fund's investment personnel and the fund's investment objective and discipline. The Independent Trustees also had discussions with senior management of Fidelity's investment operations and investment groups. The Board considered the structure of the portfolio manager compensation program and whether this structure provides appropriate incentives to act in the best interests of the fund.
Resources Dedicated to Investment Management and Support Services. The Board and the Fund Oversight and Research Committees reviewed the general qualifications and capabilities of the Investment Advisers' investment staff, including its size, education, experience, and resources, as well as the Investment Advisers' approach to recruiting, training, managing, and compensating investment personnel. The Board also noted that FMR has devoted increased resources to non-U.S. offices. The Board noted that Fidelity's analysts have extensive resources, tools and capabilities which allow them to conduct sophisticated quantitative and fundamental analysis, as well as credit analysis of issuers, counterparties and enhancers. The Board also believes that Fidelity's investment professionals have sufficient access to global information and data so as to provide competitive investment results over time, and that those professionals also have access to sophisticated tools which permit them to assess portfolio construction and risk and performance attribution characteristics continuously, as well as to transmit new information and research conclusions rapidly around the world. Additionally, in their deliberations, the Board considered the Investment Advisers' trading capabilities and resources which are an integral part of the investment management process.
Shareholder and Administrative Services. The Board considered (i) the nature, extent, quality, and cost of advisory, administrative, and shareholder services performed by the Investment Advisers and their affiliates under the Advisory Contracts and under separate agreements covering transfer agency, pricing and bookkeeping, and securities lending services for the fund; (ii) the nature and extent of the investment adviser's supervision of third party service providers, principally custodians and subcustodians; and (iii) the resources devoted to, and the record of compliance with, the fund's compliance policies and procedures. The Board also reviewed the allocation of fund brokerage, including allocations to brokers affiliated with the Investment Advisers, the use of brokerage commissions to pay fund expenses, and the use of "soft" commission dollars to pay for research services.
The Board noted that the growth of fund assets over time across the complex allows Fidelity to reinvest in the development of services designed to enhance the value or convenience of the Fidelity funds as investment vehicles. These services include 24-hour access to account information and market information through telephone representatives and over the Internet, investor education materials and asset allocation tools, and the expanded availability of Fidelity Investor Centers, with 35 new branches opening since 2010.
Annual Report
Board Approval of Investment Advisory Contracts and
Management Fees - continued
Investment in a Large Fund Family. The Board considered the benefits to shareholders of investing in a Fidelity fund, including the benefits of investing in a fund that is part of a large family of funds offering a variety of investment disciplines and providing a large variety of mutual fund investor services. The Board noted that Fidelity had taken, or had made recommendations that resulted in the Fidelity funds taking, a number of actions over the previous year that benefited particular funds, including (i) continuing to dedicate additional resources to investment research and support of the senior management team that oversees asset management; (ii) rationalizing product lines through the mergers of six funds into other funds; (iii) continuing to migrate the Freedom Funds to dedicated lower cost underlying funds; (iv) obtaining shareholder approval to broaden the investment strategies for Fidelity Consumer Finance Portfolio, Fidelity Emerging Asia Fund, and Fidelity Environment and Alternative Energy Portfolio; (v) contractually agreeing to reduce the management fees and impose other expense limitations on Spartan® 500 Index Fund and U.S. Bond Index Fund in connection with launching new institutional classes of these funds; (vi) changing the name, primary and supplemental benchmarks, and investment policies of Fidelity Global Strategies Fund to support the fund's flexible investment mandate and global orientation; and (vii) reducing the transfer agency account fee rates on certain accounts.
Investment Performance. The Board considered whether the fund has operated in accordance with its investment objective, as well as its record of compliance with its investment restrictions. It also reviewed the fund's absolute investment performance for each class, as well as the fund's relative investment performance for each class measured over multiple periods against a broad-based securities market index. The Board noted that FMR does not believe that a meaningful peer group exists against which to compare the fund's performance. The following charts considered by the Board show, over the one-, three-, and five-year periods ended December 31, 2010, the cumulative total returns of Institutional Class (Class I) and Class B of the fund and the cumulative total returns of a broad-based securities market index ("benchmark"). The returns of Institutional Class (Class I) and Class B show the performance of the highest and lowest performing classes, respectively (based on five-year performance).
Annual Report
Fidelity Advisor Real Estate Fund

The Board noted that the investment performance of Institutional Class (Class I) of the fund compared favorably to its benchmark for all the periods shown. The Board considered that the variations in performance among the fund's classes reflect the variations in class expenses, which result in lower performance for higher expense classes. The Board also reviewed the fund's performance since inception as well as performance in the current year.
Based on its review, the Board concluded that the nature, extent, and quality of services provided to the fund under the Advisory Contracts should benefit the fund's shareholders.
Competitiveness of Management Fee and Total Expense Ratio. The Board considered the fund's management fee and total expense ratio compared to "mapped groups" of competitive funds and classes. Fidelity creates "mapped groups" by combining similar Lipper investment objective categories that have comparable management fee characteristics. Combining Lipper investment objective categories aids the Board's management fee and total expense ratio comparisons by broadening the competitive group used for comparison and by reducing the number of universes to which various Fidelity funds are compared.
Management Fee. The Board considered two proprietary management fee comparisons for the 12-month periods shown in the chart below. The group of Lipper funds used by the Board for management fee comparisons is referred to below as the "Total Mapped Group." The Total Mapped Group comparison focuses on a fund's standing relative to the total universe of comparable funds available to investors in terms of gross management fees before expense reimbursements or caps. "TMG %" represents the percentage of funds in the Total Mapped Group that had management fees that were lower than the fund's. For example, a TMG % of 6% means that 94% of the funds in the Total Mapped Group had higher management fees than the fund. The "Asset-Size Peer Group" (ASPG) comparison focuses on a fund's standing relative to non-Fidelity funds similar in size to the fund within the Total Mapped Group. The ASPG represents at least 15% of the funds in the Total Mapped Group with comparable asset size and management fee characteristics, subject to a minimum of 50 funds (or all funds in the Total Mapped Group if fewer than 50). Additional information, such as the ASPG quartile in which the fund's management fee ranked, is also included in the chart and considered by the Board.
Annual Report
Board Approval of Investment Advisory Contracts and
Management Fees - continued
Fidelity Advisor Real Estate Fund

The Board noted that the fund's management fee ranked below the median of its Total Mapped Group and below the median of its ASPG for 2010.
Based on its review, the Board concluded that the fund's management fee is fair and reasonable in light of the services that the fund receives and the other factors considered.
Total Expense Ratio. In its review of each class's total expense ratio, the Board considered the fund's management fee as well as other fund or class expenses, as applicable, such as transfer agent fees, pricing and bookkeeping fees, fund-paid 12b-1 fees, and custodial, legal, and audit fees. The Board also noted the effects of any waivers and reimbursements on fees and expenses. As part of its review, the Board also considered the current and historical total expense ratios of each class of the fund compared to competitive fund median expenses. Each class of the fund is compared to those funds and classes in the Total Mapped Group (used by the Board for management fee comparisons) that have a similar sales load structure.
Annual Report
The Board noted that the total expense ratio of each class ranked below its competitive median for 2010. The Board considered that various factors, including 12b-1 fees, positive or negative performance adjustments, and relatively higher other expenses in the case of small fund size, can affect total expense ratios.
Fees Charged to Other Fidelity Clients. The Board also considered Fidelity fee structures and other information with respect to clients of FMR and its affiliates, such as other mutual funds advised or subadvised by FMR or its affiliates, pension plan clients, and other institutional clients. In March 2010, the Board created an ad hoc joint committee with the board of other Fidelity funds (the Committee) to review and compare Fidelity's institutional investment advisory business with its business of providing services to the Fidelity funds, including the differences in services provided, fees charged, and costs incurred, as well as competition in their respective marketplaces.
Based on its review of total expense ratios and fees charged to other Fidelity clients, the Board concluded that the total expense ratio of each class of the fund was reasonable in light of the services that the fund and its shareholders receive and the other factors considered, including the findings of the Committee.
Costs of the Services and Profitability. The Board considered the revenues earned and the expenses incurred by Fidelity in conducting the business of developing, marketing, distributing, managing, administering and servicing the fund and its shareholders. The Board also considered the level of Fidelity's profits in respect of all the Fidelity funds.
On an annual basis, FMR presents to the Board Fidelity's profitability for the fund. Fidelity calculates the profitability for each fund, as well as aggregate profitability for groups of Fidelity funds and all Fidelity funds, using a series of detailed revenue and cost allocation methodologies which originate with the books and records of Fidelity on which Fidelity's audited financial statements are based. The Audit Committee of the Board reviews any significant changes from the prior year's methodologies.
PricewaterhouseCoopers LLP (PwC), independent registered public accounting firm and auditor to Fidelity and certain Fidelity funds, has been engaged annually by the Board as part of the Board's assessment of Fidelity's profitability analysis. PwC's engagement includes the review and assessment of Fidelity's methodologies used in determining the revenues and expenses attributable to Fidelity's mutual fund business, and completion of agreed-upon procedures surrounding the mathematical accuracy of fund profitability and its conformity to allocation methodologies. After considering PwC's reports issued under the engagement and information provided by Fidelity, the Board concluded that while other allocation methods may also be reasonable, Fidelity's profitability methodologies are reasonable in all material respects.
Annual Report
Board Approval of Investment Advisory Contracts and
Management Fees - continued
The Board also reviewed Fidelity's non-fund businesses and fall-out benefits related to the mutual fund business as well as cases where Fidelity's affiliates may benefit from or be related to the fund's business.
The Board considered the costs of the services provided by and the profits realized by Fidelity in connection with the operation of the fund and was satisfied that the profitability was not excessive in the circumstances.
Economies of Scale. The Board considered whether there have been economies of scale in respect of the management of the Fidelity funds, whether the Fidelity funds (including the fund) have appropriately benefited from any such economies of scale, and whether there is potential for realization of any further economies of scale. The Board considered the extent to which the fund will benefit from economies of scale through increased services to the fund, through waivers or reimbursements, or through fee or expense reductions. The Board also noted that in 2009, it and the board of other Fidelity funds created an ad hoc committee (the Economies of Scale Committee) to analyze whether FMR attains economies of scale in respect of the management and servicing of the Fidelity funds, whether the Fidelity funds have appropriately benefited from such economies of scale, and whether there is potential for realization of any further economies of scale.
The Board recognized that the fund's management contract incorporates a "group fee" structure, which provides for lower group fee rates as total fund assets under FMR's management increase, and for higher group fee rates as total fund assets under FMR's management decrease. FMR calculates the group fee rates based on a tiered asset "breakpoint" schedule that varies based on asset class. The Board considered that the group fee is designed to deliver the benefits of economies of scale to fund shareholders when total Fidelity fund assets increase, even if assets of any particular fund are unchanged or have declined, because some portion of Fidelity's costs are attributable to services provided to all Fidelity funds, and all funds benefit if those costs can be allocated among more assets. The Board concluded that, given the group fee structure, fund shareholders will benefit from lower management fees as assets under FMR's management increase at the fund complex level, regardless of whether Fidelity achieves any such economies of scale.
The Board concluded, taking into account the analysis of the Economies of Scale Committee, that any potential economies of scale are being appropriately shared between fund shareholders and Fidelity.
Additional Information Requested by the Board. In order to develop fully the factual basis for consideration of the Fidelity funds' Advisory Contracts, the Board requested and received additional information on certain topics, including (i) fund performance trends, actions to be taken by FMR to improve certain funds' overall performance, and Fidelity's long-term strategies for certain funds; (ii) portfolio manager changes that have occurred during the past year and length of portfolio manager tenure for different categories of funds over time; (iii) Fidelity's compensation structure for portfolio managers and other key personnel and strategies for attracting and retaining non-investment personnel; (iv) the amount of the investment that each portfolio manager has made in the Fidelity fund(s) that he or she manages; (v) historical trends in Fidelity's realization of fall-out benefits; (vi) Fidelity's group fee structures and the rationale for the individual fee rates of certain funds; (vii) fund profitability methodology and the impact of certain factors on fund profitability results; (viii) trends regarding industry use of performance fee structures and Fidelity's compliance practices with respect to performance adjustment calculations; (ix) the fee structures in place for certain other Fidelity clients; and (x) explanations regarding the relative total expense ratios of certain funds and classes, total expense competitive trends, and actions that might be taken by FMR to reduce total expense ratios for certain funds and classes.
Annual Report
Based on its evaluation of all of the conclusions noted above, and after considering all factors it believed relevant, the Board ultimately concluded that the advisory fee structures are fair and reasonable, and that the fund's Advisory Contracts should be renewed.
Annual Report
Investment Adviser
Fidelity Management & Research Company
Boston, MA
Investment Sub-Advisers
FMR Co., Inc.
Fidelity Management & Research
(Hong Kong) Limited
Fidelity Management & Research
(Japan) Inc.
Fidelity Management & Research
(U.K.) Inc.
General Distributor
Fidelity Distributors Corporation
Boston, MA
Transfer and Service Agents
Fidelity Investments Institutional
Operations Company, Inc.
Boston, MA
Fidelity Service Company, Inc.
Boston, MA
Custodian
The Bank of New York Mellon
New York, NY
AREI-UANN-0911
1.789708.108
Item 2. Code of Ethics
As of the end of the period, July 31, 2011, Fidelity Advisor Series VII (the trust) has adopted a code of ethics, as defined in Item 2 of Form N-CSR, that applies to its President and Treasurer and its Chief Financial Officer. A copy of the code of ethics is filed as an exhibit to this Form N-CSR.
Item 3. Audit Committee Financial Expert
The Board of Trustees of the trust has determined that Joseph Mauriello is an audit committee financial expert, as defined in Item 3 of Form N-CSR. Mr. Mauriello is independent for purposes of Item 3 of Form N-CSR.
Item 4. Principal Accountant Fees and Services
Fees and Services
The following table presents fees billed by Deloitte & Touche LLP, the member firms of Deloitte Touche Tohmatsu, and their respective affiliates (collectively, "Deloitte Entities") in each of the last two fiscal years for services rendered to Fidelity Advisor Biotechnology Fund, Fidelity Advisor Communications Equipment Fund, Fidelity Advisor Consumer Discretionary Fund, Fidelity Advisor Electronics Fund, Fidelity Advisor Energy Fund, Fidelity Advisor Financial Services Fund, Fidelity Advisor Health Care Fund, Fidelity Advisor Industrials Fund, Fidelity Advisor Real Estate Fund, Fidelity Advisor Technology Fund, and Fidelity Advisor Utilities Fund (the "Funds"):
Services Billed by Deloitte Entities
July 31, 2011 FeesA
| Audit Fees | Audit-Related Fees | Tax Fees | All Other Fees |
Fidelity Advisor Biotechnology Fund | $34,000 | $- | $4,600 | $200 |
Fidelity Advisor Communications Equipment Fund | $35,000 | $- | $4,600 | $200 |
Fidelity Advisor Consumer Discretionary Fund | $33,000 | $- | $5,700 | $200 |
Fidelity Advisor Electronics Fund | $33,000 | $- | $4,600 | $200 |
Fidelity Advisor Energy Fund | $34,000 | $- | $6,700 | $200 |
Fidelity Advisor Financial Services Fund | $35,000 | $- | $8,700 | $200 |
Fidelity Advisor Health Care Fund | $34,000 | $- | $5,700 | $200 |
Fidelity Advisor Industrials Fund | $34,000 | $- | $5,700 | $200 |
Fidelity Advisor Real Estate Fund | $36,000 | $- | $5,700 | $200 |
Fidelity Advisor Technology Fund | $35,000 | $- | $5,700 | $200 |
Fidelity Advisor Utilities Fund | $33,000 | $- | $5,700 | $200 |
July 31, 2010 FeesA
| Audit Fees | Audit-Related Fees | Tax Fees | All Other Fees |
Fidelity Advisor Biotechnology Fund | $33,000 | $- | $4,500 | $- |
Fidelity Advisor Communications Equipment Fund | $34,000 | $- | $4,500 | $- |
Fidelity Advisor Consumer Discretionary Fund | $32,000 | $- | $5,600 | $- |
Fidelity Advisor Electronics Fund | $32,000 | $- | $4,500 | $- |
Fidelity Advisor Energy Fund | $34,000 | $- | $6,600 | $- |
Fidelity Advisor Financial Services Fund | $34,000 | $- | $8,100 | $- |
Fidelity Advisor Health Care Fund | $34,000 | $- | $5,700 | $- |
Fidelity Advisor Industrials Fund | $33,000 | $- | $5,600 | $- |
Fidelity Advisor Real Estate Fund | $35,000 | $- | $5,600 | $- |
Fidelity Advisor Technology Fund | $35,000 | $- | $5,600 | $- |
Fidelity Advisor Utilities Fund | $32,000 | $- | $5,600 | $- |
A Amounts may reflect rounding.
The following table presents fees billed by Deloitte Entities that were required to be approved by the Audit Committee for services that relate directly to the operations and financial reporting of the Funds and that are rendered on behalf of Fidelity Management & Research Company ("FMR") and entities controlling, controlled by, or under common control with FMR (not including any sub-adviser whose role is primarily portfolio management and is subcontracted with or overseen by another investment adviser) that provide ongoing services to the Funds ("Fund Service Providers"):
Services Billed by Deloitte Entities
| July 31, 2011A | July 31, 2010A |
Audit-Related Fees | $645,000 | $720,000 |
Tax Fees | $- | $- |
All Other Fees | $730,000 | $450,000 |
A Amounts may reflect rounding.
"Audit-Related Fees" represent fees billed for assurance and related services that are reasonably related to the performance of the fund audit or the review of the fund's financial statements and that are not reported under Audit Fees.
"Tax Fees" represent fees billed for tax compliance, tax advice or tax planning that relate directly to the operations and financial reporting of the fund.
"All Other Fees" represent fees billed for services provided to the fund or Fund Service Provider, a significant portion of which are assurance related, that relate directly to the operations and financial reporting of the fund, excluding those services that are reported under Audit Fees, Audit-Related Fees or Tax Fees.
Assurance services must be performed by an independent public accountant.
* * *
The aggregate non-audit fees billed by Deloitte Entities for services rendered to the Funds, FMR (not including any sub-adviser whose role is primarily portfolio management and is subcontracted with or overseen by another investment adviser), and any Fund Service Provider for each of the last two fiscal years of the Funds are as follows:
Billed By | July 31, 2011 A | July 31, 2010 A |
Deloitte Entities | $1,535,000 | $1,265,000 |
A Amounts may reflect rounding.
The trust's Audit Committee has considered non-audit services that were not pre-approved that were provided by Deloitte Entities to Fund Service Providers to be compatible with maintaining the independence of Deloitte Entities in its audit of the Funds, taking into account representations from Deloitte Entities, in accordance with Public Company Accounting Oversight Board rules, regarding its independence from the Funds and their related entities and FMR's review of the appropriateness and permissibility under applicable law of such non-audit services prior to their provision to the Fund Service Providers.
Audit Committee Pre-Approval Policies and Procedures
The trust's Audit Committee must pre-approve all audit and non-audit services provided by a fund's independent registered public accounting firm relating to the operations or financial reporting of the fund. Prior to the commencement of any audit or non-audit services to a fund, the Audit Committee reviews the services to determine whether they are appropriate and permissible under applicable law.
The Audit Committee has adopted policies and procedures to, among other purposes, provide a framework for the Committee's consideration of non-audit services by the audit firms that audit the Fidelity funds. The policies and procedures require that any non-audit service provided by a fund audit firm to a Fidelity fund and any non-audit service provided by a fund auditor to a Fund Service Provider that relates directly to the operations and financial reporting of a Fidelity fund ("Covered Service") are subject to approval by the Audit Committee before such service is provided.
All Covered Services must be approved in advance of provision of the service either: (i) by formal resolution of the Audit Committee, or (ii) by oral or written approval of the service by the Chair of the Audit Committee (or if the Chair is unavailable, such other member of the Audit Committee as may be designated by the Chair to act in the Chair's absence). The approval contemplated by (ii) above is permitted where the Treasurer determines that action on such an engagement is necessary before the next meeting of the Audit Committee.
Non-audit services provided by a fund audit firm to a Fund Service Provider that do not relate directly to the operations and financial reporting of a Fidelity fund are reported to the Audit Committee on a periodic basis.
Non-Audit Services Approved Pursuant to Rule 2-01(c)(7)(i)(C) and (ii) of Regulation S-X ("De Minimis Exception")
There were no non-audit services approved or required to be approved by the Audit Committee pursuant to the De Minimis Exception during the Funds' last two fiscal years relating to services provided to (i) the Funds or (ii) any Fund Service Provider that relate directly to the operations and financial reporting of the Funds.
Item 5. Audit Committee of Listed Registrants
Not applicable.
Item 6. Investments
(a) Not applicable.
(b) Not applicable
Item 7. Disclosure of Proxy Voting Policies and Procedures for Closed-End Management Investment Companies
Not applicable.
Item 8. Portfolio Managers of Closed-End Management Investment Companies
Not applicable.
Item 9. Purchase of Equity Securities by Closed-End Management Investment Company and Affiliated Purchasers
Not applicable.
Item 10. Submission of Matters to a Vote of Security Holders
There were no material changes to the procedures by which shareholders may recommend nominees to the trust's Board of Trustees.
Item 11. Controls and Procedures
(a)(i) The President and Treasurer and the Chief Financial Officer have concluded that the trust's disclosure controls and procedures (as defined in Rule 30a-3(c) under the Investment Company Act) provide reasonable assurances that material information relating to the trust is made known to them by the appropriate persons, based on their evaluation of these controls and procedures as of a date within 90 days of the filing date of this report.
(a)(ii) There was no change in the trust's internal control over financial reporting (as defined in Rule 30a-3(d) under the Investment Company Act) that occurred during the second fiscal quarter of the period covered by this report that has materially affected, or is reasonably likely to materially affect, the trust's internal control over financial reporting.
Item 12. Exhibits
(a) | (1) | Code of Ethics pursuant to Item 2 of Form N-CSR is filed and attached hereto as EX-99.CODE ETH. |
(a) | (2) | Certification pursuant to Rule 30a-2(a) under the Investment Company Act of 1940 (17 CFR 270.30a-2(a)) is filed and attached hereto as Exhibit 99.CERT. |
(a) | (3) | Not applicable. |
(b) | | Certification pursuant to Rule 30a-2(b) under the Investment Company Act of 1940 (17 CFR 270.30a-2(b)) is furnished and attached hereto as Exhibit 99.906CERT. |
SIGNATURES
Pursuant to the requirements of the Securities Exchange Act of 1934 and the Investment Company Act of 1940, the registrant has duly caused this report to be signed on its behalf by the undersigned, thereunto duly authorized.
Fidelity Advisor Series VII
By: | /s/Kenneth B. Robins |
| Kenneth B. Robins |
| President and Treasurer |
| |
Date: | September 26, 2011 |
Pursuant to the requirements of the Securities Exchange Act of 1934 and the Investment Company Act of 1940, this report has been signed below by the following persons on behalf of the registrant and in the capacities and on the dates indicated.
By: | /s/Kenneth B. Robins |
| Kenneth B. Robins |
| President and Treasurer |
| |
Date: | September 26, 2011 |
By: | /s/Christine Reynolds |
| Christine Reynolds |
| Chief Financial Officer |
| |
Date: | September 26, 2011 |