UNITED STATES
SECURITIES AND EXCHANGE COMMISSION
Washington, D.C. 20549
FORM N-CSR
CERTIFIED SHAREHOLDER REPORT OF REGISTERED
MANAGEMENT INVESTMENT COMPANIES
Investment Company Act file number 811-3010
Fidelity Advisor Series VII
(Exact name of registrant as specified in charter)
245 Summer St., Boston, MA 02110
(Address of principal executive offices) (Zip code)
Marc Bryant, Secretary
245 Summer St.
Boston, Massachusetts 02110
(Name and address of agent for service)
Registrant's telephone number, including area code:
617-563-7000
| |
Date of fiscal year end: | July 31 |
|
|
Date of reporting period: | January 31, 2016 |
Item 1.
Reports to Stockholders
Fidelity Advisor Focus Funds®
Class I Fidelity Advisor® Biotechnology Fund
Fidelity Advisor® Communications Equipment Fund
Fidelity Advisor® Consumer Discretionary Fund
Fidelity Advisor® Electronics Fund
Fidelity Advisor® Energy Fund
Fidelity Advisor® Financial Services Fund
Fidelity Advisor® Health Care Fund
Fidelity Advisor® Industrials Fund
Fidelity Advisor® Technology Fund
Fidelity Advisor® Utilities Fund
Semi-Annual Report January 31, 2016 |
 |
Contents
To view a fund's proxy voting guidelines and proxy voting record for the 12-month period ended June 30, visit http://www.fidelity.com/proxyvotingresults or visit the Securities and Exchange Commission's (SEC) web site at http://www.sec.gov.
You may also call 1-877-208-0098 to request a free copy of the proxy voting guidelines.
Standard & Poor's, S&P and S&P 500 are registered service marks of The McGraw-Hill Companies, Inc. and have been licensed for use by Fidelity Distributors Corporation.
Other third-party marks appearing herein are the property of their respective owners.
All other marks appearing herein are registered or unregistered trademarks or service marks of FMR LLC or an affiliated company. © 2016 FMR LLC. All rights reserved.
This report and the financial statements contained herein are submitted for the general information of the shareholders of the Funds. This report is not authorized for distribution to prospective investors in the Funds unless preceded or accompanied by an effective prospectus.
A fund files its complete schedule of portfolio holdings with the SEC for the first and third quarters of each fiscal year on Form N-Q. Forms N-Q are available on the SEC’s web site at http://www.sec.gov. A fund's Forms N-Q may be reviewed and copied at the SEC’s Public Reference Room in Washington, DC. Information regarding the operation of the SEC's Public Reference Room may be obtained by calling 1-800-SEC-0330.
For a complete list of a fund's portfolio holdings, view the most recent holdings listing, semiannual report, or annual report on Fidelity's web site at http://www.fidelity.com, http://www.advisor.fidelity.com, or http://www.401k.com, as applicable.
NOT FDIC INSURED •MAY LOSE VALUE •NO BANK GUARANTEE
Neither the Funds nor Fidelity Distributors Corporation is a bank.
Fidelity Advisor® Biotechnology Fund
Investment Summary (Unaudited)
Top Ten Stocks as of January 31, 2016
| | % of fund's net assets | % of fund's net assets 6 months ago |
| Biogen, Inc. | 6.5 | 6.9 |
| Alexion Pharmaceuticals, Inc. | 6.2 | 5.4 |
| Celgene Corp. | 6.1 | 6.0 |
| Regeneron Pharmaceuticals, Inc. | 5.5 | 5.4 |
| Gilead Sciences, Inc. | 4.7 | 8.8 |
| Vertex Pharmaceuticals, Inc. | 4.0 | 3.6 |
| BioMarin Pharmaceutical, Inc. | 3.8 | 4.9 |
| Incyte Corp. | 3.1 | 2.2 |
| Genmab A/S | 2.2 | 0.9 |
| Anacor Pharmaceuticals, Inc. | 1.8 | 2.3 |
| | 43.9 | |
Top Industries (% of fund's net assets)
| As of January 31, 2016 |
| | Biotechnology | 86.9% |
| | Pharmaceuticals | 12.3% |
| | Health Care Equipment & Supplies | 0.3% |
| | Capital Markets | 0.1% |
| | Health Care Providers & Services | 0.1% |
| | All Others* | 0.3% |

| As of July 31, 2015 |
| | Biotechnology | 90.4% |
| | Pharmaceuticals | 8.8% |
| | Health Care Equipment & Supplies | 0.2% |
| | Life Sciences Tools & Services | 0.1% |
| | All Others* | 0.5% |

* Includes Short-Term investments and Net Other Assets (Liabilities).
Fidelity Advisor® Biotechnology Fund
Investments January 31, 2016 (Unaudited)
Showing Percentage of Net Assets
| Common Stocks - 98.2% | | | |
| | | Shares | Value |
| Biotechnology - 85.9% | | | |
| Biotechnology - 85.9% | | | |
| ACADIA Pharmaceuticals, Inc. (a)(b) | | 499,986 | $10,344,710 |
| Acceleron Pharma, Inc. (a) | | 594,191 | 18,241,664 |
| Achillion Pharmaceuticals, Inc. (a)(b) | | 1,640,172 | 11,087,563 |
| Acorda Therapeutics, Inc. (a) | | 665,253 | 24,494,615 |
| Actelion Ltd. | | 129,712 | 17,093,395 |
| Adamas Pharmaceuticals, Inc. (a) | | 1,043,948 | 17,893,269 |
| Adaptimmune Therapeutics PLC sponsored ADR | | 823,742 | 5,823,856 |
| ADMA Biologics, Inc. (a) | | 50,300 | 303,561 |
| Aduro Biotech, Inc. (b) | | 260,518 | 3,772,301 |
| Aduro Biotech, Inc. (c) | | 345,762 | 5,006,634 |
| Aegerion Pharmaceuticals, Inc. (a)(b) | | 1,437,389 | 10,176,714 |
| Affimed NV (a) | | 179,950 | 597,434 |
| Agenus, Inc. (a) | | 487,360 | 1,535,184 |
| Agenus, Inc. warrants 1/9/18 (a) | | 452,000 | 809 |
| Agios Pharmaceuticals, Inc. (a) | | 42,471 | 1,793,126 |
| Aimmune Therapeutics, Inc. (a)(b) | | 460,656 | 6,301,774 |
| Aimmune Therapeutics, Inc. | | 460,107 | 6,231,321 |
| Akebia Therapeutics, Inc. (a) | | 434,377 | 3,183,983 |
| Alder Biopharmaceuticals, Inc. (a)(b) | | 724,713 | 17,523,560 |
| Aldeyra Therapeutics, Inc. (a) | | 478,895 | 2,303,485 |
| Alexion Pharmaceuticals, Inc. (a) | | 1,143,165 | 166,822,068 |
| Alkermes PLC (a) | | 390,703 | 12,506,403 |
| Alnylam Pharmaceuticals, Inc. (a) | | 225,735 | 15,562,171 |
| AMAG Pharmaceuticals, Inc. (a)(b) | | 847,577 | 19,417,989 |
| Amarin Corp. PLC ADR (a)(b) | | 1,077,203 | 1,464,996 |
| Amgen, Inc. | | 30,330 | 4,632,301 |
| Amicus Therapeutics, Inc. (a)(b) | | 1,005,270 | 6,071,831 |
| Anacor Pharmaceuticals, Inc. (a) | | 659,551 | 49,552,067 |
| Applied Genetic Technologies Corp. (a) | | 293,936 | 4,294,405 |
| Ardelyx, Inc. (a) | | 1,105,464 | 11,507,880 |
| ARIAD Pharmaceuticals, Inc. (a)(b) | | 815,995 | 4,096,295 |
| Array BioPharma, Inc. (a) | | 378,104 | 1,168,341 |
| Ascendis Pharma A/S sponsored ADR | | 35,700 | 679,728 |
| Asterias Biotherapeutics, Inc. (a)(b) | | 115,938 | 372,161 |
| Atara Biotherapeutics, Inc. (a)(b) | | 455,215 | 8,239,392 |
| aTyr Pharma, Inc. (a) | | 45,620 | 240,874 |
| aTyr Pharma, Inc. (c) | | 55,238 | 291,657 |
| Avalanche Biotechnologies, Inc. (a) | | 125,129 | 750,774 |
| Axovant Sciences Ltd. (a) | | 291,261 | 4,639,788 |
| BioCryst Pharmaceuticals, Inc. (a) | | 326,300 | 2,274,311 |
| Biogen, Inc. (a) | | 641,640 | 175,206,218 |
| BioMarin Pharmaceutical, Inc. (a) | | 1,393,848 | 103,172,629 |
| BioTime, Inc. warrants 10/1/18 (a) | | 2 | 1 |
| bluebird bio, Inc. (a) | | 35,449 | 1,466,171 |
| Blueprint Medicines Corp. | | 311,843 | 4,902,172 |
| Calithera Biosciences, Inc. (a)(b) | | 497,158 | 2,485,790 |
| Cara Therapeutics, Inc. (a) | | 307,888 | 2,770,992 |
| Catabasis Pharmaceuticals, Inc. (b) | | 138,100 | 914,222 |
| Catalyst Pharmaceutical Partners, Inc.: | | | |
| warrants 5/2/17 (a) | | 8,557 | 6,007 |
| warrants 5/30/17 (a) | | 17,900 | 15,969 |
| Celgene Corp. (a) | | 1,636,735 | 164,197,255 |
| Cell Therapeutics, Inc. warrants 7/6/16 (a) | | 46,404 | 0 |
| Celldex Therapeutics, Inc. (a)(b) | | 827,627 | 6,869,304 |
| Cellectis SA sponsored ADR | | 40,000 | 894,400 |
| Cepheid, Inc. (a) | | 51,400 | 1,513,730 |
| Cerulean Pharma, Inc. (a)(b) | | 1,310,113 | 3,144,271 |
| Chiasma, Inc. (a) | | 29,900 | 307,970 |
| Chiasma, Inc. (c) | | 325,192 | 3,349,478 |
| Chiasma, Inc. warrants (a) | | 81,298 | 221,852 |
| Chimerix, Inc. (a) | | 281,786 | 2,169,752 |
| Cidara Therapeutics, Inc. (b) | | 19,000 | 221,540 |
| Cidara Therapeutics, Inc. (c) | | 223,967 | 2,611,455 |
| Clovis Oncology, Inc. (a)(b) | | 139,332 | 2,914,825 |
| Concert Pharmaceuticals, Inc. (a) | | 35,584 | 543,368 |
| CTI BioPharma Corp. (a)(b) | | 5,520,646 | 6,956,014 |
| Cytokinetics, Inc. (a) | | 191,719 | 1,476,236 |
| Cytokinetics, Inc. warrants 6/25/17 (a) | | 244,500 | 123,930 |
| CytomX Therapeutics, Inc. | | 64,961 | 969,510 |
| DBV Technologies SA sponsored ADR (a) | | 258,000 | 6,705,420 |
| Dicerna Pharmaceuticals, Inc. (a)(b) | | 125,106 | 820,695 |
| Dynavax Technologies Corp. (a)(b) | | 558,819 | 13,461,950 |
| Edge Therapeutics, Inc. (a)(b) | | 215,200 | 2,390,872 |
| Eleven Biotherapeutics, Inc. (a)(b) | | 41,779 | 13,386 |
| Emergent BioSolutions, Inc. (a) | | 146,555 | 5,363,913 |
| Enanta Pharmaceuticals, Inc. (a)(b) | | 100,387 | 2,579,946 |
| Epirus Biopharmaceuticals, Inc. (a) | | 254,100 | 820,743 |
| Epizyme, Inc. (a)(b) | | 2,351,873 | 21,378,526 |
| Esperion Therapeutics, Inc. (a)(b) | | 348,778 | 5,189,817 |
| Exact Sciences Corp. (a)(b) | | 364,159 | 2,392,525 |
| Exelixis, Inc. (a)(b) | | 1,040,940 | 4,809,143 |
| Fate Therapeutics, Inc. (a)(b) | | 234,604 | 505,572 |
| Fibrocell Science, Inc. (a) | | 279,800 | 719,086 |
| FibroGen, Inc. (a) | | 74,322 | 1,507,250 |
| Forward Pharma A/S sponsored ADR (a) | | 23,100 | 370,755 |
| Foundation Medicine, Inc. (a)(b) | | 159,200 | 2,322,728 |
| Galapagos Genomics NV sponsored ADR (b) | | 253,629 | 12,407,531 |
| Genmab A/S (a) | | 464,102 | 58,280,477 |
| Genocea Biosciences, Inc. (a) | | 159,921 | 497,354 |
| Genomic Health, Inc. (a) | | 54,120 | 1,558,656 |
| Geron Corp. (a)(b) | | 4,760,774 | 14,520,361 |
| Gilead Sciences, Inc. | | 1,514,648 | 125,715,784 |
| Global Blood Therapeutics, Inc. | | 518,310 | 9,713,492 |
| Global Blood Therapeutics, Inc. (a) | | 70,157 | 1,328,072 |
| Halozyme Therapeutics, Inc. (a)(b) | | 1,156,138 | 10,174,014 |
| Heron Therapeutics, Inc. (a)(b) | | 535,642 | 11,243,126 |
| Histogenics Corp. (a)(b)(d) | | 672,534 | 2,024,327 |
| Ignyta, Inc. (a) | | 652,672 | 6,513,667 |
| Immune Design Corp. (a) | | 268,300 | 2,809,101 |
| ImmunoGen, Inc. (a)(b) | | 1,249,451 | 10,607,839 |
| Immunomedics, Inc. (a)(b) | | 2,399,384 | 4,510,842 |
| Incyte Corp. (a) | | 1,166,968 | 82,341,262 |
| Infinity Pharmaceuticals, Inc. (a) | | 287,434 | 1,784,965 |
| Insys Therapeutics, Inc. (a)(b) | | 585,194 | 10,153,116 |
| Intercept Pharmaceuticals, Inc. (a) | | 175,060 | 18,596,624 |
| Intrexon Corp. (a)(b) | | 273,808 | 7,978,765 |
| Ionis Pharmaceuticals, Inc. (a) | | 386,340 | 15,040,216 |
| Ironwood Pharmaceuticals, Inc. Class A (a) | | 670,651 | 6,190,109 |
| Juno Therapeutics, Inc. (a)(b) | | 73,900 | 2,038,162 |
| Juno Therapeutics, Inc. (c) | | 214,673 | 5,920,681 |
| Karyopharm Therapeutics, Inc. (a)(b) | | 1,159,016 | 7,209,080 |
| Keryx Biopharmaceuticals, Inc. (a)(b) | | 673,542 | 2,377,603 |
| Kite Pharma, Inc. (a)(b) | | 729,920 | 34,663,901 |
| Kura Oncology, Inc. | | 1,037,902 | 4,981,930 |
| La Jolla Pharmaceutical Co. (a) | | 327,300 | 5,796,483 |
| Lexicon Pharmaceuticals, Inc. (a)(b) | | 930,237 | 9,479,115 |
| Ligand Pharmaceuticals, Inc. Class B (a)(b) | | 126,712 | 12,667,399 |
| Lion Biotechnologies, Inc. (a) | | 369,046 | 2,210,586 |
| Loxo Oncology, Inc. (a) | | 400,471 | 8,273,731 |
| Macrogenics, Inc. (a) | | 575,691 | 11,588,660 |
| MannKind Corp. (a)(b) | | 1,121,356 | 1,118,328 |
| MediciNova, Inc. (a)(b) | | 1,018,480 | 4,104,474 |
| Medivation, Inc. (a) | | 1,377,738 | 45,052,033 |
| Merrimack Pharmaceuticals, Inc. (a) | | 204,236 | 1,260,136 |
| Mesoblast Ltd. sponsored ADR (a)(b) | | 250,700 | 1,353,780 |
| MiMedx Group, Inc. (a)(b) | | 250,413 | 2,083,436 |
| Minerva Neurosciences, Inc. (a)(b) | | 921,974 | 4,794,265 |
| Mirati Therapeutics, Inc. (a) | | 34,314 | 738,780 |
| Mirna Therapeutics, Inc. (a)(b) | | 281,700 | 1,270,467 |
| Momenta Pharmaceuticals, Inc. (a) | | 121,037 | 1,503,280 |
| Myriad Genetics, Inc. (a)(b) | | 195,057 | 7,601,371 |
| NantKwest, Inc. (a)(b) | | 361,278 | 3,721,163 |
| Neurocrine Biosciences, Inc. (a) | | 669,028 | 28,467,141 |
| NewLink Genetics Corp. (a)(b) | | 252,479 | 6,150,388 |
| Nivalis Therapeutics, Inc. | | 18,600 | 87,234 |
| Novavax, Inc. (a)(b) | | 2,767,531 | 14,252,785 |
| Novelos Therapeutics, Inc. warrants 12/6/16 (a) | | 137,600 | 1 |
| OncoMed Pharmaceuticals, Inc. (a)(b) | | 175,270 | 1,621,248 |
| Ophthotech Corp. (a) | | 762,637 | 41,327,299 |
| Opko Health, Inc. (a)(b) | | 586,151 | 4,712,654 |
| Oragenics, Inc. (a) | | 250,308 | 265,326 |
| Orexigen Therapeutics, Inc. (a)(b) | | 1,765,996 | 3,231,773 |
| Organovo Holdings, Inc. (a)(b) | | 194,083 | 380,403 |
| Osiris Therapeutics, Inc. (b) | | 203,971 | 1,460,432 |
| OvaScience, Inc. (a)(b) | | 193,445 | 1,092,964 |
| PolyMedix, Inc. warrants 4/10/16 (a) | | 163,833 | 2 |
| Portola Pharmaceuticals, Inc. (a) | | 526,888 | 17,403,111 |
| Progenics Pharmaceuticals, Inc. (a)(b) | | 793,543 | 3,309,074 |
| ProNai Therapeutics, Inc. (a)(b) | | 377,900 | 3,129,012 |
| ProQR Therapeutics BV (a) | | 249,416 | 1,314,422 |
| Proteon Therapeutics, Inc. (a) | | 137,500 | 1,282,875 |
| Prothena Corp. PLC (a) | | 128,634 | 5,010,294 |
| PTC Therapeutics, Inc. (a)(b) | | 330,278 | 7,867,222 |
| Puma Biotechnology, Inc. (a)(b) | | 324,394 | 13,540,206 |
| Radius Health, Inc. (a) | | 975,562 | 31,247,251 |
| Raptor Pharmaceutical Corp. (a) | | 625,173 | 2,563,209 |
| Regeneron Pharmaceuticals, Inc. (a) | | 353,005 | 148,293,870 |
| REGENXBIO, Inc. (a)(b) | | 423,050 | 5,880,395 |
| Regulus Therapeutics, Inc. (a) | | 265,221 | 1,532,977 |
| Repligen Corp. (a) | | 361,227 | 8,001,178 |
| Retrophin, Inc. (a) | | 266,445 | 3,988,682 |
| Rigel Pharmaceuticals, Inc. (a) | | 643,465 | 1,769,529 |
| Sage Therapeutics, Inc. (a) | | 262,168 | 8,803,601 |
| Sangamo Biosciences, Inc. (a)(b) | | 682,852 | 4,131,255 |
| Sarepta Therapeutics, Inc. (a)(b) | | 429,797 | 5,105,988 |
| Seattle Genetics, Inc. (a)(b) | | 995,001 | 32,815,133 |
| Seres Therapeutics, Inc. (b) | | 237,191 | 6,387,554 |
| Seres Therapeutics, Inc. | | 352,270 | 9,486,631 |
| Sophiris Bio, Inc. (a) | | 141,653 | 273,390 |
| Spark Therapeutics, Inc. (b) | | 314,145 | 8,849,465 |
| Spectrum Pharmaceuticals, Inc. (a) | | 338,247 | 1,677,705 |
| Stemline Therapeutics, Inc. (a)(b) | | 348,093 | 1,754,389 |
| Sunesis Pharmaceuticals, Inc. (a)(b) | | 830,240 | 647,587 |
| TESARO, Inc. (a)(b) | | 456,937 | 15,782,604 |
| TG Therapeutics, Inc. (a)(b) | | 1,428,493 | 11,670,788 |
| Threshold Pharmaceuticals, Inc. (a)(b) | | 26,804 | 8,577 |
| Threshold Pharmaceuticals, Inc. warrants 3/16/16 (a) | | 35,146 | 0 |
| Tobira Therapeutics, Inc. (a)(b) | | 299,451 | 2,150,058 |
| Tokai Pharmaceuticals, Inc. (a)(b) | | 91,000 | 570,570 |
| Trevena, Inc. (a) | | 286,767 | 2,087,664 |
| Ultragenyx Pharmaceutical, Inc. (a) | | 366,427 | 20,574,876 |
| uniQure B.V. (a)(b) | | 158,829 | 2,895,453 |
| United Therapeutics Corp. (a) | | 148,094 | 18,242,219 |
| Verastem, Inc. (a) | | 365,402 | 438,482 |
| Versartis, Inc. (a)(b) | | 355,976 | 3,965,573 |
| Vertex Pharmaceuticals, Inc. (a) | | 1,198,919 | 108,801,899 |
| Vical, Inc. (a) | | 659,862 | 230,952 |
| Vitae Pharmaceuticals, Inc. (a) | | 1,091,502 | 10,696,720 |
| Vital Therapies, Inc. (a)(b) | | 581,760 | 5,323,104 |
| Voyager Therapeutics, Inc. (a)(b) | | 1,016,525 | 10,856,487 |
| Voyager Therapeutics, Inc. | | 282,352 | 2,713,967 |
| Xencor, Inc. (a) | | 523,108 | 5,660,029 |
| Xenon Pharmaceuticals, Inc. (a) | | 102,215 | 676,663 |
| XOMA Corp. (a)(b) | | 1,918,701 | 1,937,888 |
| Zafgen, Inc. (a)(b) | | 1,356,174 | 9,018,557 |
| ZIOPHARM Oncology, Inc. (a)(b) | | 160,501 | 797,690 |
| | | | 2,309,086,797 |
| Capital Markets - 0.1% | | | |
| Asset Management & Custody Banks - 0.1% | | | |
| RPI International Holdings LP (e) | | 12,210 | 1,711,842 |
| Health Care Equipment & Supplies - 0.3% | | | |
| Health Care Equipment - 0.3% | | | |
| Bellerophon Therapeutics, Inc. (b) | | 227,700 | 523,710 |
| Novocure Ltd. | | 155,553 | 1,844,236 |
| Novocure Ltd. (a)(b) | | 169,200 | 2,111,616 |
| Vermillion, Inc. (a)(b) | | 1,165,400 | 1,783,062 |
| Zosano Pharma Corp. (b) | | 598,503 | 1,364,587 |
| | | | 7,627,211 |
| Life Sciences Tools & Services - 0.0% | | | |
| Life Sciences Tools & Services - 0.0% | | | |
| JHL Biotech, Inc. | | 469,540 | 1,596,573 |
| Transgenomic, Inc. (a) | | 13,500 | 8,505 |
| Transgenomic, Inc. warrants 2/3/17 (a) | | 81,000 | 1 |
| | | | 1,605,079 |
| Personal Products - 0.0% | | | |
| Personal Products - 0.0% | | | |
| MYOS Corp. (a) | | 6,666 | 11,466 |
| Pharmaceuticals - 11.9% | | | |
| Pharmaceuticals - 11.9% | | | |
| Achaogen, Inc. (a) | | 141,215 | 511,198 |
| Adimab LLC unit (e)(f) | | 398,401 | 7,637,946 |
| Aradigm Corp. (a) | | 8,786 | 32,596 |
| Auris Medical Holding AG (a) | | 261,667 | 1,172,268 |
| Axsome Therapeutics, Inc. (a)(b) | | 956,860 | 7,492,214 |
| Biodel, Inc. (a) | | 718,800 | 178,981 |
| Biodelivery Sciences International, Inc. (a)(b) | | 609,750 | 2,469,488 |
| Carbylan Therapeutics, Inc. | | 763,811 | 1,856,061 |
| Cempra, Inc. (a)(b) | | 1,143,578 | 19,703,849 |
| Collegium Pharmaceutical, Inc. | | 81,700 | 1,391,351 |
| Dermira, Inc. (a) | | 563,614 | 15,781,192 |
| Dermira, Inc. (c) | | 162,931 | 4,562,068 |
| Egalet Corp. (a)(b)(d) | | 1,252,974 | 10,550,041 |
| Eisai Co. Ltd. | | 342,900 | 20,726,310 |
| Endo Health Solutions, Inc. (a) | | 58,774 | 3,260,194 |
| Flex Pharma, Inc. | | 22,600 | 188,032 |
| GW Pharmaceuticals PLC ADR (a)(b) | | 351,018 | 17,607,063 |
| Horizon Pharma PLC (a) | | 1,904,309 | 33,325,408 |
| Intra-Cellular Therapies, Inc. (a) | | 273,554 | 10,143,382 |
| Jazz Pharmaceuticals PLC (a) | | 323,452 | 41,641,210 |
| MyoKardia, Inc. | | 484,822 | 4,145,228 |
| MyoKardia, Inc. (a)(b) | | 831,134 | 7,480,206 |
| Nektar Therapeutics (a) | | 277,332 | 3,782,808 |
| NeurogesX, Inc. (a) | | 150,000 | 510 |
| Ocular Therapeutix, Inc. (a)(b) | | 380,371 | 2,327,871 |
| Pacira Pharmaceuticals, Inc. (a)(b) | | 411,608 | 24,457,747 |
| Paratek Pharmaceuticals, Inc. (a) | | 881,160 | 12,882,559 |
| Parnell Pharmaceuticals Holdings Ltd. (a) | | 123,569 | 359,586 |
| Pozen, Inc. (a)(b) | | 144,020 | 943,331 |
| Repros Therapeutics, Inc. (a)(b) | | 1,037,775 | 1,068,908 |
| Revance Therapeutics, Inc. (a)(b) | | 110,800 | 2,296,884 |
| SCYNEXIS, Inc. (a) | | 111,900 | 511,383 |
| Sun Pharmaceutical Industries Ltd. | | 552,504 | 7,151,532 |
| Tetraphase Pharmaceuticals, Inc. (a)(b) | | 378,131 | 2,057,033 |
| The Medicines Company (a) | | 565,722 | 19,551,352 |
| TherapeuticsMD, Inc. (a) | | 1,497,500 | 10,707,125 |
| Theravance Biopharma, Inc. (a)(b) | | 407,503 | 6,691,199 |
| WAVE Life Sciences | | 230,144 | 2,802,463 |
| WAVE Life Sciences (a)(b) | | 171,944 | 2,326,402 |
| XenoPort, Inc. (a)(b) | | 478,008 | 2,375,700 |
| Zogenix, Inc. (a)(b) | | 683,715 | 6,481,618 |
| Zogenix, Inc. warrants 7/27/17 (a) | | 32,985 | 838 |
| | | | 320,633,135 |
| TOTAL COMMON STOCKS | | | |
| (Cost $2,959,279,215) | | | 2,640,675,530 |
|
| Convertible Preferred Stocks - 1.6% | | | |
| Biotechnology - 1.0% | | | |
| Biotechnology - 1.0% | | | |
| 23andMe, Inc. Series E (e) | | 341,730 | 3,229,349 |
| AC Immune SA Series E (e) | | 101,250 | 724,343 |
| Editas Medicine, Inc. Series B (e) | | 53,545 | 771,048 |
| Gensight Biologics Series B (e) | | 76,600 | 381,380 |
| Immunocore Ltd. Series A (e) | | 17,149 | 2,399,113 |
| Intellia Therapeutics, Inc. Series B (e) | | 121,616 | 638,484 |
| Jounce Therapeutics, Inc. Series B (e) | | 1,591,779 | 2,187,104 |
| Moderna LLC: | | | |
| Series D, 8.00% (a)(e) | | 26,918 | 1,245,173 |
| Series E (a)(e) | | 54,410 | 2,516,898 |
| Ovid Therapeutics, Inc. Series B (e) | | 246,448 | 917,279 |
| Pronutria Biosciences, Inc. Series C (e) | | 341,857 | 2,447,012 |
| RaNA Therapeutics LLC Series B (e) | | 1,310,353 | 744,281 |
| Scholar Rock LLC Series B (e) | | 1,083,994 | 2,306,739 |
| Syndax Pharmaceuticals, Inc. Series C1 (e) | | 345,059 | 2,981,310 |
| Twist Bioscience Corp.: | | | |
| Series C (e) | | 1,866,791 | 4,005,573 |
| Series D (e) | | 453,587 | 973,262 |
| | | | 28,468,348 |
| Health Care Providers & Services - 0.1% | | | |
| Health Care Services - 0.1% | | | |
| Allena Pharmaceuticals, Inc. Series C (e) | | 1,505,538 | 2,681,363 |
| Health Care Technology - 0.1% | | | |
| Health Care Technology - 0.1% | | | |
| Codiak Biosciences, Inc.: | | | |
| Series A (e) | | 213,402 | 464,149 |
| Series B (e) | | 693,558 | 1,508,489 |
| | | | 1,972,638 |
| Pharmaceuticals - 0.4% | | | |
| Pharmaceuticals - 0.4% | | | |
| Afferent Pharmaceuticals, Inc. Series C (e) | | 1,915,787 | 2,693,597 |
| Corvus Pharmaceuticals, Inc. Series B (e) | | 180,163 | 2,524,084 |
| Kolltan Pharmaceuticals, Inc. Series D (a)(e) | | 1,610,391 | 1,610,391 |
| Stemcentrx, Inc. Series G (e) | | 208,907 | 2,996,144 |
| Syros Pharmaceuticals, Inc. Series B, 6.00% (a)(e) | | 234,635 | 738,185 |
| | | | 10,562,401 |
| TOTAL CONVERTIBLE PREFERRED STOCKS | | | |
| (Cost $55,238,619) | | | 43,684,750 |
|
| Money Market Funds - 8.2% | | | |
| Fidelity Cash Central Fund, 0.38% (g) | | 13,705,065 | 13,705,065 |
| Fidelity Securities Lending Cash Central Fund, 0.42% (g)(h) | | 205,674,731 | 205,674,731 |
| TOTAL MONEY MARKET FUNDS | | | |
| (Cost $219,379,796) | | | 219,379,796 |
| TOTAL INVESTMENT PORTFOLIO - 108.0% | | | |
| (Cost $3,233,897,630) | | | 2,903,740,076 |
| NET OTHER ASSETS (LIABILITIES) - (8.0)% | | | (215,921,247) |
| NET ASSETS - 100% | | | $2,687,818,829 |
Legend
(a) Non-income producing
(b) Security or a portion of the security is on loan at period end.
(c) Security exempt from registration under Rule 144A of the Securities Act of 1933. These securities may be resold in transactions exempt from registration, normally to qualified institutional buyers. At the end of the period, the value of these securities amounted to $21,741,973 or 0.8% of net assets.
(d) Affiliated company
(e) Restricted securities - Investment in securities not registered under the Securities Act of 1933 (excluding 144A issues). At the end of the period, the value of restricted securities (excluding 144A issues) amounted to $53,034,536 or 2.0% of net assets.
(f) Investment is owned by an entity that is treated as a corporation for U.S. tax purposes and is wholly-owned by the Fund.
(g) Affiliated fund that is generally available only to investment companies and other accounts managed by Fidelity Investments. The rate quoted is the annualized seven-day yield of the fund at period end. A complete unaudited listing of the fund's holdings as of its most recent quarter end is available upon request. In addition, each Fidelity Central Fund's financial statements are available on the SEC's website or upon request.
(h) Investment made with cash collateral received from securities on loan.
Additional information on each restricted holding is as follows:
| Security | Acquisition Date | Acquisition Cost |
| 23andMe, Inc. Series E | 6/18/15 | $3,700,003 |
| AC Immune SA Series E | 10/19/15 | $975,669 |
| Adimab LLC unit | 9/17/14 - 6/5/15 | $6,416,091 |
| Afferent Pharmaceuticals, Inc. Series C | 7/1/15 | $4,700,000 |
| Allena Pharmaceuticals, Inc. Series C | 11/25/15 | $3,989,676 |
| Codiak Biosciences, Inc. Series A | 11/12/15 | $213,402 |
| Codiak Biosciences, Inc. Series B | 11/12/15 | $2,080,674 |
| Corvus Pharmaceuticals, Inc. Series B | 9/16/15 | $2,524,084 |
| Editas Medicine, Inc. Series B | 8/4/15 | $626,477 |
| Gensight Biologics Series B | 7/2/15 | $590,265 |
| Immunocore Ltd. Series A | 7/27/15 | $3,227,085 |
| Intellia Therapeutics, Inc. Series B | 8/20/15 | $638,484 |
| Jounce Therapeutics, Inc. Series B | 4/17/15 | $3,597,421 |
| Kolltan Pharmaceuticals, Inc. Series D | 3/13/14 | $1,610,391 |
| Moderna LLC Series D, 8.00% | 11/6/13 | $574,161 |
| Moderna LLC Series E | 12/18/14 | $3,355,465 |
| Ovid Therapeutics, Inc. Series B | 8/10/15 | $1,535,371 |
| Pronutria Biosciences, Inc. Series C | 1/30/15 | $3,445,919 |
| RaNA Therapeutics LLC Series B | 7/17/15 | $1,415,181 |
| RPI International Holdings LP | 5/21/15 | $1,439,559 |
| Scholar Rock LLC Series B | 12/17/15 | $3,251,982 |
| Stemcentrx, Inc. Series G | 8/14/15 | $4,813,217 |
| Syndax Pharmaceuticals, Inc. Series C1 | 8/21/15 | $3,862,245 |
| Syros Pharmaceuticals, Inc. Series B, 6.00% | 10/9/14 - 1/12/16 | $738,186 |
| Twist Bioscience Corp. Series C | 5/29/15 | $2,800,000 |
| Twist Bioscience Corp. Series D | 1/8/16 | $973,262 |
Affiliated Central Funds
Information regarding fiscal year to date income earned by the Fund from investments in Fidelity Central Funds is as follows:
| Fund | Income earned |
| Fidelity Cash Central Fund | $14,995 |
| Fidelity Securities Lending Cash Central Fund | 3,402,595 |
| Total | $3,417,590 |
Other Affiliated Issuers
An affiliated company is a company in which the Fund has ownership of at least 5% of the voting securities. Fiscal year to date transactions with companies which are or were affiliates are as follows:
| Affiliate | Value, beginning of period | Purchases | Sales Proceeds | Dividend Income | Value, end of period |
| Adamas Pharmaceuticals, Inc. | $22,064,924 | $3,508,766 | $-- | $-- | $-- |
| Aegerion Pharmaceuticals, Inc. | 27,497,252 | -- | -- | -- | -- |
| Egalet Corp. | 5,675,368 | 9,528,212 | -- | -- | 10,550,041 |
| Histogenics Corp. | 4,284,042 | -- | -- | -- | 2,024,327 |
| Total | $59,521,586 | $13,036,978 | $-- | $-- | $12,574,368 |
Investment Valuation
The following is a summary of the inputs used, as of January 31, 2016, involving the Fund's assets and liabilities carried at fair value. The inputs or methodology used for valuing securities may not be an indication of the risk associated with investing in those securities. For more information on valuation inputs, and their aggregation into the levels used below, please refer to the Investment Valuation section in the accompanying Notes to Financial Statements.
| | Valuation Inputs at Reporting Date: |
| Description | Total | Level 1 | Level 2 | Level 3 |
| Investments in Securities: | | | | |
| Common Stocks | $2,640,675,530 | $2,497,687,829 | $133,637,911 | $9,349,790 |
| Convertible Preferred Stocks | 43,684,750 | -- | 2,981,310 | 40,703,440 |
| Money Market Funds | 219,379,796 | 219,379,796 | -- | -- |
| Total Investments in Securities: | $2,903,740,076 | $2,717,067,625 | $136,619,221 | $50,053,230 |
The following is a summary of transfers between Level 1 and Level 2 for the period ended January 31, 2016. Transfers are assumed to have occurred at the beginning of the period, and are primarily attributable to the valuation techniques used for foreign equity securities, as discussed in the accompanying Notes to Financial Statements:
| Transfers | Total |
| Level 1 to Level 2 | $76,339,677 |
| Level 2 to Level 1 | $0 |
The following is a reconciliation of Investments in Securities for which Level 3 inputs were used in determining value:
| Investments in Securities: | |
| Other Investments in Securities | |
| Beginning Balance | $13,219,438 |
| Total Realized Gain (Loss) | -- |
| Total Unrealized Gain (Loss) | (940,217) |
| Cost of Purchases | 8,500 |
| Proceeds of Sales | (878,043) |
| Amortization/Accretion | -- |
| Transfers in to Level 3 | 2 |
| Transfers out of Level 3 | (2,059,890) |
| Ending Balance | $9,349,790 |
| The change in unrealized gain (loss) for the period attributable to Level 3 securities held at January 31, 2016 | $243,796 |
| Convertible Preferred Stocks | |
| Beginning Balance | $59,208,008 |
| Total Realized Gain (Loss) | -- |
| Total Unrealized Gain (Loss) | (20,557,571) |
| Cost of Purchases | 21,844,541 |
| Proceeds of Sales | (19,791,538) |
| Amortization/Accretion | -- |
| Transfers in to Level 3 | -- |
| Transfers out of Level 3 | -- |
| Ending Balance | $40,703,440 |
| The change in unrealized gain (loss) for the period attributable to Level 3 securities held at January 31, 2016 | $(11,764,722) |
The information used in the above reconciliations represents fiscal year to date activity for any Investments in Securities identified as using Level 3 inputs at either the beginning or the end of the current fiscal period. Transfers in or out of Level 3 represent the beginning value of any Security or Instrument where a change in the pricing level occurred from the beginning to the end of the period. The cost of purchases and the proceeds of sales may include securities received or delivered through corporate actions or exchanges. Realized and unrealized gains (losses) disclosed in the reconciliation are included in Net Gain (Loss) on the Fund's Statement of Operations.
Other Information
Distribution of investments by country or territory of incorporation, as a percentage of Total Net Assets, is as follows (Unaudited):
| United States of America | 89.9% |
| Ireland | 3.5% |
| Denmark | 2.2% |
| United Kingdom | 1.1% |
| Others (Individually Less Than 1%) | 3.3% |
| | 100.0% |
See accompanying notes which are an integral part of the financial statements.
Fidelity Advisor® Biotechnology Fund
Financial Statements
Statement of Assets and Liabilities
| | | January 31, 2016 (Unaudited) |
| Assets | | |
Investment in securities, at value (including securities loaned of $203,832,360) — See accompanying schedule:
Unaffiliated issuers (cost $2,992,516,227) | $2,671,785,912 | |
| Fidelity Central Funds (cost $219,379,796) | 219,379,796 | |
| Other affiliated issuers (cost $22,001,607) | 12,574,368 | |
| Total Investments (cost $3,233,897,630) | | $2,903,740,076 |
| Receivable for investments sold | | 24,862 |
| Receivable for fund shares sold | | 6,646,108 |
| Distributions receivable from Fidelity Central Funds | | 562,551 |
| Prepaid expenses | | 16,323 |
| Other receivables | | 3,255 |
| Total assets | | 2,910,993,175 |
| Liabilities | | |
| Payable to custodian bank | $3,063 | |
| Payable for fund shares redeemed | 14,357,667 | |
| Accrued management fee | 1,421,274 | |
| Distribution and service plan fees payable | 925,204 | |
| Other affiliated payables | 665,705 | |
| Other payables and accrued expenses | 126,702 | |
| Collateral on securities loaned, at value | 205,674,731 | |
| Total liabilities | | 223,174,346 |
| Net Assets | | $2,687,818,829 |
| Net Assets consist of: | | |
| Paid in capital | | $3,019,739,821 |
| Accumulated net investment loss | | (14,314,839) |
| Accumulated undistributed net realized gain (loss) on investments and foreign currency transactions | | 12,602,532 |
| Net unrealized appreciation (depreciation) on investments | | (330,208,685) |
| Net Assets | | $2,687,818,829 |
| Calculation of Maximum Offering Price | | |
| Class A: | | |
| Net Asset Value and redemption price per share ($1,052,779,391 ÷ 54,855,241 shares) | | $19.19 |
| Maximum offering price per share (100/94.25 of $19.19) | | $20.36 |
| Class T: | | |
| Net Asset Value and redemption price per share ($127,758,675 ÷ 6,973,005 shares) | | $18.32 |
| Maximum offering price per share (100/96.50 of $18.32) | | $18.98 |
| Class B: | | |
| Net Asset Value and offering price per share ($3,959,447 ÷ 235,036 shares)(a) | | $16.85 |
| Class C: | | |
| Net Asset Value and offering price per share ($633,768,794 ÷ 37,610,515 shares)(a) | | $16.85 |
| Class I: | | |
| Net Asset Value, offering price and redemption price per share ($869,552,522 ÷ 43,101,740 shares) | | $20.17 |
(a) Redemption price per share is equal to net asset value less any applicable contingent deferred sales charge.
See accompanying notes which are an integral part of the financial statements.
Statement of Operations
| | | Six months ended January 31, 2016 (Unaudited) |
| Investment Income | | |
| Dividends | | $2,955,118 |
| Income from Fidelity Central Funds (including $3,402,595 from security lending) | | 3,417,590 |
| Total income | | 6,372,708 |
| Expenses | | |
| Management fee | $9,867,712 | |
| Transfer agent fees | 3,570,620 | |
| Distribution and service plan fees | 6,374,234 | |
| Accounting and security lending fees | 534,459 | |
| Custodian fees and expenses | 72,351 | |
| Independent trustees' compensation | 34,197 | |
| Registration fees | 153,094 | |
| Audit | 51,038 | |
| Legal | 19,274 | |
| Interest | 6,838 | |
| Miscellaneous | 19,089 | |
| Total expenses before reductions | 20,702,906 | |
| Expense reductions | (15,359) | 20,687,547 |
| Net investment income (loss) | | (14,314,839) |
| Realized and Unrealized Gain (Loss) | | |
| Net realized gain (loss) on: | | |
| Investment securities: | | |
| Unaffiliated issuers | 25,066,087 | |
| Foreign currency transactions | (9,713) | |
| Total net realized gain (loss) | | 25,056,374 |
| Change in net unrealized appreciation (depreciation) on investment securities (net of increase in deferred foreign taxes of $51,131) | | (1,542,779,776) |
| Net gain (loss) | | (1,517,723,402) |
| Net increase (decrease) in net assets resulting from operations | | $(1,532,038,241) |
See accompanying notes which are an integral part of the financial statements.
Statement of Changes in Net Assets
| | Six months ended January 31, 2016 (Unaudited) | Year ended July 31, 2015 |
| Increase (Decrease) in Net Assets | | |
| Operations | | |
| Net investment income (loss) | $(14,314,839) | $(22,504,330) |
| Net realized gain (loss) | 25,056,374 | 265,529,861 |
| Change in net unrealized appreciation (depreciation) | (1,542,779,776) | 881,295,858 |
| Net increase (decrease) in net assets resulting from operations | (1,532,038,241) | 1,124,321,389 |
| Distributions to shareholders from net investment income | – | (69,565) |
| Distributions to shareholders from net realized gain | (189,322,364) | (51,362,234) |
| Total distributions | (189,322,364) | (51,431,799) |
| Share transactions - net increase (decrease) | 283,799,085 | 1,521,666,795 |
| Redemption fees | 200,094 | 97,303 |
| Total increase (decrease) in net assets | (1,437,361,426) | 2,594,653,688 |
| Net Assets | | |
| Beginning of period | 4,125,180,255 | 1,530,526,567 |
| End of period (including accumulated net investment loss of $14,314,839 and undistributed net investment income of $0, respectively) | $2,687,818,829 | $4,125,180,255 |
See accompanying notes which are an integral part of the financial statements.
Financial Highlights — Fidelity Advisor Biotechnology Fund Class A
| | Six months ended (Unaudited) | Years ended July 31, | | | | |
| January 31, | 2016 | 2015 | 2014 | 2013 | 2012 | 2011 |
| Selected Per–Share Data | | | | | | |
| Net asset value, beginning of period | $31.43 | $20.19 | $17.25 | $11.79 | $8.81 | $6.67 |
| Income from Investment Operations | | | | | | |
| Net investment income (loss)A | (.09) | (.20) | (.13) | (.09) | (.07) | (.07)B |
| Net realized and unrealized gain (loss) | (10.75) | 12.04 | 3.12 | 6.24 | 3.05 | 2.21 |
| Total from investment operations | (10.84) | 11.84 | 2.99 | 6.15 | 2.98 | 2.14 |
| Distributions from net realized gain | (1.40) | (.60) | (.05) | (.69) | – | – |
| Total distributions | (1.40) | (.60) | (.05) | (.69) | – | – |
| Redemption fees added to paid in capitalA,C | – | – | – | – | – | – |
| Net asset value, end of period | $19.19 | $31.43 | $20.19 | $17.25 | $11.79 | $8.81 |
| Total ReturnD,E,F | (35.90)% | 59.66% | 17.38% | 54.94% | 33.83% | 32.08% |
| Ratios to Average Net AssetsG,H | | | | | | |
| Expenses before reductions | 1.05%I | 1.04% | 1.08% | 1.15% | 1.27% | 1.35% |
| Expenses net of fee waivers, if any | 1.05%I | 1.04% | 1.08% | 1.15% | 1.27% | 1.35% |
| Expenses net of all reductions | 1.05%I | 1.04% | 1.08% | 1.14% | 1.27% | 1.34% |
| Net investment income (loss) | (.69)%I | (.75)% | (.68)% | (.63)% | (.73)% | (.91)%B |
| Supplemental Data | | | | | | |
| Net assets, end of period (000 omitted) | $1,052,779 | $1,560,528 | $602,625 | $286,695 | $68,993 | $30,639 |
| Portfolio turnover rateJ | 28%I | 26% | 50% | 22% | 82% | 99% |
A Calculated based on average shares outstanding during the period.
B Net Investment income per share reflects a large, non-recurring dividend which amounted to $.01 per share. Excluding this non-recurring dividend, the ratio of net investment income (loss) to average net assets would have been (1.04) %.
C Amount represents less than $.005 per share.
D Total returns for periods of less than one year are not annualized.
E Total returns would have been lower if certain expenses had not been reduced during the applicable periods shown.
F Total returns do not include the effect of the sales charges.
G Fees and expenses of any underlying Fidelity Central Funds are not included in the Fund's expense ratio. The Fund indirectly bears its proportionate share of the expenses of any underlying Fidelity Central Funds.
H Expense ratios reflect operating expenses of the class. Expenses before reductions do not reflect amounts reimbursed by the investment adviser or reductions from brokerage service arrangements or reductions from other expense offset arrangements and do not represent the amount paid by the class during periods when reimbursements or reductions occur. Expenses net of fee waivers reflect expenses after reimbursement by the investment adviser but prior to reductions from brokerage service arrangements or other expense offset arrangements. Expenses net of all reductions represent the net expenses paid by the class.
I Annualized
J Amount does not include the portfolio activity of any underlying Fidelity Central Funds.
See accompanying notes which are an integral part of the financial statements.
Financial Highlights — Fidelity Advisor Biotechnology Fund Class T
| | Six months ended (Unaudited) | Years ended July 31, | | | | |
| January 31, | 2016 | 2015 | 2014 | 2013 | 2012 | 2011 |
| Selected Per–Share Data | | | | | | |
| Net asset value, beginning of period | $30.06 | $19.39 | $16.63 | $11.42 | $8.56 | $6.50 |
| Income from Investment Operations | | | | | | |
| Net investment income (loss)A | (.12) | (.27) | (.19) | (.12) | (.10) | (.09)B |
| Net realized and unrealized gain (loss) | (10.27) | 11.54 | 3.00 | 6.02 | 2.96 | 2.15 |
| Total from investment operations | (10.39) | 11.27 | 2.81 | 5.90 | 2.86 | 2.06 |
| Distributions from net realized gain | (1.35) | (.60) | (.05) | (.69) | – | – |
| Total distributions | (1.35) | (.60) | (.05) | (.69) | – | – |
| Redemption fees added to paid in capitalA,C | – | – | – | – | – | – |
| Net asset value, end of period | $18.32 | $30.06 | $19.39 | $16.63 | $11.42 | $8.56 |
| Total ReturnD,E,F | (35.98)% | 59.17% | 16.95% | 54.50% | 33.41% | 31.69% |
| Ratios to Average Net AssetsG,H | | | | | | |
| Expenses before reductions | 1.36%I | 1.35% | 1.41% | 1.46% | 1.56% | 1.64% |
| Expenses net of fee waivers, if any | 1.36%I | 1.35% | 1.41% | 1.46% | 1.56% | 1.64% |
| Expenses net of all reductions | 1.36%I | 1.34% | 1.40% | 1.46% | 1.56% | 1.64% |
| Net investment income (loss) | (1.00)%I | (1.05)% | (1.01)% | (.94)% | (1.02)% | (1.21)%B |
| Supplemental Data | | | | | | |
| Net assets, end of period (000 omitted) | $127,759 | $196,393 | $95,945 | $67,887 | $28,154 | $16,454 |
| Portfolio turnover rateJ | 28%I | 26% | 50% | 22% | 82% | 99% |
A Calculated based on average shares outstanding during the period.
B Net Investment income per share reflects a large, non-recurring dividend which amounted to $.01 per share. Excluding this non-recurring dividend, the ratio of net investment income (loss) to average net assets would have been (1.34) %.
C Amount represents less than $.005 per share.
D Total returns for periods of less than one year are not annualized.
E Total returns would have been lower if certain expenses had not been reduced during the applicable periods shown.
F Total returns do not include the effect of the sales charges.
G Fees and expenses of any underlying Fidelity Central Funds are not included in the Fund's expense ratio. The Fund indirectly bears its proportionate share of the expenses of any underlying Fidelity Central Funds.
H Expense ratios reflect operating expenses of the class. Expenses before reductions do not reflect amounts reimbursed by the investment adviser or reductions from brokerage service arrangements or reductions from other expense offset arrangements and do not represent the amount paid by the class during periods when reimbursements or reductions occur. Expenses net of fee waivers reflect expenses after reimbursement by the investment adviser but prior to reductions from brokerage service arrangements or other expense offset arrangements. Expenses net of all reductions represent the net expenses paid by the class.
I Annualized
J Amount does not include the portfolio activity of any underlying Fidelity Central Funds.
See accompanying notes which are an integral part of the financial statements.
Financial Highlights — Fidelity Advisor Biotechnology Fund Class B
| | Six months ended (Unaudited) | Years ended July 31, | | | | |
| January 31, | 2016 | 2015 | 2014 | 2013 | 2012 | 2011 |
| Selected Per–Share Data | | | | | | |
| Net asset value, beginning of period | $27.73 | $18.01 | $15.52 | $10.75 | $8.09 | $6.17 |
| Income from Investment Operations | | | | | | |
| Net investment income (loss)A | (.17) | (.35) | (.26) | (.17) | (.13) | (.12)B |
| Net realized and unrealized gain (loss) | (9.45) | 10.67 | 2.80 | 5.63 | 2.79 | 2.04 |
| Total from investment operations | (9.62) | 10.32 | 2.54 | 5.46 | 2.66 | 1.92 |
| Distributions from net realized gain | (1.26) | (.60) | (.05) | (.69) | – | – |
| Total distributions | (1.26) | (.60) | (.05) | (.69) | – | – |
| Redemption fees added to paid in capitalA,C | – | – | – | – | – | – |
| Net asset value, end of period | $16.85 | $27.73 | $18.01 | $15.52 | $10.75 | $8.09 |
| Total ReturnD,E,F | (36.13)% | 58.42% | 16.42% | 53.76% | 32.88% | 31.12% |
| Ratios to Average Net AssetsG,H | | | | | | |
| Expenses before reductions | 1.83%I | 1.83% | 1.89% | 1.94% | 2.03% | 2.10% |
| Expenses net of fee waivers, if any | 1.83%I | 1.83% | 1.89% | 1.94% | 2.03% | 2.10% |
| Expenses net of all reductions | 1.83%I | 1.82% | 1.88% | 1.94% | 2.02% | 2.09% |
| Net investment income (loss) | (1.48)%I | (1.53)% | (1.49)% | (1.42)% | (1.49)% | (1.66)%B |
| Supplemental Data | | | | | | |
| Net assets, end of period (000 omitted) | $3,959 | $8,098 | $6,101 | $8,136 | $6,349 | $5,849 |
| Portfolio turnover rateJ | 28%I | 26% | 50% | 22% | 82% | 99% |
A Calculated based on average shares outstanding during the period.
B Net Investment income per share reflects a large, non-recurring dividend which amounted to $.01 per share. Excluding this non-recurring dividend, the ratio of net investment income (loss) to average net assets would have been (1.79) %.
C Amount represents less than $.005 per share.
D Total returns for periods of less than one year are not annualized.
E Total returns would have been lower if certain expenses had not been reduced during the applicable periods shown.
F Total returns do not include the effect of the contingent deferred sales charge.
G Fees and expenses of any underlying Fidelity Central Funds are not included in the Fund's expense ratio. The Fund indirectly bears its proportionate share of the expenses of any underlying Fidelity Central Funds.
H Expense ratios reflect operating expenses of the class. Expenses before reductions do not reflect amounts reimbursed by the investment adviser or reductions from brokerage service arrangements or reductions from other expense offset arrangements and do not represent the amount paid by the class during periods when reimbursements or reductions occur. Expenses net of fee waivers reflect expenses after reimbursement by the investment adviser but prior to reductions from brokerage service arrangements or other expense offset arrangements. Expenses net of all reductions represent the net expenses paid by the class.
I Annualized
J Amount does not include the portfolio activity of any underlying Fidelity Central Funds.
See accompanying notes which are an integral part of the financial statements.
Financial Highlights — Fidelity Advisor Biotechnology Fund Class C
| | Six months ended (Unaudited) | Years ended July 31, | | | | |
| January 31, | 2016 | 2015 | 2014 | 2013 | 2012 | 2011 |
| Selected Per–Share Data | | | | | | |
| Net asset value, beginning of period | $27.78 | $18.04 | $15.53 | $10.76 | $8.10 | $6.18 |
| Income from Investment Operations | | | | | | |
| Net investment income (loss)A | (.16) | (.35) | (.25) | (.17) | (.13) | (.12)B |
| Net realized and unrealized gain (loss) | (9.45) | 10.69 | 2.81 | 5.63 | 2.79 | 2.04 |
| Total from investment operations | (9.61) | 10.34 | 2.56 | 5.46 | 2.66 | 1.92 |
| Distributions from net realized gain | (1.32) | (.60) | (.05) | (.69) | – | – |
| Total distributions | (1.32) | (.60) | (.05) | (.69) | – | – |
| Redemption fees added to paid in capitalA,C | – | – | – | – | – | – |
| Net asset value, end of period | $16.85 | $27.78 | $18.04 | $15.53 | $10.76 | $8.10 |
| Total ReturnD,E,F | (36.11)% | 58.43% | 16.54% | 53.71% | 32.84% | 31.07% |
| Ratios to Average Net AssetsG,H | | | | | | |
| Expenses before reductions | 1.80%I | 1.79% | 1.83% | 1.88% | 2.01% | 2.10% |
| Expenses net of fee waivers, if any | 1.80%I | 1.79% | 1.83% | 1.88% | 2.01% | 2.10% |
| Expenses net of all reductions | 1.80%I | 1.79% | 1.83% | 1.87% | 2.01% | 2.09% |
| Net investment income (loss) | (1.44)%I | (1.49)% | (1.43)% | (1.36)% | (1.47)% | (1.66)%B |
| Supplemental Data | | | | | | |
| Net assets, end of period (000 omitted) | $633,769 | $956,495 | $359,967 | $146,684 | $31,710 | $15,787 |
| Portfolio turnover rateJ | 28%I | 26% | 50% | 22% | 82% | 99% |
A Calculated based on average shares outstanding during the period.
B Net Investment income per share reflects a large, non-recurring dividend which amounted to $.01 per share. Excluding this non-recurring dividend, the ratio of net investment income (loss) to average net assets would have been (1.79) %.
C Amount represents less than $.005 per share.
D Total returns for periods of less than one year are not annualized.
E Total returns would have been lower if certain expenses had not been reduced during the applicable periods shown.
F Total returns do not include the effect of the contingent deferred sales charge.
G Fees and expenses of any underlying Fidelity Central Funds are not included in the Fund's expense ratio. The Fund indirectly bears its proportionate share of the expenses of any underlying Fidelity Central Funds.
H Expense ratios reflect operating expenses of the class. Expenses before reductions do not reflect amounts reimbursed by the investment adviser or reductions from brokerage service arrangements or reductions from other expense offset arrangements and do not represent the amount paid by the class during periods when reimbursements or reductions occur. Expenses net of fee waivers reflect expenses after reimbursement by the investment adviser but prior to reductions from brokerage service arrangements or other expense offset arrangements. Expenses net of all reductions represent the net expenses paid by the class.
I Annualized
J Amount does not include the portfolio activity of any underlying Fidelity Central Funds.
See accompanying notes which are an integral part of the financial statements.
Financial Highlights — Fidelity Advisor Biotechnology Fund Class I
| | Six months ended (Unaudited) | Years ended July 31, | | | | |
| January 31, | 2016 | 2015 | 2014 | 2013 | 2012 | 2011 |
| Selected Per–Share Data | | | | | | |
| Net asset value, beginning of period | $32.95 | $21.10 | $17.97 | $12.22 | $9.10 | $6.87 |
| Income from Investment Operations | | | | | | |
| Net investment income (loss)A | (.06) | (.14) | (.08) | (.05) | (.04) | (.05)B |
| Net realized and unrealized gain (loss) | (11.28) | 12.60 | 3.26 | 6.49 | 3.16 | 2.28 |
| Total from investment operations | (11.34) | 12.46 | 3.18 | 6.44 | 3.12 | 2.23 |
| Distributions from net realized gain | (1.44) | (.60) | (.05) | (.69) | – | – |
| Total distributions | (1.44) | (.61)C | (.05) | (.69) | – | – |
| Redemption fees added to paid in capitalA,D | – | – | – | – | – | – |
| Net asset value, end of period | $20.17 | $32.95 | $21.10 | $17.97 | $12.22 | $9.10 |
| Total ReturnE,F | (35.80)% | 60.00% | 17.74% | 55.39% | 34.29% | 32.46% |
| Ratios to Average Net AssetsG,H | | | | | | |
| Expenses before reductions | .78%I | .78% | .81% | .85% | .95% | 1.04% |
| Expenses net of fee waivers, if any | .78%I | .78% | .81% | .85% | .95% | 1.04% |
| Expenses net of all reductions | .78%I | .77% | .80% | .84% | .94% | 1.03% |
| Net investment income (loss) | (.43)%I | (.48)% | (.41)% | (.32)% | (.40)% | (.60)%B |
| Supplemental Data | | | | | | |
| Net assets, end of period (000 omitted) | $869,553 | $1,403,666 | $465,889 | $177,926 | $26,772 | $5,903 |
| Portfolio turnover rateJ | 28%I | 26% | 50% | 22% | 82% | 99% |
A Calculated based on average shares outstanding during the period.
B Net Investment income per share reflects a large, non-recurring dividend which amounted to $.01 per share. Excluding this non-recurring dividend, the ratio of net investment income (loss) to average net assets would have been (.73) %.
C Total distributions of $.61 per share is comprised of distributions from net investment income of $.003 and distributions from net realized gain of $.604 per share.
D Amount represents less than $.005 per share.
E Total returns for periods of less than one year are not annualized.
F Total returns would have been lower if certain expenses had not been reduced during the applicable periods shown.
G Fees and expenses of any underlying Fidelity Central Funds are not included in the Fund's expense ratio. The Fund indirectly bears its proportionate share of the expenses of any underlying Fidelity Central Funds.
H Expense ratios reflect operating expenses of the class. Expenses before reductions do not reflect amounts reimbursed by the investment adviser or reductions from brokerage service arrangements or reductions from other expense offset arrangements and do not represent the amount paid by the class during periods when reimbursements or reductions occur. Expenses net of fee waivers reflect expenses after reimbursement by the investment adviser but prior to reductions from brokerage service arrangements or other expense offset arrangements. Expenses net of all reductions represent the net expenses paid by the class.
I Annualized
J Amount does not include the portfolio activity of any underlying Fidelity Central Funds.
See accompanying notes which are an integral part of the financial statements.
Notes to Financial Statements (Unaudited)
For the period ended January 31, 2016
1. Organization.
Fidelity Advisor Biotechnology Fund (the Fund) is a non-diversified fund of Fidelity Advisor Series VII (the Trust) and is authorized to issue an unlimited number of shares. The Trust is registered under the Investment Company Act of 1940, as amended (the 1940 Act), as an open-end management investment company organized as a Massachusetts business trust. The Fund offers Class A, Class T, Class C and Class I shares, each of which, along with Class B shares, has equal rights as to assets and voting privileges. Class B shares are closed to new accounts and additional purchases, except for exchanges and reinvestments. Each class has exclusive voting rights with respect to matters that affect that class. Class B shares will automatically convert to Class A shares after a holding period of seven years from the initial date of purchase.
During the period, the Board of Trustees approved the conversion of all existing Class B shares into Class A shares, effective on or about July 1, 2016, regardless of the length of times shares have been held.
2. Investments in Fidelity Central Funds.
The Fund invests in Fidelity Central Funds, which are open-end investment companies generally available only to other investment companies and accounts managed by the investment adviser and its affiliates. The Fund's Schedule of Investments lists each of the Fidelity Central Funds held as of period end, if any, as an investment of the Fund, but does not include the underlying holdings of each Fidelity Central Fund. As an Investing Fund, the Fund indirectly bears its proportionate share of the expenses of the underlying Fidelity Central Funds.
The Money Market Central Funds seek preservation of capital and current income and are managed by Fidelity Investments Money Management, Inc. (FIMM), an affiliate of the investment adviser. Annualized expenses of the Money Market Central Funds as of their most recent shareholder report date are less than .005%.
A complete unaudited list of holdings for each Fidelity Central Fund is available upon request or at the Securities and Exchange Commission (the SEC) website at www.sec.gov. In addition, the financial statements of the Fidelity Central Funds are available on the SEC website or upon request.
3. Significant Accounting Policies.
The financial statements have been prepared in conformity with accounting principles generally accepted in the United States of America (GAAP), which require management to make certain estimates and assumptions at the date of the financial statements. Actual results could differ from those estimates. Subsequent events, if any, through the date that the financial statements were issued have been evaluated in the preparation of the financial statements. The following summarizes the significant accounting policies of the Fund:
Investment Valuation. Investments are valued as of 4:00 p.m. Eastern time on the last calendar day of the period. The Board of Trustees (the Board) has delegated the day to day responsibility for the valuation of the Fund's investments to the Fidelity SelectCo, LLC (SelectCo) Fair Value Committee (the Committee). In accordance with valuation policies and procedures approved by the Board, the Fund attempts to obtain prices from one or more third party pricing vendors or brokers to value its investments. When current market prices, quotations or currency exchange rates are not readily available or reliable, investments will be fair valued in good faith by the Committee, in accordance with procedures adopted by the Board. Factors used in determining fair value vary by investment type and may include market or investment specific events. The frequency with which these procedures are used cannot be predicted and they may be utilized to a significant extent. The Committee oversees the Fund's valuation policies and procedures and reports to the Board on the Committee's activities and fair value determinations. The Board monitors the appropriateness of the procedures used in valuing the Fund's investments and ratifies the fair value determinations of the Committee.
The Fund categorizes the inputs to valuation techniques used to value its investments into a disclosure hierarchy consisting of three levels as shown below:
- Level 1 – quoted prices in active markets for identical investments
- Level 2 – other significant observable inputs (including quoted prices for similar investments, interest rates, prepayment speeds, etc.)
- Level 3 – unobservable inputs (including the Fund's own assumptions based on the best information available)
Valuation techniques used to value the Fund's investments by major category are as follows:
Equity securities, including restricted securities, for which market quotations are readily available, are valued at the last reported sale price or official closing price as reported by a third party pricing vendor on the primary market or exchange on which they are traded and are categorized as Level 1 in the hierarchy. In the event there were no sales during the day or closing prices are not available, securities are valued at the last quoted bid price or may be valued using the last available price and are generally categorized as Level 2 in the hierarchy. For foreign equity securities, when market or security specific events arise, comparisons to the valuation of American Depositary Receipts (ADRs), futures contracts, Exchange-Traded Funds (ETFs) and certain indexes as well as quoted prices for similar securities may be used and would be categorized as Level 2 in the hierarchy. Utilizing these techniques may result in transfers between Level 1 and Level 2. For equity securities, including restricted securities, where observable inputs are limited, assumptions about market activity and risk are used and these securities may be categorized as Level 3 in the hierarchy. Equity securities, including restricted securities, for which observable inputs are not available are valued using alternate valuation approaches, including the market approach and the income approach and are categorized as Level 3 in the hierarchy. The market approach generally consists of using comparable market transactions while the income approach generally consists of using the net present value of estimated future cash flows, adjusted as appropriate for liquidity, credit, market and/or other risk factors.
Investments in open-end mutual funds, including the Fidelity Central Funds, are valued at their closing net asset value (NAV) each business day and are categorized as Level 1 in the hierarchy.
The following provides information on Level 3 securities held by the Fund that were valued at period end based on unobservable inputs. These amounts exclude valuations provided by a broker.
| Asset Type | Fair Value at 01/31/16 | Valuation Technique(s) | Unobservable Input | Amount or Range/Weighted Average | Impact to Valuation from an Increase in Input* |
| Equities | $50,053,230 | Expected distribution | Recovery rate | 0.0% | Increase |
| | | Last transaction price
| Transaction price
| $1.00 - $140.00/
$20.50
| Increase
|
| | | Market comparable
| EV/Sales multiple
| 2.1
| Increase
|
| | | | Discount rate
| 21.0%
| Decrease
|
| | | | Discount for lack of marketability | 10.0% | Decrease |
| | | Partnership NAV
| Partnership NAV
| $140.20
| Increase
|
| | | Proposed transaction price | Transaction price | $8.00 | Increase |
| | | | Discount rate
| 10.0%
| Decrease
|
| | | | Index movement
| 30.2% | Increase
|
| | | Proxy adjustment | Proxy movement | 25.0% - 47.4% / 32.9% | Increase |
* Represents the expected directional change in the fair value of the Level 3 investments that would result from an increase in the corresponding input. A decrease to the unobservable input would have the opposite effect. Significant changes in these inputs could result in significantly higher or lower fair value measurements.
Changes in valuation techniques may result in transfers in or out of an assigned level within the disclosure hierarchy. The aggregate value of investments by input level as of January 31, 2016, including information on transfers between Levels 1 and 2, as well as a roll forward of Level 3 investments, is included at the end of the Fund's Schedule of Investments.
Foreign Currency. The Fund may use foreign currency contracts to facilitate transactions in foreign-denominated securities. Gains and losses from these transactions may arise from changes in the value of the foreign currency or if the counterparties do not perform under the contracts' terms.
Foreign-denominated assets, including investment securities, and liabilities are translated into U.S. dollars at the exchange rates at period end. Purchases and sales of investment securities, income and dividends received and expenses denominated in foreign currencies are translated into U.S. dollars at the exchange rate in effect on the transaction date.
The effects of exchange rate fluctuations on investments are included with the net realized and unrealized gain (loss) on investment securities. Other foreign currency transactions resulting in realized and unrealized gain (loss) are disclosed separately.
Investment Transactions and Income. For financial reporting purposes, the Fund's investment holdings and NAV include trades executed through the end of the last business day of the period. The NAV per share for processing shareholder transactions is calculated as of the close of business of the New York Stock Exchange (NYSE), normally 4:00 p.m. Eastern time and includes trades executed through the end of the prior business day. Gains and losses on securities sold are determined on the basis of identified cost and may include proceeds received from litigation. Dividend income is recorded on the ex-dividend date, except for certain dividends from foreign securities where the ex-dividend date may have passed, which are recorded as soon as the Fund is informed of the ex-dividend date. Distributions received on securities that represent a return of capital or capital gain are recorded as a reduction of cost of investments and/or as a realized gain. Subsequent to ex-dividend date the Fund determines the components of these distributions, based upon receipt of tax filings or other correspondence relating to the underlying investment. Non-cash dividends included in dividend income, if any, are recorded at the fair market value of the securities received. Income and capital gain distributions from Fidelity Central Funds, if any, are recorded on the ex-dividend date. Investment income is recorded net of foreign taxes withheld where recovery of such taxes is uncertain.
Class Allocations and Expenses. Investment income, realized and unrealized capital gains and losses, common expenses of the Fund, and certain fund-level expense reductions, if any, are allocated daily on a pro-rata basis to each class based on the relative net assets of each class to the total net assets of the Fund. Each class differs with respect to transfer agent and distribution and service plan fees incurred. Certain expense reductions may also differ by class. For the reporting period, the allocated portion of income and expenses to each class as a percent of its average net assets may vary due to the timing of recording these transactions in relation to fluctuating net assets of the classes. Expenses directly attributable to a fund are charged to that fund. Expenses attributable to more than one fund are allocated among the respective funds on the basis of relative net assets or other appropriate methods. Expense estimates are accrued in the period to which they relate and adjustments are made when actual amounts are known.
Income Tax Information and Distributions to Shareholders. Each year, the Fund intends to qualify as a regulated investment company under Subchapter M of the Internal Revenue Code, including distributing substantially all of its taxable income and realized gains. As a result, no provision for U.S. Federal income taxes is required. The Fund files a U.S. federal tax return, in addition to state and local tax returns as required. The Fund's federal income tax returns are subject to examination by the Internal Revenue Service (IRS) for a period of three fiscal years after they are filed. State and local tax returns may be subject to examination for an additional fiscal year depending on the jurisdiction. Foreign taxes are provided for based on the Fund's understanding of the tax rules and rates that exist in the foreign markets in which it invests. The Fund is subject to a tax imposed on capital gains by certain countries in which it invests. An estimated deferred tax liability for net unrealized appreciation on the applicable securities is included in Other payables and accrued expenses on the Statement of Assets & Liabilities.
Distributions are declared and recorded on the ex-dividend date. Income dividends and capital gain distributions are declared separately for each class. Income and capital gain distributions are determined in accordance with income tax regulations, which may differ from GAAP.
Capital accounts within the financial statements are adjusted for permanent book-tax differences. These adjustments have no impact on net assets or the results of operations. Capital accounts are not adjusted for temporary book-tax differences which will reverse in a subsequent period.
Book-tax differences are primarily due to foreign currency transactions, passive foreign investment companies (PFIC), partnerships, net operating losses and losses deferred due to wash sales and excise tax regulations.
The federal tax cost of investment securities and unrealized appreciation (depreciation) as of period end were as follows:
| Gross unrealized appreciation | $476,116,518 |
| Gross unrealized depreciation | (814,858,124) |
| Net unrealized appreciation (depreciation) on securities | $(338,741,606) |
| Tax cost | $3,242,481,682 |
Short-Term Trading (Redemption) Fees. Shares held by investors in the Fund less than 30 days may have been subject to a redemption fee equal to .75% of the NAV of shares redeemed. All redemption fees, which reduce the proceeds of the shareholder redemption, are retained by the Fund and accounted for as an addition to paid in capital.
Restricted Securities. The Fund may invest in securities that are subject to legal or contractual restrictions on resale. These securities generally may be resold in transactions exempt from registration or to the public if the securities are registered. Disposal of these securities may involve time-consuming negotiations and expense, and prompt sale at an acceptable price may be difficult. Information regarding restricted securities is included at the end of the Fund's Schedule of Investments.
4. Purchases and Sales of Investments.
Purchases and sales of securities, other than short-term securities, aggregated $591,885,078 and $494,207,020, respectively.
5. Fees and Other Transactions with Affiliates.
Management Fee. Fidelity SelectCo, LLC (the investment adviser) and its affiliates provide the Fund with investment management related services for which the Fund pays a monthly management fee. The management fee is the sum of an individual fund fee rate that is based on an annual rate of .30% of the Fund's average net assets and an annualized group fee rate that averaged .25% during the period. The group fee rate is based upon the average net assets of all the mutual funds advised by Fidelity Management & Research Company (FMR) and the investment adviser. The group fee rate decreases as assets under management increase and increases as assets under management decrease. For the reporting period, the total annualized management fee rate was .55% of the Fund's average net assets.
Distribution and Service Plan Fees. In accordance with Rule 12b-1 of the 1940 Act, the Fund has adopted separate Distribution and Service Plans for each class of shares. Certain classes pay Fidelity Distributors Corporation (FDC), an affiliate of the investment adviser, separate Distribution and Service Fees, each of which is based on an annual percentage of each class' average net assets. In addition, FDC may pay financial intermediaries for selling shares of the Fund and providing shareholder support services. For the period, the Distribution and Service Fee rates, total fees and amounts retained by FDC were as follows:
| | Distribution
Fee | Service
Fee | Total Fees | Retained
by FDC |
| Class A | -% | .25% | $1,729,946 | $– |
| Class T | .25% | .25% | 420,676 | – |
| Class B | .75% | .25% | 30,633 | 22,975 |
| Class C | .75% | .25% | 4,192,979 | 1,706,860 |
| | | | $6,374,234 | $1,729,835 |
Sales Load. FDC may receive a front-end sales charge of up to 5.75% for selling Class A shares and 3.50% for selling Class T shares, some of which is paid to financial intermediaries for selling shares of the Fund. Depending on the holding period, FDC may receive contingent deferred sales charges levied on Class A, Class T, Class B, and Class C redemptions. The deferred sales charges range from 5.00% to 1.00% for Class B shares, 1.00% for Class C shares, 1.00% for certain purchases of Class A shares and .25% for certain purchases of Class T shares.
For the period, sales charge amounts retained by FDC were as follows:
| | Retained
by FDC |
| Class A | $881,974 |
| Class T | 53,596 |
| Class B(a) | 528 |
| Class C(a) | 175,492 |
| | $1,111,590 |
(a) When Class B and Class C shares are initially sold, FDC pays commissions from its own resources to financial intermediaries through which the sales are made.
Transfer Agent Fees. Fidelity Investments Institutional Operations Company, Inc., (FIIOC), an affiliate of the investment adviser, is the transfer, dividend disbursing and shareholder servicing agent for each class of the Fund. FIIOC receives account fees and asset-based fees that vary according to the account size and type of account of the shareholders of the respective classes of the Fund. FIIOC pays for typesetting, printing and mailing of shareholder reports, except proxy statements.
For the period, transfer agent fees for each class were as follows:
| | Amount | % of
Class-Level Average
Net Assets(a) |
| Class A | $1,380,953 | .20 |
| Class T | 218,765 | .26 |
| Class B | 7,327 | .24 |
| Class C | 841,596 | .20 |
| Class I | 1,121,979 | .19 |
| | $3,570,620 | |
(a) Annualized
Accounting and Security Lending Fees. Fidelity Service Company, Inc. (FSC), an affiliate of the investment adviser, maintains the Fund's accounting records. The accounting fee is based on the level of average net assets for each month. Under a separate contract, FSC administers the security lending program. The security lending fee is based on the number and duration of lending transactions.
Brokerage Commissions. The Fund placed a portion of its portfolio transactions with brokerage firms which are affiliates of the investment adviser. Brokerage commissions are included in net realized gain (loss) and change in net unrealized appreciation (depreciation) in the Statement of Operations. The commissions paid to these affiliated firms were $35,955 for the period.
Interfund Lending Program. Pursuant to an Exemptive Order issued by the SEC, the Fund, along with other registered investment companies having management contracts with FMR or other affiliated entities of FMR, may participate in an interfund lending program. This program provides an alternative credit facility allowing the funds to borrow from, or lend money to, other participating affiliated funds. At period end, there were no interfund loans outstanding. The Fund's activity in this program during the period for which loans were outstanding was as follows:
| Borrower or Lender | Average Loan Balance | Weighted Average Interest Rate | Interest Expense |
| Borrower | $6,694,333 | .48% | $1,875 |
Interfund Trades. The Fundmay purchase from or sell securities to other Fidelity Funds under procedures adopted by the Board. The procedures have been designed to ensure these interfund trades are executed in accordance with Rule 17a-7 of the 1940 Act. Interfund trades are included within the respective purchases and sales amounts shown in the Purchases and Sales of Investments note.
6. Committed Line of Credit.
The Fund participates with other funds managed by the investment adviser or an affiliate in a $4.25 billion credit facility (the "line of credit") to be utilized for temporary or emergency purposes to fund shareholder redemptions or for other short-term liquidity purposes. The Fund has agreed to pay commitment fees on its pro-rata portion of the line of credit, which amounted to $2,493 and is reflected in Miscellaneous expenses on the Statement of Operations. During the period, the Fund did not borrow on this line of credit.
7. Security Lending.
The Fund lends portfolio securities through a lending agent from time to time in order to earn additional income. On the settlement date of the loan, the Fund receives collateral (in the form of U.S. Treasury obligations, letters of credit and/or cash) against the loaned securities and maintains collateral in an amount not less than 100% of the market value of the loaned securities during the period of the loan. The market value of the loaned securities is determined at the close of business of the Fund and any additional required collateral is delivered to the Fund on the next business day. The Fund or borrower may terminate the loan at any time, and if the borrower defaults on its obligation to return the securities loaned because of insolvency or other reasons, the Fund may apply collateral received from the borrower against the obligation. The Fund may experience delays and costs in recovering the securities loaned. Any cash collateral received is invested in the Fidelity Securities Lending Cash Central Fund. The value of loaned securities and cash collateral at period end are disclosed on the Fund's Statement of Assets and Liabilities. Security lending income represents the income earned on investing cash collateral, less rebates paid to borrowers and any lending agent fees associated with the loan, plus any premium payments received for lending certain types of securities. Security lending income is presented in the Statement of Operations as a component of income from Fidelity Central Funds.
8. Bank Borrowings.
The Fund is permitted to have bank borrowings for temporary or emergency purposes to fund shareholder redemptions or for other short-term liquidity requirements. The Fund has established borrowing arrangements with certain banks. The interest rate on the borrowings is the bank's base rate, as revised from time to time. The average loan balance during the period for which loans were outstanding amounted to $18,734,636. The weighted average interest rate was .87%. The interest expense amounted to $4,963 under the bank borrowing program. At period end, there were no bank borrowings outstanding.
9. Expense Reductions.
Commissions paid to certain brokers with whom the investment adviser, or its affiliates, places trades on behalf of the Fund include an amount in addition to trade execution, which may be rebated back to the Fund to offset certain expenses. This amount totaled $2,097 for the period.
In addition, during the period the investment advisor reimbursed and/or waived a portion of fund-level operating expenses in the amount of $13,262.
10. Distributions to Shareholders.
Distributions to shareholders of each class were as follows:
| | Six months ended January 31, 2016 | Year ended July 31, 2015 |
| From net investment income | | |
| Class I | $– | $69,565 |
| Total | $– | $69,565 |
| From net realized gain | | |
| Class A | $71,428,585 | $19,162,759 |
| Class T | 8,780,705 | 3,137,062 |
| Class B | 350,358 | 191,809 |
| Class C | 46,525,418 | 13,249,824 |
| Class I | 62,237,298 | 15,620,780 |
| Total | $189,322,364 | $51,362,234 |
11. Share Transactions.
Share transactions for each class were as follows and may contain automatic conversions between classes or exchanges between affiliated funds:
| | Shares | Shares | Dollars | Dollars |
| | Six months ended January 31, 2016 | Year ended July 31, 2015 | Six months ended January 31, 2016 | Year ended July 31, 2015 |
| Class A | | | | |
| Shares sold | 13,519,468 | 28,734,829 | $352,870,183 | $782,311,246 |
| Reinvestment of distributions | 2,387,348 | 750,777 | 66,988,968 | 17,834,437 |
| Shares redeemed | (10,708,989) | (9,674,834) | (265,479,703) | (251,598,976) |
| Net increase (decrease) | 5,197,827 | 19,810,772 | $154,379,448 | $548,546,707 |
| Class T | | | | |
| Shares sold | 1,232,394 | 2,609,939 | $30,442,567 | $67,425,583 |
| Reinvestment of distributions | 319,200 | 134,415 | 8,560,935 | 3,058,643 |
| Shares redeemed | (1,111,590) | (1,158,298) | (26,768,785) | (29,041,801) |
| Net increase (decrease) | 440,004 | 1,586,056 | $12,234,717 | $41,442,425 |
| Class B | | | | |
| Shares sold | 15,603 | 83,752 | $361,193 | $1,983,767 |
| Reinvestment of distributions | 13,390 | 8,590 | 330,876 | 180,710 |
| Shares redeemed | (86,028) | (138,999) | (1,919,426) | (3,242,788) |
| Net increase (decrease) | (57,035) | (46,657) | $(1,227,357) | $(1,078,311) |
| Class C | | | | |
| Shares sold | 6,956,533 | 18,036,528 | $160,829,470 | $437,867,038 |
| Reinvestment of distributions | 1,618,899 | 528,140 | 40,003,000 | 11,164,448 |
| Shares redeemed | (5,390,758) | (4,090,881) | (117,485,878) | (97,122,016) |
| Net increase (decrease) | 3,184,674 | 14,473,787 | $83,346,592 | $351,909,470 |
| Class I | | | | |
| Shares sold | 12,159,049 | 29,622,523 | $329,675,010 | $833,349,459 |
| Reinvestment of distributions | 1,787,031 | 532,595 | 52,663,804 | 13,257,162 |
| Shares redeemed | (13,439,620) | (9,644,195) | (347,273,129) | (265,760,117) |
| Net increase (decrease) | 506,460 | 20,510,923 | $35,065,685 | $580,846,504 |
12. Other.
The Fund's organizational documents provide former and current trustees and officers with a limited indemnification against liabilities arising in connection with the performance of their duties to the Fund. In the normal course of business, the Fund may also enter into contracts that provide general indemnifications. The Fund's maximum exposure under these arrangements is unknown as this would be dependent on future claims that may be made against the Fund. The risk of material loss from such claims is considered remote.
Fidelity Advisor® Communications Equipment Fund
Investment Summary (Unaudited)
Top Ten Stocks as of January 31, 2016
| | % of fund's net assets | % of fund's net assets 6 months ago |
| Cisco Systems, Inc. | 18.8 | 16.9 |
| Qualcomm, Inc. | 17.0 | 19.2 |
| Nokia Corp. sponsored ADR | 8.1 | 3.9 |
| F5 Networks, Inc. | 6.1 | 6.9 |
| CommScope Holding Co., Inc. | 4.9 | 4.8 |
| Harris Corp. | 4.9 | 4.6 |
| Telefonaktiebolaget LM Ericsson (B Shares) sponsored ADR | 4.9 | 4.4 |
| Juniper Networks, Inc. | 4.5 | 5.0 |
| Brocade Communications Systems, Inc. | 4.2 | 3.4 |
| Ruckus Wireless, Inc. | 2.0 | 2.4 |
| | 75.4 | |
Top Industries (% of fund's net assets)
| As of January 31, 2016 |
| | Communications Equipment | 90.0% |
| | Technology Hardware, Storage & Peripherals | 3.0% |
| | Semiconductors & Semiconductor Equipment | 2.1% |
| | Electronic Equipment & Components | 1.8% |
| | Internet Software & Services | 1.6% |
| | All Others* | 1.5% |

| As of July 31, 2015 |
| | Communications Equipment | 92.2% |
| | Technology Hardware, Storage & Peripherals | 2.8% |
| | Semiconductors & Semiconductor Equipment | 1.6% |
| | Internet Software & Services | 1.3% |
| | Electronic Equipment & Components | 1.0% |
| | All Others* | 1.1% |

* Includes Short-Term investments and Net Other Assets (Liabilities).
Fidelity Advisor® Communications Equipment Fund
Investments January 31, 2016 (Unaudited)
Showing Percentage of Net Assets
| Common Stocks - 99.2% | | | |
| | | Shares | Value |
| Communications Equipment - 90.0% | | | |
| Communications Equipment - 90.0% | | | |
| ADTRAN, Inc. | | 6,000 | $108,960 |
| Arris International PLC (a) | | 7,097 | 180,761 |
| AudioCodes Ltd. (a) | | 4,900 | 21,168 |
| Black Box Corp. | | 2,300 | 17,526 |
| Brocade Communications Systems, Inc. | | 54,500 | 434,910 |
| Calix Networks, Inc. (a) | | 1,700 | 13,056 |
| Ciena Corp. (a) | | 600 | 10,662 |
| Cisco Systems, Inc. | | 81,524 | 1,939,456 |
| CommScope Holding Co., Inc. (a) | | 22,720 | 509,382 |
| EchoStar Holding Corp. Class A (a) | | 650 | 22,835 |
| F5 Networks, Inc. (a) | | 6,735 | 631,608 |
| Finisar Corp. (a) | | 11,600 | 147,320 |
| Harris Corp. | | 5,820 | 506,165 |
| Infinera Corp. (a) | | 3,517 | 53,880 |
| InterDigital, Inc. | | 2,700 | 121,608 |
| Ixia (a) | | 6,190 | 59,238 |
| Juniper Networks, Inc. | | 19,558 | 461,569 |
| Lumentum Holdings, Inc. (a) | | 2,560 | 50,509 |
| Mitel Networks Corp. (a) | | 3,710 | 27,009 |
| Motorola Solutions, Inc. | | 2,209 | 147,495 |
| NETGEAR, Inc. (a) | | 500 | 18,685 |
| Nokia Corp. sponsored ADR | | 115,921 | 834,631 |
| Plantronics, Inc. | | 2,310 | 103,557 |
| Polycom, Inc. (a) | | 5,119 | 52,163 |
| Qualcomm, Inc. | | 38,661 | 1,752,890 |
| Radware Ltd. (a) | | 14,600 | 195,056 |
| Ruckus Wireless, Inc. (a) | | 24,120 | 202,849 |
| Sandvine Corp. (U.K.) | | 5,100 | 12,669 |
| Sierra Wireless, Inc. (a) | | 400 | 5,976 |
| Sonus Networks, Inc. (a) | | 7,150 | 42,900 |
| Telefonaktiebolaget LM Ericsson (B Shares) sponsored ADR (b) | | 56,330 | 501,337 |
| Viavi Solutions, Inc. (a) | | 12,800 | 64,000 |
| Wi-Lan, Inc. (b) | | 30,000 | 32,979 |
| | | | 9,284,809 |
| Diversified Telecommunication Services - 0.2% | | | |
| Alternative Carriers - 0.2% | | | |
| Vonage Holdings Corp. (a) | | 4,390 | 22,521 |
| Electronic Equipment & Components - 1.8% | | | |
| Electronic Components - 0.3% | | | |
| II-VI, Inc. (a) | | 1,360 | 28,288 |
| Electronic Equipment & Instruments - 0.6% | | | |
| Keysight Technologies, Inc. (a) | | 2,500 | 58,500 |
| Electronic Manufacturing Services - 0.9% | | | |
| TE Connectivity Ltd. | | 1,700 | 97,172 |
|
| TOTAL ELECTRONIC EQUIPMENT & COMPONENTS | | | 183,960 |
|
| Internet Software & Services - 1.6% | | | |
| Internet Software & Services - 1.6% | | | |
| Alphabet, Inc.: | | | |
| Class A | | 49 | 37,306 |
| Class C | | 78 | 57,950 |
| Rackspace Hosting, Inc. (a) | | 800 | 16,168 |
| Web.com Group, Inc. (a) | | 2,700 | 50,841 |
| | | | 162,265 |
| Semiconductors & Semiconductor Equipment - 2.1% | | | |
| Semiconductors - 2.1% | | | |
| Broadcom Corp. Class A | | 400 | 21,868 |
| GSI Technology, Inc. (a) | | 4,700 | 16,215 |
| Marvell Technology Group Ltd. | | 6,800 | 60,180 |
| Maxim Integrated Products, Inc. | | 1,100 | 36,740 |
| Qorvo, Inc. (a) | | 1,550 | 61,380 |
| Semtech Corp. (a) | | 1,200 | 24,120 |
| | | | 220,503 |
| Software - 0.5% | | | |
| Application Software - 0.1% | | | |
| Xura, Inc. (a) | | 370 | 7,940 |
| Systems Software - 0.4% | | | |
| Oracle Corp. | | 1,270 | 46,114 |
|
| TOTAL SOFTWARE | | | 54,054 |
|
| Technology Hardware, Storage & Peripherals - 3.0% | | | |
| Technology Hardware, Storage & Peripherals - 3.0% | | | |
| BlackBerry Ltd. (a) | | 20,300 | 144,762 |
| EMC Corp. | | 2,000 | 49,540 |
| Hewlett Packard Enterprise Co. | | 1,000 | 13,760 |
| HP, Inc. | | 4,600 | 44,666 |
| QLogic Corp. (a) | | 500 | 6,410 |
| Samsung Electronics Co. Ltd. | | 53 | 50,884 |
| | | | 310,022 |
| TOTAL COMMON STOCKS | | | |
| (Cost $10,646,394) | | | 10,238,134 |
|
| Money Market Funds - 3.1% | | | |
| Fidelity Cash Central Fund, 0.38% (c) | | 67,370 | 67,370 |
| Fidelity Securities Lending Cash Central Fund, 0.42% (c)(d) | | 252,900 | 252,900 |
| TOTAL MONEY MARKET FUNDS | | | |
| (Cost $320,270) | | | 320,270 |
| TOTAL INVESTMENT PORTFOLIO - 102.3% | | | |
| (Cost $10,966,664) | | | 10,558,404 |
| NET OTHER ASSETS (LIABILITIES) - (2.3)% | | | (236,787) |
| NET ASSETS - 100% | | | $10,321,617 |
Legend
(a) Non-income producing
(b) Security or a portion of the security is on loan at period end.
(c) Affiliated fund that is generally available only to investment companies and other accounts managed by Fidelity Investments. The rate quoted is the annualized seven-day yield of the fund at period end. A complete unaudited listing of the fund's holdings as of its most recent quarter end is available upon request. In addition, each Fidelity Central Fund's financial statements are available on the SEC's website or upon request.
(d) Investment made with cash collateral received from securities on loan.
Affiliated Central Funds
Information regarding fiscal year to date income earned by the Fund from investments in Fidelity Central Funds is as follows:
| Fund | Income earned |
| Fidelity Cash Central Fund | $78 |
| Fidelity Securities Lending Cash Central Fund | 713 |
| Total | $791 |
Investment Valuation
The following is a summary of the inputs used, as of January 31, 2016, involving the Fund's assets and liabilities carried at fair value. The inputs or methodology used for valuing securities may not be an indication of the risk associated with investing in those securities. For more information on valuation inputs, and their aggregation into the levels used below, please refer to the Investment Valuation section in the accompanying Notes to Financial Statements.
| | Valuation Inputs at Reporting Date: |
| Description | Total | Level 1 | Level 2 | Level 3 |
| Investments in Securities: | | | | |
| Common Stocks | $10,238,134 | $10,187,250 | $50,884 | $-- |
| Money Market Funds | 320,270 | 320,270 | -- | -- |
| Total Investments in Securities: | $10,558,404 | $10,507,520 | $50,884 | $-- |
Other Information
Distribution of investments by country or territory of incorporation, as a percentage of Total Net Assets, is as follows (Unaudited):
| United States of America | 79.0% |
| Finland | 8.1% |
| Sweden | 4.9% |
| Canada | 2.2% |
| Israel | 2.1% |
| United Kingdom | 1.7% |
| Others (Individually Less Than 1%) | 2.0% |
| | 100.0% |
See accompanying notes which are an integral part of the financial statements.
Fidelity Advisor® Communications Equipment Fund
Financial Statements
Statement of Assets and Liabilities
| | | January 31, 2016 (Unaudited) |
| Assets | | |
Investment in securities, at value (including securities loaned of $250,090) — See accompanying schedule:
Unaffiliated issuers (cost $10,646,394) | $10,238,134 | |
| Fidelity Central Funds (cost $320,270) | 320,270 | |
| Total Investments (cost $10,966,664) | | $10,558,404 |
| Receivable for investments sold | | 102,888 |
| Receivable for fund shares sold | | 991 |
| Dividends receivable | | 787 |
| Distributions receivable from Fidelity Central Funds | | 225 |
| Prepaid expenses | | 52 |
| Receivable from investment adviser for expense reductions | | 2,933 |
| Other receivables | | 21 |
| Total assets | | 10,666,301 |
| Liabilities | | |
| Payable for investments purchased | $45,289 | |
| Payable for fund shares redeemed | 9,195 | |
| Accrued management fee | 4,859 | |
| Distribution and service plan fees payable | 4,298 | |
| Other affiliated payables | 3,106 | |
| Other payables and accrued expenses | 25,037 | |
| Collateral on securities loaned, at value | 252,900 | |
| Total liabilities | | 344,684 |
| Net Assets | | $10,321,617 |
| Net Assets consist of: | | |
| Paid in capital | | $10,525,495 |
| Undistributed net investment income | | 3,587 |
| Accumulated undistributed net realized gain (loss) on investments and foreign currency transactions | | 200,819 |
| Net unrealized appreciation (depreciation) on investments and assets and liabilities in foreign currencies | | (408,284) |
| Net Assets | | $10,321,617 |
| Calculation of Maximum Offering Price | | |
| Class A: | | |
| Net Asset Value and redemption price per share ($3,866,941 ÷ 385,408 shares) | | $10.03 |
| Maximum offering price per share (100/94.25 of $10.03) | | $10.64 |
| Class T: | | |
| Net Asset Value and redemption price per share ($3,244,774 ÷ 335,093 shares) | | $9.68 |
| Maximum offering price per share (100/96.50 of $9.68) | | $10.03 |
| Class B: | | |
| Net Asset Value and offering price per share ($204,530 ÷ 22,848 shares)(a) | | $8.95 |
| Class C: | | |
| Net Asset Value and offering price per share ($2,214,885 ÷ 247,540 shares)(a) | | $8.95 |
| Class I: | | |
| Net Asset Value, offering price and redemption price per share ($790,487 ÷ 76,023 shares) | | $10.40 |
(a) Redemption price per share is equal to net asset value less any applicable contingent deferred sales charge.
See accompanying notes which are an integral part of the financial statements.
Statement of Operations
| | | Six months ended January 31, 2016 (Unaudited) |
| Investment Income | | |
| Dividends | | $98,134 |
| Income from Fidelity Central Funds | | 791 |
| Total income | | 98,925 |
| Expenses | | |
| Management fee | $31,963 | |
| Transfer agent fees | 18,467 | |
| Distribution and service plan fees | 28,425 | |
| Accounting and security lending fees | 2,308 | |
| Custodian fees and expenses | 1,314 | |
| Independent trustees' compensation | 110 | |
| Registration fees | 48,235 | |
| Audit | 22,604 | |
| Legal | 302 | |
| Miscellaneous | 172 | |
| Total expenses before reductions | 153,900 | |
| Expense reductions | (58,562) | 95,338 |
| Net investment income (loss) | | 3,587 |
| Realized and Unrealized Gain (Loss) | | |
| Net realized gain (loss) on: | | |
| Investment securities: | | |
| Unaffiliated issuers | 355,512 | |
| Foreign currency transactions | 372 | |
| Total net realized gain (loss) | | 355,884 |
Change in net unrealized appreciation (depreciation) on:
Investment securities | (2,616,110) | |
| Assets and liabilities in foreign currencies | (23) | |
| Total change in net unrealized appreciation (depreciation) | | (2,616,133) |
| Net gain (loss) | | (2,260,249) |
| Net increase (decrease) in net assets resulting from operations | | $(2,256,662) |
See accompanying notes which are an integral part of the financial statements.
Statement of Changes in Net Assets
| | Six months ended January 31, 2016 (Unaudited) | Year ended July 31, 2015 |
| Increase (Decrease) in Net Assets | | |
| Operations | | |
| Net investment income (loss) | $3,587 | $(6,053) |
| Net realized gain (loss) | 355,884 | 967,469 |
| Change in net unrealized appreciation (depreciation) | (2,616,133) | (133,970) |
| Net increase (decrease) in net assets resulting from operations | (2,256,662) | 827,446 |
| Distributions to shareholders from net investment income | – | (25,322) |
| Distributions to shareholders from net realized gain | (387,325) | – |
| Share transactions - net increase (decrease) | (147,369) | (2,143,838) |
| Redemption fees | 46 | 500 |
| Total increase (decrease) in net assets | (2,791,310) | (1,341,214) |
| Net Assets | | |
| Beginning of period | 13,112,927 | 14,454,141 |
| End of period (including undistributed net investment income of $3,587 and $0, respectively) | $10,321,617 | $13,112,927 |
See accompanying notes which are an integral part of the financial statements.
Financial Highlights — Fidelity Advisor Communications Equipment Fund Class A
| | Six months ended (Unaudited) | Years ended July 31, | | | | |
| January 31, | 2016 | 2015 | 2014 | 2013 | 2012 | 2011 |
| Selected Per–Share Data | | | | | | |
| Net asset value, beginning of period | $12.57 | $11.94 | $10.22 | $7.71 | $9.73 | $8.67 |
| Income from Investment Operations | | | | | | |
| Net investment income (loss)A | .02 | .02 | .04B | .02 | (.01) | (.06) |
| Net realized and unrealized gain (loss) | (2.19) | .64 | 1.68 | 2.50 | (1.81) | 1.12 |
| Total from investment operations | (2.17) | .66 | 1.72 | 2.52 | (1.82) | 1.06 |
| Distributions from net investment income | – | (.03) | – | (.01) | – | – |
| Distributions from net realized gain | (.37) | – | – | – | (.20) | – |
| Total distributions | (.37) | (.03) | – | (.01) | (.20) | – |
| Redemption fees added to paid in capitalA,C | – | – | – | – | – | – |
| Net asset value, end of period | $10.03 | $12.57 | $11.94 | $10.22 | $7.71 | $9.73 |
| Total ReturnD,E,F | (17.48)% | 5.54% | 16.83% | 32.65% | (18.88)% | 12.23% |
| Ratios to Average Net AssetsG,H | | | | | | |
| Expenses before reductions | 2.40%I | 1.90% | 1.96% | 2.22% | 1.96% | 1.64% |
| Expenses net of fee waivers, if any | 1.40%I | 1.40% | 1.40% | 1.40% | 1.40% | 1.40% |
| Expenses net of all reductions | 1.40%I | 1.39% | 1.39% | 1.37% | 1.39% | 1.39% |
| Net investment income (loss) | .30%I | .16% | .40%B | .18% | (.16)% | (.60)% |
| Supplemental Data | | | | | | |
| Net assets, end of period (000 omitted) | $3,867 | $4,806 | $4,725 | $3,962 | $3,568 | $8,787 |
| Portfolio turnover rateJ | 26%I | 60% | 160% | 33% | 79% | 101% |
A Calculated based on average shares outstanding during the period.
B Net Investment income per share reflects a large, non-recurring dividend which amounted to $.03 per share. Excluding this non-recurring dividend, the ratio of net investment income (loss) to average net assets would have been .14%.
C Amount represents less than $.005 per share.
D Total returns for periods of less than one year are not annualized.
E Total returns would have been lower if certain expenses had not been reduced during the applicable periods shown.
F Total returns do not include the effect of the sales charges.
G Fees and expenses of any underlying Fidelity Central Funds are not included in the Fund's expense ratio. The Fund indirectly bears its proportionate share of the expenses of any underlying Fidelity Central Funds.
H Expense ratios reflect operating expenses of the class. Expenses before reductions do not reflect amounts reimbursed by the investment adviser or reductions from brokerage service arrangements or reductions from other expense offset arrangements and do not represent the amount paid by the class during periods when reimbursements or reductions occur. Expenses net of fee waivers reflect expenses after reimbursement by the investment adviser but prior to reductions from brokerage service arrangements or other expense offset arrangements. Expenses net of all reductions represent the net expenses paid by the class.
I Annualized
J Amount does not include the portfolio activity of any underlying Fidelity Central Funds.
See accompanying notes which are an integral part of the financial statements.
Financial Highlights — Fidelity Advisor Communications Equipment Fund Class T
| | Six months ended (Unaudited) | Years ended July 31, | | | | |
| January 31, | 2016 | 2015 | 2014 | 2013 | 2012 | 2011 |
| Selected Per–Share Data | | | | | | |
| Net asset value, beginning of period | $12.15 | $11.55 | $9.91 | $7.49 | $9.48 | $8.46 |
| Income from Investment Operations | | | | | | |
| Net investment income (loss)A | –B | (.01) | .02C | (.01) | (.03) | (.09) |
| Net realized and unrealized gain (loss) | (2.11) | .62 | 1.62 | 2.43 | (1.76) | 1.11 |
| Total from investment operations | (2.11) | .61 | 1.64 | 2.42 | (1.79) | 1.02 |
| Distributions from net investment income | – | (.01) | – | – | – | – |
| Distributions from net realized gain | (.36) | – | – | – | (.20) | – |
| Total distributions | (.36) | (.01) | – | – | (.20) | – |
| Redemption fees added to paid in capitalA,B | – | – | – | – | – | – |
| Net asset value, end of period | $9.68 | $12.15 | $11.55 | $9.91 | $7.49 | $9.48 |
| Total ReturnD,E,F | (17.60)% | 5.24% | 16.55% | 32.31% | (19.06)% | 12.06% |
| Ratios to Average Net AssetsG,H | | | | | | |
| Expenses before reductions | 2.69%I | 2.19% | 2.25% | 2.52% | 2.27% | 1.97% |
| Expenses net of fee waivers, if any | 1.65%I | 1.65% | 1.65% | 1.65% | 1.65% | 1.65% |
| Expenses net of all reductions | 1.64%I | 1.64% | 1.64% | 1.62% | 1.64% | 1.64% |
| Net investment income (loss) | .05%I | (.09)% | .14%C | (.07)% | (.41)% | (.85)% |
| Supplemental Data | | | | | | |
| Net assets, end of period (000 omitted) | $3,245 | $4,029 | $3,995 | $3,342 | $2,843 | $4,607 |
| Portfolio turnover rateJ | 26%I | 60% | 160% | 33% | 79% | 101% |
A Calculated based on average shares outstanding during the period.
B Amount represents less than $.005 per share.
C Net Investment income per share reflects a large, non-recurring dividend which amounted to $.03 per share. Excluding this non-recurring dividend, the ratio of net investment income (loss) to average net assets would have been (.11) %.
D Total returns for periods of less than one year are not annualized.
E Total returns would have been lower if certain expenses had not been reduced during the applicable periods shown.
F Total returns do not include the effect of the sales charges.
G Fees and expenses of any underlying Fidelity Central Funds are not included in the Fund's expense ratio. The Fund indirectly bears its proportionate share of the expenses of any underlying Fidelity Central Funds.
H Expense ratios reflect operating expenses of the class. Expenses before reductions do not reflect amounts reimbursed by the investment adviser or reductions from brokerage service arrangements or reductions from other expense offset arrangements and do not represent the amount paid by the class during periods when reimbursements or reductions occur. Expenses net of fee waivers reflect expenses after reimbursement by the investment adviser but prior to reductions from brokerage service arrangements or other expense offset arrangements. Expenses net of all reductions represent the net expenses paid by the class.
I Annualized
J Amount does not include the portfolio activity of any underlying Fidelity Central Funds.
See accompanying notes which are an integral part of the financial statements.
Financial Highlights — Fidelity Advisor Communications Equipment Fund Class B
| | Six months ended (Unaudited) | Years ended July 31, | | | | |
| January 31, | 2016 | 2015 | 2014 | 2013 | 2012 | 2011 |
| Selected Per–Share Data | | | | | | |
| Net asset value, beginning of period | $11.28 | $10.77 | $9.28 | $7.05 | $8.99 | $8.06 |
| Income from Investment Operations | | | | | | |
| Net investment income (loss)A | (.02) | (.07) | (.04)B | (.05) | (.07) | (.13) |
| Net realized and unrealized gain (loss) | (1.96) | .58 | 1.53 | 2.28 | (1.67) | 1.06 |
| Total from investment operations | (1.98) | .51 | 1.49 | 2.23 | (1.74) | .93 |
| Distributions from net realized gain | (.35) | – | – | – | (.20) | – |
| Total distributions | (.35) | – | – | – | (.20) | – |
| Redemption fees added to paid in capitalA,C | – | – | – | – | – | – |
| Net asset value, end of period | $8.95 | $11.28 | $10.77 | $9.28 | $7.05 | $8.99 |
| Total ReturnD,E,F | (17.82)% | 4.74% | 16.06% | 31.63% | (19.56)% | 11.54% |
| Ratios to Average Net AssetsG,H | | | | | | |
| Expenses before reductions | 3.15%I | 2.68% | 2.74% | 3.00% | 2.71% | 2.47% |
| Expenses net of fee waivers, if any | 2.15%I | 2.15% | 2.15% | 2.15% | 2.15% | 2.15% |
| Expenses net of all reductions | 2.15%I | 2.14% | 2.14% | 2.13% | 2.13% | 2.14% |
| Net investment income (loss) | (.45)%I | (.60)% | (.36)%B | (.57)% | (.91)% | (1.35)% |
| Supplemental Data | | | | | | |
| Net assets, end of period (000 omitted) | $205 | $288 | $399 | $480 | $570 | $1,316 |
| Portfolio turnover rateJ | 26%I | 60% | 160% | 33% | 79% | 101% |
A Calculated based on average shares outstanding during the period.
B Net Investment income per share reflects a large, non-recurring dividend which amounted to $.03 per share. Excluding this non-recurring dividend, the ratio of net investment income (loss) to average net assets would have been (.61) %.
C Amount represents less than $.005 per share.
D Total returns for periods of less than one year are not annualized.
E Total returns would have been lower if certain expenses had not been reduced during the applicable periods shown.
F Total returns do not include the effect of the contingent deferred sales charge.
G Fees and expenses of any underlying Fidelity Central Funds are not included in the Fund's expense ratio. The Fund indirectly bears its proportionate share of the expenses of any underlying Fidelity Central Funds.
H Expense ratios reflect operating expenses of the class. Expenses before reductions do not reflect amounts reimbursed by the investment adviser or reductions from brokerage service arrangements or reductions from other expense offset arrangements and do not represent the amount paid by the class during periods when reimbursements or reductions occur. Expenses net of fee waivers reflect expenses after reimbursement by the investment adviser but prior to reductions from brokerage service arrangements or other expense offset arrangements. Expenses net of all reductions represent the net expenses paid by the class.
I Annualized
J Amount does not include the portfolio activity of any underlying Fidelity Central Funds.
See accompanying notes which are an integral part of the financial statements.
Financial Highlights — Fidelity Advisor Communications Equipment Fund Class C
| | Six months ended (Unaudited) | Years ended July 31, | | | | |
| January 31, | 2016 | 2015 | 2014 | 2013 | 2012 | 2011 |
| Selected Per–Share Data | | | | | | |
| Net asset value, beginning of period | $11.27 | $10.76 | $9.28 | $7.05 | $8.98 | $8.06 |
| Income from Investment Operations | | | | | | |
| Net investment income (loss)A | (.02) | (.07) | (.04)B | (.05) | (.07) | (.13) |
| Net realized and unrealized gain (loss) | (1.95) | .58 | 1.52 | 2.28 | (1.66) | 1.05 |
| Total from investment operations | (1.97) | .51 | 1.48 | 2.23 | (1.73) | .92 |
| Distributions from net realized gain | (.35) | – | – | – | (.20) | – |
| Total distributions | (.35) | – | – | – | (.20) | – |
| Redemption fees added to paid in capitalA,C | – | – | – | – | – | – |
| Net asset value, end of period | $8.95 | $11.27 | $10.76 | $9.28 | $7.05 | $8.98 |
| Total ReturnD,E,F | (17.74)% | 4.74% | 15.95% | 31.63% | (19.47)% | 11.41% |
| Ratios to Average Net AssetsG,H | | | | | | |
| Expenses before reductions | 3.15%I | 2.65% | 2.73% | 2.98% | 2.71% | 2.40% |
| Expenses net of fee waivers, if any | 2.15%I | 2.15% | 2.15% | 2.15% | 2.15% | 2.15% |
| Expenses net of all reductions | 2.15%I | 2.14% | 2.14% | 2.12% | 2.14% | 2.14% |
| Net investment income (loss) | (.45)%I | (.59)% | (.35)%B | (.57)% | (.91)% | (1.35)% |
| Supplemental Data | | | | | | |
| Net assets, end of period (000 omitted) | $2,215 | $2,966 | $2,744 | $2,334 | $2,142 | $5,866 |
| Portfolio turnover rateJ | 26%I | 60% | 160% | 33% | 79% | 101% |
A Calculated based on average shares outstanding during the period.
B Net Investment income per share reflects a large, non-recurring dividend which amounted to $.03 per share. Excluding this non-recurring dividend, the ratio of net investment income (loss) to average net assets would have been (.61) %.
C Amount represents less than $.005 per share.
D Total returns for periods of less than one year are not annualized.
E Total returns would have been lower if certain expenses had not been reduced during the applicable periods shown.
F Total returns do not include the effect of the contingent deferred sales charge.
G Fees and expenses of any underlying Fidelity Central Funds are not included in the Fund's expense ratio. The Fund indirectly bears its proportionate share of the expenses of any underlying Fidelity Central Funds.
H Expense ratios reflect operating expenses of the class. Expenses before reductions do not reflect amounts reimbursed by the investment adviser or reductions from brokerage service arrangements or reductions from other expense offset arrangements and do not represent the amount paid by the class during periods when reimbursements or reductions occur. Expenses net of fee waivers reflect expenses after reimbursement by the investment adviser but prior to reductions from brokerage service arrangements or other expense offset arrangements. Expenses net of all reductions represent the net expenses paid by the class.
I Annualized
J Amount does not include the portfolio activity of any underlying Fidelity Central Funds.
See accompanying notes which are an integral part of the financial statements.
Financial Highlights — Fidelity Advisor Communications Equipment Fund Class I
| | Six months ended (Unaudited) | Years ended July 31, | | | | |
| January 31, | 2016 | 2015 | 2014 | 2013 | 2012 | 2011 |
| Selected Per–Share Data | | | | | | |
| Net asset value, beginning of period | $13.01 | $12.35 | $10.55 | $7.95 | $10.00 | $8.88 |
| Income from Investment Operations | | | | | | |
| Net investment income (loss)A | .03 | .05 | .08B | .04 | .01 | (.04) |
| Net realized and unrealized gain (loss) | (2.25) | .67 | 1.72 | 2.58 | (1.86) | 1.16 |
| Total from investment operations | (2.22) | .72 | 1.80 | 2.62 | (1.85) | 1.12 |
| Distributions from net investment income | – | (.06) | – | (.02) | – | – |
| Distributions from net realized gain | (.39) | – | – | – | (.20) | – |
| Total distributions | (.39) | (.06) | – | (.02) | (.20) | – |
| Redemption fees added to paid in capitalA,C | – | – | – | – | – | – |
| Net asset value, end of period | $10.40 | $13.01 | $12.35 | $10.55 | $7.95 | $10.00 |
| Total ReturnD,E | (17.34)% | 5.83% | 17.06% | 32.92% | (18.66)% | 12.61% |
| Ratios to Average Net AssetsF,G | | | | | | |
| Expenses before reductions | 2.02%H | 1.57% | 1.45% | 1.93% | 1.66% | 1.22% |
| Expenses net of fee waivers, if any | 1.15%H | 1.15% | 1.15% | 1.15% | 1.15% | 1.15% |
| Expenses net of all reductions | 1.15%H | 1.14% | 1.14% | 1.12% | 1.13% | 1.14% |
| Net investment income (loss) | .55%H | .41% | .65%B | .43% | .10% | (.35)% |
| Supplemental Data | | | | | | |
| Net assets, end of period (000 omitted) | $790 | $1,024 | $2,592 | $855 | $721 | $2,855 |
| Portfolio turnover rateI | 26%H | 60% | 160% | 33% | 79% | 101% |
A Calculated based on average shares outstanding during the period.
B Net Investment income per share reflects a large, non-recurring dividend which amounted to $.03 per share. Excluding this non-recurring dividend, the ratio of net investment income (loss) to average net assets would have been .39%.
C Amount represents less than $.005 per share.
D Total returns for periods of less than one year are not annualized.
E Total returns would have been lower if certain expenses had not been reduced during the applicable periods shown.
F Fees and expenses of any underlying Fidelity Central Funds are not included in the Fund's expense ratio. The Fund indirectly bears its proportionate share of the expenses of any underlying Fidelity Central Funds.
G Expense ratios reflect operating expenses of the class. Expenses before reductions do not reflect amounts reimbursed by the investment adviser or reductions from brokerage service arrangements or reductions from other expense offset arrangements and do not represent the amount paid by the class during periods when reimbursements or reductions occur. Expenses net of fee waivers reflect expenses after reimbursement by the investment adviser but prior to reductions from brokerage service arrangements or other expense offset arrangements. Expenses net of all reductions represent the net expenses paid by the class.
H Annualized
I Amount does not include the portfolio activity of any underlying Fidelity Central Funds.
See accompanying notes which are an integral part of the financial statements.
Notes to Financial Statements (Unaudited)
For the period ended January 31, 2016
1. Organization.
Fidelity Advisor Communications Equipment Fund (the Fund) is a non-diversified fund of Fidelity Advisor Series VII (the Trust) and is authorized to issue an unlimited number of shares. The Trust is registered under the Investment Company Act of 1940, as amended (the 1940 Act), as an open-end management investment company organized as a Massachusetts business trust. The Fund offers Class A, Class T, Class C and Class I shares, each of which, along with Class B shares, has equal rights as to assets and voting privileges. Class B shares are closed to new accounts and additional purchases, except for exchanges and reinvestments. Each class has exclusive voting rights with respect to matters that affect that class. Class B shares will automatically convert to Class A shares after a holding period of seven years from the initial date of purchase.
During the period, the Board of Trustees approved the conversion of all existing Class B shares into Class A shares, effective on or about July 1, 2016, regardless of the length of times shares have been held.
2. Investments in Fidelity Central Funds.
The Fund invests in Fidelity Central Funds, which are open-end investment companies generally available only to other investment companies and accounts managed by the investment adviser and its affiliates. The Fund's Schedule of Investments lists each of the Fidelity Central Funds held as of period end, if any, as an investment of the Fund, but does not include the underlying holdings of each Fidelity Central Fund. As an Investing Fund, the Fund indirectly bears its proportionate share of the expenses of the underlying Fidelity Central Funds.
The Money Market Central Funds seek preservation of capital and current income and are managed by Fidelity Investments Money Management, Inc. (FIMM), an affiliate of the investment adviser. Annualized expenses of the Money Market Central Funds as of their most recent shareholder report date are less than .005%.
A complete unaudited list of holdings for each Fidelity Central Fund is available upon request or at the Securities and Exchange Commission (the SEC) website at www.sec.gov. In addition, the financial statements of the Fidelity Central Funds are available on the SEC website or upon request.
3. Significant Accounting Policies.
The financial statements have been prepared in conformity with accounting principles generally accepted in the United States of America (GAAP), which require management to make certain estimates and assumptions at the date of the financial statements. Actual results could differ from those estimates. Subsequent events, if any, through the date that the financial statements were issued have been evaluated in the preparation of the financial statements. The following summarizes the significant accounting policies of the Fund:
Investment Valuation. Investments are valued as of 4:00 p.m. Eastern time on the last calendar day of the period. The Board of Trustees (the Board) has delegated the day to day responsibility for the valuation of the Fund's investments to the Fidelity SelectCo, LLC (SelectCo) Fair Value Committee (the Committee). In accordance with valuation policies and procedures approved by the Board, the Fund attempts to obtain prices from one or more third party pricing vendors or brokers to value its investments. When current market prices, quotations or currency exchange rates are not readily available or reliable, investments will be fair valued in good faith by the Committee, in accordance with procedures adopted by the Board. Factors used in determining fair value vary by investment type and may include market or investment specific events. The frequency with which these procedures are used cannot be predicted and they may be utilized to a significant extent. The Committee oversees the Fund's valuation policies and procedures and reports to the Board on the Committee's activities and fair value determinations. The Board monitors the appropriateness of the procedures used in valuing the Fund's investments and ratifies the fair value determinations of the Committee.
The Fund categorizes the inputs to valuation techniques used to value its investments into a disclosure hierarchy consisting of three levels as shown below:
- Level 1 – quoted prices in active markets for identical investments
- Level 2 – other significant observable inputs (including quoted prices for similar investments, interest rates, prepayment speeds, etc.)
- Level 3 – unobservable inputs (including the Fund's own assumptions based on the best information available)
Valuation techniques used to value the Fund's investments by major category are as follows:
Equity securities, including restricted securities, for which market quotations are readily available, are valued at the last reported sale price or official closing price as reported by a third party pricing vendor on the primary market or exchange on which they are traded and are categorized as Level 1 in the hierarchy. In the event there were no sales during the day or closing prices are not available, securities are valued at the last quoted bid price or may be valued using the last available price and are generally categorized as Level 2 in the hierarchy. For foreign equity securities, when market or security specific events arise, comparisons to the valuation of American Depositary Receipts (ADRs), futures contracts, Exchange-Traded Funds (ETFs) and certain indexes as well as quoted prices for similar securities may be used and would be categorized as Level 2 in the hierarchy. Utilizing these techniques may result in transfers between Level 1 and Level 2. For equity securities, including restricted securities, where observable inputs are limited, assumptions about market activity and risk are used and these securities may be categorized as Level 3 in the hierarchy.
Investments in open-end mutual funds, including the Fidelity Central Funds, are valued at their closing net asset value (NAV) each business day and are categorized as Level 1 in the hierarchy.
Changes in valuation techniques may result in transfers in or out of an assigned level within the disclosure hierarchy. The aggregate value of investments by input level as of January 31, 2016 is included at the end of the Fund's Schedule of Investments.
Foreign Currency. The Fund may use foreign currency contracts to facilitate transactions in foreign-denominated securities. Gains and losses from these transactions may arise from changes in the value of the foreign currency or if the counterparties do not perform under the contracts' terms.
Foreign-denominated assets, including investment securities, and liabilities are translated into U.S. dollars at the exchange rates at period end. Purchases and sales of investment securities, income and dividends received and expenses denominated in foreign currencies are translated into U.S. dollars at the exchange rate in effect on the transaction date.
The effects of exchange rate fluctuations on investments are included with the net realized and unrealized gain (loss) on investment securities. Other foreign currency transactions resulting in realized and unrealized gain (loss) are disclosed separately.
Investment Transactions and Income. For financial reporting purposes, the Fund's investment holdings and NAV include trades executed through the end of the last business day of the period. The NAV per share for processing shareholder transactions is calculated as of the close of business of the New York Stock Exchange (NYSE) regular trading hours on the NASDAQ exchange, normally 4:00 p.m. Eastern time and includes trades executed through the end of the prior business day. Gains and losses on securities sold are determined on the basis of identified cost and may include proceeds received from litigation. Dividend income is recorded on the ex-dividend date, except for certain dividends from foreign securities where the ex-dividend date may have passed, which are recorded as soon as the Fund is informed of the ex-dividend date. Non-cash dividends included in dividend income, if any, are recorded at the fair market value of the securities received. Income and capital gain distributions from Fidelity Central Funds, if any, are recorded on the ex-dividend date. Distributions received on securities that represent a return of capital or capital gain are recorded as a reduction of cost of investments and/or as a realized gain. Subsequent to ex-dividend date the Fund determines the components of these distributions, based upon receipt of tax filings or other correspondence relating to the underlying investment. Investment income is recorded net of foreign taxes withheld where recovery of such taxes is uncertain.
Class Allocations and Expenses. Investment income, realized and unrealized capital gains and losses, common expenses of the Fund, and certain fund-level expense reductions, if any, are allocated daily on a pro-rata basis to each class based on the relative net assets of each class to the total net assets of the Fund. Each class differs with respect to transfer agent and distribution and service plan fees incurred. Certain expense reductions may also differ by class. For the reporting period, the allocated portion of income and expenses to each class as a percent of its average net assets may vary due to the timing of recording these transactions in relation to fluctuating net assets of the classes. Expenses directly attributable to a fund are charged to that fund. Expenses attributable to more than one fund are allocated among the respective funds on the basis of relative net assets or other appropriate methods. Expense estimates are accrued in the period to which they relate and adjustments are made when actual amounts are known.
Income Tax Information and Distributions to Shareholders. Each year, the Fund intends to qualify as a regulated investment company under Subchapter M of the Internal Revenue Code, including distributing substantially all of its taxable income and realized gains. As a result, no provision for U.S. Federal income taxes is required. The Fund files a U.S. federal tax return, in addition to state and local tax returns as required. The Fund's federal income tax returns are subject to examination by the Internal Revenue Service (IRS) for a period of three fiscal years after they are filed. State and local tax returns may be subject to examination for an additional fiscal year depending on the jurisdiction. Foreign taxes are provided for based on the Fund's understanding of the tax rules and rates that exist in the foreign markets in which it invests.
Distributions are declared and recorded on the ex-dividend date. Income dividends and capital gain distributions are declared separately for each class. Income and capital gain distributions are determined in accordance with income tax regulations, which may differ from GAAP.
Capital accounts within the financial statements are adjusted for permanent book-tax differences. These adjustments have no impact on net assets or the results of operations. Capital accounts are not adjusted for temporary book-tax differences which will reverse in a subsequent period.
Book-tax differences are primarily due to foreign currency transactions, net operating losses, capital loss carryforwards and losses deferred due to wash sales.
The federal tax cost of investment securities and unrealized appreciation (depreciation) as of period end were as follows:
| Gross unrealized appreciation | $979,370 |
| Gross unrealized depreciation | (1,446,153) |
| Net unrealized appreciation (depreciation) on securities | $(466,783) |
| Tax cost | $11,025,187 |
Short-Term Trading (Redemption) Fees. Shares held by investors in the Fund less than 30 days may have been subject to a redemption fee equal to .75% of the NAV of shares redeemed. All redemption fees, which reduce the proceeds of the shareholder redemption, are retained by the Fund and accounted for as an addition to paid in capital.
4. Purchases and Sales of Investments.
Purchases and sales of securities, other than short-term securities, aggregated $1,543,342 and $2,173,925, respectively.
5. Fees and Other Transactions with Affiliates.
Management Fee. Fidelity SelectCo, LLC (the investment adviser) and its affiliates provide the Fund with investment management related services for which the Fund pays a monthly management fee. The management fee is the sum of an individual fund fee rate that is based on an annual rate of .30% of the Fund's average net assets and an annualized group fee rate that averaged .25% during the period. The group fee rate is based upon the average net assets of all the mutual funds advised by Fidelity Management & Research Company (FMR) and the investment adviser. The group fee rate decreases as assets under management increase and increases as assets under management decrease. For the reporting period, the total annualized management fee rate was .55% of the Fund's average net assets.
Distribution and Service Plan Fees. In accordance with Rule 12b-1 of the 1940 Act, the Fund has adopted separate Distribution and Service Plans for each class of shares. Certain classes pay Fidelity Distributors Corporation (FDC), an affiliate of the investment adviser, separate Distribution and Service Fees, each of which is based on an annual percentage of each class' average net assets. In addition, FDC may pay financial intermediaries for selling shares of the Fund and providing shareholder support services. For the period, the Distribution and Service Fee rates, total fees and amounts retained by FDC were as follows:
| | Distribution
Fee | Service
Fee | Total Fees | Retained
by FDC |
| Class A | -% | .25% | $5,394 | $– |
| Class T | .25% | .25% | 9,124 | – |
| Class B | .75% | .25% | 1,216 | 912 |
| Class C | .75% | .25% | 12,691 | 1,795 |
| | | | $28,425 | $2,707 |
Sales Load. FDC may receive a front-end sales charge of up to 5.75% for selling Class A shares and 3.50% for selling Class T shares, some of which is paid to financial intermediaries for selling shares of the Fund. Depending on the holding period, FDC may receive contingent deferred sales charges levied on Class A, Class T, Class B, and Class C redemptions. The deferred sales charges range from 5.00% to 1.00% for Class B shares, 1.00% for Class C shares, 1.00% for certain purchases of Class A shares and .25% for certain purchases of Class T shares.
For the period, sales charge amounts retained by FDC were as follows:
| | Retained
by FDC |
| Class A | $1,325 |
| Class T | 580 |
| Class B(a) | 25 |
| Class C(a) | 318 |
| | $2,248 |
(a) When Class B and Class C shares are initially sold, FDC pays commissions from its own resources to financial intermediaries through which the sales are made.
Transfer Agent Fees. Fidelity Investments Institutional Operations Company, Inc., (FIIOC), an affiliate of the investment adviser, is the transfer, dividend disbursing and shareholder servicing agent for each class of the Fund. FIIOC receives account fees and asset-based fees that vary according to the account size and type of account of the shareholders of the respective classes of the Fund. FIIOC pays for typesetting, printing and mailing of shareholder reports, except proxy statements.
For the period, transfer agent fees for each class were as follows:
| | Amount | % of
Class-Level Average
Net Assets(a) |
| Class A | $6,695 | .31 |
| Class T | 6,564 | .36 |
| Class B | 366 | .30 |
| Class C | 3,998 | .31 |
| Class I | 844 | .19 |
| | $ 18,467 | |
(a) Annualized
Accounting and Security Lending Fees. Fidelity Service Company, Inc. (FSC), an affiliate of the investment adviser, maintains the Fund's accounting records. The accounting fee is based on the level of average net assets for each month. Under a separate contract, FSC administers the security lending program. The security lending fee is based on the number and duration of lending transactions.
Brokerage Commissions. The Fund placed a portion of its portfolio transactions with brokerage firms which are affiliates of the investment adviser. Brokerage commissions are included in net realized gain (loss) and change in net unrealized appreciation (depreciation) in the Statement of Operations. The commissions paid to these affiliated firms were $111 for the period.
Interfund Trades. The Fundmay purchase from or sell securities to other Fidelity Funds under procedures adopted by the Board. The procedures have been designed to ensure these interfund trades are executed in accordance with Rule 17a-7 of the 1940 Act. Interfund trades are included within the respective purchases and sales amounts shown in the Purchases and Sales of Investments note.
6. Committed Line of Credit.
The Fund participates with other funds managed by the investment adviser or an affiliate in a $4.25 billion credit facility (the "line of credit") to be utilized for temporary or emergency purposes to fund shareholder redemptions or for other short-term liquidity purposes. The Fund has agreed to pay commitment fees on its pro-rata portion of the line of credit, which amounted to $8 and is reflected in Miscellaneous expenses on the Statement of Operations. During the period, the Fund did not borrow on this line of credit.
7. Security Lending.
The Fund lends portfolio securities through a lending agent from time to time in order to earn additional income. On the settlement date of the loan, the Fund receives collateral (in the form of U.S. Treasury obligations, letters of credit and/or cash) against the loaned securities and maintains collateral in an amount not less than 100% of the market value of the loaned securities during the period of the loan. The market value of the loaned securities is determined at the close of business of the Fund and any additional required collateral is delivered to the Fund on the next business day. The Fund or borrower may terminate the loan at any time, and if the borrower defaults on its obligation to return the securities loaned because of insolvency or other reasons, the Fund may apply collateral received from the borrower against the obligation. The Fund may experience delays and costs in recovering the securities loaned. Any cash collateral received is invested in the Fidelity Securities Lending Cash Central Fund. The value of loaned securities and cash collateral at period end are disclosed on the Fund's Statement of Assets and Liabilities. Security lending income represents the income earned on investing cash collateral, less rebates paid to borrowers and any lending agent fees associated with the loan, plus any premium payments received for lending certain types of securities. Security lending income is presented in the Statement of Operations as a component of income from Fidelity Central Funds. Total security lending income during the period amounted to $713.
8. Expense Reductions.
The investment adviser voluntarily agreed to reimburse each class to the extent annual operating expenses exceeded certain levels of average net assets as noted in the table below. Some expenses, for example interest expense, including commitment fees, are excluded from this reimbursement.
The following classes were in reimbursement during the period:
| | Expense
Limitations | Reimbursement |
| Class A | 1.40% | $21,450 |
| Class T | 1.65% | 19,100 |
| Class B | 2.15% | 1,214 |
| Class C | 2.15% | 12,621 |
| Class I | 1.15% | 3,913 |
| | | $58,298 |
Commissions paid to certain brokers with whom the investment adviser, or its affiliates, places trades on behalf of the Fund include an amount in addition to trade execution, which may be rebated back to the Fund to offset certain expenses. This amount totaled $223 for the period.
In addition, during the period the investment advisor reimbursed and/or waived a portion of fund-level operating expenses in the amount of $41.
9. Distributions to Shareholders.
Distributions to shareholders of each class were as follows:
| | Six months ended January 31, 2016 | Year ended July 31, 2015 |
| From net investment income | | |
| Class A | $– | $11,846 |
| Class T | – | 1,754 |
| Class I | – | 11,722 |
| Total | $– | $25,322 |
| From net realized gain | | |
| Class A | $140,942 | $– |
| Class T | 120,506 | – |
| Class B | 8,665 | – |
| Class C | 87,907 | – |
| Class I | 29,305 | – |
| Total | $387,325 | $– |
10. Share Transactions.
Share transactions for each class were as follows and may contain automatic conversions between classes or exchanges between affiliated funds:
| | Shares | Shares | Dollars | Dollars |
| | Six months ended January 31, 2016 | Year ended July 31, 2015 | Six months ended January 31, 2016 | Year ended July 31, 2015 |
| Class A | | | | |
| Shares sold | 25,373 | 153,268 | $283,828 | $1,925,058 |
| Reinvestment of distributions | 12,164 | 914 | 134,093 | 11,238 |
| Shares redeemed | (34,391) | (167,571) | (380,784) | (2,111,373) |
| Net increase (decrease) | 3,146 | (13,389) | $37,137 | $(175,077) |
| Class T | | | | |
| Shares sold | 15,956 | 42,233 | $173,003 | $505,832 |
| Reinvestment of distributions | 11,237 | 146 | 119,674 | 1,738 |
| Shares redeemed | (23,665) | (56,809) | (254,428) | (686,152) |
| Net increase (decrease) | 3,528 | (14,430) | $38,249 | $(178,582) |
| Class B | | | | |
| Shares sold | – | – | $3 | $– |
| Reinvestment of distributions | 803 | – | 7,933 | – |
| Shares redeemed | (3,496) | (11,477) | (35,958) | (128,010) |
| Net increase (decrease) | (2,693) | (11,477) | $(28,022) | $(128,010) |
| Class C | | | | |
| Shares sold | 12,542 | 55,503 | $124,780 | $631,530 |
| Reinvestment of distributions | 8,306 | – | 81,979 | – |
| Shares redeemed | (36,403) | (47,426) | (370,346) | (530,907) |
| Net increase (decrease) | (15,555) | 8,077 | $(163,587) | $100,623 |
| Class I | | | | |
| Shares sold | 4,285 | 18,312 | $50,030 | $232,557 |
| Reinvestment of distributions | 2,247 | 868 | 25,646 | 11,030 |
| Shares redeemed | (9,183) | (150,382) | (106,822) | (2,006,379) |
| Net increase (decrease) | (2,651) | (131,202) | $(31,146) | $(1,762,792) |
11. Other.
The Fund's organizational documents provide former and current trustees and officers with a limited indemnification against liabilities arising in connection with the performance of their duties to the Fund. In the normal course of business, the Fund may also enter into contracts that provide general indemnifications. The Fund's maximum exposure under these arrangements is unknown as this would be dependent on future claims that may be made against the Fund. The risk of material loss from such claims is considered remote.
Fidelity Advisor® Consumer Discretionary Fund
Investment Summary (Unaudited)
Top Ten Stocks as of January 31, 2016
| | % of fund's net assets | % of fund's net assets 6 months ago |
| Amazon.com, Inc. | 10.3 | 7.1 |
| Home Depot, Inc. | 8.4 | 4.5 |
| The Walt Disney Co. | 7.5 | 8.0 |
| L Brands, Inc. | 5.4 | 4.2 |
| Starbucks Corp. | 4.6 | 4.6 |
| Ross Stores, Inc. | 4.3 | 2.3 |
| NIKE, Inc. Class B | 4.2 | 4.6 |
| Charter Communications, Inc. Class A | 3.9 | 1.3 |
| Comcast Corp. Class A | 2.8 | 5.4 |
| VF Corp. | 2.8 | 0.0 |
| | 54.2 | |
Top Industries (% of fund's net assets)
| As of January 31, 2016 |
| | Specialty Retail | 24.8% |
| | Media | 20.0% |
| | Hotels, Restaurants & Leisure | 16.6% |
| | Internet & Catalog Retail | 12.5% |
| | Textiles, Apparel & Luxury Goods | 9.7% |
| | All Others* | 16.4% |
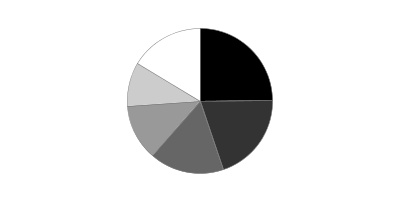
| As of July 31, 2015 |
| | Media | 23.0% |
| | Hotels, Restaurants & Leisure | 22.3% |
| | Specialty Retail | 17.9% |
| | Internet & Catalog Retail | 8.1% |
| | Textiles, Apparel & Luxury Goods | 6.2% |
| | All Others* | 22.5% |
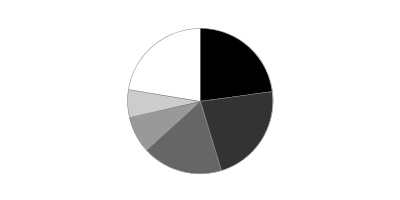
* Includes Short-Term investments and Net Other Assets (Liabilities).
Percentages shown as 0.0% may reflect amounts less than 0.05%.
Fidelity Advisor® Consumer Discretionary Fund
Investments January 31, 2016 (Unaudited)
Showing Percentage of Net Assets
| Common Stocks - 97.4% | | | |
| | | Shares | Value |
| Auto Components - 3.4% | | | |
| Auto Parts & Equipment - 3.4% | | | |
| Delphi Automotive PLC | | 76,184 | $4,947,389 |
| Tenneco, Inc. (a) | | 111,800 | 4,271,878 |
| Visteon Corp. | | 27,900 | 1,865,952 |
| | | | 11,085,219 |
| Automobiles - 0.2% | | | |
| Automobile Manufacturers - 0.2% | | | |
| Ferrari NV (a) | | 16,700 | 664,159 |
| Beverages - 1.9% | | | |
| Distillers & Vintners - 0.8% | | | |
| Constellation Brands, Inc. Class A (sub. vtg.) | | 17,627 | 2,687,765 |
| Soft Drinks - 1.1% | | | |
| Monster Beverage Corp. | | 26,500 | 3,578,295 |
|
| TOTAL BEVERAGES | | | 6,266,060 |
|
| Food Products - 0.3% | | | |
| Packaged Foods & Meats - 0.3% | | | |
| Associated British Foods PLC | | 21,300 | 960,920 |
| Hotels, Restaurants & Leisure - 16.6% | | | |
| Casinos & Gaming - 2.1% | | | |
| Las Vegas Sands Corp. | | 146,380 | 6,601,738 |
| Hotels, Resorts & Cruise Lines - 5.0% | | | |
| Accor SA | | 108,394 | 4,116,617 |
| Hilton Worldwide Holdings, Inc. | | 485,000 | 8,637,850 |
| Royal Caribbean Cruises Ltd. | | 40,000 | 3,278,400 |
| | | | 16,032,867 |
| Leisure Facilities - 1.6% | | | |
| Vail Resorts, Inc. | | 41,800 | 5,225,000 |
| Restaurants - 7.9% | | | |
| Chipotle Mexican Grill, Inc. (a) | | 1,700 | 770,049 |
| McDonald's Corp. | | 59,000 | 7,303,020 |
| Ruth's Hospitality Group, Inc. | | 162,800 | 2,645,500 |
| Starbucks Corp. | | 245,576 | 14,923,654 |
| | | | 25,642,223 |
|
| TOTAL HOTELS, RESTAURANTS & LEISURE | | | 53,501,828 |
|
| Household Durables - 4.0% | | | |
| Home Furnishings - 0.9% | | | |
| Tempur Sealy International, Inc. (a) | | 49,000 | 2,956,660 |
| Homebuilding - 1.5% | | | |
| PulteGroup, Inc. | | 288,600 | 4,836,936 |
| Household Appliances - 1.6% | | | |
| Techtronic Industries Co. Ltd. | | 1,333,500 | 5,059,569 |
|
| TOTAL HOUSEHOLD DURABLES | | | 12,853,165 |
|
| Household Products - 1.7% | | | |
| Household Products - 1.7% | | | |
| Spectrum Brands Holdings, Inc. | | 57,010 | 5,418,230 |
| Internet & Catalog Retail - 12.5% | | | |
| Internet Retail - 12.5% | | | |
| Amazon.com, Inc. (a) | | 56,480 | 33,153,760 |
| Netflix, Inc. (a) | | 27,900 | 2,562,336 |
| Ocado Group PLC (a)(b) | | 1,215,940 | 4,599,783 |
| | | | 40,315,879 |
| Internet Software & Services - 1.0% | | | |
| Internet Software & Services - 1.0% | | | |
| Alibaba Group Holding Ltd. sponsored ADR (a) | | 48,000 | 3,217,440 |
| Media - 20.0% | | | |
| Advertising - 1.1% | | | |
| Interpublic Group of Companies, Inc. | | 153,400 | 3,442,296 |
| Broadcasting - 2.4% | | | |
| ITV PLC | | 2,041,229 | 7,803,361 |
| Cable & Satellite - 7.8% | | | |
| Charter Communications, Inc. Class A (a)(b) | | 72,420 | 12,409,891 |
| Comcast Corp. Class A | | 163,000 | 9,080,730 |
| Naspers Ltd. Class N | | 28,470 | 3,597,843 |
| | | | 25,088,464 |
| Movies & Entertainment - 8.7% | | | |
| The Walt Disney Co. | | 253,306 | 24,271,781 |
| Time Warner, Inc. | | 56,100 | 3,951,684 |
| | | | 28,223,465 |
|
| TOTAL MEDIA | | | 64,557,586 |
|
| Multiline Retail - 0.9% | | | |
| Department Stores - 0.1% | | | |
| Macy's, Inc. | | 10,200 | 412,182 |
| General Merchandise Stores - 0.8% | | | |
| B&M European Value Retail S.A. | | 640,985 | 2,574,797 |
|
| TOTAL MULTILINE RETAIL | | | 2,986,979 |
|
| Software - 0.4% | | | |
| Application Software - 0.4% | | | |
| Mobileye NV (a)(b) | | 43,400 | 1,177,442 |
| Specialty Retail - 24.8% | | | |
| Apparel Retail - 12.8% | | | |
| Inditex SA | | 75,937 | 2,499,029 |
| L Brands, Inc. | | 183,100 | 17,605,065 |
| Ross Stores, Inc. | | 245,920 | 13,835,459 |
| TJX Companies, Inc. | | 44,908 | 3,199,246 |
| United Arrows Ltd. | | 14,200 | 686,827 |
| Zumiez, Inc. (a)(b) | | 197,848 | 3,583,027 |
| | | | 41,408,653 |
| Automotive Retail - 3.6% | | | |
| AutoZone, Inc. (a) | | 9,380 | 7,198,118 |
| O'Reilly Automotive, Inc. (a) | | 17,700 | 4,617,930 |
| | | | 11,816,048 |
| Home Improvement Retail - 8.4% | | | |
| Home Depot, Inc. | | 214,960 | 27,033,370 |
|
| TOTAL SPECIALTY RETAIL | | | 80,258,071 |
|
| Textiles, Apparel & Luxury Goods - 9.7% | | | |
| Apparel, Accessories & Luxury Goods - 5.5% | | | |
| G-III Apparel Group Ltd. (a) | | 170,680 | 8,424,765 |
| Regina Miracle International Holdings Ltd. (a) | | 157,635 | 258,012 |
| VF Corp. | | 143,780 | 9,000,628 |
| | | | 17,683,405 |
| Footwear - 4.2% | | | |
| NIKE, Inc. Class B | | 218,434 | 13,545,092 |
|
| TOTAL TEXTILES, APPAREL & LUXURY GOODS | | | 31,228,497 |
|
| TOTAL COMMON STOCKS | | | |
| (Cost $300,396,023) | | | 314,491,475 |
|
| Money Market Funds - 6.4% | | �� | |
| Fidelity Cash Central Fund, 0.38% (c) | | 3,891,803 | 3,891,803 |
| Fidelity Securities Lending Cash Central Fund, 0.42% (c)(d) | | 16,918,411 | 16,918,411 |
| TOTAL MONEY MARKET FUNDS | | | |
| (Cost $20,810,214) | | | 20,810,214 |
| TOTAL INVESTMENT PORTFOLIO - 103.8% | | | |
| (Cost $321,206,237) | | | 335,301,689 |
| NET OTHER ASSETS (LIABILITIES) - (3.8)% | | | (12,410,782) |
| NET ASSETS - 100% | | | $322,890,907 |
Legend
(a) Non-income producing
(b) Security or a portion of the security is on loan at period end.
(c) Affiliated fund that is generally available only to investment companies and other accounts managed by Fidelity Investments. The rate quoted is the annualized seven-day yield of the fund at period end. A complete unaudited listing of the fund's holdings as of its most recent quarter end is available upon request. In addition, each Fidelity Central Fund's financial statements are available on the SEC's website or upon request.
(d) Investment made with cash collateral received from securities on loan.
Affiliated Central Funds
Information regarding fiscal year to date income earned by the Fund from investments in Fidelity Central Funds is as follows:
| Fund | Income earned |
| Fidelity Cash Central Fund | $14,057 |
| Fidelity Securities Lending Cash Central Fund | 97,898 |
| Total | $111,955 |
Investment Valuation
The following is a summary of the inputs used, as of January 31, 2016, involving the Fund's assets and liabilities carried at fair value. The inputs or methodology used for valuing securities may not be an indication of the risk associated with investing in those securities. For more information on valuation inputs, and their aggregation into the levels used below, please refer to the Investment Valuation section in the accompanying Notes to Financial Statements.
| | Valuation Inputs at Reporting Date: |
| Description | Total | Level 1 | Level 2 | Level 3 |
| Investments in Securities: | | | | |
| Common Stocks | $314,491,475 | $282,334,717 | $32,156,758 | $-- |
| Money Market Funds | 20,810,214 | 20,810,214 | -- | -- |
| Total Investments in Securities: | $335,301,689 | $303,144,931 | $32,156,758 | $-- |
The following is a summary of transfers between Level 1 and Level 2 for the period ended January 31, 2016. Transfers are assumed to have occurred at the beginning of the period, and are primarily attributable to the valuation techniques used for foreign equity securities, as discussed in the accompanying Notes to Financial Statements:
| Transfers | Total |
| Level 1 to Level 2 | $17,056,474 |
| Level 2 to Level 1 | $0 |
Other Information
Distribution of investments by country or territory of incorporation, as a percentage of Total Net Assets, is as follows (Unaudited):
| United States of America | 85.9% |
| United Kingdom | 4.9% |
| Hong Kong | 1.6% |
| Bailiwick of Jersey | 1.5% |
| France | 1.3% |
| South Africa | 1.1% |
| Cayman Islands | 1.1% |
| Liberia | 1.0% |
| Others (Individually Less Than 1%) | 1.6% |
| | 100.0% |
See accompanying notes which are an integral part of the financial statements.
Fidelity Advisor® Consumer Discretionary Fund
Financial Statements
Statement of Assets and Liabilities
| | | January 31, 2016 (Unaudited) |
| Assets | | |
Investment in securities, at value (including securities loaned of $16,678,920) — See accompanying schedule:
Unaffiliated issuers (cost $300,396,023) | $314,491,475 | |
| Fidelity Central Funds (cost $20,810,214) | 20,810,214 | |
| Total Investments (cost $321,206,237) | | $335,301,689 |
| Cash | | 11,146 |
| Receivable for investments sold | | 6,966,445 |
| Receivable for fund shares sold | | 742,430 |
| Dividends receivable | | 17,097 |
| Distributions receivable from Fidelity Central Funds | | 24,948 |
| Prepaid expenses | | 901 |
| Other receivables | | 2,641 |
| Total assets | | 343,067,297 |
| Liabilities | | |
| Payable for investments purchased | $2,371,880 | |
| Payable for fund shares redeemed | 539,092 | |
| Accrued management fee | 148,835 | |
| Distribution and service plan fees payable | 94,288 | |
| Other affiliated payables | 69,612 | |
| Other payables and accrued expenses | 34,272 | |
| Collateral on securities loaned, at value | 16,918,411 | |
| Total liabilities | | 20,176,390 |
| Net Assets | | $322,890,907 |
| Net Assets consist of: | | |
| Paid in capital | | $320,992,543 |
| Distributions in excess of net investment income | | (104,787) |
| Accumulated undistributed net realized gain (loss) on investments and foreign currency transactions | | (12,091,077) |
| Net unrealized appreciation (depreciation) on investments and assets and liabilities in foreign currencies | | 14,094,228 |
| Net Assets | | $322,890,907 |
| Calculation of Maximum Offering Price | | |
| Class A: | | |
| Net Asset Value and redemption price per share ($140,340,362 ÷ 7,346,678 shares) | | $19.10 |
| Maximum offering price per share (100/94.25 of $19.10) | | $20.27 |
| Class T: | | |
| Net Asset Value and redemption price per share ($26,138,734 ÷ 1,455,054 shares) | | $17.96 |
| Maximum offering price per share (100/96.50 of $17.96) | | $18.61 |
| Class B: | | |
| Net Asset Value and offering price per share ($1,182,922 ÷ 75,275 shares)(a) | | $15.71 |
| Class C: | | |
| Net Asset Value and offering price per share ($64,407,057 ÷ 4,094,933 shares)(a) | | $15.73 |
| Class I: | | |
| Net Asset Value, offering price and redemption price per share ($90,821,832 ÷ 4,433,849 shares) | | $20.48 |
(a) Redemption price per share is equal to net asset value less any applicable contingent deferred sales charge.
See accompanying notes which are an integral part of the financial statements.
Statement of Operations
| | | Six months ended January 31, 2016 (Unaudited) |
| Investment Income | | |
| Dividends | | $1,823,714 |
| Income from Fidelity Central Funds (including $97,898 from security lending) | | 111,955 |
| Total income | | 1,935,669 |
| Expenses | | |
| Management fee | $804,009 | |
| Transfer agent fees | 309,103 | |
| Distribution and service plan fees | 513,774 | |
| Accounting and security lending fees | 58,682 | |
| Custodian fees and expenses | 6,854 | |
| Independent trustees' compensation | 2,557 | |
| Registration fees | 74,160 | |
| Audit | 23,761 | |
| Legal | 1,191 | |
| Miscellaneous | 1,290 | |
| Total expenses before reductions | 1,795,381 | |
| Expense reductions | (5,277) | 1,790,104 |
| Net investment income (loss) | | 145,565 |
| Realized and Unrealized Gain (Loss) | | |
| Net realized gain (loss) on: | | |
| Investment securities: | | |
| Unaffiliated issuers | (11,789,944) | |
| Foreign currency transactions | 13,094 | |
| Total net realized gain (loss) | | (11,776,850) |
Change in net unrealized appreciation (depreciation) on:
Investment securities (net of decrease in deferred foreign taxes of $15,238) | (17,481,793) | |
| Assets and liabilities in foreign currencies | (269) | |
| Total change in net unrealized appreciation (depreciation) | | (17,482,062) |
| Net gain (loss) | | (29,258,912) |
| Net increase (decrease) in net assets resulting from operations | | $(29,113,347) |
See accompanying notes which are an integral part of the financial statements.
Statement of Changes in Net Assets
| | Six months ended January 31, 2016 (Unaudited) | Year ended July 31, 2015 |
| Increase (Decrease) in Net Assets | | |
| Operations | | |
| Net investment income (loss) | $145,565 | $218,833 |
| Net realized gain (loss) | (11,776,850) | 7,993,991 |
| Change in net unrealized appreciation (depreciation) | (17,482,062) | 21,200,743 |
| Net increase (decrease) in net assets resulting from operations | (29,113,347) | 29,413,567 |
| Distributions to shareholders from net investment income | (425,920) | – |
| Distributions to shareholders from net realized gain | (5,484,780) | (13,923,456) |
| Total distributions | (5,910,700) | (13,923,456) |
| Share transactions - net increase (decrease) | 123,148,784 | 97,114,685 |
| Redemption fees | 25,847 | 10,114 |
| Total increase (decrease) in net assets | 88,150,584 | 112,614,910 |
| Net Assets | | |
| Beginning of period | 234,740,323 | 122,125,413 |
| End of period (including distributions in excess of net investment income of $104,787 and undistributed net investment income of $175,568, respectively) | $322,890,907 | $234,740,323 |
See accompanying notes which are an integral part of the financial statements.
Financial Highlights — Fidelity Advisor Consumer Discretionary Fund Class A
| | Six months ended (Unaudited) | Years ended July 31, | | | | |
| January 31, | 2016 | 2015 | 2014 | 2013 | 2012 | 2011 |
| Selected Per–Share Data | | | | | | |
| Net asset value, beginning of period | $21.51 | $19.75 | $19.59 | $16.22 | $16.00 | $12.75 |
| Income from Investment Operations | | | | | | |
| Net investment income (loss)A | .02 | .05 | (.04) | (.02) | .01 | (.02) |
| Net realized and unrealized gain (loss) | (1.97) | 3.99 | 1.75 | 5.04 | 1.07 | 3.27 |
| Total from investment operations | (1.95) | 4.04 | 1.71 | 5.02 | 1.08 | 3.25 |
| Distributions from net investment income | (.02) | – | – | – | (.03) | – |
| Distributions from net realized gain | (.44) | (2.28) | (1.55) | (1.65) | (.83) | – |
| Total distributions | (.46) | (2.28) | (1.55) | (1.65) | (.86) | – |
| Redemption fees added to paid in capitalA,B | – | – | – | – | – | – |
| Net asset value, end of period | $19.10 | $21.51 | $19.75 | $19.59 | $16.22 | $16.00 |
| Total ReturnC,D,E | (9.14)% | 22.26% | 9.28% | 33.65% | 7.96% | 25.49% |
| Ratios to Average Net AssetsF,G | | | | | | |
| Expenses before reductions | 1.12%H | 1.15% | 1.20% | 1.31% | 1.38% | 1.39% |
| Expenses net of fee waivers, if any | 1.12%H | 1.15% | 1.20% | 1.31% | 1.38% | 1.39% |
| Expenses net of all reductions | 1.12%H | 1.14% | 1.19% | 1.29% | 1.37% | 1.38% |
| Net investment income (loss) | .20%H | .27% | (.21)% | (.10)% | .04% | (.15)% |
| Supplemental Data | | | | | | |
| Net assets, end of period (000 omitted) | $140,340 | $115,027 | $59,089 | $45,292 | $26,547 | $23,447 |
| Portfolio turnover rateI | 59%H | 71% | 171% | 146% | 217% | 179% |
A Calculated based on average shares outstanding during the period.
B Amount represents less than $.005 per share.
C Total returns for periods of less than one year are not annualized.
D Total returns would have been lower if certain expenses had not been reduced during the applicable periods shown.
E Total returns do not include the effect of the sales charges.
F Fees and expenses of any underlying Fidelity Central Funds are not included in the Fund's expense ratio. The Fund indirectly bears its proportionate share of the expenses of any underlying Fidelity Central Funds.
G Expense ratios reflect operating expenses of the class. Expenses before reductions do not reflect amounts reimbursed by the investment adviser or reductions from brokerage service arrangements or reductions from other expense offset arrangements and do not represent the amount paid by the class during periods when reimbursements or reductions occur. Expenses net of fee waivers reflect expenses after reimbursement by the investment adviser but prior to reductions from brokerage service arrangements or other expense offset arrangements. Expenses net of all reductions represent the net expenses paid by the class.
H Annualized
I Amount does not include the portfolio activity of any underlying Fidelity Central Funds.
See accompanying notes which are an integral part of the financial statements.
Financial Highlights — Fidelity Advisor Consumer Discretionary Fund Class T
| | Six months ended (Unaudited) | Years ended July 31, | | | | |
| January 31, | 2016 | 2015 | 2014 | 2013 | 2012 | 2011 |
| Selected Per–Share Data | | | | | | |
| Net asset value, beginning of period | $20.26 | $18.75 | $18.68 | $15.57 | $15.43 | $12.32 |
| Income from Investment Operations | | | | | | |
| Net investment income (loss)A | (.01) | (.01) | (.10) | (.06) | (.03) | (.06) |
| Net realized and unrealized gain (loss) | (1.85) | 3.77 | 1.67 | 4.81 | 1.02 | 3.17 |
| Total from investment operations | (1.86) | 3.76 | 1.57 | 4.75 | .99 | 3.11 |
| Distributions from net investment income | – | – | – | – | (.02) | – |
| Distributions from net realized gain | (.44) | (2.25) | (1.50) | (1.64) | (.83) | – |
| Total distributions | (.44) | (2.25) | (1.50) | (1.64) | (.85) | – |
| Redemption fees added to paid in capitalA,B | – | – | – | – | – | – |
| Net asset value, end of period | $17.96 | $20.26 | $18.75 | $18.68 | $15.57 | $15.43 |
| Total ReturnC,D,E | (9.26)% | 21.92% | 8.94% | 33.25% | 7.62% | 25.24% |
| Ratios to Average Net AssetsF,G | | | | | | |
| Expenses before reductions | 1.43%H | 1.46% | 1.50% | 1.60% | 1.64% | 1.66% |
| Expenses net of fee waivers, if any | 1.42%H | 1.45% | 1.50% | 1.60% | 1.64% | 1.65% |
| Expenses net of all reductions | 1.42%H | 1.45% | 1.49% | 1.58% | 1.63% | 1.64% |
| Net investment income (loss) | (.10)%H | (.03)% | (.51)% | (.39)% | (.23)% | (.40)% |
| Supplemental Data | | | | | | |
| Net assets, end of period (000 omitted) | $26,139 | $25,948 | $18,779 | $15,613 | $10,447 | $9,897 |
| Portfolio turnover rateI | 59%H | 71% | 171% | 146% | 217% | 179% |
A Calculated based on average shares outstanding during the period.
B Amount represents less than $.005 per share.
C Total returns for periods of less than one year are not annualized.
D Total returns would have been lower if certain expenses had not been reduced during the applicable periods shown.
E Total returns do not include the effect of the sales charges.
F Fees and expenses of any underlying Fidelity Central Funds are not included in the Fund's expense ratio. The Fund indirectly bears its proportionate share of the expenses of any underlying Fidelity Central Funds.
G Expense ratios reflect operating expenses of the class. Expenses before reductions do not reflect amounts reimbursed by the investment adviser or reductions from brokerage service arrangements or reductions from other expense offset arrangements and do not represent the amount paid by the class during periods when reimbursements or reductions occur. Expenses net of fee waivers reflect expenses after reimbursement by the investment adviser but prior to reductions from brokerage service arrangements or other expense offset arrangements. Expenses net of all reductions represent the net expenses paid by the class.
H Annualized
I Amount does not include the portfolio activity of any underlying Fidelity Central Funds.
See accompanying notes which are an integral part of the financial statements.
Financial Highlights — Fidelity Advisor Consumer Discretionary Fund Class B
| | Six months ended (Unaudited) | Years ended July 31, | | | | |
| January 31, | 2016 | 2015 | 2014 | 2013 | 2012 | 2011 |
| Selected Per–Share Data | | | | | | |
| Net asset value, beginning of period | $17.83 | $16.76 | $16.85 | $14.23 | $14.23 | $11.42 |
| Income from Investment Operations | | | | | | |
| Net investment income (loss)A | (.05) | (.09) | (.17) | (.13) | (.10) | (.12) |
| Net realized and unrealized gain (loss) | (1.63) | 3.34 | 1.49 | 4.36 | .93 | 2.93 |
| Total from investment operations | (1.68) | 3.25 | 1.32 | 4.23 | .83 | 2.81 |
| Distributions from net investment income | – | – | – | – | – | – |
| Distributions from net realized gain | (.44) | (2.18) | (1.41) | (1.61) | (.83) | – |
| Total distributions | (.44) | (2.18) | (1.41) | (1.61) | (.83) | – |
| Redemption fees added to paid in capitalA,B | – | – | – | – | – | – |
| Net asset value, end of period | $15.71 | $17.83 | $16.76 | $16.85 | $14.23 | $14.23 |
| Total ReturnC,D,E | (9.52)% | 21.35% | 8.36% | 32.61% | 7.11% | 24.61% |
| Ratios to Average Net AssetsF,G | | | | | | |
| Expenses before reductions | 1.92%H | 1.96% | 2.01% | 2.09% | 2.13% | 2.15% |
| Expenses net of fee waivers, if any | 1.92%H | 1.96% | 2.01% | 2.09% | 2.13% | 2.15% |
| Expenses net of all reductions | 1.91%H | 1.95% | 2.01% | 2.07% | 2.12% | 2.13% |
| Net investment income (loss) | (.59)%H | (.54)% | (1.02)% | (.88)% | (.72)% | (.90)% |
| Supplemental Data | | | | | | |
| Net assets, end of period (000 omitted) | $1,183 | $1,438 | $1,824 | $2,389 | $2,577 | $3,170 |
| Portfolio turnover rateI | 59%H | 71% | 171% | 146% | 217% | 179% |
A Calculated based on average shares outstanding during the period.
B Amount represents less than $.005 per share.
C Total returns for periods of less than one year are not annualized.
D Total returns would have been lower if certain expenses had not been reduced during the applicable periods shown.
E Total returns do not include the effect of the contingent deferred sales charge.
F Fees and expenses of any underlying Fidelity Central Funds are not included in the Fund's expense ratio. The Fund indirectly bears its proportionate share of the expenses of any underlying Fidelity Central Funds.
G Expense ratios reflect operating expenses of the class. Expenses before reductions do not reflect amounts reimbursed by the investment adviser or reductions from brokerage service arrangements or reductions from other expense offset arrangements and do not represent the amount paid by the class during periods when reimbursements or reductions occur. Expenses net of fee waivers reflect expenses after reimbursement by the investment adviser but prior to reductions from brokerage service arrangements or other expense offset arrangements. Expenses net of all reductions represent the net expenses paid by the class.
H Annualized
I Amount does not include the portfolio activity of any underlying Fidelity Central Funds.
See accompanying notes which are an integral part of the financial statements.
Financial Highlights — Fidelity Advisor Consumer Discretionary Fund Class C
| | Six months ended (Unaudited) | Years ended July 31, | | | | |
| January 31, | 2016 | 2015 | 2014 | 2013 | 2012 | 2011 |
| Selected Per–Share Data | | | | | | |
| Net asset value, beginning of period | $17.84 | $16.79 | $16.90 | $14.27 | $14.26 | $11.44 |
| Income from Investment Operations | | | | | | |
| Net investment income (loss)A | (.05) | (.08) | (.16) | (.12) | (.09) | (.12) |
| Net realized and unrealized gain (loss) | (1.62) | 3.34 | 1.49 | 4.37 | .93 | 2.94 |
| Total from investment operations | (1.67) | 3.26 | 1.33 | 4.25 | .84 | 2.82 |
| Distributions from net investment income | – | – | – | – | – | – |
| Distributions from net realized gain | (.44) | (2.21) | (1.44) | (1.62) | (.83) | – |
| Total distributions | (.44) | (2.21) | (1.44) | (1.62) | (.83) | – |
| Redemption fees added to paid in capitalA,B | – | – | – | – | – | – |
| Net asset value, end of period | $15.73 | $17.84 | $16.79 | $16.90 | $14.27 | $14.26 |
| Total ReturnC,D,E | (9.46)% | 21.37% | 8.44% | 32.68% | 7.17% | 24.65% |
| Ratios to Average Net AssetsF,G | | | | | | |
| Expenses before reductions | 1.89%H | 1.91% | 1.97% | 2.04% | 2.09% | 2.11% |
| Expenses net of fee waivers, if any | 1.88%H | 1.91% | 1.97% | 2.04% | 2.09% | 2.11% |
| Expenses net of all reductions | 1.88%H | 1.90% | 1.96% | 2.02% | 2.08% | 2.09% |
| Net investment income (loss) | (.56)%H | (.49)% | (.97)% | (.83)% | (.68)% | (.86)% |
| Supplemental Data | | | | | | |
| Net assets, end of period (000 omitted) | $64,407 | $43,999 | $20,726 | $17,176 | $13,507 | $7,341 |
| Portfolio turnover rateI | 59%H | 71% | 171% | 146% | 217% | 179% |
A Calculated based on average shares outstanding during the period.
B Amount represents less than $.005 per share.
C Total returns for periods of less than one year are not annualized.
D Total returns would have been lower if certain expenses had not been reduced during the applicable periods shown.
E Total returns do not include the effect of the contingent deferred sales charge.
F Fees and expenses of any underlying Fidelity Central Funds are not included in the Fund's expense ratio. The Fund indirectly bears its proportionate share of the expenses of any underlying Fidelity Central Funds.
G Expense ratios reflect operating expenses of the class. Expenses before reductions do not reflect amounts reimbursed by the investment adviser or reductions from brokerage service arrangements or reductions from other expense offset arrangements and do not represent the amount paid by the class during periods when reimbursements or reductions occur. Expenses net of fee waivers reflect expenses after reimbursement by the investment adviser but prior to reductions from brokerage service arrangements or other expense offset arrangements. Expenses net of all reductions represent the net expenses paid by the class.
H Annualized
I Amount does not include the portfolio activity of any underlying Fidelity Central Funds.
See accompanying notes which are an integral part of the financial statements.
Financial Highlights — Fidelity Advisor Consumer Discretionary Fund Class I
| | Six months ended (Unaudited) | Years ended July 31, | | | | |
| January 31, | 2016 | 2015 | 2014 | 2013 | 2012 | 2011 |
| Selected Per–Share Data | | | | | | |
| Net asset value, beginning of period | $23.06 | $21.00 | $20.72 | $17.04 | $16.72 | $13.27 |
| Income from Investment Operations | | | | | | |
| Net investment income (loss)A | .05 | .12 | .02 | .04 | .07 | .03 |
| Net realized and unrealized gain (loss) | (2.11) | 4.26 | 1.85 | 5.32 | 1.13 | 3.42 |
| Total from investment operations | (2.06) | 4.38 | 1.87 | 5.36 | 1.20 | 3.45 |
| Distributions from net investment income | (.08) | – | – | – | (.05) | – |
| Distributions from net realized gain | (.44) | (2.32) | (1.59) | (1.68) | (.83) | – |
| Total distributions | (.52) | (2.32) | (1.59) | (1.68) | (.88) | – |
| Redemption fees added to paid in capitalA,B | – | – | – | – | – | – |
| Net asset value, end of period | $20.48 | $23.06 | $21.00 | $20.72 | $17.04 | $16.72 |
| Total ReturnC,D | (9.01)% | 22.60% | 9.61% | 34.06% | 8.33% | 26.00% |
| Ratios to Average Net AssetsE,F | | | | | | |
| Expenses before reductions | .86%G | .87% | .91% | .97% | 1.00% | 1.03% |
| Expenses net of fee waivers, if any | .86%G | .87% | .91% | .97% | 1.00% | 1.03% |
| Expenses net of all reductions | .86%G | .87% | .91% | .96% | .99% | 1.01% |
| Net investment income (loss) | .47%G | .55% | .08% | .24% | .41% | .22% |
| Supplemental Data | | | | | | |
| Net assets, end of period (000 omitted) | $90,822 | $48,329 | $21,708 | $13,044 | $9,984 | $9,406 |
| Portfolio turnover rateH | 59%G | 71% | 171% | 146% | 217% | 179% |
A Calculated based on average shares outstanding during the period.
B Amount represents less than $.005 per share.
C Total returns for periods of less than one year are not annualized.
D Total returns would have been lower if certain expenses had not been reduced during the applicable periods shown.
E Fees and expenses of any underlying Fidelity Central Funds are not included in the Fund's expense ratio. The Fund indirectly bears its proportionate share of the expenses of any underlying Fidelity Central Funds.
F Expense ratios reflect operating expenses of the class. Expenses before reductions do not reflect amounts reimbursed by the investment adviser or reductions from brokerage service arrangements or reductions from other expense offset arrangements and do not represent the amount paid by the class during periods when reimbursements or reductions occur. Expenses net of fee waivers reflect expenses after reimbursement by the investment adviser but prior to reductions from brokerage service arrangements or other expense offset arrangements. Expenses net of all reductions represent the net expenses paid by the class.
G Annualized
H Amount does not include the portfolio activity of any underlying Fidelity Central Funds.
See accompanying notes which are an integral part of the financial statements.
Notes to Financial Statements (Unaudited)
For the period ended January 31, 2016
1. Organization.
Fidelity Advisor Consumer Discretionary Fund (the Fund) is a non-diversified fund of Fidelity Advisor Series VII (the Trust) and is authorized to issue an unlimited number of shares. The Trust is registered under the Investment Company Act of 1940, as amended (the 1940 Act), as an open-end management investment company organized as a Massachusetts business trust. The Fund offers Class A, Class T, Class C and Class I shares, each of which, along with Class B shares, has equal rights as to assets and voting privileges. Class B shares are closed to new accounts and additional purchases, except for exchanges and reinvestments. Class B shares will automatically convert to Class A shares after a holding period of seven years from the initial date of purchase.
During the period, the Board of Trustees approved the conversion of all existing Class B shares into Class A shares, effective on or about July 1, 2016, regardless of the length of times shares have been held.
2. Investments in Fidelity Central Funds.
The Fund invests in Fidelity Central Funds, which are open-end investment companies generally available only to other investment companies and accounts managed by the investment adviser and its affiliates. The Fund's Schedule of Investments lists each of the Fidelity Central Funds held as of period end, if any, as an investment of the Fund, but does not include the underlying holdings of each Fidelity Central Fund. As an Investing Fund, the Fund indirectly bears its proportionate share of the expenses of the underlying Fidelity Central Funds.
The Money Market Central Funds seek preservation of capital and current income and are managed by Fidelity Investments Money Management, Inc. (FIMM), an affiliate of the investment adviser. Annualized expenses of the Money Market Central Funds as of their most recent shareholder report date are less than .005%.
A complete unaudited list of holdings for each Fidelity Central Fund is available upon request or at the Securities and Exchange Commission (the SEC) website at www.sec.gov. In addition, the financial statements of the Fidelity Central Funds are available on the SEC website or upon request.
3. Significant Accounting Policies.
The financial statements have been prepared in conformity with accounting principles generally accepted in the United States of America (GAAP), which require management to make certain estimates and assumptions at the date of the financial statements. Actual results could differ from those estimates. Subsequent events, if any, through the date that the financial statements were issued have been evaluated in the preparation of the financial statements. The following summarizes the significant accounting policies of the Fund:
Investment Valuation. Investments are valued as of 4:00 p.m. Eastern time on the last calendar day of the period. The Board of Trustees (the Board) has delegated the day to day responsibility for the valuation of the Fund's investments to the Fidelity SelectCo, LLC (SelectCo) Fair Value Committee (the Committee). In accordance with valuation policies and procedures approved by the Board, the Fund attempts to obtain prices from one or more third party pricing vendors or brokers to value its investments. When current market prices, quotations or currency exchange rates are not readily available or reliable, investments will be fair valued in good faith by the Committee, in accordance with procedures adopted by the Board. Factors used in determining fair value vary by investment type and may include market or investment specific events. The frequency with which these procedures are used cannot be predicted and they may be utilized to a significant extent. The Committee oversees the Fund's valuation policies and procedures and reports to the Board on the Committee's activities and fair value determinations. The Board monitors the appropriateness of the procedures used in valuing the Fund's investments and ratifies the fair value determinations of the Committee.
The Fund categorizes the inputs to valuation techniques used to value its investments into a disclosure hierarchy consisting of three levels as shown below:
- Level 1 – quoted prices in active markets for identical investments
- Level 2 – other significant observable inputs (including quoted prices for similar investments, interest rates, prepayment speeds, etc.)
- Level 3 – unobservable inputs (including the Fund's own assumptions based on the best information available)
Valuation techniques used to value the Fund's investments by major category are as follows:
Equity securities, including restricted securities, for which market quotations are readily available, are valued at the last reported sale price or official closing price as reported by a third party pricing vendor on the primary market or exchange on which they are traded and are categorized as Level 1 in the hierarchy. In the event there were no sales during the day or closing prices are not available, securities are valued at the last quoted bid price or may be valued using the last available price and are generally categorized as Level 2 in the hierarchy. For foreign equity securities, when market or security specific events arise, comparisons to the valuation of American Depositary Receipts (ADRs), futures contracts, Exchange-Traded Funds (ETFs) and certain indexes as well as quoted prices for similar securities may be used and would be categorized as Level 2 in the hierarchy. Utilizing these techniques may result in transfers between Level 1 and Level 2. For equity securities, including restricted securities, where observable inputs are limited, assumptions about market activity and risk are used and these securities may be categorized as Level 3 in the hierarchy.
Investments in open-end mutual funds, including the Fidelity Central Funds, are valued at their closing net asset value (NAV) each business day and are categorized as Level 1 in the hierarchy.
Changes in valuation techniques may result in transfers in or out of an assigned level within the disclosure hierarchy. The aggregate value of investments by input level as of January 31, 2016, including information on transfers between Levels 1 and 2, is included at the end of the Fund's Schedule of Investments.
Foreign Currency. The Fund may use foreign currency contracts to facilitate transactions in foreign-denominated securities. Gains and losses from these transactions may arise from changes in the value of the foreign currency or if the counterparties do not perform under the contracts' terms.
Foreign-denominated assets, including investment securities, and liabilities are translated into U.S. dollars at the exchange rates at period end. Purchases and sales of investment securities, income and dividends received and expenses denominated in foreign currencies are translated into U.S. dollars at the exchange rate in effect on the transaction date.
The effects of exchange rate fluctuations on investments are included with the net realized and unrealized gain (loss) on investment securities. Other foreign currency transactions resulting in realized and unrealized gain (loss) are disclosed separately.
Investment Transactions and Income. For financial reporting purposes, the Fund's investment holdings and NAV include trades executed through the end of the last business day of the period. The NAV per share for processing shareholder transactions is calculated as of the close of business of the New York Stock Exchange (NYSE), normally 4:00 p.m. Eastern time and includes trades executed through the end of the prior business day. Gains and losses on securities sold are determined on the basis of identified cost and may include proceeds received from litigation. Dividend income is recorded on the ex-dividend date, except for certain dividends from foreign securities where the ex-dividend date may have passed, which are recorded as soon as the Fund is informed of the ex-dividend date. Non-cash dividends included in dividend income, if any, are recorded at the fair market value of the securities received. Income and capital gain distributions from Fidelity Central Funds, if any, are recorded on the ex-dividend date. Distributions received on securities that represent a return of capital or capital gain are recorded as a reduction of cost of investments and/or as a realized gain. Subsequent to ex-dividend date the Fund determines the components of these distributions, based upon receipt of tax filings or other correspondence relating to the underlying investment. Investment income is recorded net of foreign taxes withheld where recovery of such taxes is uncertain.
Class Allocations and Expenses. Investment income, realized and unrealized capital gains and losses, common expenses of the Fund, and certain fund-level expense reductions, if any, are allocated daily on a pro-rata basis to each class based on the relative net assets of each class to the total net assets of the Fund. Each class differs with respect to transfer agent and distribution and service plan fees incurred. Certain expense reductions may also differ by class. For the reporting period, the allocated portion of income and expenses to each class as a percent of its average net assets may vary due to the timing of recording these transactions in relation to fluctuating net assets of the classes. Expenses directly attributable to a fund are charged to that fund. Expenses attributable to more than one fund are allocated among the respective funds on the basis of relative net assets or other appropriate methods. Expense estimates are accrued in the period to which they relate and adjustments are made when actual amounts are known.
Income Tax Information and Distributions to Shareholders. Each year, the Fund intends to qualify as a regulated investment company under Subchapter M of the Internal Revenue Code, including distributing substantially all of its taxable income and realized gains. As a result, no provision for U.S. Federal income taxes is required. The Fund files a U.S. federal tax return, in addition to state and local tax returns as required. The Fund's federal income tax returns are subject to examination by the Internal Revenue Service (IRS) for a period of three fiscal years after they are filed. State and local tax returns may be subject to examination for an additional fiscal year depending on the jurisdiction. Foreign taxes are provided for based on the Fund's understanding of the tax rules and rates that exist in the foreign markets in which it invests.
Distributions are declared and recorded on the ex-dividend date. Income dividends and capital gain distributions are declared separately for each class. Income and capital gain distributions are determined in accordance with income tax regulations, which may differ from GAAP.
Capital accounts within the financial statements are adjusted for permanent book-tax differences. These adjustments have no impact on net assets or the results of operations. Capital accounts are not adjusted for temporary book-tax differences which will reverse in a subsequent period.
Book-tax differences are primarily due to foreign currency transactions, certain foreign taxes, deferred trustees compensation and losses deferred due to wash sales.
The federal tax cost of investment securities and unrealized appreciation (depreciation) as of period end were as follows:
| Gross unrealized appreciation | $37,208,756 |
| Gross unrealized depreciation | (23,496,299) |
| Net unrealized appreciation (depreciation) on securities | $13,712,457 |
| Tax cost | $321,589,232 |
Short-Term Trading (Redemption) Fees. Shares held by investors in the Fund less than 30 days may have been subject to a redemption fee equal to .75% of the NAV of shares redeemed. All redemption fees, which reduce the proceeds of the shareholder redemption, are retained by the Fund and accounted for as an addition to paid in capital.
4. Purchases and Sales of Investments.
Purchases and sales of securities, other than short-term securities, aggregated $199,029,754 and $83,699,954, respectively.
5. Fees and Other Transactions with Affiliates.
Management Fee. Fidelity SelectCo, LLC (the investment adviser) and its affiliates provide the Fund with investment management related services for which the Fund pays a monthly management fee. The management fee is the sum of an individual fund fee rate that is based on an annual rate of .30% of the Fund's average net assets and an annualized group fee rate that averaged .25% during the period. The group fee rate is based upon the average net assets of all the mutual funds advised by Fidelity Management & Research Company (FMR) and the investment adviser. The group fee rate decreases as assets under management increase and increases as assets under management decrease. For the reporting period, the total annualized management fee rate was .55% of the Fund's average net assets.
Distribution and Service Plan Fees. In accordance with Rule 12b-1 of the 1940 Act, the Fund has adopted separate Distribution and Service Plans for each class of shares. Certain classes pay Fidelity Distributors Corporation (FDC), an affiliate of the investment adviser, separate Distribution and Service Fees, each of which is based on an annual percentage of each class' average net assets. In addition, FDC may pay financial intermediaries for selling shares of the Fund and providing shareholder support services. For the period, the Distribution and Service Fee rates, total fees and amounts retained by FDC were as follows:
| | Distribution
Fee | Service
Fee | Total Fees | Retained
by FDC |
| Class A | -% | .25% | $165,724 | $601 |
| Class T | .25% | .25% | 64,338 | – |
| Class B | .75% | .25% | 6,452 | 4,839 |
| Class C | .75% | .25% | 277,260 | 140,269 |
| | | | $513,774 | $145,709 |
Sales Load. FDC may receive a front-end sales charge of up to 5.75% for selling Class A shares and 3.50% for selling Class T shares, some of which is paid to financial intermediaries for selling shares of the Fund. Depending on the holding period, FDC may receive contingent deferred sales charges levied on Class A, Class T, Class B, and Class C redemptions. The deferred sales charges range from 5.00% to 1.00% for Class B shares, 1.00% for Class C shares, 1.00% for certain purchases of Class A shares and .25% for certain purchases of Class T shares.
For the period, sales charge amounts retained by FDC were as follows:
| | Retained
by FDC |
| Class A | $98,914 |
| Class T | 9,173 |
| Class B(a) | 50 |
| Class C(a) | 8,395 |
| | $116,532 |
(a) When Class B and Class C shares are initially sold, FDC pays commissions from its own resources to financial intermediaries through which the sales are made.
Transfer Agent Fees. Fidelity Investments Institutional Operations Company, Inc., (FIIOC), an affiliate of the investment adviser, is the transfer, dividend disbursing and shareholder servicing agent for each class of the Fund. FIIOC receives account fees and asset-based fees that vary according to the account size and type of account of the shareholders of the respective classes of the Fund. FIIOC pays for typesetting, printing and mailing of shareholder reports, except proxy statements.
For the period, transfer agent fees for each class were as follows:
| | Amount | % of
Class-Level Average
Net Assets(a) |
| Class A | $137,158 | .21 |
| Class T | 33,544 | .26 |
| Class B | 1,631 | .25 |
| Class C | 60,233 | .22 |
| Class I | 76,537 | .20 |
| | $309,103 | |
(a) Annualized
Accounting and Security Lending Fees. Fidelity Service Company, Inc. (FSC), an affiliate of the investment adviser, maintains the Fund's accounting records. The accounting fee is based on the level of average net assets for each month. Under a separate contract, FSC administers the security lending program. The security lending fee is based on the number and duration of lending transactions.
Brokerage Commissions. The Fund placed a portion of its portfolio transactions with brokerage firms which are affiliates of the investment adviser. Brokerage commissions are included in net realized gain (loss) and change in net unrealized appreciation (depreciation) in the Statement of Operations. The commissions paid to these affiliated firms were $1,360 for the period.
Interfund Trades. The Fund may purchase from or sell securities to other Fidelity Funds under procedures adopted by the Board. The procedures have been designed to ensure these interfund trades are executed in accordance with Rule 17a-7 of the 1940 Act. Interfund trades are included within the respective purchases and sales amounts shown in the Purchases and Sales of Investments note.
6. Committed Line of Credit.
The Fund participates with other funds managed by the investment adviser or an affiliate in a $4.25 billion credit facility (the "line of credit") to be utilized for temporary or emergency purposes to fund shareholder redemptions or for other short-term liquidity purposes. The Fund has agreed to pay commitment fees on its pro-rata portion of the line of credit, which amounted to $184 and is reflected in Miscellaneous expenses on the Statement of Operations. During the period, the Fund did not borrow on this line of credit.
7. Security Lending.
The Fund lends portfolio securities through a lending agent from time to time in order to earn additional income. On the settlement date of the loan, the Fund receives collateral (in the form of U.S. Treasury obligations, letters of credit and/or cash) against the loaned securities and maintains collateral in an amount not less than 100% of the market value of the loaned securities during the period of the loan. The market value of the loaned securities is determined at the close of business of the Fund and any additional required collateral is delivered to the Fund on the next business day. The Fund or borrower may terminate the loan at any time, and if the borrower defaults on its obligation to return the securities loaned because of insolvency or other reasons, the Fund may apply collateral received from the borrower against the obligation. The Fund may experience delays and costs in recovering the securities loaned. Any cash collateral received is invested in the Fidelity Securities Lending Cash Central Fund. The value of loaned securities and cash collateral at period end are disclosed on the Fund's Statement of Assets and Liabilities. Security lending income represents the income earned on investing cash collateral, less rebates paid to borrowers and any lending agent fees associated with the loan, plus any premium payments received for lending certain types of securities. Security lending income is presented in the Statement of Operations as a component of income from Fidelity Central Funds.
8. Expense Reductions.
Commissions paid to certain brokers with whom the investment adviser, or its affiliates, places trades on behalf of the Fund include an amount in addition to trade execution, which may be rebated back to the Fund to offset certain expenses. This amount totaled $4,041 for the period.
In addition, during the period the investment adviser reimbursed and/or waived a portion of fund-level operating expenses in the amount of $1,236.
9. Distributions to Shareholders.
Distributions to shareholders of each class were as follows:
| | Six months ended January 31, 2016 | Year ended July 31, 2015 |
| From net investment income | | |
| Class A | $145,315 | $– |
| Class I | 280,605 | – |
| Total | $425,920 | $– |
| From net realized gain | | |
| Class A | $2,490,947 | $6,488,273 |
| Class T | 567,555 | 2,268,637 |
| Class B | 33,959 | 224,707 |
| Class C | 1,218,277 | 2,737,034 |
| Class I | 1,174,042 | 2,204,805 |
| Total | $5,484,780 | $13,923,456 |
10. Share Transactions.
Share transactions for each class were as follows and may contain automatic conversions between classes or exchanges between affiliated funds:
| | Shares | Shares | Dollars | Dollars |
| | Six months ended January 31, 2016 | Year ended July 31, 2015 | Six months ended January 31, 2016 | Year ended July 31, 2015 |
| Class A | | | | |
| Shares sold | 3,298,095 | 3,721,895 | $66,485,360 | $75,431,970 |
| Reinvestment of distributions | 125,818 | 314,662 | 2,487,810 | 5,921,151 |
| Shares redeemed | (1,425,742) | (1,680,428) | (27,626,961) | (32,834,119) |
| Net increase (decrease) | 1,998,171 | 2,356,129 | $41,346,209 | $48,519,002 |
| Class T | | | | |
| Shares sold | 283,133 | 338,629 | $5,336,970 | $6,435,082 |
| Reinvestment of distributions | 29,568 | 122,984 | 549,955 | 2,187,662 |
| Shares redeemed | (138,319) | (182,245) | (2,601,961) | (3,405,237) |
| Net increase (decrease) | 174,382 | 279,368 | $3,284,964 | $5,217,507 |
| Class B | | | | |
| Shares sold | 11,279 | 8,479 | $188,054 | $145,589 |
| Reinvestment of distributions | 1,812 | 10,956 | 29,530 | 172,497 |
| Shares redeemed | (18,502) | (47,549) | (302,796) | (771,428) |
| Net increase (decrease) | (5,411) | (28,114) | $(85,212) | $(453,342) |
| Class C | | | | |
| Shares sold | 2,028,385 | 1,409,357 | $33,764,859 | $23,864,510 |
| Reinvestment of distributions | 66,579 | 157,518 | 1,085,908 | 2,481,906 |
| Shares redeemed | (466,690) | (334,437) | (7,482,901) | (5,460,293) |
| Net increase (decrease) | 1,628,274 | 1,232,438 | $27,367,866 | $20,886,123 |
| Class I | | | | |
| Shares sold | 3,681,488 | 2,162,351 | $78,986,768 | $46,666,847 |
| Reinvestment of distributions | 55,475 | 93,807 | 1,176,667 | 1,886,667 |
| Shares redeemed | (1,399,015) | (1,194,006) | (28,928,478) | (25,608,119) |
| Net increase (decrease) | 2,337,948 | 1,062,152 | $51,234,957 | $22,945,395 |
11. Other.
The Fund's organizational documents provide former and current trustees and officers with a limited indemnification against liabilities arising in connection with the performance of their duties to the Fund. In the normal course of business, the Fund may also enter into contracts that provide general indemnifications. The Fund's maximum exposure under these arrangements is unknown as this would be dependent on future claims that may be made against the Fund. The risk of material loss from such claims is considered remote.
Fidelity Advisor® Electronics Fund
Investment Summary (Unaudited)
Top Ten Stocks as of January 31, 2016
| | % of fund's net assets | % of fund's net assets 6 months ago |
| Avago Technologies Ltd. | 11.1 | 6.1 |
| NXP Semiconductors NV | 8.6 | 0.4 |
| Qualcomm, Inc. | 8.3 | 4.6 |
| Intel Corp. | 8.2 | 15.3 |
| Micron Technology, Inc. | 5.3 | 5.8 |
| Maxim Integrated Products, Inc. | 4.7 | 5.0 |
| ON Semiconductor Corp. | 4.3 | 0.0 |
| Semtech Corp. | 3.9 | 4.5 |
| Marvell Technology Group Ltd. | 3.8 | 4.5 |
| Lam Research Corp. | 3.8 | 2.3 |
| | 62.0 | |
Top Industries (% of fund's net assets)
| As of January 31, 2016 |
| | Semiconductors & Semiconductor Equipment | 75.2% |
| | Technology Hardware, Storage & Peripherals | 8.6% |
| | Communications Equipment | 8.3% |
| | Electronic Equipment & Components | 4.6% |
| | Commercial Services & Supplies | 0.4% |
| | All Others* | 2.9% |

| As of July 31, 2015 |
| | Semiconductors & Semiconductor Equipment | 84.1% |
| | Technology Hardware, Storage & Peripherals | 5.8% |
| | Communications Equipment | 4.6% |
| | Electronic Equipment & Components | 3.4% |
| | Internet Software & Services | 0.6% |
| | All Others* | 1.5% |

* Includes Short-Term investments and Net Other Assets (Liabilities).
Percentages shown as 0.0% may reflect amounts less than 0.05%.
Fidelity Advisor® Electronics Fund
Investments January 31, 2016 (Unaudited)
Showing Percentage of Net Assets
| Common Stocks - 97.1% | | | |
| | | Shares | Value |
| Biotechnology - 0.0% | | | |
| Biotechnology - 0.0% | | | |
| Arrowhead Research Corp. warrants 5/21/17 (a) | | 64,879 | $1 |
| Commercial Services & Supplies - 0.4% | | | |
| Office Services & Supplies - 0.4% | | | |
| West Corp. | | 14,300 | 258,973 |
| Communications Equipment - 8.3% | | | |
| Communications Equipment - 8.3% | | | |
| Qualcomm, Inc. | | 135,126 | 6,126,613 |
| Diversified Telecommunication Services - 0.1% | | | |
| Alternative Carriers - 0.1% | | | |
| Intelsat SA (a) | | 33,200 | 110,888 |
| Electronic Equipment & Components - 4.6% | | | |
| Electronic Equipment & Instruments - 0.4% | | | |
| Keysight Technologies, Inc. (a) | | 10,500 | 245,700 |
| Electronic Manufacturing Services - 4.2% | | | |
| Jabil Circuit, Inc. | | 80,776 | 1,608,250 |
| TTM Technologies, Inc. (a) | | 257,655 | 1,502,129 |
| | | | 3,110,379 |
|
| TOTAL ELECTRONIC EQUIPMENT & COMPONENTS | | | 3,356,079 |
|
| Internet Software & Services - 0.2% | | | |
| Internet Software & Services - 0.2% | | | |
| Rackspace Hosting, Inc. (a) | | 7,600 | 153,596 |
| Semiconductors & Semiconductor Equipment - 74.9% | | | |
| Semiconductor Equipment - 6.7% | | | |
| Amkor Technology, Inc. (a) | | 28,400 | 174,376 |
| Applied Materials, Inc. | | 90,400 | 1,595,560 |
| Lam Research Corp. | | 38,481 | 2,762,551 |
| PDF Solutions, Inc. (a) | | 8,900 | 96,387 |
| SunEdison, Inc. (a) | | 25,200 | 78,876 |
| Xcerra Corp. (a) | | 34,600 | 189,608 |
| | | | 4,897,358 |
| Semiconductors - 68.2% | | | |
| Analog Devices, Inc. | | 10,928 | 588,582 |
| Applied Micro Circuits Corp. (a) | | 44,137 | 245,402 |
| Avago Technologies Ltd. | | 60,900 | 8,142,938 |
| Cavium, Inc. (a) | | 5,200 | 300,404 |
| Cypress Semiconductor Corp. (b) | | 203,800 | 1,601,868 |
| Diodes, Inc. (a) | | 9,000 | 172,170 |
| Exar Corp. (a) | | 32,100 | 176,550 |
| Intel Corp. | | 195,278 | 6,057,524 |
| Intersil Corp. Class A | | 166,937 | 2,170,181 |
| Marvell Technology Group Ltd. | | 319,300 | 2,825,805 |
| Maxim Integrated Products, Inc. | | 102,822 | 3,434,255 |
| Microchip Technology, Inc. | | 36,200 | 1,622,122 |
| Micron Technology, Inc. (a) | | 349,812 | 3,858,426 |
| NVIDIA Corp. | | 30,923 | 905,735 |
| NXP Semiconductors NV (a) | | 84,791 | 6,340,671 |
| ON Semiconductor Corp. (a) | | 368,600 | 3,155,216 |
| Qorvo, Inc. (a) | | 51,300 | 2,031,480 |
| Semtech Corp. (a) | | 143,322 | 2,880,772 |
| Skyworks Solutions, Inc. | | 34,300 | 2,363,956 |
| Texas Instruments, Inc. | | 24,218 | 1,281,859 |
| | | | 50,155,916 |
|
| TOTAL SEMICONDUCTORS & SEMICONDUCTOR EQUIPMENT | | | 55,053,274 |
|
| Technology Hardware, Storage & Peripherals - 8.6% | | | |
| Technology Hardware, Storage & Peripherals - 8.6% | | | |
| Hewlett Packard Enterprise Co. | | 30,500 | 419,680 |
| HP, Inc. | | 191,400 | 1,858,494 |
| Nimble Storage, Inc. (a) | | 36,100 | 237,177 |
| Seagate Technology LLC | | 73,300 | 2,129,365 |
| Western Digital Corp. | | 35,500 | 1,703,290 |
| | | | 6,348,006 |
| TOTAL COMMON STOCKS | | | |
| (Cost $80,652,483) | | | 71,407,430 |
| | | Principal Amount | Value |
|
| Nonconvertible Bonds - 0.3% | | | |
| Semiconductors & Semiconductor Equipment - 0.3% | | | |
| Semiconductors - 0.3% | | | |
Advanced Micro Devices, Inc.:
| | | |
| 7% 7/1/24 | | 215,000 | 133,300 |
| 7.75% 8/1/20 | | 130,000 | 82,550 |
| (Cost $292,458) | | | 215,850 |
| | | Shares | Value |
|
| Money Market Funds - 3.8% | | | |
| Fidelity Cash Central Fund, 0.38% (c) | | 1,311,516 | 1,311,516 |
| Fidelity Securities Lending Cash Central Fund, 0.42% (c)(d) | | 1,450,025 | 1,450,025 |
| TOTAL MONEY MARKET FUNDS | | | |
| (Cost $2,761,541) | | | 2,761,541 |
| TOTAL INVESTMENT PORTFOLIO - 101.2% | | | |
| (Cost $83,706,482) | | | 74,384,821 |
| NET OTHER ASSETS (LIABILITIES) - (1.2)% | | | (855,638) |
| NET ASSETS - 100% | | | $73,529,183 |
Legend
(a) Non-income producing
(b) Security or a portion of the security is on loan at period end.
(c) Affiliated fund that is generally available only to investment companies and other accounts managed by Fidelity Investments. The rate quoted is the annualized seven-day yield of the fund at period end. A complete unaudited listing of the fund's holdings as of its most recent quarter end is available upon request. In addition, each Fidelity Central Fund's financial statements are available on the SEC's website or upon request.
(d) Investment made with cash collateral received from securities on loan.
Affiliated Central Funds
Information regarding fiscal year to date income earned by the Fund from investments in Fidelity Central Funds is as follows:
| Fund | Income earned |
| Fidelity Cash Central Fund | $1,677 |
| Fidelity Securities Lending Cash Central Fund | 16,185 |
| Total | $17,862 |
Investment Valuation
The following is a summary of the inputs used, as of January 31, 2016, involving the Fund's assets and liabilities carried at fair value. The inputs or methodology used for valuing securities may not be an indication of the risk associated with investing in those securities. For more information on valuation inputs, and their aggregation into the levels used below, please refer to the Investment Valuation section in the accompanying Notes to Financial Statements.
| | Valuation Inputs at Reporting Date: |
| Description | Total | Level 1 | Level 2 | Level 3 |
| Investments in Securities: | | | | |
| Common Stocks | $71,407,430 | $71,407,429 | $1 | $-- |
| Nonconvertible Bonds | 215,850 | -- | 215,850 | -- |
| Money Market Funds | 2,761,541 | 2,761,541 | -- | -- |
| Total Investments in Securities: | $74,384,821 | $74,168,970 | $215,851 | $-- |
Other Information
Distribution of investments by country or territory of incorporation, as a percentage of Total Net Assets, is as follows (Unaudited):
| United States of America | 73.5% |
| Singapore | 11.1% |
| Netherlands | 8.6% |
| Bermuda | 3.8% |
| Ireland | 2.9% |
| Others (Individually Less Than 1%) | 0.1% |
| | 100.0% |
See accompanying notes which are an integral part of the financial statements.
Fidelity Advisor® Electronics Fund
Financial Statements
Statement of Assets and Liabilities
| | | January 31, 2016 (Unaudited) |
| Assets | | |
Investment in securities, at value (including securities loaned of $1,470,606) — See accompanying schedule:
Unaffiliated issuers (cost $80,944,941) | $71,623,280 | |
| Fidelity Central Funds (cost $2,761,541) | 2,761,541 | |
| Total Investments (cost $83,706,482) | | $74,384,821 |
| Receivable for investments sold | | 3,247,298 |
| Receivable for fund shares sold | | 82,119 |
| Dividends receivable | | 14,752 |
| Interest receivable | | 7,386 |
| Distributions receivable from Fidelity Central Funds | | 1,618 |
| Prepaid expenses | | 468 |
| Other receivables | | 3,513 |
| Total assets | | 77,741,975 |
| Liabilities | | |
| Payable for investments purchased | $2,396,116 | |
| Payable for fund shares redeemed | 251,470 | |
| Accrued management fee | 36,140 | |
| Distribution and service plan fees payable | 24,328 | |
| Other affiliated payables | 19,066 | |
| Other payables and accrued expenses | 35,647 | |
| Collateral on securities loaned, at value | 1,450,025 | |
| Total liabilities | | 4,212,792 |
| Net Assets | | $73,529,183 |
| Net Assets consist of: | | |
| Paid in capital | | $85,623,100 |
| Distributions in excess of net investment income | | (178,148) |
| Accumulated undistributed net realized gain (loss) on investments and foreign currency transactions | | (2,594,011) |
| Net unrealized appreciation (depreciation) on investments and assets and liabilities in foreign currencies | | (9,321,758) |
| Net Assets | | $73,529,183 |
| Calculation of Maximum Offering Price | | |
| Class A: | | |
| Net Asset Value and redemption price per share ($28,502,356 ÷ 2,184,096 shares) | | $13.05 |
| Maximum offering price per share (100/94.25 of $13.05) | | $13.85 |
| Class T: | | |
| Net Asset Value and redemption price per share ($8,788,289 ÷ 696,945 shares) | | $12.61 |
| Maximum offering price per share (100/96.50 of $12.61) | | $13.07 |
| Class B: | | |
| Net Asset Value and offering price per share ($263,497 ÷ 22,488 shares)(a) | | $11.72 |
| Class C: | | |
| Net Asset Value and offering price per share ($17,554,451 ÷ 1,504,810 shares)(a) | | $11.67 |
| Class I: | | |
| Net Asset Value, offering price and redemption price per share ($18,420,590 ÷ 1,352,954 shares) | | $13.62 |
(a) Redemption price per share is equal to net asset value less any applicable contingent deferred sales charge.
See accompanying notes which are an integral part of the financial statements.
Statement of Operations
| | | Six months ended January 31, 2016 (Unaudited) |
| Investment Income | | |
| Dividends | | $667,708 |
| Interest | | 20,073 |
| Income from Fidelity Central Funds | | 17,862 |
| Total income | | 705,643 |
| Expenses | | |
| Management fee | $232,154 | |
| Transfer agent fees | 102,270 | |
| Distribution and service plan fees | 159,458 | |
| Accounting and security lending fees | 16,762 | |
| Custodian fees and expenses | 43,515 | |
| Independent trustees' compensation | 836 | |
| Registration fees | 52,048 | |
| Audit | 22,738 | |
| Legal | 762 | |
| Miscellaneous | 642 | |
| Total expenses before reductions | 631,185 | |
| Expense reductions | (8,253) | 622,932 |
| Net investment income (loss) | | 82,711 |
| Realized and Unrealized Gain (Loss) | | |
| Net realized gain (loss) on: | | |
| Investment securities: | | |
| Unaffiliated issuers | (1,362,870) | |
| Foreign currency transactions | (1,266) | |
| Total net realized gain (loss) | | (1,364,136) |
Change in net unrealized appreciation (depreciation) on:
Investment securities | (3,293,575) | |
| Assets and liabilities in foreign currencies | 192 | |
| Total change in net unrealized appreciation (depreciation) | | (3,293,383) |
| Net gain (loss) | | (4,657,519) |
| Net increase (decrease) in net assets resulting from operations | | $(4,574,808) |
See accompanying notes which are an integral part of the financial statements.
Statement of Changes in Net Assets
| | Six months ended January 31, 2016 (Unaudited) | Year ended July 31, 2015 |
| Increase (Decrease) in Net Assets | | |
| Operations | | |
| Net investment income (loss) | $82,711 | $168,582 |
| Net realized gain (loss) | (1,364,136) | 10,893,475 |
| Change in net unrealized appreciation (depreciation) | (3,293,383) | (5,873,187) |
| Net increase (decrease) in net assets resulting from operations | (4,574,808) | 5,188,870 |
| Distributions to shareholders from net investment income | (300,749) | (57,407) |
| Distributions to shareholders from net realized gain | (8,936,577) | (377,502) |
| Total distributions | (9,237,326) | (434,909) |
| Share transactions - net increase (decrease) | (18,851,156) | 44,912,905 |
| Redemption fees | 2,581 | 13,381 |
| Total increase (decrease) in net assets | (32,660,709) | 49,680,247 |
| Net Assets | | |
| Beginning of period | 106,189,892 | 56,509,645 |
| End of period (including distributions in excess of net investment income of $178,148 and undistributed net investment income of $39,890, respectively) | $73,529,183 | $106,189,892 |
See accompanying notes which are an integral part of the financial statements.
Financial Highlights — Fidelity Advisor Electronics Fund Class A
| | Six months ended (Unaudited) | Years ended July 31, | | | | |
| January 31, | 2016 | 2015 | 2014 | 2013 | 2012 | 2011 |
| Selected Per–Share Data | | | | | | |
| Net asset value, beginning of period | $15.29 | $13.86 | $10.33 | $8.45 | $8.93 | $7.14 |
| Income from Investment Operations | | | | | | |
| Net investment income (loss)A | .02 | .03 | (.02) | (.01) | (.05) | (.04) |
| Net realized and unrealized gain (loss) | (.71) | 1.48 | 3.55 | 1.89 | (.43) | 1.83 |
| Total from investment operations | (.69) | 1.51 | 3.53 | 1.88 | (.48) | 1.79 |
| Distributions from net investment income | (.05) | (.01) | – | – | – | – |
| Distributions from net realized gain | (1.49) | (.07) | – | – | – | – |
| Total distributions | (1.55)B | (.08) | – | – | – | – |
| Redemption fees added to paid in capitalA,C | – | – | – | – | – | – |
| Net asset value, end of period | $13.05 | $15.29 | $13.86 | $10.33 | $8.45 | $8.93 |
| Total ReturnD,E,F | (4.73)% | 10.85% | 34.17% | 22.25% | (5.38)% | 25.07% |
| Ratios to Average Net AssetsG,H | | | | | | |
| Expenses before reductions | 1.37%I | 1.28% | 1.84% | 2.18% | 1.88% | 1.89% |
| Expenses net of fee waivers, if any | 1.37%I | 1.28% | 1.40% | 1.40% | 1.40% | 1.40% |
| Expenses net of all reductions | 1.36%I | 1.27% | 1.39% | 1.37% | 1.39% | 1.39% |
| Net investment income (loss) | .31%I | .20% | (.16)% | (.07)% | (.53)% | (.40)% |
| Supplemental Data | | | | | | |
| Net assets, end of period (000 omitted) | $28,502 | $38,237 | $16,542 | $5,833 | $6,000 | $7,537 |
| Portfolio turnover rateJ | 228%I | 156% | 156% | 179% | 140% | 166% |
A Calculated based on average shares outstanding during the period.
B Total distributions of $1.55 per share is comprised of distributions from net investment income of $.053 and distributions from net realized gain of $1.494 per share.
C Amount represents less than $.005 per share.
D Total returns for periods of less than one year are not annualized.
E Total returns would have been lower if certain expenses had not been reduced during the applicable periods shown.
F Total returns do not include the effect of the sales charges.
G Fees and expenses of any underlying Fidelity Central Funds are not included in the Fund's expense ratio. The Fund indirectly bears its proportionate share of the expenses of any underlying Fidelity Central Funds.
H Expense ratios reflect operating expenses of the class. Expenses before reductions do not reflect amounts reimbursed by the investment adviser or reductions from brokerage service arrangements or reductions from other expense offset arrangements and do not represent the amount paid by the class during periods when reimbursements or reductions occur. Expenses net of fee waivers reflect expenses after reimbursement by the investment adviser but prior to reductions from brokerage service arrangements or other expense offset arrangements. Expenses net of all reductions represent the net expenses paid by the class.
I Annualized
J Amount does not include the portfolio activity of any underlying Fidelity Central Funds.
See accompanying notes which are an integral part of the financial statements.
Financial Highlights — Fidelity Advisor Electronics Fund Class T
| | Six months ended (Unaudited) | Years ended July 31, | | | | |
| January 31, | 2016 | 2015 | 2014 | 2013 | 2012 | 2011 |
| Selected Per–Share Data | | | | | | |
| Net asset value, beginning of period | $14.81 | $13.45 | $10.05 | $8.24 | $8.73 | $7.00 |
| Income from Investment Operations | | | | | | |
| Net investment income (loss)A | – | (.02) | (.05) | (.03) | (.07) | (.06) |
| Net realized and unrealized gain (loss) | (.69) | 1.44 | 3.45 | 1.84 | (.42) | 1.79 |
| Total from investment operations | (.69) | 1.42 | 3.40 | 1.81 | (.49) | 1.73 |
| Distributions from net investment income | (.04) | – | – | – | – | – |
| Distributions from net realized gain | (1.47) | (.06) | – | – | – | – |
| Total distributions | (1.51) | (.06) | – | – | – | – |
| Redemption fees added to paid in capitalA,B | – | – | – | – | – | – |
| Net asset value, end of period | $12.61 | $14.81 | $13.45 | $10.05 | $8.24 | $8.73 |
| Total ReturnC,D,E | (4.88)% | 10.55% | 33.83% | 21.97% | (5.61)% | 24.71% |
| Ratios to Average Net AssetsF,G | | | | | | |
| Expenses before reductions | 1.71%H | 1.62% | 2.19% | 2.48% | 2.23% | 2.25% |
| Expenses net of fee waivers, if any | 1.65%H | 1.62% | 1.65% | 1.65% | 1.65% | 1.65% |
| Expenses net of all reductions | 1.64%H | 1.61% | 1.64% | 1.62% | 1.64% | 1.64% |
| Net investment income (loss) | .03%H | (.14)% | (.42)% | (.32)% | (.78)% | (.65)% |
| Supplemental Data | | | | | | |
| Net assets, end of period (000 omitted) | $8,788 | $10,826 | $7,144 | $3,756 | $3,909 | $4,476 |
| Portfolio turnover rateI | 228%H | 156% | 156% | 179% | 140% | 166% |
A Calculated based on average shares outstanding during the period.
B Amount represents less than $.005 per share.
C Total returns for periods of less than one year are not annualized.
D Total returns would have been lower if certain expenses had not been reduced during the applicable periods shown.
E Total returns do not include the effect of the sales charges.
F Fees and expenses of any underlying Fidelity Central Funds are not included in the Fund's expense ratio. The Fund indirectly bears its proportionate share of the expenses of any underlying Fidelity Central Funds.
G Expense ratios reflect operating expenses of the class. Expenses before reductions do not reflect amounts reimbursed by the investment adviser or reductions from brokerage service arrangements or reductions from other expense offset arrangements and do not represent the amount paid by the class during periods when reimbursements or reductions occur. Expenses net of fee waivers reflect expenses after reimbursement by the investment adviser but prior to reductions from brokerage service arrangements or other expense offset arrangements. Expenses net of all reductions represent the net expenses paid by the class.
H Annualized
I Amount does not include the portfolio activity of any underlying Fidelity Central Funds.
See accompanying notes which are an integral part of the financial statements.
Financial Highlights — Fidelity Advisor Electronics Fund Class B
| | Six months ended (Unaudited) | Years ended July 31, | | | | |
| January 31, | 2016 | 2015 | 2014 | 2013 | 2012 | 2011 |
| Selected Per–Share Data | | | | | | |
| Net asset value, beginning of period | $13.82 | $12.59 | $9.46 | $7.79 | $8.29 | $6.69 |
| Income from Investment Operations | | | | | | |
| Net investment income (loss)A | (.03) | (.09) | (.10) | (.07) | (.10) | (.09) |
| Net realized and unrealized gain (loss) | (.64) | 1.34 | 3.23 | 1.74 | (.40) | 1.69 |
| Total from investment operations | (.67) | 1.25 | 3.13 | 1.67 | (.50) | 1.60 |
| Distributions from net investment income | (.02) | – | – | – | – | – |
| Distributions from net realized gain | (1.41) | (.02) | – | – | – | – |
| Total distributions | (1.43) | (.02) | – | – | – | – |
| Redemption fees added to paid in capitalA,B | – | – | – | – | – | – |
| Net asset value, end of period | $11.72 | $13.82 | $12.59 | $9.46 | $7.79 | $8.29 |
| Total ReturnC,D,E | (5.07)% | 9.95% | 33.09% | 21.44% | (6.03)% | 23.92% |
| Ratios to Average Net AssetsF,G | | | | | | |
| Expenses before reductions | 2.17%H | 2.11% | 2.68% | 2.95% | 2.70% | 2.76% |
| Expenses net of fee waivers, if any | 2.15%H | 2.10% | 2.15% | 2.15% | 2.15% | 2.15% |
| Expenses net of all reductions | 2.14%H | 2.09% | 2.14% | 2.12% | 2.15% | 2.14% |
| Net investment income (loss) | (.47)%H | (.62)% | (.91)% | (.82)% | (1.29)% | (1.15)% |
| Supplemental Data | | | | | | |
| Net assets, end of period (000 omitted) | $263 | $320 | $392 | $306 | $459 | $691 |
| Portfolio turnover rateI | 228%H | 156% | 156% | 179% | 140% | 166% |
A Calculated based on average shares outstanding during the period.
B Amount represents less than $.005 per share.
C Total returns for periods of less than one year are not annualized.
D Total returns would have been lower if certain expenses had not been reduced during the applicable periods shown.
E Total returns do not include the effect of the contingent deferred sales charge.
F Fees and expenses of any underlying Fidelity Central Funds are not included in the Fund's expense ratio. The Fund indirectly bears its proportionate share of the expenses of any underlying Fidelity Central Funds.
G Expense ratios reflect operating expenses of the class. Expenses before reductions do not reflect amounts reimbursed by the investment adviser or reductions from brokerage service arrangements or reductions from other expense offset arrangements and do not represent the amount paid by the class during periods when reimbursements or reductions occur. Expenses net of fee waivers reflect expenses after reimbursement by the investment adviser but prior to reductions from brokerage service arrangements or other expense offset arrangements. Expenses net of all reductions represent the net expenses paid by the class.
H Annualized
I Amount does not include the portfolio activity of any underlying Fidelity Central Funds.
See accompanying notes which are an integral part of the financial statements.
Financial Highlights — Fidelity Advisor Electronics Fund Class C
| | Six months ended (Unaudited) | Years ended July 31, | | | | |
| January 31, | 2016 | 2015 | 2014 | 2013 | 2012 | 2011 |
| Selected Per–Share Data | | | | | | |
| Net asset value, beginning of period | $13.80 | $12.58 | $9.44 | $7.78 | $8.29 | $6.68 |
| Income from Investment Operations | | | | | | |
| Net investment income (loss)A | (.03) | (.08) | (.10) | (.07) | (.10) | (.09) |
| Net realized and unrealized gain (loss) | (.64) | 1.34 | 3.24 | 1.73 | (.41) | 1.70 |
| Total from investment operations | (.67) | 1.26 | 3.14 | 1.66 | (.51) | 1.61 |
| Distributions from net investment income | (.02) | – | – | – | – | – |
| Distributions from net realized gain | (1.44) | (.04) | – | – | – | – |
| Total distributions | (1.46) | (.04) | – | – | – | – |
| Redemption fees added to paid in capitalA,B | – | – | – | – | – | – |
| Net asset value, end of period | $11.67 | $13.80 | $12.58 | $9.44 | $7.78 | $8.29 |
| Total ReturnC,D,E | (5.08)% | 10.03% | 33.26% | 21.34% | (6.15)% | 24.10% |
| Ratios to Average Net AssetsF,G | | | | | | |
| Expenses before reductions | 2.14%H | 2.06% | 2.60% | 2.93% | 2.65% | 2.70% |
| Expenses net of fee waivers, if any | 2.14%H | 2.06% | 2.15% | 2.15% | 2.15% | 2.15% |
| Expenses net of all reductions | 2.13%H | 2.05% | 2.14% | 2.12% | 2.14% | 2.14% |
| Net investment income (loss) | (.47)%H | (.58)% | (.90)% | (.82)% | (1.28)% | (1.15)% |
| Supplemental Data | | | | | | |
| Net assets, end of period (000 omitted) | $17,554 | $20,864 | $7,381 | $3,157 | $3,721 | $3,836 |
| Portfolio turnover rateI | 228%H | 156% | 156% | 179% | 140% | 166% |
A Calculated based on average shares outstanding during the period.
B Amount represents less than $.005 per share.
C Total returns for periods of less than one year are not annualized.
D Total returns would have been lower if certain expenses had not been reduced during the applicable periods shown.
E Total returns do not include the effect of the contingent deferred sales charge.
F Fees and expenses of any underlying Fidelity Central Funds are not included in the Fund's expense ratio. The Fund indirectly bears its proportionate share of the expenses of any underlying Fidelity Central Funds.
G Expense ratios reflect operating expenses of the class. Expenses before reductions do not reflect amounts reimbursed by the investment adviser or reductions from brokerage service arrangements or reductions from other expense offset arrangements and do not represent the amount paid by the class during periods when reimbursements or reductions occur. Expenses net of fee waivers reflect expenses after reimbursement by the investment adviser but prior to reductions from brokerage service arrangements or other expense offset arrangements. Expenses net of all reductions represent the net expenses paid by the class.
H Annualized
I Amount does not include the portfolio activity of any underlying Fidelity Central Funds.
See accompanying notes which are an integral part of the financial statements.
Financial Highlights — Fidelity Advisor Electronics Fund Class I
| | Six months ended (Unaudited) | Years ended July 31, | | | | |
| January 31, | 2016 | 2015 | 2014 | 2013 | 2012 | 2011 |
| Selected Per–Share Data | | | | | | |
| Net asset value, beginning of period | $15.89 | $14.37 | $10.68 | $8.72 | $9.19 | $7.33 |
| Income from Investment Operations | | | | | | |
| Net investment income (loss)A | .05 | .08 | .01 | .02 | (.02) | (.01) |
| Net realized and unrealized gain (loss) | (.74) | 1.53 | 3.68 | 1.94 | (.45) | 1.87 |
| Total from investment operations | (.69) | 1.61 | 3.69 | 1.96 | (.47) | 1.86 |
| Distributions from net investment income | (.09) | (.02) | – | – | – | – |
| Distributions from net realized gain | (1.49) | (.07) | – | – | – | – |
| Total distributions | (1.58) | (.09) | – | – | – | – |
| Redemption fees added to paid in capitalA,B | – | – | – | – | – | – |
| Net asset value, end of period | $13.62 | $15.89 | $14.37 | $10.68 | $8.72 | $9.19 |
| Total ReturnC,D | (4.52)% | 11.17% | 34.55% | 22.48% | (5.11)% | 25.38% |
| Ratios to Average Net AssetsE,F | | | | | | |
| Expenses before reductions | 1.04%G | .98% | 1.34% | 1.86% | 1.55% | 1.42% |
| Expenses net of fee waivers, if any | 1.04%G | .98% | 1.15% | 1.15% | 1.15% | 1.15% |
| Expenses net of all reductions | 1.02%G | .96% | 1.14% | 1.12% | 1.14% | 1.14% |
| Net investment income (loss) | .64%G | .51% | .10% | .18% | (.28)% | (.15)% |
| Supplemental Data | | | | | | |
| Net assets, end of period (000 omitted) | $18,421 | $35,943 | $25,050 | $2,874 | $3,271 | $1,765 |
| Portfolio turnover rateH | 228%G | 156% | 156% | 179% | 140% | 166% |
A Calculated based on average shares outstanding during the period.
B Amount represents less than $.005 per share.
C Total returns for periods of less than one year are not annualized.
D Total returns would have been lower if certain expenses had not been reduced during the applicable periods shown.
E Fees and expenses of any underlying Fidelity Central Funds are not included in the Fund's expense ratio. The Fund indirectly bears its proportionate share of the expenses of any underlying Fidelity Central Funds.
F Expense ratios reflect operating expenses of the class. Expenses before reductions do not reflect amounts reimbursed by the investment adviser or reductions from brokerage service arrangements or reductions from other expense offset arrangements and do not represent the amount paid by the class during periods when reimbursements or reductions occur. Expenses net of fee waivers reflect expenses after reimbursement by the investment adviser but prior to reductions from brokerage service arrangements or other expense offset arrangements. Expenses net of all reductions represent the net expenses paid by the class.
G Annualized
H Amount does not include the portfolio activity of any underlying Fidelity Central Funds.
See accompanying notes which are an integral part of the financial statements.
Notes to Financial Statements (Unaudited)
For the period ended January 31, 2016
1. Organization.
Fidelity Advisor Electronics Fund (the Fund) is a non-diversified fund of Fidelity Advisor Series VII (the Trust) and is authorized to issue an unlimited number of shares. The Trust is registered under the Investment Company Act of 1940, as amended (the 1940 Act), as an open-end management investment company organized as a Massachusetts business trust. The Fund offers Class A, Class T, Class C and Class I shares, each of which, along with Class B shares, has equal rights as to assets and voting privileges. Class B shares are closed to new accounts and additional purchases, except for exchanges and reinvestments. Each class has exclusive voting rights with respect to matters that affect that class. Class B shares will automatically convert to Class A shares after a holding period of seven years from the initial date of purchase.
During the period, the Board of Trustees approved the conversion of all existing Class B shares into Class A shares, effective on or about July 1, 2016, regardless of the length of times shares have been held.
2. Investments in Fidelity Central Funds.
The Fund invests in Fidelity Central Funds, which are open-end investment companies generally available only to other investment companies and accounts managed by the investment adviser and its affiliates. The Fund's Schedule of Investments lists each of the Fidelity Central Funds held as of period end, if any, as an investment of the Fund, but does not include the underlying holdings of each Fidelity Central Fund. As an Investing Fund, the Fund indirectly bears its proportionate share of the expenses of the underlying Fidelity Central Funds.
The Money Market Central Funds seek preservation of capital and current income and are managed by Fidelity Investments Money Management, Inc. (FIMM), an affiliate of the investment adviser. Annualized expenses of the Money Market Central Funds as of their most recent shareholder report date are less than .005%.
A complete unaudited list of holdings for each Fidelity Central Fund is available upon request or at the Securities and Exchange Commission (the SEC) website at www.sec.gov. In addition, the financial statements of the Fidelity Central Funds are available on the SEC website or upon request.
3. Significant Accounting Policies.
The financial statements have been prepared in conformity with accounting principles generally accepted in the United States of America (GAAP), which require management to make certain estimates and assumptions at the date of the financial statements. Actual results could differ from those estimates. Subsequent events, if any, through the date that the financial statements were issued have been evaluated in the preparation of the financial statements. The following summarizes the significant accounting policies of the Fund:
Investment Valuation. Investments are valued as of 4:00 p.m. Eastern time on the last calendar day of the period. The Board of Trustees (the Board) has delegated the day to day responsibility for the valuation of the Fund's investments to the Fidelity SelectCo, LLC (SelectCo) Fair Value Committee (the Committee). In accordance with valuation policies and procedures approved by the Board, the Fund attempts to obtain prices from one or more third party pricing vendors or brokers to value its investments. When current market prices, quotations or currency exchange rates are not readily available or reliable, investments will be fair valued in good faith by the Committee, in accordance with procedures adopted by the Board. Factors used in determining fair value vary by investment type and may include market or investment specific events, changes in interest rates and credit quality. The frequency with which these procedures are used cannot be predicted and they may be utilized to a significant extent. The Committee oversees the Fund's valuation policies and procedures and reports to the Board on the Committee's activities and fair value determinations. The Board monitors the appropriateness of the procedures used in valuing the Fund's investments and ratifies the fair value determinations of the Committee.
The Fund categorizes the inputs to valuation techniques used to value its investments into a disclosure hierarchy consisting of three levels as shown below:
- Level 1 – quoted prices in active markets for identical investments
- Level 2 – other significant observable inputs (including quoted prices for similar investments, interest rates, prepayment speeds, etc.)
- Level 3 – unobservable inputs (including the Fund's own assumptions based on the best information available)
Valuation techniques used to value the Fund's investments by major category are as follows:
Equity securities, including restricted securities, for which market quotations are readily available, are valued at the last reported sale price or official closing price as reported by a third party pricing vendor on the primary market or exchange on which they are traded and are categorized as Level 1 in the hierarchy. In the event there were no sales during the day or closing prices are not available, securities are valued at the last quoted bid price or may be valued using the last available price and are generally categorized as Level 2 in the hierarchy. For foreign equity securities, when market or security specific events arise, comparisons to the valuation of American Depositary Receipts (ADRs), futures contracts, Exchange-Traded Funds (ETFs) and certain indexes as well as quoted prices for similar securities may be used and would be categorized as Level 2 in the hierarchy. Utilizing these techniques may result in transfers between Level 1 and Level 2. For equity securities, including restricted securities, where observable inputs are limited, assumptions about market activity and risk are used and these securities may be categorized as Level 3 in the hierarchy.
Debt securities, including restricted securities, are valued based on evaluated prices received from third party pricing vendors or from brokers who make markets in such securities. Corporate bonds are valued by pricing vendors who utilize matrix pricing which considers yield or price of bonds of comparable quality, coupon, maturity and type or by broker-supplied prices. When independent prices are unavailable or unreliable, debt securities may be valued utilizing pricing methodologies which consider similar factors that would be used by third party pricing vendors. Debt securities are generally categorized as Level 2 in the hierarchy but may be Level 3 depending on the circumstances.
Investments in open-end mutual funds, including the Fidelity Central Funds, are valued at their closing net asset value (NAV) each business day and are categorized as Level 1 in the hierarchy.
Changes in valuation techniques may result in transfers in or out of an assigned level within the disclosure hierarchy. The aggregate value of investments by input level as of January 31, 2016 is included at the end of the Fund's Schedule of Investments.
Foreign Currency. The Fund may use foreign currency contracts to facilitate transactions in foreign-denominated securities. Gains and losses from these transactions may arise from changes in the value of the foreign currency or if the counterparties do not perform under the contracts' terms.
Foreign-denominated assets, including investment securities, and liabilities are translated into U.S. dollars at the exchange rates at period end. Purchases and sales of investment securities, income and dividends received and expenses denominated in foreign currencies are translated into U.S. dollars at the exchange rate in effect on the transaction date.
The effects of exchange rate fluctuations on investments are included with the net realized and unrealized gain (loss) on investment securities. Other foreign currency transactions resulting in realized and unrealized gain (loss) are disclosed separately.
Investment Transactions and Income. For financial reporting purposes, the Fund's investment holdings and NAV include trades executed through the end of the last business day of the period. The NAV per share for processing shareholder transactions is calculated as of the close of business of the New York Stock Exchange (NYSE), normally 4:00 p.m. Eastern time and includes trades executed through the end of the prior business day. Gains and losses on securities sold are determined on the basis of identified cost and may include proceeds received from litigation. Dividend income is recorded on the ex-dividend date, except for certain dividends from foreign securities where the ex-dividend date may have passed, which are recorded as soon as the Fund is informed of the ex-dividend date. Non-cash dividends included in dividend income, if any, are recorded at the fair market value of the securities received. Income and capital gain distributions from Fidelity Central Funds, if any, are recorded on the ex-dividend date. Distributions received on securities that represent a return of capital or capital gain are recorded as a reduction of cost of investments and/or as a realized gain. Subsequent to ex-dividend date the Fund determines the components of these distributions, based upon receipt of tax filings or other correspondence relating to the underlying investment. Interest income is accrued as earned and includes coupon interest and amortization of premium and accretion of discount on debt securities as applicable. Investment income is recorded net of foreign taxes withheld where recovery of such taxes is uncertain.
Class Allocations and Expenses. Investment income, realized and unrealized capital gains and losses, common expenses of the Fund, and certain fund-level expense reductions, if any, are allocated daily on a pro-rata basis to each class based on the relative net assets of each class to the total net assets of the Fund. Each class differs with respect to transfer agent and distribution and service plan fees incurred. Certain expense reductions may also differ by class. For the reporting period, the allocated portion of income and expenses to each class as a percent of its average net assets may vary due to the timing of recording these transactions in relation to fluctuating net assets of the classes. Expenses directly attributable to a fund are charged to that fund. Expenses attributable to more than one fund are allocated among the respective funds on the basis of relative net assets or other appropriate methods. Expense estimates are accrued in the period to which they relate and adjustments are made when actual amounts are known.
Income Tax Information and Distributions to Shareholders. Each year, the Fund intends to qualify as a regulated investment company under Subchapter M of the Internal Revenue Code, including distributing substantially all of its taxable income and realized gains. As a result, no provision for U.S. Federal income taxes is required. The Fund files a U.S. federal tax return, in addition to state and local tax returns as required. The Fund's federal income tax returns are subject to examination by the Internal Revenue Service (IRS) for a period of three fiscal years after they are filed. State and local tax returns may be subject to examination for an additional fiscal year depending on the jurisdiction. Foreign taxes are provided for based on the Fund's understanding of the tax rules and rates that exist in the foreign markets in which it invests.
Distributions are declared and recorded on the ex-dividend date. Income dividends and capital gain distributions are declared separately for each class. Income and capital gain distributions are determined in accordance with income tax regulations, which may differ from GAAP.
Capital accounts within the financial statements are adjusted for permanent book-tax differences. These adjustments have no impact on net assets or the results of operations. Capital accounts are not adjusted for temporary book-tax differences which will reverse in a subsequent period.
Book-tax differences are primarily due to foreign currency transactions, capital loss carryforwards, market discount and losses deferred to wash sales and excise tax regulations.
The federal tax cost of investment securities and unrealized appreciation (depreciation) as of period end were as follows:
| Gross unrealized appreciation | $1,917,924 |
| Gross unrealized depreciation | (14,024,578) |
| Net unrealized appreciation (depreciation) on securities | $(12,106,654) |
| Tax cost | $86,491,475 |
Short-Term Trading (Redemption) Fees. Shares held by investors in the Fund less than 30 days may have been subject to a redemption fee equal to .75% of the NAV of shares redeemed. All redemption fees, which reduce the proceeds of the shareholder redemption, are retained by the Fund and accounted for as an addition to paid in capital.
4. Purchases and Sales of Investments.
Purchases and sales of securities, other than short-term securities, aggregated $96,637,409 and $125,076,922, respectively.
5. Fees and Other Transactions with Affiliates.
Management Fee. Fidelity SelectCo, LLC (the investment adviser) and its affiliates provide the Fund with investment management related services for which the Fund pays a monthly management fee. The management fee is the sum of an individual fund fee rate that is based on an annual rate of .30% of the Fund's average net assets and an annualized group fee rate that averaged .25% during the period. The group fee rate is based upon the average net assets of all the mutual funds advised by Fidelity Management & Research Company (FMR) and the investment adviser. The group fee rate decreases as assets under management increase and increases as assets under management decrease. For the reporting period, the total annualized management fee rate was .55% of the Fund's average net assets.
Distribution and Service Plan Fees. In accordance with Rule 12b-1 of the 1940 Act, the Fund has adopted separate Distribution and Service Plans for each class of shares. Certain classes pay Fidelity Distributors Corporation (FDC), an affiliate of the investment adviser, separate Distribution and Service Fees, each of which is based on an annual percentage of each class' average net assets. In addition, FDC may pay financial intermediaries for selling shares of the Fund and providing shareholder support services. For the period, the Distribution and Service Fee rates, total fees and amounts retained by FDC were as follows:
| | Distribution
Fee | Service
Fee | Total Fees | Retained
by FDC |
| Class A | - % | .25% | $39,616 | $749 |
| Class T | .25% | .25% | 24,552 | - |
| Class B | .75% | .25% | 1,465 | 1,099 |
| Class C | .75% | .25% | 93,825 | 28,441 |
| | | | $159,458 | $30,289 |
Sales Load. FDC may receive a front-end sales charge of up to 5.75% for selling Class A shares and 3.50% for selling Class T shares, some of which is paid to financial intermediaries for selling shares of the Fund. Depending on the holding period, FDC may receive contingent deferred sales charges levied on Class A, Class T, Class B, and Class C redemptions. The deferred sales charges range from 5.00% to 1.00% for Class B shares, 1.00% for Class C shares, 1.00% for certain purchases of Class A shares and .25% for certain purchases of Class T shares.
For the period, sales charge amounts retained by FDC were as follows:
| | Retained
by FDC |
| Class A | $16,777 |
| Class T | 1,421 |
| Class C(a) | 4,197 |
| | $22,395 |
(a) When Class C shares are initially sold, FDC pays commissions from its own resources to financial intermediaries through which the sales are made.
Transfer Agent Fees. Fidelity Investments Institutional Operations Company, Inc., (FIIOC), an affiliate of the investment adviser, is the transfer, dividend disbursing and shareholder servicing agent for each class of the Fund. FIIOC receives account fees and asset-based fees that vary according to the account size and type of account of the shareholders of the respective classes of the Fund. FIIOC pays for typesetting, printing and mailing of shareholder reports, except proxy statements.
For the period, transfer agent fees for each class were as follows:
| | Amount | % of
Class-Level Average
Net Assets(a) |
| Class A | $39,279 | .25 |
| Class T | 16,744 | .34 |
| Class B | 439 | .30 |
| Class C | 25,865 | .28 |
| Class I | 19,943 | .17 |
| | $102,270 | |
(a) Annualized
Accounting and Security Lending Fees. Fidelity Service Company, Inc. (FSC), an affiliate of the investment adviser, maintains the Fund's accounting records. The accounting fee is based on the level of average net assets for each month. Under a separate contract, FSC administers the security lending program. The security lending fee is based on the number and duration of lending transactions.
Brokerage Commissions. The Fund placed a portion of its portfolio transactions with brokerage firms which are affiliates of the investment adviser. Brokerage commissions are included in net realized gain (loss) and change in net unrealized appreciation (depreciation) in the Statement of Operations. The commissions paid to these affiliated firms were $5,348 for the period.
Interfund Trades. The Fund may purchase from or sell securities to other Fidelity Funds under procedures adopted by the Board. The procedures have been designed to ensure these interfund trades are executed in accordance with Rule 17a-7 of the 1940 Act. Interfund trades are included within the respective purchases and sales amounts shown in the Purchases and Sales of Investments note.
6. Committed Line of Credit.
The Fund participates with other funds managed by the investment adviser or an affiliate in a $4.25 billion credit facility (the "line of credit") to be utilized for temporary or emergency purposes to fund shareholder redemptions or for other short-term liquidity purposes. The Fund has agreed to pay commitment fees on its pro-rata portion of the line of credit, which amounted to $61 and is reflected in Miscellaneous expenses on the Statement of Operations. During the period, the Fund did not borrow on this line of credit.
7. Security Lending.
The Fund lends portfolio securities through a lending agent from time to time in order to earn additional income. On the settlement date of the loan, the Fund receives collateral (in the form of U.S. Treasury obligations, letters of credit and/or cash) against the loaned securities and maintains collateral in an amount not less than 100% of the market value of the loaned securities during the period of the loan. The market value of the loaned securities is determined at the close of business of the Fund and any additional required collateral is delivered to the Fund on the next business day. The Fund or borrower may terminate the loan at any time, and if the borrower defaults on its obligation to return the securities loaned because of insolvency or other reasons, the Fund may apply collateral received from the borrower against the obligation. The Fund may experience delays and costs in recovering the securities loaned. Any cash collateral received is invested in the Fidelity Securities Lending Cash Central Fund. The value of loaned securities and cash collateral at period end are disclosed on the Fund's Statement of Assets and Liabilities. Security lending income represents the income earned on investing cash collateral, less rebates paid to borrowers and any lending agent fees associated with the loan, plus any premium payments received for lending certain types of securities. Security lending income is presented in the Statement of Operations as a component of income from Fidelity Central Funds. Total security lending income during the period amounted to $16,185.
8. Expense Reductions.
The investment adviser voluntarily agreed to reimburse each class to the extent annual operating expenses exceeded certain levels of average net assets as noted in the table below. Some expenses, for example interest expense, including commitment fees, are excluded from this reimbursement.
The following classes were in reimbursement during the period:
| | Expense
Limitations | Reimbursement |
| Class T | 1.65% | $3,028 |
| Class B | 2.15% | 30 |
| | | $3,058 |
Commissions paid to certain brokers with whom the investment adviser, or its affiliates, places trades on behalf of the Fund include an amount in addition to trade execution, which may be rebated back to the Fund to offset certain expenses. This amount totaled $4,893 for the period.
In addition, during the period the investment advisor reimbursed and/ or waived a portion of fund-level operating expenses in the amount of $302.
9. Distributions to Shareholders.
Distributions to shareholders of each class were as follows:
| | Six months ended January 31, 2016 | Year ended July 31, 2015 |
| From net investment income | | |
| Class A | $113,188 | $13,078 |
| Class T | 30,105 | – |
| Class B | 373 | – |
| Class C | 23,745 | – |
| Class I | 133,338 | 44,329 |
| Total | $300,749 | $57,407 |
| From net realized gain | | |
| Class A | $3,392,087 | $128,913 |
| Class T | 1,000,750 | 34,794 |
| Class B | 31,868 | 598 |
| Class C | 2,046,878 | 43,270 |
| Class I | 2,464,994 | 169,927 |
| Total | $8,936,577 | $377,502 |
10. Share Transactions.
Share transactions for each class were as follows and may contain automatic conversions between classes or exchanges between affiliated funds:
| | Shares | Shares | Dollars | Dollars |
| | Six months ended January 31, 2016 | Year ended July 31, 2015 | Six months ended January 31, 2016 | Year ended July 31, 2015 |
| Class A | | | | |
| Shares sold | 409,291 | 2,442,737 | $5,752,867 | $38,016,336 |
| Reinvestment of distributions | 243,337 | 7,644 | 3,248,410 | 119,544 |
| Shares redeemed | (969,254) | (1,143,527) | (13,618,357) | (17,859,819) |
| Net increase (decrease) | (316,626) | 1,306,854 | $(4,617,080) | $20,276,061 |
| Class T | | | | |
| Shares sold | 62,943 | 393,756 | $862,188 | $5,963,896 |
| Reinvestment of distributions | 74,437 | 2,215 | 959,818 | 33,619 |
| Shares redeemed | (171,612) | (195,977) | (2,292,464) | (2,908,278) |
| Net increase (decrease) | (34,232) | 199,994 | $(470,458) | $3,089,237 |
| Class B | | | | |
| Shares sold | 526 | 8,518 | $6,775 | $118,987 |
| Reinvestment of distributions | 2,652 | 39 | 31,733 | 551 |
| Shares redeemed | (3,847) | (16,542) | (48,572) | (232,148) |
| Net increase (decrease) | (669) | (7,985) | $(10,064) | $(112,610) |
| Class C | | | | |
| Shares sold | 238,000 | 1,188,406 | $2,983,314 | $16,685,789 |
| Reinvestment of distributions | 160,178 | 2,732 | 1,907,126 | 38,744 |
| Shares redeemed | (405,734) | (265,701) | (5,084,884) | (3,757,943) |
| Net increase (decrease) | (7,556) | 925,437 | $(194,444) | $12,966,590 |
| Class I | | | | |
| Shares sold | 238,555 | 3,205,885 | $3,563,788 | $51,968,937 |
| Reinvestment of distributions | 135,996 | 10,497 | 1,894,884 | 170,367 |
| Shares redeemed | (1,283,203) | (2,698,476) | (19,017,782) | (43,445,677) |
| Net increase (decrease) | (908,652) | 517,906 | $(13,559,110) | $8,693,627 |
11. Other.
The Fund's organizational documents provide former and current trustees and officers with a limited indemnification against liabilities arising in connection with the performance of their duties to the Fund. In the normal course of business, the Fund may also enter into contracts that provide general indemnifications. The Fund's maximum exposure under these arrangements is unknown as this would be dependent on future claims that may be made against the Fund. The risk of material loss from such claims is considered remote.
Fidelity Advisor® Energy Fund
Investment Summary (Unaudited)
Top Ten Stocks as of January 31, 2016
| | % of fund's net assets | % of fund's net assets 6 months ago |
| Exxon Mobil Corp. | 9.5 | 14.6 |
| Schlumberger Ltd. | 8.3 | 9.5 |
| EOG Resources, Inc. | 6.3 | 6.1 |
| Valero Energy Corp. | 5.2 | 5.2 |
| Cimarex Energy Co. | 4.4 | 3.9 |
| Pioneer Natural Resources Co. | 3.8 | 2.9 |
| Baker Hughes, Inc. | 3.7 | 2.7 |
| Anadarko Petroleum Corp. | 3.7 | 4.5 |
| Diamondback Energy, Inc. | 3.5 | 1.6 |
| Newfield Exploration Co. | 3.4 | 3.9 |
| | 51.8 | |
Top Industries (% of fund's net assets)
| As of January 31, 2016 |
| | Oil, Gas & Consumable Fuels | 76.2% |
| | Energy Equipment & Services | 18.9% |
| | Chemicals | 1.2% |
| | Independent Power and Renewable Electricity Producers | 0.9% |
| | Semiconductors & Semiconductor Equipment | 0.3% |
| | All Others* | 2.5% |

| As of July 31, 2015 |
| | Oil, Gas & Consumable Fuels | 82.1% |
| | Energy Equipment & Services | 15.6% |
| | Independent Power and Renewable Electricity Producers | 1.1% |
| | Chemicals | 0.6% |
| | All Others* | 0.6% |

* Includes Short-Term investments and Net Other Assets (Liabilities).
Fidelity Advisor® Energy Fund
Investments January 31, 2016 (Unaudited)
Showing Percentage of Net Assets
| Common Stocks - 97.5% | | | |
| | | Shares | Value |
| Chemicals - 1.2% | | | |
| Commodity Chemicals - 1.2% | | | |
| LyondellBasell Industries NV Class A | | 108,900 | $8,490,933 |
| Energy Equipment & Services - 18.9% | | | |
| Oil & Gas Drilling - 0.4% | | | |
| Nabors Industries Ltd. | | 179,900 | 1,324,064 |
| Odfjell Drilling A/S (a) | | 567,856 | 354,465 |
| Xtreme Drilling & Coil Services Corp. (a) | | 813,202 | 969,411 |
| | | | 2,647,940 |
| Oil & Gas Equipment & Services - 18.5% | | | |
| Baker Hughes, Inc. | | 587,800 | 25,575,178 |
| Bristow Group, Inc. | | 27,500 | 639,650 |
| Cameron International Corp. (a) | | 285,600 | 18,752,496 |
| Dril-Quip, Inc. (a) | | 141,191 | 8,279,440 |
| Frank's International NV | | 553,200 | 8,093,316 |
| Oceaneering International, Inc. | | 216,273 | 7,320,841 |
| Schlumberger Ltd. | | 789,409 | 57,050,588 |
| Tesco Corp. | | 196,200 | 1,334,160 |
| Total Energy Services, Inc. | | 38,900 | 398,469 |
| | | | 127,444,138 |
|
| TOTAL ENERGY EQUIPMENT & SERVICES | | | 130,092,078 |
|
| Independent Power and Renewable Electricity Producers - 0.9% | | | |
| Independent Power Producers & Energy Traders - 0.2% | | | |
| NRG Yield, Inc. Class C (b) | | 83,000 | 1,098,920 |
| Renewable Electricity - 0.7% | | | |
| NextEra Energy Partners LP | | 184,600 | 4,982,354 |
|
| TOTAL INDEPENDENT POWER AND RENEWABLE ELECTRICITY PRODUCERS | | | 6,081,274 |
|
| Oil, Gas & Consumable Fuels - 76.2% | | | |
| Coal & Consumable Fuels - 0.2% | | | |
| CONSOL Energy, Inc. | | 160,800 | 1,276,752 |
| Integrated Oil & Gas - 13.3% | | | |
| Chevron Corp. | | 215,309 | 18,617,769 |
| Exxon Mobil Corp. | | 840,161 | 65,406,533 |
| Occidental Petroleum Corp. | | 111,900 | 7,702,077 |
| | | | 91,726,379 |
| Oil & Gas Exploration & Production - 48.1% | | | |
| Anadarko Petroleum Corp. | | 648,883 | 25,364,836 |
| Antero Resources Corp. (a)(b) | | 154,500 | 4,197,765 |
| Apache Corp. | | 39,900 | 1,697,346 |
| ARC Resources Ltd. (b) | | 58,100 | 780,943 |
| Bankers Petroleum Ltd. (a) | | 314,900 | 200,058 |
| Cabot Oil & Gas Corp. | | 201,100 | 4,172,825 |
| Canadian Natural Resources Ltd. | | 114,000 | 2,440,474 |
| Carrizo Oil & Gas, Inc. (a) | | 49,800 | 1,351,074 |
| Cimarex Energy Co. | | 323,047 | 30,043,371 |
| Concho Resources, Inc. (a) | | 144,800 | 13,774,824 |
| ConocoPhillips Co. | | 131,500 | 5,139,020 |
| Continental Resources, Inc. (a) | | 53,630 | 1,132,129 |
| Denbury Resources, Inc. | | 200,600 | 312,936 |
| Devon Energy Corp. | | 298,400 | 8,325,360 |
| Diamondback Energy, Inc. | | 320,500 | 24,213,775 |
| Encana Corp. | | 983,200 | 4,316,282 |
| Energen Corp. | | 142,713 | 5,033,488 |
| EOG Resources, Inc. | | 608,586 | 43,221,778 |
| EQT Corp. | | 80,500 | 4,970,070 |
| Evolution Petroleum Corp. | | 42,495 | 198,027 |
| Gran Tierra Energy, Inc. (Canada) (a) | | 343,300 | 784,182 |
| Gulfport Energy Corp. (a) | | 151,200 | 4,467,960 |
| Hess Corp. | | 266,400 | 11,322,000 |
| Memorial Resource Development Corp. (a) | | 1,019,700 | 16,223,427 |
| Newfield Exploration Co. (a) | | 805,500 | 23,415,885 |
| Noble Energy, Inc. | | 582,308 | 18,849,310 |
| Northern Oil & Gas, Inc. (a) | | 234,293 | 773,167 |
| Parsley Energy, Inc. Class A (a) | | 468,000 | 9,013,680 |
| PDC Energy, Inc. (a) | | 360,288 | 20,489,579 |
| Pioneer Natural Resources Co. | | 209,216 | 25,932,323 |
| Rice Energy, Inc. (a) | | 184,900 | 2,157,783 |
| RSP Permian, Inc. (a) | | 218,100 | 5,136,255 |
| Seven Generations Energy Ltd. (a) | | 367,300 | 4,132,092 |
| SM Energy Co. (b) | | 328,402 | 4,591,060 |
| Synergy Resources Corp. (a) | | 546,215 | 3,463,003 |
| TAG Oil Ltd. (a) | | 342,200 | 141,677 |
| Whiting Petroleum Corp. (a) | | 31,600 | 232,260 |
| | | | 332,012,024 |
| Oil & Gas Refining & Marketing - 7.5% | | | |
| Keyera Corp. (b) | | 233,900 | 6,411,421 |
| PBF Energy, Inc. Class A | | 122,700 | 4,293,273 |
| Valero Energy Corp. | | 526,226 | 35,714,959 |
| Western Refining, Inc. | | 75,500 | 2,483,950 |
| World Fuel Services Corp. | | 65,333 | 2,544,720 |
| | | | 51,448,323 |
| Oil & Gas Storage & Transport - 7.1% | | | |
| Buckeye Partners LP | | 5,000 | 291,200 |
| Cheniere Energy Partners LP Holdings LLC | | 164,400 | 2,454,492 |
| Cheniere Energy, Inc. (a) | | 122,100 | 3,669,105 |
| Columbia Pipeline Group, Inc. | | 228,000 | 4,229,400 |
| Enterprise Products Partners LP | | 248,100 | 5,932,071 |
| Gener8 Maritime, Inc. (a) | | 79,800 | 537,054 |
| Golar LNG Ltd. | | 167,300 | 3,115,126 |
| Kinder Morgan, Inc. | | 1,040,000 | 17,108,000 |
| Magellan Midstream Partners LP | | 49,834 | 3,200,838 |
| Phillips 66 Partners LP | | 13,969 | 791,763 |
| Plains All American Pipeline LP | | 95,800 | 2,022,338 |
| Rice Midstream Partners LP | | 117,300 | 1,265,667 |
| Shell Midstream Partners LP | | 117,100 | 4,164,076 |
| | | | 48,781,130 |
|
| TOTAL OIL, GAS & CONSUMABLE FUELS | | | 525,244,608 |
|
| Semiconductors& Semiconductor Equipment - 0.3% | | | |
| Semiconductor Equipment - 0.3% | | | |
| SolarEdge Technologies, Inc. | | 80,800 | 2,284,216 |
| TOTAL COMMON STOCKS | | | |
| (Cost $782,828,800) | | | 672,193,109 |
|
| Money Market Funds - 3.9% | | | |
| Fidelity Cash Central Fund, 0.38% (c) | | 13,838,214 | 13,838,214 |
| Fidelity Securities Lending Cash Central Fund, 0.42% (c)(d) | | 13,171,670 | 13,171,670 |
| TOTAL MONEY MARKET FUNDS | | | |
| (Cost $27,009,884) | | | 27,009,884 |
| TOTAL INVESTMENT PORTFOLIO - 101.4% | | | |
| (Cost $809,838,684) | | | 699,202,993 |
| NET OTHER ASSETS (LIABILITIES) - (1.4)% | | | (9,854,392) |
| NET ASSETS - 100% | | | $689,348,601 |
Legend
(a) Non-income producing
(b) Security or a portion of the security is on loan at period end.
(c) Affiliated fund that is generally available only to investment companies and other accounts managed by Fidelity Investments. The rate quoted is the annualized seven-day yield of the fund at period end. A complete unaudited listing of the fund's holdings as of its most recent quarter end is available upon request. In addition, each Fidelity Central Fund's financial statements are available on the SEC's website or upon request.
(d) Investment made with cash collateral received from securities on loan.
Affiliated Central Funds
Information regarding fiscal year to date income earned by the Fund from investments in Fidelity Central Funds is as follows:
| Fund | Income earned |
| Fidelity Cash Central Fund | $9,640 |
| Fidelity Securities Lending Cash Central Fund | 38,523 |
| Total | $48,163 |
Investment Valuation
The following is a summary of the inputs used, as of January 31, 2016, involving the Fund's assets and liabilities carried at fair value. The inputs or methodology used for valuing securities may not be an indication of the risk associated with investing in those securities. For more information on valuation inputs, and their aggregation into the levels used below, please refer to the Investment Valuation section in the accompanying Notes to Financial Statements.
| | Valuation Inputs at Reporting Date: |
| Description | Total | Level 1 | Level 2 | Level 3 |
| Investments in Securities: | | | | |
| Common Stocks | $672,193,109 | $671,838,644 | $354,465 | $-- |
| Money Market Funds | 27,009,884 | 27,009,884 | -- | -- |
| Total Investments in Securities: | $699,202,993 | $698,848,528 | $354,465 | $-- |
Other Information
Distribution of investments by country or territory of incorporation, as a percentage of Total Net Assets, is as follows (Unaudited):
| United States of America | 85.6% |
| Curacao | 8.3% |
| Canada | 2.9% |
| Netherlands | 2.4% |
| Others (Individually Less Than 1%) | 0.8% |
| | 100.0% |
See accompanying notes which are an integral part of the financial statements.
Fidelity Advisor® Energy Fund
Financial Statements
Statement of Assets and Liabilities
| | | January 31, 2016 (Unaudited) |
| Assets | | |
Investment in securities, at value (including securities loaned of $13,257,503) — See accompanying schedule:
Unaffiliated issuers (cost $782,828,800) | $672,193,109 | |
| Fidelity Central Funds (cost $27,009,884) | 27,009,884 | |
| Total Investments (cost $809,838,684) | | $699,202,993 |
| Receivable for investments sold | | 16,133,984 |
| Receivable for fund shares sold | | 4,044,481 |
| Dividends receivable | | 402,799 |
| Distributions receivable from Fidelity Central Funds | | 15,943 |
| Prepaid expenses | | 3,224 |
| Other receivables | | 29,990 |
| Total assets | | 719,833,414 |
| Liabilities | | |
| Payable for investments purchased | $15,046,939 | |
| Payable for fund shares redeemed | 1,527,756 | |
| Accrued management fee | 289,443 | |
| Distribution and service plan fees payable | 225,325 | |
| Other affiliated payables | 170,014 | |
| Other payables and accrued expenses | 53,666 | |
| Collateral on securities loaned, at value | 13,171,670 | |
| Total liabilities | | 30,484,813 |
| Net Assets | | $689,348,601 |
| Net Assets consist of: | | |
| Paid in capital | | $926,814,258 |
| Distributions in excess of net investment income | | (675,959) |
| Accumulated undistributed net realized gain (loss) on investments and foreign currency transactions | | (126,154,603) |
| Net unrealized appreciation (depreciation) on investments and assets and liabilities in foreign currencies | | (110,635,095) |
| Net Assets | | $689,348,601 |
| Calculation of Maximum Offering Price | | |
| Class A: | | |
| Net Asset Value and redemption price per share ($263,313,918 ÷ 9,944,544 shares) | | $26.48 |
| Maximum offering price per share (100/94.25 of $26.48) | | $28.10 |
| Class T: | | |
| Net Asset Value and redemption price per share ($133,860,722 ÷ 4,937,164 shares) | | $27.11 |
| Maximum offering price per share (100/96.50 of $27.11) | | $28.09 |
| Class B: | | |
| Net Asset Value and offering price per share ($4,982,762 ÷ 204,426 shares)(a) | | $24.37 |
| Class C: | | |
| Net Asset Value and offering price per share ($159,509,219 ÷ 6,510,338 shares)(a) | | $24.50 |
| Class I: | | |
| Net Asset Value, offering price and redemption price per share ($127,681,980 ÷ 4,583,182 shares) | | $27.86 |
(a) Redemption price per share is equal to net asset value less any applicable contingent deferred sales charge.
See accompanying notes which are an integral part of the financial statements.
Statement of Operations
| | | Six months ended January 31, 2016 (Unaudited) |
| Investment Income | | |
| Dividends | | $6,878,495 |
| Income from Fidelity Central Funds | | 48,163 |
| Total income | | 6,926,658 |
| Expenses | | |
| Management fee | $1,990,195 | |
| Transfer agent fees | 924,852 | |
| Distribution and service plan fees | 1,540,232 | |
| Accounting and security lending fees | 129,450 | |
| Custodian fees and expenses | 11,860 | |
| Independent trustees' compensation | 6,916 | |
| Registration fees | 76,319 | |
| Audit | 24,013 | |
| Legal | 4,097 | |
| Miscellaneous | 4,137 | |
| Total expenses before reductions | 4,712,071 | |
| Expense reductions | (29,358) | 4,682,713 |
| Net investment income (loss) | | 2,243,945 |
| Realized and Unrealized Gain (Loss) | | |
| Net realized gain (loss) on: | | |
| Investment securities: | | |
| Unaffiliated issuers | (66,019,287) | |
| Foreign currency transactions | (13,326) | |
| Total net realized gain (loss) | | (66,032,613) |
Change in net unrealized appreciation (depreciation) on:
Investment securities | (43,600,872) | |
| Assets and liabilities in foreign currencies | 3,771 | |
| Total change in net unrealized appreciation (depreciation) | | (43,597,101) |
| Net gain (loss) | | (109,629,714) |
| Net increase (decrease) in net assets resulting from operations | | $(107,385,769) |
See accompanying notes which are an integral part of the financial statements.
Statement of Changes in Net Assets
| | Six months ended January 31, 2016 (Unaudited) | Year ended July 31, 2015 |
| Increase (Decrease) in Net Assets | | |
| Operations | | |
| Net investment income (loss) | $2,243,945 | $4,666,139 |
| Net realized gain (loss) | (66,032,613) | (60,209,572) |
| Change in net unrealized appreciation (depreciation) | (43,597,101) | (212,688,818) |
| Net increase (decrease) in net assets resulting from operations | (107,385,769) | (268,232,251) |
| Distributions to shareholders from net investment income | (3,958,373) | (2,612,091) |
| Distributions to shareholders from net realized gain | – | (36,171,815) |
| Total distributions | (3,958,373) | (38,783,906) |
| Share transactions - net increase (decrease) | 42,742,066 | 190,554,548 |
| Redemption fees | 21,860 | 54,564 |
| Total increase (decrease) in net assets | (68,580,216) | (116,407,045) |
| Net Assets | | |
| Beginning of period | 757,928,817 | 874,335,862 |
| End of period (including distributions in excess of net investment income of $675,959 and undistributed net investment income of $1,038,469, respectively) | $689,348,601 | $757,928,817 |
See accompanying notes which are an integral part of the financial statements.
Financial Highlights — Fidelity Advisor Energy Fund Class A
| | Six months ended (Unaudited) | Years ended July 31, | | | | |
| January 31, | 2016 | 2015 | 2014 | 2013 | 2012 | 2011 |
| Selected Per–Share Data | | | | | | |
| Net asset value, beginning of period | $30.96 | $45.71 | $40.59 | $33.71 | $40.17 | $27.70 |
| Income from Investment Operations | | | | | | |
| Net investment income (loss)A | .11 | .28 | .15 | .23 | .25 | .11 |
| Net realized and unrealized gain (loss) | (4.39) | (12.89) | 7.06 | 6.81 | (6.50) | 12.47 |
| Total from investment operations | (4.28) | (12.61) | 7.21 | 7.04 | (6.25) | 12.58 |
| Distributions from net investment income | (.20) | (.18)B | (.17) | (.16) | (.21) | (.11) |
| Distributions from net realized gain | – | (1.96)B | (1.93) | – | – | – |
| Total distributions | (.20) | (2.14) | (2.09)C | (.16) | (.21) | (.11) |
| Redemption fees added to paid in capitalA,D | – | – | – | – | – | – |
| Net asset value, end of period | $26.48 | $30.96 | $45.71 | $40.59 | $33.71 | $40.17 |
| Total ReturnE,F,G | (13.84)% | (28.92)% | 18.46% | 20.94% | (15.58)% | 45.46% |
| Ratios to Average Net AssetsH,I | | | | | | |
| Expenses before reductions | 1.13%J | 1.12% | 1.12% | 1.16% | 1.17% | 1.16% |
| Expenses net of fee waivers, if any | 1.13%J | 1.12% | 1.12% | 1.16% | 1.17% | 1.16% |
| Expenses net of all reductions | 1.12%J | 1.11% | 1.12% | 1.15% | 1.17% | 1.16% |
| Net investment income (loss) | .78%J | .76% | .36% | .61% | .72% | .30% |
| Supplemental Data | | | | | | |
| Net assets, end of period (000 omitted) | $263,314 | $292,288 | $369,400 | $279,798 | $253,332 | $331,120 |
| Portfolio turnover rateK | 70%J | 61% | 112% | 68% | 88% | 91% |
A Calculated based on average shares outstanding during the period.
B The amounts shown reflect certain reclassifications related to book to tax differences that were made in the year shown.
C Total distributions of $2.09 per share is comprised of distributions from net investment income of $.165 and distributions from net realized gain of $1.929 per share.
D Amount represents less than $.005 per share.
E Total returns for periods of less than one year are not annualized.
F Total returns would have been lower if certain expenses had not been reduced during the applicable periods shown.
G Total returns do not include the effect of the sales charges.
H Fees and expenses of any underlying Fidelity Central Funds are not included in the Fund's expense ratio. The Fund indirectly bears its proportionate share of the expenses of any underlying Fidelity Central Funds.
I Expense ratios reflect operating expenses of the class. Expenses before reductions do not reflect amounts reimbursed by the investment adviser or reductions from brokerage service arrangements or reductions from other expense offset arrangements and do not represent the amount paid by the class during periods when reimbursements or reductions occur. Expenses net of fee waivers reflect expenses after reimbursement by the investment adviser but prior to reductions from brokerage service arrangements or other expense offset arrangements. Expenses net of all reductions represent the net expenses paid by the class.
J Annualized
K Amount does not include the portfolio activity of any underlying Fidelity Central Funds.
See accompanying notes which are an integral part of the financial statements.
Financial Highlights — Fidelity Advisor Energy Fund Class T
| | Six months ended (Unaudited) | Years ended July 31, | | | | |
| January 31, | 2016 | 2015 | 2014 | 2013 | 2012 | 2011 |
| Selected Per–Share Data | | | | | | |
| Net asset value, beginning of period | $31.63 | $46.64 | $41.38 | $34.40 | $41.04 | $28.33 |
| Income from Investment Operations | | | | | | |
| Net investment income (loss)A | .08 | .20 | .06 | .15 | .18 | .03 |
| Net realized and unrealized gain (loss) | (4.49) | (13.18) | 7.21 | 6.95 | (6.65) | 12.75 |
| Total from investment operations | (4.41) | (12.98) | 7.27 | 7.10 | (6.47) | 12.78 |
| Distributions from net investment income | (.11) | (.08)B | (.08) | (.12) | (.17) | (.07) |
| Distributions from net realized gain | – | (1.95)B | (1.93) | – | – | – |
| Total distributions | (.11) | (2.03) | (2.01) | (.12) | (.17) | (.07) |
| Redemption fees added to paid in capitalA,C | – | – | – | – | – | – |
| Net asset value, end of period | $27.11 | $31.63 | $46.64 | $41.38 | $34.40 | $41.04 |
| Total ReturnD,E,F | (13.97)% | (29.09)% | 18.19% | 20.70% | (15.77)% | 45.16% |
| Ratios to Average Net AssetsG,H | | | | | | |
| Expenses before reductions | 1.38%I | 1.36% | 1.34% | 1.36% | 1.38% | 1.37% |
| Expenses net of fee waivers, if any | 1.38%I | 1.35% | 1.34% | 1.36% | 1.38% | 1.37% |
| Expenses net of all reductions | 1.38%I | 1.35% | 1.34% | 1.35% | 1.38% | 1.37% |
| Net investment income (loss) | .53%I | .52% | .14% | .40% | .50% | .09% |
| Supplemental Data | | | | | | |
| Net assets, end of period (000 omitted) | $133,861 | $164,848 | $245,828 | $223,248 | $215,488 | $290,512 |
| Portfolio turnover rateJ | 70%I | 61% | 112% | 68% | 88% | 91% |
A Calculated based on average shares outstanding during the period.
B The amounts shown reflect certain reclassifications related to book to tax differences that were made in the year shown.
C Amount represents less than $.005 per share.
D Total returns for periods of less than one year are not annualized.
E Total returns would have been lower if certain expenses had not been reduced during the applicable periods shown.
F Total returns do not include the effect of the sales charges.
G Fees and expenses of any underlying Fidelity Central Funds are not included in the Fund's expense ratio. The Fund indirectly bears its proportionate share of the expenses of any underlying Fidelity Central Funds.
H Expense ratios reflect operating expenses of the class. Expenses before reductions do not reflect amounts reimbursed by the investment adviser or reductions from brokerage service arrangements or reductions from other expense offset arrangements and do not represent the amount paid by the class during periods when reimbursements or reductions occur. Expenses net of fee waivers reflect expenses after reimbursement by the investment adviser but prior to reductions from brokerage service arrangements or other expense offset arrangements. Expenses net of all reductions represent the net expenses paid by the class.
I Annualized
J Amount does not include the portfolio activity of any underlying Fidelity Central Funds.
See accompanying notes which are an integral part of the financial statements.
Financial Highlights — Fidelity Advisor Energy Fund Class B
| | Six months ended (Unaudited) | Years ended July 31, | | | | |
| January 31, | 2016 | 2015 | 2014 | 2013 | 2012 | 2011 |
| Selected Per–Share Data | | | | | | |
| Net asset value, beginning of period | $28.41 | $42.08 | $37.65 | $31.41 | $37.61 | $26.06 |
| Income from Investment Operations | | | | | | |
| Net investment income (loss)A | –B | (.02) | (.17) | (.05) | (.01) | (.15) |
| Net realized and unrealized gain (loss) | (4.04) | (11.84) | 6.52 | 6.34 | (6.09) | 11.71 |
| Total from investment operations | (4.04) | (11.86) | 6.35 | 6.29 | (6.10) | 11.56 |
| Distributions from net investment income | –B | – | – | (.05) | (.10) | (.01) |
| Distributions from net realized gain | – | (1.81) | (1.92) | – | – | – |
| Total distributions | –B | (1.81) | (1.92) | (.05) | (.10) | (.01) |
| Redemption fees added to paid in capitalA,B | – | – | – | – | – | – |
| Net asset value, end of period | $24.37 | $28.41 | $42.08 | $37.65 | $31.41 | $37.61 |
| Total ReturnC,D,E | (14.21)% | (29.47)% | 17.50% | 20.04% | (16.22)% | 44.38% |
| Ratios to Average Net AssetsF,G | | | | | | |
| Expenses before reductions | 1.91%H | 1.92% | 1.91% | 1.92% | 1.92% | 1.93% |
| Expenses net of fee waivers, if any | 1.91%H | 1.92% | 1.91% | 1.92% | 1.92% | 1.93% |
| Expenses net of all reductions | 1.90%H | 1.92% | 1.91% | 1.91% | 1.92% | 1.92% |
| Net investment income (loss) | - %H,I | (.05)% | (.44)% | (.15)% | (.03)% | (.46)% |
| Supplemental Data | | | | | | |
| Net assets, end of period (000 omitted) | $4,983 | $8,163 | $17,432 | $20,551 | $28,558 | $49,793 |
| Portfolio turnover rateJ | 70%H | 61% | 112% | 68% | 88% | 91% |
A Calculated based on average shares outstanding during the period.
B Amount represents less than $.005 per share.
C Total returns for periods of less than one year are not annualized.
D Total returns would have been lower if certain expenses had not been reduced during the applicable periods shown.
E Total returns do not include the effect of the contingent deferred sales charge.
F Fees and expenses of any underlying Fidelity Central Funds are not included in the Fund's expense ratio. The Fund indirectly bears its proportionate share of the expenses of any underlying Fidelity Central Funds.
G Expense ratios reflect operating expenses of the class. Expenses before reductions do not reflect amounts reimbursed by the investment adviser or reductions from brokerage service arrangements or reductions from other expense offset arrangements and do not represent the amount paid by the class during periods when reimbursements or reductions occur. Expenses net of fee waivers reflect expenses after reimbursement by the investment adviser but prior to reductions from brokerage service arrangements or other expense offset arrangements. Expenses net of all reductions represent the net expenses paid by the class.
H Annualized
I Amount represents less than .005%.
J Amount does not include the portfolio activity of any underlying Fidelity Central Funds.
See accompanying notes which are an integral part of the financial statements.
Financial Highlights — Fidelity Advisor Energy Fund Class C
| | Six months ended (Unaudited) | Years ended July 31, | | | | |
| January 31, | 2016 | 2015 | 2014 | 2013 | 2012 | 2011 |
| Selected Per–Share Data | | | | | | |
| Net asset value, beginning of period | $28.58 | $42.40 | $37.92 | $31.63 | $37.88 | $26.25 |
| Income from Investment Operations | | | | | | |
| Net investment income (loss)A | .01 | .01 | (.15) | (.04) | (.01) | (.15) |
| Net realized and unrealized gain (loss) | (4.06) | (11.93) | 6.57 | 6.38 | (6.13) | 11.80 |
| Total from investment operations | (4.05) | (11.92) | 6.42 | 6.34 | (6.14) | 11.65 |
| Distributions from net investment income | (.03) | (.03)B | (.01) | (.05) | (.11) | (.02) |
| Distributions from net realized gain | – | (1.88)B | (1.93) | – | – | – |
| Total distributions | (.03) | (1.90)C | (1.94) | (.05) | (.11) | (.02) |
| Redemption fees added to paid in capitalA,D | – | – | – | – | – | – |
| Net asset value, end of period | $24.50 | $28.58 | $42.40 | $37.92 | $31.63 | $37.88 |
| Total ReturnE,F,G | (14.16)% | (29.44)% | 17.57% | 20.08% | (16.22)% | 44.38% |
| Ratios to Average Net AssetsH,I | | | | | | |
| Expenses before reductions | 1.85%J | 1.85% | 1.86% | 1.90% | 1.92% | 1.90% |
| Expenses net of fee waivers, if any | 1.85%J | 1.85% | 1.86% | 1.90% | 1.92% | 1.90% |
| Expenses net of all reductions | 1.84%J | 1.85% | 1.86% | 1.88% | 1.91% | 1.89% |
| Net investment income (loss) | .06%J | .02% | (.38)% | (.13)% | (.03)% | (.43)% |
| Supplemental Data | | | | | | |
| Net assets, end of period (000 omitted) | $159,509 | $162,322 | $130,881 | $99,833 | $93,504 | $133,476 |
| Portfolio turnover rateK | 70%J | 61% | 112% | 68% | 88% | 91% |
A Calculated based on average shares outstanding during the period.
B The amounts shown reflect certain reclassifications related to book to tax differences that were made in the year shown.
C Total distributions of $1.90 per share is comprised of distributions from net investment income of $.027 and distributions from net realized gain of $1.877 per share.
D Amount represents less than $.005 per share.
E Total returns for periods of less than one year are not annualized.
F Total returns would have been lower if certain expenses had not been reduced during the applicable periods shown.
G Total returns do not include the effect of the contingent deferred sales charge.
H Fees and expenses of any underlying Fidelity Central Funds are not included in the Fund's expense ratio. The Fund indirectly bears its proportionate share of the expenses of any underlying Fidelity Central Funds.
I Expense ratios reflect operating expenses of the class. Expenses before reductions do not reflect amounts reimbursed by the investment adviser or reductions from brokerage service arrangements or reductions from other expense offset arrangements and do not represent the amount paid by the class during periods when reimbursements or reductions occur. Expenses net of fee waivers reflect expenses after reimbursement by the investment adviser but prior to reductions from brokerage service arrangements or other expense offset arrangements. Expenses net of all reductions represent the net expenses paid by the class.
J Annualized
K Amount does not include the portfolio activity of any underlying Fidelity Central Funds.
See accompanying notes which are an integral part of the financial statements.
Financial Highlights — Fidelity Advisor Energy Fund Class I
| | Six months ended (Unaudited) | Years ended July 31, | | | | |
| January 31, | 2016 | 2015 | 2014 | 2013 | 2012 | 2011 |
| Selected Per–Share Data | | | | | | |
| Net asset value, beginning of period | $32.62 | $48.05 | $42.55 | $35.28 | $41.95 | $28.87 |
| Income from Investment Operations | | | | | | |
| Net investment income (loss)A | .16 | .39 | .28 | .35 | .37 | .23 |
| Net realized and unrealized gain (loss) | (4.63) | (13.56) | 7.42 | 7.12 | (6.79) | 12.99 |
| Total from investment operations | (4.47) | (13.17) | 7.70 | 7.47 | (6.42) | 13.22 |
| Distributions from net investment income | (.29) | (.30)B | (.27) | (.20) | (.25) | (.14) |
| Distributions from net realized gain | – | (1.96)B | (1.93) | – | – | – |
| Total distributions | (.29) | (2.26) | (2.20) | (.20) | (.25) | (.14) |
| Redemption fees added to paid in capitalA,C | – | – | – | – | – | – |
| Net asset value, end of period | $27.86 | $32.62 | $48.05 | $42.55 | $35.28 | $41.95 |
| Total ReturnD,E | (13.74)% | (28.73)% | 18.80% | 21.26% | (15.31)% | 45.87% |
| Ratios to Average Net AssetsF,G | | | | | | |
| Expenses before reductions | .86%H | .85% | .85% | .88% | .86% | .86% |
| Expenses net of fee waivers, if any | .86%H | .85% | .85% | .88% | .86% | .86% |
| Expenses net of all reductions | .85%H | .85% | .85% | .86% | .85% | .85% |
| Net investment income (loss) | 1.06%H | 1.02% | .63% | .89% | 1.03% | .60% |
| Supplemental Data | | | | | | |
| Net assets, end of period (000 omitted) | $127,682 | $130,308 | $110,795 | $65,034 | $56,692 | $54,024 |
| Portfolio turnover rateI | 70%H | 61% | 112% | 68% | 88% | 91% |
A Calculated based on average shares outstanding during the period.
B The amounts shown reflect certain reclassifications related to book to tax differences that were made in the year shown.
C Amount represents less than $.005 per share.
D Total returns for periods of less than one year are not annualized.
E Total returns would have been lower if certain expenses had not been reduced during the applicable periods shown.
F Fees and expenses of any underlying Fidelity Central Funds are not included in the Fund's expense ratio. The Fund indirectly bears its proportionate share of the expenses of any underlying Fidelity Central Funds.
G Expense ratios reflect operating expenses of the class. Expenses before reductions do not reflect amounts reimbursed by the investment adviser or reductions from brokerage service arrangements or reductions from other expense offset arrangements and do not represent the amount paid by the class during periods when reimbursements or reductions occur. Expenses net of fee waivers reflect expenses after reimbursement by the investment adviser but prior to reductions from brokerage service arrangements or other expense offset arrangements. Expenses net of all reductions represent the net expenses paid by the class.
H Annualized
I Amount does not include the portfolio activity of any underlying Fidelity Central Funds.
See accompanying notes which are an integral part of the financial statements.
Notes to Financial Statements (Unaudited)
For the period ended January 31, 2016
1. Organization.
Fidelity Advisor Energy Fund (the Fund) is a non-diversified fund of Fidelity Advisor Series VII (the Trust) and is authorized to issue an unlimited number of shares. The Trust is registered under the Investment Company Act of 1940, as amended (the 1940 Act), as an open-end management investment company organized as a Massachusetts business trust. The Fund offers Class A, Class T, Class C and Class I shares, each of which, along with Class B shares, has equal rights as to assets and voting privileges. Class B shares are closed to new accounts and additional purchases, except for exchanges and reinvestments. Each class has exclusive voting rights with respect to matters that affect that class. Class B shares will automatically convert to Class A shares after a holding period of seven years from the initial date of purchase.
During the period, the Board of Trustees approved the conversion of all existing Class B shares into Class A shares, effective on or about July 1, 2016, regardless of the length of times shares have been held.
2. Investments in Fidelity Central Funds.
The Fund invests in Fidelity Central Funds, which are open-end investment companies generally available only to other investment companies and accounts managed by the investment adviser and its affiliates. The Fund's Schedule of Investments lists each of the Fidelity Central Funds held as of period end, if any, as an investment of the Fund, but does not include the underlying holdings of each Fidelity Central Fund. As an Investing Fund, the Fund indirectly bears its proportionate share of the expenses of the underlying Fidelity Central Funds.
The Money Market Central Funds seek preservation of capital and current income and are managed by Fidelity Investments Money Management, Inc. (FIMM), an affiliate of the investment adviser. Annualized expenses of the Money Market Central Funds as of their most recent shareholder report date are less than .005%.
A complete unaudited list of holdings for each Fidelity Central Fund is available upon request or at the Securities and Exchange Commission (the SEC) website at www.sec.gov. In addition, the financial statements of the Fidelity Central Funds are available on the SEC website or upon request.
3. Significant Accounting Policies.
The financial statements have been prepared in conformity with accounting principles generally accepted in the United States of America (GAAP), which require management to make certain estimates and assumptions at the date of the financial statements. Actual results could differ from those estimates. Subsequent events, if any, through the date that the financial statements were issued have been evaluated in the preparation of the financial statements. The following summarizes the significant accounting policies of the Fund:
Investment Valuation. Investments are valued as of 4:00 p.m. Eastern time on the last calendar day of the period. The Board of Trustees (the Board) has delegated the day to day responsibility for the valuation of the Fund's investments to the Fidelity SelectCo, LLC (SelectCo) Fair Value Committee (the Committee). In accordance with valuation policies and procedures approved by the Board, the Fund attempts to obtain prices from one or more third party pricing vendors or brokers to value its investments. When current market prices, quotations or currency exchange rates are not readily available or reliable, investments will be fair valued in good faith by the Committee, in accordance with procedures adopted by the Board. Factors used in determining fair value vary by investment type and may include market or investment specific events. The frequency with which these procedures are used cannot be predicted and they may be utilized to a significant extent. The Committee oversees the Fund's valuation policies and procedures and reports to the Board on the Committee's activities and fair value determinations. The Board monitors the appropriateness of the procedures used in valuing the Fund's investments and ratifies the fair value determinations of the Committee.
The Fund categorizes the inputs to valuation techniques used to value its investments into a disclosure hierarchy consisting of three levels as shown below:
- Level 1 – quoted prices in active markets for identical investments
- Level 2 – other significant observable inputs (including quoted prices for similar investments, interest rates, prepayment speeds, etc.)
- Level 3 – unobservable inputs (including the Fund's own assumptions based on the best information available)
Valuation techniques used to value the Fund's investments by major category are as follows:
Equity securities, including restricted securities, for which market quotations are readily available, are valued at the last reported sale price or official closing price as reported by a third party pricing vendor on the primary market or exchange on which they are traded and are categorized as Level 1 in the hierarchy. In the event there were no sales during the day or closing prices are not available, securities are valued at the last quoted bid price or may be valued using the last available price and are generally categorized as Level 2 in the hierarchy. For foreign equity securities, when market or security specific events arise, comparisons to the valuation of American Depositary Receipts (ADRs), futures contracts, Exchange-Traded Funds (ETFs) and certain indexes as well as quoted prices for similar securities may be used and would be categorized as Level 2 in the hierarchy. Utilizing these techniques may result in transfers between Level 1 and Level 2. For equity securities, including restricted securities, where observable inputs are limited, assumptions about market activity and risk are used and these securities may be categorized as Level 3 in the hierarchy.
Investments in open-end mutual funds, including the Fidelity Central Funds, are valued at their closing net asset value (NAV) each business day and are categorized as Level 1 in the hierarchy.
Changes in valuation techniques may result in transfers in or out of an assigned level within the disclosure hierarchy. The aggregate value of investments by input level as of January 31, 2016 is included at the end of the Fund's Schedule of Investments.
Foreign Currency. The Fund may use foreign currency contracts to facilitate transactions in foreign-denominated securities. Gains and losses from these transactions may arise from changes in the value of the foreign currency or if the counterparties do not perform under the contracts' terms.
Foreign-denominated assets, including investment securities, and liabilities are translated into U.S. dollars at the exchange rates at period end. Purchases and sales of investment securities, income and dividends received and expenses denominated in foreign currencies are translated into U.S. dollars at the exchange rate in effect on the transaction date.
The effects of exchange rate fluctuations on investments are included with the net realized and unrealized gain (loss) on investment securities. Other foreign currency transactions resulting in realized and unrealized gain (loss) are disclosed separately.
Investment Transactions and Income. For financial reporting purposes, the Fund's investment holdings and NAV include trades executed through the end of the last business day of the period. The NAV per share for processing shareholder transactions is calculated as of the close of business of the New York Stock Exchange (NYSE), normally 4:00 p.m. Eastern time and includes trades executed through the end of the prior business day. Gains and losses on securities sold are determined on the basis of identified cost and may include proceeds received from litigation. Dividend income is recorded on the ex-dividend date, except for certain dividends from foreign securities where the ex-dividend date may have passed, which are recorded as soon as the Fund is informed of the ex-dividend date. Non-cash dividends included in dividend income, if any, are recorded at the fair market value of the securities received. Income and capital gain distributions from Fidelity Central Funds, if any, are recorded on the ex-dividend date. Distributions received on securities that represent a return of capital or capital gain are recorded as a reduction of cost of investments and/or as a realized gain. Subsequent to ex-dividend date the Fund determines the components of these distributions, based upon receipt of tax filings or other correspondence relating to the underlying investment. Investment income is recorded net of foreign taxes withheld where recovery of such taxes is uncertain.
Class Allocations and Expenses. Investment income, realized and unrealized capital gains and losses, common expenses of the Fund, and certain fund-level expense reductions, if any, are allocated daily on a pro-rata basis to each class based on the relative net assets of each class to the total net assets of the Fund. Each class differs with respect to transfer agent and distribution and service plan fees incurred. Certain expense reductions may also differ by class. For the reporting period, the allocated portion of income and expenses to each class as a percent of its average net assets may vary due to the timing of recording these transactions in relation to fluctuating net assets of the classes. Expenses directly attributable to a fund are charged to that fund. Expenses attributable to more than one fund are allocated among the respective funds on the basis of relative net assets or other appropriate methods. Expense estimates are accrued in the period to which they relate and adjustments are made when actual amounts are known.
Deferred Trustee Compensation. Under a Deferred Compensation Plan (the Plan), independent Trustees may elect to defer receipt of a portion of their annual compensation. Deferred amounts are invested in a cross-section of Fidelity funds, are marked-to-market and remain in the Fund until distributed in accordance with the Plan. The investment of deferred amounts and the offsetting payable to the Trustees are included in the accompanying Statement of Assets and Liabilities.
Income Tax Information and Distributions to Shareholders. Each year, the Fund intends to qualify as a regulated investment company under Subchapter M of the Internal Revenue Code, including distributing substantially all of its taxable income and realized gains. As a result, no provision for U.S. Federal income taxes is required. The Fund files a U.S. federal tax return, in addition to state and local tax returns as required. The Fund's federal income tax returns are subject to examination by the Internal Revenue Service (IRS) for a period of three fiscal years after they are filed. State and local tax returns may be subject to examination for an additional fiscal year depending on the jurisdiction. Foreign taxes are provided for based on the Fund's understanding of the tax rules and rates that exist in the foreign markets in which it invests.
Distributions are declared and recorded on the ex-dividend date. Income dividends and capital gain distributions are declared separately for each class. Income and capital gain distributions are determined in accordance with income tax regulations, which may differ from GAAP.
Capital accounts within the financial statements are adjusted for permanent book-tax differences. These adjustments have no impact on net assets or the results of operations. Capital accounts are not adjusted for temporary book-tax differences which will reverse in a subsequent period.
Book-tax differences are primarily due to foreign currency transactions, passive foreign investment companies (PFIC), partnerships, deferred trustees compensation, capital loss carryforwards and losses deferred due to wash sales and excise tax regulations.
The federal tax cost of investment securities and unrealized appreciation (depreciation) as of period end were as follows:
| Gross unrealized appreciation | $32,612,102 |
| Gross unrealized depreciation | (148,719,309) |
| Net unrealized appreciation (depreciation) on securities | $(116,107,207) |
| Tax cost | $815,310,200 |
Capital loss carryforwards are only available to offset future capital gains of the Fund to the extent provided by regulations and may be limited. Under the Regulated Investment Company Modernization Act of 2010 (the Act), the Fund is permitted to carry forward capital losses incurred in taxable years beginning after December 22, 2010 for an unlimited period and such capital losses are required to be used prior to any losses that expire. The capital loss carryforward information presented below, including any applicable limitation, is estimated as of prior fiscal period end and is subject to adjustment.
| No expiration | |
| Short-term | $(2,928,505) |
The Fund elected to defer to its next fiscal year approximately $50,491,927 of capital losses recognized during the period November 1, 2014 to July 31, 2015.
Short-Term Trading (Redemption) Fees. Shares held by investors in the Fund less than 30 days may have been subject to a redemption fee equal to .75% of the NAV of shares redeemed. All redemption fees, which reduce the proceeds of the shareholder redemption, are retained by the Fund and accounted for as an addition to paid in capital.
4. Purchases and Sales of Investments.
Purchases and sales of securities, other than short-term securities, aggregated $282,153,097 and $253,644,273, respectively.
5. Fees and Other Transactions with Affiliates.
Management Fee. Fidelity SelectCo, LLC (the investment adviser) and its affiliates provide the Fund with investment management related services for which the Fund pays a monthly management fee. The management fee is the sum of an individual fund fee rate that is based on an annual rate of .30% of the Fund's average net assets and an annualized group fee rate that averaged .25% during the period. The group fee rate is based upon the average net assets of all the mutual funds advised by Fidelity Management & Research Company (FMR) and the investment adviser. The group fee rate decreases as assets under management increase and increases as assets under management decrease. For the reporting period, the total annualized management fee rate was .55% of the Fund's average net assets.
Distribution and Service Plan Fees. In accordance with Rule 12b-1 of the 1940 Act, the Fund has adopted separate Distribution and Service Plans for each class of shares. Certain classes pay Fidelity Distributors Corporation (FDC), an affiliate of the investment adviser, separate Distribution and Service Fees, each of which is based on an annual percentage of each class' average net assets. In addition, FDC may pay financial intermediaries for selling shares of the Fund and providing shareholder support services. For the period, the Distribution and Service Fee rates, total fees and amounts retained by FDC were as follows:
| | Distribution
Fee | Service
Fee | Total Fees | Retained
by FDC |
| Class A | -% | .25% | $346,353 | $26,091 |
| Class T | .25% | .25% | 374,470 | – |
| Class B | .75% | .25% | 32,665 | 24,499 |
| Class C | .75% | .25% | 786,744 | 387,169 |
| | | | $1,540,232 | $437,759 |
Sales Load. FDC may receive a front-end sales charge of up to 5.75% for selling Class A shares and 3.50% for selling Class T shares, some of which is paid to financial intermediaries for selling shares of the Fund. Depending on the holding period, FDC may receive contingent deferred sales charges levied on Class A, Class T, Class B, and Class C redemptions. The deferred sales charges range from 5.00% to 1.00% for Class B shares, 1.00% for Class C shares, 1.00% for certain purchases of Class A shares and .25% for certain purchases of Class T shares.
For the period, sales charge amounts retained by FDC were as follows:
| | Retained
by FDC |
| Class A | $104,562 |
| Class T | 16,381 |
| Class B(a) | 1,343 |
| Class C(a) | 40,150 |
| | $162,436 |
(a) When Class B and Class C shares are initially sold, FDC pays commissions from its own resources to financial intermediaries through which the sales are made.
Transfer Agent Fees. Fidelity Investments Institutional Operations Company, Inc., (FIIOC), an affiliate of the investment adviser, is the transfer, dividend disbursing and shareholder servicing agent for each class of the Fund. FIIOC receives account fees and asset-based fees that vary according to the account size and type of account of the shareholders of the respective classes of the Fund. FIIOC pays for typesetting, printing and mailing of shareholder reports, except proxy statements.
For the period, transfer agent fees for each class were as follows:
| | Amount | % of
Class-Level Average
Net Assets(a) |
| Class A | $366,166 | .26 |
| Class T | 201,372 | .27 |
| Class B | 9,774 | .30 |
| Class C | 187,105 | .24 |
| Class I | 160,435 | .24 |
| | $924,852 | |
(a) Annualized
Accounting and Security Lending Fees. Fidelity Service Company, Inc. (FSC), an affiliate of the investment adviser, maintains the Fund's accounting records. The accounting fee is based on the level of average net assets for each month. Under a separate contract, FSC administers the security lending program. The security lending fee is based on the number and duration of lending transactions.
Brokerage Commissions. The Fund placed a portion of its portfolio transactions with brokerage firms which are affiliates of the investment adviser. Brokerage commissions are included in net realized gain (loss) and change in net unrealized appreciation (depreciation) in the Statement of Operations. The commissions paid to these affiliated firms were $5,983 for the period.
Interfund Trades. The Fund may purchase from or sell securities to other Fidelity Funds under procedures adopted by the Board. The procedures have been designed to ensure these interfund trades are executed in accordance with Rule 17a-7 of the 1940 Act. Interfund trades are included within the respective purchases and sales amounts shown in the Purchases and Sales of Investments note.
6. Committed Line of Credit.
The Fund participates with other funds managed by the investment adviser or an affiliate in a $4.25 billion credit facility (the "line of credit") to be utilized for temporary or emergency purposes to fund shareholder redemptions or for other short-term liquidity purposes. The Fund has agreed to pay commitment fees on its pro-rata portion of the line of credit, which amounted to $502 and is reflected in Miscellaneous expenses on the Statement of Operations. During the period, the Fund did not borrow on this line of credit.
7. Security Lending.
The Fund lends portfolio securities through a lending agent from time to time in order to earn additional income. On the settlement date of the loan, the Fund receives collateral (in the form of U.S. Treasury obligations, letters of credit and/or cash) against the loaned securities and maintains collateral in an amount not less than 100% of the market value of the loaned securities during the period of the loan. The market value of the loaned securities is determined at the close of business of the Fund and any additional required collateral is delivered to the Fund on the next business day. The Fund or borrower may terminate the loan at any time, and if the borrower defaults on its obligation to return the securities loaned because of insolvency or other reasons, the Fund may apply collateral received from the borrower against the obligation. The Fund may experience delays and costs in recovering the securities loaned. Any cash collateral received is invested in Fidelity Securities Lending Cash Central Fund. The value of loaned securities and cash collateral at period end are disclosed on the Fund's Statement of Assets and Liabilities. Security lending income represents the income earned on investing cash collateral, less rebates paid to borrowers and any lending agent fees associated with the loan, plus any premium payments received for lending certain types of securities. Security lending income is presented in the Statement of Operations as a component of income from Fidelity Central Funds. Total security lending income during the period amounted to $38,523.
8. Expense Reductions.
Commissions paid to certain brokers with whom the investment adviser, or its affiliates, places trades on behalf of the Fund include an amount in addition to trade execution, which may be rebated back to the Fund to offset certain expenses. This amount totaled $26,805 for the period. In addition, through arrangements with the Fund's custodian, credits realized as a result of certain uninvested cash balances were used to reduce the Fund's expenses. During the period, these credits reduced the Fund's custody expenses by $20.
In addition, during the period the investment adviser reimbursed and/or waived a portion of fund-level operating expenses in the amount of $2,533.
9. Distributions to Shareholders.
Distributions to shareholders of each class were as follows:
| | Six months ended January 31, 2016 | Year ended July 31, 2015 |
| From net investment income | | |
| Class A | $1,922,249 | $1,364,001 |
| Class T | 529,063 | 410,584 |
| Class B | 897 | – |
| Class C | 204,569 | 97,069 |
| Class I | 1,301,595 | 740,437 |
| Total | $3,958,373 | $2,612,091 |
| From net realized gain | | |
| Class A | $– | $14,838,103 |
| Class T | – | 10,229,565 |
| Class B | – | 735,058 |
| Class C | – | 5,981,735 |
| Class I | – | 4,387,354 |
| Total | $– | $36,171,815 |
10. Share Transactions.
Share transactions for each class were as follows and may contain automatic conversions between classes or exchanges between affiliated funds:
| | Shares | Shares | Dollars | Dollars |
| | Six months ended January 31, 2016 | Year ended July 31, 2015 | Six months ended January 31, 2016 | Year ended July 31, 2015 |
| Class A | | | | |
| Shares sold | 2,392,577 | 4,817,511 | $67,714,007 | $172,397,292 |
| Reinvestment of distributions | 66,473 | 346,427 | 1,828,265 | 15,023,137 |
| Shares redeemed | (1,955,755) | (3,804,502) | (55,983,680) | (141,434,625) |
| Net increase (decrease) | 503,295 | 1,359,436 | $13,558,592 | $45,985,804 |
| Class T | | | | |
| Shares sold | 399,804 | 895,677 | $11,569,886 | $32,882,150 |
| Reinvestment of distributions | 18,369 | 229,140 | 510,908 | 10,214,195 |
| Shares redeemed | (692,858) | (1,183,564) | (20,171,378) | (44,251,675) |
| Net increase (decrease) | (274,685) | (58,747) | $(8,090,584) | $(1,155,330) |
| Class B | | | | |
| Shares sold | 2,751 | 43,535 | $72,566 | $1,451,766 |
| Reinvestment of distributions | 35 | 16,323 | 864 | 661,892 |
| Shares redeemed | (85,705) | (186,733) | (2,272,984) | (6,263,061) |
| Net increase (decrease) | (82,919) | (126,875) | $(2,199,554) | $(4,149,403) |
| Class C | | | | |
| Shares sold | 1,835,043 | 3,704,544 | $47,035,371 | $122,458,966 |
| Reinvestment of distributions | 7,392 | 130,140 | 181,396 | 5,288,652 |
| Shares redeemed | (1,011,446) | (1,241,801) | (26,564,955) | (41,167,367) |
| Net increase (decrease) | 830,989 | 2,592,883 | $20,651,812 | $86,580,251 |
| Class I | | | | |
| Shares sold | 2,310,144 | 3,563,036 | $69,257,814 | $133,557,103 |
| Reinvestment of distributions | 40,692 | 99,377 | 1,182,189 | 4,498,001 |
| Shares redeemed | (1,762,926) | (1,973,125) | (51,618,203) | (74,761,878) |
| Net increase (decrease) | 587,910 | 1,689,288 | $18,821,800 | $63,293,226 |
11. Other.
The Fund's organizational documents provide former and current trustees and officers with a limited indemnification against liabilities arising in connection with the performance of their duties to the Fund. In the normal course of business, the Fund may also enter into contracts that provide general indemnifications. The Fund's maximum exposure under these arrangements is unknown as this would be dependent on future claims that may be made against the Fund. The risk of material loss from such claims is considered remote.
Fidelity Advisor® Financial Services Fund
Investment Summary (Unaudited)
Top Ten Stocks as of January 31, 2016
| | % of fund's net assets | % of fund's net assets 6 months ago |
| Berkshire Hathaway, Inc. Class B | 5.4 | 4.8 |
| JPMorgan Chase & Co. | 5.2 | 5.0 |
| Bank of America Corp. | 5.0 | 5.0 |
| Citigroup, Inc. | 4.9 | 5.0 |
| U.S. Bancorp | 3.8 | 4.1 |
| Chubb Ltd. | 3.8 | 2.6 |
| Wells Fargo & Co. | 3.7 | 3.8 |
| American Tower Corp. | 3.5 | 3.3 |
| Capital One Financial Corp. | 3.1 | 3.8 |
| Allstate Corp. | 2.6 | 2.3 |
| | 41.0 | |
Top Industries (% of fund's net assets)
| As of January 31, 2016 |
| | Banks | 28.5% |
| | Real Estate Investment Trusts | 17.1% |
| | Insurance | 16.3% |
| | Capital Markets | 8.0% |
| | Diversified Financial Services | 7.8% |
| | All Others* | 22.3% |

| As of July 31, 2015 |
| | Banks | 30.5% |
| | Real Estate Investment Trusts | 13.4% |
| | Insurance | 12.8% |
| | Capital Markets | 10.9% |
| | Diversified Financial Services | 9.0% |
| | All Others* | 23.4% |

* Includes Short-Term investments and Net Other Assets (Liabilities).
Fidelity Advisor® Financial Services Fund
Investments January 31, 2016 (Unaudited)
Showing Percentage of Net Assets
| Common Stocks - 95.0% | | | |
| | | Shares | Value |
| Banks - 28.5% | | | |
| Diversified Banks - 23.5% | | | |
| Bank of America Corp. | | 736,556 | $10,414,902 |
| Citigroup, Inc. | | 240,165 | 10,226,226 |
| Comerica, Inc. | | 54,219 | 1,859,712 |
| JPMorgan Chase & Co. | | 183,831 | 10,937,945 |
| U.S. Bancorp | | 197,908 | 7,928,194 |
| Wells Fargo & Co. | | 153,748 | 7,722,762 |
| | | | 49,089,741 |
| Regional Banks - 5.0% | | | |
| CoBiz, Inc. | | 83,491 | 917,566 |
| Huntington Bancshares, Inc. | | 183,600 | 1,575,288 |
| M&T Bank Corp. | | 29,400 | 3,239,292 |
| Popular, Inc. | | 52,200 | 1,312,308 |
| SunTrust Banks, Inc. | | 90,000 | 3,292,200 |
| | | | 10,336,654 |
|
| TOTAL BANKS | | | 59,426,395 |
|
| Capital Markets - 8.0% | | | |
| Asset Management & Custody Banks - 5.7% | | | |
| Affiliated Managers Group, Inc. (a) | | 13,754 | 1,845,649 |
| Artisan Partners Asset Management, Inc. | | 59,300 | 1,856,090 |
| Invesco Ltd. | | 100,738 | 3,015,088 |
| Northern Trust Corp. | | 41,000 | 2,545,280 |
| Oaktree Capital Group LLC Class A | | 37,600 | 1,645,376 |
| The Blackstone Group LP | | 36,365 | 955,309 |
| | | | 11,862,792 |
| Investment Banking & Brokerage - 2.3% | | | |
| E*TRADE Financial Corp. (a) | | 82,400 | 1,941,344 |
| Goldman Sachs Group, Inc. | | 17,950 | 2,900,002 |
| | | | 4,841,346 |
|
| TOTAL CAPITAL MARKETS | | | 16,704,138 |
|
| Consumer Finance - 6.0% | | | |
| Consumer Finance - 6.0% | | | |
| American Express Co. | | 38,400 | 2,054,400 |
| Capital One Financial Corp. | | 99,538 | 6,531,684 |
| OneMain Holdings, Inc. (a) | | 54,900 | 1,451,007 |
| Synchrony Financial (a) | | 87,200 | 2,478,224 |
| | | | 12,515,315 |
| Diversified Consumer Services - 1.2% | | | |
| Specialized Consumer Services - 1.2% | | | |
| H&R Block, Inc. | | 75,200 | 2,560,560 |
| Diversified Financial Services - 7.8% | | | |
| Multi-Sector Holdings - 5.4% | | | |
| Berkshire Hathaway, Inc. Class B (a) | | 86,169 | 11,182,149 |
| Specialized Finance - 2.4% | | | |
| IntercontinentalExchange, Inc. | | 19,464 | 5,134,603 |
|
| TOTAL DIVERSIFIED FINANCIAL SERVICES | | | 16,316,752 |
|
| Insurance - 16.3% | | | |
| Insurance Brokers - 3.8% | | | |
| Brown & Brown, Inc. | | 107,900 | 3,263,975 |
| Marsh & McLennan Companies, Inc. | | 85,500 | 4,559,715 |
| | | | 7,823,690 |
| Life & Health Insurance - 2.4% | | | |
| Principal Financial Group, Inc. | | 20,900 | 794,200 |
| Torchmark Corp. | | 79,180 | 4,302,641 |
| | | | 5,096,841 |
| Property & Casualty Insurance - 10.1% | | | |
| Allied World Assurance Co. Holdings AG | | 81,400 | 2,978,426 |
| Allstate Corp. | | 90,490 | 5,483,694 |
| Chubb Ltd. | | 69,657 | 7,876,117 |
| FNF Group | | 144,750 | 4,687,005 |
| | | | 21,025,242 |
|
| TOTAL INSURANCE | | | 33,945,773 |
|
| IT Services - 5.7% | | | |
| Data Processing & Outsourced Services - 5.7% | | | |
| MasterCard, Inc. Class A | | 34,300 | 3,053,729 |
| PayPal Holdings, Inc. (a) | | 36,600 | 1,322,724 |
| The Western Union Co. | | 136,700 | 2,438,728 |
| Visa, Inc. Class A | | 66,420 | 4,947,626 |
| | | | 11,762,807 |
| Professional Services - 0.6% | | | |
| Research & Consulting Services - 0.6% | | | |
| Verisk Analytics, Inc. (a) | | 16,000 | 1,168,000 |
| Real Estate Investment Trusts - 17.1% | | | |
| Diversified REITs - 0.4% | | | |
| NorthStar Realty Finance Corp. | | 64,025 | 759,977 |
| Health Care REIT's - 2.0% | | | |
| Ventas, Inc. | | 76,900 | 4,254,108 |
| Mortgage REITs - 2.8% | | | |
| Altisource Residential Corp. Class B | | 134,950 | 1,342,753 |
| American Capital Agency Corp. | | 85,500 | 1,459,485 |
| Redwood Trust, Inc. (b) | | 162,800 | 1,753,356 |
| Two Harbors Investment Corp. | | 166,900 | 1,268,440 |
| | | | 5,824,034 |
| Office REITs - 1.8% | | | |
| Boston Properties, Inc. | | 32,600 | 3,788,446 |
| Residential REITs - 3.3% | | | |
| American Campus Communities, Inc. | | 23,100 | 974,820 |
| Equity Residential (SBI) | | 32,000 | 2,466,880 |
| Essex Property Trust, Inc. | | 6,800 | 1,449,148 |
| UDR, Inc. | | 58,800 | 2,092,692 |
| | | | 6,983,540 |
| Specialized REITs - 6.8% | | | |
| American Tower Corp. | | 76,400 | 7,207,576 |
| Outfront Media, Inc. | | 79,430 | 1,727,603 |
| Public Storage | | 20,400 | 5,172,624 |
| | | | 14,107,803 |
|
| TOTAL REAL ESTATE INVESTMENT TRUSTS | | | 35,717,908 |
|
| Real Estate Management & Development - 2.2% | | | |
| Real Estate Services - 2.2% | | | |
| CBRE Group, Inc. (a) | | 68,487 | 1,915,581 |
| Realogy Holdings Corp. (a) | | 82,000 | 2,689,600 |
| | | | 4,605,181 |
| Thrifts & Mortgage Finance - 0.5% | | | |
| Thrifts & Mortgage Finance - 0.5% | | | |
| MGIC Investment Corp. (a) | | 105,000 | 695,100 |
| Radian Group, Inc. | | 33,700 | 339,022 |
| | | | 1,034,122 |
| Trading Companies & Distributors - 1.1% | | | |
| Trading Companies & Distributors - 1.1% | | | |
| AerCap Holdings NV (a) | | 72,900 | 2,238,759 |
| TOTAL COMMON STOCKS | | | |
| (Cost $212,608,978) | | | 197,995,710 |
|
| Money Market Funds - 6.0% | | | |
| Fidelity Cash Central Fund, 0.38% (c) | | 11,791,184 | 11,791,184 |
| Fidelity Securities Lending Cash Central Fund, 0.42% (c)(d) | | 827,200 | 827,200 |
| TOTAL MONEY MARKET FUNDS | | | |
| (Cost $12,618,384) | | | 12,618,384 |
| TOTAL INVESTMENT PORTFOLIO - 101.0% | | | |
| (Cost $225,227,362) | | | 210,614,094 |
| NET OTHER ASSETS (LIABILITIES) - (1.0)% | | | (2,104,475) |
| NET ASSETS - 100% | | | $208,509,619 |
Legend
(a) Non-income producing
(b) Security or a portion of the security is on loan at period end.
(c) Affiliated fund that is generally available only to investment companies and other accounts managed by Fidelity Investments. The rate quoted is the annualized seven-day yield of the fund at period end. A complete unaudited listing of the fund's holdings as of its most recent quarter end is available upon request. In addition, each Fidelity Central Fund's financial statements are available on the SEC's website or upon request.
(d) Investment made with cash collateral received from securities on loan.
Affiliated Central Funds
Information regarding fiscal year to date income earned by the Fund from investments in Fidelity Central Funds is as follows:
| Fund | Income earned |
| Fidelity Cash Central Fund | $11,391 |
| Fidelity Securities Lending Cash Central Fund | 1,146 |
| Total | $12,537 |
Investment Valuation
All investments are categorized as Level 1 under the Fair Value Hierarchy. The inputs or methodology used for valuing securities may not be an indication of the risk associated with investing in those securities. For more information on valuation inputs please refer to the Investment Valuation section in the accompanying Notes to Financial Statements.
See accompanying notes which are an integral part of the financial statements.
Fidelity Advisor® Financial Services Fund
Financial Statements
Statement of Assets and Liabilities
| | | January 31, 2016 (Unaudited) |
| Assets | | |
Investment in securities, at value (including securities loaned of $809,904) — See accompanying schedule:
Unaffiliated issuers (cost $212,608,978) | $197,995,710 | |
| Fidelity Central Funds (cost $12,618,384) | 12,618,384 | |
| Total Investments (cost $225,227,362) | | $210,614,094 |
| Receivable for investments sold | | 1,453,066 |
| Receivable for fund shares sold | | 178,660 |
| Dividends receivable | | 195,320 |
| Distributions receivable from Fidelity Central Funds | | 3,238 |
| Prepaid expenses | | 914 |
| Other receivables | | 2,492 |
| Total assets | | 212,447,784 |
| Liabilities | | |
| Payable for investments purchased | $2,230,073 | |
| Payable for fund shares redeemed | 619,581 | |
| Accrued management fee | 99,343 | |
| Distribution and service plan fees payable | 76,106 | |
| Other affiliated payables | 54,539 | |
| Other payables and accrued expenses | 31,323 | |
| Collateral on securities loaned, at value | 827,200 | |
| Total liabilities | | 3,938,165 |
| Net Assets | | $208,509,619 |
| Net Assets consist of: | | |
| Paid in capital | | $269,253,632 |
| Distributions in excess of net investment income | | (640,322) |
| Accumulated undistributed net realized gain (loss) on investments and foreign currency transactions | | (45,489,838) |
| Net unrealized appreciation (depreciation) on investments and assets and liabilities in foreign currencies | | (14,613,853) |
| Net Assets | | $208,509,619 |
| Calculation of Maximum Offering Price | | |
| Class A: | | |
| Net Asset Value and redemption price per share ($96,442,461 ÷ 6,841,359 shares) | | $14.10 |
| Maximum offering price per share (100/94.25 of $14.10) | | $14.96 |
| Class T: | | |
| Net Asset Value and redemption price per share ($30,357,074 ÷ 2,169,845 shares) | | $13.99 |
| Maximum offering price per share (100/96.50 of $13.99) | | $14.50 |
| Class B: | | |
| Net Asset Value and offering price per share ($2,470,008 ÷ 183,135 shares)(a) | | $13.49 |
| Class C: | | |
| Net Asset Value and offering price per share ($47,627,592 ÷ 3,569,093 shares)(a) | | $13.34 |
| Class I: | | |
| Net Asset Value, offering price and redemption price per share ($31,612,484 ÷ 2,187,279 shares) | | $14.45 |
(a) Redemption price per share is equal to net asset value less any applicable contingent deferred sales charge.
See accompanying notes which are an integral part of the financial statements.
Statement of Operations
| | | Six months ended January 31, 2016 (Unaudited) |
| Investment Income | | |
| Dividends | | $2,023,941 |
| Income from Fidelity Central Funds | | 12,537 |
| Total income | | 2,036,478 |
| Expenses | | |
| Management fee | $627,763 | |
| Transfer agent fees | 277,993 | |
| Distribution and service plan fees | 470,525 | |
| Accounting and security lending fees | 44,586 | |
| Custodian fees and expenses | 9,056 | |
| Independent trustees' compensation | 2,133 | |
| Registration fees | 51,522 | |
| Audit | 23,544 | |
| Legal | 1,908 | |
| Miscellaneous | 1,198 | |
| Total expenses before reductions | 1,510,228 | |
| Expense reductions | (4,851) | 1,505,377 |
| Net investment income (loss) | | 531,101 |
| Realized and Unrealized Gain (Loss) | | |
| Net realized gain (loss) on: | | |
| Investment securities: | | |
| Unaffiliated issuers | 1,490,169 | |
| Foreign currency transactions | 29,827 | |
| Total net realized gain (loss) | | 1,519,996 |
Change in net unrealized appreciation (depreciation) on:
Investment securities | (38,352,669) | |
| Assets and liabilities in foreign currencies | (508) | |
| Total change in net unrealized appreciation (depreciation) | | (38,353,177) |
| Net gain (loss) | | (36,833,181) |
| Net increase (decrease) in net assets resulting from operations | | $(36,302,080) |
See accompanying notes which are an integral part of the financial statements.
Statement of Changes in Net Assets
| | Six months ended January 31, 2016 (Unaudited) | Year ended July 31, 2015 |
| Increase (Decrease) in Net Assets | | |
| Operations | | |
| Net investment income (loss) | $531,101 | $836,701 |
| Net realized gain (loss) | 1,519,996 | 12,569,347 |
| Change in net unrealized appreciation (depreciation) | (38,353,177) | 5,448,999 |
| Net increase (decrease) in net assets resulting from operations | (36,302,080) | 18,855,047 |
| Distributions to shareholders from net investment income | (957,546) | (1,174,436) |
| Distributions to shareholders from net realized gain | (189,767) | – |
| Total distributions | (1,147,313) | (1,174,436) |
| Share transactions - net increase (decrease) | 12,173,524 | 48,366,952 |
| Redemption fees | 8,377 | 16,144 |
| Total increase (decrease) in net assets | (25,267,492) | 66,063,707 |
| Net Assets | | |
| Beginning of period | 233,777,111 | 167,713,404 |
| End of period (including distributions in excess of net investment income of $640,322 and distributions in excess of net investment income of $213,877, respectively) | $208,509,619 | $233,777,111 |
See accompanying notes which are an integral part of the financial statements.
Financial Highlights — Fidelity Advisor Financial Services Fund Class A
| | Six months ended (Unaudited) | Years ended July 31, | | | | |
| January 31, | 2016 | 2015 | 2014 | 2013 | 2012 | 2011 |
| Selected Per–Share Data | | | | | | |
| Net asset value, beginning of period | $16.53 | $14.97 | $13.41 | $10.18 | $10.06 | $10.35 |
| Income from Investment Operations | | | | | | |
| Net investment income (loss)A | .05 | .10 | .10 | .15 | .07 | (.02) |
| Net realized and unrealized gain (loss) | (2.40) | 1.59B | 1.55 | 3.18 | .06 | (.27) |
| Total from investment operations | (2.35) | 1.69 | 1.65 | 3.33 | .13 | (.29) |
| Distributions from net investment income | (.07) | (.13) | (.08) | (.10) | (.01) | – |
| Distributions from net realized gain | (.01) | – | (.01) | – | – | – |
| Total distributions | (.08) | (.13) | (.09) | (.10) | (.01) | – |
| Redemption fees added to paid in capitalA,C | – | – | – | – | – | – |
| Net asset value, end of period | $14.10 | $16.53 | $14.97 | $13.41 | $10.18 | $10.06 |
| Total ReturnD,E,F | (14.24)% | 11.29%B | 12.39% | 32.99% | 1.34% | (2.80)% |
| Ratios to Average Net AssetsG,H | | | | | | |
| Expenses before reductions | 1.16%I | 1.17% | 1.22% | 1.29% | 1.28% | 1.26% |
| Expenses net of fee waivers, if any | 1.16%I | 1.17% | 1.22% | 1.29% | 1.28% | 1.26% |
| Expenses net of all reductions | 1.16%I | 1.17% | 1.22% | 1.21% | 1.20% | 1.21% |
| Net investment income (loss) | .62%I | .61% | .68% | 1.31% | .72% | (.24)% |
| Supplemental Data | | | | | | |
| Net assets, end of period (000 omitted) | $96,442 | $102,983 | $77,674 | $64,428 | $47,055 | $63,937 |
| Portfolio turnover rateJ | 73%I | 44% | 49% | 288% | 441% | 260% |
A Calculated based on average shares outstanding during the period.
B Net realized and unrealized gain (loss) per share reflects proceeds from litigation which amounted to $.05 per share. Excluding these litigation proceeds, the total return would have been 10.97%.
C Amount represents less than $.005 per share.
D Total returns for periods of less than one year are not annualized.
E Total returns would have been lower if certain expenses had not been reduced during the applicable periods shown.
F Total returns do not include the effect of the sales charges.
G Fees and expenses of any underlying Fidelity Central Funds are not included in the Fund's expense ratio. The Fund indirectly bears its proportionate share of the expenses of any underlying Fidelity Central Funds.
H Expense ratios reflect operating expenses of the class. Expenses before reductions do not reflect amounts reimbursed by the investment adviser or reductions from brokerage service arrangements or reductions from other expense offset arrangements and do not represent the amount paid by the class during periods when reimbursements or reductions occur. Expenses net of fee waivers reflect expenses after reimbursement by the investment adviser but prior to reductions from brokerage service arrangements or other expense offset arrangements. Expenses net of all reductions represent the net expenses paid by the class.
I Annualized
J Amount does not include the portfolio activity of any underlying Fidelity Central Funds.
See accompanying notes which are an integral part of the financial statements.
Financial Highlights — Fidelity Advisor Financial Services Fund Class T
| | Six months ended (Unaudited) | Years ended July 31, | | | | |
| January 31, | 2016 | 2015 | 2014 | 2013 | 2012 | 2011 |
| Selected Per–Share Data | | | | | | |
| Net asset value, beginning of period | $16.41 | $14.86 | $13.31 | $10.11 | $10.01 | $10.32 |
| Income from Investment Operations | | | | | | |
| Net investment income (loss)A | .03 | .05 | .06 | .12 | .04 | (.05) |
| Net realized and unrealized gain (loss) | (2.39) | 1.58B | 1.55 | 3.16 | .06 | (.26) |
| Total from investment operations | (2.36) | 1.63 | 1.61 | 3.28 | .10 | (.31) |
| Distributions from net investment income | (.05) | (.08) | (.05) | (.08) | –C | – |
| Distributions from net realized gain | (.01) | – | (.01) | – | – | – |
| Total distributions | (.06) | (.08) | (.06) | (.08) | –C | – |
| Redemption fees added to paid in capitalA,C | – | – | – | – | – | – |
| Net asset value, end of period | $13.99 | $16.41 | $14.86 | $13.31 | $10.11 | $10.01 |
| Total ReturnD,E,F | (14.39)% | 10.98%B | 12.10% | 32.66% | 1.03% | (3.00)% |
| Ratios to Average Net AssetsG,H | | | | | | |
| Expenses before reductions | 1.45%I | 1.45% | 1.48% | 1.55% | 1.54% | 1.52% |
| Expenses net of fee waivers, if any | 1.45%I | 1.45% | 1.48% | 1.55% | 1.54% | 1.52% |
| Expenses net of all reductions | 1.45%I | 1.45% | 1.48% | 1.47% | 1.45% | 1.47% |
| Net investment income (loss) | .33%I | .33% | .42% | 1.06% | .46% | (.49)% |
| Supplemental Data | | | | | | |
| Net assets, end of period (000 omitted) | $30,357 | $34,314 | $31,596 | $30,576 | $24,367 | $27,037 |
| Portfolio turnover rateJ | 73%I | 44% | 49% | 288% | 441% | 260% |
A Calculated based on average shares outstanding during the period.
B Net realized and unrealized gain (loss) per share reflects proceeds from litigation which amounted to $.05 per share. Excluding these litigation proceeds, the total return would have been 10.66%.
C Amount represents less than $.005 per share.
D Total returns for periods of less than one year are not annualized.
E Total returns would have been lower if certain expenses had not been reduced during the applicable periods shown.
F Total returns do not include the effect of the sales charges.
G Fees and expenses of any underlying Fidelity Central Funds are not included in the Fund's expense ratio. The Fund indirectly bears its proportionate share of the expenses of any underlying Fidelity Central Funds.
H Expense ratios reflect operating expenses of the class. Expenses before reductions do not reflect amounts reimbursed by the investment adviser or reductions from brokerage service arrangements or reductions from other expense offset arrangements and do not represent the amount paid by the class during periods when reimbursements or reductions occur. Expenses net of fee waivers reflect expenses after reimbursement by the investment adviser but prior to reductions from brokerage service arrangements or other expense offset arrangements. Expenses net of all reductions represent the net expenses paid by the class.
I Annualized
J Amount does not include the portfolio activity of any underlying Fidelity Central Funds.
See accompanying notes which are an integral part of the financial statements.
Financial Highlights — Fidelity Advisor Financial Services Fund Class B
| | Six months ended (Unaudited) | Years ended July 31, | | | | |
| January 31, | 2016 | 2015 | 2014 | 2013 | 2012 | 2011 |
| Selected Per–Share Data | | | | | | |
| Net asset value, beginning of period | $15.82 | $14.35 | $12.87 | $9.79 | $9.73 | $10.09 |
| Income from Investment Operations | | | | | | |
| Net investment income (loss)A | (.01) | (.03) | (.01) | .06 | –B | (.10) |
| Net realized and unrealized gain (loss) | (2.30) | 1.52C | 1.49 | 3.06 | .06 | (.26) |
| Total from investment operations | (2.31) | 1.49 | 1.48 | 3.12 | .06 | (.36) |
| Distributions from net investment income | (.01) | (.02) | – | (.04) | – | – |
| Distributions from net realized gain | (.01) | – | – | – | – | – |
| Total distributions | (.02) | (.02) | – | (.04) | – | – |
| Redemption fees added to paid in capitalA,B | – | – | – | – | – | – |
| Net asset value, end of period | $13.49 | $15.82 | $14.35 | $12.87 | $9.79 | $9.73 |
| Total ReturnD,E,F | (14.59)% | 10.41%C | 11.50% | 32.00% | .62% | (3.57)% |
| Ratios to Average Net AssetsG,H | | | | | | |
| Expenses before reductions | 1.97%I | 1.96% | 1.98% | 2.04% | 2.03% | 2.01% |
| Expenses net of fee waivers, if any | 1.97%I | 1.96% | 1.98% | 2.04% | 2.03% | 2.01% |
| Expenses net of all reductions | 1.96%I | 1.96% | 1.98% | 1.97% | 1.94% | 1.96% |
| Net investment income (loss) | (.18)%I | (.18)% | (.08)% | .56% | (.03)% | (.98)% |
| Supplemental Data | | | | | | |
| Net assets, end of period (000 omitted) | $2,470 | $3,831 | $5,540 | $6,511 | $5,745 | $7,480 |
| Portfolio turnover rateJ | 73%I | 44% | 49% | 288% | 441% | 260% |
A Calculated based on average shares outstanding during the period.
B Amount represents less than $.005 per share.
C Net realized and unrealized gain (loss) per share reflects proceeds from litigation which amounted to $.05 per share. Excluding these litigation proceeds, the total return would have been 10.09%.
D Total returns for periods of less than one year are not annualized.
E Total returns would have been lower if certain expenses had not been reduced during the applicable periods shown.
F Total returns do not include the effect of the contingent deferred sales charge.
G Fees and expenses of any underlying Fidelity Central Funds are not included in the Fund's expense ratio. The Fund indirectly bears its proportionate share of the expenses of any underlying Fidelity Central Funds.
H Expense ratios reflect operating expenses of the class. Expenses before reductions do not reflect amounts reimbursed by the investment adviser or reductions from brokerage service arrangements or reductions from other expense offset arrangements and do not represent the amount paid by the class during periods when reimbursements or reductions occur. Expenses net of fee waivers reflect expenses after reimbursement by the investment adviser but prior to reductions from brokerage service arrangements or other expense offset arrangements. Expenses net of all reductions represent the net expenses paid by the class.
I Annualized
J Amount does not include the portfolio activity of any underlying Fidelity Central Funds.
See accompanying notes which are an integral part of the financial statements.
Financial Highlights — Fidelity Advisor Financial Services Fund Class C
| | Six months ended (Unaudited) | Years ended July 31, | | | | |
| January 31, | 2016 | 2015 | 2014 | 2013 | 2012 | 2011 |
| Selected Per–Share Data | | | | | | |
| Net asset value, beginning of period | $15.67 | $14.22 | $12.75 | $9.70 | $9.65 | $10.00 |
| Income from Investment Operations | | | | | | |
| Net investment income (loss)A | (.01) | (.02) | –B | .06 | –B | (.10) |
| Net realized and unrealized gain (loss) | (2.28) | 1.51C | 1.48 | 3.03 | .05 | (.25) |
| Total from investment operations | (2.29) | 1.49 | 1.48 | 3.09 | .05 | (.35) |
| Distributions from net investment income | (.03) | (.04) | (.01) | (.04) | – | – |
| Distributions from net realized gain | (.01) | – | – | – | – | – |
| Total distributions | (.04) | (.04) | (.01) | (.04) | – | – |
| Redemption fees added to paid in capitalA,B | – | – | – | – | – | – |
| Net asset value, end of period | $13.34 | $15.67 | $14.22 | $12.75 | $9.70 | $9.65 |
| Total ReturnD,E,F | (14.63)% | 10.45%C | 11.65% | 31.98% | .52% | (3.50)% |
| Ratios to Average Net AssetsG,H | | | | | | |
| Expenses before reductions | 1.91%I | 1.90% | 1.94% | 2.03% | 2.03% | 2.01% |
| Expenses net of fee waivers, if any | 1.91%I | 1.90% | 1.94% | 2.03% | 2.03% | 2.01% |
| Expenses net of all reductions | 1.90%I | 1.90% | 1.93% | 1.96% | 1.94% | 1.96% |
| Net investment income (loss) | (.12)%I | (.12)% | (.03)% | .57% | (.03)% | (.99)% |
| Supplemental Data | | | | | | |
| Net assets, end of period (000 omitted) | $47,628 | $50,206 | $36,740 | $29,897 | $20,875 | $23,196 |
| Portfolio turnover rateJ | 73%I | 44% | 49% | 288% | 441% | 260% |
A Calculated based on average shares outstanding during the period.
B Amount represents less than $.005 per share.
C Net realized and unrealized gain (loss) per share reflects proceeds from litigation which amounted to $.05 per share. Excluding these litigation proceeds, the total return would have been 10.13%.
D Total returns for periods of less than one year are not annualized.
E Total returns would have been lower if certain expenses had not been reduced during the applicable periods shown.
F Total returns do not include the effect of the contingent deferred sales charge.
G Fees and expenses of any underlying Fidelity Central Funds are not included in the Fund's expense ratio. The Fund indirectly bears its proportionate share of the expenses of any underlying Fidelity Central Funds.
H Expense ratios reflect operating expenses of the class. Expenses before reductions do not reflect amounts reimbursed by the investment adviser or reductions from brokerage service arrangements or reductions from other expense offset arrangements and do not represent the amount paid by the class during periods when reimbursements or reductions occur. Expenses net of fee waivers reflect expenses after reimbursement by the investment adviser but prior to reductions from brokerage service arrangements or other expense offset arrangements. Expenses net of all reductions represent the net expenses paid by the class.
I Annualized
J Amount does not include the portfolio activity of any underlying Fidelity Central Funds.
See accompanying notes which are an integral part of the financial statements.
Financial Highlights — Fidelity Advisor Financial Services Fund Class I
| | Six months ended (Unaudited) | Years ended July 31, | | | | |
| January 31, | 2016 | 2015 | 2014 | 2013 | 2012 | 2011 |
| Selected Per–Share Data | | | | | | |
| Net asset value, beginning of period | $16.94 | $15.34 | $13.73 | $10.42 | $10.28 | $10.55 |
| Income from Investment Operations | | | | | | |
| Net investment income (loss)A | .07 | .15 | .15 | .20 | .10 | .01 |
| Net realized and unrealized gain (loss) | (2.46) | 1.62B | 1.60 | 3.25 | .06 | (.28) |
| Total from investment operations | (2.39) | 1.77 | 1.75 | 3.45 | .16 | (.27) |
| Distributions from net investment income | (.09) | (.17) | (.13) | (.14) | (.02) | – |
| Distributions from net realized gain | (.01) | – | (.01) | – | – | – |
| Total distributions | (.10) | (.17) | (.14) | (.14) | (.02) | – |
| Redemption fees added to paid in capitalA,C | – | – | – | – | – | – |
| Net asset value, end of period | $14.45 | $16.94 | $15.34 | $13.73 | $10.42 | $10.28 |
| Total ReturnD,E | (14.15)% | 11.61%B | 12.85% | 33.45% | 1.61% | (2.56)% |
| Ratios to Average Net AssetsF,G | | | | | | |
| Expenses before reductions | .86%H | .84% | .87% | .96% | .98% | .96% |
| Expenses net of fee waivers, if any | .86%H | .84% | .87% | .96% | .98% | .96% |
| Expenses net of all reductions | .86%H | .84% | .86% | .88% | .89% | .91% |
| Net investment income (loss) | .92%H | .94% | 1.04% | 1.65% | 1.02% | .07% |
| Supplemental Data | | | | | | |
| Net assets, end of period (000 omitted) | $31,612 | $42,443 | $16,164 | $9,275 | $5,596 | $8,162 |
| Portfolio turnover rateI | 73%H | 44% | 49% | 288% | 441% | 260% |
A Calculated based on average shares outstanding during the period.
B Net realized and unrealized gain (loss) per share reflects proceeds from litigation which amounted to $.05 per share. Excluding these litigation proceeds, the total return would have been 11.29%.
C Amount represents less than $.005 per share.
D Total returns for periods of less than one year are not annualized.
E Total returns would have been lower if certain expenses had not been reduced during the applicable periods shown.
F Fees and expenses of any underlying Fidelity Central Funds are not included in the Fund's expense ratio. The Fund indirectly bears its proportionate share of the expenses of any underlying Fidelity Central Funds.
G Expense ratios reflect operating expenses of the class. Expenses before reductions do not reflect amounts reimbursed by the investment adviser or reductions from brokerage service arrangements or reductions from other expense offset arrangements and do not represent the amount paid by the class during periods when reimbursements or reductions occur. Expenses net of fee waivers reflect expenses after reimbursement by the investment adviser but prior to reductions from brokerage service arrangements or other expense offset arrangements. Expenses net of all reductions represent the net expenses paid by the class.
H Annualized
I Amount does not include the portfolio activity of any underlying Fidelity Central Funds.
See accompanying notes which are an integral part of the financial statements.
Notes to Financial Statements (Unaudited)
For the period ended January 31, 2016
1. Organization.
Fidelity Advisor Financial Services Fund (the Fund) is a fund of Fidelity Advisor Series VII (the Trust) and is authorized to issue an unlimited number of shares. The Trust is registered under the Investment Company Act of 1940, as amended (the 1940 Act), as an open-end management investment company organized as a Massachusetts business trust. The Fund offers Class A, Class T, Class C and Class I shares, each of which, along with Class B shares, has equal rights as to assets and voting privileges. Class B shares are closed to new accounts and additional purchases, except for exchanges and reinvestments. Each class has exclusive voting rights with respect to matters that affect that class. Class B shares will automatically convert to Class A shares after a holding period of seven years from the initial date of purchase.
During the period, the Board of Trustees approved the conversion of all existing Class B shares into Class A shares, effective on or about July 1, 2016, regardless of the length of times shares have been held.
2. Investments in Fidelity Central Funds.
The Fund invests in Fidelity Central Funds, which are open-end investment companies generally available only to other investment companies and accounts managed by the investment adviser and its affiliates. The Fund's Schedule of Investments lists each of the Fidelity Central Funds held as of period end, if any, as an investment of the Fund, but does not include the underlying holdings of each Fidelity Central Fund. As an Investing Fund, the Fund indirectly bears its proportionate share of the expenses of the underlying Fidelity Central Funds.
The Money Market Central Funds seek preservation of capital and current income and are managed by Fidelity Investments Money Management, Inc. (FIMM), an affiliate of the investment adviser. Annualized expenses of the Money Market Central Funds as of their most recent shareholder report date are less than .005%.
A complete unaudited list of holdings for each Fidelity Central Fund is available upon request or at the Securities and Exchange Commission (the SEC) website at www.sec.gov. In addition, the financial statements of the Fidelity Central Funds are available on the SEC website or upon request.
3. Significant Accounting Policies.
The financial statements have been prepared in conformity with accounting principles generally accepted in the United States of America (GAAP), which require management to make certain estimates and assumptions at the date of the financial statements. Actual results could differ from those estimates. Subsequent events, if any, through the date that the financial statements were issued have been evaluated in the preparation of the financial statements. The following summarizes the significant accounting policies of the Fund:
Investment Valuation. Investments are valued as of 4:00 p.m. Eastern time on the last calendar day of the period. The Board of Trustees (the Board) has delegated the day to day responsibility for the valuation of the Fund's investments to the Fidelity SelectCo, LLC (SelectCo) Fair Value Committee (the Committee). In accordance with valuation policies and procedures approved by the Board, the Fund attempts to obtain prices from one or more third party pricing vendors or brokers to value its investments. When current market prices, quotations or currency exchange rates are not readily available or reliable, investments will be fair valued in good faith by the Committee, in accordance with procedures adopted by the Board. Factors used in determining fair value vary by investment type and may include market or investment specific events. The frequency with which these procedures are used cannot be predicted and they may be utilized to a significant extent. The Committee oversees the Fund's valuation policies and procedures and reports to the Board on the Committee's activities and fair value determinations. The Board monitors the appropriateness of the procedures used in valuing the Fund's investments and ratifies the fair value determinations of the Committee.
The Fund categorizes the inputs to valuation techniques used to value its investments into a disclosure hierarchy consisting of three levels as shown below:
- Level 1 – quoted prices in active markets for identical investments
- Level 2 – other significant observable inputs (including quoted prices for similar investments, interest rates, prepayment speeds, etc.)
- Level 3 – unobservable inputs (including the Fund's own assumptions based on the best information available)
Valuation techniques used to value the Fund's investments by major category are as follows:
Equity securities, including restricted securities, for which market quotations are readily available, are valued at the last reported sale price or official closing price as reported by a third party pricing vendor on the primary market or exchange on which they are traded and are categorized as Level 1 in the hierarchy. In the event there were no sales during the day or closing prices are not available, securities are valued at the last quoted bid price or may be valued using the last available price and are generally categorized as Level 2 in the hierarchy. For foreign equity securities, when market or security specific events arise, comparisons to the valuation of American Depositary Receipts (ADRs), futures contracts, Exchange-Traded Funds (ETFs) and certain indexes as well as quoted prices for similar securities may be used and would be categorized as Level 2 in the hierarchy. Utilizing these techniques may result in transfers between Level 1 and Level 2. For equity securities, including restricted securities, where observable inputs are limited, assumptions about market activity and risk are used and these securities may be categorized as Level 3 in the hierarchy.
Investments in open-end mutual funds, including the Fidelity Central Funds, are valued at their closing net asset value (NAV) each business day and are categorized as Level 1 in the hierarchy.
Changes in valuation techniques may result in transfers in or out of an assigned level within the disclosure hierarchy.
Foreign Currency. The Fund may use foreign currency contracts to facilitate transactions in foreign-denominated securities. Gains and losses from these transactions may arise from changes in the value of the foreign currency or if the counterparties do not perform under the contracts' terms.
Foreign-denominated assets, including investment securities, and liabilities are translated into U.S. dollars at the exchange rates at period end. Purchases and sales of investment securities, income and dividends received and expenses denominated in foreign currencies are translated into U.S. dollars at the exchange rate in effect on the transaction date.
The effects of exchange rate fluctuations on investments are included with the net realized and unrealized gain (loss) on investment securities. Other foreign currency transactions resulting in realized and unrealized gain (loss) are disclosed separately.
Investment Transactions and Income. For financial reporting purposes, the Fund's investment holdings and NAV include trades executed through the end of the last business day of the period. The NAV per share for processing shareholder transactions is calculated as of the close of business of the New York Stock Exchange (NYSE), normally 4:00 p.m. Eastern time and includes trades executed through the end of the prior business day. Gains and losses on securities sold are determined on the basis of identified cost and may include proceeds received from litigation. Dividend income is recorded on the ex-dividend date, except for certain dividends from foreign securities where the ex-dividend date may have passed, which are recorded as soon as the Fund is informed of the ex-dividend date. Non-cash dividends included in dividend income, if any, are recorded at the fair market value of the securities received. Income and capital gain distributions from Fidelity Central Funds, if any, are recorded on the ex-dividend date. Distributions received on securities that represent a return of capital or capital gain are recorded as a reduction of cost of investments and/or as a realized gain. Subsequent to ex-dividend date the Fund determines the components of these distributions, based upon receipt of tax filings or other correspondence relating to the underlying investment. Investment income is recorded net of foreign taxes withheld where recovery of such taxes is uncertain.
Class Allocations and Expenses. Investment income, realized and unrealized capital gains and losses, common expenses of the Fund, and certain fund-level expense reductions, if any, are allocated daily on a pro-rata basis to each class based on the relative net assets of each class to the total net assets of the Fund. Each class differs with respect to transfer agent and distribution and service plan fees incurred. Certain expense reductions may also differ by class. For the reporting period, the allocated portion of income and expenses to each class as a percent of its average net assets may vary due to the timing of recording these transactions in relation to fluctuating net assets of the classes. Expenses directly attributable to a fund are charged to that fund. Expenses attributable to more than one fund are allocated among the respective funds on the basis of relative net assets or other appropriate methods. Expense estimates are accrued in the period to which they relate and adjustments are made when actual amounts are known.
Income Tax Information and Distributions to Shareholders. Each year, the Fund intends to qualify as a regulated investment company under Subchapter M of the Internal Revenue Code, including distributing substantially all of its taxable income and realized gains. As a result, no provision for U.S. Federal income taxes is required. The Fund files a U.S. federal tax return, in addition to state and local tax returns as required. The Fund's federal income tax returns are subject to examination by the Internal Revenue Service (IRS) for a period of three fiscal years after they are filed. State and local tax returns may be subject to examination for an additional fiscal year depending on the jurisdiction. Foreign taxes are provided for based on the Fund's understanding of the tax rules and rates that exist in the foreign markets in which it invests.
Distributions are declared and recorded on the ex-dividend date. Income dividends and capital gain distributions are declared separately for each class. Income and capital gain distributions are determined in accordance with income tax regulations, which may differ from GAAP.
Capital accounts within the financial statements are adjusted for permanent book-tax differences. These adjustments have no impact on net assets or the results of operations. Capital accounts are not adjusted for temporary book-tax differences which will reverse in a subsequent period.
Book-tax differences are primarily due to foreign currency transactions, partnerships, capital loss carryforwards and losses deferred due to wash sales and excise tax regulations.
The federal tax cost of investment securities and unrealized appreciation (depreciation) as of period end were as follows:
| Gross unrealized appreciation | $7,948,537 |
| Gross unrealized depreciation | (23,483,737) |
| Net unrealized appreciation (depreciation) on securities | $(15,535,200) |
| Tax cost | $226,149,294 |
Capital loss carryforwards are only available to offset future capital gains of the Fund to the extent provided by regulations and may be limited. Under the Regulated Investment Company Modernization Act of 2010 (the Act), the Fund is permitted to carry forward capital losses incurred in taxable years beginning after December 22, 2010 for an unlimited period and such capital losses are required to be used prior to any losses that expire. The capital loss carryforward information presented below, including any applicable limitation, is estimated as of prior fiscal period end and is subject to adjustment.
| Fiscal year of expiration | |
| 2017 | $(22,843,955) |
| 2018 | (23,251,884) |
| 2019 | (445,604) |
| Total capital loss carryforward | $(46,541,443) |
The Fund elected to defer to its next fiscal year approximately $213,865 of ordinary losses recognized during the period January 1, 2015 to July 31, 2015.
Short-Term Trading (Redemption) Fees. Share held by investors in the Fund less than 30 days may have been subject to a redemption fee equal to .75% of the NAV of shares redeemed. All redemption fees, which reduce the proceeds of the shareholder redemption, are retained by the Fund and accounted for as an addition to paid in capital.
4. Purchases and Sales of Investments.
Purchases and sales of securities, other than short-term securities, aggregated $89,113,289 and $79,622,756, respectively.
5. Fees and Other Transactions with Affiliates.
Management Fee. Fidelity SelectCo, LLC (the investment adviser) and its affiliates provide the Fund with investment management related services for which the Fund pays a monthly management fee. The management fee is the sum of an individual fund fee rate that is based on an annual rate of .30% of the Fund's average net assets and an annualized group fee rate that averaged .25% during the period. The group fee rate is based upon the average net assets of all the mutual funds advised by Fidelity Management & Research Company (FMR) and the investment adviser. The group fee rate decreases as assets under management increase and increases as assets under management decrease. For the reporting period, the total annualized management fee rate was .55% of the Fund's average net assets.
Distribution and Service Plan Fees. In accordance with Rule 12b-1 of the 1940 Act, the Fund has adopted separate Distribution and Service Plans for each class of shares. Certain classes pay Fidelity Distributors Corporation (FDC), an affiliate of the investment adviser, separate Distribution and Service Fees, each of which is based on an annual percentage of each class' average net assets. In addition, FDC may pay financial intermediaries for selling shares of the Fund and providing shareholder support services. For the period, the Distribution and Service Fee rates, total fees and amounts retained by FDC were as follows:
| | Distribution
Fee | Service
Fee | Total Fees | Retained
by FDC |
| Class A | -% | .25% | $125,781 | $– |
| Class T | .25% | .25% | 81,044 | – |
| Class B | .75% | .25% | 15,577 | 11,683 |
| Class C | .75% | .25% | 248,123 | 75,328 |
| | | | $470,525 | $87,011 |
Sales Load. FDC may receive a front-end sales charge of up to 5.75% for selling Class A shares and 3.50% for selling Class T shares, some of which is paid to financial intermediaries for selling shares of the Fund. Depending on the holding period, FDC may receive contingent deferred sales charges levied on Class A, Class T, Class B, and Class C redemptions. The deferred sales charges range from 5.00% to 1.00% for Class B shares, 1.00% for Class C shares, 1.00% for certain purchases of Class A shares and .25% for certain purchases of Class T shares.
For the period, sales charge amounts retained by FDC were as follows:
| | Retained
by FDC |
| Class A | $34,332 |
| Class T | 5,301 |
| Class B(a) | 375 |
| Class C(a) | 6,520 |
| | $46,528 |
(a) When Class B and Class C shares are initially sold, FDC pays commissions from its own resources to financial intermediaries through which the sales are made.
Transfer Agent Fees. Fidelity Investments Institutional Operations Company, Inc., (FIIOC), an affiliate of the investment adviser, is the transfer, dividend disbursing and shareholder servicing agent for each class of the Fund. FIIOC receives account fees and asset-based fees that vary according to the account size and type of account of the shareholders of the respective classes of the Fund. FIIOC pays for typesetting, printing and mailing of shareholder reports, except proxy statements.
For the period, transfer agent fees for each class were as follows:
| | Amount | % of
Class-Level Average
Net Assets(a) |
| Class A | $124,786 | .25 |
| Class T | 46,586 | .29 |
| Class B | 4,760 | .30 |
| Class C | 59,992 | .24 |
| Class I | 41,869 | .19 |
| | $277,993 | |
(a) Annualized
Accounting and Security Lending Fees. Fidelity Service Company, Inc. (FSC), an affiliate of the investment adviser, maintains the Fund's accounting records. The accounting fee is based on the level of average net assets for each month. Under a separate contract, FSC administers the security lending program. The security lending fee is based on the number and duration of lending transactions.
Brokerage Commissions. The Fund placed a portion of its portfolio transactions with brokerage firms which are affiliates of the investment adviser. Brokerage commissions are included in net realized gain (loss) and change in net unrealized appreciation (depreciation) in the Statement of Operations. The commissions paid to these affiliated firms were $1,245 for the period.
Interfund Trades. The Fund may purchase from or sell securities to other Fidelity Funds under procedures adopted by the Board. The procedures have been designed to ensure these interfund trades are executed in accordance with Rule 17a-7 of the 1940 Act. Interfund trades are included within the respective purchases and sales amounts shown in the Purchases and Sales of Investments note.
6. Committed Line of Credit.
The Fund participates with other funds managed by the investment adviser or an affiliate in a $4.25 billion credit facility (the "line of credit") to be utilized for temporary or emergency purposes to fund shareholder redemptions or for other short-term liquidity purposes. The Fund has agreed to pay commitment fees on its pro-rata portion of the line of credit, which amounted to $153 and is reflected in Miscellaneous expenses on the Statement of Operations. During the period, the Fund did not borrow on this line of credit.
7. Security Lending.
The Fund lends portfolio securities through a lending agent from time to time in order to earn additional income. On the settlement date of the loan, the Fund receives collateral (in the form of U.S. Treasury obligations, letters of credit and/or cash) against the loaned securities and maintains collateral in an amount not less than 100% of the market value of the loaned securities during the period of the loan. The market value of the loaned securities is determined at the close of business of the Fund and any additional required collateral is delivered to the Fund on the next business day. The Fund or borrower may terminate the loan at any time, and if the borrower defaults on its obligation to return the securities loaned because of insolvency or other reasons, the Fund may apply collateral received from the borrower against the obligation. The Fund may experience delays and costs in recovering the securities loaned. Any cash collateral received is invested in the Fidelity Securities Lending Cash Central Fund. The value of loaned securities and cash collateral at period end are disclosed on the Fund's Statement of Assets and Liabilities. Security lending income represents the income earned on investing cash collateral, less rebates paid to borrowers and any lending agent fees associated with the loan, plus any premium payments received for lending certain types of securities. Security lending income is presented in the Statement of Operations as a component of income from Fidelity Central Funds. Total security lending income during the period amounted to $1,146.
8. Expense Reductions.
Commissions paid to certain brokers with whom the investment adviser, or its affiliates, places trades on behalf of the Fund include an amount in addition to trade execution, which may be rebated back to the Fund to offset certain expenses. This amount totaled $3,973 for the period. In addition, through arrangements with the Fund's custodian, credits realized as a result of certain uninvested cash balances were used to reduce the Fund's expenses. During the period, these credits reduced the Fund's custody expenses by $9.
In addition, during the period the investment adviser reimbursed and/or waived a portion of fund-level operating expenses in the amount of $869.
9. Distributions to Shareholders.
Distributions to shareholders of each class were as follows:
| | Six months ended January 31, 2016 | Year ended July 31, 2015 |
| From net investment income | | |
| Class A | $487,874 | $677,086 |
| Class T | 110,989 | 166,609 |
| Class B | 2,181 | 7,587 |
| Class C | 104,614 | 95,653 |
| Class I | 251,888 | 227,501 |
| Total | $957,546 | $1,174,436 |
| From net realized gain | | |
| Class A | $83,636 | $– |
| Class T | 26,115 | – |
| Class B | 2,379 | – |
| Class C | 43,289 | – |
| Class I | 34,348 | – |
| Total | $189,767 | $– |
10. Share Transactions.
Share transactions for each class were as follows and may contain automatic conversions between classes or exchanges between affiliated funds:
| | Shares | Shares | Dollars | Dollars |
| | Six months ended January 31, 2016 | Year ended July 31, 2015 | Six months ended January 31, 2016 | Year ended July 31, 2015 |
| Class A | | | | |
| Shares sold | 1,825,159 | 2,375,926 | $28,448,911 | $38,271,380 |
| Reinvestment of distributions | 34,331 | 37,600 | 519,430 | 601,602 |
| Shares redeemed | (1,248,508) | (1,370,832) | (18,711,707) | (21,745,625) |
| Net increase (decrease) | 610,982 | 1,042,694 | $10,256,634 | $17,127,357 |
| Class T | | | | |
| Shares sold | 255,275 | 282,748 | $3,952,059 | $4,530,961 |
| Reinvestment of distributions | 8,782 | 9,927 | 131,908 | 158,623 |
| Shares redeemed | (185,505) | (327,213) | (2,810,375) | (5,144,018) |
| Net increase (decrease) | 78,552 | (34,538) | $1,273,592 | $(454,434) |
| Class B | | | | |
| Shares sold | 9,818 | 9,940 | $145,243 | $153,403 |
| Reinvestment of distributions | 304 | 462 | 4,404 | 7,229 |
| Shares redeemed | (69,180) | (154,232) | (1,015,214) | (2,370,354) |
| Net increase (decrease) | (59,058) | (143,830) | $(865,567) | $(2,209,722) |
| Class C | | | | |
| Shares sold | 873,462 | 1,276,982 | $12,833,896 | $19,580,585 |
| Reinvestment of distributions | 9,045 | 5,490 | 129,709 | 84,931 |
| Shares redeemed | (518,325) | (661,896) | (7,364,427) | (9,959,897) |
| Net increase (decrease) | 364,182 | 620,576 | $5,599,178 | $9,705,619 |
| Class I | | | | |
| Shares sold | 1,012,179 | 2,718,004 | $15,880,600 | $44,696,215 |
| Reinvestment of distributions | 13,725 | 9,845 | 212,871 | 161,164 |
| Shares redeemed | (1,344,363) | (1,276,123) | (20,183,784) | (20,659,247) |
| Net increase (decrease) | (318,459) | 1,451,726 | $(4,090,313) | $24,198,132 |
11. Other.
The Fund's organizational documents provide former and current trustees and officers with a limited indemnification against liabilities arising in connection with the performance of their duties to the Fund. In the normal course of business, the Fund may also enter into contracts that provide general indemnifications. The Fund's maximum exposure under these arrangements is unknown as this would be dependent on future claims that may be made against the Fund. The risk of material loss from such claims is considered remote.
Fidelity Advisor® Health Care Fund
Investment Summary (Unaudited)
Top Ten Stocks as of January 31, 2016
| | % of fund's net assets | % of fund's net assets 6 months ago |
| Medtronic PLC | 9.6 | 7.8 |
| Allergan PLC | 6.4 | 6.6 |
| Teva Pharmaceutical Industries Ltd. sponsored ADR | 5.9 | 5.0 |
| Amgen, Inc. | 4.6 | 2.5 |
| Boston Scientific Corp. | 4.4 | 4.3 |
| AbbVie, Inc. | 3.4 | 4.2 |
| Bristol-Myers Squibb Co. | 3.3 | 2.3 |
| McKesson Corp. | 2.9 | 3.2 |
| UnitedHealth Group, Inc. | 2.6 | 2.2 |
| Cigna Corp. | 2.2 | 2.0 |
| | 45.3 | |
Top Industries (% of fund's net assets)
| As of January 31, 2016 |
| | Pharmaceuticals | 28.8% |
| | Biotechnology | 25.0% |
| | Health Care Equipment & Supplies | 24.6% |
| | Health Care Providers & Services | 13.8% |
| | Health Care Technology | 2.8% |
| | All Others* | 5.0% |

| As of July 31, 2015 |
| | Pharmaceuticals | 36.6% |
| | Health Care Equipment & Supplies | 20.5% |
| | Biotechnology | 19.0% |
| | Health Care Providers & Services | 13.4% |
| | Health Care Technology | 3.2% |
| | All Others* | 7.3% |

* Includes Short-Term investments and Net Other Assets (Liabilities).
Fidelity Advisor® Health Care Fund
Investments January 31, 2016 (Unaudited)
Showing Percentage of Net Assets
| Common Stocks - 98.6% | | | |
| | | Shares | Value |
| Biotechnology - 25.0% | | | |
| Biotechnology - 25.0% | | | |
| AbbVie, Inc. | | 1,635,300 | $89,777,970 |
| Ablynx NV (a) | | 591,709 | 8,621,127 |
| Acceleron Pharma, Inc. (a) | | 142,448 | 4,373,154 |
| Acorda Therapeutics, Inc. (a) | | 201,929 | 7,435,026 |
| Actelion Ltd. | | 90,000 | 11,860,163 |
| Advaxis, Inc. (a)(b) | | 531,200 | 3,622,784 |
| Alnylam Pharmaceuticals, Inc. (a) | | 156,555 | 10,792,902 |
| AMAG Pharmaceuticals, Inc. (a) | | 344,115 | 7,883,675 |
| Amgen, Inc. | | 808,666 | 123,507,558 |
| Amicus Therapeutics, Inc. (a)(b) | | 870,000 | 5,254,800 |
| Anacor Pharmaceuticals, Inc. (a) | | 322,037 | 24,194,640 |
| Arena Pharmaceuticals, Inc. (a) | | 2,519,396 | 3,804,288 |
| Array BioPharma, Inc. (a) | | 800,000 | 2,472,000 |
| Ascendis Pharma A/S ADR | | 400,000 | 7,616,000 |
| Biogen, Inc. (a) | | 197,884 | 54,034,205 |
| BioMarin Pharmaceutical, Inc. (a) | | 299,200 | 22,146,784 |
| bluebird bio, Inc. (a) | | 43,420 | 1,795,851 |
| Blueprint Medicines Corp. | | 205,000 | 3,222,600 |
| Cara Therapeutics, Inc. (a) | | 282,162 | 2,539,458 |
| Celgene Corp. (a) | | 238,208 | 23,897,027 |
| Cellectis SA sponsored ADR | | 220,700 | 4,934,852 |
| Curis, Inc. (a) | | 1,519,300 | 2,491,652 |
| CytomX Therapeutics, Inc. (a) | | 145,200 | 2,281,092 |
| Edge Therapeutics, Inc. (a) | | 181,343 | 2,014,721 |
| Galapagos Genomics NV sponsored ADR | | 120,209 | 5,880,624 |
| Gilead Sciences, Inc. | | 266,862 | 22,149,546 |
| Heron Therapeutics, Inc. (a) | | 163,315 | 3,427,982 |
| Incyte Corp. (a) | | 142,200 | 10,033,632 |
| Insmed, Inc. (a) | | 900,800 | 11,890,560 |
| Intercept Pharmaceuticals, Inc. (a) | | 53,021 | 5,632,421 |
| Mirati Therapeutics, Inc. (a) | | 274,000 | 5,899,220 |
| Neurocrine Biosciences, Inc. (a) | | 222,100 | 9,450,355 |
| ProNai Therapeutics, Inc. (a) | | 97,200 | 804,816 |
| Puma Biotechnology, Inc. (a)(b) | | 400,000 | 16,696,000 |
| Regeneron Pharmaceuticals, Inc. (a) | | 105,298 | 44,234,637 |
| Spark Therapeutics, Inc. | | 131,942 | 3,716,806 |
| TESARO, Inc. (a)(b) | | 300,000 | 10,362,000 |
| Trevena, Inc. (a) | | 1,000,000 | 7,280,000 |
| Ultragenyx Pharmaceutical, Inc. (a) | | 201,440 | 11,310,856 |
| United Therapeutics Corp. (a) | | 101,800 | 12,539,724 |
| Vertex Pharmaceuticals, Inc. (a) | | 597,700 | 54,241,275 |
| Xencor, Inc. (a) | | 297,400 | 3,217,868 |
| | | | 669,342,651 |
| Capital Markets - 0.0% | | | |
| Asset Management & Custody Banks - 0.0% | | | |
| RPI International Holdings LP (c) | | 10,510 | 1,473,502 |
| Diversified Consumer Services - 0.2% | | | |
| Specialized Consumer Services - 0.2% | | | |
| Carriage Services, Inc. | | 215,735 | 4,787,160 |
| Health Care Equipment & Supplies - 24.6% | | | |
| Health Care Equipment - 23.2% | | | |
| Atricure, Inc. (a) | | 556,504 | 9,727,690 |
| Boston Scientific Corp. (a) | | 6,788,948 | 119,010,258 |
| CONMED Corp. | | 304,100 | 11,233,454 |
| Edwards Lifesciences Corp. (a) | | 501,500 | 39,222,315 |
| HeartWare International, Inc. (a) | | 138,771 | 5,570,268 |
| Integra LifeSciences Holdings Corp. (a) | | 244,600 | 15,030,670 |
| Intuitive Surgical, Inc. (a) | | 44,000 | 23,797,400 |
| Invuity, Inc. | | 517,800 | 3,976,704 |
| LivaNova PLC (a) | | 235,600 | 13,188,888 |
| Medtronic PLC | | 3,395,700 | 257,801,539 |
| Neovasc, Inc. (a) | | 1,100,000 | 3,762,000 |
| Nevro Corp. (a)(b) | | 314,300 | 19,420,597 |
| Novocure Ltd. (a)(b) | | 185,300 | 2,312,544 |
| ResMed, Inc. | | 408,000 | 23,133,600 |
| St. Jude Medical, Inc. | | 97,800 | 5,169,708 |
| Steris PLC | | 120,184 | 8,321,540 |
| Stryker Corp. | | 100,000 | 9,915,000 |
| Teleflex, Inc. (b) | | 80,000 | 10,855,200 |
| Wright Medical Group NV (a) | | 1,300,000 | 25,935,000 |
| Zeltiq Aesthetics, Inc. (a) | | 253,818 | 5,893,654 |
| Zimmer Biomet Holdings, Inc. | | 88,500 | 8,784,510 |
| | | | 622,062,539 |
| Health Care Supplies - 1.4% | | | |
| The Cooper Companies, Inc. | | 220,000 | 28,853,000 |
| The Spectranetics Corp. (a)(b) | | 700,000 | 8,435,000 |
| | | | 37,288,000 |
|
| TOTAL HEALTH CARE EQUIPMENT & SUPPLIES | | | 659,350,539 |
|
| Health Care Providers & Services - 13.7% | | | |
| Health Care Distributors & Services - 3.7% | | | |
| Amplifon SpA | | 761,295 | 6,382,162 |
| EBOS Group Ltd. | | 1,312,664 | 11,441,210 |
| McKesson Corp. | | 475,175 | 76,493,672 |
| United Drug PLC (United Kingdom) | | 800,000 | 5,980,068 |
| | | | 100,297,112 |
| Health Care Facilities - 3.7% | | | |
| AmSurg Corp. (a) | | 150,000 | 10,978,500 |
| Brookdale Senior Living, Inc. (a) | | 406,070 | 6,610,820 |
| HCA Holdings, Inc. (a) | | 429,800 | 29,905,484 |
| Surgical Care Affiliates, Inc. (a) | | 500,005 | 21,335,213 |
| Universal Health Services, Inc. Class B | | 272,600 | 30,705,664 |
| | | | 99,535,681 |
| Health Care Services - 1.5% | | | |
| Adeptus Health, Inc. Class A (a)(b) | | 120,200 | 5,671,036 |
| DaVita HealthCare Partners, Inc. (a) | | 307,100 | 20,612,552 |
| Envision Healthcare Holdings, Inc. (a) | | 571,304 | 12,625,818 |
| | | | 38,909,406 |
| Managed Health Care - 4.8% | | | |
| Cigna Corp. | | 430,200 | 57,474,720 |
| UnitedHealth Group, Inc. | | 612,800 | 70,570,048 |
| | | | 128,044,768 |
|
| TOTAL HEALTH CARE PROVIDERS & SERVICES | | | 366,786,967 |
|
| Health Care Technology - 2.8% | | | |
| Health Care Technology - 2.8% | | | |
| athenahealth, Inc. (a) | | 239,100 | 33,904,380 |
| Castlight Health, Inc. (a) | | 336,800 | 1,114,808 |
| Castlight Health, Inc. Class B (a)(b) | | 94,050 | 311,306 |
| Connecture, Inc. (a) | | 489,461 | 1,155,128 |
| Evolent Health, Inc. | | 243,600 | 2,404,332 |
| HealthStream, Inc. (a) | | 685,600 | 15,014,640 |
| Medidata Solutions, Inc. (a) | | 485,900 | 20,762,507 |
| | | | 74,667,101 |
| Life Sciences Tools & Services - 2.8% | | | |
| Life Sciences Tools & Services - 2.8% | | | |
| Agilent Technologies, Inc. | | 1,349,700 | 50,816,205 |
| Bruker Corp. (a) | | 746,200 | 16,662,646 |
| PRA Health Sciences, Inc. (a) | | 167,300 | 7,207,284 |
| | | | 74,686,135 |
| Pharmaceuticals - 28.8% | | | |
| Pharmaceuticals - 28.8% | | | |
| Allergan PLC (a) | | 602,300 | 171,312,189 |
| Amphastar Pharmaceuticals, Inc. (a) | | 600,000 | 7,230,000 |
| Astellas Pharma, Inc. | | 1,012,300 | 14,016,876 |
| Bristol-Myers Squibb Co. | | 1,404,000 | 87,272,640 |
| Catalent, Inc. (a) | | 609,100 | 14,332,123 |
| Dechra Pharmaceuticals PLC | | 600,000 | 8,570,365 |
| Eisai Co. Ltd. | | 304,000 | 18,375,032 |
| Endo Health Solutions, Inc. (a) | | 931,400 | 51,664,758 |
| Horizon Pharma PLC (a) | | 728,100 | 12,741,750 |
| Jazz Pharmaceuticals PLC (a) | | 163,100 | 20,997,494 |
| Jiangsu Hengrui Medicine Co. Ltd. | | 1,430,000 | 9,605,122 |
| Lee's Pharmaceutical Holdings Ltd. | | 4,366,536 | 4,037,954 |
| Mylan N.V. | | 1,011,400 | 53,290,666 |
| Pfizer, Inc. | | 1,349,700 | 41,152,353 |
| Prestige Brands Holdings, Inc. (a) | | 307,500 | 14,354,100 |
| Sanofi SA sponsored ADR | | 500,000 | 20,820,000 |
| Sun Pharmaceutical Industries Ltd. | | 1,123,677 | 14,544,714 |
| Teva Pharmaceutical Industries Ltd. sponsored ADR | | 2,564,500 | 157,665,460 |
| The Medicines Company (a)(b) | | 291,900 | 10,088,064 |
| TherapeuticsMD, Inc. (a)(b) | | 2,003,600 | 14,325,740 |
| UCB SA | | 91,500 | 7,823,336 |
| Valeant Pharmaceuticals International, Inc. (Canada) (a) | | 188,700 | 17,376,187 |
| | | | 771,596,923 |
| Professional Services - 0.7% | | | |
| Human Resource & Employment Services - 0.7% | | | |
| WageWorks, Inc. (a) | | 401,600 | 17,967,584 |
| TOTAL COMMON STOCKS | | | |
| (Cost $2,610,997,227) | | | 2,640,658,562 |
|
| Convertible Preferred Stocks - 0.1% | | | |
| Health Care Providers & Services - 0.1% | | | |
| Health Care Services - 0.1% | | | |
| 1Life Healthcare, Inc. Series G (a)(c) | | | |
| (Cost $2,121,583) | | 322,145 | 2,812,326 |
|
| Money Market Funds - 1.1% | | | |
| Fidelity Cash Central Fund, 0.38% (d) | | 7,673,993 | 7,673,993 |
| Fidelity Securities Lending Cash Central Fund, 0.42% (d)(e) | | 21,198,175 | 21,198,175 |
| TOTAL MONEY MARKET FUNDS | | | |
| (Cost $28,872,168) | | | 28,872,168 |
| TOTAL INVESTMENT PORTFOLIO - 99.8% | | | |
| (Cost $2,641,990,978) | | | 2,672,343,056 |
| NET OTHER ASSETS (LIABILITIES) - 0.2% | | | 4,225,975 |
| NET ASSETS - 100% | | | $2,676,569,031 |
Legend
(a) Non-income producing
(b) Security or a portion of the security is on loan at period end.
(c) Restricted securities - Investment in securities not registered under the Securities Act of 1933 (excluding 144A issues). At the end of the period, the value of restricted securities (excluding 144A issues) amounted to $4,285,828 or 0.2% of net assets.
(d) Affiliated fund that is generally available only to investment companies and other accounts managed by Fidelity Investments. The rate quoted is the annualized seven-day yield of the fund at period end. A complete unaudited listing of the fund's holdings as of its most recent quarter end is available upon request. In addition, each Fidelity Central Fund's financial statements are available on the SEC's website or upon request.
(e) Investment made with cash collateral received from securities on loan.
Additional information on each restricted holding is as follows:
| Security | Acquisition Date | Acquisition Cost |
| 1Life Healthcare, Inc. Series G | 4/10/14 | $2,121,583 |
| RPI International Holdings LP | 5/21/15 | $1,239,129 |
Affiliated Central Funds
Information regarding fiscal year to date income earned by the Fund from investments in Fidelity Central Funds is as follows:
| Fund | Income earned |
| Fidelity Cash Central Fund | $76,615 |
| Fidelity Securities Lending Cash Central Fund | 173,746 |
| Total | $250,361 |
Investment Valuation
The following is a summary of the inputs used, as of January 31, 2016, involving the Fund's assets and liabilities carried at fair value. The inputs or methodology used for valuing securities may not be an indication of the risk associated with investing in those securities. For more information on valuation inputs, and their aggregation into the levels used below, please refer to the Investment Valuation section in the accompanying Notes to Financial Statements.
| | Valuation Inputs at Reporting Date: |
| Description | Total | Level 1 | Level 2 | Level 3 |
| Investments in Securities: | | | | |
| Common Stocks | $2,640,658,562 | $2,529,368,141 | $109,816,919 | $1,473,502 |
| Convertible Preferred Stocks | 2,812,326 | -- | -- | 2,812,326 |
| Money Market Funds | 28,872,168 | 28,872,168 | -- | -- |
| Total Investments in Securities: | $2,672,343,056 | $2,558,240,309 | $109,816,919 | $4,285,828 |
The following is a summary of transfers between Level 1 and Level 2 for the period ended January 31, 2016. Transfers are assumed to have occurred at the beginning of the period, and are primarily attributable to the valuation techniques used for foreign equity securities, as discussed in the accompanying Notes to Financial Statements:
| Transfers | Total |
| Level 1 to Level 2 | $105,922,384 |
| Level 2 to Level 1 | $0 |
Other Information
Distribution of investments by country or territory of incorporation, as a percentage of Total Net Assets, is as follows (Unaudited):
| United States of America | 64.4% |
| Ireland | 19.4% |
| Israel | 5.9% |
| Netherlands | 3.0% |
| Japan | 1.2% |
| United Kingdom | 1.1% |
| France | 1.0% |
| Others (Individually Less Than 1%) | 4.0% |
| | 100.0% |
See accompanying notes which are an integral part of the financial statements.
Fidelity Advisor® Health Care Fund
Financial Statements
Statement of Assets and Liabilities
| | | January 31, 2016 (Unaudited) |
| Assets | | |
Investment in securities, at value (including securities loaned of $21,253,216) — See accompanying schedule:
Unaffiliated issuers (cost $2,613,118,810) | $2,643,470,888 | |
| Fidelity Central Funds (cost $28,872,168) | 28,872,168 | |
| Total Investments (cost $2,641,990,978) | | $2,672,343,056 |
| Cash | | 1,276 |
| Receivable for investments sold | | 69,888,696 |
| Receivable for fund shares sold | | 5,884,117 |
| Dividends receivable | | 2,026,278 |
| Distributions receivable from Fidelity Central Funds | | 19,048 |
| Prepaid expenses | | 12,978 |
| Other receivables | | 24,256 |
| Total assets | | 2,750,199,705 |
| Liabilities | | |
| Payable for investments purchased | $43,522,607 | |
| Payable for fund shares redeemed | 6,061,951 | |
| Accrued management fee | 1,272,719 | |
| Distribution and service plan fees payable | 948,267 | |
| Other affiliated payables | 564,327 | |
| Other payables and accrued expenses | 62,628 | |
| Collateral on securities loaned, at value | 21,198,175 | |
| Total liabilities | | 73,630,674 |
| Net Assets | | $2,676,569,031 |
| Net Assets consist of: | | |
| Paid in capital | | $2,682,982,928 |
| Accumulated net investment loss | | (6,325,168) |
| Accumulated undistributed net realized gain (loss) on investments and foreign currency transactions | | (30,439,600) |
| Net unrealized appreciation (depreciation) on investments and assets and liabilities in foreign currencies | | 30,350,871 |
| Net Assets | | $2,676,569,031 |
| Calculation of Maximum Offering Price | | |
| Class A: | | |
| Net Asset Value and redemption price per share ($1,144,713,999 ÷ 33,396,915 shares) | | $34.28 |
| Maximum offering price per share (100/94.25 of $34.28) | | $36.37 |
| Class T: | | |
| Net Asset Value and redemption price per share ($280,233,432 ÷ 8,682,523 shares) | | $32.28 |
| Maximum offering price per share (100/96.50 of $32.28) | | $33.45 |
| Class B: | | |
| Net Asset Value and offering price per share ($7,814,846 ÷ 275,621 shares)(a) | | $28.35 |
| Class C: | | |
| Net Asset Value and offering price per share ($661,247,663 ÷ 23,608,402 shares)(a) | | $28.01 |
| Class I: | | |
| Net Asset Value, offering price and redemption price per share ($582,559,091 ÷ 15,747,853 shares) | | $36.99 |
(a) Redemption price per share is equal to net asset value less any applicable contingent deferred sales charge.
See accompanying notes which are an integral part of the financial statements.
Statement of Operations
| | | Six months ended January 31, 2016 (Unaudited) |
| Investment Income | | |
| Dividends | | $11,372,909 |
| Interest | | 55 |
| Income from Fidelity Central Funds | | 250,361 |
| Total income | | 11,623,325 |
| Expenses | | |
| Management fee | $8,285,409 | |
| Transfer agent fees | 3,008,708 | |
| Distribution and service plan fees | 6,001,966 | |
| Accounting and security lending fees | 446,580 | |
| Custodian fees and expenses | 31,779 | |
| Independent trustees' compensation | 28,263 | |
| Registration fees | 129,680 | |
| Audit | 28,286 | |
| Legal | 15,842 | |
| Interest | 1,775 | |
| Miscellaneous | 15,220 | |
| Total expenses before reductions | 17,993,508 | |
| Expense reductions | (45,032) | 17,948,476 |
| Net investment income (loss) | | (6,325,151) |
| Realized and Unrealized Gain (Loss) | | |
| Net realized gain (loss) on: | | |
| Investment securities: | | |
| Unaffiliated issuers | (27,431,418) | |
| Foreign currency transactions | 36,177 | |
| Total net realized gain (loss) | | (27,395,241) |
Change in net unrealized appreciation (depreciation) on:
Investment securities | (616,274,989) | |
| Assets and liabilities in foreign currencies | (799) | |
| Total change in net unrealized appreciation (depreciation) | | (616,275,788) |
| Net gain (loss) | | (643,671,029) |
| Net increase (decrease) in net assets resulting from operations | | $(649,996,180) |
See accompanying notes which are an integral part of the financial statements.
Statement of Changes in Net Assets
| | Six months ended January 31, 2016 (Unaudited) | Year ended July 31, 2015 |
| Increase (Decrease) in Net Assets | | |
| Operations | | |
| Net investment income (loss) | $(6,325,151) | $(13,226,611) |
| Net realized gain (loss) | (27,395,241) | 303,936,182 |
| Change in net unrealized appreciation (depreciation) | (616,275,788) | 322,305,451 |
| Net increase (decrease) in net assets resulting from operations | (649,996,180) | 613,015,022 |
| Distributions to shareholders from net realized gain | (200,296,844) | (188,666,593) |
| Share transactions - net increase (decrease) | 196,848,910 | 1,510,649,436 |
| Redemption fees | 63,116 | 66,619 |
| Total increase (decrease) in net assets | (653,380,998) | 1,935,064,484 |
| Net Assets | | |
| Beginning of period | 3,329,950,029 | 1,394,885,545 |
| End of period (including accumulated net investment loss of $6,325,168 and accumulated net investment loss of $17, respectively) | $2,676,569,031 | $3,329,950,029 |
See accompanying notes which are an integral part of the financial statements.
Financial Highlights — Fidelity Advisor Health Care Fund Class A
| | Six months ended (Unaudited) | Years ended July 31, | | | | |
| January 31, | 2016 | 2015 | 2014 | 2013 | 2012 | 2011 |
| Selected Per–Share Data | | | | | | |
| Net asset value, beginning of period | $45.17 | $37.72 | $31.29 | $24.35 | $25.60 | $19.01 |
| Income from Investment Operations | | | | | | |
| Net investment income (loss)A | (.05) | (.19) | (.18) | –B | (.04) | (.10) |
| Net realized and unrealized gain (loss) | (8.29) | 12.03 | 10.13 | 9.53 | 1.43 | 6.69 |
| Total from investment operations | (8.34) | 11.84 | 9.95 | 9.53 | 1.39 | 6.59 |
| Distributions from net realized gain | (2.55) | (4.39) | (3.52) | (2.59) | (2.64) | – |
| Total distributions | (2.55) | (4.39) | (3.52) | (2.59) | (2.64) | – |
| Redemption fees added to paid in capitalA,B | – | – | – | – | – | – |
| Net asset value, end of period | $34.28 | $45.17 | $37.72 | $31.29 | $24.35 | $25.60 |
| Total ReturnC,D,E | (19.14)% | 34.07% | 34.79% | 42.77% | 7.58% | 34.67% |
| Ratios to Average Net AssetsF,G | | | | | | |
| Expenses before reductions | 1.04%H | 1.04% | 1.08% | 1.14% | 1.19% | 1.19% |
| Expenses net of fee waivers, if any | 1.04%H | 1.04% | 1.08% | 1.14% | 1.19% | 1.19% |
| Expenses net of all reductions | 1.04%H | 1.04% | 1.07% | 1.13% | 1.18% | 1.18% |
| Net investment income (loss) | (.27)%H | (.45)% | (.54)% | (.01)% | (.18)% | (.43)% |
| Supplemental Data | | | | | | |
| Net assets, end of period (000 omitted) | $1,144,714 | $1,374,654 | $613,995 | $365,416 | $233,188 | $224,704 |
| Portfolio turnover rateI | 71%H | 80% | 111% | 92% | 124% | 125% |
A Calculated based on average shares outstanding during the period.
B Amount represents less than $.005 per share.
C Total returns for periods of less than one year are not annualized.
D Total returns would have been lower if certain expenses had not been reduced during the applicable periods shown.
E Total returns do not include the effect of the sales charges.
F Fees and expenses of any underlying Fidelity Central Funds are not included in the Fund's expense ratio. The Fund indirectly bears its proportionate share of the expenses of any underlying Fidelity Central Funds.
G Expense ratios reflect operating expenses of the class. Expenses before reductions do not reflect amounts reimbursed by the investment adviser or reductions from brokerage service arrangements or reductions from other expense offset arrangements and do not represent the amount paid by the class during periods when reimbursements or reductions occur. Expenses net of fee waivers reflect expenses after reimbursement by the investment adviser but prior to reductions from brokerage service arrangements or other expense offset arrangements. Expenses net of all reductions represent the net expenses paid by the class.
H Annualized
I Amount does not include the portfolio activity of any underlying Fidelity Central Funds.
See accompanying notes which are an integral part of the financial statements.
Financial Highlights — Fidelity Advisor Health Care Fund Class T
| | Six months ended (Unaudited) | Years ended July 31, | | | | |
| January 31, | 2016 | 2015 | 2014 | 2013 | 2012 | 2011 |
| Selected Per–Share Data | | | | | | |
| Net asset value, beginning of period | $42.68 | $35.87 | $29.91 | $23.42 | $24.80 | $18.46 |
| Income from Investment Operations | | | | | | |
| Net investment income (loss)A | (.10) | (.28) | (.26) | (.07) | (.09) | (.16) |
| Net realized and unrealized gain (loss) | (7.81) | 11.39 | 9.67 | 9.13 | 1.35 | 6.50 |
| Total from investment operations | (7.91) | 11.11 | 9.41 | 9.06 | 1.26 | 6.34 |
| Distributions from net realized gain | (2.49) | (4.30) | (3.45) | (2.57) | (2.64) | – |
| Total distributions | (2.49) | (4.30) | (3.45) | (2.57) | (2.64) | – |
| Redemption fees added to paid in capitalA,B | – | – | – | – | – | – |
| Net asset value, end of period | $32.28 | $42.68 | $35.87 | $29.91 | $23.42 | $24.80 |
| Total ReturnC,D,E | (19.24)% | 33.69% | 34.49% | 42.39% | 7.27% | 34.34% |
| Ratios to Average Net AssetsF,G | | | | | | |
| Expenses before reductions | 1.31%H | 1.31% | 1.34% | 1.39% | 1.43% | 1.44% |
| Expenses net of fee waivers, if any | 1.31%H | 1.31% | 1.34% | 1.39% | 1.43% | 1.44% |
| Expenses net of all reductions | 1.31%H | 1.30% | 1.34% | 1.38% | 1.43% | 1.43% |
| Net investment income (loss) | (.54)%H | (.72)% | (.80)% | (.26)% | (.42)% | (.69)% |
| Supplemental Data | | | | | | |
| Net assets, end of period (000 omitted) | $280,233 | $348,886 | $216,973 | $158,611 | $117,969 | $123,606 |
| Portfolio turnover rateI | 71%H | 80% | 111% | 92% | 124% | 125% |
A Calculated based on average shares outstanding during the period.
B Amount represents less than $.005 per share.
C Total returns for periods of less than one year are not annualized.
D Total returns would have been lower if certain expenses had not been reduced during the applicable periods shown.
E Total returns do not include the effect of the sales charges.
F Fees and expenses of any underlying Fidelity Central Funds are not included in the Fund's expense ratio. The Fund indirectly bears its proportionate share of the expenses of any underlying Fidelity Central Funds.
G Expense ratios reflect operating expenses of the class. Expenses before reductions do not reflect amounts reimbursed by the investment adviser or reductions from brokerage service arrangements or reductions from other expense offset arrangements and do not represent the amount paid by the class during periods when reimbursements or reductions occur. Expenses net of fee waivers reflect expenses after reimbursement by the investment adviser but prior to reductions from brokerage service arrangements or other expense offset arrangements. Expenses net of all reductions represent the net expenses paid by the class.
H Annualized
I Amount does not include the portfolio activity of any underlying Fidelity Central Funds.
See accompanying notes which are an integral part of the financial statements.
Financial Highlights — Fidelity Advisor Health Care Fund Class B
| | Six months ended (Unaudited) | Years ended July 31, | | | | |
| January 31, | 2016 | 2015 | 2014 | 2013 | 2012 | 2011 |
| Selected Per–Share Data | | | | | | |
| Net asset value, beginning of period | $37.77 | $32.17 | $27.16 | $21.55 | $23.15 | $17.32 |
| Income from Investment Operations | | | | | | |
| Net investment income (loss)A | (.17) | (.43) | (.40) | (.18) | (.19) | (.25) |
| Net realized and unrealized gain (loss) | (6.90) | 10.13 | 8.71 | 8.31 | 1.23 | 6.08 |
| Total from investment operations | (7.07) | 9.70 | 8.31 | 8.13 | 1.04 | 5.83 |
| Distributions from net realized gain | (2.35) | (4.10) | (3.30) | (2.52) | (2.64) | – |
| Total distributions | (2.35) | (4.10) | (3.30) | (2.52) | (2.64) | – |
| Redemption fees added to paid in capitalA,B | – | – | – | – | – | – |
| Net asset value, end of period | $28.35 | $37.77 | $32.17 | $27.16 | $21.55 | $23.15 |
| Total ReturnC,D,E | (19.49)% | 33.00% | 33.72% | 41.61% | 6.78% | 33.66% |
| Ratios to Average Net AssetsF,G | | | | | | |
| Expenses before reductions | 1.87%H | 1.85% | 1.91% | 1.93% | 1.94% | 1.94% |
| Expenses net of fee waivers, if any | 1.87%H | 1.85% | 1.91% | 1.93% | 1.94% | 1.94% |
| Expenses net of all reductions | 1.86%H | 1.85% | 1.90% | 1.91% | 1.93% | 1.93% |
| Net investment income (loss) | (1.09)%H | (1.26)% | (1.37)% | (.80)% | (.93)% | (1.19)% |
| Supplemental Data | | | | | | |
| Net assets, end of period (000 omitted) | $7,815 | $12,926 | $13,405 | $14,517 | $15,403 | $20,365 |
| Portfolio turnover rateI | 71%H | 80% | 111% | 92% | 124% | 125% |
A Calculated based on average shares outstanding during the period.
B Amount represents less than $.005 per share.
C Total returns for periods of less than one year are not annualized.
D Total returns would have been lower if certain expenses had not been reduced during the applicable periods shown.
E Total returns do not include the effect of the contingent deferred sales charge.
F Fees and expenses of any underlying Fidelity Central Funds are not included in the Fund's expense ratio. The Fund indirectly bears its proportionate share of the expenses of any underlying Fidelity Central Funds.
G Expense ratios reflect operating expenses of the class. Expenses before reductions do not reflect amounts reimbursed by the investment adviser or reductions from brokerage service arrangements or reductions from other expense offset arrangements and do not represent the amount paid by the class during periods when reimbursements or reductions occur. Expenses net of fee waivers reflect expenses after reimbursement by the investment adviser but prior to reductions from brokerage service arrangements or other expense offset arrangements. Expenses net of all reductions represent the net expenses paid by the class.
H Annualized
I Amount does not include the portfolio activity of any underlying Fidelity Central Funds.
See accompanying notes which are an integral part of the financial statements.
Financial Highlights — Fidelity Advisor Health Care Fund Class C
| | Six months ended (Unaudited) | Years ended July 31, | | | | |
| January 31, | 2016 | 2015 | 2014 | 2013 | 2012 | 2011 |
| Selected Per–Share Data | | | | | | |
| Net asset value, beginning of period | $37.45 | $32.03 | $27.11 | $21.51 | $23.11 | $17.29 |
| Income from Investment Operations | | | | | | |
| Net investment income (loss)A | (.16) | (.41) | (.38) | (.17) | (.18) | (.24) |
| Net realized and unrealized gain (loss) | (6.82) | 10.05 | 8.68 | 8.31 | 1.22 | 6.06 |
| Total from investment operations | (6.98) | 9.64 | 8.30 | 8.14 | 1.04 | 5.82 |
| Distributions from net realized gain | (2.46) | (4.22) | (3.38) | (2.54) | (2.64) | – |
| Total distributions | (2.46) | (4.22) | (3.38) | (2.54) | (2.64) | – |
| Redemption fees added to paid in capitalA,B | – | – | – | – | – | – |
| Net asset value, end of period | $28.01 | $37.45 | $32.03 | $27.11 | $21.51 | $23.11 |
| Total ReturnC,D,E | (19.45)% | 33.04% | 33.83% | 41.74% | 6.80% | 33.66% |
| Ratios to Average Net AssetsF,G | | | | | | |
| Expenses before reductions | 1.80%H | 1.79% | 1.83% | 1.87% | 1.90% | 1.90% |
| Expenses net of fee waivers, if any | 1.80%H | 1.79% | 1.83% | 1.87% | 1.90% | 1.90% |
| Expenses net of all reductions | 1.79%H | 1.79% | 1.82% | 1.85% | 1.89% | 1.89% |
| Net investment income (loss) | (1.02)%H | (1.20)% | (1.29)% | (.74)% | (.89)% | (1.15)% |
| Supplemental Data | | | | | | |
| Net assets, end of period (000 omitted) | $661,248 | $761,070 | $257,859 | $125,965 | $78,763 | $77,749 |
| Portfolio turnover rateI | 71%H | 80% | 111% | 92% | 124% | 125% |
A Calculated based on average shares outstanding during the period.
B Amount represents less than $.005 per share.
C Total returns for periods of less than one year are not annualized.
D Total returns would have been lower if certain expenses had not been reduced during the applicable periods shown.
E Total returns do not include the effect of the contingent deferred sales charge.
F Fees and expenses of any underlying Fidelity Central Funds are not included in the Fund's expense ratio. The Fund indirectly bears its proportionate share of the expenses of any underlying Fidelity Central Funds.
G Expense ratios reflect operating expenses of the class. Expenses before reductions do not reflect amounts reimbursed by the investment adviser or reductions from brokerage service arrangements or reductions from other expense offset arrangements and do not represent the amount paid by the class during periods when reimbursements or reductions occur. Expenses net of fee waivers reflect expenses after reimbursement by the investment adviser but prior to reductions from brokerage service arrangements or other expense offset arrangements. Expenses net of all reductions represent the net expenses paid by the class.
H Annualized
I Amount does not include the portfolio activity of any underlying Fidelity Central Funds.
See accompanying notes which are an integral part of the financial statements.
Financial Highlights — Fidelity Advisor Health Care Fund Class I
| | Six months ended (Unaudited) | Years ended July 31, | | | | |
| January 31, | 2016 | 2015 | 2014 | 2013 | 2012 | 2011 |
| Selected Per–Share Data | | | | | | |
| Net asset value, beginning of period | $48.53 | $40.22 | $33.12 | $25.60 | $26.69 | $19.77 |
| Income from Investment Operations | | | | | | |
| Net investment income (loss)A | –B | (.09) | (.10) | .07 | .03 | (.03) |
| Net realized and unrealized gain (loss) | (8.94) | 12.88 | 10.80 | 10.07 | 1.52 | 6.95 |
| Total from investment operations | (8.94) | 12.79 | 10.70 | 10.14 | 1.55 | 6.92 |
| Distributions from net realized gain | (2.60) | (4.48) | (3.60) | (2.62) | (2.64) | – |
| Total distributions | (2.60) | (4.48) | (3.60) | (2.62) | (2.64) | – |
| Redemption fees added to paid in capitalA,B | – | – | – | – | – | – |
| Net asset value, end of period | $36.99 | $48.53 | $40.22 | $33.12 | $25.60 | $26.69 |
| Total ReturnC,D | (19.06)% | 34.40% | 35.21% | 43.12% | 7.91% | 35.00% |
| Ratios to Average Net AssetsE,F | | | | | | |
| Expenses before reductions | .79%G | .79% | .81% | .87% | .89% | .89% |
| Expenses net of fee waivers, if any | .79%G | .79% | .81% | .87% | .89% | .89% |
| Expenses net of all reductions | .78%G | .78% | .81% | .85% | .88% | .88% |
| Net investment income (loss) | (.01)%G | (.20)% | (.27)% | .26% | .12% | (.13)% |
| Supplemental Data | | | | | | |
| Net assets, end of period (000 omitted) | $582,559 | $832,415 | $292,654 | $74,417 | $40,737 | $45,243 |
| Portfolio turnover rateH | 71%G | 80% | 111% | 92% | 124% | 125% |
A Calculated based on average shares outstanding during the period.
B Amount represents less than $.005 per share.
C Total returns for periods of less than one year are not annualized.
D Total returns would have been lower if certain expenses had not been reduced during the applicable periods shown.
E Fees and expenses of any underlying Fidelity Central Funds are not included in the Fund's expense ratio. The Fund indirectly bears its proportionate share of the expenses of any underlying Fidelity Central Funds.
F Expense ratios reflect operating expenses of the class. Expenses before reductions do not reflect amounts reimbursed by the investment adviser or reductions from brokerage service arrangements or reductions from other expense offset arrangements and do not represent the amount paid by the class during periods when reimbursements or reductions occur. Expenses net of fee waivers reflect expenses after reimbursement by the investment adviser but prior to reductions from brokerage service arrangements or other expense offset arrangements. Expenses net of all reductions represent the net expenses paid by the class.
G Annualized
H Amount does not include the portfolio activity of any underlying Fidelity Central Funds.
See accompanying notes which are an integral part of the financial statements.
Notes to Financial Statements (Unaudited)
For the period ended January 31, 2016
1. Organization.
Fidelity Advisor Health Care Fund (the Fund) is a fund of Fidelity Advisor Series VII (the Trust) and is authorized to issue an unlimited number of shares. The Trust is registered under the Investment Company Act of 1940, as amended (the 1940 Act), as an open-end management investment company organized as a Massachusetts business trust. The Fund offers Class A, Class T, Class C and Class I shares, each of which, along with Class B shares, has equal rights as to assets and voting privileges. Class B shares are closed to new accounts and additional purchases, except for exchanges and reinvestments. Each class has exclusive voting rights with respect to matters that affect that class. Class B shares will automatically convert to Class A shares after a holding period of seven years from the initial date of purchase.
During the period, the Board of Trustees approved the conversion of all existing Class B shares into Class A shares, effective on or about July 1, 2016, regardless of the length of times shares have been held.
2. Investments in Fidelity Central Funds.
The Fund invests in Fidelity Central Funds, which are open-end investment companies generally available only to other investment companies and accounts managed by the investment adviser and its affiliates. The Fund's Schedule of Investments lists each of the Fidelity Central Funds held as of period end, if an, as an investment of the Fund, but does not include the underlying holdings of each Fidelity Central Fund. As an Investing Fund, the Fund indirectly bears its proportionate share of the expenses of the underlying Fidelity Central Funds.
The Money Market Central Funds seek preservation of capital and current income and are managed by Fidelity Investments Money Management, Inc. (FIMM), an affiliate of the investment adviser. Annualized expenses of the Money Market Central Funds as of their most recent shareholder report date are less than .005%.
A complete unaudited list of holdings for each Fidelity Central Fund is available upon request or at the Securities and Exchange Commission (the SEC) website at www.sec.gov. In addition, the financial statements of the Fidelity Central Funds are available on the SEC website or upon request.
3. Significant Accounting Policies.
The financial statements have been prepared in conformity with accounting principles generally accepted in the United States of America (GAAP), which require management to make certain estimates and assumptions at the date of the financial statements. Actual results could differ from those estimates. Subsequent events, if any, through the date that the financial statements were issued have been evaluated in the preparation of the financial statements. The following summarizes the significant accounting policies of the Fund:
Investment Valuation. Investments are valued as of 4:00 p.m. Eastern time on the last calendar day of the period. The Board of Trustees (the Board) has delegated the day to day responsibility for the valuation of the Fund's investments to the Fidelity SelectCo, LLC (SelectCo) Fair Value Committee (the Committee). In accordance with valuation policies and procedures approved by the Board, the Fund attempts to obtain prices from one or more third party pricing vendors or brokers to value its investments. When current market prices, quotations or currency exchange rates are not readily available or reliable, investments will be fair valued in good faith by the Committee, in accordance with procedures adopted by the Board. Factors used in determining fair value vary by investment type and may include market or investment specific events. The frequency with which these procedures are used cannot be predicted and they may be utilized to a significant extent. The Committee oversees the Fund's valuation policies and procedures and reports to the Board on the Committee's activities and fair value determinations. The Board monitors the appropriateness of the procedures used in valuing the Fund's investments and ratifies the fair value determinations of the Committee.
The Fund categorizes the inputs to valuation techniques used to value its investments into a disclosure hierarchy consisting of three levels as shown below:
- Level 1 – quoted prices in active markets for identical investments
- Level 2 – other significant observable inputs (including quoted prices for similar investments, interest rates, prepayment speeds, etc.)
- Level 3 – unobservable inputs (including the Fund's own assumptions based on the best information available)
Valuation techniques used to value the Fund's investments by major category are as follows:
Equity securities, including restricted securities, for which market quotations are readily available, are valued at the last reported sale price or official closing price as reported by a third party pricing vendor on the primary market or exchange on which they are traded and are categorized as Level 1 in the hierarchy. In the event there were no sales during the day or closing prices are not available, securities are valued at the last quoted bid price or may be valued using the last available price and are generally categorized as Level 2 in the hierarchy. For foreign equity securities, when market or security specific events arise, comparisons to the valuation of American Depositary Receipts (ADRs), futures contracts, Exchange-Traded Funds (ETFs) and certain indexes as well as quoted prices for similar securities may be used and would be categorized as Level 2 in the hierarchy. Utilizing these techniques may result in transfers between Level 1 and Level 2. For equity securities, including restricted securities, where observable inputs are limited, assumptions about market activity and risk are used and these securities may be categorized as Level 3 in the hierarchy.
Investments in open-end mutual funds, including the Fidelity Central Funds, are valued at their closing net asset value (NAV) each business day and are categorized as Level 1 in the hierarchy.
Changes in valuation techniques may result in transfers in or out of an assigned level within the disclosure hierarchy. The aggregate value of investments by input level as of January 31, 2016, including information on transfers between Levels 1 and 2 is included at the end of the Fund's Schedule of Investments.
Foreign Currency. The Fund may use foreign currency contracts to facilitate transactions in foreign-denominated securities. Gains and losses from these transactions may arise from changes in the value of the foreign currency or if the counterparties do not perform under the contracts' terms.
Foreign-denominated assets, including investment securities, and liabilities are translated into U.S. dollars at the exchange rates at period end. Purchases and sales of investment securities, income and dividends received and expenses denominated in foreign currencies are translated into U.S. dollars at the exchange rate in effect on the transaction date.
The effects of exchange rate fluctuations on investments are included with the net realized and unrealized gain (loss) on investment securities. Other foreign currency transactions resulting in realized and unrealized gain (loss) are disclosed separately.
Investment Transactions and Income. For financial reporting purposes, the Fund's investment holdings and NAV include trades executed through the end of the last business day of the period. The NAV per share for processing shareholder transactions is calculated as of the close of business of the New York Stock Exchange (NYSE), normally 4:00 p.m. Eastern time and includes trades executed through the end of the prior business day. Gains and losses on securities sold are determined on the basis of identified cost and may include proceeds received from litigation. Dividend income is recorded on the ex-dividend date, except for certain dividends from foreign securities where the ex-dividend date may have passed, which are recorded as soon as the Fund is informed of the ex-dividend date. Non-cash dividends included in dividend income, if any, are recorded at the fair market value of the securities received. Income and capital gain distributions from Fidelity Central Funds, if any, are recorded on the ex-dividend date. Distributions received on securities that represent a return of capital or capital gain are recorded as a reduction of cost of investments and/or as a realized gain. Subsequent to ex-dividend date the Fund determines the components of these distributions, based upon receipt of tax filings or other correspondence relating to the underlying investment. Interest income is accrued as earned and includes coupon interest and amortization of premium and accretion of discount on debt securities as applicable. Investment income is recorded net of foreign taxes withheld where recovery of such taxes is uncertain.
Class Allocations and Expenses. Investment income, realized and unrealized capital gains and losses, common expenses of the Fund, and certain fund-level expense reductions, if any, are allocated daily on a pro-rata basis to each class based on the relative net assets of each class to the total net assets of the Fund. Each class differs with respect to transfer agent and distribution and service plan fees incurred. Certain expense reductions may also differ by class. For the reporting period, the allocated portion of income and expenses to each class as a percent of its average net assets may vary due to the timing of recording these transactions in relation to fluctuating net assets of the classes. Expenses directly attributable to a fund are charged to that fund. Expenses attributable to more than one fund are allocated among the respective funds on the basis of relative net assets or other appropriate methods. Expense estimates are accrued in the period to which they relate and adjustments are made when actual amounts are known.
Income Tax Information and Distributions to Shareholders. Each year, the Fund intends to qualify as a regulated investment company under Subchapter M of the Internal Revenue Code, including distributing substantially all of its taxable income and realized gains. As a result, no provision for U.S. Federal income taxes is required. The Fund files a U.S. federal tax return, in addition to state and local tax returns as required. The Fund's federal income tax returns are subject to examination by the Internal Revenue Service (IRS) for a period of three fiscal years after they are filed. State and local tax returns may be subject to examination for an additional fiscal year depending on the jurisdiction. Foreign taxes are provided for based on the Fund's understanding of the tax rules and rates that exist in the foreign markets in which it invests.
Distributions are declared and recorded on the ex-dividend date. Income dividends and capital gain distributions are declared separately for each class. Income and capital gain distributions are determined in accordance with income tax regulations, which may differ from GAAP.
Capital accounts within the financial statements are adjusted for permanent book-tax differences. These adjustments have no impact on net assets or the results of operations. Capital accounts are not adjusted for temporary book-tax differences which will reverse in a subsequent period.
Book-tax differences are primarily due to foreign currency transactions, deferred trustees compensation, net operating losses and losses deferred due to wash sales and excise tax regulations.
The federal tax cost of investment securities and unrealized appreciation (depreciation) as of period end were as follows:
| Gross unrealized appreciation | $314,885,092 |
| Gross unrealized depreciation | (301,895,585) |
| Net unrealized appreciation (depreciation) on securities | $12,989,507 |
| Tax cost | $2,659,353,549 |
Short-Term Trading (Redemption) Fees. Shares held by investors in the Fund less than 30 days may have been subject to a redemption fee equal to .75% of the NAV of shares redeemed. All redemption fees, which reduce the proceeds of the shareholder redemption, are retained by the Fund and accounted for as an addition to paid in capital.
Restricted Securities. The Fund may invest in securities that are subject to legal or contractual restrictions on resale. These securities generally may be resold in transactions exempt from registration or to the public if the securities are registered. Disposal of these securities may involve time-consuming negotiations and expense, and prompt sale at an acceptable price may be difficult. Information regarding restricted securities is included at the end of the Fund's Schedule of Investments.
4. Purchases and Sales of Investments.
Purchases and sales of securities, other than short-term securities, aggregated $1,083,265,592 and $1,045,744,946, respectively.
5. Fees and Other Transactions with Affiliates.
Management Fee. Fidelity SelectCo, LLC (the investment adviser) and its affiliates provide the Fund with investment management related services for which the Fund pays a monthly management fee. The management fee is the sum of an individual fund fee rate that is based on an annual rate of .30% of the Fund's average net assets and an annualized group fee rate that averaged .25% during the period. The group fee rate is based upon the average net assets of all the mutual funds advised by Fidelity Management & Research Company (FMR) and the investment adviser. The group fee rate decreases as assets under management increase and increases as assets under management decrease. For the reporting period, the total annualized management fee rate was .55% of the Fund's average net assets.
Distribution and Service Plan Fees. In accordance with Rule 12b-1 of the 1940 Act, the Fund has adopted separate Distribution and Service Plans for each class of shares. Certain classes pay Fidelity Distributors Corporation (FDC), an affiliate of the investment adviser, separate Distribution and Service Fees, each of which is based on an annual percentage of each class' average net assets. In addition, FDC may pay financial intermediaries for selling shares of the Fund and providing shareholder support services. For the period, the Distribution and Service Fee rates, total fees and amounts retained by FDC were as follows:
| | Distribution
Fee | Service
Fee | Total Fees | Retained
by FDC |
| Class A | -% | .25% | $1,575,283 | $– |
| Class T | .25% | .25% | 778,504 | – |
| Class B | .75% | .25% | 50,075 | 37,556 |
| Class C | .75% | .25% | 3,598,104 | 1,634,490 |
| | | | $6,001,966 | $1,672,046 |
Sales Load. FDC may receive a front-end sales charge of up to 5.75% for selling Class A shares and 3.50% for selling Class T shares, some of which is paid to financial intermediaries for selling shares of the Fund. Depending on the holding period, FDC may receive contingent deferred sales charges levied on Class A, Class T, Class B, and Class C redemptions. The deferred sales charges range from 5.00% to 1.00% for Class B shares, 1.00% for Class C shares, 1.00% for certain purchases of Class A shares and .25% for certain purchases of Class T shares.
For the period, sales charge amounts retained by FDC were as follows:
| | Retained
by FDC |
| Class A | $526,259 |
| Class T | 60,160 |
| Class B(a) | 284 |
| Class C(a) | 120,995 |
| | $707,698 |
(a) When Class B and Class C shares are initially sold, FDC pays commissions from its own resources to financial intermediaries through which the sales are made.
Transfer Agent Fees. Fidelity Investments Institutional Operations Company, Inc., (FIIOC), an affiliate of the investment adviser, is the transfer, dividend disbursing and shareholder servicing agent for each class of the Fund. FIIOC receives account fees and asset-based fees that vary according to the account size and type of account of the shareholders of the respective classes of the Fund. FIIOC pays for typesetting, printing and mailing of shareholder reports, except proxy statements.
For the period, transfer agent fees for each class were as follows:
| | Amount | % of
Class-Level Average
Net Assets(a) |
| Class A | $1,245,810 | .20 |
| Class T | 335,870 | .22 |
| Class B | 13,695 | .27 |
| Class C | 722,414 | .20 |
| Class I | 690,919 | .19 |
| | $3,008,708 | |
(a) Annualized
Accounting and Security Lending Fees. Fidelity Service Company, Inc. (FSC), an affiliate of the investment adviser, maintains the Fund's accounting records. The accounting fee is based on the level of average net assets for each month. Under a separate contract, FSC administers the security lending program. The security lending fee is based on the number and duration of lending transactions.
Brokerage Commissions. The Fund placed a portion of its portfolio transactions with brokerage firms which are affiliates of the investment adviser. Brokerage commissions are included in net realized gain (loss) and change in net unrealized appreciation (depreciation) in the Statement of Operations. The commissions paid to these affiliated firms were $20,755 for the period.
Interfund Lending Program. Pursuant to an Exemptive Order issued by the SEC, the Fund, along with other registered investment companies having management contracts with FMR or other affiliated entities of FMR, may participate in an interfund lending program. This program provides an alternative credit facility allowing the funds to borrow from, or lend money to, other participating affiliated funds. At period end, there were no interfund loans outstanding. The Fund's activity in this program during the period for which loans were outstanding was as follows:
| Borrower or Lender | Average Loan Balance | Weighted Average Interest Rate | Interest Expense |
| Borrower | $20,250,800 | .63% | $1,775 |
Interfund Trades. The Fund may purchase from or sell securities to other Fidelity Funds under procedures adopted by the Board. The procedures have been designed to ensure these interfund trades are executed in accordance with Rule 17a-7 of the 1940 Act. Interfund trades are included within the respective purchases and sales amounts shown in the Purchases and Sales of Investments note.
6. Committed Line of Credit.
The Fund participates with other funds managed by the investment adviser or an affiliate in a $4.25 billion credit facility (the "line of credit") to be utilized for temporary or emergency purposes to fund shareholder redemptions or for other short-term liquidity purposes. The Fund has agreed to pay commitment fees on its pro-rata portion of the line of credit, which amounted to $2,058 and is reflected in Miscellaneous expenses on the Statement of Operations. During the period, the Fund did not borrow on this line of credit.
7. Security Lending.
The Fund lends portfolio securities through a lending agent from time to time in order to earn additional income. On the settlement date of the loan, the Fund receives collateral (in the form of U.S. Treasury obligations, letters of credit and/or cash) against the loaned securities and maintains collateral in an amount not less than 100% of the market value of the loaned securities during the period of the loan. The market value of the loaned securities is determined at the close of business of the Fund and any additional required collateral is delivered to the Fund on the next business day. The Fund or borrower may terminate the loan at any time, and if the borrower defaults on its obligation to return the securities loaned because of insolvency or other reasons, the Fund may apply collateral received from the borrower against the obligation. The Fund may experience delays and costs in recovering the securities loaned. Any cash collateral received is invested in the Fidelity Securities Lending Cash Central Fund. The value of loaned securities and cash collateral at period end are disclosed on the Fund's Statement of Assets and Liabilities. Security lending income represents the income earned on investing cash collateral, less rebates paid to borrowers and any lending agent fees associated with the loan, plus any premium payments received for lending certain types of securities. Security lending income is presented in the Statement of Operations as a component of income from Fidelity Central Funds. Total security lending income during the period amounted to $173,746.
8. Expense Reductions.
Commissions paid to certain brokers with whom the investment adviser, or its affiliates, places trades on behalf of the Fund include an amount in addition to trade execution, which may be rebated back to the Fund to offset certain expenses. This amount totaled $34,057 for the period. In addition, through arrangements with the Fund's custodian, credits realized as a result of certain uninvested cash balances were used to reduce the Fund's expenses. During the period, these credits reduced the Fund's custody expenses by $52.
In addition, during the period the investment adviser reimbursed and/or waived a portion of fund-level operating expenses in the amount of $10,923.
9. Distributions to Shareholders.
Distributions to shareholders of each class were as follows:
| | Six months ended January 31, 2016 | Year ended July 31, 2015 |
| From net realized gain | | |
| Class A | $80,223,535 | $79,203,094 |
| Class T | 20,669,994 | 27,289,653 |
| Class B | 758,774 | 1,660,970 |
| Class C | 52,885,499 | 39,451,396 |
| Class I | 45,759,042 | 41,061,480 |
| Total | $200,296,844 | $188,666,593 |
10. Share Transactions.
Share transactions for each class were as follows and may contain automatic conversions between classes or exchanges between affiliated funds:
| | Shares | Shares | Dollars | Dollars |
| | Six months ended January 31, 2016 | Year ended July 31, 2015 | Six months ended January 31, 2016 | Year ended July 31, 2015 |
| Class A | | | | |
| Shares sold | 6,167,784 | 16,613,714 | $240,057,288 | $685,795,856 |
| Reinvestment of distributions | 1,936,618 | 1,907,379 | 75,411,924 | 71,987,733 |
| Shares redeemed | (5,139,089) | (4,365,455) | (194,239,025) | (177,799,342) |
| Net increase (decrease) | 2,965,313 | 14,155,638 | $121,230,187 | $579,984,247 |
| Class T | | | | |
| Shares sold | 893,590 | 2,292,430 | $32,521,292 | $89,470,281 |
| Reinvestment of distributions | 545,495 | 737,547 | 20,019,680 | 26,321,410 |
| Shares redeemed | (930,246) | (905,351) | (32,765,322) | (35,007,523) |
| Net increase (decrease) | 508,839 | 2,124,626 | $19,775,650 | $80,784,168 |
| Class B | | | | |
| Shares sold | 13,031 | 49,985 | $424,415 | $1,711,713 |
| Reinvestment of distributions | 22,031 | 47,751 | 711,834 | 1,514,650 |
| Shares redeemed | (101,669) | (172,141) | (3,212,121) | (5,890,995) |
| Net increase (decrease) | (66,607) | (74,405) | $(2,075,872) | $(2,664,632) |
| Class C | | | | |
| Shares sold | 4,687,635 | 12,628,362 | $149,930,726 | $437,473,337 |
| Reinvestment of distributions | 1,474,771 | 1,088,220 | 47,059,934 | 34,383,515 |
| Shares redeemed | (2,875,954) | (1,445,818) | (87,839,368) | (49,753,436) |
| Net increase (decrease) | 3,286,452 | 12,270,764 | $109,151,292 | $422,103,416 |
| Class I | | | | |
| Shares sold | 5,178,904 | 13,587,551 | $215,580,442 | $597,091,181 |
| Reinvestment of distributions | 979,448 | 926,189 | 41,117,225 | 37,490,066 |
| Shares redeemed | (7,564,319) | (4,637,021) | (307,930,014) | (204,139,010) |
| Net increase (decrease) | (1,405,967) | 9,876,719 | $(51,232,347) | $430,442,237 |
11. Other.
The Fund's organizational documents provide former and current trustees and officers with a limited indemnification against liabilities arising in connection with the performance of their duties to the Fund. In the normal course of business, the Fund may also enter into contracts that provide general indemnifications. The Fund's maximum exposure under these arrangements is unknown as this would be dependent on future claims that may be made against the Fund. The risk of material loss from such claims is considered remote.
Fidelity Advisor® Industrials Fund
Investment Summary (Unaudited)
Top Ten Stocks as of January 31, 2016
| | % of fund's net assets | % of fund's net assets 6 months ago |
| General Electric Co. | 14.9 | 12.1 |
| Danaher Corp. | 7.0 | 7.7 |
| J.B. Hunt Transport Services, Inc. | 5.4 | 5.4 |
| Honeywell International, Inc. | 5.2 | 4.0 |
| United Technologies Corp. | 4.5 | 5.8 |
| General Dynamics Corp. | 4.4 | 2.7 |
| Southwest Airlines Co. | 4.2 | 0.0 |
| Raytheon Co. | 4.1 | 2.9 |
| AECOM | 3.9 | 2.7 |
| Northrop Grumman Corp. | 2.8 | 0.0 |
| | 56.4 | |
Top Industries (% of fund's net assets)
| As of January 31, 2016 |
| | Aerospace & Defense | 30.3% |
| | Industrial Conglomerates | 21.9% |
| | Road & Rail | 6.4% |
| | Machinery | 5.4% |
| | Trading Companies & Distributors | 5.1% |
| | All Others* | 30.9% |
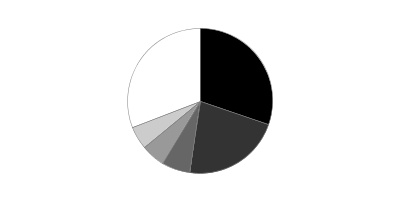
| As of July 31, 2015 |
| | Aerospace & Defense | 26.4% |
| | Industrial Conglomerates | 19.8% |
| | Road & Rail | 10.3% |
| | Electrical Equipment | 7.1% |
| | Machinery | 6.7% |
| | All Others* | 29.7% |

* Includes Short-Term investments and Net Other Assets (Liabilities).
Percentages shown as 0.0% may reflect amounts less than 0.05%.
Fidelity Advisor® Industrials Fund
Investments January 31, 2016 (Unaudited)
Showing Percentage of Net Assets
| Common Stocks - 98.8% | | | |
| | | Shares | Value |
| Aerospace & Defense - 30.3% | | | |
| Aerospace & Defense - 30.3% | | | |
| BWX Technologies, Inc. | | 340,500 | $10,194,570 |
| General Dynamics Corp. | | 187,462 | 25,076,792 |
| Honeywell International, Inc. | | 292,933 | 30,230,686 |
| Northrop Grumman Corp. | | 86,800 | 16,063,208 |
| Orbital ATK, Inc. | | 126,669 | 11,429,344 |
| Raytheon Co. | | 183,700 | 23,557,688 |
| Rockwell Collins, Inc. | | 103,500 | 8,371,080 |
| Teledyne Technologies, Inc. (a) | | 156,965 | 12,753,406 |
| Textron, Inc. | | 323,978 | 11,086,527 |
| United Technologies Corp. | | 296,151 | 25,969,481 |
| | | | 174,732,782 |
| Air Freight & Logistics - 4.2% | | | |
| Air Freight & Logistics - 4.2% | | | |
| C.H. Robinson Worldwide, Inc. | | 134,800 | 8,730,996 |
| FedEx Corp. | | 115,232 | 15,312,028 |
| | | | 24,043,024 |
| Airlines - 4.2% | | | |
| Airlines - 4.2% | | | |
| Southwest Airlines Co. | | 642,400 | 24,167,088 |
| Building Products - 4.2% | | | |
| Building Products - 4.2% | | | |
| A.O. Smith Corp. | | 201,242 | 14,056,754 |
| Caesarstone Sdot-Yam Ltd. (a) | | 60,392 | 2,270,135 |
| Lennox International, Inc. | | 63,804 | 7,644,995 |
| | | | 23,971,884 |
| Commercial Services & Supplies - 4.0% | | | |
| Commercial Printing - 0.7% | | | |
| Deluxe Corp. | | 72,000 | 4,024,800 |
| Environmental & Facility Services - 1.0% | | | |
| Stericycle, Inc. (a) | | 49,100 | 5,909,185 |
| Office Services & Supplies - 2.3% | | | |
| Regus PLC | | 1,055,300 | 4,461,076 |
| West Corp. | | 490,532 | 8,883,535 |
| | | | 13,344,611 |
|
| TOTAL COMMERCIAL SERVICES & SUPPLIES | | | 23,278,596 |
|
| Construction & Engineering - 3.9% | | | |
| Construction & Engineering - 3.9% | | | |
| AECOM (a) | | 807,721 | 22,163,864 |
| Diversified Consumer Services - 1.6% | | | |
| Specialized Consumer Services - 1.6% | | | |
| ServiceMaster Global Holdings, Inc. (a) | | 222,000 | 9,370,620 |
| Electrical Equipment - 4.6% | | | |
| Electrical Components & Equipment - 4.6% | | | |
| AMETEK, Inc. | | 253,800 | 11,941,290 |
| Eaton Corp. PLC | | 292,500 | 14,774,175 |
| | | | 26,715,465 |
| Energy Equipment & Services - 0.1% | | | |
| Oil & Gas Equipment & Services - 0.1% | | | |
| Aspen Aerogels, Inc. (a) | | 140,385 | 612,079 |
| Industrial Conglomerates - 21.9% | | | |
| Industrial Conglomerates - 21.9% | | | |
| Danaher Corp. | | 463,232 | 40,139,053 |
| General Electric Co. | | 2,946,848 | 85,753,276 |
| | | | 125,892,329 |
| Machinery - 5.4% | | | |
| Construction Machinery & Heavy Trucks - 1.3% | | | |
| Wabtec Corp. | | 114,600 | 7,328,670 |
| Industrial Machinery - 4.1% | | | |
| IDEX Corp. | | 178,529 | 12,945,138 |
| Ingersoll-Rand PLC | | 211,400 | 10,880,758 |
| | | | 23,825,896 |
|
| TOTAL MACHINERY | | | 31,154,566 |
|
| Professional Services - 2.9% | | | |
| Research & Consulting Services - 2.9% | | | |
| CEB, Inc. | | 113,054 | 6,667,925 |
| Verisk Analytics, Inc. (a) | | 140,944 | 10,288,912 |
| | | | 16,956,837 |
| Road & Rail - 6.4% | | | |
| Trucking - 6.4% | | | |
| J.B. Hunt Transport Services, Inc. | | 429,184 | 31,201,677 |
| Old Dominion Freight Lines, Inc. (a) | | 100,200 | 5,493,966 |
| | | | 36,695,643 |
| Trading Companies & Distributors - 5.1% | | | |
| Trading Companies & Distributors - 5.1% | | | |
| AerCap Holdings NV (a) | | 358,800 | 11,018,748 |
| HD Supply Holdings, Inc. (a) | | 534,306 | 14,036,219 |
| Wolseley PLC | | 86,148 | 4,273,515 |
| | | | 29,328,482 |
| TOTAL COMMON STOCKS | | | |
| (Cost $524,440,761) | | | 569,083,259 |
|
| Money Market Funds - 1.8% | | | |
| Fidelity Cash Central Fund, 0.38% (b) | | | |
| (Cost $10,414,512) | | 10,414,512 | 10,414,512 |
| TOTAL INVESTMENT PORTFOLIO - 100.6% | | | |
| (Cost $534,855,273) | | | 579,497,771 |
| NET OTHER ASSETS (LIABILITIES) - (0.6)% | | | (3,698,289) |
| NET ASSETS - 100% | | | $575,799,482 |
Legend
(a) Non-income producing
(b) Affiliated fund that is generally available only to investment companies and other accounts managed by Fidelity Investments. The rate quoted is the annualized seven-day yield of the fund at period end. A complete unaudited listing of the fund's holdings as of its most recent quarter end is available upon request. In addition, each Fidelity Central Fund's financial statements are available on the SEC's website or upon request.
Affiliated Central Funds
Information regarding fiscal year to date income earned by the Fund from investments in Fidelity Central Funds is as follows:
| Fund | Income earned |
| Fidelity Cash Central Fund | $3,825 |
| Fidelity Securities Lending Cash Central Fund | 2,285 |
| Total | $6,110 |
Investment Valuation
The following is a summary of the inputs used, as of January 31, 2016, involving the Fund's assets and liabilities carried at fair value. The inputs or methodology used for valuing securities may not be an indication of the risk associated with investing in those securities. For more information on valuation inputs, and their aggregation into the levels used below, please refer to the Investment Valuation section in the accompanying Notes to Financial Statements.
| | Valuation Inputs at Reporting Date: |
| Description | Total | Level 1 | Level 2 | Level 3 |
| Investments in Securities: | | | | |
| Common Stocks | $569,083,259 | $560,348,668 | $8,734,591 | $-- |
| Money Market Funds | 10,414,512 | 10,414,512 | -- | -- |
| Total Investments in Securities: | $579,497,771 | $570,763,180 | $8,734,591 | $-- |
See accompanying notes which are an integral part of the financial statements.
Fidelity Advisor® Industrials Fund
Financial Statements
Statement of Assets and Liabilities
| | | January 31, 2016 (Unaudited) |
| Assets | | |
Investment in securities, at value — See accompanying schedule:
Unaffiliated issuers (cost $524,440,761) | $569,083,259 | |
| Fidelity Central Funds (cost $10,414,512) | 10,414,512 | |
| Total Investments (cost $534,855,273) | | $579,497,771 |
| Receivable for investments sold | | 2,642,135 |
| Receivable for fund shares sold | | 515,617 |
| Dividends receivable | | 284,663 |
| Distributions receivable from Fidelity Central Funds | | 1,280 |
| Prepaid expenses | | 3,197 |
| Other receivables | | 5,579 |
| Total assets | | 582,950,242 |
| Liabilities | | |
| Payable for investments purchased | $4,724,816 | |
| Payable for fund shares redeemed | 1,818,662 | |
| Accrued management fee | 268,942 | |
| Distribution and service plan fees payable | 180,556 | |
| Other affiliated payables | 128,521 | |
| Other payables and accrued expenses | 29,263 | |
| Total liabilities | | 7,150,760 |
| Net Assets | | $575,799,482 |
| Net Assets consist of: | | |
| Paid in capital | | $525,172,017 |
| Distributions in excess of net investment income | | (252,463) |
| Accumulated undistributed net realized gain (loss) on investments and foreign currency transactions | | 6,239,022 |
| Net unrealized appreciation (depreciation) on investments and assets and liabilities in foreign currencies | | 44,640,906 |
| Net Assets | | $575,799,482 |
| Calculation of Maximum Offering Price | | |
| Class A: | | |
| Net Asset Value and redemption price per share ($261,929,038 ÷ 8,515,940 shares) | | $30.76 |
| Maximum offering price per share (100/94.25 of $30.76) | | $32.64 |
| Class T: | | |
| Net Asset Value and redemption price per share ($72,848,359 ÷ 2,416,023 shares) | | $30.15 |
| Maximum offering price per share (100/96.50 of $30.15) | | $31.24 |
| Class B: | | |
| Net Asset Value and offering price per share ($4,053,361 ÷ 146,061 shares)(a) | | $27.75 |
| Class C: | | |
| Net Asset Value and offering price per share ($107,545,474 ÷ 3,837,703 shares)(a) | | $28.02 |
| Class I: | | |
| Net Asset Value, offering price and redemption price per share ($129,423,250 ÷ 4,022,052 shares) | | $32.18 |
(a) Redemption price per share is equal to net asset value less any applicable contingent deferred sales charge.
See accompanying notes which are an integral part of the financial statements.
Statement of Operations
| | | Six months ended January 31, 2016 (Unaudited) |
| Investment Income | | |
| Dividends | | $5,021,437 |
| Income from Fidelity Central Funds | | 6,110 |
| Total income | | 5,027,547 |
| Expenses | | |
| Management fee | $1,847,226 | |
| Transfer agent fees | 681,194 | |
| Distribution and service plan fees | 1,215,474 | |
| Accounting and security lending fees | 121,397 | |
| Custodian fees and expenses | 7,533 | |
| Independent trustees' compensation | 6,473 | |
| Registration fees | 52,460 | |
| Audit | 23,031 | |
| Legal | 3,791 | |
| Interest | 193 | |
| Miscellaneous | 3,957 | |
| Total expenses before reductions | 3,962,729 | |
| Expense reductions | (13,498) | 3,949,231 |
| Net investment income (loss) | | 1,078,316 |
| Realized and Unrealized Gain (Loss) | | |
| Net realized gain (loss) on: | | |
| Investment securities: | | |
| Unaffiliated issuers | 12,625,704 | |
| Foreign currency transactions | 2,943 | |
| Total net realized gain (loss) | | 12,628,647 |
Change in net unrealized appreciation (depreciation) on:
Investment securities | (79,027,194) | |
| Assets and liabilities in foreign currencies | (1,117) | |
| Total change in net unrealized appreciation (depreciation) | | (79,028,311) |
| Net gain (loss) | | (66,399,664) |
| Net increase (decrease) in net assets resulting from operations | | $(65,321,348) |
See accompanying notes which are an integral part of the financial statements.
Statement of Changes in Net Assets
| | Six months ended January 31, 2016 (Unaudited) | Year ended July 31, 2015 |
| Increase (Decrease) in Net Assets | | |
| Operations | | |
| Net investment income (loss) | $1,078,316 | $3,071,370 |
| Net realized gain (loss) | 12,628,647 | 72,042,724 |
| Change in net unrealized appreciation (depreciation) | (79,028,311) | (8,021,862) |
| Net increase (decrease) in net assets resulting from operations | (65,321,348) | 67,092,232 |
| Distributions to shareholders from net investment income | (2,537,760) | (2,601,876) |
| Distributions to shareholders from net realized gain | (58,090,566) | (62,327,818) |
| Total distributions | (60,628,326) | (64,929,694) |
| Share transactions - net increase (decrease) | (75,434,336) | (97,329,347) |
| Redemption fees | 8,062 | 26,890 |
| Total increase (decrease) in net assets | (201,375,948) | (95,139,919) |
| Net Assets | | |
| Beginning of period | 777,175,430 | 872,315,349 |
| End of period (including distributions in excess of net investment income of $252,463 and undistributed net investment income of $1,206,981, respectively) | $575,799,482 | $777,175,430 |
See accompanying notes which are an integral part of the financial statements.
Financial Highlights — Fidelity Advisor Industrials Fund Class A
| | Six months ended (Unaudited) | Years ended July 31, | | | | |
| January 31, | 2016 | 2015 | 2014 | 2013 | 2012 | 2011 |
| Selected Per–Share Data | | | | | | |
| Net asset value, beginning of period | $37.06 | $36.92 | $34.50 | $26.18 | $25.73 | $21.54 |
| Income from Investment Operations | | | | | | |
| Net investment income (loss)A | .07 | .17 | .13 | .23 | .20 | .09 |
| Net realized and unrealized gain (loss) | (3.34) | 2.76 | 4.01 | 8.33 | .61 | 4.13 |
| Total from investment operations | (3.27) | 2.93 | 4.14 | 8.56 | .81 | 4.22 |
| Distributions from net investment income | (.14) | (.11) | (.15) | (.24) | (.11) | (.03) |
| Distributions from net realized gain | (2.89) | (2.68) | (1.58) | – | (.25) | – |
| Total distributions | (3.03) | (2.79) | (1.72)B | (.24) | (.36) | (.03) |
| Redemption fees added to paid in capitalA,C | – | – | – | – | – | – |
| Net asset value, end of period | $30.76 | $37.06 | $36.92 | $34.50 | $26.18 | $25.73 |
| Total ReturnD,E,F | (9.04)% | 8.17% | 12.52% | 32.92% | 3.42% | 19.59% |
| Ratios to Average Net AssetsG,H | | | | | | |
| Expenses before reductions | 1.07%I | 1.06% | 1.09% | 1.11% | 1.14% | 1.13% |
| Expenses net of fee waivers, if any | 1.07%I | 1.06% | 1.09% | 1.11% | 1.14% | 1.13% |
| Expenses net of all reductions | 1.06%I | 1.06% | 1.09% | 1.11% | 1.14% | 1.13% |
| Net investment income (loss) | .43%I | .46% | .37% | .77% | .80% | .36% |
| Supplemental Data | | | | | | |
| Net assets, end of period (000 omitted) | $261,929 | $333,405 | $378,826 | $271,512 | $192,038 | $228,106 |
| Portfolio turnover rateJ | 53%I | 70% | 57% | 78% | 82% | 75% |
A Calculated based on average shares outstanding during the period.
B Total distributions of $1.72 per share is comprised of distributions from net investment income of $.146 and distributions from net realized gain of $1.577 per share.
C Amount represents less than $.005 per share.
D Total returns for periods of less than one year are not annualized.
E Total returns would have been lower if certain expenses had not been reduced during the applicable periods shown.
F Total returns do not include the effect of the sales charges.
G Fees and expenses of any underlying Fidelity Central Funds are not included in the Fund's expense ratio. The Fund indirectly bears its proportionate share of the expenses of any underlying Fidelity Central Funds.
H Expense ratios reflect operating expenses of the class. Expenses before reductions do not reflect amounts reimbursed by the investment adviser or reductions from brokerage service arrangements or reductions from other expense offset arrangements and do not represent the amount paid by the class during periods when reimbursements or reductions occur. Expenses net of fee waivers reflect expenses after reimbursement by the investment adviser but prior to reductions from brokerage service arrangements or other expense offset arrangements. Expenses net of all reductions represent the net expenses paid by the class.
I Annualized
J Amount does not include the portfolio activity of any underlying Fidelity Central Funds.
See accompanying notes which are an integral part of the financial statements.
Financial Highlights — Fidelity Advisor Industrials Fund Class T
| | Six months ended (Unaudited) | Years ended July 31, | | | | |
| January 31, | 2016 | 2015 | 2014 | 2013 | 2012 | 2011 |
| Selected Per–Share Data | | | | | | |
| Net asset value, beginning of period | $36.35 | $36.29 | $33.93 | $25.75 | $25.33 | $21.24 |
| Income from Investment Operations | | | | | | |
| Net investment income (loss)A | .03 | .07 | .04 | .15 | .13 | .03 |
| Net realized and unrealized gain (loss) | (3.28) | 2.71 | 3.95 | 8.20 | .61 | 4.07 |
| Total from investment operations | (3.25) | 2.78 | 3.99 | 8.35 | .74 | 4.10 |
| Distributions from net investment income | (.06) | (.05) | (.06) | (.17) | (.07) | (.01) |
| Distributions from net realized gain | (2.89) | (2.67) | (1.58) | – | (.25) | – |
| Total distributions | (2.95) | (2.72) | (1.63)B | (.17) | (.32) | (.01) |
| Redemption fees added to paid in capitalA,C | – | – | – | – | – | – |
| Net asset value, end of period | $30.15 | $36.35 | $36.29 | $33.93 | $25.75 | $25.33 |
| Total ReturnD,E,F | (9.18)% | 7.88% | 12.27% | 32.60% | 3.15% | 19.28% |
| Ratios to Average Net AssetsG,H | | | | | | |
| Expenses before reductions | 1.33%I | 1.33% | 1.33% | 1.37% | 1.40% | 1.39% |
| Expenses net of fee waivers, if any | 1.33%I | 1.32% | 1.33% | 1.37% | 1.40% | 1.39% |
| Expenses net of all reductions | 1.33%I | 1.32% | 1.33% | 1.36% | 1.39% | 1.38% |
| Net investment income (loss) | .16%I | .20% | .12% | .52% | .54% | .10% |
| Supplemental Data | | | | | | |
| Net assets, end of period (000 omitted) | $72,848 | $88,116 | $90,509 | $79,172 | $63,954 | $71,542 |
| Portfolio turnover rateJ | 53%I | 70% | 57% | 78% | 82% | 75% |
A Calculated based on average shares outstanding during the period.
B Total distributions of $1.63 per share is comprised of distributions from net investment income of $.057 and distributions from net realized gain of $1.577 per share.
C Amount represents less than $.005 per share.
D Total returns for periods of less than one year are not annualized.
E Total returns would have been lower if certain expenses had not been reduced during the applicable periods shown.
F Total returns do not include the effect of the sales charges.
G Fees and expenses of any underlying Fidelity Central Funds are not included in the Fund's expense ratio. The Fund indirectly bears its proportionate share of the expenses of any underlying Fidelity Central Funds.
H Expense ratios reflect operating expenses of the class. Expenses before reductions do not reflect amounts reimbursed by the investment adviser or reductions from brokerage service arrangements or reductions from other expense offset arrangements and do not represent the amount paid by the class during periods when reimbursements or reductions occur. Expenses net of fee waivers reflect expenses after reimbursement by the investment adviser but prior to reductions from brokerage service arrangements or other expense offset arrangements. Expenses net of all reductions represent the net expenses paid by the class.
I Annualized
J Amount does not include the portfolio activity of any underlying Fidelity Central Funds.
See accompanying notes which are an integral part of the financial statements.
Financial Highlights — Fidelity Advisor Industrials Fund Class B
| | Six months ended (Unaudited) | Years ended July 31, | | | | |
| January 31, | 2016 | 2015 | 2014 | 2013 | 2012 | 2011 |
| Selected Per–Share Data | | | | | | |
| Net asset value, beginning of period | $33.72 | $34.02 | $31.97 | $24.29 | $23.99 | $20.22 |
| Income from Investment Operations | | | | | | |
| Net investment income (loss)A | (.05) | (.11) | (.14) | (.01) | –B | (.11) |
| Net realized and unrealized gain (loss) | (3.03) | 2.52 | 3.71 | 7.74 | .57 | 3.88 |
| Total from investment operations | (3.08) | 2.41 | 3.57 | 7.73 | .57 | 3.77 |
| Distributions from net investment income | – | (.03) | – | (.05) | (.02) | – |
| Distributions from net realized gain | (2.89) | (2.68) | (1.52) | – | (.25) | – |
| Total distributions | (2.89) | (2.71) | (1.52) | (.05) | (.27) | – |
| Redemption fees added to paid in capitalA,B | – | – | – | – | – | – |
| Net asset value, end of period | $27.75 | $33.72 | $34.02 | $31.97 | $24.29 | $23.99 |
| Total ReturnC,D,E | (9.39)% | 7.29% | 11.64% | 31.87% | 2.59% | 18.64% |
| Ratios to Average Net AssetsF,G | | | | | | |
| Expenses before reductions | 1.86%H | 1.86% | 1.88% | 1.92% | 1.94% | 1.93% |
| Expenses net of fee waivers, if any | 1.85%H | 1.85% | 1.88% | 1.92% | 1.94% | 1.93% |
| Expenses net of all reductions | 1.85%H | 1.85% | 1.87% | 1.91% | 1.94% | 1.93% |
| Net investment income (loss) | (.36)%H | (.33)% | (.42)% | (.04)% | - %I | (.44)% |
| Supplemental Data | | | | | | |
| Net assets, end of period (000 omitted) | $4,053 | $6,698 | $12,459 | $17,502 | $20,058 | $28,600 |
| Portfolio turnover rateJ | 53%H | 70% | 57% | 78% | 82% | 75% |
A Calculated based on average shares outstanding during the period.
B Amount represents less than $.005 per share.
C Total returns for periods of less than one year are not annualized.
D Total returns would have been lower if certain expenses had not been reduced during the applicable periods shown.
E Total returns do not include the effect of the contingent deferred sales charge.
F Fees and expenses of any underlying Fidelity Central Funds are not included in the Fund's expense ratio. The Fund indirectly bears its proportionate share of the expenses of any underlying Fidelity Central Funds.
G Expense ratios reflect operating expenses of the class. Expenses before reductions do not reflect amounts reimbursed by the investment adviser or reductions from brokerage service arrangements or reductions from other expense offset arrangements and do not represent the amount paid by the class during periods when reimbursements or reductions occur. Expenses net of fee waivers reflect expenses after reimbursement by the investment adviser but prior to reductions from brokerage service arrangements or other expense offset arrangements. Expenses net of all reductions represent the net expenses paid by the class.
H Annualized
I Amount represents less than .005%.
J Amount does not include the portfolio activity of any underlying Fidelity Central Funds.
See accompanying notes which are an integral part of the financial statements.
Financial Highlights — Fidelity Advisor Industrials Fund Class C
| | Six months ended (Unaudited) | Years ended July 31, | | | | |
| January 31, | 2016 | 2015 | 2014 | 2013 | 2012 | 2011 |
| Selected Per–Share Data | | | | | | |
| Net asset value, beginning of period | $34.02 | $34.13 | $32.08 | $24.38 | $24.07 | $20.28 |
| Income from Investment Operations | | | | | | |
| Net investment income (loss)A | (.05) | (.10) | (.13) | .01 | .01 | (.09) |
| Net realized and unrealized gain (loss) | (3.06) | 2.54 | 3.73 | 7.75 | .58 | 3.88 |
| Total from investment operations | (3.11) | 2.44 | 3.60 | 7.76 | .59 | 3.79 |
| Distributions from net investment income | – | – | – | (.06) | (.03) | – |
| Distributions from net realized gain | (2.89) | (2.55) | (1.55) | – | (.25) | – |
| Total distributions | (2.89) | (2.55) | (1.55) | (.06) | (.28) | – |
| Redemption fees added to paid in capitalA,B | – | – | – | – | – | – |
| Net asset value, end of period | $28.02 | $34.02 | $34.13 | $32.08 | $24.38 | $24.07 |
| Total ReturnC,D,E | (9.40)% | 7.36% | 11.71% | 31.90% | 2.67% | 18.69% |
| Ratios to Average Net AssetsF,G | | | | | | |
| Expenses before reductions | 1.82%H | 1.82% | 1.83% | 1.87% | 1.89% | 1.89% |
| Expenses net of fee waivers, if any | 1.82%H | 1.82% | 1.83% | 1.87% | 1.89% | 1.89% |
| Expenses net of all reductions | 1.81%H | 1.81% | 1.83% | 1.86% | 1.88% | 1.88% |
| Net investment income (loss) | (.32)%H | (.30)% | (.38)% | .02% | .05% | (.40)% |
| Supplemental Data | | | | | | |
| Net assets, end of period (000 omitted) | $107,545 | $141,494 | $147,749 | $89,893 | $66,289 | $72,673 |
| Portfolio turnover rateI | 53%H | 70% | 57% | 78% | 82% | 75% |
A Calculated based on average shares outstanding during the period.
B Amount represents less than $.005 per share.
C Total returns for periods of less than one year are not annualized.
D Total returns would have been lower if certain expenses had not been reduced during the applicable periods shown.
E Total returns do not include the effect of the contingent deferred sales charge.
F Fees and expenses of any underlying Fidelity Central Funds are not included in the Fund's expense ratio. The Fund indirectly bears its proportionate share of the expenses of any underlying Fidelity Central Funds.
G Expense ratios reflect operating expenses of the class. Expenses before reductions do not reflect amounts reimbursed by the investment adviser or reductions from brokerage service arrangements or reductions from other expense offset arrangements and do not represent the amount paid by the class during periods when reimbursements or reductions occur. Expenses net of fee waivers reflect expenses after reimbursement by the investment adviser but prior to reductions from brokerage service arrangements or other expense offset arrangements. Expenses net of all reductions represent the net expenses paid by the class.
H Annualized
I Amount does not include the portfolio activity of any underlying Fidelity Central Funds.
See accompanying notes which are an integral part of the financial statements.
Financial Highlights — Fidelity Advisor Industrials Fund Class I
| | Six months ended (Unaudited) | Years ended July 31, | | | | |
| January 31, | 2016 | 2015 | 2014 | 2013 | 2012 | 2011 |
| Selected Per–Share Data | | | | | | |
| Net asset value, beginning of period | $38.67 | $38.42 | $35.83 | $27.18 | $26.69 | $22.30 |
| Income from Investment Operations | | | | | | |
| Net investment income (loss)A | .12 | .28 | .25 | .33 | .28 | .17 |
| Net realized and unrealized gain (loss) | (3.48) | 2.87 | 4.16 | 8.64 | .63 | 4.28 |
| Total from investment operations | (3.36) | 3.15 | 4.41 | 8.97 | .91 | 4.45 |
| Distributions from net investment income | (.24) | (.22) | (.24) | (.32) | (.17) | (.06) |
| Distributions from net realized gain | (2.89) | (2.68) | (1.58) | – | (.25) | – |
| Total distributions | (3.13) | (2.90) | (1.82) | (.32) | (.42) | (.06) |
| Redemption fees added to paid in capitalA,B | – | – | – | – | – | – |
| Net asset value, end of period | $32.18 | $38.67 | $38.42 | $35.83 | $27.18 | $26.69 |
| Total ReturnC,D | (8.91)% | 8.45% | 12.82% | 33.28% | 3.72% | 19.95% |
| Ratios to Average Net AssetsE,F | | | | | | |
| Expenses before reductions | .80%G | .80% | .81% | .84% | .85% | .85% |
| Expenses net of fee waivers, if any | .80%G | .80% | .81% | .84% | .85% | .85% |
| Expenses net of all reductions | .79%G | .79% | .81% | .83% | .85% | .84% |
| Net investment income (loss) | .70%G | .72% | .64% | 1.04% | 1.08% | .65% |
| Supplemental Data | | | | | | |
| Net assets, end of period (000 omitted) | $129,423 | $207,462 | $242,772 | $84,780 | $42,850 | $68,323 |
| Portfolio turnover rateH | 53%G | 70% | 57% | 78% | 82% | 75% |
A Calculated based on average shares outstanding during the period.
B Amount represents less than $.005 per share.
C Total returns for periods of less than one year are not annualized.
D Total returns would have been lower if certain expenses had not been reduced during the applicable periods shown.
E Fees and expenses of any underlying Fidelity Central Funds are not included in the Fund's expense ratio. The Fund indirectly bears its proportionate share of the expenses of any underlying Fidelity Central Funds.
F Expense ratios reflect operating expenses of the class. Expenses before reductions do not reflect amounts reimbursed by the investment adviser or reductions from brokerage service arrangements or reductions from other expense offset arrangements and do not represent the amount paid by the class during periods when reimbursements or reductions occur. Expenses net of fee waivers reflect expenses after reimbursement by the investment adviser but prior to reductions from brokerage service arrangements or other expense offset arrangements. Expenses net of all reductions represent the net expenses paid by the class.
G Annualized
H Amount does not include the portfolio activity of any underlying Fidelity Central Funds.
See accompanying notes which are an integral part of the financial statements.
Notes to Financial Statements (Unaudited)
For the period ended January 31, 2016
1. Organization.
Fidelity Advisor Industrials Fund (the Fund) is a non-diversified fund of Fidelity Advisor Series VII (the Trust) and is authorized to issue an unlimited number of shares. The Trust is registered under the Investment Company Act of 1940, as amended (the 1940 Act), as an open-end management investment company organized as a Massachusetts business trust. The Fund offers Class A, Class T, Class C and Class I shares, each of which, along with Class B shares, has equal rights as to assets and voting privileges. Class B shares are closed to new accounts and additional purchases, except for exchanges and reinvestments. Each class has exclusive voting rights with respect to matters that affect that class. Class B shares will automatically convert to Class A shares after a holding period of seven years from the initial date of purchase.
During the period, the Board of Trustees approved the conversion of all existing Class B shares into Class A shares, effective on or about July 1, 2016, regardless of the length of times shares have been held.
2. Investments in Fidelity Central Funds.
The Fund invests in Fidelity Central Funds, which are open-end investment companies generally available only to other investment companies and accounts managed by the investment adviser and its affiliates. The Fund's Schedule of Investments lists each of the Fidelity Central Funds held as of period end, if any, as an investment of the Fund, but does not include the underlying holdings of each Fidelity Central Fund. As an Investing Fund, the Fund indirectly bears its proportionate share of the expenses of the underlying Fidelity Central Funds.
The Money Market Central Funds seek preservation of capital and current income and are managed by Fidelity Investments Money Management, Inc. (FIMM), an affiliate of the investment adviser. Annualized expenses of the Money Market Central Funds as of their most recent shareholder report date are less than .005%.
A complete unaudited list of holdings for each Fidelity Central Fund is available upon request or at the Securities and Exchange Commission (the SEC) website at www.sec.gov. In addition, the financial statements of the Fidelity Central Funds are available on the SEC website or upon request.
3. Significant Accounting Policies.
The financial statements have been prepared in conformity with accounting principles generally accepted in the United States of America (GAAP), which require management to make certain estimates and assumptions at the date of the financial statements. Actual results could differ from those estimates. Subsequent events, if any, through the date that the financial statements were issued have been evaluated in the preparation of the financial statements. The following summarizes the significant accounting policies of the Fund:
Investment Valuation. Investments are valued as of 4:00 p.m. Eastern time on the last calendar day of the period. The Board of Trustees (the Board) has delegated the day to day responsibility for the valuation of the Fund's investments to the Fidelity SelectCo, LLC (SelectCo) Fair Value Committee (the Committee). In accordance with valuation policies and procedures approved by the Board, the Fund attempts to obtain prices from one or more third party pricing vendors or brokers to value its investments. When current market prices, quotations or currency exchange rates are not readily available or reliable, investments will be fair valued in good faith by the Committee, in accordance with procedures adopted by the Board. Factors used in determining fair value vary by investment type and may include market or investment specific events. The frequency with which these procedures are used cannot be predicted and they may be utilized to a significant extent. The Committee oversees the Fund's valuation policies and procedures and reports to the Board on the Committee's activities and fair value determinations. The Board monitors the appropriateness of the procedures used in valuing the Fund's investments and ratifies the fair value determinations of the Committee.
The Fund categorizes the inputs to valuation techniques used to value its investments into a disclosure hierarchy consisting of three levels as shown below:
- Level 1 – quoted prices in active markets for identical investments
- Level 2 – other significant observable inputs (including quoted prices for similar investments, interest rates, prepayment speeds, etc.)
- Level 3 – unobservable inputs (including the Fund's own assumptions based on the best information available)
Valuation techniques used to value the Fund's investments by major category are as follows:
Equity securities, including restricted securities, for which market quotations are readily available, are valued at the last reported sale price or official closing price as reported by a third party pricing vendor on the primary market or exchange on which they are traded and are categorized as Level 1 in the hierarchy. In the event there were no sales during the day or closing prices are not available, securities are valued at the last quoted bid price or may be valued using the last available price and are generally categorized as Level 2 in the hierarchy. For foreign equity securities, when market or security specific events arise, comparisons to the valuation of American Depositary Receipts (ADRs), futures contracts, Exchange-Traded Funds (ETFs) and certain indexes as well as quoted prices for similar securities may be used and would be categorized as Level 2 in the hierarchy. Utilizing these techniques may result in transfers between Level 1 and Level 2. For equity securities, including restricted securities, where observable inputs are limited, assumptions about market activity and risk are used and these securities may be categorized as Level 3 in the hierarchy.
Investments in open-end mutual funds, including the Fidelity Central Funds, are valued at their closing net asset value (NAV) each business day and are categorized as Level 1 in the hierarchy.
Changes in valuation techniques may result in transfers in or out of an assigned level within the disclosure hierarchy. The aggregate value of investments by input level as of January 31, 2016 is included at the end of the Fund's Schedule of Investments.
Foreign Currency. The Fund may use foreign currency contracts to facilitate transactions in foreign-denominated securities. Gains and losses from these transactions may arise from changes in the value of the foreign currency or if the counterparties do not perform under the contracts' terms.
Foreign-denominated assets, including investment securities, and liabilities are translated into U.S. dollars at the exchange rates at period end. Purchases and sales of investment securities, income and dividends received and expenses denominated in foreign currencies are translated into U.S. dollars at the exchange rate in effect on the transaction date.
The effects of exchange rate fluctuations on investments are included with the net realized and unrealized gain (loss) on investment securities. Other foreign currency transactions resulting in realized and unrealized gain (loss) are disclosed separately.
Investment Transactions and Income. For financial reporting purposes, the Fund's investment holdings and NAV include trades executed through the end of the last business day of the period. The NAV per share for processing shareholder transactions is calculated as of the close of business of the New York Stock Exchange (NYSE), normally 4:00 p.m. Eastern time and includes trades executed through the end of the prior business day. Gains and losses on securities sold are determined on the basis of identified cost. Dividend income is recorded on the ex-dividend date, except for certain dividends from foreign securities where the ex-dividend date may have passed, which are recorded as soon as the Fund is informed of the ex-dividend date. Non-cash dividends included in dividend income, if any, are recorded at the fair market value of the securities received. Income and capital gain distributions from Fidelity Central Funds, if any, are recorded on the ex-dividend date. Distributions received on securities that represent a return of capital or capital gain are recorded as a reduction of cost of investments and/or as a realized gain. Subsequent to ex-dividend date the Fund determines the components of these distributions, based upon receipt of tax filings or other correspondence relating to the underlying investment. Investment income is recorded net of foreign taxes withheld where recovery of such taxes is uncertain.
Class Allocations and Expenses. Investment income, realized and unrealized capital gains and losses, common expenses of the Fund, and certain fund-level expense reductions, if any, are allocated daily on a pro-rata basis to each class based on the relative net assets of each class to the total net assets of the Fund. Each class differs with respect to transfer agent and distribution and service plan fees incurred. Certain expense reductions may also differ by class. For the reporting period, the allocated portion of income and expenses to each class as a percent of its average net assets may vary due to the timing of recording these transactions in relation to fluctuating net assets of the classes. Expenses directly attributable to a fund are charged to that fund. Expenses attributable to more than one fund are allocated among the respective funds on the basis of relative net assets or other appropriate methods. Expense estimates are accrued in the period to which they relate and adjustments are made when actual amounts are known.
Income Tax Information and Distributions to Shareholders. Each year, the Fund intends to qualify as a regulated investment company under Subchapter M of the Internal Revenue Code, including distributing substantially all of its taxable income and realized gains. As a result, no provision for U.S. Federal income taxes is required. The Fund files a U.S. federal tax return, in addition to state and local tax returns as required. The Fund's federal income tax returns are subject to examination by the Internal Revenue Service (IRS) for a period of three fiscal years after they are filed. State and local tax returns may be subject to examination for an additional fiscal year depending on the jurisdiction. Foreign taxes are provided for based on the Fund's understanding of the tax rules and rates that exist in the foreign markets in which it invests.
Distributions are declared and recorded on the ex-dividend date. Income dividends and capital gain distributions are declared separately for each class. Income and capital gain distributions are determined in accordance with income tax regulations, which may differ from GAAP.
Capital accounts within the financial statements are adjusted for permanent book-tax differences. These adjustments have no impact on net assets or the results of operations. Capital accounts are not adjusted for temporary book-tax differences which will reverse in a subsequent period.
Book-tax differences are primarily due to foreign currency transactions and losses deferred due to wash sales.
The federal tax cost of investment securities and unrealized appreciation (depreciation) as of period end were as follows:
| Gross unrealized appreciation | $82,135,573 |
| Gross unrealized depreciation | (39,309,187) |
| Net unrealized appreciation (depreciation) on securities | $42,826,386 |
| Tax cost | $536,671,385 |
Short-Term Trading (Redemption) Fees. Shares held by investors in the Fund less than 30 days may have been subject to a redemption fee equal to .75% of the NAV of shares redeemed. All redemption fees, which reduce the proceeds of the shareholder redemption, are retained by the Fund and accounted for as an addition to paid in capital.
4. Purchases and Sales of Investments.
Purchases and sales of securities, other than short-term securities, aggregated $178,419,237 and $315,785,937, respectively.
5. Fees and Other Transactions with Affiliates.
Management Fee. Fidelity SelectCo, LLC (the investment adviser) and its affiliates provide the Fund with investment management related services for which the Fund pays a monthly management fee. The management fee is the sum of an individual fund fee rate that is based on an annual rate of .30% of the Fund's average net assets and an annualized group fee rate that averaged .25% during the period. The group fee rate is based upon the average net assets of all the mutual funds advised by Fidelity Management & Research Company (FMR) and the investment adviser. The group fee rate decreases as assets under management increase and increases as assets under management decrease. For the reporting period, the total annualized management fee rate was .55% of the Fund's average net assets.
Distribution and Service Plan Fees. In accordance with Rule 12b-1 of the 1940 Act, the Fund has adopted separate Distribution and Service Plans for each class of shares. Certain classes pay Fidelity Distributors Corporation (FDC), an affiliate of the investment adviser, separate Distribution and Service Fees, each of which is based on an annual percentage of each class' average net assets. In addition, FDC may pay financial intermediaries for selling shares of the Fund and providing shareholder support services. For the period, the Distribution and Service Fee rates, total fees and amounts retained by FDC were as follows:
| | Distribution
Fee | Service
Fee | Total Fees | Retained
by FDC |
| Class A | -% | .25% | $368,024 | $– |
| Class T | .25% | .25% | 201,984 | – |
| Class B | .75% | .25% | 26,075 | 19,556 |
| Class C | .75% | .25% | 619,391 | 50,884 |
| | | | $1,215,474 | $70,440 |
Sales Load. FDC may receive a front-end sales charge of up to 5.75% for selling Class A shares and 3.50% for selling Class T shares, some of which is paid to financial intermediaries for selling shares of the Fund. Depending on the holding period, FDC may receive contingent deferred sales charges levied on Class A, Class T, Class B, and Class C redemptions. The deferred sales charges range from 5.00% to 1.00% for Class B shares, 1.00% for Class C shares, 1.00% for certain purchases of Class A shares and .25% for certain purchases of Class T shares.
For the period, sales charge amounts retained by FDC were as follows:
| | Retained
by FDC |
| Class A | $22,165 |
| Class T | 3,081 |
| Class B(a) | 845 |
| Class C(a) | 9,689 |
| | $35,780 |
(a) When Class B and Class C shares are initially sold, FDC pays commissions from its own resources to financial intermediaries through which the sales are made.
Transfer Agent Fees. Fidelity Investments Institutional Operations Company, Inc., (FIIOC), an affiliate of the investment adviser, is the transfer, dividend disbursing and shareholder servicing agent for each class of the Fund. FIIOC receives account fees and asset-based fees that vary according to the account size and type of account of the shareholders of the respective classes of the Fund. FIIOC pays for typesetting, printing and mailing of shareholder reports, except proxy statements.
For the period, transfer agent fees for each class were as follows:
| | Amount | % of
Class-Level Average
Net Assets(a) |
| Class A | $299,904 | .20 |
| Class T | 88,766 | .22 |
| Class B | 6,425 | .25 |
| Class C | 128,774 | .21 |
| Class I | 157,325 | .19 |
| | $681,194 | |
(a) Annualized
Accounting and Security Lending Fees. Fidelity Service Company, Inc. (FSC), an affiliate of the investment adviser, maintains the Fund's accounting records. The accounting fee is based on the level of average net assets for each month. Under a separate contract, FSC administers the security lending program. The security lending fee is based on the number and duration of lending transactions.
Brokerage Commissions. The Fund placed a portion of its portfolio transactions with brokerage firms which are affiliates of the investment adviser. Brokerage commissions are included in net realized gain (loss) and change in net unrealized appreciation (depreciation) in the Statement of Operations. The commissions paid to these affiliated firms were $2,884 for the period.
Interfund Lending Program. Pursuant to an Exemptive Order issued by the SEC, the Fund, along with other registered investment companies having management contracts with FMR or other affiliated entities of FMR, may participate in an interfund lending program. This program provides an alternative credit facility allowing the funds to borrow from, or lend money to, other participating affiliated funds. At period end, there were no interfund loans outstanding. The Fund's activity in this program during the period for which loans were outstanding was as follows:
| Borrower or Lender | Average Loan Balance | Weighted Average Interest Rate | Interest Expense |
| Borrower | $1,810,333 | .36% | $164 |
Interfund Trades. The Fund may purchase from or sell securities to other Fidelity Funds under procedures adopted by the Board. The procedures have been designed to ensure these interfund trades are executed in accordance with Rule 17a-7 of the 1940 Act. Interfund trades are included within the respective purchases and sales amounts shown in the Purchases and Sales of Investments note.
6. Committed Line of Credit.
The Fund participates with other funds managed by the investment adviser or an affiliate in a $4.25 billion credit facility (the "line of credit") to be utilized for temporary or emergency purposes to fund shareholder redemptions or for other short-term liquidity purposes. The Fund has agreed to pay commitment fees on its pro-rata portion of the line of credit, which amounted to $471 and is reflected in Miscellaneous expenses on the Statement of Operations. During the period, the Fund did not borrow on this line of credit.
7. Security Lending.
The Fund lends portfolio securities through a lending agent from time to time in order to earn additional income. On the settlement date of the loan, the Fund receives collateral (in the form of U.S. Treasury obligations, letters of credit and/or cash) against the loaned securities and maintains collateral in an amount not less than 100% of the market value of the loaned securities during the period of the loan. The market value of the loaned securities is determined at the close of business of the Fund and any additional required collateral is delivered to the Fund on the next business day. The Fund or borrower may terminate the loan at any time, and if the borrower defaults on its obligation to return the securities loaned because of insolvency or other reasons, the Fund may apply collateral received from the borrower against the obligation. The Fund may experience delays and costs in recovering the securities loaned. Any cash collateral received is invested in the Fidelity Securities Lending Cash Central Fund. At period end, there were no security loans outstanding. Security lending income represents the income earned on investing cash collateral, less rebates paid to borrowers and any lending agent fees associated with the loan, plus any premium payments received for lending certain types of securities. Security lending income is presented in the Statement of Operations as a component of income from Fidelity Central Funds. Total security lending income during the period amounted to $2,285.
8. Bank Borrowings.
The Fund is permitted to have bank borrowings for temporary or emergency purposes to fund shareholder redemptions or for other short-term liquidity requirements. The Fund has established borrowing arrangements with certain banks. The interest rate on the borrowings is the bank's base rate, as revised from time to time. The average loan balance during the period for which loans were outstanding amounted to $802,500. The weighted average interest rate was .64%. The interest expense amounted to $29 under the bank borrowing program. At period end, there were no bank borrowings outstanding.
9. Expense Reductions.
Commissions paid to certain brokers with whom the investment adviser, or its affiliates, places trades on behalf of the Fund include an amount in addition to trade execution, which may be rebated back to the Fund to offset certain expenses. This amount totaled $11,126 for the period.
In addition, during the period the investment adviser reimbursed and/or waived a portion of fund-level operating expenses in the amount of $2,372.
10. Distributions to Shareholders.
Distributions to shareholders of each class were as follows:
| | Six months ended January 31, 2016 | Year ended July 31, 2015 |
| From net investment income | | |
| Class A | $1,251,437 | $1,073,088 |
| Class T | 142,172 | 117,188 |
| Class B | – | 10,986 |
| Class I | 1,144,151 | 1,400,614 |
| Total | $2,537,760 | $2,601,876 |
| From net realized gain | | |
| Class A | $24,885,132 | $26,712,147 |
| Class T | 6,913,270 | 6,664,310 |
| Class B | 520,980 | 905,701 |
| Class C | 11,465,082 | 11,132,591 |
| Class I | 14,306,102 | 16,913,069 |
| Total | $58,090,566 | $62,327,818 |
11. Share Transactions.
Share transactions for each class were as follows and may contain automatic conversions between classes or exchanges between affiliated funds:
| | Shares | Shares | Dollars | Dollars |
| | Six months ended January 31, 2016 | Year ended July 31, 2015 | Six months ended January 31, 2016 | Year ended July 31, 2015 |
| Class A | | | | |
| Shares sold | 530,811 | 1,896,772 | $17,590,338 | $70,041,684 |
| Reinvestment of distributions | 771,777 | 707,344 | 24,606,761 | 25,707,295 |
| Shares redeemed | (1,783,280) | (3,868,022) | (59,142,240) | (142,586,857) |
| Net increase (decrease) | (480,692) | (1,263,906) | $(16,945,141) | $(46,837,878) |
| Class T | | | | |
| Shares sold | 64,553 | 223,605 | $2,106,828 | $8,111,419 |
| Reinvestment of distributions | 219,403 | 183,489 | 6,858,376 | 6,551,657 |
| Shares redeemed | (292,248) | (477,116) | (9,493,422) | (17,277,571) |
| Net increase (decrease) | (8,292) | (70,022) | $(528,218) | $(2,614,495) |
| Class B | | | | |
| Shares sold | 4,919 | 7,145 | $141,277 | $236,954 |
| Reinvestment of distributions | 16,748 | 23,129 | 482,266 | 769,253 |
| Shares redeemed | (74,228) | (197,915) | (2,238,291) | (6,710,202) |
| Net increase (decrease) | (52,561) | (167,641) | $(1,614,748) | $(5,703,995) |
| Class C | | | | |
| Shares sold | 241,596 | 897,971 | $7,287,189 | $30,459,518 |
| Reinvestment of distributions | 324,873 | 266,310 | 9,447,456 | 8,933,204 |
| Shares redeemed | (888,021) | (1,333,978) | (26,693,312) | (45,225,201) |
| Net increase (decrease) | (321,552) | (169,697) | $(9,958,667) | $(5,832,479) |
| Class I | | | | |
| Shares sold | 480,498 | 2,703,369 | $16,625,183 | $103,567,578 |
| Reinvestment of distributions | 386,271 | 388,187 | 12,880,051 | 14,699,436 |
| Shares redeemed | (2,209,090) | (4,045,495) | (75,892,796) | (154,607,514) |
| Net increase (decrease) | (1,342,321) | (953,939) | $(46,387,562) | $(36,340,500) |
12. Other.
The Fund's organizational documents provide former and current trustees and officers with a limited indemnification against liabilities arising in connection with the performance of their duties to the Fund. In the normal course of business, the Fund may also enter into contracts that provide general indemnifications. The Fund's maximum exposure under these arrangements is unknown as this would be dependent on future claims that may be made against the Fund. The risk of material loss from such claims is considered remote.
Fidelity Advisor® Technology Fund
Investment Summary (Unaudited)
Top Ten Stocks as of January 31, 2016
| | % of fund's net assets | % of fund's net assets 6 months ago |
| Apple, Inc. | 9.8 | 12.9 |
| Alphabet, Inc. Class C | 6.9 | 5.2 |
| Facebook, Inc. Class A | 6.5 | 7.0 |
| Alphabet, Inc. Class A | 6.4 | 5.0 |
| Yahoo!, Inc. | 3.0 | 2.1 |
| Visa, Inc. Class A | 2.7 | 1.6 |
| Marvell Technology Group Ltd. | 2.6 | 1.6 |
| 58.com, Inc. ADR | 2.1 | 0.6 |
| Micron Technology, Inc. | 2.1 | 0.7 |
| Alibaba Group Holding Ltd. sponsored ADR | 2.1 | 1.0 |
| | 44.2 | |
Top Industries (% of fund's net assets)
| As of January 31, 2016 |
| | Internet Software & Services | 32.7% |
| | Semiconductors & Semiconductor Equipment | 17.4% |
| | Software | 12.4% |
| | Technology Hardware, Storage & Peripherals | 12.4% |
| | IT Services | 6.9% |
| | All Others* | 18.2% |
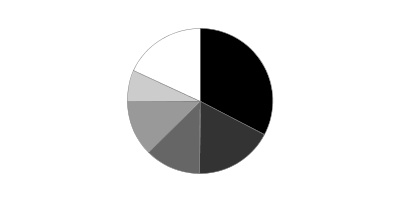
| As of July 31, 2015 |
| | Internet Software & Services | 29.2% |
| | Technology Hardware, Storage & Peripherals | 16.4% |
| | Software | 14.9% |
| | Semiconductors & Semiconductor Equipment | 10.3% |
| | IT Services | 6.1% |
| | All Others* | 23.1% |

* Includes Short-Term investments and Net Other Assets (Liabilities).
Fidelity Advisor® Technology Fund
Investments January 31, 2016 (Unaudited)
Showing Percentage of Net Assets
| Common Stocks - 98.2% | | | |
| | | Shares | Value |
| Automobiles - 1.7% | | | |
| Automobile Manufacturers - 1.7% | | | |
| Tesla Motors, Inc. (a)(b) | | 126,309 | $24,150,281 |
| Banks - 0.1% | | | |
| Diversified Banks - 0.1% | | | |
| Hangzhou Hikvision Digital Technology Co. Ltd. ELS (BNP Paribas Warrant Program) warrants 11/27/17 (a)(c) | | 417,300 | 1,703,331 |
| Biotechnology - 0.2% | | | |
| Biotechnology - 0.2% | | | |
| Genscript Biotech Corp. | | 15,144,000 | 2,702,033 |
| Chemicals - 0.2% | | | |
| Specialty Chemicals - 0.2% | | | |
| Duk San Neolux Co. Ltd. (a) | | 105,097 | 2,436,189 |
| Communications Equipment - 4.1% | | | |
| Communications Equipment - 4.1% | | | |
| Ciena Corp. (a) | | 77,800 | 1,382,506 |
| Cisco Systems, Inc. | | 908,300 | 21,608,457 |
| CommScope Holding Co., Inc. (a) | | 439,800 | 9,860,316 |
| F5 Networks, Inc. (a) | | 51,500 | 4,829,670 |
| Juniper Networks, Inc. | | 78,400 | 1,850,240 |
| Qualcomm, Inc. | | 422,200 | 19,142,548 |
| Radware Ltd. (a) | | 610 | 8,150 |
| | | | 58,681,887 |
| Consumer Finance - 0.0% | | | |
| Consumer Finance - 0.0% | | | |
| LendingClub Corp. (a) | | 700 | 5,166 |
| Diversified Consumer Services - 0.1% | | | |
| Education Services - 0.1% | | | |
| New Oriental Education & Technology Group, Inc. sponsored ADR | | 26,600 | 835,506 |
| TAL Education Group ADR (a) | | 15,400 | 738,738 |
| | | | 1,574,244 |
| Specialized Consumer Services - 0.0% | | | |
| LifeLock, Inc. (a) | | 867 | 10,387 |
|
| TOTAL DIVERSIFIED CONSUMER SERVICES | | | 1,584,631 |
|
| Diversified Telecommunication Services - 0.1% | | | |
| Alternative Carriers - 0.1% | | | |
| 8x8, Inc. (a) | | 72,200 | 906,832 |
| Electrical Equipment - 0.5% | | | |
| Electrical Components & Equipment - 0.5% | | | |
| Lumenpulse, Inc. (a) | | 21,700 | 263,331 |
| Nidec Corp. | | 21,500 | 1,466,920 |
| Sensata Technologies Holding BV (a) | | 165,500 | 6,073,850 |
| | | | 7,804,101 |
| Electronic Equipment & Components - 2.9% | | | |
| Electronic Components - 1.2% | | | |
| Alps Electric Co. Ltd. | | 57,900 | 1,147,955 |
| Largan Precision Co. Ltd. | | 35,000 | 2,500,403 |
| Ledlink Optics, Inc. | | 791,075 | 1,040,199 |
| Murata Manufacturing Co. Ltd. | | 5,900 | 682,441 |
| Samsung SDI Co. Ltd. | | 59,376 | 4,661,787 |
| Sunny Optical Technology Group Co. Ltd. | | 694,100 | 1,489,689 |
| Universal Display Corp. (a) | | 21,800 | 1,070,380 |
| Yageo Corp. | | 2,450,660 | 3,850,412 |
| Yaskawa Electric Corp. | | 1,100 | 12,207 |
| | | | 16,455,473 |
| Electronic Equipment & Instruments - 0.3% | | | |
| Chroma ATE, Inc. | | 1,700,683 | 3,361,002 |
| Cognex Corp. | | 34,600 | 1,115,850 |
| FEI Co. | | 200 | 14,490 |
| | | | 4,491,342 |
| Electronic Manufacturing Services - 1.4% | | | |
| Trimble Navigation Ltd. (a) | | 1,053,796 | 20,327,725 |
| Technology Distributors - 0.0% | | | |
| Digital China Holdings Ltd. (H Shares) | | 23,000 | 23,844 |
|
| TOTAL ELECTRONIC EQUIPMENT & COMPONENTS | | | 41,298,384 |
|
| Health Care Equipment & Supplies - 0.1% | | | |
| Health Care Equipment - 0.1% | | | |
| Intai Technology Corp. | | 517,000 | 1,893,651 |
| Olympus Corp. | | 4,500 | 175,472 |
| | | | 2,069,123 |
| Health Care Providers & Services - 0.0% | | | |
| Managed Health Care - 0.0% | | | |
| HealthEquity, Inc. (a) | | 11,300 | 243,515 |
| Health Care Technology - 1.6% | | | |
| Health Care Technology - 1.6% | | | |
| athenahealth, Inc. (a) | | 66,994 | 9,499,749 |
| Inovalon Holdings, Inc. Class A (b) | | 71,200 | 1,201,856 |
| M3, Inc. | | 31,000 | 711,001 |
| Medidata Solutions, Inc. (a) | | 213,300 | 9,114,309 |
| Veeva Systems, Inc. Class A (a) | | 96,600 | 2,328,060 |
| | | | 22,854,975 |
| Hotels, Restaurants & Leisure - 0.5% | | | |
| Casinos & Gaming - 0.3% | | | |
| 500.com Ltd. sponsored ADR Class A (a)(b) | | 232,100 | 4,168,516 |
| Hotels, Resorts & Cruise Lines - 0.2% | | | |
| Tuniu Corp. Class A sponsored ADR (a)(b) | | 217,908 | 2,782,685 |
|
| TOTAL HOTELS, RESTAURANTS & LEISURE | | | 6,951,201 |
|
| Household Durables - 0.9% | | | |
| Consumer Electronics - 0.9% | | | |
| Sony Corp. | | 216,300 | 5,020,174 |
| Sony Corp. sponsored ADR | | 333,500 | 7,963,980 |
| | | | 12,984,154 |
| Internet & Catalog Retail - 3.0% | | | |
| Internet Retail - 3.0% | | | |
| Amazon.com, Inc. (a) | | 11,000 | 6,457,000 |
| Groupon, Inc. Class A (a)(b) | | 1,910,600 | 5,196,832 |
| JD.com, Inc. sponsored ADR (a) | | 164,800 | 4,289,744 |
| Jumei International Holding Ltd. sponsored ADR (a)(b) | | 1,290,810 | 8,312,816 |
| Liberty Interactive Corp. QVC Group Series A (a) | | 309 | 8,053 |
| MySale Group PLC (a) | | 19,300 | 13,201 |
| Qunar Cayman Islands Ltd. sponsored ADR (a) | | 295,894 | 13,043,008 |
| Vipshop Holdings Ltd. ADR (a) | | 455,600 | 5,849,904 |
| | | | 43,170,558 |
| Internet Software & Services - 31.9% | | | |
| Internet Software & Services - 31.9% | | | |
| 58.com, Inc. ADR (a)(b) | | 545,000 | 30,574,500 |
| Alibaba Group Holding Ltd. sponsored ADR (a) | | 447,800 | 30,016,034 |
| Alphabet, Inc.: | | | |
| Class A | | 120,887 | 92,037,317 |
| Class C | | 133,455 | 99,150,392 |
| Baidu.com, Inc. sponsored ADR (a) | | 100 | 16,327 |
| Benefitfocus, Inc. (a)(b) | | 10,800 | 314,928 |
| Box, Inc. Class A | | 58,500 | 629,460 |
| ChannelAdvisor Corp. (a) | | 108,417 | 1,325,940 |
| Constant Contact, Inc. (a) | | 400 | 12,644 |
| Cornerstone OnDemand, Inc. (a) | | 91,432 | 2,806,048 |
| Cvent, Inc. (a) | | 50,808 | 1,341,839 |
| Demandware, Inc. (a)(b) | | 110,606 | 4,693,013 |
| DeNA Co. Ltd. | | 262,400 | 3,797,749 |
| eBay, Inc. (a) | | 28,700 | 673,302 |
| eGain Communications Corp. (a)(b) | | 64,050 | 239,547 |
| Endurance International Group Holdings, Inc. (a)(b) | | 655,200 | 6,014,736 |
| Envestnet, Inc. (a) | | 245 | 5,745 |
| Facebook, Inc. Class A (a) | | 836,411 | 93,853,678 |
| Hortonworks, Inc. (a)(b) | | 1,500 | 14,550 |
| Instructure, Inc. (a) | | 103,570 | 1,794,868 |
| LinkedIn Corp. Class A (a) | | 51,800 | 10,251,738 |
| Marketo, Inc. (a) | | 178,513 | 3,393,532 |
| NAVER Corp. | | 3,405 | 1,781,666 |
| New Relic, Inc. (a) | | 89,100 | 2,514,402 |
| Q2 Holdings, Inc. (a) | | 700 | 15,162 |
| Rackspace Hosting, Inc. (a) | | 29,439 | 594,962 |
| Renren, Inc. ADR (a)(b) | | 272,700 | 872,640 |
| SciQuest, Inc. (a) | | 210,654 | 2,681,625 |
| SINA Corp. (a) | | 143,198 | 6,579,948 |
| SouFun Holdings Ltd. ADR | | 839,600 | 5,004,016 |
| Textura Corp. (a)(b) | | 280,915 | 4,435,648 |
| Twitter, Inc. (a) | | 27,800 | 467,040 |
| Web.com Group, Inc. (a) | | 203,586 | 3,833,524 |
| Weibo Corp. sponsored ADR (a) | | 800 | 12,176 |
| Xunlei Ltd. sponsored ADR (a) | | 599,944 | 3,695,655 |
| Yahoo!, Inc. (a) | | 1,448,200 | 42,736,382 |
| Yirendai Ltd. ADR | | 70,400 | 480,128 |
| Zillow Group, Inc.: | | | |
| Class A (a)(b) | | 710 | 15,386 |
| Class C (a)(b) | | 720 | 14,760 |
| | | | 458,693,007 |
| IT Services - 6.9% | | | |
| Data Processing & Outsourced Services - 6.2% | | | |
| Amadeus IT Holding SA Class A | | 180,500 | 7,371,392 |
| Euronet Worldwide, Inc. (a) | | 25,835 | 2,060,858 |
| Fidelity National Information Services, Inc. | | 36,195 | 2,161,927 |
| Fiserv, Inc. (a) | | 43,600 | 4,122,816 |
| FleetCor Technologies, Inc. (a) | | 56,800 | 6,977,312 |
| Global Payments, Inc. | | 126,500 | 7,457,175 |
| MasterCard, Inc. Class A | | 25,100 | 2,234,653 |
| Optimal Payments PLC (a) | | 1,400,300 | 8,067,848 |
| Sabre Corp. | | 82,400 | 2,110,264 |
| Total System Services, Inc. | | 31,553 | 1,267,168 |
| Travelport Worldwide Ltd. | | 345,223 | 3,759,478 |
| Vantiv, Inc. (a) | | 32,100 | 1,510,305 |
| Visa, Inc. Class A | | 528,900 | 39,397,761 |
| | | | 88,498,957 |
| IT Consulting & Other Services - 0.7% | | | |
| Cognizant Technology Solutions Corp. Class A (a) | | 142,494 | 9,021,295 |
| EPAM Systems, Inc. (a) | | 20,761 | 1,554,999 |
| Virtusa Corp. (a) | | 400 | 17,888 |
| | | | 10,594,182 |
|
| TOTAL IT SERVICES | | | 99,093,139 |
|
| Life Sciences Tools & Services - 0.1% | | | |
| Life Sciences Tools & Services - 0.1% | | | |
| JHL Biotech, Inc. | | 555,476 | 1,888,781 |
| Machinery - 0.1% | | | |
| Industrial Machinery - 0.1% | | | |
| Harmonic Drive Systems, Inc. (b) | | 38,600 | 782,885 |
| King Slide Works Co. Ltd. | | 29,000 | 375,108 |
| | | | 1,157,993 |
| Media - 0.5% | | | |
| Advertising - 0.0% | | | |
| iCar Asia Ltd. (a)(b) | | 1,257,513 | 840,771 |
| Cable & Satellite - 0.3% | | | |
| Naspers Ltd. Class N | | 36,545 | 4,618,306 |
| Publishing - 0.2% | | | |
| NEXT Co. Ltd. | | 21,800 | 228,043 |
| Schibsted ASA: | | | |
| (A Shares) | | 22,300 | 654,531 |
| (B Shares) (a) | | 51,941 | 1,460,705 |
| | | | 2,343,279 |
|
| TOTAL MEDIA | | | 7,802,356 |
|
| Professional Services - 0.5% | | | |
| Human Resource & Employment Services - 0.4% | | | |
| 51job, Inc. sponsored ADR (a) | | 400 | 11,132 |
| WageWorks, Inc. (a) | | 149,044 | 6,668,229 |
| | | | 6,679,361 |
| Research & Consulting Services - 0.1% | | | |
| ICF International, Inc. (a) | | 33,600 | 1,149,456 |
| Verisk Analytics, Inc. (a) | | 168 | 12,264 |
| | | | 1,161,720 |
|
| TOTAL PROFESSIONAL SERVICES | | | 7,841,081 |
|
| Semiconductors & Semiconductor Equipment - 17.4% | | | |
| Semiconductor Equipment - 0.9% | | | |
| Amkor Technology, Inc. (a) | | 986,646 | 6,058,006 |
| Applied Materials, Inc. | | 900 | 15,885 |
| ASM Pacific Technology Ltd. | | 35,500 | 258,253 |
| EO Technics Co. Ltd. | | 54,339 | 5,675,154 |
| Hermes Microvision, Inc. | | 48,000 | 1,183,333 |
| Nanometrics, Inc. (a) | | 9,409 | 132,949 |
| Rubicon Technology, Inc. (a)(b) | | 451,167 | 469,214 |
| SunEdison, Inc. (a)(b) | | 700 | 2,191 |
| | | | 13,794,985 |
| Semiconductors - 16.5% | | | |
| Advanced Micro Devices, Inc. (a)(b) | | 361,400 | 795,080 |
| Advanced Semiconductor Engineering, Inc. | | 8,330,000 | 8,906,298 |
| Advanced Semiconductor Engineering, Inc. sponsored ADR | | 1,207,762 | 6,461,527 |
| Ambarella, Inc. (a) | | 51,300 | 2,035,584 |
| Analog Devices, Inc. | | 80,800 | 4,351,888 |
| Avago Technologies Ltd. | | 5,800 | 775,518 |
| Cavium, Inc. (a) | | 68,200 | 3,939,914 |
| Chipbond Technology Corp. | | 2,376,000 | 3,353,706 |
| ChipMOS TECHNOLOGIES (Bermuda) Ltd. | | 243,127 | 4,376,286 |
| Cirrus Logic, Inc. (a) | | 22,714 | 788,630 |
| Cypress Semiconductor Corp. (b) | | 173,983 | 1,367,506 |
| Everlight Electronics Co. Ltd. | | 2,135,000 | 3,555,831 |
| Genesis Photonics, Inc. (a) | | 2,474,066 | 597,986 |
| Himax Technologies, Inc. sponsored ADR (b) | | 393,304 | 3,052,039 |
| Hua Hong Semiconductor Ltd. (a) | | 2,480,000 | 1,913,128 |
| Inotera Memories, Inc. (a) | | 6,239,000 | 5,352,499 |
| Integrated Device Technology, Inc. (a) | | 72,300 | 1,842,204 |
| Intersil Corp. Class A | | 351,594 | 4,570,722 |
| King Yuan Electronics Co. Ltd. | | 1,388,000 | 920,775 |
| Lextar Electronics Corp. | | 437,000 | 207,946 |
| MagnaChip Semiconductor Corp. (a)(b) | | 114,554 | 524,657 |
| Marvell Technology Group Ltd. | | 4,183,982 | 37,028,241 |
| Maxim Integrated Products, Inc. | | 415,100 | 13,864,340 |
| Melexis NV | | 293 | 14,725 |
| Micron Technology, Inc. (a) | | 2,757,500 | 30,415,225 |
| Microsemi Corp. (a) | | 150,700 | 4,777,190 |
| Monolithic Power Systems, Inc. | | 71,201 | 4,455,047 |
| NXP Semiconductors NV (a) | | 267,780 | 20,024,588 |
| ON Semiconductor Corp. (a) | | 344,400 | 2,948,064 |
| Power Integrations, Inc. | | 41,500 | 1,955,895 |
| Qorvo, Inc. (a) | | 298,158 | 11,807,057 |
| Sanken Electric Co. Ltd. | | 386,000 | 1,221,815 |
| Semtech Corp. (a) | | 296,398 | 5,957,600 |
| Silicon Laboratories, Inc. (a) | | 30,500 | 1,390,800 |
| Silicon Motion Technology Corp. sponsored ADR | | 108,288 | 3,366,674 |
| Siliconware Precision Industries Co. Ltd. | | 7,587,341 | 11,695,230 |
| Siliconware Precision Industries Co. Ltd. sponsored ADR (b) | | 1,359,064 | 10,424,021 |
| Sitronix Technology Corp. | | 235,000 | 694,481 |
| SK Hynix, Inc. | | 61,383 | 1,405,982 |
| Skyworks Solutions, Inc. | | 107,600 | 7,415,792 |
| STMicroelectronics NV | | 1,630 | 10,649 |
| Vanguard International Semiconductor Corp. | | 4,388,000 | 6,270,147 |
| Xilinx, Inc. | | 300 | 15,081 |
| | | | 236,848,368 |
|
| TOTAL SEMICONDUCTORS & SEMICONDUCTOR EQUIPMENT | | | 250,643,353 |
|
| Software - 12.4% | | | |
| Application Software - 6.3% | | | |
| Adobe Systems, Inc. (a) | | 159,716 | 14,235,487 |
| ANSYS, Inc. (a) | | 175 | 15,433 |
| Autodesk, Inc. (a) | | 117,200 | 5,487,304 |
| Blackbaud, Inc. | | 17,200 | 1,057,456 |
| Citrix Systems, Inc. (a) | | 65,815 | 4,637,325 |
| Guidewire Software, Inc. (a) | | 190 | 10,458 |
| Interactive Intelligence Group, Inc. (a) | | 43,960 | 1,049,765 |
| Intuit, Inc. | | 137,300 | 13,113,523 |
| Kingdee International Software Group Co. Ltd. | | 365,800 | 127,994 |
| Linx SA | | 700 | 8,773 |
| Mobileye NV (a)(b) | | 277,100 | 7,517,723 |
| Parametric Technology Corp. (a) | | 500 | 14,805 |
| Paycom Software, Inc. (a) | | 900 | 27,135 |
| Paylocity Holding Corp. (a)(b) | | 100,400 | 3,124,448 |
| Qlik Technologies, Inc. (a) | | 400 | 10,016 |
| RealPage, Inc. (a) | | 181,783 | 3,506,594 |
| RingCentral, Inc. (a) | | 68,300 | 1,490,306 |
| Salesforce.com, Inc. (a) | | 339,219 | 23,087,245 |
| SolarWinds, Inc. (a) | | 333 | 19,963 |
| SS&C Technologies Holdings, Inc. | | 52,200 | 3,355,938 |
| Ultimate Software Group, Inc. (a) | | 76 | 13,348 |
| Workday, Inc. Class A (a) | | 25,600 | 1,613,056 |
| Workiva, Inc. (a)(b) | | 51,400 | 767,402 |
| Zendesk, Inc. (a) | | 288,700 | 6,354,287 |
| | | | 90,645,784 |
| Home Entertainment Software - 1.9% | | | |
| Activision Blizzard, Inc. | | 233,170 | 8,118,979 |
| Electronic Arts, Inc. (a) | | 49,900 | 3,220,796 |
| NCSOFT Corp. | | 45,458 | 8,880,865 |
| NHN Entertainment Corp. (a) | | 88,294 | 3,533,704 |
| Nintendo Co. Ltd. | | 26,200 | 3,673,600 |
| | | | 27,427,944 |
| Systems Software - 4.2% | | | |
| Allot Communications Ltd. (a) | | 288,719 | 1,440,708 |
| CommVault Systems, Inc. (a) | | 300 | 11,256 |
| Fleetmatics Group PLC (a) | | 341,030 | 14,804,112 |
| Imperva, Inc. (a) | | 300 | 15,468 |
| Infoblox, Inc. (a) | | 900 | 14,526 |
| Microsoft Corp. | | 206,900 | 11,398,121 |
| NetSuite, Inc. (a)(b) | | 97,577 | 6,768,916 |
| Oracle Corp. | | 394,500 | 14,324,295 |
| Progress Software Corp. (a) | | 52,200 | 1,351,458 |
| Rapid7, Inc. (a)(b) | | 2,500 | 32,750 |
| ServiceNow, Inc. (a) | | 46,895 | 2,917,338 |
| Tableau Software, Inc. (a) | | 3,300 | 264,792 |
| Varonis Systems, Inc. (a) | | 900 | 16,938 |
| VMware, Inc. Class A (a)(b) | | 143,900 | 6,583,425 |
| | | | 59,944,103 |
|
| TOTAL SOFTWARE | | | 178,017,831 |
|
| Technology Hardware, Storage & Peripherals - 12.4% | | | |
| Technology Hardware, Storage & Peripherals - 12.4% | | | |
| Apple, Inc. | | 1,446,329 | 140,785,661 |
| BlackBerry Ltd. (a) | | 1,486 | 10,597 |
| Electronics for Imaging, Inc. (a) | | 67,200 | 2,780,736 |
| EMC Corp. | | 610,800 | 15,129,516 |
| HP, Inc. | | 1,411,300 | 13,703,723 |
| Nimble Storage, Inc. (a)(b) | | 162,600 | 1,068,282 |
| Quanta Computer, Inc. | | 475,000 | 753,608 |
| SanDisk Corp. | | 28,000 | 1,979,600 |
| Silicon Graphics International Corp. (a) | | 166,658 | 979,116 |
| Stratasys Ltd. (a) | | 100 | 1,630 |
| Western Digital Corp. | | 15,700 | 753,286 |
| | | | 177,945,755 |
| TOTAL COMMON STOCKS | | | |
| (Cost $1,355,264,928) | | | 1,412,629,657 |
|
| Preferred Stocks - 1.8% | | | |
| Convertible Preferred Stocks - 1.4% | | | |
| Internet & Catalog Retail - 0.6% | | | |
| Internet Retail - 0.6% | | | |
| China Internet Plus Holdings Ltd. Series B (d) | | 2,042,487 | 7,885,430 |
| Internet Software & Services - 0.8% | | | |
| Internet Software & Services - 0.8% | | | |
| Uber Technologies, Inc. Series D, 8.00% (a)(d) | | 232,064 | 11,318,278 |
| IT Services - 0.0% | | | |
| Data Processing & Outsourced Services - 0.0% | | | |
| Nutanix, Inc. Series E (a)(d) | | 39,963 | 495,541 |
|
| TOTAL CONVERTIBLE PREFERRED STOCKS | | | 19,699,249 |
|
| Nonconvertible Preferred Stocks - 0.4% | | | |
| Internet & Catalog Retail - 0.4% | | | |
| Internet Retail - 0.4% | | | |
| China Internet Plus Holdings Ltd. (d) | | 1,516,912 | 5,856,342 |
| TOTAL PREFERRED STOCKS | | | |
| (Cost $16,815,545) | | | 25,555,591 |
|
| Money Market Funds - 5.5% | | | |
| Fidelity Cash Central Fund, 0.38% (e) | | 4,188,303 | 4,188,303 |
| Fidelity Securities Lending Cash Central Fund, 0.42% (e)(f) | | 75,135,694 | 75,135,694 |
| TOTAL MONEY MARKET FUNDS | | | |
| (Cost $79,323,997) | | | 79,323,997 |
| TOTAL INVESTMENT PORTFOLIO - 105.5% | | | |
| (Cost $1,451,404,470) | | | 1,517,509,245 |
| NET OTHER ASSETS (LIABILITIES) - (5.5)% | | | (78,771,517) |
| NET ASSETS - 100% | | | $1,438,737,728 |
Security Type Abbreviations
ELS – Equity-Linked Security
Legend
(a) Non-income producing
(b) Security or a portion of the security is on loan at period end.
(c) Security exempt from registration under Rule 144A of the Securities Act of 1933. These securities may be resold in transactions exempt from registration, normally to qualified institutional buyers. At the end of the period, the value of these securities amounted to $1,703,331 or 0.1% of net assets.
(d) Restricted securities - Investment in securities not registered under the Securities Act of 1933 (excluding 144A issues). At the end of the period, the value of restricted securities (excluding 144A issues) amounted to $25,555,591 or 1.8% of net assets.
(e) Affiliated fund that is generally available only to investment companies and other accounts managed by Fidelity Investments. The rate quoted is the annualized seven-day yield of the fund at period end. A complete unaudited listing of the fund's holdings as of its most recent quarter end is available upon request. In addition, each Fidelity Central Fund's financial statements are available on the SEC's website or upon request.
(f) Investment made with cash collateral received from securities on loan.
Additional information on each restricted holding is as follows:
| Security | Acquisition Date | Acquisition Cost |
| China Internet Plus Holdings Ltd. | 1/26/15 | $4,794,731 |
| China Internet Plus Holdings Ltd. Series B | 12/11/15 | $7,885,430 |
| Nutanix, Inc. Series E | 8/26/14 | $535,364 |
| Uber Technologies, Inc. Series D, 8.00% | 6/6/14 | $3,600,020 |
Affiliated Central Funds
Information regarding fiscal year to date income earned by the Fund from investments in Fidelity Central Funds is as follows:
| Fund | Income earned |
| Fidelity Cash Central Fund | $19,192 |
| Fidelity Securities Lending Cash Central Fund | 459,108 |
| Total | $478,300 |
Investment Valuation
The following is a summary of the inputs used, as of January 31, 2016, involving the Fund's assets and liabilities carried at fair value. The inputs or methodology used for valuing securities may not be an indication of the risk associated with investing in those securities. For more information on valuation inputs, and their aggregation into the levels used below, please refer to the Investment Valuation section in the accompanying Notes to Financial Statements.
| | Valuation Inputs at Reporting Date: |
| Description | Total | Level 1 | Level 2 | Level 3 |
| Investments in Securities: | | | | |
| Common Stocks | $1,412,629,657 | $1,275,662,252 | $136,967,405 | $-- |
| Preferred Stocks | 25,555,591 | -- | -- | 25,555,591 |
| Money Market Funds | 79,323,997 | 79,323,997 | -- | -- |
| Total Investments in Securities: | $1,517,509,245 | $1,354,986,249 | $136,967,405 | $25,555,591 |
The following is a summary of transfers between Level 1 and Level 2 for the period ended January 31, 2016. Transfers are assumed to have occurred at the beginning of the period, and are primarily attributable to the valuation techniques used for foreign equity securities, as discussed in the accompanying Notes to Financial Statements:
| Transfers | Total |
| Level 1 to Level 2 | $93,113,352 |
| Level 2 to Level 1 | $0 |
The following is a reconciliation of Investments in Securities for which Level 3 inputs were used in determining value:
| Investments in Securities: | |
| Other Investments in Securities | |
| Beginning Balance | $12,656,409 |
| Total Realized Gain (Loss) | -- |
| Total Unrealized Gain (Loss) | -- |
| Cost of Purchases | -- |
| Proceeds of Sales | (1,038,740) |
| Amortization/Accretion | -- |
| Transfers in to Level 3 | -- |
| Transfers out of Level 3 | (11,617,669) |
| Ending Balance | $-- |
| The change in unrealized gain (loss) for the period attributable to Level 3 securities held at January 31, 2016 | $-- |
| Preferred Stocks | |
| Beginning Balance | $15,728,431 |
| Total Realized Gain (Loss) | -- |
| Total Unrealized Gain (Loss) | 1,941,730 |
| Cost of Purchases | 12,680,161 |
| Proceeds of Sales | (4,794,731) |
| Amortization/Accretion | -- |
| Transfers in to Level 3 | -- |
| Transfers out of Level 3 | -- |
| Ending Balance | $25,555,591 |
| The change in unrealized gain (loss) for the period attributable to Level 3 securities held at January 31, 2016 | $1,941,731 |
The information used in the above reconciliations represents fiscal year to date activity for any Investments in Securities identified as using Level 3 inputs at either the beginning or the end of the current fiscal period. Transfers in or out of Level 3 represent the beginning value of any Security or Instrument where a change in the pricing level occurred from the beginning to the end of the period. The cost of purchases and the proceeds of sales may include securities received or delivered through corporate actions or exchanges. Realized and unrealized gains (losses) disclosed in the reconciliation are included in Net Gain (Loss) on the Fund's Statement of Operations.
Other Information
Distribution of investments by country or territory of incorporation, as a percentage of Total Net Assets, is as follows (Unaudited):
| United States of America | 72.2% |
| Cayman Islands | 10.1% |
| Taiwan | 5.4% |
| Bermuda | 3.2% |
| Netherlands | 2.4% |
| Korea (South) | 1.9% |
| Japan | 1.9% |
| Ireland | 1.0% |
| Others (Individually Less Than 1%) | 1.9% |
| | 100.0% |
See accompanying notes which are an integral part of the financial statements.
Fidelity Advisor® Technology Fund
Financial Statements
Statement of Assets and Liabilities
| | | January 31, 2016 (Unaudited) |
| Assets | | |
Investment in securities, at value (including securities loaned of $74,958,638) — See accompanying schedule:
Unaffiliated issuers (cost $1,372,080,473) | $1,438,185,248 | |
| Fidelity Central Funds (cost $79,323,997) | 79,323,997 | |
| Total Investments (cost $1,451,404,470) | | $1,517,509,245 |
| Cash | | 640,052 |
| Receivable for investments sold | | 25,773,136 |
| Receivable for fund shares sold | | 3,496,618 |
| Dividends receivable | | 142,142 |
| Distributions receivable from Fidelity Central Funds | | 105,604 |
| Prepaid expenses | | 6,504 |
| Other receivables | | 69,241 |
| Total assets | | 1,547,742,542 |
| Liabilities | | |
| Payable for investments purchased | $28,200,774 | |
| Payable for fund shares redeemed | 4,332,597 | |
| Accrued management fee | 663,421 | |
| Distribution and service plan fees payable | 287,468 | |
| Other affiliated payables | 297,644 | |
| Other payables and accrued expenses | 87,216 | |
| Collateral on securities loaned, at value | 75,135,694 | |
| Total liabilities | | 109,004,814 |
| Net Assets | | $1,438,737,728 |
| Net Assets consist of: | | |
| Paid in capital | | $1,401,561,028 |
| Accumulated net investment loss | | (1,917,495) |
| Accumulated undistributed net realized gain (loss) on investments and foreign currency transactions | | (27,007,535) |
| Net unrealized appreciation (depreciation) on investments and assets and liabilities in foreign currencies | | 66,101,730 |
| Net Assets | | $1,438,737,728 |
| Calculation of Maximum Offering Price | | |
| Class A: | | |
| Net Asset Value and redemption price per share ($438,155,491 ÷ 13,548,071 shares) | | $32.34 |
| Maximum offering price per share (100/94.25 of $32.34) | | $34.31 |
| Class T: | | |
| Net Asset Value and redemption price per share ($187,692,764 ÷ 6,071,684 shares) | | $30.91 |
| Maximum offering price per share (100/96.50 of $30.91) | | $32.03 |
| Class B: | | |
| Net Asset Value and offering price per share ($6,273,029 ÷ 223,232 shares)(a) | | $28.10 |
| Class C: | | |
| Net Asset Value and offering price per share ($135,079,596 ÷ 4,798,880 shares)(a) | | $28.15 |
| Class I: | | |
| Net Asset Value, offering price and redemption price per share ($671,536,848 ÷ 19,540,391 shares) | | $34.37 |
(a) Redemption price per share is equal to net asset value less any applicable contingent deferred sales charge.
See accompanying notes which are an integral part of the financial statements.
Statement of Operations
| | | Six months ended January 31, 2016 (Unaudited) |
| Investment Income | | |
| Dividends | | $5,575,687 |
| Income from Fidelity Central Funds (including $459,108 from security lending) | | 478,300 |
| Total income | | 6,053,987 |
| Expenses | | |
| Management fee | $4,250,574 | |
| Transfer agent fees | 1,528,212 | |
| Distribution and service plan fees | 1,794,751 | |
| Accounting and security lending fees | 254,849 | |
| Custodian fees and expenses | 57,364 | |
| Independent trustees' compensation | 14,526 | |
| Registration fees | 68,271 | |
| Audit | 39,762 | |
| Legal | 14,112 | |
| Interest | 712 | |
| Miscellaneous | 7,988 | |
| Total expenses before reductions | 8,031,121 | |
| Expense reductions | (83,809) | 7,947,312 |
| Net investment income (loss) | | (1,893,325) |
| Realized and Unrealized Gain (Loss) | | |
| Net realized gain (loss) on: | | |
| Investment securities: | | |
| Unaffiliated issuers (net of foreign taxes of $41,234) | (13,591,342) | |
| Foreign currency transactions | (206,874) | |
| Total net realized gain (loss) | | (13,798,216) |
Change in net unrealized appreciation (depreciation) on:
Investment securities (net of decrease in deferred foreign taxes of $107,750) | (109,883,399) | |
| Assets and liabilities in foreign currencies | 8,905 | |
| Total change in net unrealized appreciation (depreciation) | | (109,874,494) |
| Net gain (loss) | | (123,672,710) |
| Net increase (decrease) in net assets resulting from operations | | $(125,566,035) |
See accompanying notes which are an integral part of the financial statements.
Statement of Changes in Net Assets
| | Six months ended January 31, 2016 (Unaudited) | Year ended July 31, 2015 |
| Increase (Decrease) in Net Assets | | |
| Operations | | |
| Net investment income (loss) | $(1,893,325) | $257,390 |
| Net realized gain (loss) | (13,798,216) | 123,100,237 |
| Change in net unrealized appreciation (depreciation) | (109,874,494) | 30,802,154 |
| Net increase (decrease) in net assets resulting from operations | (125,566,035) | 154,159,781 |
| Distributions to shareholders from net investment income | – | (1,694,661) |
| Distributions to shareholders from net realized gain | (70,068,833) | (115,642,281) |
| Total distributions | (70,068,833) | (117,336,942) |
| Share transactions - net increase (decrease) | 26,303,162 | 393,289,614 |
| Redemption fees | 23,770 | 24,197 |
| Total increase (decrease) in net assets | (169,307,936) | 430,136,650 |
| Net Assets | | |
| Beginning of period | 1,608,045,664 | 1,177,909,014 |
| End of period (including accumulated net investment loss of $1,917,495 and accumulated net investment loss of $24,170, respectively) | $1,438,737,728 | $1,608,045,664 |
See accompanying notes which are an integral part of the financial statements.
Financial Highlights — Fidelity Advisor Technology Fund Class A
| | Six months ended (Unaudited) | Years ended July 31, | | | | |
| January 31, | 2016 | 2015 | 2014 | 2013 | 2012 | 2011 |
| Selected Per–Share Data | | | | | | |
| Net asset value, beginning of period | $36.83 | $36.06 | $29.90 | $25.25 | $25.14 | $19.83 |
| Income from Investment Operations | | | | | | |
| Net investment income (loss)A | (.05) | (.02)B | (.12) | (.07) | (.13) | (.18) |
| Net realized and unrealized gain (loss) | (2.83) | 3.75 | 6.70 | 4.72 | .24 | 5.49 |
| Total from investment operations | (2.88) | 3.73 | 6.58 | 4.65 | .11 | 5.31 |
| Distributions from net investment income | – | (.02) | – | – | – | – |
| Distributions from net realized gain | (1.61) | (2.94) | (.42) | – | – | – |
| Total distributions | (1.61) | (2.96) | (.42) | – | – | – |
| Redemption fees added to paid in capitalA,C | – | – | – | – | – | – |
| Net asset value, end of period | $32.34 | $36.83 | $36.06 | $29.90 | $25.25 | $25.14 |
| Total ReturnD,E,F | (7.86)% | 10.94% | 22.15% | 18.42% | .44% | 26.78% |
| Ratios to Average Net AssetsG,H | | | | | | |
| Expenses before reductions | 1.09%I | 1.09% | 1.14% | 1.18% | 1.18% | 1.18% |
| Expenses net of fee waivers, if any | 1.09%I | 1.09% | 1.14% | 1.18% | 1.18% | 1.18% |
| Expenses net of all reductions | 1.08%I | 1.08% | 1.12% | 1.14% | 1.17% | 1.16% |
| Net investment income (loss) | (.30)%I | (.05)%B | (.35)% | (.25)% | (.55)% | (.73)% |
| Supplemental Data | | | | | | |
| Net assets, end of period (000 omitted) | $438,155 | $468,819 | $408,687 | $355,306 | $336,693 | $375,609 |
| Portfolio turnover rateJ | 123%I | 142%K | 186% | 142% | 201% | 167% |
A Calculated based on average shares outstanding during the period.
B Net Investment income per share reflects a large, non-recurring dividend which amounted to $.07 per share. Excluding this non-recurring dividend, the ratio of net investment income (loss) to average net assets would have been (.25) %.
C Amount represents less than $.005 per share.
D Total returns for periods of less than one year are not annualized.
E Total returns would have been lower if certain expenses had not been reduced during the applicable periods shown.
F Total returns do not include the effect of the sales charges.
G Fees and expenses of any underlying Fidelity Central Funds are not included in the Fund's expense ratio. The Fund indirectly bears its proportionate share of the expenses of any underlying Fidelity Central Funds.
H Expense ratios reflect operating expenses of the class. Expenses before reductions do not reflect amounts reimbursed by the investment adviser or reductions from brokerage service arrangements or reductions from other expense offset arrangements and do not represent the amount paid by the class during periods when reimbursements or reductions occur. Expenses net of fee waivers reflect expenses after reimbursement by the investment adviser but prior to reductions from brokerage service arrangements or other expense offset arrangements. Expenses net of all reductions represent the net expenses paid by the class.
I Annualized
J Amount does not include the portfolio activity of any underlying Fidelity Central Funds.
K Portfolio turnover rate excludes securities received or delivered in-kind.
See accompanying notes which are an integral part of the financial statements.
Financial Highlights — Fidelity Advisor Technology Fund Class T
| | Six months ended (Unaudited) | Years ended July 31, | | | | |
| January 31, | 2016 | 2015 | 2014 | 2013 | 2012 | 2011 |
| Selected Per–Share Data | | | | | | |
| Net asset value, beginning of period | $35.26 | $34.66 | $28.79 | $24.38 | $24.33 | $19.24 |
| Income from Investment Operations | | | | | | |
| Net investment income (loss)A | (.09) | (.11)B | (.19) | (.13) | (.19) | (.23) |
| Net realized and unrealized gain (loss) | (2.71) | 3.60 | 6.45 | 4.54 | .24 | 5.32 |
| Total from investment operations | (2.80) | 3.49 | 6.26 | 4.41 | .05 | 5.09 |
| Distributions from net realized gain | (1.55) | (2.89) | (.39) | – | – | – |
| Total distributions | (1.55) | (2.89) | (.39) | – | – | – |
| Redemption fees added to paid in capitalA,C | – | – | – | – | – | – |
| Net asset value, end of period | $30.91 | $35.26 | $34.66 | $28.79 | $24.38 | $24.33 |
| Total ReturnD,E,F | (7.97)% | 10.63% | 21.89% | 18.09% | .21% | 26.46% |
| Ratios to Average Net AssetsG,H | | | | | | |
| Expenses before reductions | 1.36%I | 1.35% | 1.38% | 1.42% | 1.43% | 1.43% |
| Expenses net of fee waivers, if any | 1.35%I | 1.35% | 1.38% | 1.42% | 1.43% | 1.43% |
| Expenses net of all reductions | 1.34%I | 1.34% | 1.37% | 1.39% | 1.42% | 1.40% |
| Net investment income (loss) | (.56)%I | (.31)%B | (.60)% | (.50)% | (.80)% | (.98)% |
| Supplemental Data | | | | | | |
| Net assets, end of period (000 omitted) | $187,693 | $208,192 | $196,067 | $173,692 | $172,709 | $196,913 |
| Portfolio turnover rateJ | 123%I | 142%K | 186% | 142% | 201% | 167% |
A Calculated based on average shares outstanding during the period.
B Net Investment income per share reflects a large, non-recurring dividend which amounted to $.07 per share. Excluding this non-recurring dividend, the ratio of net investment income (loss) to average net assets would have been (.51) %.
C Amount represents less than $.005 per share.
D Total returns for periods of less than one year are not annualized.
E Total returns would have been lower if certain expenses had not been reduced during the applicable periods shown.
F Total returns do not include the effect of the sales charges.
G Fees and expenses of any underlying Fidelity Central Funds are not included in the Fund's expense ratio. The Fund indirectly bears its proportionate share of the expenses of any underlying Fidelity Central Funds.
H Expense ratios reflect operating expenses of the class. Expenses before reductions do not reflect amounts reimbursed by the investment adviser or reductions from brokerage service arrangements or reductions from other expense offset arrangements and do not represent the amount paid by the class during periods when reimbursements or reductions occur. Expenses net of fee waivers reflect expenses after reimbursement by the investment adviser but prior to reductions from brokerage service arrangements or other expense offset arrangements. Expenses net of all reductions represent the net expenses paid by the class.
I Annualized
J Amount does not include the portfolio activity of any underlying Fidelity Central Funds.
K Portfolio turnover rate excludes securities received or delivered in-kind.
See accompanying notes which are an integral part of the financial statements.
Financial Highlights — Fidelity Advisor Technology Fund Class B
| | Six months ended (Unaudited) | Years ended July 31, | | | | |
| January 31, | 2016 | 2015 | 2014 | 2013 | 2012 | 2011 |
| Selected Per–Share Data | | | | | | |
| Net asset value, beginning of period | $32.15 | $31.83 | $26.56 | $22.60 | $22.67 | $18.01 |
| Income from Investment Operations | | | | | | |
| Net investment income (loss)A | (.17) | (.27)B | (.34) | (.24) | (.28) | (.33) |
| Net realized and unrealized gain (loss) | (2.46) | 3.29 | 5.94 | 4.20 | .21 | 4.99 |
| Total from investment operations | (2.63) | 3.02 | 5.60 | 3.96 | (.07) | 4.66 |
| Distributions from net realized gain | (1.42) | (2.70) | (.33) | – | – | – |
| Total distributions | (1.42) | (2.70) | (.33) | – | – | – |
| Redemption fees added to paid in capitalA,C | – | – | – | – | – | – |
| Net asset value, end of period | $28.10 | $32.15 | $31.83 | $26.56 | $22.60 | $22.67 |
| Total ReturnD,E,F | (8.24)% | 10.04% | 21.21% | 17.52% | (.31)% | 25.87% |
| Ratios to Average Net AssetsG,H | | | | | | |
| Expenses before reductions | 1.91%I | 1.91% | 1.92% | 1.93% | 1.93% | 1.93% |
| Expenses net of fee waivers, if any | 1.91%I | 1.91% | 1.92% | 1.93% | 1.93% | 1.93% |
| Expenses net of all reductions | 1.90%I | 1.90% | 1.91% | 1.89% | 1.92% | 1.91% |
| Net investment income (loss) | (1.12)%I | (.86)%B | (1.14)% | (1.01)% | (1.30)% | (1.49)% |
| Supplemental Data | | | | | | |
| Net assets, end of period (000 omitted) | $6,273 | $8,885 | $12,043 | $13,745 | $17,476 | $25,508 |
| Portfolio turnover rateJ | 123%I | 142%K | 186% | 142% | 201% | 167% |
A Calculated based on average shares outstanding during the period.
B Net Investment income per share reflects a large, non-recurring dividend which amounted to $.06 per share. Excluding this non-recurring dividend, the ratio of net investment income (loss) to average net assets would have been (1.07) %.
C Amount represents less than $.005 per share.
D Total returns for periods of less than one year are not annualized.
E Total returns would have been lower if certain expenses had not been reduced during the applicable periods shown.
F Total returns do not include the effect of the contingent deferred sales charge.
G Fees and expenses of any underlying Fidelity Central Funds are not included in the Fund's expense ratio. The Fund indirectly bears its proportionate share of the expenses of any underlying Fidelity Central Funds.
H Expense ratios reflect operating expenses of the class. Expenses before reductions do not reflect amounts reimbursed by the investment adviser or reductions from brokerage service arrangements or reductions from other expense offset arrangements and do not represent the amount paid by the class during periods when reimbursements or reductions occur. Expenses net of fee waivers reflect expenses after reimbursement by the investment adviser but prior to reductions from brokerage service arrangements or other expense offset arrangements. Expenses net of all reductions represent the net expenses paid by the class.
I Annualized
J Amount does not include the portfolio activity of any underlying Fidelity Central Funds.
K Portfolio turnover rate excludes securities received or delivered in-kind.
See accompanying notes which are an integral part of the financial statements.
Financial Highlights — Fidelity Advisor Technology Fund Class C
| | Six months ended (Unaudited) | Years ended July 31, | | | | |
| January 31, | 2016 | 2015 | 2014 | 2013 | 2012 | 2011 |
| Selected Per–Share Data | | | | | | |
| Net asset value, beginning of period | $32.27 | $31.99 | $26.68 | $22.70 | $22.77 | $18.09 |
| Income from Investment Operations | | | | | | |
| Net investment income (loss)A | (.16) | (.25)B | (.33) | (.24) | (.29) | (.33) |
| Net realized and unrealized gain (loss) | (2.46) | 3.29 | 5.98 | 4.22 | .22 | 5.01 |
| Total from investment operations | (2.62) | 3.04 | 5.65 | 3.98 | (.07) | 4.68 |
| Distributions from net realized gain | (1.50) | (2.76) | (.34) | – | – | – |
| Total distributions | (1.50) | (2.76) | (.34) | – | – | – |
| Redemption fees added to paid in capitalA,C | – | – | – | – | – | – |
| Net asset value, end of period | $28.15 | $32.27 | $31.99 | $26.68 | $22.70 | $22.77 |
| Total ReturnD,E,F | (8.18)% | 10.07% | 21.31% | 17.53% | (.31)% | 25.87% |
| Ratios to Average Net AssetsG,H | | | | | | |
| Expenses before reductions | 1.85%I | 1.84% | 1.87% | 1.91% | 1.93% | 1.92% |
| Expenses net of fee waivers, if any | 1.85%I | 1.84% | 1.87% | 1.91% | 1.93% | 1.92% |
| Expenses net of all reductions | 1.84%I | 1.83% | 1.86% | 1.88% | 1.91% | 1.90% |
| Net investment income (loss) | (1.06)%I | (.80)%B | (1.09)% | (.99)% | (1.29)% | (1.48)% |
| Supplemental Data | | | | | | |
| Net assets, end of period (000 omitted) | $135,080 | $138,205 | $105,499 | $84,858 | $88,074 | $89,819 |
| Portfolio turnover rateJ | 123%I | 142%K | 186% | 142% | 201% | 167% |
A Calculated based on average shares outstanding during the period.
B Net Investment income per share reflects a large, non-recurring dividend which amounted to $.06 per share. Excluding this non-recurring dividend, the ratio of net investment income (loss) to average net assets would have been (1.00) %.
C Amount represents less than $.005 per share.
D Total returns for periods of less than one year are not annualized.
E Total returns would have been lower if certain expenses had not been reduced during the applicable periods shown.
F Total returns do not include the effect of the contingent deferred sales charge.
G Fees and expenses of any underlying Fidelity Central Funds are not included in the Fund's expense ratio. The Fund indirectly bears its proportionate share of the expenses of any underlying Fidelity Central Funds.
H Expense ratios reflect operating expenses of the class. Expenses before reductions do not reflect amounts reimbursed by the investment adviser or reductions from brokerage service arrangements or reductions from other expense offset arrangements and do not represent the amount paid by the class during periods when reimbursements or reductions occur. Expenses net of fee waivers reflect expenses after reimbursement by the investment adviser but prior to reductions from brokerage service arrangements or other expense offset arrangements. Expenses net of all reductions represent the net expenses paid by the class.
I Annualized
J Amount does not include the portfolio activity of any underlying Fidelity Central Funds.
K Portfolio turnover rate excludes securities received or delivered in-kind.
See accompanying notes which are an integral part of the financial statements.
Financial Highlights — Fidelity Advisor Technology Fund Class I
| | Six months ended (Unaudited) | Years ended July 31, | | | | |
| January 31, | 2016 | 2015 | 2014 | 2013 | 2012 | 2011 |
| Selected Per–Share Data | | | | | | |
| Net asset value, beginning of period | $39.03 | $38.06 | $31.47 | $26.50 | $26.30 | $20.68 |
| Income from Investment Operations | | | | | | |
| Net investment income (loss)A | .01 | .11B | (.02) | .02 | (.06) | (.11) |
| Net realized and unrealized gain (loss) | (3.00) | 3.96 | 7.06 | 4.95 | .26 | 5.73 |
| Total from investment operations | (2.99) | 4.07 | 7.04 | 4.97 | .20 | 5.62 |
| Distributions from net investment income | – | (.07) | – | – | – | – |
| Distributions from net realized gain | (1.67) | (3.03) | (.45) | – | – | – |
| Total distributionsC | (1.67) | (3.10) | (.45) | – | – | – |
| Redemption fees added to paid in capitalA | – | – | – | – | – | – |
| Net asset value, end of period | $34.37 | $39.03 | $38.06 | $31.47 | $26.50 | $26.30 |
| Total ReturnD,E | (7.68)% | 11.30% | 22.55% | 18.75% | .76% | 27.18% |
| Ratios to Average Net AssetsF,G | | | | | | |
| Expenses before reductions | .76%H | .75% | .83% | .86% | .86% | .87% |
| Expenses net of fee waivers, if any | .76%H | .75% | .83% | .86% | .86% | .87% |
| Expenses net of all reductions | .75%H | .74% | .82% | .83% | .85% | .85% |
| Net investment income (loss) | .03%H | .29%B | (.05)% | .06% | (.23)% | (.43)% |
| Supplemental Data | | | | | | |
| Net assets, end of period (000 omitted) | $671,537 | $783,945 | $455,612 | $218,944 | $95,310 | $81,350 |
| Portfolio turnover rateI | 123%H | 142%J | 186% | 142% | 201% | 167% |
A Calculated based on average shares outstanding during the period.
B Net Investment income per share reflects a large, non-recurring dividend which amounted to $.08 per share. Excluding this non-recurring dividend, the ratio of net investment income (loss) to average net assets would have been .09%.
C Amount represents less than $.005 per share.
D Total returns for periods of less than one year are not annualized.
E Total returns would have been lower if certain expenses had not been reduced during the applicable periods shown.
F Fees and expenses of any underlying Fidelity Central Funds are not included in the Fund's expense ratio. The Fund indirectly bears its proportionate share of the expenses of any underlying Fidelity Central Funds.
G Expense ratios reflect operating expenses of the class. Expenses before reductions do not reflect amounts reimbursed by the investment adviser or reductions from brokerage service arrangements or reductions from other expense offset arrangements and do not represent the amount paid by the class during periods when reimbursements or reductions occur. Expenses net of fee waivers reflect expenses after reimbursement by the investment adviser but prior to reductions from brokerage service arrangements or other expense offset arrangements. Expenses net of all reductions represent the net expenses paid by the class.
H Annualized
I Amount does not include the portfolio activity of any underlying Fidelity Central Funds.
J Portfolio turnover rate excludes securities received or delivered in-kind.
See accompanying notes which are an integral part of the financial statements.
Notes to Financial Statements (Unaudited)
For the period ended January 31, 2016
1. Organization.
Fidelity Advisor Technology Fund (the Fund) is a non-diversified fund of Fidelity Advisor Series VII (the Trust) and is authorized to issue an unlimited number of shares. The Trust is registered under the Investment Company Act of 1940, as amended (the 1940 Act), as an open-end management investment company organized as a Massachusetts business trust. The Fund offers Class A, Class T, Class C and Class I shares, each of which, along with Class B shares, has equal rights as to assets and voting privileges. Class B shares are closed to new accounts and additional purchases, except for exchanges and reinvestments. Each class has exclusive voting rights with respect to matters that affect that class. Class B shares will automatically convert to Class A shares after a holding period of seven years from the initial date of purchase. The Fund's investments in emerging markets can be subject to social, economic, regulatory, and political uncertainties and can be extremely volatile.
During the period, the Board of Trustees approved the conversion of all existing Class B shares into Class A shares, effective on or about July 1, 2016, regardless of the length of times shares have been held.
2. Investments in Fidelity Central Funds.
The Fund invests in Fidelity Central Funds, which are open-end investment companies generally available only to other investment companies and accounts managed by the investment adviser and its affiliates. The Fund's Schedule of Investments lists each of the Fidelity Central Funds held as of period end, if any, as an investment of the Fund, but does not include the underlying holdings of each Fidelity Central Fund. As an Investing Fund, the Fund indirectly bears its proportionate share of the expenses of the underlying Fidelity Central Funds.
The Money Market Central Funds seek preservation of capital and current income and are managed by Fidelity Investments Money Management, Inc. (FIMM), an affiliate of the investment adviser. Annualized expenses of the Money Market Central Funds as of their most recent shareholder report date are less than .005%.
A complete unaudited list of holdings for each Fidelity Central Fund is available upon request or at the Securities and Exchange Commission (the SEC) website at www.sec.gov. In addition, the financial statements of the Fidelity Central Funds are available on the SEC website or upon request.
3. Significant Accounting Policies.
The financial statements have been prepared in conformity with accounting principles generally accepted in the United States of America (GAAP), which require management to make certain estimates and assumptions at the date of the financial statements. Actual results could differ from those estimates. Subsequent events, if any, through the date that the financial statements were issued have been evaluated in the preparation of the financial statements. The following summarizes the significant accounting policies of the Fund:
Investment Valuation. Investments are valued as of 4:00 p.m. Eastern time on the last calendar day of the period. The Board of Trustees (the Board) has delegated the day to day responsibility for the valuation of the Fund's investments to the Fidelity SelectCo, LLC (SelectCo) Fair Value Committee (the Committee). In accordance with valuation policies and procedures approved by the Board, the Fund attempts to obtain prices from one or more third party pricing vendors or brokers to value its investments. When current market prices, quotations or currency exchange rates are not readily available or reliable, investments will be fair valued in good faith by the Committee, in accordance with procedures adopted by the Board. Factors used in determining fair value vary by investment type and may include market or investment specific events. The frequency with which these procedures are used cannot be predicted and they may be utilized to a significant extent. The Committee oversees the Fund's valuation policies and procedures and reports to the Board on the Committee's activities and fair value determinations. The Board monitors the appropriateness of the procedures used in valuing the Fund's investments and ratifies the fair value determinations of the Committee.
The Fund categorizes the inputs to valuation techniques used to value its investments into a disclosure hierarchy consisting of three levels as shown below:
- Level 1 – quoted prices in active markets for identical investments
- Level 2 – other significant observable inputs (including quoted prices for similar investments, interest rates, prepayment speeds, etc.)
- Level 3 – unobservable inputs (including the Fund's own assumptions based on the best information available)
Valuation techniques used to value the Fund's investments by major category are as follows:
Equity securities, including restricted securities, for which market quotations are readily available, are valued at the last reported sale price or official closing price as reported by a third party pricing vendor on the primary market or exchange on which they are traded and are categorized as Level 1 in the hierarchy. In the event there were no sales during the day or closing prices are not available, securities are valued at the last quoted bid price or may be valued using the last available price and are generally categorized as Level 2 in the hierarchy. For foreign equity securities, when market or security specific events arise, comparisons to the valuation of American Depositary Receipts (ADRs), futures contracts, Exchange-Traded Funds (ETFs) and certain indexes as well as quoted prices for similar securities may be used and would be categorized as Level 2 in the hierarchy. Utilizing these techniques may result in transfers between Level 1 and Level 2. For equity securities, including restricted securities, where observable inputs are limited, assumptions about market activity and risk are used and these securities may be categorized as Level 3 in the hierarchy. Equity securities, including restricted securities, for which observable inputs are not available are valued using alternate valuation approaches, including the market approach and the income approach and are categorized as Level 3 in the hierarchy. The market approach generally consists of using comparable market transactions while the income approach generally consists of using the net present value of estimated future cash flows, adjusted as appropriate for liquidity, credit, market and/or other risk factors.
Investments in open-end mutual funds, including the Fidelity Central Funds, are valued at their closing net asset value (NAV) each business day and are categorized as Level 1 in the hierarchy.
The following provides information on Level 3 securities held by the Fund that were valued at period end based on unobservable inputs. These amounts exclude valuations provided by a broker.
| Asset Type | Fair Value at 01/31/16 | Valuation Technique(s) | Unobservable Input | Amount or Range/Weighted Average | Impact to Valuation from an Increase in Input* |
| Equities | $ 25,555,591 | Last transaction price | Transaction price | $3.86 - $48.77 / $24.14 | Increase |
| | | Market comparable | EV/Sales multiple | 3.6 | Increase |
| | | | Discount rate | 10.0% | Decrease |
* Represents the expected directional change in the fair value of the Level 3 investments that would result from an increase in the corresponding input. A decrease to the unobservable input would have the opposite effect. Significant changes in these inputs could result in significantly higher or lower fair value measurements.
Changes in valuation techniques may result in transfers in or out of an assigned level within the disclosure hierarchy. The aggregate value of investments by input level as of January 31, 2016, including information on transfers between Levels 1 and 2, as well as a roll forward of Level 3 investments, is included at the end of the Fund's Schedule of Investments.
Foreign Currency. The Fund may use foreign currency contracts to facilitate transactions in foreign-denominated securities. Gains and losses from these transactions may arise from changes in the value of the foreign currency or if the counterparties do not perform under the contracts' terms.
Foreign-denominated assets, including investment securities, and liabilities are translated into U.S. dollars at the exchange rates at period end. Purchases and sales of investment securities, income and dividends received and expenses denominated in foreign currencies are translated into U.S. dollars at the exchange rate in effect on the transaction date.
The effects of exchange rate fluctuations on investments are included with the net realized and unrealized gain (loss) on investment securities. Other foreign currency transactions resulting in realized and unrealized gain (loss) are disclosed separately.
Investment Transactions and Income. For financial reporting purposes, the Fund's investment holdings and NAV include trades executed through the end of the last business day of the period. The NAV per share for processing shareholder transactions is calculated as of the close of business of the New York Stock Exchange (NYSE), normally 4:00 p.m. Eastern time and includes trades executed through the end of the prior business day. Gains and losses on securities sold are determined on the basis of identified cost and may include proceeds received from litigation. Dividend income is recorded on the ex-dividend date, except for certain dividends from foreign securities where the ex-dividend date may have passed, which are recorded as soon as the Fund is informed of the ex-dividend date. Non-cash dividends included in dividend income, if any, are recorded at the fair market value of the securities received. Income and capital gain distributions from Fidelity Central Funds, if any, are recorded on the ex-dividend date. Distributions received on securities that represent a return of capital or capital gain are recorded as a reduction of cost of investments and/or as a realized gain. Subsequent to ex-dividend date the Fund determines the components of these distributions, based upon receipt of tax filings or other correspondence relating to the underlying investment. Investment income is recorded net of foreign taxes withheld where recovery of such taxes is uncertain.
Class Allocations and Expenses. Investment income, realized and unrealized capital gains and losses, common expenses of the Fund, and certain fund-level expense reductions, if any, are allocated daily on a pro-rata basis to each class based on the relative net assets of each class to the total net assets of the Fund. Each class differs with respect to transfer agent and distribution and service plan fees incurred. Certain expense reductions may also differ by class. For the reporting period, the allocated portion of income and expenses to each class as a percent of its average net assets may vary due to the timing of recording these transactions in relation to fluctuating net assets of the classes. Expenses directly attributable to a fund are charged to that fund. Expenses attributable to more than one fund are allocated among the respective funds on the basis of relative net assets or other appropriate methods. Expense estimates are accrued in the period to which they relate and adjustments are made when actual amounts are known.
Deferred Trustee Compensation. Under a Deferred Compensation Plan (the Plan), independent Trustees may elect to defer receipt of a portion of their annual compensation. Deferred amounts are invested in a cross-section of Fidelity funds, are marked-to-market and remain in the Fund until distributed in accordance with the Plan. The investment of deferred amounts and the offsetting payable to the Trustees are included in the accompanying Statement of Assets and Liabilities.
Income Tax Information and Distributions to Shareholders. Each year, the Fund intends to qualify as a regulated investment company under Subchapter M of the Internal Revenue Code, including distributing substantially all of its taxable income and realized gains. As a result, no provision for U.S. Federal income taxes is required. The Fund files a U.S. federal tax return, in addition to state and local tax returns as required. The Fund's federal income tax returns are subject to examination by the Internal Revenue Service (IRS) for a period of three fiscal years after they are filed. State and local tax returns may be subject to examination for an additional fiscal year depending on the jurisdiction. Foreign taxes are provided for based on the Fund's understanding of the tax rules and rates that exist in the foreign markets in which it invests. The Fund is subject to a tax imposed on capital gains by certain countries in which it invests.
Distributions are declared and recorded on the ex-dividend date. Income dividends and capital gain distributions are declared separately for each class. Income and capital gain distributions are determined in accordance with income tax regulations, which may differ from GAAP.
Capital accounts within the financial statements are adjusted for permanent book-tax differences. These adjustments have no impact on net assets or the results of operations. Capital accounts are not adjusted for temporary book-tax differences which will reverse in a subsequent period.
Book-tax differences are primarily due to foreign currency transactions, passive foreign investment companies (PFIC), redemptions in kind, deferred trustees compensation and losses deferred due to wash sales.
The federal tax cost of investment securities and unrealized appreciation (depreciation) as of period end were as follows:
| Gross unrealized appreciation | $231,659,674 |
| Gross unrealized depreciation | (179,284,463) |
| Net unrealized appreciation (depreciation) on securities | $52,375,211 |
| Tax cost | $1,465,134,034 |
Short-Term Trading (Redemption) Fees. Shares held by investors in the Fund less than 30 days may have been subject to a redemption fee equal to .75% of the NAV of shares redeemed. All redemption fees, which reduce the proceeds of the shareholder redemption, are retained by the Fund and accounted for as an addition to paid in capital.
Restricted Securities. The Fund may invest in securities that are subject to legal or contractual restrictions on resale. These securities generally may be resold in transactions exempt from registration or to the public if the securities are registered. Disposal of these securities may involve time-consuming negotiations and expense, and prompt sale at an acceptable price may be difficult. Information regarding restricted securities is included at the end of the Fund's Schedule of Investments.
4. Purchases and Sales of Investments.
Purchases and sales of securities, other than short-term securities, aggregated $937,907,376 and $961,876,227, respectively.
5. Fees and Other Transactions with Affiliates.
Management Fee. Fidelity SelectCo, LLC (the investment adviser) and its affiliates provide the Fund with investment management related services for which the Fund pays a monthly management fee. The management fee is the sum of an individual fund fee rate that is based on an annual rate of .30% of the Fund's average net assets and an annualized group fee rate that averaged .25% during the period. The group fee rate is based upon the average net assets of all the mutual funds advised by Fidelity Management & Research Company (FMR) and the investment adviser. The group fee rate decreases as assets under management increase and increases as assets under management decrease. For the reporting period, the total annualized management fee rate was .55% of the Fund's average net assets.
Distribution and Service Plan Fees. In accordance with Rule 12b-1 of the 1940 Act, the Fund has adopted separate Distribution and Service Plans for each class of shares. Certain classes pay Fidelity Distributors Corporation (FDC), an affiliate of the investment adviser, separate Distribution and Service Fees, each of which is based on an annual percentage of each class' average net assets. In addition, FDC may pay financial intermediaries for selling shares of the Fund and providing shareholder support services. For the period, the Distribution and Service Fee rates, total fees and amounts retained by FDC were as follows:
| | Distribution
Fee | Service
Fee | Total Fees | Retained
by FDC |
| Class A | -% | .25% | $570,271 | $– |
| Class T | .25% | .25% | 496,638 | – |
| Class B | .75% | .25% | 37,979 | 28,484 |
| Class C | .75% | .25% | 689,863 | 145,428 |
| | | | $1,794,751 | $173,912 |
Sales Load. FDC may receive a front-end sales charge of up to 5.75% for selling Class A shares and 3.50% for selling Class T shares, some of which is paid to financial intermediaries for selling shares of the Fund. Depending on the holding period, FDC may receive contingent deferred sales charges levied on Class A, Class T, Class B, and Class C redemptions. The deferred sales charges range from 5.00% to 1.00% for Class B shares, 1.00% for Class C shares, 1.00% for certain purchases of Class A shares and .25% for certain purchases of Class T shares.
For the period, sales charge amounts retained by FDC were as follows:
| | Retained
by FDC |
| Class A | $79,247 |
| Class T | 15,051 |
| Class B(a) | 652 |
| Class C(a) | 11,624 |
| | $106,574 |
(a) When Class B and Class C shares are initially sold, FDC pays commissions from its own resources to financial intermediaries through which the sales are made.
Transfer Agent Fees. Fidelity Investments Institutional Operations Company, Inc., (FIIOC), an affiliate of the investment adviser, is the transfer, dividend disbursing and shareholder servicing agent for each class of the Fund. FIIOC receives account fees and asset-based fees that vary according to the account size and type of account of the shareholders of the respective classes of the Fund. FIIOC pays for typesetting, printing and mailing of shareholder reports, except proxy statements.
For the period, transfer agent fees for each class were as follows:
| | Amount | % of
Class-Level Average
Net Assets(a) |
| Class A | $539,687 | .24 |
| Class T | 247,069 | .25 |
| Class B | 11,563 | .30 |
| Class C | 168,158 | .24 |
| Class I | 561,735 | .15 |
| | $1,528,212 | |
(a) Annualized
Accounting and Security Lending Fees. Fidelity Service Company, Inc. (FSC), an affiliate of the investment adviser, maintains the Fund's accounting records. The accounting fee is based on the level of average net assets for each month. Under a separate contract, FSC administers the security lending program. The security lending fee is based on the number and duration of lending transactions.
Brokerage Commissions. The Fund placed a portion of its portfolio transactions with brokerage firms which are affiliates of the investment adviser. Brokerage commissions are included in net realized gain (loss) and change in net unrealized appreciation (depreciation) in the Statement of Operations. The commissions paid to these affiliated firms were $18,183 for the period.
Interfund Lending Program. Pursuant to an Exemptive Order issued by the SEC, the Fund, along with other registered investment companies having management contracts with FMR or other affiliated entities of FMR, may participate in an interfund lending program. This program provides an alternative credit facility allowing the funds to borrow from, or lend money to, other participating affiliated funds. At period end, there were no interfund loans outstanding. The Fund's activity in this program during the period for which loans were outstanding was as follows:
| Borrower or Lender | Average Loan Balance | Weighted Average Interest Rate | Interest Expense |
| Borrower | $7,119,143 | .51% | $712 |
Interfund Trades. The Fund may purchase from or sell securities to other Fidelity Funds under procedures adopted by the Board. The procedures have been designed to ensure these interfund trades are executed in accordance with Rule 17a-7 of the 1940 Act. Interfund trades are included within the respective purchases and sales amounts shown in the Purchases and Sales of Investments note.
6. Committed Line of Credit.
The Fund participates with other funds managed by the investment adviser or an affiliate in a $4.25 billion credit facility (the "line of credit") to be utilized for temporary or emergency purposes to fund shareholder redemptions or for other short-term liquidity purposes. The Fund has agreed to pay commitment fees on its pro-rata portion of the line of credit, which amounted to $1,050 and is reflected in Miscellaneous expenses on the Statement of Operations. During the period, the Fund did not borrow on this line of credit.
7. Security Lending.
The Fund lends portfolio securities through a lending agent from time to time in order to earn additional income. On the settlement date of the loan, the Fund receives collateral (in the form of U.S. Treasury obligations, letters of credit and/or cash) against the loaned securities and maintains collateral in an amount not less than 100% of the market value of the loaned securities during the period of the loan. The market value of the loaned securities is determined at the close of business of the Fund and any additional required collateral is delivered to the Fund on the next business day. The Fund or borrower may terminate the loan at any time, and if the borrower defaults on its obligation to return the securities loaned because of insolvency or other reasons, the Fund may apply collateral received from the borrower against the obligation. The Fund may experience delays and costs in recovering the securities loaned. Any cash collateral received is invested in the Fidelity Securities Lending Cash Central Fund. The value of loaned securities and cash collateral at period end are disclosed on the Fund's Statement of Assets and Liabilities. Security lending income represents the income earned on investing cash collateral, less rebates paid to borrowers and any lending agent fees associated with the loan, plus any premium payments received for lending certain types of securities. Security lending income is presented in the Statement of Operations as a component of income from Fidelity Central Funds.
8. Expense Reductions.
Commissions paid to certain brokers with whom the investment adviser, or its affiliates, places trades on behalf of the Fund include an amount in addition to trade execution, which may be rebated back to the Fund to offset certain expenses. This amount totaled $77,970 for the period.
In addition, during the period the investment advisor reimbursed/waived a portion of fund-level operating expenses in the amount of $5,839.
9. Distributions to Shareholders.
Distributions to shareholders of each class were as follows:
| | Six months ended January 31, 2016 | Year ended July 31, 2015 |
| From net investment income | | |
| Class A | $– | $285,364 |
| Class I | – | 1,409,297 |
| Total | $– | $1,694,661 |
| From net realized gain | | |
| Class A | $20,472,714 | $33,752,271 |
| Class T | 9,063,088 | 16,437,395 |
| Class B | 374,802 | 983,656 |
| Class C | 6,550,928 | 9,419,892 |
| Class I | 33,607,301 | 55,049,067 |
| Total | $70,068,833 | $115,642,281 |
10. Share Transactions.
Share transactions for each class were as follows and may contain automatic conversions between classes or exchanges between affiliated funds:
| | Shares | Shares | Dollars | Dollars |
| | Six months ended January 31, 2016 | Year ended July 31, 2015 | Six months ended January 31, 2016 | Year ended July 31, 2015 |
| Class A | | | | |
| Shares sold | 1,773,219 | 2,913,106 | $61,129,456 | $105,555,201 |
| Reinvestment of distributions | 590,741 | 901,782 | 19,252,252 | 31,562,947 |
| Shares redeemed | (1,546,674) | (2,417,005) | (52,559,612) | (86,800,900) |
| Net increase (decrease) | 817,286 | 1,397,883 | $27,822,096 | $50,317,248 |
| Class T | | | | |
| Shares sold | 428,365 | 637,105 | $14,104,967 | $22,054,709 |
| Reinvestment of distributions | 284,010 | 476,624 | 8,858,269 | 16,015,842 |
| Shares redeemed | (544,745) | (866,616) | (17,660,693) | (29,828,780) |
| Net increase (decrease) | 167,630 | 247,113 | $5,302,543 | $8,241,771 |
| Class B | | | | |
| Shares sold | 6,296 | 11,273 | $188,902 | $348,144 |
| Reinvestment of distributions | 12,391 | 29,273 | 352,034 | 901,739 |
| Shares redeemed | (71,823) | (142,494) | (2,145,688) | (4,494,534) |
| Net increase (decrease) | (53,136) | (101,948) | $(1,604,752) | $(3,244,651) |
| Class C | | | | |
| Shares sold | 710,262 | 1,277,139 | $21,299,797 | $40,629,084 |
| Reinvestment of distributions | 202,969 | 261,235 | 5,774,470 | 8,065,851 |
| Shares redeemed | (396,652) | (554,231) | (11,605,149) | (17,408,387) |
| Net increase (decrease) | 516,579 | 984,143 | $15,469,118 | $31,286,548 |
| Class I | | | | |
| Shares sold | 1,413,558 | 23,671,191(a) | $51,512,643 | $899,915,317(a) |
| Reinvestment of distributions | 955,239 | 1,510,080 | 33,041,700 | 55,853,504 |
| Shares redeemed | (2,913,152) | (17,066,384)(b) | (105,240,186) | (649,080,123)(b) |
| Net increase (decrease) | (544,355) | 8,114,887 | $(20,685,843) | $306,688,698 |
(a) Amount includes in-kind exchanges.
(b) Amount includes in-kind redemptions.
11. Other.
The Fund's organizational documents provide former and current trustees and officers with a limited indemnification against liabilities arising in connection with the performance of their duties to the Fund. In the normal course of business, the Fund may also enter into contracts that provide general indemnifications. The Fund's maximum exposure under these arrangements is unknown as this would be dependent on future claims that may be made against the Fund. The risk of material loss from such claims is considered remote.
At the end of the period, Strategic Advisers Core Fund was the owner of record of approximately 31% of the total outstanding shares of the Fund.
Fidelity Advisor® Utilities Fund
Investment Summary (Unaudited)
Top Ten Stocks as of January 31, 2016
| | % of fund's net assets | % of fund's net assets 6 months ago |
| NextEra Energy, Inc. | 17.8 | 16.1 |
| Exelon Corp. | 12.2 | 13.0 |
| Sempra Energy | 10.1 | 11.2 |
| Dominion Resources, Inc. | 9.0 | 9.0 |
| PG&E Corp. | 4.9 | 4.6 |
| PPL Corp. | 4.8 | 4.9 |
| Avangrid, Inc. | 4.4 | 0.0 |
| Edison International | 4.4 | 4.9 |
| DTE Energy Co. | 4.1 | 2.1 |
| Calpine Corp. | 3.8 | 4.3 |
| | 75.5 | |
Top Industries (% of fund's net assets)
| As of January 31, 2016 |
| | Electric Utilities | 47.7% |
| | Multi-Utilities | 36.4% |
| | Independent Power and Renewable Electricity Producers | 9.1% |
| | Media | 3.4% |
| | Real Estate Investment Trusts | 1.5% |
| | All Others* | 1.9% |

| As of July 31, 2015 |
| | Electric Utilities | 48.8% |
| | Multi-Utilities | 30.8% |
| | Independent Power and Renewable Electricity Producers | 11.6% |
| | Oil, Gas & Consumable Fuels | 4.7% |
| | Real Estate Investment Trusts | 2.7% |
| | All Others* | 1.4% |

* Includes Short-Term investments and Net Other Assets (Liabilities).
Percentages shown as 0.0% may reflect amounts less than 0.05%.
Fidelity Advisor® Utilities Fund
Investments January 31, 2016 (Unaudited)
Showing Percentage of Net Assets
| Common Stocks - 99.1% | | | |
| | | Shares | Value |
| Electric Utilities - 47.7% | | | |
| Electric Utilities - 47.7% | | | |
| Edison International | | 173,202 | $10,703,884 |
| Exelon Corp. | | 1,006,941 | 29,775,245 |
| FirstEnergy Corp. | | 257,300 | 8,506,338 |
| ITC Holdings Corp. | | 143,500 | 5,725,650 |
| NextEra Energy, Inc. | | 390,940 | 43,671,908 |
| OGE Energy Corp. | | 114,523 | 3,003,938 |
| PNM Resources, Inc. | | 112,200 | 3,524,202 |
| PPL Corp. | | 337,872 | 11,845,792 |
| | | | 116,756,957 |
| Independent Power and Renewable Electricity Producers - 9.1% | | | |
| Independent Power Producers & Energy Traders - 8.2% | | | |
| Calpine Corp. (a) | | 613,217 | 9,388,352 |
| Dynegy, Inc. (a) | | 306,557 | 3,629,635 |
| NRG Energy, Inc. | | 222,735 | 2,369,900 |
| NRG Yield, Inc. Class C (b) | | 139,220 | 1,843,273 |
| The AES Corp. | | 296,100 | 2,812,950 |
| | | | 20,044,110 |
| Renewable Electricity - 0.9% | | | |
| NextEra Energy Partners LP | | 32,900 | 887,971 |
| Pattern Energy Group, Inc. (b) | | 76,400 | 1,447,780 |
| | | | 2,335,751 |
|
| TOTAL INDEPENDENT POWER AND RENEWABLE ELECTRICITY PRODUCERS | | | 22,379,861 |
|
| Media - 3.4% | | | |
| Cable & Satellite - 3.4% | | | |
| Comcast Corp. Class A | | 147,900 | 8,239,509 |
| Multi-Utilities - 36.4% | | | |
| Multi-Utilities - 36.4% | | | |
| Avangrid, Inc. (a) | | 280,900 | 10,800,605 |
| Black Hills Corp. | | 46,200 | 2,276,736 |
| Dominion Resources, Inc. | | 305,999 | 22,083,948 |
| DTE Energy Co. | | 118,098 | 10,039,511 |
| NiSource, Inc. | | 345,883 | 7,267,002 |
| PG&E Corp. | | 216,618 | 11,894,494 |
| Sempra Energy | | 260,737 | 24,704,831 |
| | | | 89,067,127 |
| Oil, Gas & Consumable Fuels - 1.0% | | | |
| Oil & Gas Storage & Transport - 1.0% | | | |
| Cheniere Energy Partners LP Holdings LLC | | 166,562 | 2,486,771 |
| Real Estate Investment Trusts - 1.5% | | | |
| Specialized REITs - 1.5% | | | |
| Crown Castle International Corp. | | 43,500 | 3,749,700 |
| TOTAL COMMON STOCKS | | | |
| (Cost $229,094,479) | | | 242,679,925 |
|
| Money Market Funds - 1.6% | | | |
| Fidelity Cash Central Fund, 0.38% (c) | | 1,622,622 | 1,622,622 |
| Fidelity Securities Lending Cash Central Fund, 0.42% (c)(d) | | 2,459,975 | 2,459,975 |
| TOTAL MONEY MARKET FUNDS | | | |
| (Cost $4,082,597) | | | 4,082,597 |
| TOTAL INVESTMENT PORTFOLIO - 100.7% | | | |
| (Cost $233,177,076) | | | 246,762,522 |
| NET OTHER ASSETS (LIABILITIES) - (0.7)% | | | (1,834,131) |
| NET ASSETS - 100% | | | $244,928,391 |
Legend
(a) Non-income producing
(b) Security or a portion of the security is on loan at period end.
(c) Affiliated fund that is generally available only to investment companies and other accounts managed by Fidelity Investments. The rate quoted is the annualized seven-day yield of the fund at period end. A complete unaudited listing of the fund's holdings as of its most recent quarter end is available upon request. In addition, each Fidelity Central Fund's financial statements are available on the SEC's website or upon request.
(d) Investment made with cash collateral received from securities on loan.
Affiliated Central Funds
Information regarding fiscal year to date income earned by the Fund from investments in Fidelity Central Funds is as follows:
| Fund | Income earned |
| Fidelity Cash Central Fund | $1,511 |
| Fidelity Securities Lending Cash Central Fund | 3,427 |
| Total | $4,938 |
Investment Valuation
All investments are categorized as Level 1 under the Fair Value Hierarchy. The inputs or methodology used for valuing securities may not be an indication of the risk associated with investing in those securities. For more information on valuation inputs please refer to the Investment Valuation section in the accompanying Notes to Financial Statements.
See accompanying notes which are an integral part of the financial statements.
Fidelity Advisor® Utilities Fund
Financial Statements
Statement of Assets and Liabilities
| | | January 31, 2016 (Unaudited) |
| Assets | | |
Investment in securities, at value (including securities loaned of $2,381,953) — See accompanying schedule:
Unaffiliated issuers (cost $229,094,479) | $242,679,925 | |
| Fidelity Central Funds (cost $4,082,597) | 4,082,597 | |
| Total Investments (cost $233,177,076) | | $246,762,522 |
| Receivable for fund shares sold | | 968,491 |
| Dividends receivable | | 178,340 |
| Distributions receivable from Fidelity Central Funds | | 1,435 |
| Prepaid expenses | | 1,119 |
| Other receivables | | 7,601 |
| Total assets | | 247,919,508 |
| Liabilities | | |
| Payable for investments purchased | $79,246 | |
| Payable for fund shares redeemed | 178,187 | |
| Accrued management fee | 107,177 | |
| Distribution and service plan fees payable | 81,617 | |
| Other affiliated payables | 58,294 | |
| Other payables and accrued expenses | 26,621 | |
| Collateral on securities loaned, at value | 2,459,975 | |
| Total liabilities | | 2,991,117 |
| Net Assets | | $244,928,391 |
| Net Assets consist of: | | |
| Paid in capital | | $244,805,100 |
| Distributions in excess of net investment income | | (203,800) |
| Accumulated undistributed net realized gain (loss) on investments | | (13,258,055) |
| Net unrealized appreciation (depreciation) on investments and assets and liabilities in foreign currencies | | 13,585,146 |
| Net Assets | | $244,928,391 |
| Calculation of Maximum Offering Price | | |
| Class A: | | |
| Net Asset Value and redemption price per share ($126,289,901 ÷ 5,328,059 shares) | | $23.70 |
| Maximum offering price per share (100/94.25 of $23.70) | | $25.15 |
| Class T: | | |
| Net Asset Value and redemption price per share ($41,977,387 ÷ 1,766,808 shares) | | $23.76 |
| Maximum offering price per share (100/96.50 of $23.76) | | $24.62 |
| Class B: | | |
| Net Asset Value and offering price per share ($1,739,429 ÷ 73,428 shares)(a) | | $23.69 |
| Class C: | | |
| Net Asset Value and offering price per share ($47,651,546 ÷ 2,048,320 shares)(a) | | $23.26 |
| Class I: | | |
| Net Asset Value, offering price and redemption price per share ($27,270,128 ÷ 1,129,626 shares) | | $24.14 |
(a) Redemption price per share is equal to net asset value less any applicable contingent deferred sales charge.
See accompanying notes which are an integral part of the financial statements.
Statement of Operations
| | | Six months ended January 31, 2016 (Unaudited) |
| Investment Income | | |
| Dividends | | $3,829,150 |
| Income from Fidelity Central Funds | | 4,938 |
| Total income | | 3,834,088 |
| Expenses | | |
| Management fee | $684,609 | |
| Transfer agent fees | 316,976 | |
| Distribution and service plan fees | 518,449 | |
| Accounting and security lending fees | 48,624 | |
| Custodian fees and expenses | 3,622 | |
| Independent trustees' compensation | 2,360 | |
| Registration fees | 47,156 | |
| Audit | 22,210 | |
| Legal | 1,470 | |
| Miscellaneous | 1,432 | |
| Total expenses before reductions | 1,646,908 | |
| Expense reductions | (2,064) | 1,644,844 |
| Net investment income (loss) | | 2,189,244 |
| Realized and Unrealized Gain (Loss) | | |
| Net realized gain (loss) on: | | |
| Investment securities: | | |
| Unaffiliated issuers | (9,871,188) | |
| Total net realized gain (loss) | | (9,871,188) |
Change in net unrealized appreciation (depreciation) on:
Investment securities | (119,427) | |
| Assets and liabilities in foreign currencies | (78) | |
| Total change in net unrealized appreciation (depreciation) | | (119,505) |
| Net gain (loss) | | (9,990,693) |
| Net increase (decrease) in net assets resulting from operations | | $(7,801,449) |
See accompanying notes which are an integral part of the financial statements.
Statement of Changes in Net Assets
| | Six months ended January 31, 2016 (Unaudited) | Year ended July 31, 2015 |
| Increase (Decrease) in Net Assets | | |
| Operations | | |
| Net investment income (loss) | $2,189,244 | $4,638,676 |
| Net realized gain (loss) | (9,871,188) | 6,045,318 |
| Change in net unrealized appreciation (depreciation) | (119,505) | (5,645,684) |
| Net increase (decrease) in net assets resulting from operations | (7,801,449) | 5,038,310 |
| Distributions to shareholders from net investment income | (4,356,273) | (4,008,742) |
| Distributions to shareholders from net realized gain | (6,473,264) | (17,304,031) |
| Total distributions | (10,829,537) | (21,312,773) |
| Share transactions - net increase (decrease) | (9,521,670) | (19,607,828) |
| Redemption fees | 3,930 | 10,186 |
| Total increase (decrease) in net assets | (28,148,726) | (35,872,105) |
| Net Assets | | |
| Beginning of period | 273,077,117 | 308,949,222 |
| End of period (including distributions in excess of net investment income of $203,800 and undistributed net investment income of $1,963,229, respectively) | $244,928,391 | $273,077,117 |
See accompanying notes which are an integral part of the financial statements.
Financial Highlights — Fidelity Advisor Utilities Fund Class A
| | Six months ended (Unaudited) | Years ended July 31, | | | | |
| January 31, | 2016 | 2015 | 2014 | 2013 | 2012 | 2011 |
| Selected Per–Share Data | | | | | | |
| Net asset value, beginning of period | $25.48 | $26.77 | $23.48 | $21.20 | $19.09 | $16.59 |
| Income from Investment Operations | | | | | | |
| Net investment income (loss)A | .23 | .44 | .41 | .47 | .43 | .39 |
| Net realized and unrealized gain (loss) | (.93) | .18 | 3.35 | 2.24 | 2.07 | 2.50 |
| Total from investment operations | (.70) | .62 | 3.76 | 2.71 | 2.50 | 2.89 |
| Distributions from net investment income | (.46) | (.38) | (.46) | (.43) | (.39) | (.39) |
| Distributions from net realized gain | (.61) | (1.52) | (.01) | – | – | – |
| Total distributions | (1.08)B | (1.91)C | (.47) | (.43) | (.39) | (.39) |
| Redemption fees added to paid in capitalA,D | – | – | – | – | – | – |
| Net asset value, end of period | $23.70 | $25.48 | $26.77 | $23.48 | $21.20 | $19.09 |
| Total ReturnE,F,G | (2.51)% | 2.01% | 16.38% | 13.09% | 13.40% | 17.71% |
| Ratios to Average Net AssetsH,I | | | | | | |
| Expenses before reductions | 1.15%J | 1.13% | 1.16% | 1.20% | 1.23% | 1.24% |
| Expenses net of fee waivers, if any | 1.15%J | 1.13% | 1.16% | 1.20% | 1.23% | 1.24% |
| Expenses net of all reductions | 1.15%J | 1.11% | 1.15% | 1.16% | 1.22% | 1.20% |
| Net investment income (loss) | 1.92%J | 1.65% | 1.64% | 2.16% | 2.24% | 2.18% |
| Supplemental Data | | | | | | |
| Net assets, end of period (000 omitted) | $126,290 | $140,148 | $154,134 | $106,851 | $99,813 | $78,312 |
| Portfolio turnover rateK | 62%J | 105% | 112% | 154% | 195% | 201% |
A Calculated based on average shares outstanding during the period.
B Total distributions of $1.08 per share is comprised of distributions from net investment income of $.462 and distributions from net realized gain of $.613 per share.
C Total distributions of $1.91 per share is comprised of distributions from net investment income of $.384 and distributions from net realized gain of $1.524 per share.
D Amount represents less than $.005 per share.
E Total returns for periods of less than one year are not annualized.
F Total returns would have been lower if certain expenses had not been reduced during the applicable periods shown.
G Total returns do not include the effect of the sales charges.
H Fees and expenses of any underlying Fidelity Central Funds are not included in the Fund's expense ratio. The Fund indirectly bears its proportionate share of the expenses of any underlying Fidelity Central Funds.
I Expense ratios reflect operating expenses of the class. Expenses before reductions do not reflect amounts reimbursed by the investment adviser or reductions from brokerage service arrangements or reductions from other expense offset arrangements and do not represent the amount paid by the class during periods when reimbursements or reductions occur. Expenses net of fee waivers reflect expenses after reimbursement by the investment adviser but prior to reductions from brokerage service arrangements or other expense offset arrangements. Expenses net of all reductions represent the net expenses paid by the class.
J Annualized
K Amount does not include the portfolio activity of any underlying Fidelity Central Funds.
See accompanying notes which are an integral part of the financial statements.
Financial Highlights — Fidelity Advisor Utilities Fund Class T
| | Six months ended (Unaudited) | Years ended July 31, | | | | |
| January 31, | 2016 | 2015 | 2014 | 2013 | 2012 | 2011 |
| Selected Per–Share Data | | | | | | |
| Net asset value, beginning of period | $25.49 | $26.78 | $23.50 | $21.21 | $19.09 | $16.59 |
| Income from Investment Operations | | | | | | |
| Net investment income (loss)A | .19 | .36 | .34 | .41 | .38 | .35 |
| Net realized and unrealized gain (loss) | (.92) | .18 | 3.35 | 2.25 | 2.07 | 2.50 |
| Total from investment operations | (.73) | .54 | 3.69 | 2.66 | 2.45 | 2.85 |
| Distributions from net investment income | (.39) | (.31) | (.40) | (.37) | (.33) | (.35) |
| Distributions from net realized gain | (.61) | (1.52) | (.01) | – | – | – |
| Total distributions | (1.00) | (1.83) | (.41) | (.37) | (.33) | (.35) |
| Redemption fees added to paid in capitalA,B | – | – | – | – | – | – |
| Net asset value, end of period | $23.76 | $25.49 | $26.78 | $23.50 | $21.21 | $19.09 |
| Total ReturnC,D,E | (2.63)% | 1.72% | 15.99% | 12.81% | 13.13% | 17.39% |
| Ratios to Average Net AssetsF,G | | | | | | |
| Expenses before reductions | 1.45%H | 1.42% | 1.45% | 1.47% | 1.49% | 1.50% |
| Expenses net of fee waivers, if any | 1.45%H | 1.42% | 1.45% | 1.47% | 1.49% | 1.50% |
| Expenses net of all reductions | 1.45%H | 1.41% | 1.44% | 1.43% | 1.48% | 1.46% |
| Net investment income (loss) | 1.62%H | 1.35% | 1.35% | 1.89% | 1.98% | 1.92% |
| Supplemental Data | | | | | | |
| Net assets, end of period (000 omitted) | $41,977 | $46,366 | $49,272 | $41,239 | $38,276 | $35,701 |
| Portfolio turnover rateI | 62%H | 105% | 112% | 154% | 195% | 201% |
A Calculated based on average shares outstanding during the period.
B Amount represents less than $.005 per share.
C Total returns for periods of less than one year are not annualized.
D Total returns would have been lower if certain expenses had not been reduced during the applicable periods shown.
E Total returns do not include the effect of the sales charges.
F Fees and expenses of any underlying Fidelity Central Funds are not included in the Fund's expense ratio. The Fund indirectly bears its proportionate share of the expenses of any underlying Fidelity Central Funds.
G Expense ratios reflect operating expenses of the class. Expenses before reductions do not reflect amounts reimbursed by the investment adviser or reductions from brokerage service arrangements or reductions from other expense offset arrangements and do not represent the amount paid by the class during periods when reimbursements or reductions occur. Expenses net of fee waivers reflect expenses after reimbursement by the investment adviser but prior to reductions from brokerage service arrangements or other expense offset arrangements. Expenses net of all reductions represent the net expenses paid by the class.
H Annualized
I Amount does not include the portfolio activity of any underlying Fidelity Central Funds.
See accompanying notes which are an integral part of the financial statements.
Financial Highlights — Fidelity Advisor Utilities Fund Class B
| | Six months ended (Unaudited) | Years ended July 31, | | | | |
| January 31, | 2016 | 2015 | 2014 | 2013 | 2012 | 2011 |
| Selected Per–Share Data | | | | | | |
| Net asset value, beginning of period | $25.25 | $26.51 | $23.24 | $20.96 | $18.86 | $16.38 |
| Income from Investment Operations | | | | | | |
| Net investment income (loss)A | .13 | .22 | .21 | .30 | .28 | .25 |
| Net realized and unrealized gain (loss) | (.91) | .19 | 3.33 | 2.23 | 2.05 | 2.49 |
| Total from investment operations | (.78) | .41 | 3.54 | 2.53 | 2.33 | 2.74 |
| Distributions from net investment income | (.17) | (.14) | (.26) | (.25) | (.23) | (.26) |
| Distributions from net realized gain | (.61) | (1.52) | (.01) | – | – | – |
| Total distributions | (.78) | (1.67)B | (.27) | (.25) | (.23) | (.26) |
| Redemption fees added to paid in capitalA,C | – | – | – | – | – | – |
| Net asset value, end of period | $23.69 | $25.25 | $26.51 | $23.24 | $20.96 | $18.86 |
| Total ReturnD,E,F | (2.90)% | 1.23% | 15.41% | 12.24% | 12.54% | 16.87% |
| Ratios to Average Net AssetsG,H | | | | | | |
| Expenses before reductions | 1.94%I | 1.94% | 1.95% | 1.96% | 1.98% | 1.99% |
| Expenses net of fee waivers, if any | 1.94%I | 1.94% | 1.95% | 1.96% | 1.98% | 1.99% |
| Expenses net of all reductions | 1.94%I | 1.93% | 1.94% | 1.92% | 1.97% | 1.95% |
| Net investment income (loss) | 1.13%I | .83% | .85% | 1.40% | 1.49% | 1.43% |
| Supplemental Data | | | | | | |
| Net assets, end of period (000 omitted) | $1,739 | $2,680 | $4,598 | $5,289 | $6,677 | $7,773 |
| Portfolio turnover rateJ | 62%I | 105% | 112% | 154% | 195% | 201% |
A Calculated based on average shares outstanding during the period.
B Total distributions of $1.67 per share is comprised of distributions from net investment income of $.141 and distributions from net realized gain of $1.524 per share.
C Amount represents less than $.005 per share.
D Total returns for periods of less than one year are not annualized.
E Total returns would have been lower if certain expenses had not been reduced during the applicable periods shown.
F Total returns do not include the effect of the contingent deferred sales charge.
G Fees and expenses of any underlying Fidelity Central Funds are not included in the Fund's expense ratio. The Fund indirectly bears its proportionate share of the expenses of any underlying Fidelity Central Funds.
H Expense ratios reflect operating expenses of the class. Expenses before reductions do not reflect amounts reimbursed by the investment adviser or reductions from brokerage service arrangements or reductions from other expense offset arrangements and do not represent the amount paid by the class during periods when reimbursements or reductions occur. Expenses net of fee waivers reflect expenses after reimbursement by the investment adviser but prior to reductions from brokerage service arrangements or other expense offset arrangements. Expenses net of all reductions represent the net expenses paid by the class.
I Annualized
J Amount does not include the portfolio activity of any underlying Fidelity Central Funds.
See accompanying notes which are an integral part of the financial statements.
Financial Highlights — Fidelity Advisor Utilities Fund Class C
| | Six months ended (Unaudited) | Years ended July 31, | | | | |
| January 31, | 2016 | 2015 | 2014 | 2013 | 2012 | 2011 |
| Selected Per–Share Data | | | | | | |
| Net asset value, beginning of period | $24.91 | $26.23 | $23.03 | $20.80 | $18.75 | $16.30 |
| Income from Investment Operations | | | | | | |
| Net investment income (loss)A | .14 | .23 | .23 | .31 | .29 | .26 |
| Net realized and unrealized gain (loss) | (.91) | .19 | 3.29 | 2.20 | 2.03 | 2.46 |
| Total from investment operations | (.77) | .42 | 3.52 | 2.51 | 2.32 | 2.72 |
| Distributions from net investment income | (.27) | (.22) | (.31) | (.28) | (.27) | (.27) |
| Distributions from net realized gain | (.61) | (1.52) | (.01) | – | – | – |
| Total distributions | (.88) | (1.74) | (.32) | (.28) | (.27) | (.27) |
| Redemption fees added to paid in capitalA,B | – | – | – | – | – | – |
| Net asset value, end of period | $23.26 | $24.91 | $26.23 | $23.03 | $20.80 | $18.75 |
| Total ReturnC,D,E | (2.89)% | 1.29% | 15.52% | 12.27% | 12.56% | 16.85% |
| Ratios to Average Net AssetsF,G | | | | | | |
| Expenses before reductions | 1.89%H | 1.88% | 1.89% | 1.93% | 1.95% | 1.98% |
| Expenses net of fee waivers, if any | 1.89%H | 1.88% | 1.89% | 1.93% | 1.95% | 1.98% |
| Expenses net of all reductions | 1.89%H | 1.86% | 1.88% | 1.89% | 1.95% | 1.94% |
| Net investment income (loss) | 1.18%H | .89% | .91% | 1.43% | 1.51% | 1.43% |
| Supplemental Data | | | | | | |
| Net assets, end of period (000 omitted) | $47,652 | $52,172 | $54,810 | $35,457 | $29,942 | $26,915 |
| Portfolio turnover rateI | 62%H | 105% | 112% | 154% | 195% | 201% |
A Calculated based on average shares outstanding during the period.
B Amount represents less than $.005 per share.
C Total returns for periods of less than one year are not annualized.
D Total returns would have been lower if certain expenses had not been reduced during the applicable periods shown.
E Total returns do not include the effect of the contingent deferred sales charge.
F Fees and expenses of any underlying Fidelity Central Funds are not included in the Fund's expense ratio. The Fund indirectly bears its proportionate share of the expenses of any underlying Fidelity Central Funds.
G Expense ratios reflect operating expenses of the class. Expenses before reductions do not reflect amounts reimbursed by the investment adviser or reductions from brokerage service arrangements or reductions from other expense offset arrangements and do not represent the amount paid by the class during periods when reimbursements or reductions occur. Expenses net of fee waivers reflect expenses after reimbursement by the investment adviser but prior to reductions from brokerage service arrangements or other expense offset arrangements. Expenses net of all reductions represent the net expenses paid by the class.
H Annualized
I Amount does not include the portfolio activity of any underlying Fidelity Central Funds.
See accompanying notes which are an integral part of the financial statements.
Financial Highlights — Fidelity Advisor Utilities Fund Class I
| | Six months ended (Unaudited) | Years ended July 31, | | | | |
| January 31, | 2016 | 2015 | 2014 | 2013 | 2012 | 2011 |
| Selected Per–Share Data | | | | | | |
| Net asset value, beginning of period | $25.97 | $27.24 | $23.87 | $21.56 | $19.40 | $16.85 |
| Income from Investment Operations | | | | | | |
| Net investment income (loss)A | .27 | .52 | .51 | .55 | .50 | .45 |
| Net realized and unrealized gain (loss) | (.96) | .20 | 3.39 | 2.26 | 2.10 | 2.54 |
| Total from investment operations | (.69) | .72 | 3.90 | 2.81 | 2.60 | 2.99 |
| Distributions from net investment income | (.53) | (.46) | (.52) | (.50) | (.44) | (.44) |
| Distributions from net realized gain | (.61) | (1.52) | (.01) | – | – | – |
| Total distributions | (1.14) | (1.99)B | (.53) | (.50) | (.44) | (.44) |
| Redemption fees added to paid in capitalA,C | – | – | – | – | – | – |
| Net asset value, end of period | $24.14 | $25.97 | $27.24 | $23.87 | $21.56 | $19.40 |
| Total ReturnD,E | (2.37)% | 2.35% | 16.74% | 13.40% | 13.79% | 18.05% |
| Ratios to Average Net AssetsF,G | | | | | | |
| Expenses before reductions | .86%H | .83% | .85% | .89% | .92% | .98% |
| Expenses net of fee waivers, if any | .86%H | .83% | .85% | .89% | .92% | .98% |
| Expenses net of all reductions | .86%H | .81% | .84% | .85% | .91% | .94% |
| Net investment income (loss) | 2.21%H | 1.94% | 1.95% | 2.46% | 2.55% | 2.44% |
| Supplemental Data | | | | | | |
| Net assets, end of period (000 omitted) | $27,270 | $31,710 | $46,135 | $19,562 | $20,564 | $10,914 |
| Portfolio turnover rateI | 62%H | 105% | 112% | 154% | 195% | 201% |
A Calculated based on average shares outstanding during the period.
B Total distributions of $1.99 per share is comprised of distributions from net investment income of $.463 and distributions from net realized gain of $1.524 per share.
C Amount represents less than $.005 per share.
D Total returns for periods of less than one year are not annualized.
E Total returns would have been lower if certain expenses had not been reduced during the applicable periods shown.
F Fees and expenses of any underlying Fidelity Central Funds are not included in the Fund's expense ratio. The Fund indirectly bears its proportionate share of the expenses of any underlying Fidelity Central Funds.
G Expense ratios reflect operating expenses of the class. Expenses before reductions do not reflect amounts reimbursed by the investment adviser or reductions from brokerage service arrangements or reductions from other expense offset arrangements and do not represent the amount paid by the class during periods when reimbursements or reductions occur. Expenses net of fee waivers reflect expenses after reimbursement by the investment adviser but prior to reductions from brokerage service arrangements or other expense offset arrangements. Expenses net of all reductions represent the net expenses paid by the class.
H Annualized
I Amount does not include the portfolio activity of any underlying Fidelity Central Funds.
See accompanying notes which are an integral part of the financial statements.
Notes to Financial Statements (Unaudited)
For the period ended January 31, 2016
1. Organization.
Fidelity Advisor Utilities Fund (the Fund) is a non-diversified fund of Fidelity Advisor Series VII (the Trust) and is authorized to issue an unlimited number of shares. The Trust is registered under the Investment Company Act of 1940, as amended (the 1940 Act), as an open-end management investment company organized as a Massachusetts business trust. The Fund offers Class A, Class T, Class C and Class I shares, each of which, along with Class B shares, has equal rights as to assets and voting privileges. Class B shares are closed to new accounts and additional purchases, except for exchanges and reinvestments. Each class has exclusive voting rights with respect to matters that affect that class. Class B shares will automatically convert to Class A shares after a holding period of seven years from the initial date of purchase.
During the period, the Board of Trustees approved the conversion of all existing Class B shares into Class A shares, effective on or about July 1, 2016, regardless of the length of times shares have been held.
2. Investments in Fidelity Central Funds.
The Fund invests in Fidelity Central Funds, which are open-end investment companies generally available only to other investment companies and accounts managed by the investment adviser and its affiliates. The Fund's Schedule of Investments lists each of the Fidelity Central Funds held as of period end, if any, as an investment of the Fund, but does not include the underlying holdings of each Fidelity Central Fund. As an Investing Fund, the Fund indirectly bears its proportionate share of the expenses of the underlying Fidelity Central Funds.
The Money Market Central Funds seek preservation of capital and current income and are managed by Fidelity Investments Money Management, Inc. (FIMM), an affiliate of the investment adviser. Annualized expenses of the Money Market Central Funds as of their most recent shareholder report date are less than .005%.
A complete unaudited list of holdings for each Fidelity Central Fund is available upon request or at the Securities and Exchange Commission (the SEC) website at www.sec.gov. In addition, the financial statements of the Fidelity Central Funds are available on the SEC website or upon request.
3. Significant Accounting Policies.
The financial statements have been prepared in conformity with accounting principles generally accepted in the United States of America (GAAP), which require management to make certain estimates and assumptions at the date of the financial statements. Actual results could differ from those estimates. Subsequent events, if any, through the date that the financial statements were issued have been evaluated in the preparation of the financial statements. The following summarizes the significant accounting policies of the Fund:
Investment Valuation. Investments are valued as of 4:00 p.m. Eastern time on the last calendar day of the period. The Board of Trustees (the Board) has delegated the day to day responsibility for the valuation of the Fund's investments to the Fidelity SelectCo, LLC (SelectCo) Fair Value Committee (the Committee). In accordance with valuation policies and procedures approved by the Board, the Fund attempts to obtain prices from one or more third party pricing vendors or brokers to value its investments. When current market prices, quotations or currency exchange rates are not readily available or reliable, investments will be fair valued in good faith by the Committee, in accordance with procedures adopted by the Board. Factors used in determining fair value vary by investment type and may include market or investment specific events. The frequency with which these procedures are used cannot be predicted and they may be utilized to a significant extent. The Committee oversees the Fund's valuation policies and procedures and reports to the Board on the Committee's activities and fair value determinations. The Board monitors the appropriateness of the procedures used in valuing the Fund's investments and ratifies the fair value determinations of the Committee.
The Fund categorizes the inputs to valuation techniques used to value its investments into a disclosure hierarchy consisting of three levels as shown below:
- Level 1 – quoted prices in active markets for identical investments
- Level 2 – other significant observable inputs (including quoted prices for similar investments, interest rates, prepayment speeds, etc.)
- Level 3 – unobservable inputs (including the Fund's own assumptions based on the best information available)
Valuation techniques used to value the Fund's investments by major category are as follows:
Equity securities, including restricted securities, for which market quotations are readily available, are valued at the last reported sale price or official closing price as reported by a third party pricing vendor on the primary market or exchange on which they are traded and are categorized as Level 1 in the hierarchy. In the event there were no sales during the day or closing prices are not available, securities are valued at the last quoted bid price or may be valued using the last available price and are generally categorized as Level 2 in the hierarchy. For foreign equity securities, when market or security specific events arise, comparisons to the valuation of American Depositary Receipts (ADRs), futures contracts, Exchange-Traded Funds (ETFs) and certain indexes as well as quoted prices for similar securities may be used and would be categorized as Level 2 in the hierarchy. Utilizing these techniques may result in transfers between Level 1 and Level 2. For equity securities, including restricted securities, where observable inputs are limited, assumptions about market activity and risk are used and these securities may be categorized as Level 3 in the hierarchy.
Investments in open-end mutual funds, including the Fidelity Central Funds, are valued at their closing net asset value (NAV) each business day and are categorized as Level 1 in the hierarchy.
Changes in valuation techniques may result in transfers in or out of an assigned level within the disclosure hierarchy.
Foreign Currency. The Fund may use foreign currency contracts to facilitate transactions in foreign-denominated securities. Gains and losses from these transactions may arise from changes in the value of the foreign currency or if the counterparties do not perform under the contracts' terms.
Foreign-denominated assets, including investment securities, and liabilities are translated into U.S. dollars at the exchange rates at period end. Purchases and sales of investment securities, income and dividends received and expenses denominated in foreign currencies are translated into U.S. dollars at the exchange rate in effect on the transaction date.
The effects of exchange rate fluctuations on investments are included with the net realized and unrealized gain (loss) on investment securities. Other foreign currency transactions resulting in realized and unrealized gain (loss) are disclosed separately.
Investment Transactions and Income. For financial reporting purposes, the Fund's investment holdings and NAV include trades executed through the end of the last business day of the period. The NAV per share for processing shareholder transactions is calculated as of the close of business of the New York Stock Exchange (NYSE), normally 4:00 p.m. Eastern time and includes trades executed through the end of the prior business day. Gains and losses on securities sold are determined on the basis of identified cost and may include proceeds received from litigation. Dividend income is recorded on the ex-dividend date, except for certain dividends from foreign securities where the ex-dividend date may have passed, which are recorded as soon as the Fund is informed of the ex-dividend date. Non-cash dividends included in dividend income, if any, are recorded at the fair market value of the securities received. Income and capital gain distributions from Fidelity Central Funds, if any, are recorded on the ex-dividend date. Distributions received on securities that represent a return of capital or capital gain are recorded as a reduction of cost of investments and/or as a realized gain. Subsequent to ex-dividend date the Fund determines the components of these distributions, based upon receipt of tax filings or other correspondence relating to the underlying investment. Investment income is recorded net of foreign taxes withheld where recovery of such taxes is uncertain.
Class Allocations and Expenses. Investment income, realized and unrealized capital gains and losses, common expenses of the Fund, and certain fund-level expense reductions, if any, are allocated daily on a pro-rata basis to each class based on the relative net assets of each class to the total net assets of the Fund. Each class differs with respect to transfer agent and distribution and service plan fees incurred. Certain expense reductions may also differ by class. For the reporting period, the allocated portion of income and expenses to each class as a percent of its average net assets may vary due to the timing of recording these transactions in relation to fluctuating net assets of the classes. Expenses directly attributable to a fund are charged to that fund. Expenses attributable to more than one fund are allocated among the respective funds on the basis of relative net assets or other appropriate methods. Expense estimates are accrued in the period to which they relate and adjustments are made when actual amounts are known.
Income Tax Information and Distributions to Shareholders. Each year, the Fund intends to qualify as a regulated investment company under Subchapter M of the Internal Revenue Code, including distributing substantially all of its taxable income and realized gains. As a result, no provision for U.S. Federal income taxes is required. The Fund files a U.S. federal tax return, in addition to state and local tax returns as required. The Fund's federal income tax returns are subject to examination by the Internal Revenue Service (IRS) for a period of three fiscal years after they are filed. State and local tax returns may be subject to examination for an additional fiscal year depending on the jurisdiction. Foreign taxes are provided for based on the Fund's understanding of the tax rules and rates that exist in the foreign markets in which it invests.
Distributions are declared and recorded on the ex-dividend date. Income dividends and capital gain distributions are declared separately for each class. Income and capital gain distributions are determined in accordance with income tax regulations, which may differ from GAAP.
Capital accounts within the financial statements are adjusted for permanent book-tax differences. These adjustments have no impact on net assets or the results of operations. Capital accounts are not adjusted for temporary book-tax differences which will reverse in a subsequent period.
Book-tax differences are primarily due to futures contracts, foreign currency transactions, partnerships, deferred trustees compensation, and losses deferred due to wash sales and excise tax regulations.
The federal tax cost of investment securities and unrealized appreciation (depreciation) as of period end were as follows:
| Gross unrealized appreciation | $26,793,561 |
| Gross unrealized depreciation | (15,485,888) |
| Net unrealized appreciation (depreciation) on securities | $11,307,673 |
| Tax cost | $235,454,849 |
The Fund elected to defer to its next fiscal year approximately $2,413,933 of capital losses recognized during the period November 1, 2014 to July 31, 2015.
Short-Term Trading (Redemption) Fees. Shares held by investors in the Fund less than 30 days may have been subject to a redemption fee equal to .75% of the NAV of shares redeemed. All redemption fees, which reduce the proceeds of the shareholder redemption, are retained by the Fund and accounted for as an addition to paid in capital.
4. Purchases and Sales of Investments
Purchases and sales of securities, other than short-term securities, aggregated $77,114,349 and $93,403,125, respectively.
5. Fees and Other Transactions with Affiliates.
Management Fee. Fidelity SelectCo, LLC (the investment adviser) and its affiliates provide the Fund with investment management related services for which the Fund pays a monthly management fee. The management fee is the sum of an individual fund fee rate that is based on an annual rate of .30% of the Fund's average net assets and an annualized group fee rate that averaged .25% during the period. The group fee rate is based upon the average net assets of all the mutual funds advised by Fidelity Management & Research Company (FMR) and the investment adviser. The group fee rate decreases as assets under management increase and increases as assets under management decrease. For the reporting period, the total annualized management fee rate was .55% of the Fund's average net assets.
Distribution and Service Plan Fees. In accordance with Rule 12b-1 of the 1940 Act, the Fund has adopted separate Distribution and Service Plans for each class of shares. Certain classes pay Fidelity Distributors Corporation (FDC), an affiliate of the investment adviser, separate Distribution and Service Fees, each of which is based on an annual percentage of each class' average net assets. In addition, FDC may pay financial intermediaries for selling shares of the Fund and providing shareholder support services. For the period, the Distribution and Service Fee rates, total fees and amounts retained by FDC were as follows:
| | Distribution
Fee | Service
Fee | Total Fees | Retained
by FDC |
| Class A | -% | .25% | $161,014 | $252 |
| Class T | .25% | .25% | 107,180 | – |
| Class B | .75% | .25% | 10,456 | 7,842 |
| Class C | .75% | .25% | 239,799 | 33,193 |
| | | | $518,449 | $41,287 |
Sales Load. FDC may receive a front-end sales charge of up to 5.75% for selling Class A shares and 3.50% for selling Class T shares, some of which is paid to financial intermediaries for selling shares of the Fund. Depending on the holding period, FDC may receive contingent deferred sales charges levied on Class A, Class T, Class B, and Class C redemptions. The deferred sales charges range from 5.00% to 1.00% for Class B shares, 1.00% for Class C shares, 1.00% for certain purchases of Class A shares and .25% for certain purchases of Class T shares.
For the period, sales charge amounts retained by FDC were as follows:
| | Retained
by FDC |
| Class A | $30,219 |
| Class T | 4,152 |
| Class B(a) | 38 |
| Class C(a) | 4,707 |
| | $39,116 |
(a) When Class B Class C shares are initially sold, FDC pays commissions from its own resources to financial intermediaries through which the sales are made.
Transfer Agent Fees. Fidelity Investments Institutional Operations Company, Inc., (FIIOC), an affiliate of the investment adviser, is the transfer, dividend disbursing and shareholder servicing agent for each class of the Fund. FIIOC receives account fees and asset-based fees that vary according to the account size and type of account of the shareholders of the respective classes of the Fund FIIOC pays for typesetting, printing and mailing of shareholder reports, except proxy statements.
For the period, transfer agent fees for each class were as follows:
| | Amount | % of
Class-Level Average
Net Assets(a) |
| Class A | $160,747 | .25 |
| Class T | 64,922 | .30 |
| Class B | 3,106 | .30 |
| Class C | 59,096 | .25 |
| Class I | 29,105 | .21 |
| | $316,976 | |
(a) Annualized
Accounting and Security Lending Fees. Fidelity Service Company, Inc. (FSC), an affiliate of the investment adviser, maintains the Fund's accounting records. The accounting fee is based on the level of average net assets for each month. Under a separate contract, FSC administers the security lending program. The security lending fee is based on the number and duration of lending transactions.
Brokerage Commissions. The Fund placed a portion of its portfolio transactions with brokerage firms which are affiliates of the investment adviser. Brokerage commissions are included in net realized gain (loss) and change in net unrealized appreciation (depreciation) in the Statement of Operations. The commissions paid to these affiliated firms were $2,749 for the period.
Interfund Trades. The Fund may purchase from or sell securities to other Fidelity Funds under procedures adopted by the Board. The procedures have been designed to ensure these interfund trades are executed in accordance with Rule 17a-7 of the 1940 Act. Interfund trades are included within the respective purchases and sales amounts shown in the Purchases and Sales of Investments note.
6. Committed Line of Credit.
The Fund participates with other funds managed by the investment adviser or an affiliate in a $4.25 billion credit facility (the "line of credit") to be utilized for temporary or emergency purposes to fund shareholder redemptions or for other short-term liquidity purposes. The Fund has agreed to pay commitment fees on its pro-rata portion of the line of credit, which amounted to $171 and is reflected in Miscellaneous expenses on the Statement of Operations. During the period, the Fund did not borrow on this line of credit.
7. Security Lending.
The Fund lends portfolio securities through a lending agent from time to time in order to earn additional income. On the settlement date of the loan, the Fund receives collateral (in the form of U.S. Treasury obligations, letters of credit and/or cash) against the loaned securities and maintains collateral in an amount not less than 100% of the market value of the loaned securities during the period of the loan. The market value of the loaned securities is determined at the close of business of the Fund and any additional required collateral is delivered to the Fund on the next business day. The Fund or borrower may terminate the loan at any time, and if the borrower defaults on its obligation to return the securities loaned because of insolvency or other reasons, the Fund may apply collateral received from the borrower against the obligation. The Fund may experience delays and costs in recovering the securities loaned. Any cash collateral received is invested in the Fidelity Securities Lending Cash Central Fund. The value of loaned securities and cash collateral at period end are disclosed on the Fund's Statement of Assets and Liabilities. Security lending income represents the income earned on investing cash collateral, less rebates paid to borrowers and any lending agent fees associated with the loan, plus any premium payments received for lending certain types of securities. Security lending income is presented in the Statement of Operations as a component of income from Fidelity Central Funds. Total security lending income during the period amounted to $3,427.
8. Expense Reductions.
Commissions paid to certain brokers with whom the investment adviser, or its affiliates, places trades on behalf of the Fund include an amount in addition to trade execution, which may be rebated back to the Fund to offset certain expenses. This amount totaled $1,215 for the period.
In addition, during the period the investment advisor reimbursed and/or waived a portion of fund-level operating expenses in the amount of $849.
9. Distributions to Shareholders.
Distributions to shareholders of each class were as follows:
| | Six months ended January 31, 2016 | Year ended July 31, 2015 |
| From net investment income | | |
| Class A | $2,494,667 | $2,209,427 |
| Class T | 696,864 | 589,279 |
| Class B | 13,894 | 23,317 |
| Class C | 548,207 | 465,161 |
| Class I | 602,641 | 721,558 |
| Total | $4,356,273 | $4,008,742 |
| From net realized gain | | |
| Class A | $3,341,067 | $8,639,872 |
| Class T | 1,100,541 | 2,863,183 |
| Class B | 58,860 | 255,750 |
| Class C | 1,254,979 | 3,177,658 |
| Class I | 717,817 | 2,367,568 |
| Total | $6,473,264 | $17,304,031 |
10. Share Transactions.
Share transactions for each class were as follows and may contain automatic conversions between classes or exchanges between affiliated funds:
| | Shares | Shares | Dollars | Dollars |
| | Six months ended January 31, 2016 | Year ended July 31, 2015 | Six months ended January 31, 2016 | Year ended July 31, 2015 |
| Class A | | | | |
| Shares sold | 470,287 | 1,888,559 | $11,191,022 | $50,338,260 |
| Reinvestment of distributions | 240,305 | 365,507 | 5,414,225 | 9,845,503 |
| Shares redeemed | (882,776) | (2,512,099) | (20,769,813) | (66,117,493) |
| Net increase (decrease) | (172,184) | (258,033) | $(4,164,566) | $(5,933,730) |
| Class T | | | | |
| Shares sold | 109,490 | 388,662 | $2,601,524 | $10,348,248 |
| Reinvestment of distributions | 76,233 | 123,166 | 1,721,689 | 3,324,380 |
| Shares redeemed | (237,725) | (532,785) | (5,551,342) | (14,023,975) |
| Net increase (decrease) | (52,002) | (20,957) | $(1,228,129) | $(351,347) |
| Class B | | | | |
| Shares sold | 1,992 | 10,961 | $45,271 | $290,048 |
| Reinvestment of distributions | 2,783 | 9,053 | 62,667 | 242,668 |
| Shares redeemed | (37,515) | (87,257) | (885,495) | (2,288,453) |
| Net increase (decrease) | (32,740) | (67,243) | $(777,557) | $(1,755,737) |
| Class C | | | | |
| Shares sold | 230,514 | 773,976 | $5,283,518 | $20,247,064 |
| Reinvestment of distributions | 71,102 | 116,026 | 1,573,006 | 3,068,131 |
| Shares redeemed | (347,955) | (884,724) | (8,055,697) | (22,817,991) |
| Net increase (decrease) | (46,339) | 5,278 | $(1,199,173) | $497,204 |
| Class I | | | | |
| Shares sold | 375,260 | 1,143,014 | $9,175,899 | $31,002,673 |
| Reinvestment of distributions | 49,611 | 90,001 | 1,138,487 | 2,465,972 |
| Shares redeemed | (516,375) | (1,705,406) | (12,466,631) | (45,532,863) |
| Net increase (decrease) | (91,504) | (472,391) | $(2,152,245) | $(12,064,218) |
11. Other.
The Fund's organizational documents provide former and current trustees and officers with a limited indemnification against liabilities arising in connection with the performance of their duties to the Fund. In the normal course of business, the Fund may also enter into contracts that provide general indemnifications. The Fund's maximum exposure under these arrangements is unknown as this would be dependent on future claims that may be made against the Fund. The risk of material loss from such claims is considered remote.
Shareholder Expense Example
As a shareholder of the Fund, you incur two types of costs: (1) transaction costs, including sales charges (loads) on purchase payments or redemption proceeds, redemption fees and (2) ongoing costs, including management fees, distribution and/or service (12b-1) fees and other Fund expenses. This Example is intended to help you understand your ongoing costs (in dollars) of investing in the Fund and to compare these costs with the ongoing costs of investing in other mutual funds.
The Example is based on an investment of $1,000 invested at the beginning of the period and held for the entire period (August 1, 2015 to January 31, 2016).
Actual Expenses
The first line of the accompanying table for each class of the Fund provides information about actual account values and actual expenses. You may use the information in this line, together with the amount you invested, to estimate the expenses that you paid over the period. Simply divide your account value by $1,000.00 (for example, an $8,600 account value divided by $1,000.00 = 8.6), then multiply the result by the number in the first line for a class of the Fund under the heading entitled "Expenses Paid During Period" to estimate the expenses you paid on your account during this period. In addition, the Fund, as a shareholder in the underlying Fidelity Central Funds, will indirectly bear its pro-rata share of the fees and expenses incurred by the underlying Fidelity Central Funds. These fees and expenses are not included in the Fund's annualized expense ratio used to calculate the expense estimate in the table below.
Hypothetical Example for Comparison Purposes
The second line of the accompanying table for each class of the Fund provides information about hypothetical account values and hypothetical expenses based on a Class' actual expense ratio and an assumed rate of return of 5% per year before expenses, which is not the Class' actual return. The hypothetical account values and expenses may not be used to estimate the actual ending account balance or expenses you paid for the period. You may use this information to compare the ongoing costs of investing in the Fund and other funds. To do so, compare this 5% hypothetical example with the 5% hypothetical examples that appear in the shareholder reports of the other funds. In addition, the Fund, as a shareholder in the underlying Fidelity Central Funds, will indirectly bear its pro-rata share of the fees and expenses incurred by the underlying Fidelity Central Funds. These fees and expenses are not included in the Fund's annualized expense ratio used to calculate the expense estimate in the table below.
Please note that the expenses shown in the table are meant to highlight your ongoing costs only and do not reflect any transaction costs. Therefore, the second line of the table is useful in comparing ongoing costs only, and will not help you determine the relative total costs of owning different funds. In addition, if these transactional costs were included, your costs would have been higher.
| | Annualized Expense RatioA | Beginning
Account Value
August 1, 2015 | Ending
Account Value
January 31, 2016 | Expenses Paid
During Period-B
August 1, 2015
to January 31, 2016 |
| Fidelity Advisor Biotechnology Fund | | | | |
| Class A | 1.05% | | | |
| Actual | | $1,000.00 | $641.00 | $4.33 |
| Hypothetical-C | | $1,000.00 | $1,019.86 | $5.33 |
| Class T | 1.36% | | | |
| Actual | | $1,000.00 | $640.20 | $5.61 |
| Hypothetical-C | | $1,000.00 | $1,018.30 | $6.90 |
| Class B | 1.83% | | | |
| Actual | | $1,000.00 | $638.70 | $7.54 |
| Hypothetical-C | | $1,000.00 | $1,015.94 | $9.27 |
| Class C | 1.80% | | | |
| Actual | | $1,000.00 | $638.90 | $7.42 |
| Hypothetical-C | | $1,000.00 | $1,016.09 | $9.12 |
| Class I | .78% | | | |
| Actual | | $1,000.00 | $642.00 | $3.22 |
| Hypothetical-C | | $1,000.00 | $1,021.22 | $3.96 |
| Fidelity Advisor Communications Equipment Fund | | | | |
| Class A | 1.40% | | | |
| Actual | | $1,000.00 | $825.20 | $6.42 |
| Hypothetical-C | | $1,000.00 | $1,018.10 | $7.10 |
| Class T | 1.65% | | | |
| Actual | | $1,000.00 | $824.00 | $7.57 |
| Hypothetical-C | | $1,000.00 | $1,016.84 | $8.36 |
| Class B | 2.15% | | | |
| Actual | | $1,000.00 | $821.80 | $9.85 |
| Hypothetical-C | | $1,000.00 | $1,014.33 | $10.89 |
| Class C | 2.15% | | | |
| Actual | | $1,000.00 | $822.60 | $9.85 |
| Hypothetical-C | | $1,000.00 | $1,014.33 | $10.89 |
| Class I | 1.15% | | | |
| Actual | | $1,000.00 | $826.60 | $5.28 |
| Hypothetical-C | | $1,000.00 | $1,019.36 | $5.84 |
| Fidelity Advisor Consumer Discretionary Fund | | | | |
| Class A | 1.12% | | | |
| Actual | | $1,000.00 | $908.60 | $5.37 |
| Hypothetical-C | | $1,000.00 | $1,019.51 | $5.69 |
| Class T | 1.42% | | | |
| Actual | | $1,000.00 | $907.40 | $6.81 |
| Hypothetical-C | | $1,000.00 | $1,018.00 | $7.20 |
| Class B | 1.92% | | | |
| Actual | | $1,000.00 | $904.80 | $9.19 |
| Hypothetical-C | | $1,000.00 | $1,015.48 | $9.73 |
| Class C | 1.88% | | | |
| Actual | | $1,000.00 | $905.40 | $9.00 |
| Hypothetical-C | | $1,000.00 | $1,015.69 | $9.53 |
| Class I | .86% | | | |
| Actual | | $1,000.00 | $909.90 | $4.13 |
| Hypothetical-C | | $1,000.00 | $1,020.81 | $4.37 |
| Fidelity Advisor Electronics Fund | | | | |
| Class A | 1.37% | | | |
| Actual | | $1,000.00 | $952.70 | $6.72 |
| Hypothetical-C | | $1,000.00 | $1,018.25 | $6.95 |
| Class T | 1.65% | | | |
| Actual | | $1,000.00 | $951.20 | $8.09 |
| Hypothetical-C | | $1,000.00 | $1,016.84 | $8.36 |
| Class B | 2.15% | | | |
| Actual | | $1,000.00 | $949.30 | $10.53 |
| Hypothetical-C | | $1,000.00 | $1,014.33 | $10.89 |
| Class C | 2.14% | | | |
| Actual | | $1,000.00 | $949.20 | $10.49 |
| Hypothetical-C | | $1,000.00 | $1,014.38 | $10.84 |
| Class I | 1.04% | | | |
| Actual | | $1,000.00 | $954.80 | $5.11 |
| Hypothetical-C | | $1,000.00 | $1,019.91 | $5.28 |
| Fidelity Advisor Energy Fund | | | | |
| Class A | 1.13% | | | |
| Actual | | $1,000.00 | $861.60 | $5.29 |
| Hypothetical-C | | $1,000.00 | $1,019.46 | $5.74 |
| Class T | 1.38% | | | |
| Actual | | $1,000.00 | $860.30 | $6.45 |
| Hypothetical-C | | $1,000.00 | $1,018.20 | $7.00 |
| Class B | 1.91% | | | |
| Actual | | $1,000.00 | $857.90 | $8.92 |
| Hypothetical-C | | $1,000.00 | $1,015.53 | $9.68 |
| Class C | 1.85% | | | |
| Actual | | $1,000.00 | $858.40 | $8.64 |
| Hypothetical-C | | $1,000.00 | $1,015.84 | $9.37 |
| Class I | .86% | | | |
| Actual | | $1,000.00 | $862.60 | $4.03 |
| Hypothetical-C | | $1,000.00 | $1,020.81 | $4.37 |
| Fidelity Advisor Financial Services Fund | | | | |
| Class A | 1.16% | | | |
| Actual | | $1,000.00 | $857.60 | $5.42 |
| Hypothetical-C | | $1,000.00 | $1,019.30 | $5.89 |
| Class T | 1.45% | | | |
| Actual | | $1,000.00 | $856.10 | $6.77 |
| Hypothetical-C | | $1,000.00 | $1,017.85 | $7.35 |
| Class B | 1.97% | | | |
| Actual | | $1,000.00 | $854.10 | $9.18 |
| Hypothetical-C | | $1,000.00 | $1,015.23 | $9.98 |
| Class C | 1.91% | | | |
| Actual | | $1,000.00 | $853.70 | $8.90 |
| Hypothetical-C | | $1,000.00 | $1,015.53 | $9.68 |
| Class I | .86% | | | |
| Actual | | $1,000.00 | $858.50 | $4.02 |
| Hypothetical-C | | $1,000.00 | $1,020.81 | $4.37 |
| Fidelity Advisor Health Care Fund | | | | |
| Class A | 1.04% | | | |
| Actual | | $1,000.00 | $808.60 | $4.73 |
| Hypothetical-C | | $1,000.00 | $1,019.91 | $5.28 |
| Class T | 1.31% | | | |
| Actual | | $1,000.00 | $807.60 | $5.95 |
| Hypothetical-C | | $1,000.00 | $1,018.55 | $6.65 |
| Class B | 1.87% | | | |
| Actual | | $1,000.00 | $805.10 | $8.48 |
| Hypothetical-C | | $1,000.00 | $1,015.74 | $9.48 |
| Class C | 1.80% | | | |
| Actual | | $1,000.00 | $805.50 | $8.17 |
| Hypothetical-C | | $1,000.00 | $1,016.09 | $9.12 |
| Class I | .79% | | | |
| Actual | | $1,000.00 | $809.40 | $3.59 |
| Hypothetical-C | | $1,000.00 | $1,021.17 | $4.01 |
| Fidelity Advisor Industrials Fund | | | | |
| Class A | 1.07% | | | |
| Actual | | $1,000.00 | $909.60 | $5.14 |
| Hypothetical-C | | $1,000.00 | $1,019.76 | $5.43 |
| Class T | 1.33% | | | |
| Actual | | $1,000.00 | $908.20 | $6.38 |
| Hypothetical-C | | $1,000.00 | $1,018.45 | $6.75 |
| Class B | 1.85% | | | |
| Actual | | $1,000.00 | $906.10 | $8.86 |
| Hypothetical-C | | $1,000.00 | $1,015.84 | $9.37 |
| Class C | 1.82% | | | |
| Actual | | $1,000.00 | $906.00 | $8.72 |
| Hypothetical-C | | $1,000.00 | $1,015.99 | $9.22 |
| Class I | .80% | | | |
| Actual | | $1,000.00 | $910.90 | $3.84 |
| Hypothetical-C | | $1,000.00 | $1,021.11 | $4.06 |
| Fidelity Advisor Technology Fund | | | | |
| Class A | 1.09% | | | |
| Actual | | $1,000.00 | $921.40 | $5.26 |
| Hypothetical-C | | $1,000.00 | $1,019.66 | $5.53 |
| Class T | 1.35% | | | |
| Actual | | $1,000.00 | $920.30 | $6.52 |
| Hypothetical-C | | $1,000.00 | $1,018.35 | $6.85 |
| Class B | 1.91% | | | |
| Actual | | $1,000.00 | $917.60 | $9.21 |
| Hypothetical-C | | $1,000.00 | $1,015.53 | $9.68 |
| Class C | 1.85% | | | |
| Actual | | $1,000.00 | $918.20 | $8.92 |
| Hypothetical-C | | $1,000.00 | $1,015.84 | $9.37 |
| Class I | .76% | | | |
| Actual | | $1,000.00 | $923.20 | $3.67 |
| Hypothetical-C | | $1,000.00 | $1,021.32 | $3.86 |
| Fidelity Advisor Utilities Fund | | | | |
| Class A | 1.15% | | | |
| Actual | | $1,000.00 | $974.90 | $5.71 |
| Hypothetical-C | | $1,000.00 | $1,019.36 | $5.84 |
| Class T | 1.45% | | | |
| Actual | | $1,000.00 | $973.70 | $7.19 |
| Hypothetical-C | | $1,000.00 | $1,017.85 | $7.35 |
| Class B | 1.94% | | | |
| Actual | | $1,000.00 | $971.00 | $9.61 |
| Hypothetical-C | | $1,000.00 | $1,015.38 | $9.83 |
| Class C | 1.89% | | | |
| Actual | | $1,000.00 | $971.10 | $9.36 |
| Hypothetical-C | | $1,000.00 | $1,015.63 | $9.58 |
| Class I | .86% | | | |
| Actual | | $1,000.00 | $976.30 | $4.27 |
| Hypothetical-C | | $1,000.00 | $1,020.81 | $4.37 |
| | | | | |
| | | | | |
| | | | | |
A Annualized expense ratio reflects expenses net of applicable fee waivers.
B Expenses are equal to each Class' annualized expense ratio, multiplied by the average account value over the period, multiplied by 184/ 366 (to reflect the one-half year period).
C 5% return per year before expenses
Board Approval of Investment Advisory Contracts and Management Fees
Fidelity Advisor Focus Funds
Each year, the Board of Trustees, including the Independent Trustees (together, the Board), votes on the renewal of the management contract with Fidelity SelectCo, LLC (SelectCo), an affiliate of Fidelity Management & Research Company (FMR), and the sub-advisory agreements with affiliates of FMR (together, the Advisory Contracts) for each fund. The Board, assisted by the advice of fund counsel and Independent Trustees' counsel, requests and considers a broad range of information relevant to the renewal of the Advisory Contracts throughout the year.
The Board meets regularly and, at each of its meetings, covers an extensive agenda of topics and materials and considers factors that are relevant to its annual consideration of the renewal of each fund's Advisory Contracts, including the services and support provided to each fund and its shareholders. The Board has established four standing committees (Committees) — Operations, Audit, Fair Valuation, and Governance and Nominating — each composed of and chaired by Independent Trustees with varying backgrounds, to which the Board has assigned specific subject matter responsibilities in order to enhance effective decision-making by the Board. The Operations Committee, of which all of the Independent Trustees are members, meets regularly throughout the year and considers, among other matters, information specifically related to the annual consideration of the renewal of each fund's Advisory Contracts. The Board, acting directly and through its Committees, requests and receives information concerning the annual consideration of the renewal of each fund's Advisory Contracts. The Board also meets as needed to consider matters specifically related to the Board's annual consideration of the renewal of the Advisory Contracts. Members of the Board may also meet with trustees of other Fidelity funds through ad hoc joint committees to discuss certain matters relevant to all of the Fidelity funds.
At its January 2016 meeting, the Board unanimously determined to renew each fund's Advisory Contracts. In reaching its determination, the Board considered all factors it believed relevant, including (i) the nature, extent, and quality of the services to be provided to each fund and its shareholders (including the investment performance of each fund); (ii) the competitiveness of each fund's management fee and total expense ratio relative to peer funds; (iii) the total costs of the services to be provided by and the profits to be realized by Fidelity from its relationships with each fund; and (iv) the extent to which, if any, economies of scale exist and would be realized as each fund grows, and whether any economies of scale are appropriately shared with fund shareholders.
In considering whether to renew the Advisory Contracts for each fund, the Board reached a determination, with the assistance of fund counsel and Independent Trustees' counsel and through the exercise of its business judgment, that the renewal of the Advisory Contracts was in the best interests of each fund and its shareholders and that the compensation payable under the Advisory Contracts was fair and reasonable. The Board's decision to renew the Advisory Contracts was not based on any single factor, but rather was based on a comprehensive consideration of all the information provided to the Board at its meetings throughout the year. The Board, in reaching its determination to renew the Advisory Contracts, was aware that shareholders of each fund have a broad range of investment choices available to them, including a wide choice among funds offered by Fidelity's competitors, and that each fund's shareholders, who have the opportunity to review and weigh the disclosure provided by the fund in its prospectus and other public disclosures, have chosen to invest in that fund, which is part of the Fidelity family of funds.
Nature, Extent, and Quality of Services Provided. The Board considered the staffing of SelectCo and the sub-advisers (together with SelectCo, the Investment Advisers) as it relates to the funds, including the backgrounds of investment personnel of SelectCo, and also considered the funds' investment objectives, strategies, and related investment philosophies. The Independent Trustees also had discussions with senior management of Fidelity's investment operations and investment groups. The Board considered the structure of the investment personnel compensation program and whether this structure provides appropriate incentives to act in the best interests of each fund. Additionally, the Board considered the portfolio managers' investments, if any, in the funds that they manage.
Resources Dedicated to Investment Management and Support Services. The Board reviewed the general qualifications and capabilities of the investment staff of the Investment Advisers, including their size, education, experience, and resources, as well as Fidelity's approach to recruiting, training, managing, and compensating investment personnel. The Board noted that Fidelity has continued to increase the resources devoted to non-U.S. offices, including expansion of Fidelity's global investment organization. The Board also noted that Fidelity's analysts have extensive resources, tools and capabilities that allow them to conduct sophisticated quantitative and fundamental analysis, as well as credit analysis of issuers, counterparties and guarantors. Further, the Board considered that Fidelity's investment professionals have sufficient access to global information and data so as to provide competitive investment results over time, and that those professionals also have access to sophisticated tools that permit them to assess portfolio construction and risk and performance attribution characteristics continuously, as well as to transmit new information and research conclusions rapidly around the world. Additionally, in its deliberations, the Board considered Fidelity's trading, risk management, compliance, and technology and operations capabilities and resources, which are integral parts of the investment management process.
Shareholder and Administrative Services. The Board considered (i) the nature, extent, quality, and cost of advisory, administrative, and shareholder services performed by the Investment Advisers and their affiliates under the Advisory Contracts and under separate agreements covering transfer agency, pricing and bookkeeping, and securities lending services for each fund; (ii) the nature and extent of the supervision of third party service providers, principally custodians, subcustodians, and pricing vendors; and (iii) the resources devoted to, and the record of compliance with, each fund's compliance policies and procedures. The Board also reviewed the allocation of fund brokerage, including allocations to brokers affiliated with the Investment Advisers, the use of brokerage commissions to pay fund expenses, and the use of "soft" commission dollars to pay for research services.
The Board noted that the growth of fund assets over time across the complex allows Fidelity to reinvest in the development of services designed to enhance the value or convenience of the Fidelity funds as investment vehicles. These services include 24-hour access to account information and market information through telephone representatives and over the Internet, investor education materials and asset allocation tools, and the expanded availability of Fidelity Investor Centers.
The Board noted that in 2014 the ad hoc Committee on Transfer Agency Fees was formed by it and the boards of certain other Fidelity funds to review the variety of transfer agency services and fee structures throughout the mutual fund industry compared to Fidelity's.
Investment in a Large Fund Family. The Board considered the benefits to shareholders of investing in a Fidelity fund, including the benefits of investing in a fund that is part of a large family of funds offering a variety of investment disciplines and providing a large variety of mutual fund investor services. The Board noted that Fidelity had taken, or had made recommendations that resulted in the Fidelity funds taking, a number of actions over the previous year that benefited particular funds, including (i) continuing to dedicate additional resources to investment research and to the support of the senior management team that oversees asset management; (ii) continuing efforts to enhance Fidelity's global research capabilities; (iii) launching new funds and making other enhancements to meet client needs; (iv) reducing management fees and total expenses for certain index funds; (v) continuing to launch dedicated lower cost underlying funds to meet portfolio construction needs related to expanding underlying fund options for Fidelity funds of funds, specifically for the Freedom Fund product lines; (vi) rationalizing product lines and gaining increased efficiencies through fund mergers; (vii) continuing to develop, acquire and implement systems and technology to improve services to the funds and shareholders, strengthen information security, and increase efficiency; (viii) implementing investment enhancements to further strengthen Fidelity's target date product line to increase investors' probability of success in achieving their goals; (ix) modifying the eligibility criteria for certain share classes to accommodate roll-over assets from employer-sponsored retirement plans; (x) launching a new Class W of the Freedom Index Funds to attract and retain Fidelity record-kept retirement plan assets; and (xi) implementing changes to Fidelity's money market fund product line in response to recent regulatory reforms.
Investment Performance. The Board considered whether each fund has operated in accordance with its investment objective, as well as its record of compliance with its investment restrictions and its performance history.
The Board took into account discussions with representatives of the Investment Advisers about fund investment performance that occur at Board meetings throughout the year. In this regard the Board noted that as part of regularly scheduled fund reviews and other reports to the Board on fund performance, the Board considers annualized return information for each fund, for different time periods, measured against a securities market index ("benchmark index"). In its evaluation of fund investment performance at meetings throughout the year, the Board gave particular attention to information indicating underperformance of certain Fidelity funds for specific time periods and discussed with the Investment Advisers the reasons for such underperformance. Each of Advisor Consumer Discretionary, Advisor Financial Services, Advisor Industrials, and Advisor Technology underperformed its benchmark for the one-, three-, and five-year periods ended June 30, 2015, and as a result, the Board will continue to discuss with SelectCo the steps it has taken and is taking to address each such fund's performance.
In addition to reviewing absolute and relative fund performance, the Independent Trustees periodically consider the appropriateness of fund performance metrics in evaluating the results achieved. In general, the Independent Trustees believe that fund performance should be evaluated based on net performance (after fees and expenses) of both the highest performing and lowest performing fund share classes, where applicable, compared to appropriate benchmark indices, over appropriate time periods that may include full market cycles, taking into account relevant factors, including the following: general market conditions; issuer-specific information; and fund cash flows and other factors. Depending on the circumstances, the Independent Trustees may be satisfied with a fund's performance notwithstanding that it lags its benchmark index for certain periods.
The Independent Trustees recognize that shareholders evaluate performance on a net basis over their own holding periods, for which one-, three-, and five-year periods are often used as a proxy. For this reason, the performance information reviewed by the Board also included net cumulative total return information for each fund and an appropriate benchmark index for the most recent one-, three-, and five-year periods ended June 30, 2015.
Based on its review, the Board concluded that the nature, extent, and quality of services provided to each fund under the Advisory Contracts should benefit the shareholders of each fund.
Competitiveness of Management Fee and Total Expense Ratio. The Board considered each fund's management fee and total expense ratio compared to "mapped groups" of competitive funds and classes created for the purpose of facilitating the Trustees' analysis of the competitiveness of management fees and total expenses. Fidelity creates "mapped groups" by combining similar Lipper investment objective categories that have comparable investment mandates. For this purpose, all sector focused equity funds are grouped in the same mapped group. Combining Lipper investment objective categories aids the Board's management fee and total expense ratio comparisons by broadening the competitive group used for comparison.
Management Fee. The Board considered two proprietary management fee comparisons for the 12-month periods ended June 30 shown in basis points (BP) in the charts below. The group of Lipper funds used by the Board for management fee comparisons is referred to below as the "Total Mapped Group." The Total Mapped Group comparison focuses on a fund's standing in terms of gross management fees before expense reimbursements or caps relative to the total universe of funds with comparable investment mandates (
i.e., sector equities), regardless of whether their management fee structures also are comparable. Funds with comparable management fee structures have similar management fee contractual arrangements (
e.g., flat rate charged for advisory services, all-inclusive fee rate,
etc.). "TMG %" represents the percentage of funds in the Total Mapped Group that had management fees that were lower than a fund's. For example, a hypothetical TMG % of 20% would mean that 80% of the funds in the Total Mapped Group had higher, and 20% had lower, management fees than a fund. The funds' actual TMG %s and the number of funds in the Total Mapped Group are in the charts below. The "Asset-Size Peer Group" (ASPG) comparison focuses on a fund's standing relative to a subset of non-Fidelity funds within the Total Mapped Group that are similar in size and management fee structure. For example, if a fund is in the first quartile of the ASPG, the fund's management fee ranks in the least expensive or lowest 25% of funds in the ASPG. The ASPG represents at least 15% of the funds in the Total Mapped Group with comparable asset size and management fee structures, subject to a minimum of 50 funds (or all funds in the Total Mapped Group if fewer than 50). Additional information, such as the ASPG quartile in which a fund's management fee rate ranked, is also included in the charts and considered by the Board.
Fidelity Advisor Biotechnology Fund
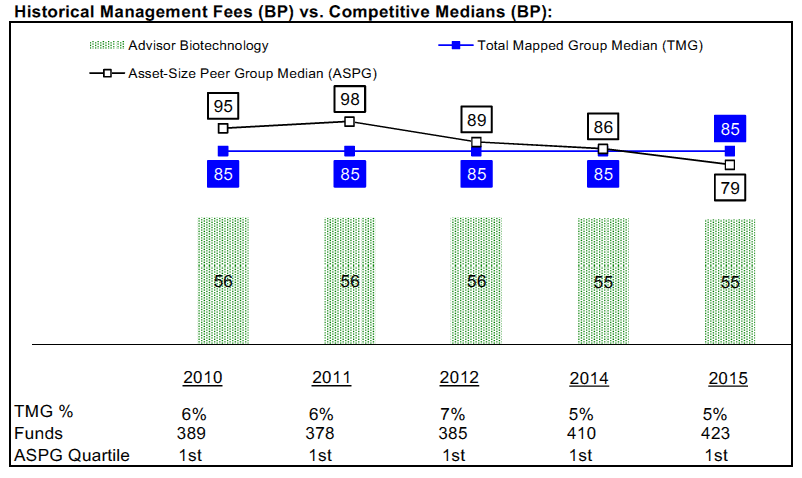
Fidelity Advisor Communications Equipment Fund
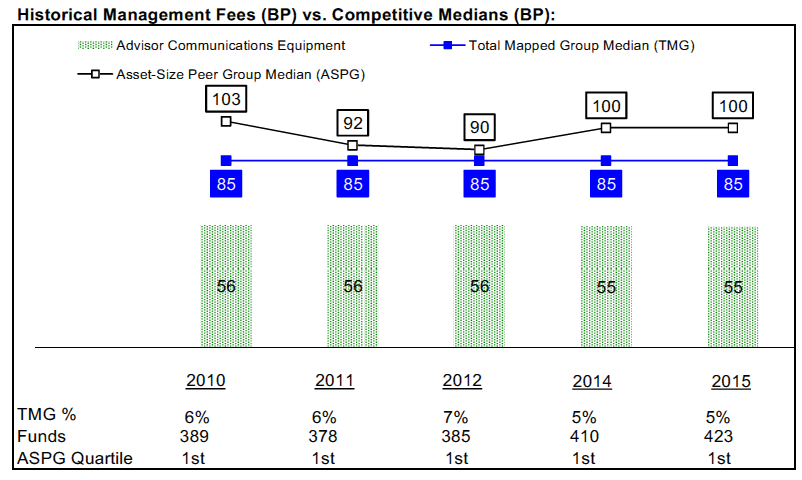
Fidelity Advisor Consumer Discretionary Fund
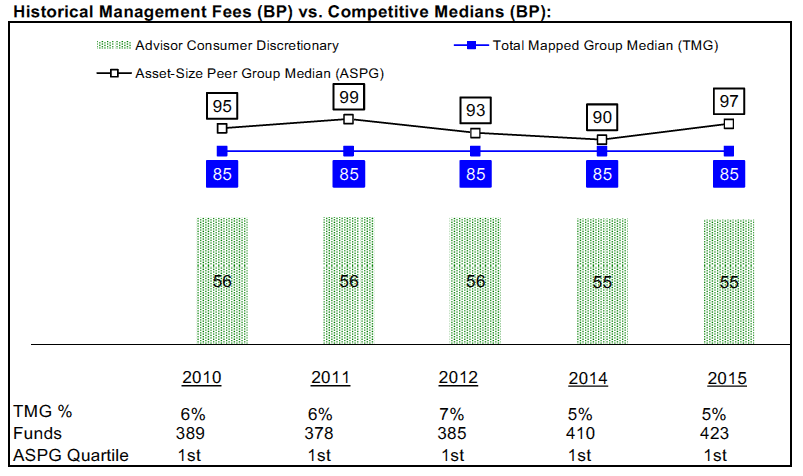
Fidelity Advisor Electronics Fund

Fidelity Advisor Energy Fund
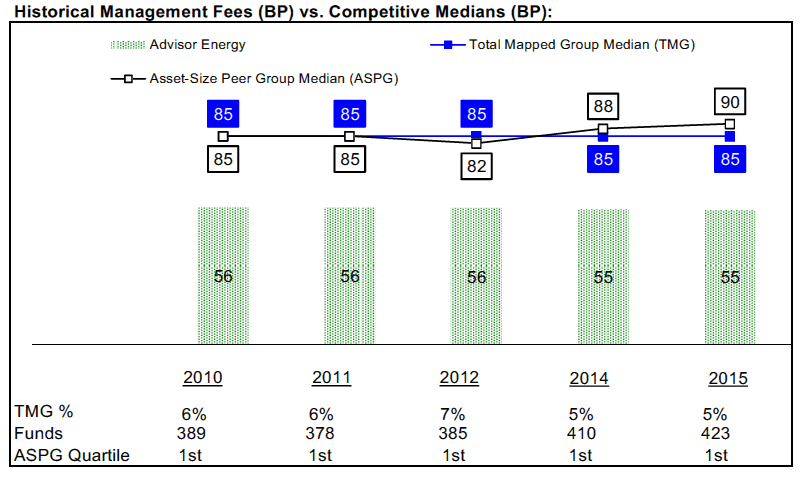
Fidelity Advisor Financial Services Fund
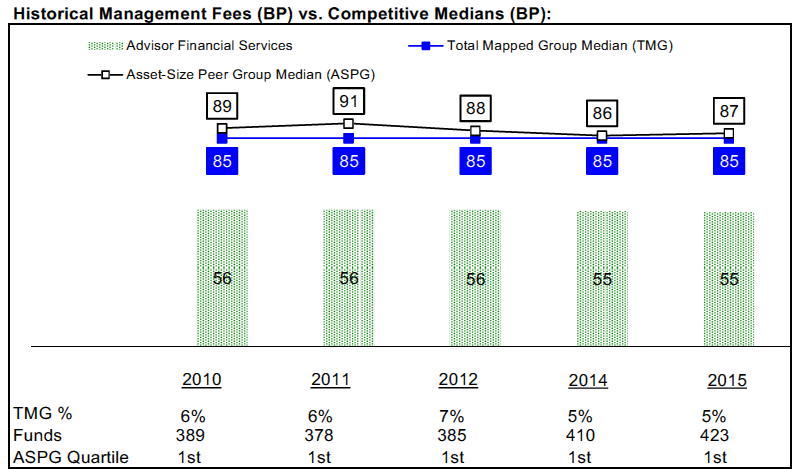
Fidelity Advisor Health Care Fund
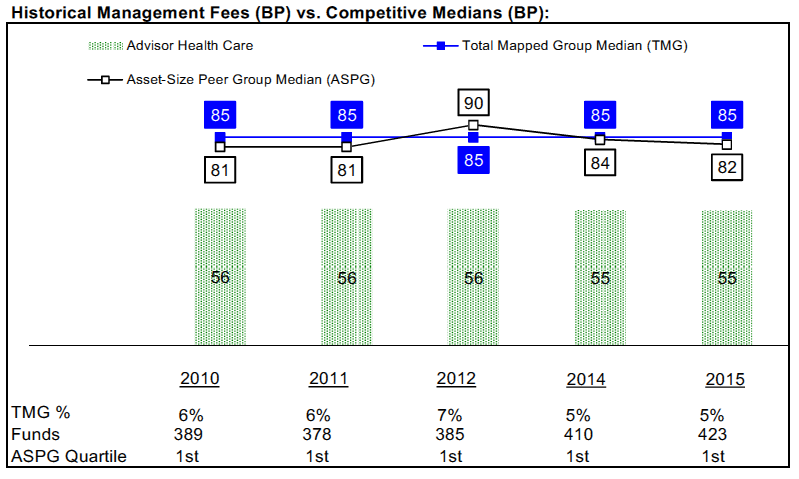
Fidelity Advisor Industrials Fund
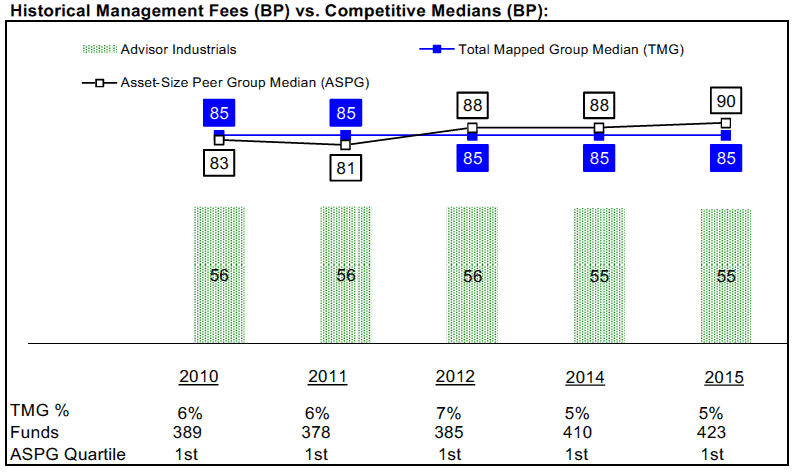
Fidelity Advisor Technology Fund
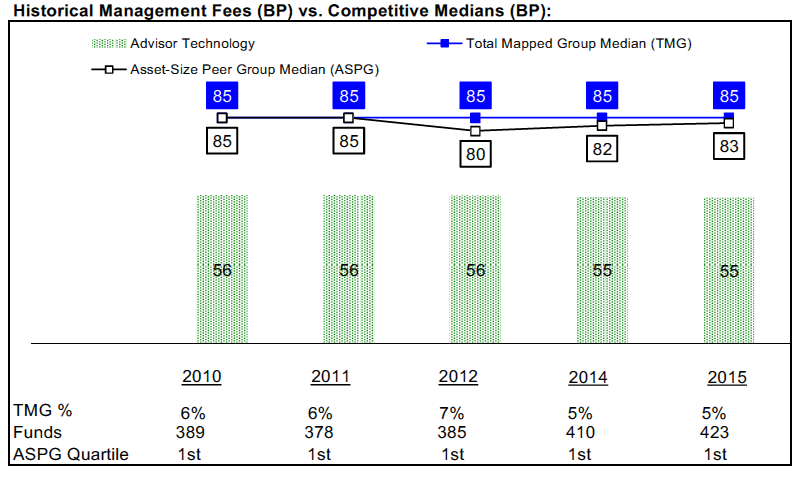
Fidelity Advisor Utilities Fund
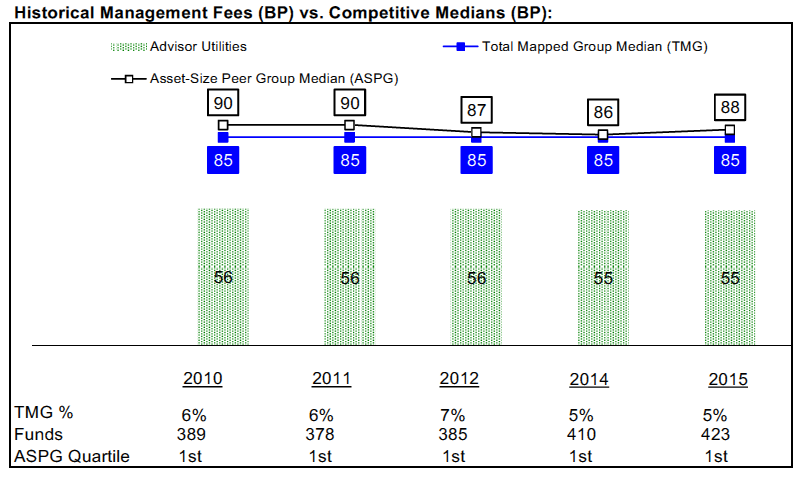
The Board noted that each fund's management fee rate ranked below the median of its Total Mapped Group and below the median of its ASPG for the 12-month period ended June 30, 2015.
The Board noted that, in 2014, the ad hoc Committee on Group Fee was formed by it and the boards of other Fidelity funds to conduct an in-depth review of the "group fee" component of the management fee of funds with such management fee structures. Committee focus included the mechanics of the group fee, the competitive landscape of group fee structures, Fidelity funds with no group fee component and investment products not included in group fee assets. The Board also considered that, for funds subject to the group fee, FMR agreed to voluntarily waive fees over a specified period of time in amounts designed to account for assets converted from certain funds to certain collective investment trusts.
Based on its review, the Board concluded that each fund's management fee is fair and reasonable in light of the services that each fund receives and the other factors considered.
Total Expense Ratio. In its review of the total expense ratio of each class of each fund, the Board considered the fund's management fee rate as well as other fund or class expenses, as applicable, such as transfer agent fees, pricing and bookkeeping fees, fund-paid 12b-1 fees, and custodial, legal, and audit fees. The Board also noted that Fidelity may agree to waive fees and expenses from time to time, and the extent to which, if any, it has done so for the funds. As part of its review, the Board also considered the current and historical total expense ratios of each class of each fund compared to competitive fund median expenses. Each class of each fund is compared to those funds and classes in the Total Mapped Group (used by the Board for management fee comparisons) that have a similar sales load structure.
For Advisor Biotechnology, Advisor Energy, Advisor Health Care, Advisor Industrials, and Advisor Technology, the Board noted that the total expense ratio of each class ranked below the competitive median for the 12-month period ended June 30, 2015.
For Advisor Consumer Discretionary, Advisor Financial Services, and Advisor Utilities, the Board noted that the total expense ratio of each of Class A, Class B, Class C, and Class I ranked below the competitive median for the 12-month period ended June 30, 2015 and the total expense ratio of Class T ranked above the competitive median for the 12-month period ended June 30, 2015.
For Advisor Electronics, the Board noted that the total expense ratio of each of Class A, Class C, and Class I ranked below the competitive median for the 12-month period ended June 30, 2015 and the total expense ratio of each of Class T and Class B ranked above the competitive median for the 12-month period ended June 30, 2015. The Board noted that the total expense ratio for each of Class T and Class B was above median as a result of higher transfer agent fees due to small average account sizes as compared to other funds.
For Advisor Communications Equipment, the Board noted that the total expense ratio of Class A ranked equal to the competitive median for the 12-month period ended June 30, 2015 and the total expense ratio of each of Class T, Class B, Class C, and Class I ranked above the competitive median for the 12-month period ended June 30, 2015. The Board noted that total expenses ratios for these classes were above the median as a result of higher transfer agent fees due to small average account sizes as compared to other Fidelity funds.
The Board considered that, in general, various factors can affect total expense ratios. The Board noted that the total expense ratio of Class T of certain funds was above the competitive median primarily because of higher 12b-1 fees on Class T as compared to most competitor funds. Class T has a higher 12b-1 fee, but a lower front-end sales charge, than traditionally priced front-end sales charge classes. The Board considered that Class T is primarily sold load-waived in the retirement plan market where its 0.50% 12b-1 fee is comparable to competing no-load, higher 12b-1 fee classes designed specifically for retirement plans. The Board noted that each fund offers multiple classes, each of which has a different sales load and 12b-1 fee structure, and that the multiple structures are intended to offer a range of pricing options for the intermediary market. The Board also noted that the total expense ratios of the classes of each fund vary primarily by the level of their 12b-1 fees, although differences in transfer agent fees may also cause expenses to vary from class to class.
Fees Charged to Other Fidelity Clients. The Board also considered Fidelity fee structures and other information with respect to clients of Fidelity, such as other funds advised or subadvised by Fidelity, pension plan clients, and other institutional clients with similar mandates. The Board noted the findings of the 2013 ad hoc joint committee (created with the boards of other Fidelity funds), which reviewed and compared Fidelity's institutional investment advisory business with its business of providing services to the Fidelity funds, including the differences in services provided, fees charged, and costs incurred, as well as competition in their respective marketplaces.
Based on its review of total expense ratios and fees charged to other Fidelity clients, the Board concluded that, although some classes were above the median of the universe presented for comparison, the total expense ratio of each class of each fund was reasonable in light of the services that each fund and its shareholders receive and the other factors considered.
Costs of the Services and Profitability. The Board considered the revenues earned and the expenses incurred by Fidelity in conducting the business of developing, marketing, distributing, managing, administering and servicing each fund and servicing each fund's shareholders. The Board also considered the level of Fidelity's profits in respect of all the Fidelity funds.
On an annual basis, Fidelity presents to the Board information about the profitability of its relationship with each fund. Fidelity calculates profitability information for each fund, as well as aggregate profitability information for groups of Fidelity funds and all Fidelity funds, using a series of detailed revenue and cost allocation methodologies which originate with the books and records of Fidelity on which Fidelity's audited financial statements are based. The Audit Committee of the Board reviews any significant changes from the prior year's methodologies.
PricewaterhouseCoopers LLP (PwC), independent registered public accounting firm and auditor to Fidelity and certain Fidelity funds, has been engaged annually by the Board as part of the Board's assessment of the profitability analysis used by Fidelity. PwC's engagement includes the review and assessment of Fidelity's methodologies used in determining the revenues and expenses attributable to Fidelity's mutual fund business, and completion of agreed-upon procedures in respect of the mathematical accuracy of fund profitability and its conformity to established allocation methodologies. After considering PwC's reports issued under the engagement and information provided by Fidelity, the Board concluded that while other allocation methods may also be reasonable, Fidelity's profitability methodologies are reasonable in all material respects.
The Board also reviewed Fidelity's non-fund businesses and fall-out benefits related to the mutual fund business as well as cases where Fidelity's affiliates may benefit from or be related to the funds' business.
The Board considered the costs of the services provided by and the profits realized by Fidelity in connection with the operation of each fund and was satisfied that the profitability was not excessive.
Economies of Scale. The Board considered whether there have been economies of scale in respect of the management of the Fidelity funds, whether the Fidelity funds (including each fund) have appropriately benefited from any such economies of scale, and whether there is potential for realization of any further economies of scale. The Board considered the extent to which each fund will benefit from economies of scale as assets grow through increased services to the fund, through waivers or reimbursements, or through fee or expense ratio reductions. The Board also noted that in 2013, it and the boards of other Fidelity funds created an ad hoc committee (the Economies of Scale Committee) to analyze whether Fidelity attains economies of scale in respect of the management and servicing of the Fidelity funds, whether the Fidelity funds have appropriately benefited from such economies of scale, and whether there is potential for realization of any further economies of scale.
The Board recognized that each fund's management contract incorporates a "group fee" structure, which provides for lower group fee rates as total group assets increase, and for higher group fee rates as total group assets decrease (with "group assets" defined to include fund assets under SelectCo's management plus assets under FMR's management). SelectCo calculates the group fee rates based on a tiered asset "breakpoint" schedule that varies based on asset class. The Board considered that the group fee is designed to deliver the benefits of economies of scale to fund shareholders when total group assets increase, even if assets of any particular fund are unchanged or have declined, because some portion of Fidelity's costs are attributable to services provided to all Fidelity funds, and all funds benefit if those costs can be allocated among more assets. The Board concluded that, given the group fee structure, fund shareholders will benefit from lower management fees as group assets increase at the fund complex level, regardless of whether Fidelity achieves any such economies of scale.
The Board concluded, taking into account the analysis of the Economies of Scale Committee, that economies of scale, if any, are being appropriately shared between fund shareholders and Fidelity.
Additional Information Requested by the Board. In order to develop fully the factual basis for consideration of the Fidelity funds' Advisory Contracts, the Board requested and received additional information on certain topics, including: (i) Fidelity's fund profitability methodology, profitability trends for certain funds, and the impact of certain factors on fund profitability results; (ii) portfolio manager changes that have occurred during the past year and the amount of the investment that each portfolio manager has made in the Fidelity fund(s) that he or she manages; (iii) Fidelity's compensation structure for portfolio managers, research analysts, and other key personnel, including its effects on fund profitability; (iv) the arrangements with and compensation paid to certain fund sub-advisers on behalf of the Fidelity funds; (v) Fidelity's long-term expectations for its offerings in the workplace investing channel; (vi) the methodology with respect to competitive fund data and peer group classifications; (vii) Fidelity's transfer agent fee, expense, and service structures for different funds and classes, and the impact of outsourcing, the increased use of omnibus accounts, and lower pricing in the retirement channel; and (viii) explanations regarding the relative total expense ratios of certain funds and classes, total expense competitive trends and methodologies for total expense competitive comparisons, and actions that might be taken by Fidelity to reduce total expense ratios for certain funds and classes or to achieve further economies of scale.
Based on its evaluation of all of the conclusions noted above, and after considering all factors it believed relevant, the Board concluded that the advisory fee structures are fair and reasonable, and that each fund's Advisory Contracts should be renewed.

AFOCI-SANN-0316
1.700906.119
Fidelity Advisor® Real Estate Fund
Class A, Class T, Class B and Class C
Semi-Annual Report January 31, 2016 |
|
Contents
To view a fund's proxy voting guidelines and proxy voting record for the 12-month period ended June 30, visit http://www.fidelity.com/proxyvotingresults or visit the Securities and Exchange Commission's (SEC) web site at http://www.sec.gov.
You may also call 1-877-208-0098 to request a free copy of the proxy voting guidelines.
Standard & Poor's, S&P and S&P 500 are registered service marks of The McGraw-Hill Companies, Inc. and have been licensed for use by Fidelity Distributors Corporation.
Other third-party marks appearing herein are the property of their respective owners.
All other marks appearing herein are registered or unregistered trademarks or service marks of FMR LLC or an affiliated company. © 2016 FMR LLC. All rights reserved.
This report and the financial statements contained herein are submitted for the general information of the shareholders of the Fund. This report is not authorized for distribution to prospective investors in the Fund unless preceded or accompanied by an effective prospectus.
A fund files its complete schedule of portfolio holdings with the SEC for the first and third quarters of each fiscal year on Form N-Q. Forms N-Q are available on the SEC’s web site at http://www.sec.gov. A fund's Forms N-Q may be reviewed and copied at the SEC’s Public Reference Room in Washington, DC. Information regarding the operation of the SEC's Public Reference Room may be obtained by calling 1-800-SEC-0330.
For a complete list of a fund's portfolio holdings, view the most recent holdings listing, semiannual report, or annual report on Fidelity's web site at http://www.fidelity.com, http://www.advisor.fidelity.com, or http://www.401k.com, as applicable.
NOT FDIC INSURED •MAY LOSE VALUE •NO BANK GUARANTEE
Neither the Fund nor Fidelity Distributors Corporation is a bank.
Investment Summary (Unaudited)
Top Ten Stocks as of January 31, 2016
| | % of fund's net assets | % of fund's net assets 6 months ago |
| Simon Property Group, Inc. | 11.7 | 10.1 |
| Boston Properties, Inc. | 5.4 | 5.6 |
| Public Storage | 5.3 | 4.5 |
| Ventas, Inc. | 5.0 | 3.2 |
| Extra Space Storage, Inc. | 4.7 | 3.4 |
| Essex Property Trust, Inc. | 4.6 | 5.1 |
| UDR, Inc. | 3.9 | 3.9 |
| Federal Realty Investment Trust (SBI) | 3.5 | 3.1 |
| Equity Residential (SBI) | 3.4 | 2.2 |
| Mid-America Apartment Communities, Inc. | 3.3 | 0.2 |
| | 50.8 | |
Top Five REIT Sectors as of January 31, 2016
| | % of fund's net assets | % of fund's net assets 6 months ago |
| REITs - Apartments | 18.2 | 18.0 |
| REITs - Regional Malls | 16.1 | 15.7 |
| REITs - Office Property | 13.0 | 16.7 |
| REITs - Health Care | 10.5 | 11.5 |
| REITs - Storage | 10.0 | 7.9 |
Asset Allocation (% of fund's net assets)
| As of January 31, 2016 |
| | Stocks | 98.2% |
| | Short-Term Investments and Net Other Assets (Liabilities) | 1.8% |

| As of July 31, 2015 |
| | Stocks | 99.6% |
| | Short-Term Investments and Net Other Assets (Liabilities) | 0.4% |

Investments January 31, 2016 (Unaudited)
Showing Percentage of Net Assets
| Common Stocks - 98.2% | | | |
| | | Shares | Value |
| Hotels, Restaurants & Leisure - 0.9% | | | |
| Hotels, Resorts & Cruise Lines - 0.9% | | | |
| Hilton Worldwide Holdings, Inc. | | 417,200 | $7,430,332 |
| Real Estate Investment Trusts - 97.3% | | | |
| REITs - Apartments - 18.2% | | | |
| AvalonBay Communities, Inc. | | 159,840 | 27,410,962 |
| Equity Residential (SBI) | | 397,309 | 30,628,551 |
| Essex Property Trust, Inc. | | 193,447 | 41,225,490 |
| Mid-America Apartment Communities, Inc. | | 313,300 | 29,393,806 |
| UDR, Inc. | | 976,300 | 34,746,517 |
| | | | 163,405,326 |
| REITs - Diversified - 5.9% | | | |
| Cousins Properties, Inc. | | 754,743 | 6,505,885 |
| DuPont Fabros Technology, Inc. | | 541,600 | 17,964,872 |
| Forest City Realty Trust, Inc. (a) | | 892,067 | 17,573,720 |
| Liberty Property Trust (SBI) | | 251,300 | 7,368,116 |
| Vornado Realty Trust | | 39,783 | 3,519,204 |
| | | | 52,931,797 |
| REITs - Health Care - 10.5% | | | |
| HCP, Inc. | | 219,295 | 7,881,462 |
| Healthcare Realty Trust, Inc. | | 803,900 | 23,345,256 |
| Healthcare Trust of America, Inc. | | 109,800 | 3,078,792 |
| Sabra Health Care REIT, Inc. | | 386,800 | 7,101,648 |
| Ventas, Inc. | | 806,605 | 44,621,389 |
| Welltower, Inc. | | 128,369 | 7,987,119 |
| | | | 94,015,666 |
| REITs - Hotels - 4.7% | | | |
| Ashford Hospitality Prime, Inc. | | 282,400 | 3,103,576 |
| Chesapeake Lodging Trust | | 138,200 | 3,471,584 |
| FelCor Lodging Trust, Inc. | | 2,127,989 | 14,810,803 |
| Host Hotels & Resorts, Inc. | | 1,341,534 | 18,580,246 |
| Pebblebrook Hotel Trust | | 77,800 | 1,899,876 |
| | | | 41,866,085 |
| REITs - Management/Investment - 2.5% | | | |
| Coresite Realty Corp. | | 71,500 | 4,586,010 |
| Empire State Realty Trust, Inc. | | 1,082,600 | 17,917,030 |
| | | | 22,503,040 |
| REITs - Manufactured Homes - 2.4% | | | |
| Equity Lifestyle Properties, Inc. | | 50,600 | 3,335,552 |
| Sun Communities, Inc. | | 274,922 | 18,307,056 |
| | | | 21,642,608 |
| REITs - Office Property - 13.0% | | | |
| Alexandria Real Estate Equities, Inc. | | 111,633 | 8,839,101 |
| Boston Properties, Inc. | | 421,247 | 48,953,114 |
| Mack-Cali Realty Corp. | | 1,334,700 | 27,748,413 |
| New York (REIT), Inc. | | 230,100 | 2,365,428 |
| Parkway Properties, Inc. | | 864,900 | 11,650,203 |
| SL Green Realty Corp. | | 179,965 | 17,386,419 |
| | | | 116,942,678 |
| REITs - Regional Malls - 16.1% | | | |
| General Growth Properties, Inc. | | 558,900 | 15,671,556 |
| Simon Property Group, Inc. | | 565,450 | 105,332,025 |
| Taubman Centers, Inc. | | 123,400 | 8,766,336 |
| The Macerich Co. | | 190,200 | 14,829,894 |
| | | | 144,599,811 |
| REITs - Shopping Centers - 9.4% | | | |
| Cedar Shopping Centers, Inc. | | 1,355,043 | 9,566,604 |
| Federal Realty Investment Trust (SBI) | | 207,502 | 31,297,527 |
| Inland Real Estate Corp. | | 239,872 | 2,569,029 |
| Kite Realty Group Trust | | 246,332 | 6,527,798 |
| Ramco-Gershenson Properties Trust (SBI) | | 408,022 | 6,973,096 |
| Urban Edge Properties | | 1,139,241 | 27,683,556 |
| | | | 84,617,610 |
| REITs - Storage - 10.0% | | | |
| Extra Space Storage, Inc. | | 465,400 | 42,207,126 |
| Public Storage | | 189,450 | 48,036,942 |
| | | | 90,244,068 |
| REITs - Warehouse/Industrial - 4.6% | | | |
| DCT Industrial Trust, Inc. | | 731,450 | 26,178,596 |
| Prologis, Inc. | | 243,277 | 9,602,143 |
| Terreno Realty Corp. | | 255,600 | 5,745,888 |
| | | | 41,526,627 |
|
| TOTAL REAL ESTATE INVESTMENT TRUSTS | | | 874,295,316 |
|
| TOTAL COMMON STOCKS | | | |
| (Cost $711,166,781) | | | 881,725,648 |
|
| Money Market Funds - 2.1% | | | |
| Fidelity Cash Central Fund, 0.38% (b) | | | |
| (Cost $18,940,881) | | 18,940,881 | 18,940,881 |
| TOTAL INVESTMENT PORTFOLIO - 100.3% | | | |
| (Cost $730,107,662) | | | 900,666,529 |
| NET OTHER ASSETS (LIABILITIES) - (0.3)% | | | (2,301,653) |
| NET ASSETS - 100% | | | $898,364,876 |
Legend
(a) Non-income producing
(b) Affiliated fund that is generally available only to investment companies and other accounts managed by Fidelity Investments. The rate quoted is the annualized seven-day yield of the fund at period end. A complete unaudited listing of the fund's holdings as of its most recent quarter end is available upon request. In addition, each Fidelity Central Fund's financial statements are available on the SEC's website or upon request.
Affiliated Central Funds
Information regarding fiscal year to date income earned by the Fund from investments in Fidelity Central Funds is as follows:
| Fund | Income earned |
| Fidelity Cash Central Fund | $21,011 |
| Fidelity Securities Lending Cash Central Fund | 80 |
| Total | $21,091 |
Investment Valuation
All investments are categorized as Level 1 under the Fair Value Hierarchy. The inputs or methodology used for valuing securities may not be an indication of the risk associated with investing in those securities. For more information on valuation inputs please refer to the Investment Valuation section in the accompanying Notes to Financial Statements.
See accompanying notes which are an integral part of the financial statements.
Financial Statements
Statement of Assets and Liabilities
| | | January 31, 2016 (Unaudited) |
| Assets | | |
Investment in securities, at value — See accompanying schedule:
Unaffiliated issuers (cost $711,166,781) | $881,725,648 | |
| Fidelity Central Funds (cost $18,940,881) | 18,940,881 | |
| Total Investments (cost $730,107,662) | | $900,666,529 |
| Receivable for investments sold | | 6,317,780 |
| Receivable for fund shares sold | | 2,955,545 |
| Dividends receivable | | 316,831 |
| Distributions receivable from Fidelity Central Funds | | 6,684 |
| Prepaid expenses | | 3,758 |
| Other receivables | | 39,783 |
| Total assets | | 910,306,910 |
| Liabilities | | |
| Payable for investments purchased | $7,869,476 | |
| Payable for fund shares redeemed | 3,180,320 | |
| Accrued management fee | 415,517 | |
| Distribution and service plan fees payable | 200,449 | |
| Other affiliated payables | 207,262 | |
| Other payables and accrued expenses | 69,010 | |
| Total liabilities | | 11,942,034 |
| Net Assets | | $898,364,876 |
| Net Assets consist of: | | |
| Paid in capital | | $734,739,233 |
| Undistributed net investment income | | 91,271 |
| Accumulated undistributed net realized gain (loss) on investments | | (7,024,495) |
| Net unrealized appreciation (depreciation) on investments | | 170,558,867 |
| Net Assets | | $898,364,876 |
| Calculation of Maximum Offering Price | | |
| Class A: | | |
| Net Asset Value and redemption price per share ($313,528,962 ÷ 14,375,811 shares) | | $21.81 |
| Maximum offering price per share (100/94.25 of $21.81) | | $23.14 |
| Class T: | | |
| Net Asset Value and redemption price per share ($166,908,911 ÷ 7,657,536 shares) | | $21.80 |
| Maximum offering price per share (100/96.50 of $21.80) | | $22.59 |
| Class B: | | |
| Net Asset Value and offering price per share ($2,923,020 ÷ 135,933 shares)(a) | | $21.50 |
| Class C: | | |
| Net Asset Value and offering price per share ($73,331,365 ÷ 3,423,257 shares)(a) | | $21.42 |
| Class I: | | |
| Net Asset Value, offering price and redemption price per share ($341,672,618 ÷ 15,537,276 shares) | | $21.99 |
(a) Redemption price per share is equal to net asset value less any applicable contingent deferred sales charge.
See accompanying notes which are an integral part of the financial statements.
Statement of Operations
| | | Six months ended January 31, 2016 (Unaudited) |
| Investment Income | | |
| Dividends | | $12,791,014 |
| Income from Fidelity Central Funds | | 21,091 |
| Total income | | 12,812,105 |
| Expenses | | |
| Management fee | $2,494,357 | |
| Transfer agent fees | 1,083,454 | |
| Distribution and service plan fees | 1,213,856 | |
| Accounting and security lending fees | 153,505 | |
| Custodian fees and expenses | 17,777 | |
| Independent trustees' compensation | 8,384 | |
| Registration fees | 68,532 | |
| Audit | 24,856 | |
| Legal | 4,599 | |
| Miscellaneous | 4,628 | |
| Total expenses before reductions | 5,073,948 | |
| Expense reductions | (34,745) | 5,039,203 |
| Net investment income (loss) | | 7,772,902 |
| Realized and Unrealized Gain (Loss) | | |
| Net realized gain (loss) on: | | |
| Investment securities: | | |
| Unaffiliated issuers | (3,046,757) | |
| Total net realized gain (loss) | | (3,046,757) |
| Change in net unrealized appreciation (depreciation) on investment securities | | (14,401,840) |
| Net gain (loss) | | (17,448,597) |
| Net increase (decrease) in net assets resulting from operations | | $(9,675,695) |
See accompanying notes which are an integral part of the financial statements.
Statement of Changes in Net Assets
| | Six months ended January 31, 2016 (Unaudited) | Year ended July 31, 2015 |
| Increase (Decrease) in Net Assets | | |
| Operations | | |
| Net investment income (loss) | $7,772,902 | $11,937,523 |
| Net realized gain (loss) | (3,046,757) | 43,067,889 |
| Change in net unrealized appreciation (depreciation) | (14,401,840) | 17,845,717 |
| Net increase (decrease) in net assets resulting from operations | (9,675,695) | 72,851,129 |
| Distributions to shareholders from net investment income | (10,122,918) | (11,243,675) |
| Distributions to shareholders from net realized gain | (23,588,298) | (53,617,748) |
| Total distributions | (33,711,216) | (64,861,423) |
| Share transactions - net increase (decrease) | 13,467,020 | 137,991,224 |
| Total increase (decrease) in net assets | (29,919,891) | 145,980,930 |
| Net Assets | | |
| Beginning of period | 928,284,767 | 782,303,837 |
| End of period (including undistributed net investment income of $91,271 and undistributed net investment income of $2,441,287, respectively) | $898,364,876 | $928,284,767 |
See accompanying notes which are an integral part of the financial statements.
Financial Highlights — Fidelity Advisor Real Estate Fund Class A
| | Six months ended (Unaudited) | Years ended July 31, | | | | |
| January 31, | 2016 | 2015 | 2014 | 2013 | 2012 | 2011 |
| Selected Per–Share Data | | | | | | |
| Net asset value, beginning of period | $22.90 | $22.57 | $20.92 | $19.83 | $18.24 | $14.88 |
| Income from Investment Operations | | | | | | |
| Net investment income (loss)A | .19 | .30 | .31 | .22 | .17 | .12 |
| Net realized and unrealized gain (loss) | (.43) | 1.82 | 2.13 | 1.27 | 2.02 | 3.37 |
| Total from investment operations | (.24) | 2.12 | 2.44 | 1.49 | 2.19 | 3.49 |
| Distributions from net investment income | (.25) | (.30) | (.27) | (.23) | (.13) | (.13) |
| Distributions from net realized gain | (.59) | (1.49) | (.52) | (.17) | (.47) | – |
| Total distributions | (.85)B | (1.79) | (.79) | (.40) | (.60) | (.13) |
| Net asset value, end of period | $21.81 | $22.90 | $22.57 | $20.92 | $19.83 | $18.24 |
| Total ReturnC,D,E | (.91)% | 9.70% | 12.34% | 7.66% | 12.81% | 23.63% |
| Ratios to Average Net AssetsF,G | | | | | | |
| Expenses before reductions | 1.10%H | 1.10% | 1.16% | 1.17% | 1.19% | 1.19% |
| Expenses net of fee waivers, if any | 1.10%H | 1.10% | 1.16% | 1.17% | 1.19% | 1.19% |
| Expenses net of all reductions | 1.09%H | 1.09% | 1.15% | 1.16% | 1.18% | 1.18% |
| Net investment income (loss) | 1.73%H | 1.32% | 1.47% | 1.06% | .98% | .69% |
| Supplemental Data | | | | | | |
| Net assets, end of period (000 omitted) | $313,529 | $327,489 | $274,136 | $246,323 | $199,303 | $178,978 |
| Portfolio turnover rateI | 69%H | 57% | 83% | 63% | 48% | 63% |
A Calculated based on average shares outstanding during the period.
B Total distributions of $.85 per share is comprised of distributions from net investment income of $.251 and distributions from net realized gain of $.594 per share.
C Total returns for periods of less than one year are not annualized.
D Total returns would have been lower if certain expenses had not been reduced during the applicable periods shown.
E Total returns do not include the effect of the sales charges.
F Fees and expenses of any underlying Fidelity Central Funds are not included in the Fund's expense ratio. The Fund indirectly bears its proportionate share of the expenses of any underlying Fidelity Central Funds.
G Expense ratios reflect operating expenses of the class. Expenses before reductions do not reflect amounts reimbursed by the investment adviser or reductions from brokerage service arrangements or reductions from other expense offset arrangements and do not represent the amount paid by the class during periods when reimbursements or reductions occur. Expenses net of fee waivers reflect expenses after reimbursement by the investment adviser but prior to reductions from brokerage service arrangements or other expense offset arrangements. Expenses net of all reductions represent the net expenses paid by the class.
H Annualized
I Amount does not include the portfolio activity of any underlying Fidelity Central Funds.
See accompanying notes which are an integral part of the financial statements.
Financial Highlights — Fidelity Advisor Real Estate Fund Class T
| | Six months ended (Unaudited) | Years ended July 31, | | | | |
| January 31, | 2016 | 2015 | 2014 | 2013 | 2012 | 2011 |
| Selected Per–Share Data | | | | | | |
| Net asset value, beginning of period | $22.88 | $22.55 | $20.91 | $19.82 | $18.24 | $14.90 |
| Income from Investment Operations | | | | | | |
| Net investment income (loss)A | .17 | .25 | .26 | .17 | .13 | .07 |
| Net realized and unrealized gain (loss) | (.44) | 1.82 | 2.13 | 1.28 | 2.02 | 3.38 |
| Total from investment operations | (.27) | 2.07 | 2.39 | 1.45 | 2.15 | 3.45 |
| Distributions from net investment income | (.22) | (.25) | (.23) | (.19) | (.10) | (.11) |
| Distributions from net realized gain | (.59) | (1.49) | (.52) | (.17) | (.47) | – |
| Total distributions | (.81) | (1.74) | (.75) | (.36) | (.57) | (.11) |
| Net asset value, end of period | $21.80 | $22.88 | $22.55 | $20.91 | $19.82 | $18.24 |
| Total ReturnB,C,D | (1.01)% | 9.46% | 12.07% | 7.43% | 12.52% | 23.28% |
| Ratios to Average Net AssetsE,F | | | | | | |
| Expenses before reductions | 1.33%G | 1.34% | 1.37% | 1.38% | 1.43% | 1.44% |
| Expenses net of fee waivers, if any | 1.33%G | 1.34% | 1.37% | 1.38% | 1.43% | 1.44% |
| Expenses net of all reductions | 1.33%G | 1.33% | 1.36% | 1.38% | 1.43% | 1.44% |
| Net investment income (loss) | 1.49%G | 1.09% | 1.26% | .85% | .73% | .43% |
| Supplemental Data | | | | | | |
| Net assets, end of period (000 omitted) | $166,909 | $168,375 | $138,783 | $114,717 | $86,987 | $76,785 |
| Portfolio turnover rateH | 69%G | 57% | 83% | 63% | 48% | 63% |
A Calculated based on average shares outstanding during the period.
B Total returns for periods of less than one year are not annualized.
C Total returns would have been lower if certain expenses had not been reduced during the applicable periods shown.
D Total returns do not include the effect of the sales charges.
E Fees and expenses of any underlying Fidelity Central Funds are not included in the Fund's expense ratio. The Fund indirectly bears its proportionate share of the expenses of any underlying Fidelity Central Funds.
F Expense ratios reflect operating expenses of the class. Expenses before reductions do not reflect amounts reimbursed by the investment adviser or reductions from brokerage service arrangements or reductions from other expense offset arrangements and do not represent the amount paid by the class during periods when reimbursements or reductions occur. Expenses net of fee waivers reflect expenses after reimbursement by the investment adviser but prior to reductions from brokerage service arrangements or other expense offset arrangements. Expenses net of all reductions represent the net expenses paid by the class.
G Annualized
H Amount does not include the portfolio activity of any underlying Fidelity Central Funds.
See accompanying notes which are an integral part of the financial statements.
Financial Highlights — Fidelity Advisor Real Estate Fund Class B
| | Six months ended (Unaudited) | Years ended July 31, | | | | |
| January 31, | 2016 | 2015 | 2014 | 2013 | 2012 | 2011 |
| Selected Per–Share Data | | | | | | |
| Net asset value, beginning of period | $22.56 | $22.28 | $20.66 | $19.59 | $18.05 | $14.77 |
| Income from Investment Operations | | | | | | |
| Net investment income (loss)A | .10 | .11 | .14 | .06 | .04 | (.01) |
| Net realized and unrealized gain (loss) | (.43) | 1.80 | 2.10 | 1.26 | 2.00 | 3.35 |
| Total from investment operations | (.33) | 1.91 | 2.24 | 1.32 | 2.04 | 3.34 |
| Distributions from net investment income | (.13) | (.14) | (.11) | (.08) | (.03) | (.06) |
| Distributions from net realized gain | (.59) | (1.49) | (.52) | (.17) | (.47) | – |
| Total distributions | (.73)B | (1.63) | (.62)C | (.25) | (.50) | (.06) |
| Net asset value, end of period | $21.50 | $22.56 | $22.28 | $20.66 | $19.59 | $18.05 |
| Total ReturnD,E,F | (1.34)% | 8.85% | 11.45% | 6.84% | 11.99% | 22.69% |
| Ratios to Average Net AssetsG,H | | | | | | |
| Expenses before reductions | 1.91%I | 1.92% | 1.92% | 1.92% | 1.93% | 1.94% |
| Expenses net of fee waivers, if any | 1.91%I | 1.92% | 1.92% | 1.92% | 1.93% | 1.94% |
| Expenses net of all reductions | 1.90%I | 1.91% | 1.91% | 1.91% | 1.93% | 1.93% |
| Net investment income (loss) | .92%I | .50% | .70% | .31% | .23% | (.07)% |
| Supplemental Data | | | | | | |
| Net assets, end of period (000 omitted) | $2,923 | $3,829 | $5,631 | $8,697 | $9,481 | $11,542 |
| Portfolio turnover rateJ | 69%I | 57% | 83% | 63% | 48% | 63% |
A Calculated based on average shares outstanding during the period.
B Total distributions of $.73 per share is comprised of distributions from net investment income of $.131 and distributions from net realized gain of $.594 per share.
C Total distributions of $.62 per share is comprised of distributions from net investment income of $.106 and distributions from net realized gain of $.518 per share.
D Total returns for periods of less than one year are not annualized.
E Total returns would have been lower if certain expenses had not been reduced during the applicable periods shown.
F Total returns do not include the effect of the contingent deferred sales charge.
G Fees and expenses of any underlying Fidelity Central Funds are not included in the Fund's expense ratio. The Fund indirectly bears its proportionate share of the expenses of any underlying Fidelity Central Funds.
H Expense ratios reflect operating expenses of the class. Expenses before reductions do not reflect amounts reimbursed by the investment adviser or reductions from brokerage service arrangements or reductions from other expense offset arrangements and do not represent the amount paid by the class during periods when reimbursements or reductions occur. Expenses net of fee waivers reflect expenses after reimbursement by the investment adviser but prior to reductions from brokerage service arrangements or other expense offset arrangements. Expenses net of all reductions represent the net expenses paid by the class.
I Annualized
J Amount does not include the portfolio activity of any underlying Fidelity Central Funds.
See accompanying notes which are an integral part of the financial statements.
Financial Highlights — Fidelity Advisor Real Estate Fund Class C
| | Six months ended (Unaudited) | Years ended July 31, | | | | |
| January 31, | 2016 | 2015 | 2014 | 2013 | 2012 | 2011 |
| Selected Per–Share Data | | | | | | |
| Net asset value, beginning of period | $22.49 | $22.23 | $20.61 | $19.55 | $18.03 | $14.76 |
| Income from Investment Operations | | | | | | |
| Net investment income (loss)A | .10 | .13 | .15 | .07 | .04 | (.01) |
| Net realized and unrealized gain (loss) | (.43) | 1.78 | 2.10 | 1.26 | 1.98 | 3.35 |
| Total from investment operations | (.33) | 1.91 | 2.25 | 1.33 | 2.02 | 3.34 |
| Distributions from net investment income | (.15) | (.16) | (.11) | (.10) | (.03) | (.07) |
| Distributions from net realized gain | (.59) | (1.49) | (.52) | (.17) | (.47) | – |
| Total distributions | (.74) | (1.65) | (.63) | (.27) | (.50) | (.07) |
| Net asset value, end of period | $21.42 | $22.49 | $22.23 | $20.61 | $19.55 | $18.03 |
| Total ReturnB,C,D | (1.30)% | 8.85% | 11.52% | 6.89% | 11.92% | 22.69% |
| Ratios to Average Net AssetsE,F | | | | | | |
| Expenses before reductions | 1.87%G | 1.87% | 1.90% | 1.90% | 1.93% | 1.94% |
| Expenses net of fee waivers, if any | 1.87%G | 1.87% | 1.90% | 1.90% | 1.93% | 1.94% |
| Expenses net of all reductions | 1.86%G | 1.86% | 1.89% | 1.89% | 1.93% | 1.93% |
| Net investment income (loss) | .96%G | .56% | .73% | .33% | .23% | (.07)% |
| Supplemental Data | | | | | | |
| Net assets, end of period (000 omitted) | $73,331 | $79,291 | $64,822 | $75,461 | $55,064 | $47,406 |
| Portfolio turnover rateH | 69%G | 57% | 83% | 63% | 48% | 63% |
A Calculated based on average shares outstanding during the period.
B Total returns for periods of less than one year are not annualized.
C Total returns would have been lower if certain expenses had not been reduced during the applicable periods shown.
D Total returns do not include the effect of the contingent deferred sales charge.
E Fees and expenses of any underlying Fidelity Central Funds are not included in the Fund's expense ratio. The Fund indirectly bears its proportionate share of the expenses of any underlying Fidelity Central Funds.
F Expense ratios reflect operating expenses of the class. Expenses before reductions do not reflect amounts reimbursed by the investment adviser or reductions from brokerage service arrangements or reductions from other expense offset arrangements and do not represent the amount paid by the class during periods when reimbursements or reductions occur. Expenses net of fee waivers reflect expenses after reimbursement by the investment adviser but prior to reductions from brokerage service arrangements or other expense offset arrangements. Expenses net of all reductions represent the net expenses paid by the class.
G Annualized
H Amount does not include the portfolio activity of any underlying Fidelity Central Funds.
See accompanying notes which are an integral part of the financial statements.
Financial Highlights — Fidelity Advisor Real Estate Fund Class I
| | Six months ended (Unaudited) | Years ended July 31, | | | | |
| January 31, | 2016 | 2015 | 2014 | 2013 | 2012 | 2011 |
| Selected Per–Share Data | | | | | | |
| Net asset value, beginning of period | $23.09 | $22.74 | $21.07 | $19.97 | $18.36 | $14.96 |
| Income from Investment Operations | | | | | | |
| Net investment income (loss)A | .22 | .36 | .36 | .28 | .22 | .16 |
| Net realized and unrealized gain (loss) | (.44) | 1.83 | 2.15 | 1.27 | 2.03 | 3.39 |
| Total from investment operations | (.22) | 2.19 | 2.51 | 1.55 | 2.25 | 3.55 |
| Distributions from net investment income | (.28) | (.35) | (.32) | (.28) | (.17) | (.15) |
| Distributions from net realized gain | (.59) | (1.49) | (.52) | (.17) | (.47) | – |
| Total distributions | (.88)B | (1.84) | (.84) | (.45) | (.64) | (.15) |
| Net asset value, end of period | $21.99 | $23.09 | $22.74 | $21.07 | $19.97 | $18.36 |
| Total ReturnC,D | (.80)% | 9.99% | 12.64% | 7.92% | 13.12% | 23.92% |
| Ratios to Average Net AssetsE,F | | | | | | |
| Expenses before reductions | .85%G | .85% | .89% | .90% | .93% | .93% |
| Expenses net of fee waivers, if any | .85%G | .85% | .89% | .90% | .93% | .93% |
| Expenses net of all reductions | .84%G | .84% | .88% | .89% | .93% | .92% |
| Net investment income (loss) | 1.97%G | 1.57% | 1.74% | 1.33% | 1.23% | .94% |
| Supplemental Data | | | | | | |
| Net assets, end of period (000 omitted) | $341,673 | $349,301 | $298,932 | $305,619 | $283,054 | $174,655 |
| Portfolio turnover rateH | 69%G | 57% | 83% | 63% | 48% | 63% |
A Calculated based on average shares outstanding during the period.
B Total distributions of $.88 per share is comprised of distributions from net investment income of $.284 and distributions from net realized gain of $.594 per share.
C Total returns for periods of less than one year are not annualized.
D Total returns would have been lower if certain expenses had not been reduced during the applicable periods shown.
E Fees and expenses of any underlying Fidelity Central Funds are not included in the Fund's expense ratio. The Fund indirectly bears its proportionate share of the expenses of any underlying Fidelity Central Funds.
F Expense ratios reflect operating expenses of the class. Expenses before reductions do not reflect amounts reimbursed by the investment adviser or reductions from brokerage service arrangements or reductions from other expense offset arrangements and do not represent the amount paid by the class during periods when reimbursements or reductions occur. Expenses net of fee waivers reflect expenses after reimbursement by the investment adviser but prior to reductions from brokerage service arrangements or other expense offset arrangements. Expenses net of all reductions represent the net expenses paid by the class.
G Annualized
H Amount does not include the portfolio activity of any underlying Fidelity Central Funds.
See accompanying notes which are an integral part of the financial statements.
Notes to Financial Statements (Unaudited)
For the period ended January 31, 2016
1. Organization.
Fidelity Advisor Real Estate Fund (the Fund) is a non-diversified fund of Fidelity Advisor Series VII (the Trust) and is authorized to issue an unlimited number of shares. The Trust is registered under the Investment Company Act of 1940, as amended (the 1940 Act), as an open-end management investment company organized as a Massachusetts business trust. The Fund offers Class A, Class T, Class C and Class I shares, each of which, along with Class B shares, has equal rights as to assets and voting privileges. Class B shares are closed to new accounts and additional purchases, except for exchanges and reinvestments. Each class has exclusive voting rights with respect to matters that affect that class. Class B shares will automatically convert to Class A shares after a holding period of seven years from the initial date of purchase.
During the period, the Board of Trustees approved the conversion of all existing Class B shares into Class A shares, effective on or about July 1, 2016, regardless of the length of times shares have been held.
2. Investments in Fidelity Central Funds.
The Fund invests in Fidelity Central Funds, which are open-end investment companies generally available only to other investment companies and accounts managed by the investment adviser and its affiliates. The Fund's Schedule of Investments lists each of the Fidelity Central Funds held as of period end, if any, as an investment of the Fund, but does not include the underlying holdings of each Fidelity Central Fund. As an Investing Fund, the Fund indirectly bears its proportionate share of the expenses of the underlying Fidelity Central Funds.
The Money Market Central Funds seek preservation of capital and current income and are managed by Fidelity Investments Money Management, Inc. (FIMM), an affiliate of the investment adviser. Annualized expenses of the Money Market Central Funds as of their most recent shareholder report date are less than .005%.
A complete unaudited list of holdings for each Fidelity Central Fund is available upon request or at the Securities and Exchange Commission (the SEC) website at www.sec.gov. In addition, the financial statements of the Fidelity Central Funds are available on the SEC website or upon request.
3. Significant Accounting Policies.
The financial statements have been prepared in conformity with accounting principles generally accepted in the United States of America (GAAP), which require management to make certain estimates and assumptions at the date of the financial statements. Actual results could differ from those estimates. Subsequent events, if any, through the date that the financial statements were issued have been evaluated in the preparation of the financial statements. The following summarizes the significant accounting policies of the Fund:
Investment Valuation. Investments are valued as of 4:00 p.m. Eastern time on the last calendar day of the period. The Board of Trustees (the Board) has delegated the day to day responsibility for the valuation of the Fund's investments to the Fidelity SelectCo, LLC (SelectCo) Fair Value Committee (the Committee). In accordance with valuation policies and procedures approved by the Board, the Fund attempts to obtain prices from one or more third party pricing vendors or brokers to value its investments. When current market prices, quotations or currency exchange rates are not readily available or reliable, investments will be fair valued in good faith by the Committee, in accordance with procedures adopted by the Board. Factors used in determining fair value vary by investment type and may include market or investment specific events. The frequency with which these procedures are used cannot be predicted and they may be utilized to a significant extent. The Committee oversees the Fund's valuation policies and procedures and reports to the Board on the Committee's activities and fair value determinations. The Board monitors the appropriateness of the procedures used in valuing the Fund's investments and ratifies the fair value determinations of the Committee.
The Fund categorizes the inputs to valuation techniques used to value its investments into a disclosure hierarchy consisting of three levels as shown below:
- Level 1 – quoted prices in active markets for identical investments
- Level 2 – other significant observable inputs (including quoted prices for similar investments, interest rates, prepayment speeds, etc.)
- Level 3 – unobservable inputs (including the Fund's own assumptions based on the best information available)
Valuation techniques used to value the Fund's investments by major category are as follows:
Equity securities, including restricted securities, for which market quotations are readily available, are valued at the last reported sale price or official closing price as reported by a third party pricing vendor on the primary market or exchange on which they are traded and are categorized as Level 1 in the hierarchy. In the event there were no sales during the day or closing prices are not available, securities are valued at the last quoted bid price or may be valued using the last available price and are generally categorized as Level 2 in the hierarchy. For foreign equity securities, when market or security specific events arise, comparisons to the valuation of American Depositary Receipts (ADRs), futures contracts, Exchange-Traded Funds (ETFs) and certain indexes as well as quoted prices for similar securities may be used and would be categorized as Level 2 in the hierarchy. Utilizing these techniques may result in transfers between Level 1 and Level 2. For equity securities, including restricted securities, where observable inputs are limited, assumptions about market activity and risk are used and these securities may be categorized as Level 3 in the hierarchy.
Investments in open-end mutual funds, including the Fidelity Central Funds, are valued at their closing net asset value (NAV) each business day and are categorized as Level 1 in the hierarchy.
Changes in valuation techniques may result in transfers in or out of an assigned level within the disclosure hierarchy.
Investment Transactions and Income. For financial reporting purposes, the Fund's investment holdings and NAV include trades executed through the end of the last business day of the period. The NAV per share for processing shareholder transactions is calculated as of the close of business of the New York Stock Exchange (NYSE), normally 4:00 p.m. Eastern time and includes trades executed through the end of the prior business day. Gains and losses on securities sold are determined on the basis of identified cost. Dividend income is recorded on the ex-dividend date, except for certain dividends from foreign securities where the ex-dividend date may have passed, which are recorded as soon as the Fund is informed of the ex-dividend date. Non-cash dividends included in dividend income, if any, are recorded at the fair market value of the securities received. Income and capital gain distributions from Fidelity Central Funds, if any, are recorded on the ex-dividend date. Distributions received on securities that represent a return of capital or capital gain are recorded as a reduction of cost of investments and/or as a realized gain. Subsequent to ex-dividend date the Fund determines the components of these distributions, based upon receipt of tax filings or other correspondence relating to the underlying investment.
Class Allocations and Expenses. Investment income, realized and unrealized capital gains and losses, common expenses of the Fund, and certain fund-level expense reductions, if any, are allocated daily on a pro-rata basis to each class based on the relative net assets of each class to the total net assets of the Fund. Each class differs with respect to transfer agent and distribution and service plan fees incurred. Certain expense reductions may also differ by class. For the reporting period, the allocated portion of income and expenses to each class as a percent of its average net assets may vary due to the timing of recording these transactions in relation to fluctuating net assets of the classes. Expenses directly attributable to a fund are charged to that fund. Expenses attributable to more than one fund are allocated among the respective funds on the basis of relative net assets or other appropriate methods. Expense estimates are accrued in the period to which they relate and adjustments are made when actual amounts are known.
Deferred Trustee Compensation. Under a Deferred Compensation Plan (the Plan), independent Trustees may elect to defer receipt of a portion of their annual compensation. Deferred amounts are invested in a cross-section of Fidelity funds, are marked-to-market and remain in the Fund until distributed in accordance with the Plan. The investment of deferred amounts and the offsetting payable to the Trustees are included in the accompanying Statement of Assets and Liabilities.
Income Tax Information and Distributions to Shareholders. Each year, the Fund intends to qualify as a regulated investment company under Subchapter M of the Internal Revenue Code, including distributing substantially all of its taxable income and realized gains. As a result, no provision for U.S. Federal income taxes is required. The Fund files a U.S. federal tax return, in addition to state and local tax returns as required. The Fund's federal income tax returns are subject to examination by the Internal Revenue Service (IRS) for a period of three fiscal years after they are filed. State and local tax returns may be subject to examination for an additional fiscal year depending on the jurisdiction.
Distributions are declared and recorded on the ex-dividend date. Income dividends and capital gain distributions are declared separately for each class. Income and capital gain distributions are determined in accordance with income tax regulations, which may differ from GAAP.
Capital accounts within the financial statements are adjusted for permanent book-tax differences. These adjustments have no impact on net assets or the results of operations. Capital accounts are not adjusted for temporary book-tax differences which will reverse in a subsequent period.
Book-tax differences are primarily due to deferred trustees compensation and losses deferred due to wash sales.
The federal tax cost of investment securities and unrealized appreciation (depreciation) as of period end were as follows:
| Gross unrealized appreciation | $196,631,215 |
| Gross unrealized depreciation | (30,625,096) |
| Net unrealized appreciation (depreciation) on securities | $166,006,119 |
| Tax cost | $734,660,410 |
4. Purchases and Sales of Investments.
Purchases and sales of securities, other than short-term securities, aggregated $305,912,352 and $327,422,011, respectively.
5. Fees and Other Transactions with Affiliates.
Management Fee. Fidelity SelectCo, LLC (the investment adviser) and its affiliates provide the Fund with investment management related services for which the Fund pays a monthly management fee. The management fee is the sum of an individual fund fee rate that is based on an annual rate of .30% of the Fund's average net assets and an annualized group fee rate that averaged .25% during the period. The group fee rate is based upon the average net assets of all the mutual funds advised by Fidelity Management & Research Company (FMR) and the investment adviser. The group fee rate decreases as assets under management increase and increases as assets under management decrease. For the reporting period, the total annualized management fee rate was .55% of the Fund's average net assets.
Distribution and Service Plan Fees. In accordance with Rule 12b-1 of the 1940 Act, the Fund has adopted separate Distribution and Service Plans for each class of shares. Certain classes pay Fidelity Distributors Corporation (FDC), an affiliate of the investment adviser, separate Distribution and Service Fees, each of which is based on an annual percentage of each class' average net assets. In addition, FDC may pay financial intermediaries for selling shares of the Fund and providing shareholder support services. For the period, the Distribution and Service Fee rates, total fees and amounts retained by FDC were as follows:
| | Distribution
Fee | Service
Fee | Total Fees | Retained
by FDC |
| Class A | -% | .25% | $399,714 | $- |
| Class T | .25% | .25% | 420,274 | - |
| Class B | .75% | .25% | 16,903 | 12,677 |
| Class C | .75% | .25% | 376,965 | 67,164 |
| | | | $1,213,856 | $79,841 |
Sales Load. FDC may receive a front-end sales charge of up to 5.75% for selling Class A shares and 3.50% for selling Class T shares, some of which is paid to financial intermediaries for selling shares of the Fund. Depending on the holding period, FDC may receive contingent deferred sales charges levied on Class A, Class T, Class B, and Class C redemptions. The deferred sales charges range from 5.00% to 1.00% for Class B shares, 1.00% for Class C shares, 1.00% for certain purchases of Class A shares and .25% for certain purchases of Class T shares.
For the period, sales charge amounts retained by FDC were as follows:
| | Retained
by FDC |
| Class A | $26,339 |
| Class T | 4,186 |
| Class B* | 238 |
| Class C* | 6,670 |
| | $37,433 |
* When Class B and Class C shares are initially sold, FDC pays commissions from its own resources to financial intermediaries through which the sales are made.
Transfer Agent Fees. Fidelity Investments Institutional Operations Company, Inc., (FIIOC), an affiliate of the investment adviser, is the transfer, dividend disbursing and shareholder servicing agent for each class of the Fund. FIIOC receives account fees and asset-based fees that vary according to the account size and type of account of the shareholders of the respective classes of the Fund. FIIOC pays for typesetting, printing and mailing of shareholder reports, except proxy statements.
For the period, transfer agent fees for each class were as follows:
| | Amount | % of
Class-Level Average
Net Assets(a) |
| Class A | $380,977 | .24 |
| Class T | 187,940 | .22 |
| Class B | 5,038 | .30 |
| Class C | 96,863 | .26 |
| Class I | 412,636 | .24 |
| | $1,083,454 | |
(a) Annualized
Accounting and Security Lending Fees. Fidelity Service Company, Inc. (FSC), an affiliate of the investment adviser, maintains the Fund's accounting records. The accounting fee is based on the level of average net assets for each month. Under a separate contract, FSC administers the security lending program. The security lending fee is based on the number and duration of lending transactions.
Brokerage Commissions. The Fund placed a portion of its portfolio transactions with brokerage firms which are affiliates of the investment adviser. Brokerage commissions are included in net realized gain (loss) and change in net unrealized appreciation (depreciation) in the Statement of Operations. The commissions paid to these affiliated firms were $1,564 for the period.
Interfund Trades. The Fund may purchase from or sell securities to other Fidelity Funds under procedures adopted by the Board. The procedures have been designed to ensure these interfund trades are executed in accordance with Rule 17a-7 of the 1940 Act. Interfund trades are included within the respective purchases and sales amounts shown in the Purchases and Sales of Investments note.
6. Committed Line of Credit.
The Fund participates with other funds managed by the investment adviser or an affiliate in a $4.25 billion credit facility (the "line of credit") to be utilized for temporary or emergency purposes to fund shareholder redemptions or for other short-term liquidity purposes. The Fund has agreed to pay commitment fees on its pro-rata portion of the line of credit, which amounted to $608 and is reflected in Miscellaneous expenses on the Statement of Operations. During the period, the Fund did not borrow on this line of credit.
7. Security Lending.
The Fund lends portfolio securities through a lending agent from time to time in order to earn additional income. On the settlement date of the loan, the Fund receives collateral (in the form of U.S. Treasury obligations, letters of credit and/or cash) against the loaned securities and maintains collateral in an amount not less than 100% of the market value of the loaned securities during the period of the loan. The market value of the loaned securities is determined at the close of business of the Fund and any additional required collateral is delivered to the Fund on the next business day. The Fund or borrower may terminate the loan at any time, and if the borrower defaults on its obligation to return the securities loaned because of insolvency or other reasons, the Fund may apply collateral received from the borrower against the obligation. The Fund may experience delays and costs in recovering the securities loaned. Any cash collateral received is invested in the Fidelity Securities Lending Cash Central Fund. At period end, there were no security loans outstanding. Security lending income represents the income earned on investing cash collateral, less rebates paid to borrowers and any lending agent fees associated with the loan, plus any premium payments received for lending certain types of securities. Security lending income is presented in the Statement of Operations as a component of income from Fidelity Central Funds. Total security lending income during the period amounted to $80.
8. Expense Reductions.
Commissions paid to certain brokers with whom the investment adviser, or its affiliates, places trades on behalf of the Fund include an amount in addition to trade execution, which may be rebated back to the Fund to offset certain expenses. This amount totaled $31,403 for the period. In addition, through arrangements with the Fund's custodian, credits realized as a result of certain uninvested cash balances were used to reduce the Fund's expenses. During the period, these credits reduced the Fund's custody expenses by $12.
In addition, during the period the investment adviser reimbursed and/or waived a portion of fund-level operating expenses in the amount of $3,330.
9. Distributions to Shareholders.
Distributions to shareholders of each class were as follows:
| | Six months ended January 31, 2016 | Year ended July 31, 2015 |
| From net investment income | | |
| Class A | $3,601,177 | $4,035,347 |
| Class T | 1,649,988 | 1,622,788 |
| Class B | 19,721 | 34,655 |
| Class C | 516,913 | 511,454 |
| Class I | 4,335,119 | 5,039,431 |
| Total | $10,122,918 | $11,243,675 |
| From net realized gain | | |
| Class A | $8,321,843 | $19,013,153 |
| Class T | 4,346,704 | 9,450,491 |
| Class B | 96,771 | 364,345 |
| Class C | 2,036,085 | 4,547,430 |
| Class I | 8,786,895 | 20,242,329 |
| Total | $23,588,298 | $53,617,748 |
10. Share Transactions.
Share transactions for each class were as follows and may contain automatic conversions between classes or exchanges between affiliated funds:
| | Shares | Shares | Dollars | Dollars |
| | Six months ended January 31, 2016 | Year ended July 31, 2015 | Six months ended January 31, 2016 | Year ended July 31, 2015 |
| Class A | | | | |
| Shares sold | 2,308,311 | 6,477,452 | $51,457,038 | $150,703,408 |
| Reinvestment of distributions | 549,638 | 994,050 | 11,564,581 | 22,291,454 |
| Shares redeemed | (2,784,360) | (5,315,431) | (61,435,193) | (122,321,981) |
| Net increase (decrease) | 73,589 | 2,156,071 | $1,586,426 | $50,672,881 |
| Class T | | | | |
| Shares sold | 962,736 | 2,562,977 | $21,119,964 | $59,571,645 |
| Reinvestment of distributions | 279,758 | 484,775 | 5,877,551 | 10,861,687 |
| Shares redeemed | (944,157) | (1,841,950) | (20,887,252) | (42,022,412) |
| Net increase (decrease) | 298,337 | 1,205,802 | $6,110,263 | $28,410,920 |
| Class B | | | | |
| Shares sold | 574 | 16,002 | $12,750 | $364,459 |
| Reinvestment of distributions | 5,480 | 16,893 | 113,056 | 373,842 |
| Shares redeemed | (39,888) | (115,814) | (867,476) | (2,618,545) |
| Net increase (decrease) | (33,834) | (82,919) | $(741,670) | $(1,880,244) |
| Class C | | | | |
| Shares sold | 308,691 | 1,502,434 | $6,723,666 | $34,498,632 |
| Reinvestment of distributions | 114,145 | 210,658 | 2,351,123 | 4,650,868 |
| Shares redeemed | (525,600) | (1,103,640) | (11,356,967) | (24,943,789) |
| Net increase (decrease) | (102,764) | 609,452 | $(2,282,178) | $14,205,711 |
| Class I | | | | |
| Shares sold | 3,105,505 | 6,270,229 | $68,985,951 | $146,901,080 |
| Reinvestment of distributions | 499,887 | 857,158 | 10,614,336 | 19,361,443 |
| Shares redeemed | (3,198,310) | (5,142,590) | (70,806,108) | (119,680,567) |
| Net increase (decrease) | 407,082 | 1,984,797 | $8,794,179 | $46,581,956 |
11. Other.
The Fund's organizational documents provide former and current trustees and officers with a limited indemnification against liabilities arising in connection with the performance of their duties to the Fund. In the normal course of business, the Fund may also enter into contracts that provide general indemnifications. The Fund's maximum exposure under these arrangements is unknown as this would be dependent on future claims that may be made against the Fund. The risk of material loss from such claims is considered remote.
Shareholder Expense Example
As a shareholder of the Fund, you incur two types of costs: (1) transaction costs, including sales charges (loads) on purchase payments or redemption proceeds, and (2) ongoing costs, including management fees, distribution and/or service (12b-1) fees and other Fund expenses. This Example is intended to help you understand your ongoing costs (in dollars) of investing in the Fund and to compare these costs with the ongoing costs of investing in other mutual funds.
The Example is based on an investment of $1,000 invested at the beginning of the period and held for the entire period (August 1, 2015 to January 31, 2016).
Actual Expenses
The first line of the accompanying table for each class of the Fund provides information about actual account values and actual expenses. You may use the information in this line, together with the amount you invested, to estimate the expenses that you paid over the period. Simply divide your account value by $1,000.00 (for example, an $8,600 account value divided by $1,000.00 = 8.6), then multiply the result by the number in the first line for a class of the Fund under the heading entitled "Expenses Paid During Period" to estimate the expenses you paid on your account during this period. In addition, the Fund, as a shareholder in the underlying Fidelity Central Funds, will indirectly bear its pro-rata share of the fees and expenses incurred by the underlying Fidelity Central Funds. These fees and expenses are not included in the Fund's annualized expense ratio used to calculate the expense estimate in the table below.
Hypothetical Example for Comparison Purposes
The second line of the accompanying table for each class of the Fund provides information about hypothetical account values and hypothetical expenses based on a Class' actual expense ratio and an assumed rate of return of 5% per year before expenses, which is not the Class' actual return. The hypothetical account values and expenses may not be used to estimate the actual ending account balance or expenses you paid for the period. You may use this information to compare the ongoing costs of investing in the Fund and other funds. To do so, compare this 5% hypothetical example with the 5% hypothetical examples that appear in the shareholder reports of the other funds. In addition, the Fund, as a shareholder in the underlying Fidelity Central Funds, will indirectly bear its pro-rata share of the fees and expenses incurred by the underlying Fidelity Central Funds. These fees and expenses are not included in the Fund's annualized expense ratio used to calculate the expense estimate in the table below.
Please note that the expenses shown in the table are meant to highlight your ongoing costs only and do not reflect any transaction costs. Therefore, the second line of the table is useful in comparing ongoing costs only, and will not help you determine the relative total costs of owning different funds. In addition, if these transactional costs were included, your costs would have been higher.
| | Annualized Expense Ratio-A | Beginning
Account Value
August 1, 2015 | Ending
Account Value
January 31, 2016 | Expenses Paid
During Period-B
August 1, 2015
to January 31, 2016 |
| Class A | 1.10% | | | |
| Actual | | $1,000.00 | $990.90 | $5.50 |
| Hypothetical-C | | $1,000.00 | $1,019.61 | $5.58 |
| Class T | 1.33% | | | |
| Actual | | $1,000.00 | $989.90 | $6.65 |
| Hypothetical-C | | $1,000.00 | $1,018.45 | $6.75 |
| Class B | 1.91% | | | |
| Actual | | $1,000.00 | $986.60 | $9.54 |
| Hypothetical-C | | $1,000.00 | $1,015.53 | $9.68 |
| Class C | 1.87% | | | |
| Actual | | $1,000.00 | $987.00 | $9.34 |
| Hypothetical-C | | $1,000.00 | $1,015.74 | $9.48 |
| Class I | .85% | | | |
| Actual | | $1,000.00 | $992.00 | $4.26 |
| Hypothetical-C | | $1,000.00 | $1,020.86 | $4.32 |
A Annualized expense ratio reflects expenses net of applicable fee waivers.
B Expenses are equal to each Class' annualized expense ratio, multiplied by the average account value over the period, multiplied by 184/366 (to reflect the one-half year period).
C 5% return per year before expenses
Board Approval of Investment Advisory Contracts and Management Fees
Fidelity Advisor Real Estate Fund
Each year, the Board of Trustees, including the Independent Trustees (together, the Board), votes on the renewal of the management contract with Fidelity SelectCo, LLC (SelectCo), an affiliate of Fidelity Management & Research Company (FMR), and the sub-advisory agreements with affiliates of FMR (together, the Advisory Contracts) for the fund. The Board, assisted by the advice of fund counsel and Independent Trustees' counsel, requests and considers a broad range of information relevant to the renewal of the Advisory Contracts throughout the year.
The Board meets regularly and, at each of its meetings, covers an extensive agenda of topics and materials and considers factors that are relevant to its annual consideration of the renewal of the fund's Advisory Contracts, including the services and support provided to the fund and its shareholders. The Board has established four standing committees (Committees) — Operations, Audit, Fair Valuation, and Governance and Nominating — each composed of and chaired by Independent Trustees with varying backgrounds, to which the Board has assigned specific subject matter responsibilities in order to enhance effective decision-making by the Board. The Operations Committee, of which all of the Independent Trustees are members, meets regularly throughout the year and considers, among other matters, information specifically related to the annual consideration of the renewal of the fund's Advisory Contracts. The Board, acting directly and through its Committees, requests and receives information concerning the annual consideration of the renewal of the fund's Advisory Contracts. The Board also meets as needed to consider matters specifically related to the Board's annual consideration of the renewal of the Advisory Contracts. Members of the Board may also meet with trustees of other Fidelity funds through ad hoc joint committees to discuss certain matters relevant to all of the Fidelity funds.
At its January 2016 meeting, the Board unanimously determined to renew the fund's Advisory Contracts. In reaching its determination, the Board considered all factors it believed relevant, including (i) the nature, extent, and quality of the services to be provided to the fund and its shareholders (including the investment performance of the fund); (ii) the competitiveness of the fund's management fee and total expense ratio relative to peer funds; (iii) the total costs of the services to be provided by and the profits to be realized by Fidelity from its relationships with the fund; and (iv) the extent to which, if any, economies of scale exist and would be realized as the fund grows, and whether any economies of scale are appropriately shared with fund shareholders.
In considering whether to renew the Advisory Contracts for the fund, the Board reached a determination, with the assistance of fund counsel and Independent Trustees' counsel and through the exercise of its business judgment, that the renewal of the Advisory Contracts was in the best interests of the fund and its shareholders and that the compensation payable under the Advisory Contracts was fair and reasonable. The Board's decision to renew the Advisory Contracts was not based on any single factor, but rather was based on a comprehensive consideration of all the information provided to the Board at its meetings throughout the year. The Board, in reaching its determination to renew the Advisory Contracts, was aware that shareholders of the fund have a broad range of investment choices available to them, including a wide choice among funds offered by Fidelity's competitors, and that the fund's shareholders, who have the opportunity to review and weigh the disclosure provided by the fund in its prospectus and other public disclosures, have chosen to invest in this fund, which is part of the Fidelity family of funds.
Nature, Extent, and Quality of Services Provided. The Board considered the staffing of SelectCo and the sub-advisers (together with SelectCo, the Investment Advisers) as it relates to the fund, including the backgrounds of investment personnel of SelectCo, and also considered the fund's investment objectives, strategies, and related investment philosophies. The Independent Trustees also had discussions with senior management of Fidelity's investment operations and investment groups. The Board considered the structure of the investment personnel compensation program and whether this structure provides appropriate incentives to act in the best interests of the fund. Additionally, the Board considered the portfolio managers' investments, if any, in the funds that they manage.
Resources Dedicated to Investment Management and Support Services. The Board reviewed the general qualifications and capabilities of the investment staff of the Investment Advisers, including their size, education, experience, and resources, as well as Fidelity's approach to recruiting, training, managing, and compensating investment personnel. The Board noted that Fidelity has continued to increase the resources devoted to non-U.S. offices, including expansion of Fidelity's global investment organization. The Board also noted that Fidelity's analysts have extensive resources, tools and capabilities that allow them to conduct sophisticated quantitative and fundamental analysis, as well as credit analysis of issuers, counterparties and guarantors. Further, the Board considered that Fidelity's investment professionals have sufficient access to global information and data so as to provide competitive investment results over time, and that those professionals also have access to sophisticated tools that permit them to assess portfolio construction and risk and performance attribution characteristics continuously, as well as to transmit new information and research conclusions rapidly around the world. Additionally, in its deliberations, the Board considered Fidelity's trading, risk management, compliance, and technology and operations capabilities and resources, which are integral parts of the investment management process.
Shareholder and Administrative Services. The Board considered (i) the nature, extent, quality, and cost of advisory, administrative, and shareholder services performed by the Investment Advisers and their affiliates under the Advisory Contracts and under separate agreements covering transfer agency, pricing and bookkeeping, and securities lending services for the fund; (ii) the nature and extent of the supervision of third party service providers, principally custodians, subcustodians, and pricing vendors; and (iii) the resources devoted to, and the record of compliance with, the fund's compliance policies and procedures. The Board also reviewed the allocation of fund brokerage, including allocations to brokers affiliated with the Investment Advisers, the use of brokerage commissions to pay fund expenses, and the use of "soft" commission dollars to pay for research services.
The Board noted that the growth of fund assets over time across the complex allows Fidelity to reinvest in the development of services designed to enhance the value or convenience of the Fidelity funds as investment vehicles. These services include 24-hour access to account information and market information through telephone representatives and over the Internet, investor education materials and asset allocation tools, and the expanded availability of Fidelity Investor Centers.
The Board noted that in 2014 the ad hoc Committee on Transfer Agency Fees was formed by it and the boards of certain other Fidelity funds to review the variety of transfer agency services and fee structures throughout the mutual fund industry compared to Fidelity's.
Investment in a Large Fund Family. The Board considered the benefits to shareholders of investing in a Fidelity fund, including the benefits of investing in a fund that is part of a large family of funds offering a variety of investment disciplines and providing a large variety of mutual fund investor services. The Board noted that Fidelity had taken, or had made recommendations that resulted in the Fidelity funds taking, a number of actions over the previous year that benefited particular funds, including (i) continuing to dedicate additional resources to investment research and to the support of the senior management team that oversees asset management; (ii) continuing efforts to enhance Fidelity's global research capabilities; (iii) launching new funds and making other enhancements to meet client needs; (iv) reducing management fees and total expenses for certain index funds; (v) continuing to launch dedicated lower cost underlying funds to meet portfolio construction needs related to expanding underlying fund options for Fidelity funds of funds, specifically for the Freedom Fund product lines; (vi) rationalizing product lines and gaining increased efficiencies through fund mergers; (vii) continuing to develop, acquire and implement systems and technology to improve services to the funds and shareholders, strengthen information security, and increase efficiency; (viii) implementing investment enhancements to further strengthen Fidelity's target date product line to increase investors' probability of success in achieving their goals; (ix) modifying the eligibility criteria for certain share classes to accommodate roll-over assets from employer-sponsored retirement plans; (x) launching a new Class W of the Freedom Index Funds to attract and retain Fidelity record-kept retirement plan assets; and (xi) implementing changes to Fidelity's money market fund product line in response to recent regulatory reforms.
Investment Performance. The Board considered whether the fund has operated in accordance with its investment objective, as well as its record of compliance with its investment restrictions and its performance history.
The Board took into account discussions with representatives of the Investment Advisers about fund investment performance that occur at Board meetings throughout the year. In this regard the Board noted that as part of regularly scheduled fund reviews and other reports to the Board on fund performance, the Board considers annualized return information for the fund, for different time periods, measured against a securities market index ("benchmark index"). In its evaluation of fund investment performance at meetings throughout the year, the Board gave particular attention to information indicating underperformance of certain Fidelity funds for specific time periods and discussed with the Investment Advisers the reasons for such underperformance. The fund underperformed its benchmark for the one-, three-, and five-year periods ended June 30, 2015, and as a result, the Board will continue to discuss with SelectCo the steps it is taking to address the fund's performance.
In addition to reviewing absolute and relative fund performance, the Independent Trustees periodically consider the appropriateness of fund performance metrics in evaluating the results achieved. In general, the Independent Trustees believe that fund performance should be evaluated based on net performance (after fees and expenses) of both the highest performing and lowest performing fund share classes, where applicable, compared to appropriate benchmark indices, over appropriate time periods that may include full market cycles, taking into account relevant factors, including the following: general market conditions; issuer-specific information; and fund cash flows and other factors. Depending on the circumstances, the Independent Trustees may be satisfied with a fund's performance notwithstanding that it lags its benchmark index for certain periods.
The Independent Trustees recognize that shareholders evaluate performance on a net basis over their own holding periods, for which one-, three-, and five-year periods are often used as a proxy. For this reason, the performance information reviewed by the Board also included net cumulative total return information for the fund and an appropriate benchmark index for the most recent one-, three-, and five-year periods ended June 30, 2015.
Based on its review, the Board concluded that the nature, extent, and quality of services provided to the fund under the Advisory Contracts should benefit the shareholders of the fund.
Competitiveness of Management Fee and Total Expense Ratio. The Board considered the fund's management fee and total expense ratio compared to "mapped groups" of competitive funds and classes created for the purpose of facilitating the Trustees' analysis of the competitiveness of management fees and total expenses. Fidelity creates "mapped groups" by combining similar Lipper investment objective categories that have comparable investment mandates. For this purpose, all sector focused equity funds are grouped in the same mapped group. Combining Lipper investment objective categories aids the Board's management fee and total expense ratio comparisons by broadening the competitive group used for comparison.
Management Fee. The Board considered two proprietary management fee comparisons for the 12-month periods ended June 30 shown in basis points (BP) in the chart below. The group of Lipper funds used by the Board for management fee comparisons is referred to below as the "Total Mapped Group." The Total Mapped Group comparison focuses on a fund's standing in terms of gross management fees before expense reimbursements or caps relative to the total universe of funds with comparable investment mandates (
i.e., sector equities), regardless of whether their management fee structures also are comparable. Funds with comparable management fee structures have similar management fee contractual arrangements (
e.g., flat rate charged for advisory services, all-inclusive fee rate,
etc.). "TMG %" represents the percentage of funds in the Total Mapped Group that had management fees that were lower than the fund's. For example, a hypothetical TMG % of 20% would mean that 80% of the funds in the Total Mapped Group had higher, and 20% had lower, management fees than the fund. The fund's actual TMG %s and the number of funds in the Total Mapped Group are in the chart below. The "Asset-Size Peer Group" (ASPG) comparison focuses on a fund's standing relative to a subset of non-Fidelity funds within the Total Mapped Group that are similar in size and management fee structure. For example, if a fund is in the first quartile of the ASPG, the fund's management fee ranks in the least expensive or lowest 25% of funds in the ASPG. The ASPG represents at least 15% of the funds in the Total Mapped Group with comparable asset size and management fee structures, subject to a minimum of 50 funds (or all funds in the Total Mapped Group if fewer than 50). Additional information, such as the ASPG quartile in which the fund's management fee rate ranked, is also included in the chart and considered by the Board.
Fidelity Advisor Real Estate Fund
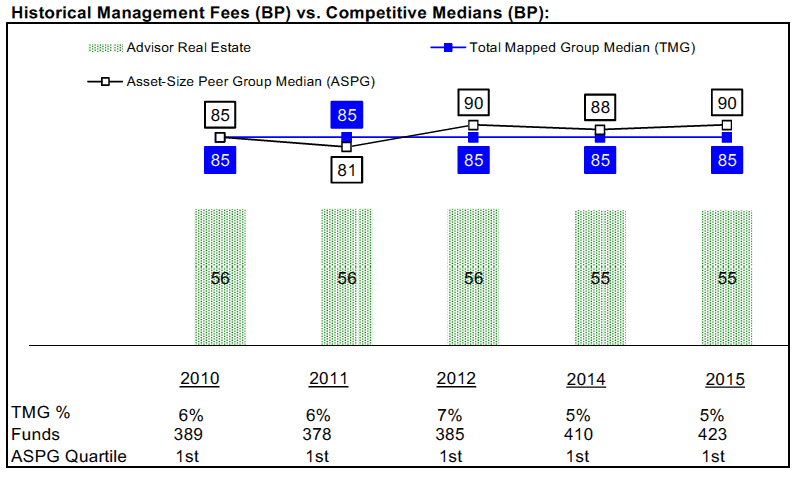
The Board noted that the fund's management fee rate ranked below the median of its Total Mapped Group and below the median of its ASPG for the 12-month period ended June 30, 2015.
The Board noted that, in 2014, the ad hoc Committee on Group Fee was formed by it and the boards of other Fidelity funds to conduct an in-depth review of the "group fee" component of the management fee of funds with such management fee structures. Committee focus included the mechanics of the group fee, the competitive landscape of group fee structures, Fidelity funds with no group fee component and investment products not included in group fee assets. The Board also considered that, for funds subject to the group fee, FMR agreed to voluntarily waive fees over a specified period of time in amounts designed to account for assets converted from certain funds to certain collective investment trusts.
Based on its review, the Board concluded that the fund's management fee is fair and reasonable in light of the services that the fund receives and the other factors considered.
Total Expense Ratio. In its review of each class's total expense ratio, the Board considered the fund's management fee rate as well as other fund or class expenses, as applicable, such as transfer agent fees, pricing and bookkeeping fees, fund-paid 12b-1 fees, and custodial, legal, and audit fees. The Board also noted that Fidelity may agree to waive fees and expenses from time to time, and the extent to which, if any, it has done so for the fund. As part of its review, the Board also considered the current and historical total expense ratios of each class of the fund compared to competitive fund median expenses. Each class of the fund is compared to those funds and classes in the Total Mapped Group (used by the Board for management fee comparisons) that have a similar sales load structure.
The Board noted that the total expense ratio of each class ranked below the competitive median for the 12-month period ended June 30, 2015.
Fees Charged to Other Fidelity Clients. The Board also considered Fidelity fee structures and other information with respect to clients of Fidelity, such as other funds advised or subadvised by Fidelity, pension plan clients, and other institutional clients with similar mandates. The Board noted the findings of the 2013 ad hoc joint committee (created with the boards of other Fidelity funds), which reviewed and compared Fidelity's institutional investment advisory business with its business of providing services to the Fidelity funds, including the differences in services provided, fees charged, and costs incurred, as well as competition in their respective marketplaces.
Based on its review of total expense ratios and fees charged to other Fidelity clients, the Board concluded that the total expense ratio of each class of the fund was reasonable in light of the services that the fund and its shareholders receive and the other factors considered.
Costs of the Services and Profitability. The Board considered the revenues earned and the expenses incurred by Fidelity in conducting the business of developing, marketing, distributing, managing, administering and servicing the fund and servicing the fund's shareholders. The Board also considered the level of Fidelity's profits in respect of all the Fidelity funds.
On an annual basis, Fidelity presents to the Board information about the profitability of its relationship with the fund. Fidelity calculates profitability information for each fund, as well as aggregate profitability information for groups of Fidelity funds and all Fidelity funds, using a series of detailed revenue and cost allocation methodologies which originate with the books and records of Fidelity on which Fidelity's audited financial statements are based. The Audit Committee of the Board reviews any significant changes from the prior year's methodologies.
PricewaterhouseCoopers LLP (PwC), independent registered public accounting firm and auditor to Fidelity and certain Fidelity funds, has been engaged annually by the Board as part of the Board's assessment of the profitability analysis used by Fidelity. PwC's engagement includes the review and assessment of Fidelity's methodologies used in determining the revenues and expenses attributable to Fidelity's mutual fund business, and completion of agreed-upon procedures in respect of the mathematical accuracy of fund profitability and its conformity to established allocation methodologies. After considering PwC's reports issued under the engagement and information provided by Fidelity, the Board concluded that while other allocation methods may also be reasonable, Fidelity's profitability methodologies are reasonable in all material respects.
The Board also reviewed Fidelity's non-fund businesses and fall-out benefits related to the mutual fund business as well as cases where Fidelity's affiliates may benefit from or be related to the fund's business.
The Board considered the costs of the services provided by and the profits realized by Fidelity in connection with the operation of the fund and was satisfied that the profitability was not excessive.
Economies of Scale. The Board considered whether there have been economies of scale in respect of the management of the Fidelity funds, whether the Fidelity funds (including the fund) have appropriately benefited from any such economies of scale, and whether there is potential for realization of any further economies of scale. The Board considered the extent to which the fund will benefit from economies of scale as assets grow through increased services to the fund, through waivers or reimbursements, or through fee or expense ratio reductions. The Board also noted that in 2013, it and the boards of other Fidelity funds created an ad hoc committee (the Economies of Scale Committee) to analyze whether Fidelity attains economies of scale in respect of the management and servicing of the Fidelity funds, whether the Fidelity funds have appropriately benefited from such economies of scale, and whether there is potential for realization of any further economies of scale.
The Board recognized that the fund's management contract incorporates a "group fee" structure, which provides for lower group fee rates as total group assets increase, and for higher group fee rates as total group assets decrease (with "group assets" defined to include fund assets under SelectCo's management plus assets under FMR's management). SelectCo calculates the group fee rates based on a tiered asset "breakpoint" schedule that varies based on asset class. The Board considered that the group fee is designed to deliver the benefits of economies of scale to fund shareholders when total group assets increase, even if assets of any particular fund are unchanged or have declined, because some portion of Fidelity's costs are attributable to services provided to all Fidelity funds, and all funds benefit if those costs can be allocated among more assets. The Board concluded that, given the group fee structure, fund shareholders will benefit from lower management fees as group assets increase at the fund complex level, regardless of whether Fidelity achieves any such economies of scale.
The Board concluded, taking into account the analysis of the Economies of Scale Committee, that economies of scale, if any, are being appropriately shared between fund shareholders and Fidelity.
Additional Information Requested by the Board. In order to develop fully the factual basis for consideration of the Fidelity funds' Advisory Contracts, the Board requested and received additional information on certain topics, including: (i) Fidelity's fund profitability methodology, profitability trends for certain funds, and the impact of certain factors on fund profitability results; (ii) portfolio manager changes that have occurred during the past year and the amount of the investment that each portfolio manager has made in the Fidelity fund(s) that he or she manages; (iii) Fidelity's compensation structure for portfolio managers, research analysts, and other key personnel, including its effects on fund profitability; (iv) the arrangements with and compensation paid to certain fund sub-advisers on behalf of the Fidelity funds; (v) Fidelity's long-term expectations for its offerings in the workplace investing channel; (vi) the methodology with respect to competitive fund data and peer group classifications; (vii) Fidelity's transfer agent fee, expense, and service structures for different funds and classes, and the impact of outsourcing, the increased use of omnibus accounts, and lower pricing in the retirement channel; and (viii) explanations regarding the relative total expense ratios of certain funds and classes, total expense competitive trends and methodologies for total expense competitive comparisons, and actions that might be taken by Fidelity to reduce total expense ratios for certain funds and classes or to achieve further economies of scale.
Based on its evaluation of all of the conclusions noted above, and after considering all factors it believed relevant, the Board concluded that the advisory fee structures are fair and reasonable, and that the fund's Advisory Contracts should be renewed.
ARE-SANN-0316
1.783109.114
Fidelity Advisor® Real Estate Fund
Class I
Semi-Annual Report January 31, 2016 |
|
Contents
To view a fund's proxy voting guidelines and proxy voting record for the 12-month period ended June 30, visit http://www.fidelity.com/proxyvotingresults or visit the Securities and Exchange Commission's (SEC) web site at http://www.sec.gov.
You may also call 1-877-208-0098 to request a free copy of the proxy voting guidelines.
Standard & Poor's, S&P and S&P 500 are registered service marks of The McGraw-Hill Companies, Inc. and have been licensed for use by Fidelity Distributors Corporation.
Other third-party marks appearing herein are the property of their respective owners.
All other marks appearing herein are registered or unregistered trademarks or service marks of FMR LLC or an affiliated company. © 2016 FMR LLC. All rights reserved.
This report and the financial statements contained herein are submitted for the general information of the shareholders of the Fund. This report is not authorized for distribution to prospective investors in the Fund unless preceded or accompanied by an effective prospectus.
A fund files its complete schedule of portfolio holdings with the SEC for the first and third quarters of each fiscal year on Form N-Q. Forms N-Q are available on the SEC’s web site at http://www.sec.gov. A fund's Forms N-Q may be reviewed and copied at the SEC’s Public Reference Room in Washington, DC. Information regarding the operation of the SEC's Public Reference Room may be obtained by calling 1-800-SEC-0330.
For a complete list of a fund's portfolio holdings, view the most recent holdings listing, semiannual report, or annual report on Fidelity's web site at http://www.fidelity.com, http://www.advisor.fidelity.com, or http://www.401k.com, as applicable.
NOT FDIC INSURED •MAY LOSE VALUE •NO BANK GUARANTEE
Neither the Fund nor Fidelity Distributors Corporation is a bank.
Investment Summary (Unaudited)
Top Ten Stocks as of January 31, 2016
| | % of fund's net assets | % of fund's net assets 6 months ago |
| Simon Property Group, Inc. | 11.7 | 10.1 |
| Boston Properties, Inc. | 5.4 | 5.6 |
| Public Storage | 5.3 | 4.5 |
| Ventas, Inc. | 5.0 | 3.2 |
| Extra Space Storage, Inc. | 4.7 | 3.4 |
| Essex Property Trust, Inc. | 4.6 | 5.1 |
| UDR, Inc. | 3.9 | 3.9 |
| Federal Realty Investment Trust (SBI) | 3.5 | 3.1 |
| Equity Residential (SBI) | 3.4 | 2.2 |
| Mid-America Apartment Communities, Inc. | 3.3 | 0.2 |
| | 50.8 | |
Top Five REIT Sectors as of January 31, 2016
| | % of fund's net assets | % of fund's net assets 6 months ago |
| REITs - Apartments | 18.2 | 18.0 |
| REITs - Regional Malls | 16.1 | 15.7 |
| REITs - Office Property | 13.0 | 16.7 |
| REITs - Health Care | 10.5 | 11.5 |
| REITs - Storage | 10.0 | 7.9 |
Asset Allocation (% of fund's net assets)
| As of January 31, 2016 |
| | Stocks | 98.2% |
| | Short-Term Investments and Net Other Assets (Liabilities) | 1.8% |

| As of July 31, 2015 |
| | Stocks | 99.6% |
| | Short-Term Investments and Net Other Assets (Liabilities) | 0.4% |

Investments January 31, 2016 (Unaudited)
Showing Percentage of Net Assets
| Common Stocks - 98.2% | | | |
| | | Shares | Value |
| Hotels, Restaurants & Leisure - 0.9% | | | |
| Hotels, Resorts & Cruise Lines - 0.9% | | | |
| Hilton Worldwide Holdings, Inc. | | 417,200 | $7,430,332 |
| Real Estate Investment Trusts - 97.3% | | | |
| REITs - Apartments - 18.2% | | | |
| AvalonBay Communities, Inc. | | 159,840 | 27,410,962 |
| Equity Residential (SBI) | | 397,309 | 30,628,551 |
| Essex Property Trust, Inc. | | 193,447 | 41,225,490 |
| Mid-America Apartment Communities, Inc. | | 313,300 | 29,393,806 |
| UDR, Inc. | | 976,300 | 34,746,517 |
| | | | 163,405,326 |
| REITs - Diversified - 5.9% | | | |
| Cousins Properties, Inc. | | 754,743 | 6,505,885 |
| DuPont Fabros Technology, Inc. | | 541,600 | 17,964,872 |
| Forest City Realty Trust, Inc. (a) | | 892,067 | 17,573,720 |
| Liberty Property Trust (SBI) | | 251,300 | 7,368,116 |
| Vornado Realty Trust | | 39,783 | 3,519,204 |
| | | | 52,931,797 |
| REITs - Health Care - 10.5% | | | |
| HCP, Inc. | | 219,295 | 7,881,462 |
| Healthcare Realty Trust, Inc. | | 803,900 | 23,345,256 |
| Healthcare Trust of America, Inc. | | 109,800 | 3,078,792 |
| Sabra Health Care REIT, Inc. | | 386,800 | 7,101,648 |
| Ventas, Inc. | | 806,605 | 44,621,389 |
| Welltower, Inc. | | 128,369 | 7,987,119 |
| | | | 94,015,666 |
| REITs - Hotels - 4.7% | | | |
| Ashford Hospitality Prime, Inc. | | 282,400 | 3,103,576 |
| Chesapeake Lodging Trust | | 138,200 | 3,471,584 |
| FelCor Lodging Trust, Inc. | | 2,127,989 | 14,810,803 |
| Host Hotels & Resorts, Inc. | | 1,341,534 | 18,580,246 |
| Pebblebrook Hotel Trust | | 77,800 | 1,899,876 |
| | | | 41,866,085 |
| REITs - Management/Investment - 2.5% | | | |
| Coresite Realty Corp. | | 71,500 | 4,586,010 |
| Empire State Realty Trust, Inc. | | 1,082,600 | 17,917,030 |
| | | | 22,503,040 |
| REITs - Manufactured Homes - 2.4% | | | |
| Equity Lifestyle Properties, Inc. | | 50,600 | 3,335,552 |
| Sun Communities, Inc. | | 274,922 | 18,307,056 |
| | | | 21,642,608 |
| REITs - Office Property - 13.0% | | | |
| Alexandria Real Estate Equities, Inc. | | 111,633 | 8,839,101 |
| Boston Properties, Inc. | | 421,247 | 48,953,114 |
| Mack-Cali Realty Corp. | | 1,334,700 | 27,748,413 |
| New York (REIT), Inc. | | 230,100 | 2,365,428 |
| Parkway Properties, Inc. | | 864,900 | 11,650,203 |
| SL Green Realty Corp. | | 179,965 | 17,386,419 |
| | | | 116,942,678 |
| REITs - Regional Malls - 16.1% | | | |
| General Growth Properties, Inc. | | 558,900 | 15,671,556 |
| Simon Property Group, Inc. | | 565,450 | 105,332,025 |
| Taubman Centers, Inc. | | 123,400 | 8,766,336 |
| The Macerich Co. | | 190,200 | 14,829,894 |
| | | | 144,599,811 |
| REITs - Shopping Centers - 9.4% | | | |
| Cedar Shopping Centers, Inc. | | 1,355,043 | 9,566,604 |
| Federal Realty Investment Trust (SBI) | | 207,502 | 31,297,527 |
| Inland Real Estate Corp. | | 239,872 | 2,569,029 |
| Kite Realty Group Trust | | 246,332 | 6,527,798 |
| Ramco-Gershenson Properties Trust (SBI) | | 408,022 | 6,973,096 |
| Urban Edge Properties | | 1,139,241 | 27,683,556 |
| | | | 84,617,610 |
| REITs - Storage - 10.0% | | | |
| Extra Space Storage, Inc. | | 465,400 | 42,207,126 |
| Public Storage | | 189,450 | 48,036,942 |
| | | | 90,244,068 |
| REITs - Warehouse/Industrial - 4.6% | | | |
| DCT Industrial Trust, Inc. | | 731,450 | 26,178,596 |
| Prologis, Inc. | | 243,277 | 9,602,143 |
| Terreno Realty Corp. | | 255,600 | 5,745,888 |
| | | | 41,526,627 |
|
| TOTAL REAL ESTATE INVESTMENT TRUSTS | | | 874,295,316 |
|
| TOTAL COMMON STOCKS | | | |
| (Cost $711,166,781) | | | 881,725,648 |
|
| Money Market Funds - 2.1% | | | |
| Fidelity Cash Central Fund, 0.38% (b) | | | |
| (Cost $18,940,881) | | 18,940,881 | 18,940,881 |
| TOTAL INVESTMENT PORTFOLIO - 100.3% | | | |
| (Cost $730,107,662) | | | 900,666,529 |
| NET OTHER ASSETS (LIABILITIES) - (0.3)% | | | (2,301,653) |
| NET ASSETS - 100% | | | $898,364,876 |
Legend
(a) Non-income producing
(b) Affiliated fund that is generally available only to investment companies and other accounts managed by Fidelity Investments. The rate quoted is the annualized seven-day yield of the fund at period end. A complete unaudited listing of the fund's holdings as of its most recent quarter end is available upon request. In addition, each Fidelity Central Fund's financial statements are available on the SEC's website or upon request.
Affiliated Central Funds
Information regarding fiscal year to date income earned by the Fund from investments in Fidelity Central Funds is as follows:
| Fund | Income earned |
| Fidelity Cash Central Fund | $21,011 |
| Fidelity Securities Lending Cash Central Fund | 80 |
| Total | $21,091 |
Investment Valuation
All investments are categorized as Level 1 under the Fair Value Hierarchy. The inputs or methodology used for valuing securities may not be an indication of the risk associated with investing in those securities. For more information on valuation inputs please refer to the Investment Valuation section in the accompanying Notes to Financial Statements.
See accompanying notes which are an integral part of the financial statements.
Financial Statements
Statement of Assets and Liabilities
| | | January 31, 2016 (Unaudited) |
| Assets | | |
Investment in securities, at value — See accompanying schedule:
Unaffiliated issuers (cost $711,166,781) | $881,725,648 | |
| Fidelity Central Funds (cost $18,940,881) | 18,940,881 | |
| Total Investments (cost $730,107,662) | | $900,666,529 |
| Receivable for investments sold | | 6,317,780 |
| Receivable for fund shares sold | | 2,955,545 |
| Dividends receivable | | 316,831 |
| Distributions receivable from Fidelity Central Funds | | 6,684 |
| Prepaid expenses | | 3,758 |
| Other receivables | | 39,783 |
| Total assets | | 910,306,910 |
| Liabilities | | |
| Payable for investments purchased | $7,869,476 | |
| Payable for fund shares redeemed | 3,180,320 | |
| Accrued management fee | 415,517 | |
| Distribution and service plan fees payable | 200,449 | |
| Other affiliated payables | 207,262 | |
| Other payables and accrued expenses | 69,010 | |
| Total liabilities | | 11,942,034 |
| Net Assets | | $898,364,876 |
| Net Assets consist of: | | |
| Paid in capital | | $734,739,233 |
| Undistributed net investment income | | 91,271 |
| Accumulated undistributed net realized gain (loss) on investments | | (7,024,495) |
| Net unrealized appreciation (depreciation) on investments | | 170,558,867 |
| Net Assets | | $898,364,876 |
| Calculation of Maximum Offering Price | | |
| Class A: | | |
| Net Asset Value and redemption price per share ($313,528,962 ÷ 14,375,811 shares) | | $21.81 |
| Maximum offering price per share (100/94.25 of $21.81) | | $23.14 |
| Class T: | | |
| Net Asset Value and redemption price per share ($166,908,911 ÷ 7,657,536 shares) | | $21.80 |
| Maximum offering price per share (100/96.50 of $21.80) | | $22.59 |
| Class B: | | |
| Net Asset Value and offering price per share ($2,923,020 ÷ 135,933 shares)(a) | | $21.50 |
| Class C: | | |
| Net Asset Value and offering price per share ($73,331,365 ÷ 3,423,257 shares)(a) | | $21.42 |
| Class I: | | |
| Net Asset Value, offering price and redemption price per share ($341,672,618 ÷ 15,537,276 shares) | | $21.99 |
(a) Redemption price per share is equal to net asset value less any applicable contingent deferred sales charge.
See accompanying notes which are an integral part of the financial statements.
Statement of Operations
| | | Six months ended January 31, 2016 (Unaudited) |
| Investment Income | | |
| Dividends | | $12,791,014 |
| Income from Fidelity Central Funds | | 21,091 |
| Total income | | 12,812,105 |
| Expenses | | |
| Management fee | $2,494,357 | |
| Transfer agent fees | 1,083,454 | |
| Distribution and service plan fees | 1,213,856 | |
| Accounting and security lending fees | 153,505 | |
| Custodian fees and expenses | 17,777 | |
| Independent trustees' compensation | 8,384 | |
| Registration fees | 68,532 | |
| Audit | 24,856 | |
| Legal | 4,599 | |
| Miscellaneous | 4,628 | |
| Total expenses before reductions | 5,073,948 | |
| Expense reductions | (34,745) | 5,039,203 |
| Net investment income (loss) | | 7,772,902 |
| Realized and Unrealized Gain (Loss) | | |
| Net realized gain (loss) on: | | |
| Investment securities: | | |
| Unaffiliated issuers | (3,046,757) | |
| Total net realized gain (loss) | | (3,046,757) |
| Change in net unrealized appreciation (depreciation) on investment securities | | (14,401,840) |
| Net gain (loss) | | (17,448,597) |
| Net increase (decrease) in net assets resulting from operations | | $(9,675,695) |
See accompanying notes which are an integral part of the financial statements.
Statement of Changes in Net Assets
| | Six months ended January 31, 2016 (Unaudited) | Year ended July 31, 2015 |
| Increase (Decrease) in Net Assets | | |
| Operations | | |
| Net investment income (loss) | $7,772,902 | $11,937,523 |
| Net realized gain (loss) | (3,046,757) | 43,067,889 |
| Change in net unrealized appreciation (depreciation) | (14,401,840) | 17,845,717 |
| Net increase (decrease) in net assets resulting from operations | (9,675,695) | 72,851,129 |
| Distributions to shareholders from net investment income | (10,122,918) | (11,243,675) |
| Distributions to shareholders from net realized gain | (23,588,298) | (53,617,748) |
| Total distributions | (33,711,216) | (64,861,423) |
| Share transactions - net increase (decrease) | 13,467,020 | 137,991,224 |
| Total increase (decrease) in net assets | (29,919,891) | 145,980,930 |
| Net Assets | | |
| Beginning of period | 928,284,767 | 782,303,837 |
| End of period (including undistributed net investment income of $91,271 and undistributed net investment income of $2,441,287, respectively) | $898,364,876 | $928,284,767 |
See accompanying notes which are an integral part of the financial statements.
Financial Highlights — Fidelity Advisor Real Estate Fund Class A
| | Six months ended (Unaudited) | Years ended July 31, | | | | |
| January 31, | 2016 | 2015 | 2014 | 2013 | 2012 | 2011 |
| Selected Per–Share Data | | | | | | |
| Net asset value, beginning of period | $22.90 | $22.57 | $20.92 | $19.83 | $18.24 | $14.88 |
| Income from Investment Operations | | | | | | |
| Net investment income (loss)A | .19 | .30 | .31 | .22 | .17 | .12 |
| Net realized and unrealized gain (loss) | (.43) | 1.82 | 2.13 | 1.27 | 2.02 | 3.37 |
| Total from investment operations | (.24) | 2.12 | 2.44 | 1.49 | 2.19 | 3.49 |
| Distributions from net investment income | (.25) | (.30) | (.27) | (.23) | (.13) | (.13) |
| Distributions from net realized gain | (.59) | (1.49) | (.52) | (.17) | (.47) | – |
| Total distributions | (.85)B | (1.79) | (.79) | (.40) | (.60) | (.13) |
| Net asset value, end of period | $21.81 | $22.90 | $22.57 | $20.92 | $19.83 | $18.24 |
| Total ReturnC,D,E | (.91)% | 9.70% | 12.34% | 7.66% | 12.81% | 23.63% |
| Ratios to Average Net AssetsF,G | | | | | | |
| Expenses before reductions | 1.10%H | 1.10% | 1.16% | 1.17% | 1.19% | 1.19% |
| Expenses net of fee waivers, if any | 1.10%H | 1.10% | 1.16% | 1.17% | 1.19% | 1.19% |
| Expenses net of all reductions | 1.09%H | 1.09% | 1.15% | 1.16% | 1.18% | 1.18% |
| Net investment income (loss) | 1.73%H | 1.32% | 1.47% | 1.06% | .98% | .69% |
| Supplemental Data | | | | | | |
| Net assets, end of period (000 omitted) | $313,529 | $327,489 | $274,136 | $246,323 | $199,303 | $178,978 |
| Portfolio turnover rateI | 69%H | 57% | 83% | 63% | 48% | 63% |
A Calculated based on average shares outstanding during the period.
B Total distributions of $.85 per share is comprised of distributions from net investment income of $.251 and distributions from net realized gain of $.594 per share.
C Total returns for periods of less than one year are not annualized.
D Total returns would have been lower if certain expenses had not been reduced during the applicable periods shown.
E Total returns do not include the effect of the sales charges.
F Fees and expenses of any underlying Fidelity Central Funds are not included in the Fund's expense ratio. The Fund indirectly bears its proportionate share of the expenses of any underlying Fidelity Central Funds.
G Expense ratios reflect operating expenses of the class. Expenses before reductions do not reflect amounts reimbursed by the investment adviser or reductions from brokerage service arrangements or reductions from other expense offset arrangements and do not represent the amount paid by the class during periods when reimbursements or reductions occur. Expenses net of fee waivers reflect expenses after reimbursement by the investment adviser but prior to reductions from brokerage service arrangements or other expense offset arrangements. Expenses net of all reductions represent the net expenses paid by the class.
H Annualized
I Amount does not include the portfolio activity of any underlying Fidelity Central Funds.
See accompanying notes which are an integral part of the financial statements.
Financial Highlights — Fidelity Advisor Real Estate Fund Class T
| | Six months ended (Unaudited) | Years ended July 31, | | | | |
| January 31, | 2016 | 2015 | 2014 | 2013 | 2012 | 2011 |
| Selected Per–Share Data | | | | | | |
| Net asset value, beginning of period | $22.88 | $22.55 | $20.91 | $19.82 | $18.24 | $14.90 |
| Income from Investment Operations | | | | | | |
| Net investment income (loss)A | .17 | .25 | .26 | .17 | .13 | .07 |
| Net realized and unrealized gain (loss) | (.44) | 1.82 | 2.13 | 1.28 | 2.02 | 3.38 |
| Total from investment operations | (.27) | 2.07 | 2.39 | 1.45 | 2.15 | 3.45 |
| Distributions from net investment income | (.22) | (.25) | (.23) | (.19) | (.10) | (.11) |
| Distributions from net realized gain | (.59) | (1.49) | (.52) | (.17) | (.47) | – |
| Total distributions | (.81) | (1.74) | (.75) | (.36) | (.57) | (.11) |
| Net asset value, end of period | $21.80 | $22.88 | $22.55 | $20.91 | $19.82 | $18.24 |
| Total ReturnB,C,D | (1.01)% | 9.46% | 12.07% | 7.43% | 12.52% | 23.28% |
| Ratios to Average Net AssetsE,F | | | | | | |
| Expenses before reductions | 1.33%G | 1.34% | 1.37% | 1.38% | 1.43% | 1.44% |
| Expenses net of fee waivers, if any | 1.33%G | 1.34% | 1.37% | 1.38% | 1.43% | 1.44% |
| Expenses net of all reductions | 1.33%G | 1.33% | 1.36% | 1.38% | 1.43% | 1.44% |
| Net investment income (loss) | 1.49%G | 1.09% | 1.26% | .85% | .73% | .43% |
| Supplemental Data | | | | | | |
| Net assets, end of period (000 omitted) | $166,909 | $168,375 | $138,783 | $114,717 | $86,987 | $76,785 |
| Portfolio turnover rateH | 69%G | 57% | 83% | 63% | 48% | 63% |
A Calculated based on average shares outstanding during the period.
B Total returns for periods of less than one year are not annualized.
C Total returns would have been lower if certain expenses had not been reduced during the applicable periods shown.
D Total returns do not include the effect of the sales charges.
E Fees and expenses of any underlying Fidelity Central Funds are not included in the Fund's expense ratio. The Fund indirectly bears its proportionate share of the expenses of any underlying Fidelity Central Funds.
F Expense ratios reflect operating expenses of the class. Expenses before reductions do not reflect amounts reimbursed by the investment adviser or reductions from brokerage service arrangements or reductions from other expense offset arrangements and do not represent the amount paid by the class during periods when reimbursements or reductions occur. Expenses net of fee waivers reflect expenses after reimbursement by the investment adviser but prior to reductions from brokerage service arrangements or other expense offset arrangements. Expenses net of all reductions represent the net expenses paid by the class.
G Annualized
H Amount does not include the portfolio activity of any underlying Fidelity Central Funds.
See accompanying notes which are an integral part of the financial statements.
Financial Highlights — Fidelity Advisor Real Estate Fund Class B
| | Six months ended (Unaudited) | Years ended July 31, | | | | |
| January 31, | 2016 | 2015 | 2014 | 2013 | 2012 | 2011 |
| Selected Per–Share Data | | | | | | |
| Net asset value, beginning of period | $22.56 | $22.28 | $20.66 | $19.59 | $18.05 | $14.77 |
| Income from Investment Operations | | | | | | |
| Net investment income (loss)A | .10 | .11 | .14 | .06 | .04 | (.01) |
| Net realized and unrealized gain (loss) | (.43) | 1.80 | 2.10 | 1.26 | 2.00 | 3.35 |
| Total from investment operations | (.33) | 1.91 | 2.24 | 1.32 | 2.04 | 3.34 |
| Distributions from net investment income | (.13) | (.14) | (.11) | (.08) | (.03) | (.06) |
| Distributions from net realized gain | (.59) | (1.49) | (.52) | (.17) | (.47) | – |
| Total distributions | (.73)B | (1.63) | (.62)C | (.25) | (.50) | (.06) |
| Net asset value, end of period | $21.50 | $22.56 | $22.28 | $20.66 | $19.59 | $18.05 |
| Total ReturnD,E,F | (1.34)% | 8.85% | 11.45% | 6.84% | 11.99% | 22.69% |
| Ratios to Average Net AssetsG,H | | | | | | |
| Expenses before reductions | 1.91%I | 1.92% | 1.92% | 1.92% | 1.93% | 1.94% |
| Expenses net of fee waivers, if any | 1.91%I | 1.92% | 1.92% | 1.92% | 1.93% | 1.94% |
| Expenses net of all reductions | 1.90%I | 1.91% | 1.91% | 1.91% | 1.93% | 1.93% |
| Net investment income (loss) | .92%I | .50% | .70% | .31% | .23% | (.07)% |
| Supplemental Data | | | | | | |
| Net assets, end of period (000 omitted) | $2,923 | $3,829 | $5,631 | $8,697 | $9,481 | $11,542 |
| Portfolio turnover rateJ | 69%I | 57% | 83% | 63% | 48% | 63% |
A Calculated based on average shares outstanding during the period.
B Total distributions of $.73 per share is comprised of distributions from net investment income of $.131 and distributions from net realized gain of $.594 per share.
C Total distributions of $.62 per share is comprised of distributions from net investment income of $.106 and distributions from net realized gain of $.518 per share.
D Total returns for periods of less than one year are not annualized.
E Total returns would have been lower if certain expenses had not been reduced during the applicable periods shown.
F Total returns do not include the effect of the contingent deferred sales charge.
G Fees and expenses of any underlying Fidelity Central Funds are not included in the Fund's expense ratio. The Fund indirectly bears its proportionate share of the expenses of any underlying Fidelity Central Funds.
H Expense ratios reflect operating expenses of the class. Expenses before reductions do not reflect amounts reimbursed by the investment adviser or reductions from brokerage service arrangements or reductions from other expense offset arrangements and do not represent the amount paid by the class during periods when reimbursements or reductions occur. Expenses net of fee waivers reflect expenses after reimbursement by the investment adviser but prior to reductions from brokerage service arrangements or other expense offset arrangements. Expenses net of all reductions represent the net expenses paid by the class.
I Annualized
J Amount does not include the portfolio activity of any underlying Fidelity Central Funds.
See accompanying notes which are an integral part of the financial statements.
Financial Highlights — Fidelity Advisor Real Estate Fund Class C
| | Six months ended (Unaudited) | Years ended July 31, | | | | |
| January 31, | 2016 | 2015 | 2014 | 2013 | 2012 | 2011 |
| Selected Per–Share Data | | | | | | |
| Net asset value, beginning of period | $22.49 | $22.23 | $20.61 | $19.55 | $18.03 | $14.76 |
| Income from Investment Operations | | | | | | |
| Net investment income (loss)A | .10 | .13 | .15 | .07 | .04 | (.01) |
| Net realized and unrealized gain (loss) | (.43) | 1.78 | 2.10 | 1.26 | 1.98 | 3.35 |
| Total from investment operations | (.33) | 1.91 | 2.25 | 1.33 | 2.02 | 3.34 |
| Distributions from net investment income | (.15) | (.16) | (.11) | (.10) | (.03) | (.07) |
| Distributions from net realized gain | (.59) | (1.49) | (.52) | (.17) | (.47) | – |
| Total distributions | (.74) | (1.65) | (.63) | (.27) | (.50) | (.07) |
| Net asset value, end of period | $21.42 | $22.49 | $22.23 | $20.61 | $19.55 | $18.03 |
| Total ReturnB,C,D | (1.30)% | 8.85% | 11.52% | 6.89% | 11.92% | 22.69% |
| Ratios to Average Net AssetsE,F | | | | | | |
| Expenses before reductions | 1.87%G | 1.87% | 1.90% | 1.90% | 1.93% | 1.94% |
| Expenses net of fee waivers, if any | 1.87%G | 1.87% | 1.90% | 1.90% | 1.93% | 1.94% |
| Expenses net of all reductions | 1.86%G | 1.86% | 1.89% | 1.89% | 1.93% | 1.93% |
| Net investment income (loss) | .96%G | .56% | .73% | .33% | .23% | (.07)% |
| Supplemental Data | | | | | | |
| Net assets, end of period (000 omitted) | $73,331 | $79,291 | $64,822 | $75,461 | $55,064 | $47,406 |
| Portfolio turnover rateH | 69%G | 57% | 83% | 63% | 48% | 63% |
A Calculated based on average shares outstanding during the period.
B Total returns for periods of less than one year are not annualized.
C Total returns would have been lower if certain expenses had not been reduced during the applicable periods shown.
D Total returns do not include the effect of the contingent deferred sales charge.
E Fees and expenses of any underlying Fidelity Central Funds are not included in the Fund's expense ratio. The Fund indirectly bears its proportionate share of the expenses of any underlying Fidelity Central Funds.
F Expense ratios reflect operating expenses of the class. Expenses before reductions do not reflect amounts reimbursed by the investment adviser or reductions from brokerage service arrangements or reductions from other expense offset arrangements and do not represent the amount paid by the class during periods when reimbursements or reductions occur. Expenses net of fee waivers reflect expenses after reimbursement by the investment adviser but prior to reductions from brokerage service arrangements or other expense offset arrangements. Expenses net of all reductions represent the net expenses paid by the class.
G Annualized
H Amount does not include the portfolio activity of any underlying Fidelity Central Funds.
See accompanying notes which are an integral part of the financial statements.
Financial Highlights — Fidelity Advisor Real Estate Fund Class I
| | Six months ended (Unaudited) | Years ended July 31, | | | | |
| January 31, | 2016 | 2015 | 2014 | 2013 | 2012 | 2011 |
| Selected Per–Share Data | | | | | | |
| Net asset value, beginning of period | $23.09 | $22.74 | $21.07 | $19.97 | $18.36 | $14.96 |
| Income from Investment Operations | | | | | | |
| Net investment income (loss)A | .22 | .36 | .36 | .28 | .22 | .16 |
| Net realized and unrealized gain (loss) | (.44) | 1.83 | 2.15 | 1.27 | 2.03 | 3.39 |
| Total from investment operations | (.22) | 2.19 | 2.51 | 1.55 | 2.25 | 3.55 |
| Distributions from net investment income | (.28) | (.35) | (.32) | (.28) | (.17) | (.15) |
| Distributions from net realized gain | (.59) | (1.49) | (.52) | (.17) | (.47) | – |
| Total distributions | (.88)B | (1.84) | (.84) | (.45) | (.64) | (.15) |
| Net asset value, end of period | $21.99 | $23.09 | $22.74 | $21.07 | $19.97 | $18.36 |
| Total ReturnC,D | (.80)% | 9.99% | 12.64% | 7.92% | 13.12% | 23.92% |
| Ratios to Average Net AssetsE,F | | | | | | |
| Expenses before reductions | .85%G | .85% | .89% | .90% | .93% | .93% |
| Expenses net of fee waivers, if any | .85%G | .85% | .89% | .90% | .93% | .93% |
| Expenses net of all reductions | .84%G | .84% | .88% | .89% | .93% | .92% |
| Net investment income (loss) | 1.97%G | 1.57% | 1.74% | 1.33% | 1.23% | .94% |
| Supplemental Data | | | | | | |
| Net assets, end of period (000 omitted) | $341,673 | $349,301 | $298,932 | $305,619 | $283,054 | $174,655 |
| Portfolio turnover rateH | 69%G | 57% | 83% | 63% | 48% | 63% |
A Calculated based on average shares outstanding during the period.
B Total distributions of $.88 per share is comprised of distributions from net investment income of $.284 and distributions from net realized gain of $.594 per share.
C Total returns for periods of less than one year are not annualized.
D Total returns would have been lower if certain expenses had not been reduced during the applicable periods shown.
E Fees and expenses of any underlying Fidelity Central Funds are not included in the Fund's expense ratio. The Fund indirectly bears its proportionate share of the expenses of any underlying Fidelity Central Funds.
F Expense ratios reflect operating expenses of the class. Expenses before reductions do not reflect amounts reimbursed by the investment adviser or reductions from brokerage service arrangements or reductions from other expense offset arrangements and do not represent the amount paid by the class during periods when reimbursements or reductions occur. Expenses net of fee waivers reflect expenses after reimbursement by the investment adviser but prior to reductions from brokerage service arrangements or other expense offset arrangements. Expenses net of all reductions represent the net expenses paid by the class.
G Annualized
H Amount does not include the portfolio activity of any underlying Fidelity Central Funds.
See accompanying notes which are an integral part of the financial statements.
Notes to Financial Statements (Unaudited)
For the period ended January 31, 2016
1. Organization.
Fidelity Advisor Real Estate Fund (the Fund) is a non-diversified fund of Fidelity Advisor Series VII (the Trust) and is authorized to issue an unlimited number of shares. The Trust is registered under the Investment Company Act of 1940, as amended (the 1940 Act), as an open-end management investment company organized as a Massachusetts business trust. The Fund offers Class A, Class T, Class C and Class I shares, each of which, along with Class B shares, has equal rights as to assets and voting privileges. Class B shares are closed to new accounts and additional purchases, except for exchanges and reinvestments. Each class has exclusive voting rights with respect to matters that affect that class. Class B shares will automatically convert to Class A shares after a holding period of seven years from the initial date of purchase.
During the period, the Board of Trustees approved the conversion of all existing Class B shares into Class A shares, effective on or about July 1, 2016, regardless of the length of times shares have been held.
2. Investments in Fidelity Central Funds.
The Fund invests in Fidelity Central Funds, which are open-end investment companies generally available only to other investment companies and accounts managed by the investment adviser and its affiliates. The Fund's Schedule of Investments lists each of the Fidelity Central Funds held as of period end, if any, as an investment of the Fund, but does not include the underlying holdings of each Fidelity Central Fund. As an Investing Fund, the Fund indirectly bears its proportionate share of the expenses of the underlying Fidelity Central Funds.
The Money Market Central Funds seek preservation of capital and current income and are managed by Fidelity Investments Money Management, Inc. (FIMM), an affiliate of the investment adviser. Annualized expenses of the Money Market Central Funds as of their most recent shareholder report date are less than .005%.
A complete unaudited list of holdings for each Fidelity Central Fund is available upon request or at the Securities and Exchange Commission (the SEC) website at www.sec.gov. In addition, the financial statements of the Fidelity Central Funds are available on the SEC website or upon request.
3. Significant Accounting Policies.
The financial statements have been prepared in conformity with accounting principles generally accepted in the United States of America (GAAP), which require management to make certain estimates and assumptions at the date of the financial statements. Actual results could differ from those estimates. Subsequent events, if any, through the date that the financial statements were issued have been evaluated in the preparation of the financial statements. The following summarizes the significant accounting policies of the Fund:
Investment Valuation. Investments are valued as of 4:00 p.m. Eastern time on the last calendar day of the period. The Board of Trustees (the Board) has delegated the day to day responsibility for the valuation of the Fund's investments to the Fidelity SelectCo, LLC (SelectCo) Fair Value Committee (the Committee). In accordance with valuation policies and procedures approved by the Board, the Fund attempts to obtain prices from one or more third party pricing vendors or brokers to value its investments. When current market prices, quotations or currency exchange rates are not readily available or reliable, investments will be fair valued in good faith by the Committee, in accordance with procedures adopted by the Board. Factors used in determining fair value vary by investment type and may include market or investment specific events. The frequency with which these procedures are used cannot be predicted and they may be utilized to a significant extent. The Committee oversees the Fund's valuation policies and procedures and reports to the Board on the Committee's activities and fair value determinations. The Board monitors the appropriateness of the procedures used in valuing the Fund's investments and ratifies the fair value determinations of the Committee.
The Fund categorizes the inputs to valuation techniques used to value its investments into a disclosure hierarchy consisting of three levels as shown below:
- Level 1 – quoted prices in active markets for identical investments
- Level 2 – other significant observable inputs (including quoted prices for similar investments, interest rates, prepayment speeds, etc.)
- Level 3 – unobservable inputs (including the Fund's own assumptions based on the best information available)
Valuation techniques used to value the Fund's investments by major category are as follows:
Equity securities, including restricted securities, for which market quotations are readily available, are valued at the last reported sale price or official closing price as reported by a third party pricing vendor on the primary market or exchange on which they are traded and are categorized as Level 1 in the hierarchy. In the event there were no sales during the day or closing prices are not available, securities are valued at the last quoted bid price or may be valued using the last available price and are generally categorized as Level 2 in the hierarchy. For foreign equity securities, when market or security specific events arise, comparisons to the valuation of American Depositary Receipts (ADRs), futures contracts, Exchange-Traded Funds (ETFs) and certain indexes as well as quoted prices for similar securities may be used and would be categorized as Level 2 in the hierarchy. Utilizing these techniques may result in transfers between Level 1 and Level 2. For equity securities, including restricted securities, where observable inputs are limited, assumptions about market activity and risk are used and these securities may be categorized as Level 3 in the hierarchy.
Investments in open-end mutual funds, including the Fidelity Central Funds, are valued at their closing net asset value (NAV) each business day and are categorized as Level 1 in the hierarchy.
Changes in valuation techniques may result in transfers in or out of an assigned level within the disclosure hierarchy.
Investment Transactions and Income. For financial reporting purposes, the Fund's investment holdings and NAV include trades executed through the end of the last business day of the period. The NAV per share for processing shareholder transactions is calculated as of the close of business of the New York Stock Exchange (NYSE), normally 4:00 p.m. Eastern time and includes trades executed through the end of the prior business day. Gains and losses on securities sold are determined on the basis of identified cost. Dividend income is recorded on the ex-dividend date, except for certain dividends from foreign securities where the ex-dividend date may have passed, which are recorded as soon as the Fund is informed of the ex-dividend date. Non-cash dividends included in dividend income, if any, are recorded at the fair market value of the securities received. Income and capital gain distributions from Fidelity Central Funds, if any, are recorded on the ex-dividend date. Distributions received on securities that represent a return of capital or capital gain are recorded as a reduction of cost of investments and/or as a realized gain. Subsequent to ex-dividend date the Fund determines the components of these distributions, based upon receipt of tax filings or other correspondence relating to the underlying investment.
Class Allocations and Expenses. Investment income, realized and unrealized capital gains and losses, common expenses of the Fund, and certain fund-level expense reductions, if any, are allocated daily on a pro-rata basis to each class based on the relative net assets of each class to the total net assets of the Fund. Each class differs with respect to transfer agent and distribution and service plan fees incurred. Certain expense reductions may also differ by class. For the reporting period, the allocated portion of income and expenses to each class as a percent of its average net assets may vary due to the timing of recording these transactions in relation to fluctuating net assets of the classes. Expenses directly attributable to a fund are charged to that fund. Expenses attributable to more than one fund are allocated among the respective funds on the basis of relative net assets or other appropriate methods. Expense estimates are accrued in the period to which they relate and adjustments are made when actual amounts are known.
Deferred Trustee Compensation. Under a Deferred Compensation Plan (the Plan), independent Trustees may elect to defer receipt of a portion of their annual compensation. Deferred amounts are invested in a cross-section of Fidelity funds, are marked-to-market and remain in the Fund until distributed in accordance with the Plan. The investment of deferred amounts and the offsetting payable to the Trustees are included in the accompanying Statement of Assets and Liabilities.
Income Tax Information and Distributions to Shareholders. Each year, the Fund intends to qualify as a regulated investment company under Subchapter M of the Internal Revenue Code, including distributing substantially all of its taxable income and realized gains. As a result, no provision for U.S. Federal income taxes is required. The Fund files a U.S. federal tax return, in addition to state and local tax returns as required. The Fund's federal income tax returns are subject to examination by the Internal Revenue Service (IRS) for a period of three fiscal years after they are filed. State and local tax returns may be subject to examination for an additional fiscal year depending on the jurisdiction.
Distributions are declared and recorded on the ex-dividend date. Income dividends and capital gain distributions are declared separately for each class. Income and capital gain distributions are determined in accordance with income tax regulations, which may differ from GAAP.
Capital accounts within the financial statements are adjusted for permanent book-tax differences. These adjustments have no impact on net assets or the results of operations. Capital accounts are not adjusted for temporary book-tax differences which will reverse in a subsequent period.
Book-tax differences are primarily due to deferred trustees compensation and losses deferred due to wash sales.
The federal tax cost of investment securities and unrealized appreciation (depreciation) as of period end were as follows:
| Gross unrealized appreciation | $196,631,215 |
| Gross unrealized depreciation | (30,625,096) |
| Net unrealized appreciation (depreciation) on securities | $166,006,119 |
| Tax cost | $734,660,410 |
4. Purchases and Sales of Investments.
Purchases and sales of securities, other than short-term securities, aggregated $305,912,352 and $327,422,011, respectively.
5. Fees and Other Transactions with Affiliates.
Management Fee. Fidelity SelectCo, LLC (the investment adviser) and its affiliates provide the Fund with investment management related services for which the Fund pays a monthly management fee. The management fee is the sum of an individual fund fee rate that is based on an annual rate of .30% of the Fund's average net assets and an annualized group fee rate that averaged .25% during the period. The group fee rate is based upon the average net assets of all the mutual funds advised by Fidelity Management & Research Company (FMR) and the investment adviser. The group fee rate decreases as assets under management increase and increases as assets under management decrease. For the reporting period, the total annualized management fee rate was .55% of the Fund's average net assets.
Distribution and Service Plan Fees. In accordance with Rule 12b-1 of the 1940 Act, the Fund has adopted separate Distribution and Service Plans for each class of shares. Certain classes pay Fidelity Distributors Corporation (FDC), an affiliate of the investment adviser, separate Distribution and Service Fees, each of which is based on an annual percentage of each class' average net assets. In addition, FDC may pay financial intermediaries for selling shares of the Fund and providing shareholder support services. For the period, the Distribution and Service Fee rates, total fees and amounts retained by FDC were as follows:
| | Distribution
Fee | Service
Fee | Total Fees | Retained
by FDC |
| Class A | -% | .25% | $399,714 | $- |
| Class T | .25% | .25% | 420,274 | - |
| Class B | .75% | .25% | 16,903 | 12,677 |
| Class C | .75% | .25% | 376,965 | 67,164 |
| | | | $1,213,856 | $79,841 |
Sales Load. FDC may receive a front-end sales charge of up to 5.75% for selling Class A shares and 3.50% for selling Class T shares, some of which is paid to financial intermediaries for selling shares of the Fund. Depending on the holding period, FDC may receive contingent deferred sales charges levied on Class A, Class T, Class B, and Class C redemptions. The deferred sales charges range from 5.00% to 1.00% for Class B shares, 1.00% for Class C shares, 1.00% for certain purchases of Class A shares and .25% for certain purchases of Class T shares.
For the period, sales charge amounts retained by FDC were as follows:
| | Retained
by FDC |
| Class A | $26,339 |
| Class T | 4,186 |
| Class B* | 238 |
| Class C* | 6,670 |
| | $37,433 |
* When Class B and Class C shares are initially sold, FDC pays commissions from its own resources to financial intermediaries through which the sales are made.
Transfer Agent Fees. Fidelity Investments Institutional Operations Company, Inc., (FIIOC), an affiliate of the investment adviser, is the transfer, dividend disbursing and shareholder servicing agent for each class of the Fund. FIIOC receives account fees and asset-based fees that vary according to the account size and type of account of the shareholders of the respective classes of the Fund. FIIOC pays for typesetting, printing and mailing of shareholder reports, except proxy statements.
For the period, transfer agent fees for each class were as follows:
| | Amount | % of
Class-Level Average
Net Assets(a) |
| Class A | $380,977 | .24 |
| Class T | 187,940 | .22 |
| Class B | 5,038 | .30 |
| Class C | 96,863 | .26 |
| Class I | 412,636 | .24 |
| | $1,083,454 | |
(a) Annualized
Accounting and Security Lending Fees. Fidelity Service Company, Inc. (FSC), an affiliate of the investment adviser, maintains the Fund's accounting records. The accounting fee is based on the level of average net assets for each month. Under a separate contract, FSC administers the security lending program. The security lending fee is based on the number and duration of lending transactions.
Brokerage Commissions. The Fund placed a portion of its portfolio transactions with brokerage firms which are affiliates of the investment adviser. Brokerage commissions are included in net realized gain (loss) and change in net unrealized appreciation (depreciation) in the Statement of Operations. The commissions paid to these affiliated firms were $1,564 for the period.
Interfund Trades. The Fund may purchase from or sell securities to other Fidelity Funds under procedures adopted by the Board. The procedures have been designed to ensure these interfund trades are executed in accordance with Rule 17a-7 of the 1940 Act. Interfund trades are included within the respective purchases and sales amounts shown in the Purchases and Sales of Investments note.
6. Committed Line of Credit.
The Fund participates with other funds managed by the investment adviser or an affiliate in a $4.25 billion credit facility (the "line of credit") to be utilized for temporary or emergency purposes to fund shareholder redemptions or for other short-term liquidity purposes. The Fund has agreed to pay commitment fees on its pro-rata portion of the line of credit, which amounted to $608 and is reflected in Miscellaneous expenses on the Statement of Operations. During the period, the Fund did not borrow on this line of credit.
7. Security Lending.
The Fund lends portfolio securities through a lending agent from time to time in order to earn additional income. On the settlement date of the loan, the Fund receives collateral (in the form of U.S. Treasury obligations, letters of credit and/or cash) against the loaned securities and maintains collateral in an amount not less than 100% of the market value of the loaned securities during the period of the loan. The market value of the loaned securities is determined at the close of business of the Fund and any additional required collateral is delivered to the Fund on the next business day. The Fund or borrower may terminate the loan at any time, and if the borrower defaults on its obligation to return the securities loaned because of insolvency or other reasons, the Fund may apply collateral received from the borrower against the obligation. The Fund may experience delays and costs in recovering the securities loaned. Any cash collateral received is invested in the Fidelity Securities Lending Cash Central Fund. At period end, there were no security loans outstanding. Security lending income represents the income earned on investing cash collateral, less rebates paid to borrowers and any lending agent fees associated with the loan, plus any premium payments received for lending certain types of securities. Security lending income is presented in the Statement of Operations as a component of income from Fidelity Central Funds. Total security lending income during the period amounted to $80.
8. Expense Reductions.
Commissions paid to certain brokers with whom the investment adviser, or its affiliates, places trades on behalf of the Fund include an amount in addition to trade execution, which may be rebated back to the Fund to offset certain expenses. This amount totaled $31,403 for the period. In addition, through arrangements with the Fund's custodian, credits realized as a result of certain uninvested cash balances were used to reduce the Fund's expenses. During the period, these credits reduced the Fund's custody expenses by $12.
In addition, during the period the investment adviser reimbursed and/or waived a portion of fund-level operating expenses in the amount of $3,330.
9. Distributions to Shareholders.
Distributions to shareholders of each class were as follows:
| | Six months ended January 31, 2016 | Year ended July 31, 2015 |
| From net investment income | | |
| Class A | $3,601,177 | $4,035,347 |
| Class T | 1,649,988 | 1,622,788 |
| Class B | 19,721 | 34,655 |
| Class C | 516,913 | 511,454 |
| Class I | 4,335,119 | 5,039,431 |
| Total | $10,122,918 | $11,243,675 |
| From net realized gain | | |
| Class A | $8,321,843 | $19,013,153 |
| Class T | 4,346,704 | 9,450,491 |
| Class B | 96,771 | 364,345 |
| Class C | 2,036,085 | 4,547,430 |
| Class I | 8,786,895 | 20,242,329 |
| Total | $23,588,298 | $53,617,748 |
10. Share Transactions.
Share transactions for each class were as follows and may contain automatic conversions between classes or exchanges between affiliated funds:
| | Shares | Shares | Dollars | Dollars |
| | Six months ended January 31, 2016 | Year ended July 31, 2015 | Six months ended January 31, 2016 | Year ended July 31, 2015 |
| Class A | | | | |
| Shares sold | 2,308,311 | 6,477,452 | $51,457,038 | $150,703,408 |
| Reinvestment of distributions | 549,638 | 994,050 | 11,564,581 | 22,291,454 |
| Shares redeemed | (2,784,360) | (5,315,431) | (61,435,193) | (122,321,981) |
| Net increase (decrease) | 73,589 | 2,156,071 | $1,586,426 | $50,672,881 |
| Class T | | | | |
| Shares sold | 962,736 | 2,562,977 | $21,119,964 | $59,571,645 |
| Reinvestment of distributions | 279,758 | 484,775 | 5,877,551 | 10,861,687 |
| Shares redeemed | (944,157) | (1,841,950) | (20,887,252) | (42,022,412) |
| Net increase (decrease) | 298,337 | 1,205,802 | $6,110,263 | $28,410,920 |
| Class B | | | | |
| Shares sold | 574 | 16,002 | $12,750 | $364,459 |
| Reinvestment of distributions | 5,480 | 16,893 | 113,056 | 373,842 |
| Shares redeemed | (39,888) | (115,814) | (867,476) | (2,618,545) |
| Net increase (decrease) | (33,834) | (82,919) | $(741,670) | $(1,880,244) |
| Class C | | | | |
| Shares sold | 308,691 | 1,502,434 | $6,723,666 | $34,498,632 |
| Reinvestment of distributions | 114,145 | 210,658 | 2,351,123 | 4,650,868 |
| Shares redeemed | (525,600) | (1,103,640) | (11,356,967) | (24,943,789) |
| Net increase (decrease) | (102,764) | 609,452 | $(2,282,178) | $14,205,711 |
| Class I | | | | |
| Shares sold | 3,105,505 | 6,270,229 | $68,985,951 | $146,901,080 |
| Reinvestment of distributions | 499,887 | 857,158 | 10,614,336 | 19,361,443 |
| Shares redeemed | (3,198,310) | (5,142,590) | (70,806,108) | (119,680,567) |
| Net increase (decrease) | 407,082 | 1,984,797 | $8,794,179 | $46,581,956 |
11. Other.
The Fund's organizational documents provide former and current trustees and officers with a limited indemnification against liabilities arising in connection with the performance of their duties to the Fund. In the normal course of business, the Fund may also enter into contracts that provide general indemnifications. The Fund's maximum exposure under these arrangements is unknown as this would be dependent on future claims that may be made against the Fund. The risk of material loss from such claims is considered remote.
Shareholder Expense Example
As a shareholder of the Fund, you incur two types of costs: (1) transaction costs, including sales charges (loads) on purchase payments or redemption proceeds, and (2) ongoing costs, including management fees, distribution and/or service (12b-1) fees and other Fund expenses. This Example is intended to help you understand your ongoing costs (in dollars) of investing in the Fund and to compare these costs with the ongoing costs of investing in other mutual funds.
The Example is based on an investment of $1,000 invested at the beginning of the period and held for the entire period (August 1, 2015 to January 31, 2016).
Actual Expenses
The first line of the accompanying table for each class of the Fund provides information about actual account values and actual expenses. You may use the information in this line, together with the amount you invested, to estimate the expenses that you paid over the period. Simply divide your account value by $1,000.00 (for example, an $8,600 account value divided by $1,000.00 = 8.6), then multiply the result by the number in the first line for a class of the Fund under the heading entitled "Expenses Paid During Period" to estimate the expenses you paid on your account during this period. In addition, the Fund, as a shareholder in the underlying Fidelity Central Funds, will indirectly bear its pro-rata share of the fees and expenses incurred by the underlying Fidelity Central Funds. These fees and expenses are not included in the Fund's annualized expense ratio used to calculate the expense estimate in the table below.
Hypothetical Example for Comparison Purposes
The second line of the accompanying table for each class of the Fund provides information about hypothetical account values and hypothetical expenses based on a Class' actual expense ratio and an assumed rate of return of 5% per year before expenses, which is not the Class' actual return. The hypothetical account values and expenses may not be used to estimate the actual ending account balance or expenses you paid for the period. You may use this information to compare the ongoing costs of investing in the Fund and other funds. To do so, compare this 5% hypothetical example with the 5% hypothetical examples that appear in the shareholder reports of the other funds. In addition, the Fund, as a shareholder in the underlying Fidelity Central Funds, will indirectly bear its pro-rata share of the fees and expenses incurred by the underlying Fidelity Central Funds. These fees and expenses are not included in the Fund's annualized expense ratio used to calculate the expense estimate in the table below.
Please note that the expenses shown in the table are meant to highlight your ongoing costs only and do not reflect any transaction costs. Therefore, the second line of the table is useful in comparing ongoing costs only, and will not help you determine the relative total costs of owning different funds. In addition, if these transactional costs were included, your costs would have been higher.
| | Annualized Expense Ratio-A | Beginning
Account Value
August 1, 2015 | Ending
Account Value
January 31, 2016 | Expenses Paid
During Period-B
August 1, 2015
to January 31, 2016 |
| Class A | 1.10% | | | |
| Actual | | $1,000.00 | $990.90 | $5.50 |
| Hypothetical-C | | $1,000.00 | $1,019.61 | $5.58 |
| Class T | 1.33% | | | |
| Actual | | $1,000.00 | $989.90 | $6.65 |
| Hypothetical-C | | $1,000.00 | $1,018.45 | $6.75 |
| Class B | 1.91% | | | |
| Actual | | $1,000.00 | $986.60 | $9.54 |
| Hypothetical-C | | $1,000.00 | $1,015.53 | $9.68 |
| Class C | 1.87% | | | |
| Actual | | $1,000.00 | $987.00 | $9.34 |
| Hypothetical-C | | $1,000.00 | $1,015.74 | $9.48 |
| Class I | .85% | | | |
| Actual | | $1,000.00 | $992.00 | $4.26 |
| Hypothetical-C | | $1,000.00 | $1,020.86 | $4.32 |
A Annualized expense ratio reflects expenses net of applicable fee waivers.
B Expenses are equal to each Class' annualized expense ratio, multiplied by the average account value over the period, multiplied by 184/366 (to reflect the one-half year period).
C 5% return per year before expenses
Board Approval of Investment Advisory Contracts and Management Fees
Fidelity Advisor Real Estate Fund
Each year, the Board of Trustees, including the Independent Trustees (together, the Board), votes on the renewal of the management contract with Fidelity SelectCo, LLC (SelectCo), an affiliate of Fidelity Management & Research Company (FMR), and the sub-advisory agreements with affiliates of FMR (together, the Advisory Contracts) for the fund. The Board, assisted by the advice of fund counsel and Independent Trustees' counsel, requests and considers a broad range of information relevant to the renewal of the Advisory Contracts throughout the year.
The Board meets regularly and, at each of its meetings, covers an extensive agenda of topics and materials and considers factors that are relevant to its annual consideration of the renewal of the fund's Advisory Contracts, including the services and support provided to the fund and its shareholders. The Board has established four standing committees (Committees) — Operations, Audit, Fair Valuation, and Governance and Nominating — each composed of and chaired by Independent Trustees with varying backgrounds, to which the Board has assigned specific subject matter responsibilities in order to enhance effective decision-making by the Board. The Operations Committee, of which all of the Independent Trustees are members, meets regularly throughout the year and considers, among other matters, information specifically related to the annual consideration of the renewal of the fund's Advisory Contracts. The Board, acting directly and through its Committees, requests and receives information concerning the annual consideration of the renewal of the fund's Advisory Contracts. The Board also meets as needed to consider matters specifically related to the Board's annual consideration of the renewal of the Advisory Contracts. Members of the Board may also meet with trustees of other Fidelity funds through ad hoc joint committees to discuss certain matters relevant to all of the Fidelity funds.
At its January 2016 meeting, the Board unanimously determined to renew the fund's Advisory Contracts. In reaching its determination, the Board considered all factors it believed relevant, including (i) the nature, extent, and quality of the services to be provided to the fund and its shareholders (including the investment performance of the fund); (ii) the competitiveness of the fund's management fee and total expense ratio relative to peer funds; (iii) the total costs of the services to be provided by and the profits to be realized by Fidelity from its relationships with the fund; and (iv) the extent to which, if any, economies of scale exist and would be realized as the fund grows, and whether any economies of scale are appropriately shared with fund shareholders.
In considering whether to renew the Advisory Contracts for the fund, the Board reached a determination, with the assistance of fund counsel and Independent Trustees' counsel and through the exercise of its business judgment, that the renewal of the Advisory Contracts was in the best interests of the fund and its shareholders and that the compensation payable under the Advisory Contracts was fair and reasonable. The Board's decision to renew the Advisory Contracts was not based on any single factor, but rather was based on a comprehensive consideration of all the information provided to the Board at its meetings throughout the year. The Board, in reaching its determination to renew the Advisory Contracts, was aware that shareholders of the fund have a broad range of investment choices available to them, including a wide choice among funds offered by Fidelity's competitors, and that the fund's shareholders, who have the opportunity to review and weigh the disclosure provided by the fund in its prospectus and other public disclosures, have chosen to invest in this fund, which is part of the Fidelity family of funds.
Nature, Extent, and Quality of Services Provided. The Board considered the staffing of SelectCo and the sub-advisers (together with SelectCo, the Investment Advisers) as it relates to the fund, including the backgrounds of investment personnel of SelectCo, and also considered the fund's investment objectives, strategies, and related investment philosophies. The Independent Trustees also had discussions with senior management of Fidelity's investment operations and investment groups. The Board considered the structure of the investment personnel compensation program and whether this structure provides appropriate incentives to act in the best interests of the fund. Additionally, the Board considered the portfolio managers' investments, if any, in the funds that they manage.
Resources Dedicated to Investment Management and Support Services. The Board reviewed the general qualifications and capabilities of the investment staff of the Investment Advisers, including their size, education, experience, and resources, as well as Fidelity's approach to recruiting, training, managing, and compensating investment personnel. The Board noted that Fidelity has continued to increase the resources devoted to non-U.S. offices, including expansion of Fidelity's global investment organization. The Board also noted that Fidelity's analysts have extensive resources, tools and capabilities that allow them to conduct sophisticated quantitative and fundamental analysis, as well as credit analysis of issuers, counterparties and guarantors. Further, the Board considered that Fidelity's investment professionals have sufficient access to global information and data so as to provide competitive investment results over time, and that those professionals also have access to sophisticated tools that permit them to assess portfolio construction and risk and performance attribution characteristics continuously, as well as to transmit new information and research conclusions rapidly around the world. Additionally, in its deliberations, the Board considered Fidelity's trading, risk management, compliance, and technology and operations capabilities and resources, which are integral parts of the investment management process.
Shareholder and Administrative Services. The Board considered (i) the nature, extent, quality, and cost of advisory, administrative, and shareholder services performed by the Investment Advisers and their affiliates under the Advisory Contracts and under separate agreements covering transfer agency, pricing and bookkeeping, and securities lending services for the fund; (ii) the nature and extent of the supervision of third party service providers, principally custodians, subcustodians, and pricing vendors; and (iii) the resources devoted to, and the record of compliance with, the fund's compliance policies and procedures. The Board also reviewed the allocation of fund brokerage, including allocations to brokers affiliated with the Investment Advisers, the use of brokerage commissions to pay fund expenses, and the use of "soft" commission dollars to pay for research services.
The Board noted that the growth of fund assets over time across the complex allows Fidelity to reinvest in the development of services designed to enhance the value or convenience of the Fidelity funds as investment vehicles. These services include 24-hour access to account information and market information through telephone representatives and over the Internet, investor education materials and asset allocation tools, and the expanded availability of Fidelity Investor Centers.
The Board noted that in 2014 the ad hoc Committee on Transfer Agency Fees was formed by it and the boards of certain other Fidelity funds to review the variety of transfer agency services and fee structures throughout the mutual fund industry compared to Fidelity's.
Investment in a Large Fund Family. The Board considered the benefits to shareholders of investing in a Fidelity fund, including the benefits of investing in a fund that is part of a large family of funds offering a variety of investment disciplines and providing a large variety of mutual fund investor services. The Board noted that Fidelity had taken, or had made recommendations that resulted in the Fidelity funds taking, a number of actions over the previous year that benefited particular funds, including (i) continuing to dedicate additional resources to investment research and to the support of the senior management team that oversees asset management; (ii) continuing efforts to enhance Fidelity's global research capabilities; (iii) launching new funds and making other enhancements to meet client needs; (iv) reducing management fees and total expenses for certain index funds; (v) continuing to launch dedicated lower cost underlying funds to meet portfolio construction needs related to expanding underlying fund options for Fidelity funds of funds, specifically for the Freedom Fund product lines; (vi) rationalizing product lines and gaining increased efficiencies through fund mergers; (vii) continuing to develop, acquire and implement systems and technology to improve services to the funds and shareholders, strengthen information security, and increase efficiency; (viii) implementing investment enhancements to further strengthen Fidelity's target date product line to increase investors' probability of success in achieving their goals; (ix) modifying the eligibility criteria for certain share classes to accommodate roll-over assets from employer-sponsored retirement plans; (x) launching a new Class W of the Freedom Index Funds to attract and retain Fidelity record-kept retirement plan assets; and (xi) implementing changes to Fidelity's money market fund product line in response to recent regulatory reforms.
Investment Performance. The Board considered whether the fund has operated in accordance with its investment objective, as well as its record of compliance with its investment restrictions and its performance history.
The Board took into account discussions with representatives of the Investment Advisers about fund investment performance that occur at Board meetings throughout the year. In this regard the Board noted that as part of regularly scheduled fund reviews and other reports to the Board on fund performance, the Board considers annualized return information for the fund, for different time periods, measured against a securities market index ("benchmark index"). In its evaluation of fund investment performance at meetings throughout the year, the Board gave particular attention to information indicating underperformance of certain Fidelity funds for specific time periods and discussed with the Investment Advisers the reasons for such underperformance. The fund underperformed its benchmark for the one-, three-, and five-year periods ended June 30, 2015, and as a result, the Board will continue to discuss with SelectCo the steps it is taking to address the fund's performance.
In addition to reviewing absolute and relative fund performance, the Independent Trustees periodically consider the appropriateness of fund performance metrics in evaluating the results achieved. In general, the Independent Trustees believe that fund performance should be evaluated based on net performance (after fees and expenses) of both the highest performing and lowest performing fund share classes, where applicable, compared to appropriate benchmark indices, over appropriate time periods that may include full market cycles, taking into account relevant factors, including the following: general market conditions; issuer-specific information; and fund cash flows and other factors. Depending on the circumstances, the Independent Trustees may be satisfied with a fund's performance notwithstanding that it lags its benchmark index for certain periods.
The Independent Trustees recognize that shareholders evaluate performance on a net basis over their own holding periods, for which one-, three-, and five-year periods are often used as a proxy. For this reason, the performance information reviewed by the Board also included net cumulative total return information for the fund and an appropriate benchmark index for the most recent one-, three-, and five-year periods ended June 30, 2015.
Based on its review, the Board concluded that the nature, extent, and quality of services provided to the fund under the Advisory Contracts should benefit the shareholders of the fund.
Competitiveness of Management Fee and Total Expense Ratio. The Board considered the fund's management fee and total expense ratio compared to "mapped groups" of competitive funds and classes created for the purpose of facilitating the Trustees' analysis of the competitiveness of management fees and total expenses. Fidelity creates "mapped groups" by combining similar Lipper investment objective categories that have comparable investment mandates. For this purpose, all sector focused equity funds are grouped in the same mapped group. Combining Lipper investment objective categories aids the Board's management fee and total expense ratio comparisons by broadening the competitive group used for comparison.
Management Fee. The Board considered two proprietary management fee comparisons for the 12-month periods ended June 30 shown in basis points (BP) in the chart below. The group of Lipper funds used by the Board for management fee comparisons is referred to below as the "Total Mapped Group." The Total Mapped Group comparison focuses on a fund's standing in terms of gross management fees before expense reimbursements or caps relative to the total universe of funds with comparable investment mandates (
i.e., sector equities), regardless of whether their management fee structures also are comparable. Funds with comparable management fee structures have similar management fee contractual arrangements (
e.g., flat rate charged for advisory services, all-inclusive fee rate,
etc.). "TMG %" represents the percentage of funds in the Total Mapped Group that had management fees that were lower than the fund's. For example, a hypothetical TMG % of 20% would mean that 80% of the funds in the Total Mapped Group had higher, and 20% had lower, management fees than the fund. The fund's actual TMG %s and the number of funds in the Total Mapped Group are in the chart below. The "Asset-Size Peer Group" (ASPG) comparison focuses on a fund's standing relative to a subset of non-Fidelity funds within the Total Mapped Group that are similar in size and management fee structure. For example, if a fund is in the first quartile of the ASPG, the fund's management fee ranks in the least expensive or lowest 25% of funds in the ASPG. The ASPG represents at least 15% of the funds in the Total Mapped Group with comparable asset size and management fee structures, subject to a minimum of 50 funds (or all funds in the Total Mapped Group if fewer than 50). Additional information, such as the ASPG quartile in which the fund's management fee rate ranked, is also included in the chart and considered by the Board.
Fidelity Advisor Real Estate Fund
The Board noted that the fund's management fee rate ranked below the median of its Total Mapped Group and below the median of its ASPG for the 12-month period ended June 30, 2015.
The Board noted that, in 2014, the ad hoc Committee on Group Fee was formed by it and the boards of other Fidelity funds to conduct an in-depth review of the "group fee" component of the management fee of funds with such management fee structures. Committee focus included the mechanics of the group fee, the competitive landscape of group fee structures, Fidelity funds with no group fee component and investment products not included in group fee assets. The Board also considered that, for funds subject to the group fee, FMR agreed to voluntarily waive fees over a specified period of time in amounts designed to account for assets converted from certain funds to certain collective investment trusts.
Based on its review, the Board concluded that the fund's management fee is fair and reasonable in light of the services that the fund receives and the other factors considered.
Total Expense Ratio. In its review of each class's total expense ratio, the Board considered the fund's management fee rate as well as other fund or class expenses, as applicable, such as transfer agent fees, pricing and bookkeeping fees, fund-paid 12b-1 fees, and custodial, legal, and audit fees. The Board also noted that Fidelity may agree to waive fees and expenses from time to time, and the extent to which, if any, it has done so for the fund. As part of its review, the Board also considered the current and historical total expense ratios of each class of the fund compared to competitive fund median expenses. Each class of the fund is compared to those funds and classes in the Total Mapped Group (used by the Board for management fee comparisons) that have a similar sales load structure.
The Board noted that the total expense ratio of each class ranked below the competitive median for the 12-month period ended June 30, 2015.
Fees Charged to Other Fidelity Clients. The Board also considered Fidelity fee structures and other information with respect to clients of Fidelity, such as other funds advised or subadvised by Fidelity, pension plan clients, and other institutional clients with similar mandates. The Board noted the findings of the 2013 ad hoc joint committee (created with the boards of other Fidelity funds), which reviewed and compared Fidelity's institutional investment advisory business with its business of providing services to the Fidelity funds, including the differences in services provided, fees charged, and costs incurred, as well as competition in their respective marketplaces.
Based on its review of total expense ratios and fees charged to other Fidelity clients, the Board concluded that the total expense ratio of each class of the fund was reasonable in light of the services that the fund and its shareholders receive and the other factors considered.
Costs of the Services and Profitability. The Board considered the revenues earned and the expenses incurred by Fidelity in conducting the business of developing, marketing, distributing, managing, administering and servicing the fund and servicing the fund's shareholders. The Board also considered the level of Fidelity's profits in respect of all the Fidelity funds.
On an annual basis, Fidelity presents to the Board information about the profitability of its relationship with the fund. Fidelity calculates profitability information for each fund, as well as aggregate profitability information for groups of Fidelity funds and all Fidelity funds, using a series of detailed revenue and cost allocation methodologies which originate with the books and records of Fidelity on which Fidelity's audited financial statements are based. The Audit Committee of the Board reviews any significant changes from the prior year's methodologies.
PricewaterhouseCoopers LLP (PwC), independent registered public accounting firm and auditor to Fidelity and certain Fidelity funds, has been engaged annually by the Board as part of the Board's assessment of the profitability analysis used by Fidelity. PwC's engagement includes the review and assessment of Fidelity's methodologies used in determining the revenues and expenses attributable to Fidelity's mutual fund business, and completion of agreed-upon procedures in respect of the mathematical accuracy of fund profitability and its conformity to established allocation methodologies. After considering PwC's reports issued under the engagement and information provided by Fidelity, the Board concluded that while other allocation methods may also be reasonable, Fidelity's profitability methodologies are reasonable in all material respects.
The Board also reviewed Fidelity's non-fund businesses and fall-out benefits related to the mutual fund business as well as cases where Fidelity's affiliates may benefit from or be related to the fund's business.
The Board considered the costs of the services provided by and the profits realized by Fidelity in connection with the operation of the fund and was satisfied that the profitability was not excessive.
Economies of Scale. The Board considered whether there have been economies of scale in respect of the management of the Fidelity funds, whether the Fidelity funds (including the fund) have appropriately benefited from any such economies of scale, and whether there is potential for realization of any further economies of scale. The Board considered the extent to which the fund will benefit from economies of scale as assets grow through increased services to the fund, through waivers or reimbursements, or through fee or expense ratio reductions. The Board also noted that in 2013, it and the boards of other Fidelity funds created an ad hoc committee (the Economies of Scale Committee) to analyze whether Fidelity attains economies of scale in respect of the management and servicing of the Fidelity funds, whether the Fidelity funds have appropriately benefited from such economies of scale, and whether there is potential for realization of any further economies of scale.
The Board recognized that the fund's management contract incorporates a "group fee" structure, which provides for lower group fee rates as total group assets increase, and for higher group fee rates as total group assets decrease (with "group assets" defined to include fund assets under SelectCo's management plus assets under FMR's management). SelectCo calculates the group fee rates based on a tiered asset "breakpoint" schedule that varies based on asset class. The Board considered that the group fee is designed to deliver the benefits of economies of scale to fund shareholders when total group assets increase, even if assets of any particular fund are unchanged or have declined, because some portion of Fidelity's costs are attributable to services provided to all Fidelity funds, and all funds benefit if those costs can be allocated among more assets. The Board concluded that, given the group fee structure, fund shareholders will benefit from lower management fees as group assets increase at the fund complex level, regardless of whether Fidelity achieves any such economies of scale.
The Board concluded, taking into account the analysis of the Economies of Scale Committee, that economies of scale, if any, are being appropriately shared between fund shareholders and Fidelity.
Additional Information Requested by the Board. In order to develop fully the factual basis for consideration of the Fidelity funds' Advisory Contracts, the Board requested and received additional information on certain topics, including: (i) Fidelity's fund profitability methodology, profitability trends for certain funds, and the impact of certain factors on fund profitability results; (ii) portfolio manager changes that have occurred during the past year and the amount of the investment that each portfolio manager has made in the Fidelity fund(s) that he or she manages; (iii) Fidelity's compensation structure for portfolio managers, research analysts, and other key personnel, including its effects on fund profitability; (iv) the arrangements with and compensation paid to certain fund sub-advisers on behalf of the Fidelity funds; (v) Fidelity's long-term expectations for its offerings in the workplace investing channel; (vi) the methodology with respect to competitive fund data and peer group classifications; (vii) Fidelity's transfer agent fee, expense, and service structures for different funds and classes, and the impact of outsourcing, the increased use of omnibus accounts, and lower pricing in the retirement channel; and (viii) explanations regarding the relative total expense ratios of certain funds and classes, total expense competitive trends and methodologies for total expense competitive comparisons, and actions that might be taken by Fidelity to reduce total expense ratios for certain funds and classes or to achieve further economies of scale.
Based on its evaluation of all of the conclusions noted above, and after considering all factors it believed relevant, the Board concluded that the advisory fee structures are fair and reasonable, and that the fund's Advisory Contracts should be renewed.
AREI-SANN-0316
1.783110.114
Fidelity Advisor Focus Funds®
Class A, Class T, Class B and Class C Fidelity Advisor® Biotechnology Fund
Fidelity Advisor® Communications Equipment Fund
Fidelity Advisor® Consumer Discretionary Fund
Fidelity Advisor® Electronics Fund
Fidelity Advisor® Energy Fund
Fidelity Advisor® Financial Services Fund
Fidelity Advisor® Health Care Fund
Fidelity Advisor® Industrials Fund
Fidelity Advisor® Technology Fund
Fidelity Advisor® Utilities Fund
Semi-Annual Report January 31, 2016 |
|
Contents
To view a fund's proxy voting guidelines and proxy voting record for the 12-month period ended June 30, visit http://www.fidelity.com/proxyvotingresults or visit the Securities and Exchange Commission's (SEC) web site at http://www.sec.gov.
You may also call 1-877-208-0098 to request a free copy of the proxy voting guidelines.
Standard & Poor's, S&P and S&P 500 are registered service marks of The McGraw-Hill Companies, Inc. and have been licensed for use by Fidelity Distributors Corporation.
Other third-party marks appearing herein are the property of their respective owners.
All other marks appearing herein are registered or unregistered trademarks or service marks of FMR LLC or an affiliated company. © 2016 FMR LLC. All rights reserved.
This report and the financial statements contained herein are submitted for the general information of the shareholders of the Funds. This report is not authorized for distribution to prospective investors in the Funds unless preceded or accompanied by an effective prospectus.
A fund files its complete schedule of portfolio holdings with the SEC for the first and third quarters of each fiscal year on Form N-Q. Forms N-Q are available on the SEC’s web site at http://www.sec.gov. A fund's Forms N-Q may be reviewed and copied at the SEC’s Public Reference Room in Washington, DC. Information regarding the operation of the SEC's Public Reference Room may be obtained by calling 1-800-SEC-0330.
For a complete list of a fund's portfolio holdings, view the most recent holdings listing, semiannual report, or annual report on Fidelity's web site at http://www.fidelity.com, http://www.advisor.fidelity.com, or http://www.401k.com, as applicable.
NOT FDIC INSURED •MAY LOSE VALUE •NO BANK GUARANTEE
Neither the Funds nor Fidelity Distributors Corporation is a bank.
Fidelity Advisor® Biotechnology Fund
Investment Summary (Unaudited)
Top Ten Stocks as of January 31, 2016
| | % of fund's net assets | % of fund's net assets 6 months ago |
| Biogen, Inc. | 6.5 | 6.9 |
| Alexion Pharmaceuticals, Inc. | 6.2 | 5.4 |
| Celgene Corp. | 6.1 | 6.0 |
| Regeneron Pharmaceuticals, Inc. | 5.5 | 5.4 |
| Gilead Sciences, Inc. | 4.7 | 8.8 |
| Vertex Pharmaceuticals, Inc. | 4.0 | 3.6 |
| BioMarin Pharmaceutical, Inc. | 3.8 | 4.9 |
| Incyte Corp. | 3.1 | 2.2 |
| Genmab A/S | 2.2 | 0.9 |
| Anacor Pharmaceuticals, Inc. | 1.8 | 2.3 |
| | 43.9 | |
Top Industries (% of fund's net assets)
| As of January 31, 2016 |
| | Biotechnology | 86.9% |
| | Pharmaceuticals | 12.3% |
| | Health Care Equipment & Supplies | 0.3% |
| | Capital Markets | 0.1% |
| | Health Care Providers & Services | 0.1% |
| | All Others* | 0.3% |

| As of July 31, 2015 |
| | Biotechnology | 90.4% |
| | Pharmaceuticals | 8.8% |
| | Health Care Equipment & Supplies | 0.2% |
| | Life Sciences Tools & Services | 0.1% |
| | All Others* | 0.5% |

* Includes Short-Term investments and Net Other Assets (Liabilities).
Fidelity Advisor® Biotechnology Fund
Investments January 31, 2016 (Unaudited)
Showing Percentage of Net Assets
| Common Stocks - 98.2% | | | |
| | | Shares | Value |
| Biotechnology - 85.9% | | | |
| Biotechnology - 85.9% | | | |
| ACADIA Pharmaceuticals, Inc. (a)(b) | | 499,986 | $10,344,710 |
| Acceleron Pharma, Inc. (a) | | 594,191 | 18,241,664 |
| Achillion Pharmaceuticals, Inc. (a)(b) | | 1,640,172 | 11,087,563 |
| Acorda Therapeutics, Inc. (a) | | 665,253 | 24,494,615 |
| Actelion Ltd. | | 129,712 | 17,093,395 |
| Adamas Pharmaceuticals, Inc. (a) | | 1,043,948 | 17,893,269 |
| Adaptimmune Therapeutics PLC sponsored ADR | | 823,742 | 5,823,856 |
| ADMA Biologics, Inc. (a) | | 50,300 | 303,561 |
| Aduro Biotech, Inc. (b) | | 260,518 | 3,772,301 |
| Aduro Biotech, Inc. (c) | | 345,762 | 5,006,634 |
| Aegerion Pharmaceuticals, Inc. (a)(b) | | 1,437,389 | 10,176,714 |
| Affimed NV (a) | | 179,950 | 597,434 |
| Agenus, Inc. (a) | | 487,360 | 1,535,184 |
| Agenus, Inc. warrants 1/9/18 (a) | | 452,000 | 809 |
| Agios Pharmaceuticals, Inc. (a) | | 42,471 | 1,793,126 |
| Aimmune Therapeutics, Inc. (a)(b) | | 460,656 | 6,301,774 |
| Aimmune Therapeutics, Inc. | | 460,107 | 6,231,321 |
| Akebia Therapeutics, Inc. (a) | | 434,377 | 3,183,983 |
| Alder Biopharmaceuticals, Inc. (a)(b) | | 724,713 | 17,523,560 |
| Aldeyra Therapeutics, Inc. (a) | | 478,895 | 2,303,485 |
| Alexion Pharmaceuticals, Inc. (a) | | 1,143,165 | 166,822,068 |
| Alkermes PLC (a) | | 390,703 | 12,506,403 |
| Alnylam Pharmaceuticals, Inc. (a) | | 225,735 | 15,562,171 |
| AMAG Pharmaceuticals, Inc. (a)(b) | | 847,577 | 19,417,989 |
| Amarin Corp. PLC ADR (a)(b) | | 1,077,203 | 1,464,996 |
| Amgen, Inc. | | 30,330 | 4,632,301 |
| Amicus Therapeutics, Inc. (a)(b) | | 1,005,270 | 6,071,831 |
| Anacor Pharmaceuticals, Inc. (a) | | 659,551 | 49,552,067 |
| Applied Genetic Technologies Corp. (a) | | 293,936 | 4,294,405 |
| Ardelyx, Inc. (a) | | 1,105,464 | 11,507,880 |
| ARIAD Pharmaceuticals, Inc. (a)(b) | | 815,995 | 4,096,295 |
| Array BioPharma, Inc. (a) | | 378,104 | 1,168,341 |
| Ascendis Pharma A/S sponsored ADR | | 35,700 | 679,728 |
| Asterias Biotherapeutics, Inc. (a)(b) | | 115,938 | 372,161 |
| Atara Biotherapeutics, Inc. (a)(b) | | 455,215 | 8,239,392 |
| aTyr Pharma, Inc. (a) | | 45,620 | 240,874 |
| aTyr Pharma, Inc. (c) | | 55,238 | 291,657 |
| Avalanche Biotechnologies, Inc. (a) | | 125,129 | 750,774 |
| Axovant Sciences Ltd. (a) | | 291,261 | 4,639,788 |
| BioCryst Pharmaceuticals, Inc. (a) | | 326,300 | 2,274,311 |
| Biogen, Inc. (a) | | 641,640 | 175,206,218 |
| BioMarin Pharmaceutical, Inc. (a) | | 1,393,848 | 103,172,629 |
| BioTime, Inc. warrants 10/1/18 (a) | | 2 | 1 |
| bluebird bio, Inc. (a) | | 35,449 | 1,466,171 |
| Blueprint Medicines Corp. | | 311,843 | 4,902,172 |
| Calithera Biosciences, Inc. (a)(b) | | 497,158 | 2,485,790 |
| Cara Therapeutics, Inc. (a) | | 307,888 | 2,770,992 |
| Catabasis Pharmaceuticals, Inc. (b) | | 138,100 | 914,222 |
| Catalyst Pharmaceutical Partners, Inc.: | | | |
| warrants 5/2/17 (a) | | 8,557 | 6,007 |
| warrants 5/30/17 (a) | | 17,900 | 15,969 |
| Celgene Corp. (a) | | 1,636,735 | 164,197,255 |
| Cell Therapeutics, Inc. warrants 7/6/16 (a) | | 46,404 | 0 |
| Celldex Therapeutics, Inc. (a)(b) | | 827,627 | 6,869,304 |
| Cellectis SA sponsored ADR | | 40,000 | 894,400 |
| Cepheid, Inc. (a) | | 51,400 | 1,513,730 |
| Cerulean Pharma, Inc. (a)(b) | | 1,310,113 | 3,144,271 |
| Chiasma, Inc. (a) | | 29,900 | 307,970 |
| Chiasma, Inc. (c) | | 325,192 | 3,349,478 |
| Chiasma, Inc. warrants (a) | | 81,298 | 221,852 |
| Chimerix, Inc. (a) | | 281,786 | 2,169,752 |
| Cidara Therapeutics, Inc. (b) | | 19,000 | 221,540 |
| Cidara Therapeutics, Inc. (c) | | 223,967 | 2,611,455 |
| Clovis Oncology, Inc. (a)(b) | | 139,332 | 2,914,825 |
| Concert Pharmaceuticals, Inc. (a) | | 35,584 | 543,368 |
| CTI BioPharma Corp. (a)(b) | | 5,520,646 | 6,956,014 |
| Cytokinetics, Inc. (a) | | 191,719 | 1,476,236 |
| Cytokinetics, Inc. warrants 6/25/17 (a) | | 244,500 | 123,930 |
| CytomX Therapeutics, Inc. | | 64,961 | 969,510 |
| DBV Technologies SA sponsored ADR (a) | | 258,000 | 6,705,420 |
| Dicerna Pharmaceuticals, Inc. (a)(b) | | 125,106 | 820,695 |
| Dynavax Technologies Corp. (a)(b) | | 558,819 | 13,461,950 |
| Edge Therapeutics, Inc. (a)(b) | | 215,200 | 2,390,872 |
| Eleven Biotherapeutics, Inc. (a)(b) | | 41,779 | 13,386 |
| Emergent BioSolutions, Inc. (a) | | 146,555 | 5,363,913 |
| Enanta Pharmaceuticals, Inc. (a)(b) | | 100,387 | 2,579,946 |
| Epirus Biopharmaceuticals, Inc. (a) | | 254,100 | 820,743 |
| Epizyme, Inc. (a)(b) | | 2,351,873 | 21,378,526 |
| Esperion Therapeutics, Inc. (a)(b) | | 348,778 | 5,189,817 |
| Exact Sciences Corp. (a)(b) | | 364,159 | 2,392,525 |
| Exelixis, Inc. (a)(b) | | 1,040,940 | 4,809,143 |
| Fate Therapeutics, Inc. (a)(b) | | 234,604 | 505,572 |
| Fibrocell Science, Inc. (a) | | 279,800 | 719,086 |
| FibroGen, Inc. (a) | | 74,322 | 1,507,250 |
| Forward Pharma A/S sponsored ADR (a) | | 23,100 | 370,755 |
| Foundation Medicine, Inc. (a)(b) | | 159,200 | 2,322,728 |
| Galapagos Genomics NV sponsored ADR (b) | | 253,629 | 12,407,531 |
| Genmab A/S (a) | | 464,102 | 58,280,477 |
| Genocea Biosciences, Inc. (a) | | 159,921 | 497,354 |
| Genomic Health, Inc. (a) | | 54,120 | 1,558,656 |
| Geron Corp. (a)(b) | | 4,760,774 | 14,520,361 |
| Gilead Sciences, Inc. | | 1,514,648 | 125,715,784 |
| Global Blood Therapeutics, Inc. | | 518,310 | 9,713,492 |
| Global Blood Therapeutics, Inc. (a) | | 70,157 | 1,328,072 |
| Halozyme Therapeutics, Inc. (a)(b) | | 1,156,138 | 10,174,014 |
| Heron Therapeutics, Inc. (a)(b) | | 535,642 | 11,243,126 |
| Histogenics Corp. (a)(b)(d) | | 672,534 | 2,024,327 |
| Ignyta, Inc. (a) | | 652,672 | 6,513,667 |
| Immune Design Corp. (a) | | 268,300 | 2,809,101 |
| ImmunoGen, Inc. (a)(b) | | 1,249,451 | 10,607,839 |
| Immunomedics, Inc. (a)(b) | | 2,399,384 | 4,510,842 |
| Incyte Corp. (a) | | 1,166,968 | 82,341,262 |
| Infinity Pharmaceuticals, Inc. (a) | | 287,434 | 1,784,965 |
| Insys Therapeutics, Inc. (a)(b) | | 585,194 | 10,153,116 |
| Intercept Pharmaceuticals, Inc. (a) | | 175,060 | 18,596,624 |
| Intrexon Corp. (a)(b) | | 273,808 | 7,978,765 |
| Ionis Pharmaceuticals, Inc. (a) | | 386,340 | 15,040,216 |
| Ironwood Pharmaceuticals, Inc. Class A (a) | | 670,651 | 6,190,109 |
| Juno Therapeutics, Inc. (a)(b) | | 73,900 | 2,038,162 |
| Juno Therapeutics, Inc. (c) | | 214,673 | 5,920,681 |
| Karyopharm Therapeutics, Inc. (a)(b) | | 1,159,016 | 7,209,080 |
| Keryx Biopharmaceuticals, Inc. (a)(b) | | 673,542 | 2,377,603 |
| Kite Pharma, Inc. (a)(b) | | 729,920 | 34,663,901 |
| Kura Oncology, Inc. | | 1,037,902 | 4,981,930 |
| La Jolla Pharmaceutical Co. (a) | | 327,300 | 5,796,483 |
| Lexicon Pharmaceuticals, Inc. (a)(b) | | 930,237 | 9,479,115 |
| Ligand Pharmaceuticals, Inc. Class B (a)(b) | | 126,712 | 12,667,399 |
| Lion Biotechnologies, Inc. (a) | | 369,046 | 2,210,586 |
| Loxo Oncology, Inc. (a) | | 400,471 | 8,273,731 |
| Macrogenics, Inc. (a) | | 575,691 | 11,588,660 |
| MannKind Corp. (a)(b) | | 1,121,356 | 1,118,328 |
| MediciNova, Inc. (a)(b) | | 1,018,480 | 4,104,474 |
| Medivation, Inc. (a) | | 1,377,738 | 45,052,033 |
| Merrimack Pharmaceuticals, Inc. (a) | | 204,236 | 1,260,136 |
| Mesoblast Ltd. sponsored ADR (a)(b) | | 250,700 | 1,353,780 |
| MiMedx Group, Inc. (a)(b) | | 250,413 | 2,083,436 |
| Minerva Neurosciences, Inc. (a)(b) | | 921,974 | 4,794,265 |
| Mirati Therapeutics, Inc. (a) | | 34,314 | 738,780 |
| Mirna Therapeutics, Inc. (a)(b) | | 281,700 | 1,270,467 |
| Momenta Pharmaceuticals, Inc. (a) | | 121,037 | 1,503,280 |
| Myriad Genetics, Inc. (a)(b) | | 195,057 | 7,601,371 |
| NantKwest, Inc. (a)(b) | | 361,278 | 3,721,163 |
| Neurocrine Biosciences, Inc. (a) | | 669,028 | 28,467,141 |
| NewLink Genetics Corp. (a)(b) | | 252,479 | 6,150,388 |
| Nivalis Therapeutics, Inc. | | 18,600 | 87,234 |
| Novavax, Inc. (a)(b) | | 2,767,531 | 14,252,785 |
| Novelos Therapeutics, Inc. warrants 12/6/16 (a) | | 137,600 | 1 |
| OncoMed Pharmaceuticals, Inc. (a)(b) | | 175,270 | 1,621,248 |
| Ophthotech Corp. (a) | | 762,637 | 41,327,299 |
| Opko Health, Inc. (a)(b) | | 586,151 | 4,712,654 |
| Oragenics, Inc. (a) | | 250,308 | 265,326 |
| Orexigen Therapeutics, Inc. (a)(b) | | 1,765,996 | 3,231,773 |
| Organovo Holdings, Inc. (a)(b) | | 194,083 | 380,403 |
| Osiris Therapeutics, Inc. (b) | | 203,971 | 1,460,432 |
| OvaScience, Inc. (a)(b) | | 193,445 | 1,092,964 |
| PolyMedix, Inc. warrants 4/10/16 (a) | | 163,833 | 2 |
| Portola Pharmaceuticals, Inc. (a) | | 526,888 | 17,403,111 |
| Progenics Pharmaceuticals, Inc. (a)(b) | | 793,543 | 3,309,074 |
| ProNai Therapeutics, Inc. (a)(b) | | 377,900 | 3,129,012 |
| ProQR Therapeutics BV (a) | | 249,416 | 1,314,422 |
| Proteon Therapeutics, Inc. (a) | | 137,500 | 1,282,875 |
| Prothena Corp. PLC (a) | | 128,634 | 5,010,294 |
| PTC Therapeutics, Inc. (a)(b) | | 330,278 | 7,867,222 |
| Puma Biotechnology, Inc. (a)(b) | | 324,394 | 13,540,206 |
| Radius Health, Inc. (a) | | 975,562 | 31,247,251 |
| Raptor Pharmaceutical Corp. (a) | | 625,173 | 2,563,209 |
| Regeneron Pharmaceuticals, Inc. (a) | | 353,005 | 148,293,870 |
| REGENXBIO, Inc. (a)(b) | | 423,050 | 5,880,395 |
| Regulus Therapeutics, Inc. (a) | | 265,221 | 1,532,977 |
| Repligen Corp. (a) | | 361,227 | 8,001,178 |
| Retrophin, Inc. (a) | | 266,445 | 3,988,682 |
| Rigel Pharmaceuticals, Inc. (a) | | 643,465 | 1,769,529 |
| Sage Therapeutics, Inc. (a) | | 262,168 | 8,803,601 |
| Sangamo Biosciences, Inc. (a)(b) | | 682,852 | 4,131,255 |
| Sarepta Therapeutics, Inc. (a)(b) | | 429,797 | 5,105,988 |
| Seattle Genetics, Inc. (a)(b) | | 995,001 | 32,815,133 |
| Seres Therapeutics, Inc. (b) | | 237,191 | 6,387,554 |
| Seres Therapeutics, Inc. | | 352,270 | 9,486,631 |
| Sophiris Bio, Inc. (a) | | 141,653 | 273,390 |
| Spark Therapeutics, Inc. (b) | | 314,145 | 8,849,465 |
| Spectrum Pharmaceuticals, Inc. (a) | | 338,247 | 1,677,705 |
| Stemline Therapeutics, Inc. (a)(b) | | 348,093 | 1,754,389 |
| Sunesis Pharmaceuticals, Inc. (a)(b) | | 830,240 | 647,587 |
| TESARO, Inc. (a)(b) | | 456,937 | 15,782,604 |
| TG Therapeutics, Inc. (a)(b) | | 1,428,493 | 11,670,788 |
| Threshold Pharmaceuticals, Inc. (a)(b) | | 26,804 | 8,577 |
| Threshold Pharmaceuticals, Inc. warrants 3/16/16 (a) | | 35,146 | 0 |
| Tobira Therapeutics, Inc. (a)(b) | | 299,451 | 2,150,058 |
| Tokai Pharmaceuticals, Inc. (a)(b) | | 91,000 | 570,570 |
| Trevena, Inc. (a) | | 286,767 | 2,087,664 |
| Ultragenyx Pharmaceutical, Inc. (a) | | 366,427 | 20,574,876 |
| uniQure B.V. (a)(b) | | 158,829 | 2,895,453 |
| United Therapeutics Corp. (a) | | 148,094 | 18,242,219 |
| Verastem, Inc. (a) | | 365,402 | 438,482 |
| Versartis, Inc. (a)(b) | | 355,976 | 3,965,573 |
| Vertex Pharmaceuticals, Inc. (a) | | 1,198,919 | 108,801,899 |
| Vical, Inc. (a) | | 659,862 | 230,952 |
| Vitae Pharmaceuticals, Inc. (a) | | 1,091,502 | 10,696,720 |
| Vital Therapies, Inc. (a)(b) | | 581,760 | 5,323,104 |
| Voyager Therapeutics, Inc. (a)(b) | | 1,016,525 | 10,856,487 |
| Voyager Therapeutics, Inc. | | 282,352 | 2,713,967 |
| Xencor, Inc. (a) | | 523,108 | 5,660,029 |
| Xenon Pharmaceuticals, Inc. (a) | | 102,215 | 676,663 |
| XOMA Corp. (a)(b) | | 1,918,701 | 1,937,888 |
| Zafgen, Inc. (a)(b) | | 1,356,174 | 9,018,557 |
| ZIOPHARM Oncology, Inc. (a)(b) | | 160,501 | 797,690 |
| | | | 2,309,086,797 |
| Capital Markets - 0.1% | | | |
| Asset Management & Custody Banks - 0.1% | | | |
| RPI International Holdings LP (e) | | 12,210 | 1,711,842 |
| Health Care Equipment & Supplies - 0.3% | | | |
| Health Care Equipment - 0.3% | | | |
| Bellerophon Therapeutics, Inc. (b) | | 227,700 | 523,710 |
| Novocure Ltd. | | 155,553 | 1,844,236 |
| Novocure Ltd. (a)(b) | | 169,200 | 2,111,616 |
| Vermillion, Inc. (a)(b) | | 1,165,400 | 1,783,062 |
| Zosano Pharma Corp. (b) | | 598,503 | 1,364,587 |
| | | | 7,627,211 |
| Life Sciences Tools & Services - 0.0% | | | |
| Life Sciences Tools & Services - 0.0% | | | |
| JHL Biotech, Inc. | | 469,540 | 1,596,573 |
| Transgenomic, Inc. (a) | | 13,500 | 8,505 |
| Transgenomic, Inc. warrants 2/3/17 (a) | | 81,000 | 1 |
| | | | 1,605,079 |
| Personal Products - 0.0% | | | |
| Personal Products - 0.0% | | | |
| MYOS Corp. (a) | | 6,666 | 11,466 |
| Pharmaceuticals - 11.9% | | | |
| Pharmaceuticals - 11.9% | | | |
| Achaogen, Inc. (a) | | 141,215 | 511,198 |
| Adimab LLC unit (e)(f) | | 398,401 | 7,637,946 |
| Aradigm Corp. (a) | | 8,786 | 32,596 |
| Auris Medical Holding AG (a) | | 261,667 | 1,172,268 |
| Axsome Therapeutics, Inc. (a)(b) | | 956,860 | 7,492,214 |
| Biodel, Inc. (a) | | 718,800 | 178,981 |
| Biodelivery Sciences International, Inc. (a)(b) | | 609,750 | 2,469,488 |
| Carbylan Therapeutics, Inc. | | 763,811 | 1,856,061 |
| Cempra, Inc. (a)(b) | | 1,143,578 | 19,703,849 |
| Collegium Pharmaceutical, Inc. | | 81,700 | 1,391,351 |
| Dermira, Inc. (a) | | 563,614 | 15,781,192 |
| Dermira, Inc. (c) | | 162,931 | 4,562,068 |
| Egalet Corp. (a)(b)(d) | | 1,252,974 | 10,550,041 |
| Eisai Co. Ltd. | | 342,900 | 20,726,310 |
| Endo Health Solutions, Inc. (a) | | 58,774 | 3,260,194 |
| Flex Pharma, Inc. | | 22,600 | 188,032 |
| GW Pharmaceuticals PLC ADR (a)(b) | | 351,018 | 17,607,063 |
| Horizon Pharma PLC (a) | | 1,904,309 | 33,325,408 |
| Intra-Cellular Therapies, Inc. (a) | | 273,554 | 10,143,382 |
| Jazz Pharmaceuticals PLC (a) | | 323,452 | 41,641,210 |
| MyoKardia, Inc. | | 484,822 | 4,145,228 |
| MyoKardia, Inc. (a)(b) | | 831,134 | 7,480,206 |
| Nektar Therapeutics (a) | | 277,332 | 3,782,808 |
| NeurogesX, Inc. (a) | | 150,000 | 510 |
| Ocular Therapeutix, Inc. (a)(b) | | 380,371 | 2,327,871 |
| Pacira Pharmaceuticals, Inc. (a)(b) | | 411,608 | 24,457,747 |
| Paratek Pharmaceuticals, Inc. (a) | | 881,160 | 12,882,559 |
| Parnell Pharmaceuticals Holdings Ltd. (a) | | 123,569 | 359,586 |
| Pozen, Inc. (a)(b) | | 144,020 | 943,331 |
| Repros Therapeutics, Inc. (a)(b) | | 1,037,775 | 1,068,908 |
| Revance Therapeutics, Inc. (a)(b) | | 110,800 | 2,296,884 |
| SCYNEXIS, Inc. (a) | | 111,900 | 511,383 |
| Sun Pharmaceutical Industries Ltd. | | 552,504 | 7,151,532 |
| Tetraphase Pharmaceuticals, Inc. (a)(b) | | 378,131 | 2,057,033 |
| The Medicines Company (a) | | 565,722 | 19,551,352 |
| TherapeuticsMD, Inc. (a) | | 1,497,500 | 10,707,125 |
| Theravance Biopharma, Inc. (a)(b) | | 407,503 | 6,691,199 |
| WAVE Life Sciences | | 230,144 | 2,802,463 |
| WAVE Life Sciences (a)(b) | | 171,944 | 2,326,402 |
| XenoPort, Inc. (a)(b) | | 478,008 | 2,375,700 |
| Zogenix, Inc. (a)(b) | | 683,715 | 6,481,618 |
| Zogenix, Inc. warrants 7/27/17 (a) | | 32,985 | 838 |
| | | | 320,633,135 |
| TOTAL COMMON STOCKS | | | |
| (Cost $2,959,279,215) | | | 2,640,675,530 |
|
| Convertible Preferred Stocks - 1.6% | | | |
| Biotechnology - 1.0% | | | |
| Biotechnology - 1.0% | | | |
| 23andMe, Inc. Series E (e) | | 341,730 | 3,229,349 |
| AC Immune SA Series E (e) | | 101,250 | 724,343 |
| Editas Medicine, Inc. Series B (e) | | 53,545 | 771,048 |
| Gensight Biologics Series B (e) | | 76,600 | 381,380 |
| Immunocore Ltd. Series A (e) | | 17,149 | 2,399,113 |
| Intellia Therapeutics, Inc. Series B (e) | | 121,616 | 638,484 |
| Jounce Therapeutics, Inc. Series B (e) | | 1,591,779 | 2,187,104 |
| Moderna LLC: | | | |
| Series D, 8.00% (a)(e) | | 26,918 | 1,245,173 |
| Series E (a)(e) | | 54,410 | 2,516,898 |
| Ovid Therapeutics, Inc. Series B (e) | | 246,448 | 917,279 |
| Pronutria Biosciences, Inc. Series C (e) | | 341,857 | 2,447,012 |
| RaNA Therapeutics LLC Series B (e) | | 1,310,353 | 744,281 |
| Scholar Rock LLC Series B (e) | | 1,083,994 | 2,306,739 |
| Syndax Pharmaceuticals, Inc. Series C1 (e) | | 345,059 | 2,981,310 |
| Twist Bioscience Corp.: | | | |
| Series C (e) | | 1,866,791 | 4,005,573 |
| Series D (e) | | 453,587 | 973,262 |
| | | | 28,468,348 |
| Health Care Providers & Services - 0.1% | | | |
| Health Care Services - 0.1% | | | |
| Allena Pharmaceuticals, Inc. Series C (e) | | 1,505,538 | 2,681,363 |
| Health Care Technology - 0.1% | | | |
| Health Care Technology - 0.1% | | | |
| Codiak Biosciences, Inc.: | | | |
| Series A (e) | | 213,402 | 464,149 |
| Series B (e) | | 693,558 | 1,508,489 |
| | | | 1,972,638 |
| Pharmaceuticals - 0.4% | | | |
| Pharmaceuticals - 0.4% | | | |
| Afferent Pharmaceuticals, Inc. Series C (e) | | 1,915,787 | 2,693,597 |
| Corvus Pharmaceuticals, Inc. Series B (e) | | 180,163 | 2,524,084 |
| Kolltan Pharmaceuticals, Inc. Series D (a)(e) | | 1,610,391 | 1,610,391 |
| Stemcentrx, Inc. Series G (e) | | 208,907 | 2,996,144 |
| Syros Pharmaceuticals, Inc. Series B, 6.00% (a)(e) | | 234,635 | 738,185 |
| | | | 10,562,401 |
| TOTAL CONVERTIBLE PREFERRED STOCKS | | | |
| (Cost $55,238,619) | | | 43,684,750 |
|
| Money Market Funds - 8.2% | | | |
| Fidelity Cash Central Fund, 0.38% (g) | | 13,705,065 | 13,705,065 |
| Fidelity Securities Lending Cash Central Fund, 0.42% (g)(h) | | 205,674,731 | 205,674,731 |
| TOTAL MONEY MARKET FUNDS | | | |
| (Cost $219,379,796) | | | 219,379,796 |
| TOTAL INVESTMENT PORTFOLIO - 108.0% | | | |
| (Cost $3,233,897,630) | | | 2,903,740,076 |
| NET OTHER ASSETS (LIABILITIES) - (8.0)% | | | (215,921,247) |
| NET ASSETS - 100% | | | $2,687,818,829 |
Legend
(a) Non-income producing
(b) Security or a portion of the security is on loan at period end.
(c) Security exempt from registration under Rule 144A of the Securities Act of 1933. These securities may be resold in transactions exempt from registration, normally to qualified institutional buyers. At the end of the period, the value of these securities amounted to $21,741,973 or 0.8% of net assets.
(d) Affiliated company
(e) Restricted securities - Investment in securities not registered under the Securities Act of 1933 (excluding 144A issues). At the end of the period, the value of restricted securities (excluding 144A issues) amounted to $53,034,536 or 2.0% of net assets.
(f) Investment is owned by an entity that is treated as a corporation for U.S. tax purposes and is wholly-owned by the Fund.
(g) Affiliated fund that is generally available only to investment companies and other accounts managed by Fidelity Investments. The rate quoted is the annualized seven-day yield of the fund at period end. A complete unaudited listing of the fund's holdings as of its most recent quarter end is available upon request. In addition, each Fidelity Central Fund's financial statements are available on the SEC's website or upon request.
(h) Investment made with cash collateral received from securities on loan.
Additional information on each restricted holding is as follows:
| Security | Acquisition Date | Acquisition Cost |
| 23andMe, Inc. Series E | 6/18/15 | $3,700,003 |
| AC Immune SA Series E | 10/19/15 | $975,669 |
| Adimab LLC unit | 9/17/14 - 6/5/15 | $6,416,091 |
| Afferent Pharmaceuticals, Inc. Series C | 7/1/15 | $4,700,000 |
| Allena Pharmaceuticals, Inc. Series C | 11/25/15 | $3,989,676 |
| Codiak Biosciences, Inc. Series A | 11/12/15 | $213,402 |
| Codiak Biosciences, Inc. Series B | 11/12/15 | $2,080,674 |
| Corvus Pharmaceuticals, Inc. Series B | 9/16/15 | $2,524,084 |
| Editas Medicine, Inc. Series B | 8/4/15 | $626,477 |
| Gensight Biologics Series B | 7/2/15 | $590,265 |
| Immunocore Ltd. Series A | 7/27/15 | $3,227,085 |
| Intellia Therapeutics, Inc. Series B | 8/20/15 | $638,484 |
| Jounce Therapeutics, Inc. Series B | 4/17/15 | $3,597,421 |
| Kolltan Pharmaceuticals, Inc. Series D | 3/13/14 | $1,610,391 |
| Moderna LLC Series D, 8.00% | 11/6/13 | $574,161 |
| Moderna LLC Series E | 12/18/14 | $3,355,465 |
| Ovid Therapeutics, Inc. Series B | 8/10/15 | $1,535,371 |
| Pronutria Biosciences, Inc. Series C | 1/30/15 | $3,445,919 |
| RaNA Therapeutics LLC Series B | 7/17/15 | $1,415,181 |
| RPI International Holdings LP | 5/21/15 | $1,439,559 |
| Scholar Rock LLC Series B | 12/17/15 | $3,251,982 |
| Stemcentrx, Inc. Series G | 8/14/15 | $4,813,217 |
| Syndax Pharmaceuticals, Inc. Series C1 | 8/21/15 | $3,862,245 |
| Syros Pharmaceuticals, Inc. Series B, 6.00% | 10/9/14 - 1/12/16 | $738,186 |
| Twist Bioscience Corp. Series C | 5/29/15 | $2,800,000 |
| Twist Bioscience Corp. Series D | 1/8/16 | $973,262 |
Affiliated Central Funds
Information regarding fiscal year to date income earned by the Fund from investments in Fidelity Central Funds is as follows:
| Fund | Income earned |
| Fidelity Cash Central Fund | $14,995 |
| Fidelity Securities Lending Cash Central Fund | 3,402,595 |
| Total | $3,417,590 |
Other Affiliated Issuers
An affiliated company is a company in which the Fund has ownership of at least 5% of the voting securities. Fiscal year to date transactions with companies which are or were affiliates are as follows:
| Affiliate | Value, beginning of period | Purchases | Sales Proceeds | Dividend Income | Value, end of period |
| Adamas Pharmaceuticals, Inc. | $22,064,924 | $3,508,766 | $-- | $-- | $-- |
| Aegerion Pharmaceuticals, Inc. | 27,497,252 | -- | -- | -- | -- |
| Egalet Corp. | 5,675,368 | 9,528,212 | -- | -- | 10,550,041 |
| Histogenics Corp. | 4,284,042 | -- | -- | -- | 2,024,327 |
| Total | $59,521,586 | $13,036,978 | $-- | $-- | $12,574,368 |
Investment Valuation
The following is a summary of the inputs used, as of January 31, 2016, involving the Fund's assets and liabilities carried at fair value. The inputs or methodology used for valuing securities may not be an indication of the risk associated with investing in those securities. For more information on valuation inputs, and their aggregation into the levels used below, please refer to the Investment Valuation section in the accompanying Notes to Financial Statements.
| | Valuation Inputs at Reporting Date: |
| Description | Total | Level 1 | Level 2 | Level 3 |
| Investments in Securities: | | | | |
| Common Stocks | $2,640,675,530 | $2,497,687,829 | $133,637,911 | $9,349,790 |
| Convertible Preferred Stocks | 43,684,750 | -- | 2,981,310 | 40,703,440 |
| Money Market Funds | 219,379,796 | 219,379,796 | -- | -- |
| Total Investments in Securities: | $2,903,740,076 | $2,717,067,625 | $136,619,221 | $50,053,230 |
The following is a summary of transfers between Level 1 and Level 2 for the period ended January 31, 2016. Transfers are assumed to have occurred at the beginning of the period, and are primarily attributable to the valuation techniques used for foreign equity securities, as discussed in the accompanying Notes to Financial Statements:
| Transfers | Total |
| Level 1 to Level 2 | $76,339,677 |
| Level 2 to Level 1 | $0 |
The following is a reconciliation of Investments in Securities for which Level 3 inputs were used in determining value:
| Investments in Securities: | |
| Other Investments in Securities | |
| Beginning Balance | $13,219,438 |
| Total Realized Gain (Loss) | -- |
| Total Unrealized Gain (Loss) | (940,217) |
| Cost of Purchases | 8,500 |
| Proceeds of Sales | (878,043) |
| Amortization/Accretion | -- |
| Transfers in to Level 3 | 2 |
| Transfers out of Level 3 | (2,059,890) |
| Ending Balance | $9,349,790 |
| The change in unrealized gain (loss) for the period attributable to Level 3 securities held at January 31, 2016 | $243,796 |
| Convertible Preferred Stocks | |
| Beginning Balance | $59,208,008 |
| Total Realized Gain (Loss) | -- |
| Total Unrealized Gain (Loss) | (20,557,571) |
| Cost of Purchases | 21,844,541 |
| Proceeds of Sales | (19,791,538) |
| Amortization/Accretion | -- |
| Transfers in to Level 3 | -- |
| Transfers out of Level 3 | -- |
| Ending Balance | $40,703,440 |
| The change in unrealized gain (loss) for the period attributable to Level 3 securities held at January 31, 2016 | $(11,764,722) |
The information used in the above reconciliations represents fiscal year to date activity for any Investments in Securities identified as using Level 3 inputs at either the beginning or the end of the current fiscal period. Transfers in or out of Level 3 represent the beginning value of any Security or Instrument where a change in the pricing level occurred from the beginning to the end of the period. The cost of purchases and the proceeds of sales may include securities received or delivered through corporate actions or exchanges. Realized and unrealized gains (losses) disclosed in the reconciliation are included in Net Gain (Loss) on the Fund's Statement of Operations.
Other Information
Distribution of investments by country or territory of incorporation, as a percentage of Total Net Assets, is as follows (Unaudited):
| United States of America | 89.9% |
| Ireland | 3.5% |
| Denmark | 2.2% |
| United Kingdom | 1.1% |
| Others (Individually Less Than 1%) | 3.3% |
| | 100.0% |
See accompanying notes which are an integral part of the financial statements.
Fidelity Advisor® Biotechnology Fund
Financial Statements
Statement of Assets and Liabilities
| | | January 31, 2016 (Unaudited) |
| Assets | | |
Investment in securities, at value (including securities loaned of $203,832,360) — See accompanying schedule:
Unaffiliated issuers (cost $2,992,516,227) | $2,671,785,912 | |
| Fidelity Central Funds (cost $219,379,796) | 219,379,796 | |
| Other affiliated issuers (cost $22,001,607) | 12,574,368 | |
| Total Investments (cost $3,233,897,630) | | $2,903,740,076 |
| Receivable for investments sold | | 24,862 |
| Receivable for fund shares sold | | 6,646,108 |
| Distributions receivable from Fidelity Central Funds | | 562,551 |
| Prepaid expenses | | 16,323 |
| Other receivables | | 3,255 |
| Total assets | | 2,910,993,175 |
| Liabilities | | |
| Payable to custodian bank | $3,063 | |
| Payable for fund shares redeemed | 14,357,667 | |
| Accrued management fee | 1,421,274 | |
| Distribution and service plan fees payable | 925,204 | |
| Other affiliated payables | 665,705 | |
| Other payables and accrued expenses | 126,702 | |
| Collateral on securities loaned, at value | 205,674,731 | |
| Total liabilities | | 223,174,346 |
| Net Assets | | $2,687,818,829 |
| Net Assets consist of: | | |
| Paid in capital | | $3,019,739,821 |
| Accumulated net investment loss | | (14,314,839) |
| Accumulated undistributed net realized gain (loss) on investments and foreign currency transactions | | 12,602,532 |
| Net unrealized appreciation (depreciation) on investments | | (330,208,685) |
| Net Assets | | $2,687,818,829 |
| Calculation of Maximum Offering Price | | |
| Class A: | | |
| Net Asset Value and redemption price per share ($1,052,779,391 ÷ 54,855,241 shares) | | $19.19 |
| Maximum offering price per share (100/94.25 of $19.19) | | $20.36 |
| Class T: | | |
| Net Asset Value and redemption price per share ($127,758,675 ÷ 6,973,005 shares) | | $18.32 |
| Maximum offering price per share (100/96.50 of $18.32) | | $18.98 |
| Class B: | | |
| Net Asset Value and offering price per share ($3,959,447 ÷ 235,036 shares)(a) | | $16.85 |
| Class C: | | |
| Net Asset Value and offering price per share ($633,768,794 ÷ 37,610,515 shares)(a) | | $16.85 |
| Class I: | | |
| Net Asset Value, offering price and redemption price per share ($869,552,522 ÷ 43,101,740 shares) | | $20.17 |
(a) Redemption price per share is equal to net asset value less any applicable contingent deferred sales charge.
See accompanying notes which are an integral part of the financial statements.
Statement of Operations
| | | Six months ended January 31, 2016 (Unaudited) |
| Investment Income | | |
| Dividends | | $2,955,118 |
| Income from Fidelity Central Funds (including $3,402,595 from security lending) | | 3,417,590 |
| Total income | | 6,372,708 |
| Expenses | | |
| Management fee | $9,867,712 | |
| Transfer agent fees | 3,570,620 | |
| Distribution and service plan fees | 6,374,234 | |
| Accounting and security lending fees | 534,459 | |
| Custodian fees and expenses | 72,351 | |
| Independent trustees' compensation | 34,197 | |
| Registration fees | 153,094 | |
| Audit | 51,038 | |
| Legal | 19,274 | |
| Interest | 6,838 | |
| Miscellaneous | 19,089 | |
| Total expenses before reductions | 20,702,906 | |
| Expense reductions | (15,359) | 20,687,547 |
| Net investment income (loss) | | (14,314,839) |
| Realized and Unrealized Gain (Loss) | | |
| Net realized gain (loss) on: | | |
| Investment securities: | | |
| Unaffiliated issuers | 25,066,087 | |
| Foreign currency transactions | (9,713) | |
| Total net realized gain (loss) | | 25,056,374 |
| Change in net unrealized appreciation (depreciation) on investment securities (net of increase in deferred foreign taxes of $51,131) | | (1,542,779,776) |
| Net gain (loss) | | (1,517,723,402) |
| Net increase (decrease) in net assets resulting from operations | | $(1,532,038,241) |
See accompanying notes which are an integral part of the financial statements.
Statement of Changes in Net Assets
| | Six months ended January 31, 2016 (Unaudited) | Year ended July 31, 2015 |
| Increase (Decrease) in Net Assets | | |
| Operations | | |
| Net investment income (loss) | $(14,314,839) | $(22,504,330) |
| Net realized gain (loss) | 25,056,374 | 265,529,861 |
| Change in net unrealized appreciation (depreciation) | (1,542,779,776) | 881,295,858 |
| Net increase (decrease) in net assets resulting from operations | (1,532,038,241) | 1,124,321,389 |
| Distributions to shareholders from net investment income | – | (69,565) |
| Distributions to shareholders from net realized gain | (189,322,364) | (51,362,234) |
| Total distributions | (189,322,364) | (51,431,799) |
| Share transactions - net increase (decrease) | 283,799,085 | 1,521,666,795 |
| Redemption fees | 200,094 | 97,303 |
| Total increase (decrease) in net assets | (1,437,361,426) | 2,594,653,688 |
| Net Assets | | |
| Beginning of period | 4,125,180,255 | 1,530,526,567 |
| End of period (including accumulated net investment loss of $14,314,839 and undistributed net investment income of $0, respectively) | $2,687,818,829 | $4,125,180,255 |
See accompanying notes which are an integral part of the financial statements.
Financial Highlights — Fidelity Advisor Biotechnology Fund Class A
| | Six months ended (Unaudited) | Years ended July 31, | | | | |
| January 31, | 2016 | 2015 | 2014 | 2013 | 2012 | 2011 |
| Selected Per–Share Data | | | | | | |
| Net asset value, beginning of period | $31.43 | $20.19 | $17.25 | $11.79 | $8.81 | $6.67 |
| Income from Investment Operations | | | | | | |
| Net investment income (loss)A | (.09) | (.20) | (.13) | (.09) | (.07) | (.07)B |
| Net realized and unrealized gain (loss) | (10.75) | 12.04 | 3.12 | 6.24 | 3.05 | 2.21 |
| Total from investment operations | (10.84) | 11.84 | 2.99 | 6.15 | 2.98 | 2.14 |
| Distributions from net realized gain | (1.40) | (.60) | (.05) | (.69) | – | – |
| Total distributions | (1.40) | (.60) | (.05) | (.69) | – | – |
| Redemption fees added to paid in capitalA,C | – | – | – | – | – | – |
| Net asset value, end of period | $19.19 | $31.43 | $20.19 | $17.25 | $11.79 | $8.81 |
| Total ReturnD,E,F | (35.90)% | 59.66% | 17.38% | 54.94% | 33.83% | 32.08% |
| Ratios to Average Net AssetsG,H | | | | | | |
| Expenses before reductions | 1.05%I | 1.04% | 1.08% | 1.15% | 1.27% | 1.35% |
| Expenses net of fee waivers, if any | 1.05%I | 1.04% | 1.08% | 1.15% | 1.27% | 1.35% |
| Expenses net of all reductions | 1.05%I | 1.04% | 1.08% | 1.14% | 1.27% | 1.34% |
| Net investment income (loss) | (.69)%I | (.75)% | (.68)% | (.63)% | (.73)% | (.91)%B |
| Supplemental Data | | | | | | |
| Net assets, end of period (000 omitted) | $1,052,779 | $1,560,528 | $602,625 | $286,695 | $68,993 | $30,639 |
| Portfolio turnover rateJ | 28%I | 26% | 50% | 22% | 82% | 99% |
A Calculated based on average shares outstanding during the period.
B Net Investment income per share reflects a large, non-recurring dividend which amounted to $.01 per share. Excluding this non-recurring dividend, the ratio of net investment income (loss) to average net assets would have been (1.04) %.
C Amount represents less than $.005 per share.
D Total returns for periods of less than one year are not annualized.
E Total returns would have been lower if certain expenses had not been reduced during the applicable periods shown.
F Total returns do not include the effect of the sales charges.
G Fees and expenses of any underlying Fidelity Central Funds are not included in the Fund's expense ratio. The Fund indirectly bears its proportionate share of the expenses of any underlying Fidelity Central Funds.
H Expense ratios reflect operating expenses of the class. Expenses before reductions do not reflect amounts reimbursed by the investment adviser or reductions from brokerage service arrangements or reductions from other expense offset arrangements and do not represent the amount paid by the class during periods when reimbursements or reductions occur. Expenses net of fee waivers reflect expenses after reimbursement by the investment adviser but prior to reductions from brokerage service arrangements or other expense offset arrangements. Expenses net of all reductions represent the net expenses paid by the class.
I Annualized
J Amount does not include the portfolio activity of any underlying Fidelity Central Funds.
See accompanying notes which are an integral part of the financial statements.
Financial Highlights — Fidelity Advisor Biotechnology Fund Class T
| | Six months ended (Unaudited) | Years ended July 31, | | | | |
| January 31, | 2016 | 2015 | 2014 | 2013 | 2012 | 2011 |
| Selected Per–Share Data | | | | | | |
| Net asset value, beginning of period | $30.06 | $19.39 | $16.63 | $11.42 | $8.56 | $6.50 |
| Income from Investment Operations | | | | | | |
| Net investment income (loss)A | (.12) | (.27) | (.19) | (.12) | (.10) | (.09)B |
| Net realized and unrealized gain (loss) | (10.27) | 11.54 | 3.00 | 6.02 | 2.96 | 2.15 |
| Total from investment operations | (10.39) | 11.27 | 2.81 | 5.90 | 2.86 | 2.06 |
| Distributions from net realized gain | (1.35) | (.60) | (.05) | (.69) | – | – |
| Total distributions | (1.35) | (.60) | (.05) | (.69) | – | – |
| Redemption fees added to paid in capitalA,C | – | – | – | – | – | – |
| Net asset value, end of period | $18.32 | $30.06 | $19.39 | $16.63 | $11.42 | $8.56 |
| Total ReturnD,E,F | (35.98)% | 59.17% | 16.95% | 54.50% | 33.41% | 31.69% |
| Ratios to Average Net AssetsG,H | | | | | | |
| Expenses before reductions | 1.36%I | 1.35% | 1.41% | 1.46% | 1.56% | 1.64% |
| Expenses net of fee waivers, if any | 1.36%I | 1.35% | 1.41% | 1.46% | 1.56% | 1.64% |
| Expenses net of all reductions | 1.36%I | 1.34% | 1.40% | 1.46% | 1.56% | 1.64% |
| Net investment income (loss) | (1.00)%I | (1.05)% | (1.01)% | (.94)% | (1.02)% | (1.21)%B |
| Supplemental Data | | | | | | |
| Net assets, end of period (000 omitted) | $127,759 | $196,393 | $95,945 | $67,887 | $28,154 | $16,454 |
| Portfolio turnover rateJ | 28%I | 26% | 50% | 22% | 82% | 99% |
A Calculated based on average shares outstanding during the period.
B Net Investment income per share reflects a large, non-recurring dividend which amounted to $.01 per share. Excluding this non-recurring dividend, the ratio of net investment income (loss) to average net assets would have been (1.34) %.
C Amount represents less than $.005 per share.
D Total returns for periods of less than one year are not annualized.
E Total returns would have been lower if certain expenses had not been reduced during the applicable periods shown.
F Total returns do not include the effect of the sales charges.
G Fees and expenses of any underlying Fidelity Central Funds are not included in the Fund's expense ratio. The Fund indirectly bears its proportionate share of the expenses of any underlying Fidelity Central Funds.
H Expense ratios reflect operating expenses of the class. Expenses before reductions do not reflect amounts reimbursed by the investment adviser or reductions from brokerage service arrangements or reductions from other expense offset arrangements and do not represent the amount paid by the class during periods when reimbursements or reductions occur. Expenses net of fee waivers reflect expenses after reimbursement by the investment adviser but prior to reductions from brokerage service arrangements or other expense offset arrangements. Expenses net of all reductions represent the net expenses paid by the class.
I Annualized
J Amount does not include the portfolio activity of any underlying Fidelity Central Funds.
See accompanying notes which are an integral part of the financial statements.
Financial Highlights — Fidelity Advisor Biotechnology Fund Class B
| | Six months ended (Unaudited) | Years ended July 31, | | | | |
| January 31, | 2016 | 2015 | 2014 | 2013 | 2012 | 2011 |
| Selected Per–Share Data | | | | | | |
| Net asset value, beginning of period | $27.73 | $18.01 | $15.52 | $10.75 | $8.09 | $6.17 |
| Income from Investment Operations | | | | | | |
| Net investment income (loss)A | (.17) | (.35) | (.26) | (.17) | (.13) | (.12)B |
| Net realized and unrealized gain (loss) | (9.45) | 10.67 | 2.80 | 5.63 | 2.79 | 2.04 |
| Total from investment operations | (9.62) | 10.32 | 2.54 | 5.46 | 2.66 | 1.92 |
| Distributions from net realized gain | (1.26) | (.60) | (.05) | (.69) | – | – |
| Total distributions | (1.26) | (.60) | (.05) | (.69) | – | – |
| Redemption fees added to paid in capitalA,C | – | – | – | – | – | – |
| Net asset value, end of period | $16.85 | $27.73 | $18.01 | $15.52 | $10.75 | $8.09 |
| Total ReturnD,E,F | (36.13)% | 58.42% | 16.42% | 53.76% | 32.88% | 31.12% |
| Ratios to Average Net AssetsG,H | | | | | | |
| Expenses before reductions | 1.83%I | 1.83% | 1.89% | 1.94% | 2.03% | 2.10% |
| Expenses net of fee waivers, if any | 1.83%I | 1.83% | 1.89% | 1.94% | 2.03% | 2.10% |
| Expenses net of all reductions | 1.83%I | 1.82% | 1.88% | 1.94% | 2.02% | 2.09% |
| Net investment income (loss) | (1.48)%I | (1.53)% | (1.49)% | (1.42)% | (1.49)% | (1.66)%B |
| Supplemental Data | | | | | | |
| Net assets, end of period (000 omitted) | $3,959 | $8,098 | $6,101 | $8,136 | $6,349 | $5,849 |
| Portfolio turnover rateJ | 28%I | 26% | 50% | 22% | 82% | 99% |
A Calculated based on average shares outstanding during the period.
B Net Investment income per share reflects a large, non-recurring dividend which amounted to $.01 per share. Excluding this non-recurring dividend, the ratio of net investment income (loss) to average net assets would have been (1.79) %.
C Amount represents less than $.005 per share.
D Total returns for periods of less than one year are not annualized.
E Total returns would have been lower if certain expenses had not been reduced during the applicable periods shown.
F Total returns do not include the effect of the contingent deferred sales charge.
G Fees and expenses of any underlying Fidelity Central Funds are not included in the Fund's expense ratio. The Fund indirectly bears its proportionate share of the expenses of any underlying Fidelity Central Funds.
H Expense ratios reflect operating expenses of the class. Expenses before reductions do not reflect amounts reimbursed by the investment adviser or reductions from brokerage service arrangements or reductions from other expense offset arrangements and do not represent the amount paid by the class during periods when reimbursements or reductions occur. Expenses net of fee waivers reflect expenses after reimbursement by the investment adviser but prior to reductions from brokerage service arrangements or other expense offset arrangements. Expenses net of all reductions represent the net expenses paid by the class.
I Annualized
J Amount does not include the portfolio activity of any underlying Fidelity Central Funds.
See accompanying notes which are an integral part of the financial statements.
Financial Highlights — Fidelity Advisor Biotechnology Fund Class C
| | Six months ended (Unaudited) | Years ended July 31, | | | | |
| January 31, | 2016 | 2015 | 2014 | 2013 | 2012 | 2011 |
| Selected Per–Share Data | | | | | | |
| Net asset value, beginning of period | $27.78 | $18.04 | $15.53 | $10.76 | $8.10 | $6.18 |
| Income from Investment Operations | | | | | | |
| Net investment income (loss)A | (.16) | (.35) | (.25) | (.17) | (.13) | (.12)B |
| Net realized and unrealized gain (loss) | (9.45) | 10.69 | 2.81 | 5.63 | 2.79 | 2.04 |
| Total from investment operations | (9.61) | 10.34 | 2.56 | 5.46 | 2.66 | 1.92 |
| Distributions from net realized gain | (1.32) | (.60) | (.05) | (.69) | – | – |
| Total distributions | (1.32) | (.60) | (.05) | (.69) | – | – |
| Redemption fees added to paid in capitalA,C | – | – | – | – | – | – |
| Net asset value, end of period | $16.85 | $27.78 | $18.04 | $15.53 | $10.76 | $8.10 |
| Total ReturnD,E,F | (36.11)% | 58.43% | 16.54% | 53.71% | 32.84% | 31.07% |
| Ratios to Average Net AssetsG,H | | | | | | |
| Expenses before reductions | 1.80%I | 1.79% | 1.83% | 1.88% | 2.01% | 2.10% |
| Expenses net of fee waivers, if any | 1.80%I | 1.79% | 1.83% | 1.88% | 2.01% | 2.10% |
| Expenses net of all reductions | 1.80%I | 1.79% | 1.83% | 1.87% | 2.01% | 2.09% |
| Net investment income (loss) | (1.44)%I | (1.49)% | (1.43)% | (1.36)% | (1.47)% | (1.66)%B |
| Supplemental Data | | | | | | |
| Net assets, end of period (000 omitted) | $633,769 | $956,495 | $359,967 | $146,684 | $31,710 | $15,787 |
| Portfolio turnover rateJ | 28%I | 26% | 50% | 22% | 82% | 99% |
A Calculated based on average shares outstanding during the period.
B Net Investment income per share reflects a large, non-recurring dividend which amounted to $.01 per share. Excluding this non-recurring dividend, the ratio of net investment income (loss) to average net assets would have been (1.79) %.
C Amount represents less than $.005 per share.
D Total returns for periods of less than one year are not annualized.
E Total returns would have been lower if certain expenses had not been reduced during the applicable periods shown.
F Total returns do not include the effect of the contingent deferred sales charge.
G Fees and expenses of any underlying Fidelity Central Funds are not included in the Fund's expense ratio. The Fund indirectly bears its proportionate share of the expenses of any underlying Fidelity Central Funds.
H Expense ratios reflect operating expenses of the class. Expenses before reductions do not reflect amounts reimbursed by the investment adviser or reductions from brokerage service arrangements or reductions from other expense offset arrangements and do not represent the amount paid by the class during periods when reimbursements or reductions occur. Expenses net of fee waivers reflect expenses after reimbursement by the investment adviser but prior to reductions from brokerage service arrangements or other expense offset arrangements. Expenses net of all reductions represent the net expenses paid by the class.
I Annualized
J Amount does not include the portfolio activity of any underlying Fidelity Central Funds.
See accompanying notes which are an integral part of the financial statements.
Financial Highlights — Fidelity Advisor Biotechnology Fund Class I
| | Six months ended (Unaudited) | Years ended July 31, | | | | |
| January 31, | 2016 | 2015 | 2014 | 2013 | 2012 | 2011 |
| Selected Per–Share Data | | | | | | |
| Net asset value, beginning of period | $32.95 | $21.10 | $17.97 | $12.22 | $9.10 | $6.87 |
| Income from Investment Operations | | | | | | |
| Net investment income (loss)A | (.06) | (.14) | (.08) | (.05) | (.04) | (.05)B |
| Net realized and unrealized gain (loss) | (11.28) | 12.60 | 3.26 | 6.49 | 3.16 | 2.28 |
| Total from investment operations | (11.34) | 12.46 | 3.18 | 6.44 | 3.12 | 2.23 |
| Distributions from net realized gain | (1.44) | (.60) | (.05) | (.69) | – | – |
| Total distributions | (1.44) | (.61)C | (.05) | (.69) | – | – |
| Redemption fees added to paid in capitalA,D | – | – | – | – | – | – |
| Net asset value, end of period | $20.17 | $32.95 | $21.10 | $17.97 | $12.22 | $9.10 |
| Total ReturnE,F | (35.80)% | 60.00% | 17.74% | 55.39% | 34.29% | 32.46% |
| Ratios to Average Net AssetsG,H | | | | | | |
| Expenses before reductions | .78%I | .78% | .81% | .85% | .95% | 1.04% |
| Expenses net of fee waivers, if any | .78%I | .78% | .81% | .85% | .95% | 1.04% |
| Expenses net of all reductions | .78%I | .77% | .80% | .84% | .94% | 1.03% |
| Net investment income (loss) | (.43)%I | (.48)% | (.41)% | (.32)% | (.40)% | (.60)%B |
| Supplemental Data | | | | | | |
| Net assets, end of period (000 omitted) | $869,553 | $1,403,666 | $465,889 | $177,926 | $26,772 | $5,903 |
| Portfolio turnover rateJ | 28%I | 26% | 50% | 22% | 82% | 99% |
A Calculated based on average shares outstanding during the period.
B Net Investment income per share reflects a large, non-recurring dividend which amounted to $.01 per share. Excluding this non-recurring dividend, the ratio of net investment income (loss) to average net assets would have been (.73) %.
C Total distributions of $.61 per share is comprised of distributions from net investment income of $.003 and distributions from net realized gain of $.604 per share.
D Amount represents less than $.005 per share.
E Total returns for periods of less than one year are not annualized.
F Total returns would have been lower if certain expenses had not been reduced during the applicable periods shown.
G Fees and expenses of any underlying Fidelity Central Funds are not included in the Fund's expense ratio. The Fund indirectly bears its proportionate share of the expenses of any underlying Fidelity Central Funds.
H Expense ratios reflect operating expenses of the class. Expenses before reductions do not reflect amounts reimbursed by the investment adviser or reductions from brokerage service arrangements or reductions from other expense offset arrangements and do not represent the amount paid by the class during periods when reimbursements or reductions occur. Expenses net of fee waivers reflect expenses after reimbursement by the investment adviser but prior to reductions from brokerage service arrangements or other expense offset arrangements. Expenses net of all reductions represent the net expenses paid by the class.
I Annualized
J Amount does not include the portfolio activity of any underlying Fidelity Central Funds.
See accompanying notes which are an integral part of the financial statements.
Notes to Financial Statements (Unaudited)
For the period ended January 31, 2016
1. Organization.
Fidelity Advisor Biotechnology Fund (the Fund) is a non-diversified fund of Fidelity Advisor Series VII (the Trust) and is authorized to issue an unlimited number of shares. The Trust is registered under the Investment Company Act of 1940, as amended (the 1940 Act), as an open-end management investment company organized as a Massachusetts business trust. The Fund offers Class A, Class T, Class C and Class I shares, each of which, along with Class B shares, has equal rights as to assets and voting privileges. Class B shares are closed to new accounts and additional purchases, except for exchanges and reinvestments. Each class has exclusive voting rights with respect to matters that affect that class. Class B shares will automatically convert to Class A shares after a holding period of seven years from the initial date of purchase.
During the period, the Board of Trustees approved the conversion of all existing Class B shares into Class A shares, effective on or about July 1, 2016, regardless of the length of times shares have been held.
2. Investments in Fidelity Central Funds.
The Fund invests in Fidelity Central Funds, which are open-end investment companies generally available only to other investment companies and accounts managed by the investment adviser and its affiliates. The Fund's Schedule of Investments lists each of the Fidelity Central Funds held as of period end, if any, as an investment of the Fund, but does not include the underlying holdings of each Fidelity Central Fund. As an Investing Fund, the Fund indirectly bears its proportionate share of the expenses of the underlying Fidelity Central Funds.
The Money Market Central Funds seek preservation of capital and current income and are managed by Fidelity Investments Money Management, Inc. (FIMM), an affiliate of the investment adviser. Annualized expenses of the Money Market Central Funds as of their most recent shareholder report date are less than .005%.
A complete unaudited list of holdings for each Fidelity Central Fund is available upon request or at the Securities and Exchange Commission (the SEC) website at www.sec.gov. In addition, the financial statements of the Fidelity Central Funds are available on the SEC website or upon request.
3. Significant Accounting Policies.
The financial statements have been prepared in conformity with accounting principles generally accepted in the United States of America (GAAP), which require management to make certain estimates and assumptions at the date of the financial statements. Actual results could differ from those estimates. Subsequent events, if any, through the date that the financial statements were issued have been evaluated in the preparation of the financial statements. The following summarizes the significant accounting policies of the Fund:
Investment Valuation. Investments are valued as of 4:00 p.m. Eastern time on the last calendar day of the period. The Board of Trustees (the Board) has delegated the day to day responsibility for the valuation of the Fund's investments to the Fidelity SelectCo, LLC (SelectCo) Fair Value Committee (the Committee). In accordance with valuation policies and procedures approved by the Board, the Fund attempts to obtain prices from one or more third party pricing vendors or brokers to value its investments. When current market prices, quotations or currency exchange rates are not readily available or reliable, investments will be fair valued in good faith by the Committee, in accordance with procedures adopted by the Board. Factors used in determining fair value vary by investment type and may include market or investment specific events. The frequency with which these procedures are used cannot be predicted and they may be utilized to a significant extent. The Committee oversees the Fund's valuation policies and procedures and reports to the Board on the Committee's activities and fair value determinations. The Board monitors the appropriateness of the procedures used in valuing the Fund's investments and ratifies the fair value determinations of the Committee.
The Fund categorizes the inputs to valuation techniques used to value its investments into a disclosure hierarchy consisting of three levels as shown below:
- Level 1 – quoted prices in active markets for identical investments
- Level 2 – other significant observable inputs (including quoted prices for similar investments, interest rates, prepayment speeds, etc.)
- Level 3 – unobservable inputs (including the Fund's own assumptions based on the best information available)
Valuation techniques used to value the Fund's investments by major category are as follows:
Equity securities, including restricted securities, for which market quotations are readily available, are valued at the last reported sale price or official closing price as reported by a third party pricing vendor on the primary market or exchange on which they are traded and are categorized as Level 1 in the hierarchy. In the event there were no sales during the day or closing prices are not available, securities are valued at the last quoted bid price or may be valued using the last available price and are generally categorized as Level 2 in the hierarchy. For foreign equity securities, when market or security specific events arise, comparisons to the valuation of American Depositary Receipts (ADRs), futures contracts, Exchange-Traded Funds (ETFs) and certain indexes as well as quoted prices for similar securities may be used and would be categorized as Level 2 in the hierarchy. Utilizing these techniques may result in transfers between Level 1 and Level 2. For equity securities, including restricted securities, where observable inputs are limited, assumptions about market activity and risk are used and these securities may be categorized as Level 3 in the hierarchy. Equity securities, including restricted securities, for which observable inputs are not available are valued using alternate valuation approaches, including the market approach and the income approach and are categorized as Level 3 in the hierarchy. The market approach generally consists of using comparable market transactions while the income approach generally consists of using the net present value of estimated future cash flows, adjusted as appropriate for liquidity, credit, market and/or other risk factors.
Investments in open-end mutual funds, including the Fidelity Central Funds, are valued at their closing net asset value (NAV) each business day and are categorized as Level 1 in the hierarchy.
The following provides information on Level 3 securities held by the Fund that were valued at period end based on unobservable inputs. These amounts exclude valuations provided by a broker.
| Asset Type | Fair Value at 01/31/16 | Valuation Technique(s) | Unobservable Input | Amount or Range/Weighted Average | Impact to Valuation from an Increase in Input* |
| Equities | $50,053,230 | Expected distribution | Recovery rate | 0.0% | Increase |
| | | Last transaction price
| Transaction price
| $1.00 - $140.00/
$20.50
| Increase
|
| | | Market comparable
| EV/Sales multiple
| 2.1
| Increase
|
| | | | Discount rate
| 21.0%
| Decrease
|
| | | | Discount for lack of marketability | 10.0% | Decrease |
| | | Partnership NAV
| Partnership NAV
| $140.20
| Increase
|
| | | Proposed transaction price | Transaction price | $8.00 | Increase |
| | | | Discount rate
| 10.0%
| Decrease
|
| | | | Index movement
| 30.2% | Increase
|
| | | Proxy adjustment | Proxy movement | 25.0% - 47.4% / 32.9% | Increase |
* Represents the expected directional change in the fair value of the Level 3 investments that would result from an increase in the corresponding input. A decrease to the unobservable input would have the opposite effect. Significant changes in these inputs could result in significantly higher or lower fair value measurements.
Changes in valuation techniques may result in transfers in or out of an assigned level within the disclosure hierarchy. The aggregate value of investments by input level as of January 31, 2016, including information on transfers between Levels 1 and 2, as well as a roll forward of Level 3 investments, is included at the end of the Fund's Schedule of Investments.
Foreign Currency. The Fund may use foreign currency contracts to facilitate transactions in foreign-denominated securities. Gains and losses from these transactions may arise from changes in the value of the foreign currency or if the counterparties do not perform under the contracts' terms.
Foreign-denominated assets, including investment securities, and liabilities are translated into U.S. dollars at the exchange rates at period end. Purchases and sales of investment securities, income and dividends received and expenses denominated in foreign currencies are translated into U.S. dollars at the exchange rate in effect on the transaction date.
The effects of exchange rate fluctuations on investments are included with the net realized and unrealized gain (loss) on investment securities. Other foreign currency transactions resulting in realized and unrealized gain (loss) are disclosed separately.
Investment Transactions and Income. For financial reporting purposes, the Fund's investment holdings and NAV include trades executed through the end of the last business day of the period. The NAV per share for processing shareholder transactions is calculated as of the close of business of the New York Stock Exchange (NYSE), normally 4:00 p.m. Eastern time and includes trades executed through the end of the prior business day. Gains and losses on securities sold are determined on the basis of identified cost and may include proceeds received from litigation. Dividend income is recorded on the ex-dividend date, except for certain dividends from foreign securities where the ex-dividend date may have passed, which are recorded as soon as the Fund is informed of the ex-dividend date. Distributions received on securities that represent a return of capital or capital gain are recorded as a reduction of cost of investments and/or as a realized gain. Subsequent to ex-dividend date the Fund determines the components of these distributions, based upon receipt of tax filings or other correspondence relating to the underlying investment. Non-cash dividends included in dividend income, if any, are recorded at the fair market value of the securities received. Income and capital gain distributions from Fidelity Central Funds, if any, are recorded on the ex-dividend date. Investment income is recorded net of foreign taxes withheld where recovery of such taxes is uncertain.
Class Allocations and Expenses. Investment income, realized and unrealized capital gains and losses, common expenses of the Fund, and certain fund-level expense reductions, if any, are allocated daily on a pro-rata basis to each class based on the relative net assets of each class to the total net assets of the Fund. Each class differs with respect to transfer agent and distribution and service plan fees incurred. Certain expense reductions may also differ by class. For the reporting period, the allocated portion of income and expenses to each class as a percent of its average net assets may vary due to the timing of recording these transactions in relation to fluctuating net assets of the classes. Expenses directly attributable to a fund are charged to that fund. Expenses attributable to more than one fund are allocated among the respective funds on the basis of relative net assets or other appropriate methods. Expense estimates are accrued in the period to which they relate and adjustments are made when actual amounts are known.
Income Tax Information and Distributions to Shareholders. Each year, the Fund intends to qualify as a regulated investment company under Subchapter M of the Internal Revenue Code, including distributing substantially all of its taxable income and realized gains. As a result, no provision for U.S. Federal income taxes is required. The Fund files a U.S. federal tax return, in addition to state and local tax returns as required. The Fund's federal income tax returns are subject to examination by the Internal Revenue Service (IRS) for a period of three fiscal years after they are filed. State and local tax returns may be subject to examination for an additional fiscal year depending on the jurisdiction. Foreign taxes are provided for based on the Fund's understanding of the tax rules and rates that exist in the foreign markets in which it invests. The Fund is subject to a tax imposed on capital gains by certain countries in which it invests. An estimated deferred tax liability for net unrealized appreciation on the applicable securities is included in Other payables and accrued expenses on the Statement of Assets & Liabilities.
Distributions are declared and recorded on the ex-dividend date. Income dividends and capital gain distributions are declared separately for each class. Income and capital gain distributions are determined in accordance with income tax regulations, which may differ from GAAP.
Capital accounts within the financial statements are adjusted for permanent book-tax differences. These adjustments have no impact on net assets or the results of operations. Capital accounts are not adjusted for temporary book-tax differences which will reverse in a subsequent period.
Book-tax differences are primarily due to foreign currency transactions, passive foreign investment companies (PFIC), partnerships, net operating losses and losses deferred due to wash sales and excise tax regulations.
The federal tax cost of investment securities and unrealized appreciation (depreciation) as of period end were as follows:
| Gross unrealized appreciation | $476,116,518 |
| Gross unrealized depreciation | (814,858,124) |
| Net unrealized appreciation (depreciation) on securities | $(338,741,606) |
| Tax cost | $3,242,481,682 |
Short-Term Trading (Redemption) Fees. Shares held by investors in the Fund less than 30 days may have been subject to a redemption fee equal to .75% of the NAV of shares redeemed. All redemption fees, which reduce the proceeds of the shareholder redemption, are retained by the Fund and accounted for as an addition to paid in capital.
Restricted Securities. The Fund may invest in securities that are subject to legal or contractual restrictions on resale. These securities generally may be resold in transactions exempt from registration or to the public if the securities are registered. Disposal of these securities may involve time-consuming negotiations and expense, and prompt sale at an acceptable price may be difficult. Information regarding restricted securities is included at the end of the Fund's Schedule of Investments.
4. Purchases and Sales of Investments.
Purchases and sales of securities, other than short-term securities, aggregated $591,885,078 and $494,207,020, respectively.
5. Fees and Other Transactions with Affiliates.
Management Fee. Fidelity SelectCo, LLC (the investment adviser) and its affiliates provide the Fund with investment management related services for which the Fund pays a monthly management fee. The management fee is the sum of an individual fund fee rate that is based on an annual rate of .30% of the Fund's average net assets and an annualized group fee rate that averaged .25% during the period. The group fee rate is based upon the average net assets of all the mutual funds advised by Fidelity Management & Research Company (FMR) and the investment adviser. The group fee rate decreases as assets under management increase and increases as assets under management decrease. For the reporting period, the total annualized management fee rate was .55% of the Fund's average net assets.
Distribution and Service Plan Fees. In accordance with Rule 12b-1 of the 1940 Act, the Fund has adopted separate Distribution and Service Plans for each class of shares. Certain classes pay Fidelity Distributors Corporation (FDC), an affiliate of the investment adviser, separate Distribution and Service Fees, each of which is based on an annual percentage of each class' average net assets. In addition, FDC may pay financial intermediaries for selling shares of the Fund and providing shareholder support services. For the period, the Distribution and Service Fee rates, total fees and amounts retained by FDC were as follows:
| | Distribution
Fee | Service
Fee | Total Fees | Retained
by FDC |
| Class A | -% | .25% | $1,729,946 | $– |
| Class T | .25% | .25% | 420,676 | – |
| Class B | .75% | .25% | 30,633 | 22,975 |
| Class C | .75% | .25% | 4,192,979 | 1,706,860 |
| | | | $6,374,234 | $1,729,835 |
Sales Load. FDC may receive a front-end sales charge of up to 5.75% for selling Class A shares and 3.50% for selling Class T shares, some of which is paid to financial intermediaries for selling shares of the Fund. Depending on the holding period, FDC may receive contingent deferred sales charges levied on Class A, Class T, Class B, and Class C redemptions. The deferred sales charges range from 5.00% to 1.00% for Class B shares, 1.00% for Class C shares, 1.00% for certain purchases of Class A shares and .25% for certain purchases of Class T shares.
For the period, sales charge amounts retained by FDC were as follows:
| | Retained
by FDC |
| Class A | $881,974 |
| Class T | 53,596 |
| Class B(a) | 528 |
| Class C(a) | 175,492 |
| | $1,111,590 |
(a) When Class B and Class C shares are initially sold, FDC pays commissions from its own resources to financial intermediaries through which the sales are made.
Transfer Agent Fees. Fidelity Investments Institutional Operations Company, Inc., (FIIOC), an affiliate of the investment adviser, is the transfer, dividend disbursing and shareholder servicing agent for each class of the Fund. FIIOC receives account fees and asset-based fees that vary according to the account size and type of account of the shareholders of the respective classes of the Fund. FIIOC pays for typesetting, printing and mailing of shareholder reports, except proxy statements.
For the period, transfer agent fees for each class were as follows:
| | Amount | % of
Class-Level Average
Net Assets(a) |
| Class A | $1,380,953 | .20 |
| Class T | 218,765 | .26 |
| Class B | 7,327 | .24 |
| Class C | 841,596 | .20 |
| Class I | 1,121,979 | .19 |
| | $3,570,620 | |
(a) Annualized
Accounting and Security Lending Fees. Fidelity Service Company, Inc. (FSC), an affiliate of the investment adviser, maintains the Fund's accounting records. The accounting fee is based on the level of average net assets for each month. Under a separate contract, FSC administers the security lending program. The security lending fee is based on the number and duration of lending transactions.
Brokerage Commissions. The Fund placed a portion of its portfolio transactions with brokerage firms which are affiliates of the investment adviser. Brokerage commissions are included in net realized gain (loss) and change in net unrealized appreciation (depreciation) in the Statement of Operations. The commissions paid to these affiliated firms were $35,955 for the period.
Interfund Lending Program. Pursuant to an Exemptive Order issued by the SEC, the Fund, along with other registered investment companies having management contracts with FMR or other affiliated entities of FMR, may participate in an interfund lending program. This program provides an alternative credit facility allowing the funds to borrow from, or lend money to, other participating affiliated funds. At period end, there were no interfund loans outstanding. The Fund's activity in this program during the period for which loans were outstanding was as follows:
| Borrower or Lender | Average Loan Balance | Weighted Average Interest Rate | Interest Expense |
| Borrower | $6,694,333 | .48% | $1,875 |
Interfund Trades. The Fundmay purchase from or sell securities to other Fidelity Funds under procedures adopted by the Board. The procedures have been designed to ensure these interfund trades are executed in accordance with Rule 17a-7 of the 1940 Act. Interfund trades are included within the respective purchases and sales amounts shown in the Purchases and Sales of Investments note.
6. Committed Line of Credit.
The Fund participates with other funds managed by the investment adviser or an affiliate in a $4.25 billion credit facility (the "line of credit") to be utilized for temporary or emergency purposes to fund shareholder redemptions or for other short-term liquidity purposes. The Fund has agreed to pay commitment fees on its pro-rata portion of the line of credit, which amounted to $2,493 and is reflected in Miscellaneous expenses on the Statement of Operations. During the period, the Fund did not borrow on this line of credit.
7. Security Lending.
The Fund lends portfolio securities through a lending agent from time to time in order to earn additional income. On the settlement date of the loan, the Fund receives collateral (in the form of U.S. Treasury obligations, letters of credit and/or cash) against the loaned securities and maintains collateral in an amount not less than 100% of the market value of the loaned securities during the period of the loan. The market value of the loaned securities is determined at the close of business of the Fund and any additional required collateral is delivered to the Fund on the next business day. The Fund or borrower may terminate the loan at any time, and if the borrower defaults on its obligation to return the securities loaned because of insolvency or other reasons, the Fund may apply collateral received from the borrower against the obligation. The Fund may experience delays and costs in recovering the securities loaned. Any cash collateral received is invested in the Fidelity Securities Lending Cash Central Fund. The value of loaned securities and cash collateral at period end are disclosed on the Fund's Statement of Assets and Liabilities. Security lending income represents the income earned on investing cash collateral, less rebates paid to borrowers and any lending agent fees associated with the loan, plus any premium payments received for lending certain types of securities. Security lending income is presented in the Statement of Operations as a component of income from Fidelity Central Funds.
8. Bank Borrowings.
The Fund is permitted to have bank borrowings for temporary or emergency purposes to fund shareholder redemptions or for other short-term liquidity requirements. The Fund has established borrowing arrangements with certain banks. The interest rate on the borrowings is the bank's base rate, as revised from time to time. The average loan balance during the period for which loans were outstanding amounted to $18,734,636. The weighted average interest rate was .87%. The interest expense amounted to $4,963 under the bank borrowing program. At period end, there were no bank borrowings outstanding.
9. Expense Reductions.
Commissions paid to certain brokers with whom the investment adviser, or its affiliates, places trades on behalf of the Fund include an amount in addition to trade execution, which may be rebated back to the Fund to offset certain expenses. This amount totaled $2,097 for the period.
In addition, during the period the investment advisor reimbursed and/or waived a portion of fund-level operating expenses in the amount of $13,262.
10. Distributions to Shareholders.
Distributions to shareholders of each class were as follows:
| | Six months ended January 31, 2016 | Year ended July 31, 2015 |
| From net investment income | | |
| Class I | $– | $69,565 |
| Total | $– | $69,565 |
| From net realized gain | | |
| Class A | $71,428,585 | $19,162,759 |
| Class T | 8,780,705 | 3,137,062 |
| Class B | 350,358 | 191,809 |
| Class C | 46,525,418 | 13,249,824 |
| Class I | 62,237,298 | 15,620,780 |
| Total | $189,322,364 | $51,362,234 |
11. Share Transactions.
Share transactions for each class were as follows and may contain automatic conversions between classes or exchanges between affiliated funds:
| | Shares | Shares | Dollars | Dollars |
| | Six months ended January 31, 2016 | Year ended July 31, 2015 | Six months ended January 31, 2016 | Year ended July 31, 2015 |
| Class A | | | | |
| Shares sold | 13,519,468 | 28,734,829 | $352,870,183 | $782,311,246 |
| Reinvestment of distributions | 2,387,348 | 750,777 | 66,988,968 | 17,834,437 |
| Shares redeemed | (10,708,989) | (9,674,834) | (265,479,703) | (251,598,976) |
| Net increase (decrease) | 5,197,827 | 19,810,772 | $154,379,448 | $548,546,707 |
| Class T | | | | |
| Shares sold | 1,232,394 | 2,609,939 | $30,442,567 | $67,425,583 |
| Reinvestment of distributions | 319,200 | 134,415 | 8,560,935 | 3,058,643 |
| Shares redeemed | (1,111,590) | (1,158,298) | (26,768,785) | (29,041,801) |
| Net increase (decrease) | 440,004 | 1,586,056 | $12,234,717 | $41,442,425 |
| Class B | | | | |
| Shares sold | 15,603 | 83,752 | $361,193 | $1,983,767 |
| Reinvestment of distributions | 13,390 | 8,590 | 330,876 | 180,710 |
| Shares redeemed | (86,028) | (138,999) | (1,919,426) | (3,242,788) |
| Net increase (decrease) | (57,035) | (46,657) | $(1,227,357) | $(1,078,311) |
| Class C | | | | |
| Shares sold | 6,956,533 | 18,036,528 | $160,829,470 | $437,867,038 |
| Reinvestment of distributions | 1,618,899 | 528,140 | 40,003,000 | 11,164,448 |
| Shares redeemed | (5,390,758) | (4,090,881) | (117,485,878) | (97,122,016) |
| Net increase (decrease) | 3,184,674 | 14,473,787 | $83,346,592 | $351,909,470 |
| Class I | | | | |
| Shares sold | 12,159,049 | 29,622,523 | $329,675,010 | $833,349,459 |
| Reinvestment of distributions | 1,787,031 | 532,595 | 52,663,804 | 13,257,162 |
| Shares redeemed | (13,439,620) | (9,644,195) | (347,273,129) | (265,760,117) |
| Net increase (decrease) | 506,460 | 20,510,923 | $35,065,685 | $580,846,504 |
12. Other.
The Fund's organizational documents provide former and current trustees and officers with a limited indemnification against liabilities arising in connection with the performance of their duties to the Fund. In the normal course of business, the Fund may also enter into contracts that provide general indemnifications. The Fund's maximum exposure under these arrangements is unknown as this would be dependent on future claims that may be made against the Fund. The risk of material loss from such claims is considered remote.
Fidelity Advisor® Communications Equipment Fund
Investment Summary (Unaudited)
Top Ten Stocks as of January 31, 2016
| | % of fund's net assets | % of fund's net assets 6 months ago |
| Cisco Systems, Inc. | 18.8 | 16.9 |
| Qualcomm, Inc. | 17.0 | 19.2 |
| Nokia Corp. sponsored ADR | 8.1 | 3.9 |
| F5 Networks, Inc. | 6.1 | 6.9 |
| CommScope Holding Co., Inc. | 4.9 | 4.8 |
| Harris Corp. | 4.9 | 4.6 |
| Telefonaktiebolaget LM Ericsson (B Shares) sponsored ADR | 4.9 | 4.4 |
| Juniper Networks, Inc. | 4.5 | 5.0 |
| Brocade Communications Systems, Inc. | 4.2 | 3.4 |
| Ruckus Wireless, Inc. | 2.0 | 2.4 |
| | 75.4 | |
Top Industries (% of fund's net assets)
| As of January 31, 2016 |
| | Communications Equipment | 90.0% |
| | Technology Hardware, Storage & Peripherals | 3.0% |
| | Semiconductors & Semiconductor Equipment | 2.1% |
| | Electronic Equipment & Components | 1.8% |
| | Internet Software & Services | 1.6% |
| | All Others* | 1.5% |

| As of July 31, 2015 |
| | Communications Equipment | 92.2% |
| | Technology Hardware, Storage & Peripherals | 2.8% |
| | Semiconductors & Semiconductor Equipment | 1.6% |
| | Internet Software & Services | 1.3% |
| | Electronic Equipment & Components | 1.0% |
| | All Others* | 1.1% |

* Includes Short-Term investments and Net Other Assets (Liabilities).
Fidelity Advisor® Communications Equipment Fund
Investments January 31, 2016 (Unaudited)
Showing Percentage of Net Assets
| Common Stocks - 99.2% | | | |
| | | Shares | Value |
| Communications Equipment - 90.0% | | | |
| Communications Equipment - 90.0% | | | |
| ADTRAN, Inc. | | 6,000 | $108,960 |
| Arris International PLC (a) | | 7,097 | 180,761 |
| AudioCodes Ltd. (a) | | 4,900 | 21,168 |
| Black Box Corp. | | 2,300 | 17,526 |
| Brocade Communications Systems, Inc. | | 54,500 | 434,910 |
| Calix Networks, Inc. (a) | | 1,700 | 13,056 |
| Ciena Corp. (a) | | 600 | 10,662 |
| Cisco Systems, Inc. | | 81,524 | 1,939,456 |
| CommScope Holding Co., Inc. (a) | | 22,720 | 509,382 |
| EchoStar Holding Corp. Class A (a) | | 650 | 22,835 |
| F5 Networks, Inc. (a) | | 6,735 | 631,608 |
| Finisar Corp. (a) | | 11,600 | 147,320 |
| Harris Corp. | | 5,820 | 506,165 |
| Infinera Corp. (a) | | 3,517 | 53,880 |
| InterDigital, Inc. | | 2,700 | 121,608 |
| Ixia (a) | | 6,190 | 59,238 |
| Juniper Networks, Inc. | | 19,558 | 461,569 |
| Lumentum Holdings, Inc. (a) | | 2,560 | 50,509 |
| Mitel Networks Corp. (a) | | 3,710 | 27,009 |
| Motorola Solutions, Inc. | | 2,209 | 147,495 |
| NETGEAR, Inc. (a) | | 500 | 18,685 |
| Nokia Corp. sponsored ADR | | 115,921 | 834,631 |
| Plantronics, Inc. | | 2,310 | 103,557 |
| Polycom, Inc. (a) | | 5,119 | 52,163 |
| Qualcomm, Inc. | | 38,661 | 1,752,890 |
| Radware Ltd. (a) | | 14,600 | 195,056 |
| Ruckus Wireless, Inc. (a) | | 24,120 | 202,849 |
| Sandvine Corp. (U.K.) | | 5,100 | 12,669 |
| Sierra Wireless, Inc. (a) | | 400 | 5,976 |
| Sonus Networks, Inc. (a) | | 7,150 | 42,900 |
| Telefonaktiebolaget LM Ericsson (B Shares) sponsored ADR (b) | | 56,330 | 501,337 |
| Viavi Solutions, Inc. (a) | | 12,800 | 64,000 |
| Wi-Lan, Inc. (b) | | 30,000 | 32,979 |
| | | | 9,284,809 |
| Diversified Telecommunication Services - 0.2% | | | |
| Alternative Carriers - 0.2% | | | |
| Vonage Holdings Corp. (a) | | 4,390 | 22,521 |
| Electronic Equipment & Components - 1.8% | | | |
| Electronic Components - 0.3% | | | |
| II-VI, Inc. (a) | | 1,360 | 28,288 |
| Electronic Equipment & Instruments - 0.6% | | | |
| Keysight Technologies, Inc. (a) | | 2,500 | 58,500 |
| Electronic Manufacturing Services - 0.9% | | | |
| TE Connectivity Ltd. | | 1,700 | 97,172 |
|
| TOTAL ELECTRONIC EQUIPMENT & COMPONENTS | | | 183,960 |
|
| Internet Software & Services - 1.6% | | | |
| Internet Software & Services - 1.6% | | | |
| Alphabet, Inc.: | | | |
| Class A | | 49 | 37,306 |
| Class C | | 78 | 57,950 |
| Rackspace Hosting, Inc. (a) | | 800 | 16,168 |
| Web.com Group, Inc. (a) | | 2,700 | 50,841 |
| | | | 162,265 |
| Semiconductors & Semiconductor Equipment - 2.1% | | | |
| Semiconductors - 2.1% | | | |
| Broadcom Corp. Class A | | 400 | 21,868 |
| GSI Technology, Inc. (a) | | 4,700 | 16,215 |
| Marvell Technology Group Ltd. | | 6,800 | 60,180 |
| Maxim Integrated Products, Inc. | | 1,100 | 36,740 |
| Qorvo, Inc. (a) | | 1,550 | 61,380 |
| Semtech Corp. (a) | | 1,200 | 24,120 |
| | | | 220,503 |
| Software - 0.5% | | | |
| Application Software - 0.1% | | | |
| Xura, Inc. (a) | | 370 | 7,940 |
| Systems Software - 0.4% | | | |
| Oracle Corp. | | 1,270 | 46,114 |
|
| TOTAL SOFTWARE | | | 54,054 |
|
| Technology Hardware, Storage & Peripherals - 3.0% | | | |
| Technology Hardware, Storage & Peripherals - 3.0% | | | |
| BlackBerry Ltd. (a) | | 20,300 | 144,762 |
| EMC Corp. | | 2,000 | 49,540 |
| Hewlett Packard Enterprise Co. | | 1,000 | 13,760 |
| HP, Inc. | | 4,600 | 44,666 |
| QLogic Corp. (a) | | 500 | 6,410 |
| Samsung Electronics Co. Ltd. | | 53 | 50,884 |
| | | | 310,022 |
| TOTAL COMMON STOCKS | | | |
| (Cost $10,646,394) | | | 10,238,134 |
|
| Money Market Funds - 3.1% | | | |
| Fidelity Cash Central Fund, 0.38% (c) | | 67,370 | 67,370 |
| Fidelity Securities Lending Cash Central Fund, 0.42% (c)(d) | | 252,900 | 252,900 |
| TOTAL MONEY MARKET FUNDS | | | |
| (Cost $320,270) | | | 320,270 |
| TOTAL INVESTMENT PORTFOLIO - 102.3% | | | |
| (Cost $10,966,664) | | | 10,558,404 |
| NET OTHER ASSETS (LIABILITIES) - (2.3)% | | | (236,787) |
| NET ASSETS - 100% | | | $10,321,617 |
Legend
(a) Non-income producing
(b) Security or a portion of the security is on loan at period end.
(c) Affiliated fund that is generally available only to investment companies and other accounts managed by Fidelity Investments. The rate quoted is the annualized seven-day yield of the fund at period end. A complete unaudited listing of the fund's holdings as of its most recent quarter end is available upon request. In addition, each Fidelity Central Fund's financial statements are available on the SEC's website or upon request.
(d) Investment made with cash collateral received from securities on loan.
Affiliated Central Funds
Information regarding fiscal year to date income earned by the Fund from investments in Fidelity Central Funds is as follows:
| Fund | Income earned |
| Fidelity Cash Central Fund | $78 |
| Fidelity Securities Lending Cash Central Fund | 713 |
| Total | $791 |
Investment Valuation
The following is a summary of the inputs used, as of January 31, 2016, involving the Fund's assets and liabilities carried at fair value. The inputs or methodology used for valuing securities may not be an indication of the risk associated with investing in those securities. For more information on valuation inputs, and their aggregation into the levels used below, please refer to the Investment Valuation section in the accompanying Notes to Financial Statements.
| | Valuation Inputs at Reporting Date: |
| Description | Total | Level 1 | Level 2 | Level 3 |
| Investments in Securities: | | | | |
| Common Stocks | $10,238,134 | $10,187,250 | $50,884 | $-- |
| Money Market Funds | 320,270 | 320,270 | -- | -- |
| Total Investments in Securities: | $10,558,404 | $10,507,520 | $50,884 | $-- |
Other Information
Distribution of investments by country or territory of incorporation, as a percentage of Total Net Assets, is as follows (Unaudited):
| United States of America | 79.0% |
| Finland | 8.1% |
| Sweden | 4.9% |
| Canada | 2.2% |
| Israel | 2.1% |
| United Kingdom | 1.7% |
| Others (Individually Less Than 1%) | 2.0% |
| | 100.0% |
See accompanying notes which are an integral part of the financial statements.
Fidelity Advisor® Communications Equipment Fund
Financial Statements
Statement of Assets and Liabilities
| | | January 31, 2016 (Unaudited) |
| Assets | | |
Investment in securities, at value (including securities loaned of $250,090) — See accompanying schedule:
Unaffiliated issuers (cost $10,646,394) | $10,238,134 | |
| Fidelity Central Funds (cost $320,270) | 320,270 | |
| Total Investments (cost $10,966,664) | | $10,558,404 |
| Receivable for investments sold | | 102,888 |
| Receivable for fund shares sold | | 991 |
| Dividends receivable | | 787 |
| Distributions receivable from Fidelity Central Funds | | 225 |
| Prepaid expenses | | 52 |
| Receivable from investment adviser for expense reductions | | 2,933 |
| Other receivables | | 21 |
| Total assets | | 10,666,301 |
| Liabilities | | |
| Payable for investments purchased | $45,289 | |
| Payable for fund shares redeemed | 9,195 | |
| Accrued management fee | 4,859 | |
| Distribution and service plan fees payable | 4,298 | |
| Other affiliated payables | 3,106 | |
| Other payables and accrued expenses | 25,037 | |
| Collateral on securities loaned, at value | 252,900 | |
| Total liabilities | | 344,684 |
| Net Assets | | $10,321,617 |
| Net Assets consist of: | | |
| Paid in capital | | $10,525,495 |
| Undistributed net investment income | | 3,587 |
| Accumulated undistributed net realized gain (loss) on investments and foreign currency transactions | | 200,819 |
| Net unrealized appreciation (depreciation) on investments and assets and liabilities in foreign currencies | | (408,284) |
| Net Assets | | $10,321,617 |
| Calculation of Maximum Offering Price | | |
| Class A: | | |
| Net Asset Value and redemption price per share ($3,866,941 ÷ 385,408 shares) | | $10.03 |
| Maximum offering price per share (100/94.25 of $10.03) | | $10.64 |
| Class T: | | |
| Net Asset Value and redemption price per share ($3,244,774 ÷ 335,093 shares) | | $9.68 |
| Maximum offering price per share (100/96.50 of $9.68) | | $10.03 |
| Class B: | | |
| Net Asset Value and offering price per share ($204,530 ÷ 22,848 shares)(a) | | $8.95 |
| Class C: | | |
| Net Asset Value and offering price per share ($2,214,885 ÷ 247,540 shares)(a) | | $8.95 |
| Class I: | | |
| Net Asset Value, offering price and redemption price per share ($790,487 ÷ 76,023 shares) | | $10.40 |
(a) Redemption price per share is equal to net asset value less any applicable contingent deferred sales charge.
See accompanying notes which are an integral part of the financial statements.
Statement of Operations
| | | Six months ended January 31, 2016 (Unaudited) |
| Investment Income | | |
| Dividends | | $98,134 |
| Income from Fidelity Central Funds | | 791 |
| Total income | | 98,925 |
| Expenses | | |
| Management fee | $31,963 | |
| Transfer agent fees | 18,467 | |
| Distribution and service plan fees | 28,425 | |
| Accounting and security lending fees | 2,308 | |
| Custodian fees and expenses | 1,314 | |
| Independent trustees' compensation | 110 | |
| Registration fees | 48,235 | |
| Audit | 22,604 | |
| Legal | 302 | |
| Miscellaneous | 172 | |
| Total expenses before reductions | 153,900 | |
| Expense reductions | (58,562) | 95,338 |
| Net investment income (loss) | | 3,587 |
| Realized and Unrealized Gain (Loss) | | |
| Net realized gain (loss) on: | | |
| Investment securities: | | |
| Unaffiliated issuers | 355,512 | |
| Foreign currency transactions | 372 | |
| Total net realized gain (loss) | | 355,884 |
Change in net unrealized appreciation (depreciation) on:
Investment securities | (2,616,110) | |
| Assets and liabilities in foreign currencies | (23) | |
| Total change in net unrealized appreciation (depreciation) | | (2,616,133) |
| Net gain (loss) | | (2,260,249) |
| Net increase (decrease) in net assets resulting from operations | | $(2,256,662) |
See accompanying notes which are an integral part of the financial statements.
Statement of Changes in Net Assets
| | Six months ended January 31, 2016 (Unaudited) | Year ended July 31, 2015 |
| Increase (Decrease) in Net Assets | | |
| Operations | | |
| Net investment income (loss) | $3,587 | $(6,053) |
| Net realized gain (loss) | 355,884 | 967,469 |
| Change in net unrealized appreciation (depreciation) | (2,616,133) | (133,970) |
| Net increase (decrease) in net assets resulting from operations | (2,256,662) | 827,446 |
| Distributions to shareholders from net investment income | – | (25,322) |
| Distributions to shareholders from net realized gain | (387,325) | – |
| Share transactions - net increase (decrease) | (147,369) | (2,143,838) |
| Redemption fees | 46 | 500 |
| Total increase (decrease) in net assets | (2,791,310) | (1,341,214) |
| Net Assets | | |
| Beginning of period | 13,112,927 | 14,454,141 |
| End of period (including undistributed net investment income of $3,587 and $0, respectively) | $10,321,617 | $13,112,927 |
See accompanying notes which are an integral part of the financial statements.
Financial Highlights — Fidelity Advisor Communications Equipment Fund Class A
| | Six months ended (Unaudited) | Years ended July 31, | | | | |
| January 31, | 2016 | 2015 | 2014 | 2013 | 2012 | 2011 |
| Selected Per–Share Data | | | | | | |
| Net asset value, beginning of period | $12.57 | $11.94 | $10.22 | $7.71 | $9.73 | $8.67 |
| Income from Investment Operations | | | | | | |
| Net investment income (loss)A | .02 | .02 | .04B | .02 | (.01) | (.06) |
| Net realized and unrealized gain (loss) | (2.19) | .64 | 1.68 | 2.50 | (1.81) | 1.12 |
| Total from investment operations | (2.17) | .66 | 1.72 | 2.52 | (1.82) | 1.06 |
| Distributions from net investment income | – | (.03) | – | (.01) | – | – |
| Distributions from net realized gain | (.37) | – | – | – | (.20) | – |
| Total distributions | (.37) | (.03) | – | (.01) | (.20) | – |
| Redemption fees added to paid in capitalA,C | – | – | – | – | – | – |
| Net asset value, end of period | $10.03 | $12.57 | $11.94 | $10.22 | $7.71 | $9.73 |
| Total ReturnD,E,F | (17.48)% | 5.54% | 16.83% | 32.65% | (18.88)% | 12.23% |
| Ratios to Average Net AssetsG,H | | | | | | |
| Expenses before reductions | 2.40%I | 1.90% | 1.96% | 2.22% | 1.96% | 1.64% |
| Expenses net of fee waivers, if any | 1.40%I | 1.40% | 1.40% | 1.40% | 1.40% | 1.40% |
| Expenses net of all reductions | 1.40%I | 1.39% | 1.39% | 1.37% | 1.39% | 1.39% |
| Net investment income (loss) | .30%I | .16% | .40%B | .18% | (.16)% | (.60)% |
| Supplemental Data | | | | | | |
| Net assets, end of period (000 omitted) | $3,867 | $4,806 | $4,725 | $3,962 | $3,568 | $8,787 |
| Portfolio turnover rateJ | 26%I | 60% | 160% | 33% | 79% | 101% |
A Calculated based on average shares outstanding during the period.
B Net Investment income per share reflects a large, non-recurring dividend which amounted to $.03 per share. Excluding this non-recurring dividend, the ratio of net investment income (loss) to average net assets would have been .14%.
C Amount represents less than $.005 per share.
D Total returns for periods of less than one year are not annualized.
E Total returns would have been lower if certain expenses had not been reduced during the applicable periods shown.
F Total returns do not include the effect of the sales charges.
G Fees and expenses of any underlying Fidelity Central Funds are not included in the Fund's expense ratio. The Fund indirectly bears its proportionate share of the expenses of any underlying Fidelity Central Funds.
H Expense ratios reflect operating expenses of the class. Expenses before reductions do not reflect amounts reimbursed by the investment adviser or reductions from brokerage service arrangements or reductions from other expense offset arrangements and do not represent the amount paid by the class during periods when reimbursements or reductions occur. Expenses net of fee waivers reflect expenses after reimbursement by the investment adviser but prior to reductions from brokerage service arrangements or other expense offset arrangements. Expenses net of all reductions represent the net expenses paid by the class.
I Annualized
J Amount does not include the portfolio activity of any underlying Fidelity Central Funds.
See accompanying notes which are an integral part of the financial statements.
Financial Highlights — Fidelity Advisor Communications Equipment Fund Class T
| | Six months ended (Unaudited) | Years ended July 31, | | | | |
| January 31, | 2016 | 2015 | 2014 | 2013 | 2012 | 2011 |
| Selected Per–Share Data | | | | | | |
| Net asset value, beginning of period | $12.15 | $11.55 | $9.91 | $7.49 | $9.48 | $8.46 |
| Income from Investment Operations | | | | | | |
| Net investment income (loss)A | –B | (.01) | .02C | (.01) | (.03) | (.09) |
| Net realized and unrealized gain (loss) | (2.11) | .62 | 1.62 | 2.43 | (1.76) | 1.11 |
| Total from investment operations | (2.11) | .61 | 1.64 | 2.42 | (1.79) | 1.02 |
| Distributions from net investment income | – | (.01) | – | – | – | – |
| Distributions from net realized gain | (.36) | – | – | – | (.20) | – |
| Total distributions | (.36) | (.01) | – | – | (.20) | – |
| Redemption fees added to paid in capitalA,B | – | – | – | – | – | – |
| Net asset value, end of period | $9.68 | $12.15 | $11.55 | $9.91 | $7.49 | $9.48 |
| Total ReturnD,E,F | (17.60)% | 5.24% | 16.55% | 32.31% | (19.06)% | 12.06% |
| Ratios to Average Net AssetsG,H | | | | | | |
| Expenses before reductions | 2.69%I | 2.19% | 2.25% | 2.52% | 2.27% | 1.97% |
| Expenses net of fee waivers, if any | 1.65%I | 1.65% | 1.65% | 1.65% | 1.65% | 1.65% |
| Expenses net of all reductions | 1.64%I | 1.64% | 1.64% | 1.62% | 1.64% | 1.64% |
| Net investment income (loss) | .05%I | (.09)% | .14%C | (.07)% | (.41)% | (.85)% |
| Supplemental Data | | | | | | |
| Net assets, end of period (000 omitted) | $3,245 | $4,029 | $3,995 | $3,342 | $2,843 | $4,607 |
| Portfolio turnover rateJ | 26%I | 60% | 160% | 33% | 79% | 101% |
A Calculated based on average shares outstanding during the period.
B Amount represents less than $.005 per share.
C Net Investment income per share reflects a large, non-recurring dividend which amounted to $.03 per share. Excluding this non-recurring dividend, the ratio of net investment income (loss) to average net assets would have been (.11) %.
D Total returns for periods of less than one year are not annualized.
E Total returns would have been lower if certain expenses had not been reduced during the applicable periods shown.
F Total returns do not include the effect of the sales charges.
G Fees and expenses of any underlying Fidelity Central Funds are not included in the Fund's expense ratio. The Fund indirectly bears its proportionate share of the expenses of any underlying Fidelity Central Funds.
H Expense ratios reflect operating expenses of the class. Expenses before reductions do not reflect amounts reimbursed by the investment adviser or reductions from brokerage service arrangements or reductions from other expense offset arrangements and do not represent the amount paid by the class during periods when reimbursements or reductions occur. Expenses net of fee waivers reflect expenses after reimbursement by the investment adviser but prior to reductions from brokerage service arrangements or other expense offset arrangements. Expenses net of all reductions represent the net expenses paid by the class.
I Annualized
J Amount does not include the portfolio activity of any underlying Fidelity Central Funds.
See accompanying notes which are an integral part of the financial statements.
Financial Highlights — Fidelity Advisor Communications Equipment Fund Class B
| | Six months ended (Unaudited) | Years ended July 31, | | | | |
| January 31, | 2016 | 2015 | 2014 | 2013 | 2012 | 2011 |
| Selected Per–Share Data | | | | | | |
| Net asset value, beginning of period | $11.28 | $10.77 | $9.28 | $7.05 | $8.99 | $8.06 |
| Income from Investment Operations | | | | | | |
| Net investment income (loss)A | (.02) | (.07) | (.04)B | (.05) | (.07) | (.13) |
| Net realized and unrealized gain (loss) | (1.96) | .58 | 1.53 | 2.28 | (1.67) | 1.06 |
| Total from investment operations | (1.98) | .51 | 1.49 | 2.23 | (1.74) | .93 |
| Distributions from net realized gain | (.35) | – | – | – | (.20) | – |
| Total distributions | (.35) | – | – | – | (.20) | – |
| Redemption fees added to paid in capitalA,C | – | – | – | – | – | – |
| Net asset value, end of period | $8.95 | $11.28 | $10.77 | $9.28 | $7.05 | $8.99 |
| Total ReturnD,E,F | (17.82)% | 4.74% | 16.06% | 31.63% | (19.56)% | 11.54% |
| Ratios to Average Net AssetsG,H | | | | | | |
| Expenses before reductions | 3.15%I | 2.68% | 2.74% | 3.00% | 2.71% | 2.47% |
| Expenses net of fee waivers, if any | 2.15%I | 2.15% | 2.15% | 2.15% | 2.15% | 2.15% |
| Expenses net of all reductions | 2.15%I | 2.14% | 2.14% | 2.13% | 2.13% | 2.14% |
| Net investment income (loss) | (.45)%I | (.60)% | (.36)%B | (.57)% | (.91)% | (1.35)% |
| Supplemental Data | | | | | | |
| Net assets, end of period (000 omitted) | $205 | $288 | $399 | $480 | $570 | $1,316 |
| Portfolio turnover rateJ | 26%I | 60% | 160% | 33% | 79% | 101% |
A Calculated based on average shares outstanding during the period.
B Net Investment income per share reflects a large, non-recurring dividend which amounted to $.03 per share. Excluding this non-recurring dividend, the ratio of net investment income (loss) to average net assets would have been (.61) %.
C Amount represents less than $.005 per share.
D Total returns for periods of less than one year are not annualized.
E Total returns would have been lower if certain expenses had not been reduced during the applicable periods shown.
F Total returns do not include the effect of the contingent deferred sales charge.
G Fees and expenses of any underlying Fidelity Central Funds are not included in the Fund's expense ratio. The Fund indirectly bears its proportionate share of the expenses of any underlying Fidelity Central Funds.
H Expense ratios reflect operating expenses of the class. Expenses before reductions do not reflect amounts reimbursed by the investment adviser or reductions from brokerage service arrangements or reductions from other expense offset arrangements and do not represent the amount paid by the class during periods when reimbursements or reductions occur. Expenses net of fee waivers reflect expenses after reimbursement by the investment adviser but prior to reductions from brokerage service arrangements or other expense offset arrangements. Expenses net of all reductions represent the net expenses paid by the class.
I Annualized
J Amount does not include the portfolio activity of any underlying Fidelity Central Funds.
See accompanying notes which are an integral part of the financial statements.
Financial Highlights — Fidelity Advisor Communications Equipment Fund Class C
| | Six months ended (Unaudited) | Years ended July 31, | | | | |
| January 31, | 2016 | 2015 | 2014 | 2013 | 2012 | 2011 |
| Selected Per–Share Data | | | | | | |
| Net asset value, beginning of period | $11.27 | $10.76 | $9.28 | $7.05 | $8.98 | $8.06 |
| Income from Investment Operations | | | | | | |
| Net investment income (loss)A | (.02) | (.07) | (.04)B | (.05) | (.07) | (.13) |
| Net realized and unrealized gain (loss) | (1.95) | .58 | 1.52 | 2.28 | (1.66) | 1.05 |
| Total from investment operations | (1.97) | .51 | 1.48 | 2.23 | (1.73) | .92 |
| Distributions from net realized gain | (.35) | – | – | – | (.20) | – |
| Total distributions | (.35) | – | – | – | (.20) | – |
| Redemption fees added to paid in capitalA,C | – | – | – | – | – | – |
| Net asset value, end of period | $8.95 | $11.27 | $10.76 | $9.28 | $7.05 | $8.98 |
| Total ReturnD,E,F | (17.74)% | 4.74% | 15.95% | 31.63% | (19.47)% | 11.41% |
| Ratios to Average Net AssetsG,H | | | | | | |
| Expenses before reductions | 3.15%I | 2.65% | 2.73% | 2.98% | 2.71% | 2.40% |
| Expenses net of fee waivers, if any | 2.15%I | 2.15% | 2.15% | 2.15% | 2.15% | 2.15% |
| Expenses net of all reductions | 2.15%I | 2.14% | 2.14% | 2.12% | 2.14% | 2.14% |
| Net investment income (loss) | (.45)%I | (.59)% | (.35)%B | (.57)% | (.91)% | (1.35)% |
| Supplemental Data | | | | | | |
| Net assets, end of period (000 omitted) | $2,215 | $2,966 | $2,744 | $2,334 | $2,142 | $5,866 |
| Portfolio turnover rateJ | 26%I | 60% | 160% | 33% | 79% | 101% |
A Calculated based on average shares outstanding during the period.
B Net Investment income per share reflects a large, non-recurring dividend which amounted to $.03 per share. Excluding this non-recurring dividend, the ratio of net investment income (loss) to average net assets would have been (.61) %.
C Amount represents less than $.005 per share.
D Total returns for periods of less than one year are not annualized.
E Total returns would have been lower if certain expenses had not been reduced during the applicable periods shown.
F Total returns do not include the effect of the contingent deferred sales charge.
G Fees and expenses of any underlying Fidelity Central Funds are not included in the Fund's expense ratio. The Fund indirectly bears its proportionate share of the expenses of any underlying Fidelity Central Funds.
H Expense ratios reflect operating expenses of the class. Expenses before reductions do not reflect amounts reimbursed by the investment adviser or reductions from brokerage service arrangements or reductions from other expense offset arrangements and do not represent the amount paid by the class during periods when reimbursements or reductions occur. Expenses net of fee waivers reflect expenses after reimbursement by the investment adviser but prior to reductions from brokerage service arrangements or other expense offset arrangements. Expenses net of all reductions represent the net expenses paid by the class.
I Annualized
J Amount does not include the portfolio activity of any underlying Fidelity Central Funds.
See accompanying notes which are an integral part of the financial statements.
Financial Highlights — Fidelity Advisor Communications Equipment Fund Class I
| | Six months ended (Unaudited) | Years ended July 31, | | | | |
| January 31, | 2016 | 2015 | 2014 | 2013 | 2012 | 2011 |
| Selected Per–Share Data | | | | | | |
| Net asset value, beginning of period | $13.01 | $12.35 | $10.55 | $7.95 | $10.00 | $8.88 |
| Income from Investment Operations | | | | | | |
| Net investment income (loss)A | .03 | .05 | .08B | .04 | .01 | (.04) |
| Net realized and unrealized gain (loss) | (2.25) | .67 | 1.72 | 2.58 | (1.86) | 1.16 |
| Total from investment operations | (2.22) | .72 | 1.80 | 2.62 | (1.85) | 1.12 |
| Distributions from net investment income | – | (.06) | – | (.02) | – | – |
| Distributions from net realized gain | (.39) | – | – | – | (.20) | – |
| Total distributions | (.39) | (.06) | – | (.02) | (.20) | – |
| Redemption fees added to paid in capitalA,C | – | – | – | – | – | – |
| Net asset value, end of period | $10.40 | $13.01 | $12.35 | $10.55 | $7.95 | $10.00 |
| Total ReturnD,E | (17.34)% | 5.83% | 17.06% | 32.92% | (18.66)% | 12.61% |
| Ratios to Average Net AssetsF,G | | | | | | |
| Expenses before reductions | 2.02%H | 1.57% | 1.45% | 1.93% | 1.66% | 1.22% |
| Expenses net of fee waivers, if any | 1.15%H | 1.15% | 1.15% | 1.15% | 1.15% | 1.15% |
| Expenses net of all reductions | 1.15%H | 1.14% | 1.14% | 1.12% | 1.13% | 1.14% |
| Net investment income (loss) | .55%H | .41% | .65%B | .43% | .10% | (.35)% |
| Supplemental Data | | | | | | |
| Net assets, end of period (000 omitted) | $790 | $1,024 | $2,592 | $855 | $721 | $2,855 |
| Portfolio turnover rateI | 26%H | 60% | 160% | 33% | 79% | 101% |
A Calculated based on average shares outstanding during the period.
B Net Investment income per share reflects a large, non-recurring dividend which amounted to $.03 per share. Excluding this non-recurring dividend, the ratio of net investment income (loss) to average net assets would have been .39%.
C Amount represents less than $.005 per share.
D Total returns for periods of less than one year are not annualized.
E Total returns would have been lower if certain expenses had not been reduced during the applicable periods shown.
F Fees and expenses of any underlying Fidelity Central Funds are not included in the Fund's expense ratio. The Fund indirectly bears its proportionate share of the expenses of any underlying Fidelity Central Funds.
G Expense ratios reflect operating expenses of the class. Expenses before reductions do not reflect amounts reimbursed by the investment adviser or reductions from brokerage service arrangements or reductions from other expense offset arrangements and do not represent the amount paid by the class during periods when reimbursements or reductions occur. Expenses net of fee waivers reflect expenses after reimbursement by the investment adviser but prior to reductions from brokerage service arrangements or other expense offset arrangements. Expenses net of all reductions represent the net expenses paid by the class.
H Annualized
I Amount does not include the portfolio activity of any underlying Fidelity Central Funds.
See accompanying notes which are an integral part of the financial statements.
Notes to Financial Statements (Unaudited)
For the period ended January 31, 2016
1. Organization.
Fidelity Advisor Communications Equipment Fund (the Fund) is a non-diversified fund of Fidelity Advisor Series VII (the Trust) and is authorized to issue an unlimited number of shares. The Trust is registered under the Investment Company Act of 1940, as amended (the 1940 Act), as an open-end management investment company organized as a Massachusetts business trust. The Fund offers Class A, Class T, Class C and Class I shares, each of which, along with Class B shares, has equal rights as to assets and voting privileges. Class B shares are closed to new accounts and additional purchases, except for exchanges and reinvestments. Each class has exclusive voting rights with respect to matters that affect that class. Class B shares will automatically convert to Class A shares after a holding period of seven years from the initial date of purchase.
During the period, the Board of Trustees approved the conversion of all existing Class B shares into Class A shares, effective on or about July 1, 2016, regardless of the length of times shares have been held.
2. Investments in Fidelity Central Funds.
The Fund invests in Fidelity Central Funds, which are open-end investment companies generally available only to other investment companies and accounts managed by the investment adviser and its affiliates. The Fund's Schedule of Investments lists each of the Fidelity Central Funds held as of period end, if any, as an investment of the Fund, but does not include the underlying holdings of each Fidelity Central Fund. As an Investing Fund, the Fund indirectly bears its proportionate share of the expenses of the underlying Fidelity Central Funds.
The Money Market Central Funds seek preservation of capital and current income and are managed by Fidelity Investments Money Management, Inc. (FIMM), an affiliate of the investment adviser. Annualized expenses of the Money Market Central Funds as of their most recent shareholder report date are less than .005%.
A complete unaudited list of holdings for each Fidelity Central Fund is available upon request or at the Securities and Exchange Commission (the SEC) website at www.sec.gov. In addition, the financial statements of the Fidelity Central Funds are available on the SEC website or upon request.
3. Significant Accounting Policies.
The financial statements have been prepared in conformity with accounting principles generally accepted in the United States of America (GAAP), which require management to make certain estimates and assumptions at the date of the financial statements. Actual results could differ from those estimates. Subsequent events, if any, through the date that the financial statements were issued have been evaluated in the preparation of the financial statements. The following summarizes the significant accounting policies of the Fund:
Investment Valuation. Investments are valued as of 4:00 p.m. Eastern time on the last calendar day of the period. The Board of Trustees (the Board) has delegated the day to day responsibility for the valuation of the Fund's investments to the Fidelity SelectCo, LLC (SelectCo) Fair Value Committee (the Committee). In accordance with valuation policies and procedures approved by the Board, the Fund attempts to obtain prices from one or more third party pricing vendors or brokers to value its investments. When current market prices, quotations or currency exchange rates are not readily available or reliable, investments will be fair valued in good faith by the Committee, in accordance with procedures adopted by the Board. Factors used in determining fair value vary by investment type and may include market or investment specific events. The frequency with which these procedures are used cannot be predicted and they may be utilized to a significant extent. The Committee oversees the Fund's valuation policies and procedures and reports to the Board on the Committee's activities and fair value determinations. The Board monitors the appropriateness of the procedures used in valuing the Fund's investments and ratifies the fair value determinations of the Committee.
The Fund categorizes the inputs to valuation techniques used to value its investments into a disclosure hierarchy consisting of three levels as shown below:
- Level 1 – quoted prices in active markets for identical investments
- Level 2 – other significant observable inputs (including quoted prices for similar investments, interest rates, prepayment speeds, etc.)
- Level 3 – unobservable inputs (including the Fund's own assumptions based on the best information available)
Valuation techniques used to value the Fund's investments by major category are as follows:
Equity securities, including restricted securities, for which market quotations are readily available, are valued at the last reported sale price or official closing price as reported by a third party pricing vendor on the primary market or exchange on which they are traded and are categorized as Level 1 in the hierarchy. In the event there were no sales during the day or closing prices are not available, securities are valued at the last quoted bid price or may be valued using the last available price and are generally categorized as Level 2 in the hierarchy. For foreign equity securities, when market or security specific events arise, comparisons to the valuation of American Depositary Receipts (ADRs), futures contracts, Exchange-Traded Funds (ETFs) and certain indexes as well as quoted prices for similar securities may be used and would be categorized as Level 2 in the hierarchy. Utilizing these techniques may result in transfers between Level 1 and Level 2. For equity securities, including restricted securities, where observable inputs are limited, assumptions about market activity and risk are used and these securities may be categorized as Level 3 in the hierarchy.
Investments in open-end mutual funds, including the Fidelity Central Funds, are valued at their closing net asset value (NAV) each business day and are categorized as Level 1 in the hierarchy.
Changes in valuation techniques may result in transfers in or out of an assigned level within the disclosure hierarchy. The aggregate value of investments by input level as of January 31, 2016 is included at the end of the Fund's Schedule of Investments.
Foreign Currency. The Fund may use foreign currency contracts to facilitate transactions in foreign-denominated securities. Gains and losses from these transactions may arise from changes in the value of the foreign currency or if the counterparties do not perform under the contracts' terms.
Foreign-denominated assets, including investment securities, and liabilities are translated into U.S. dollars at the exchange rates at period end. Purchases and sales of investment securities, income and dividends received and expenses denominated in foreign currencies are translated into U.S. dollars at the exchange rate in effect on the transaction date.
The effects of exchange rate fluctuations on investments are included with the net realized and unrealized gain (loss) on investment securities. Other foreign currency transactions resulting in realized and unrealized gain (loss) are disclosed separately.
Investment Transactions and Income. For financial reporting purposes, the Fund's investment holdings and NAV include trades executed through the end of the last business day of the period. The NAV per share for processing shareholder transactions is calculated as of the close of business of the New York Stock Exchange (NYSE) regular trading hours on the NASDAQ exchange, normally 4:00 p.m. Eastern time and includes trades executed through the end of the prior business day. Gains and losses on securities sold are determined on the basis of identified cost and may include proceeds received from litigation. Dividend income is recorded on the ex-dividend date, except for certain dividends from foreign securities where the ex-dividend date may have passed, which are recorded as soon as the Fund is informed of the ex-dividend date. Non-cash dividends included in dividend income, if any, are recorded at the fair market value of the securities received. Income and capital gain distributions from Fidelity Central Funds, if any, are recorded on the ex-dividend date. Distributions received on securities that represent a return of capital or capital gain are recorded as a reduction of cost of investments and/or as a realized gain. Subsequent to ex-dividend date the Fund determines the components of these distributions, based upon receipt of tax filings or other correspondence relating to the underlying investment. Investment income is recorded net of foreign taxes withheld where recovery of such taxes is uncertain.
Class Allocations and Expenses. Investment income, realized and unrealized capital gains and losses, common expenses of the Fund, and certain fund-level expense reductions, if any, are allocated daily on a pro-rata basis to each class based on the relative net assets of each class to the total net assets of the Fund. Each class differs with respect to transfer agent and distribution and service plan fees incurred. Certain expense reductions may also differ by class. For the reporting period, the allocated portion of income and expenses to each class as a percent of its average net assets may vary due to the timing of recording these transactions in relation to fluctuating net assets of the classes. Expenses directly attributable to a fund are charged to that fund. Expenses attributable to more than one fund are allocated among the respective funds on the basis of relative net assets or other appropriate methods. Expense estimates are accrued in the period to which they relate and adjustments are made when actual amounts are known.
Income Tax Information and Distributions to Shareholders. Each year, the Fund intends to qualify as a regulated investment company under Subchapter M of the Internal Revenue Code, including distributing substantially all of its taxable income and realized gains. As a result, no provision for U.S. Federal income taxes is required. The Fund files a U.S. federal tax return, in addition to state and local tax returns as required. The Fund's federal income tax returns are subject to examination by the Internal Revenue Service (IRS) for a period of three fiscal years after they are filed. State and local tax returns may be subject to examination for an additional fiscal year depending on the jurisdiction. Foreign taxes are provided for based on the Fund's understanding of the tax rules and rates that exist in the foreign markets in which it invests.
Distributions are declared and recorded on the ex-dividend date. Income dividends and capital gain distributions are declared separately for each class. Income and capital gain distributions are determined in accordance with income tax regulations, which may differ from GAAP.
Capital accounts within the financial statements are adjusted for permanent book-tax differences. These adjustments have no impact on net assets or the results of operations. Capital accounts are not adjusted for temporary book-tax differences which will reverse in a subsequent period.
Book-tax differences are primarily due to foreign currency transactions, net operating losses, capital loss carryforwards and losses deferred due to wash sales.
The federal tax cost of investment securities and unrealized appreciation (depreciation) as of period end were as follows:
| Gross unrealized appreciation | $979,370 |
| Gross unrealized depreciation | (1,446,153) |
| Net unrealized appreciation (depreciation) on securities | $(466,783) |
| Tax cost | $11,025,187 |
Short-Term Trading (Redemption) Fees. Shares held by investors in the Fund less than 30 days may have been subject to a redemption fee equal to .75% of the NAV of shares redeemed. All redemption fees, which reduce the proceeds of the shareholder redemption, are retained by the Fund and accounted for as an addition to paid in capital.
4. Purchases and Sales of Investments.
Purchases and sales of securities, other than short-term securities, aggregated $1,543,342 and $2,173,925, respectively.
5. Fees and Other Transactions with Affiliates.
Management Fee. Fidelity SelectCo, LLC (the investment adviser) and its affiliates provide the Fund with investment management related services for which the Fund pays a monthly management fee. The management fee is the sum of an individual fund fee rate that is based on an annual rate of .30% of the Fund's average net assets and an annualized group fee rate that averaged .25% during the period. The group fee rate is based upon the average net assets of all the mutual funds advised by Fidelity Management & Research Company (FMR) and the investment adviser. The group fee rate decreases as assets under management increase and increases as assets under management decrease. For the reporting period, the total annualized management fee rate was .55% of the Fund's average net assets.
Distribution and Service Plan Fees. In accordance with Rule 12b-1 of the 1940 Act, the Fund has adopted separate Distribution and Service Plans for each class of shares. Certain classes pay Fidelity Distributors Corporation (FDC), an affiliate of the investment adviser, separate Distribution and Service Fees, each of which is based on an annual percentage of each class' average net assets. In addition, FDC may pay financial intermediaries for selling shares of the Fund and providing shareholder support services. For the period, the Distribution and Service Fee rates, total fees and amounts retained by FDC were as follows:
| | Distribution
Fee | Service
Fee | Total Fees | Retained
by FDC |
| Class A | -% | .25% | $5,394 | $– |
| Class T | .25% | .25% | 9,124 | – |
| Class B | .75% | .25% | 1,216 | 912 |
| Class C | .75% | .25% | 12,691 | 1,795 |
| | | | $28,425 | $2,707 |
Sales Load. FDC may receive a front-end sales charge of up to 5.75% for selling Class A shares and 3.50% for selling Class T shares, some of which is paid to financial intermediaries for selling shares of the Fund. Depending on the holding period, FDC may receive contingent deferred sales charges levied on Class A, Class T, Class B, and Class C redemptions. The deferred sales charges range from 5.00% to 1.00% for Class B shares, 1.00% for Class C shares, 1.00% for certain purchases of Class A shares and .25% for certain purchases of Class T shares.
For the period, sales charge amounts retained by FDC were as follows:
| | Retained
by FDC |
| Class A | $1,325 |
| Class T | 580 |
| Class B(a) | 25 |
| Class C(a) | 318 |
| | $2,248 |
(a) When Class B and Class C shares are initially sold, FDC pays commissions from its own resources to financial intermediaries through which the sales are made.
Transfer Agent Fees. Fidelity Investments Institutional Operations Company, Inc., (FIIOC), an affiliate of the investment adviser, is the transfer, dividend disbursing and shareholder servicing agent for each class of the Fund. FIIOC receives account fees and asset-based fees that vary according to the account size and type of account of the shareholders of the respective classes of the Fund. FIIOC pays for typesetting, printing and mailing of shareholder reports, except proxy statements.
For the period, transfer agent fees for each class were as follows:
| | Amount | % of
Class-Level Average
Net Assets(a) |
| Class A | $6,695 | .31 |
| Class T | 6,564 | .36 |
| Class B | 366 | .30 |
| Class C | 3,998 | .31 |
| Class I | 844 | .19 |
| | $ 18,467 | |
(a) Annualized
Accounting and Security Lending Fees. Fidelity Service Company, Inc. (FSC), an affiliate of the investment adviser, maintains the Fund's accounting records. The accounting fee is based on the level of average net assets for each month. Under a separate contract, FSC administers the security lending program. The security lending fee is based on the number and duration of lending transactions.
Brokerage Commissions. The Fund placed a portion of its portfolio transactions with brokerage firms which are affiliates of the investment adviser. Brokerage commissions are included in net realized gain (loss) and change in net unrealized appreciation (depreciation) in the Statement of Operations. The commissions paid to these affiliated firms were $111 for the period.
Interfund Trades. The Fundmay purchase from or sell securities to other Fidelity Funds under procedures adopted by the Board. The procedures have been designed to ensure these interfund trades are executed in accordance with Rule 17a-7 of the 1940 Act. Interfund trades are included within the respective purchases and sales amounts shown in the Purchases and Sales of Investments note.
6. Committed Line of Credit.
The Fund participates with other funds managed by the investment adviser or an affiliate in a $4.25 billion credit facility (the "line of credit") to be utilized for temporary or emergency purposes to fund shareholder redemptions or for other short-term liquidity purposes. The Fund has agreed to pay commitment fees on its pro-rata portion of the line of credit, which amounted to $8 and is reflected in Miscellaneous expenses on the Statement of Operations. During the period, the Fund did not borrow on this line of credit.
7. Security Lending.
The Fund lends portfolio securities through a lending agent from time to time in order to earn additional income. On the settlement date of the loan, the Fund receives collateral (in the form of U.S. Treasury obligations, letters of credit and/or cash) against the loaned securities and maintains collateral in an amount not less than 100% of the market value of the loaned securities during the period of the loan. The market value of the loaned securities is determined at the close of business of the Fund and any additional required collateral is delivered to the Fund on the next business day. The Fund or borrower may terminate the loan at any time, and if the borrower defaults on its obligation to return the securities loaned because of insolvency or other reasons, the Fund may apply collateral received from the borrower against the obligation. The Fund may experience delays and costs in recovering the securities loaned. Any cash collateral received is invested in the Fidelity Securities Lending Cash Central Fund. The value of loaned securities and cash collateral at period end are disclosed on the Fund's Statement of Assets and Liabilities. Security lending income represents the income earned on investing cash collateral, less rebates paid to borrowers and any lending agent fees associated with the loan, plus any premium payments received for lending certain types of securities. Security lending income is presented in the Statement of Operations as a component of income from Fidelity Central Funds. Total security lending income during the period amounted to $713.
8. Expense Reductions.
The investment adviser voluntarily agreed to reimburse each class to the extent annual operating expenses exceeded certain levels of average net assets as noted in the table below. Some expenses, for example interest expense, including commitment fees, are excluded from this reimbursement.
The following classes were in reimbursement during the period:
| | Expense
Limitations | Reimbursement |
| Class A | 1.40% | $21,450 |
| Class T | 1.65% | 19,100 |
| Class B | 2.15% | 1,214 |
| Class C | 2.15% | 12,621 |
| Class I | 1.15% | 3,913 |
| | | $58,298 |
Commissions paid to certain brokers with whom the investment adviser, or its affiliates, places trades on behalf of the Fund include an amount in addition to trade execution, which may be rebated back to the Fund to offset certain expenses. This amount totaled $223 for the period.
In addition, during the period the investment advisor reimbursed and/or waived a portion of fund-level operating expenses in the amount of $41.
9. Distributions to Shareholders.
Distributions to shareholders of each class were as follows:
| | Six months ended January 31, 2016 | Year ended July 31, 2015 |
| From net investment income | | |
| Class A | $– | $11,846 |
| Class T | – | 1,754 |
| Class I | – | 11,722 |
| Total | $– | $25,322 |
| From net realized gain | | |
| Class A | $140,942 | $– |
| Class T | 120,506 | – |
| Class B | 8,665 | – |
| Class C | 87,907 | – |
| Class I | 29,305 | – |
| Total | $387,325 | $– |
10. Share Transactions.
Share transactions for each class were as follows and may contain automatic conversions between classes or exchanges between affiliated funds:
| | Shares | Shares | Dollars | Dollars |
| | Six months ended January 31, 2016 | Year ended July 31, 2015 | Six months ended January 31, 2016 | Year ended July 31, 2015 |
| Class A | | | | |
| Shares sold | 25,373 | 153,268 | $283,828 | $1,925,058 |
| Reinvestment of distributions | 12,164 | 914 | 134,093 | 11,238 |
| Shares redeemed | (34,391) | (167,571) | (380,784) | (2,111,373) |
| Net increase (decrease) | 3,146 | (13,389) | $37,137 | $(175,077) |
| Class T | | | | |
| Shares sold | 15,956 | 42,233 | $173,003 | $505,832 |
| Reinvestment of distributions | 11,237 | 146 | 119,674 | 1,738 |
| Shares redeemed | (23,665) | (56,809) | (254,428) | (686,152) |
| Net increase (decrease) | 3,528 | (14,430) | $38,249 | $(178,582) |
| Class B | | | | |
| Shares sold | – | – | $3 | $– |
| Reinvestment of distributions | 803 | – | 7,933 | – |
| Shares redeemed | (3,496) | (11,477) | (35,958) | (128,010) |
| Net increase (decrease) | (2,693) | (11,477) | $(28,022) | $(128,010) |
| Class C | | | | |
| Shares sold | 12,542 | 55,503 | $124,780 | $631,530 |
| Reinvestment of distributions | 8,306 | – | 81,979 | – |
| Shares redeemed | (36,403) | (47,426) | (370,346) | (530,907) |
| Net increase (decrease) | (15,555) | 8,077 | $(163,587) | $100,623 |
| Class I | | | | |
| Shares sold | 4,285 | 18,312 | $50,030 | $232,557 |
| Reinvestment of distributions | 2,247 | 868 | 25,646 | 11,030 |
| Shares redeemed | (9,183) | (150,382) | (106,822) | (2,006,379) |
| Net increase (decrease) | (2,651) | (131,202) | $(31,146) | $(1,762,792) |
11. Other.
The Fund's organizational documents provide former and current trustees and officers with a limited indemnification against liabilities arising in connection with the performance of their duties to the Fund. In the normal course of business, the Fund may also enter into contracts that provide general indemnifications. The Fund's maximum exposure under these arrangements is unknown as this would be dependent on future claims that may be made against the Fund. The risk of material loss from such claims is considered remote.
Fidelity Advisor® Consumer Discretionary Fund
Investment Summary (Unaudited)
Top Ten Stocks as of January 31, 2016
| | % of fund's net assets | % of fund's net assets 6 months ago |
| Amazon.com, Inc. | 10.3 | 7.1 |
| Home Depot, Inc. | 8.4 | 4.5 |
| The Walt Disney Co. | 7.5 | 8.0 |
| L Brands, Inc. | 5.4 | 4.2 |
| Starbucks Corp. | 4.6 | 4.6 |
| Ross Stores, Inc. | 4.3 | 2.3 |
| NIKE, Inc. Class B | 4.2 | 4.6 |
| Charter Communications, Inc. Class A | 3.9 | 1.3 |
| Comcast Corp. Class A | 2.8 | 5.4 |
| VF Corp. | 2.8 | 0.0 |
| | 54.2 | |
Top Industries (% of fund's net assets)
| As of January 31, 2016 |
| | Specialty Retail | 24.8% |
| | Media | 20.0% |
| | Hotels, Restaurants & Leisure | 16.6% |
| | Internet & Catalog Retail | 12.5% |
| | Textiles, Apparel & Luxury Goods | 9.7% |
| | All Others* | 16.4% |

| As of July 31, 2015 |
| | Media | 23.0% |
| | Hotels, Restaurants & Leisure | 22.3% |
| | Specialty Retail | 17.9% |
| | Internet & Catalog Retail | 8.1% |
| | Textiles, Apparel & Luxury Goods | 6.2% |
| | All Others* | 22.5% |

* Includes Short-Term investments and Net Other Assets (Liabilities).
Percentages shown as 0.0% may reflect amounts less than 0.05%.
Fidelity Advisor® Consumer Discretionary Fund
Investments January 31, 2016 (Unaudited)
Showing Percentage of Net Assets
| Common Stocks - 97.4% | | | |
| | | Shares | Value |
| Auto Components - 3.4% | | | |
| Auto Parts & Equipment - 3.4% | | | |
| Delphi Automotive PLC | | 76,184 | $4,947,389 |
| Tenneco, Inc. (a) | | 111,800 | 4,271,878 |
| Visteon Corp. | | 27,900 | 1,865,952 |
| | | | 11,085,219 |
| Automobiles - 0.2% | | | |
| Automobile Manufacturers - 0.2% | | | |
| Ferrari NV (a) | | 16,700 | 664,159 |
| Beverages - 1.9% | | | |
| Distillers & Vintners - 0.8% | | | |
| Constellation Brands, Inc. Class A (sub. vtg.) | | 17,627 | 2,687,765 |
| Soft Drinks - 1.1% | | | |
| Monster Beverage Corp. | | 26,500 | 3,578,295 |
|
| TOTAL BEVERAGES | | | 6,266,060 |
|
| Food Products - 0.3% | | | |
| Packaged Foods & Meats - 0.3% | | | |
| Associated British Foods PLC | | 21,300 | 960,920 |
| Hotels, Restaurants & Leisure - 16.6% | | | |
| Casinos & Gaming - 2.1% | | | |
| Las Vegas Sands Corp. | | 146,380 | 6,601,738 |
| Hotels, Resorts & Cruise Lines - 5.0% | | | |
| Accor SA | | 108,394 | 4,116,617 |
| Hilton Worldwide Holdings, Inc. | | 485,000 | 8,637,850 |
| Royal Caribbean Cruises Ltd. | | 40,000 | 3,278,400 |
| | | | 16,032,867 |
| Leisure Facilities - 1.6% | | | |
| Vail Resorts, Inc. | | 41,800 | 5,225,000 |
| Restaurants - 7.9% | | | |
| Chipotle Mexican Grill, Inc. (a) | | 1,700 | 770,049 |
| McDonald's Corp. | | 59,000 | 7,303,020 |
| Ruth's Hospitality Group, Inc. | | 162,800 | 2,645,500 |
| Starbucks Corp. | | 245,576 | 14,923,654 |
| | | | 25,642,223 |
|
| TOTAL HOTELS, RESTAURANTS & LEISURE | | | 53,501,828 |
|
| Household Durables - 4.0% | | | |
| Home Furnishings - 0.9% | | | |
| Tempur Sealy International, Inc. (a) | | 49,000 | 2,956,660 |
| Homebuilding - 1.5% | | | |
| PulteGroup, Inc. | | 288,600 | 4,836,936 |
| Household Appliances - 1.6% | | | |
| Techtronic Industries Co. Ltd. | | 1,333,500 | 5,059,569 |
|
| TOTAL HOUSEHOLD DURABLES | | | 12,853,165 |
|
| Household Products - 1.7% | | | |
| Household Products - 1.7% | | | |
| Spectrum Brands Holdings, Inc. | | 57,010 | 5,418,230 |
| Internet & Catalog Retail - 12.5% | | | |
| Internet Retail - 12.5% | | | |
| Amazon.com, Inc. (a) | | 56,480 | 33,153,760 |
| Netflix, Inc. (a) | | 27,900 | 2,562,336 |
| Ocado Group PLC (a)(b) | | 1,215,940 | 4,599,783 |
| | | | 40,315,879 |
| Internet Software & Services - 1.0% | | | |
| Internet Software & Services - 1.0% | | | |
| Alibaba Group Holding Ltd. sponsored ADR (a) | | 48,000 | 3,217,440 |
| Media - 20.0% | | | |
| Advertising - 1.1% | | | |
| Interpublic Group of Companies, Inc. | | 153,400 | 3,442,296 |
| Broadcasting - 2.4% | | | |
| ITV PLC | | 2,041,229 | 7,803,361 |
| Cable & Satellite - 7.8% | | | |
| Charter Communications, Inc. Class A (a)(b) | | 72,420 | 12,409,891 |
| Comcast Corp. Class A | | 163,000 | 9,080,730 |
| Naspers Ltd. Class N | | 28,470 | 3,597,843 |
| | | | 25,088,464 |
| Movies & Entertainment - 8.7% | | | |
| The Walt Disney Co. | | 253,306 | 24,271,781 |
| Time Warner, Inc. | | 56,100 | 3,951,684 |
| | | | 28,223,465 |
|
| TOTAL MEDIA | | | 64,557,586 |
|
| Multiline Retail - 0.9% | | | |
| Department Stores - 0.1% | | | |
| Macy's, Inc. | | 10,200 | 412,182 |
| General Merchandise Stores - 0.8% | | | |
| B&M European Value Retail S.A. | | 640,985 | 2,574,797 |
|
| TOTAL MULTILINE RETAIL | | | 2,986,979 |
|
| Software - 0.4% | | | |
| Application Software - 0.4% | | | |
| Mobileye NV (a)(b) | | 43,400 | 1,177,442 |
| Specialty Retail - 24.8% | | | |
| Apparel Retail - 12.8% | | | |
| Inditex SA | | 75,937 | 2,499,029 |
| L Brands, Inc. | | 183,100 | 17,605,065 |
| Ross Stores, Inc. | | 245,920 | 13,835,459 |
| TJX Companies, Inc. | | 44,908 | 3,199,246 |
| United Arrows Ltd. | | 14,200 | 686,827 |
| Zumiez, Inc. (a)(b) | | 197,848 | 3,583,027 |
| | | | 41,408,653 |
| Automotive Retail - 3.6% | | | |
| AutoZone, Inc. (a) | | 9,380 | 7,198,118 |
| O'Reilly Automotive, Inc. (a) | | 17,700 | 4,617,930 |
| | | | 11,816,048 |
| Home Improvement Retail - 8.4% | | | |
| Home Depot, Inc. | | 214,960 | 27,033,370 |
|
| TOTAL SPECIALTY RETAIL | | | 80,258,071 |
|
| Textiles, Apparel & Luxury Goods - 9.7% | | | |
| Apparel, Accessories & Luxury Goods - 5.5% | | | |
| G-III Apparel Group Ltd. (a) | | 170,680 | 8,424,765 |
| Regina Miracle International Holdings Ltd. (a) | | 157,635 | 258,012 |
| VF Corp. | | 143,780 | 9,000,628 |
| | | | 17,683,405 |
| Footwear - 4.2% | | | |
| NIKE, Inc. Class B | | 218,434 | 13,545,092 |
|
| TOTAL TEXTILES, APPAREL & LUXURY GOODS | | | 31,228,497 |
|
| TOTAL COMMON STOCKS | | | |
| (Cost $300,396,023) | | | 314,491,475 |
|
| Money Market Funds - 6.4% | | | |
| Fidelity Cash Central Fund, 0.38% (c) | | 3,891,803 | 3,891,803 |
| Fidelity Securities Lending Cash Central Fund, 0.42% (c)(d) | | 16,918,411 | 16,918,411 |
| TOTAL MONEY MARKET FUNDS | | | |
| (Cost $20,810,214) | | | 20,810,214 |
| TOTAL INVESTMENT PORTFOLIO - 103.8% | | | |
| (Cost $321,206,237) | | | 335,301,689 |
| NET OTHER ASSETS (LIABILITIES) - (3.8)% | | | (12,410,782) |
| NET ASSETS - 100% | | | $322,890,907 |
Legend
(a) Non-income producing
(b) Security or a portion of the security is on loan at period end.
(c) Affiliated fund that is generally available only to investment companies and other accounts managed by Fidelity Investments. The rate quoted is the annualized seven-day yield of the fund at period end. A complete unaudited listing of the fund's holdings as of its most recent quarter end is available upon request. In addition, each Fidelity Central Fund's financial statements are available on the SEC's website or upon request.
(d) Investment made with cash collateral received from securities on loan.
Affiliated Central Funds
Information regarding fiscal year to date income earned by the Fund from investments in Fidelity Central Funds is as follows:
| Fund | Income earned |
| Fidelity Cash Central Fund | $14,057 |
| Fidelity Securities Lending Cash Central Fund | 97,898 |
| Total | $111,955 |
Investment Valuation
The following is a summary of the inputs used, as of January 31, 2016, involving the Fund's assets and liabilities carried at fair value. The inputs or methodology used for valuing securities may not be an indication of the risk associated with investing in those securities. For more information on valuation inputs, and their aggregation into the levels used below, please refer to the Investment Valuation section in the accompanying Notes to Financial Statements.
| | Valuation Inputs at Reporting Date: |
| Description | Total | Level 1 | Level 2 | Level 3 |
| Investments in Securities: | | | | |
| Common Stocks | $314,491,475 | $282,334,717 | $32,156,758 | $-- |
| Money Market Funds | 20,810,214 | 20,810,214 | -- | -- |
| Total Investments in Securities: | $335,301,689 | $303,144,931 | $32,156,758 | $-- |
The following is a summary of transfers between Level 1 and Level 2 for the period ended January 31, 2016. Transfers are assumed to have occurred at the beginning of the period, and are primarily attributable to the valuation techniques used for foreign equity securities, as discussed in the accompanying Notes to Financial Statements:
| Transfers | Total |
| Level 1 to Level 2 | $17,056,474 |
| Level 2 to Level 1 | $0 |
Other Information
Distribution of investments by country or territory of incorporation, as a percentage of Total Net Assets, is as follows (Unaudited):
| United States of America | 85.9% |
| United Kingdom | 4.9% |
| Hong Kong | 1.6% |
| Bailiwick of Jersey | 1.5% |
| France | 1.3% |
| South Africa | 1.1% |
| Cayman Islands | 1.1% |
| Liberia | 1.0% |
| Others (Individually Less Than 1%) | 1.6% |
| | 100.0% |
See accompanying notes which are an integral part of the financial statements.
Fidelity Advisor® Consumer Discretionary Fund
Financial Statements
Statement of Assets and Liabilities
| | | January 31, 2016 (Unaudited) |
| Assets | | |
Investment in securities, at value (including securities loaned of $16,678,920) — See accompanying schedule:
Unaffiliated issuers (cost $300,396,023) | $314,491,475 | |
| Fidelity Central Funds (cost $20,810,214) | 20,810,214 | |
| Total Investments (cost $321,206,237) | | $335,301,689 |
| Cash | | 11,146 |
| Receivable for investments sold | | 6,966,445 |
| Receivable for fund shares sold | | 742,430 |
| Dividends receivable | | 17,097 |
| Distributions receivable from Fidelity Central Funds | | 24,948 |
| Prepaid expenses | | 901 |
| Other receivables | | 2,641 |
| Total assets | | 343,067,297 |
| Liabilities | | |
| Payable for investments purchased | $2,371,880 | |
| Payable for fund shares redeemed | 539,092 | |
| Accrued management fee | 148,835 | |
| Distribution and service plan fees payable | 94,288 | |
| Other affiliated payables | 69,612 | |
| Other payables and accrued expenses | 34,272 | |
| Collateral on securities loaned, at value | 16,918,411 | |
| Total liabilities | | 20,176,390 |
| Net Assets | | $322,890,907 |
| Net Assets consist of: | | |
| Paid in capital | | $320,992,543 |
| Distributions in excess of net investment income | | (104,787) |
| Accumulated undistributed net realized gain (loss) on investments and foreign currency transactions | | (12,091,077) |
| Net unrealized appreciation (depreciation) on investments and assets and liabilities in foreign currencies | | 14,094,228 |
| Net Assets | | $322,890,907 |
| Calculation of Maximum Offering Price | | |
| Class A: | | |
| Net Asset Value and redemption price per share ($140,340,362 ÷ 7,346,678 shares) | | $19.10 |
| Maximum offering price per share (100/94.25 of $19.10) | | $20.27 |
| Class T: | | |
| Net Asset Value and redemption price per share ($26,138,734 ÷ 1,455,054 shares) | | $17.96 |
| Maximum offering price per share (100/96.50 of $17.96) | | $18.61 |
| Class B: | | |
| Net Asset Value and offering price per share ($1,182,922 ÷ 75,275 shares)(a) | | $15.71 |
| Class C: | | |
| Net Asset Value and offering price per share ($64,407,057 ÷ 4,094,933 shares)(a) | | $15.73 |
| Class I: | | |
| Net Asset Value, offering price and redemption price per share ($90,821,832 ÷ 4,433,849 shares) | | $20.48 |
(a) Redemption price per share is equal to net asset value less any applicable contingent deferred sales charge.
See accompanying notes which are an integral part of the financial statements.
Statement of Operations
| | | Six months ended January 31, 2016 (Unaudited) |
| Investment Income | | |
| Dividends | | $1,823,714 |
| Income from Fidelity Central Funds (including $97,898 from security lending) | | 111,955 |
| Total income | | 1,935,669 |
| Expenses | | |
| Management fee | $804,009 | |
| Transfer agent fees | 309,103 | |
| Distribution and service plan fees | 513,774 | |
| Accounting and security lending fees | 58,682 | |
| Custodian fees and expenses | 6,854 | |
| Independent trustees' compensation | 2,557 | |
| Registration fees | 74,160 | |
| Audit | 23,761 | |
| Legal | 1,191 | |
| Miscellaneous | 1,290 | |
| Total expenses before reductions | 1,795,381 | |
| Expense reductions | (5,277) | 1,790,104 |
| Net investment income (loss) | | 145,565 |
| Realized and Unrealized Gain (Loss) | | |
| Net realized gain (loss) on: | | |
| Investment securities: | | |
| Unaffiliated issuers | (11,789,944) | |
| Foreign currency transactions | 13,094 | |
| Total net realized gain (loss) | | (11,776,850) |
Change in net unrealized appreciation (depreciation) on:
Investment securities (net of decrease in deferred foreign taxes of $15,238) | (17,481,793) | |
| Assets and liabilities in foreign currencies | (269) | |
| Total change in net unrealized appreciation (depreciation) | | (17,482,062) |
| Net gain (loss) | | (29,258,912) |
| Net increase (decrease) in net assets resulting from operations | | $(29,113,347) |
See accompanying notes which are an integral part of the financial statements.
Statement of Changes in Net Assets
| | Six months ended January 31, 2016 (Unaudited) | Year ended July 31, 2015 |
| Increase (Decrease) in Net Assets | | |
| Operations | | |
| Net investment income (loss) | $145,565 | $218,833 |
| Net realized gain (loss) | (11,776,850) | 7,993,991 |
| Change in net unrealized appreciation (depreciation) | (17,482,062) | 21,200,743 |
| Net increase (decrease) in net assets resulting from operations | (29,113,347) | 29,413,567 |
| Distributions to shareholders from net investment income | (425,920) | – |
| Distributions to shareholders from net realized gain | (5,484,780) | (13,923,456) |
| Total distributions | (5,910,700) | (13,923,456) |
| Share transactions - net increase (decrease) | 123,148,784 | 97,114,685 |
| Redemption fees | 25,847 | 10,114 |
| Total increase (decrease) in net assets | 88,150,584 | 112,614,910 |
| Net Assets | | |
| Beginning of period | 234,740,323 | 122,125,413 |
| End of period (including distributions in excess of net investment income of $104,787 and undistributed net investment income of $175,568, respectively) | $322,890,907 | $234,740,323 |
See accompanying notes which are an integral part of the financial statements.
Financial Highlights — Fidelity Advisor Consumer Discretionary Fund Class A
| | Six months ended (Unaudited) | Years ended July 31, | | | | |
| January 31, | 2016 | 2015 | 2014 | 2013 | 2012 | 2011 |
| Selected Per–Share Data | | | | | | |
| Net asset value, beginning of period | $21.51 | $19.75 | $19.59 | $16.22 | $16.00 | $12.75 |
| Income from Investment Operations | | | | | | |
| Net investment income (loss)A | .02 | .05 | (.04) | (.02) | .01 | (.02) |
| Net realized and unrealized gain (loss) | (1.97) | 3.99 | 1.75 | 5.04 | 1.07 | 3.27 |
| Total from investment operations | (1.95) | 4.04 | 1.71 | 5.02 | 1.08 | 3.25 |
| Distributions from net investment income | (.02) | – | – | – | (.03) | – |
| Distributions from net realized gain | (.44) | (2.28) | (1.55) | (1.65) | (.83) | – |
| Total distributions | (.46) | (2.28) | (1.55) | (1.65) | (.86) | – |
| Redemption fees added to paid in capitalA,B | – | – | – | – | – | – |
| Net asset value, end of period | $19.10 | $21.51 | $19.75 | $19.59 | $16.22 | $16.00 |
| Total ReturnC,D,E | (9.14)% | 22.26% | 9.28% | 33.65% | 7.96% | 25.49% |
| Ratios to Average Net AssetsF,G | | | | | | |
| Expenses before reductions | 1.12%H | 1.15% | 1.20% | 1.31% | 1.38% | 1.39% |
| Expenses net of fee waivers, if any | 1.12%H | 1.15% | 1.20% | 1.31% | 1.38% | 1.39% |
| Expenses net of all reductions | 1.12%H | 1.14% | 1.19% | 1.29% | 1.37% | 1.38% |
| Net investment income (loss) | .20%H | .27% | (.21)% | (.10)% | .04% | (.15)% |
| Supplemental Data | | | | | | |
| Net assets, end of period (000 omitted) | $140,340 | $115,027 | $59,089 | $45,292 | $26,547 | $23,447 |
| Portfolio turnover rateI | 59%H | 71% | 171% | 146% | 217% | 179% |
A Calculated based on average shares outstanding during the period.
B Amount represents less than $.005 per share.
C Total returns for periods of less than one year are not annualized.
D Total returns would have been lower if certain expenses had not been reduced during the applicable periods shown.
E Total returns do not include the effect of the sales charges.
F Fees and expenses of any underlying Fidelity Central Funds are not included in the Fund's expense ratio. The Fund indirectly bears its proportionate share of the expenses of any underlying Fidelity Central Funds.
G Expense ratios reflect operating expenses of the class. Expenses before reductions do not reflect amounts reimbursed by the investment adviser or reductions from brokerage service arrangements or reductions from other expense offset arrangements and do not represent the amount paid by the class during periods when reimbursements or reductions occur. Expenses net of fee waivers reflect expenses after reimbursement by the investment adviser but prior to reductions from brokerage service arrangements or other expense offset arrangements. Expenses net of all reductions represent the net expenses paid by the class.
H Annualized
I Amount does not include the portfolio activity of any underlying Fidelity Central Funds.
See accompanying notes which are an integral part of the financial statements.
Financial Highlights — Fidelity Advisor Consumer Discretionary Fund Class T
| | Six months ended (Unaudited) | Years ended July 31, | | | | |
| January 31, | 2016 | 2015 | 2014 | 2013 | 2012 | 2011 |
| Selected Per–Share Data | | | | | | |
| Net asset value, beginning of period | $20.26 | $18.75 | $18.68 | $15.57 | $15.43 | $12.32 |
| Income from Investment Operations | | | | | | |
| Net investment income (loss)A | (.01) | (.01) | (.10) | (.06) | (.03) | (.06) |
| Net realized and unrealized gain (loss) | (1.85) | 3.77 | 1.67 | 4.81 | 1.02 | 3.17 |
| Total from investment operations | (1.86) | 3.76 | 1.57 | 4.75 | .99 | 3.11 |
| Distributions from net investment income | – | – | – | – | (.02) | – |
| Distributions from net realized gain | (.44) | (2.25) | (1.50) | (1.64) | (.83) | – |
| Total distributions | (.44) | (2.25) | (1.50) | (1.64) | (.85) | – |
| Redemption fees added to paid in capitalA,B | – | – | – | – | – | – |
| Net asset value, end of period | $17.96 | $20.26 | $18.75 | $18.68 | $15.57 | $15.43 |
| Total ReturnC,D,E | (9.26)% | 21.92% | 8.94% | 33.25% | 7.62% | 25.24% |
| Ratios to Average Net AssetsF,G | | | | | | |
| Expenses before reductions | 1.43%H | 1.46% | 1.50% | 1.60% | 1.64% | 1.66% |
| Expenses net of fee waivers, if any | 1.42%H | 1.45% | 1.50% | 1.60% | 1.64% | 1.65% |
| Expenses net of all reductions | 1.42%H | 1.45% | 1.49% | 1.58% | 1.63% | 1.64% |
| Net investment income (loss) | (.10)%H | (.03)% | (.51)% | (.39)% | (.23)% | (.40)% |
| Supplemental Data | | | | | | |
| Net assets, end of period (000 omitted) | $26,139 | $25,948 | $18,779 | $15,613 | $10,447 | $9,897 |
| Portfolio turnover rateI | 59%H | 71% | 171% | 146% | 217% | 179% |
A Calculated based on average shares outstanding during the period.
B Amount represents less than $.005 per share.
C Total returns for periods of less than one year are not annualized.
D Total returns would have been lower if certain expenses had not been reduced during the applicable periods shown.
E Total returns do not include the effect of the sales charges.
F Fees and expenses of any underlying Fidelity Central Funds are not included in the Fund's expense ratio. The Fund indirectly bears its proportionate share of the expenses of any underlying Fidelity Central Funds.
G Expense ratios reflect operating expenses of the class. Expenses before reductions do not reflect amounts reimbursed by the investment adviser or reductions from brokerage service arrangements or reductions from other expense offset arrangements and do not represent the amount paid by the class during periods when reimbursements or reductions occur. Expenses net of fee waivers reflect expenses after reimbursement by the investment adviser but prior to reductions from brokerage service arrangements or other expense offset arrangements. Expenses net of all reductions represent the net expenses paid by the class.
H Annualized
I Amount does not include the portfolio activity of any underlying Fidelity Central Funds.
See accompanying notes which are an integral part of the financial statements.
Financial Highlights — Fidelity Advisor Consumer Discretionary Fund Class B
| | Six months ended (Unaudited) | Years ended July 31, | | | | |
| January 31, | 2016 | 2015 | 2014 | 2013 | 2012 | 2011 |
| Selected Per–Share Data | | | | | | |
| Net asset value, beginning of period | $17.83 | $16.76 | $16.85 | $14.23 | $14.23 | $11.42 |
| Income from Investment Operations | | | | | | |
| Net investment income (loss)A | (.05) | (.09) | (.17) | (.13) | (.10) | (.12) |
| Net realized and unrealized gain (loss) | (1.63) | 3.34 | 1.49 | 4.36 | .93 | 2.93 |
| Total from investment operations | (1.68) | 3.25 | 1.32 | 4.23 | .83 | 2.81 |
| Distributions from net investment income | – | – | – | – | – | – |
| Distributions from net realized gain | (.44) | (2.18) | (1.41) | (1.61) | (.83) | – |
| Total distributions | (.44) | (2.18) | (1.41) | (1.61) | (.83) | – |
| Redemption fees added to paid in capitalA,B | – | – | – | – | – | – |
| Net asset value, end of period | $15.71 | $17.83 | $16.76 | $16.85 | $14.23 | $14.23 |
| Total ReturnC,D,E | (9.52)% | 21.35% | 8.36% | 32.61% | 7.11% | 24.61% |
| Ratios to Average Net AssetsF,G | | | | | | |
| Expenses before reductions | 1.92%H | 1.96% | 2.01% | 2.09% | 2.13% | 2.15% |
| Expenses net of fee waivers, if any | 1.92%H | 1.96% | 2.01% | 2.09% | 2.13% | 2.15% |
| Expenses net of all reductions | 1.91%H | 1.95% | 2.01% | 2.07% | 2.12% | 2.13% |
| Net investment income (loss) | (.59)%H | (.54)% | (1.02)% | (.88)% | (.72)% | (.90)% |
| Supplemental Data | | | | | | |
| Net assets, end of period (000 omitted) | $1,183 | $1,438 | $1,824 | $2,389 | $2,577 | $3,170 |
| Portfolio turnover rateI | 59%H | 71% | 171% | 146% | 217% | 179% |
A Calculated based on average shares outstanding during the period.
B Amount represents less than $.005 per share.
C Total returns for periods of less than one year are not annualized.
D Total returns would have been lower if certain expenses had not been reduced during the applicable periods shown.
E Total returns do not include the effect of the contingent deferred sales charge.
F Fees and expenses of any underlying Fidelity Central Funds are not included in the Fund's expense ratio. The Fund indirectly bears its proportionate share of the expenses of any underlying Fidelity Central Funds.
G Expense ratios reflect operating expenses of the class. Expenses before reductions do not reflect amounts reimbursed by the investment adviser or reductions from brokerage service arrangements or reductions from other expense offset arrangements and do not represent the amount paid by the class during periods when reimbursements or reductions occur. Expenses net of fee waivers reflect expenses after reimbursement by the investment adviser but prior to reductions from brokerage service arrangements or other expense offset arrangements. Expenses net of all reductions represent the net expenses paid by the class.
H Annualized
I Amount does not include the portfolio activity of any underlying Fidelity Central Funds.
See accompanying notes which are an integral part of the financial statements.
Financial Highlights — Fidelity Advisor Consumer Discretionary Fund Class C
| | Six months ended (Unaudited) | Years ended July 31, | | | | |
| January 31, | 2016 | 2015 | 2014 | 2013 | 2012 | 2011 |
| Selected Per–Share Data | | | | | | |
| Net asset value, beginning of period | $17.84 | $16.79 | $16.90 | $14.27 | $14.26 | $11.44 |
| Income from Investment Operations | | | | | | |
| Net investment income (loss)A | (.05) | (.08) | (.16) | (.12) | (.09) | (.12) |
| Net realized and unrealized gain (loss) | (1.62) | 3.34 | 1.49 | 4.37 | .93 | 2.94 |
| Total from investment operations | (1.67) | 3.26 | 1.33 | 4.25 | .84 | 2.82 |
| Distributions from net investment income | – | – | – | – | – | – |
| Distributions from net realized gain | (.44) | (2.21) | (1.44) | (1.62) | (.83) | – |
| Total distributions | (.44) | (2.21) | (1.44) | (1.62) | (.83) | – |
| Redemption fees added to paid in capitalA,B | – | – | – | – | – | – |
| Net asset value, end of period | $15.73 | $17.84 | $16.79 | $16.90 | $14.27 | $14.26 |
| Total ReturnC,D,E | (9.46)% | 21.37% | 8.44% | 32.68% | 7.17% | 24.65% |
| Ratios to Average Net AssetsF,G | | | | | | |
| Expenses before reductions | 1.89%H | 1.91% | 1.97% | 2.04% | 2.09% | 2.11% |
| Expenses net of fee waivers, if any | 1.88%H | 1.91% | 1.97% | 2.04% | 2.09% | 2.11% |
| Expenses net of all reductions | 1.88%H | 1.90% | 1.96% | 2.02% | 2.08% | 2.09% |
| Net investment income (loss) | (.56)%H | (.49)% | (.97)% | (.83)% | (.68)% | (.86)% |
| Supplemental Data | | | | | | |
| Net assets, end of period (000 omitted) | $64,407 | $43,999 | $20,726 | $17,176 | $13,507 | $7,341 |
| Portfolio turnover rateI | 59%H | 71% | 171% | 146% | 217% | 179% |
A Calculated based on average shares outstanding during the period.
B Amount represents less than $.005 per share.
C Total returns for periods of less than one year are not annualized.
D Total returns would have been lower if certain expenses had not been reduced during the applicable periods shown.
E Total returns do not include the effect of the contingent deferred sales charge.
F Fees and expenses of any underlying Fidelity Central Funds are not included in the Fund's expense ratio. The Fund indirectly bears its proportionate share of the expenses of any underlying Fidelity Central Funds.
G Expense ratios reflect operating expenses of the class. Expenses before reductions do not reflect amounts reimbursed by the investment adviser or reductions from brokerage service arrangements or reductions from other expense offset arrangements and do not represent the amount paid by the class during periods when reimbursements or reductions occur. Expenses net of fee waivers reflect expenses after reimbursement by the investment adviser but prior to reductions from brokerage service arrangements or other expense offset arrangements. Expenses net of all reductions represent the net expenses paid by the class.
H Annualized
I Amount does not include the portfolio activity of any underlying Fidelity Central Funds.
See accompanying notes which are an integral part of the financial statements.
Financial Highlights — Fidelity Advisor Consumer Discretionary Fund Class I
| | Six months ended (Unaudited) | Years ended July 31, | | | | |
| January 31, | 2016 | 2015 | 2014 | 2013 | 2012 | 2011 |
| Selected Per–Share Data | | | | | | |
| Net asset value, beginning of period | $23.06 | $21.00 | $20.72 | $17.04 | $16.72 | $13.27 |
| Income from Investment Operations | | | | | | |
| Net investment income (loss)A | .05 | .12 | .02 | .04 | .07 | .03 |
| Net realized and unrealized gain (loss) | (2.11) | 4.26 | 1.85 | 5.32 | 1.13 | 3.42 |
| Total from investment operations | (2.06) | 4.38 | 1.87 | 5.36 | 1.20 | 3.45 |
| Distributions from net investment income | (.08) | – | – | – | (.05) | – |
| Distributions from net realized gain | (.44) | (2.32) | (1.59) | (1.68) | (.83) | – |
| Total distributions | (.52) | (2.32) | (1.59) | (1.68) | (.88) | – |
| Redemption fees added to paid in capitalA,B | – | – | – | – | – | – |
| Net asset value, end of period | $20.48 | $23.06 | $21.00 | $20.72 | $17.04 | $16.72 |
| Total ReturnC,D | (9.01)% | 22.60% | 9.61% | 34.06% | 8.33% | 26.00% |
| Ratios to Average Net AssetsE,F | | | | | | |
| Expenses before reductions | .86%G | .87% | .91% | .97% | 1.00% | 1.03% |
| Expenses net of fee waivers, if any | .86%G | .87% | .91% | .97% | 1.00% | 1.03% |
| Expenses net of all reductions | .86%G | .87% | .91% | .96% | .99% | 1.01% |
| Net investment income (loss) | .47%G | .55% | .08% | .24% | .41% | .22% |
| Supplemental Data | | | | | | |
| Net assets, end of period (000 omitted) | $90,822 | $48,329 | $21,708 | $13,044 | $9,984 | $9,406 |
| Portfolio turnover rateH | 59%G | 71% | 171% | 146% | 217% | 179% |
A Calculated based on average shares outstanding during the period.
B Amount represents less than $.005 per share.
C Total returns for periods of less than one year are not annualized.
D Total returns would have been lower if certain expenses had not been reduced during the applicable periods shown.
E Fees and expenses of any underlying Fidelity Central Funds are not included in the Fund's expense ratio. The Fund indirectly bears its proportionate share of the expenses of any underlying Fidelity Central Funds.
F Expense ratios reflect operating expenses of the class. Expenses before reductions do not reflect amounts reimbursed by the investment adviser or reductions from brokerage service arrangements or reductions from other expense offset arrangements and do not represent the amount paid by the class during periods when reimbursements or reductions occur. Expenses net of fee waivers reflect expenses after reimbursement by the investment adviser but prior to reductions from brokerage service arrangements or other expense offset arrangements. Expenses net of all reductions represent the net expenses paid by the class.
G Annualized
H Amount does not include the portfolio activity of any underlying Fidelity Central Funds.
See accompanying notes which are an integral part of the financial statements.
Notes to Financial Statements (Unaudited)
For the period ended January 31, 2016
1. Organization.
Fidelity Advisor Consumer Discretionary Fund (the Fund) is a non-diversified fund of Fidelity Advisor Series VII (the Trust) and is authorized to issue an unlimited number of shares. The Trust is registered under the Investment Company Act of 1940, as amended (the 1940 Act), as an open-end management investment company organized as a Massachusetts business trust. The Fund offers Class A, Class T, Class C and Class I shares, each of which, along with Class B shares, has equal rights as to assets and voting privileges. Class B shares are closed to new accounts and additional purchases, except for exchanges and reinvestments. Class B shares will automatically convert to Class A shares after a holding period of seven years from the initial date of purchase.
During the period, the Board of Trustees approved the conversion of all existing Class B shares into Class A shares, effective on or about July 1, 2016, regardless of the length of times shares have been held.
2. Investments in Fidelity Central Funds.
The Fund invests in Fidelity Central Funds, which are open-end investment companies generally available only to other investment companies and accounts managed by the investment adviser and its affiliates. The Fund's Schedule of Investments lists each of the Fidelity Central Funds held as of period end, if any, as an investment of the Fund, but does not include the underlying holdings of each Fidelity Central Fund. As an Investing Fund, the Fund indirectly bears its proportionate share of the expenses of the underlying Fidelity Central Funds.
The Money Market Central Funds seek preservation of capital and current income and are managed by Fidelity Investments Money Management, Inc. (FIMM), an affiliate of the investment adviser. Annualized expenses of the Money Market Central Funds as of their most recent shareholder report date are less than .005%.
A complete unaudited list of holdings for each Fidelity Central Fund is available upon request or at the Securities and Exchange Commission (the SEC) website at www.sec.gov. In addition, the financial statements of the Fidelity Central Funds are available on the SEC website or upon request.
3. Significant Accounting Policies.
The financial statements have been prepared in conformity with accounting principles generally accepted in the United States of America (GAAP), which require management to make certain estimates and assumptions at the date of the financial statements. Actual results could differ from those estimates. Subsequent events, if any, through the date that the financial statements were issued have been evaluated in the preparation of the financial statements. The following summarizes the significant accounting policies of the Fund:
Investment Valuation. Investments are valued as of 4:00 p.m. Eastern time on the last calendar day of the period. The Board of Trustees (the Board) has delegated the day to day responsibility for the valuation of the Fund's investments to the Fidelity SelectCo, LLC (SelectCo) Fair Value Committee (the Committee). In accordance with valuation policies and procedures approved by the Board, the Fund attempts to obtain prices from one or more third party pricing vendors or brokers to value its investments. When current market prices, quotations or currency exchange rates are not readily available or reliable, investments will be fair valued in good faith by the Committee, in accordance with procedures adopted by the Board. Factors used in determining fair value vary by investment type and may include market or investment specific events. The frequency with which these procedures are used cannot be predicted and they may be utilized to a significant extent. The Committee oversees the Fund's valuation policies and procedures and reports to the Board on the Committee's activities and fair value determinations. The Board monitors the appropriateness of the procedures used in valuing the Fund's investments and ratifies the fair value determinations of the Committee.
The Fund categorizes the inputs to valuation techniques used to value its investments into a disclosure hierarchy consisting of three levels as shown below:
- Level 1 – quoted prices in active markets for identical investments
- Level 2 – other significant observable inputs (including quoted prices for similar investments, interest rates, prepayment speeds, etc.)
- Level 3 – unobservable inputs (including the Fund's own assumptions based on the best information available)
Valuation techniques used to value the Fund's investments by major category are as follows:
Equity securities, including restricted securities, for which market quotations are readily available, are valued at the last reported sale price or official closing price as reported by a third party pricing vendor on the primary market or exchange on which they are traded and are categorized as Level 1 in the hierarchy. In the event there were no sales during the day or closing prices are not available, securities are valued at the last quoted bid price or may be valued using the last available price and are generally categorized as Level 2 in the hierarchy. For foreign equity securities, when market or security specific events arise, comparisons to the valuation of American Depositary Receipts (ADRs), futures contracts, Exchange-Traded Funds (ETFs) and certain indexes as well as quoted prices for similar securities may be used and would be categorized as Level 2 in the hierarchy. Utilizing these techniques may result in transfers between Level 1 and Level 2. For equity securities, including restricted securities, where observable inputs are limited, assumptions about market activity and risk are used and these securities may be categorized as Level 3 in the hierarchy.
Investments in open-end mutual funds, including the Fidelity Central Funds, are valued at their closing net asset value (NAV) each business day and are categorized as Level 1 in the hierarchy.
Changes in valuation techniques may result in transfers in or out of an assigned level within the disclosure hierarchy. The aggregate value of investments by input level as of January 31, 2016, including information on transfers between Levels 1 and 2, is included at the end of the Fund's Schedule of Investments.
Foreign Currency. The Fund may use foreign currency contracts to facilitate transactions in foreign-denominated securities. Gains and losses from these transactions may arise from changes in the value of the foreign currency or if the counterparties do not perform under the contracts' terms.
Foreign-denominated assets, including investment securities, and liabilities are translated into U.S. dollars at the exchange rates at period end. Purchases and sales of investment securities, income and dividends received and expenses denominated in foreign currencies are translated into U.S. dollars at the exchange rate in effect on the transaction date.
The effects of exchange rate fluctuations on investments are included with the net realized and unrealized gain (loss) on investment securities. Other foreign currency transactions resulting in realized and unrealized gain (loss) are disclosed separately.
Investment Transactions and Income. For financial reporting purposes, the Fund's investment holdings and NAV include trades executed through the end of the last business day of the period. The NAV per share for processing shareholder transactions is calculated as of the close of business of the New York Stock Exchange (NYSE), normally 4:00 p.m. Eastern time and includes trades executed through the end of the prior business day. Gains and losses on securities sold are determined on the basis of identified cost and may include proceeds received from litigation. Dividend income is recorded on the ex-dividend date, except for certain dividends from foreign securities where the ex-dividend date may have passed, which are recorded as soon as the Fund is informed of the ex-dividend date. Non-cash dividends included in dividend income, if any, are recorded at the fair market value of the securities received. Income and capital gain distributions from Fidelity Central Funds, if any, are recorded on the ex-dividend date. Distributions received on securities that represent a return of capital or capital gain are recorded as a reduction of cost of investments and/or as a realized gain. Subsequent to ex-dividend date the Fund determines the components of these distributions, based upon receipt of tax filings or other correspondence relating to the underlying investment. Investment income is recorded net of foreign taxes withheld where recovery of such taxes is uncertain.
Class Allocations and Expenses. Investment income, realized and unrealized capital gains and losses, common expenses of the Fund, and certain fund-level expense reductions, if any, are allocated daily on a pro-rata basis to each class based on the relative net assets of each class to the total net assets of the Fund. Each class differs with respect to transfer agent and distribution and service plan fees incurred. Certain expense reductions may also differ by class. For the reporting period, the allocated portion of income and expenses to each class as a percent of its average net assets may vary due to the timing of recording these transactions in relation to fluctuating net assets of the classes. Expenses directly attributable to a fund are charged to that fund. Expenses attributable to more than one fund are allocated among the respective funds on the basis of relative net assets or other appropriate methods. Expense estimates are accrued in the period to which they relate and adjustments are made when actual amounts are known.
Income Tax Information and Distributions to Shareholders. Each year, the Fund intends to qualify as a regulated investment company under Subchapter M of the Internal Revenue Code, including distributing substantially all of its taxable income and realized gains. As a result, no provision for U.S. Federal income taxes is required. The Fund files a U.S. federal tax return, in addition to state and local tax returns as required. The Fund's federal income tax returns are subject to examination by the Internal Revenue Service (IRS) for a period of three fiscal years after they are filed. State and local tax returns may be subject to examination for an additional fiscal year depending on the jurisdiction. Foreign taxes are provided for based on the Fund's understanding of the tax rules and rates that exist in the foreign markets in which it invests.
Distributions are declared and recorded on the ex-dividend date. Income dividends and capital gain distributions are declared separately for each class. Income and capital gain distributions are determined in accordance with income tax regulations, which may differ from GAAP.
Capital accounts within the financial statements are adjusted for permanent book-tax differences. These adjustments have no impact on net assets or the results of operations. Capital accounts are not adjusted for temporary book-tax differences which will reverse in a subsequent period.
Book-tax differences are primarily due to foreign currency transactions, certain foreign taxes, deferred trustees compensation and losses deferred due to wash sales.
The federal tax cost of investment securities and unrealized appreciation (depreciation) as of period end were as follows:
| Gross unrealized appreciation | $37,208,756 |
| Gross unrealized depreciation | (23,496,299) |
| Net unrealized appreciation (depreciation) on securities | $13,712,457 |
| Tax cost | $321,589,232 |
Short-Term Trading (Redemption) Fees. Shares held by investors in the Fund less than 30 days may have been subject to a redemption fee equal to .75% of the NAV of shares redeemed. All redemption fees, which reduce the proceeds of the shareholder redemption, are retained by the Fund and accounted for as an addition to paid in capital.
4. Purchases and Sales of Investments.
Purchases and sales of securities, other than short-term securities, aggregated $199,029,754 and $83,699,954, respectively.
5. Fees and Other Transactions with Affiliates.
Management Fee. Fidelity SelectCo, LLC (the investment adviser) and its affiliates provide the Fund with investment management related services for which the Fund pays a monthly management fee. The management fee is the sum of an individual fund fee rate that is based on an annual rate of .30% of the Fund's average net assets and an annualized group fee rate that averaged .25% during the period. The group fee rate is based upon the average net assets of all the mutual funds advised by Fidelity Management & Research Company (FMR) and the investment adviser. The group fee rate decreases as assets under management increase and increases as assets under management decrease. For the reporting period, the total annualized management fee rate was .55% of the Fund's average net assets.
Distribution and Service Plan Fees. In accordance with Rule 12b-1 of the 1940 Act, the Fund has adopted separate Distribution and Service Plans for each class of shares. Certain classes pay Fidelity Distributors Corporation (FDC), an affiliate of the investment adviser, separate Distribution and Service Fees, each of which is based on an annual percentage of each class' average net assets. In addition, FDC may pay financial intermediaries for selling shares of the Fund and providing shareholder support services. For the period, the Distribution and Service Fee rates, total fees and amounts retained by FDC were as follows:
| | Distribution
Fee | Service
Fee | Total Fees | Retained
by FDC |
| Class A | -% | .25% | $165,724 | $601 |
| Class T | .25% | .25% | 64,338 | – |
| Class B | .75% | .25% | 6,452 | 4,839 |
| Class C | .75% | .25% | 277,260 | 140,269 |
| | | | $513,774 | $145,709 |
Sales Load. FDC may receive a front-end sales charge of up to 5.75% for selling Class A shares and 3.50% for selling Class T shares, some of which is paid to financial intermediaries for selling shares of the Fund. Depending on the holding period, FDC may receive contingent deferred sales charges levied on Class A, Class T, Class B, and Class C redemptions. The deferred sales charges range from 5.00% to 1.00% for Class B shares, 1.00% for Class C shares, 1.00% for certain purchases of Class A shares and .25% for certain purchases of Class T shares.
For the period, sales charge amounts retained by FDC were as follows:
| | Retained
by FDC |
| Class A | $98,914 |
| Class T | 9,173 |
| Class B(a) | 50 |
| Class C(a) | 8,395 |
| | $116,532 |
(a) When Class B and Class C shares are initially sold, FDC pays commissions from its own resources to financial intermediaries through which the sales are made.
Transfer Agent Fees. Fidelity Investments Institutional Operations Company, Inc., (FIIOC), an affiliate of the investment adviser, is the transfer, dividend disbursing and shareholder servicing agent for each class of the Fund. FIIOC receives account fees and asset-based fees that vary according to the account size and type of account of the shareholders of the respective classes of the Fund. FIIOC pays for typesetting, printing and mailing of shareholder reports, except proxy statements.
For the period, transfer agent fees for each class were as follows:
| | Amount | % of
Class-Level Average
Net Assets(a) |
| Class A | $137,158 | .21 |
| Class T | 33,544 | .26 |
| Class B | 1,631 | .25 |
| Class C | 60,233 | .22 |
| Class I | 76,537 | .20 |
| | $309,103 | |
(a) Annualized
Accounting and Security Lending Fees. Fidelity Service Company, Inc. (FSC), an affiliate of the investment adviser, maintains the Fund's accounting records. The accounting fee is based on the level of average net assets for each month. Under a separate contract, FSC administers the security lending program. The security lending fee is based on the number and duration of lending transactions.
Brokerage Commissions. The Fund placed a portion of its portfolio transactions with brokerage firms which are affiliates of the investment adviser. Brokerage commissions are included in net realized gain (loss) and change in net unrealized appreciation (depreciation) in the Statement of Operations. The commissions paid to these affiliated firms were $1,360 for the period.
Interfund Trades. The Fund may purchase from or sell securities to other Fidelity Funds under procedures adopted by the Board. The procedures have been designed to ensure these interfund trades are executed in accordance with Rule 17a-7 of the 1940 Act. Interfund trades are included within the respective purchases and sales amounts shown in the Purchases and Sales of Investments note.
6. Committed Line of Credit.
The Fund participates with other funds managed by the investment adviser or an affiliate in a $4.25 billion credit facility (the "line of credit") to be utilized for temporary or emergency purposes to fund shareholder redemptions or for other short-term liquidity purposes. The Fund has agreed to pay commitment fees on its pro-rata portion of the line of credit, which amounted to $184 and is reflected in Miscellaneous expenses on the Statement of Operations. During the period, the Fund did not borrow on this line of credit.
7. Security Lending.
The Fund lends portfolio securities through a lending agent from time to time in order to earn additional income. On the settlement date of the loan, the Fund receives collateral (in the form of U.S. Treasury obligations, letters of credit and/or cash) against the loaned securities and maintains collateral in an amount not less than 100% of the market value of the loaned securities during the period of the loan. The market value of the loaned securities is determined at the close of business of the Fund and any additional required collateral is delivered to the Fund on the next business day. The Fund or borrower may terminate the loan at any time, and if the borrower defaults on its obligation to return the securities loaned because of insolvency or other reasons, the Fund may apply collateral received from the borrower against the obligation. The Fund may experience delays and costs in recovering the securities loaned. Any cash collateral received is invested in the Fidelity Securities Lending Cash Central Fund. The value of loaned securities and cash collateral at period end are disclosed on the Fund's Statement of Assets and Liabilities. Security lending income represents the income earned on investing cash collateral, less rebates paid to borrowers and any lending agent fees associated with the loan, plus any premium payments received for lending certain types of securities. Security lending income is presented in the Statement of Operations as a component of income from Fidelity Central Funds.
8. Expense Reductions.
Commissions paid to certain brokers with whom the investment adviser, or its affiliates, places trades on behalf of the Fund include an amount in addition to trade execution, which may be rebated back to the Fund to offset certain expenses. This amount totaled $4,041 for the period.
In addition, during the period the investment adviser reimbursed and/or waived a portion of fund-level operating expenses in the amount of $1,236.
9. Distributions to Shareholders.
Distributions to shareholders of each class were as follows:
| | Six months ended January 31, 2016 | Year ended July 31, 2015 |
| From net investment income | | |
| Class A | $145,315 | $– |
| Class I | 280,605 | – |
| Total | $425,920 | $– |
| From net realized gain | | |
| Class A | $2,490,947 | $6,488,273 |
| Class T | 567,555 | 2,268,637 |
| Class B | 33,959 | 224,707 |
| Class C | 1,218,277 | 2,737,034 |
| Class I | 1,174,042 | 2,204,805 |
| Total | $5,484,780 | $13,923,456 |
10. Share Transactions.
Share transactions for each class were as follows and may contain automatic conversions between classes or exchanges between affiliated funds:
| | Shares | Shares | Dollars | Dollars |
| | Six months ended January 31, 2016 | Year ended July 31, 2015 | Six months ended January 31, 2016 | Year ended July 31, 2015 |
| Class A | | | | |
| Shares sold | 3,298,095 | 3,721,895 | $66,485,360 | $75,431,970 |
| Reinvestment of distributions | 125,818 | 314,662 | 2,487,810 | 5,921,151 |
| Shares redeemed | (1,425,742) | (1,680,428) | (27,626,961) | (32,834,119) |
| Net increase (decrease) | 1,998,171 | 2,356,129 | $41,346,209 | $48,519,002 |
| Class T | | | | |
| Shares sold | 283,133 | 338,629 | $5,336,970 | $6,435,082 |
| Reinvestment of distributions | 29,568 | 122,984 | 549,955 | 2,187,662 |
| Shares redeemed | (138,319) | (182,245) | (2,601,961) | (3,405,237) |
| Net increase (decrease) | 174,382 | 279,368 | $3,284,964 | $5,217,507 |
| Class B | | | | |
| Shares sold | 11,279 | 8,479 | $188,054 | $145,589 |
| Reinvestment of distributions | 1,812 | 10,956 | 29,530 | 172,497 |
| Shares redeemed | (18,502) | (47,549) | (302,796) | (771,428) |
| Net increase (decrease) | (5,411) | (28,114) | $(85,212) | $(453,342) |
| Class C | | | | |
| Shares sold | 2,028,385 | 1,409,357 | $33,764,859 | $23,864,510 |
| Reinvestment of distributions | 66,579 | 157,518 | 1,085,908 | 2,481,906 |
| Shares redeemed | (466,690) | (334,437) | (7,482,901) | (5,460,293) |
| Net increase (decrease) | 1,628,274 | 1,232,438 | $27,367,866 | $20,886,123 |
| Class I | | | | |
| Shares sold | 3,681,488 | 2,162,351 | $78,986,768 | $46,666,847 |
| Reinvestment of distributions | 55,475 | 93,807 | 1,176,667 | 1,886,667 |
| Shares redeemed | (1,399,015) | (1,194,006) | (28,928,478) | (25,608,119) |
| Net increase (decrease) | 2,337,948 | 1,062,152 | $51,234,957 | $22,945,395 |
11. Other.
The Fund's organizational documents provide former and current trustees and officers with a limited indemnification against liabilities arising in connection with the performance of their duties to the Fund. In the normal course of business, the Fund may also enter into contracts that provide general indemnifications. The Fund's maximum exposure under these arrangements is unknown as this would be dependent on future claims that may be made against the Fund. The risk of material loss from such claims is considered remote.
Fidelity Advisor® Electronics Fund
Investment Summary (Unaudited)
Top Ten Stocks as of January 31, 2016
| | % of fund's net assets | % of fund's net assets 6 months ago |
| Avago Technologies Ltd. | 11.1 | 6.1 |
| NXP Semiconductors NV | 8.6 | 0.4 |
| Qualcomm, Inc. | 8.3 | 4.6 |
| Intel Corp. | 8.2 | 15.3 |
| Micron Technology, Inc. | 5.3 | 5.8 |
| Maxim Integrated Products, Inc. | 4.7 | 5.0 |
| ON Semiconductor Corp. | 4.3 | 0.0 |
| Semtech Corp. | 3.9 | 4.5 |
| Marvell Technology Group Ltd. | 3.8 | 4.5 |
| Lam Research Corp. | 3.8 | 2.3 |
| | 62.0 | |
Top Industries (% of fund's net assets)
| As of January 31, 2016 |
| | Semiconductors & Semiconductor Equipment | 75.2% |
| | Technology Hardware, Storage & Peripherals | 8.6% |
| | Communications Equipment | 8.3% |
| | Electronic Equipment & Components | 4.6% |
| | Commercial Services & Supplies | 0.4% |
| | All Others* | 2.9% |

| As of July 31, 2015 |
| | Semiconductors & Semiconductor Equipment | 84.1% |
| | Technology Hardware, Storage & Peripherals | 5.8% |
| | Communications Equipment | 4.6% |
| | Electronic Equipment & Components | 3.4% |
| | Internet Software & Services | 0.6% |
| | All Others* | 1.5% |

* Includes Short-Term investments and Net Other Assets (Liabilities).
Percentages shown as 0.0% may reflect amounts less than 0.05%.
Fidelity Advisor® Electronics Fund
Investments January 31, 2016 (Unaudited)
Showing Percentage of Net Assets
| Common Stocks - 97.1% | | | |
| | | Shares | Value |
| Biotechnology - 0.0% | | | |
| Biotechnology - 0.0% | | | |
| Arrowhead Research Corp. warrants 5/21/17 (a) | | 64,879 | $1 |
| Commercial Services & Supplies - 0.4% | | | |
| Office Services & Supplies - 0.4% | | | |
| West Corp. | | 14,300 | 258,973 |
| Communications Equipment - 8.3% | | | |
| Communications Equipment - 8.3% | | | |
| Qualcomm, Inc. | | 135,126 | 6,126,613 |
| Diversified Telecommunication Services - 0.1% | | | |
| Alternative Carriers - 0.1% | | | |
| Intelsat SA (a) | | 33,200 | 110,888 |
| Electronic Equipment & Components - 4.6% | | | |
| Electronic Equipment & Instruments - 0.4% | | | |
| Keysight Technologies, Inc. (a) | | 10,500 | 245,700 |
| Electronic Manufacturing Services - 4.2% | | | |
| Jabil Circuit, Inc. | | 80,776 | 1,608,250 |
| TTM Technologies, Inc. (a) | | 257,655 | 1,502,129 |
| | | | 3,110,379 |
|
| TOTAL ELECTRONIC EQUIPMENT & COMPONENTS | | | 3,356,079 |
|
| Internet Software & Services - 0.2% | | | |
| Internet Software & Services - 0.2% | | | |
| Rackspace Hosting, Inc. (a) | | 7,600 | 153,596 |
| Semiconductors & Semiconductor Equipment - 74.9% | | | |
| Semiconductor Equipment - 6.7% | | | |
| Amkor Technology, Inc. (a) | | 28,400 | 174,376 |
| Applied Materials, Inc. | | 90,400 | 1,595,560 |
| Lam Research Corp. | | 38,481 | 2,762,551 |
| PDF Solutions, Inc. (a) | | 8,900 | 96,387 |
| SunEdison, Inc. (a) | | 25,200 | 78,876 |
| Xcerra Corp. (a) | | 34,600 | 189,608 |
| | | | 4,897,358 |
| Semiconductors - 68.2% | | | |
| Analog Devices, Inc. | | 10,928 | 588,582 |
| Applied Micro Circuits Corp. (a) | | 44,137 | 245,402 |
| Avago Technologies Ltd. | | 60,900 | 8,142,938 |
| Cavium, Inc. (a) | | 5,200 | 300,404 |
| Cypress Semiconductor Corp. (b) | | 203,800 | 1,601,868 |
| Diodes, Inc. (a) | | 9,000 | 172,170 |
| Exar Corp. (a) | | 32,100 | 176,550 |
| Intel Corp. | | 195,278 | 6,057,524 |
| Intersil Corp. Class A | | 166,937 | 2,170,181 |
| Marvell Technology Group Ltd. | | 319,300 | 2,825,805 |
| Maxim Integrated Products, Inc. | | 102,822 | 3,434,255 |
| Microchip Technology, Inc. | | 36,200 | 1,622,122 |
| Micron Technology, Inc. (a) | | 349,812 | 3,858,426 |
| NVIDIA Corp. | | 30,923 | 905,735 |
| NXP Semiconductors NV (a) | | 84,791 | 6,340,671 |
| ON Semiconductor Corp. (a) | | 368,600 | 3,155,216 |
| Qorvo, Inc. (a) | | 51,300 | 2,031,480 |
| Semtech Corp. (a) | | 143,322 | 2,880,772 |
| Skyworks Solutions, Inc. | | 34,300 | 2,363,956 |
| Texas Instruments, Inc. | | 24,218 | 1,281,859 |
| | | | 50,155,916 |
|
| TOTAL SEMICONDUCTORS & SEMICONDUCTOR EQUIPMENT | | | 55,053,274 |
|
| Technology Hardware, Storage & Peripherals - 8.6% | | | |
| Technology Hardware, Storage & Peripherals - 8.6% | | | |
| Hewlett Packard Enterprise Co. | | 30,500 | 419,680 |
| HP, Inc. | | 191,400 | 1,858,494 |
| Nimble Storage, Inc. (a) | | 36,100 | 237,177 |
| Seagate Technology LLC | | 73,300 | 2,129,365 |
| Western Digital Corp. | | 35,500 | 1,703,290 |
| | | | 6,348,006 |
| TOTAL COMMON STOCKS | | | |
| (Cost $80,652,483) | | | 71,407,430 |
| | | Principal Amount | Value |
|
| Nonconvertible Bonds - 0.3% | | | |
| Semiconductors & Semiconductor Equipment - 0.3% | | | |
| Semiconductors - 0.3% | | | |
Advanced Micro Devices, Inc.:
| | | |
| 7% 7/1/24 | | 215,000 | 133,300 |
| 7.75% 8/1/20 | | 130,000 | 82,550 |
| (Cost $292,458) | | | 215,850 |
| | | Shares | Value |
|
| Money Market Funds - 3.8% | | | |
| Fidelity Cash Central Fund, 0.38% (c) | | 1,311,516 | 1,311,516 |
| Fidelity Securities Lending Cash Central Fund, 0.42% (c)(d) | | 1,450,025 | 1,450,025 |
| TOTAL MONEY MARKET FUNDS | | | |
| (Cost $2,761,541) | | | 2,761,541 |
| TOTAL INVESTMENT PORTFOLIO - 101.2% | | | |
| (Cost $83,706,482) | | | 74,384,821 |
| NET OTHER ASSETS (LIABILITIES) - (1.2)% | | | (855,638) |
| NET ASSETS - 100% | | | $73,529,183 |
Legend
(a) Non-income producing
(b) Security or a portion of the security is on loan at period end.
(c) Affiliated fund that is generally available only to investment companies and other accounts managed by Fidelity Investments. The rate quoted is the annualized seven-day yield of the fund at period end. A complete unaudited listing of the fund's holdings as of its most recent quarter end is available upon request. In addition, each Fidelity Central Fund's financial statements are available on the SEC's website or upon request.
(d) Investment made with cash collateral received from securities on loan.
Affiliated Central Funds
Information regarding fiscal year to date income earned by the Fund from investments in Fidelity Central Funds is as follows:
| Fund | Income earned |
| Fidelity Cash Central Fund | $1,677 |
| Fidelity Securities Lending Cash Central Fund | 16,185 |
| Total | $17,862 |
Investment Valuation
The following is a summary of the inputs used, as of January 31, 2016, involving the Fund's assets and liabilities carried at fair value. The inputs or methodology used for valuing securities may not be an indication of the risk associated with investing in those securities. For more information on valuation inputs, and their aggregation into the levels used below, please refer to the Investment Valuation section in the accompanying Notes to Financial Statements.
| | Valuation Inputs at Reporting Date: |
| Description | Total | Level 1 | Level 2 | Level 3 |
| Investments in Securities: | | | | |
| Common Stocks | $71,407,430 | $71,407,429 | $1 | $-- |
| Nonconvertible Bonds | 215,850 | -- | 215,850 | -- |
| Money Market Funds | 2,761,541 | 2,761,541 | -- | -- |
| Total Investments in Securities: | $74,384,821 | $74,168,970 | $215,851 | $-- |
Other Information
Distribution of investments by country or territory of incorporation, as a percentage of Total Net Assets, is as follows (Unaudited):
| United States of America | 73.5% |
| Singapore | 11.1% |
| Netherlands | 8.6% |
| Bermuda | 3.8% |
| Ireland | 2.9% |
| Others (Individually Less Than 1%) | 0.1% |
| | 100.0% |
See accompanying notes which are an integral part of the financial statements.
Fidelity Advisor® Electronics Fund
Financial Statements
Statement of Assets and Liabilities
| | | January 31, 2016 (Unaudited) |
| Assets | | |
Investment in securities, at value (including securities loaned of $1,470,606) — See accompanying schedule:
Unaffiliated issuers (cost $80,944,941) | $71,623,280 | |
| Fidelity Central Funds (cost $2,761,541) | 2,761,541 | |
| Total Investments (cost $83,706,482) | | $74,384,821 |
| Receivable for investments sold | | 3,247,298 |
| Receivable for fund shares sold | | 82,119 |
| Dividends receivable | | 14,752 |
| Interest receivable | | 7,386 |
| Distributions receivable from Fidelity Central Funds | | 1,618 |
| Prepaid expenses | | 468 |
| Other receivables | | 3,513 |
| Total assets | | 77,741,975 |
| Liabilities | | |
| Payable for investments purchased | $2,396,116 | |
| Payable for fund shares redeemed | 251,470 | |
| Accrued management fee | 36,140 | |
| Distribution and service plan fees payable | 24,328 | |
| Other affiliated payables | 19,066 | |
| Other payables and accrued expenses | 35,647 | |
| Collateral on securities loaned, at value | 1,450,025 | |
| Total liabilities | | 4,212,792 |
| Net Assets | | $73,529,183 |
| Net Assets consist of: | | |
| Paid in capital | | $85,623,100 |
| Distributions in excess of net investment income | | (178,148) |
| Accumulated undistributed net realized gain (loss) on investments and foreign currency transactions | | (2,594,011) |
| Net unrealized appreciation (depreciation) on investments and assets and liabilities in foreign currencies | | (9,321,758) |
| Net Assets | | $73,529,183 |
| Calculation of Maximum Offering Price | | |
| Class A: | | |
| Net Asset Value and redemption price per share ($28,502,356 ÷ 2,184,096 shares) | | $13.05 |
| Maximum offering price per share (100/94.25 of $13.05) | | $13.85 |
| Class T: | | |
| Net Asset Value and redemption price per share ($8,788,289 ÷ 696,945 shares) | | $12.61 |
| Maximum offering price per share (100/96.50 of $12.61) | | $13.07 |
| Class B: | | |
| Net Asset Value and offering price per share ($263,497 ÷ 22,488 shares)(a) | | $11.72 |
| Class C: | | |
| Net Asset Value and offering price per share ($17,554,451 ÷ 1,504,810 shares)(a) | | $11.67 |
| Class I: | | |
| Net Asset Value, offering price and redemption price per share ($18,420,590 ÷ 1,352,954 shares) | | $13.62 |
(a) Redemption price per share is equal to net asset value less any applicable contingent deferred sales charge.
See accompanying notes which are an integral part of the financial statements.
Statement of Operations
| | | Six months ended January 31, 2016 (Unaudited) |
| Investment Income | | |
| Dividends | | $667,708 |
| Interest | | 20,073 |
| Income from Fidelity Central Funds | | 17,862 |
| Total income | | 705,643 |
| Expenses | | |
| Management fee | $232,154 | |
| Transfer agent fees | 102,270 | |
| Distribution and service plan fees | 159,458 | |
| Accounting and security lending fees | 16,762 | |
| Custodian fees and expenses | 43,515 | |
| Independent trustees' compensation | 836 | |
| Registration fees | 52,048 | |
| Audit | 22,738 | |
| Legal | 762 | |
| Miscellaneous | 642 | |
| Total expenses before reductions | 631,185 | |
| Expense reductions | (8,253) | 622,932 |
| Net investment income (loss) | | 82,711 |
| Realized and Unrealized Gain (Loss) | | |
| Net realized gain (loss) on: | | |
| Investment securities: | | |
| Unaffiliated issuers | (1,362,870) | |
| Foreign currency transactions | (1,266) | |
| Total net realized gain (loss) | | (1,364,136) |
Change in net unrealized appreciation (depreciation) on:
Investment securities | (3,293,575) | |
| Assets and liabilities in foreign currencies | 192 | |
| Total change in net unrealized appreciation (depreciation) | | (3,293,383) |
| Net gain (loss) | | (4,657,519) |
| Net increase (decrease) in net assets resulting from operations | | $(4,574,808) |
See accompanying notes which are an integral part of the financial statements.
Statement of Changes in Net Assets
| | Six months ended January 31, 2016 (Unaudited) | Year ended July 31, 2015 |
| Increase (Decrease) in Net Assets | | |
| Operations | | |
| Net investment income (loss) | $82,711 | $168,582 |
| Net realized gain (loss) | (1,364,136) | 10,893,475 |
| Change in net unrealized appreciation (depreciation) | (3,293,383) | (5,873,187) |
| Net increase (decrease) in net assets resulting from operations | (4,574,808) | 5,188,870 |
| Distributions to shareholders from net investment income | (300,749) | (57,407) |
| Distributions to shareholders from net realized gain | (8,936,577) | (377,502) |
| Total distributions | (9,237,326) | (434,909) |
| Share transactions - net increase (decrease) | (18,851,156) | 44,912,905 |
| Redemption fees | 2,581 | 13,381 |
| Total increase (decrease) in net assets | (32,660,709) | 49,680,247 |
| Net Assets | | |
| Beginning of period | 106,189,892 | 56,509,645 |
| End of period (including distributions in excess of net investment income of $178,148 and undistributed net investment income of $39,890, respectively) | $73,529,183 | $106,189,892 |
See accompanying notes which are an integral part of the financial statements.
Financial Highlights — Fidelity Advisor Electronics Fund Class A
| | Six months ended (Unaudited) | Years ended July 31, | | | | |
| January 31, | 2016 | 2015 | 2014 | 2013 | 2012 | 2011 |
| Selected Per–Share Data | | | | | | |
| Net asset value, beginning of period | $15.29 | $13.86 | $10.33 | $8.45 | $8.93 | $7.14 |
| Income from Investment Operations | | | | | | |
| Net investment income (loss)A | .02 | .03 | (.02) | (.01) | (.05) | (.04) |
| Net realized and unrealized gain (loss) | (.71) | 1.48 | 3.55 | 1.89 | (.43) | 1.83 |
| Total from investment operations | (.69) | 1.51 | 3.53 | 1.88 | (.48) | 1.79 |
| Distributions from net investment income | (.05) | (.01) | – | – | – | – |
| Distributions from net realized gain | (1.49) | (.07) | – | – | – | – |
| Total distributions | (1.55)B | (.08) | – | – | – | – |
| Redemption fees added to paid in capitalA,C | – | – | – | – | – | – |
| Net asset value, end of period | $13.05 | $15.29 | $13.86 | $10.33 | $8.45 | $8.93 |
| Total ReturnD,E,F | (4.73)% | 10.85% | 34.17% | 22.25% | (5.38)% | 25.07% |
| Ratios to Average Net AssetsG,H | | | | | | |
| Expenses before reductions | 1.37%I | 1.28% | 1.84% | 2.18% | 1.88% | 1.89% |
| Expenses net of fee waivers, if any | 1.37%I | 1.28% | 1.40% | 1.40% | 1.40% | 1.40% |
| Expenses net of all reductions | 1.36%I | 1.27% | 1.39% | 1.37% | 1.39% | 1.39% |
| Net investment income (loss) | .31%I | .20% | (.16)% | (.07)% | (.53)% | (.40)% |
| Supplemental Data | | | | | | |
| Net assets, end of period (000 omitted) | $28,502 | $38,237 | $16,542 | $5,833 | $6,000 | $7,537 |
| Portfolio turnover rateJ | 228%I | 156% | 156% | 179% | 140% | 166% |
A Calculated based on average shares outstanding during the period.
B Total distributions of $1.55 per share is comprised of distributions from net investment income of $.053 and distributions from net realized gain of $1.494 per share.
C Amount represents less than $.005 per share.
D Total returns for periods of less than one year are not annualized.
E Total returns would have been lower if certain expenses had not been reduced during the applicable periods shown.
F Total returns do not include the effect of the sales charges.
G Fees and expenses of any underlying Fidelity Central Funds are not included in the Fund's expense ratio. The Fund indirectly bears its proportionate share of the expenses of any underlying Fidelity Central Funds.
H Expense ratios reflect operating expenses of the class. Expenses before reductions do not reflect amounts reimbursed by the investment adviser or reductions from brokerage service arrangements or reductions from other expense offset arrangements and do not represent the amount paid by the class during periods when reimbursements or reductions occur. Expenses net of fee waivers reflect expenses after reimbursement by the investment adviser but prior to reductions from brokerage service arrangements or other expense offset arrangements. Expenses net of all reductions represent the net expenses paid by the class.
I Annualized
J Amount does not include the portfolio activity of any underlying Fidelity Central Funds.
See accompanying notes which are an integral part of the financial statements.
Financial Highlights — Fidelity Advisor Electronics Fund Class T
| | Six months ended (Unaudited) | Years ended July 31, | | | | |
| January 31, | 2016 | 2015 | 2014 | 2013 | 2012 | 2011 |
| Selected Per–Share Data | | | | | | |
| Net asset value, beginning of period | $14.81 | $13.45 | $10.05 | $8.24 | $8.73 | $7.00 |
| Income from Investment Operations | | | | | | |
| Net investment income (loss)A | – | (.02) | (.05) | (.03) | (.07) | (.06) |
| Net realized and unrealized gain (loss) | (.69) | 1.44 | 3.45 | 1.84 | (.42) | 1.79 |
| Total from investment operations | (.69) | 1.42 | 3.40 | 1.81 | (.49) | 1.73 |
| Distributions from net investment income | (.04) | – | – | – | – | – |
| Distributions from net realized gain | (1.47) | (.06) | – | – | – | – |
| Total distributions | (1.51) | (.06) | – | – | – | – |
| Redemption fees added to paid in capitalA,B | – | – | – | – | – | – |
| Net asset value, end of period | $12.61 | $14.81 | $13.45 | $10.05 | $8.24 | $8.73 |
| Total ReturnC,D,E | (4.88)% | 10.55% | 33.83% | 21.97% | (5.61)% | 24.71% |
| Ratios to Average Net AssetsF,G | | | | | | |
| Expenses before reductions | 1.71%H | 1.62% | 2.19% | 2.48% | 2.23% | 2.25% |
| Expenses net of fee waivers, if any | 1.65%H | 1.62% | 1.65% | 1.65% | 1.65% | 1.65% |
| Expenses net of all reductions | 1.64%H | 1.61% | 1.64% | 1.62% | 1.64% | 1.64% |
| Net investment income (loss) | .03%H | (.14)% | (.42)% | (.32)% | (.78)% | (.65)% |
| Supplemental Data | | | | | | |
| Net assets, end of period (000 omitted) | $8,788 | $10,826 | $7,144 | $3,756 | $3,909 | $4,476 |
| Portfolio turnover rateI | 228%H | 156% | 156% | 179% | 140% | 166% |
A Calculated based on average shares outstanding during the period.
B Amount represents less than $.005 per share.
C Total returns for periods of less than one year are not annualized.
D Total returns would have been lower if certain expenses had not been reduced during the applicable periods shown.
E Total returns do not include the effect of the sales charges.
F Fees and expenses of any underlying Fidelity Central Funds are not included in the Fund's expense ratio. The Fund indirectly bears its proportionate share of the expenses of any underlying Fidelity Central Funds.
G Expense ratios reflect operating expenses of the class. Expenses before reductions do not reflect amounts reimbursed by the investment adviser or reductions from brokerage service arrangements or reductions from other expense offset arrangements and do not represent the amount paid by the class during periods when reimbursements or reductions occur. Expenses net of fee waivers reflect expenses after reimbursement by the investment adviser but prior to reductions from brokerage service arrangements or other expense offset arrangements. Expenses net of all reductions represent the net expenses paid by the class.
H Annualized
I Amount does not include the portfolio activity of any underlying Fidelity Central Funds.
See accompanying notes which are an integral part of the financial statements.
Financial Highlights — Fidelity Advisor Electronics Fund Class B
| | Six months ended (Unaudited) | Years ended July 31, | | | | |
| January 31, | 2016 | 2015 | 2014 | 2013 | 2012 | 2011 |
| Selected Per–Share Data | | | | | | |
| Net asset value, beginning of period | $13.82 | $12.59 | $9.46 | $7.79 | $8.29 | $6.69 |
| Income from Investment Operations | | | | | | |
| Net investment income (loss)A | (.03) | (.09) | (.10) | (.07) | (.10) | (.09) |
| Net realized and unrealized gain (loss) | (.64) | 1.34 | 3.23 | 1.74 | (.40) | 1.69 |
| Total from investment operations | (.67) | 1.25 | 3.13 | 1.67 | (.50) | 1.60 |
| Distributions from net investment income | (.02) | – | – | – | – | – |
| Distributions from net realized gain | (1.41) | (.02) | – | – | – | – |
| Total distributions | (1.43) | (.02) | – | – | – | – |
| Redemption fees added to paid in capitalA,B | – | – | – | – | – | – |
| Net asset value, end of period | $11.72 | $13.82 | $12.59 | $9.46 | $7.79 | $8.29 |
| Total ReturnC,D,E | (5.07)% | 9.95% | 33.09% | 21.44% | (6.03)% | 23.92% |
| Ratios to Average Net AssetsF,G | | | | | | |
| Expenses before reductions | 2.17%H | 2.11% | 2.68% | 2.95% | 2.70% | 2.76% |
| Expenses net of fee waivers, if any | 2.15%H | 2.10% | 2.15% | 2.15% | 2.15% | 2.15% |
| Expenses net of all reductions | 2.14%H | 2.09% | 2.14% | 2.12% | 2.15% | 2.14% |
| Net investment income (loss) | (.47)%H | (.62)% | (.91)% | (.82)% | (1.29)% | (1.15)% |
| Supplemental Data | | | | | | |
| Net assets, end of period (000 omitted) | $263 | $320 | $392 | $306 | $459 | $691 |
| Portfolio turnover rateI | 228%H | 156% | 156% | 179% | 140% | 166% |
A Calculated based on average shares outstanding during the period.
B Amount represents less than $.005 per share.
C Total returns for periods of less than one year are not annualized.
D Total returns would have been lower if certain expenses had not been reduced during the applicable periods shown.
E Total returns do not include the effect of the contingent deferred sales charge.
F Fees and expenses of any underlying Fidelity Central Funds are not included in the Fund's expense ratio. The Fund indirectly bears its proportionate share of the expenses of any underlying Fidelity Central Funds.
G Expense ratios reflect operating expenses of the class. Expenses before reductions do not reflect amounts reimbursed by the investment adviser or reductions from brokerage service arrangements or reductions from other expense offset arrangements and do not represent the amount paid by the class during periods when reimbursements or reductions occur. Expenses net of fee waivers reflect expenses after reimbursement by the investment adviser but prior to reductions from brokerage service arrangements or other expense offset arrangements. Expenses net of all reductions represent the net expenses paid by the class.
H Annualized
I Amount does not include the portfolio activity of any underlying Fidelity Central Funds.
See accompanying notes which are an integral part of the financial statements.
Financial Highlights — Fidelity Advisor Electronics Fund Class C
| | Six months ended (Unaudited) | Years ended July 31, | | | | |
| January 31, | 2016 | 2015 | 2014 | 2013 | 2012 | 2011 |
| Selected Per–Share Data | | | | | | |
| Net asset value, beginning of period | $13.80 | $12.58 | $9.44 | $7.78 | $8.29 | $6.68 |
| Income from Investment Operations | | | | | | |
| Net investment income (loss)A | (.03) | (.08) | (.10) | (.07) | (.10) | (.09) |
| Net realized and unrealized gain (loss) | (.64) | 1.34 | 3.24 | 1.73 | (.41) | 1.70 |
| Total from investment operations | (.67) | 1.26 | 3.14 | 1.66 | (.51) | 1.61 |
| Distributions from net investment income | (.02) | – | – | – | – | – |
| Distributions from net realized gain | (1.44) | (.04) | – | – | – | – |
| Total distributions | (1.46) | (.04) | – | – | – | – |
| Redemption fees added to paid in capitalA,B | – | – | – | – | – | – |
| Net asset value, end of period | $11.67 | $13.80 | $12.58 | $9.44 | $7.78 | $8.29 |
| Total ReturnC,D,E | (5.08)% | 10.03% | 33.26% | 21.34% | (6.15)% | 24.10% |
| Ratios to Average Net AssetsF,G | | | | | | |
| Expenses before reductions | 2.14%H | 2.06% | 2.60% | 2.93% | 2.65% | 2.70% |
| Expenses net of fee waivers, if any | 2.14%H | 2.06% | 2.15% | 2.15% | 2.15% | 2.15% |
| Expenses net of all reductions | 2.13%H | 2.05% | 2.14% | 2.12% | 2.14% | 2.14% |
| Net investment income (loss) | (.47)%H | (.58)% | (.90)% | (.82)% | (1.28)% | (1.15)% |
| Supplemental Data | | | | | | |
| Net assets, end of period (000 omitted) | $17,554 | $20,864 | $7,381 | $3,157 | $3,721 | $3,836 |
| Portfolio turnover rateI | 228%H | 156% | 156% | 179% | 140% | 166% |
A Calculated based on average shares outstanding during the period.
B Amount represents less than $.005 per share.
C Total returns for periods of less than one year are not annualized.
D Total returns would have been lower if certain expenses had not been reduced during the applicable periods shown.
E Total returns do not include the effect of the contingent deferred sales charge.
F Fees and expenses of any underlying Fidelity Central Funds are not included in the Fund's expense ratio. The Fund indirectly bears its proportionate share of the expenses of any underlying Fidelity Central Funds.
G Expense ratios reflect operating expenses of the class. Expenses before reductions do not reflect amounts reimbursed by the investment adviser or reductions from brokerage service arrangements or reductions from other expense offset arrangements and do not represent the amount paid by the class during periods when reimbursements or reductions occur. Expenses net of fee waivers reflect expenses after reimbursement by the investment adviser but prior to reductions from brokerage service arrangements or other expense offset arrangements. Expenses net of all reductions represent the net expenses paid by the class.
H Annualized
I Amount does not include the portfolio activity of any underlying Fidelity Central Funds.
See accompanying notes which are an integral part of the financial statements.
Financial Highlights — Fidelity Advisor Electronics Fund Class I
| | Six months ended (Unaudited) | Years ended July 31, | | | | |
| January 31, | 2016 | 2015 | 2014 | 2013 | 2012 | 2011 |
| Selected Per–Share Data | | | | | | |
| Net asset value, beginning of period | $15.89 | $14.37 | $10.68 | $8.72 | $9.19 | $7.33 |
| Income from Investment Operations | | | | | | |
| Net investment income (loss)A | .05 | .08 | .01 | .02 | (.02) | (.01) |
| Net realized and unrealized gain (loss) | (.74) | 1.53 | 3.68 | 1.94 | (.45) | 1.87 |
| Total from investment operations | (.69) | 1.61 | 3.69 | 1.96 | (.47) | 1.86 |
| Distributions from net investment income | (.09) | (.02) | – | – | – | – |
| Distributions from net realized gain | (1.49) | (.07) | – | – | – | – |
| Total distributions | (1.58) | (.09) | – | – | – | – |
| Redemption fees added to paid in capitalA,B | – | – | – | – | – | – |
| Net asset value, end of period | $13.62 | $15.89 | $14.37 | $10.68 | $8.72 | $9.19 |
| Total ReturnC,D | (4.52)% | 11.17% | 34.55% | 22.48% | (5.11)% | 25.38% |
| Ratios to Average Net AssetsE,F | | | | | | |
| Expenses before reductions | 1.04%G | .98% | 1.34% | 1.86% | 1.55% | 1.42% |
| Expenses net of fee waivers, if any | 1.04%G | .98% | 1.15% | 1.15% | 1.15% | 1.15% |
| Expenses net of all reductions | 1.02%G | .96% | 1.14% | 1.12% | 1.14% | 1.14% |
| Net investment income (loss) | .64%G | .51% | .10% | .18% | (.28)% | (.15)% |
| Supplemental Data | | | | | | |
| Net assets, end of period (000 omitted) | $18,421 | $35,943 | $25,050 | $2,874 | $3,271 | $1,765 |
| Portfolio turnover rateH | 228%G | 156% | 156% | 179% | 140% | 166% |
A Calculated based on average shares outstanding during the period.
B Amount represents less than $.005 per share.
C Total returns for periods of less than one year are not annualized.
D Total returns would have been lower if certain expenses had not been reduced during the applicable periods shown.
E Fees and expenses of any underlying Fidelity Central Funds are not included in the Fund's expense ratio. The Fund indirectly bears its proportionate share of the expenses of any underlying Fidelity Central Funds.
F Expense ratios reflect operating expenses of the class. Expenses before reductions do not reflect amounts reimbursed by the investment adviser or reductions from brokerage service arrangements or reductions from other expense offset arrangements and do not represent the amount paid by the class during periods when reimbursements or reductions occur. Expenses net of fee waivers reflect expenses after reimbursement by the investment adviser but prior to reductions from brokerage service arrangements or other expense offset arrangements. Expenses net of all reductions represent the net expenses paid by the class.
G Annualized
H Amount does not include the portfolio activity of any underlying Fidelity Central Funds.
See accompanying notes which are an integral part of the financial statements.
Notes to Financial Statements (Unaudited)
For the period ended January 31, 2016
1. Organization.
Fidelity Advisor Electronics Fund (the Fund) is a non-diversified fund of Fidelity Advisor Series VII (the Trust) and is authorized to issue an unlimited number of shares. The Trust is registered under the Investment Company Act of 1940, as amended (the 1940 Act), as an open-end management investment company organized as a Massachusetts business trust. The Fund offers Class A, Class T, Class C and Class I shares, each of which, along with Class B shares, has equal rights as to assets and voting privileges. Class B shares are closed to new accounts and additional purchases, except for exchanges and reinvestments. Each class has exclusive voting rights with respect to matters that affect that class. Class B shares will automatically convert to Class A shares after a holding period of seven years from the initial date of purchase.
During the period, the Board of Trustees approved the conversion of all existing Class B shares into Class A shares, effective on or about July 1, 2016, regardless of the length of times shares have been held.
2. Investments in Fidelity Central Funds.
The Fund invests in Fidelity Central Funds, which are open-end investment companies generally available only to other investment companies and accounts managed by the investment adviser and its affiliates. The Fund's Schedule of Investments lists each of the Fidelity Central Funds held as of period end, if any, as an investment of the Fund, but does not include the underlying holdings of each Fidelity Central Fund. As an Investing Fund, the Fund indirectly bears its proportionate share of the expenses of the underlying Fidelity Central Funds.
The Money Market Central Funds seek preservation of capital and current income and are managed by Fidelity Investments Money Management, Inc. (FIMM), an affiliate of the investment adviser. Annualized expenses of the Money Market Central Funds as of their most recent shareholder report date are less than .005%.
A complete unaudited list of holdings for each Fidelity Central Fund is available upon request or at the Securities and Exchange Commission (the SEC) website at www.sec.gov. In addition, the financial statements of the Fidelity Central Funds are available on the SEC website or upon request.
3. Significant Accounting Policies.
The financial statements have been prepared in conformity with accounting principles generally accepted in the United States of America (GAAP), which require management to make certain estimates and assumptions at the date of the financial statements. Actual results could differ from those estimates. Subsequent events, if any, through the date that the financial statements were issued have been evaluated in the preparation of the financial statements. The following summarizes the significant accounting policies of the Fund:
Investment Valuation. Investments are valued as of 4:00 p.m. Eastern time on the last calendar day of the period. The Board of Trustees (the Board) has delegated the day to day responsibility for the valuation of the Fund's investments to the Fidelity SelectCo, LLC (SelectCo) Fair Value Committee (the Committee). In accordance with valuation policies and procedures approved by the Board, the Fund attempts to obtain prices from one or more third party pricing vendors or brokers to value its investments. When current market prices, quotations or currency exchange rates are not readily available or reliable, investments will be fair valued in good faith by the Committee, in accordance with procedures adopted by the Board. Factors used in determining fair value vary by investment type and may include market or investment specific events, changes in interest rates and credit quality. The frequency with which these procedures are used cannot be predicted and they may be utilized to a significant extent. The Committee oversees the Fund's valuation policies and procedures and reports to the Board on the Committee's activities and fair value determinations. The Board monitors the appropriateness of the procedures used in valuing the Fund's investments and ratifies the fair value determinations of the Committee.
The Fund categorizes the inputs to valuation techniques used to value its investments into a disclosure hierarchy consisting of three levels as shown below:
- Level 1 – quoted prices in active markets for identical investments
- Level 2 – other significant observable inputs (including quoted prices for similar investments, interest rates, prepayment speeds, etc.)
- Level 3 – unobservable inputs (including the Fund's own assumptions based on the best information available)
Valuation techniques used to value the Fund's investments by major category are as follows:
Equity securities, including restricted securities, for which market quotations are readily available, are valued at the last reported sale price or official closing price as reported by a third party pricing vendor on the primary market or exchange on which they are traded and are categorized as Level 1 in the hierarchy. In the event there were no sales during the day or closing prices are not available, securities are valued at the last quoted bid price or may be valued using the last available price and are generally categorized as Level 2 in the hierarchy. For foreign equity securities, when market or security specific events arise, comparisons to the valuation of American Depositary Receipts (ADRs), futures contracts, Exchange-Traded Funds (ETFs) and certain indexes as well as quoted prices for similar securities may be used and would be categorized as Level 2 in the hierarchy. Utilizing these techniques may result in transfers between Level 1 and Level 2. For equity securities, including restricted securities, where observable inputs are limited, assumptions about market activity and risk are used and these securities may be categorized as Level 3 in the hierarchy.
Debt securities, including restricted securities, are valued based on evaluated prices received from third party pricing vendors or from brokers who make markets in such securities. Corporate bonds are valued by pricing vendors who utilize matrix pricing which considers yield or price of bonds of comparable quality, coupon, maturity and type or by broker-supplied prices. When independent prices are unavailable or unreliable, debt securities may be valued utilizing pricing methodologies which consider similar factors that would be used by third party pricing vendors. Debt securities are generally categorized as Level 2 in the hierarchy but may be Level 3 depending on the circumstances.
Investments in open-end mutual funds, including the Fidelity Central Funds, are valued at their closing net asset value (NAV) each business day and are categorized as Level 1 in the hierarchy.
Changes in valuation techniques may result in transfers in or out of an assigned level within the disclosure hierarchy. The aggregate value of investments by input level as of January 31, 2016 is included at the end of the Fund's Schedule of Investments.
Foreign Currency. The Fund may use foreign currency contracts to facilitate transactions in foreign-denominated securities. Gains and losses from these transactions may arise from changes in the value of the foreign currency or if the counterparties do not perform under the contracts' terms.
Foreign-denominated assets, including investment securities, and liabilities are translated into U.S. dollars at the exchange rates at period end. Purchases and sales of investment securities, income and dividends received and expenses denominated in foreign currencies are translated into U.S. dollars at the exchange rate in effect on the transaction date.
The effects of exchange rate fluctuations on investments are included with the net realized and unrealized gain (loss) on investment securities. Other foreign currency transactions resulting in realized and unrealized gain (loss) are disclosed separately.
Investment Transactions and Income. For financial reporting purposes, the Fund's investment holdings and NAV include trades executed through the end of the last business day of the period. The NAV per share for processing shareholder transactions is calculated as of the close of business of the New York Stock Exchange (NYSE), normally 4:00 p.m. Eastern time and includes trades executed through the end of the prior business day. Gains and losses on securities sold are determined on the basis of identified cost and may include proceeds received from litigation. Dividend income is recorded on the ex-dividend date, except for certain dividends from foreign securities where the ex-dividend date may have passed, which are recorded as soon as the Fund is informed of the ex-dividend date. Non-cash dividends included in dividend income, if any, are recorded at the fair market value of the securities received. Income and capital gain distributions from Fidelity Central Funds, if any, are recorded on the ex-dividend date. Distributions received on securities that represent a return of capital or capital gain are recorded as a reduction of cost of investments and/or as a realized gain. Subsequent to ex-dividend date the Fund determines the components of these distributions, based upon receipt of tax filings or other correspondence relating to the underlying investment. Interest income is accrued as earned and includes coupon interest and amortization of premium and accretion of discount on debt securities as applicable. Investment income is recorded net of foreign taxes withheld where recovery of such taxes is uncertain.
Class Allocations and Expenses. Investment income, realized and unrealized capital gains and losses, common expenses of the Fund, and certain fund-level expense reductions, if any, are allocated daily on a pro-rata basis to each class based on the relative net assets of each class to the total net assets of the Fund. Each class differs with respect to transfer agent and distribution and service plan fees incurred. Certain expense reductions may also differ by class. For the reporting period, the allocated portion of income and expenses to each class as a percent of its average net assets may vary due to the timing of recording these transactions in relation to fluctuating net assets of the classes. Expenses directly attributable to a fund are charged to that fund. Expenses attributable to more than one fund are allocated among the respective funds on the basis of relative net assets or other appropriate methods. Expense estimates are accrued in the period to which they relate and adjustments are made when actual amounts are known.
Income Tax Information and Distributions to Shareholders. Each year, the Fund intends to qualify as a regulated investment company under Subchapter M of the Internal Revenue Code, including distributing substantially all of its taxable income and realized gains. As a result, no provision for U.S. Federal income taxes is required. The Fund files a U.S. federal tax return, in addition to state and local tax returns as required. The Fund's federal income tax returns are subject to examination by the Internal Revenue Service (IRS) for a period of three fiscal years after they are filed. State and local tax returns may be subject to examination for an additional fiscal year depending on the jurisdiction. Foreign taxes are provided for based on the Fund's understanding of the tax rules and rates that exist in the foreign markets in which it invests.
Distributions are declared and recorded on the ex-dividend date. Income dividends and capital gain distributions are declared separately for each class. Income and capital gain distributions are determined in accordance with income tax regulations, which may differ from GAAP.
Capital accounts within the financial statements are adjusted for permanent book-tax differences. These adjustments have no impact on net assets or the results of operations. Capital accounts are not adjusted for temporary book-tax differences which will reverse in a subsequent period.
Book-tax differences are primarily due to foreign currency transactions, capital loss carryforwards, market discount and losses deferred to wash sales and excise tax regulations.
The federal tax cost of investment securities and unrealized appreciation (depreciation) as of period end were as follows:
| Gross unrealized appreciation | $1,917,924 |
| Gross unrealized depreciation | (14,024,578) |
| Net unrealized appreciation (depreciation) on securities | $(12,106,654) |
| Tax cost | $86,491,475 |
Short-Term Trading (Redemption) Fees. Shares held by investors in the Fund less than 30 days may have been subject to a redemption fee equal to .75% of the NAV of shares redeemed. All redemption fees, which reduce the proceeds of the shareholder redemption, are retained by the Fund and accounted for as an addition to paid in capital.
4. Purchases and Sales of Investments.
Purchases and sales of securities, other than short-term securities, aggregated $96,637,409 and $125,076,922, respectively.
5. Fees and Other Transactions with Affiliates.
Management Fee. Fidelity SelectCo, LLC (the investment adviser) and its affiliates provide the Fund with investment management related services for which the Fund pays a monthly management fee. The management fee is the sum of an individual fund fee rate that is based on an annual rate of .30% of the Fund's average net assets and an annualized group fee rate that averaged .25% during the period. The group fee rate is based upon the average net assets of all the mutual funds advised by Fidelity Management & Research Company (FMR) and the investment adviser. The group fee rate decreases as assets under management increase and increases as assets under management decrease. For the reporting period, the total annualized management fee rate was .55% of the Fund's average net assets.
Distribution and Service Plan Fees. In accordance with Rule 12b-1 of the 1940 Act, the Fund has adopted separate Distribution and Service Plans for each class of shares. Certain classes pay Fidelity Distributors Corporation (FDC), an affiliate of the investment adviser, separate Distribution and Service Fees, each of which is based on an annual percentage of each class' average net assets. In addition, FDC may pay financial intermediaries for selling shares of the Fund and providing shareholder support services. For the period, the Distribution and Service Fee rates, total fees and amounts retained by FDC were as follows:
| | Distribution
Fee | Service
Fee | Total Fees | Retained
by FDC |
| Class A | - % | .25% | $39,616 | $749 |
| Class T | .25% | .25% | 24,552 | - |
| Class B | .75% | .25% | 1,465 | 1,099 |
| Class C | .75% | .25% | 93,825 | 28,441 |
| | | | $159,458 | $30,289 |
Sales Load. FDC may receive a front-end sales charge of up to 5.75% for selling Class A shares and 3.50% for selling Class T shares, some of which is paid to financial intermediaries for selling shares of the Fund. Depending on the holding period, FDC may receive contingent deferred sales charges levied on Class A, Class T, Class B, and Class C redemptions. The deferred sales charges range from 5.00% to 1.00% for Class B shares, 1.00% for Class C shares, 1.00% for certain purchases of Class A shares and .25% for certain purchases of Class T shares.
For the period, sales charge amounts retained by FDC were as follows:
| | Retained
by FDC |
| Class A | $16,777 |
| Class T | 1,421 |
| Class C(a) | 4,197 |
| | $22,395 |
(a) When Class C shares are initially sold, FDC pays commissions from its own resources to financial intermediaries through which the sales are made.
Transfer Agent Fees. Fidelity Investments Institutional Operations Company, Inc., (FIIOC), an affiliate of the investment adviser, is the transfer, dividend disbursing and shareholder servicing agent for each class of the Fund. FIIOC receives account fees and asset-based fees that vary according to the account size and type of account of the shareholders of the respective classes of the Fund. FIIOC pays for typesetting, printing and mailing of shareholder reports, except proxy statements.
For the period, transfer agent fees for each class were as follows:
| | Amount | % of
Class-Level Average
Net Assets(a) |
| Class A | $39,279 | .25 |
| Class T | 16,744 | .34 |
| Class B | 439 | .30 |
| Class C | 25,865 | .28 |
| Class I | 19,943 | .17 |
| | $102,270 | |
(a) Annualized
Accounting and Security Lending Fees. Fidelity Service Company, Inc. (FSC), an affiliate of the investment adviser, maintains the Fund's accounting records. The accounting fee is based on the level of average net assets for each month. Under a separate contract, FSC administers the security lending program. The security lending fee is based on the number and duration of lending transactions.
Brokerage Commissions. The Fund placed a portion of its portfolio transactions with brokerage firms which are affiliates of the investment adviser. Brokerage commissions are included in net realized gain (loss) and change in net unrealized appreciation (depreciation) in the Statement of Operations. The commissions paid to these affiliated firms were $5,348 for the period.
Interfund Trades. The Fund may purchase from or sell securities to other Fidelity Funds under procedures adopted by the Board. The procedures have been designed to ensure these interfund trades are executed in accordance with Rule 17a-7 of the 1940 Act. Interfund trades are included within the respective purchases and sales amounts shown in the Purchases and Sales of Investments note.
6. Committed Line of Credit.
The Fund participates with other funds managed by the investment adviser or an affiliate in a $4.25 billion credit facility (the "line of credit") to be utilized for temporary or emergency purposes to fund shareholder redemptions or for other short-term liquidity purposes. The Fund has agreed to pay commitment fees on its pro-rata portion of the line of credit, which amounted to $61 and is reflected in Miscellaneous expenses on the Statement of Operations. During the period, the Fund did not borrow on this line of credit.
7. Security Lending.
The Fund lends portfolio securities through a lending agent from time to time in order to earn additional income. On the settlement date of the loan, the Fund receives collateral (in the form of U.S. Treasury obligations, letters of credit and/or cash) against the loaned securities and maintains collateral in an amount not less than 100% of the market value of the loaned securities during the period of the loan. The market value of the loaned securities is determined at the close of business of the Fund and any additional required collateral is delivered to the Fund on the next business day. The Fund or borrower may terminate the loan at any time, and if the borrower defaults on its obligation to return the securities loaned because of insolvency or other reasons, the Fund may apply collateral received from the borrower against the obligation. The Fund may experience delays and costs in recovering the securities loaned. Any cash collateral received is invested in the Fidelity Securities Lending Cash Central Fund. The value of loaned securities and cash collateral at period end are disclosed on the Fund's Statement of Assets and Liabilities. Security lending income represents the income earned on investing cash collateral, less rebates paid to borrowers and any lending agent fees associated with the loan, plus any premium payments received for lending certain types of securities. Security lending income is presented in the Statement of Operations as a component of income from Fidelity Central Funds. Total security lending income during the period amounted to $16,185.
8. Expense Reductions.
The investment adviser voluntarily agreed to reimburse each class to the extent annual operating expenses exceeded certain levels of average net assets as noted in the table below. Some expenses, for example interest expense, including commitment fees, are excluded from this reimbursement.
The following classes were in reimbursement during the period:
| | Expense
Limitations | Reimbursement |
| Class T | 1.65% | $3,028 |
| Class B | 2.15% | 30 |
| | | $3,058 |
Commissions paid to certain brokers with whom the investment adviser, or its affiliates, places trades on behalf of the Fund include an amount in addition to trade execution, which may be rebated back to the Fund to offset certain expenses. This amount totaled $4,893 for the period.
In addition, during the period the investment advisor reimbursed and/ or waived a portion of fund-level operating expenses in the amount of $302.
9. Distributions to Shareholders.
Distributions to shareholders of each class were as follows:
| | Six months ended January 31, 2016 | Year ended July 31, 2015 |
| From net investment income | | |
| Class A | $113,188 | $13,078 |
| Class T | 30,105 | – |
| Class B | 373 | – |
| Class C | 23,745 | – |
| Class I | 133,338 | 44,329 |
| Total | $300,749 | $57,407 |
| From net realized gain | | |
| Class A | $3,392,087 | $128,913 |
| Class T | 1,000,750 | 34,794 |
| Class B | 31,868 | 598 |
| Class C | 2,046,878 | 43,270 |
| Class I | 2,464,994 | 169,927 |
| Total | $8,936,577 | $377,502 |
10. Share Transactions.
Share transactions for each class were as follows and may contain automatic conversions between classes or exchanges between affiliated funds:
| | Shares | Shares | Dollars | Dollars |
| | Six months ended January 31, 2016 | Year ended July 31, 2015 | Six months ended January 31, 2016 | Year ended July 31, 2015 |
| Class A | | | | |
| Shares sold | 409,291 | 2,442,737 | $5,752,867 | $38,016,336 |
| Reinvestment of distributions | 243,337 | 7,644 | 3,248,410 | 119,544 |
| Shares redeemed | (969,254) | (1,143,527) | (13,618,357) | (17,859,819) |
| Net increase (decrease) | (316,626) | 1,306,854 | $(4,617,080) | $20,276,061 |
| Class T | | | | |
| Shares sold | 62,943 | 393,756 | $862,188 | $5,963,896 |
| Reinvestment of distributions | 74,437 | 2,215 | 959,818 | 33,619 |
| Shares redeemed | (171,612) | (195,977) | (2,292,464) | (2,908,278) |
| Net increase (decrease) | (34,232) | 199,994 | $(470,458) | $3,089,237 |
| Class B | | | | |
| Shares sold | 526 | 8,518 | $6,775 | $118,987 |
| Reinvestment of distributions | 2,652 | 39 | 31,733 | 551 |
| Shares redeemed | (3,847) | (16,542) | (48,572) | (232,148) |
| Net increase (decrease) | (669) | (7,985) | $(10,064) | $(112,610) |
| Class C | | | | |
| Shares sold | 238,000 | 1,188,406 | $2,983,314 | $16,685,789 |
| Reinvestment of distributions | 160,178 | 2,732 | 1,907,126 | 38,744 |
| Shares redeemed | (405,734) | (265,701) | (5,084,884) | (3,757,943) |
| Net increase (decrease) | (7,556) | 925,437 | $(194,444) | $12,966,590 |
| Class I | | | | |
| Shares sold | 238,555 | 3,205,885 | $3,563,788 | $51,968,937 |
| Reinvestment of distributions | 135,996 | 10,497 | 1,894,884 | 170,367 |
| Shares redeemed | (1,283,203) | (2,698,476) | (19,017,782) | (43,445,677) |
| Net increase (decrease) | (908,652) | 517,906 | $(13,559,110) | $8,693,627 |
11. Other.
The Fund's organizational documents provide former and current trustees and officers with a limited indemnification against liabilities arising in connection with the performance of their duties to the Fund. In the normal course of business, the Fund may also enter into contracts that provide general indemnifications. The Fund's maximum exposure under these arrangements is unknown as this would be dependent on future claims that may be made against the Fund. The risk of material loss from such claims is considered remote.
Fidelity Advisor® Energy Fund
Investment Summary (Unaudited)
Top Ten Stocks as of January 31, 2016
| | % of fund's net assets | % of fund's net assets 6 months ago |
| Exxon Mobil Corp. | 9.5 | 14.6 |
| Schlumberger Ltd. | 8.3 | 9.5 |
| EOG Resources, Inc. | 6.3 | 6.1 |
| Valero Energy Corp. | 5.2 | 5.2 |
| Cimarex Energy Co. | 4.4 | 3.9 |
| Pioneer Natural Resources Co. | 3.8 | 2.9 |
| Baker Hughes, Inc. | 3.7 | 2.7 |
| Anadarko Petroleum Corp. | 3.7 | 4.5 |
| Diamondback Energy, Inc. | 3.5 | 1.6 |
| Newfield Exploration Co. | 3.4 | 3.9 |
| | 51.8 | |
Top Industries (% of fund's net assets)
| As of January 31, 2016 |
| | Oil, Gas & Consumable Fuels | 76.2% |
| | Energy Equipment & Services | 18.9% |
| | Chemicals | 1.2% |
| | Independent Power and Renewable Electricity Producers | 0.9% |
| | Semiconductors & Semiconductor Equipment | 0.3% |
| | All Others* | 2.5% |

| As of July 31, 2015 |
| | Oil, Gas & Consumable Fuels | 82.1% |
| | Energy Equipment & Services | 15.6% |
| | Independent Power and Renewable Electricity Producers | 1.1% |
| | Chemicals | 0.6% |
| | All Others* | 0.6% |

* Includes Short-Term investments and Net Other Assets (Liabilities).
Fidelity Advisor® Energy Fund
Investments January 31, 2016 (Unaudited)
Showing Percentage of Net Assets
| Common Stocks - 97.5% | | | |
| | | Shares | Value |
| Chemicals - 1.2% | | | |
| Commodity Chemicals - 1.2% | | | |
| LyondellBasell Industries NV Class A | | 108,900 | $8,490,933 |
| Energy Equipment & Services - 18.9% | | | |
| Oil & Gas Drilling - 0.4% | | | |
| Nabors Industries Ltd. | | 179,900 | 1,324,064 |
| Odfjell Drilling A/S (a) | | 567,856 | 354,465 |
| Xtreme Drilling & Coil Services Corp. (a) | | 813,202 | 969,411 |
| | | | 2,647,940 |
| Oil & Gas Equipment & Services - 18.5% | | | |
| Baker Hughes, Inc. | | 587,800 | 25,575,178 |
| Bristow Group, Inc. | | 27,500 | 639,650 |
| Cameron International Corp. (a) | | 285,600 | 18,752,496 |
| Dril-Quip, Inc. (a) | | 141,191 | 8,279,440 |
| Frank's International NV | | 553,200 | 8,093,316 |
| Oceaneering International, Inc. | | 216,273 | 7,320,841 |
| Schlumberger Ltd. | | 789,409 | 57,050,588 |
| Tesco Corp. | | 196,200 | 1,334,160 |
| Total Energy Services, Inc. | | 38,900 | 398,469 |
| | | | 127,444,138 |
|
| TOTAL ENERGY EQUIPMENT & SERVICES | | | 130,092,078 |
|
| Independent Power and Renewable Electricity Producers - 0.9% | | | |
| Independent Power Producers & Energy Traders - 0.2% | | | |
| NRG Yield, Inc. Class C (b) | | 83,000 | 1,098,920 |
| Renewable Electricity - 0.7% | | | |
| NextEra Energy Partners LP | | 184,600 | 4,982,354 |
|
| TOTAL INDEPENDENT POWER AND RENEWABLE ELECTRICITY PRODUCERS | | | 6,081,274 |
|
| Oil, Gas & Consumable Fuels - 76.2% | | | |
| Coal & Consumable Fuels - 0.2% | | | |
| CONSOL Energy, Inc. | | 160,800 | 1,276,752 |
| Integrated Oil & Gas - 13.3% | | | |
| Chevron Corp. | | 215,309 | 18,617,769 |
| Exxon Mobil Corp. | | 840,161 | 65,406,533 |
| Occidental Petroleum Corp. | | 111,900 | 7,702,077 |
| | | | 91,726,379 |
| Oil & Gas Exploration & Production - 48.1% | | | |
| Anadarko Petroleum Corp. | | 648,883 | 25,364,836 |
| Antero Resources Corp. (a)(b) | | 154,500 | 4,197,765 |
| Apache Corp. | | 39,900 | 1,697,346 |
| ARC Resources Ltd. (b) | | 58,100 | 780,943 |
| Bankers Petroleum Ltd. (a) | | 314,900 | 200,058 |
| Cabot Oil & Gas Corp. | | 201,100 | 4,172,825 |
| Canadian Natural Resources Ltd. | | 114,000 | 2,440,474 |
| Carrizo Oil & Gas, Inc. (a) | | 49,800 | 1,351,074 |
| Cimarex Energy Co. | | 323,047 | 30,043,371 |
| Concho Resources, Inc. (a) | | 144,800 | 13,774,824 |
| ConocoPhillips Co. | | 131,500 | 5,139,020 |
| Continental Resources, Inc. (a) | | 53,630 | 1,132,129 |
| Denbury Resources, Inc. | | 200,600 | 312,936 |
| Devon Energy Corp. | | 298,400 | 8,325,360 |
| Diamondback Energy, Inc. | | 320,500 | 24,213,775 |
| Encana Corp. | | 983,200 | 4,316,282 |
| Energen Corp. | | 142,713 | 5,033,488 |
| EOG Resources, Inc. | | 608,586 | 43,221,778 |
| EQT Corp. | | 80,500 | 4,970,070 |
| Evolution Petroleum Corp. | | 42,495 | 198,027 |
| Gran Tierra Energy, Inc. (Canada) (a) | | 343,300 | 784,182 |
| Gulfport Energy Corp. (a) | | 151,200 | 4,467,960 |
| Hess Corp. | | 266,400 | 11,322,000 |
| Memorial Resource Development Corp. (a) | | 1,019,700 | 16,223,427 |
| Newfield Exploration Co. (a) | | 805,500 | 23,415,885 |
| Noble Energy, Inc. | | 582,308 | 18,849,310 |
| Northern Oil & Gas, Inc. (a) | | 234,293 | 773,167 |
| Parsley Energy, Inc. Class A (a) | | 468,000 | 9,013,680 |
| PDC Energy, Inc. (a) | | 360,288 | 20,489,579 |
| Pioneer Natural Resources Co. | | 209,216 | 25,932,323 |
| Rice Energy, Inc. (a) | | 184,900 | 2,157,783 |
| RSP Permian, Inc. (a) | | 218,100 | 5,136,255 |
| Seven Generations Energy Ltd. (a) | | 367,300 | 4,132,092 |
| SM Energy Co. (b) | | 328,402 | 4,591,060 |
| Synergy Resources Corp. (a) | | 546,215 | 3,463,003 |
| TAG Oil Ltd. (a) | | 342,200 | 141,677 |
| Whiting Petroleum Corp. (a) | | 31,600 | 232,260 |
| | | | 332,012,024 |
| Oil & Gas Refining & Marketing - 7.5% | | | |
| Keyera Corp. (b) | | 233,900 | 6,411,421 |
| PBF Energy, Inc. Class A | | 122,700 | 4,293,273 |
| Valero Energy Corp. | | 526,226 | 35,714,959 |
| Western Refining, Inc. | | 75,500 | 2,483,950 |
| World Fuel Services Corp. | | 65,333 | 2,544,720 |
| | | | 51,448,323 |
| Oil & Gas Storage & Transport - 7.1% | | | |
| Buckeye Partners LP | | 5,000 | 291,200 |
| Cheniere Energy Partners LP Holdings LLC | | 164,400 | 2,454,492 |
| Cheniere Energy, Inc. (a) | | 122,100 | 3,669,105 |
| Columbia Pipeline Group, Inc. | | 228,000 | 4,229,400 |
| Enterprise Products Partners LP | | 248,100 | 5,932,071 |
| Gener8 Maritime, Inc. (a) | | 79,800 | 537,054 |
| Golar LNG Ltd. | | 167,300 | 3,115,126 |
| Kinder Morgan, Inc. | | 1,040,000 | 17,108,000 |
| Magellan Midstream Partners LP | | 49,834 | 3,200,838 |
| Phillips 66 Partners LP | | 13,969 | 791,763 |
| Plains All American Pipeline LP | | 95,800 | 2,022,338 |
| Rice Midstream Partners LP | | 117,300 | 1,265,667 |
| Shell Midstream Partners LP | | 117,100 | 4,164,076 |
| | | | 48,781,130 |
|
| TOTAL OIL, GAS & CONSUMABLE FUELS | | | 525,244,608 |
|
| Semiconductors& Semiconductor Equipment - 0.3% | | | |
| Semiconductor Equipment - 0.3% | | | |
| SolarEdge Technologies, Inc. | | 80,800 | 2,284,216 |
| TOTAL COMMON STOCKS | | | |
| (Cost $782,828,800) | | | 672,193,109 |
|
| Money Market Funds - 3.9% | | | |
| Fidelity Cash Central Fund, 0.38% (c) | | 13,838,214 | 13,838,214 |
| Fidelity Securities Lending Cash Central Fund, 0.42% (c)(d) | | 13,171,670 | 13,171,670 |
| TOTAL MONEY MARKET FUNDS | | | |
| (Cost $27,009,884) | | | 27,009,884 |
| TOTAL INVESTMENT PORTFOLIO - 101.4% | | | |
| (Cost $809,838,684) | | | 699,202,993 |
| NET OTHER ASSETS (LIABILITIES) - (1.4)% | | | (9,854,392) |
| NET ASSETS - 100% | | | $689,348,601 |
Legend
(a) Non-income producing
(b) Security or a portion of the security is on loan at period end.
(c) Affiliated fund that is generally available only to investment companies and other accounts managed by Fidelity Investments. The rate quoted is the annualized seven-day yield of the fund at period end. A complete unaudited listing of the fund's holdings as of its most recent quarter end is available upon request. In addition, each Fidelity Central Fund's financial statements are available on the SEC's website or upon request.
(d) Investment made with cash collateral received from securities on loan.
Affiliated Central Funds
Information regarding fiscal year to date income earned by the Fund from investments in Fidelity Central Funds is as follows:
| Fund | Income earned |
| Fidelity Cash Central Fund | $9,640 |
| Fidelity Securities Lending Cash Central Fund | 38,523 |
| Total | $48,163 |
Investment Valuation
The following is a summary of the inputs used, as of January 31, 2016, involving the Fund's assets and liabilities carried at fair value. The inputs or methodology used for valuing securities may not be an indication of the risk associated with investing in those securities. For more information on valuation inputs, and their aggregation into the levels used below, please refer to the Investment Valuation section in the accompanying Notes to Financial Statements.
| | Valuation Inputs at Reporting Date: |
| Description | Total | Level 1 | Level 2 | Level 3 |
| Investments in Securities: | | | | |
| Common Stocks | $672,193,109 | $671,838,644 | $354,465 | $-- |
| Money Market Funds | 27,009,884 | 27,009,884 | -- | -- |
| Total Investments in Securities: | $699,202,993 | $698,848,528 | $354,465 | $-- |
Other Information
Distribution of investments by country or territory of incorporation, as a percentage of Total Net Assets, is as follows (Unaudited):
| United States of America | 85.6% |
| Curacao | 8.3% |
| Canada | 2.9% |
| Netherlands | 2.4% |
| Others (Individually Less Than 1%) | 0.8% |
| | 100.0% |
See accompanying notes which are an integral part of the financial statements.
Fidelity Advisor® Energy Fund
Financial Statements
Statement of Assets and Liabilities
| | | January 31, 2016 (Unaudited) |
| Assets | | |
Investment in securities, at value (including securities loaned of $13,257,503) — See accompanying schedule:
Unaffiliated issuers (cost $782,828,800) | $672,193,109 | |
| Fidelity Central Funds (cost $27,009,884) | 27,009,884 | |
| Total Investments (cost $809,838,684) | | $699,202,993 |
| Receivable for investments sold | | 16,133,984 |
| Receivable for fund shares sold | | 4,044,481 |
| Dividends receivable | | 402,799 |
| Distributions receivable from Fidelity Central Funds | | 15,943 |
| Prepaid expenses | | 3,224 |
| Other receivables | | 29,990 |
| Total assets | | 719,833,414 |
| Liabilities | | |
| Payable for investments purchased | $15,046,939 | |
| Payable for fund shares redeemed | 1,527,756 | |
| Accrued management fee | 289,443 | |
| Distribution and service plan fees payable | 225,325 | |
| Other affiliated payables | 170,014 | |
| Other payables and accrued expenses | 53,666 | |
| Collateral on securities loaned, at value | 13,171,670 | |
| Total liabilities | | 30,484,813 |
| Net Assets | | $689,348,601 |
| Net Assets consist of: | | |
| Paid in capital | | $926,814,258 |
| Distributions in excess of net investment income | | (675,959) |
| Accumulated undistributed net realized gain (loss) on investments and foreign currency transactions | | (126,154,603) |
| Net unrealized appreciation (depreciation) on investments and assets and liabilities in foreign currencies | | (110,635,095) |
| Net Assets | | $689,348,601 |
| Calculation of Maximum Offering Price | | |
| Class A: | | |
| Net Asset Value and redemption price per share ($263,313,918 ÷ 9,944,544 shares) | | $26.48 |
| Maximum offering price per share (100/94.25 of $26.48) | | $28.10 |
| Class T: | | |
| Net Asset Value and redemption price per share ($133,860,722 ÷ 4,937,164 shares) | | $27.11 |
| Maximum offering price per share (100/96.50 of $27.11) | | $28.09 |
| Class B: | | |
| Net Asset Value and offering price per share ($4,982,762 ÷ 204,426 shares)(a) | | $24.37 |
| Class C: | | |
| Net Asset Value and offering price per share ($159,509,219 ÷ 6,510,338 shares)(a) | | $24.50 |
| Class I: | | |
| Net Asset Value, offering price and redemption price per share ($127,681,980 ÷ 4,583,182 shares) | | $27.86 |
(a) Redemption price per share is equal to net asset value less any applicable contingent deferred sales charge.
See accompanying notes which are an integral part of the financial statements.
Statement of Operations
| | | Six months ended January 31, 2016 (Unaudited) |
| Investment Income | | |
| Dividends | | $6,878,495 |
| Income from Fidelity Central Funds | | 48,163 |
| Total income | | 6,926,658 |
| Expenses | | |
| Management fee | $1,990,195 | |
| Transfer agent fees | 924,852 | |
| Distribution and service plan fees | 1,540,232 | |
| Accounting and security lending fees | 129,450 | |
| Custodian fees and expenses | 11,860 | |
| Independent trustees' compensation | 6,916 | |
| Registration fees | 76,319 | |
| Audit | 24,013 | |
| Legal | 4,097 | |
| Miscellaneous | 4,137 | |
| Total expenses before reductions | 4,712,071 | |
| Expense reductions | (29,358) | 4,682,713 |
| Net investment income (loss) | | 2,243,945 |
| Realized and Unrealized Gain (Loss) | | |
| Net realized gain (loss) on: | | |
| Investment securities: | | |
| Unaffiliated issuers | (66,019,287) | |
| Foreign currency transactions | (13,326) | |
| Total net realized gain (loss) | | (66,032,613) |
Change in net unrealized appreciation (depreciation) on:
Investment securities | (43,600,872) | |
| Assets and liabilities in foreign currencies | 3,771 | |
| Total change in net unrealized appreciation (depreciation) | | (43,597,101) |
| Net gain (loss) | | (109,629,714) |
| Net increase (decrease) in net assets resulting from operations | | $(107,385,769) |
See accompanying notes which are an integral part of the financial statements.
Statement of Changes in Net Assets
| | Six months ended January 31, 2016 (Unaudited) | Year ended July 31, 2015 |
| Increase (Decrease) in Net Assets | | |
| Operations | | |
| Net investment income (loss) | $2,243,945 | $4,666,139 |
| Net realized gain (loss) | (66,032,613) | (60,209,572) |
| Change in net unrealized appreciation (depreciation) | (43,597,101) | (212,688,818) |
| Net increase (decrease) in net assets resulting from operations | (107,385,769) | (268,232,251) |
| Distributions to shareholders from net investment income | (3,958,373) | (2,612,091) |
| Distributions to shareholders from net realized gain | – | (36,171,815) |
| Total distributions | (3,958,373) | (38,783,906) |
| Share transactions - net increase (decrease) | 42,742,066 | 190,554,548 |
| Redemption fees | 21,860 | 54,564 |
| Total increase (decrease) in net assets | (68,580,216) | (116,407,045) |
| Net Assets | | |
| Beginning of period | 757,928,817 | 874,335,862 |
| End of period (including distributions in excess of net investment income of $675,959 and undistributed net investment income of $1,038,469, respectively) | $689,348,601 | $757,928,817 |
See accompanying notes which are an integral part of the financial statements.
Financial Highlights — Fidelity Advisor Energy Fund Class A
| | Six months ended (Unaudited) | Years ended July 31, | | | | |
| January 31, | 2016 | 2015 | 2014 | 2013 | 2012 | 2011 |
| Selected Per–Share Data | | | | | | |
| Net asset value, beginning of period | $30.96 | $45.71 | $40.59 | $33.71 | $40.17 | $27.70 |
| Income from Investment Operations | | | | | | |
| Net investment income (loss)A | .11 | .28 | .15 | .23 | .25 | .11 |
| Net realized and unrealized gain (loss) | (4.39) | (12.89) | 7.06 | 6.81 | (6.50) | 12.47 |
| Total from investment operations | (4.28) | (12.61) | 7.21 | 7.04 | (6.25) | 12.58 |
| Distributions from net investment income | (.20) | (.18)B | (.17) | (.16) | (.21) | (.11) |
| Distributions from net realized gain | – | (1.96)B | (1.93) | – | – | – |
| Total distributions | (.20) | (2.14) | (2.09)C | (.16) | (.21) | (.11) |
| Redemption fees added to paid in capitalA,D | – | – | – | – | – | – |
| Net asset value, end of period | $26.48 | $30.96 | $45.71 | $40.59 | $33.71 | $40.17 |
| Total ReturnE,F,G | (13.84)% | (28.92)% | 18.46% | 20.94% | (15.58)% | 45.46% |
| Ratios to Average Net AssetsH,I | | | | | | |
| Expenses before reductions | 1.13%J | 1.12% | 1.12% | 1.16% | 1.17% | 1.16% |
| Expenses net of fee waivers, if any | 1.13%J | 1.12% | 1.12% | 1.16% | 1.17% | 1.16% |
| Expenses net of all reductions | 1.12%J | 1.11% | 1.12% | 1.15% | 1.17% | 1.16% |
| Net investment income (loss) | .78%J | .76% | .36% | .61% | .72% | .30% |
| Supplemental Data | | | | | | |
| Net assets, end of period (000 omitted) | $263,314 | $292,288 | $369,400 | $279,798 | $253,332 | $331,120 |
| Portfolio turnover rateK | 70%J | 61% | 112% | 68% | 88% | 91% |
A Calculated based on average shares outstanding during the period.
B The amounts shown reflect certain reclassifications related to book to tax differences that were made in the year shown.
C Total distributions of $2.09 per share is comprised of distributions from net investment income of $.165 and distributions from net realized gain of $1.929 per share.
D Amount represents less than $.005 per share.
E Total returns for periods of less than one year are not annualized.
F Total returns would have been lower if certain expenses had not been reduced during the applicable periods shown.
G Total returns do not include the effect of the sales charges.
H Fees and expenses of any underlying Fidelity Central Funds are not included in the Fund's expense ratio. The Fund indirectly bears its proportionate share of the expenses of any underlying Fidelity Central Funds.
I Expense ratios reflect operating expenses of the class. Expenses before reductions do not reflect amounts reimbursed by the investment adviser or reductions from brokerage service arrangements or reductions from other expense offset arrangements and do not represent the amount paid by the class during periods when reimbursements or reductions occur. Expenses net of fee waivers reflect expenses after reimbursement by the investment adviser but prior to reductions from brokerage service arrangements or other expense offset arrangements. Expenses net of all reductions represent the net expenses paid by the class.
J Annualized
K Amount does not include the portfolio activity of any underlying Fidelity Central Funds.
See accompanying notes which are an integral part of the financial statements.
Financial Highlights — Fidelity Advisor Energy Fund Class T
| | Six months ended (Unaudited) | Years ended July 31, | | | | |
| January 31, | 2016 | 2015 | 2014 | 2013 | 2012 | 2011 |
| Selected Per–Share Data | | | | | | |
| Net asset value, beginning of period | $31.63 | $46.64 | $41.38 | $34.40 | $41.04 | $28.33 |
| Income from Investment Operations | | | | | | |
| Net investment income (loss)A | .08 | .20 | .06 | .15 | .18 | .03 |
| Net realized and unrealized gain (loss) | (4.49) | (13.18) | 7.21 | 6.95 | (6.65) | 12.75 |
| Total from investment operations | (4.41) | (12.98) | 7.27 | 7.10 | (6.47) | 12.78 |
| Distributions from net investment income | (.11) | (.08)B | (.08) | (.12) | (.17) | (.07) |
| Distributions from net realized gain | – | (1.95)B | (1.93) | – | – | – |
| Total distributions | (.11) | (2.03) | (2.01) | (.12) | (.17) | (.07) |
| Redemption fees added to paid in capitalA,C | – | – | – | – | – | – |
| Net asset value, end of period | $27.11 | $31.63 | $46.64 | $41.38 | $34.40 | $41.04 |
| Total ReturnD,E,F | (13.97)% | (29.09)% | 18.19% | 20.70% | (15.77)% | 45.16% |
| Ratios to Average Net AssetsG,H | | | | | | |
| Expenses before reductions | 1.38%I | 1.36% | 1.34% | 1.36% | 1.38% | 1.37% |
| Expenses net of fee waivers, if any | 1.38%I | 1.35% | 1.34% | 1.36% | 1.38% | 1.37% |
| Expenses net of all reductions | 1.38%I | 1.35% | 1.34% | 1.35% | 1.38% | 1.37% |
| Net investment income (loss) | .53%I | .52% | .14% | .40% | .50% | .09% |
| Supplemental Data | | | | | | |
| Net assets, end of period (000 omitted) | $133,861 | $164,848 | $245,828 | $223,248 | $215,488 | $290,512 |
| Portfolio turnover rateJ | 70%I | 61% | 112% | 68% | 88% | 91% |
A Calculated based on average shares outstanding during the period.
B The amounts shown reflect certain reclassifications related to book to tax differences that were made in the year shown.
C Amount represents less than $.005 per share.
D Total returns for periods of less than one year are not annualized.
E Total returns would have been lower if certain expenses had not been reduced during the applicable periods shown.
F Total returns do not include the effect of the sales charges.
G Fees and expenses of any underlying Fidelity Central Funds are not included in the Fund's expense ratio. The Fund indirectly bears its proportionate share of the expenses of any underlying Fidelity Central Funds.
H Expense ratios reflect operating expenses of the class. Expenses before reductions do not reflect amounts reimbursed by the investment adviser or reductions from brokerage service arrangements or reductions from other expense offset arrangements and do not represent the amount paid by the class during periods when reimbursements or reductions occur. Expenses net of fee waivers reflect expenses after reimbursement by the investment adviser but prior to reductions from brokerage service arrangements or other expense offset arrangements. Expenses net of all reductions represent the net expenses paid by the class.
I Annualized
J Amount does not include the portfolio activity of any underlying Fidelity Central Funds.
See accompanying notes which are an integral part of the financial statements.
Financial Highlights — Fidelity Advisor Energy Fund Class B
| | Six months ended (Unaudited) | Years ended July 31, | | | | |
| January 31, | 2016 | 2015 | 2014 | 2013 | 2012 | 2011 |
| Selected Per–Share Data | | | | | | |
| Net asset value, beginning of period | $28.41 | $42.08 | $37.65 | $31.41 | $37.61 | $26.06 |
| Income from Investment Operations | | | | | | |
| Net investment income (loss)A | –B | (.02) | (.17) | (.05) | (.01) | (.15) |
| Net realized and unrealized gain (loss) | (4.04) | (11.84) | 6.52 | 6.34 | (6.09) | 11.71 |
| Total from investment operations | (4.04) | (11.86) | 6.35 | 6.29 | (6.10) | 11.56 |
| Distributions from net investment income | –B | – | – | (.05) | (.10) | (.01) |
| Distributions from net realized gain | – | (1.81) | (1.92) | – | – | – |
| Total distributions | –B | (1.81) | (1.92) | (.05) | (.10) | (.01) |
| Redemption fees added to paid in capitalA,B | – | – | – | – | – | – |
| Net asset value, end of period | $24.37 | $28.41 | $42.08 | $37.65 | $31.41 | $37.61 |
| Total ReturnC,D,E | (14.21)% | (29.47)% | 17.50% | 20.04% | (16.22)% | 44.38% |
| Ratios to Average Net AssetsF,G | | | | | | |
| Expenses before reductions | 1.91%H | 1.92% | 1.91% | 1.92% | 1.92% | 1.93% |
| Expenses net of fee waivers, if any | 1.91%H | 1.92% | 1.91% | 1.92% | 1.92% | 1.93% |
| Expenses net of all reductions | 1.90%H | 1.92% | 1.91% | 1.91% | 1.92% | 1.92% |
| Net investment income (loss) | - %H,I | (.05)% | (.44)% | (.15)% | (.03)% | (.46)% |
| Supplemental Data | | | | | | |
| Net assets, end of period (000 omitted) | $4,983 | $8,163 | $17,432 | $20,551 | $28,558 | $49,793 |
| Portfolio turnover rateJ | 70%H | 61% | 112% | 68% | 88% | 91% |
A Calculated based on average shares outstanding during the period.
B Amount represents less than $.005 per share.
C Total returns for periods of less than one year are not annualized.
D Total returns would have been lower if certain expenses had not been reduced during the applicable periods shown.
E Total returns do not include the effect of the contingent deferred sales charge.
F Fees and expenses of any underlying Fidelity Central Funds are not included in the Fund's expense ratio. The Fund indirectly bears its proportionate share of the expenses of any underlying Fidelity Central Funds.
G Expense ratios reflect operating expenses of the class. Expenses before reductions do not reflect amounts reimbursed by the investment adviser or reductions from brokerage service arrangements or reductions from other expense offset arrangements and do not represent the amount paid by the class during periods when reimbursements or reductions occur. Expenses net of fee waivers reflect expenses after reimbursement by the investment adviser but prior to reductions from brokerage service arrangements or other expense offset arrangements. Expenses net of all reductions represent the net expenses paid by the class.
H Annualized
I Amount represents less than .005%.
J Amount does not include the portfolio activity of any underlying Fidelity Central Funds.
See accompanying notes which are an integral part of the financial statements.
Financial Highlights — Fidelity Advisor Energy Fund Class C
| | Six months ended (Unaudited) | Years ended July 31, | | | | |
| January 31, | 2016 | 2015 | 2014 | 2013 | 2012 | 2011 |
| Selected Per–Share Data | | | | | | |
| Net asset value, beginning of period | $28.58 | $42.40 | $37.92 | $31.63 | $37.88 | $26.25 |
| Income from Investment Operations | | | | | | |
| Net investment income (loss)A | .01 | .01 | (.15) | (.04) | (.01) | (.15) |
| Net realized and unrealized gain (loss) | (4.06) | (11.93) | 6.57 | 6.38 | (6.13) | 11.80 |
| Total from investment operations | (4.05) | (11.92) | 6.42 | 6.34 | (6.14) | 11.65 |
| Distributions from net investment income | (.03) | (.03)B | (.01) | (.05) | (.11) | (.02) |
| Distributions from net realized gain | – | (1.88)B | (1.93) | – | – | – |
| Total distributions | (.03) | (1.90)C | (1.94) | (.05) | (.11) | (.02) |
| Redemption fees added to paid in capitalA,D | – | – | – | – | – | – |
| Net asset value, end of period | $24.50 | $28.58 | $42.40 | $37.92 | $31.63 | $37.88 |
| Total ReturnE,F,G | (14.16)% | (29.44)% | 17.57% | 20.08% | (16.22)% | 44.38% |
| Ratios to Average Net AssetsH,I | | | | | | |
| Expenses before reductions | 1.85%J | 1.85% | 1.86% | 1.90% | 1.92% | 1.90% |
| Expenses net of fee waivers, if any | 1.85%J | 1.85% | 1.86% | 1.90% | 1.92% | 1.90% |
| Expenses net of all reductions | 1.84%J | 1.85% | 1.86% | 1.88% | 1.91% | 1.89% |
| Net investment income (loss) | .06%J | .02% | (.38)% | (.13)% | (.03)% | (.43)% |
| Supplemental Data | | | | | | |
| Net assets, end of period (000 omitted) | $159,509 | $162,322 | $130,881 | $99,833 | $93,504 | $133,476 |
| Portfolio turnover rateK | 70%J | 61% | 112% | 68% | 88% | 91% |
A Calculated based on average shares outstanding during the period.
B The amounts shown reflect certain reclassifications related to book to tax differences that were made in the year shown.
C Total distributions of $1.90 per share is comprised of distributions from net investment income of $.027 and distributions from net realized gain of $1.877 per share.
D Amount represents less than $.005 per share.
E Total returns for periods of less than one year are not annualized.
F Total returns would have been lower if certain expenses had not been reduced during the applicable periods shown.
G Total returns do not include the effect of the contingent deferred sales charge.
H Fees and expenses of any underlying Fidelity Central Funds are not included in the Fund's expense ratio. The Fund indirectly bears its proportionate share of the expenses of any underlying Fidelity Central Funds.
I Expense ratios reflect operating expenses of the class. Expenses before reductions do not reflect amounts reimbursed by the investment adviser or reductions from brokerage service arrangements or reductions from other expense offset arrangements and do not represent the amount paid by the class during periods when reimbursements or reductions occur. Expenses net of fee waivers reflect expenses after reimbursement by the investment adviser but prior to reductions from brokerage service arrangements or other expense offset arrangements. Expenses net of all reductions represent the net expenses paid by the class.
J Annualized
K Amount does not include the portfolio activity of any underlying Fidelity Central Funds.
See accompanying notes which are an integral part of the financial statements.
Financial Highlights — Fidelity Advisor Energy Fund Class I
| | Six months ended (Unaudited) | Years ended July 31, | | | | |
| January 31, | 2016 | 2015 | 2014 | 2013 | 2012 | 2011 |
| Selected Per–Share Data | | | | | | |
| Net asset value, beginning of period | $32.62 | $48.05 | $42.55 | $35.28 | $41.95 | $28.87 |
| Income from Investment Operations | | | | | | |
| Net investment income (loss)A | .16 | .39 | .28 | .35 | .37 | .23 |
| Net realized and unrealized gain (loss) | (4.63) | (13.56) | 7.42 | 7.12 | (6.79) | 12.99 |
| Total from investment operations | (4.47) | (13.17) | 7.70 | 7.47 | (6.42) | 13.22 |
| Distributions from net investment income | (.29) | (.30)B | (.27) | (.20) | (.25) | (.14) |
| Distributions from net realized gain | – | (1.96)B | (1.93) | – | – | – |
| Total distributions | (.29) | (2.26) | (2.20) | (.20) | (.25) | (.14) |
| Redemption fees added to paid in capitalA,C | – | – | – | – | – | – |
| Net asset value, end of period | $27.86 | $32.62 | $48.05 | $42.55 | $35.28 | $41.95 |
| Total ReturnD,E | (13.74)% | (28.73)% | 18.80% | 21.26% | (15.31)% | 45.87% |
| Ratios to Average Net AssetsF,G | | | | | | |
| Expenses before reductions | .86%H | .85% | .85% | .88% | .86% | .86% |
| Expenses net of fee waivers, if any | .86%H | .85% | .85% | .88% | .86% | .86% |
| Expenses net of all reductions | .85%H | .85% | .85% | .86% | .85% | .85% |
| Net investment income (loss) | 1.06%H | 1.02% | .63% | .89% | 1.03% | .60% |
| Supplemental Data | | | | | | |
| Net assets, end of period (000 omitted) | $127,682 | $130,308 | $110,795 | $65,034 | $56,692 | $54,024 |
| Portfolio turnover rateI | 70%H | 61% | 112% | 68% | 88% | 91% |
A Calculated based on average shares outstanding during the period.
B The amounts shown reflect certain reclassifications related to book to tax differences that were made in the year shown.
C Amount represents less than $.005 per share.
D Total returns for periods of less than one year are not annualized.
E Total returns would have been lower if certain expenses had not been reduced during the applicable periods shown.
F Fees and expenses of any underlying Fidelity Central Funds are not included in the Fund's expense ratio. The Fund indirectly bears its proportionate share of the expenses of any underlying Fidelity Central Funds.
G Expense ratios reflect operating expenses of the class. Expenses before reductions do not reflect amounts reimbursed by the investment adviser or reductions from brokerage service arrangements or reductions from other expense offset arrangements and do not represent the amount paid by the class during periods when reimbursements or reductions occur. Expenses net of fee waivers reflect expenses after reimbursement by the investment adviser but prior to reductions from brokerage service arrangements or other expense offset arrangements. Expenses net of all reductions represent the net expenses paid by the class.
H Annualized
I Amount does not include the portfolio activity of any underlying Fidelity Central Funds.
See accompanying notes which are an integral part of the financial statements.
Notes to Financial Statements (Unaudited)
For the period ended January 31, 2016
1. Organization.
Fidelity Advisor Energy Fund (the Fund) is a non-diversified fund of Fidelity Advisor Series VII (the Trust) and is authorized to issue an unlimited number of shares. The Trust is registered under the Investment Company Act of 1940, as amended (the 1940 Act), as an open-end management investment company organized as a Massachusetts business trust. The Fund offers Class A, Class T, Class C and Class I shares, each of which, along with Class B shares, has equal rights as to assets and voting privileges. Class B shares are closed to new accounts and additional purchases, except for exchanges and reinvestments. Each class has exclusive voting rights with respect to matters that affect that class. Class B shares will automatically convert to Class A shares after a holding period of seven years from the initial date of purchase.
During the period, the Board of Trustees approved the conversion of all existing Class B shares into Class A shares, effective on or about July 1, 2016, regardless of the length of times shares have been held.
2. Investments in Fidelity Central Funds.
The Fund invests in Fidelity Central Funds, which are open-end investment companies generally available only to other investment companies and accounts managed by the investment adviser and its affiliates. The Fund's Schedule of Investments lists each of the Fidelity Central Funds held as of period end, if any, as an investment of the Fund, but does not include the underlying holdings of each Fidelity Central Fund. As an Investing Fund, the Fund indirectly bears its proportionate share of the expenses of the underlying Fidelity Central Funds.
The Money Market Central Funds seek preservation of capital and current income and are managed by Fidelity Investments Money Management, Inc. (FIMM), an affiliate of the investment adviser. Annualized expenses of the Money Market Central Funds as of their most recent shareholder report date are less than .005%.
A complete unaudited list of holdings for each Fidelity Central Fund is available upon request or at the Securities and Exchange Commission (the SEC) website at www.sec.gov. In addition, the financial statements of the Fidelity Central Funds are available on the SEC website or upon request.
3. Significant Accounting Policies.
The financial statements have been prepared in conformity with accounting principles generally accepted in the United States of America (GAAP), which require management to make certain estimates and assumptions at the date of the financial statements. Actual results could differ from those estimates. Subsequent events, if any, through the date that the financial statements were issued have been evaluated in the preparation of the financial statements. The following summarizes the significant accounting policies of the Fund:
Investment Valuation. Investments are valued as of 4:00 p.m. Eastern time on the last calendar day of the period. The Board of Trustees (the Board) has delegated the day to day responsibility for the valuation of the Fund's investments to the Fidelity SelectCo, LLC (SelectCo) Fair Value Committee (the Committee). In accordance with valuation policies and procedures approved by the Board, the Fund attempts to obtain prices from one or more third party pricing vendors or brokers to value its investments. When current market prices, quotations or currency exchange rates are not readily available or reliable, investments will be fair valued in good faith by the Committee, in accordance with procedures adopted by the Board. Factors used in determining fair value vary by investment type and may include market or investment specific events. The frequency with which these procedures are used cannot be predicted and they may be utilized to a significant extent. The Committee oversees the Fund's valuation policies and procedures and reports to the Board on the Committee's activities and fair value determinations. The Board monitors the appropriateness of the procedures used in valuing the Fund's investments and ratifies the fair value determinations of the Committee.
The Fund categorizes the inputs to valuation techniques used to value its investments into a disclosure hierarchy consisting of three levels as shown below:
- Level 1 – quoted prices in active markets for identical investments
- Level 2 – other significant observable inputs (including quoted prices for similar investments, interest rates, prepayment speeds, etc.)
- Level 3 – unobservable inputs (including the Fund's own assumptions based on the best information available)
Valuation techniques used to value the Fund's investments by major category are as follows:
Equity securities, including restricted securities, for which market quotations are readily available, are valued at the last reported sale price or official closing price as reported by a third party pricing vendor on the primary market or exchange on which they are traded and are categorized as Level 1 in the hierarchy. In the event there were no sales during the day or closing prices are not available, securities are valued at the last quoted bid price or may be valued using the last available price and are generally categorized as Level 2 in the hierarchy. For foreign equity securities, when market or security specific events arise, comparisons to the valuation of American Depositary Receipts (ADRs), futures contracts, Exchange-Traded Funds (ETFs) and certain indexes as well as quoted prices for similar securities may be used and would be categorized as Level 2 in the hierarchy. Utilizing these techniques may result in transfers between Level 1 and Level 2. For equity securities, including restricted securities, where observable inputs are limited, assumptions about market activity and risk are used and these securities may be categorized as Level 3 in the hierarchy.
Investments in open-end mutual funds, including the Fidelity Central Funds, are valued at their closing net asset value (NAV) each business day and are categorized as Level 1 in the hierarchy.
Changes in valuation techniques may result in transfers in or out of an assigned level within the disclosure hierarchy. The aggregate value of investments by input level as of January 31, 2016 is included at the end of the Fund's Schedule of Investments.
Foreign Currency. The Fund may use foreign currency contracts to facilitate transactions in foreign-denominated securities. Gains and losses from these transactions may arise from changes in the value of the foreign currency or if the counterparties do not perform under the contracts' terms.
Foreign-denominated assets, including investment securities, and liabilities are translated into U.S. dollars at the exchange rates at period end. Purchases and sales of investment securities, income and dividends received and expenses denominated in foreign currencies are translated into U.S. dollars at the exchange rate in effect on the transaction date.
The effects of exchange rate fluctuations on investments are included with the net realized and unrealized gain (loss) on investment securities. Other foreign currency transactions resulting in realized and unrealized gain (loss) are disclosed separately.
Investment Transactions and Income. For financial reporting purposes, the Fund's investment holdings and NAV include trades executed through the end of the last business day of the period. The NAV per share for processing shareholder transactions is calculated as of the close of business of the New York Stock Exchange (NYSE), normally 4:00 p.m. Eastern time and includes trades executed through the end of the prior business day. Gains and losses on securities sold are determined on the basis of identified cost and may include proceeds received from litigation. Dividend income is recorded on the ex-dividend date, except for certain dividends from foreign securities where the ex-dividend date may have passed, which are recorded as soon as the Fund is informed of the ex-dividend date. Non-cash dividends included in dividend income, if any, are recorded at the fair market value of the securities received. Income and capital gain distributions from Fidelity Central Funds, if any, are recorded on the ex-dividend date. Distributions received on securities that represent a return of capital or capital gain are recorded as a reduction of cost of investments and/or as a realized gain. Subsequent to ex-dividend date the Fund determines the components of these distributions, based upon receipt of tax filings or other correspondence relating to the underlying investment. Investment income is recorded net of foreign taxes withheld where recovery of such taxes is uncertain.
Class Allocations and Expenses. Investment income, realized and unrealized capital gains and losses, common expenses of the Fund, and certain fund-level expense reductions, if any, are allocated daily on a pro-rata basis to each class based on the relative net assets of each class to the total net assets of the Fund. Each class differs with respect to transfer agent and distribution and service plan fees incurred. Certain expense reductions may also differ by class. For the reporting period, the allocated portion of income and expenses to each class as a percent of its average net assets may vary due to the timing of recording these transactions in relation to fluctuating net assets of the classes. Expenses directly attributable to a fund are charged to that fund. Expenses attributable to more than one fund are allocated among the respective funds on the basis of relative net assets or other appropriate methods. Expense estimates are accrued in the period to which they relate and adjustments are made when actual amounts are known.
Deferred Trustee Compensation. Under a Deferred Compensation Plan (the Plan), independent Trustees may elect to defer receipt of a portion of their annual compensation. Deferred amounts are invested in a cross-section of Fidelity funds, are marked-to-market and remain in the Fund until distributed in accordance with the Plan. The investment of deferred amounts and the offsetting payable to the Trustees are included in the accompanying Statement of Assets and Liabilities.
Income Tax Information and Distributions to Shareholders. Each year, the Fund intends to qualify as a regulated investment company under Subchapter M of the Internal Revenue Code, including distributing substantially all of its taxable income and realized gains. As a result, no provision for U.S. Federal income taxes is required. The Fund files a U.S. federal tax return, in addition to state and local tax returns as required. The Fund's federal income tax returns are subject to examination by the Internal Revenue Service (IRS) for a period of three fiscal years after they are filed. State and local tax returns may be subject to examination for an additional fiscal year depending on the jurisdiction. Foreign taxes are provided for based on the Fund's understanding of the tax rules and rates that exist in the foreign markets in which it invests.
Distributions are declared and recorded on the ex-dividend date. Income dividends and capital gain distributions are declared separately for each class. Income and capital gain distributions are determined in accordance with income tax regulations, which may differ from GAAP.
Capital accounts within the financial statements are adjusted for permanent book-tax differences. These adjustments have no impact on net assets or the results of operations. Capital accounts are not adjusted for temporary book-tax differences which will reverse in a subsequent period.
Book-tax differences are primarily due to foreign currency transactions, passive foreign investment companies (PFIC), partnerships, deferred trustees compensation, capital loss carryforwards and losses deferred due to wash sales and excise tax regulations.
The federal tax cost of investment securities and unrealized appreciation (depreciation) as of period end were as follows:
| Gross unrealized appreciation | $32,612,102 |
| Gross unrealized depreciation | (148,719,309) |
| Net unrealized appreciation (depreciation) on securities | $(116,107,207) |
| Tax cost | $815,310,200 |
Capital loss carryforwards are only available to offset future capital gains of the Fund to the extent provided by regulations and may be limited. Under the Regulated Investment Company Modernization Act of 2010 (the Act), the Fund is permitted to carry forward capital losses incurred in taxable years beginning after December 22, 2010 for an unlimited period and such capital losses are required to be used prior to any losses that expire. The capital loss carryforward information presented below, including any applicable limitation, is estimated as of prior fiscal period end and is subject to adjustment.
| No expiration | |
| Short-term | $(2,928,505) |
The Fund elected to defer to its next fiscal year approximately $50,491,927 of capital losses recognized during the period November 1, 2014 to July 31, 2015.
Short-Term Trading (Redemption) Fees. Shares held by investors in the Fund less than 30 days may have been subject to a redemption fee equal to .75% of the NAV of shares redeemed. All redemption fees, which reduce the proceeds of the shareholder redemption, are retained by the Fund and accounted for as an addition to paid in capital.
4. Purchases and Sales of Investments.
Purchases and sales of securities, other than short-term securities, aggregated $282,153,097 and $253,644,273, respectively.
5. Fees and Other Transactions with Affiliates.
Management Fee. Fidelity SelectCo, LLC (the investment adviser) and its affiliates provide the Fund with investment management related services for which the Fund pays a monthly management fee. The management fee is the sum of an individual fund fee rate that is based on an annual rate of .30% of the Fund's average net assets and an annualized group fee rate that averaged .25% during the period. The group fee rate is based upon the average net assets of all the mutual funds advised by Fidelity Management & Research Company (FMR) and the investment adviser. The group fee rate decreases as assets under management increase and increases as assets under management decrease. For the reporting period, the total annualized management fee rate was .55% of the Fund's average net assets.
Distribution and Service Plan Fees. In accordance with Rule 12b-1 of the 1940 Act, the Fund has adopted separate Distribution and Service Plans for each class of shares. Certain classes pay Fidelity Distributors Corporation (FDC), an affiliate of the investment adviser, separate Distribution and Service Fees, each of which is based on an annual percentage of each class' average net assets. In addition, FDC may pay financial intermediaries for selling shares of the Fund and providing shareholder support services. For the period, the Distribution and Service Fee rates, total fees and amounts retained by FDC were as follows:
| | Distribution
Fee | Service
Fee | Total Fees | Retained
by FDC |
| Class A | -% | .25% | $346,353 | $26,091 |
| Class T | .25% | .25% | 374,470 | – |
| Class B | .75% | .25% | 32,665 | 24,499 |
| Class C | .75% | .25% | 786,744 | 387,169 |
| | | | $1,540,232 | $437,759 |
Sales Load. FDC may receive a front-end sales charge of up to 5.75% for selling Class A shares and 3.50% for selling Class T shares, some of which is paid to financial intermediaries for selling shares of the Fund. Depending on the holding period, FDC may receive contingent deferred sales charges levied on Class A, Class T, Class B, and Class C redemptions. The deferred sales charges range from 5.00% to 1.00% for Class B shares, 1.00% for Class C shares, 1.00% for certain purchases of Class A shares and .25% for certain purchases of Class T shares.
For the period, sales charge amounts retained by FDC were as follows:
| | Retained
by FDC |
| Class A | $104,562 |
| Class T | 16,381 |
| Class B(a) | 1,343 |
| Class C(a) | 40,150 |
| | $162,436 |
(a) When Class B and Class C shares are initially sold, FDC pays commissions from its own resources to financial intermediaries through which the sales are made.
Transfer Agent Fees. Fidelity Investments Institutional Operations Company, Inc., (FIIOC), an affiliate of the investment adviser, is the transfer, dividend disbursing and shareholder servicing agent for each class of the Fund. FIIOC receives account fees and asset-based fees that vary according to the account size and type of account of the shareholders of the respective classes of the Fund. FIIOC pays for typesetting, printing and mailing of shareholder reports, except proxy statements.
For the period, transfer agent fees for each class were as follows:
| | Amount | % of
Class-Level Average
Net Assets(a) |
| Class A | $366,166 | .26 |
| Class T | 201,372 | .27 |
| Class B | 9,774 | .30 |
| Class C | 187,105 | .24 |
| Class I | 160,435 | .24 |
| | $924,852 | |
(a) Annualized
Accounting and Security Lending Fees. Fidelity Service Company, Inc. (FSC), an affiliate of the investment adviser, maintains the Fund's accounting records. The accounting fee is based on the level of average net assets for each month. Under a separate contract, FSC administers the security lending program. The security lending fee is based on the number and duration of lending transactions.
Brokerage Commissions. The Fund placed a portion of its portfolio transactions with brokerage firms which are affiliates of the investment adviser. Brokerage commissions are included in net realized gain (loss) and change in net unrealized appreciation (depreciation) in the Statement of Operations. The commissions paid to these affiliated firms were $5,983 for the period.
Interfund Trades. The Fund may purchase from or sell securities to other Fidelity Funds under procedures adopted by the Board. The procedures have been designed to ensure these interfund trades are executed in accordance with Rule 17a-7 of the 1940 Act. Interfund trades are included within the respective purchases and sales amounts shown in the Purchases and Sales of Investments note.
6. Committed Line of Credit.
The Fund participates with other funds managed by the investment adviser or an affiliate in a $4.25 billion credit facility (the "line of credit") to be utilized for temporary or emergency purposes to fund shareholder redemptions or for other short-term liquidity purposes. The Fund has agreed to pay commitment fees on its pro-rata portion of the line of credit, which amounted to $502 and is reflected in Miscellaneous expenses on the Statement of Operations. During the period, the Fund did not borrow on this line of credit.
7. Security Lending.
The Fund lends portfolio securities through a lending agent from time to time in order to earn additional income. On the settlement date of the loan, the Fund receives collateral (in the form of U.S. Treasury obligations, letters of credit and/or cash) against the loaned securities and maintains collateral in an amount not less than 100% of the market value of the loaned securities during the period of the loan. The market value of the loaned securities is determined at the close of business of the Fund and any additional required collateral is delivered to the Fund on the next business day. The Fund or borrower may terminate the loan at any time, and if the borrower defaults on its obligation to return the securities loaned because of insolvency or other reasons, the Fund may apply collateral received from the borrower against the obligation. The Fund may experience delays and costs in recovering the securities loaned. Any cash collateral received is invested in Fidelity Securities Lending Cash Central Fund. The value of loaned securities and cash collateral at period end are disclosed on the Fund's Statement of Assets and Liabilities. Security lending income represents the income earned on investing cash collateral, less rebates paid to borrowers and any lending agent fees associated with the loan, plus any premium payments received for lending certain types of securities. Security lending income is presented in the Statement of Operations as a component of income from Fidelity Central Funds. Total security lending income during the period amounted to $38,523.
8. Expense Reductions.
Commissions paid to certain brokers with whom the investment adviser, or its affiliates, places trades on behalf of the Fund include an amount in addition to trade execution, which may be rebated back to the Fund to offset certain expenses. This amount totaled $26,805 for the period. In addition, through arrangements with the Fund's custodian, credits realized as a result of certain uninvested cash balances were used to reduce the Fund's expenses. During the period, these credits reduced the Fund's custody expenses by $20.
In addition, during the period the investment adviser reimbursed and/or waived a portion of fund-level operating expenses in the amount of $2,533.
9. Distributions to Shareholders.
Distributions to shareholders of each class were as follows:
| | Six months ended January 31, 2016 | Year ended July 31, 2015 |
| From net investment income | | |
| Class A | $1,922,249 | $1,364,001 |
| Class T | 529,063 | 410,584 |
| Class B | 897 | – |
| Class C | 204,569 | 97,069 |
| Class I | 1,301,595 | 740,437 |
| Total | $3,958,373 | $2,612,091 |
| From net realized gain | | |
| Class A | $– | $14,838,103 |
| Class T | – | 10,229,565 |
| Class B | – | 735,058 |
| Class C | – | 5,981,735 |
| Class I | – | 4,387,354 |
| Total | $– | $36,171,815 |
10. Share Transactions.
Share transactions for each class were as follows and may contain automatic conversions between classes or exchanges between affiliated funds:
| | Shares | Shares | Dollars | Dollars |
| | Six months ended January 31, 2016 | Year ended July 31, 2015 | Six months ended January 31, 2016 | Year ended July 31, 2015 |
| Class A | | | | |
| Shares sold | 2,392,577 | 4,817,511 | $67,714,007 | $172,397,292 |
| Reinvestment of distributions | 66,473 | 346,427 | 1,828,265 | 15,023,137 |
| Shares redeemed | (1,955,755) | (3,804,502) | (55,983,680) | (141,434,625) |
| Net increase (decrease) | 503,295 | 1,359,436 | $13,558,592 | $45,985,804 |
| Class T | | | | |
| Shares sold | 399,804 | 895,677 | $11,569,886 | $32,882,150 |
| Reinvestment of distributions | 18,369 | 229,140 | 510,908 | 10,214,195 |
| Shares redeemed | (692,858) | (1,183,564) | (20,171,378) | (44,251,675) |
| Net increase (decrease) | (274,685) | (58,747) | $(8,090,584) | $(1,155,330) |
| Class B | | | | |
| Shares sold | 2,751 | 43,535 | $72,566 | $1,451,766 |
| Reinvestment of distributions | 35 | 16,323 | 864 | 661,892 |
| Shares redeemed | (85,705) | (186,733) | (2,272,984) | (6,263,061) |
| Net increase (decrease) | (82,919) | (126,875) | $(2,199,554) | $(4,149,403) |
| Class C | | | | |
| Shares sold | 1,835,043 | 3,704,544 | $47,035,371 | $122,458,966 |
| Reinvestment of distributions | 7,392 | 130,140 | 181,396 | 5,288,652 |
| Shares redeemed | (1,011,446) | (1,241,801) | (26,564,955) | (41,167,367) |
| Net increase (decrease) | 830,989 | 2,592,883 | $20,651,812 | $86,580,251 |
| Class I | | | | |
| Shares sold | 2,310,144 | 3,563,036 | $69,257,814 | $133,557,103 |
| Reinvestment of distributions | 40,692 | 99,377 | 1,182,189 | 4,498,001 |
| Shares redeemed | (1,762,926) | (1,973,125) | (51,618,203) | (74,761,878) |
| Net increase (decrease) | 587,910 | 1,689,288 | $18,821,800 | $63,293,226 |
11. Other.
The Fund's organizational documents provide former and current trustees and officers with a limited indemnification against liabilities arising in connection with the performance of their duties to the Fund. In the normal course of business, the Fund may also enter into contracts that provide general indemnifications. The Fund's maximum exposure under these arrangements is unknown as this would be dependent on future claims that may be made against the Fund. The risk of material loss from such claims is considered remote.
Fidelity Advisor® Financial Services Fund
Investment Summary (Unaudited)
Top Ten Stocks as of January 31, 2016
| | % of fund's net assets | % of fund's net assets 6 months ago |
| Berkshire Hathaway, Inc. Class B | 5.4 | 4.8 |
| JPMorgan Chase & Co. | 5.2 | 5.0 |
| Bank of America Corp. | 5.0 | 5.0 |
| Citigroup, Inc. | 4.9 | 5.0 |
| U.S. Bancorp | 3.8 | 4.1 |
| Chubb Ltd. | 3.8 | 2.6 |
| Wells Fargo & Co. | 3.7 | 3.8 |
| American Tower Corp. | 3.5 | 3.3 |
| Capital One Financial Corp. | 3.1 | 3.8 |
| Allstate Corp. | 2.6 | 2.3 |
| | 41.0 | |
Top Industries (% of fund's net assets)
| As of January 31, 2016 |
| | Banks | 28.5% |
| | Real Estate Investment Trusts | 17.1% |
| | Insurance | 16.3% |
| | Capital Markets | 8.0% |
| | Diversified Financial Services | 7.8% |
| | All Others* | 22.3% |
| As of July 31, 2015 |
| | Banks | 30.5% |
| | Real Estate Investment Trusts | 13.4% |
| | Insurance | 12.8% |
| | Capital Markets | 10.9% |
| | Diversified Financial Services | 9.0% |
| | All Others* | 23.4% |
* Includes Short-Term investments and Net Other Assets (Liabilities).
Fidelity Advisor® Financial Services Fund
Investments January 31, 2016 (Unaudited)
Showing Percentage of Net Assets
| Common Stocks - 95.0% | | | |
| | | Shares | Value |
| Banks - 28.5% | | | |
| Diversified Banks - 23.5% | | | |
| Bank of America Corp. | | 736,556 | $10,414,902 |
| Citigroup, Inc. | | 240,165 | 10,226,226 |
| Comerica, Inc. | | 54,219 | 1,859,712 |
| JPMorgan Chase & Co. | | 183,831 | 10,937,945 |
| U.S. Bancorp | | 197,908 | 7,928,194 |
| Wells Fargo & Co. | | 153,748 | 7,722,762 |
| | | | 49,089,741 |
| Regional Banks - 5.0% | | | |
| CoBiz, Inc. | | 83,491 | 917,566 |
| Huntington Bancshares, Inc. | | 183,600 | 1,575,288 |
| M&T Bank Corp. | | 29,400 | 3,239,292 |
| Popular, Inc. | | 52,200 | 1,312,308 |
| SunTrust Banks, Inc. | | 90,000 | 3,292,200 |
| | | | 10,336,654 |
|
| TOTAL BANKS | | | 59,426,395 |
|
| Capital Markets - 8.0% | | | |
| Asset Management & Custody Banks - 5.7% | | | |
| Affiliated Managers Group, Inc. (a) | | 13,754 | 1,845,649 |
| Artisan Partners Asset Management, Inc. | | 59,300 | 1,856,090 |
| Invesco Ltd. | | 100,738 | 3,015,088 |
| Northern Trust Corp. | | 41,000 | 2,545,280 |
| Oaktree Capital Group LLC Class A | | 37,600 | 1,645,376 |
| The Blackstone Group LP | | 36,365 | 955,309 |
| | | | 11,862,792 |
| Investment Banking & Brokerage - 2.3% | | | |
| E*TRADE Financial Corp. (a) | | 82,400 | 1,941,344 |
| Goldman Sachs Group, Inc. | | 17,950 | 2,900,002 |
| | | | 4,841,346 |
|
| TOTAL CAPITAL MARKETS | | | 16,704,138 |
|
| Consumer Finance - 6.0% | | | |
| Consumer Finance - 6.0% | | | |
| American Express Co. | | 38,400 | 2,054,400 |
| Capital One Financial Corp. | | 99,538 | 6,531,684 |
| OneMain Holdings, Inc. (a) | | 54,900 | 1,451,007 |
| Synchrony Financial (a) | | 87,200 | 2,478,224 |
| | | | 12,515,315 |
| Diversified Consumer Services - 1.2% | | | |
| Specialized Consumer Services - 1.2% | | | |
| H&R Block, Inc. | | 75,200 | 2,560,560 |
| Diversified Financial Services - 7.8% | | | |
| Multi-Sector Holdings - 5.4% | | | |
| Berkshire Hathaway, Inc. Class B (a) | | 86,169 | 11,182,149 |
| Specialized Finance - 2.4% | | | |
| IntercontinentalExchange, Inc. | | 19,464 | 5,134,603 |
|
| TOTAL DIVERSIFIED FINANCIAL SERVICES | | | 16,316,752 |
|
| Insurance - 16.3% | | | |
| Insurance Brokers - 3.8% | | | |
| Brown & Brown, Inc. | | 107,900 | 3,263,975 |
| Marsh & McLennan Companies, Inc. | | 85,500 | 4,559,715 |
| | | | 7,823,690 |
| Life & Health Insurance - 2.4% | | | |
| Principal Financial Group, Inc. | | 20,900 | 794,200 |
| Torchmark Corp. | | 79,180 | 4,302,641 |
| | | | 5,096,841 |
| Property & Casualty Insurance - 10.1% | | | |
| Allied World Assurance Co. Holdings AG | | 81,400 | 2,978,426 |
| Allstate Corp. | | 90,490 | 5,483,694 |
| Chubb Ltd. | | 69,657 | 7,876,117 |
| FNF Group | | 144,750 | 4,687,005 |
| | | | 21,025,242 |
|
| TOTAL INSURANCE | | | 33,945,773 |
|
| IT Services - 5.7% | | | |
| Data Processing & Outsourced Services - 5.7% | | | |
| MasterCard, Inc. Class A | | 34,300 | 3,053,729 |
| PayPal Holdings, Inc. (a) | | 36,600 | 1,322,724 |
| The Western Union Co. | | 136,700 | 2,438,728 |
| Visa, Inc. Class A | | 66,420 | 4,947,626 |
| | | | 11,762,807 |
| Professional Services - 0.6% | | | |
| Research & Consulting Services - 0.6% | | | |
| Verisk Analytics, Inc. (a) | | 16,000 | 1,168,000 |
| Real Estate Investment Trusts - 17.1% | | | |
| Diversified REITs - 0.4% | | | |
| NorthStar Realty Finance Corp. | | 64,025 | 759,977 |
| Health Care REIT's - 2.0% | | | |
| Ventas, Inc. | | 76,900 | 4,254,108 |
| Mortgage REITs - 2.8% | | | |
| Altisource Residential Corp. Class B | | 134,950 | 1,342,753 |
| American Capital Agency Corp. | | 85,500 | 1,459,485 |
| Redwood Trust, Inc. (b) | | 162,800 | 1,753,356 |
| Two Harbors Investment Corp. | | 166,900 | 1,268,440 |
| | | | 5,824,034 |
| Office REITs - 1.8% | | | |
| Boston Properties, Inc. | | 32,600 | 3,788,446 |
| Residential REITs - 3.3% | | | |
| American Campus Communities, Inc. | | 23,100 | 974,820 |
| Equity Residential (SBI) | | 32,000 | 2,466,880 |
| Essex Property Trust, Inc. | | 6,800 | 1,449,148 |
| UDR, Inc. | | 58,800 | 2,092,692 |
| | | | 6,983,540 |
| Specialized REITs - 6.8% | | | |
| American Tower Corp. | | 76,400 | 7,207,576 |
| Outfront Media, Inc. | | 79,430 | 1,727,603 |
| Public Storage | | 20,400 | 5,172,624 |
| | | | 14,107,803 |
|
| TOTAL REAL ESTATE INVESTMENT TRUSTS | | | 35,717,908 |
|
| Real Estate Management & Development - 2.2% | | | |
| Real Estate Services - 2.2% | | | |
| CBRE Group, Inc. (a) | | 68,487 | 1,915,581 |
| Realogy Holdings Corp. (a) | | 82,000 | 2,689,600 |
| | | | 4,605,181 |
| Thrifts & Mortgage Finance - 0.5% | | | |
| Thrifts & Mortgage Finance - 0.5% | | | |
| MGIC Investment Corp. (a) | | 105,000 | 695,100 |
| Radian Group, Inc. | | 33,700 | 339,022 |
| | | | 1,034,122 |
| Trading Companies & Distributors - 1.1% | | | |
| Trading Companies & Distributors - 1.1% | | | |
| AerCap Holdings NV (a) | | 72,900 | 2,238,759 |
| TOTAL COMMON STOCKS | | | |
| (Cost $212,608,978) | | | 197,995,710 |
|
| Money Market Funds - 6.0% | | | |
| Fidelity Cash Central Fund, 0.38% (c) | | 11,791,184 | 11,791,184 |
| Fidelity Securities Lending Cash Central Fund, 0.42% (c)(d) | | 827,200 | 827,200 |
| TOTAL MONEY MARKET FUNDS | | | |
| (Cost $12,618,384) | | | 12,618,384 |
| TOTAL INVESTMENT PORTFOLIO - 101.0% | | | |
| (Cost $225,227,362) | | | 210,614,094 |
| NET OTHER ASSETS (LIABILITIES) - (1.0)% | | | (2,104,475) |
| NET ASSETS - 100% | | | $208,509,619 |
Legend
(a) Non-income producing
(b) Security or a portion of the security is on loan at period end.
(c) Affiliated fund that is generally available only to investment companies and other accounts managed by Fidelity Investments. The rate quoted is the annualized seven-day yield of the fund at period end. A complete unaudited listing of the fund's holdings as of its most recent quarter end is available upon request. In addition, each Fidelity Central Fund's financial statements are available on the SEC's website or upon request.
(d) Investment made with cash collateral received from securities on loan.
Affiliated Central Funds
Information regarding fiscal year to date income earned by the Fund from investments in Fidelity Central Funds is as follows:
| Fund | Income earned |
| Fidelity Cash Central Fund | $11,391 |
| Fidelity Securities Lending Cash Central Fund | 1,146 |
| Total | $12,537 |
Investment Valuation
All investments are categorized as Level 1 under the Fair Value Hierarchy. The inputs or methodology used for valuing securities may not be an indication of the risk associated with investing in those securities. For more information on valuation inputs please refer to the Investment Valuation section in the accompanying Notes to Financial Statements.
See accompanying notes which are an integral part of the financial statements.
Fidelity Advisor® Financial Services Fund
Financial Statements
Statement of Assets and Liabilities
| | | January 31, 2016 (Unaudited) |
| Assets | | |
Investment in securities, at value (including securities loaned of $809,904) — See accompanying schedule:
Unaffiliated issuers (cost $212,608,978) | $197,995,710 | |
| Fidelity Central Funds (cost $12,618,384) | 12,618,384 | |
| Total Investments (cost $225,227,362) | | $210,614,094 |
| Receivable for investments sold | | 1,453,066 |
| Receivable for fund shares sold | | 178,660 |
| Dividends receivable | | 195,320 |
| Distributions receivable from Fidelity Central Funds | | 3,238 |
| Prepaid expenses | | 914 |
| Other receivables | | 2,492 |
| Total assets | | 212,447,784 |
| Liabilities | | |
| Payable for investments purchased | $2,230,073 | |
| Payable for fund shares redeemed | 619,581 | |
| Accrued management fee | 99,343 | |
| Distribution and service plan fees payable | 76,106 | |
| Other affiliated payables | 54,539 | |
| Other payables and accrued expenses | 31,323 | |
| Collateral on securities loaned, at value | 827,200 | |
| Total liabilities | | 3,938,165 |
| Net Assets | | $208,509,619 |
| Net Assets consist of: | | |
| Paid in capital | | $269,253,632 |
| Distributions in excess of net investment income | | (640,322) |
| Accumulated undistributed net realized gain (loss) on investments and foreign currency transactions | | (45,489,838) |
| Net unrealized appreciation (depreciation) on investments and assets and liabilities in foreign currencies | | (14,613,853) |
| Net Assets | | $208,509,619 |
| Calculation of Maximum Offering Price | | |
| Class A: | | |
| Net Asset Value and redemption price per share ($96,442,461 ÷ 6,841,359 shares) | | $14.10 |
| Maximum offering price per share (100/94.25 of $14.10) | | $14.96 |
| Class T: | | |
| Net Asset Value and redemption price per share ($30,357,074 ÷ 2,169,845 shares) | | $13.99 |
| Maximum offering price per share (100/96.50 of $13.99) | | $14.50 |
| Class B: | | |
| Net Asset Value and offering price per share ($2,470,008 ÷ 183,135 shares)(a) | | $13.49 |
| Class C: | | |
| Net Asset Value and offering price per share ($47,627,592 ÷ 3,569,093 shares)(a) | | $13.34 |
| Class I: | | |
| Net Asset Value, offering price and redemption price per share ($31,612,484 ÷ 2,187,279 shares) | | $14.45 |
(a) Redemption price per share is equal to net asset value less any applicable contingent deferred sales charge.
See accompanying notes which are an integral part of the financial statements.
Statement of Operations
| | | Six months ended January 31, 2016 (Unaudited) |
| Investment Income | | |
| Dividends | | $2,023,941 |
| Income from Fidelity Central Funds | | 12,537 |
| Total income | | 2,036,478 |
| Expenses | | |
| Management fee | $627,763 | |
| Transfer agent fees | 277,993 | |
| Distribution and service plan fees | 470,525 | |
| Accounting and security lending fees | 44,586 | |
| Custodian fees and expenses | 9,056 | |
| Independent trustees' compensation | 2,133 | |
| Registration fees | 51,522 | |
| Audit | 23,544 | |
| Legal | 1,908 | |
| Miscellaneous | 1,198 | |
| Total expenses before reductions | 1,510,228 | |
| Expense reductions | (4,851) | 1,505,377 |
| Net investment income (loss) | | 531,101 |
| Realized and Unrealized Gain (Loss) | | |
| Net realized gain (loss) on: | | |
| Investment securities: | | |
| Unaffiliated issuers | 1,490,169 | |
| Foreign currency transactions | 29,827 | |
| Total net realized gain (loss) | | 1,519,996 |
Change in net unrealized appreciation (depreciation) on:
Investment securities | (38,352,669) | |
| Assets and liabilities in foreign currencies | (508) | |
| Total change in net unrealized appreciation (depreciation) | | (38,353,177) |
| Net gain (loss) | | (36,833,181) |
| Net increase (decrease) in net assets resulting from operations | | $(36,302,080) |
See accompanying notes which are an integral part of the financial statements.
Statement of Changes in Net Assets
| | Six months ended January 31, 2016 (Unaudited) | Year ended July 31, 2015 |
| Increase (Decrease) in Net Assets | | |
| Operations | | |
| Net investment income (loss) | $531,101 | $836,701 |
| Net realized gain (loss) | 1,519,996 | 12,569,347 |
| Change in net unrealized appreciation (depreciation) | (38,353,177) | 5,448,999 |
| Net increase (decrease) in net assets resulting from operations | (36,302,080) | 18,855,047 |
| Distributions to shareholders from net investment income | (957,546) | (1,174,436) |
| Distributions to shareholders from net realized gain | (189,767) | – |
| Total distributions | (1,147,313) | (1,174,436) |
| Share transactions - net increase (decrease) | 12,173,524 | 48,366,952 |
| Redemption fees | 8,377 | 16,144 |
| Total increase (decrease) in net assets | (25,267,492) | 66,063,707 |
| Net Assets | | |
| Beginning of period | 233,777,111 | 167,713,404 |
| End of period (including distributions in excess of net investment income of $640,322 and distributions in excess of net investment income of $213,877, respectively) | $208,509,619 | $233,777,111 |
See accompanying notes which are an integral part of the financial statements.
Financial Highlights — Fidelity Advisor Financial Services Fund Class A
| | Six months ended (Unaudited) | Years ended July 31, | | | | |
| January 31, | 2016 | 2015 | 2014 | 2013 | 2012 | 2011 |
| Selected Per–Share Data | | | | | | |
| Net asset value, beginning of period | $16.53 | $14.97 | $13.41 | $10.18 | $10.06 | $10.35 |
| Income from Investment Operations | | | | | | |
| Net investment income (loss)A | .05 | .10 | .10 | .15 | .07 | (.02) |
| Net realized and unrealized gain (loss) | (2.40) | 1.59B | 1.55 | 3.18 | .06 | (.27) |
| Total from investment operations | (2.35) | 1.69 | 1.65 | 3.33 | .13 | (.29) |
| Distributions from net investment income | (.07) | (.13) | (.08) | (.10) | (.01) | – |
| Distributions from net realized gain | (.01) | – | (.01) | – | – | – |
| Total distributions | (.08) | (.13) | (.09) | (.10) | (.01) | – |
| Redemption fees added to paid in capitalA,C | – | – | – | – | – | – |
| Net asset value, end of period | $14.10 | $16.53 | $14.97 | $13.41 | $10.18 | $10.06 |
| Total ReturnD,E,F | (14.24)% | 11.29%B | 12.39% | 32.99% | 1.34% | (2.80)% |
| Ratios to Average Net AssetsG,H | | | | | | |
| Expenses before reductions | 1.16%I | 1.17% | 1.22% | 1.29% | 1.28% | 1.26% |
| Expenses net of fee waivers, if any | 1.16%I | 1.17% | 1.22% | 1.29% | 1.28% | 1.26% |
| Expenses net of all reductions | 1.16%I | 1.17% | 1.22% | 1.21% | 1.20% | 1.21% |
| Net investment income (loss) | .62%I | .61% | .68% | 1.31% | .72% | (.24)% |
| Supplemental Data | | | | | | |
| Net assets, end of period (000 omitted) | $96,442 | $102,983 | $77,674 | $64,428 | $47,055 | $63,937 |
| Portfolio turnover rateJ | 73%I | 44% | 49% | 288% | 441% | 260% |
A Calculated based on average shares outstanding during the period.
B Net realized and unrealized gain (loss) per share reflects proceeds from litigation which amounted to $.05 per share. Excluding these litigation proceeds, the total return would have been 10.97%.
C Amount represents less than $.005 per share.
D Total returns for periods of less than one year are not annualized.
E Total returns would have been lower if certain expenses had not been reduced during the applicable periods shown.
F Total returns do not include the effect of the sales charges.
G Fees and expenses of any underlying Fidelity Central Funds are not included in the Fund's expense ratio. The Fund indirectly bears its proportionate share of the expenses of any underlying Fidelity Central Funds.
H Expense ratios reflect operating expenses of the class. Expenses before reductions do not reflect amounts reimbursed by the investment adviser or reductions from brokerage service arrangements or reductions from other expense offset arrangements and do not represent the amount paid by the class during periods when reimbursements or reductions occur. Expenses net of fee waivers reflect expenses after reimbursement by the investment adviser but prior to reductions from brokerage service arrangements or other expense offset arrangements. Expenses net of all reductions represent the net expenses paid by the class.
I Annualized
J Amount does not include the portfolio activity of any underlying Fidelity Central Funds.
See accompanying notes which are an integral part of the financial statements.
Financial Highlights — Fidelity Advisor Financial Services Fund Class T
| | Six months ended (Unaudited) | Years ended July 31, | | | | |
| January 31, | 2016 | 2015 | 2014 | 2013 | 2012 | 2011 |
| Selected Per–Share Data | | | | | | |
| Net asset value, beginning of period | $16.41 | $14.86 | $13.31 | $10.11 | $10.01 | $10.32 |
| Income from Investment Operations | | | | | | |
| Net investment income (loss)A | .03 | .05 | .06 | .12 | .04 | (.05) |
| Net realized and unrealized gain (loss) | (2.39) | 1.58B | 1.55 | 3.16 | .06 | (.26) |
| Total from investment operations | (2.36) | 1.63 | 1.61 | 3.28 | .10 | (.31) |
| Distributions from net investment income | (.05) | (.08) | (.05) | (.08) | –C | – |
| Distributions from net realized gain | (.01) | – | (.01) | – | – | – |
| Total distributions | (.06) | (.08) | (.06) | (.08) | –C | – |
| Redemption fees added to paid in capitalA,C | – | – | – | – | – | – |
| Net asset value, end of period | $13.99 | $16.41 | $14.86 | $13.31 | $10.11 | $10.01 |
| Total ReturnD,E,F | (14.39)% | 10.98%B | 12.10% | 32.66% | 1.03% | (3.00)% |
| Ratios to Average Net AssetsG,H | | | | | | |
| Expenses before reductions | 1.45%I | 1.45% | 1.48% | 1.55% | 1.54% | 1.52% |
| Expenses net of fee waivers, if any | 1.45%I | 1.45% | 1.48% | 1.55% | 1.54% | 1.52% |
| Expenses net of all reductions | 1.45%I | 1.45% | 1.48% | 1.47% | 1.45% | 1.47% |
| Net investment income (loss) | .33%I | .33% | .42% | 1.06% | .46% | (.49)% |
| Supplemental Data | | | | | | |
| Net assets, end of period (000 omitted) | $30,357 | $34,314 | $31,596 | $30,576 | $24,367 | $27,037 |
| Portfolio turnover rateJ | 73%I | 44% | 49% | 288% | 441% | 260% |
A Calculated based on average shares outstanding during the period.
B Net realized and unrealized gain (loss) per share reflects proceeds from litigation which amounted to $.05 per share. Excluding these litigation proceeds, the total return would have been 10.66%.
C Amount represents less than $.005 per share.
D Total returns for periods of less than one year are not annualized.
E Total returns would have been lower if certain expenses had not been reduced during the applicable periods shown.
F Total returns do not include the effect of the sales charges.
G Fees and expenses of any underlying Fidelity Central Funds are not included in the Fund's expense ratio. The Fund indirectly bears its proportionate share of the expenses of any underlying Fidelity Central Funds.
H Expense ratios reflect operating expenses of the class. Expenses before reductions do not reflect amounts reimbursed by the investment adviser or reductions from brokerage service arrangements or reductions from other expense offset arrangements and do not represent the amount paid by the class during periods when reimbursements or reductions occur. Expenses net of fee waivers reflect expenses after reimbursement by the investment adviser but prior to reductions from brokerage service arrangements or other expense offset arrangements. Expenses net of all reductions represent the net expenses paid by the class.
I Annualized
J Amount does not include the portfolio activity of any underlying Fidelity Central Funds.
See accompanying notes which are an integral part of the financial statements.
Financial Highlights — Fidelity Advisor Financial Services Fund Class B
| | Six months ended (Unaudited) | Years ended July 31, | | | | |
| January 31, | 2016 | 2015 | 2014 | 2013 | 2012 | 2011 |
| Selected Per–Share Data | | | | | | |
| Net asset value, beginning of period | $15.82 | $14.35 | $12.87 | $9.79 | $9.73 | $10.09 |
| Income from Investment Operations | | | | | | |
| Net investment income (loss)A | (.01) | (.03) | (.01) | .06 | –B | (.10) |
| Net realized and unrealized gain (loss) | (2.30) | 1.52C | 1.49 | 3.06 | .06 | (.26) |
| Total from investment operations | (2.31) | 1.49 | 1.48 | 3.12 | .06 | (.36) |
| Distributions from net investment income | (.01) | (.02) | – | (.04) | – | – |
| Distributions from net realized gain | (.01) | – | – | – | – | – |
| Total distributions | (.02) | (.02) | – | (.04) | – | – |
| Redemption fees added to paid in capitalA,B | – | – | – | – | – | – |
| Net asset value, end of period | $13.49 | $15.82 | $14.35 | $12.87 | $9.79 | $9.73 |
| Total ReturnD,E,F | (14.59)% | 10.41%C | 11.50% | 32.00% | .62% | (3.57)% |
| Ratios to Average Net AssetsG,H | | | | | | |
| Expenses before reductions | 1.97%I | 1.96% | 1.98% | 2.04% | 2.03% | 2.01% |
| Expenses net of fee waivers, if any | 1.97%I | 1.96% | 1.98% | 2.04% | 2.03% | 2.01% |
| Expenses net of all reductions | 1.96%I | 1.96% | 1.98% | 1.97% | 1.94% | 1.96% |
| Net investment income (loss) | (.18)%I | (.18)% | (.08)% | .56% | (.03)% | (.98)% |
| Supplemental Data | | | | | | |
| Net assets, end of period (000 omitted) | $2,470 | $3,831 | $5,540 | $6,511 | $5,745 | $7,480 |
| Portfolio turnover rateJ | 73%I | 44% | 49% | 288% | 441% | 260% |
A Calculated based on average shares outstanding during the period.
B Amount represents less than $.005 per share.
C Net realized and unrealized gain (loss) per share reflects proceeds from litigation which amounted to $.05 per share. Excluding these litigation proceeds, the total return would have been 10.09%.
D Total returns for periods of less than one year are not annualized.
E Total returns would have been lower if certain expenses had not been reduced during the applicable periods shown.
F Total returns do not include the effect of the contingent deferred sales charge.
G Fees and expenses of any underlying Fidelity Central Funds are not included in the Fund's expense ratio. The Fund indirectly bears its proportionate share of the expenses of any underlying Fidelity Central Funds.
H Expense ratios reflect operating expenses of the class. Expenses before reductions do not reflect amounts reimbursed by the investment adviser or reductions from brokerage service arrangements or reductions from other expense offset arrangements and do not represent the amount paid by the class during periods when reimbursements or reductions occur. Expenses net of fee waivers reflect expenses after reimbursement by the investment adviser but prior to reductions from brokerage service arrangements or other expense offset arrangements. Expenses net of all reductions represent the net expenses paid by the class.
I Annualized
J Amount does not include the portfolio activity of any underlying Fidelity Central Funds.
See accompanying notes which are an integral part of the financial statements.
Financial Highlights — Fidelity Advisor Financial Services Fund Class C
| | Six months ended (Unaudited) | Years ended July 31, | | | | |
| January 31, | 2016 | 2015 | 2014 | 2013 | 2012 | 2011 |
| Selected Per–Share Data | | | | | | |
| Net asset value, beginning of period | $15.67 | $14.22 | $12.75 | $9.70 | $9.65 | $10.00 |
| Income from Investment Operations | | | | | | |
| Net investment income (loss)A | (.01) | (.02) | –B | .06 | –B | (.10) |
| Net realized and unrealized gain (loss) | (2.28) | 1.51C | 1.48 | 3.03 | .05 | (.25) |
| Total from investment operations | (2.29) | 1.49 | 1.48 | 3.09 | .05 | (.35) |
| Distributions from net investment income | (.03) | (.04) | (.01) | (.04) | – | – |
| Distributions from net realized gain | (.01) | – | – | – | – | – |
| Total distributions | (.04) | (.04) | (.01) | (.04) | – | – |
| Redemption fees added to paid in capitalA,B | – | – | – | – | – | – |
| Net asset value, end of period | $13.34 | $15.67 | $14.22 | $12.75 | $9.70 | $9.65 |
| Total ReturnD,E,F | (14.63)% | 10.45%C | 11.65% | 31.98% | .52% | (3.50)% |
| Ratios to Average Net AssetsG,H | | | | | | |
| Expenses before reductions | 1.91%I | 1.90% | 1.94% | 2.03% | 2.03% | 2.01% |
| Expenses net of fee waivers, if any | 1.91%I | 1.90% | 1.94% | 2.03% | 2.03% | 2.01% |
| Expenses net of all reductions | 1.90%I | 1.90% | 1.93% | 1.96% | 1.94% | 1.96% |
| Net investment income (loss) | (.12)%I | (.12)% | (.03)% | .57% | (.03)% | (.99)% |
| Supplemental Data | | | | | | |
| Net assets, end of period (000 omitted) | $47,628 | $50,206 | $36,740 | $29,897 | $20,875 | $23,196 |
| Portfolio turnover rateJ | 73%I | 44% | 49% | 288% | 441% | 260% |
A Calculated based on average shares outstanding during the period.
B Amount represents less than $.005 per share.
C Net realized and unrealized gain (loss) per share reflects proceeds from litigation which amounted to $.05 per share. Excluding these litigation proceeds, the total return would have been 10.13%.
D Total returns for periods of less than one year are not annualized.
E Total returns would have been lower if certain expenses had not been reduced during the applicable periods shown.
F Total returns do not include the effect of the contingent deferred sales charge.
G Fees and expenses of any underlying Fidelity Central Funds are not included in the Fund's expense ratio. The Fund indirectly bears its proportionate share of the expenses of any underlying Fidelity Central Funds.
H Expense ratios reflect operating expenses of the class. Expenses before reductions do not reflect amounts reimbursed by the investment adviser or reductions from brokerage service arrangements or reductions from other expense offset arrangements and do not represent the amount paid by the class during periods when reimbursements or reductions occur. Expenses net of fee waivers reflect expenses after reimbursement by the investment adviser but prior to reductions from brokerage service arrangements or other expense offset arrangements. Expenses net of all reductions represent the net expenses paid by the class.
I Annualized
J Amount does not include the portfolio activity of any underlying Fidelity Central Funds.
See accompanying notes which are an integral part of the financial statements.
Financial Highlights — Fidelity Advisor Financial Services Fund Class I
| | Six months ended (Unaudited) | Years ended July 31, | | | | |
| January 31, | 2016 | 2015 | 2014 | 2013 | 2012 | 2011 |
| Selected Per–Share Data | | | | | | |
| Net asset value, beginning of period | $16.94 | $15.34 | $13.73 | $10.42 | $10.28 | $10.55 |
| Income from Investment Operations | | | | | | |
| Net investment income (loss)A | .07 | .15 | .15 | .20 | .10 | .01 |
| Net realized and unrealized gain (loss) | (2.46) | 1.62B | 1.60 | 3.25 | .06 | (.28) |
| Total from investment operations | (2.39) | 1.77 | 1.75 | 3.45 | .16 | (.27) |
| Distributions from net investment income | (.09) | (.17) | (.13) | (.14) | (.02) | – |
| Distributions from net realized gain | (.01) | – | (.01) | – | – | – |
| Total distributions | (.10) | (.17) | (.14) | (.14) | (.02) | – |
| Redemption fees added to paid in capitalA,C | – | – | – | – | – | – |
| Net asset value, end of period | $14.45 | $16.94 | $15.34 | $13.73 | $10.42 | $10.28 |
| Total ReturnD,E | (14.15)% | 11.61%B | 12.85% | 33.45% | 1.61% | (2.56)% |
| Ratios to Average Net AssetsF,G | | | | | | |
| Expenses before reductions | .86%H | .84% | .87% | .96% | .98% | .96% |
| Expenses net of fee waivers, if any | .86%H | .84% | .87% | .96% | .98% | .96% |
| Expenses net of all reductions | .86%H | .84% | .86% | .88% | .89% | .91% |
| Net investment income (loss) | .92%H | .94% | 1.04% | 1.65% | 1.02% | .07% |
| Supplemental Data | | | | | | |
| Net assets, end of period (000 omitted) | $31,612 | $42,443 | $16,164 | $9,275 | $5,596 | $8,162 |
| Portfolio turnover rateI | 73%H | 44% | 49% | 288% | 441% | 260% |
A Calculated based on average shares outstanding during the period.
B Net realized and unrealized gain (loss) per share reflects proceeds from litigation which amounted to $.05 per share. Excluding these litigation proceeds, the total return would have been 11.29%.
C Amount represents less than $.005 per share.
D Total returns for periods of less than one year are not annualized.
E Total returns would have been lower if certain expenses had not been reduced during the applicable periods shown.
F Fees and expenses of any underlying Fidelity Central Funds are not included in the Fund's expense ratio. The Fund indirectly bears its proportionate share of the expenses of any underlying Fidelity Central Funds.
G Expense ratios reflect operating expenses of the class. Expenses before reductions do not reflect amounts reimbursed by the investment adviser or reductions from brokerage service arrangements or reductions from other expense offset arrangements and do not represent the amount paid by the class during periods when reimbursements or reductions occur. Expenses net of fee waivers reflect expenses after reimbursement by the investment adviser but prior to reductions from brokerage service arrangements or other expense offset arrangements. Expenses net of all reductions represent the net expenses paid by the class.
H Annualized
I Amount does not include the portfolio activity of any underlying Fidelity Central Funds.
See accompanying notes which are an integral part of the financial statements.
Notes to Financial Statements (Unaudited)
For the period ended January 31, 2016
1. Organization.
Fidelity Advisor Financial Services Fund (the Fund) is a fund of Fidelity Advisor Series VII (the Trust) and is authorized to issue an unlimited number of shares. The Trust is registered under the Investment Company Act of 1940, as amended (the 1940 Act), as an open-end management investment company organized as a Massachusetts business trust. The Fund offers Class A, Class T, Class C and Class I shares, each of which, along with Class B shares, has equal rights as to assets and voting privileges. Class B shares are closed to new accounts and additional purchases, except for exchanges and reinvestments. Each class has exclusive voting rights with respect to matters that affect that class. Class B shares will automatically convert to Class A shares after a holding period of seven years from the initial date of purchase.
During the period, the Board of Trustees approved the conversion of all existing Class B shares into Class A shares, effective on or about July 1, 2016, regardless of the length of times shares have been held.
2. Investments in Fidelity Central Funds.
The Fund invests in Fidelity Central Funds, which are open-end investment companies generally available only to other investment companies and accounts managed by the investment adviser and its affiliates. The Fund's Schedule of Investments lists each of the Fidelity Central Funds held as of period end, if any, as an investment of the Fund, but does not include the underlying holdings of each Fidelity Central Fund. As an Investing Fund, the Fund indirectly bears its proportionate share of the expenses of the underlying Fidelity Central Funds.
The Money Market Central Funds seek preservation of capital and current income and are managed by Fidelity Investments Money Management, Inc. (FIMM), an affiliate of the investment adviser. Annualized expenses of the Money Market Central Funds as of their most recent shareholder report date are less than .005%.
A complete unaudited list of holdings for each Fidelity Central Fund is available upon request or at the Securities and Exchange Commission (the SEC) website at www.sec.gov. In addition, the financial statements of the Fidelity Central Funds are available on the SEC website or upon request.
3. Significant Accounting Policies.
The financial statements have been prepared in conformity with accounting principles generally accepted in the United States of America (GAAP), which require management to make certain estimates and assumptions at the date of the financial statements. Actual results could differ from those estimates. Subsequent events, if any, through the date that the financial statements were issued have been evaluated in the preparation of the financial statements. The following summarizes the significant accounting policies of the Fund:
Investment Valuation. Investments are valued as of 4:00 p.m. Eastern time on the last calendar day of the period. The Board of Trustees (the Board) has delegated the day to day responsibility for the valuation of the Fund's investments to the Fidelity SelectCo, LLC (SelectCo) Fair Value Committee (the Committee). In accordance with valuation policies and procedures approved by the Board, the Fund attempts to obtain prices from one or more third party pricing vendors or brokers to value its investments. When current market prices, quotations or currency exchange rates are not readily available or reliable, investments will be fair valued in good faith by the Committee, in accordance with procedures adopted by the Board. Factors used in determining fair value vary by investment type and may include market or investment specific events. The frequency with which these procedures are used cannot be predicted and they may be utilized to a significant extent. The Committee oversees the Fund's valuation policies and procedures and reports to the Board on the Committee's activities and fair value determinations. The Board monitors the appropriateness of the procedures used in valuing the Fund's investments and ratifies the fair value determinations of the Committee.
The Fund categorizes the inputs to valuation techniques used to value its investments into a disclosure hierarchy consisting of three levels as shown below:
- Level 1 – quoted prices in active markets for identical investments
- Level 2 – other significant observable inputs (including quoted prices for similar investments, interest rates, prepayment speeds, etc.)
- Level 3 – unobservable inputs (including the Fund's own assumptions based on the best information available)
Valuation techniques used to value the Fund's investments by major category are as follows:
Equity securities, including restricted securities, for which market quotations are readily available, are valued at the last reported sale price or official closing price as reported by a third party pricing vendor on the primary market or exchange on which they are traded and are categorized as Level 1 in the hierarchy. In the event there were no sales during the day or closing prices are not available, securities are valued at the last quoted bid price or may be valued using the last available price and are generally categorized as Level 2 in the hierarchy. For foreign equity securities, when market or security specific events arise, comparisons to the valuation of American Depositary Receipts (ADRs), futures contracts, Exchange-Traded Funds (ETFs) and certain indexes as well as quoted prices for similar securities may be used and would be categorized as Level 2 in the hierarchy. Utilizing these techniques may result in transfers between Level 1 and Level 2. For equity securities, including restricted securities, where observable inputs are limited, assumptions about market activity and risk are used and these securities may be categorized as Level 3 in the hierarchy.
Investments in open-end mutual funds, including the Fidelity Central Funds, are valued at their closing net asset value (NAV) each business day and are categorized as Level 1 in the hierarchy.
Changes in valuation techniques may result in transfers in or out of an assigned level within the disclosure hierarchy.
Foreign Currency. The Fund may use foreign currency contracts to facilitate transactions in foreign-denominated securities. Gains and losses from these transactions may arise from changes in the value of the foreign currency or if the counterparties do not perform under the contracts' terms.
Foreign-denominated assets, including investment securities, and liabilities are translated into U.S. dollars at the exchange rates at period end. Purchases and sales of investment securities, income and dividends received and expenses denominated in foreign currencies are translated into U.S. dollars at the exchange rate in effect on the transaction date.
The effects of exchange rate fluctuations on investments are included with the net realized and unrealized gain (loss) on investment securities. Other foreign currency transactions resulting in realized and unrealized gain (loss) are disclosed separately.
Investment Transactions and Income. For financial reporting purposes, the Fund's investment holdings and NAV include trades executed through the end of the last business day of the period. The NAV per share for processing shareholder transactions is calculated as of the close of business of the New York Stock Exchange (NYSE), normally 4:00 p.m. Eastern time and includes trades executed through the end of the prior business day. Gains and losses on securities sold are determined on the basis of identified cost and may include proceeds received from litigation. Dividend income is recorded on the ex-dividend date, except for certain dividends from foreign securities where the ex-dividend date may have passed, which are recorded as soon as the Fund is informed of the ex-dividend date. Non-cash dividends included in dividend income, if any, are recorded at the fair market value of the securities received. Income and capital gain distributions from Fidelity Central Funds, if any, are recorded on the ex-dividend date. Distributions received on securities that represent a return of capital or capital gain are recorded as a reduction of cost of investments and/or as a realized gain. Subsequent to ex-dividend date the Fund determines the components of these distributions, based upon receipt of tax filings or other correspondence relating to the underlying investment. Investment income is recorded net of foreign taxes withheld where recovery of such taxes is uncertain.
Class Allocations and Expenses. Investment income, realized and unrealized capital gains and losses, common expenses of the Fund, and certain fund-level expense reductions, if any, are allocated daily on a pro-rata basis to each class based on the relative net assets of each class to the total net assets of the Fund. Each class differs with respect to transfer agent and distribution and service plan fees incurred. Certain expense reductions may also differ by class. For the reporting period, the allocated portion of income and expenses to each class as a percent of its average net assets may vary due to the timing of recording these transactions in relation to fluctuating net assets of the classes. Expenses directly attributable to a fund are charged to that fund. Expenses attributable to more than one fund are allocated among the respective funds on the basis of relative net assets or other appropriate methods. Expense estimates are accrued in the period to which they relate and adjustments are made when actual amounts are known.
Income Tax Information and Distributions to Shareholders. Each year, the Fund intends to qualify as a regulated investment company under Subchapter M of the Internal Revenue Code, including distributing substantially all of its taxable income and realized gains. As a result, no provision for U.S. Federal income taxes is required. The Fund files a U.S. federal tax return, in addition to state and local tax returns as required. The Fund's federal income tax returns are subject to examination by the Internal Revenue Service (IRS) for a period of three fiscal years after they are filed. State and local tax returns may be subject to examination for an additional fiscal year depending on the jurisdiction. Foreign taxes are provided for based on the Fund's understanding of the tax rules and rates that exist in the foreign markets in which it invests.
Distributions are declared and recorded on the ex-dividend date. Income dividends and capital gain distributions are declared separately for each class. Income and capital gain distributions are determined in accordance with income tax regulations, which may differ from GAAP.
Capital accounts within the financial statements are adjusted for permanent book-tax differences. These adjustments have no impact on net assets or the results of operations. Capital accounts are not adjusted for temporary book-tax differences which will reverse in a subsequent period.
Book-tax differences are primarily due to foreign currency transactions, partnerships, capital loss carryforwards and losses deferred due to wash sales and excise tax regulations.
The federal tax cost of investment securities and unrealized appreciation (depreciation) as of period end were as follows:
| Gross unrealized appreciation | $7,948,537 |
| Gross unrealized depreciation | (23,483,737) |
| Net unrealized appreciation (depreciation) on securities | $(15,535,200) |
| Tax cost | $226,149,294 |
Capital loss carryforwards are only available to offset future capital gains of the Fund to the extent provided by regulations and may be limited. Under the Regulated Investment Company Modernization Act of 2010 (the Act), the Fund is permitted to carry forward capital losses incurred in taxable years beginning after December 22, 2010 for an unlimited period and such capital losses are required to be used prior to any losses that expire. The capital loss carryforward information presented below, including any applicable limitation, is estimated as of prior fiscal period end and is subject to adjustment.
| Fiscal year of expiration | |
| 2017 | $(22,843,955) |
| 2018 | (23,251,884) |
| 2019 | (445,604) |
| Total capital loss carryforward | $(46,541,443) |
The Fund elected to defer to its next fiscal year approximately $213,865 of ordinary losses recognized during the period January 1, 2015 to July 31, 2015.
Short-Term Trading (Redemption) Fees. Share held by investors in the Fund less than 30 days may have been subject to a redemption fee equal to .75% of the NAV of shares redeemed. All redemption fees, which reduce the proceeds of the shareholder redemption, are retained by the Fund and accounted for as an addition to paid in capital.
4. Purchases and Sales of Investments.
Purchases and sales of securities, other than short-term securities, aggregated $89,113,289 and $79,622,756, respectively.
5. Fees and Other Transactions with Affiliates.
Management Fee. Fidelity SelectCo, LLC (the investment adviser) and its affiliates provide the Fund with investment management related services for which the Fund pays a monthly management fee. The management fee is the sum of an individual fund fee rate that is based on an annual rate of .30% of the Fund's average net assets and an annualized group fee rate that averaged .25% during the period. The group fee rate is based upon the average net assets of all the mutual funds advised by Fidelity Management & Research Company (FMR) and the investment adviser. The group fee rate decreases as assets under management increase and increases as assets under management decrease. For the reporting period, the total annualized management fee rate was .55% of the Fund's average net assets.
Distribution and Service Plan Fees. In accordance with Rule 12b-1 of the 1940 Act, the Fund has adopted separate Distribution and Service Plans for each class of shares. Certain classes pay Fidelity Distributors Corporation (FDC), an affiliate of the investment adviser, separate Distribution and Service Fees, each of which is based on an annual percentage of each class' average net assets. In addition, FDC may pay financial intermediaries for selling shares of the Fund and providing shareholder support services. For the period, the Distribution and Service Fee rates, total fees and amounts retained by FDC were as follows:
| | Distribution
Fee | Service
Fee | Total Fees | Retained
by FDC |
| Class A | -% | .25% | $125,781 | $– |
| Class T | .25% | .25% | 81,044 | – |
| Class B | .75% | .25% | 15,577 | 11,683 |
| Class C | .75% | .25% | 248,123 | 75,328 |
| | | | $470,525 | $87,011 |
Sales Load. FDC may receive a front-end sales charge of up to 5.75% for selling Class A shares and 3.50% for selling Class T shares, some of which is paid to financial intermediaries for selling shares of the Fund. Depending on the holding period, FDC may receive contingent deferred sales charges levied on Class A, Class T, Class B, and Class C redemptions. The deferred sales charges range from 5.00% to 1.00% for Class B shares, 1.00% for Class C shares, 1.00% for certain purchases of Class A shares and .25% for certain purchases of Class T shares.
For the period, sales charge amounts retained by FDC were as follows:
| | Retained
by FDC |
| Class A | $34,332 |
| Class T | 5,301 |
| Class B(a) | 375 |
| Class C(a) | 6,520 |
| | $46,528 |
(a) When Class B and Class C shares are initially sold, FDC pays commissions from its own resources to financial intermediaries through which the sales are made.
Transfer Agent Fees. Fidelity Investments Institutional Operations Company, Inc., (FIIOC), an affiliate of the investment adviser, is the transfer, dividend disbursing and shareholder servicing agent for each class of the Fund. FIIOC receives account fees and asset-based fees that vary according to the account size and type of account of the shareholders of the respective classes of the Fund. FIIOC pays for typesetting, printing and mailing of shareholder reports, except proxy statements.
For the period, transfer agent fees for each class were as follows:
| | Amount | % of
Class-Level Average
Net Assets(a) |
| Class A | $124,786 | .25 |
| Class T | 46,586 | .29 |
| Class B | 4,760 | .30 |
| Class C | 59,992 | .24 |
| Class I | 41,869 | .19 |
| | $277,993 | |
(a) Annualized
Accounting and Security Lending Fees. Fidelity Service Company, Inc. (FSC), an affiliate of the investment adviser, maintains the Fund's accounting records. The accounting fee is based on the level of average net assets for each month. Under a separate contract, FSC administers the security lending program. The security lending fee is based on the number and duration of lending transactions.
Brokerage Commissions. The Fund placed a portion of its portfolio transactions with brokerage firms which are affiliates of the investment adviser. Brokerage commissions are included in net realized gain (loss) and change in net unrealized appreciation (depreciation) in the Statement of Operations. The commissions paid to these affiliated firms were $1,245 for the period.
Interfund Trades. The Fund may purchase from or sell securities to other Fidelity Funds under procedures adopted by the Board. The procedures have been designed to ensure these interfund trades are executed in accordance with Rule 17a-7 of the 1940 Act. Interfund trades are included within the respective purchases and sales amounts shown in the Purchases and Sales of Investments note.
6. Committed Line of Credit.
The Fund participates with other funds managed by the investment adviser or an affiliate in a $4.25 billion credit facility (the "line of credit") to be utilized for temporary or emergency purposes to fund shareholder redemptions or for other short-term liquidity purposes. The Fund has agreed to pay commitment fees on its pro-rata portion of the line of credit, which amounted to $153 and is reflected in Miscellaneous expenses on the Statement of Operations. During the period, the Fund did not borrow on this line of credit.
7. Security Lending.
The Fund lends portfolio securities through a lending agent from time to time in order to earn additional income. On the settlement date of the loan, the Fund receives collateral (in the form of U.S. Treasury obligations, letters of credit and/or cash) against the loaned securities and maintains collateral in an amount not less than 100% of the market value of the loaned securities during the period of the loan. The market value of the loaned securities is determined at the close of business of the Fund and any additional required collateral is delivered to the Fund on the next business day. The Fund or borrower may terminate the loan at any time, and if the borrower defaults on its obligation to return the securities loaned because of insolvency or other reasons, the Fund may apply collateral received from the borrower against the obligation. The Fund may experience delays and costs in recovering the securities loaned. Any cash collateral received is invested in the Fidelity Securities Lending Cash Central Fund. The value of loaned securities and cash collateral at period end are disclosed on the Fund's Statement of Assets and Liabilities. Security lending income represents the income earned on investing cash collateral, less rebates paid to borrowers and any lending agent fees associated with the loan, plus any premium payments received for lending certain types of securities. Security lending income is presented in the Statement of Operations as a component of income from Fidelity Central Funds. Total security lending income during the period amounted to $1,146.
8. Expense Reductions.
Commissions paid to certain brokers with whom the investment adviser, or its affiliates, places trades on behalf of the Fund include an amount in addition to trade execution, which may be rebated back to the Fund to offset certain expenses. This amount totaled $3,973 for the period. In addition, through arrangements with the Fund's custodian, credits realized as a result of certain uninvested cash balances were used to reduce the Fund's expenses. During the period, these credits reduced the Fund's custody expenses by $9.
In addition, during the period the investment adviser reimbursed and/or waived a portion of fund-level operating expenses in the amount of $869.
9. Distributions to Shareholders.
Distributions to shareholders of each class were as follows:
| | Six months ended January 31, 2016 | Year ended July 31, 2015 |
| From net investment income | | |
| Class A | $487,874 | $677,086 |
| Class T | 110,989 | 166,609 |
| Class B | 2,181 | 7,587 |
| Class C | 104,614 | 95,653 |
| Class I | 251,888 | 227,501 |
| Total | $957,546 | $1,174,436 |
| From net realized gain | | |
| Class A | $83,636 | $– |
| Class T | 26,115 | – |
| Class B | 2,379 | – |
| Class C | 43,289 | – |
| Class I | 34,348 | – |
| Total | $189,767 | $– |
10. Share Transactions.
Share transactions for each class were as follows and may contain automatic conversions between classes or exchanges between affiliated funds:
| | Shares | Shares | Dollars | Dollars |
| | Six months ended January 31, 2016 | Year ended July 31, 2015 | Six months ended January 31, 2016 | Year ended July 31, 2015 |
| Class A | | | | |
| Shares sold | 1,825,159 | 2,375,926 | $28,448,911 | $38,271,380 |
| Reinvestment of distributions | 34,331 | 37,600 | 519,430 | 601,602 |
| Shares redeemed | (1,248,508) | (1,370,832) | (18,711,707) | (21,745,625) |
| Net increase (decrease) | 610,982 | 1,042,694 | $10,256,634 | $17,127,357 |
| Class T | | | | |
| Shares sold | 255,275 | 282,748 | $3,952,059 | $4,530,961 |
| Reinvestment of distributions | 8,782 | 9,927 | 131,908 | 158,623 |
| Shares redeemed | (185,505) | (327,213) | (2,810,375) | (5,144,018) |
| Net increase (decrease) | 78,552 | (34,538) | $1,273,592 | $(454,434) |
| Class B | | | | |
| Shares sold | 9,818 | 9,940 | $145,243 | $153,403 |
| Reinvestment of distributions | 304 | 462 | 4,404 | 7,229 |
| Shares redeemed | (69,180) | (154,232) | (1,015,214) | (2,370,354) |
| Net increase (decrease) | (59,058) | (143,830) | $(865,567) | $(2,209,722) |
| Class C | | | | |
| Shares sold | 873,462 | 1,276,982 | $12,833,896 | $19,580,585 |
| Reinvestment of distributions | 9,045 | 5,490 | 129,709 | 84,931 |
| Shares redeemed | (518,325) | (661,896) | (7,364,427) | (9,959,897) |
| Net increase (decrease) | 364,182 | 620,576 | $5,599,178 | $9,705,619 |
| Class I | | | | |
| Shares sold | 1,012,179 | 2,718,004 | $15,880,600 | $44,696,215 |
| Reinvestment of distributions | 13,725 | 9,845 | 212,871 | 161,164 |
| Shares redeemed | (1,344,363) | (1,276,123) | (20,183,784) | (20,659,247) |
| Net increase (decrease) | (318,459) | 1,451,726 | $(4,090,313) | $24,198,132 |
11. Other.
The Fund's organizational documents provide former and current trustees and officers with a limited indemnification against liabilities arising in connection with the performance of their duties to the Fund. In the normal course of business, the Fund may also enter into contracts that provide general indemnifications. The Fund's maximum exposure under these arrangements is unknown as this would be dependent on future claims that may be made against the Fund. The risk of material loss from such claims is considered remote.
Fidelity Advisor® Health Care Fund
Investment Summary (Unaudited)
Top Ten Stocks as of January 31, 2016
| | % of fund's net assets | % of fund's net assets 6 months ago |
| Medtronic PLC | 9.6 | 7.8 |
| Allergan PLC | 6.4 | 6.6 |
| Teva Pharmaceutical Industries Ltd. sponsored ADR | 5.9 | 5.0 |
| Amgen, Inc. | 4.6 | 2.5 |
| Boston Scientific Corp. | 4.4 | 4.3 |
| AbbVie, Inc. | 3.4 | 4.2 |
| Bristol-Myers Squibb Co. | 3.3 | 2.3 |
| McKesson Corp. | 2.9 | 3.2 |
| UnitedHealth Group, Inc. | 2.6 | 2.2 |
| Cigna Corp. | 2.2 | 2.0 |
| | 45.3 | |
Top Industries (% of fund's net assets)
| As of January 31, 2016 |
| | Pharmaceuticals | 28.8% |
| | Biotechnology | 25.0% |
| | Health Care Equipment & Supplies | 24.6% |
| | Health Care Providers & Services | 13.8% |
| | Health Care Technology | 2.8% |
| | All Others* | 5.0% |

| As of July 31, 2015 |
| | Pharmaceuticals | 36.6% |
| | Health Care Equipment & Supplies | 20.5% |
| | Biotechnology | 19.0% |
| | Health Care Providers & Services | 13.4% |
| | Health Care Technology | 3.2% |
| | All Others* | 7.3% |

* Includes Short-Term investments and Net Other Assets (Liabilities).
Fidelity Advisor® Health Care Fund
Investments January 31, 2016 (Unaudited)
Showing Percentage of Net Assets
| Common Stocks - 98.6% | | | |
| | | Shares | Value |
| Biotechnology - 25.0% | | | |
| Biotechnology - 25.0% | | | |
| AbbVie, Inc. | | 1,635,300 | $89,777,970 |
| Ablynx NV (a) | | 591,709 | 8,621,127 |
| Acceleron Pharma, Inc. (a) | | 142,448 | 4,373,154 |
| Acorda Therapeutics, Inc. (a) | | 201,929 | 7,435,026 |
| Actelion Ltd. | | 90,000 | 11,860,163 |
| Advaxis, Inc. (a)(b) | | 531,200 | 3,622,784 |
| Alnylam Pharmaceuticals, Inc. (a) | | 156,555 | 10,792,902 |
| AMAG Pharmaceuticals, Inc. (a) | | 344,115 | 7,883,675 |
| Amgen, Inc. | | 808,666 | 123,507,558 |
| Amicus Therapeutics, Inc. (a)(b) | | 870,000 | 5,254,800 |
| Anacor Pharmaceuticals, Inc. (a) | | 322,037 | 24,194,640 |
| Arena Pharmaceuticals, Inc. (a) | | 2,519,396 | 3,804,288 |
| Array BioPharma, Inc. (a) | | 800,000 | 2,472,000 |
| Ascendis Pharma A/S ADR | | 400,000 | 7,616,000 |
| Biogen, Inc. (a) | | 197,884 | 54,034,205 |
| BioMarin Pharmaceutical, Inc. (a) | | 299,200 | 22,146,784 |
| bluebird bio, Inc. (a) | | 43,420 | 1,795,851 |
| Blueprint Medicines Corp. | | 205,000 | 3,222,600 |
| Cara Therapeutics, Inc. (a) | | 282,162 | 2,539,458 |
| Celgene Corp. (a) | | 238,208 | 23,897,027 |
| Cellectis SA sponsored ADR | | 220,700 | 4,934,852 |
| Curis, Inc. (a) | | 1,519,300 | 2,491,652 |
| CytomX Therapeutics, Inc. (a) | | 145,200 | 2,281,092 |
| Edge Therapeutics, Inc. (a) | | 181,343 | 2,014,721 |
| Galapagos Genomics NV sponsored ADR | | 120,209 | 5,880,624 |
| Gilead Sciences, Inc. | | 266,862 | 22,149,546 |
| Heron Therapeutics, Inc. (a) | | 163,315 | 3,427,982 |
| Incyte Corp. (a) | | 142,200 | 10,033,632 |
| Insmed, Inc. (a) | | 900,800 | 11,890,560 |
| Intercept Pharmaceuticals, Inc. (a) | | 53,021 | 5,632,421 |
| Mirati Therapeutics, Inc. (a) | | 274,000 | 5,899,220 |
| Neurocrine Biosciences, Inc. (a) | | 222,100 | 9,450,355 |
| ProNai Therapeutics, Inc. (a) | | 97,200 | 804,816 |
| Puma Biotechnology, Inc. (a)(b) | | 400,000 | 16,696,000 |
| Regeneron Pharmaceuticals, Inc. (a) | | 105,298 | 44,234,637 |
| Spark Therapeutics, Inc. | | 131,942 | 3,716,806 |
| TESARO, Inc. (a)(b) | | 300,000 | 10,362,000 |
| Trevena, Inc. (a) | | 1,000,000 | 7,280,000 |
| Ultragenyx Pharmaceutical, Inc. (a) | | 201,440 | 11,310,856 |
| United Therapeutics Corp. (a) | | 101,800 | 12,539,724 |
| Vertex Pharmaceuticals, Inc. (a) | | 597,700 | 54,241,275 |
| Xencor, Inc. (a) | | 297,400 | 3,217,868 |
| | | | 669,342,651 |
| Capital Markets - 0.0% | | | |
| Asset Management & Custody Banks - 0.0% | | | |
| RPI International Holdings LP (c) | | 10,510 | 1,473,502 |
| Diversified Consumer Services - 0.2% | | | |
| Specialized Consumer Services - 0.2% | | | |
| Carriage Services, Inc. | | 215,735 | 4,787,160 |
| Health Care Equipment & Supplies - 24.6% | | | |
| Health Care Equipment - 23.2% | | | |
| Atricure, Inc. (a) | | 556,504 | 9,727,690 |
| Boston Scientific Corp. (a) | | 6,788,948 | 119,010,258 |
| CONMED Corp. | | 304,100 | 11,233,454 |
| Edwards Lifesciences Corp. (a) | | 501,500 | 39,222,315 |
| HeartWare International, Inc. (a) | | 138,771 | 5,570,268 |
| Integra LifeSciences Holdings Corp. (a) | | 244,600 | 15,030,670 |
| Intuitive Surgical, Inc. (a) | | 44,000 | 23,797,400 |
| Invuity, Inc. | | 517,800 | 3,976,704 |
| LivaNova PLC (a) | | 235,600 | 13,188,888 |
| Medtronic PLC | | 3,395,700 | 257,801,539 |
| Neovasc, Inc. (a) | | 1,100,000 | 3,762,000 |
| Nevro Corp. (a)(b) | | 314,300 | 19,420,597 |
| Novocure Ltd. (a)(b) | | 185,300 | 2,312,544 |
| ResMed, Inc. | | 408,000 | 23,133,600 |
| St. Jude Medical, Inc. | | 97,800 | 5,169,708 |
| Steris PLC | | 120,184 | 8,321,540 |
| Stryker Corp. | | 100,000 | 9,915,000 |
| Teleflex, Inc. (b) | | 80,000 | 10,855,200 |
| Wright Medical Group NV (a) | | 1,300,000 | 25,935,000 |
| Zeltiq Aesthetics, Inc. (a) | | 253,818 | 5,893,654 |
| Zimmer Biomet Holdings, Inc. | | 88,500 | 8,784,510 |
| | | | 622,062,539 |
| Health Care Supplies - 1.4% | | | |
| The Cooper Companies, Inc. | | 220,000 | 28,853,000 |
| The Spectranetics Corp. (a)(b) | | 700,000 | 8,435,000 |
| | | | 37,288,000 |
|
| TOTAL HEALTH CARE EQUIPMENT & SUPPLIES | | | 659,350,539 |
|
| Health Care Providers & Services - 13.7% | | | |
| Health Care Distributors & Services - 3.7% | | | |
| Amplifon SpA | | 761,295 | 6,382,162 |
| EBOS Group Ltd. | | 1,312,664 | 11,441,210 |
| McKesson Corp. | | 475,175 | 76,493,672 |
| United Drug PLC (United Kingdom) | | 800,000 | 5,980,068 |
| | | | 100,297,112 |
| Health Care Facilities - 3.7% | | | |
| AmSurg Corp. (a) | | 150,000 | 10,978,500 |
| Brookdale Senior Living, Inc. (a) | | 406,070 | 6,610,820 |
| HCA Holdings, Inc. (a) | | 429,800 | 29,905,484 |
| Surgical Care Affiliates, Inc. (a) | | 500,005 | 21,335,213 |
| Universal Health Services, Inc. Class B | | 272,600 | 30,705,664 |
| | | | 99,535,681 |
| Health Care Services - 1.5% | | | |
| Adeptus Health, Inc. Class A (a)(b) | | 120,200 | 5,671,036 |
| DaVita HealthCare Partners, Inc. (a) | | 307,100 | 20,612,552 |
| Envision Healthcare Holdings, Inc. (a) | | 571,304 | 12,625,818 |
| | | | 38,909,406 |
| Managed Health Care - 4.8% | | | |
| Cigna Corp. | | 430,200 | 57,474,720 |
| UnitedHealth Group, Inc. | | 612,800 | 70,570,048 |
| | | | 128,044,768 |
|
| TOTAL HEALTH CARE PROVIDERS & SERVICES | | | 366,786,967 |
|
| Health Care Technology - 2.8% | | | |
| Health Care Technology - 2.8% | | | |
| athenahealth, Inc. (a) | | 239,100 | 33,904,380 |
| Castlight Health, Inc. (a) | | 336,800 | 1,114,808 |
| Castlight Health, Inc. Class B (a)(b) | | 94,050 | 311,306 |
| Connecture, Inc. (a) | | 489,461 | 1,155,128 |
| Evolent Health, Inc. | | 243,600 | 2,404,332 |
| HealthStream, Inc. (a) | | 685,600 | 15,014,640 |
| Medidata Solutions, Inc. (a) | | 485,900 | 20,762,507 |
| | | | 74,667,101 |
| Life Sciences Tools & Services - 2.8% | | | |
| Life Sciences Tools & Services - 2.8% | | | |
| Agilent Technologies, Inc. | | 1,349,700 | 50,816,205 |
| Bruker Corp. (a) | | 746,200 | 16,662,646 |
| PRA Health Sciences, Inc. (a) | | 167,300 | 7,207,284 |
| | | | 74,686,135 |
| Pharmaceuticals - 28.8% | | | |
| Pharmaceuticals - 28.8% | | | |
| Allergan PLC (a) | | 602,300 | 171,312,189 |
| Amphastar Pharmaceuticals, Inc. (a) | | 600,000 | 7,230,000 |
| Astellas Pharma, Inc. | | 1,012,300 | 14,016,876 |
| Bristol-Myers Squibb Co. | | 1,404,000 | 87,272,640 |
| Catalent, Inc. (a) | | 609,100 | 14,332,123 |
| Dechra Pharmaceuticals PLC | | 600,000 | 8,570,365 |
| Eisai Co. Ltd. | | 304,000 | 18,375,032 |
| Endo Health Solutions, Inc. (a) | | 931,400 | 51,664,758 |
| Horizon Pharma PLC (a) | | 728,100 | 12,741,750 |
| Jazz Pharmaceuticals PLC (a) | | 163,100 | 20,997,494 |
| Jiangsu Hengrui Medicine Co. Ltd. | | 1,430,000 | 9,605,122 |
| Lee's Pharmaceutical Holdings Ltd. | | 4,366,536 | 4,037,954 |
| Mylan N.V. | | 1,011,400 | 53,290,666 |
| Pfizer, Inc. | | 1,349,700 | 41,152,353 |
| Prestige Brands Holdings, Inc. (a) | | 307,500 | 14,354,100 |
| Sanofi SA sponsored ADR | | 500,000 | 20,820,000 |
| Sun Pharmaceutical Industries Ltd. | | 1,123,677 | 14,544,714 |
| Teva Pharmaceutical Industries Ltd. sponsored ADR | | 2,564,500 | 157,665,460 |
| The Medicines Company (a)(b) | | 291,900 | 10,088,064 |
| TherapeuticsMD, Inc. (a)(b) | | 2,003,600 | 14,325,740 |
| UCB SA | | 91,500 | 7,823,336 |
| Valeant Pharmaceuticals International, Inc. (Canada) (a) | | 188,700 | 17,376,187 |
| | | | 771,596,923 |
| Professional Services - 0.7% | | | |
| Human Resource & Employment Services - 0.7% | | | |
| WageWorks, Inc. (a) | | 401,600 | 17,967,584 |
| TOTAL COMMON STOCKS | | | |
| (Cost $2,610,997,227) | | | 2,640,658,562 |
|
| Convertible Preferred Stocks - 0.1% | | | |
| Health Care Providers & Services - 0.1% | | | |
| Health Care Services - 0.1% | | | |
| 1Life Healthcare, Inc. Series G (a)(c) | | | |
| (Cost $2,121,583) | | 322,145 | 2,812,326 |
|
| Money Market Funds - 1.1% | | | |
| Fidelity Cash Central Fund, 0.38% (d) | | 7,673,993 | 7,673,993 |
| Fidelity Securities Lending Cash Central Fund, 0.42% (d)(e) | | 21,198,175 | 21,198,175 |
| TOTAL MONEY MARKET FUNDS | | | |
| (Cost $28,872,168) | | | 28,872,168 |
| TOTAL INVESTMENT PORTFOLIO - 99.8% | | | |
| (Cost $2,641,990,978) | | | 2,672,343,056 |
| NET OTHER ASSETS (LIABILITIES) - 0.2% | | | 4,225,975 |
| NET ASSETS - 100% | | | $2,676,569,031 |
Legend
(a) Non-income producing
(b) Security or a portion of the security is on loan at period end.
(c) Restricted securities - Investment in securities not registered under the Securities Act of 1933 (excluding 144A issues). At the end of the period, the value of restricted securities (excluding 144A issues) amounted to $4,285,828 or 0.2% of net assets.
(d) Affiliated fund that is generally available only to investment companies and other accounts managed by Fidelity Investments. The rate quoted is the annualized seven-day yield of the fund at period end. A complete unaudited listing of the fund's holdings as of its most recent quarter end is available upon request. In addition, each Fidelity Central Fund's financial statements are available on the SEC's website or upon request.
(e) Investment made with cash collateral received from securities on loan.
Additional information on each restricted holding is as follows:
| Security | Acquisition Date | Acquisition Cost |
| 1Life Healthcare, Inc. Series G | 4/10/14 | $2,121,583 |
| RPI International Holdings LP | 5/21/15 | $1,239,129 |
Affiliated Central Funds
Information regarding fiscal year to date income earned by the Fund from investments in Fidelity Central Funds is as follows:
| Fund | Income earned |
| Fidelity Cash Central Fund | $76,615 |
| Fidelity Securities Lending Cash Central Fund | 173,746 |
| Total | $250,361 |
Investment Valuation
The following is a summary of the inputs used, as of January 31, 2016, involving the Fund's assets and liabilities carried at fair value. The inputs or methodology used for valuing securities may not be an indication of the risk associated with investing in those securities. For more information on valuation inputs, and their aggregation into the levels used below, please refer to the Investment Valuation section in the accompanying Notes to Financial Statements.
| | Valuation Inputs at Reporting Date: |
| Description | Total | Level 1 | Level 2 | Level 3 |
| Investments in Securities: | | | | |
| Common Stocks | $2,640,658,562 | $2,529,368,141 | $109,816,919 | $1,473,502 |
| Convertible Preferred Stocks | 2,812,326 | -- | -- | 2,812,326 |
| Money Market Funds | 28,872,168 | 28,872,168 | -- | -- |
| Total Investments in Securities: | $2,672,343,056 | $2,558,240,309 | $109,816,919 | $4,285,828 |
The following is a summary of transfers between Level 1 and Level 2 for the period ended January 31, 2016. Transfers are assumed to have occurred at the beginning of the period, and are primarily attributable to the valuation techniques used for foreign equity securities, as discussed in the accompanying Notes to Financial Statements:
| Transfers | Total |
| Level 1 to Level 2 | $105,922,384 |
| Level 2 to Level 1 | $0 |
Other Information
Distribution of investments by country or territory of incorporation, as a percentage of Total Net Assets, is as follows (Unaudited):
| United States of America | 64.4% |
| Ireland | 19.4% |
| Israel | 5.9% |
| Netherlands | 3.0% |
| Japan | 1.2% |
| United Kingdom | 1.1% |
| France | 1.0% |
| Others (Individually Less Than 1%) | 4.0% |
| | 100.0% |
See accompanying notes which are an integral part of the financial statements.
Fidelity Advisor® Health Care Fund
Financial Statements
Statement of Assets and Liabilities
| | | January 31, 2016 (Unaudited) |
| Assets | | |
Investment in securities, at value (including securities loaned of $21,253,216) — See accompanying schedule:
Unaffiliated issuers (cost $2,613,118,810) | $2,643,470,888 | |
| Fidelity Central Funds (cost $28,872,168) | 28,872,168 | |
| Total Investments (cost $2,641,990,978) | | $2,672,343,056 |
| Cash | | 1,276 |
| Receivable for investments sold | | 69,888,696 |
| Receivable for fund shares sold | | 5,884,117 |
| Dividends receivable | | 2,026,278 |
| Distributions receivable from Fidelity Central Funds | | 19,048 |
| Prepaid expenses | | 12,978 |
| Other receivables | | 24,256 |
| Total assets | | 2,750,199,705 |
| Liabilities | | |
| Payable for investments purchased | $43,522,607 | |
| Payable for fund shares redeemed | 6,061,951 | |
| Accrued management fee | 1,272,719 | |
| Distribution and service plan fees payable | 948,267 | |
| Other affiliated payables | 564,327 | |
| Other payables and accrued expenses | 62,628 | |
| Collateral on securities loaned, at value | 21,198,175 | |
| Total liabilities | | 73,630,674 |
| Net Assets | | $2,676,569,031 |
| Net Assets consist of: | | |
| Paid in capital | | $2,682,982,928 |
| Accumulated net investment loss | | (6,325,168) |
| Accumulated undistributed net realized gain (loss) on investments and foreign currency transactions | | (30,439,600) |
| Net unrealized appreciation (depreciation) on investments and assets and liabilities in foreign currencies | | 30,350,871 |
| Net Assets | | $2,676,569,031 |
| Calculation of Maximum Offering Price | | |
| Class A: | | |
| Net Asset Value and redemption price per share ($1,144,713,999 ÷ 33,396,915 shares) | | $34.28 |
| Maximum offering price per share (100/94.25 of $34.28) | | $36.37 |
| Class T: | | |
| Net Asset Value and redemption price per share ($280,233,432 ÷ 8,682,523 shares) | | $32.28 |
| Maximum offering price per share (100/96.50 of $32.28) | | $33.45 |
| Class B: | | |
| Net Asset Value and offering price per share ($7,814,846 ÷ 275,621 shares)(a) | | $28.35 |
| Class C: | | |
| Net Asset Value and offering price per share ($661,247,663 ÷ 23,608,402 shares)(a) | | $28.01 |
| Class I: | | |
| Net Asset Value, offering price and redemption price per share ($582,559,091 ÷ 15,747,853 shares) | | $36.99 |
(a) Redemption price per share is equal to net asset value less any applicable contingent deferred sales charge.
See accompanying notes which are an integral part of the financial statements.
Statement of Operations
| | | Six months ended January 31, 2016 (Unaudited) |
| Investment Income | | |
| Dividends | | $11,372,909 |
| Interest | | 55 |
| Income from Fidelity Central Funds | | 250,361 |
| Total income | | 11,623,325 |
| Expenses | | |
| Management fee | $8,285,409 | |
| Transfer agent fees | 3,008,708 | |
| Distribution and service plan fees | 6,001,966 | |
| Accounting and security lending fees | 446,580 | |
| Custodian fees and expenses | 31,779 | |
| Independent trustees' compensation | 28,263 | |
| Registration fees | 129,680 | |
| Audit | 28,286 | |
| Legal | 15,842 | |
| Interest | 1,775 | |
| Miscellaneous | 15,220 | |
| Total expenses before reductions | 17,993,508 | |
| Expense reductions | (45,032) | 17,948,476 |
| Net investment income (loss) | | (6,325,151) |
| Realized and Unrealized Gain (Loss) | | |
| Net realized gain (loss) on: | | |
| Investment securities: | | |
| Unaffiliated issuers | (27,431,418) | |
| Foreign currency transactions | 36,177 | |
| Total net realized gain (loss) | | (27,395,241) |
Change in net unrealized appreciation (depreciation) on:
Investment securities | (616,274,989) | |
| Assets and liabilities in foreign currencies | (799) | |
| Total change in net unrealized appreciation (depreciation) | | (616,275,788) |
| Net gain (loss) | | (643,671,029) |
| Net increase (decrease) in net assets resulting from operations | | $(649,996,180) |
See accompanying notes which are an integral part of the financial statements.
Statement of Changes in Net Assets
| | Six months ended January 31, 2016 (Unaudited) | Year ended July 31, 2015 |
| Increase (Decrease) in Net Assets | | |
| Operations | | |
| Net investment income (loss) | $(6,325,151) | $(13,226,611) |
| Net realized gain (loss) | (27,395,241) | 303,936,182 |
| Change in net unrealized appreciation (depreciation) | (616,275,788) | 322,305,451 |
| Net increase (decrease) in net assets resulting from operations | (649,996,180) | 613,015,022 |
| Distributions to shareholders from net realized gain | (200,296,844) | (188,666,593) |
| Share transactions - net increase (decrease) | 196,848,910 | 1,510,649,436 |
| Redemption fees | 63,116 | 66,619 |
| Total increase (decrease) in net assets | (653,380,998) | 1,935,064,484 |
| Net Assets | | |
| Beginning of period | 3,329,950,029 | 1,394,885,545 |
| End of period (including accumulated net investment loss of $6,325,168 and accumulated net investment loss of $17, respectively) | $2,676,569,031 | $3,329,950,029 |
See accompanying notes which are an integral part of the financial statements.
Financial Highlights — Fidelity Advisor Health Care Fund Class A
| | Six months ended (Unaudited) | Years ended July 31, | | | | |
| January 31, | 2016 | 2015 | 2014 | 2013 | 2012 | 2011 |
| Selected Per–Share Data | | | | | | |
| Net asset value, beginning of period | $45.17 | $37.72 | $31.29 | $24.35 | $25.60 | $19.01 |
| Income from Investment Operations | | | | | | |
| Net investment income (loss)A | (.05) | (.19) | (.18) | –B | (.04) | (.10) |
| Net realized and unrealized gain (loss) | (8.29) | 12.03 | 10.13 | 9.53 | 1.43 | 6.69 |
| Total from investment operations | (8.34) | 11.84 | 9.95 | 9.53 | 1.39 | 6.59 |
| Distributions from net realized gain | (2.55) | (4.39) | (3.52) | (2.59) | (2.64) | – |
| Total distributions | (2.55) | (4.39) | (3.52) | (2.59) | (2.64) | – |
| Redemption fees added to paid in capitalA,B | – | – | – | – | – | – |
| Net asset value, end of period | $34.28 | $45.17 | $37.72 | $31.29 | $24.35 | $25.60 |
| Total ReturnC,D,E | (19.14)% | 34.07% | 34.79% | 42.77% | 7.58% | 34.67% |
| Ratios to Average Net AssetsF,G | | | | | | |
| Expenses before reductions | 1.04%H | 1.04% | 1.08% | 1.14% | 1.19% | 1.19% |
| Expenses net of fee waivers, if any | 1.04%H | 1.04% | 1.08% | 1.14% | 1.19% | 1.19% |
| Expenses net of all reductions | 1.04%H | 1.04% | 1.07% | 1.13% | 1.18% | 1.18% |
| Net investment income (loss) | (.27)%H | (.45)% | (.54)% | (.01)% | (.18)% | (.43)% |
| Supplemental Data | | | | | | |
| Net assets, end of period (000 omitted) | $1,144,714 | $1,374,654 | $613,995 | $365,416 | $233,188 | $224,704 |
| Portfolio turnover rateI | 71%H | 80% | 111% | 92% | 124% | 125% |
A Calculated based on average shares outstanding during the period.
B Amount represents less than $.005 per share.
C Total returns for periods of less than one year are not annualized.
D Total returns would have been lower if certain expenses had not been reduced during the applicable periods shown.
E Total returns do not include the effect of the sales charges.
F Fees and expenses of any underlying Fidelity Central Funds are not included in the Fund's expense ratio. The Fund indirectly bears its proportionate share of the expenses of any underlying Fidelity Central Funds.
G Expense ratios reflect operating expenses of the class. Expenses before reductions do not reflect amounts reimbursed by the investment adviser or reductions from brokerage service arrangements or reductions from other expense offset arrangements and do not represent the amount paid by the class during periods when reimbursements or reductions occur. Expenses net of fee waivers reflect expenses after reimbursement by the investment adviser but prior to reductions from brokerage service arrangements or other expense offset arrangements. Expenses net of all reductions represent the net expenses paid by the class.
H Annualized
I Amount does not include the portfolio activity of any underlying Fidelity Central Funds.
See accompanying notes which are an integral part of the financial statements.
Financial Highlights — Fidelity Advisor Health Care Fund Class T
| | Six months ended (Unaudited) | Years ended July 31, | | | | |
| January 31, | 2016 | 2015 | 2014 | 2013 | 2012 | 2011 |
| Selected Per–Share Data | | | | | | |
| Net asset value, beginning of period | $42.68 | $35.87 | $29.91 | $23.42 | $24.80 | $18.46 |
| Income from Investment Operations | | | | | | |
| Net investment income (loss)A | (.10) | (.28) | (.26) | (.07) | (.09) | (.16) |
| Net realized and unrealized gain (loss) | (7.81) | 11.39 | 9.67 | 9.13 | 1.35 | 6.50 |
| Total from investment operations | (7.91) | 11.11 | 9.41 | 9.06 | 1.26 | 6.34 |
| Distributions from net realized gain | (2.49) | (4.30) | (3.45) | (2.57) | (2.64) | – |
| Total distributions | (2.49) | (4.30) | (3.45) | (2.57) | (2.64) | – |
| Redemption fees added to paid in capitalA,B | – | – | – | – | – | – |
| Net asset value, end of period | $32.28 | $42.68 | $35.87 | $29.91 | $23.42 | $24.80 |
| Total ReturnC,D,E | (19.24)% | 33.69% | 34.49% | 42.39% | 7.27% | 34.34% |
| Ratios to Average Net AssetsF,G | | | | | | |
| Expenses before reductions | 1.31%H | 1.31% | 1.34% | 1.39% | 1.43% | 1.44% |
| Expenses net of fee waivers, if any | 1.31%H | 1.31% | 1.34% | 1.39% | 1.43% | 1.44% |
| Expenses net of all reductions | 1.31%H | 1.30% | 1.34% | 1.38% | 1.43% | 1.43% |
| Net investment income (loss) | (.54)%H | (.72)% | (.80)% | (.26)% | (.42)% | (.69)% |
| Supplemental Data | | | | | | |
| Net assets, end of period (000 omitted) | $280,233 | $348,886 | $216,973 | $158,611 | $117,969 | $123,606 |
| Portfolio turnover rateI | 71%H | 80% | 111% | 92% | 124% | 125% |
A Calculated based on average shares outstanding during the period.
B Amount represents less than $.005 per share.
C Total returns for periods of less than one year are not annualized.
D Total returns would have been lower if certain expenses had not been reduced during the applicable periods shown.
E Total returns do not include the effect of the sales charges.
F Fees and expenses of any underlying Fidelity Central Funds are not included in the Fund's expense ratio. The Fund indirectly bears its proportionate share of the expenses of any underlying Fidelity Central Funds.
G Expense ratios reflect operating expenses of the class. Expenses before reductions do not reflect amounts reimbursed by the investment adviser or reductions from brokerage service arrangements or reductions from other expense offset arrangements and do not represent the amount paid by the class during periods when reimbursements or reductions occur. Expenses net of fee waivers reflect expenses after reimbursement by the investment adviser but prior to reductions from brokerage service arrangements or other expense offset arrangements. Expenses net of all reductions represent the net expenses paid by the class.
H Annualized
I Amount does not include the portfolio activity of any underlying Fidelity Central Funds.
See accompanying notes which are an integral part of the financial statements.
Financial Highlights — Fidelity Advisor Health Care Fund Class B
| | Six months ended (Unaudited) | Years ended July 31, | | | | |
| January 31, | 2016 | 2015 | 2014 | 2013 | 2012 | 2011 |
| Selected Per–Share Data | | | | | | |
| Net asset value, beginning of period | $37.77 | $32.17 | $27.16 | $21.55 | $23.15 | $17.32 |
| Income from Investment Operations | | | | | | |
| Net investment income (loss)A | (.17) | (.43) | (.40) | (.18) | (.19) | (.25) |
| Net realized and unrealized gain (loss) | (6.90) | 10.13 | 8.71 | 8.31 | 1.23 | 6.08 |
| Total from investment operations | (7.07) | 9.70 | 8.31 | 8.13 | 1.04 | 5.83 |
| Distributions from net realized gain | (2.35) | (4.10) | (3.30) | (2.52) | (2.64) | – |
| Total distributions | (2.35) | (4.10) | (3.30) | (2.52) | (2.64) | – |
| Redemption fees added to paid in capitalA,B | – | – | – | – | – | – |
| Net asset value, end of period | $28.35 | $37.77 | $32.17 | $27.16 | $21.55 | $23.15 |
| Total ReturnC,D,E | (19.49)% | 33.00% | 33.72% | 41.61% | 6.78% | 33.66% |
| Ratios to Average Net AssetsF,G | | | | | | |
| Expenses before reductions | 1.87%H | 1.85% | 1.91% | 1.93% | 1.94% | 1.94% |
| Expenses net of fee waivers, if any | 1.87%H | 1.85% | 1.91% | 1.93% | 1.94% | 1.94% |
| Expenses net of all reductions | 1.86%H | 1.85% | 1.90% | 1.91% | 1.93% | 1.93% |
| Net investment income (loss) | (1.09)%H | (1.26)% | (1.37)% | (.80)% | (.93)% | (1.19)% |
| Supplemental Data | | | | | | |
| Net assets, end of period (000 omitted) | $7,815 | $12,926 | $13,405 | $14,517 | $15,403 | $20,365 |
| Portfolio turnover rateI | 71%H | 80% | 111% | 92% | 124% | 125% |
A Calculated based on average shares outstanding during the period.
B Amount represents less than $.005 per share.
C Total returns for periods of less than one year are not annualized.
D Total returns would have been lower if certain expenses had not been reduced during the applicable periods shown.
E Total returns do not include the effect of the contingent deferred sales charge.
F Fees and expenses of any underlying Fidelity Central Funds are not included in the Fund's expense ratio. The Fund indirectly bears its proportionate share of the expenses of any underlying Fidelity Central Funds.
G Expense ratios reflect operating expenses of the class. Expenses before reductions do not reflect amounts reimbursed by the investment adviser or reductions from brokerage service arrangements or reductions from other expense offset arrangements and do not represent the amount paid by the class during periods when reimbursements or reductions occur. Expenses net of fee waivers reflect expenses after reimbursement by the investment adviser but prior to reductions from brokerage service arrangements or other expense offset arrangements. Expenses net of all reductions represent the net expenses paid by the class.
H Annualized
I Amount does not include the portfolio activity of any underlying Fidelity Central Funds.
See accompanying notes which are an integral part of the financial statements.
Financial Highlights — Fidelity Advisor Health Care Fund Class C
| | Six months ended (Unaudited) | Years ended July 31, | | | | |
| January 31, | 2016 | 2015 | 2014 | 2013 | 2012 | 2011 |
| Selected Per–Share Data | | | | | | |
| Net asset value, beginning of period | $37.45 | $32.03 | $27.11 | $21.51 | $23.11 | $17.29 |
| Income from Investment Operations | | | | | | |
| Net investment income (loss)A | (.16) | (.41) | (.38) | (.17) | (.18) | (.24) |
| Net realized and unrealized gain (loss) | (6.82) | 10.05 | 8.68 | 8.31 | 1.22 | 6.06 |
| Total from investment operations | (6.98) | 9.64 | 8.30 | 8.14 | 1.04 | 5.82 |
| Distributions from net realized gain | (2.46) | (4.22) | (3.38) | (2.54) | (2.64) | – |
| Total distributions | (2.46) | (4.22) | (3.38) | (2.54) | (2.64) | – |
| Redemption fees added to paid in capitalA,B | – | – | – | – | – | – |
| Net asset value, end of period | $28.01 | $37.45 | $32.03 | $27.11 | $21.51 | $23.11 |
| Total ReturnC,D,E | (19.45)% | 33.04% | 33.83% | 41.74% | 6.80% | 33.66% |
| Ratios to Average Net AssetsF,G | | | | | | |
| Expenses before reductions | 1.80%H | 1.79% | 1.83% | 1.87% | 1.90% | 1.90% |
| Expenses net of fee waivers, if any | 1.80%H | 1.79% | 1.83% | 1.87% | 1.90% | 1.90% |
| Expenses net of all reductions | 1.79%H | 1.79% | 1.82% | 1.85% | 1.89% | 1.89% |
| Net investment income (loss) | (1.02)%H | (1.20)% | (1.29)% | (.74)% | (.89)% | (1.15)% |
| Supplemental Data | | | | | | |
| Net assets, end of period (000 omitted) | $661,248 | $761,070 | $257,859 | $125,965 | $78,763 | $77,749 |
| Portfolio turnover rateI | 71%H | 80% | 111% | 92% | 124% | 125% |
A Calculated based on average shares outstanding during the period.
B Amount represents less than $.005 per share.
C Total returns for periods of less than one year are not annualized.
D Total returns would have been lower if certain expenses had not been reduced during the applicable periods shown.
E Total returns do not include the effect of the contingent deferred sales charge.
F Fees and expenses of any underlying Fidelity Central Funds are not included in the Fund's expense ratio. The Fund indirectly bears its proportionate share of the expenses of any underlying Fidelity Central Funds.
G Expense ratios reflect operating expenses of the class. Expenses before reductions do not reflect amounts reimbursed by the investment adviser or reductions from brokerage service arrangements or reductions from other expense offset arrangements and do not represent the amount paid by the class during periods when reimbursements or reductions occur. Expenses net of fee waivers reflect expenses after reimbursement by the investment adviser but prior to reductions from brokerage service arrangements or other expense offset arrangements. Expenses net of all reductions represent the net expenses paid by the class.
H Annualized
I Amount does not include the portfolio activity of any underlying Fidelity Central Funds.
See accompanying notes which are an integral part of the financial statements.
Financial Highlights — Fidelity Advisor Health Care Fund Class I
| | Six months ended (Unaudited) | Years ended July 31, | | | | |
| January 31, | 2016 | 2015 | 2014 | 2013 | 2012 | 2011 |
| Selected Per–Share Data | | | | | | |
| Net asset value, beginning of period | $48.53 | $40.22 | $33.12 | $25.60 | $26.69 | $19.77 |
| Income from Investment Operations | | | | | | |
| Net investment income (loss)A | –B | (.09) | (.10) | .07 | .03 | (.03) |
| Net realized and unrealized gain (loss) | (8.94) | 12.88 | 10.80 | 10.07 | 1.52 | 6.95 |
| Total from investment operations | (8.94) | 12.79 | 10.70 | 10.14 | 1.55 | 6.92 |
| Distributions from net realized gain | (2.60) | (4.48) | (3.60) | (2.62) | (2.64) | – |
| Total distributions | (2.60) | (4.48) | (3.60) | (2.62) | (2.64) | – |
| Redemption fees added to paid in capitalA,B | – | – | – | – | – | – |
| Net asset value, end of period | $36.99 | $48.53 | $40.22 | $33.12 | $25.60 | $26.69 |
| Total ReturnC,D | (19.06)% | 34.40% | 35.21% | 43.12% | 7.91% | 35.00% |
| Ratios to Average Net AssetsE,F | | | | | | |
| Expenses before reductions | .79%G | .79% | .81% | .87% | .89% | .89% |
| Expenses net of fee waivers, if any | .79%G | .79% | .81% | .87% | .89% | .89% |
| Expenses net of all reductions | .78%G | .78% | .81% | .85% | .88% | .88% |
| Net investment income (loss) | (.01)%G | (.20)% | (.27)% | .26% | .12% | (.13)% |
| Supplemental Data | | | | | | |
| Net assets, end of period (000 omitted) | $582,559 | $832,415 | $292,654 | $74,417 | $40,737 | $45,243 |
| Portfolio turnover rateH | 71%G | 80% | 111% | 92% | 124% | 125% |
A Calculated based on average shares outstanding during the period.
B Amount represents less than $.005 per share.
C Total returns for periods of less than one year are not annualized.
D Total returns would have been lower if certain expenses had not been reduced during the applicable periods shown.
E Fees and expenses of any underlying Fidelity Central Funds are not included in the Fund's expense ratio. The Fund indirectly bears its proportionate share of the expenses of any underlying Fidelity Central Funds.
F Expense ratios reflect operating expenses of the class. Expenses before reductions do not reflect amounts reimbursed by the investment adviser or reductions from brokerage service arrangements or reductions from other expense offset arrangements and do not represent the amount paid by the class during periods when reimbursements or reductions occur. Expenses net of fee waivers reflect expenses after reimbursement by the investment adviser but prior to reductions from brokerage service arrangements or other expense offset arrangements. Expenses net of all reductions represent the net expenses paid by the class.
G Annualized
H Amount does not include the portfolio activity of any underlying Fidelity Central Funds.
See accompanying notes which are an integral part of the financial statements.
Notes to Financial Statements (Unaudited)
For the period ended January 31, 2016
1. Organization.
Fidelity Advisor Health Care Fund (the Fund) is a fund of Fidelity Advisor Series VII (the Trust) and is authorized to issue an unlimited number of shares. The Trust is registered under the Investment Company Act of 1940, as amended (the 1940 Act), as an open-end management investment company organized as a Massachusetts business trust. The Fund offers Class A, Class T, Class C and Class I shares, each of which, along with Class B shares, has equal rights as to assets and voting privileges. Class B shares are closed to new accounts and additional purchases, except for exchanges and reinvestments. Each class has exclusive voting rights with respect to matters that affect that class. Class B shares will automatically convert to Class A shares after a holding period of seven years from the initial date of purchase.
During the period, the Board of Trustees approved the conversion of all existing Class B shares into Class A shares, effective on or about July 1, 2016, regardless of the length of times shares have been held.
2. Investments in Fidelity Central Funds.
The Fund invests in Fidelity Central Funds, which are open-end investment companies generally available only to other investment companies and accounts managed by the investment adviser and its affiliates. The Fund's Schedule of Investments lists each of the Fidelity Central Funds held as of period end, if an, as an investment of the Fund, but does not include the underlying holdings of each Fidelity Central Fund. As an Investing Fund, the Fund indirectly bears its proportionate share of the expenses of the underlying Fidelity Central Funds.
The Money Market Central Funds seek preservation of capital and current income and are managed by Fidelity Investments Money Management, Inc. (FIMM), an affiliate of the investment adviser. Annualized expenses of the Money Market Central Funds as of their most recent shareholder report date are less than .005%.
A complete unaudited list of holdings for each Fidelity Central Fund is available upon request or at the Securities and Exchange Commission (the SEC) website at www.sec.gov. In addition, the financial statements of the Fidelity Central Funds are available on the SEC website or upon request.
3. Significant Accounting Policies.
The financial statements have been prepared in conformity with accounting principles generally accepted in the United States of America (GAAP), which require management to make certain estimates and assumptions at the date of the financial statements. Actual results could differ from those estimates. Subsequent events, if any, through the date that the financial statements were issued have been evaluated in the preparation of the financial statements. The following summarizes the significant accounting policies of the Fund:
Investment Valuation. Investments are valued as of 4:00 p.m. Eastern time on the last calendar day of the period. The Board of Trustees (the Board) has delegated the day to day responsibility for the valuation of the Fund's investments to the Fidelity SelectCo, LLC (SelectCo) Fair Value Committee (the Committee). In accordance with valuation policies and procedures approved by the Board, the Fund attempts to obtain prices from one or more third party pricing vendors or brokers to value its investments. When current market prices, quotations or currency exchange rates are not readily available or reliable, investments will be fair valued in good faith by the Committee, in accordance with procedures adopted by the Board. Factors used in determining fair value vary by investment type and may include market or investment specific events. The frequency with which these procedures are used cannot be predicted and they may be utilized to a significant extent. The Committee oversees the Fund's valuation policies and procedures and reports to the Board on the Committee's activities and fair value determinations. The Board monitors the appropriateness of the procedures used in valuing the Fund's investments and ratifies the fair value determinations of the Committee.
The Fund categorizes the inputs to valuation techniques used to value its investments into a disclosure hierarchy consisting of three levels as shown below:
- Level 1 – quoted prices in active markets for identical investments
- Level 2 – other significant observable inputs (including quoted prices for similar investments, interest rates, prepayment speeds, etc.)
- Level 3 – unobservable inputs (including the Fund's own assumptions based on the best information available)
Valuation techniques used to value the Fund's investments by major category are as follows:
Equity securities, including restricted securities, for which market quotations are readily available, are valued at the last reported sale price or official closing price as reported by a third party pricing vendor on the primary market or exchange on which they are traded and are categorized as Level 1 in the hierarchy. In the event there were no sales during the day or closing prices are not available, securities are valued at the last quoted bid price or may be valued using the last available price and are generally categorized as Level 2 in the hierarchy. For foreign equity securities, when market or security specific events arise, comparisons to the valuation of American Depositary Receipts (ADRs), futures contracts, Exchange-Traded Funds (ETFs) and certain indexes as well as quoted prices for similar securities may be used and would be categorized as Level 2 in the hierarchy. Utilizing these techniques may result in transfers between Level 1 and Level 2. For equity securities, including restricted securities, where observable inputs are limited, assumptions about market activity and risk are used and these securities may be categorized as Level 3 in the hierarchy.
Investments in open-end mutual funds, including the Fidelity Central Funds, are valued at their closing net asset value (NAV) each business day and are categorized as Level 1 in the hierarchy.
Changes in valuation techniques may result in transfers in or out of an assigned level within the disclosure hierarchy. The aggregate value of investments by input level as of January 31, 2016, including information on transfers between Levels 1 and 2 is included at the end of the Fund's Schedule of Investments.
Foreign Currency. The Fund may use foreign currency contracts to facilitate transactions in foreign-denominated securities. Gains and losses from these transactions may arise from changes in the value of the foreign currency or if the counterparties do not perform under the contracts' terms.
Foreign-denominated assets, including investment securities, and liabilities are translated into U.S. dollars at the exchange rates at period end. Purchases and sales of investment securities, income and dividends received and expenses denominated in foreign currencies are translated into U.S. dollars at the exchange rate in effect on the transaction date.
The effects of exchange rate fluctuations on investments are included with the net realized and unrealized gain (loss) on investment securities. Other foreign currency transactions resulting in realized and unrealized gain (loss) are disclosed separately.
Investment Transactions and Income. For financial reporting purposes, the Fund's investment holdings and NAV include trades executed through the end of the last business day of the period. The NAV per share for processing shareholder transactions is calculated as of the close of business of the New York Stock Exchange (NYSE), normally 4:00 p.m. Eastern time and includes trades executed through the end of the prior business day. Gains and losses on securities sold are determined on the basis of identified cost and may include proceeds received from litigation. Dividend income is recorded on the ex-dividend date, except for certain dividends from foreign securities where the ex-dividend date may have passed, which are recorded as soon as the Fund is informed of the ex-dividend date. Non-cash dividends included in dividend income, if any, are recorded at the fair market value of the securities received. Income and capital gain distributions from Fidelity Central Funds, if any, are recorded on the ex-dividend date. Distributions received on securities that represent a return of capital or capital gain are recorded as a reduction of cost of investments and/or as a realized gain. Subsequent to ex-dividend date the Fund determines the components of these distributions, based upon receipt of tax filings or other correspondence relating to the underlying investment. Interest income is accrued as earned and includes coupon interest and amortization of premium and accretion of discount on debt securities as applicable. Investment income is recorded net of foreign taxes withheld where recovery of such taxes is uncertain.
Class Allocations and Expenses. Investment income, realized and unrealized capital gains and losses, common expenses of the Fund, and certain fund-level expense reductions, if any, are allocated daily on a pro-rata basis to each class based on the relative net assets of each class to the total net assets of the Fund. Each class differs with respect to transfer agent and distribution and service plan fees incurred. Certain expense reductions may also differ by class. For the reporting period, the allocated portion of income and expenses to each class as a percent of its average net assets may vary due to the timing of recording these transactions in relation to fluctuating net assets of the classes. Expenses directly attributable to a fund are charged to that fund. Expenses attributable to more than one fund are allocated among the respective funds on the basis of relative net assets or other appropriate methods. Expense estimates are accrued in the period to which they relate and adjustments are made when actual amounts are known.
Income Tax Information and Distributions to Shareholders. Each year, the Fund intends to qualify as a regulated investment company under Subchapter M of the Internal Revenue Code, including distributing substantially all of its taxable income and realized gains. As a result, no provision for U.S. Federal income taxes is required. The Fund files a U.S. federal tax return, in addition to state and local tax returns as required. The Fund's federal income tax returns are subject to examination by the Internal Revenue Service (IRS) for a period of three fiscal years after they are filed. State and local tax returns may be subject to examination for an additional fiscal year depending on the jurisdiction. Foreign taxes are provided for based on the Fund's understanding of the tax rules and rates that exist in the foreign markets in which it invests.
Distributions are declared and recorded on the ex-dividend date. Income dividends and capital gain distributions are declared separately for each class. Income and capital gain distributions are determined in accordance with income tax regulations, which may differ from GAAP.
Capital accounts within the financial statements are adjusted for permanent book-tax differences. These adjustments have no impact on net assets or the results of operations. Capital accounts are not adjusted for temporary book-tax differences which will reverse in a subsequent period.
Book-tax differences are primarily due to foreign currency transactions, deferred trustees compensation, net operating losses and losses deferred due to wash sales and excise tax regulations.
The federal tax cost of investment securities and unrealized appreciation (depreciation) as of period end were as follows:
| Gross unrealized appreciation | $314,885,092 |
| Gross unrealized depreciation | (301,895,585) |
| Net unrealized appreciation (depreciation) on securities | $12,989,507 |
| Tax cost | $2,659,353,549 |
Short-Term Trading (Redemption) Fees. Shares held by investors in the Fund less than 30 days may have been subject to a redemption fee equal to .75% of the NAV of shares redeemed. All redemption fees, which reduce the proceeds of the shareholder redemption, are retained by the Fund and accounted for as an addition to paid in capital.
Restricted Securities. The Fund may invest in securities that are subject to legal or contractual restrictions on resale. These securities generally may be resold in transactions exempt from registration or to the public if the securities are registered. Disposal of these securities may involve time-consuming negotiations and expense, and prompt sale at an acceptable price may be difficult. Information regarding restricted securities is included at the end of the Fund's Schedule of Investments.
4. Purchases and Sales of Investments.
Purchases and sales of securities, other than short-term securities, aggregated $1,083,265,592 and $1,045,744,946, respectively.
5. Fees and Other Transactions with Affiliates.
Management Fee. Fidelity SelectCo, LLC (the investment adviser) and its affiliates provide the Fund with investment management related services for which the Fund pays a monthly management fee. The management fee is the sum of an individual fund fee rate that is based on an annual rate of .30% of the Fund's average net assets and an annualized group fee rate that averaged .25% during the period. The group fee rate is based upon the average net assets of all the mutual funds advised by Fidelity Management & Research Company (FMR) and the investment adviser. The group fee rate decreases as assets under management increase and increases as assets under management decrease. For the reporting period, the total annualized management fee rate was .55% of the Fund's average net assets.
Distribution and Service Plan Fees. In accordance with Rule 12b-1 of the 1940 Act, the Fund has adopted separate Distribution and Service Plans for each class of shares. Certain classes pay Fidelity Distributors Corporation (FDC), an affiliate of the investment adviser, separate Distribution and Service Fees, each of which is based on an annual percentage of each class' average net assets. In addition, FDC may pay financial intermediaries for selling shares of the Fund and providing shareholder support services. For the period, the Distribution and Service Fee rates, total fees and amounts retained by FDC were as follows:
| | Distribution
Fee | Service
Fee | Total Fees | Retained
by FDC |
| Class A | -% | .25% | $1,575,283 | $– |
| Class T | .25% | .25% | 778,504 | – |
| Class B | .75% | .25% | 50,075 | 37,556 |
| Class C | .75% | .25% | 3,598,104 | 1,634,490 |
| | | | $6,001,966 | $1,672,046 |
Sales Load. FDC may receive a front-end sales charge of up to 5.75% for selling Class A shares and 3.50% for selling Class T shares, some of which is paid to financial intermediaries for selling shares of the Fund. Depending on the holding period, FDC may receive contingent deferred sales charges levied on Class A, Class T, Class B, and Class C redemptions. The deferred sales charges range from 5.00% to 1.00% for Class B shares, 1.00% for Class C shares, 1.00% for certain purchases of Class A shares and .25% for certain purchases of Class T shares.
For the period, sales charge amounts retained by FDC were as follows:
| | Retained
by FDC |
| Class A | $526,259 |
| Class T | 60,160 |
| Class B(a) | 284 |
| Class C(a) | 120,995 |
| | $707,698 |
(a) When Class B and Class C shares are initially sold, FDC pays commissions from its own resources to financial intermediaries through which the sales are made.
Transfer Agent Fees. Fidelity Investments Institutional Operations Company, Inc., (FIIOC), an affiliate of the investment adviser, is the transfer, dividend disbursing and shareholder servicing agent for each class of the Fund. FIIOC receives account fees and asset-based fees that vary according to the account size and type of account of the shareholders of the respective classes of the Fund. FIIOC pays for typesetting, printing and mailing of shareholder reports, except proxy statements.
For the period, transfer agent fees for each class were as follows:
| | Amount | % of
Class-Level Average
Net Assets(a) |
| Class A | $1,245,810 | .20 |
| Class T | 335,870 | .22 |
| Class B | 13,695 | .27 |
| Class C | 722,414 | .20 |
| Class I | 690,919 | .19 |
| | $3,008,708 | |
(a) Annualized
Accounting and Security Lending Fees. Fidelity Service Company, Inc. (FSC), an affiliate of the investment adviser, maintains the Fund's accounting records. The accounting fee is based on the level of average net assets for each month. Under a separate contract, FSC administers the security lending program. The security lending fee is based on the number and duration of lending transactions.
Brokerage Commissions. The Fund placed a portion of its portfolio transactions with brokerage firms which are affiliates of the investment adviser. Brokerage commissions are included in net realized gain (loss) and change in net unrealized appreciation (depreciation) in the Statement of Operations. The commissions paid to these affiliated firms were $20,755 for the period.
Interfund Lending Program. Pursuant to an Exemptive Order issued by the SEC, the Fund, along with other registered investment companies having management contracts with FMR or other affiliated entities of FMR, may participate in an interfund lending program. This program provides an alternative credit facility allowing the funds to borrow from, or lend money to, other participating affiliated funds. At period end, there were no interfund loans outstanding. The Fund's activity in this program during the period for which loans were outstanding was as follows:
| Borrower or Lender | Average Loan Balance | Weighted Average Interest Rate | Interest Expense |
| Borrower | $20,250,800 | .63% | $1,775 |
Interfund Trades. The Fund may purchase from or sell securities to other Fidelity Funds under procedures adopted by the Board. The procedures have been designed to ensure these interfund trades are executed in accordance with Rule 17a-7 of the 1940 Act. Interfund trades are included within the respective purchases and sales amounts shown in the Purchases and Sales of Investments note.
6. Committed Line of Credit.
The Fund participates with other funds managed by the investment adviser or an affiliate in a $4.25 billion credit facility (the "line of credit") to be utilized for temporary or emergency purposes to fund shareholder redemptions or for other short-term liquidity purposes. The Fund has agreed to pay commitment fees on its pro-rata portion of the line of credit, which amounted to $2,058 and is reflected in Miscellaneous expenses on the Statement of Operations. During the period, the Fund did not borrow on this line of credit.
7. Security Lending.
The Fund lends portfolio securities through a lending agent from time to time in order to earn additional income. On the settlement date of the loan, the Fund receives collateral (in the form of U.S. Treasury obligations, letters of credit and/or cash) against the loaned securities and maintains collateral in an amount not less than 100% of the market value of the loaned securities during the period of the loan. The market value of the loaned securities is determined at the close of business of the Fund and any additional required collateral is delivered to the Fund on the next business day. The Fund or borrower may terminate the loan at any time, and if the borrower defaults on its obligation to return the securities loaned because of insolvency or other reasons, the Fund may apply collateral received from the borrower against the obligation. The Fund may experience delays and costs in recovering the securities loaned. Any cash collateral received is invested in the Fidelity Securities Lending Cash Central Fund. The value of loaned securities and cash collateral at period end are disclosed on the Fund's Statement of Assets and Liabilities. Security lending income represents the income earned on investing cash collateral, less rebates paid to borrowers and any lending agent fees associated with the loan, plus any premium payments received for lending certain types of securities. Security lending income is presented in the Statement of Operations as a component of income from Fidelity Central Funds. Total security lending income during the period amounted to $173,746.
8. Expense Reductions.
Commissions paid to certain brokers with whom the investment adviser, or its affiliates, places trades on behalf of the Fund include an amount in addition to trade execution, which may be rebated back to the Fund to offset certain expenses. This amount totaled $34,057 for the period. In addition, through arrangements with the Fund's custodian, credits realized as a result of certain uninvested cash balances were used to reduce the Fund's expenses. During the period, these credits reduced the Fund's custody expenses by $52.
In addition, during the period the investment adviser reimbursed and/or waived a portion of fund-level operating expenses in the amount of $10,923.
9. Distributions to Shareholders.
Distributions to shareholders of each class were as follows:
| | Six months ended January 31, 2016 | Year ended July 31, 2015 |
| From net realized gain | | |
| Class A | $80,223,535 | $79,203,094 |
| Class T | 20,669,994 | 27,289,653 |
| Class B | 758,774 | 1,660,970 |
| Class C | 52,885,499 | 39,451,396 |
| Class I | 45,759,042 | 41,061,480 |
| Total | $200,296,844 | $188,666,593 |
10. Share Transactions.
Share transactions for each class were as follows and may contain automatic conversions between classes or exchanges between affiliated funds:
| | Shares | Shares | Dollars | Dollars |
| | Six months ended January 31, 2016 | Year ended July 31, 2015 | Six months ended January 31, 2016 | Year ended July 31, 2015 |
| Class A | | | | |
| Shares sold | 6,167,784 | 16,613,714 | $240,057,288 | $685,795,856 |
| Reinvestment of distributions | 1,936,618 | 1,907,379 | 75,411,924 | 71,987,733 |
| Shares redeemed | (5,139,089) | (4,365,455) | (194,239,025) | (177,799,342) |
| Net increase (decrease) | 2,965,313 | 14,155,638 | $121,230,187 | $579,984,247 |
| Class T | | | | |
| Shares sold | 893,590 | 2,292,430 | $32,521,292 | $89,470,281 |
| Reinvestment of distributions | 545,495 | 737,547 | 20,019,680 | 26,321,410 |
| Shares redeemed | (930,246) | (905,351) | (32,765,322) | (35,007,523) |
| Net increase (decrease) | 508,839 | 2,124,626 | $19,775,650 | $80,784,168 |
| Class B | | | | |
| Shares sold | 13,031 | 49,985 | $424,415 | $1,711,713 |
| Reinvestment of distributions | 22,031 | 47,751 | 711,834 | 1,514,650 |
| Shares redeemed | (101,669) | (172,141) | (3,212,121) | (5,890,995) |
| Net increase (decrease) | (66,607) | (74,405) | $(2,075,872) | $(2,664,632) |
| Class C | | | | |
| Shares sold | 4,687,635 | 12,628,362 | $149,930,726 | $437,473,337 |
| Reinvestment of distributions | 1,474,771 | 1,088,220 | 47,059,934 | 34,383,515 |
| Shares redeemed | (2,875,954) | (1,445,818) | (87,839,368) | (49,753,436) |
| Net increase (decrease) | 3,286,452 | 12,270,764 | $109,151,292 | $422,103,416 |
| Class I | | | | |
| Shares sold | 5,178,904 | 13,587,551 | $215,580,442 | $597,091,181 |
| Reinvestment of distributions | 979,448 | 926,189 | 41,117,225 | 37,490,066 |
| Shares redeemed | (7,564,319) | (4,637,021) | (307,930,014) | (204,139,010) |
| Net increase (decrease) | (1,405,967) | 9,876,719 | $(51,232,347) | $430,442,237 |
11. Other.
The Fund's organizational documents provide former and current trustees and officers with a limited indemnification against liabilities arising in connection with the performance of their duties to the Fund. In the normal course of business, the Fund may also enter into contracts that provide general indemnifications. The Fund's maximum exposure under these arrangements is unknown as this would be dependent on future claims that may be made against the Fund. The risk of material loss from such claims is considered remote.
Fidelity Advisor® Industrials Fund
Investment Summary (Unaudited)
Top Ten Stocks as of January 31, 2016
| | % of fund's net assets | % of fund's net assets 6 months ago |
| General Electric Co. | 14.9 | 12.1 |
| Danaher Corp. | 7.0 | 7.7 |
| J.B. Hunt Transport Services, Inc. | 5.4 | 5.4 |
| Honeywell International, Inc. | 5.2 | 4.0 |
| United Technologies Corp. | 4.5 | 5.8 |
| General Dynamics Corp. | 4.4 | 2.7 |
| Southwest Airlines Co. | 4.2 | 0.0 |
| Raytheon Co. | 4.1 | 2.9 |
| AECOM | 3.9 | 2.7 |
| Northrop Grumman Corp. | 2.8 | 0.0 |
| | 56.4 | |
Top Industries (% of fund's net assets)
| As of January 31, 2016 |
| | Aerospace & Defense | 30.3% |
| | Industrial Conglomerates | 21.9% |
| | Road & Rail | 6.4% |
| | Machinery | 5.4% |
| | Trading Companies & Distributors | 5.1% |
| | All Others* | 30.9% |

| As of July 31, 2015 |
| | Aerospace & Defense | 26.4% |
| | Industrial Conglomerates | 19.8% |
| | Road & Rail | 10.3% |
| | Electrical Equipment | 7.1% |
| | Machinery | 6.7% |
| | All Others* | 29.7% |
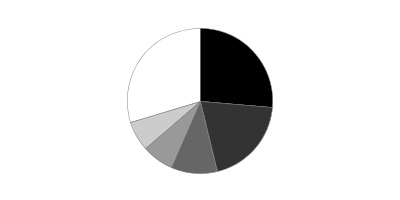
* Includes Short-Term investments and Net Other Assets (Liabilities).
Percentages shown as 0.0% may reflect amounts less than 0.05%.
Fidelity Advisor® Industrials Fund
Investments January 31, 2016 (Unaudited)
Showing Percentage of Net Assets
| Common Stocks - 98.8% | | | |
| | | Shares | Value |
| Aerospace & Defense - 30.3% | | | |
| Aerospace & Defense - 30.3% | | | |
| BWX Technologies, Inc. | | 340,500 | $10,194,570 |
| General Dynamics Corp. | | 187,462 | 25,076,792 |
| Honeywell International, Inc. | | 292,933 | 30,230,686 |
| Northrop Grumman Corp. | | 86,800 | 16,063,208 |
| Orbital ATK, Inc. | | 126,669 | 11,429,344 |
| Raytheon Co. | | 183,700 | 23,557,688 |
| Rockwell Collins, Inc. | | 103,500 | 8,371,080 |
| Teledyne Technologies, Inc. (a) | | 156,965 | 12,753,406 |
| Textron, Inc. | | 323,978 | 11,086,527 |
| United Technologies Corp. | | 296,151 | 25,969,481 |
| | | | 174,732,782 |
| Air Freight & Logistics - 4.2% | | | |
| Air Freight & Logistics - 4.2% | | | |
| C.H. Robinson Worldwide, Inc. | | 134,800 | 8,730,996 |
| FedEx Corp. | | 115,232 | 15,312,028 |
| | | | 24,043,024 |
| Airlines - 4.2% | | | |
| Airlines - 4.2% | | | |
| Southwest Airlines Co. | | 642,400 | 24,167,088 |
| Building Products - 4.2% | | | |
| Building Products - 4.2% | | | |
| A.O. Smith Corp. | | 201,242 | 14,056,754 |
| Caesarstone Sdot-Yam Ltd. (a) | | 60,392 | 2,270,135 |
| Lennox International, Inc. | | 63,804 | 7,644,995 |
| | | | 23,971,884 |
| Commercial Services & Supplies - 4.0% | | | |
| Commercial Printing - 0.7% | | | |
| Deluxe Corp. | | 72,000 | 4,024,800 |
| Environmental & Facility Services - 1.0% | | | |
| Stericycle, Inc. (a) | | 49,100 | 5,909,185 |
| Office Services & Supplies - 2.3% | | | |
| Regus PLC | | 1,055,300 | 4,461,076 |
| West Corp. | | 490,532 | 8,883,535 |
| | | | 13,344,611 |
|
| TOTAL COMMERCIAL SERVICES & SUPPLIES | | | 23,278,596 |
|
| Construction & Engineering - 3.9% | | | |
| Construction & Engineering - 3.9% | | | |
| AECOM (a) | | 807,721 | 22,163,864 |
| Diversified Consumer Services - 1.6% | | | |
| Specialized Consumer Services - 1.6% | | | |
| ServiceMaster Global Holdings, Inc. (a) | | 222,000 | 9,370,620 |
| Electrical Equipment - 4.6% | | | |
| Electrical Components & Equipment - 4.6% | | | |
| AMETEK, Inc. | | 253,800 | 11,941,290 |
| Eaton Corp. PLC | | 292,500 | 14,774,175 |
| | | | 26,715,465 |
| Energy Equipment & Services - 0.1% | | | |
| Oil & Gas Equipment & Services - 0.1% | | | |
| Aspen Aerogels, Inc. (a) | | 140,385 | 612,079 |
| Industrial Conglomerates - 21.9% | | | |
| Industrial Conglomerates - 21.9% | | | |
| Danaher Corp. | | 463,232 | 40,139,053 |
| General Electric Co. | | 2,946,848 | 85,753,276 |
| | | | 125,892,329 |
| Machinery - 5.4% | | | |
| Construction Machinery & Heavy Trucks - 1.3% | | | |
| Wabtec Corp. | | 114,600 | 7,328,670 |
| Industrial Machinery - 4.1% | | | |
| IDEX Corp. | | 178,529 | 12,945,138 |
| Ingersoll-Rand PLC | | 211,400 | 10,880,758 |
| | | | 23,825,896 |
|
| TOTAL MACHINERY | | | 31,154,566 |
|
| Professional Services - 2.9% | | | |
| Research & Consulting Services - 2.9% | | | |
| CEB, Inc. | | 113,054 | 6,667,925 |
| Verisk Analytics, Inc. (a) | | 140,944 | 10,288,912 |
| | | | 16,956,837 |
| Road & Rail - 6.4% | | | |
| Trucking - 6.4% | | | |
| J.B. Hunt Transport Services, Inc. | | 429,184 | 31,201,677 |
| Old Dominion Freight Lines, Inc. (a) | | 100,200 | 5,493,966 |
| | | | 36,695,643 |
| Trading Companies & Distributors - 5.1% | | | |
| Trading Companies & Distributors - 5.1% | | | |
| AerCap Holdings NV (a) | | 358,800 | 11,018,748 |
| HD Supply Holdings, Inc. (a) | | 534,306 | 14,036,219 |
| Wolseley PLC | | 86,148 | 4,273,515 |
| | | | 29,328,482 |
| TOTAL COMMON STOCKS | | | |
| (Cost $524,440,761) | | | 569,083,259 |
|
| Money Market Funds - 1.8% | | | |
| Fidelity Cash Central Fund, 0.38% (b) | | | |
| (Cost $10,414,512) | | 10,414,512 | 10,414,512 |
| TOTAL INVESTMENT PORTFOLIO - 100.6% | | | |
| (Cost $534,855,273) | | | 579,497,771 |
| NET OTHER ASSETS (LIABILITIES) - (0.6)% | | | (3,698,289) |
| NET ASSETS - 100% | | | $575,799,482 |
Legend
(a) Non-income producing
(b) Affiliated fund that is generally available only to investment companies and other accounts managed by Fidelity Investments. The rate quoted is the annualized seven-day yield of the fund at period end. A complete unaudited listing of the fund's holdings as of its most recent quarter end is available upon request. In addition, each Fidelity Central Fund's financial statements are available on the SEC's website or upon request.
Affiliated Central Funds
Information regarding fiscal year to date income earned by the Fund from investments in Fidelity Central Funds is as follows:
| Fund | Income earned |
| Fidelity Cash Central Fund | $3,825 |
| Fidelity Securities Lending Cash Central Fund | 2,285 |
| Total | $6,110 |
Investment Valuation
The following is a summary of the inputs used, as of January 31, 2016, involving the Fund's assets and liabilities carried at fair value. The inputs or methodology used for valuing securities may not be an indication of the risk associated with investing in those securities. For more information on valuation inputs, and their aggregation into the levels used below, please refer to the Investment Valuation section in the accompanying Notes to Financial Statements.
| | Valuation Inputs at Reporting Date: |
| Description | Total | Level 1 | Level 2 | Level 3 |
| Investments in Securities: | | | | |
| Common Stocks | $569,083,259 | $560,348,668 | $8,734,591 | $-- |
| Money Market Funds | 10,414,512 | 10,414,512 | -- | -- |
| Total Investments in Securities: | $579,497,771 | $570,763,180 | $8,734,591 | $-- |
See accompanying notes which are an integral part of the financial statements.
Fidelity Advisor® Industrials Fund
Financial Statements
Statement of Assets and Liabilities
| | | January 31, 2016 (Unaudited) |
| Assets | | |
Investment in securities, at value — See accompanying schedule:
Unaffiliated issuers (cost $524,440,761) | $569,083,259 | |
| Fidelity Central Funds (cost $10,414,512) | 10,414,512 | |
| Total Investments (cost $534,855,273) | | $579,497,771 |
| Receivable for investments sold | | 2,642,135 |
| Receivable for fund shares sold | | 515,617 |
| Dividends receivable | | 284,663 |
| Distributions receivable from Fidelity Central Funds | | 1,280 |
| Prepaid expenses | | 3,197 |
| Other receivables | | 5,579 |
| Total assets | | 582,950,242 |
| Liabilities | | |
| Payable for investments purchased | $4,724,816 | |
| Payable for fund shares redeemed | 1,818,662 | |
| Accrued management fee | 268,942 | |
| Distribution and service plan fees payable | 180,556 | |
| Other affiliated payables | 128,521 | |
| Other payables and accrued expenses | 29,263 | |
| Total liabilities | | 7,150,760 |
| Net Assets | | $575,799,482 |
| Net Assets consist of: | | |
| Paid in capital | | $525,172,017 |
| Distributions in excess of net investment income | | (252,463) |
| Accumulated undistributed net realized gain (loss) on investments and foreign currency transactions | | 6,239,022 |
| Net unrealized appreciation (depreciation) on investments and assets and liabilities in foreign currencies | | 44,640,906 |
| Net Assets | | $575,799,482 |
| Calculation of Maximum Offering Price | | |
| Class A: | | |
| Net Asset Value and redemption price per share ($261,929,038 ÷ 8,515,940 shares) | | $30.76 |
| Maximum offering price per share (100/94.25 of $30.76) | | $32.64 |
| Class T: | | |
| Net Asset Value and redemption price per share ($72,848,359 ÷ 2,416,023 shares) | | $30.15 |
| Maximum offering price per share (100/96.50 of $30.15) | | $31.24 |
| Class B: | | |
| Net Asset Value and offering price per share ($4,053,361 ÷ 146,061 shares)(a) | | $27.75 |
| Class C: | | |
| Net Asset Value and offering price per share ($107,545,474 ÷ 3,837,703 shares)(a) | | $28.02 |
| Class I: | | |
| Net Asset Value, offering price and redemption price per share ($129,423,250 ÷ 4,022,052 shares) | | $32.18 |
(a) Redemption price per share is equal to net asset value less any applicable contingent deferred sales charge.
See accompanying notes which are an integral part of the financial statements.
Statement of Operations
| | | Six months ended January 31, 2016 (Unaudited) |
| Investment Income | | |
| Dividends | | $5,021,437 |
| Income from Fidelity Central Funds | | 6,110 |
| Total income | | 5,027,547 |
| Expenses | | |
| Management fee | $1,847,226 | |
| Transfer agent fees | 681,194 | |
| Distribution and service plan fees | 1,215,474 | |
| Accounting and security lending fees | 121,397 | |
| Custodian fees and expenses | 7,533 | |
| Independent trustees' compensation | 6,473 | |
| Registration fees | 52,460 | |
| Audit | 23,031 | |
| Legal | 3,791 | |
| Interest | 193 | |
| Miscellaneous | 3,957 | |
| Total expenses before reductions | 3,962,729 | |
| Expense reductions | (13,498) | 3,949,231 |
| Net investment income (loss) | | 1,078,316 |
| Realized and Unrealized Gain (Loss) | | |
| Net realized gain (loss) on: | | |
| Investment securities: | | |
| Unaffiliated issuers | 12,625,704 | |
| Foreign currency transactions | 2,943 | |
| Total net realized gain (loss) | | 12,628,647 |
Change in net unrealized appreciation (depreciation) on:
Investment securities | (79,027,194) | |
| Assets and liabilities in foreign currencies | (1,117) | |
| Total change in net unrealized appreciation (depreciation) | | (79,028,311) |
| Net gain (loss) | | (66,399,664) |
| Net increase (decrease) in net assets resulting from operations | | $(65,321,348) |
See accompanying notes which are an integral part of the financial statements.
Statement of Changes in Net Assets
| | Six months ended January 31, 2016 (Unaudited) | Year ended July 31, 2015 |
| Increase (Decrease) in Net Assets | | |
| Operations | | |
| Net investment income (loss) | $1,078,316 | $3,071,370 |
| Net realized gain (loss) | 12,628,647 | 72,042,724 |
| Change in net unrealized appreciation (depreciation) | (79,028,311) | (8,021,862) |
| Net increase (decrease) in net assets resulting from operations | (65,321,348) | 67,092,232 |
| Distributions to shareholders from net investment income | (2,537,760) | (2,601,876) |
| Distributions to shareholders from net realized gain | (58,090,566) | (62,327,818) |
| Total distributions | (60,628,326) | (64,929,694) |
| Share transactions - net increase (decrease) | (75,434,336) | (97,329,347) |
| Redemption fees | 8,062 | 26,890 |
| Total increase (decrease) in net assets | (201,375,948) | (95,139,919) |
| Net Assets | | |
| Beginning of period | 777,175,430 | 872,315,349 |
| End of period (including distributions in excess of net investment income of $252,463 and undistributed net investment income of $1,206,981, respectively) | $575,799,482 | $777,175,430 |
See accompanying notes which are an integral part of the financial statements.
Financial Highlights — Fidelity Advisor Industrials Fund Class A
| | Six months ended (Unaudited) | Years ended July 31, | | | | |
| January 31, | 2016 | 2015 | 2014 | 2013 | 2012 | 2011 |
| Selected Per–Share Data | | | | | | |
| Net asset value, beginning of period | $37.06 | $36.92 | $34.50 | $26.18 | $25.73 | $21.54 |
| Income from Investment Operations | | | | | | |
| Net investment income (loss)A | .07 | .17 | .13 | .23 | .20 | .09 |
| Net realized and unrealized gain (loss) | (3.34) | 2.76 | 4.01 | 8.33 | .61 | 4.13 |
| Total from investment operations | (3.27) | 2.93 | 4.14 | 8.56 | .81 | 4.22 |
| Distributions from net investment income | (.14) | (.11) | (.15) | (.24) | (.11) | (.03) |
| Distributions from net realized gain | (2.89) | (2.68) | (1.58) | – | (.25) | – |
| Total distributions | (3.03) | (2.79) | (1.72)B | (.24) | (.36) | (.03) |
| Redemption fees added to paid in capitalA,C | – | – | – | – | – | – |
| Net asset value, end of period | $30.76 | $37.06 | $36.92 | $34.50 | $26.18 | $25.73 |
| Total ReturnD,E,F | (9.04)% | 8.17% | 12.52% | 32.92% | 3.42% | 19.59% |
| Ratios to Average Net AssetsG,H | | | | | | |
| Expenses before reductions | 1.07%I | 1.06% | 1.09% | 1.11% | 1.14% | 1.13% |
| Expenses net of fee waivers, if any | 1.07%I | 1.06% | 1.09% | 1.11% | 1.14% | 1.13% |
| Expenses net of all reductions | 1.06%I | 1.06% | 1.09% | 1.11% | 1.14% | 1.13% |
| Net investment income (loss) | .43%I | .46% | .37% | .77% | .80% | .36% |
| Supplemental Data | | | | | | |
| Net assets, end of period (000 omitted) | $261,929 | $333,405 | $378,826 | $271,512 | $192,038 | $228,106 |
| Portfolio turnover rateJ | 53%I | 70% | 57% | 78% | 82% | 75% |
A Calculated based on average shares outstanding during the period.
B Total distributions of $1.72 per share is comprised of distributions from net investment income of $.146 and distributions from net realized gain of $1.577 per share.
C Amount represents less than $.005 per share.
D Total returns for periods of less than one year are not annualized.
E Total returns would have been lower if certain expenses had not been reduced during the applicable periods shown.
F Total returns do not include the effect of the sales charges.
G Fees and expenses of any underlying Fidelity Central Funds are not included in the Fund's expense ratio. The Fund indirectly bears its proportionate share of the expenses of any underlying Fidelity Central Funds.
H Expense ratios reflect operating expenses of the class. Expenses before reductions do not reflect amounts reimbursed by the investment adviser or reductions from brokerage service arrangements or reductions from other expense offset arrangements and do not represent the amount paid by the class during periods when reimbursements or reductions occur. Expenses net of fee waivers reflect expenses after reimbursement by the investment adviser but prior to reductions from brokerage service arrangements or other expense offset arrangements. Expenses net of all reductions represent the net expenses paid by the class.
I Annualized
J Amount does not include the portfolio activity of any underlying Fidelity Central Funds.
See accompanying notes which are an integral part of the financial statements.
Financial Highlights — Fidelity Advisor Industrials Fund Class T
| | Six months ended (Unaudited) | Years ended July 31, | | | | |
| January 31, | 2016 | 2015 | 2014 | 2013 | 2012 | 2011 |
| Selected Per–Share Data | | | | | | |
| Net asset value, beginning of period | $36.35 | $36.29 | $33.93 | $25.75 | $25.33 | $21.24 |
| Income from Investment Operations | | | | | | |
| Net investment income (loss)A | .03 | .07 | .04 | .15 | .13 | .03 |
| Net realized and unrealized gain (loss) | (3.28) | 2.71 | 3.95 | 8.20 | .61 | 4.07 |
| Total from investment operations | (3.25) | 2.78 | 3.99 | 8.35 | .74 | 4.10 |
| Distributions from net investment income | (.06) | (.05) | (.06) | (.17) | (.07) | (.01) |
| Distributions from net realized gain | (2.89) | (2.67) | (1.58) | – | (.25) | – |
| Total distributions | (2.95) | (2.72) | (1.63)B | (.17) | (.32) | (.01) |
| Redemption fees added to paid in capitalA,C | – | – | – | – | – | – |
| Net asset value, end of period | $30.15 | $36.35 | $36.29 | $33.93 | $25.75 | $25.33 |
| Total ReturnD,E,F | (9.18)% | 7.88% | 12.27% | 32.60% | 3.15% | 19.28% |
| Ratios to Average Net AssetsG,H | | | | | | |
| Expenses before reductions | 1.33%I | 1.33% | 1.33% | 1.37% | 1.40% | 1.39% |
| Expenses net of fee waivers, if any | 1.33%I | 1.32% | 1.33% | 1.37% | 1.40% | 1.39% |
| Expenses net of all reductions | 1.33%I | 1.32% | 1.33% | 1.36% | 1.39% | 1.38% |
| Net investment income (loss) | .16%I | .20% | .12% | .52% | .54% | .10% |
| Supplemental Data | | | | | | |
| Net assets, end of period (000 omitted) | $72,848 | $88,116 | $90,509 | $79,172 | $63,954 | $71,542 |
| Portfolio turnover rateJ | 53%I | 70% | 57% | 78% | 82% | 75% |
A Calculated based on average shares outstanding during the period.
B Total distributions of $1.63 per share is comprised of distributions from net investment income of $.057 and distributions from net realized gain of $1.577 per share.
C Amount represents less than $.005 per share.
D Total returns for periods of less than one year are not annualized.
E Total returns would have been lower if certain expenses had not been reduced during the applicable periods shown.
F Total returns do not include the effect of the sales charges.
G Fees and expenses of any underlying Fidelity Central Funds are not included in the Fund's expense ratio. The Fund indirectly bears its proportionate share of the expenses of any underlying Fidelity Central Funds.
H Expense ratios reflect operating expenses of the class. Expenses before reductions do not reflect amounts reimbursed by the investment adviser or reductions from brokerage service arrangements or reductions from other expense offset arrangements and do not represent the amount paid by the class during periods when reimbursements or reductions occur. Expenses net of fee waivers reflect expenses after reimbursement by the investment adviser but prior to reductions from brokerage service arrangements or other expense offset arrangements. Expenses net of all reductions represent the net expenses paid by the class.
I Annualized
J Amount does not include the portfolio activity of any underlying Fidelity Central Funds.
See accompanying notes which are an integral part of the financial statements.
Financial Highlights — Fidelity Advisor Industrials Fund Class B
| | Six months ended (Unaudited) | Years ended July 31, | | | | |
| January 31, | 2016 | 2015 | 2014 | 2013 | 2012 | 2011 |
| Selected Per–Share Data | | | | | | |
| Net asset value, beginning of period | $33.72 | $34.02 | $31.97 | $24.29 | $23.99 | $20.22 |
| Income from Investment Operations | | | | | | |
| Net investment income (loss)A | (.05) | (.11) | (.14) | (.01) | –B | (.11) |
| Net realized and unrealized gain (loss) | (3.03) | 2.52 | 3.71 | 7.74 | .57 | 3.88 |
| Total from investment operations | (3.08) | 2.41 | 3.57 | 7.73 | .57 | 3.77 |
| Distributions from net investment income | – | (.03) | – | (.05) | (.02) | – |
| Distributions from net realized gain | (2.89) | (2.68) | (1.52) | – | (.25) | – |
| Total distributions | (2.89) | (2.71) | (1.52) | (.05) | (.27) | – |
| Redemption fees added to paid in capitalA,B | – | – | – | – | – | – |
| Net asset value, end of period | $27.75 | $33.72 | $34.02 | $31.97 | $24.29 | $23.99 |
| Total ReturnC,D,E | (9.39)% | 7.29% | 11.64% | 31.87% | 2.59% | 18.64% |
| Ratios to Average Net AssetsF,G | | | | | | |
| Expenses before reductions | 1.86%H | 1.86% | 1.88% | 1.92% | 1.94% | 1.93% |
| Expenses net of fee waivers, if any | 1.85%H | 1.85% | 1.88% | 1.92% | 1.94% | 1.93% |
| Expenses net of all reductions | 1.85%H | 1.85% | 1.87% | 1.91% | 1.94% | 1.93% |
| Net investment income (loss) | (.36)%H | (.33)% | (.42)% | (.04)% | - %I | (.44)% |
| Supplemental Data | | | | | | |
| Net assets, end of period (000 omitted) | $4,053 | $6,698 | $12,459 | $17,502 | $20,058 | $28,600 |
| Portfolio turnover rateJ | 53%H | 70% | 57% | 78% | 82% | 75% |
A Calculated based on average shares outstanding during the period.
B Amount represents less than $.005 per share.
C Total returns for periods of less than one year are not annualized.
D Total returns would have been lower if certain expenses had not been reduced during the applicable periods shown.
E Total returns do not include the effect of the contingent deferred sales charge.
F Fees and expenses of any underlying Fidelity Central Funds are not included in the Fund's expense ratio. The Fund indirectly bears its proportionate share of the expenses of any underlying Fidelity Central Funds.
G Expense ratios reflect operating expenses of the class. Expenses before reductions do not reflect amounts reimbursed by the investment adviser or reductions from brokerage service arrangements or reductions from other expense offset arrangements and do not represent the amount paid by the class during periods when reimbursements or reductions occur. Expenses net of fee waivers reflect expenses after reimbursement by the investment adviser but prior to reductions from brokerage service arrangements or other expense offset arrangements. Expenses net of all reductions represent the net expenses paid by the class.
H Annualized
I Amount represents less than .005%.
J Amount does not include the portfolio activity of any underlying Fidelity Central Funds.
See accompanying notes which are an integral part of the financial statements.
Financial Highlights — Fidelity Advisor Industrials Fund Class C
| | Six months ended (Unaudited) | Years ended July 31, | | | | |
| January 31, | 2016 | 2015 | 2014 | 2013 | 2012 | 2011 |
| Selected Per–Share Data | | | | | | |
| Net asset value, beginning of period | $34.02 | $34.13 | $32.08 | $24.38 | $24.07 | $20.28 |
| Income from Investment Operations | | | | | | |
| Net investment income (loss)A | (.05) | (.10) | (.13) | .01 | .01 | (.09) |
| Net realized and unrealized gain (loss) | (3.06) | 2.54 | 3.73 | 7.75 | .58 | 3.88 |
| Total from investment operations | (3.11) | 2.44 | 3.60 | 7.76 | .59 | 3.79 |
| Distributions from net investment income | – | – | – | (.06) | (.03) | – |
| Distributions from net realized gain | (2.89) | (2.55) | (1.55) | – | (.25) | – |
| Total distributions | (2.89) | (2.55) | (1.55) | (.06) | (.28) | – |
| Redemption fees added to paid in capitalA,B | – | – | – | – | – | – |
| Net asset value, end of period | $28.02 | $34.02 | $34.13 | $32.08 | $24.38 | $24.07 |
| Total ReturnC,D,E | (9.40)% | 7.36% | 11.71% | 31.90% | 2.67% | 18.69% |
| Ratios to Average Net AssetsF,G | | | | | | |
| Expenses before reductions | 1.82%H | 1.82% | 1.83% | 1.87% | 1.89% | 1.89% |
| Expenses net of fee waivers, if any | 1.82%H | 1.82% | 1.83% | 1.87% | 1.89% | 1.89% |
| Expenses net of all reductions | 1.81%H | 1.81% | 1.83% | 1.86% | 1.88% | 1.88% |
| Net investment income (loss) | (.32)%H | (.30)% | (.38)% | .02% | .05% | (.40)% |
| Supplemental Data | | | | | | |
| Net assets, end of period (000 omitted) | $107,545 | $141,494 | $147,749 | $89,893 | $66,289 | $72,673 |
| Portfolio turnover rateI | 53%H | 70% | 57% | 78% | 82% | 75% |
A Calculated based on average shares outstanding during the period.
B Amount represents less than $.005 per share.
C Total returns for periods of less than one year are not annualized.
D Total returns would have been lower if certain expenses had not been reduced during the applicable periods shown.
E Total returns do not include the effect of the contingent deferred sales charge.
F Fees and expenses of any underlying Fidelity Central Funds are not included in the Fund's expense ratio. The Fund indirectly bears its proportionate share of the expenses of any underlying Fidelity Central Funds.
G Expense ratios reflect operating expenses of the class. Expenses before reductions do not reflect amounts reimbursed by the investment adviser or reductions from brokerage service arrangements or reductions from other expense offset arrangements and do not represent the amount paid by the class during periods when reimbursements or reductions occur. Expenses net of fee waivers reflect expenses after reimbursement by the investment adviser but prior to reductions from brokerage service arrangements or other expense offset arrangements. Expenses net of all reductions represent the net expenses paid by the class.
H Annualized
I Amount does not include the portfolio activity of any underlying Fidelity Central Funds.
See accompanying notes which are an integral part of the financial statements.
Financial Highlights — Fidelity Advisor Industrials Fund Class I
| | Six months ended (Unaudited) | Years ended July 31, | | | | |
| January 31, | 2016 | 2015 | 2014 | 2013 | 2012 | 2011 |
| Selected Per–Share Data | | | | | | |
| Net asset value, beginning of period | $38.67 | $38.42 | $35.83 | $27.18 | $26.69 | $22.30 |
| Income from Investment Operations | | | | | | |
| Net investment income (loss)A | .12 | .28 | .25 | .33 | .28 | .17 |
| Net realized and unrealized gain (loss) | (3.48) | 2.87 | 4.16 | 8.64 | .63 | 4.28 |
| Total from investment operations | (3.36) | 3.15 | 4.41 | 8.97 | .91 | 4.45 |
| Distributions from net investment income | (.24) | (.22) | (.24) | (.32) | (.17) | (.06) |
| Distributions from net realized gain | (2.89) | (2.68) | (1.58) | – | (.25) | – |
| Total distributions | (3.13) | (2.90) | (1.82) | (.32) | (.42) | (.06) |
| Redemption fees added to paid in capitalA,B | – | – | – | – | – | – |
| Net asset value, end of period | $32.18 | $38.67 | $38.42 | $35.83 | $27.18 | $26.69 |
| Total ReturnC,D | (8.91)% | 8.45% | 12.82% | 33.28% | 3.72% | 19.95% |
| Ratios to Average Net AssetsE,F | | | | | | |
| Expenses before reductions | .80%G | .80% | .81% | .84% | .85% | .85% |
| Expenses net of fee waivers, if any | .80%G | .80% | .81% | .84% | .85% | .85% |
| Expenses net of all reductions | .79%G | .79% | .81% | .83% | .85% | .84% |
| Net investment income (loss) | .70%G | .72% | .64% | 1.04% | 1.08% | .65% |
| Supplemental Data | | | | | | |
| Net assets, end of period (000 omitted) | $129,423 | $207,462 | $242,772 | $84,780 | $42,850 | $68,323 |
| Portfolio turnover rateH | 53%G | 70% | 57% | 78% | 82% | 75% |
A Calculated based on average shares outstanding during the period.
B Amount represents less than $.005 per share.
C Total returns for periods of less than one year are not annualized.
D Total returns would have been lower if certain expenses had not been reduced during the applicable periods shown.
E Fees and expenses of any underlying Fidelity Central Funds are not included in the Fund's expense ratio. The Fund indirectly bears its proportionate share of the expenses of any underlying Fidelity Central Funds.
F Expense ratios reflect operating expenses of the class. Expenses before reductions do not reflect amounts reimbursed by the investment adviser or reductions from brokerage service arrangements or reductions from other expense offset arrangements and do not represent the amount paid by the class during periods when reimbursements or reductions occur. Expenses net of fee waivers reflect expenses after reimbursement by the investment adviser but prior to reductions from brokerage service arrangements or other expense offset arrangements. Expenses net of all reductions represent the net expenses paid by the class.
G Annualized
H Amount does not include the portfolio activity of any underlying Fidelity Central Funds.
See accompanying notes which are an integral part of the financial statements.
Notes to Financial Statements (Unaudited)
For the period ended January 31, 2016
1. Organization.
Fidelity Advisor Industrials Fund (the Fund) is a non-diversified fund of Fidelity Advisor Series VII (the Trust) and is authorized to issue an unlimited number of shares. The Trust is registered under the Investment Company Act of 1940, as amended (the 1940 Act), as an open-end management investment company organized as a Massachusetts business trust. The Fund offers Class A, Class T, Class C and Class I shares, each of which, along with Class B shares, has equal rights as to assets and voting privileges. Class B shares are closed to new accounts and additional purchases, except for exchanges and reinvestments. Each class has exclusive voting rights with respect to matters that affect that class. Class B shares will automatically convert to Class A shares after a holding period of seven years from the initial date of purchase.
During the period, the Board of Trustees approved the conversion of all existing Class B shares into Class A shares, effective on or about July 1, 2016, regardless of the length of times shares have been held.
2. Investments in Fidelity Central Funds.
The Fund invests in Fidelity Central Funds, which are open-end investment companies generally available only to other investment companies and accounts managed by the investment adviser and its affiliates. The Fund's Schedule of Investments lists each of the Fidelity Central Funds held as of period end, if any, as an investment of the Fund, but does not include the underlying holdings of each Fidelity Central Fund. As an Investing Fund, the Fund indirectly bears its proportionate share of the expenses of the underlying Fidelity Central Funds.
The Money Market Central Funds seek preservation of capital and current income and are managed by Fidelity Investments Money Management, Inc. (FIMM), an affiliate of the investment adviser. Annualized expenses of the Money Market Central Funds as of their most recent shareholder report date are less than .005%.
A complete unaudited list of holdings for each Fidelity Central Fund is available upon request or at the Securities and Exchange Commission (the SEC) website at www.sec.gov. In addition, the financial statements of the Fidelity Central Funds are available on the SEC website or upon request.
3. Significant Accounting Policies.
The financial statements have been prepared in conformity with accounting principles generally accepted in the United States of America (GAAP), which require management to make certain estimates and assumptions at the date of the financial statements. Actual results could differ from those estimates. Subsequent events, if any, through the date that the financial statements were issued have been evaluated in the preparation of the financial statements. The following summarizes the significant accounting policies of the Fund:
Investment Valuation. Investments are valued as of 4:00 p.m. Eastern time on the last calendar day of the period. The Board of Trustees (the Board) has delegated the day to day responsibility for the valuation of the Fund's investments to the Fidelity SelectCo, LLC (SelectCo) Fair Value Committee (the Committee). In accordance with valuation policies and procedures approved by the Board, the Fund attempts to obtain prices from one or more third party pricing vendors or brokers to value its investments. When current market prices, quotations or currency exchange rates are not readily available or reliable, investments will be fair valued in good faith by the Committee, in accordance with procedures adopted by the Board. Factors used in determining fair value vary by investment type and may include market or investment specific events. The frequency with which these procedures are used cannot be predicted and they may be utilized to a significant extent. The Committee oversees the Fund's valuation policies and procedures and reports to the Board on the Committee's activities and fair value determinations. The Board monitors the appropriateness of the procedures used in valuing the Fund's investments and ratifies the fair value determinations of the Committee.
The Fund categorizes the inputs to valuation techniques used to value its investments into a disclosure hierarchy consisting of three levels as shown below:
- Level 1 – quoted prices in active markets for identical investments
- Level 2 – other significant observable inputs (including quoted prices for similar investments, interest rates, prepayment speeds, etc.)
- Level 3 ��� unobservable inputs (including the Fund's own assumptions based on the best information available)
Valuation techniques used to value the Fund's investments by major category are as follows:
Equity securities, including restricted securities, for which market quotations are readily available, are valued at the last reported sale price or official closing price as reported by a third party pricing vendor on the primary market or exchange on which they are traded and are categorized as Level 1 in the hierarchy. In the event there were no sales during the day or closing prices are not available, securities are valued at the last quoted bid price or may be valued using the last available price and are generally categorized as Level 2 in the hierarchy. For foreign equity securities, when market or security specific events arise, comparisons to the valuation of American Depositary Receipts (ADRs), futures contracts, Exchange-Traded Funds (ETFs) and certain indexes as well as quoted prices for similar securities may be used and would be categorized as Level 2 in the hierarchy. Utilizing these techniques may result in transfers between Level 1 and Level 2. For equity securities, including restricted securities, where observable inputs are limited, assumptions about market activity and risk are used and these securities may be categorized as Level 3 in the hierarchy.
Investments in open-end mutual funds, including the Fidelity Central Funds, are valued at their closing net asset value (NAV) each business day and are categorized as Level 1 in the hierarchy.
Changes in valuation techniques may result in transfers in or out of an assigned level within the disclosure hierarchy. The aggregate value of investments by input level as of January 31, 2016 is included at the end of the Fund's Schedule of Investments.
Foreign Currency. The Fund may use foreign currency contracts to facilitate transactions in foreign-denominated securities. Gains and losses from these transactions may arise from changes in the value of the foreign currency or if the counterparties do not perform under the contracts' terms.
Foreign-denominated assets, including investment securities, and liabilities are translated into U.S. dollars at the exchange rates at period end. Purchases and sales of investment securities, income and dividends received and expenses denominated in foreign currencies are translated into U.S. dollars at the exchange rate in effect on the transaction date.
The effects of exchange rate fluctuations on investments are included with the net realized and unrealized gain (loss) on investment securities. Other foreign currency transactions resulting in realized and unrealized gain (loss) are disclosed separately.
Investment Transactions and Income. For financial reporting purposes, the Fund's investment holdings and NAV include trades executed through the end of the last business day of the period. The NAV per share for processing shareholder transactions is calculated as of the close of business of the New York Stock Exchange (NYSE), normally 4:00 p.m. Eastern time and includes trades executed through the end of the prior business day. Gains and losses on securities sold are determined on the basis of identified cost. Dividend income is recorded on the ex-dividend date, except for certain dividends from foreign securities where the ex-dividend date may have passed, which are recorded as soon as the Fund is informed of the ex-dividend date. Non-cash dividends included in dividend income, if any, are recorded at the fair market value of the securities received. Income and capital gain distributions from Fidelity Central Funds, if any, are recorded on the ex-dividend date. Distributions received on securities that represent a return of capital or capital gain are recorded as a reduction of cost of investments and/or as a realized gain. Subsequent to ex-dividend date the Fund determines the components of these distributions, based upon receipt of tax filings or other correspondence relating to the underlying investment. Investment income is recorded net of foreign taxes withheld where recovery of such taxes is uncertain.
Class Allocations and Expenses. Investment income, realized and unrealized capital gains and losses, common expenses of the Fund, and certain fund-level expense reductions, if any, are allocated daily on a pro-rata basis to each class based on the relative net assets of each class to the total net assets of the Fund. Each class differs with respect to transfer agent and distribution and service plan fees incurred. Certain expense reductions may also differ by class. For the reporting period, the allocated portion of income and expenses to each class as a percent of its average net assets may vary due to the timing of recording these transactions in relation to fluctuating net assets of the classes. Expenses directly attributable to a fund are charged to that fund. Expenses attributable to more than one fund are allocated among the respective funds on the basis of relative net assets or other appropriate methods. Expense estimates are accrued in the period to which they relate and adjustments are made when actual amounts are known.
Income Tax Information and Distributions to Shareholders. Each year, the Fund intends to qualify as a regulated investment company under Subchapter M of the Internal Revenue Code, including distributing substantially all of its taxable income and realized gains. As a result, no provision for U.S. Federal income taxes is required. The Fund files a U.S. federal tax return, in addition to state and local tax returns as required. The Fund's federal income tax returns are subject to examination by the Internal Revenue Service (IRS) for a period of three fiscal years after they are filed. State and local tax returns may be subject to examination for an additional fiscal year depending on the jurisdiction. Foreign taxes are provided for based on the Fund's understanding of the tax rules and rates that exist in the foreign markets in which it invests.
Distributions are declared and recorded on the ex-dividend date. Income dividends and capital gain distributions are declared separately for each class. Income and capital gain distributions are determined in accordance with income tax regulations, which may differ from GAAP.
Capital accounts within the financial statements are adjusted for permanent book-tax differences. These adjustments have no impact on net assets or the results of operations. Capital accounts are not adjusted for temporary book-tax differences which will reverse in a subsequent period.
Book-tax differences are primarily due to foreign currency transactions and losses deferred due to wash sales.
The federal tax cost of investment securities and unrealized appreciation (depreciation) as of period end were as follows:
| Gross unrealized appreciation | $82,135,573 |
| Gross unrealized depreciation | (39,309,187) |
| Net unrealized appreciation (depreciation) on securities | $42,826,386 |
| Tax cost | $536,671,385 |
Short-Term Trading (Redemption) Fees. Shares held by investors in the Fund less than 30 days may have been subject to a redemption fee equal to .75% of the NAV of shares redeemed. All redemption fees, which reduce the proceeds of the shareholder redemption, are retained by the Fund and accounted for as an addition to paid in capital.
4. Purchases and Sales of Investments.
Purchases and sales of securities, other than short-term securities, aggregated $178,419,237 and $315,785,937, respectively.
5. Fees and Other Transactions with Affiliates.
Management Fee. Fidelity SelectCo, LLC (the investment adviser) and its affiliates provide the Fund with investment management related services for which the Fund pays a monthly management fee. The management fee is the sum of an individual fund fee rate that is based on an annual rate of .30% of the Fund's average net assets and an annualized group fee rate that averaged .25% during the period. The group fee rate is based upon the average net assets of all the mutual funds advised by Fidelity Management & Research Company (FMR) and the investment adviser. The group fee rate decreases as assets under management increase and increases as assets under management decrease. For the reporting period, the total annualized management fee rate was .55% of the Fund's average net assets.
Distribution and Service Plan Fees. In accordance with Rule 12b-1 of the 1940 Act, the Fund has adopted separate Distribution and Service Plans for each class of shares. Certain classes pay Fidelity Distributors Corporation (FDC), an affiliate of the investment adviser, separate Distribution and Service Fees, each of which is based on an annual percentage of each class' average net assets. In addition, FDC may pay financial intermediaries for selling shares of the Fund and providing shareholder support services. For the period, the Distribution and Service Fee rates, total fees and amounts retained by FDC were as follows:
| | Distribution
Fee | Service
Fee | Total Fees | Retained
by FDC |
| Class A | -% | .25% | $368,024 | $– |
| Class T | .25% | .25% | 201,984 | – |
| Class B | .75% | .25% | 26,075 | 19,556 |
| Class C | .75% | .25% | 619,391 | 50,884 |
| | | | $1,215,474 | $70,440 |
Sales Load. FDC may receive a front-end sales charge of up to 5.75% for selling Class A shares and 3.50% for selling Class T shares, some of which is paid to financial intermediaries for selling shares of the Fund. Depending on the holding period, FDC may receive contingent deferred sales charges levied on Class A, Class T, Class B, and Class C redemptions. The deferred sales charges range from 5.00% to 1.00% for Class B shares, 1.00% for Class C shares, 1.00% for certain purchases of Class A shares and .25% for certain purchases of Class T shares.
For the period, sales charge amounts retained by FDC were as follows:
| | Retained
by FDC |
| Class A | $22,165 |
| Class T | 3,081 |
| Class B(a) | 845 |
| Class C(a) | 9,689 |
| | $35,780 |
(a) When Class B and Class C shares are initially sold, FDC pays commissions from its own resources to financial intermediaries through which the sales are made.
Transfer Agent Fees. Fidelity Investments Institutional Operations Company, Inc., (FIIOC), an affiliate of the investment adviser, is the transfer, dividend disbursing and shareholder servicing agent for each class of the Fund. FIIOC receives account fees and asset-based fees that vary according to the account size and type of account of the shareholders of the respective classes of the Fund. FIIOC pays for typesetting, printing and mailing of shareholder reports, except proxy statements.
For the period, transfer agent fees for each class were as follows:
| | Amount | % of
Class-Level Average
Net Assets(a) |
| Class A | $299,904 | .20 |
| Class T | 88,766 | .22 |
| Class B | 6,425 | .25 |
| Class C | 128,774 | .21 |
| Class I | 157,325 | .19 |
| | $681,194 | |
(a) Annualized
Accounting and Security Lending Fees. Fidelity Service Company, Inc. (FSC), an affiliate of the investment adviser, maintains the Fund's accounting records. The accounting fee is based on the level of average net assets for each month. Under a separate contract, FSC administers the security lending program. The security lending fee is based on the number and duration of lending transactions.
Brokerage Commissions. The Fund placed a portion of its portfolio transactions with brokerage firms which are affiliates of the investment adviser. Brokerage commissions are included in net realized gain (loss) and change in net unrealized appreciation (depreciation) in the Statement of Operations. The commissions paid to these affiliated firms were $2,884 for the period.
Interfund Lending Program. Pursuant to an Exemptive Order issued by the SEC, the Fund, along with other registered investment companies having management contracts with FMR or other affiliated entities of FMR, may participate in an interfund lending program. This program provides an alternative credit facility allowing the funds to borrow from, or lend money to, other participating affiliated funds. At period end, there were no interfund loans outstanding. The Fund's activity in this program during the period for which loans were outstanding was as follows:
| Borrower or Lender | Average Loan Balance | Weighted Average Interest Rate | Interest Expense |
| Borrower | $1,810,333 | .36% | $164 |
Interfund Trades. The Fund may purchase from or sell securities to other Fidelity Funds under procedures adopted by the Board. The procedures have been designed to ensure these interfund trades are executed in accordance with Rule 17a-7 of the 1940 Act. Interfund trades are included within the respective purchases and sales amounts shown in the Purchases and Sales of Investments note.
6. Committed Line of Credit.
The Fund participates with other funds managed by the investment adviser or an affiliate in a $4.25 billion credit facility (the "line of credit") to be utilized for temporary or emergency purposes to fund shareholder redemptions or for other short-term liquidity purposes. The Fund has agreed to pay commitment fees on its pro-rata portion of the line of credit, which amounted to $471 and is reflected in Miscellaneous expenses on the Statement of Operations. During the period, the Fund did not borrow on this line of credit.
7. Security Lending.
The Fund lends portfolio securities through a lending agent from time to time in order to earn additional income. On the settlement date of the loan, the Fund receives collateral (in the form of U.S. Treasury obligations, letters of credit and/or cash) against the loaned securities and maintains collateral in an amount not less than 100% of the market value of the loaned securities during the period of the loan. The market value of the loaned securities is determined at the close of business of the Fund and any additional required collateral is delivered to the Fund on the next business day. The Fund or borrower may terminate the loan at any time, and if the borrower defaults on its obligation to return the securities loaned because of insolvency or other reasons, the Fund may apply collateral received from the borrower against the obligation. The Fund may experience delays and costs in recovering the securities loaned. Any cash collateral received is invested in the Fidelity Securities Lending Cash Central Fund. At period end, there were no security loans outstanding. Security lending income represents the income earned on investing cash collateral, less rebates paid to borrowers and any lending agent fees associated with the loan, plus any premium payments received for lending certain types of securities. Security lending income is presented in the Statement of Operations as a component of income from Fidelity Central Funds. Total security lending income during the period amounted to $2,285.
8. Bank Borrowings.
The Fund is permitted to have bank borrowings for temporary or emergency purposes to fund shareholder redemptions or for other short-term liquidity requirements. The Fund has established borrowing arrangements with certain banks. The interest rate on the borrowings is the bank's base rate, as revised from time to time. The average loan balance during the period for which loans were outstanding amounted to $802,500. The weighted average interest rate was .64%. The interest expense amounted to $29 under the bank borrowing program. At period end, there were no bank borrowings outstanding.
9. Expense Reductions.
Commissions paid to certain brokers with whom the investment adviser, or its affiliates, places trades on behalf of the Fund include an amount in addition to trade execution, which may be rebated back to the Fund to offset certain expenses. This amount totaled $11,126 for the period.
In addition, during the period the investment adviser reimbursed and/or waived a portion of fund-level operating expenses in the amount of $2,372.
10. Distributions to Shareholders.
Distributions to shareholders of each class were as follows:
| | Six months ended January 31, 2016 | Year ended July 31, 2015 |
| From net investment income | | |
| Class A | $1,251,437 | $1,073,088 |
| Class T | 142,172 | 117,188 |
| Class B | – | 10,986 |
| Class I | 1,144,151 | 1,400,614 |
| Total | $2,537,760 | $2,601,876 |
| From net realized gain | | |
| Class A | $24,885,132 | $26,712,147 |
| Class T | 6,913,270 | 6,664,310 |
| Class B | 520,980 | 905,701 |
| Class C | 11,465,082 | 11,132,591 |
| Class I | 14,306,102 | 16,913,069 |
| Total | $58,090,566 | $62,327,818 |
11. Share Transactions.
Share transactions for each class were as follows and may contain automatic conversions between classes or exchanges between affiliated funds:
| | Shares | Shares | Dollars | Dollars |
| | Six months ended January 31, 2016 | Year ended July 31, 2015 | Six months ended January 31, 2016 | Year ended July 31, 2015 |
| Class A | | | | |
| Shares sold | 530,811 | 1,896,772 | $17,590,338 | $70,041,684 |
| Reinvestment of distributions | 771,777 | 707,344 | 24,606,761 | 25,707,295 |
| Shares redeemed | (1,783,280) | (3,868,022) | (59,142,240) | (142,586,857) |
| Net increase (decrease) | (480,692) | (1,263,906) | $(16,945,141) | $(46,837,878) |
| Class T | | | | |
| Shares sold | 64,553 | 223,605 | $2,106,828 | $8,111,419 |
| Reinvestment of distributions | 219,403 | 183,489 | 6,858,376 | 6,551,657 |
| Shares redeemed | (292,248) | (477,116) | (9,493,422) | (17,277,571) |
| Net increase (decrease) | (8,292) | (70,022) | $(528,218) | $(2,614,495) |
| Class B | | | | |
| Shares sold | 4,919 | 7,145 | $141,277 | $236,954 |
| Reinvestment of distributions | 16,748 | 23,129 | 482,266 | 769,253 |
| Shares redeemed | (74,228) | (197,915) | (2,238,291) | (6,710,202) |
| Net increase (decrease) | (52,561) | (167,641) | $(1,614,748) | $(5,703,995) |
| Class C | | | | |
| Shares sold | 241,596 | 897,971 | $7,287,189 | $30,459,518 |
| Reinvestment of distributions | 324,873 | 266,310 | 9,447,456 | 8,933,204 |
| Shares redeemed | (888,021) | (1,333,978) | (26,693,312) | (45,225,201) |
| Net increase (decrease) | (321,552) | (169,697) | $(9,958,667) | $(5,832,479) |
| Class I | | | | |
| Shares sold | 480,498 | 2,703,369 | $16,625,183 | $103,567,578 |
| Reinvestment of distributions | 386,271 | 388,187 | 12,880,051 | 14,699,436 |
| Shares redeemed | (2,209,090) | (4,045,495) | (75,892,796) | (154,607,514) |
| Net increase (decrease) | (1,342,321) | (953,939) | $(46,387,562) | $(36,340,500) |
12. Other.
The Fund's organizational documents provide former and current trustees and officers with a limited indemnification against liabilities arising in connection with the performance of their duties to the Fund. In the normal course of business, the Fund may also enter into contracts that provide general indemnifications. The Fund's maximum exposure under these arrangements is unknown as this would be dependent on future claims that may be made against the Fund. The risk of material loss from such claims is considered remote.
Fidelity Advisor® Technology Fund
Investment Summary (Unaudited)
Top Ten Stocks as of January 31, 2016
| | % of fund's net assets | % of fund's net assets 6 months ago |
| Apple, Inc. | 9.8 | 12.9 |
| Alphabet, Inc. Class C | 6.9 | 5.2 |
| Facebook, Inc. Class A | 6.5 | 7.0 |
| Alphabet, Inc. Class A | 6.4 | 5.0 |
| Yahoo!, Inc. | 3.0 | 2.1 |
| Visa, Inc. Class A | 2.7 | 1.6 |
| Marvell Technology Group Ltd. | 2.6 | 1.6 |
| 58.com, Inc. ADR | 2.1 | 0.6 |
| Micron Technology, Inc. | 2.1 | 0.7 |
| Alibaba Group Holding Ltd. sponsored ADR | 2.1 | 1.0 |
| | 44.2 | |
Top Industries (% of fund's net assets)
| As of January 31, 2016 |
| | Internet Software & Services | 32.7% |
| | Semiconductors & Semiconductor Equipment | 17.4% |
| | Software | 12.4% |
| | Technology Hardware, Storage & Peripherals | 12.4% |
| | IT Services | 6.9% |
| | All Others* | 18.2% |

| As of July 31, 2015 |
| | Internet Software & Services | 29.2% |
| | Technology Hardware, Storage & Peripherals | 16.4% |
| | Software | 14.9% |
| | Semiconductors & Semiconductor Equipment | 10.3% |
| | IT Services | 6.1% |
| | All Others* | 23.1% |
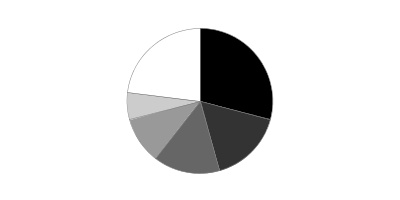
* Includes Short-Term investments and Net Other Assets (Liabilities).
Fidelity Advisor® Technology Fund
Investments January 31, 2016 (Unaudited)
Showing Percentage of Net Assets
| Common Stocks - 98.2% | | | |
| | | Shares | Value |
| Automobiles - 1.7% | | | |
| Automobile Manufacturers - 1.7% | | | |
| Tesla Motors, Inc. (a)(b) | | 126,309 | $24,150,281 |
| Banks - 0.1% | | | |
| Diversified Banks - 0.1% | | | |
| Hangzhou Hikvision Digital Technology Co. Ltd. ELS (BNP Paribas Warrant Program) warrants 11/27/17 (a)(c) | | 417,300 | 1,703,331 |
| Biotechnology - 0.2% | | | |
| Biotechnology - 0.2% | | | |
| Genscript Biotech Corp. | | 15,144,000 | 2,702,033 |
| Chemicals - 0.2% | | | |
| Specialty Chemicals - 0.2% | | | |
| Duk San Neolux Co. Ltd. (a) | | 105,097 | 2,436,189 |
| Communications Equipment - 4.1% | | | |
| Communications Equipment - 4.1% | | | |
| Ciena Corp. (a) | | 77,800 | 1,382,506 |
| Cisco Systems, Inc. | | 908,300 | 21,608,457 |
| CommScope Holding Co., Inc. (a) | | 439,800 | 9,860,316 |
| F5 Networks, Inc. (a) | | 51,500 | 4,829,670 |
| Juniper Networks, Inc. | | 78,400 | 1,850,240 |
| Qualcomm, Inc. | | 422,200 | 19,142,548 |
| Radware Ltd. (a) | | 610 | 8,150 |
| | | | 58,681,887 |
| Consumer Finance - 0.0% | | | |
| Consumer Finance - 0.0% | | | |
| LendingClub Corp. (a) | | 700 | 5,166 |
| Diversified Consumer Services - 0.1% | | | |
| Education Services - 0.1% | | | |
| New Oriental Education & Technology Group, Inc. sponsored ADR | | 26,600 | 835,506 |
| TAL Education Group ADR (a) | | 15,400 | 738,738 |
| | | | 1,574,244 |
| Specialized Consumer Services - 0.0% | | | |
| LifeLock, Inc. (a) | | 867 | 10,387 |
|
| TOTAL DIVERSIFIED CONSUMER SERVICES | | | 1,584,631 |
|
| Diversified Telecommunication Services - 0.1% | | | |
| Alternative Carriers - 0.1% | | | |
| 8x8, Inc. (a) | | 72,200 | 906,832 |
| Electrical Equipment - 0.5% | | | |
| Electrical Components & Equipment - 0.5% | | | |
| Lumenpulse, Inc. (a) | | 21,700 | 263,331 |
| Nidec Corp. | | 21,500 | 1,466,920 |
| Sensata Technologies Holding BV (a) | | 165,500 | 6,073,850 |
| | | | 7,804,101 |
| Electronic Equipment & Components - 2.9% | | | |
| Electronic Components - 1.2% | | | |
| Alps Electric Co. Ltd. | | 57,900 | 1,147,955 |
| Largan Precision Co. Ltd. | | 35,000 | 2,500,403 |
| Ledlink Optics, Inc. | | 791,075 | 1,040,199 |
| Murata Manufacturing Co. Ltd. | | 5,900 | 682,441 |
| Samsung SDI Co. Ltd. | | 59,376 | 4,661,787 |
| Sunny Optical Technology Group Co. Ltd. | | 694,100 | 1,489,689 |
| Universal Display Corp. (a) | | 21,800 | 1,070,380 |
| Yageo Corp. | | 2,450,660 | 3,850,412 |
| Yaskawa Electric Corp. | | 1,100 | 12,207 |
| | | | 16,455,473 |
| Electronic Equipment & Instruments - 0.3% | | | |
| Chroma ATE, Inc. | | 1,700,683 | 3,361,002 |
| Cognex Corp. | | 34,600 | 1,115,850 |
| FEI Co. | | 200 | 14,490 |
| | | | 4,491,342 |
| Electronic Manufacturing Services - 1.4% | | | |
| Trimble Navigation Ltd. (a) | | 1,053,796 | 20,327,725 |
| Technology Distributors - 0.0% | | | |
| Digital China Holdings Ltd. (H Shares) | | 23,000 | 23,844 |
|
| TOTAL ELECTRONIC EQUIPMENT & COMPONENTS | | | 41,298,384 |
|
| Health Care Equipment & Supplies - 0.1% | | | |
| Health Care Equipment - 0.1% | | | |
| Intai Technology Corp. | | 517,000 | 1,893,651 |
| Olympus Corp. | | 4,500 | 175,472 |
| | | | 2,069,123 |
| Health Care Providers & Services - 0.0% | | | |
| Managed Health Care - 0.0% | | | |
| HealthEquity, Inc. (a) | | 11,300 | 243,515 |
| Health Care Technology - 1.6% | | | |
| Health Care Technology - 1.6% | | | |
| athenahealth, Inc. (a) | | 66,994 | 9,499,749 |
| Inovalon Holdings, Inc. Class A (b) | | 71,200 | 1,201,856 |
| M3, Inc. | | 31,000 | 711,001 |
| Medidata Solutions, Inc. (a) | | 213,300 | 9,114,309 |
| Veeva Systems, Inc. Class A (a) | | 96,600 | 2,328,060 |
| | | | 22,854,975 |
| Hotels, Restaurants & Leisure - 0.5% | | | |
| Casinos & Gaming - 0.3% | | | |
| 500.com Ltd. sponsored ADR Class A (a)(b) | | 232,100 | 4,168,516 |
| Hotels, Resorts & Cruise Lines - 0.2% | | | |
| Tuniu Corp. Class A sponsored ADR (a)(b) | | 217,908 | 2,782,685 |
|
| TOTAL HOTELS, RESTAURANTS & LEISURE | | | 6,951,201 |
|
| Household Durables - 0.9% | | | |
| Consumer Electronics - 0.9% | | | |
| Sony Corp. | | 216,300 | 5,020,174 |
| Sony Corp. sponsored ADR | | 333,500 | 7,963,980 |
| | | | 12,984,154 |
| Internet & Catalog Retail - 3.0% | | | |
| Internet Retail - 3.0% | | | |
| Amazon.com, Inc. (a) | | 11,000 | 6,457,000 |
| Groupon, Inc. Class A (a)(b) | | 1,910,600 | 5,196,832 |
| JD.com, Inc. sponsored ADR (a) | | 164,800 | 4,289,744 |
| Jumei International Holding Ltd. sponsored ADR (a)(b) | | 1,290,810 | 8,312,816 |
| Liberty Interactive Corp. QVC Group Series A (a) | | 309 | 8,053 |
| MySale Group PLC (a) | | 19,300 | 13,201 |
| Qunar Cayman Islands Ltd. sponsored ADR (a) | | 295,894 | 13,043,008 |
| Vipshop Holdings Ltd. ADR (a) | | 455,600 | 5,849,904 |
| | | | 43,170,558 |
| Internet Software & Services - 31.9% | | | |
| Internet Software & Services - 31.9% | | | |
| 58.com, Inc. ADR (a)(b) | | 545,000 | 30,574,500 |
| Alibaba Group Holding Ltd. sponsored ADR (a) | | 447,800 | 30,016,034 |
| Alphabet, Inc.: | | | |
| Class A | | 120,887 | 92,037,317 |
| Class C | | 133,455 | 99,150,392 |
| Baidu.com, Inc. sponsored ADR (a) | | 100 | 16,327 |
| Benefitfocus, Inc. (a)(b) | | 10,800 | 314,928 |
| Box, Inc. Class A | | 58,500 | 629,460 |
| ChannelAdvisor Corp. (a) | | 108,417 | 1,325,940 |
| Constant Contact, Inc. (a) | | 400 | 12,644 |
| Cornerstone OnDemand, Inc. (a) | | 91,432 | 2,806,048 |
| Cvent, Inc. (a) | | 50,808 | 1,341,839 |
| Demandware, Inc. (a)(b) | | 110,606 | 4,693,013 |
| DeNA Co. Ltd. | | 262,400 | 3,797,749 |
| eBay, Inc. (a) | | 28,700 | 673,302 |
| eGain Communications Corp. (a)(b) | | 64,050 | 239,547 |
| Endurance International Group Holdings, Inc. (a)(b) | | 655,200 | 6,014,736 |
| Envestnet, Inc. (a) | | 245 | 5,745 |
| Facebook, Inc. Class A (a) | | 836,411 | 93,853,678 |
| Hortonworks, Inc. (a)(b) | | 1,500 | 14,550 |
| Instructure, Inc. (a) | | 103,570 | 1,794,868 |
| LinkedIn Corp. Class A (a) | | 51,800 | 10,251,738 |
| Marketo, Inc. (a) | | 178,513 | 3,393,532 |
| NAVER Corp. | | 3,405 | 1,781,666 |
| New Relic, Inc. (a) | | 89,100 | 2,514,402 |
| Q2 Holdings, Inc. (a) | | 700 | 15,162 |
| Rackspace Hosting, Inc. (a) | | 29,439 | 594,962 |
| Renren, Inc. ADR (a)(b) | | 272,700 | 872,640 |
| SciQuest, Inc. (a) | | 210,654 | 2,681,625 |
| SINA Corp. (a) | | 143,198 | 6,579,948 |
| SouFun Holdings Ltd. ADR | | 839,600 | 5,004,016 |
| Textura Corp. (a)(b) | | 280,915 | 4,435,648 |
| Twitter, Inc. (a) | | 27,800 | 467,040 |
| Web.com Group, Inc. (a) | | 203,586 | 3,833,524 |
| Weibo Corp. sponsored ADR (a) | | 800 | 12,176 |
| Xunlei Ltd. sponsored ADR (a) | | 599,944 | 3,695,655 |
| Yahoo!, Inc. (a) | | 1,448,200 | 42,736,382 |
| Yirendai Ltd. ADR | | 70,400 | 480,128 |
| Zillow Group, Inc.: | | | |
| Class A (a)(b) | | 710 | 15,386 |
| Class C (a)(b) | | 720 | 14,760 |
| | | | 458,693,007 |
| IT Services - 6.9% | | | |
| Data Processing & Outsourced Services - 6.2% | | | |
| Amadeus IT Holding SA Class A | | 180,500 | 7,371,392 |
| Euronet Worldwide, Inc. (a) | | 25,835 | 2,060,858 |
| Fidelity National Information Services, Inc. | | 36,195 | 2,161,927 |
| Fiserv, Inc. (a) | | 43,600 | 4,122,816 |
| FleetCor Technologies, Inc. (a) | | 56,800 | 6,977,312 |
| Global Payments, Inc. | | 126,500 | 7,457,175 |
| MasterCard, Inc. Class A | | 25,100 | 2,234,653 |
| Optimal Payments PLC (a) | | 1,400,300 | 8,067,848 |
| Sabre Corp. | | 82,400 | 2,110,264 |
| Total System Services, Inc. | | 31,553 | 1,267,168 |
| Travelport Worldwide Ltd. | | 345,223 | 3,759,478 |
| Vantiv, Inc. (a) | | 32,100 | 1,510,305 |
| Visa, Inc. Class A | | 528,900 | 39,397,761 |
| | | | 88,498,957 |
| IT Consulting & Other Services - 0.7% | | | |
| Cognizant Technology Solutions Corp. Class A (a) | | 142,494 | 9,021,295 |
| EPAM Systems, Inc. (a) | | 20,761 | 1,554,999 |
| Virtusa Corp. (a) | | 400 | 17,888 |
| | | | 10,594,182 |
|
| TOTAL IT SERVICES | | | 99,093,139 |
|
| Life Sciences Tools & Services - 0.1% | | | |
| Life Sciences Tools & Services - 0.1% | | | |
| JHL Biotech, Inc. | | 555,476 | 1,888,781 |
| Machinery - 0.1% | | | |
| Industrial Machinery - 0.1% | | | |
| Harmonic Drive Systems, Inc. (b) | | 38,600 | 782,885 |
| King Slide Works Co. Ltd. | | 29,000 | 375,108 |
| | | | 1,157,993 |
| Media - 0.5% | | | |
| Advertising - 0.0% | | | |
| iCar Asia Ltd. (a)(b) | | 1,257,513 | 840,771 |
| Cable & Satellite - 0.3% | | | |
| Naspers Ltd. Class N | | 36,545 | 4,618,306 |
| Publishing - 0.2% | | | |
| NEXT Co. Ltd. | | 21,800 | 228,043 |
| Schibsted ASA: | | | |
| (A Shares) | | 22,300 | 654,531 |
| (B Shares) (a) | | 51,941 | 1,460,705 |
| | | | 2,343,279 |
|
| TOTAL MEDIA | | | 7,802,356 |
|
| Professional Services - 0.5% | | | |
| Human Resource & Employment Services - 0.4% | | | |
| 51job, Inc. sponsored ADR (a) | | 400 | 11,132 |
| WageWorks, Inc. (a) | | 149,044 | 6,668,229 |
| | | | 6,679,361 |
| Research & Consulting Services - 0.1% | | | |
| ICF International, Inc. (a) | | 33,600 | 1,149,456 |
| Verisk Analytics, Inc. (a) | | 168 | 12,264 |
| | | | 1,161,720 |
|
| TOTAL PROFESSIONAL SERVICES | | | 7,841,081 |
|
| Semiconductors & Semiconductor Equipment - 17.4% | | | |
| Semiconductor Equipment - 0.9% | | | |
| Amkor Technology, Inc. (a) | | 986,646 | 6,058,006 |
| Applied Materials, Inc. | | 900 | 15,885 |
| ASM Pacific Technology Ltd. | | 35,500 | 258,253 |
| EO Technics Co. Ltd. | | 54,339 | 5,675,154 |
| Hermes Microvision, Inc. | | 48,000 | 1,183,333 |
| Nanometrics, Inc. (a) | | 9,409 | 132,949 |
| Rubicon Technology, Inc. (a)(b) | | 451,167 | 469,214 |
| SunEdison, Inc. (a)(b) | | 700 | 2,191 |
| | | | 13,794,985 |
| Semiconductors - 16.5% | | | |
| Advanced Micro Devices, Inc. (a)(b) | | 361,400 | 795,080 |
| Advanced Semiconductor Engineering, Inc. | | 8,330,000 | 8,906,298 |
| Advanced Semiconductor Engineering, Inc. sponsored ADR | | 1,207,762 | 6,461,527 |
| Ambarella, Inc. (a) | | 51,300 | 2,035,584 |
| Analog Devices, Inc. | | 80,800 | 4,351,888 |
| Avago Technologies Ltd. | | 5,800 | 775,518 |
| Cavium, Inc. (a) | | 68,200 | 3,939,914 |
| Chipbond Technology Corp. | | 2,376,000 | 3,353,706 |
| ChipMOS TECHNOLOGIES (Bermuda) Ltd. | | 243,127 | 4,376,286 |
| Cirrus Logic, Inc. (a) | | 22,714 | 788,630 |
| Cypress Semiconductor Corp. (b) | | 173,983 | 1,367,506 |
| Everlight Electronics Co. Ltd. | | 2,135,000 | 3,555,831 |
| Genesis Photonics, Inc. (a) | | 2,474,066 | 597,986 |
| Himax Technologies, Inc. sponsored ADR (b) | | 393,304 | 3,052,039 |
| Hua Hong Semiconductor Ltd. (a) | | 2,480,000 | 1,913,128 |
| Inotera Memories, Inc. (a) | | 6,239,000 | 5,352,499 |
| Integrated Device Technology, Inc. (a) | | 72,300 | 1,842,204 |
| Intersil Corp. Class A | | 351,594 | 4,570,722 |
| King Yuan Electronics Co. Ltd. | | 1,388,000 | 920,775 |
| Lextar Electronics Corp. | | 437,000 | 207,946 |
| MagnaChip Semiconductor Corp. (a)(b) | | 114,554 | 524,657 |
| Marvell Technology Group Ltd. | | 4,183,982 | 37,028,241 |
| Maxim Integrated Products, Inc. | | 415,100 | 13,864,340 |
| Melexis NV | | 293 | 14,725 |
| Micron Technology, Inc. (a) | | 2,757,500 | 30,415,225 |
| Microsemi Corp. (a) | | 150,700 | 4,777,190 |
| Monolithic Power Systems, Inc. | | 71,201 | 4,455,047 |
| NXP Semiconductors NV (a) | | 267,780 | 20,024,588 |
| ON Semiconductor Corp. (a) | | 344,400 | 2,948,064 |
| Power Integrations, Inc. | | 41,500 | 1,955,895 |
| Qorvo, Inc. (a) | | 298,158 | 11,807,057 |
| Sanken Electric Co. Ltd. | | 386,000 | 1,221,815 |
| Semtech Corp. (a) | | 296,398 | 5,957,600 |
| Silicon Laboratories, Inc. (a) | | 30,500 | 1,390,800 |
| Silicon Motion Technology Corp. sponsored ADR | | 108,288 | 3,366,674 |
| Siliconware Precision Industries Co. Ltd. | | 7,587,341 | 11,695,230 |
| Siliconware Precision Industries Co. Ltd. sponsored ADR (b) | | 1,359,064 | 10,424,021 |
| Sitronix Technology Corp. | | 235,000 | 694,481 |
| SK Hynix, Inc. | | 61,383 | 1,405,982 |
| Skyworks Solutions, Inc. | | 107,600 | 7,415,792 |
| STMicroelectronics NV | | 1,630 | 10,649 |
| Vanguard International Semiconductor Corp. | | 4,388,000 | 6,270,147 |
| Xilinx, Inc. | | 300 | 15,081 |
| | | | 236,848,368 |
|
| TOTAL SEMICONDUCTORS & SEMICONDUCTOR EQUIPMENT | | | 250,643,353 |
|
| Software - 12.4% | | | |
| Application Software - 6.3% | | | |
| Adobe Systems, Inc. (a) | | 159,716 | 14,235,487 |
| ANSYS, Inc. (a) | | 175 | 15,433 |
| Autodesk, Inc. (a) | | 117,200 | 5,487,304 |
| Blackbaud, Inc. | | 17,200 | 1,057,456 |
| Citrix Systems, Inc. (a) | | 65,815 | 4,637,325 |
| Guidewire Software, Inc. (a) | | 190 | 10,458 |
| Interactive Intelligence Group, Inc. (a) | | 43,960 | 1,049,765 |
| Intuit, Inc. | | 137,300 | 13,113,523 |
| Kingdee International Software Group Co. Ltd. | | 365,800 | 127,994 |
| Linx SA | | 700 | 8,773 |
| Mobileye NV (a)(b) | | 277,100 | 7,517,723 |
| Parametric Technology Corp. (a) | | 500 | 14,805 |
| Paycom Software, Inc. (a) | | 900 | 27,135 |
| Paylocity Holding Corp. (a)(b) | | 100,400 | 3,124,448 |
| Qlik Technologies, Inc. (a) | | 400 | 10,016 |
| RealPage, Inc. (a) | | 181,783 | 3,506,594 |
| RingCentral, Inc. (a) | | 68,300 | 1,490,306 |
| Salesforce.com, Inc. (a) | | 339,219 | 23,087,245 |
| SolarWinds, Inc. (a) | | 333 | 19,963 |
| SS&C Technologies Holdings, Inc. | | 52,200 | 3,355,938 |
| Ultimate Software Group, Inc. (a) | | 76 | 13,348 |
| Workday, Inc. Class A (a) | | 25,600 | 1,613,056 |
| Workiva, Inc. (a)(b) | | 51,400 | 767,402 |
| Zendesk, Inc. (a) | | 288,700 | 6,354,287 |
| | | | 90,645,784 |
| Home Entertainment Software - 1.9% | | | |
| Activision Blizzard, Inc. | | 233,170 | 8,118,979 |
| Electronic Arts, Inc. (a) | | 49,900 | 3,220,796 |
| NCSOFT Corp. | | 45,458 | 8,880,865 |
| NHN Entertainment Corp. (a) | | 88,294 | 3,533,704 |
| Nintendo Co. Ltd. | | 26,200 | 3,673,600 |
| | | | 27,427,944 |
| Systems Software - 4.2% | | | |
| Allot Communications Ltd. (a) | | 288,719 | 1,440,708 |
| CommVault Systems, Inc. (a) | | 300 | 11,256 |
| Fleetmatics Group PLC (a) | | 341,030 | 14,804,112 |
| Imperva, Inc. (a) | | 300 | 15,468 |
| Infoblox, Inc. (a) | | 900 | 14,526 |
| Microsoft Corp. | | 206,900 | 11,398,121 |
| NetSuite, Inc. (a)(b) | | 97,577 | 6,768,916 |
| Oracle Corp. | | 394,500 | 14,324,295 |
| Progress Software Corp. (a) | | 52,200 | 1,351,458 |
| Rapid7, Inc. (a)(b) | | 2,500 | 32,750 |
| ServiceNow, Inc. (a) | | 46,895 | 2,917,338 |
| Tableau Software, Inc. (a) | | 3,300 | 264,792 |
| Varonis Systems, Inc. (a) | | 900 | 16,938 |
| VMware, Inc. Class A (a)(b) | | 143,900 | 6,583,425 |
| | | | 59,944,103 |
|
| TOTAL SOFTWARE | | | 178,017,831 |
|
| Technology Hardware, Storage & Peripherals - 12.4% | | | |
| Technology Hardware, Storage & Peripherals - 12.4% | | | |
| Apple, Inc. | | 1,446,329 | 140,785,661 |
| BlackBerry Ltd. (a) | | 1,486 | 10,597 |
| Electronics for Imaging, Inc. (a) | | 67,200 | 2,780,736 |
| EMC Corp. | | 610,800 | 15,129,516 |
| HP, Inc. | | 1,411,300 | 13,703,723 |
| Nimble Storage, Inc. (a)(b) | | 162,600 | 1,068,282 |
| Quanta Computer, Inc. | | 475,000 | 753,608 |
| SanDisk Corp. | | 28,000 | 1,979,600 |
| Silicon Graphics International Corp. (a) | | 166,658 | 979,116 |
| Stratasys Ltd. (a) | | 100 | 1,630 |
| Western Digital Corp. | | 15,700 | 753,286 |
| | | | 177,945,755 |
| TOTAL COMMON STOCKS | | | |
| (Cost $1,355,264,928) | | | 1,412,629,657 |
|
| Preferred Stocks - 1.8% | | | |
| Convertible Preferred Stocks - 1.4% | | | |
| Internet & Catalog Retail - 0.6% | | | |
| Internet Retail - 0.6% | | | |
| China Internet Plus Holdings Ltd. Series B (d) | | 2,042,487 | 7,885,430 |
| Internet Software & Services - 0.8% | | | |
| Internet Software & Services - 0.8% | | | |
| Uber Technologies, Inc. Series D, 8.00% (a)(d) | | 232,064 | 11,318,278 |
| IT Services - 0.0% | | | |
| Data Processing & Outsourced Services - 0.0% | | | |
| Nutanix, Inc. Series E (a)(d) | | 39,963 | 495,541 |
|
| TOTAL CONVERTIBLE PREFERRED STOCKS | | | 19,699,249 |
|
| Nonconvertible Preferred Stocks - 0.4% | | | |
| Internet & Catalog Retail - 0.4% | | | |
| Internet Retail - 0.4% | | | |
| China Internet Plus Holdings Ltd. (d) | | 1,516,912 | 5,856,342 |
| TOTAL PREFERRED STOCKS | | | |
| (Cost $16,815,545) | | | 25,555,591 |
|
| Money Market Funds - 5.5% | | | |
| Fidelity Cash Central Fund, 0.38% (e) | | 4,188,303 | 4,188,303 |
| Fidelity Securities Lending Cash Central Fund, 0.42% (e)(f) | | 75,135,694 | 75,135,694 |
| TOTAL MONEY MARKET FUNDS | | | |
| (Cost $79,323,997) | | | 79,323,997 |
| TOTAL INVESTMENT PORTFOLIO - 105.5% | | | |
| (Cost $1,451,404,470) | | | 1,517,509,245 |
| NET OTHER ASSETS (LIABILITIES) - (5.5)% | | | (78,771,517) |
| NET ASSETS - 100% | | | $1,438,737,728 |
Security Type Abbreviations
ELS – Equity-Linked Security
Legend
(a) Non-income producing
(b) Security or a portion of the security is on loan at period end.
(c) Security exempt from registration under Rule 144A of the Securities Act of 1933. These securities may be resold in transactions exempt from registration, normally to qualified institutional buyers. At the end of the period, the value of these securities amounted to $1,703,331 or 0.1% of net assets.
(d) Restricted securities - Investment in securities not registered under the Securities Act of 1933 (excluding 144A issues). At the end of the period, the value of restricted securities (excluding 144A issues) amounted to $25,555,591 or 1.8% of net assets.
(e) Affiliated fund that is generally available only to investment companies and other accounts managed by Fidelity Investments. The rate quoted is the annualized seven-day yield of the fund at period end. A complete unaudited listing of the fund's holdings as of its most recent quarter end is available upon request. In addition, each Fidelity Central Fund's financial statements are available on the SEC's website or upon request.
(f) Investment made with cash collateral received from securities on loan.
Additional information on each restricted holding is as follows:
| Security | Acquisition Date | Acquisition Cost |
| China Internet Plus Holdings Ltd. | 1/26/15 | $4,794,731 |
| China Internet Plus Holdings Ltd. Series B | 12/11/15 | $7,885,430 |
| Nutanix, Inc. Series E | 8/26/14 | $535,364 |
| Uber Technologies, Inc. Series D, 8.00% | 6/6/14 | $3,600,020 |
Affiliated Central Funds
Information regarding fiscal year to date income earned by the Fund from investments in Fidelity Central Funds is as follows:
| Fund | Income earned |
| Fidelity Cash Central Fund | $19,192 |
| Fidelity Securities Lending Cash Central Fund | 459,108 |
| Total | $478,300 |
Investment Valuation
The following is a summary of the inputs used, as of January 31, 2016, involving the Fund's assets and liabilities carried at fair value. The inputs or methodology used for valuing securities may not be an indication of the risk associated with investing in those securities. For more information on valuation inputs, and their aggregation into the levels used below, please refer to the Investment Valuation section in the accompanying Notes to Financial Statements.
| | Valuation Inputs at Reporting Date: |
| Description | Total | Level 1 | Level 2 | Level 3 |
| Investments in Securities: | | | | |
| Common Stocks | $1,412,629,657 | $1,275,662,252 | $136,967,405 | $-- |
| Preferred Stocks | 25,555,591 | -- | -- | 25,555,591 |
| Money Market Funds | 79,323,997 | 79,323,997 | -- | -- |
| Total Investments in Securities: | $1,517,509,245 | $1,354,986,249 | $136,967,405 | $25,555,591 |
The following is a summary of transfers between Level 1 and Level 2 for the period ended January 31, 2016. Transfers are assumed to have occurred at the beginning of the period, and are primarily attributable to the valuation techniques used for foreign equity securities, as discussed in the accompanying Notes to Financial Statements:
| Transfers | Total |
| Level 1 to Level 2 | $93,113,352 |
| Level 2 to Level 1 | $0 |
The following is a reconciliation of Investments in Securities for which Level 3 inputs were used in determining value:
| Investments in Securities: | |
| Other Investments in Securities | |
| Beginning Balance | $12,656,409 |
| Total Realized Gain (Loss) | -- |
| Total Unrealized Gain (Loss) | -- |
| Cost of Purchases | -- |
| Proceeds of Sales | (1,038,740) |
| Amortization/Accretion | -- |
| Transfers in to Level 3 | -- |
| Transfers out of Level 3 | (11,617,669) |
| Ending Balance | $-- |
| The change in unrealized gain (loss) for the period attributable to Level 3 securities held at January 31, 2016 | $-- |
| Preferred Stocks | |
| Beginning Balance | $15,728,431 |
| Total Realized Gain (Loss) | -- |
| Total Unrealized Gain (Loss) | 1,941,730 |
| Cost of Purchases | 12,680,161 |
| Proceeds of Sales | (4,794,731) |
| Amortization/Accretion | -- |
| Transfers in to Level 3 | -- |
| Transfers out of Level 3 | -- |
| Ending Balance | $25,555,591 |
| The change in unrealized gain (loss) for the period attributable to Level 3 securities held at January 31, 2016 | $1,941,731 |
The information used in the above reconciliations represents fiscal year to date activity for any Investments in Securities identified as using Level 3 inputs at either the beginning or the end of the current fiscal period. Transfers in or out of Level 3 represent the beginning value of any Security or Instrument where a change in the pricing level occurred from the beginning to the end of the period. The cost of purchases and the proceeds of sales may include securities received or delivered through corporate actions or exchanges. Realized and unrealized gains (losses) disclosed in the reconciliation are included in Net Gain (Loss) on the Fund's Statement of Operations.
Other Information
Distribution of investments by country or territory of incorporation, as a percentage of Total Net Assets, is as follows (Unaudited):
| United States of America | 72.2% |
| Cayman Islands | 10.1% |
| Taiwan | 5.4% |
| Bermuda | 3.2% |
| Netherlands | 2.4% |
| Korea (South) | 1.9% |
| Japan | 1.9% |
| Ireland | 1.0% |
| Others (Individually Less Than 1%) | 1.9% |
| | 100.0% |
See accompanying notes which are an integral part of the financial statements.
Fidelity Advisor® Technology Fund
Financial Statements
Statement of Assets and Liabilities
| | | January 31, 2016 (Unaudited) |
| Assets | | |
Investment in securities, at value (including securities loaned of $74,958,638) — See accompanying schedule:
Unaffiliated issuers (cost $1,372,080,473) | $1,438,185,248 | |
| Fidelity Central Funds (cost $79,323,997) | 79,323,997 | |
| Total Investments (cost $1,451,404,470) | | $1,517,509,245 |
| Cash | | 640,052 |
| Receivable for investments sold | | 25,773,136 |
| Receivable for fund shares sold | | 3,496,618 |
| Dividends receivable | | 142,142 |
| Distributions receivable from Fidelity Central Funds | | 105,604 |
| Prepaid expenses | | 6,504 |
| Other receivables | | 69,241 |
| Total assets | | 1,547,742,542 |
| Liabilities | | |
| Payable for investments purchased | $28,200,774 | |
| Payable for fund shares redeemed | 4,332,597 | |
| Accrued management fee | 663,421 | |
| Distribution and service plan fees payable | 287,468 | |
| Other affiliated payables | 297,644 | |
| Other payables and accrued expenses | 87,216 | |
| Collateral on securities loaned, at value | 75,135,694 | |
| Total liabilities | | 109,004,814 |
| Net Assets | | $1,438,737,728 |
| Net Assets consist of: | | |
| Paid in capital | | $1,401,561,028 |
| Accumulated net investment loss | | (1,917,495) |
| Accumulated undistributed net realized gain (loss) on investments and foreign currency transactions | | (27,007,535) |
| Net unrealized appreciation (depreciation) on investments and assets and liabilities in foreign currencies | | 66,101,730 |
| Net Assets | | $1,438,737,728 |
| Calculation of Maximum Offering Price | | |
| Class A: | | |
| Net Asset Value and redemption price per share ($438,155,491 ÷ 13,548,071 shares) | | $32.34 |
| Maximum offering price per share (100/94.25 of $32.34) | | $34.31 |
| Class T: | | |
| Net Asset Value and redemption price per share ($187,692,764 ÷ 6,071,684 shares) | | $30.91 |
| Maximum offering price per share (100/96.50 of $30.91) | | $32.03 |
| Class B: | | |
| Net Asset Value and offering price per share ($6,273,029 ÷ 223,232 shares)(a) | | $28.10 |
| Class C: | | |
| Net Asset Value and offering price per share ($135,079,596 ÷ 4,798,880 shares)(a) | | $28.15 |
| Class I: | | |
| Net Asset Value, offering price and redemption price per share ($671,536,848 ÷ 19,540,391 shares) | | $34.37 |
(a) Redemption price per share is equal to net asset value less any applicable contingent deferred sales charge.
See accompanying notes which are an integral part of the financial statements.
Statement of Operations
| | | Six months ended January 31, 2016 (Unaudited) |
| Investment Income | | |
| Dividends | | $5,575,687 |
| Income from Fidelity Central Funds (including $459,108 from security lending) | | 478,300 |
| Total income | | 6,053,987 |
| Expenses | | |
| Management fee | $4,250,574 | |
| Transfer agent fees | 1,528,212 | |
| Distribution and service plan fees | 1,794,751 | |
| Accounting and security lending fees | 254,849 | |
| Custodian fees and expenses | 57,364 | |
| Independent trustees' compensation | 14,526 | |
| Registration fees | 68,271 | |
| Audit | 39,762 | |
| Legal | 14,112 | |
| Interest | 712 | |
| Miscellaneous | 7,988 | |
| Total expenses before reductions | 8,031,121 | |
| Expense reductions | (83,809) | 7,947,312 |
| Net investment income (loss) | | (1,893,325) |
| Realized and Unrealized Gain (Loss) | | |
| Net realized gain (loss) on: | | |
| Investment securities: | | |
| Unaffiliated issuers (net of foreign taxes of $41,234) | (13,591,342) | |
| Foreign currency transactions | (206,874) | |
| Total net realized gain (loss) | | (13,798,216) |
Change in net unrealized appreciation (depreciation) on:
Investment securities (net of decrease in deferred foreign taxes of $107,750) | (109,883,399) | |
| Assets and liabilities in foreign currencies | 8,905 | |
| Total change in net unrealized appreciation (depreciation) | | (109,874,494) |
| Net gain (loss) | | (123,672,710) |
| Net increase (decrease) in net assets resulting from operations | | $(125,566,035) |
See accompanying notes which are an integral part of the financial statements.
Statement of Changes in Net Assets
| | Six months ended January 31, 2016 (Unaudited) | Year ended July 31, 2015 |
| Increase (Decrease) in Net Assets | | |
| Operations | | |
| Net investment income (loss) | $(1,893,325) | $257,390 |
| Net realized gain (loss) | (13,798,216) | 123,100,237 |
| Change in net unrealized appreciation (depreciation) | (109,874,494) | 30,802,154 |
| Net increase (decrease) in net assets resulting from operations | (125,566,035) | 154,159,781 |
| Distributions to shareholders from net investment income | – | (1,694,661) |
| Distributions to shareholders from net realized gain | (70,068,833) | (115,642,281) |
| Total distributions | (70,068,833) | (117,336,942) |
| Share transactions - net increase (decrease) | 26,303,162 | 393,289,614 |
| Redemption fees | 23,770 | 24,197 |
| Total increase (decrease) in net assets | (169,307,936) | 430,136,650 |
| Net Assets | | |
| Beginning of period | 1,608,045,664 | 1,177,909,014 |
| End of period (including accumulated net investment loss of $1,917,495 and accumulated net investment loss of $24,170, respectively) | $1,438,737,728 | $1,608,045,664 |
See accompanying notes which are an integral part of the financial statements.
Financial Highlights — Fidelity Advisor Technology Fund Class A
| | Six months ended (Unaudited) | Years ended July 31, | | | | |
| January 31, | 2016 | 2015 | 2014 | 2013 | 2012 | 2011 |
| Selected Per–Share Data | | | | | | |
| Net asset value, beginning of period | $36.83 | $36.06 | $29.90 | $25.25 | $25.14 | $19.83 |
| Income from Investment Operations | | | | | | |
| Net investment income (loss)A | (.05) | (.02)B | (.12) | (.07) | (.13) | (.18) |
| Net realized and unrealized gain (loss) | (2.83) | 3.75 | 6.70 | 4.72 | .24 | 5.49 |
| Total from investment operations | (2.88) | 3.73 | 6.58 | 4.65 | .11 | 5.31 |
| Distributions from net investment income | – | (.02) | – | – | – | – |
| Distributions from net realized gain | (1.61) | (2.94) | (.42) | – | – | – |
| Total distributions | (1.61) | (2.96) | (.42) | – | – | – |
| Redemption fees added to paid in capitalA,C | – | – | – | – | – | – |
| Net asset value, end of period | $32.34 | $36.83 | $36.06 | $29.90 | $25.25 | $25.14 |
| Total ReturnD,E,F | (7.86)% | 10.94% | 22.15% | 18.42% | .44% | 26.78% |
| Ratios to Average Net AssetsG,H | | | | | | |
| Expenses before reductions | 1.09%I | 1.09% | 1.14% | 1.18% | 1.18% | 1.18% |
| Expenses net of fee waivers, if any | 1.09%I | 1.09% | 1.14% | 1.18% | 1.18% | 1.18% |
| Expenses net of all reductions | 1.08%I | 1.08% | 1.12% | 1.14% | 1.17% | 1.16% |
| Net investment income (loss) | (.30)%I | (.05)%B | (.35)% | (.25)% | (.55)% | (.73)% |
| Supplemental Data | | | | | | |
| Net assets, end of period (000 omitted) | $438,155 | $468,819 | $408,687 | $355,306 | $336,693 | $375,609 |
| Portfolio turnover rateJ | 123%I | 142%K | 186% | 142% | 201% | 167% |
A Calculated based on average shares outstanding during the period.
B Net Investment income per share reflects a large, non-recurring dividend which amounted to $.07 per share. Excluding this non-recurring dividend, the ratio of net investment income (loss) to average net assets would have been (.25) %.
C Amount represents less than $.005 per share.
D Total returns for periods of less than one year are not annualized.
E Total returns would have been lower if certain expenses had not been reduced during the applicable periods shown.
F Total returns do not include the effect of the sales charges.
G Fees and expenses of any underlying Fidelity Central Funds are not included in the Fund's expense ratio. The Fund indirectly bears its proportionate share of the expenses of any underlying Fidelity Central Funds.
H Expense ratios reflect operating expenses of the class. Expenses before reductions do not reflect amounts reimbursed by the investment adviser or reductions from brokerage service arrangements or reductions from other expense offset arrangements and do not represent the amount paid by the class during periods when reimbursements or reductions occur. Expenses net of fee waivers reflect expenses after reimbursement by the investment adviser but prior to reductions from brokerage service arrangements or other expense offset arrangements. Expenses net of all reductions represent the net expenses paid by the class.
I Annualized
J Amount does not include the portfolio activity of any underlying Fidelity Central Funds.
K Portfolio turnover rate excludes securities received or delivered in-kind.
See accompanying notes which are an integral part of the financial statements.
Financial Highlights — Fidelity Advisor Technology Fund Class T
| | Six months ended (Unaudited) | Years ended July 31, | | | | |
| January 31, | 2016 | 2015 | 2014 | 2013 | 2012 | 2011 |
| Selected Per–Share Data | | | | | | |
| Net asset value, beginning of period | $35.26 | $34.66 | $28.79 | $24.38 | $24.33 | $19.24 |
| Income from Investment Operations | | | | | | |
| Net investment income (loss)A | (.09) | (.11)B | (.19) | (.13) | (.19) | (.23) |
| Net realized and unrealized gain (loss) | (2.71) | 3.60 | 6.45 | 4.54 | .24 | 5.32 |
| Total from investment operations | (2.80) | 3.49 | 6.26 | 4.41 | .05 | 5.09 |
| Distributions from net realized gain | (1.55) | (2.89) | (.39) | – | – | – |
| Total distributions | (1.55) | (2.89) | (.39) | – | – | – |
| Redemption fees added to paid in capitalA,C | – | – | – | – | – | – |
| Net asset value, end of period | $30.91 | $35.26 | $34.66 | $28.79 | $24.38 | $24.33 |
| Total ReturnD,E,F | (7.97)% | 10.63% | 21.89% | 18.09% | .21% | 26.46% |
| Ratios to Average Net AssetsG,H | | | | | | |
| Expenses before reductions | 1.36%I | 1.35% | 1.38% | 1.42% | 1.43% | 1.43% |
| Expenses net of fee waivers, if any | 1.35%I | 1.35% | 1.38% | 1.42% | 1.43% | 1.43% |
| Expenses net of all reductions | 1.34%I | 1.34% | 1.37% | 1.39% | 1.42% | 1.40% |
| Net investment income (loss) | (.56)%I | (.31)%B | (.60)% | (.50)% | (.80)% | (.98)% |
| Supplemental Data | | | | | | |
| Net assets, end of period (000 omitted) | $187,693 | $208,192 | $196,067 | $173,692 | $172,709 | $196,913 |
| Portfolio turnover rateJ | 123%I | 142%K | 186% | 142% | 201% | 167% |
A Calculated based on average shares outstanding during the period.
B Net Investment income per share reflects a large, non-recurring dividend which amounted to $.07 per share. Excluding this non-recurring dividend, the ratio of net investment income (loss) to average net assets would have been (.51) %.
C Amount represents less than $.005 per share.
D Total returns for periods of less than one year are not annualized.
E Total returns would have been lower if certain expenses had not been reduced during the applicable periods shown.
F Total returns do not include the effect of the sales charges.
G Fees and expenses of any underlying Fidelity Central Funds are not included in the Fund's expense ratio. The Fund indirectly bears its proportionate share of the expenses of any underlying Fidelity Central Funds.
H Expense ratios reflect operating expenses of the class. Expenses before reductions do not reflect amounts reimbursed by the investment adviser or reductions from brokerage service arrangements or reductions from other expense offset arrangements and do not represent the amount paid by the class during periods when reimbursements or reductions occur. Expenses net of fee waivers reflect expenses after reimbursement by the investment adviser but prior to reductions from brokerage service arrangements or other expense offset arrangements. Expenses net of all reductions represent the net expenses paid by the class.
I Annualized
J Amount does not include the portfolio activity of any underlying Fidelity Central Funds.
K Portfolio turnover rate excludes securities received or delivered in-kind.
See accompanying notes which are an integral part of the financial statements.
Financial Highlights — Fidelity Advisor Technology Fund Class B
| | Six months ended (Unaudited) | Years ended July 31, | | | | |
| January 31, | 2016 | 2015 | 2014 | 2013 | 2012 | 2011 |
| Selected Per–Share Data | | | | | | |
| Net asset value, beginning of period | $32.15 | $31.83 | $26.56 | $22.60 | $22.67 | $18.01 |
| Income from Investment Operations | | | | | | |
| Net investment income (loss)A | (.17) | (.27)B | (.34) | (.24) | (.28) | (.33) |
| Net realized and unrealized gain (loss) | (2.46) | 3.29 | 5.94 | 4.20 | .21 | 4.99 |
| Total from investment operations | (2.63) | 3.02 | 5.60 | 3.96 | (.07) | 4.66 |
| Distributions from net realized gain | (1.42) | (2.70) | (.33) | – | – | – |
| Total distributions | (1.42) | (2.70) | (.33) | – | – | – |
| Redemption fees added to paid in capitalA,C | – | – | – | – | – | – |
| Net asset value, end of period | $28.10 | $32.15 | $31.83 | $26.56 | $22.60 | $22.67 |
| Total ReturnD,E,F | (8.24)% | 10.04% | 21.21% | 17.52% | (.31)% | 25.87% |
| Ratios to Average Net AssetsG,H | | | | | | |
| Expenses before reductions | 1.91%I | 1.91% | 1.92% | 1.93% | 1.93% | 1.93% |
| Expenses net of fee waivers, if any | 1.91%I | 1.91% | 1.92% | 1.93% | 1.93% | 1.93% |
| Expenses net of all reductions | 1.90%I | 1.90% | 1.91% | 1.89% | 1.92% | 1.91% |
| Net investment income (loss) | (1.12)%I | (.86)%B | (1.14)% | (1.01)% | (1.30)% | (1.49)% |
| Supplemental Data | | | | | | |
| Net assets, end of period (000 omitted) | $6,273 | $8,885 | $12,043 | $13,745 | $17,476 | $25,508 |
| Portfolio turnover rateJ | 123%I | 142%K | 186% | 142% | 201% | 167% |
A Calculated based on average shares outstanding during the period.
B Net Investment income per share reflects a large, non-recurring dividend which amounted to $.06 per share. Excluding this non-recurring dividend, the ratio of net investment income (loss) to average net assets would have been (1.07) %.
C Amount represents less than $.005 per share.
D Total returns for periods of less than one year are not annualized.
E Total returns would have been lower if certain expenses had not been reduced during the applicable periods shown.
F Total returns do not include the effect of the contingent deferred sales charge.
G Fees and expenses of any underlying Fidelity Central Funds are not included in the Fund's expense ratio. The Fund indirectly bears its proportionate share of the expenses of any underlying Fidelity Central Funds.
H Expense ratios reflect operating expenses of the class. Expenses before reductions do not reflect amounts reimbursed by the investment adviser or reductions from brokerage service arrangements or reductions from other expense offset arrangements and do not represent the amount paid by the class during periods when reimbursements or reductions occur. Expenses net of fee waivers reflect expenses after reimbursement by the investment adviser but prior to reductions from brokerage service arrangements or other expense offset arrangements. Expenses net of all reductions represent the net expenses paid by the class.
I Annualized
J Amount does not include the portfolio activity of any underlying Fidelity Central Funds.
K Portfolio turnover rate excludes securities received or delivered in-kind.
See accompanying notes which are an integral part of the financial statements.
Financial Highlights — Fidelity Advisor Technology Fund Class C
| | Six months ended (Unaudited) | Years ended July 31, | | | | |
| January 31, | 2016 | 2015 | 2014 | 2013 | 2012 | 2011 |
| Selected Per–Share Data | | | | | | |
| Net asset value, beginning of period | $32.27 | $31.99 | $26.68 | $22.70 | $22.77 | $18.09 |
| Income from Investment Operations | | | | | | |
| Net investment income (loss)A | (.16) | (.25)B | (.33) | (.24) | (.29) | (.33) |
| Net realized and unrealized gain (loss) | (2.46) | 3.29 | 5.98 | 4.22 | .22 | 5.01 |
| Total from investment operations | (2.62) | 3.04 | 5.65 | 3.98 | (.07) | 4.68 |
| Distributions from net realized gain | (1.50) | (2.76) | (.34) | – | – | – |
| Total distributions | (1.50) | (2.76) | (.34) | – | – | – |
| Redemption fees added to paid in capitalA,C | – | – | – | – | – | – |
| Net asset value, end of period | $28.15 | $32.27 | $31.99 | $26.68 | $22.70 | $22.77 |
| Total ReturnD,E,F | (8.18)% | 10.07% | 21.31% | 17.53% | (.31)% | 25.87% |
| Ratios to Average Net AssetsG,H | | | | | | |
| Expenses before reductions | 1.85%I | 1.84% | 1.87% | 1.91% | 1.93% | 1.92% |
| Expenses net of fee waivers, if any | 1.85%I | 1.84% | 1.87% | 1.91% | 1.93% | 1.92% |
| Expenses net of all reductions | 1.84%I | 1.83% | 1.86% | 1.88% | 1.91% | 1.90% |
| Net investment income (loss) | (1.06)%I | (.80)%B | (1.09)% | (.99)% | (1.29)% | (1.48)% |
| Supplemental Data | | | | | | |
| Net assets, end of period (000 omitted) | $135,080 | $138,205 | $105,499 | $84,858 | $88,074 | $89,819 |
| Portfolio turnover rateJ | 123%I | 142%K | 186% | 142% | 201% | 167% |
A Calculated based on average shares outstanding during the period.
B Net Investment income per share reflects a large, non-recurring dividend which amounted to $.06 per share. Excluding this non-recurring dividend, the ratio of net investment income (loss) to average net assets would have been (1.00) %.
C Amount represents less than $.005 per share.
D Total returns for periods of less than one year are not annualized.
E Total returns would have been lower if certain expenses had not been reduced during the applicable periods shown.
F Total returns do not include the effect of the contingent deferred sales charge.
G Fees and expenses of any underlying Fidelity Central Funds are not included in the Fund's expense ratio. The Fund indirectly bears its proportionate share of the expenses of any underlying Fidelity Central Funds.
H Expense ratios reflect operating expenses of the class. Expenses before reductions do not reflect amounts reimbursed by the investment adviser or reductions from brokerage service arrangements or reductions from other expense offset arrangements and do not represent the amount paid by the class during periods when reimbursements or reductions occur. Expenses net of fee waivers reflect expenses after reimbursement by the investment adviser but prior to reductions from brokerage service arrangements or other expense offset arrangements. Expenses net of all reductions represent the net expenses paid by the class.
I Annualized
J Amount does not include the portfolio activity of any underlying Fidelity Central Funds.
K Portfolio turnover rate excludes securities received or delivered in-kind.
See accompanying notes which are an integral part of the financial statements.
Financial Highlights — Fidelity Advisor Technology Fund Class I
| | Six months ended (Unaudited) | Years ended July 31, | | | | |
| January 31, | 2016 | 2015 | 2014 | 2013 | 2012 | 2011 |
| Selected Per–Share Data | | | | | | |
| Net asset value, beginning of period | $39.03 | $38.06 | $31.47 | $26.50 | $26.30 | $20.68 |
| Income from Investment Operations | | | | | | |
| Net investment income (loss)A | .01 | .11B | (.02) | .02 | (.06) | (.11) |
| Net realized and unrealized gain (loss) | (3.00) | 3.96 | 7.06 | 4.95 | .26 | 5.73 |
| Total from investment operations | (2.99) | 4.07 | 7.04 | 4.97 | .20 | 5.62 |
| Distributions from net investment income | – | (.07) | – | – | – | – |
| Distributions from net realized gain | (1.67) | (3.03) | (.45) | – | – | – |
| Total distributionsC | (1.67) | (3.10) | (.45) | – | – | – |
| Redemption fees added to paid in capitalA | – | – | – | – | – | – |
| Net asset value, end of period | $34.37 | $39.03 | $38.06 | $31.47 | $26.50 | $26.30 |
| Total ReturnD,E | (7.68)% | 11.30% | 22.55% | 18.75% | .76% | 27.18% |
| Ratios to Average Net AssetsF,G | | | | | | |
| Expenses before reductions | .76%H | .75% | .83% | .86% | .86% | .87% |
| Expenses net of fee waivers, if any | .76%H | .75% | .83% | .86% | .86% | .87% |
| Expenses net of all reductions | .75%H | .74% | .82% | .83% | .85% | .85% |
| Net investment income (loss) | .03%H | .29%B | (.05)% | .06% | (.23)% | (.43)% |
| Supplemental Data | | | | | | |
| Net assets, end of period (000 omitted) | $671,537 | $783,945 | $455,612 | $218,944 | $95,310 | $81,350 |
| Portfolio turnover rateI | 123%H | 142%J | 186% | 142% | 201% | 167% |
A Calculated based on average shares outstanding during the period.
B Net Investment income per share reflects a large, non-recurring dividend which amounted to $.08 per share. Excluding this non-recurring dividend, the ratio of net investment income (loss) to average net assets would have been .09%.
C Amount represents less than $.005 per share.
D Total returns for periods of less than one year are not annualized.
E Total returns would have been lower if certain expenses had not been reduced during the applicable periods shown.
F Fees and expenses of any underlying Fidelity Central Funds are not included in the Fund's expense ratio. The Fund indirectly bears its proportionate share of the expenses of any underlying Fidelity Central Funds.
G Expense ratios reflect operating expenses of the class. Expenses before reductions do not reflect amounts reimbursed by the investment adviser or reductions from brokerage service arrangements or reductions from other expense offset arrangements and do not represent the amount paid by the class during periods when reimbursements or reductions occur. Expenses net of fee waivers reflect expenses after reimbursement by the investment adviser but prior to reductions from brokerage service arrangements or other expense offset arrangements. Expenses net of all reductions represent the net expenses paid by the class.
H Annualized
I Amount does not include the portfolio activity of any underlying Fidelity Central Funds.
J Portfolio turnover rate excludes securities received or delivered in-kind.
See accompanying notes which are an integral part of the financial statements.
Notes to Financial Statements (Unaudited)
For the period ended January 31, 2016
1. Organization.
Fidelity Advisor Technology Fund (the Fund) is a non-diversified fund of Fidelity Advisor Series VII (the Trust) and is authorized to issue an unlimited number of shares. The Trust is registered under the Investment Company Act of 1940, as amended (the 1940 Act), as an open-end management investment company organized as a Massachusetts business trust. The Fund offers Class A, Class T, Class C and Class I shares, each of which, along with Class B shares, has equal rights as to assets and voting privileges. Class B shares are closed to new accounts and additional purchases, except for exchanges and reinvestments. Each class has exclusive voting rights with respect to matters that affect that class. Class B shares will automatically convert to Class A shares after a holding period of seven years from the initial date of purchase. The Fund's investments in emerging markets can be subject to social, economic, regulatory, and political uncertainties and can be extremely volatile.
During the period, the Board of Trustees approved the conversion of all existing Class B shares into Class A shares, effective on or about July 1, 2016, regardless of the length of times shares have been held.
2. Investments in Fidelity Central Funds.
The Fund invests in Fidelity Central Funds, which are open-end investment companies generally available only to other investment companies and accounts managed by the investment adviser and its affiliates. The Fund's Schedule of Investments lists each of the Fidelity Central Funds held as of period end, if any, as an investment of the Fund, but does not include the underlying holdings of each Fidelity Central Fund. As an Investing Fund, the Fund indirectly bears its proportionate share of the expenses of the underlying Fidelity Central Funds.
The Money Market Central Funds seek preservation of capital and current income and are managed by Fidelity Investments Money Management, Inc. (FIMM), an affiliate of the investment adviser. Annualized expenses of the Money Market Central Funds as of their most recent shareholder report date are less than .005%.
A complete unaudited list of holdings for each Fidelity Central Fund is available upon request or at the Securities and Exchange Commission (the SEC) website at www.sec.gov. In addition, the financial statements of the Fidelity Central Funds are available on the SEC website or upon request.
3. Significant Accounting Policies.
The financial statements have been prepared in conformity with accounting principles generally accepted in the United States of America (GAAP), which require management to make certain estimates and assumptions at the date of the financial statements. Actual results could differ from those estimates. Subsequent events, if any, through the date that the financial statements were issued have been evaluated in the preparation of the financial statements. The following summarizes the significant accounting policies of the Fund:
Investment Valuation. Investments are valued as of 4:00 p.m. Eastern time on the last calendar day of the period. The Board of Trustees (the Board) has delegated the day to day responsibility for the valuation of the Fund's investments to the Fidelity SelectCo, LLC (SelectCo) Fair Value Committee (the Committee). In accordance with valuation policies and procedures approved by the Board, the Fund attempts to obtain prices from one or more third party pricing vendors or brokers to value its investments. When current market prices, quotations or currency exchange rates are not readily available or reliable, investments will be fair valued in good faith by the Committee, in accordance with procedures adopted by the Board. Factors used in determining fair value vary by investment type and may include market or investment specific events. The frequency with which these procedures are used cannot be predicted and they may be utilized to a significant extent. The Committee oversees the Fund's valuation policies and procedures and reports to the Board on the Committee's activities and fair value determinations. The Board monitors the appropriateness of the procedures used in valuing the Fund's investments and ratifies the fair value determinations of the Committee.
The Fund categorizes the inputs to valuation techniques used to value its investments into a disclosure hierarchy consisting of three levels as shown below:
- Level 1 – quoted prices in active markets for identical investments
- Level 2 – other significant observable inputs (including quoted prices for similar investments, interest rates, prepayment speeds, etc.)
- Level 3 – unobservable inputs (including the Fund's own assumptions based on the best information available)
Valuation techniques used to value the Fund's investments by major category are as follows:
Equity securities, including restricted securities, for which market quotations are readily available, are valued at the last reported sale price or official closing price as reported by a third party pricing vendor on the primary market or exchange on which they are traded and are categorized as Level 1 in the hierarchy. In the event there were no sales during the day or closing prices are not available, securities are valued at the last quoted bid price or may be valued using the last available price and are generally categorized as Level 2 in the hierarchy. For foreign equity securities, when market or security specific events arise, comparisons to the valuation of American Depositary Receipts (ADRs), futures contracts, Exchange-Traded Funds (ETFs) and certain indexes as well as quoted prices for similar securities may be used and would be categorized as Level 2 in the hierarchy. Utilizing these techniques may result in transfers between Level 1 and Level 2. For equity securities, including restricted securities, where observable inputs are limited, assumptions about market activity and risk are used and these securities may be categorized as Level 3 in the hierarchy. Equity securities, including restricted securities, for which observable inputs are not available are valued using alternate valuation approaches, including the market approach and the income approach and are categorized as Level 3 in the hierarchy. The market approach generally consists of using comparable market transactions while the income approach generally consists of using the net present value of estimated future cash flows, adjusted as appropriate for liquidity, credit, market and/or other risk factors.
Investments in open-end mutual funds, including the Fidelity Central Funds, are valued at their closing net asset value (NAV) each business day and are categorized as Level 1 in the hierarchy.
The following provides information on Level 3 securities held by the Fund that were valued at period end based on unobservable inputs. These amounts exclude valuations provided by a broker.
| Asset Type | Fair Value at 01/31/16 | Valuation Technique(s) | Unobservable Input | Amount or Range/Weighted Average | Impact to Valuation from an Increase in Input* |
| Equities | $ 25,555,591 | Last transaction price | Transaction price | $3.86 - $48.77 / $24.14 | Increase |
| | | Market comparable | EV/Sales multiple | 3.6 | Increase |
| | | | Discount rate | 10.0% | Decrease |
* Represents the expected directional change in the fair value of the Level 3 investments that would result from an increase in the corresponding input. A decrease to the unobservable input would have the opposite effect. Significant changes in these inputs could result in significantly higher or lower fair value measurements.
Changes in valuation techniques may result in transfers in or out of an assigned level within the disclosure hierarchy. The aggregate value of investments by input level as of January 31, 2016, including information on transfers between Levels 1 and 2, as well as a roll forward of Level 3 investments, is included at the end of the Fund's Schedule of Investments.
Foreign Currency. The Fund may use foreign currency contracts to facilitate transactions in foreign-denominated securities. Gains and losses from these transactions may arise from changes in the value of the foreign currency or if the counterparties do not perform under the contracts' terms.
Foreign-denominated assets, including investment securities, and liabilities are translated into U.S. dollars at the exchange rates at period end. Purchases and sales of investment securities, income and dividends received and expenses denominated in foreign currencies are translated into U.S. dollars at the exchange rate in effect on the transaction date.
The effects of exchange rate fluctuations on investments are included with the net realized and unrealized gain (loss) on investment securities. Other foreign currency transactions resulting in realized and unrealized gain (loss) are disclosed separately.
Investment Transactions and Income. For financial reporting purposes, the Fund's investment holdings and NAV include trades executed through the end of the last business day of the period. The NAV per share for processing shareholder transactions is calculated as of the close of business of the New York Stock Exchange (NYSE), normally 4:00 p.m. Eastern time and includes trades executed through the end of the prior business day. Gains and losses on securities sold are determined on the basis of identified cost and may include proceeds received from litigation. Dividend income is recorded on the ex-dividend date, except for certain dividends from foreign securities where the ex-dividend date may have passed, which are recorded as soon as the Fund is informed of the ex-dividend date. Non-cash dividends included in dividend income, if any, are recorded at the fair market value of the securities received. Income and capital gain distributions from Fidelity Central Funds, if any, are recorded on the ex-dividend date. Distributions received on securities that represent a return of capital or capital gain are recorded as a reduction of cost of investments and/or as a realized gain. Subsequent to ex-dividend date the Fund determines the components of these distributions, based upon receipt of tax filings or other correspondence relating to the underlying investment. Investment income is recorded net of foreign taxes withheld where recovery of such taxes is uncertain.
Class Allocations and Expenses. Investment income, realized and unrealized capital gains and losses, common expenses of the Fund, and certain fund-level expense reductions, if any, are allocated daily on a pro-rata basis to each class based on the relative net assets of each class to the total net assets of the Fund. Each class differs with respect to transfer agent and distribution and service plan fees incurred. Certain expense reductions may also differ by class. For the reporting period, the allocated portion of income and expenses to each class as a percent of its average net assets may vary due to the timing of recording these transactions in relation to fluctuating net assets of the classes. Expenses directly attributable to a fund are charged to that fund. Expenses attributable to more than one fund are allocated among the respective funds on the basis of relative net assets or other appropriate methods. Expense estimates are accrued in the period to which they relate and adjustments are made when actual amounts are known.
Deferred Trustee Compensation. Under a Deferred Compensation Plan (the Plan), independent Trustees may elect to defer receipt of a portion of their annual compensation. Deferred amounts are invested in a cross-section of Fidelity funds, are marked-to-market and remain in the Fund until distributed in accordance with the Plan. The investment of deferred amounts and the offsetting payable to the Trustees are included in the accompanying Statement of Assets and Liabilities.
Income Tax Information and Distributions to Shareholders. Each year, the Fund intends to qualify as a regulated investment company under Subchapter M of the Internal Revenue Code, including distributing substantially all of its taxable income and realized gains. As a result, no provision for U.S. Federal income taxes is required. The Fund files a U.S. federal tax return, in addition to state and local tax returns as required. The Fund's federal income tax returns are subject to examination by the Internal Revenue Service (IRS) for a period of three fiscal years after they are filed. State and local tax returns may be subject to examination for an additional fiscal year depending on the jurisdiction. Foreign taxes are provided for based on the Fund's understanding of the tax rules and rates that exist in the foreign markets in which it invests. The Fund is subject to a tax imposed on capital gains by certain countries in which it invests.
Distributions are declared and recorded on the ex-dividend date. Income dividends and capital gain distributions are declared separately for each class. Income and capital gain distributions are determined in accordance with income tax regulations, which may differ from GAAP.
Capital accounts within the financial statements are adjusted for permanent book-tax differences. These adjustments have no impact on net assets or the results of operations. Capital accounts are not adjusted for temporary book-tax differences which will reverse in a subsequent period.
Book-tax differences are primarily due to foreign currency transactions, passive foreign investment companies (PFIC), redemptions in kind, deferred trustees compensation and losses deferred due to wash sales.
The federal tax cost of investment securities and unrealized appreciation (depreciation) as of period end were as follows:
| Gross unrealized appreciation | $231,659,674 |
| Gross unrealized depreciation | (179,284,463) |
| Net unrealized appreciation (depreciation) on securities | $52,375,211 |
| Tax cost | $1,465,134,034 |
Short-Term Trading (Redemption) Fees. Shares held by investors in the Fund less than 30 days may have been subject to a redemption fee equal to .75% of the NAV of shares redeemed. All redemption fees, which reduce the proceeds of the shareholder redemption, are retained by the Fund and accounted for as an addition to paid in capital.
Restricted Securities. The Fund may invest in securities that are subject to legal or contractual restrictions on resale. These securities generally may be resold in transactions exempt from registration or to the public if the securities are registered. Disposal of these securities may involve time-consuming negotiations and expense, and prompt sale at an acceptable price may be difficult. Information regarding restricted securities is included at the end of the Fund's Schedule of Investments.
4. Purchases and Sales of Investments.
Purchases and sales of securities, other than short-term securities, aggregated $937,907,376 and $961,876,227, respectively.
5. Fees and Other Transactions with Affiliates.
Management Fee. Fidelity SelectCo, LLC (the investment adviser) and its affiliates provide the Fund with investment management related services for which the Fund pays a monthly management fee. The management fee is the sum of an individual fund fee rate that is based on an annual rate of .30% of the Fund's average net assets and an annualized group fee rate that averaged .25% during the period. The group fee rate is based upon the average net assets of all the mutual funds advised by Fidelity Management & Research Company (FMR) and the investment adviser. The group fee rate decreases as assets under management increase and increases as assets under management decrease. For the reporting period, the total annualized management fee rate was .55% of the Fund's average net assets.
Distribution and Service Plan Fees. In accordance with Rule 12b-1 of the 1940 Act, the Fund has adopted separate Distribution and Service Plans for each class of shares. Certain classes pay Fidelity Distributors Corporation (FDC), an affiliate of the investment adviser, separate Distribution and Service Fees, each of which is based on an annual percentage of each class' average net assets. In addition, FDC may pay financial intermediaries for selling shares of the Fund and providing shareholder support services. For the period, the Distribution and Service Fee rates, total fees and amounts retained by FDC were as follows:
| | Distribution
Fee | Service
Fee | Total Fees | Retained
by FDC |
| Class A | -% | .25% | $570,271 | $- |
| Class T | .25% | .25% | 496,638 | - |
| Class B | .75% | .25% | 37,979 | 28,484 |
| Class C | .75% | .25% | 689,863 | 145,428 |
| | | | $1,794,751 | $173,912 |
Sales Load. FDC may receive a front-end sales charge of up to 5.75% for selling Class A shares and 3.50% for selling Class T shares, some of which is paid to financial intermediaries for selling shares of the Fund. Depending on the holding period, FDC may receive contingent deferred sales charges levied on Class A, Class T, Class B, and Class C redemptions. The deferred sales charges range from 5.00% to 1.00% for Class B shares, 1.00% for Class C shares, 1.00% for certain purchases of Class A shares and .25% for certain purchases of Class T shares.
For the period, sales charge amounts retained by FDC were as follows:
| | Retained
by FDC |
| Class A | $79,247 |
| Class T | 15,051 |
| Class B(a) | 652 |
| Class C(a) | 11,624 |
| | $106,574 |
(a) When Class B and Class C shares are initially sold, FDC pays commissions from its own resources to financial intermediaries through which the sales are made.
Transfer Agent Fees. Fidelity Investments Institutional Operations Company, Inc., (FIIOC), an affiliate of the investment adviser, is the transfer, dividend disbursing and shareholder servicing agent for each class of the Fund. FIIOC receives account fees and asset-based fees that vary according to the account size and type of account of the shareholders of the respective classes of the Fund. FIIOC pays for typesetting, printing and mailing of shareholder reports, except proxy statements.
For the period, transfer agent fees for each class were as follows:
| | Amount | % of
Class-Level Average
Net Assets(a) |
| Class A | $539,687 | .24 |
| Class T | 247,069 | .25 |
| Class B | 11,563 | .30 |
| Class C | 168,158 | .24 |
| Class I | 561,735 | .15 |
| | $1,528,212 | |
(a) Annualized
Accounting and Security Lending Fees. Fidelity Service Company, Inc. (FSC), an affiliate of the investment adviser, maintains the Fund's accounting records. The accounting fee is based on the level of average net assets for each month. Under a separate contract, FSC administers the security lending program. The security lending fee is based on the number and duration of lending transactions.
Brokerage Commissions. The Fund placed a portion of its portfolio transactions with brokerage firms which are affiliates of the investment adviser. Brokerage commissions are included in net realized gain (loss) and change in net unrealized appreciation (depreciation) in the Statement of Operations. The commissions paid to these affiliated firms were $18,183 for the period.
Interfund Lending Program. Pursuant to an Exemptive Order issued by the SEC, the Fund, along with other registered investment companies having management contracts with FMR or other affiliated entities of FMR, may participate in an interfund lending program. This program provides an alternative credit facility allowing the funds to borrow from, or lend money to, other participating affiliated funds. At period end, there were no interfund loans outstanding. The Fund's activity in this program during the period for which loans were outstanding was as follows:
| Borrower or Lender | Average Loan Balance | Weighted Average Interest Rate | Interest Expense |
| Borrower | $7,119,143 | .51% | $712 |
Interfund Trades. The Fund may purchase from or sell securities to other Fidelity Funds under procedures adopted by the Board. The procedures have been designed to ensure these interfund trades are executed in accordance with Rule 17a-7 of the 1940 Act. Interfund trades are included within the respective purchases and sales amounts shown in the Purchases and Sales of Investments note.
6. Committed Line of Credit.
The Fund participates with other funds managed by the investment adviser or an affiliate in a $4.25 billion credit facility (the "line of credit") to be utilized for temporary or emergency purposes to fund shareholder redemptions or for other short-term liquidity purposes. The Fund has agreed to pay commitment fees on its pro-rata portion of the line of credit, which amounted to $1,050 and is reflected in Miscellaneous expenses on the Statement of Operations. During the period, the Fund did not borrow on this line of credit.
7. Security Lending.
The Fund lends portfolio securities through a lending agent from time to time in order to earn additional income. On the settlement date of the loan, the Fund receives collateral (in the form of U.S. Treasury obligations, letters of credit and/or cash) against the loaned securities and maintains collateral in an amount not less than 100% of the market value of the loaned securities during the period of the loan. The market value of the loaned securities is determined at the close of business of the Fund and any additional required collateral is delivered to the Fund on the next business day. The Fund or borrower may terminate the loan at any time, and if the borrower defaults on its obligation to return the securities loaned because of insolvency or other reasons, the Fund may apply collateral received from the borrower against the obligation. The Fund may experience delays and costs in recovering the securities loaned. Any cash collateral received is invested in the Fidelity Securities Lending Cash Central Fund. The value of loaned securities and cash collateral at period end are disclosed on the Fund's Statement of Assets and Liabilities. Security lending income represents the income earned on investing cash collateral, less rebates paid to borrowers and any lending agent fees associated with the loan, plus any premium payments received for lending certain types of securities. Security lending income is presented in the Statement of Operations as a component of income from Fidelity Central Funds.
8. Expense Reductions.
Commissions paid to certain brokers with whom the investment adviser, or its affiliates, places trades on behalf of the Fund include an amount in addition to trade execution, which may be rebated back to the Fund to offset certain expenses. This amount totaled $77,970 for the period.
In addition, during the period the investment advisor reimbursed/waived a portion of fund-level operating expenses in the amount of $5,839.
9. Distributions to Shareholders.
Distributions to shareholders of each class were as follows:
| | Six months ended January 31, 2016 | Year ended July 31, 2015 |
| From net investment income | | |
| Class A | $– | $285,364 |
| Class I | – | 1,409,297 |
| Total | $– | $1,694,661 |
| From net realized gain | | |
| Class A | $20,472,714 | $33,752,271 |
| Class T | 9,063,088 | 16,437,395 |
| Class B | 374,802 | 983,656 |
| Class C | 6,550,928 | 9,419,892 |
| Class I | 33,607,301 | 55,049,067 |
| Total | $70,068,833 | $115,642,281 |
10. Share Transactions.
Share transactions for each class were as follows and may contain automatic conversions between classes or exchanges between affiliated funds:
| | Shares | Shares | Dollars | Dollars |
| | Six months ended January 31, 2016 | Year ended July 31, 2015 | Six months ended January 31, 2016 | Year ended July 31, 2015 |
| Class A | | | | |
| Shares sold | 1,773,219 | 2,913,106 | $61,129,456 | $105,555,201 |
| Reinvestment of distributions | 590,741 | 901,782 | 19,252,252 | 31,562,947 |
| Shares redeemed | (1,546,674) | (2,417,005) | (52,559,612) | (86,800,900) |
| Net increase (decrease) | 817,286 | 1,397,883 | $27,822,096 | $50,317,248 |
| Class T | | | | |
| Shares sold | 428,365 | 637,105 | $14,104,967 | $22,054,709 |
| Reinvestment of distributions | 284,010 | 476,624 | 8,858,269 | 16,015,842 |
| Shares redeemed | (544,745) | (866,616) | (17,660,693) | (29,828,780) |
| Net increase (decrease) | 167,630 | 247,113 | $5,302,543 | $8,241,771 |
| Class B | | | | |
| Shares sold | 6,296 | 11,273 | $188,902 | $348,144 |
| Reinvestment of distributions | 12,391 | 29,273 | 352,034 | 901,739 |
| Shares redeemed | (71,823) | (142,494) | (2,145,688) | (4,494,534) |
| Net increase (decrease) | (53,136) | (101,948) | $(1,604,752) | $(3,244,651) |
| Class C | | | | |
| Shares sold | 710,262 | 1,277,139 | $21,299,797 | $40,629,084 |
| Reinvestment of distributions | 202,969 | 261,235 | 5,774,470 | 8,065,851 |
| Shares redeemed | (396,652) | (554,231) | (11,605,149) | (17,408,387) |
| Net increase (decrease) | 516,579 | 984,143 | $15,469,118 | $31,286,548 |
| Class I | | | | |
| Shares sold | 1,413,558 | 23,671,191(a) | $51,512,643 | $899,915,317(a) |
| Reinvestment of distributions | 955,239 | 1,510,080 | 33,041,700 | 55,853,504 |
| Shares redeemed | (2,913,152) | (17,066,384)(b) | (105,240,186) | (649,080,123)(b) |
| Net increase (decrease) | (544,355) | 8,114,887 | $(20,685,843) | $306,688,698 |
(a) Amount includes in-kind exchanges.
(b) Amount includes in-kind redemptions.
11. Other.
The Fund's organizational documents provide former and current trustees and officers with a limited indemnification against liabilities arising in connection with the performance of their duties to the Fund. In the normal course of business, the Fund may also enter into contracts that provide general indemnifications. The Fund's maximum exposure under these arrangements is unknown as this would be dependent on future claims that may be made against the Fund. The risk of material loss from such claims is considered remote.
At the end of the period, Strategic Advisers Core Fund was the owner of record of approximately 31% of the total outstanding shares of the Fund.
Fidelity Advisor® Utilities Fund
Investment Summary (Unaudited)
Top Ten Stocks as of January 31, 2016
| | % of fund's net assets | % of fund's net assets 6 months ago |
| NextEra Energy, Inc. | 17.8 | 16.1 |
| Exelon Corp. | 12.2 | 13.0 |
| Sempra Energy | 10.1 | 11.2 |
| Dominion Resources, Inc. | 9.0 | 9.0 |
| PG&E Corp. | 4.9 | 4.6 |
| PPL Corp. | 4.8 | 4.9 |
| Avangrid, Inc. | 4.4 | 0.0 |
| Edison International | 4.4 | 4.9 |
| DTE Energy Co. | 4.1 | 2.1 |
| Calpine Corp. | 3.8 | 4.3 |
| | 75.5 | |
Top Industries (% of fund's net assets)
| As of January 31, 2016 |
| | Electric Utilities | 47.7% |
| | Multi-Utilities | 36.4% |
| | Independent Power and Renewable Electricity Producers | 9.1% |
| | Media | 3.4% |
| | Real Estate Investment Trusts | 1.5% |
| | All Others* | 1.9% |

| As of July 31, 2015 |
| | Electric Utilities | 48.8% |
| | Multi-Utilities | 30.8% |
| | Independent Power and Renewable Electricity Producers | 11.6% |
| | Oil, Gas & Consumable Fuels | 4.7% |
| | Real Estate Investment Trusts | 2.7% |
| | All Others* | 1.4% |

* Includes Short-Term investments and Net Other Assets (Liabilities).
Percentages shown as 0.0% may reflect amounts less than 0.05%.
Fidelity Advisor® Utilities Fund
Investments January 31, 2016 (Unaudited)
Showing Percentage of Net Assets
| Common Stocks - 99.1% | | | |
| | | Shares | Value |
| Electric Utilities - 47.7% | | | |
| Electric Utilities - 47.7% | | | |
| Edison International | | 173,202 | $10,703,884 |
| Exelon Corp. | | 1,006,941 | 29,775,245 |
| FirstEnergy Corp. | | 257,300 | 8,506,338 |
| ITC Holdings Corp. | | 143,500 | 5,725,650 |
| NextEra Energy, Inc. | | 390,940 | 43,671,908 |
| OGE Energy Corp. | | 114,523 | 3,003,938 |
| PNM Resources, Inc. | | 112,200 | 3,524,202 |
| PPL Corp. | | 337,872 | 11,845,792 |
| | | | 116,756,957 |
| Independent Power and Renewable Electricity Producers - 9.1% | | | |
| Independent Power Producers & Energy Traders - 8.2% | | | |
| Calpine Corp. (a) | | 613,217 | 9,388,352 |
| Dynegy, Inc. (a) | | 306,557 | 3,629,635 |
| NRG Energy, Inc. | | 222,735 | 2,369,900 |
| NRG Yield, Inc. Class C (b) | | 139,220 | 1,843,273 |
| The AES Corp. | | 296,100 | 2,812,950 |
| | | | 20,044,110 |
| Renewable Electricity - 0.9% | | | |
| NextEra Energy Partners LP | | 32,900 | 887,971 |
| Pattern Energy Group, Inc. (b) | | 76,400 | 1,447,780 |
| | | | 2,335,751 |
|
| TOTAL INDEPENDENT POWER AND RENEWABLE ELECTRICITY PRODUCERS | | | 22,379,861 |
|
| Media - 3.4% | | | |
| Cable & Satellite - 3.4% | | | |
| Comcast Corp. Class A | | 147,900 | 8,239,509 |
| Multi-Utilities - 36.4% | | | |
| Multi-Utilities - 36.4% | | | |
| Avangrid, Inc. (a) | | 280,900 | 10,800,605 |
| Black Hills Corp. | | 46,200 | 2,276,736 |
| Dominion Resources, Inc. | | 305,999 | 22,083,948 |
| DTE Energy Co. | | 118,098 | 10,039,511 |
| NiSource, Inc. | | 345,883 | 7,267,002 |
| PG&E Corp. | | 216,618 | 11,894,494 |
| Sempra Energy | | 260,737 | 24,704,831 |
| | | | 89,067,127 |
| Oil, Gas & Consumable Fuels - 1.0% | | | |
| Oil & Gas Storage & Transport - 1.0% | | | |
| Cheniere Energy Partners LP Holdings LLC | | 166,562 | 2,486,771 |
| Real Estate Investment Trusts - 1.5% | | | |
| Specialized REITs - 1.5% | | | |
| Crown Castle International Corp. | | 43,500 | 3,749,700 |
| TOTAL COMMON STOCKS | | | |
| (Cost $229,094,479) | | | 242,679,925 |
|
| Money Market Funds - 1.6% | | | |
| Fidelity Cash Central Fund, 0.38% (c) | | 1,622,622 | 1,622,622 |
| Fidelity Securities Lending Cash Central Fund, 0.42% (c)(d) | | 2,459,975 | 2,459,975 |
| TOTAL MONEY MARKET FUNDS | | | |
| (Cost $4,082,597) | | | 4,082,597 |
| TOTAL INVESTMENT PORTFOLIO - 100.7% | | | |
| (Cost $233,177,076) | | | 246,762,522 |
| NET OTHER ASSETS (LIABILITIES) - (0.7)% | | | (1,834,131) |
| NET ASSETS - 100% | | | $244,928,391 |
Legend
(a) Non-income producing
(b) Security or a portion of the security is on loan at period end.
(c) Affiliated fund that is generally available only to investment companies and other accounts managed by Fidelity Investments. The rate quoted is the annualized seven-day yield of the fund at period end. A complete unaudited listing of the fund's holdings as of its most recent quarter end is available upon request. In addition, each Fidelity Central Fund's financial statements are available on the SEC's website or upon request.
(d) Investment made with cash collateral received from securities on loan.
Affiliated Central Funds
Information regarding fiscal year to date income earned by the Fund from investments in Fidelity Central Funds is as follows:
| Fund | Income earned |
| Fidelity Cash Central Fund | $1,511 |
| Fidelity Securities Lending Cash Central Fund | 3,427 |
| Total | $4,938 |
Investment Valuation
All investments are categorized as Level 1 under the Fair Value Hierarchy. The inputs or methodology used for valuing securities may not be an indication of the risk associated with investing in those securities. For more information on valuation inputs please refer to the Investment Valuation section in the accompanying Notes to Financial Statements.
See accompanying notes which are an integral part of the financial statements.
Fidelity Advisor® Utilities Fund
Financial Statements
Statement of Assets and Liabilities
| | | January 31, 2016 (Unaudited) |
| Assets | | |
Investment in securities, at value (including securities loaned of $2,381,953) — See accompanying schedule:
Unaffiliated issuers (cost $229,094,479) | $242,679,925 | |
| Fidelity Central Funds (cost $4,082,597) | 4,082,597 | |
| Total Investments (cost $233,177,076) | | $246,762,522 |
| Receivable for fund shares sold | | 968,491 |
| Dividends receivable | | 178,340 |
| Distributions receivable from Fidelity Central Funds | | 1,435 |
| Prepaid expenses | | 1,119 |
| Other receivables | | 7,601 |
| Total assets | | 247,919,508 |
| Liabilities | | |
| Payable for investments purchased | $79,246 | |
| Payable for fund shares redeemed | 178,187 | |
| Accrued management fee | 107,177 | |
| Distribution and service plan fees payable | 81,617 | |
| Other affiliated payables | 58,294 | |
| Other payables and accrued expenses | 26,621 | |
| Collateral on securities loaned, at value | 2,459,975 | |
| Total liabilities | | 2,991,117 |
| Net Assets | | $244,928,391 |
| Net Assets consist of: | | |
| Paid in capital | | $244,805,100 |
| Distributions in excess of net investment income | | (203,800) |
| Accumulated undistributed net realized gain (loss) on investments | | (13,258,055) |
| Net unrealized appreciation (depreciation) on investments and assets and liabilities in foreign currencies | | 13,585,146 |
| Net Assets | | $244,928,391 |
| Calculation of Maximum Offering Price | | |
| Class A: | | |
| Net Asset Value and redemption price per share ($126,289,901 ÷ 5,328,059 shares) | | $23.70 |
| Maximum offering price per share (100/94.25 of $23.70) | | $25.15 |
| Class T: | | |
| Net Asset Value and redemption price per share ($41,977,387 ÷ 1,766,808 shares) | | $23.76 |
| Maximum offering price per share (100/96.50 of $23.76) | | $24.62 |
| Class B: | | |
| Net Asset Value and offering price per share ($1,739,429 ÷ 73,428 shares)(a) | | $23.69 |
| Class C: | | |
| Net Asset Value and offering price per share ($47,651,546 ÷ 2,048,320 shares)(a) | | $23.26 |
| Class I: | | |
| Net Asset Value, offering price and redemption price per share ($27,270,128 ÷ 1,129,626 shares) | | $24.14 |
(a) Redemption price per share is equal to net asset value less any applicable contingent deferred sales charge.
See accompanying notes which are an integral part of the financial statements.
Statement of Operations
| | | Six months ended January 31, 2016 (Unaudited) |
| Investment Income | | |
| Dividends | | $3,829,150 |
| Income from Fidelity Central Funds | | 4,938 |
| Total income | | 3,834,088 |
| Expenses | | |
| Management fee | $684,609 | |
| Transfer agent fees | 316,976 | |
| Distribution and service plan fees | 518,449 | |
| Accounting and security lending fees | 48,624 | |
| Custodian fees and expenses | 3,622 | |
| Independent trustees' compensation | 2,360 | |
| Registration fees | 47,156 | |
| Audit | 22,210 | |
| Legal | 1,470 | |
| Miscellaneous | 1,432 | |
| Total expenses before reductions | 1,646,908 | |
| Expense reductions | (2,064) | 1,644,844 |
| Net investment income (loss) | | 2,189,244 |
| Realized and Unrealized Gain (Loss) | | |
| Net realized gain (loss) on: | | |
| Investment securities: | | |
| Unaffiliated issuers | (9,871,188) | |
| Total net realized gain (loss) | | (9,871,188) |
Change in net unrealized appreciation (depreciation) on:
Investment securities | (119,427) | |
| Assets and liabilities in foreign currencies | (78) | |
| Total change in net unrealized appreciation (depreciation) | | (119,505) |
| Net gain (loss) | | (9,990,693) |
| Net increase (decrease) in net assets resulting from operations | | $(7,801,449) |
See accompanying notes which are an integral part of the financial statements.
Statement of Changes in Net Assets
| | Six months ended January 31, 2016 (Unaudited) | Year ended July 31, 2015 |
| Increase (Decrease) in Net Assets | | |
| Operations | | |
| Net investment income (loss) | $2,189,244 | $4,638,676 |
| Net realized gain (loss) | (9,871,188) | 6,045,318 |
| Change in net unrealized appreciation (depreciation) | (119,505) | (5,645,684) |
| Net increase (decrease) in net assets resulting from operations | (7,801,449) | 5,038,310 |
| Distributions to shareholders from net investment income | (4,356,273) | (4,008,742) |
| Distributions to shareholders from net realized gain | (6,473,264) | (17,304,031) |
| Total distributions | (10,829,537) | (21,312,773) |
| Share transactions - net increase (decrease) | (9,521,670) | (19,607,828) |
| Redemption fees | 3,930 | 10,186 |
| Total increase (decrease) in net assets | (28,148,726) | (35,872,105) |
| Net Assets | | |
| Beginning of period | 273,077,117 | 308,949,222 |
| End of period (including distributions in excess of net investment income of $203,800 and undistributed net investment income of $1,963,229, respectively) | $244,928,391 | $273,077,117 |
See accompanying notes which are an integral part of the financial statements.
Financial Highlights — Fidelity Advisor Utilities Fund Class A
| | Six months ended (Unaudited) | Years ended July 31, | | | | |
| January 31, | 2016 | 2015 | 2014 | 2013 | 2012 | 2011 |
| Selected Per–Share Data | | | | | | |
| Net asset value, beginning of period | $25.48 | $26.77 | $23.48 | $21.20 | $19.09 | $16.59 |
| Income from Investment Operations | | | | | | |
| Net investment income (loss)A | .23 | .44 | .41 | .47 | .43 | .39 |
| Net realized and unrealized gain (loss) | (.93) | .18 | 3.35 | 2.24 | 2.07 | 2.50 |
| Total from investment operations | (.70) | .62 | 3.76 | 2.71 | 2.50 | 2.89 |
| Distributions from net investment income | (.46) | (.38) | (.46) | (.43) | (.39) | (.39) |
| Distributions from net realized gain | (.61) | (1.52) | (.01) | – | – | – |
| Total distributions | (1.08)B | (1.91)C | (.47) | (.43) | (.39) | (.39) |
| Redemption fees added to paid in capitalA,D | – | – | – | – | – | – |
| Net asset value, end of period | $23.70 | $25.48 | $26.77 | $23.48 | $21.20 | $19.09 |
| Total ReturnE,F,G | (2.51)% | 2.01% | 16.38% | 13.09% | 13.40% | 17.71% |
| Ratios to Average Net AssetsH,I | | | | | | |
| Expenses before reductions | 1.15%J | 1.13% | 1.16% | 1.20% | 1.23% | 1.24% |
| Expenses net of fee waivers, if any | 1.15%J | 1.13% | 1.16% | 1.20% | 1.23% | 1.24% |
| Expenses net of all reductions | 1.15%J | 1.11% | 1.15% | 1.16% | 1.22% | 1.20% |
| Net investment income (loss) | 1.92%J | 1.65% | 1.64% | 2.16% | 2.24% | 2.18% |
| Supplemental Data | | | | | | |
| Net assets, end of period (000 omitted) | $126,290 | $140,148 | $154,134 | $106,851 | $99,813 | $78,312 |
| Portfolio turnover rateK | 62%J | 105% | 112% | 154% | 195% | 201% |
A Calculated based on average shares outstanding during the period.
B Total distributions of $1.08 per share is comprised of distributions from net investment income of $.462 and distributions from net realized gain of $.613 per share.
C Total distributions of $1.91 per share is comprised of distributions from net investment income of $.384 and distributions from net realized gain of $1.524 per share.
D Amount represents less than $.005 per share.
E Total returns for periods of less than one year are not annualized.
F Total returns would have been lower if certain expenses had not been reduced during the applicable periods shown.
G Total returns do not include the effect of the sales charges.
H Fees and expenses of any underlying Fidelity Central Funds are not included in the Fund's expense ratio. The Fund indirectly bears its proportionate share of the expenses of any underlying Fidelity Central Funds.
I Expense ratios reflect operating expenses of the class. Expenses before reductions do not reflect amounts reimbursed by the investment adviser or reductions from brokerage service arrangements or reductions from other expense offset arrangements and do not represent the amount paid by the class during periods when reimbursements or reductions occur. Expenses net of fee waivers reflect expenses after reimbursement by the investment adviser but prior to reductions from brokerage service arrangements or other expense offset arrangements. Expenses net of all reductions represent the net expenses paid by the class.
J Annualized
K Amount does not include the portfolio activity of any underlying Fidelity Central Funds.
See accompanying notes which are an integral part of the financial statements.
Financial Highlights — Fidelity Advisor Utilities Fund Class T
| | Six months ended (Unaudited) | Years ended July 31, | | | | |
| January 31, | 2016 | 2015 | 2014 | 2013 | 2012 | 2011 |
| Selected Per–Share Data | | | | | | |
| Net asset value, beginning of period | $25.49 | $26.78 | $23.50 | $21.21 | $19.09 | $16.59 |
| Income from Investment Operations | | | | | | |
| Net investment income (loss)A | .19 | .36 | .34 | .41 | .38 | .35 |
| Net realized and unrealized gain (loss) | (.92) | .18 | 3.35 | 2.25 | 2.07 | 2.50 |
| Total from investment operations | (.73) | .54 | 3.69 | 2.66 | 2.45 | 2.85 |
| Distributions from net investment income | (.39) | (.31) | (.40) | (.37) | (.33) | (.35) |
| Distributions from net realized gain | (.61) | (1.52) | (.01) | – | – | – |
| Total distributions | (1.00) | (1.83) | (.41) | (.37) | (.33) | (.35) |
| Redemption fees added to paid in capitalA,B | – | – | – | – | – | – |
| Net asset value, end of period | $23.76 | $25.49 | $26.78 | $23.50 | $21.21 | $19.09 |
| Total ReturnC,D,E | (2.63)% | 1.72% | 15.99% | 12.81% | 13.13% | 17.39% |
| Ratios to Average Net AssetsF,G | | | | | | |
| Expenses before reductions | 1.45%H | 1.42% | 1.45% | 1.47% | 1.49% | 1.50% |
| Expenses net of fee waivers, if any | 1.45%H | 1.42% | 1.45% | 1.47% | 1.49% | 1.50% |
| Expenses net of all reductions | 1.45%H | 1.41% | 1.44% | 1.43% | 1.48% | 1.46% |
| Net investment income (loss) | 1.62%H | 1.35% | 1.35% | 1.89% | 1.98% | 1.92% |
| Supplemental Data | | | | | | |
| Net assets, end of period (000 omitted) | $41,977 | $46,366 | $49,272 | $41,239 | $38,276 | $35,701 |
| Portfolio turnover rateI | 62%H | 105% | 112% | 154% | 195% | 201% |
A Calculated based on average shares outstanding during the period.
B Amount represents less than $.005 per share.
C Total returns for periods of less than one year are not annualized.
D Total returns would have been lower if certain expenses had not been reduced during the applicable periods shown.
E Total returns do not include the effect of the sales charges.
F Fees and expenses of any underlying Fidelity Central Funds are not included in the Fund's expense ratio. The Fund indirectly bears its proportionate share of the expenses of any underlying Fidelity Central Funds.
G Expense ratios reflect operating expenses of the class. Expenses before reductions do not reflect amounts reimbursed by the investment adviser or reductions from brokerage service arrangements or reductions from other expense offset arrangements and do not represent the amount paid by the class during periods when reimbursements or reductions occur. Expenses net of fee waivers reflect expenses after reimbursement by the investment adviser but prior to reductions from brokerage service arrangements or other expense offset arrangements. Expenses net of all reductions represent the net expenses paid by the class.
H Annualized
I Amount does not include the portfolio activity of any underlying Fidelity Central Funds.
See accompanying notes which are an integral part of the financial statements.
Financial Highlights — Fidelity Advisor Utilities Fund Class B
| | Six months ended (Unaudited) | Years ended July 31, | | | | |
| January 31, | 2016 | 2015 | 2014 | 2013 | 2012 | 2011 |
| Selected Per–Share Data | | | | | | |
| Net asset value, beginning of period | $25.25 | $26.51 | $23.24 | $20.96 | $18.86 | $16.38 |
| Income from Investment Operations | | | | | | |
| Net investment income (loss)A | .13 | .22 | .21 | .30 | .28 | .25 |
| Net realized and unrealized gain (loss) | (.91) | .19 | 3.33 | 2.23 | 2.05 | 2.49 |
| Total from investment operations | (.78) | .41 | 3.54 | 2.53 | 2.33 | 2.74 |
| Distributions from net investment income | (.17) | (.14) | (.26) | (.25) | (.23) | (.26) |
| Distributions from net realized gain | (.61) | (1.52) | (.01) | – | – | – |
| Total distributions | (.78) | (1.67)B | (.27) | (.25) | (.23) | (.26) |
| Redemption fees added to paid in capitalA,C | – | – | – | – | – | – |
| Net asset value, end of period | $23.69 | $25.25 | $26.51 | $23.24 | $20.96 | $18.86 |
| Total ReturnD,E,F | (2.90)% | 1.23% | 15.41% | 12.24% | 12.54% | 16.87% |
| Ratios to Average Net AssetsG,H | | | | | | |
| Expenses before reductions | 1.94%I | 1.94% | 1.95% | 1.96% | 1.98% | 1.99% |
| Expenses net of fee waivers, if any | 1.94%I | 1.94% | 1.95% | 1.96% | 1.98% | 1.99% |
| Expenses net of all reductions | 1.94%I | 1.93% | 1.94% | 1.92% | 1.97% | 1.95% |
| Net investment income (loss) | 1.13%I | .83% | .85% | 1.40% | 1.49% | 1.43% |
| Supplemental Data | | | | | | |
| Net assets, end of period (000 omitted) | $1,739 | $2,680 | $4,598 | $5,289 | $6,677 | $7,773 |
| Portfolio turnover rateJ | 62%I | 105% | 112% | 154% | 195% | 201% |
A Calculated based on average shares outstanding during the period.
B Total distributions of $1.67 per share is comprised of distributions from net investment income of $.141 and distributions from net realized gain of $1.524 per share.
C Amount represents less than $.005 per share.
D Total returns for periods of less than one year are not annualized.
E Total returns would have been lower if certain expenses had not been reduced during the applicable periods shown.
F Total returns do not include the effect of the contingent deferred sales charge.
G Fees and expenses of any underlying Fidelity Central Funds are not included in the Fund's expense ratio. The Fund indirectly bears its proportionate share of the expenses of any underlying Fidelity Central Funds.
H Expense ratios reflect operating expenses of the class. Expenses before reductions do not reflect amounts reimbursed by the investment adviser or reductions from brokerage service arrangements or reductions from other expense offset arrangements and do not represent the amount paid by the class during periods when reimbursements or reductions occur. Expenses net of fee waivers reflect expenses after reimbursement by the investment adviser but prior to reductions from brokerage service arrangements or other expense offset arrangements. Expenses net of all reductions represent the net expenses paid by the class.
I Annualized
J Amount does not include the portfolio activity of any underlying Fidelity Central Funds.
See accompanying notes which are an integral part of the financial statements.
Financial Highlights — Fidelity Advisor Utilities Fund Class C
| | Six months ended (Unaudited) | Years ended July 31, | | | | |
| January 31, | 2016 | 2015 | 2014 | 2013 | 2012 | 2011 |
| Selected Per–Share Data | | | | | | |
| Net asset value, beginning of period | $24.91 | $26.23 | $23.03 | $20.80 | $18.75 | $16.30 |
| Income from Investment Operations | | | | | | |
| Net investment income (loss)A | .14 | .23 | .23 | .31 | .29 | .26 |
| Net realized and unrealized gain (loss) | (.91) | .19 | 3.29 | 2.20 | 2.03 | 2.46 |
| Total from investment operations | (.77) | .42 | 3.52 | 2.51 | 2.32 | 2.72 |
| Distributions from net investment income | (.27) | (.22) | (.31) | (.28) | (.27) | (.27) |
| Distributions from net realized gain | (.61) | (1.52) | (.01) | – | – | – |
| Total distributions | (.88) | (1.74) | (.32) | (.28) | (.27) | (.27) |
| Redemption fees added to paid in capitalA,B | – | – | – | – | – | – |
| Net asset value, end of period | $23.26 | $24.91 | $26.23 | $23.03 | $20.80 | $18.75 |
| Total ReturnC,D,E | (2.89)% | 1.29% | 15.52% | 12.27% | 12.56% | 16.85% |
| Ratios to Average Net AssetsF,G | | | | | | |
| Expenses before reductions | 1.89%H | 1.88% | 1.89% | 1.93% | 1.95% | 1.98% |
| Expenses net of fee waivers, if any | 1.89%H | 1.88% | 1.89% | 1.93% | 1.95% | 1.98% |
| Expenses net of all reductions | 1.89%H | 1.86% | 1.88% | 1.89% | 1.95% | 1.94% |
| Net investment income (loss) | 1.18%H | .89% | .91% | 1.43% | 1.51% | 1.43% |
| Supplemental Data | | | | | | |
| Net assets, end of period (000 omitted) | $47,652 | $52,172 | $54,810 | $35,457 | $29,942 | $26,915 |
| Portfolio turnover rateI | 62%H | 105% | 112% | 154% | 195% | 201% |
A Calculated based on average shares outstanding during the period.
B Amount represents less than $.005 per share.
C Total returns for periods of less than one year are not annualized.
D Total returns would have been lower if certain expenses had not been reduced during the applicable periods shown.
E Total returns do not include the effect of the contingent deferred sales charge.
F Fees and expenses of any underlying Fidelity Central Funds are not included in the Fund's expense ratio. The Fund indirectly bears its proportionate share of the expenses of any underlying Fidelity Central Funds.
G Expense ratios reflect operating expenses of the class. Expenses before reductions do not reflect amounts reimbursed by the investment adviser or reductions from brokerage service arrangements or reductions from other expense offset arrangements and do not represent the amount paid by the class during periods when reimbursements or reductions occur. Expenses net of fee waivers reflect expenses after reimbursement by the investment adviser but prior to reductions from brokerage service arrangements or other expense offset arrangements. Expenses net of all reductions represent the net expenses paid by the class.
H Annualized
I Amount does not include the portfolio activity of any underlying Fidelity Central Funds.
See accompanying notes which are an integral part of the financial statements.
Financial Highlights — Fidelity Advisor Utilities Fund Class I
| | Six months ended (Unaudited) | Years ended July 31, | | | | |
| January 31, | 2016 | 2015 | 2014 | 2013 | 2012 | 2011 |
| Selected Per–Share Data | | | | | | |
| Net asset value, beginning of period | $25.97 | $27.24 | $23.87 | $21.56 | $19.40 | $16.85 |
| Income from Investment Operations | | | | | | |
| Net investment income (loss)A | .27 | .52 | .51 | .55 | .50 | .45 |
| Net realized and unrealized gain (loss) | (.96) | .20 | 3.39 | 2.26 | 2.10 | 2.54 |
| Total from investment operations | (.69) | .72 | 3.90 | 2.81 | 2.60 | 2.99 |
| Distributions from net investment income | (.53) | (.46) | (.52) | (.50) | (.44) | (.44) |
| Distributions from net realized gain | (.61) | (1.52) | (.01) | – | – | – |
| Total distributions | (1.14) | (1.99)B | (.53) | (.50) | (.44) | (.44) |
| Redemption fees added to paid in capitalA,C | – | – | – | – | – | – |
| Net asset value, end of period | $24.14 | $25.97 | $27.24 | $23.87 | $21.56 | $19.40 |
| Total ReturnD,E | (2.37)% | 2.35% | 16.74% | 13.40% | 13.79% | 18.05% |
| Ratios to Average Net AssetsF,G | | | | | | |
| Expenses before reductions | .86%H | .83% | .85% | .89% | .92% | .98% |
| Expenses net of fee waivers, if any | .86%H | .83% | .85% | .89% | .92% | .98% |
| Expenses net of all reductions | .86%H | .81% | .84% | .85% | .91% | .94% |
| Net investment income (loss) | 2.21%H | 1.94% | 1.95% | 2.46% | 2.55% | 2.44% |
| Supplemental Data | | | | | | |
| Net assets, end of period (000 omitted) | $27,270 | $31,710 | $46,135 | $19,562 | $20,564 | $10,914 |
| Portfolio turnover rateI | 62%H | 105% | 112% | 154% | 195% | 201% |
A��Calculated based on average shares outstanding during the period.
B Total distributions of $1.99 per share is comprised of distributions from net investment income of $.463 and distributions from net realized gain of $1.524 per share.
C Amount represents less than $.005 per share.
D Total returns for periods of less than one year are not annualized.
E Total returns would have been lower if certain expenses had not been reduced during the applicable periods shown.
F Fees and expenses of any underlying Fidelity Central Funds are not included in the Fund's expense ratio. The Fund indirectly bears its proportionate share of the expenses of any underlying Fidelity Central Funds.
G Expense ratios reflect operating expenses of the class. Expenses before reductions do not reflect amounts reimbursed by the investment adviser or reductions from brokerage service arrangements or reductions from other expense offset arrangements and do not represent the amount paid by the class during periods when reimbursements or reductions occur. Expenses net of fee waivers reflect expenses after reimbursement by the investment adviser but prior to reductions from brokerage service arrangements or other expense offset arrangements. Expenses net of all reductions represent the net expenses paid by the class.
H Annualized
I Amount does not include the portfolio activity of any underlying Fidelity Central Funds.
See accompanying notes which are an integral part of the financial statements.
Notes to Financial Statements (Unaudited)
For the period ended January 31, 2016
1. Organization.
Fidelity Advisor Utilities Fund (the Fund) is a non-diversified fund of Fidelity Advisor Series VII (the Trust) and is authorized to issue an unlimited number of shares. The Trust is registered under the Investment Company Act of 1940, as amended (the 1940 Act), as an open-end management investment company organized as a Massachusetts business trust. The Fund offers Class A, Class T, Class C and Class I shares, each of which, along with Class B shares, has equal rights as to assets and voting privileges. Class B shares are closed to new accounts and additional purchases, except for exchanges and reinvestments. Each class has exclusive voting rights with respect to matters that affect that class. Class B shares will automatically convert to Class A shares after a holding period of seven years from the initial date of purchase.
During the period, the Board of Trustees approved the conversion of all existing Class B shares into Class A shares, effective on or about July 1, 2016, regardless of the length of times shares have been held.
2. Investments in Fidelity Central Funds.
The Fund invests in Fidelity Central Funds, which are open-end investment companies generally available only to other investment companies and accounts managed by the investment adviser and its affiliates. The Fund's Schedule of Investments lists each of the Fidelity Central Funds held as of period end, if any, as an investment of the Fund, but does not include the underlying holdings of each Fidelity Central Fund. As an Investing Fund, the Fund indirectly bears its proportionate share of the expenses of the underlying Fidelity Central Funds.
The Money Market Central Funds seek preservation of capital and current income and are managed by Fidelity Investments Money Management, Inc. (FIMM), an affiliate of the investment adviser. Annualized expenses of the Money Market Central Funds as of their most recent shareholder report date are less than .005%.
A complete unaudited list of holdings for each Fidelity Central Fund is available upon request or at the Securities and Exchange Commission (the SEC) website at www.sec.gov. In addition, the financial statements of the Fidelity Central Funds are available on the SEC website or upon request.
3. Significant Accounting Policies.
The financial statements have been prepared in conformity with accounting principles generally accepted in the United States of America (GAAP), which require management to make certain estimates and assumptions at the date of the financial statements. Actual results could differ from those estimates. Subsequent events, if any, through the date that the financial statements were issued have been evaluated in the preparation of the financial statements. The following summarizes the significant accounting policies of the Fund:
Investment Valuation. Investments are valued as of 4:00 p.m. Eastern time on the last calendar day of the period. The Board of Trustees (the Board) has delegated the day to day responsibility for the valuation of the Fund's investments to the Fidelity SelectCo, LLC (SelectCo) Fair Value Committee (the Committee). In accordance with valuation policies and procedures approved by the Board, the Fund attempts to obtain prices from one or more third party pricing vendors or brokers to value its investments. When current market prices, quotations or currency exchange rates are not readily available or reliable, investments will be fair valued in good faith by the Committee, in accordance with procedures adopted by the Board. Factors used in determining fair value vary by investment type and may include market or investment specific events. The frequency with which these procedures are used cannot be predicted and they may be utilized to a significant extent. The Committee oversees the Fund's valuation policies and procedures and reports to the Board on the Committee's activities and fair value determinations. The Board monitors the appropriateness of the procedures used in valuing the Fund's investments and ratifies the fair value determinations of the Committee.
The Fund categorizes the inputs to valuation techniques used to value its investments into a disclosure hierarchy consisting of three levels as shown below:
- Level 1 – quoted prices in active markets for identical investments
- Level 2 – other significant observable inputs (including quoted prices for similar investments, interest rates, prepayment speeds, etc.)
- Level 3 – unobservable inputs (including the Fund's own assumptions based on the best information available)
Valuation techniques used to value the Fund's investments by major category are as follows:
Equity securities, including restricted securities, for which market quotations are readily available, are valued at the last reported sale price or official closing price as reported by a third party pricing vendor on the primary market or exchange on which they are traded and are categorized as Level 1 in the hierarchy. In the event there were no sales during the day or closing prices are not available, securities are valued at the last quoted bid price or may be valued using the last available price and are generally categorized as Level 2 in the hierarchy. For foreign equity securities, when market or security specific events arise, comparisons to the valuation of American Depositary Receipts (ADRs), futures contracts, Exchange-Traded Funds (ETFs) and certain indexes as well as quoted prices for similar securities may be used and would be categorized as Level 2 in the hierarchy. Utilizing these techniques may result in transfers between Level 1 and Level 2. For equity securities, including restricted securities, where observable inputs are limited, assumptions about market activity and risk are used and these securities may be categorized as Level 3 in the hierarchy.
Investments in open-end mutual funds, including the Fidelity Central Funds, are valued at their closing net asset value (NAV) each business day and are categorized as Level 1 in the hierarchy.
Changes in valuation techniques may result in transfers in or out of an assigned level within the disclosure hierarchy.
Foreign Currency. The Fund may use foreign currency contracts to facilitate transactions in foreign-denominated securities. Gains and losses from these transactions may arise from changes in the value of the foreign currency or if the counterparties do not perform under the contracts' terms.
Foreign-denominated assets, including investment securities, and liabilities are translated into U.S. dollars at the exchange rates at period end. Purchases and sales of investment securities, income and dividends received and expenses denominated in foreign currencies are translated into U.S. dollars at the exchange rate in effect on the transaction date.
The effects of exchange rate fluctuations on investments are included with the net realized and unrealized gain (loss) on investment securities. Other foreign currency transactions resulting in realized and unrealized gain (loss) are disclosed separately.
Investment Transactions and Income. For financial reporting purposes, the Fund's investment holdings and NAV include trades executed through the end of the last business day of the period. The NAV per share for processing shareholder transactions is calculated as of the close of business of the New York Stock Exchange (NYSE), normally 4:00 p.m. Eastern time and includes trades executed through the end of the prior business day. Gains and losses on securities sold are determined on the basis of identified cost and may include proceeds received from litigation. Dividend income is recorded on the ex-dividend date, except for certain dividends from foreign securities where the ex-dividend date may have passed, which are recorded as soon as the Fund is informed of the ex-dividend date. Non-cash dividends included in dividend income, if any, are recorded at the fair market value of the securities received. Income and capital gain distributions from Fidelity Central Funds, if any, are recorded on the ex-dividend date. Distributions received on securities that represent a return of capital or capital gain are recorded as a reduction of cost of investments and/or as a realized gain. Subsequent to ex-dividend date the Fund determines the components of these distributions, based upon receipt of tax filings or other correspondence relating to the underlying investment. Investment income is recorded net of foreign taxes withheld where recovery of such taxes is uncertain.
Class Allocations and Expenses. Investment income, realized and unrealized capital gains and losses, common expenses of the Fund, and certain fund-level expense reductions, if any, are allocated daily on a pro-rata basis to each class based on the relative net assets of each class to the total net assets of the Fund. Each class differs with respect to transfer agent and distribution and service plan fees incurred. Certain expense reductions may also differ by class. For the reporting period, the allocated portion of income and expenses to each class as a percent of its average net assets may vary due to the timing of recording these transactions in relation to fluctuating net assets of the classes. Expenses directly attributable to a fund are charged to that fund. Expenses attributable to more than one fund are allocated among the respective funds on the basis of relative net assets or other appropriate methods. Expense estimates are accrued in the period to which they relate and adjustments are made when actual amounts are known.
Income Tax Information and Distributions to Shareholders. Each year, the Fund intends to qualify as a regulated investment company under Subchapter M of the Internal Revenue Code, including distributing substantially all of its taxable income and realized gains. As a result, no provision for U.S. Federal income taxes is required. The Fund files a U.S. federal tax return, in addition to state and local tax returns as required. The Fund's federal income tax returns are subject to examination by the Internal Revenue Service (IRS) for a period of three fiscal years after they are filed. State and local tax returns may be subject to examination for an additional fiscal year depending on the jurisdiction. Foreign taxes are provided for based on the Fund's understanding of the tax rules and rates that exist in the foreign markets in which it invests.
Distributions are declared and recorded on the ex-dividend date. Income dividends and capital gain distributions are declared separately for each class. Income and capital gain distributions are determined in accordance with income tax regulations, which may differ from GAAP.
Capital accounts within the financial statements are adjusted for permanent book-tax differences. These adjustments have no impact on net assets or the results of operations. Capital accounts are not adjusted for temporary book-tax differences which will reverse in a subsequent period.
Book-tax differences are primarily due to futures contracts, foreign currency transactions, partnerships, deferred trustees compensation, and losses deferred due to wash sales and excise tax regulations.
The federal tax cost of investment securities and unrealized appreciation (depreciation) as of period end were as follows:
| Gross unrealized appreciation | $26,793,561 |
| Gross unrealized depreciation | (15,485,888) |
| Net unrealized appreciation (depreciation) on securities | $11,307,673 |
| Tax cost | $235,454,849 |
The Fund elected to defer to its next fiscal year approximately $2,413,933 of capital losses recognized during the period November 1, 2014 to July 31, 2015.
Short-Term Trading (Redemption) Fees. Shares held by investors in the Fund less than 30 days may have been subject to a redemption fee equal to .75% of the NAV of shares redeemed. All redemption fees, which reduce the proceeds of the shareholder redemption, are retained by the Fund and accounted for as an addition to paid in capital.
4. Purchases and Sales of Investments
Purchases and sales of securities, other than short-term securities, aggregated $77,114,349 and $93,403,125, respectively.
5. Fees and Other Transactions with Affiliates.
Management Fee. Fidelity SelectCo, LLC (the investment adviser) and its affiliates provide the Fund with investment management related services for which the Fund pays a monthly management fee. The management fee is the sum of an individual fund fee rate that is based on an annual rate of .30% of the Fund's average net assets and an annualized group fee rate that averaged .25% during the period. The group fee rate is based upon the average net assets of all the mutual funds advised by Fidelity Management & Research Company (FMR) and the investment adviser. The group fee rate decreases as assets under management increase and increases as assets under management decrease. For the reporting period, the total annualized management fee rate was .55% of the Fund's average net assets.
Distribution and Service Plan Fees. In accordance with Rule 12b-1 of the 1940 Act, the Fund has adopted separate Distribution and Service Plans for each class of shares. Certain classes pay Fidelity Distributors Corporation (FDC), an affiliate of the investment adviser, separate Distribution and Service Fees, each of which is based on an annual percentage of each class' average net assets. In addition, FDC may pay financial intermediaries for selling shares of the Fund and providing shareholder support services. For the period, the Distribution and Service Fee rates, total fees and amounts retained by FDC were as follows:
| | Distribution
Fee | Service
Fee | Total Fees | Retained
by FDC |
| Class A | -% | .25% | $161,014 | $252 |
| Class T | .25% | .25% | 107,180 | – |
| Class B | .75% | .25% | 10,456 | 7,842 |
| Class C | .75% | .25% | 239,799 | 33,193 |
| | | | $518,449 | $41,287 |
Sales Load. FDC may receive a front-end sales charge of up to 5.75% for selling Class A shares and 3.50% for selling Class T shares, some of which is paid to financial intermediaries for selling shares of the Fund. Depending on the holding period, FDC may receive contingent deferred sales charges levied on Class A, Class T, Class B, and Class C redemptions. The deferred sales charges range from 5.00% to 1.00% for Class B shares, 1.00% for Class C shares, 1.00% for certain purchases of Class A shares and .25% for certain purchases of Class T shares.
For the period, sales charge amounts retained by FDC were as follows:
| | Retained
by FDC |
| Class A | $30,219 |
| Class T | 4,152 |
| Class B(a) | 38 |
| Class C(a) | 4,707 |
| | $39,116 |
(a) When Class B Class C shares are initially sold, FDC pays commissions from its own resources to financial intermediaries through which the sales are made.
Transfer Agent Fees. Fidelity Investments Institutional Operations Company, Inc., (FIIOC), an affiliate of the investment adviser, is the transfer, dividend disbursing and shareholder servicing agent for each class of the Fund. FIIOC receives account fees and asset-based fees that vary according to the account size and type of account of the shareholders of the respective classes of the Fund FIIOC pays for typesetting, printing and mailing of shareholder reports, except proxy statements.
For the period, transfer agent fees for each class were as follows:
| | Amount | % of
Class-Level Average
Net Assets(a) |
| Class A | $160,747 | .25 |
| Class T | 64,922 | .30 |
| Class B | 3,106 | .30 |
| Class C | 59,096 | .25 |
| Class I | 29,105 | .21 |
| | $316,976 | |
(a) Annualized
Accounting and Security Lending Fees. Fidelity Service Company, Inc. (FSC), an affiliate of the investment adviser, maintains the Fund's accounting records. The accounting fee is based on the level of average net assets for each month. Under a separate contract, FSC administers the security lending program. The security lending fee is based on the number and duration of lending transactions.
Brokerage Commissions. The Fund placed a portion of its portfolio transactions with brokerage firms which are affiliates of the investment adviser. Brokerage commissions are included in net realized gain (loss) and change in net unrealized appreciation (depreciation) in the Statement of Operations. The commissions paid to these affiliated firms were $2,749 for the period.
Interfund Trades. The Fund may purchase from or sell securities to other Fidelity Funds under procedures adopted by the Board. The procedures have been designed to ensure these interfund trades are executed in accordance with Rule 17a-7 of the 1940 Act. Interfund trades are included within the respective purchases and sales amounts shown in the Purchases and Sales of Investments note.
6. Committed Line of Credit.
The Fund participates with other funds managed by the investment adviser or an affiliate in a $4.25 billion credit facility (the "line of credit") to be utilized for temporary or emergency purposes to fund shareholder redemptions or for other short-term liquidity purposes. The Fund has agreed to pay commitment fees on its pro-rata portion of the line of credit, which amounted to $171 and is reflected in Miscellaneous expenses on the Statement of Operations. During the period, the Fund did not borrow on this line of credit.
7. Security Lending.
The Fund lends portfolio securities through a lending agent from time to time in order to earn additional income. On the settlement date of the loan, the Fund receives collateral (in the form of U.S. Treasury obligations, letters of credit and/or cash) against the loaned securities and maintains collateral in an amount not less than 100% of the market value of the loaned securities during the period of the loan. The market value of the loaned securities is determined at the close of business of the Fund and any additional required collateral is delivered to the Fund on the next business day. The Fund or borrower may terminate the loan at any time, and if the borrower defaults on its obligation to return the securities loaned because of insolvency or other reasons, the Fund may apply collateral received from the borrower against the obligation. The Fund may experience delays and costs in recovering the securities loaned. Any cash collateral received is invested in the Fidelity Securities Lending Cash Central Fund. The value of loaned securities and cash collateral at period end are disclosed on the Fund's Statement of Assets and Liabilities. Security lending income represents the income earned on investing cash collateral, less rebates paid to borrowers and any lending agent fees associated with the loan, plus any premium payments received for lending certain types of securities. Security lending income is presented in the Statement of Operations as a component of income from Fidelity Central Funds. Total security lending income during the period amounted to $3,427.
8. Expense Reductions.
Commissions paid to certain brokers with whom the investment adviser, or its affiliates, places trades on behalf of the Fund include an amount in addition to trade execution, which may be rebated back to the Fund to offset certain expenses. This amount totaled $1,215 for the period.
In addition, during the period the investment advisor reimbursed and/or waived a portion of fund-level operating expenses in the amount of $849.
9. Distributions to Shareholders.
Distributions to shareholders of each class were as follows:
| | Six months ended January 31, 2016 | Year ended July 31, 2015 |
| From net investment income | | |
| Class A | $2,494,667 | $2,209,427 |
| Class T | 696,864 | 589,279 |
| Class B | 13,894 | 23,317 |
| Class C | 548,207 | 465,161 |
| Class I | 602,641 | 721,558 |
| Total | $4,356,273 | $4,008,742 |
| From net realized gain | | |
| Class A | $3,341,067 | $8,639,872 |
| Class T | 1,100,541 | 2,863,183 |
| Class B | 58,860 | 255,750 |
| Class C | 1,254,979 | 3,177,658 |
| Class I | 717,817 | 2,367,568 |
| Total | $6,473,264 | $17,304,031 |
10. Share Transactions.
Share transactions for each class were as follows and may contain automatic conversions between classes or exchanges between affiliated funds:
| | Shares | Shares | Dollars | Dollars |
| | Six months ended January 31, 2016 | Year ended July 31, 2015 | Six months ended January 31, 2016 | Year ended July 31, 2015 |
| Class A | | | | |
| Shares sold | 470,287 | 1,888,559 | $11,191,022 | $50,338,260 |
| Reinvestment of distributions | 240,305 | 365,507 | 5,414,225 | 9,845,503 |
| Shares redeemed | (882,776) | (2,512,099) | (20,769,813) | (66,117,493) |
| Net increase (decrease) | (172,184) | (258,033) | $(4,164,566) | $(5,933,730) |
| Class T | | | | |
| Shares sold | 109,490 | 388,662 | $2,601,524 | $10,348,248 |
| Reinvestment of distributions | 76,233 | 123,166 | 1,721,689 | 3,324,380 |
| Shares redeemed | (237,725) | (532,785) | (5,551,342) | (14,023,975) |
| Net increase (decrease) | (52,002) | (20,957) | $(1,228,129) | $(351,347) |
| Class B | | | | |
| Shares sold | 1,992 | 10,961 | $45,271 | $290,048 |
| Reinvestment of distributions | 2,783 | 9,053 | 62,667 | 242,668 |
| Shares redeemed | (37,515) | (87,257) | (885,495) | (2,288,453) |
| Net increase (decrease) | (32,740) | (67,243) | $(777,557) | $(1,755,737) |
| Class C | | | | |
| Shares sold | 230,514 | 773,976 | $5,283,518 | $20,247,064 |
| Reinvestment of distributions | 71,102 | 116,026 | 1,573,006 | 3,068,131 |
| Shares redeemed | (347,955) | (884,724) | (8,055,697) | (22,817,991) |
| Net increase (decrease) | (46,339) | 5,278 | $(1,199,173) | $497,204 |
| Class I | | | | |
| Shares sold | 375,260 | 1,143,014 | $9,175,899 | $31,002,673 |
| Reinvestment of distributions | 49,611 | 90,001 | 1,138,487 | 2,465,972 |
| Shares redeemed | (516,375) | (1,705,406) | (12,466,631) | (45,532,863) |
| Net increase (decrease) | (91,504) | (472,391) | $(2,152,245) | $(12,064,218) |
11. Other.
The Fund's organizational documents provide former and current trustees and officers with a limited indemnification against liabilities arising in connection with the performance of their duties to the Fund. In the normal course of business, the Fund may also enter into contracts that provide general indemnifications. The Fund's maximum exposure under these arrangements is unknown as this would be dependent on future claims that may be made against the Fund. The risk of material loss from such claims is considered remote.
Shareholder Expense Example
As a shareholder of the Fund, you incur two types of costs: (1) transaction costs, including sales charges (loads) on purchase payments or redemption proceeds, redemption fees and (2) ongoing costs, including management fees, distribution and/or service (12b-1) fees and other Fund expenses. This Example is intended to help you understand your ongoing costs (in dollars) of investing in the Fund and to compare these costs with the ongoing costs of investing in other mutual funds.
The Example is based on an investment of $1,000 invested at the beginning of the period and held for the entire period (August 1, 2015 to January 31, 2016).
Actual Expenses
The first line of the accompanying table for each class of the Fund provides information about actual account values and actual expenses. You may use the information in this line, together with the amount you invested, to estimate the expenses that you paid over the period. Simply divide your account value by $1,000.00 (for example, an $8,600 account value divided by $1,000.00 = 8.6), then multiply the result by the number in the first line for a class of the Fund under the heading entitled "Expenses Paid During Period" to estimate the expenses you paid on your account during this period. In addition, the Fund, as a shareholder in the underlying Fidelity Central Funds, will indirectly bear its pro-rata share of the fees and expenses incurred by the underlying Fidelity Central Funds. These fees and expenses are not included in the Fund's annualized expense ratio used to calculate the expense estimate in the table below.
Hypothetical Example for Comparison Purposes
The second line of the accompanying table for each class of the Fund provides information about hypothetical account values and hypothetical expenses based on a Class' actual expense ratio and an assumed rate of return of 5% per year before expenses, which is not the Class' actual return. The hypothetical account values and expenses may not be used to estimate the actual ending account balance or expenses you paid for the period. You may use this information to compare the ongoing costs of investing in the Fund and other funds. To do so, compare this 5% hypothetical example with the 5% hypothetical examples that appear in the shareholder reports of the other funds. In addition, the Fund, as a shareholder in the underlying Fidelity Central Funds, will indirectly bear its pro-rata share of the fees and expenses incurred by the underlying Fidelity Central Funds. These fees and expenses are not included in the Fund's annualized expense ratio used to calculate the expense estimate in the table below.
Please note that the expenses shown in the table are meant to highlight your ongoing costs only and do not reflect any transaction costs. Therefore, the second line of the table is useful in comparing ongoing costs only, and will not help you determine the relative total costs of owning different funds. In addition, if these transactional costs were included, your costs would have been higher.
| | Annualized Expense RatioA | Beginning
Account Value
August 1, 2015 | Ending
Account Value
January 31, 2016 | Expenses Paid
During Period-B
August 1, 2015
to January 31, 2016 |
| Fidelity Advisor Biotechnology Fund | | | | |
| Class A | 1.05% | | | |
| Actual | | $1,000.00 | $641.00 | $4.33 |
| Hypothetical-C | | $1,000.00 | $1,019.86 | $5.33 |
| Class T | 1.36% | | | |
| Actual | | $1,000.00 | $640.20 | $5.61 |
| Hypothetical-C | | $1,000.00 | $1,018.30 | $6.90 |
| Class B | 1.83% | | | |
| Actual | | $1,000.00 | $638.70 | $7.54 |
| Hypothetical-C | | $1,000.00 | $1,015.94 | $9.27 |
| Class C | 1.80% | | | |
| Actual | | $1,000.00 | $638.90 | $7.42 |
| Hypothetical-C | | $1,000.00 | $1,016.09 | $9.12 |
| Class I | .78% | | | |
| Actual | | $1,000.00 | $642.00 | $3.22 |
| Hypothetical-C | | $1,000.00 | $1,021.22 | $3.96 |
| Fidelity Advisor Communications Equipment Fund | | | | |
| Class A | 1.40% | | | |
| Actual | | $1,000.00 | $825.20 | $6.42 |
| Hypothetical-C | | $1,000.00 | $1,018.10 | $7.10 |
| Class T | 1.65% | | | |
| Actual | | $1,000.00 | $824.00 | $7.57 |
| Hypothetical-C | | $1,000.00 | $1,016.84 | $8.36 |
| Class B | 2.15% | | | |
| Actual | | $1,000.00 | $821.80 | $9.85 |
| Hypothetical-C | | $1,000.00 | $1,014.33 | $10.89 |
| Class C | 2.15% | | | |
| Actual | | $1,000.00 | $822.60 | $9.85 |
| Hypothetical-C | | $1,000.00 | $1,014.33 | $10.89 |
| Class I | 1.15% | | | |
| Actual | | $1,000.00 | $826.60 | $5.28 |
| Hypothetical-C | | $1,000.00 | $1,019.36 | $5.84 |
| Fidelity Advisor Consumer Discretionary Fund | | | | |
| Class A | 1.12% | | | |
| Actual | | $1,000.00 | $908.60 | $5.37 |
| Hypothetical-C | | $1,000.00 | $1,019.51 | $5.69 |
| Class T | 1.42% | | | |
| Actual | | $1,000.00 | $907.40 | $6.81 |
| Hypothetical-C | | $1,000.00 | $1,018.00 | $7.20 |
| Class B | 1.92% | | | |
| Actual | | $1,000.00 | $904.80 | $9.19 |
| Hypothetical-C | | $1,000.00 | $1,015.48 | $9.73 |
| Class C | 1.88% | | | |
| Actual | | $1,000.00 | $905.40 | $9.00 |
| Hypothetical-C | | $1,000.00 | $1,015.69 | $9.53 |
| Class I | .86% | | | |
| Actual | | $1,000.00 | $909.90 | $4.13 |
| Hypothetical-C | | $1,000.00 | $1,020.81 | $4.37 |
| Fidelity Advisor Electronics Fund | | | | |
| Class A | 1.37% | | | |
| Actual | | $1,000.00 | $952.70 | $6.72 |
| Hypothetical-C | | $1,000.00 | $1,018.25 | $6.95 |
| Class T | 1.65% | | | |
| Actual | | $1,000.00 | $951.20 | $8.09 |
| Hypothetical-C | | $1,000.00 | $1,016.84 | $8.36 |
| Class B | 2.15% | | | |
| Actual | | $1,000.00 | $949.30 | $10.53 |
| Hypothetical-C | | $1,000.00 | $1,014.33 | $10.89 |
| Class C | 2.14% | | | |
| Actual | | $1,000.00 | $949.20 | $10.49 |
| Hypothetical-C | | $1,000.00 | $1,014.38 | $10.84 |
| Class I | 1.04% | | | |
| Actual | | $1,000.00 | $954.80 | $5.11 |
| Hypothetical-C | | $1,000.00 | $1,019.91 | $5.28 |
| Fidelity Advisor Energy Fund | | | | |
| Class A | 1.13% | | | |
| Actual | | $1,000.00 | $861.60 | $5.29 |
| Hypothetical-C | | $1,000.00 | $1,019.46 | $5.74 |
| Class T | 1.38% | | | |
| Actual | | $1,000.00 | $860.30 | $6.45 |
| Hypothetical-C | | $1,000.00 | $1,018.20 | $7.00 |
| Class B | 1.91% | | | |
| Actual | | $1,000.00 | $857.90 | $8.92 |
| Hypothetical-C | | $1,000.00 | $1,015.53 | $9.68 |
| Class C | 1.85% | | | |
| Actual | | $1,000.00 | $858.40 | $8.64 |
| Hypothetical-C | | $1,000.00 | $1,015.84 | $9.37 |
| Class I | .86% | | | |
| Actual | | $1,000.00 | $862.60 | $4.03 |
| Hypothetical-C | | $1,000.00 | $1,020.81 | $4.37 |
| Fidelity Advisor Financial Services Fund | | | | |
| Class A | 1.16% | | | |
| Actual | | $1,000.00 | $857.60 | $5.42 |
| Hypothetical-C | | $1,000.00 | $1,019.30 | $5.89 |
| Class T | 1.45% | | | |
| Actual | | $1,000.00 | $856.10 | $6.77 |
| Hypothetical-C | | $1,000.00 | $1,017.85 | $7.35 |
| Class B | 1.97% | | | |
| Actual | | $1,000.00 | $854.10 | $9.18 |
| Hypothetical-C | | $1,000.00 | $1,015.23 | $9.98 |
| Class C | 1.91% | | | |
| Actual | | $1,000.00 | $853.70 | $8.90 |
| Hypothetical-C | | $1,000.00 | $1,015.53 | $9.68 |
| Class I | .86% | | | |
| Actual | | $1,000.00 | $858.50 | $4.02 |
| Hypothetical-C | | $1,000.00 | $1,020.81 | $4.37 |
| Fidelity Advisor Health Care Fund | | | | |
| Class A | 1.04% | | | |
| Actual | | $1,000.00 | $808.60 | $4.73 |
| Hypothetical-C | | $1,000.00 | $1,019.91 | $5.28 |
| Class T | 1.31% | | | |
| Actual | | $1,000.00 | $807.60 | $5.95 |
| Hypothetical-C | | $1,000.00 | $1,018.55 | $6.65 |
| Class B | 1.87% | | | |
| Actual | | $1,000.00 | $805.10 | $8.48 |
| Hypothetical-C | | $1,000.00 | $1,015.74 | $9.48 |
| Class C | 1.80% | | | |
| Actual | | $1,000.00 | $805.50 | $8.17 |
| Hypothetical-C | | $1,000.00 | $1,016.09 | $9.12 |
| Class I | .79% | | | |
| Actual | | $1,000.00 | $809.40 | $3.59 |
| Hypothetical-C | | $1,000.00 | $1,021.17 | $4.01 |
| Fidelity Advisor Industrials Fund | | | | |
| Class A | 1.07% | | | |
| Actual | | $1,000.00 | $909.60 | $5.14 |
| Hypothetical-C | | $1,000.00 | $1,019.76 | $5.43 |
| Class T | 1.33% | | | |
| Actual | | $1,000.00 | $908.20 | $6.38 |
| Hypothetical-C | | $1,000.00 | $1,018.45 | $6.75 |
| Class B | 1.85% | | | |
| Actual | | $1,000.00 | $906.10 | $8.86 |
| Hypothetical-C | | $1,000.00 | $1,015.84 | $9.37 |
| Class C | 1.82% | | | |
| Actual | | $1,000.00 | $906.00 | $8.72 |
| Hypothetical-C | | $1,000.00 | $1,015.99 | $9.22 |
| Class I | .80% | | | |
| Actual | | $1,000.00 | $910.90 | $3.84 |
| Hypothetical-C | | $1,000.00 | $1,021.11 | $4.06 |
| Fidelity Advisor Technology Fund | | | | |
| Class A | 1.09% | | | |
| Actual | | $1,000.00 | $921.40 | $5.26 |
| Hypothetical-C | | $1,000.00 | $1,019.66 | $5.53 |
| Class T | 1.35% | | | |
| Actual | | $1,000.00 | $920.30 | $6.52 |
| Hypothetical-C | | $1,000.00 | $1,018.35 | $6.85 |
| Class B | 1.91% | | | |
| Actual | | $1,000.00 | $917.60 | $9.21 |
| Hypothetical-C | | $1,000.00 | $1,015.53 | $9.68 |
| Class C | 1.85% | | | |
| Actual | | $1,000.00 | $918.20 | $8.92 |
| Hypothetical-C | | $1,000.00 | $1,015.84 | $9.37 |
| Class I | .76% | | | |
| Actual | | $1,000.00 | $923.20 | $3.67 |
| Hypothetical-C | | $1,000.00 | $1,021.32 | $3.86 |
| Fidelity Advisor Utilities Fund | | | | |
| Class A | 1.15% | | | |
| Actual | | $1,000.00 | $974.90 | $5.71 |
| Hypothetical-C | | $1,000.00 | $1,019.36 | $5.84 |
| Class T | 1.45% | | | |
| Actual | | $1,000.00 | $973.70 | $7.19 |
| Hypothetical-C | | $1,000.00 | $1,017.85 | $7.35 |
| Class B | 1.94% | | | |
| Actual | | $1,000.00 | $971.00 | $9.61 |
| Hypothetical-C | | $1,000.00 | $1,015.38 | $9.83 |
| Class C | 1.89% | | | |
| Actual | | $1,000.00 | $971.10 | $9.36 |
| Hypothetical-C | | $1,000.00 | $1,015.63 | $9.58 |
| Class I | .86% | | | |
| Actual | | $1,000.00 | $976.30 | $4.27 |
| Hypothetical-C | | $1,000.00 | $1,020.81 | $4.37 |
| | | | | |
| | | | | |
| | | | | |
A Annualized expense ratio reflects expenses net of applicable fee waivers.
B Expenses are equal to each Class' annualized expense ratio, multiplied by the average account value over the period, multiplied by 184/ 366 (to reflect the one-half year period).
C 5% return per year before expenses
Board Approval of Investment Advisory Contracts and Management Fees
Fidelity Advisor Focus Funds
Each year, the Board of Trustees, including the Independent Trustees (together, the Board), votes on the renewal of the management contract with Fidelity SelectCo, LLC (SelectCo), an affiliate of Fidelity Management & Research Company (FMR), and the sub-advisory agreements with affiliates of FMR (together, the Advisory Contracts) for each fund. The Board, assisted by the advice of fund counsel and Independent Trustees' counsel, requests and considers a broad range of information relevant to the renewal of the Advisory Contracts throughout the year.
The Board meets regularly and, at each of its meetings, covers an extensive agenda of topics and materials and considers factors that are relevant to its annual consideration of the renewal of each fund's Advisory Contracts, including the services and support provided to each fund and its shareholders. The Board has established four standing committees (Committees) — Operations, Audit, Fair Valuation, and Governance and Nominating — each composed of and chaired by Independent Trustees with varying backgrounds, to which the Board has assigned specific subject matter responsibilities in order to enhance effective decision-making by the Board. The Operations Committee, of which all of the Independent Trustees are members, meets regularly throughout the year and considers, among other matters, information specifically related to the annual consideration of the renewal of each fund's Advisory Contracts. The Board, acting directly and through its Committees, requests and receives information concerning the annual consideration of the renewal of each fund's Advisory Contracts. The Board also meets as needed to consider matters specifically related to the Board's annual consideration of the renewal of the Advisory Contracts. Members of the Board may also meet with trustees of other Fidelity funds through ad hoc joint committees to discuss certain matters relevant to all of the Fidelity funds.
At its January 2016 meeting, the Board unanimously determined to renew each fund's Advisory Contracts. In reaching its determination, the Board considered all factors it believed relevant, including (i) the nature, extent, and quality of the services to be provided to each fund and its shareholders (including the investment performance of each fund); (ii) the competitiveness of each fund's management fee and total expense ratio relative to peer funds; (iii) the total costs of the services to be provided by and the profits to be realized by Fidelity from its relationships with each fund; and (iv) the extent to which, if any, economies of scale exist and would be realized as each fund grows, and whether any economies of scale are appropriately shared with fund shareholders.
In considering whether to renew the Advisory Contracts for each fund, the Board reached a determination, with the assistance of fund counsel and Independent Trustees' counsel and through the exercise of its business judgment, that the renewal of the Advisory Contracts was in the best interests of each fund and its shareholders and that the compensation payable under the Advisory Contracts was fair and reasonable. The Board's decision to renew the Advisory Contracts was not based on any single factor, but rather was based on a comprehensive consideration of all the information provided to the Board at its meetings throughout the year. The Board, in reaching its determination to renew the Advisory Contracts, was aware that shareholders of each fund have a broad range of investment choices available to them, including a wide choice among funds offered by Fidelity's competitors, and that each fund's shareholders, who have the opportunity to review and weigh the disclosure provided by the fund in its prospectus and other public disclosures, have chosen to invest in that fund, which is part of the Fidelity family of funds.
Nature, Extent, and Quality of Services Provided. The Board considered the staffing of SelectCo and the sub-advisers (together with SelectCo, the Investment Advisers) as it relates to the funds, including the backgrounds of investment personnel of SelectCo, and also considered the funds' investment objectives, strategies, and related investment philosophies. The Independent Trustees also had discussions with senior management of Fidelity's investment operations and investment groups. The Board considered the structure of the investment personnel compensation program and whether this structure provides appropriate incentives to act in the best interests of each fund. Additionally, the Board considered the portfolio managers' investments, if any, in the funds that they manage.
Resources Dedicated to Investment Management and Support Services. The Board reviewed the general qualifications and capabilities of the investment staff of the Investment Advisers, including their size, education, experience, and resources, as well as Fidelity's approach to recruiting, training, managing, and compensating investment personnel. The Board noted that Fidelity has continued to increase the resources devoted to non-U.S. offices, including expansion of Fidelity's global investment organization. The Board also noted that Fidelity's analysts have extensive resources, tools and capabilities that allow them to conduct sophisticated quantitative and fundamental analysis, as well as credit analysis of issuers, counterparties and guarantors. Further, the Board considered that Fidelity's investment professionals have sufficient access to global information and data so as to provide competitive investment results over time, and that those professionals also have access to sophisticated tools that permit them to assess portfolio construction and risk and performance attribution characteristics continuously, as well as to transmit new information and research conclusions rapidly around the world. Additionally, in its deliberations, the Board considered Fidelity's trading, risk management, compliance, and technology and operations capabilities and resources, which are integral parts of the investment management process.
Shareholder and Administrative Services. The Board considered (i) the nature, extent, quality, and cost of advisory, administrative, and shareholder services performed by the Investment Advisers and their affiliates under the Advisory Contracts and under separate agreements covering transfer agency, pricing and bookkeeping, and securities lending services for each fund; (ii) the nature and extent of the supervision of third party service providers, principally custodians, subcustodians, and pricing vendors; and (iii) the resources devoted to, and the record of compliance with, each fund's compliance policies and procedures. The Board also reviewed the allocation of fund brokerage, including allocations to brokers affiliated with the Investment Advisers, the use of brokerage commissions to pay fund expenses, and the use of "soft" commission dollars to pay for research services.
The Board noted that the growth of fund assets over time across the complex allows Fidelity to reinvest in the development of services designed to enhance the value or convenience of the Fidelity funds as investment vehicles. These services include 24-hour access to account information and market information through telephone representatives and over the Internet, investor education materials and asset allocation tools, and the expanded availability of Fidelity Investor Centers.
The Board noted that in 2014 the ad hoc Committee on Transfer Agency Fees was formed by it and the boards of certain other Fidelity funds to review the variety of transfer agency services and fee structures throughout the mutual fund industry compared to Fidelity's.
Investment in a Large Fund Family. The Board considered the benefits to shareholders of investing in a Fidelity fund, including the benefits of investing in a fund that is part of a large family of funds offering a variety of investment disciplines and providing a large variety of mutual fund investor services. The Board noted that Fidelity had taken, or had made recommendations that resulted in the Fidelity funds taking, a number of actions over the previous year that benefited particular funds, including (i) continuing to dedicate additional resources to investment research and to the support of the senior management team that oversees asset management; (ii) continuing efforts to enhance Fidelity's global research capabilities; (iii) launching new funds and making other enhancements to meet client needs; (iv) reducing management fees and total expenses for certain index funds; (v) continuing to launch dedicated lower cost underlying funds to meet portfolio construction needs related to expanding underlying fund options for Fidelity funds of funds, specifically for the Freedom Fund product lines; (vi) rationalizing product lines and gaining increased efficiencies through fund mergers; (vii) continuing to develop, acquire and implement systems and technology to improve services to the funds and shareholders, strengthen information security, and increase efficiency; (viii) implementing investment enhancements to further strengthen Fidelity's target date product line to increase investors' probability of success in achieving their goals; (ix) modifying the eligibility criteria for certain share classes to accommodate roll-over assets from employer-sponsored retirement plans; (x) launching a new Class W of the Freedom Index Funds to attract and retain Fidelity record-kept retirement plan assets; and (xi) implementing changes to Fidelity's money market fund product line in response to recent regulatory reforms.
Investment Performance. The Board considered whether each fund has operated in accordance with its investment objective, as well as its record of compliance with its investment restrictions and its performance history.
The Board took into account discussions with representatives of the Investment Advisers about fund investment performance that occur at Board meetings throughout the year. In this regard the Board noted that as part of regularly scheduled fund reviews and other reports to the Board on fund performance, the Board considers annualized return information for each fund, for different time periods, measured against a securities market index ("benchmark index"). In its evaluation of fund investment performance at meetings throughout the year, the Board gave particular attention to information indicating underperformance of certain Fidelity funds for specific time periods and discussed with the Investment Advisers the reasons for such underperformance. Each of Advisor Consumer Discretionary, Advisor Financial Services, Advisor Industrials, and Advisor Technology underperformed its benchmark for the one-, three-, and five-year periods ended June 30, 2015, and as a result, the Board will continue to discuss with SelectCo the steps it has taken and is taking to address each such fund's performance.
In addition to reviewing absolute and relative fund performance, the Independent Trustees periodically consider the appropriateness of fund performance metrics in evaluating the results achieved. In general, the Independent Trustees believe that fund performance should be evaluated based on net performance (after fees and expenses) of both the highest performing and lowest performing fund share classes, where applicable, compared to appropriate benchmark indices, over appropriate time periods that may include full market cycles, taking into account relevant factors, including the following: general market conditions; issuer-specific information; and fund cash flows and other factors. Depending on the circumstances, the Independent Trustees may be satisfied with a fund's performance notwithstanding that it lags its benchmark index for certain periods.
The Independent Trustees recognize that shareholders evaluate performance on a net basis over their own holding periods, for which one-, three-, and five-year periods are often used as a proxy. For this reason, the performance information reviewed by the Board also included net cumulative total return information for each fund and an appropriate benchmark index for the most recent one-, three-, and five-year periods ended June 30, 2015.
Based on its review, the Board concluded that the nature, extent, and quality of services provided to each fund under the Advisory Contracts should benefit the shareholders of each fund.
Competitiveness of Management Fee and Total Expense Ratio. The Board considered each fund's management fee and total expense ratio compared to "mapped groups" of competitive funds and classes created for the purpose of facilitating the Trustees' analysis of the competitiveness of management fees and total expenses. Fidelity creates "mapped groups" by combining similar Lipper investment objective categories that have comparable investment mandates. For this purpose, all sector focused equity funds are grouped in the same mapped group. Combining Lipper investment objective categories aids the Board's management fee and total expense ratio comparisons by broadening the competitive group used for comparison.
Management Fee. The Board considered two proprietary management fee comparisons for the 12-month periods ended June 30 shown in basis points (BP) in the charts below. The group of Lipper funds used by the Board for management fee comparisons is referred to below as the "Total Mapped Group." The Total Mapped Group comparison focuses on a fund's standing in terms of gross management fees before expense reimbursements or caps relative to the total universe of funds with comparable investment mandates (
i.e., sector equities), regardless of whether their management fee structures also are comparable. Funds with comparable management fee structures have similar management fee contractual arrangements (
e.g., flat rate charged for advisory services, all-inclusive fee rate,
etc.). "TMG %" represents the percentage of funds in the Total Mapped Group that had management fees that were lower than a fund's. For example, a hypothetical TMG % of 20% would mean that 80% of the funds in the Total Mapped Group had higher, and 20% had lower, management fees than a fund. The funds' actual TMG %s and the number of funds in the Total Mapped Group are in the charts below. The "Asset-Size Peer Group" (ASPG) comparison focuses on a fund's standing relative to a subset of non-Fidelity funds within the Total Mapped Group that are similar in size and management fee structure. For example, if a fund is in the first quartile of the ASPG, the fund's management fee ranks in the least expensive or lowest 25% of funds in the ASPG. The ASPG represents at least 15% of the funds in the Total Mapped Group with comparable asset size and management fee structures, subject to a minimum of 50 funds (or all funds in the Total Mapped Group if fewer than 50). Additional information, such as the ASPG quartile in which a fund's management fee rate ranked, is also included in the charts and considered by the Board.
Fidelity Advisor Biotechnology Fund
Fidelity Advisor Communications Equipment Fund
Fidelity Advisor Consumer Discretionary Fund
Fidelity Advisor Electronics Fund
Fidelity Advisor Energy Fund
Fidelity Advisor Financial Services Fund
Fidelity Advisor Health Care Fund
Fidelity Advisor Industrials Fund
Fidelity Advisor Technology Fund
Fidelity Advisor Utilities Fund
The Board noted that each fund's management fee rate ranked below the median of its Total Mapped Group and below the median of its ASPG for the 12-month period ended June 30, 2015.
The Board noted that, in 2014, the ad hoc Committee on Group Fee was formed by it and the boards of other Fidelity funds to conduct an in-depth review of the "group fee" component of the management fee of funds with such management fee structures. Committee focus included the mechanics of the group fee, the competitive landscape of group fee structures, Fidelity funds with no group fee component and investment products not included in group fee assets. The Board also considered that, for funds subject to the group fee, FMR agreed to voluntarily waive fees over a specified period of time in amounts designed to account for assets converted from certain funds to certain collective investment trusts.
Based on its review, the Board concluded that each fund's management fee is fair and reasonable in light of the services that each fund receives and the other factors considered.
Total Expense Ratio. In its review of the total expense ratio of each class of each fund, the Board considered the fund's management fee rate as well as other fund or class expenses, as applicable, such as transfer agent fees, pricing and bookkeeping fees, fund-paid 12b-1 fees, and custodial, legal, and audit fees. The Board also noted that Fidelity may agree to waive fees and expenses from time to time, and the extent to which, if any, it has done so for the funds. As part of its review, the Board also considered the current and historical total expense ratios of each class of each fund compared to competitive fund median expenses. Each class of each fund is compared to those funds and classes in the Total Mapped Group (used by the Board for management fee comparisons) that have a similar sales load structure.
For Advisor Biotechnology, Advisor Energy, Advisor Health Care, Advisor Industrials, and Advisor Technology, the Board noted that the total expense ratio of each class ranked below the competitive median for the 12-month period ended June 30, 2015.
For Advisor Consumer Discretionary, Advisor Financial Services, and Advisor Utilities, the Board noted that the total expense ratio of each of Class A, Class B, Class C, and Class I ranked below the competitive median for the 12-month period ended June 30, 2015 and the total expense ratio of Class T ranked above the competitive median for the 12-month period ended June 30, 2015.
For Advisor Electronics, the Board noted that the total expense ratio of each of Class A, Class C, and Class I ranked below the competitive median for the 12-month period ended June 30, 2015 and the total expense ratio of each of Class T and Class B ranked above the competitive median for the 12-month period ended June 30, 2015. The Board noted that the total expense ratio for each of Class T and Class B was above median as a result of higher transfer agent fees due to small average account sizes as compared to other funds.
For Advisor Communications Equipment, the Board noted that the total expense ratio of Class A ranked equal to the competitive median for the 12-month period ended June 30, 2015 and the total expense ratio of each of Class T, Class B, Class C, and Class I ranked above the competitive median for the 12-month period ended June 30, 2015. The Board noted that total expenses ratios for these classes were above the median as a result of higher transfer agent fees due to small average account sizes as compared to other Fidelity funds.
The Board considered that, in general, various factors can affect total expense ratios. The Board noted that the total expense ratio of Class T of certain funds was above the competitive median primarily because of higher 12b-1 fees on Class T as compared to most competitor funds. Class T has a higher 12b-1 fee, but a lower front-end sales charge, than traditionally priced front-end sales charge classes. The Board considered that Class T is primarily sold load-waived in the retirement plan market where its 0.50% 12b-1 fee is comparable to competing no-load, higher 12b-1 fee classes designed specifically for retirement plans. The Board noted that each fund offers multiple classes, each of which has a different sales load and 12b-1 fee structure, and that the multiple structures are intended to offer a range of pricing options for the intermediary market. The Board also noted that the total expense ratios of the classes of each fund vary primarily by the level of their 12b-1 fees, although differences in transfer agent fees may also cause expenses to vary from class to class.
Fees Charged to Other Fidelity Clients. The Board also considered Fidelity fee structures and other information with respect to clients of Fidelity, such as other funds advised or subadvised by Fidelity, pension plan clients, and other institutional clients with similar mandates. The Board noted the findings of the 2013 ad hoc joint committee (created with the boards of other Fidelity funds), which reviewed and compared Fidelity's institutional investment advisory business with its business of providing services to the Fidelity funds, including the differences in services provided, fees charged, and costs incurred, as well as competition in their respective marketplaces.
Based on its review of total expense ratios and fees charged to other Fidelity clients, the Board concluded that, although some classes were above the median of the universe presented for comparison, the total expense ratio of each class of each fund was reasonable in light of the services that each fund and its shareholders receive and the other factors considered.
Costs of the Services and Profitability. The Board considered the revenues earned and the expenses incurred by Fidelity in conducting the business of developing, marketing, distributing, managing, administering and servicing each fund and servicing each fund's shareholders. The Board also considered the level of Fidelity's profits in respect of all the Fidelity funds.
On an annual basis, Fidelity presents to the Board information about the profitability of its relationship with each fund. Fidelity calculates profitability information for each fund, as well as aggregate profitability information for groups of Fidelity funds and all Fidelity funds, using a series of detailed revenue and cost allocation methodologies which originate with the books and records of Fidelity on which Fidelity's audited financial statements are based. The Audit Committee of the Board reviews any significant changes from the prior year's methodologies.
PricewaterhouseCoopers LLP (PwC), independent registered public accounting firm and auditor to Fidelity and certain Fidelity funds, has been engaged annually by the Board as part of the Board's assessment of the profitability analysis used by Fidelity. PwC's engagement includes the review and assessment of Fidelity's methodologies used in determining the revenues and expenses attributable to Fidelity's mutual fund business, and completion of agreed-upon procedures in respect of the mathematical accuracy of fund profitability and its conformity to established allocation methodologies. After considering PwC's reports issued under the engagement and information provided by Fidelity, the Board concluded that while other allocation methods may also be reasonable, Fidelity's profitability methodologies are reasonable in all material respects.
The Board also reviewed Fidelity's non-fund businesses and fall-out benefits related to the mutual fund business as well as cases where Fidelity's affiliates may benefit from or be related to the funds' business.
The Board considered the costs of the services provided by and the profits realized by Fidelity in connection with the operation of each fund and was satisfied that the profitability was not excessive.
Economies of Scale. The Board considered whether there have been economies of scale in respect of the management of the Fidelity funds, whether the Fidelity funds (including each fund) have appropriately benefited from any such economies of scale, and whether there is potential for realization of any further economies of scale. The Board considered the extent to which each fund will benefit from economies of scale as assets grow through increased services to the fund, through waivers or reimbursements, or through fee or expense ratio reductions. The Board also noted that in 2013, it and the boards of other Fidelity funds created an ad hoc committee (the Economies of Scale Committee) to analyze whether Fidelity attains economies of scale in respect of the management and servicing of the Fidelity funds, whether the Fidelity funds have appropriately benefited from such economies of scale, and whether there is potential for realization of any further economies of scale.
The Board recognized that each fund's management contract incorporates a "group fee" structure, which provides for lower group fee rates as total group assets increase, and for higher group fee rates as total group assets decrease (with "group assets" defined to include fund assets under SelectCo's management plus assets under FMR's management). SelectCo calculates the group fee rates based on a tiered asset "breakpoint" schedule that varies based on asset class. The Board considered that the group fee is designed to deliver the benefits of economies of scale to fund shareholders when total group assets increase, even if assets of any particular fund are unchanged or have declined, because some portion of Fidelity's costs are attributable to services provided to all Fidelity funds, and all funds benefit if those costs can be allocated among more assets. The Board concluded that, given the group fee structure, fund shareholders will benefit from lower management fees as group assets increase at the fund complex level, regardless of whether Fidelity achieves any such economies of scale.
The Board concluded, taking into account the analysis of the Economies of Scale Committee, that economies of scale, if any, are being appropriately shared between fund shareholders and Fidelity.
Additional Information Requested by the Board. In order to develop fully the factual basis for consideration of the Fidelity funds' Advisory Contracts, the Board requested and received additional information on certain topics, including: (i) Fidelity's fund profitability methodology, profitability trends for certain funds, and the impact of certain factors on fund profitability results; (ii) portfolio manager changes that have occurred during the past year and the amount of the investment that each portfolio manager has made in the Fidelity fund(s) that he or she manages; (iii) Fidelity's compensation structure for portfolio managers, research analysts, and other key personnel, including its effects on fund profitability; (iv) the arrangements with and compensation paid to certain fund sub-advisers on behalf of the Fidelity funds; (v) Fidelity's long-term expectations for its offerings in the workplace investing channel; (vi) the methodology with respect to competitive fund data and peer group classifications; (vii) Fidelity's transfer agent fee, expense, and service structures for different funds and classes, and the impact of outsourcing, the increased use of omnibus accounts, and lower pricing in the retirement channel; and (viii) explanations regarding the relative total expense ratios of certain funds and classes, total expense competitive trends and methodologies for total expense competitive comparisons, and actions that might be taken by Fidelity to reduce total expense ratios for certain funds and classes or to achieve further economies of scale.
Based on its evaluation of all of the conclusions noted above, and after considering all factors it believed relevant, the Board concluded that the advisory fee structures are fair and reasonable, and that each fund's Advisory Contracts should be renewed.
AFOC-SANN-0316
1.700839.119
Item 2.
Code of Ethics
Not applicable.
Item 3.
Audit Committee Financial Expert
Not applicable.
Item 4.
Principal Accountant Fees and Services
Not applicable.
Item 5.
Audit Committee of Listed Registrants
Not applicable.
Item 6.
Investments
(a)
Not applicable.
(b)
Not applicable
Item 7.
Disclosure of Proxy Voting Policies and Procedures for Closed-End Management Investment Companies
Not applicable.
Item 8.
Portfolio Managers of Closed-End Management Investment Companies
Not applicable.
Item 9.
Purchase of Equity Securities by Closed-End Management Investment Company and Affiliated Purchasers
Not applicable.
Item 10.
Submission of Matters to a Vote of Security Holders
There were no material changes to the procedures by which shareholders may recommend nominees to the Fidelity Advisor Series VII’s Board of Trustees.
Item 11.
Controls and Procedures
(a)(i) The President and Treasurer and the Chief Financial Officer have concluded that the Fidelity Advisor Series VII’s (the “Trust”) disclosure controls and procedures (as
defined in Rule 30a-3(c) under the Investment Company Act) provide reasonable assurances that material information relating to the Trust is made known to them by the appropriate persons, based on their evaluation of these controls and procedures as of a date within 90 days of the filing date of this report.
(a)(ii) There was no change in the Trust’s internal control over financial reporting (as defined in Rule 30a-3(d) under the Investment Company Act) that occurred during the second fiscal quarter of the period covered by this report that has materially affected, or is reasonably likely to materially affect, the Trust’s internal control over financial reporting.
Item 12.
Exhibits
| | |
(a) | (1) | Not applicable. |
(a) | (2) | Certification pursuant to Rule 30a-2(a) under the Investment Company Act of 1940 (17 CFR 270.30a-2(a)) is filed and attached hereto as Exhibit 99.CERT. |
(a) | (3) | Not applicable. |
(b) |
| Certification pursuant to Rule 30a-2(b) under the Investment Company Act of 1940 (17 CFR 270.30a-2(b)) is furnished and attached hereto as Exhibit 99.906CERT. |
SIGNATURES
Pursuant to the requirements of the Securities Exchange Act of 1934 and the Investment Company Act of 1940, the registrant has duly caused this report to be signed on its behalf by the undersigned, thereunto duly authorized.
Fidelity Advisor Series VII
| |
By: | /s/Adrien E. Deberghes |
| Adrien E. Deberghes |
| President and Treasurer |
|
|
Date: | March 25, 2016 |
Pursuant to the requirements of the Securities Exchange Act of 1934 and the Investment Company Act of 1940, this report has been signed below by the following persons on behalf of the registrant and in the capacities and on the dates indicated.
| |
By: | /s/Adrien E. Deberghes |
| Adrien E. Deberghes |
| President and Treasurer |
|
|
Date: | March 25, 2016 |
| |
By: | /s/Howard J. Galligan III |
| Howard J. Galligan III |
| Chief Financial Officer |
|
|
Date: | March 25, 2016 |