Fidelity Advisor® Real Estate Fund
Semi-Annual Report January 31, 2019 |
 |
Beginning on January 1, 2021, as permitted by regulations adopted by the Securities and Exchange Commission, paper copies of a fund’s shareholder reports will no longer be sent by mail, unless you specifically request paper copies of the reports from the fund or from your financial intermediary, such as a financial advisor, broker-dealer or bank. Instead, the reports will be made available on a website, and you will be notified by mail each time a report is posted and provided with a website link to access the report.
If you already elected to receive shareholder reports electronically, you will not be affected by this change and you need not take any action. You may elect to receive shareholder reports and other communications from a fund electronically, by contacting your financial intermediary. For Fidelity customers, visit Fidelity's web site or call Fidelity using the contact information listed below.
You may elect to receive all future reports in paper free of charge. If you wish to continue receiving paper copies of your shareholder reports, you may contact your financial intermediary or, if you are a Fidelity customer, visit Fidelity’s website, or call Fidelity at the applicable toll-free number listed below. Your election to receive reports in paper will apply to all funds held with the fund complex/your financial intermediary.
| Account Type | Website | Phone Number |
| Brokerage, Mutual Fund, or Annuity Contracts: | fidelity.com/mailpreferences | 1-800-343-3548 |
| Employer Provided Retirement Accounts: | netbenefits.fidelity.com/preferences (choose 'no' under Required Disclosures to continue to print) | 1-800-343-0860 |
| Advisor Sold Accounts Serviced Through Your Financial Intermediary: | Contact Your Financial Intermediary | Your Financial Intermediary's phone number |
| Advisor Sold Accounts Serviced by Fidelity: | institutional.fidelity.com | 1-877-208-0098 |
Contents
To view a fund's proxy voting guidelines and proxy voting record for the 12-month period ended June 30, visit http://www.fidelity.com/proxyvotingresults or visit the Securities and Exchange Commission's (SEC) web site at http://www.sec.gov.
You may also call 1-877-208-0098 to request a free copy of the proxy voting guidelines.
Standard & Poor's, S&P and S&P 500 are registered service marks of The McGraw-Hill Companies, Inc. and have been licensed for use by Fidelity Distributors Corporation.
Other third-party marks appearing herein are the property of their respective owners.
All other marks appearing herein are registered or unregistered trademarks or service marks of FMR LLC or an affiliated company. © 2019 FMR LLC. All rights reserved.
This report and the financial statements contained herein are submitted for the general information of the shareholders of the Fund. This report is not authorized for distribution to prospective investors in the Fund unless preceded or accompanied by an effective prospectus.
A fund files its complete schedule of portfolio holdings with the SEC for the first and third quarters of each fiscal year on Form N-Q. Forms N-Q are available on the SEC’s web site at http://www.sec.gov. A fund's Forms N-Q may be reviewed and copied at the SEC’s Public Reference Room in Washington, DC. Information regarding the operation of the SEC's Public Reference Room may be obtained by calling 1-800-SEC-0330.
For a complete list of a fund's portfolio holdings, view the most recent holdings listing, semiannual report, or annual report on Fidelity's web site at http://www.fidelity.com, http://www.institutional.fidelity.com, or http://www.401k.com, as applicable.
NOT FDIC INSURED •MAY LOSE VALUE •NO BANK GUARANTEE
Neither the Fund nor Fidelity Distributors Corporation is a bank.
Investment Summary (Unaudited)
Top Ten Stocks as of January 31, 2019
| | % of fund's net assets |
| Simon Property Group, Inc. | 8.5 |
| Prologis, Inc. | 7.8 |
| AvalonBay Communities, Inc. | 6.0 |
| Boston Properties, Inc. | 6.0 |
| Public Storage | 5.8 |
| Essex Property Trust, Inc. | 5.0 |
| Ventas, Inc. | 4.5 |
| UDR, Inc. | 4.0 |
| Welltower, Inc. | 3.6 |
| Equity Lifestyle Properties, Inc. | 3.2 |
| | 54.4 |
Top Five REIT Sectors as of January 31, 2019
| | % of fund's net assets |
| REITs - Apartments | 19.5 |
| REITs - Office Property | 14.3 |
| REITs - Health Care | 10.4 |
| REITs - Diversified | 9.9 |
| REITs - Regional Malls | 9.7 |
Asset Allocation (% of fund's net assets)
| As of January 31, 2019 |
| | Stocks | 99.4% |
| | Short-Term Investments and Net Other Assets (Liabilities) | 0.6% |

Schedule of Investments January 31, 2019 (Unaudited)
Showing Percentage of Net Assets
| Common Stocks - 99.4% | | | |
| | | Shares | Value |
| Equity Real Estate Investment Trusts (REITs) - 97.1% | | | |
| REITs - Apartments - 19.5% | | | |
| AvalonBay Communities, Inc. | | 174,340 | $33,633,673 |
| Equity Residential (SBI) | | 241,009 | 17,487,613 |
| Essex Property Trust, Inc. | | 102,947 | 27,919,226 |
| Invitation Homes, Inc. | | 336,900 | 7,576,881 |
| UDR, Inc. | | 508,500 | 22,246,875 |
| | | | 108,864,268 |
| REITs - Diversified - 9.9% | | | |
| Clipper Realty, Inc. | | 170,800 | 2,211,860 |
| Digital Realty Trust, Inc. | | 94,100 | 10,194,794 |
| Duke Realty Corp. | | 491,400 | 14,368,536 |
| Equinix, Inc. | | 34,800 | 13,711,200 |
| Vornado Realty Trust | | 86,900 | 6,075,179 |
| Washington REIT (SBI) | | 358,700 | 9,093,045 |
| | | | 55,654,614 |
| REITs - Health Care - 10.4% | | | |
| Healthcare Realty Trust, Inc. | | 403,400 | 13,025,786 |
| Ventas, Inc. | | 392,705 | 25,325,545 |
| Welltower, Inc. | | 257,019 | 19,916,402 |
| | | | 58,267,733 |
| REITs - Hotels - 6.3% | | | |
| Braemar Hotels & Resorts, Inc. | | 303,800 | 3,378,256 |
| Host Hotels & Resorts, Inc. | | 209,034 | 3,775,154 |
| Pebblebrook Hotel Trust (a) | | 226,400 | 7,256,120 |
| RLJ Lodging Trust | | 668,600 | 12,402,530 |
| Sunstone Hotel Investors, Inc. | | 576,900 | 8,249,670 |
| | | | 35,061,730 |
| REITs - Management/Investment - 0.8% | | | |
| American Tower Corp. | | 25,700 | 4,441,988 |
| REITs - Manufactured Homes - 3.2% | | | |
| Equity Lifestyle Properties, Inc. | | 168,703 | 17,862,274 |
| REITs - Office Property - 14.3% | | | |
| Alexandria Real Estate Equities, Inc. | | 130,400 | 17,174,984 |
| Boston Properties, Inc. | | 254,247 | 33,527,552 |
| Douglas Emmett, Inc. | | 279,900 | 10,588,617 |
| Highwoods Properties, Inc. (SBI) | | 398,500 | 17,661,520 |
| SL Green Realty Corp. | | 10,400 | 961,272 |
| | | | 79,913,945 |
| REITs - Regional Malls - 9.7% | | | |
| Simon Property Group, Inc. | | 261,850 | 47,688,122 |
| Taubman Centers, Inc. | | 128,200 | 6,384,360 |
| | | | 54,072,482 |
| REITs - Shopping Centers - 6.2% | | | |
| Acadia Realty Trust (SBI) | | 353,271 | 10,149,476 |
| Cedar Realty Trust, Inc. | | 1,163,770 | 4,061,557 |
| DDR Corp. | | 584,350 | 7,637,455 |
| Urban Edge Properties | | 616,941 | 12,597,935 |
| | | | 34,446,423 |
| REITs - Storage - 7.4% | | | |
| CubeSmart | | 288,500 | 8,929,075 |
| Public Storage | | 153,350 | 32,589,942 |
| | | | 41,519,017 |
| REITs - Warehouse/Industrial - 9.4% | | | |
| Americold Realty Trust | | 144,100 | 4,225,012 |
| Prologis, Inc. | | 627,154 | 43,373,971 |
| Terreno Realty Corp. | | 124,400 | 5,018,296 |
| | | | 52,617,279 |
|
| TOTAL EQUITY REAL ESTATE INVESTMENT TRUSTS (REITS) | | | 542,721,753 |
|
| Hotels, Restaurants & Leisure - 1.4% | | | |
| Hotels, Resorts & Cruise Lines - 1.4% | | | |
| Hilton Grand Vacations, Inc. (b) | | 93,600 | 2,839,824 |
| Hilton Worldwide Holdings, Inc. | | 69,600 | 5,183,808 |
| | | | 8,023,632 |
| Household Durables - 0.4% | | | |
| Homebuilding - 0.4% | | | |
| D.R. Horton, Inc. | | 60,600 | 2,330,070 |
| Real Estate Management & Development - 0.5% | | | |
| Real Estate Development - 0.5% | | | |
| Howard Hughes Corp. (b) | | 23,100 | 2,565,024 |
| TOTAL COMMON STOCKS | | | |
| (Cost $412,749,881) | | | 555,640,479 |
|
| Money Market Funds - 0.1% | | | |
| Fidelity Securities Lending Cash Central Fund 2.43% (c)(d) | | | |
| (Cost $553,350) | | 553,295 | 553,350 |
| TOTAL INVESTMENT IN SECURITIES - 99.5% | | | |
| (Cost $413,303,231) | | | 556,193,829 |
| NET OTHER ASSETS (LIABILITIES) - 0.5% | | | 3,036,307 |
| NET ASSETS - 100% | | | $559,230,136 |
Legend
(a) Security or a portion of the security is on loan at period end.
(b) Non-income producing
(c) Affiliated fund that is generally available only to investment companies and other accounts managed by Fidelity Investments. The rate quoted is the annualized seven-day yield of the fund at period end. A complete unaudited listing of the fund's holdings as of its most recent quarter end is available upon request. In addition, each Fidelity Central Fund's financial statements are available on the SEC's website or upon request.
(d) Investment made with cash collateral received from securities on loan.
Affiliated Central Funds
Information regarding fiscal year to date income earned by the Fund from investments in Fidelity Central Funds is as follows:
| Fund | Income earned |
| Fidelity Cash Central Fund | $86,983 |
| Fidelity Securities Lending Cash Central Fund | 692 |
| Total | $87,675 |
Amounts in the income column in the above table include any capital gain distributions from underlying funds, which are presented in the corresponding line-item in the Statement of Operations, if applicable.
Investment Valuation
All investments are categorized as Level 1 under the Fair Value Hierarchy. The inputs or methodology used for valuing securities may not be an indication of the risk associated with investing in those securities. For more information on valuation inputs please refer to the Investment Valuation section in the accompanying Notes to Financial Statements.
See accompanying notes which are an integral part of the financial statements.
Financial Statements
Statement of Assets and Liabilities
| | | January 31, 2019 (Unaudited) |
| Assets | | |
Investment in securities, at value (including securities loaned of $544,850) — See accompanying schedule:
Unaffiliated issuers (cost $412,749,881) | $555,640,479 | |
| Fidelity Central Funds (cost $553,350) | 553,350 | |
| Total Investment in Securities (cost $413,303,231) | | $556,193,829 |
| Receivable for investments sold | | 6,881,092 |
| Receivable for fund shares sold | | 421,128 |
| Dividends receivable | | 66,848 |
| Distributions receivable from Fidelity Central Funds | | 9,859 |
| Prepaid expenses | | 5,858 |
| Other receivables | | 60,783 |
| Total assets | | 563,639,397 |
| Liabilities | | |
| Payable to custodian bank | $310,101 | |
| Payable for investments purchased | 295,721 | |
| Payable for fund shares redeemed | 2,692,508 | |
| Accrued management fee | 240,995 | |
| Distribution and service plan fees payable | 109,832 | |
| Other affiliated payables | 118,391 | |
| Other payables and accrued expenses | 88,363 | |
| Collateral on securities loaned | 553,350 | |
| Total liabilities | | 4,409,261 |
| Net Assets | | $559,230,136 |
| Net Assets consist of: | | |
| Paid in capital | | $418,459,736 |
| Total distributable earnings (loss) | | 140,770,400 |
| Net Assets | | $559,230,136 |
| Net Asset Value and Maximum Offering Price | | |
| Class A: | | |
| Net Asset Value and redemption price per share ($146,845,066 ÷ 6,833,574 shares) | | $21.49 |
| Maximum offering price per share (100/94.25 of $21.49) | | $22.80 |
| Class M: | | |
| Net Asset Value and redemption price per share ($128,159,206 ÷ 5,971,776 shares) | | $21.46 |
| Maximum offering price per share (100/96.50 of $21.46) | | $22.24 |
| Class C: | | |
| Net Asset Value and offering price per share ($38,866,838 ÷ 1,857,273 shares)(a) | | $20.93 |
| Class I: | | |
| Net Asset Value, offering price and redemption price per share ($241,137,878 ÷ 11,108,099 shares) | | $21.71 |
| Class Z: | | |
| Net Asset Value, offering price and redemption price per share ($4,221,148 ÷ 194,417 shares) | | $21.71 |
(a) Redemption price per share is equal to net asset value less any applicable contingent deferred sales charge.
See accompanying notes which are an integral part of the financial statements.
Statement of Operations
| | | Six months ended January 31, 2019 (Unaudited) |
| Investment Income | | |
| Dividends | | $6,913,471 |
| Income from Fidelity Central Funds | | 87,675 |
| Total income | | 7,001,146 |
| Expenses | | |
| Management fee | $1,546,842 | |
| Transfer agent fees | 650,449 | |
| Distribution and service plan fees | 695,014 | |
| Accounting and security lending fees | 107,378 | |
| Custodian fees and expenses | 11,757 | |
| Independent trustees' fees and expenses | 1,879 | |
| Registration fees | 25,274 | |
| Audit | 24,420 | |
| Legal | 722 | |
| Miscellaneous | 2,065 | |
| Total expenses before reductions | 3,065,800 | |
| Expense reductions | (11,363) | |
| Total expenses after reductions | | 3,054,437 |
| Net investment income (loss) | | 3,946,709 |
| Realized and Unrealized Gain (Loss) | | |
| Net realized gain (loss) on: | | |
| Investment securities: | | |
| Unaffiliated issuers | 7,923,909 | |
| Fidelity Central Funds | (29) | |
| Foreign currency transactions | (103) | |
| Total net realized gain (loss) | | 7,923,777 |
| Change in net unrealized appreciation (depreciation) on investment securities | | 1,828,008 |
| Net gain (loss) | | 9,751,785 |
| Net increase (decrease) in net assets resulting from operations | | $13,698,494 |
See accompanying notes which are an integral part of the financial statements.
Statement of Changes in Net Assets
| | Six months ended January 31, 2019 (Unaudited) | Year ended July 31, 2018 |
| Increase (Decrease) in Net Assets | | |
| Operations | | |
| Net investment income (loss) | $3,946,709 | $12,793,658 |
| Net realized gain (loss) | 7,923,777 | 33,476,991 |
| Change in net unrealized appreciation (depreciation) | 1,828,008 | (35,357,635) |
| Net increase (decrease) in net assets resulting from operations | 13,698,494 | 10,913,014 |
| Distributions to shareholders | (28,965,938) | – |
| Distributions to shareholders from net investment income | – | (12,752,889) |
| Distributions to shareholders from net realized gain | – | (37,943,280) |
| Total distributions | (28,965,938) | (50,696,169) |
| Share transactions - net increase (decrease) | (42,657,779) | (207,917,506) |
| Total increase (decrease) in net assets | (57,925,223) | (247,700,661) |
| Net Assets | | |
| Beginning of period | 617,155,359 | 864,856,020 |
| End of period | $559,230,136 | $617,155,359 |
| Other Information | | |
| Undistributed net investment income end of period | | $2,818,971 |
See accompanying notes which are an integral part of the financial statements.
Financial Highlights
Fidelity Advisor Real Estate Fund Class A
| | Six months ended (Unaudited) January 31, | Years endedJuly 31, | | | | |
| | 2019 | 2018 | 2017 | 2016 | 2015 | 2014 |
| Selected Per–Share Data | | | | | | |
| Net asset value, beginning of period | $22.07 | $22.96 | $25.93 | $22.90 | $22.57 | $20.92 |
| Income from Investment Operations | | | | | | |
| Net investment income (loss)A | .14 | .37 | .33 | .37 | .30 | .31 |
| Net realized and unrealized gain (loss) | .40 | .21B | (1.82) | 3.61 | 1.82 | 2.13 |
| Total from investment operations | .54 | .58 | (1.49) | 3.98 | 2.12 | 2.44 |
| Distributions from net investment income | (.39) | (.36) | (.30) | (.36) | (.30) | (.27) |
| Distributions from net realized gain | (.73) | (1.11) | (1.18) | (.59) | (1.49) | (.52) |
| Total distributions | (1.12) | (1.47) | (1.48) | (.95) | (1.79) | (.79) |
| Net asset value, end of period | $21.49 | $22.07 | $22.96 | $25.93 | $22.90 | $22.57 |
| Total ReturnC,D,E | 2.63% | 2.55% | (5.63)% | 18.33% | 9.70% | 12.34% |
| Ratios to Average Net AssetsF,G | | | | | | |
| Expenses before reductions | 1.10%H | 1.10% | 1.09% | 1.09% | 1.10% | 1.16% |
| Expenses net of fee waivers, if any | 1.09%H | 1.10% | 1.09% | 1.09% | 1.10% | 1.16% |
| Expenses net of all reductions | 1.09%H | 1.10% | 1.08% | 1.08% | 1.09% | 1.15% |
| Net investment income (loss) | 1.34%H | 1.70% | 1.42% | 1.62% | 1.32% | 1.47% |
| Supplemental Data | | | | | | |
| Net assets, end of period (000 omitted) | $146,845 | $161,570 | $249,442 | $370,408 | $327,489 | $274,136 |
| Portfolio turnover rateI | 50%H | 41% | 69% | 62% | 57% | 83% |
A Calculated based on average shares outstanding during the period.
B The amount shown for a share outstanding does not correspond with the aggregate net gain (loss) on investments for the period due to the timing of sales and repurchases of shares in relation to fluctuating market values of the investments of the Fund.
C Total returns for periods of less than one year are not annualized.
D Total returns would have been lower if certain expenses had not been reduced during the applicable periods shown.
E Total returns do not include the effect of the sales charges.
F Fees and expenses of any underlying Fidelity Central Funds are not included in the Fund's expense ratio. The Fund indirectly bears its proportionate share of the expenses of any underlying Fidelity Central Funds.
G Expense ratios reflect operating expenses of the class. Expenses before reductions do not reflect amounts reimbursed by the investment adviser or reductions from brokerage service arrangements or reductions from other expense offset arrangements and do not represent the amount paid by the class during periods when reimbursements or reductions occur. Expenses net of fee waivers reflect expenses after reimbursement by the investment adviser but prior to reductions from brokerage service arrangements or other expense offset arrangements. Expenses net of all reductions represent the net expenses paid by the class.
H Annualized
I Amount does not include the portfolio activity of any underlying Fidelity Central Funds.
See accompanying notes which are an integral part of the financial statements.
Fidelity Advisor Real Estate Fund Class M
| | Six months ended (Unaudited) January 31, | Years endedJuly 31, | | | | |
| | 2019 | 2018 | 2017 | 2016 | 2015 | 2014 |
| Selected Per–Share Data | | | | | | |
| Net asset value, beginning of period | $22.05 | $22.94 | $25.90 | $22.88 | $22.55 | $20.91 |
| Income from Investment Operations | | | | | | |
| Net investment income (loss)A | .12 | .32 | .27 | .32 | .25 | .26 |
| Net realized and unrealized gain (loss) | .39 | .21B | (1.81) | 3.60 | 1.82 | 2.13 |
| Total from investment operations | .51 | .53 | (1.54) | 3.92 | 2.07 | 2.39 |
| Distributions from net investment income | (.37) | (.31) | (.24) | (.30) | (.25) | (.23) |
| Distributions from net realized gain | (.73) | (1.11) | (1.18) | (.59) | (1.49) | (.52) |
| Total distributions | (1.10) | (1.42) | (1.42) | (.90)C | (1.74) | (.75) |
| Net asset value, end of period | $21.46 | $22.05 | $22.94 | $25.90 | $22.88 | $22.55 |
| Total ReturnD,E,F | 2.49% | 2.34% | (5.83)% | 18.02% | 9.46% | 12.07% |
| Ratios to Average Net AssetsG,H | | | | | | |
| Expenses before reductions | 1.32%I | 1.33% | 1.33% | 1.33% | 1.34% | 1.37% |
| Expenses net of fee waivers, if any | 1.32%I | 1.33% | 1.33% | 1.33% | 1.34% | 1.37% |
| Expenses net of all reductions | 1.31%I | 1.32% | 1.32% | 1.32% | 1.33% | 1.36% |
| Net investment income (loss) | 1.12%I | 1.47% | 1.18% | 1.38% | 1.09% | 1.26% |
| Supplemental Data | | | | | | |
| Net assets, end of period (000 omitted) | $128,159 | $127,038 | $153,285 | $199,431 | $168,375 | $138,783 |
| Portfolio turnover rateJ | 50%I | 41% | 69% | 62% | 57% | 83% |
A Calculated based on average shares outstanding during the period.
B The amount shown for a share outstanding does not correspond with the aggregate net gain (loss) on investments for the period due to the timing of sales and repurchases of shares in relation to fluctuating market values of the investments of the Fund.
C Total distributions of $.90 per share is comprised of distributions from net investment income of $.303 and distributions from net realized gain of $.594 per share.
D Total returns for periods of less than one year are not annualized.
E Total returns would have been lower if certain expenses had not been reduced during the applicable periods shown.
F Total returns do not include the effect of the sales charges.
G Fees and expenses of any underlying Fidelity Central Funds are not included in the Fund's expense ratio. The Fund indirectly bears its proportionate share of the expenses of any underlying Fidelity Central Funds.
H Expense ratios reflect operating expenses of the class. Expenses before reductions do not reflect amounts reimbursed by the investment adviser or reductions from brokerage service arrangements or reductions from other expense offset arrangements and do not represent the amount paid by the class during periods when reimbursements or reductions occur. Expenses net of fee waivers reflect expenses after reimbursement by the investment adviser but prior to reductions from brokerage service arrangements or other expense offset arrangements. Expenses net of all reductions represent the net expenses paid by the class.
I Annualized
J Amount does not include the portfolio activity of any underlying Fidelity Central Funds.
See accompanying notes which are an integral part of the financial statements.
Fidelity Advisor Real Estate Fund Class C
| | Six months ended (Unaudited) January 31, | Years endedJuly 31, | | | | |
| | 2019 | 2018 | 2017 | 2016 | 2015 | 2014 |
| Selected Per–Share Data | | | | | | |
| Net asset value, beginning of period | $21.54 | $22.46 | $25.43 | $22.49 | $22.23 | $20.61 |
| Income from Investment Operations | | | | | | |
| Net investment income (loss)A | .06 | .20 | .15 | .19 | .13 | .15 |
| Net realized and unrealized gain (loss) | .38 | .20B | (1.78) | 3.54 | 1.78 | 2.10 |
| Total from investment operations | .44 | .40 | (1.63) | 3.73 | 1.91 | 2.25 |
| Distributions from net investment income | (.32) | (.21) | (.16) | (.20) | (.16) | (.11) |
| Distributions from net realized gain | (.73) | (1.11) | (1.18) | (.59) | (1.49) | (.52) |
| Total distributions | (1.05) | (1.32) | (1.34) | (.79) | (1.65) | (.63) |
| Net asset value, end of period | $20.93 | $21.54 | $22.46 | $25.43 | $22.49 | $22.23 |
| Total ReturnC,D,E | 2.22% | 1.77% | (6.34)% | 17.40% | 8.85% | 11.52% |
| Ratios to Average Net AssetsF,G | | | | | | |
| Expenses before reductions | 1.88%H | 1.88% | 1.86% | 1.86% | 1.87% | 1.90% |
| Expenses net of fee waivers, if any | 1.88%H | 1.88% | 1.86% | 1.86% | 1.87% | 1.90% |
| Expenses net of all reductions | 1.87%H | 1.87% | 1.86% | 1.85% | 1.86% | 1.89% |
| Net investment income (loss) | .56%H | .92% | .65% | .85% | .56% | .73% |
| Supplemental Data | | | | | | |
| Net assets, end of period (000 omitted) | $38,867 | $43,690 | $62,551 | $86,755 | $79,291 | $64,822 |
| Portfolio turnover rateI | 50%H | 41% | 69% | 62% | 57% | 83% |
A Calculated based on average shares outstanding during the period.
B The amount shown for a share outstanding does not correspond with the aggregate net gain (loss) on investments for the period due to the timing of sales and repurchases of shares in relation to fluctuating market values of the investments of the Fund.
C Total returns for periods of less than one year are not annualized.
D Total returns would have been lower if certain expenses had not been reduced during the applicable periods shown.
E Total returns do not include the effect of the contingent deferred sales charge.
F Fees and expenses of any underlying Fidelity Central Funds are not included in the Fund's expense ratio. The Fund indirectly bears its proportionate share of the expenses of any underlying Fidelity Central Funds.
G Expense ratios reflect operating expenses of the class. Expenses before reductions do not reflect amounts reimbursed by the investment adviser or reductions from brokerage service arrangements or reductions from other expense offset arrangements and do not represent the amount paid by the class during periods when reimbursements or reductions occur. Expenses net of fee waivers reflect expenses after reimbursement by the investment adviser but prior to reductions from brokerage service arrangements or other expense offset arrangements. Expenses net of all reductions represent the net expenses paid by the class.
H Annualized
I Amount does not include the portfolio activity of any underlying Fidelity Central Funds.
See accompanying notes which are an integral part of the financial statements.
Fidelity Advisor Real Estate Fund Class I
| | Six months ended (Unaudited) January 31, | Years endedJuly 31, | | | | |
| | 2019 | 2018 | 2017 | 2016 | 2015 | 2014 |
| Selected Per–Share Data | | | | | | |
| Net asset value, beginning of period | $22.28 | $23.17 | $26.15 | $23.09 | $22.74 | $21.07 |
| Income from Investment Operations | | | | | | |
| Net investment income (loss)A | .18 | .43 | .39 | .43 | .36 | .36 |
| Net realized and unrealized gain (loss) | .40 | .21B | (1.83) | 3.64 | 1.83 | 2.15 |
| Total from investment operations | .58 | .64 | (1.44) | 4.07 | 2.19 | 2.51 |
| Distributions from net investment income | (.41) | (.42) | (.36) | (.41) | (.35) | (.32) |
| Distributions from net realized gain | (.73) | (1.11) | (1.18) | (.59) | (1.49) | (.52) |
| Total distributions | (1.15)C | (1.53) | (1.54) | (1.01)D | (1.84) | (.84) |
| Net asset value, end of period | $21.71 | $22.28 | $23.17 | $26.15 | $23.09 | $22.74 |
| Total ReturnE,F | 2.77% | 2.84% | (5.36)% | 18.61% | 9.99% | 12.64% |
| Ratios to Average Net AssetsG,H | | | | | | |
| Expenses before reductions | .81%I | .82% | .82% | .84% | .85% | .89% |
| Expenses net of fee waivers, if any | .81%I | .82% | .82% | .83% | .85% | .89% |
| Expenses net of all reductions | .81%I | .81% | .81% | .83% | .84% | .88% |
| Net investment income (loss) | 1.63%I | 1.98% | 1.69% | 1.87% | 1.57% | 1.74% |
| Supplemental Data | | | | | | |
| Net assets, end of period (000 omitted) | $241,138 | $284,857 | $399,578 | $422,848 | $349,301 | $298,932 |
| Portfolio turnover rateJ | 50%I | 41% | 69% | 62% | 57% | 83% |
A Calculated based on average shares outstanding during the period.
B The amount shown for a share outstanding does not correspond with the aggregate net gain (loss) on investments for the period due to the timing of sales and repurchases of shares in relation to fluctuating market values of the investments of the Fund.
C Total distributions of $1.15 per share is comprised of distributions from net investment income of $.414 and distributions from net realized gain of $.731 per share.
D Total distributions of $1.01 per share is comprised of distributions from net investment income of $.413 and distributions from net realized gain of $.594 per share.
E Total returns for periods of less than one year are not annualized.
F Total returns would have been lower if certain expenses had not been reduced during the applicable periods shown.
G Fees and expenses of any underlying Fidelity Central Funds are not included in the Fund's expense ratio. The Fund indirectly bears its proportionate share of the expenses of any underlying Fidelity Central Funds.
H Expense ratios reflect operating expenses of the class. Expenses before reductions do not reflect amounts reimbursed by the investment adviser or reductions from brokerage service arrangements or reductions from other expense offset arrangements and do not represent the amount paid by the class during periods when reimbursements or reductions occur. Expenses net of fee waivers reflect expenses after reimbursement by the investment adviser but prior to reductions from brokerage service arrangements or other expense offset arrangements. Expenses net of all reductions represent the net expenses paid by the class.
I Annualized
J Amount does not include the portfolio activity of any underlying Fidelity Central Funds.
See accompanying notes which are an integral part of the financial statements.
Fidelity Advisor Real Estate Fund Class Z
| | Six months ended (Unaudited) January 31, |
| | 2019 A |
| Selected Per–Share Data | |
| Net asset value, beginning of period | $21.91 |
| Income from Investment Operations | |
| Net investment income (loss)B | .16 |
| Net realized and unrealized gain (loss) | .65 |
| Total from investment operations | .81 |
| Distributions from net investment income | (.28) |
| Distributions from net realized gain | (.73) |
| Total distributions | (1.01) |
| Net asset value, end of period | $21.71 |
| Total ReturnC,D | 3.87% |
| Ratios to Average Net AssetsE,F | |
| Expenses before reductions | .65%G |
| Expenses net of fee waivers, if any | .65%G |
| Expenses net of all reductions | .64%G |
| Net investment income (loss) | 2.37%G |
| Supplemental Data | |
| Net assets, end of period (000 omitted) | $4,221 |
| Portfolio turnover rateH | 50%G |
A For the period October 2, 2018 (commencement of sale of shares) to January 31, 2019.
B Calculated based on average shares outstanding during the period.
C Total returns for periods of less than one year are not annualized.
D Total returns would have been lower if certain expenses had not been reduced during the applicable periods shown.
E Fees and expenses of any underlying Fidelity Central Funds are not included in the Fund's expense ratio. The Fund indirectly bears its proportionate share of the expenses of any underlying Fidelity Central Funds.
F Expense ratios reflect operating expenses of the class. Expenses before reductions do not reflect amounts reimbursed by the investment adviser or reductions from brokerage service arrangements or reductions from other expense offset arrangements and do not represent the amount paid by the class during periods when reimbursements or reductions occur. Expense ratios before reductions for start-up periods may not be representative of longer-term operating periods. Expenses net of fee waivers reflect expenses after reimbursement by the investment adviser but prior to reductions from brokerage service arrangements or other expense offset arrangements. Expenses net of all reductions represent the net expenses paid by the class.
G Annualized
H Amount does not include the portfolio activity of any underlying Fidelity Central Funds.
See accompanying notes which are an integral part of the financial statements.
Notes to Financial Statements (Unaudited)
For the period ended January 31, 2019
1. Organization.
Fidelity Advisor Real Estate Fund (the Fund) is a non-diversified fund of Fidelity Advisor Series VII (the Trust) and is authorized to issue an unlimited number of shares. The Trust is registered under the Investment Company Act of 1940, as amended (the 1940 Act), as an open-end management investment company organized as a Massachusetts business trust. The Fund commenced sale of Class Z shares on October 2, 2018. The Fund offers Class A, Class M, Class C, Class I and Class Z shares, each of which has equal rights as to assets and voting privileges. Each class has exclusive voting rights with respect to matters that affect that class.
Effective March 1, 2019, Class C shares will automatically convert to Class A shares after a holding period of ten years from the initial date of purchase, with certain exceptions.
2. Investments in Fidelity Central Funds.
The Fund invests in Fidelity Central Funds, which are open-end investment companies generally available only to other investment companies and accounts managed by the investment adviser and its affiliates. The Fund's Schedule of Investments lists each of the Fidelity Central Funds held as of period end, if any, as an investment of the Fund, but does not include the underlying holdings of each Fidelity Central Fund. As an Investing Fund, the Fund indirectly bears its proportionate share of the expenses of the underlying Fidelity Central Funds.
The Money Market Central Funds seek preservation of capital and current income and are managed by Fidelity Investments Money Management, Inc. (FIMM), an affiliate of the investment adviser. Annualized expenses of the Money Market Central Funds as of their most recent shareholder report date are less than .005%.
A complete unaudited list of holdings for each Fidelity Central Fund is available upon request or at the Securities and Exchange Commission (the SEC) website at www.sec.gov. In addition, the financial statements of the Fidelity Central Funds are available on the SEC website or upon request.
3. Significant Accounting Policies.
The Fund is an investment company and applies the accounting and reporting guidance of the Financial Accounting Standards Board (FASB) Accounting Standards Codification Topic 946 Financial Services – Investments Companies. The financial statements have been prepared in conformity with accounting principles generally accepted in the United States of America (GAAP), which require management to make certain estimates and assumptions at the date of the financial statements. Actual results could differ from those estimates. Subsequent events, if any, through the date that the financial statements were issued have been evaluated in the preparation of the financial statements. The following summarizes the significant accounting policies of the Fund:
Investment Valuation. Investments are valued as of 4:00 p.m. Eastern time on the last calendar day of the period. The Board of Trustees (the Board) has delegated the day to day responsibility for the valuation of the Fund's investments to the Fair Value Committee (the Committee) established by the Fund's investment adviser. In accordance with valuation policies and procedures approved by the Board, the Fund attempts to obtain prices from one or more third party pricing vendors or brokers to value its investments. When current market prices, quotations or currency exchange rates are not readily available or reliable, investments will be fair valued in good faith by the Committee, in accordance with procedures adopted by the Board. Factors used in determining fair value vary by investment type and may include market or investment specific events. The frequency with which these procedures are used cannot be predicted and they may be utilized to a significant extent. The Committee oversees the Fund's valuation policies and procedures and reports to the Board on the Committee's activities and fair value determinations. The Board monitors the appropriateness of the procedures used in valuing the Fund's investments and ratifies the fair value determinations of the Committee.
The Fund categorizes the inputs to valuation techniques used to value its investments into a disclosure hierarchy consisting of three levels as shown below:
- Level 1 – quoted prices in active markets for identical investments
- Level 2 – other significant observable inputs (including quoted prices for similar investments, interest rates, prepayment speeds, etc.)
- Level 3 – unobservable inputs (including the Fund's own assumptions based on the best information available)
Valuation techniques used to value the Fund's investments by major category are as follows:
Equity securities, including restricted securities, for which market quotations are readily available, are valued at the last reported sale price or official closing price as reported by a third party pricing vendor on the primary market or exchange on which they are traded and are categorized as Level 1 in the hierarchy. In the event there were no sales during the day or closing prices are not available, securities are valued at the last quoted bid price or may be valued using the last available price and are generally categorized as Level 2 in the hierarchy. For foreign equity securities, when market or security specific events arise, comparisons to the valuation of American Depositary Receipts (ADRs), futures contracts, Exchange-Traded Funds (ETFs) and certain indexes as well as quoted prices for similar securities may be used and would be categorized as Level 2 in the hierarchy. For equity securities, including restricted securities, where observable inputs are limited, assumptions about market activity and risk are used and these securities may be categorized as Level 3 in the hierarchy.
Investments in open-end mutual funds, including the Fidelity Central Funds, are valued at their closing net asset value (NAV) each business day and are categorized as Level 1 in the hierarchy.
Changes in valuation techniques may result in transfers in or out of an assigned level within the disclosure hierarchy.
Foreign Currency. The Fund may use foreign currency contracts to facilitate transactions in foreign-denominated securities. Gains and losses from these transactions may arise from changes in the value of the foreign currency or if the counterparties do not perform under the contracts' terms.
Foreign-denominated assets, including investment securities, and liabilities are translated into U.S. dollars at the exchange rates at period end. Purchases and sales of investment securities, income and dividends received and expenses denominated in foreign currencies are translated into U.S. dollars at the exchange rate in effect on the transaction date.
The effects of exchange rate fluctuations on investments are included with the net realized and unrealized gain (loss) on investment securities. Other foreign currency transactions resulting in realized and unrealized gain (loss) are disclosed separately.
Investment Transactions and Income. For financial reporting purposes, the Fund's investment holdings and NAV include trades executed through the end of the last business day of the period. The NAV per share for processing shareholder transactions is calculated as of the close of business of the New York Stock Exchange (NYSE), normally 4:00 p.m. Eastern time and includes trades executed through the end of the prior business day. Gains and losses on securities sold are determined on the basis of identified cost. Dividend income is recorded on the ex-dividend date, except for certain dividends from foreign securities where the ex-dividend date may have passed, which are recorded as soon as the Fund is informed of the ex-dividend date. Non-cash dividends included in dividend income, if any, are recorded at the fair market value of the securities received. Income and capital gain distributions from Fidelity Central Funds, if any, are recorded on the ex-dividend date. Certain distributions received by the Fund represent a return of capital or capital gain. The Fund determines the components of these distributions subsequent to the ex-dividend date, based upon receipt of tax filings or other correspondence relating to the underlying investment. These distributions are recorded as a reduction of cost of investments and/or as a realized gain. Investment income is recorded net of foreign taxes withheld where recovery of such taxes is uncertain.
Class Allocations and Expenses. Investment income, realized and unrealized capital gains and losses, common expenses of the Fund, and certain fund-level expense reductions, if any, are allocated daily on a pro-rata basis to each class based on the relative net assets of each class to the total net assets of the Fund. Each class differs with respect to transfer agent and distribution and service plan fees incurred. Certain expense reductions may also differ by class. For the reporting period, the allocated portion of income and expenses to each class as a percent of its average net assets may vary due to the timing of recording these transactions in relation to fluctuating net assets of the classes. Expenses directly attributable to a fund are charged to that fund. Expenses attributable to more than one fund are allocated among the respective funds on the basis of relative net assets or other appropriate methods. Expense estimates are accrued in the period to which they relate and adjustments are made when actual amounts are known.
Deferred Trustee Compensation. Under a Deferred Compensation Plan (the Plan) for the Fund, certain independent Trustees have elected to defer receipt of a portion of their annual compensation. Deferred amounts are invested in a cross-section of Fidelity funds, are marked-to-market and remain in the Fund until distributed in accordance with the Plan. The investment of deferred amounts and the offsetting payable to the Trustees of $54,586 are included in the accompanying Statement of Assets and Liabilities in other receivables and other payables and accrued expenses, respectively.
Income Tax Information and Distributions to Shareholders. Each year, the Fund intends to qualify as a regulated investment company under Subchapter M of the Internal Revenue Code, including distributing substantially all of its taxable income and realized gains. As a result, no provision for U.S. Federal income taxes is required. The Fund files a U.S. federal tax return, in addition to state and local tax returns as required. The Fund's federal income tax returns are subject to examination by the Internal Revenue Service (IRS) for a period of three fiscal years after they are filed. State and local tax returns may be subject to examination for an additional fiscal year depending on the jurisdiction. Foreign taxes are provided for based on the Fund's understanding of the tax rules and rates that exist in the foreign markets in which it invests.
Distributions are declared and recorded on the ex-dividend date. Income and capital gain distributions are declared separately for each class. Income and capital gain distributions are determined in accordance with income tax regulations, which may differ from GAAP.
Capital accounts within the financial statements are adjusted for permanent book-tax differences. These adjustments have no impact on net assets or the results of operations. Capital accounts are not adjusted for temporary book-tax differences which will reverse in a subsequent period.
Book-tax differences are primarily due to deferred trustees compensation and losses deferred due to wash sales.
As of period end, the cost and unrealized appreciation (depreciation) in securities, and derivatives if applicable, for federal income tax purposes were as follows:
| Gross unrealized appreciation | $156,586,172 |
| Gross unrealized depreciation | (16,261,821) |
| Net unrealized appreciation (depreciation) | $140,324,351 |
| Tax cost | $415,869,478 |
New Rule Issuance. During August 2018, the U.S. Securities and Exchange Commission issued Final Rule Release No. 33-10532, Disclosure Update and Simplification. This Final Rule includes amendments specific to registered investment companies that are intended to eliminate overlap in disclosure requirements between Regulation S-X and GAAP. In accordance with these amendments, certain line-items in the Fund's financial statements have been combined or removed for the current period as outlined in the table below.
| Financial Statement | Current Line-Item Presentation (As Applicable) | Prior Line-Item Presentation (As Applicable) |
| Statement of Assets and Liabilities | Total distributable earnings (loss) | Undistributed/Distributions in excess of/Accumulated net investment income (loss)
Accumulated/Undistributed net realized gain (loss)
Net unrealized appreciation (depreciation) |
| Statement of Changes in Net Assets | N/A - removed | Undistributed/Distributions in excess of/Accumulated net investment income (loss) end of period |
| Statement of Changes in Net Assets | Distributions to shareholders | Distributions to shareholders from net investment income
Distributions to shareholders from net realized gain |
| Distributions to Shareholders Note to Financial Statements | Distributions to shareholders | Distributions to shareholders from net investment income
Distributions to shareholders from net realized gain |
4. Purchases and Sales of Investments.
Purchases and sales of securities, other than short-term securities, aggregated $143,669,295 and $203,218,239, respectively.
5. Fees and Other Transactions with Affiliates.
Management Fee. Fidelity SelectCo, LLC (the investment adviser) and its affiliates provide the Fund with investment management related services for which the Fund pays a monthly management fee. The management fee is the sum of an individual fund fee rate that is based on an annual rate of .30% of the Fund's average net assets and an annualized group fee rate that averaged .24% during the period. The group fee rate is based upon the average net assets of all the mutual funds advised by Fidelity Management & Research Company (FMR) and the investment adviser. The group fee rate decreases as assets under management increase and increases as assets under management decrease. For the reporting period, the total annualized management fee rate was .54% of the Fund's average net assets.
Distribution and Service Plan Fees. In accordance with Rule 12b-1 of the 1940 Act, the Fund has adopted separate Distribution and Service Plans for each class of shares. Certain classes pay Fidelity Distributors Corporation (FDC), an affiliate of the investment adviser, separate Distribution and Service Fees, each of which is based on an annual percentage of each class' average net assets. In addition, FDC may pay financial intermediaries for selling shares of the Fund and providing shareholder support services. For the period, the Distribution and Service Fee rates, total fees and amounts retained by FDC were as follows:
| | Distribution Fee | Service Fee | Total Fees | Retained by FDC |
| Class A | -% | .25% | $186,543 | $1,886 |
| Class M | .25% | .25% | 308,096 | – |
| Class C | .75% | .25% | 200,375 | 7,878 |
| | | | $695,014 | $9,764 |
Sales Load. FDC may receive a front-end sales charge of up to 5.75% for selling Class A shares and 3.50% for selling Class M shares, some of which is paid to financial intermediaries for selling shares of the Fund. Depending on the holding period, FDC may receive contingent deferred sales charges levied on Class A, Class M and Class C redemptions. The deferred sales charges are 1.00% for Class C shares, 1.00% for certain purchases of Class A shares and .25% for certain purchases of Class M shares.
For the period, sales charge amounts retained by FDC were as follows:
| | Retained by FDC |
| Class A | $10,493 |
| Class M | 1,965 |
| Class C(a) | 546 |
| | $13,004 |
(a) When Class C shares are initially sold, FDC pays commissions from its own resources to financial intermediaries through which the sales are made.
Transfer Agent Fees. Fidelity Investments Institutional Operations Company, Inc., (FIIOC), an affiliate of the investment adviser, is the transfer, dividend disbursing and shareholder servicing agent for each class of the Fund. FIIOC receives account fees and asset-based fees that vary according to the account size and type of account of the shareholders of the respective classes of the Fund, except Class Z. FIIOC receives an asset-based fee of Class Z's average net assets. FIIOC pays for typesetting, printing and mailing of shareholder reports, except proxy statements.
For the period, transfer agent fees for each class were as follows:
| | Amount | % of Class-Level Average Net Assets(a) |
| Class A | $184,554 | .25 |
| Class M | 134,446 | .22 |
| Class C | 55,996 | .28 |
| Class I | 275,132 | .21 |
| Class Z | 321 | .05 |
| | $650,449 | |
(a) Annualized
Accounting and Security Lending Fees. Fidelity Service Company, Inc. (FSC), an affiliate of the investment adviser, maintains the Fund's accounting records. The accounting fee is based on the level of average net assets for each month. Under a separate contract, FSC administers the security lending program. The security lending fee is based on the number and duration of lending transactions. For the period, the fees were equivalent to an annualized rate of .04%.
Brokerage Commissions. The Fund placed a portion of its portfolio transactions with brokerage firms which are affiliates of the investment adviser. Brokerage commissions are included in net realized gain (loss) and change in net unrealized appreciation (depreciation) in the Statement of Operations. The commissions paid to these affiliated firms were $2,023 for the period.
Interfund Trades. The Fund may purchase from or sell securities to other Fidelity Funds under procedures adopted by the Board. The procedures have been designed to ensure these interfund trades are executed in accordance with Rule 17a-7 of the 1940 Act. Interfund trades are included within the respective purchases and sales amounts shown in the Purchases and Sales of Investments note.
6. Committed Line of Credit.
The Fund participates with other funds managed by the investment adviser or an affiliate in a $4.25 billion credit facility (the "line of credit") to be utilized for temporary or emergency purposes to fund shareholder redemptions or for other short-term liquidity purposes. The Fund has agreed to pay commitment fees on its pro-rata portion of the line of credit, which amounted to $785 and is reflected in Miscellaneous expenses on the Statement of Operations. During the period, the Fund did not borrow on this line of credit.
7. Security Lending.
The Fund lends portfolio securities through a lending agent from time to time in order to earn additional income. On the settlement date of the loan, the Fund receives collateral (in the form of U.S. Treasury obligations, letters of credit and/or cash) against the loaned securities and maintains collateral in an amount not less than 100% of the market value of the loaned securities during the period of the loan. The market value of the loaned securities is determined at the close of business of the Fund and any additional required collateral is delivered to the Fund on the next business day. The Fund or borrower may terminate the loan at any time, and if the borrower defaults on its obligation to return the securities loaned because of insolvency or other reasons, the Fund may apply collateral received from the borrower against the obligation. The Fund may experience delays and costs in recovering the securities loaned. Any cash collateral received is invested in the Fidelity Securities Lending Cash Central Fund. The value of loaned securities and cash collateral at period end are disclosed on the Fund's Statement of Assets and Liabilities. Security lending income represents the income earned on investing cash collateral, less rebates paid to borrowers and any lending agent fees associated with the loan, plus any premium payments received for lending certain types of securities. Security lending income is presented in the Statement of Operations as a component of from Fidelity Central Funds. Total security lending income during the period amounted to $692.
8. Expense Reductions.
Commissions paid to certain brokers with whom the investment adviser, or its affiliates, places trades on behalf of the Fund include an amount in addition to trade execution, which may be rebated back to the Fund to offset certain expenses. This amount totaled $9,109 for the period. Through arrangements with the Fund's custodian, credits realized as a result of certain uninvested cash balances were used to reduce the Fund's expenses. During the period, these credits reduced the Fund's custody expenses by $92.
In addition, during the period the investment adviser reimbursed and/or waived a portion of fund-level operating expenses in the amount of $2,162.
9. Distributions to Shareholders.
Distributions to shareholders of each class were as follows:
| | Six months ended
January 31, 2019(a) | Year ended
July 31, 2018 |
| Distributions to shareholders | | |
| Class A | $7,470,165 | $– |
| Class M | 6,325,539 | – |
| Class C | 1,940,812 | – |
| Class I | 13,059,576 | – |
| Class Z | 169,846 | – |
| Total | $28,965,938 | $– |
| From net investment income | | |
| Class A | $– | $3,331,946 |
| Class M | – | 1,886,568 |
| Class C | – | 517,055 |
| Class I | – | 7,017,320 |
| Total | $– | $12,752,889 |
| From net realized gain | | |
| Class A | $– | $10,241,885 |
| Class M | – | 6,686,045 |
| Class C | – | 2,729,897 |
| Class I | – | 18,285,453 |
| Total | $– | $37,943,280 |
(a) Distributions for Class Z are for the period October 2, 2018 (commencement of sale of shares) to January 31, 2019.
10. Share Transactions.
Share transactions for each class were as follows and may contain automatic conversions between classes or exchanges between affiliated funds:
| | Shares | Shares | Dollars | Dollars |
| | Six months ended January 31, 2019(a) | Year ended July 31, 2018 | Six months ended January 31, 2019(a) | Year ended July 31, 2018 |
| Class A | | | | |
| Shares sold | 519,909 | 1,262,391 | $10,873,302 | $27,206,084 |
| Reinvestment of distributions | 353,947 | 589,388 | 7,374,289 | 13,010,989 |
| Shares redeemed | (1,360,237) | (5,396,386) | (29,125,030) | (116,593,147) |
| Net increase (decrease) | (486,381) | (3,544,607) | $(10,877,439) | $(76,376,074) |
| Class M | | | | |
| Shares sold | 530,805 | 571,538 | $11,350,489 | $12,280,331 |
| Reinvestment of distributions | 299,665 | 382,137 | 6,229,225 | 8,433,594 |
| Shares redeemed | (619,968) | (1,874,375) | (13,265,192) | (40,727,468) |
| Net increase (decrease) | 210,502 | (920,700) | $4,314,522 | $(20,013,543) |
| Class C | | | | |
| Shares sold | 62,829 | 121,070 | $1,313,243 | $2,559,474 |
| Reinvestment of distributions | 93,252 | 144,584 | 1,889,253 | 3,123,837 |
| Shares redeemed | (327,155) | (1,022,590) | (6,833,974) | (21,460,230) |
| Net increase (decrease) | (171,074) | (756,936) | $(3,631,478) | $(15,776,919) |
| Class I | | | | |
| Shares sold | 1,182,569 | 3,744,282 | $25,127,727 | $80,976,845 |
| Reinvestment of distributions | 611,560 | 1,104,959 | 12,876,774 | 24,571,000 |
| Shares redeemed | (3,470,087) | (9,312,160) | (74,768,303) | (201,298,815) |
| Net increase (decrease) | (1,675,958) | (4,462,919) | $(36,763,802) | $(95,750,970) |
| Class Z | | | | |
| Shares sold | 199,247 | – | $4,400,425 | $– |
| Reinvestment of distributions | 7,734 | – | 161,245 | – |
| Shares redeemed | (12,564) | – | (261,252) | – |
| Net increase (decrease) | 194,417 | – | $4,300,418 | $– |
(a) Share transactions for Class Z are for the period October 2, 2018 (commencement of sale of shares) to January 31, 2019
11. Other.
The Fund's organizational documents provide former and current trustees and officers with a limited indemnification against liabilities arising in connection with the performance of their duties to the Fund. In the normal course of business, the Fund may also enter into contracts that provide general indemnifications. The Fund's maximum exposure under these arrangements is unknown as this would be dependent on future claims that may be made against the Fund. The risk of material loss from such claims is considered remote.
Shareholder Expense Example
As a shareholder of the Fund, you incur two types of costs: (1) transaction costs, including sales charges (loads) on purchase payments or redemption proceeds, and (2) ongoing costs, including management fees, distribution and/or service (12b-1) fees and other Fund expenses. This Example is intended to help you understand your ongoing costs (in dollars) of investing in the Fund and to compare these costs with the ongoing costs of investing in other mutual funds.
The actual expense Example is based on an investment of $1,000 invested at the beginning of the period and held for the entire period (August 1, 2018 to January 31, 2019) for Class A, Class M, Class C and Class I and for the period (October 2, 2018 to January 31, 2019) for Class Z. The hypothetical expense Example is based on an investment of $1,000 invested for the one-half year period (August 1, 2018 to January 31, 2019).
Actual Expenses
The first line of the accompanying table for each class of the Fund provides information about actual account values and actual expenses. You may use the information in this line, together with the amount you invested, to estimate the expenses that you paid over the period. Simply divide your account value by $1,000.00 (for example, an $8,600 account value divided by $1,000.00 = 8.6), then multiply the result by the number in the first line for a class of the Fund under the heading entitled "Expenses Paid During Period" to estimate the expenses you paid on your account during this period. In addition, the Fund, as a shareholder in the underlying Fidelity Central Funds, will indirectly bear its pro-rata share of the fees and expenses incurred by the underlying Fidelity Central Funds. These fees and expenses are not included in the Fund's annualized expense ratio used to calculate the expense estimate in the table below.
Hypothetical Example for Comparison Purposes
The second line of the accompanying table for each class of the Fund provides information about hypothetical account values and hypothetical expenses based on a Class' actual expense ratio and an assumed rate of return of 5% per year before expenses, which is not the Class' actual return. The hypothetical account values and expenses may not be used to estimate the actual ending account balance or expenses you paid for the period. You may use this information to compare the ongoing costs of investing in the Fund and other funds. To do so, compare this 5% hypothetical example with the 5% hypothetical examples that appear in the shareholder reports of the other funds. In addition, the Fund, as a shareholder in the underlying Fidelity Central Funds, will indirectly bear its pro-rata share of the fees and expenses incurred by the underlying Fidelity Central Funds. These fees and expenses are not included in the Fund's annualized expense ratio used to calculate the expense estimate in the table below.
Please note that the expenses shown in the table are meant to highlight your ongoing costs only and do not reflect any transaction costs. Therefore, the second line of the table is useful in comparing ongoing costs only, and will not help you determine the relative total costs of owning different funds. In addition, if these transactional costs were included, your costs would have been higher.
| | Annualized Expense Ratio-A | Beginning
Account Value
| Ending
Account Value
January 31, 2019 | Expenses Paid
During Period-
|
| Class A | 1.09% | | | |
| Actual | | $1,000.00 | $1,026.30 | $5.57-B |
| Hypothetical-C | | $1,000.00 | $1,019.71 | $5.55-D |
| Class M | 1.32% | | | |
| Actual | | $1,000.00 | $1,024.90 | $6.74-B |
| Hypothetical-C | | $1,000.00 | $1,018.55 | $6.72-D |
| Class C | 1.88% | | | |
| Actual | | $1,000.00 | $1,022.20 | $9.58-B |
| Hypothetical-C | | $1,000.00 | $1,015.73 | $9.55-D |
| Class I | .81% | | | |
| Actual | | $1,000.00 | $1,027.70 | $4.14-B |
| Hypothetical-C | | $1,000.00 | $1,021.12 | $4.13-D |
| Class Z | .65% | | | |
| Actual | | $1,000.00 | $1,038.70 | $2.21-B |
| Hypothetical-C | | $1,000.00 | $1,021.93 | $3.31-D |
A Annualized expense ratio reflects expenses net of applicable fee waivers.
B Actual expenses are equal to each Class' annualized expense ratio, multiplied by the average account value over the period, multiplied by 184/365 (to reflect the one-half year period) for Class A, Class M, Class C and Class I and multiplied by 122/365 (to reflect the period October 2, 2018 to January 31, 2019) for Class Z.
C 5% return per year before expenses
D Hypothetical expenses are equal to each Class' annualized expense ratio, multiplied by the average account value over the period, multiplied by 184/365 (to reflect the one-half year period).
Board Approval of Investment Advisory Contracts and Management Fees
Fidelity Advisor Real Estate Fund
Each year, the Board of Trustees, including the Independent Trustees (together, the Board), votes on the renewal of the management contract with Fidelity SelectCo, LLC (SelectCo), an affiliate of Fidelity Management & Research Company (FMR), and the sub-advisory agreements with affiliates of FMR (together, the Advisory Contracts) for the fund. SelectCo and the sub-advisers are referred to herein as the Investment Advisers. The Board, assisted by the advice of fund counsel and Independent Trustees' counsel, requests and considers a broad range of information relevant to the renewal of the Advisory Contracts throughout the year.
The Board meets regularly and, at each of its meetings, covers an extensive agenda of topics and materials and considers factors that are relevant to its annual consideration of the renewal of the fund's Advisory Contracts, including the services and support provided to the fund and its shareholders. The Board has established various standing committees (Committees), each composed of and chaired by Independent Trustees with varying backgrounds, to which the Board has assigned specific subject matter responsibilities in order to enhance effective decision-making by the Board. The Board, acting directly and through its Committees, requests and receives information concerning the annual consideration of the renewal of the fund's Advisory Contracts. The Board also meets as needed to review matters specifically related to the Board's annual consideration of the renewal of the Advisory Contracts. Members of the Board may also meet with trustees of other Fidelity funds through joint ad hoc committees to discuss certain matters relevant to all of the Fidelity funds.
At its January 2019 meeting, the Board unanimously determined to renew the fund's Advisory Contracts. In reaching its determination, the Board considered all factors it believed relevant, including (i) the nature, extent, and quality of the services to be provided to the fund and its shareholders (including the investment performance of the fund); (ii) the competitiveness of the fund's management fee and total expense ratio relative to peer funds; (iii) the total costs of the services to be provided by and the profits to be realized by Fidelity from its relationships with the fund; and (iv) the extent to which, if any, economies of scale exist and would be realized as the fund grows, and whether any economies of scale are appropriately shared with fund shareholders.
In considering whether to renew the Advisory Contracts for the fund, the Board reached a determination, with the assistance of fund counsel and Independent Trustees' counsel and through the exercise of its business judgment, that the renewal of the Advisory Contracts was in the best interests of the fund and its shareholders and that the compensation payable under the Advisory Contracts was fair and reasonable. The Board's decision to renew the Advisory Contracts was not based on any single factor, but rather was based on a comprehensive consideration of all the information provided to the Board at its meetings throughout the year. The Board, in reaching its determination to renew the Advisory Contracts, was aware that shareholders of the fund have a broad range of investment choices available to them, including a wide choice among funds offered by Fidelity's competitors, and that the fund's shareholders, who have the opportunity to review and weigh the disclosure provided by the fund in its prospectus and other public disclosures, have chosen to invest in this fund, which is part of the Fidelity family of funds.
Nature, Extent, and Quality of Services Provided. The Board considered Fidelity's staffing as it relates to the fund, including the backgrounds of investment personnel of Fidelity, and also considered the fund's investment objective, strategies, and related investment philosophy. The Independent Trustees also had discussions with senior management of Fidelity's investment operations and investment groups. The Board considered the structure of the investment personnel compensation program and whether this structure provides appropriate incentives to act in the best interests of the fund. Additionally, the Board considered the portfolio managers' investments, if any, in the funds that they manage.
Resources Dedicated to Investment Management and Support Services. The Board and the Fund Oversight and Research Committees reviewed the general qualifications and capabilities of Fidelity's investment staff, including its size, education, experience, and resources, as well as Fidelity's approach to recruiting, training, managing, and compensating investment personnel. The Board noted that Fidelity has continued to increase the resources devoted to non-U.S. offices, including expansion of Fidelity's global investment organization. The Board also noted that Fidelity's analysts have extensive resources, tools and capabilities that allow them to conduct sophisticated quantitative and fundamental analysis, as well as credit analysis of issuers, counterparties and guarantors. Further, the Board considered that Fidelity's investment professionals have sufficient access to global information and data so as to provide competitive investment results over time, and that those professionals also have access to sophisticated tools that permit them to assess portfolio construction and risk and performance attribution characteristics continuously, as well as to transmit new information and research conclusions rapidly around the world. Additionally, in its deliberations, the Board considered Fidelity's trading, risk management, compliance, and technology and operations capabilities and resources, which are integral parts of the investment management process.
Shareholder and Administrative Services. The Board considered (i) the nature, extent, quality, and cost of advisory, administrative, and shareholder services performed by the Investment Advisers and their affiliates under the Advisory Contracts and under separate agreements covering transfer agency, pricing and bookkeeping, and securities lending services for the fund; (ii) the nature and extent of the supervision of third party service providers, principally custodians, subcustodians, and pricing vendors; and (iii) the resources devoted to, and the record of compliance with, the fund's compliance policies and procedures. The Board also reviewed the allocation of fund brokerage, including allocations to brokers affiliated with the Investment Advisers, the use of brokerage commissions to pay fund expenses, and the use of "soft" commission dollars to pay for research services.
The Board noted that the growth of fund assets over time across the complex allows Fidelity to reinvest in the development of services designed to enhance the value and convenience of the Fidelity funds as investment vehicles. These services include 24-hour access to account information and market information through telephone representatives and over the Internet, investor education materials and asset allocation tools, and the expanded availability of Fidelity Investor Centers.
The Board noted that it and the boards of certain other Fidelity funds had formed an ad hoc Committee on Transfer Agency Fees to review the variety of transfer agency fee structures throughout the industry and Fidelity's competitive positioning with respect to industry participants.
Investment in a Large Fund Family. The Board considered the benefits to shareholders of investing in a Fidelity fund, including the benefits of investing in a fund that is part of a large family of funds offering a variety of investment disciplines and providing a large variety of mutual fund investor services. The Board noted that Fidelity had taken, or had made recommendations that resulted in the Fidelity funds taking, a number of actions over the previous year that benefited particular funds, including: (i) continuing to dedicate additional resources to Fidelity's investment research process, which includes meetings with management of issuers of securities in which the funds invest, and to the support of the senior management team that oversees asset management; (ii) continuing efforts to enhance Fidelity's global research capabilities; (iii) launching new funds and making other enhancements to meet client needs; (iv) launching new share classes of existing funds; (v) eliminating purchase minimums and broadening eligibility requirements for certain funds and share classes; (vi) reducing management fees and total expenses for certain growth equity funds and index funds; (vii) lowering expense caps for certain existing funds and classes, and converting certain voluntary expense caps to contractual caps, to reduce expenses borne by shareholders; (viii) eliminating short-term redemption fees for funds that had such fees; (ix) rationalizing product lines and gaining increased efficiencies from fund mergers and share class consolidations; (x) continuing to develop, acquire and implement systems and technology to improve services to the funds and shareholders, strengthen information security, and increase efficiency; and (xi) continuing to implement enhancements to further strengthen Fidelity's product line to increase investors' probability of success in achieving their investment goals, including retirement income goals.
Investment Performance. The Board considered whether the fund has operated in accordance with its investment objective, as well as its record of compliance with its investment restrictions and its performance history.
The Board took into account discussions that occur at Board meetings throughout the year with representatives of the Investment Advisers about fund investment performance. In this regard the Board noted that as part of regularly scheduled fund reviews and other reports to the Board on fund performance, the Board considers annualized return information for the fund for different time periods, measured against an appropriate securities market index ("benchmark index"). In its evaluation of fund investment performance, the Board gave particular attention to information indicating changes in performance of certain Fidelity funds for specific time periods and discussed with the Investment Advisers the reasons for any overperformance or underperformance.
In addition to reviewing absolute and relative fund performance, the Independent Trustees periodically consider the appropriateness of fund performance metrics in evaluating the results achieved. In general, the Independent Trustees believe that fund performance should be evaluated based on net performance (after fees and expenses) of both the highest performing and lowest performing fund share classes, where applicable, compared to appropriate benchmark indices, over appropriate time periods that may include full market cycles, taking into account relevant factors including the following: general market conditions; issuer-specific information; and fund cash flows and other factors.
The Independent Trustees recognize that shareholders evaluate performance on a net basis over their own holding periods, for which one-, three-, and five-year periods are often used as a proxy. For this reason, the performance information reviewed by the Board also included net cumulative total return information for the fund and an appropriate benchmark index for the most recent one-, three-, and five-year periods ended June 30, 2018, as shown below.
Fidelity Advisor Real Estate Fund
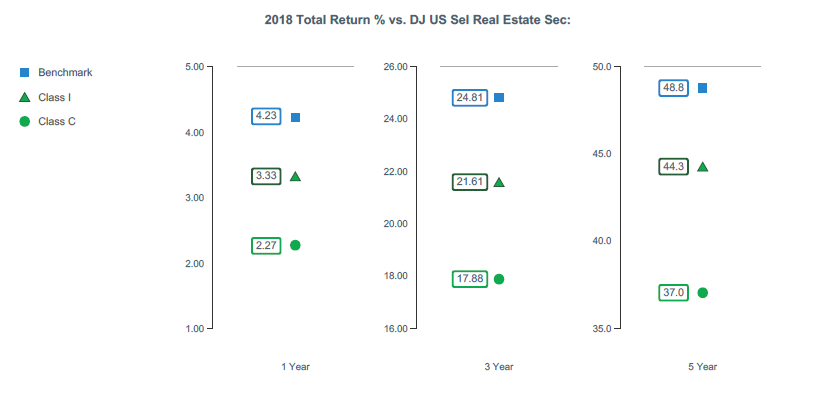
The Board considered the fund's underperformance for different time periods based on the June 30, 2018 data presented above and based on earlier periods ended prior to June 30, 2018. The Board noted that the fund's underperformance has continued since the Board approved the management contract in 2017 and 2018. The Board's discussions with SelectCo regarding underperformance cover topics including, but not limited to: the longer-term track record of a fund's portfolio manager(s); broader trends in the market that may adversely impact a fund's performance; attribution reports on contributors to the fund's underperformance; and the applicable portfolio manager's explanation of his or her underperformance. The Board engages with SelectCo on steps that might be taken to address a fund's underperformance. For a fund with underperformance over longer periods of time, the Board typically monitors the effect of any remedial actions and other relevant factors.
Based on its review, the Board concluded that the nature, extent, and quality of services provided to the fund under the Advisory Contracts should continue to benefit the shareholders of the fund.
Competitiveness of Management Fee and Total Expense Ratio. The Board considered the fund's management fee and total expense ratio compared to "mapped groups" of competitive funds and classes created for the purpose of facilitating the Trustees' competitive analysis of management fees and total expenses. Fidelity creates "mapped groups" by combining similar Lipper investment objective categories that have comparable investment mandates. For this purpose, all sector focused equity funds are grouped in the same mapped group. Combining Lipper investment objective categories aids the Board's management fee and total expense ratio comparisons by broadening the competitive group used for comparison.
Management Fee. The Board considered two proprietary management fee comparisons for the 12-month periods ended June 30 shown in basis points (BP) in the chart below. The group of Lipper funds used by the Board for management fee comparisons is referred to below as the "Total Mapped Group." The Total Mapped Group comparison focuses on a fund's standing in terms of gross management fees before expense reimbursements or caps relative to the total universe of funds with comparable investment mandates (i.e., sector equities), regardless of whether their management fee structures also are comparable. Funds with comparable management fee structures have similar management fee contractual arrangements (
e.g., flat rate charged for advisory services, all-inclusive fee rate,
etc.). "TMG %" represents the percentage of funds in the Total Mapped Group that had management fees that were lower than the fund's. For example, a hypothetical TMG % of 20% would mean that 80% of the funds in the Total Mapped Group had higher, and 20% had lower, management fees than the fund. The fund's actual TMG %s and the number of funds in the Total Mapped Group are in the chart below. The "Asset-Size Peer Group" (ASPG) comparison focuses on a fund's standing relative to a subset of non-Fidelity funds within the Total Mapped Group that are similar in size and management fee structure. For example, if a fund is in the first quartile of the ASPG, the fund's management fee ranks in the least expensive or lowest 25% of funds in the ASPG. The ASPG represents at least 15% of the funds in the Total Mapped Group with comparable asset size and management fee structures, subject to a minimum of 50 funds (or all funds in the Total Mapped Group if fewer than 50). Additional information, such as the ASPG quartile in which the fund's management fee rate ranked, is also included in the chart and was considered by the Board.
Fidelity Advisor Real Estate Fund
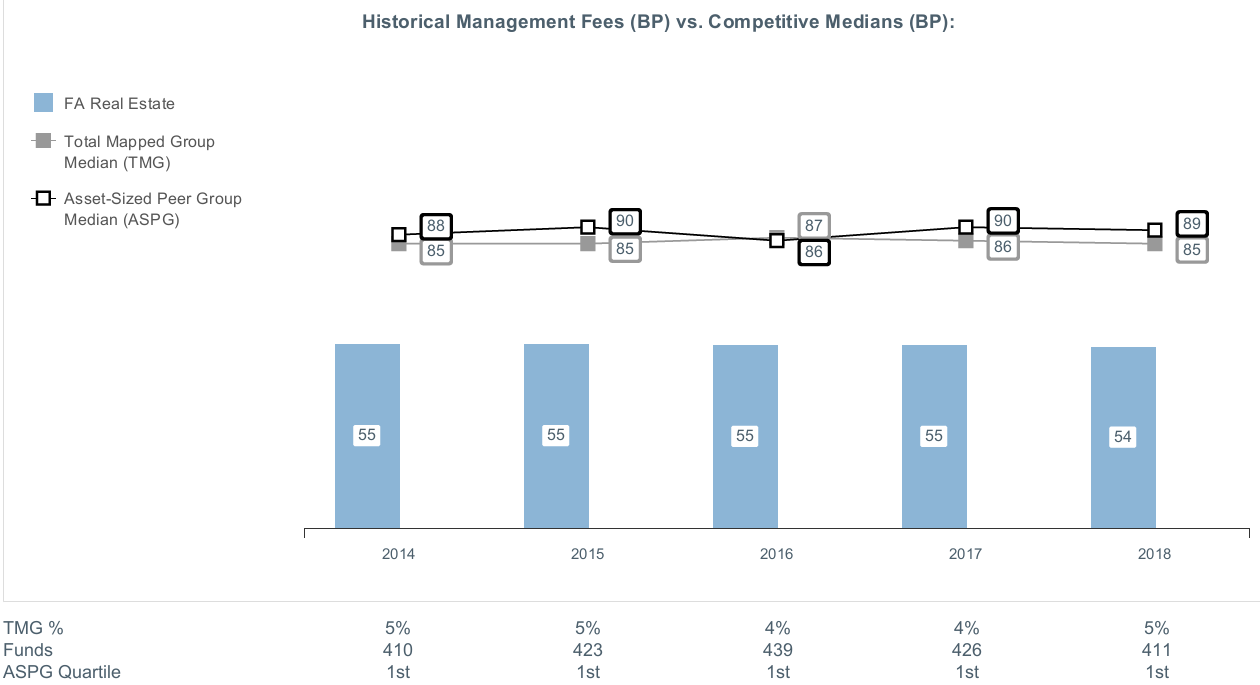
The Board noted that the fund's management fee rate ranked below the median of its Total Mapped Group and below the median of its ASPG for the 12-month period ended June 30, 2018.
The Board noted that it and the boards of other Fidelity funds formed an ad hoc Committee on Group Fee, which meets periodically, to conduct an in-depth review of the "group fee" component of the management fee of funds with such management fee structures. The Committee's focus included the mechanics of the group fee, the competitive landscape of group fee structures, Fidelity funds with no group fee component and investment products not included in group fee assets. The Board also considered that, for funds subject to the group fee, FMR agreed to voluntarily waive fees over a specified period of time in amounts designed to account for assets converted from certain funds to certain collective investment trusts.
Based on its review, the Board concluded that the fund's management fee is fair and reasonable in light of the services that the fund receives and the other factors considered.
Total Expense Ratio. In its review of each class's total expense ratio, the Board considered the fund's management fee rate as well as other fund or class expenses, as applicable, such as transfer agent fees, pricing and bookkeeping fees, fund-paid 12b-1 fees, and custodial, legal, and audit fees. The Board also noted that Fidelity may agree to waive fees and expenses from time to time, and the extent to which, if any, it has done so for the fund. As part of its review, the Board also considered the current and historical total expense ratios of each class of the fund compared to competitive fund median expenses. Each class of the fund is compared to those funds and classes in the Total Mapped Group (used by the Board for management fee comparisons) that have a similar sales load structure.
The Board noted that the total expense ratio of each class ranked below the competitive median for the 12-month period ended June 30, 2018.
Fees Charged to Other Fidelity Clients. The Board also considered Fidelity fee structures and other information with respect to clients of Fidelity, such as other funds advised or subadvised by Fidelity, pension plan clients, and other institutional clients with similar mandates. The Board noted that a joint ad hoc committee created by it and the boards of other Fidelity funds periodically reviews and compares Fidelity's institutional investment advisory business with its business of providing services to the Fidelity funds and also noted the most recent findings of the committee. The Board noted that the committee's review included a consideration of the differences in services provided, fees charged, and costs incurred, as well as competition in the markets serving the different categories of clients.
Based on its review of total expense ratios and fees charged to other Fidelity clients, the Board concluded that the total expense ratio of each class of the fund was reasonable in light of the services that the fund and its shareholders receive and the other factors considered.
Costs of the Services and Profitability. The Board considered the revenues earned and the expenses incurred by Fidelity in conducting the business of developing, marketing, distributing, managing, administering and servicing the fund and servicing the fund's shareholders. The Board also considered the level of Fidelity's profits in respect of all the Fidelity funds.
On an annual basis, Fidelity presents to the Board information about the profitability of its relationships with the fund. Fidelity calculates profitability information for each fund, as well as aggregate profitability information for groups of Fidelity funds and all Fidelity funds, using a series of detailed revenue and cost allocation methodologies which originate with the books and records of Fidelity on which Fidelity's audited financial statements are based. The Audit Committee of the Board reviews any significant changes from the prior year's methodologies.
PricewaterhouseCoopers LLP (PwC), auditor to Fidelity and certain Fidelity funds, has been engaged annually by the Board as part of the Board's assessment of Fidelity's profitability analysis. PwC's engagement includes the review and assessment of the methodologies used by Fidelity in determining the revenues and expenses attributable to Fidelity's mutual fund business, and completion of agreed-upon procedures in respect of the mathematical accuracy of the fund profitability information and its conformity to established allocation methodologies. After considering PwC's reports issued under the engagement and information provided by Fidelity, the Board concluded that while other allocation methods may also be reasonable, Fidelity's profitability methodologies are reasonable in all material respects.
The Board also reviewed Fidelity's non-fund businesses and potential indirect benefits such businesses may have received as a result of their association with Fidelity's mutual fund business (i.e., fall-out benefits) as well as cases where Fidelity's affiliates may benefit from the fund's business. The Board noted that changes to fall-out benefits year-over-year reflect business developments at Fidelity's various businesses.
The Board considered the costs of the services provided by and the profits realized by Fidelity in connection with the operation of the fund and was satisfied that the profitability was not excessive.
Economies of Scale. The Board considered whether there have been economies of scale in respect of the management of the Fidelity funds, whether the Fidelity funds (including the fund) have appropriately benefited from any such economies of scale, and whether there is potential for realization of any further economies of scale. The Board considered the extent to which the fund will benefit from economies of scale as assets grow through increased services to the fund, through waivers or reimbursements, or through fee or expense ratio reductions. The Board also noted that a committee (the Economies of Scale Committee) created by it and the boards of other Fidelity funds periodically analyzes whether Fidelity attains economies of scale in respect of the management and servicing of the Fidelity funds, whether the Fidelity funds have appropriately benefited from such economies of scale, and whether there is potential for realization of any further economies of scale.
The Board recognized that the fund's management contract incorporates a "group fee" structure, which provides for lower group fee rates as total group assets increase, and for higher group fee rates as total group assets decrease (with "group assets" defined to include fund assets under SelectCo's management plus assets under FMR's management). SelectCo calculates the group fee rates based on a tiered asset "breakpoint" schedule that varies based on asset class. The Board considered that the group fee is designed to deliver the benefits of economies of scale to fund shareholders when total group assets increase, even if assets of any particular fund are unchanged or have declined, because some portion of Fidelity's costs are attributable to services provided to all Fidelity funds, and all funds benefit if those costs can be allocated among more assets. The Board concluded that, given the group fee structure, fund shareholders will benefit from lower management fees as group assets increase at the fund complex level, regardless of whether Fidelity achieves any such economies of scale.
The Board concluded, taking into account the analysis of the Economies of Scale Committee, that economies of scale, if any, are being appropriately shared between fund shareholders and Fidelity.
Additional Information Requested by the Board. In order to develop fully the factual basis for consideration of the Fidelity funds' advisory contracts, the Board requested and received additional information on certain topics, including: (i) fund performance trends, in particular the underperformance of certain funds, and Fidelity's long-term strategies for certain funds; (ii) Fidelity's fund profitability methodology, profitability trends for certain funds, and the impact of certain factors on fund profitability results; (iii) metrics for evaluating index fund and ETF performance and information about ETF trading characteristics; (iv) the methodology with respect to the evaluation of competitive fund data and peer group classifications and fee comparisons; (v) the expense structures for different funds and classes; (vi) information regarding other accounts managed by Fidelity, including collective investment trusts; and (vii) Fidelity's philosophies and strategies for evaluating funds and classes with lower or declining asset levels.
Based on its evaluation of all of the conclusions noted above, and after considering all factors it believed relevant, the Board concluded that the advisory fee arrangements are fair and reasonable, and that the fund's Advisory Contracts should be renewed.

ARE-SANN-0319
1.783109.117
Fidelity Advisor Focus Funds®
Fidelity Advisor® Biotechnology Fund
Fidelity Advisor® Communications Equipment Fund
Fidelity Advisor® Consumer Discretionary Fund
Fidelity Advisor® Energy Fund
Fidelity Advisor® Financial Services Fund
Fidelity Advisor® Health Care Fund
Fidelity Advisor® Industrials Fund
Fidelity Advisor® Semiconductors Fund
Fidelity Advisor® Technology Fund
Fidelity Advisor® Utilities Fund
Semi-Annual Report January 31, 2019 |
|
Beginning on January 1, 2021, as permitted by regulations adopted by the Securities and Exchange Commission, paper copies of a fund’s shareholder reports will no longer be sent by mail, unless you specifically request paper copies of the reports from the fund or from your financial intermediary, such as a financial advisor, broker-dealer or bank. Instead, the reports will be made available on a website, and you will be notified by mail each time a report is posted and provided with a website link to access the report.
If you already elected to receive shareholder reports electronically, you will not be affected by this change and you need not take any action. You may elect to receive shareholder reports and other communications from a fund electronically, by contacting your financial intermediary. For Fidelity customers, visit Fidelity's web site or call Fidelity using the contact information listed below.
You may elect to receive all future reports in paper free of charge. If you wish to continue receiving paper copies of your shareholder reports, you may contact your financial intermediary or, if you are a Fidelity customer, visit Fidelity’s website, or call Fidelity at the applicable toll-free number listed below. Your election to receive reports in paper will apply to all funds held with the fund complex/your financial intermediary.
| Account Type | Website | Phone Number |
| Brokerage, Mutual Fund, or Annuity Contracts: | fidelity.com/mailpreferences | 1-800-343-3548 |
| Employer Provided Retirement Accounts: | netbenefits.fidelity.com/preferences (choose 'no' under Required Disclosures to continue to print) | 1-800-343-0860 |
| Advisor Sold Accounts Serviced Through Your Financial Intermediary: | Contact Your Financial Intermediary | Your Financial Intermediary's phone number |
| Advisor Sold Accounts Serviced by Fidelity: | institutional.fidelity.com | 1-877-208-0098 |
Contents
To view a fund's proxy voting guidelines and proxy voting record for the 12-month period ended June 30, visit http://www.fidelity.com/proxyvotingresults or visit the Securities and Exchange Commission's (SEC) web site at http://www.sec.gov.
You may also call 1-877-208-0098 to request a free copy of the proxy voting guidelines.
Standard & Poor's, S&P and S&P 500 are registered service marks of The McGraw-Hill Companies, Inc. and have been licensed for use by Fidelity Distributors Corporation.
Other third-party marks appearing herein are the property of their respective owners.
All other marks appearing herein are registered or unregistered trademarks or service marks of FMR LLC or an affiliated company. © 2019 FMR LLC. All rights reserved.
This report and the financial statements contained herein are submitted for the general information of the shareholders of the Funds. This report is not authorized for distribution to prospective investors in the Funds unless preceded or accompanied by an effective prospectus.
A fund files its complete schedule of portfolio holdings with the SEC for the first and third quarters of each fiscal year on Form N-Q. Forms N-Q are available on the SEC’s web site at http://www.sec.gov. A fund's Forms N-Q may be reviewed and copied at the SEC’s Public Reference Room in Washington, DC. Information regarding the operation of the SEC's Public Reference Room may be obtained by calling 1-800-SEC-0330.
For a complete list of a fund's portfolio holdings, view the most recent holdings listing, semiannual report, or annual report on Fidelity's web site at http://www.fidelity.com, http://www.institutional.fidelity.com, or http://www.401k.com, as applicable.
NOT FDIC INSURED •MAY LOSE VALUE •NO BANK GUARANTEE
Neither the Funds nor Fidelity Distributors Corporation is a bank.
Fidelity Advisor® Biotechnology Fund
Investment Summary (Unaudited)
Top Ten Stocks as of January 31, 2019
| | % of fund's net assets |
| Amgen, Inc. | 11.9 |
| AbbVie, Inc. | 9.4 |
| Vertex Pharmaceuticals, Inc. | 9.1 |
| Alexion Pharmaceuticals, Inc. | 8.5 |
| Regeneron Pharmaceuticals, Inc. | 6.2 |
| Celgene Corp. | 4.7 |
| Gilead Sciences, Inc. | 4.5 |
| Neurocrine Biosciences, Inc. | 2.6 |
| Sarepta Therapeutics, Inc. | 2.5 |
| Bristol-Myers Squibb Co. | 2.1 |
| | 61.5 |
Top Industries (% of fund's net assets)
| As of January 31, 2019 |
| | Biotechnology | 91.5% |
| | Pharmaceuticals | 6.7% |
| | Life Sciences Tools & Services | 0.4% |
| | Health Care Providers & Services | 0.3% |
| | Health Care Technology | 0.2% |
| | All Others* | 0.9% |

* Includes short-term investments and net other assets (liabilities).
Fidelity Advisor® Biotechnology Fund
Schedule of Investments January 31, 2019 (Unaudited)
Showing Percentage of Net Assets
| Common Stocks - 98.7% | | | |
| | | Shares | Value |
| Biotechnology - 91.3% | | | |
| Biotechnology - 91.3% | | | |
| AbbVie, Inc. | | 2,874,976 | $230,831,823 |
| Abeona Therapeutics, Inc. (a)(b) | | 955,708 | 6,489,257 |
| ACADIA Pharmaceuticals, Inc. (a)(b) | | 838,226 | 19,094,788 |
| Acceleron Pharma, Inc. (a) | | 143,307 | 6,076,217 |
| Acorda Therapeutics, Inc. (a) | | 807,853 | 13,434,595 |
| Agios Pharmaceuticals, Inc. (a)(b) | | 552,443 | 29,610,945 |
| Alexion Pharmaceuticals, Inc. (a) | | 1,713,314 | 210,669,089 |
| Alkermes PLC (a) | | 166,303 | 5,466,380 |
| Allakos, Inc. (a)(b) | | 219,665 | 8,775,617 |
| Allogene Therapeutics, Inc. (b) | | 254,607 | 7,722,230 |
| Alnylam Pharmaceuticals, Inc. (a) | | 336,210 | 28,083,621 |
| Amgen, Inc. | | 1,566,614 | 293,129,144 |
| Amicus Therapeutics, Inc. (a) | | 1,265,770 | 15,239,871 |
| AnaptysBio, Inc. (a) | | 168,966 | 11,205,825 |
| Argenx SE ADR (a) | | 345,100 | 36,618,561 |
| Array BioPharma, Inc. (a) | | 1,203,689 | 22,472,874 |
| Ascendis Pharma A/S sponsored ADR (a) | | 437,806 | 31,285,617 |
| Atara Biotherapeutics, Inc. (a) | | 692,124 | 26,300,712 |
| Audentes Therapeutics, Inc. (a) | | 334,000 | 8,283,200 |
| BeiGene Ltd. | | 109,800 | 1,087,794 |
| BeiGene Ltd. ADR (a) | | 45,500 | 5,891,340 |
| Biogen, Inc. (a) | | 104,611 | 34,917,060 |
| bluebird bio, Inc. (a) | | 166,166 | 22,171,529 |
| Blueprint Medicines Corp. (a) | | 531,661 | 38,327,441 |
| Celgene Corp. (a) | | 1,308,644 | 115,762,648 |
| Clovis Oncology, Inc. (a)(b) | | 107,025 | 2,714,154 |
| Crinetics Pharmaceuticals, Inc. (a)(b) | | 401,907 | 10,562,116 |
| Emergent BioSolutions, Inc. (a) | | 92,514 | 5,771,948 |
| Exact Sciences Corp. (a) | | 459,882 | 41,426,171 |
| Exelixis, Inc. (a) | | 265,747 | 6,263,657 |
| FibroGen, Inc. (a) | | 755,145 | 42,854,479 |
| Genomic Health, Inc. (a) | | 83,438 | 6,325,435 |
| Gilead Sciences, Inc. | | 1,600,617 | 112,059,196 |
| Global Blood Therapeutics, Inc. (a) | | 326,318 | 15,633,895 |
| Gritstone Oncology, Inc. (b) | | 390,600 | 4,999,680 |
| Halozyme Therapeutics, Inc. (a) | | 299,031 | 4,838,322 |
| Heron Therapeutics, Inc. (a) | | 552,631 | 14,865,774 |
| Immunomedics, Inc. (a)(b) | | 289,499 | 4,281,690 |
| Insmed, Inc. (a) | | 560,700 | 13,630,617 |
| Intercept Pharmaceuticals, Inc. (a) | | 177,404 | 21,409,115 |
| Ionis Pharmaceuticals, Inc. (a) | | 596,838 | 34,616,604 |
| Ironwood Pharmaceuticals, Inc. Class A (a) | | 294,575 | 4,023,895 |
| Kezar Life Sciences, Inc. (b) | | 437,019 | 7,827,010 |
| La Jolla Pharmaceutical Co. (a)(b) | | 795,306 | 4,803,648 |
| Ligand Pharmaceuticals, Inc. Class B (a)(b) | | 45,812 | 5,410,397 |
| Mirati Therapeutics, Inc. (a)(b) | | 315,820 | 20,869,386 |
| Myriad Genetics, Inc. (a) | | 169,800 | 4,786,662 |
| Natera, Inc. (a) | | 159,600 | 2,168,964 |
| Neurocrine Biosciences, Inc. (a) | | 721,252 | 63,628,851 |
| Principia Biopharma, Inc. | | 124,544 | 3,774,929 |
| Protagonist Therapeutics, Inc. (a) | | 192,401 | 1,568,068 |
| PTC Therapeutics, Inc. (a) | | 126,709 | 3,944,451 |
| Regeneron Pharmaceuticals, Inc. (a) | | 356,131 | 152,876,354 |
| REGENXBIO, Inc. (a) | | 87,486 | 3,845,885 |
| Repligen Corp. (a) | | 108,427 | 6,181,423 |
| Sage Therapeutics, Inc. (a) | | 267,015 | 38,073,669 |
| Sarepta Therapeutics, Inc. (a) | | 434,181 | 60,659,428 |
| Scholar Rock Holding Corp. | | 391,809 | 5,920,234 |
| Seattle Genetics, Inc. (a) | | 103,420 | 7,904,391 |
| Spark Therapeutics, Inc. (a) | | 271,333 | 12,975,144 |
| Twist Bioscience Corp. | | 234,357 | 5,149,644 |
| United Therapeutics Corp. (a) | | 79,480 | 9,166,428 |
| Vanda Pharmaceuticals, Inc. (a) | | 184,479 | 5,004,915 |
| Vertex Pharmaceuticals, Inc. (a) | | 1,177,494 | 224,795,380 |
| Xencor, Inc. (a) | | 375,526 | 13,556,489 |
| Y-mAbs Therapeutics, Inc. | | 360,900 | 7,427,322 |
| Zymeworks, Inc. (a) | | 355,126 | 5,657,157 |
| | | | 2,253,201,155 |
| Health Care Providers & Services - 0.3% | | | |
| Health Care Services - 0.3% | | | |
| G1 Therapeutics, Inc. (a) | | 385,500 | 8,245,845 |
| Precipio, Inc. (a)(c) | | 450 | 86 |
| | | | 8,245,931 |
| Life Sciences Tools & Services - 0.4% | | | |
| Life Sciences Tools & Services - 0.4% | | | |
| Morphosys AG sponsored ADR | | 397,244 | 10,344,234 |
| Pharmaceuticals - 6.7% | | | |
| Pharmaceuticals - 6.7% | | | |
| Adimab LLC (c)(d)(e) | | 285,956 | 11,618,392 |
| Afferent Pharmaceuticals, Inc. rights 12/31/24 (a)(e) | | 1,915,787 | 2,739,575 |
| Akcea Therapeutics, Inc. (a) | | 171,000 | 4,545,180 |
| Bristol-Myers Squibb Co. | | 1,069,600 | 52,806,152 |
| Chiasma, Inc. warrants 12/16/24 (a) | | 81,298 | 67,771 |
| Kolltan Pharmaceuticals, Inc. rights (a)(e) | | 1,610,391 | 16 |
| MyoKardia, Inc. (a) | | 390,446 | 16,156,655 |
| Nektar Therapeutics (a) | | 418,098 | 17,702,269 |
| NeurogesX, Inc. (a)(e) | | 150,000 | 2 |
| RPI International Holdings LP (a)(c)(e) | | 12,210 | 1,843,222 |
| Stemcentrx, Inc. rights 12/31/21 (a)(e) | | 208,907 | 254,867 |
| The Medicines Company (a)(b) | | 422,235 | 9,757,851 |
| Theravance Biopharma, Inc. (a)(b) | | 490,800 | 12,785,340 |
| Xeris Pharmaceuticals, Inc. (b) | | 646,200 | 8,969,256 |
| Zogenix, Inc. (a) | | 560,759 | 24,533,206 |
| | | | 163,779,754 |
| TOTAL COMMON STOCKS | | | |
| (Cost $1,942,894,534) | | | 2,435,571,074 |
|
| Preferred Stocks - 0.4% | | | |
| Convertible Preferred Stocks - 0.4% | | | |
| Biotechnology - 0.2% | | | |
| Biotechnology - 0.2% | | | |
| Axcella Health, Inc. Series C (a)(c)(e) | | 341,857 | 3,818,543 |
| Immunocore Ltd. Series A (a)(c)(e) | | 17,149 | 1,687,172 |
| | | | 5,505,715 |
| Health Care Technology - 0.2% | | | |
| Health Care Technology - 0.2% | | | |
| Codiak Biosciences, Inc.: | | | |
| Series A 8.00% (a)(c)(e) | | 213,402 | 774,649 |
| Series B 8.00% (a)(c)(e) | | 693,558 | 2,517,616 |
| | | | 3,292,265 |
| Pharmaceuticals - 0.0% | | | |
| Pharmaceuticals - 0.0% | | | |
| Afferent Pharmaceuticals, Inc. Series C (a)(c)(e) | | 1,915,787 | 19 |
|
| TOTAL CONVERTIBLE PREFERRED STOCKS | | | 8,797,999 |
|
| Nonconvertible Preferred Stocks - 0.0% | | | |
| Biotechnology - 0.0% | | | |
| Biotechnology - 0.0% | | | |
| Yumanity Holdings LLC Class A (a)(c)(e) | | 151,084 | 995,644 |
| TOTAL PREFERRED STOCKS | | | |
| (Cost $9,988,211) | | | 9,793,643 |
|
| Money Market Funds - 4.8% | | | |
| Fidelity Cash Central Fund, 2.43% (f) | | 24,855,926 | 24,860,898 |
| Fidelity Securities Lending Cash Central Fund 2.43% (f)(g) | | 93,925,956 | 93,935,348 |
| TOTAL MONEY MARKET FUNDS | | | |
| (Cost $118,790,360) | | | 118,796,246 |
| TOTAL INVESTMENT IN SECURITIES - 103.9% | | | |
| (Cost $2,071,673,105) | | | 2,564,160,963 |
| NET OTHER ASSETS (LIABILITIES) - (3.9)% | | | (95,995,909) |
| NET ASSETS - 100% | | | $2,468,165,054 |
Legend
(a) Non-income producing
(b) Security or a portion of the security is on loan at period end.
(c) Restricted securities - Investment in securities not registered under the Securities Act of 1933 (excluding 144A issues). At the end of the period, the value of restricted securities (excluding 144A issues) amounted to $23,255,343 or 0.9% of net assets.
(d) Investment is owned by a wholly-owned subsidiary (Subsidiary) that is treated as a corporation for U.S. tax purposes.
(e) Level 3 security
(f) Affiliated fund that is generally available only to investment companies and other accounts managed by Fidelity Investments. The rate quoted is the annualized seven-day yield of the fund at period end. A complete unaudited listing of the fund's holdings as of its most recent quarter end is available upon request. In addition, each Fidelity Central Fund's financial statements are available on the SEC's website or upon request.
(g) Investment made with cash collateral received from securities on loan.
Additional information on each restricted holding is as follows:
| Security | Acquisition Date | Acquisition Cost |
| Adimab LLC | 9/17/14 - 6/5/15 | $5,348,114 |
| Afferent Pharmaceuticals, Inc. Series C | 7/1/15 | $0 |
| Axcella Health, Inc. Series C | 1/30/15 | $3,445,919 |
| Codiak Biosciences, Inc. Series A 8.00% | 11/12/15 | $213,402 |
| Codiak Biosciences, Inc. Series B 8.00% | 11/12/15 | $2,080,674 |
| Immunocore Ltd. Series A | 7/27/15 | $3,227,085 |
| Precipio, Inc. | 2/3/12 - 7/31/17 | $161,441 |
| RPI International Holdings LP | 5/21/15 | $1,439,559 |
| Yumanity Holdings LLC Class A | 2/8/16 | $1,021,131 |
Affiliated Central Funds
Information regarding fiscal year to date income earned by the Fund from investments in Fidelity Central Funds is as follows:
| Fund | Income earned |
| Fidelity Cash Central Fund | $335,760 |
| Fidelity Securities Lending Cash Central Fund | 552,005 |
| Total | $887,765 |
Amounts in the income column in the above table include any capital gain distributions from underlying funds, which are presented in the corresponding line-item in the Statement of Operations, if applicable.
Investment Valuation
The following is a summary of the inputs used, as of January 31, 2019, involving the Fund's assets and liabilities carried at fair value. The inputs or methodology used for valuing securities may not be an indication of the risk associated with investing in those securities. For more information on valuation inputs, and their aggregation into the levels used below, please refer to the Investment Valuation section in the accompanying Notes to Financial Statements.
| | Valuation Inputs at Reporting Date: |
| Description | Total | Level 1 | Level 2 | Level 3 |
| Investments in Securities: | | | | |
| Common Stocks | $2,435,571,074 | $2,412,809,791 | $6,305,209 | $16,456,074 |
| Preferred Stocks | 9,793,643 | -- | -- | 9,793,643 |
| Money Market Funds | 118,796,246 | 118,796,246 | -- | -- |
| Total Investments in Securities: | $2,564,160,963 | $2,531,606,037 | $6,305,209 | $26,249,717 |
The following is a reconciliation of Investments in Securities and Derivative Instruments for which Level 3 inputs were used in determining value:
| Investments in Securities: | |
| Preferred Stocks | |
| Beginning Balance | $30,498,190 |
| Total Realized Gain (Loss) | 6,361,378 |
| Total Unrealized Gain (Loss) | (9,301,657) |
| Cost of Purchases | -- |
| Proceeds of Sales | (17,764,268) |
| Amortization/Accretion | -- |
| Transfers in to Level 3 | -- |
| Transfers out of Level 3 | -- |
| Ending Balance | $9,793,643 |
| The change in unrealized gain (loss) for the period attributable to Level 3 securities held at January 31, 2019 | $(1,605,124) |
| Other Investments in Securities | |
| Beginning Balance | $21,053,430 |
| Total Realized Gain (Loss) | 2,940,614 |
| Total Unrealized Gain (Loss) | (3,445,112) |
| Cost of Purchases | 475,782 |
| Proceeds of Sales | (4,568,640) |
| Amortization/Accretion | -- |
| Transfers in to Level 3 | -- |
| Transfers out of Level 3 | -- |
| Ending Balance | $16,456,074 |
| The change in unrealized gain (loss) for the period attributable to Level 3 securities held at January 31, 2019 | $(3,445,112) |
The information used in the above reconciliations represents fiscal year to date activity for any Investments in Securities identified as using Level 3 inputs at either the beginning or the end of the current fiscal period. Transfers in or out of Level 3 represent the beginning value of any Security or Instrument where a change in the pricing level occurred from the beginning to the end of the period. The cost of purchases and the proceeds of sales may include securities received or delivered through corporate actions or exchanges. Realized and unrealized gains (losses) disclosed in the reconciliations are included in Net Gain (Loss) on the Fund's Statement of Operations.
See accompanying notes which are an integral part of the financial statements.
Fidelity Advisor® Biotechnology Fund
Financial Statements
Statement of Assets and Liabilities
| | | January 31, 2019 (Unaudited) |
| Assets | | |
Investment in securities, at value (including securities loaned of $93,652,737) — See accompanying schedule:
Unaffiliated issuers (cost $1,952,882,745) | $2,445,364,717 | |
| Fidelity Central Funds (cost $118,790,360) | 118,796,246 | |
| Total Investment in Securities (cost $2,071,673,105) | | $2,564,160,963 |
| Restricted cash | | 220 |
| Receivable for fund shares sold | | 2,951,230 |
| Dividends receivable | | 2,939,692 |
| Distributions receivable from Fidelity Central Funds | | 110,437 |
| Prepaid expenses | | 23,830 |
| Other receivables | | 121,761 |
| Total assets | | 2,570,308,133 |
| Liabilities | | |
| Payable for investments purchased | $471,779 | |
| Payable for fund shares redeemed | 5,605,740 | |
| Accrued management fee | 1,089,553 | |
| Distribution and service plan fees payable | 586,675 | |
| Other affiliated payables | 434,420 | |
| Other payables and accrued expenses | 50,328 | |
| Collateral on securities loaned | 93,904,584 | |
| Total liabilities | | 102,143,079 |
| Net Assets | | $2,468,165,054 |
| Net Assets consist of: | | |
| Paid in capital | | $1,983,113,187 |
| Total distributable earnings (loss) | | 485,051,867 |
| Net Assets | | $2,468,165,054 |
| Net Asset Value and Maximum Offering Price | | |
| Class A: | | |
| Net Asset Value and redemption price per share ($670,672,508 ÷ 25,762,207 shares) | | $26.03 |
| Maximum offering price per share (100/94.25 of $26.03) | | $27.62 |
| Class M: | | |
| Net Asset Value and redemption price per share ($127,182,056 ÷ 5,174,743 shares) | | $24.58 |
| Maximum offering price per share (100/96.50 of $24.58) | | $25.47 |
| Class C: | | |
| Net Asset Value and offering price per share ($486,331,331 ÷ 21,841,379 shares)(a) | | $22.27 |
| Class I: | | |
| Net Asset Value, offering price and redemption price per share ($1,162,055,137 ÷ 42,065,538 shares) | | $27.62 |
| Class Z: | | |
| Net Asset Value, offering price and redemption price per share ($21,924,022 ÷ 793,404 shares) | | $27.63 |
(a) Redemption price per share is equal to net asset value less any applicable contingent deferred sales charge.
See accompanying notes which are an integral part of the financial statements.
Statement of Operations
| | | Six months ended January 31, 2019 (Unaudited) |
| Investment Income | | |
| Dividends | | $11,911,198 |
| Income from Fidelity Central Funds (including $552,005 from security lending) | | 887,765 |
| Total income | | 12,798,963 |
| Expenses | | |
| Management fee | $6,939,618 | |
| Transfer agent fees | 2,465,399 | |
| Distribution and service plan fees | 3,748,569 | |
| Accounting and security lending fees | 392,916 | |
| Custodian fees and expenses | 36,884 | |
| Independent trustees' fees and expenses | 8,315 | |
| Registration fees | 91,748 | |
| Audit | 37,951 | |
| Legal | 10,767 | |
| Interest | 783 | |
| Miscellaneous | 8,564 | |
| Total expenses before reductions | 13,741,514 | |
| Expense reductions | (130,248) | |
| Total expenses after reductions | | 13,611,266 |
| Net investment income (loss) | | (812,303) |
| Realized and Unrealized Gain (Loss) | | |
| Net realized gain (loss) on: | | |
| Investment securities: | | |
| Unaffiliated issuers | 127,915,847 | |
| Fidelity Central Funds | 4,592 | |
| Foreign currency transactions | 2,902 | |
| Total net realized gain (loss) | | 127,923,341 |
| Change in net unrealized appreciation (depreciation) on: | | |
| Investment securities: | | |
| Unaffiliated issuers | (251,730,477) | |
| Fidelity Central Funds | (3,394) | |
| Assets and liabilities in foreign currencies | (9) | |
| Total change in net unrealized appreciation (depreciation) | | (251,733,880) |
| Net gain (loss) | | (123,810,539) |
| Net increase (decrease) in net assets resulting from operations | | $(124,622,842) |
See accompanying notes which are an integral part of the financial statements.
Statement of Changes in Net Assets
| | Six months ended January 31, 2019 (Unaudited) | Year ended July 31, 2018 |
| Increase (Decrease) in Net Assets | | |
| Operations | | |
| Net investment income (loss) | $(812,303) | $(15,559,526) |
| Net realized gain (loss) | 127,923,341 | 147,763,435 |
| Change in net unrealized appreciation (depreciation) | (251,733,880) | 208,112,601 |
| Net increase (decrease) in net assets resulting from operations | (124,622,842) | 340,316,510 |
| Distributions to shareholders | (56,953,794) | – |
| Total distributions | (56,953,794) | – |
| Share transactions - net increase (decrease) | (118,693,493) | (237,264,870) |
| Total increase (decrease) in net assets | (300,270,129) | 103,051,640 |
| Net Assets | | |
| Beginning of period | 2,768,435,183 | 2,665,383,543 |
| End of period | $2,468,165,054 | $2,768,435,183 |
| Other Information | | |
| Accumulated net investment loss end of period | | $(8,149,824) |
See accompanying notes which are an integral part of the financial statements.
Financial Highlights
Fidelity Advisor Biotechnology Fund Class A
| | Six months ended (Unaudited) January 31, | Years endedJuly 31, | | | | |
| | 2019 | 2018 | 2017 | 2016 | 2015 | 2014 |
| Selected Per–Share Data | | | | | | |
| Net asset value, beginning of period | $27.80 | $24.45 | $21.39 | $31.43 | $20.19 | $17.25 |
| Income from Investment Operations | | | | | | |
| Net investment income (loss)A | –B | (.14) | (.15)C | (.16) | (.20) | (.13) |
| Net realized and unrealized gain (loss) | (1.18) | 3.49 | 3.21 | (8.48) | 12.04 | 3.12 |
| Total from investment operations | (1.18) | 3.35 | 3.06 | (8.64) | 11.84 | 2.99 |
| Distributions from net investment income | – | – | – | – | – | – |
| Distributions from net realized gain | (.59) | – | – | (1.40) | (.60) | (.05) |
| Total distributions | (.59) | – | – | (1.40) | (.60) | (.05) |
| Redemption fees added to paid in capitalA | – | – | –B | –B | –B | –B |
| Net asset value, end of period | $26.03 | $27.80 | $24.45 | $21.39 | $31.43 | $20.19 |
| Total ReturnD,E,F | (4.14)% | 13.70% | 14.31% | (28.55)% | 59.66% | 17.38% |
| Ratios to Average Net AssetsG,H | | | | | | |
| Expenses before reductions | 1.03%I | 1.06% | 1.05% | 1.05% | 1.04% | 1.08% |
| Expenses net of fee waivers, if any | 1.03%I | 1.06% | 1.05% | 1.05% | 1.04% | 1.08% |
| Expenses net of all reductions | 1.02%I | 1.06% | 1.04% | 1.04% | 1.04% | 1.08% |
| Net investment income (loss) | (.03)%I | (.53)% | (.69)%C | (.69)% | (.75)% | (.68)% |
| Supplemental Data | | | | | | |
| Net assets, end of period (000 omitted) | $670,673 | $766,303 | $787,802 | $1,080,733 | $1,560,528 | $602,625 |
| Portfolio turnover rateJ | 66%I | 45% | 30% | 29% | 26% | 50% |
A Calculated based on average shares outstanding during the period.
B Amount represents less than $.005 per share.
C Net investment income per share reflects a large, non-recurring dividend which amounted to $.01 per share. Excluding this non-recurring dividend, the ratio of net investment income (loss) to average net assets would have been (.71) %.
D Total returns for periods of less than one year are not annualized.
E Total returns would have been lower if certain expenses had not been reduced during the applicable periods shown.
F Total returns do not include the effect of the sales charges.
G Fees and expenses of any underlying Fidelity Central Funds are not included in the Fund's expense ratio. The Fund indirectly bears its proportionate share of the expenses of any underlying Fidelity Central Funds.
H Expense ratios reflect operating expenses of the class. Expenses before reductions do not reflect amounts reimbursed by the investment adviser or reductions from brokerage service arrangements or reductions from other expense offset arrangements and do not represent the amount paid by the class during periods when reimbursements or reductions occur. Expenses net of fee waivers reflect expenses after reimbursement by the investment adviser but prior to reductions from brokerage service arrangements or other expense offset arrangements. Expenses net of all reductions represent the net expenses paid by the class.
I Annualized
J Amount does not include the portfolio activity of any underlying Fidelity Central Funds.
See accompanying notes which are an integral part of the financial statements.
Fidelity Advisor Biotechnology Fund Class M
| | Six months ended (Unaudited) January 31, | Years endedJuly 31, | | | | |
| | 2019 | 2018 | 2017 | 2016 | 2015 | 2014 |
| Selected Per–Share Data | | | | | | |
| Net asset value, beginning of period | $26.32 | $23.22 | $20.39 | $30.06 | $19.39 | $16.63 |
| Income from Investment Operations | | | | | | |
| Net investment income (loss)A | (.04) | (.21) | (.21)B | (.22) | (.27) | (.19) |
| Net realized and unrealized gain (loss) | (1.11) | 3.31 | 3.04 | (8.10) | 11.54 | 3.00 |
| Total from investment operations | (1.15) | 3.10 | 2.83 | (8.32) | 11.27 | 2.81 |
| Distributions from net investment income | – | – | – | – | – | – |
| Distributions from net realized gain | (.59) | – | – | (1.35) | (.60) | (.05) |
| Total distributions | (.59) | – | – | (1.35) | (.60) | (.05) |
| Redemption fees added to paid in capitalA | – | – | –C | –C | –C | –C |
| Net asset value, end of period | $24.58 | $26.32 | $23.22 | $20.39 | $30.06 | $19.39 |
| Total ReturnD,E,F | (4.26)% | 13.35% | 13.88% | (28.75)% | 59.17% | 16.95% |
| Ratios to Average Net AssetsG,H | | | | | | |
| Expenses before reductions | 1.35%I | 1.38% | 1.38% | 1.37% | 1.35% | 1.41% |
| Expenses net of fee waivers, if any | 1.35%I | 1.38% | 1.38% | 1.37% | 1.35% | 1.41% |
| Expenses net of all reductions | 1.34%I | 1.38% | 1.38% | 1.37% | 1.34% | 1.40% |
| Net investment income (loss) | (.34)%I | (.84)% | (1.02)%B | (1.01)% | (1.05)% | (1.01)% |
| Supplemental Data | | | | | | |
| Net assets, end of period (000 omitted) | $127,182 | $135,879 | $127,734 | $131,928 | $196,393 | $95,945 |
| Portfolio turnover rateJ | 66%I | 45% | 30% | 29% | 26% | 50% |
A Calculated based on average shares outstanding during the period.
B Net investment income per share reflects a large, non-recurring dividend which amounted to $.01 per share. Excluding this non-recurring dividend, the ratio of net investment income (loss) to average net assets would have been (1.05) %.
C Amount represents less than $.005 per share.
D Total returns for periods of less than one year are not annualized.
E Total returns would have been lower if certain expenses had not been reduced during the applicable periods shown.
F Total returns do not include the effect of the sales charges.
G Fees and expenses of any underlying Fidelity Central Funds are not included in the Fund's expense ratio. The Fund indirectly bears its proportionate share of the expenses of any underlying Fidelity Central Funds.
H Expense ratios reflect operating expenses of the class. Expenses before reductions do not reflect amounts reimbursed by the investment adviser or reductions from brokerage service arrangements or reductions from other expense offset arrangements and do not represent the amount paid by the class during periods when reimbursements or reductions occur. Expenses net of fee waivers reflect expenses after reimbursement by the investment adviser but prior to reductions from brokerage service arrangements or other expense offset arrangements. Expenses net of all reductions represent the net expenses paid by the class.
I Annualized
J Amount does not include the portfolio activity of any underlying Fidelity Central Funds.
See accompanying notes which are an integral part of the financial statements.
Fidelity Advisor Biotechnology Fund Class C
| | Six months ended (Unaudited) January 31, | Years endedJuly 31, | | | | |
| | 2019 | 2018 | 2017 | 2016 | 2015 | 2014 |
| Selected Per–Share Data | | | | | | |
| Net asset value, beginning of period | $23.96 | $21.23 | $18.71 | $27.78 | $18.04 | $15.53 |
| Income from Investment Operations | | | | | | |
| Net investment income (loss)A | (.09) | (.29) | (.27)B | (.29) | (.35) | (.25) |
| Net realized and unrealized gain (loss) | (1.01) | 3.02 | 2.79 | (7.46) | 10.69 | 2.81 |
| Total from investment operations | (1.10) | 2.73 | 2.52 | (7.75) | 10.34 | 2.56 |
| Distributions from net investment income | – | – | – | – | – | – |
| Distributions from net realized gain | (.59) | – | – | (1.32) | (.60) | (.05) |
| Total distributions | (.59) | – | – | (1.32) | (.60) | (.05) |
| Redemption fees added to paid in capitalA | – | – | –C | –C | –C | –C |
| Net asset value, end of period | $22.27 | $23.96 | $21.23 | $18.71 | $27.78 | $18.04 |
| Total ReturnD,E,F | (4.47)% | 12.86% | 13.47% | (29.06)% | 58.43% | 16.54% |
| Ratios to Average Net AssetsG,H | | | | | | |
| Expenses before reductions | 1.77%I | 1.80% | 1.79% | 1.80% | 1.79% | 1.83% |
| Expenses net of fee waivers, if any | 1.77%I | 1.80% | 1.79% | 1.80% | 1.79% | 1.83% |
| Expenses net of all reductions | 1.76%I | 1.80% | 1.79% | 1.79% | 1.79% | 1.83% |
| Net investment income (loss) | (.77)%I | (1.27)% | (1.43)%B | (1.44)% | (1.49)% | (1.43)% |
| Supplemental Data | | | | | | |
| Net assets, end of period (000 omitted) | $486,331 | $558,420 | $593,489 | $665,036 | $956,495 | $359,967 |
| Portfolio turnover rateJ | 66%I | 45% | 30% | 29% | 26% | 50% |
A Calculated based on average shares outstanding during the period.
B Net investment income per share reflects a large, non-recurring dividend which amounted to $.01 per share. Excluding this non-recurring dividend, the ratio of net investment income (loss) to average net assets would have been (1.46) %.
C Amount represents less than $.005 per share.
D Total returns for periods of less than one year are not annualized.
E Total returns would have been lower if certain expenses had not been reduced during the applicable periods shown.
F Total returns do not include the effect of the contingent deferred sales charge.
G Fees and expenses of any underlying Fidelity Central Funds are not included in the Fund's expense ratio. The Fund indirectly bears its proportionate share of the expenses of any underlying Fidelity Central Funds.
H Expense ratios reflect operating expenses of the class. Expenses before reductions do not reflect amounts reimbursed by the investment adviser or reductions from brokerage service arrangements or reductions from other expense offset arrangements and do not represent the amount paid by the class during periods when reimbursements or reductions occur. Expenses net of fee waivers reflect expenses after reimbursement by the investment adviser but prior to reductions from brokerage service arrangements or other expense offset arrangements. Expenses net of all reductions represent the net expenses paid by the class.
I Annualized
J Amount does not include the portfolio activity of any underlying Fidelity Central Funds.
See accompanying notes which are an integral part of the financial statements.
Fidelity Advisor Biotechnology Fund Class I
| | Six months ended (Unaudited) January 31, | Years endedJuly 31, | | | | |
| | 2019 | 2018 | 2017 | 2016 | 2015 | 2014 |
| Selected Per–Share Data | | | | | | |
| Net asset value, beginning of period | $29.42 | $25.80 | $22.52 | $32.95 | $21.10 | $17.97 |
| Income from Investment Operations | | | | | | |
| Net investment income (loss)A | .03 | (.07) | (.10)B | (.10) | (.14) | (.08) |
| Net realized and unrealized gain (loss) | (1.24) | 3.69 | 3.38 | (8.89) | 12.60 | 3.26 |
| Total from investment operations | (1.21) | 3.62 | 3.28 | (8.99) | 12.46 | 3.18 |
| Distributions from net investment income | – | – | – | – | –C | – |
| Distributions from net realized gain | (.59) | – | – | (1.44) | (.60) | (.05) |
| Total distributions | (.59) | – | – | (1.44) | (.61)D | (.05) |
| Redemption fees added to paid in capitalA | – | – | –C | –E | –C | –C |
| Net asset value, end of period | $27.62 | $29.42 | $25.80 | $22.52 | $32.95 | $21.10 |
| Total ReturnF,G | (4.01)% | 14.03% | 14.56% | (28.32)% | 60.00% | 17.74% |
| Ratios to Average Net AssetsH,I | | | | | | |
| Expenses before reductions | .76%J | .79% | .78% | .78% | .78% | .81% |
| Expenses net of fee waivers, if any | .76%J | .79% | .78% | .78% | .78% | .81% |
| Expenses net of all reductions | .75%J | .79% | .77% | .78% | .77% | .80% |
| Net investment income (loss) | .24%J | (.26)% | (.42)%B | (.42)% | (.48)% | (.41)% |
| Supplemental Data | | | | | | |
| Net assets, end of period (000 omitted) | $1,162,055 | $1,307,833 | $1,156,358 | $908,234 | $1,403,666 | $465,889 |
| Portfolio turnover rateE | 66%J | 45% | 30% | 29% | 26% | 50% |
A Calculated based on average shares outstanding during the period.
B Net investment income per share reflects a large, non-recurring dividend which amounted to $.01 per share. Excluding this non-recurring dividend, the ratio of net investment income (loss) to average net assets would have been (.44) %.
C Amount represents less than $.005 per share.
D Total distributions of $.61 per share is comprised of distributions from net investment income of $.003 and distributions from net realized gain of $.604 per share.
E Amount does not include the portfolio activity of any underlying Fidelity Central Funds.
F Total returns for periods of less than one year are not annualized.
G Total returns would have been lower if certain expenses had not been reduced during the applicable periods shown.
H Fees and expenses of any underlying Fidelity Central Funds are not included in the Fund's expense ratio. The Fund indirectly bears its proportionate share of the expenses of any underlying Fidelity Central Funds.
I Expense ratios reflect operating expenses of the class. Expenses before reductions do not reflect amounts reimbursed by the investment adviser or reductions from brokerage service arrangements or reductions from other expense offset arrangements and do not represent the amount paid by the class during periods when reimbursements or reductions occur. Expenses net of fee waivers reflect expenses after reimbursement by the investment adviser but prior to reductions from brokerage service arrangements or other expense offset arrangements. Expenses net of all reductions represent the net expenses paid by the class.
J Annualized
See accompanying notes which are an integral part of the financial statements.
Fidelity Advisor Biotechnology Fund Class Z
| | Six months ended (Unaudited) January 31, |
| | 2019 A |
| Selected Per–Share Data | |
| Net asset value, beginning of period | $30.06 |
| Income from Investment Operations | |
| Net investment income (loss)B | .05 |
| Net realized and unrealized gain (loss) | (1.89) |
| Total from investment operations | (1.84) |
| Distributions from net investment income | – |
| Distributions from net realized gain | (.59) |
| Total distributions | (.59) |
| Net asset value, end of period | $27.63 |
| Total ReturnC,D | (6.02)% |
| Ratios to Average Net AssetsE,F | |
| Expenses before reductions | .63%G |
| Expenses net of fee waivers, if any | .63%G |
| Expenses net of all reductions | .62%G |
| Net investment income (loss) | .55%G |
| Supplemental Data | |
| Net assets, end of period (000 omitted) | $21,924 |
| Portfolio turnover rateH | 66%G |
A For the period October 2, 2018 (commencement of sale of shares) to January 31, 2019.
B Calculated based on average shares outstanding during the period.
C Total returns for periods of less than one year are not annualized.
D Total returns would have been lower if certain expenses had not been reduced during the applicable periods shown.
E Fees and expenses of any underlying Fidelity Central Funds are not included in the Fund's expense ratio. The Fund indirectly bears its proportionate share of the expenses of any underlying Fidelity Central Funds.
F Expense ratios reflect operating expenses of the class. Expenses before reductions do not reflect amounts reimbursed by the investment adviser or reductions from brokerage service arrangements or reductions from other expense offset arrangements and do not represent the amount paid by the class during periods when reimbursements or reductions occur. Expense ratios before reductions for start-up periods may not be representative of longer-term operating periods. Expenses net of fee waivers reflect expenses after reimbursement by the investment adviser but prior to reductions from brokerage service arrangements or other expense offset arrangements. Expenses net of all reductions represent the net expenses paid by the class.
G Annualized
H Amount does not include the portfolio activity of any underlying Fidelity Central Funds.
See accompanying notes which are an integral part of the financial statements.
Fidelity Advisor® Communications Equipment Fund
Investment Summary (Unaudited)
Top Ten Stocks as of January 31, 2019
| | % of fund's net assets |
| Cisco Systems, Inc. | 24.7 |
| Nokia Corp. sponsored ADR | 11.1 |
| Telefonaktiebolaget LM Ericsson (B Shares) sponsored ADR | 8.7 |
| Arista Networks, Inc. | 5.0 |
| Motorola Solutions, Inc. | 4.9 |
| F5 Networks, Inc. | 4.5 |
| Ciena Corp. | 3.4 |
| Lumentum Holdings, Inc. | 3.2 |
| Arris International PLC | 2.8 |
| Juniper Networks, Inc. | 2.8 |
| | 71.1 |
Top Industries (% of fund's net assets)
| As of January 31, 2019 |
| | Communications Equipment | 94.4% |
| | Semiconductors & Semiconductor Equipment | 2.0% |
| | Media | 1.0% |
| | Electronic Equipment & Components | 0.8% |
| | All Others* | 1.8% |

* Includes short-term investments and net other assets (liabilities).
Fidelity Advisor® Communications Equipment Fund
Schedule of Investments January 31, 2019 (Unaudited)
Showing Percentage of Net Assets
| Common Stocks - 98.2% | | | |
| | | Shares | Value |
| Communications Equipment - 94.4% | | | |
| Communications Equipment - 94.4% | | | |
| ADTRAN, Inc. | | 18,226 | $265,735 |
| Applied Optoelectronics, Inc. (a)(b) | | 6,473 | 112,501 |
| Arista Networks, Inc. (a) | | 7,286 | 1,564,887 |
| Arris International PLC (a) | | 27,619 | 866,960 |
| CalAmp Corp. (a) | | 11,597 | 167,113 |
| Ciena Corp. (a) | | 27,582 | 1,050,598 |
| Cisco Systems, Inc. | | 163,396 | 7,726,997 |
| CommScope Holding Co., Inc. (a) | | 31,501 | 658,686 |
| Comtech Telecommunications Corp. | | 10,897 | 272,098 |
| EchoStar Holding Corp. Class A (a) | | 10,735 | 439,920 |
| Extreme Networks, Inc. (a) | | 33,473 | 253,056 |
| F5 Networks, Inc. (a) | | 8,798 | 1,416,038 |
| Finisar Corp. (a) | | 24,448 | 556,925 |
| Harmonic, Inc. (a) | | 38,857 | 205,554 |
| Infinera Corp. (a) | | 43,237 | 190,243 |
| InterDigital, Inc. | | 6,033 | 439,263 |
| Juniper Networks, Inc. | | 33,178 | 860,637 |
| Lumentum Holdings, Inc. (a) | | 20,623 | 1,008,671 |
| Motorola Solutions, Inc. | | 13,079 | 1,529,066 |
| NETGEAR, Inc. (a) | | 2,800 | 110,908 |
| NetScout Systems, Inc. (a) | | 16,198 | 420,014 |
| Nokia Corp. sponsored ADR (b) | | 547,042 | 3,473,717 |
| Plantronics, Inc. | | 10,661 | 413,540 |
| Quantenna Communications, Inc. (a) | | 19,121 | 285,668 |
| Sierra Wireless, Inc. (a) | | 26,500 | 412,641 |
| Sonus Networks, Inc. (a) | | 40,084 | 223,669 |
| Telefonaktiebolaget LM Ericsson (B Shares) sponsored ADR | | 305,378 | 2,720,918 |
| Ubiquiti Networks, Inc. (b) | | 7,050 | 762,881 |
| ViaSat, Inc. (a)(b) | | 8,306 | 520,703 |
| Viavi Solutions, Inc. (a) | | 52,002 | 578,262 |
| | | | 29,507,869 |
| Electronic Equipment & Components - 0.8% | | | |
| Electronic Components - 0.8% | | | |
| Casa Systems, Inc. (a) | | 21,688 | 252,448 |
| Media - 1.0% | | | |
| Cable & Satellite - 1.0% | | | |
| Comcast Corp. Class A | | 8,530 | 311,942 |
| Semiconductors & Semiconductor Equipment - 2.0% | | | |
| Semiconductors - 2.0% | | | |
| Acacia Communications, Inc. (a) | | 14,271 | 620,931 |
| TOTAL COMMON STOCKS | | | |
| (Cost $25,600,800) | | | 30,693,190 |
|
| Money Market Funds - 11.4% | | | |
| Fidelity Cash Central Fund, 2.43% (c) | | 348,231 | 348,300 |
| Fidelity Securities Lending Cash Central Fund 2.43% (c)(d) | | 3,212,220 | 3,212,542 |
| TOTAL MONEY MARKET FUNDS | | | |
| (Cost $3,560,842) | | | 3,560,842 |
| TOTAL INVESTMENT IN SECURITIES - 109.6% | | | |
| (Cost $29,161,642) | | | 34,254,032 |
| NET OTHER ASSETS (LIABILITIES) - (9.6)% | | | (3,009,525) |
| NET ASSETS - 100% | | | $31,244,507 |
Legend
(a) Non-income producing
(b) Security or a portion of the security is on loan at period end.
(c) Affiliated fund that is generally available only to investment companies and other accounts managed by Fidelity Investments. The rate quoted is the annualized seven-day yield of the fund at period end. A complete unaudited listing of the fund's holdings as of its most recent quarter end is available upon request. In addition, each Fidelity Central Fund's financial statements are available on the SEC's website or upon request.
(d) Investment made with cash collateral received from securities on loan.
Affiliated Central Funds
Information regarding fiscal year to date income earned by the Fund from investments in Fidelity Central Funds is as follows:
| Fund | Income earned |
| Fidelity Cash Central Fund | $5,849 |
| Fidelity Securities Lending Cash Central Fund | 2,454 |
| Total | $8,303 |
Amounts in the income column in the above table include any capital gain distributions from underlying funds, which are presented in the corresponding line-item in the Statement of Operations, if applicable.
Investment Valuation
All investments are categorized as Level 1 under the Fair Value Hierarchy. The inputs or methodology used for valuing securities may not be an indication of the risk associated with investing in those securities. For more information on valuation inputs please refer to the Investment Valuation section in the accompanying Notes to Financial Statements.
Other Information
Distribution of investments by country or territory of incorporation, as a percentage of Total Net Assets, is as follows (Unaudited):
| United States of America | 76.1% |
| Finland | 11.1% |
| Sweden | 8.7% |
| United Kingdom | 2.8% |
| Canada | 1.3% |
| | 100.0% |
See accompanying notes which are an integral part of the financial statements.
Fidelity Advisor® Communications Equipment Fund
Financial Statements
Statement of Assets and Liabilities
| | | January 31, 2019 (Unaudited) |
| Assets | | |
Investment in securities, at value (including securities loaned of $3,056,811) — See accompanying schedule:
Unaffiliated issuers (cost $25,600,800) | $30,693,190 | |
| Fidelity Central Funds (cost $3,560,842) | 3,560,842 | |
| Total Investment in Securities (cost $29,161,642) | | $34,254,032 |
| Receivable for investments sold | | 404,019 |
| Receivable for fund shares sold | | 78,801 |
| Dividends receivable | | 1,090 |
| Distributions receivable from Fidelity Central Funds | | 2,098 |
| Prepaid expenses | | 146 |
| Other receivables | | 199 |
| Total assets | | 34,740,385 |
| Liabilities | | |
| Payable for investments purchased | $208,639 | |
| Payable for fund shares redeemed | 13,745 | |
| Accrued management fee | 14,305 | |
| Distribution and service plan fees payable | 9,164 | |
| Other affiliated payables | 7,148 | |
| Other payables and accrued expenses | 30,252 | |
| Collateral on securities loaned | 3,212,625 | |
| Total liabilities | | 3,495,878 |
| Net Assets | | $31,244,507 |
| Net Assets consist of: | | |
| Paid in capital | | $27,098,828 |
| Total distributable earnings (loss) | | 4,145,679 |
| Net Assets | | $31,244,507 |
| Net Asset Value and Maximum Offering Price | | |
| Class A: | | |
| Net Asset Value and redemption price per share ($12,053,849 ÷ 818,839 shares) | | $14.72 |
| Maximum offering price per share (100/94.25 of $14.72) | | $15.62 |
| Class M: | | |
| Net Asset Value and redemption price per share ($5,372,687 ÷ 380,636 shares) | | $14.12 |
| Maximum offering price per share (100/96.50 of $14.12) | | $14.63 |
| Class C: | | |
| Net Asset Value and offering price per share ($5,841,837 ÷ 455,181 shares)(a) | | $12.83 |
| Class I: | | |
| Net Asset Value, offering price and redemption price per share ($7,976,134 ÷ 519,394 shares) | | $15.36 |
(a) Redemption price per share is equal to net asset value less any applicable contingent deferred sales charge.
See accompanying notes which are an integral part of the financial statements.
Statement of Operations
| | | Six months ended January 31, 2019 (Unaudited) |
| Investment Income | | |
| Dividends | | $143,692 |
| Income from Fidelity Central Funds (including $2,454 from security lending) | | 8,303 |
| Total income | | 151,995 |
| Expenses | | |
| Management fee | $71,992 | |
| Transfer agent fees | 36,742 | |
| Distribution and service plan fees | 52,695 | |
| Accounting and security lending fees | 5,316 | |
| Custodian fees and expenses | 7,432 | |
| Independent trustees' fees and expenses | 77 | |
| Registration fees | 47,583 | |
| Audit | 22,438 | |
| Legal | 29 | |
| Miscellaneous | 134 | |
| Total expenses before reductions | 244,438 | |
| Expense reductions | (39,292) | |
| Total expenses after reductions | | 205,146 |
| Net investment income (loss) | | (53,151) |
| Realized and Unrealized Gain (Loss) | | |
| Net realized gain (loss) on: | | |
| Investment securities: | | |
| Unaffiliated issuers | (719,470) | |
| Fidelity Central Funds | (93) | |
| Foreign currency transactions | (226) | |
| Total net realized gain (loss) | | (719,789) |
| Change in net unrealized appreciation (depreciation) on: | | |
| Investment securities: | | |
| Unaffiliated issuers | 547,899 | |
| Assets and liabilities in foreign currencies | (161) | |
| Total change in net unrealized appreciation (depreciation) | | 547,738 |
| Net gain (loss) | | (172,051) |
| Net increase (decrease) in net assets resulting from operations | | $(225,202) |
See accompanying notes which are an integral part of the financial statements.
Statement of Changes in Net Assets
| | Six months ended January 31, 2019 (Unaudited) | Year ended July 31, 2018 |
| Increase (Decrease) in Net Assets | | |
| Operations | | |
| Net investment income (loss) | $(53,151) | $5,520 |
| Net realized gain (loss) | (719,789) | 1,373,163 |
| Change in net unrealized appreciation (depreciation) | 547,738 | 757,729 |
| Net increase (decrease) in net assets resulting from operations | (225,202) | 2,136,412 |
| Distributions to shareholders | (912,371) | – |
| Distributions to shareholders from net investment income | – | (27,072) |
| Distributions to shareholders from net realized gain | – | (595,291) |
| Total distributions | (912,371) | (622,363) |
| Share transactions - net increase (decrease) | 11,122,669 | 1,462,219 |
| Redemption fees | – | 967 |
| Total increase (decrease) in net assets | 9,985,096 | 2,977,235 |
| Net Assets | | |
| Beginning of period | 21,259,411 | 18,282,176 |
| End of period | $31,244,507 | $21,259,411 |
See accompanying notes which are an integral part of the financial statements.
Financial Highlights
Fidelity Advisor Communications Equipment Fund Class A
| | Six months ended (Unaudited) January 31, | Years endedJuly 31, | | | | |
| | 2019 | 2018 | 2017 | 2016 | 2015 | 2014 |
| Selected Per–Share Data | | | | | | |
| Net asset value, beginning of period | $15.17 | $13.69 | $12.09 | $12.57 | $11.94 | $10.22 |
| Income from Investment Operations | | | | | | |
| Net investment income (loss)A | (.02) | .03 | .07 | .09 | .02 | .04B |
| Net realized and unrealized gain (loss) | .01C | 2.08 | 1.76 | (.20) | .64 | 1.68 |
| Total from investment operations | (.01) | 2.11 | 1.83 | (.11) | .66 | 1.72 |
| Distributions from net investment income | – | (.04)D | (.05) | – | (.03) | – |
| Distributions from net realized gain | (.44) | (.59)D | (.18) | (.37) | – | – |
| Total distributions | (.44) | (.63) | (.23) | (.37) | (.03) | – |
| Redemption fees added to paid in capitalA | – | –E | –E | –E | –E | –E |
| Net asset value, end of period | $14.72 | $15.17 | $13.69 | $12.09 | $12.57 | $11.94 |
| Total ReturnF,G,H | .02% | 15.86% | 15.24% | (.53)% | 5.54% | 16.83% |
| Ratios to Average Net AssetsI,J | | | | | | |
| Expenses before reductions | 1.69%K | 1.76% | 1.78% | 2.10% | 1.90% | 1.96% |
| Expenses net of fee waivers, if any | 1.40%K | 1.40% | 1.40% | 1.40% | 1.40% | 1.40% |
| Expenses net of all reductions | 1.39%K | 1.39% | 1.39% | 1.40% | 1.39% | 1.39% |
| Net investment income (loss) | (.25)%K | .21% | .56% | .81% | .16% | .40%B |
| Supplemental Data | | | | | | |
| Net assets, end of period (000 omitted) | $12,054 | $8,860 | $6,247 | $4,536 | $4,806 | $4,725 |
| Portfolio turnover rateL | 103%K | 60% | 71% | 29% | 60% | 160% |
A Calculated based on average shares outstanding during the period.
B Net investment income per share reflects a large, non-recurring dividend which amounted to $.03 per share. Excluding this non-recurring dividend, the ratio of net investment income (loss) to average net assets would have been .14%.
C The amount shown for a share outstanding does not correspond with the aggregate net gain (loss) on investments for the period due to the timing of sales and repurchases of shares in relation to fluctuating market values of the investments of the Fund.
D The amounts shown reflect certain reclassifications related to book to tax differences that were made in the year shown.
E Amount represents less than $.005 per share.
F Total returns for periods of less than one year are not annualized.
G Total returns would have been lower if certain expenses had not been reduced during the applicable periods shown.
H Total returns do not include the effect of the sales charges.
I Fees and expenses of any underlying Fidelity Central Funds are not included in the Fund's expense ratio. The Fund indirectly bears its proportionate share of the expenses of any underlying Fidelity Central Funds.
J Expense ratios reflect operating expenses of the class. Expenses before reductions do not reflect amounts reimbursed by the investment adviser or reductions from brokerage service arrangements or reductions from other expense offset arrangements and do not represent the amount paid by the class during periods when reimbursements or reductions occur. Expenses net of fee waivers reflect expenses after reimbursement by the investment adviser but prior to reductions from brokerage service arrangements or other expense offset arrangements. Expenses net of all reductions represent the net expenses paid by the class.
K Annualized
L Amount does not include the portfolio activity of any underlying Fidelity Central Funds.
See accompanying notes which are an integral part of the financial statements.
Fidelity Advisor Communications Equipment Fund Class M
| | Six months ended (Unaudited) January 31, | Years endedJuly 31, | | | | |
| | 2019 | 2018 | 2017 | 2016 | 2015 | 2014 |
| Selected Per–Share Data | | | | | | |
| Net asset value, beginning of period | $14.59 | $13.18 | $11.65 | $12.15 | $11.55 | $9.91 |
| Income from Investment Operations | | | | | | |
| Net investment income (loss)A | (.04) | – | .04 | .06 | (.01) | .02B |
| Net realized and unrealized gain (loss) | .01C | 2.00 | 1.69 | (.20) | .62 | 1.62 |
| Total from investment operations | (.03) | 2.00 | 1.73 | (.14) | .61 | 1.64 |
| Distributions from net investment income | – | (.02)D | (.02) | – | (.01) | – |
| Distributions from net realized gain | (.44) | (.57)D | (.18) | (.36) | – | – |
| Total distributions | (.44) | (.59) | (.20) | (.36) | (.01) | – |
| Redemption fees added to paid in capitalA | – | –E | –E | –E | –E | –E |
| Net asset value, end of period | $14.12 | $14.59 | $13.18 | $11.65 | $12.15 | $11.55 |
| Total ReturnF,G,H | (.11)% | 15.69% | 14.94% | (.83)% | 5.24% | 16.55% |
| Ratios to Average Net AssetsI,J | | | | | | |
| Expenses before reductions | 2.01%K | 2.11% | 2.11% | 2.41% | 2.19% | 2.25% |
| Expenses net of fee waivers, if any | 1.65%K | 1.65% | 1.65% | 1.65% | 1.65% | 1.65% |
| Expenses net of all reductions | 1.65%K | 1.64% | 1.64% | 1.65% | 1.64% | 1.64% |
| Net investment income (loss) | (.50)%K | (.04)% | .31% | .56% | (.09)% | .14%B |
| Supplemental Data | | | | | | |
| Net assets, end of period (000 omitted) | $5,373 | $4,943 | $4,236 | $3,674 | $4,029 | $3,995 |
| Portfolio turnover rateL | 103%K | 60% | 71% | 29% | 60% | 160% |
A Calculated based on average shares outstanding during the period.
B Net investment income per share reflects a large, non-recurring dividend which amounted to $.03 per share. Excluding this non-recurring dividend, the ratio of net investment income (loss) to average net assets would have been (.11) %.
C The amount shown for a share outstanding does not correspond with the aggregate net gain (loss) on investments for the period due to the timing of sales and repurchases of shares in relation to fluctuating market values of the investments of the Fund.
D The amounts shown reflect certain reclassifications related to book to tax differences that were made in the year shown.
E Amount represents less than $.005 per share.
F Total returns for periods of less than one year are not annualized.
G Total returns would have been lower if certain expenses had not been reduced during the applicable periods shown.
H Total returns do not include the effect of the sales charges.
I Fees and expenses of any underlying Fidelity Central Funds are not included in the Fund's expense ratio. The Fund indirectly bears its proportionate share of the expenses of any underlying Fidelity Central Funds.
J Expense ratios reflect operating expenses of the class. Expenses before reductions do not reflect amounts reimbursed by the investment adviser or reductions from brokerage service arrangements or reductions from other expense offset arrangements and do not represent the amount paid by the class during periods when reimbursements or reductions occur. Expenses net of fee waivers reflect expenses after reimbursement by the investment adviser but prior to reductions from brokerage service arrangements or other expense offset arrangements. Expenses net of all reductions represent the net expenses paid by the class.
K Annualized
L Amount does not include the portfolio activity of any underlying Fidelity Central Funds.
See accompanying notes which are an integral part of the financial statements.
Fidelity Advisor Communications Equipment Fund Class C
| | Six months ended (Unaudited) January 31, | Years endedJuly 31, | | | | |
| | 2019 | 2018 | 2017 | 2016 | 2015 | 2014 |
| Selected Per–Share Data | | | | | | |
| Net asset value, beginning of period | $13.34 | $12.10 | $10.74 | $11.27 | $10.76 | $9.28 |
| Income from Investment Operations | | | | | | |
| Net investment income (loss)A | (.07) | (.07) | (.02) | .01 | (.07) | (.04)B |
| Net realized and unrealized gain (loss) | –C | 1.84 | 1.56 | (.19) | .58 | 1.52 |
| Total from investment operations | (.07) | 1.77 | 1.54 | (.18) | .51 | 1.48 |
| Distributions from net investment income | – | – | – | – | – | – |
| Distributions from net realized gain | (.44) | (.53) | (.18) | (.35) | – | – |
| Total distributions | (.44) | (.53) | (.18) | (.35) | – | – |
| Redemption fees added to paid in capitalA | – | –C | –C | –C | –C | –C |
| Net asset value, end of period | $12.83 | $13.34 | $12.10 | $10.74 | $11.27 | $10.76 |
| Total ReturnD,E,F | (.43)% | 15.06% | 14.39% | (1.29)% | 4.74% | 15.95% |
| Ratios to Average Net AssetsG,H | | | | | | |
| Expenses before reductions | 2.47%I | 2.54% | 2.55% | 2.86% | 2.65% | 2.73% |
| Expenses net of fee waivers, if any | 2.15%I | 2.15% | 2.15% | 2.15% | 2.15% | 2.15% |
| Expenses net of all reductions | 2.15%I | 2.14% | 2.14% | 2.15% | 2.14% | 2.14% |
| Net investment income (loss) | (1.00)%I | (.54)% | (.19)% | .06% | (.59)% | (.35)%B |
| Supplemental Data | | | | | | |
| Net assets, end of period (000 omitted) | $5,842 | $4,684 | $3,066 | $2,479 | $2,966 | $2,744 |
| Portfolio turnover rateJ | 103%I | 60% | 71% | 29% | 60% | 160% |
A Calculated based on average shares outstanding during the period.
B Net investment income per share reflects a large, non-recurring dividend which amounted to $.03 per share. Excluding this non-recurring dividend, the ratio of net investment income (loss) to average net assets would have been (.61) %.
C Amount represents less than $.005 per share.
D Total returns for periods of less than one year are not annualized.
E Total returns would have been lower if certain expenses had not been reduced during the applicable periods shown.
F Total returns do not include the effect of the contingent deferred sales charge.
G Fees and expenses of any underlying Fidelity Central Funds are not included in the Fund's expense ratio. The Fund indirectly bears its proportionate share of the expenses of any underlying Fidelity Central Funds.
H Expense ratios reflect operating expenses of the class. Expenses before reductions do not reflect amounts reimbursed by the investment adviser or reductions from brokerage service arrangements or reductions from other expense offset arrangements and do not represent the amount paid by the class during periods when reimbursements or reductions occur. Expenses net of fee waivers reflect expenses after reimbursement by the investment adviser but prior to reductions from brokerage service arrangements or other expense offset arrangements. Expenses net of all reductions represent the net expenses paid by the class.
I Annualized
J Amount does not include the portfolio activity of any underlying Fidelity Central Funds.
See accompanying notes which are an integral part of the financial statements.
Fidelity Advisor Communications Equipment Fund Class I
| | Six months ended (Unaudited) January 31, | Years endedJuly 31, | | | | |
| | 2019 | 2018 | 2017 | 2016 | 2015 | 2014 |
| Selected Per–Share Data | | | | | | |
| Net asset value, beginning of period | $15.79 | $14.22 | $12.54 | $13.01 | $12.35 | $10.55 |
| Income from Investment Operations | | | | | | |
| Net investment income (loss)A | –B | .07 | .11 | .12 | .05 | .08C |
| Net realized and unrealized gain (loss) | .01D | 2.16 | 1.83 | (.20) | .67 | 1.72 |
| Total from investment operations | .01 | 2.23 | 1.94 | (.08) | .72 | 1.80 |
| Distributions from net investment income | – | (.05)E | (.08) | – | (.06) | – |
| Distributions from net realized gain | (.44) | (.61)E | (.18) | (.39) | – | – |
| Total distributions | (.44) | (.66) | (.26) | (.39) | (.06) | – |
| Redemption fees added to paid in capitalA | – | –B | –B | –B | –B | –B |
| Net asset value, end of period | $15.36 | $15.79 | $14.22 | $12.54 | $13.01 | $12.35 |
| Total ReturnF,G | .15% | 16.21% | 15.55% | (.33)% | 5.83% | 17.06% |
| Ratios to Average Net AssetsH,I | | | | | | |
| Expenses before reductions | 1.36%J | 1.42% | 1.46% | 1.69% | 1.57% | 1.45% |
| Expenses net of fee waivers, if any | 1.15%J | 1.15% | 1.15% | 1.15% | 1.15% | 1.15% |
| Expenses net of all reductions | 1.15%J | 1.14% | 1.14% | 1.14% | 1.14% | 1.14% |
| Net investment income (loss) | (.01)%J | .47% | .81% | 1.06% | .41% | .65%C |
| Supplemental Data | | | | | | |
| Net assets, end of period (000 omitted) | $7,976 | $2,773 | $4,733 | $1,209 | $1,024 | $2,592 |
| Portfolio turnover rateK | 103%J | 60% | 71% | 29% | 60% | 160% |
A Calculated based on average shares outstanding during the period.
B Amount represents less than $.005 per share.
C Net investment income per share reflects a large, non-recurring dividend which amounted to $.03 per share. Excluding this non-recurring dividend, the ratio of net investment income (loss) to average net assets would have been .39%.
D The amount shown for a share outstanding does not correspond with the aggregate net gain (loss) on investments for the period due to the timing of sales and repurchases of shares in relation to fluctuating market values of the investments of the Fund.
E The amounts shown reflect certain reclassifications related to book to tax differences that were made in the year shown.
F Total returns for periods of less than one year are not annualized.
G Total returns would have been lower if certain expenses had not been reduced during the applicable periods shown.
H Fees and expenses of any underlying Fidelity Central Funds are not included in the Fund's expense ratio. The Fund indirectly bears its proportionate share of the expenses of any underlying Fidelity Central Funds.
I Expense ratios reflect operating expenses of the class. Expenses before reductions do not reflect amounts reimbursed by the investment adviser or reductions from brokerage service arrangements or reductions from other expense offset arrangements and do not represent the amount paid by the class during periods when reimbursements or reductions occur. Expenses net of fee waivers reflect expenses after reimbursement by the investment adviser but prior to reductions from brokerage service arrangements or other expense offset arrangements. Expenses net of all reductions represent the net expenses paid by the class.
J Annualized
K Amount does not include the portfolio activity of any underlying Fidelity Central Funds.
See accompanying notes which are an integral part of the financial statements.
Fidelity Advisor® Consumer Discretionary Fund
Investment Summary (Unaudited)
Top Ten Stocks as of January 31, 2019
| �� | % of fund's net assets |
| Amazon.com, Inc. | 23.9 |
| Home Depot, Inc. | 7.9 |
| McDonald's Corp. | 5.0 |
| Lowe's Companies, Inc. | 3.4 |
| NIKE, Inc. Class B | 3.3 |
| The Booking Holdings, Inc. | 3.1 |
| TJX Companies, Inc. | 2.5 |
| Dollar Tree, Inc. | 2.2 |
| Royal Caribbean Cruises Ltd. | 2.0 |
| Marriott International, Inc. Class A | 1.9 |
| | 55.2 |
Top Industries (% of fund's net assets)
| As of January 31, 2019 |
| | Internet & Direct Marketing Retail | 28.3% |
| | Hotels, Restaurants & Leisure | 24.1% |
| | Specialty Retail | 22.5% |
| | Textiles, Apparel & Luxury Goods | 7.5% |
| | Multiline Retail | 4.4% |
| | All Others* | 13.2% |
* Includes short-term investments and net other assets (liabilities).
Fidelity Advisor® Consumer Discretionary Fund
Schedule of Investments January 31, 2019 (Unaudited)
Showing Percentage of Net Assets
| Common Stocks - 99.9% | | | |
| | | Shares | Value |
| Air Freight & Logistics - 0.1% | | | |
| Air Freight & Logistics - 0.1% | | | |
| XPO Logistics, Inc. (a) | | 4,000 | $243,120 |
| Auto Components - 0.6% | | | |
| Auto Parts & Equipment - 0.6% | | | |
| Aptiv PLC | | 16,500 | 1,305,645 |
| Lear Corp. | | 5,700 | 877,401 |
| | | | 2,183,046 |
| Automobiles - 2.2% | | | |
| Automobile Manufacturers - 2.2% | | | |
| Ferrari NV | | 6,100 | 770,430 |
| General Motors Co. | | 26,000 | 1,014,520 |
| Tesla, Inc. (a) | | 18,016 | 5,531,272 |
| Thor Industries, Inc. | | 16,700 | 1,087,504 |
| | | | 8,403,726 |
| Beverages - 0.5% | | | |
| Distillers & Vintners - 0.4% | | | |
| Constellation Brands, Inc. Class A (sub. vtg.) | | 7,800 | 1,354,548 |
| Soft Drinks - 0.1% | | | |
| Monster Beverage Corp. (a) | | 9,578 | 548,245 |
|
| TOTAL BEVERAGES | | | 1,902,793 |
|
| Chemicals - 0.1% | | | |
| Specialty Chemicals - 0.1% | | | |
| Sherwin-Williams Co. | | 1,200 | 505,824 |
| Commercial Services & Supplies - 0.2% | | | |
| Diversified Support Services - 0.2% | | | |
| Copart, Inc. (a) | | 14,266 | 722,288 |
| Distributors - 0.7% | | | |
| Distributors - 0.7% | | | |
| LKQ Corp. (a) | | 76,838 | 2,014,692 |
| Pool Corp. | | 4,700 | 704,577 |
| | | | 2,719,269 |
| Diversified Consumer Services - 0.9% | | | |
| Education Services - 0.5% | | | |
| Grand Canyon Education, Inc. (a) | | 15,503 | 1,440,849 |
| New Oriental Education & Technology Group, Inc. sponsored ADR (a) | | 7,700 | 593,208 |
| | | | 2,034,057 |
| Specialized Consumer Services - 0.4% | | | |
| Service Corp. International | | 9,500 | 407,740 |
| ServiceMaster Global Holdings, Inc. (a) | | 453 | 17,662 |
| Weight Watchers International, Inc. (a) | | 29,550 | 945,600 |
| | | | 1,371,002 |
|
| TOTAL DIVERSIFIED CONSUMER SERVICES | | | 3,405,059 |
|
| Entertainment - 0.7% | | | |
| Interactive Home Entertainment - 0.1% | | | |
| Activision Blizzard, Inc. | | 6,219 | 293,786 |
| Movies & Entertainment - 0.6% | | | |
| Cinemark Holdings, Inc. | | 16,000 | 654,720 |
| Live Nation Entertainment, Inc. (a) | | 7,400 | 395,974 |
| Netflix, Inc. (a) | | 2,152 | 730,604 |
| World Wrestling Entertainment, Inc. Class A | | 4,800 | 395,232 |
| | | | 2,176,530 |
|
| TOTAL ENTERTAINMENT | | | 2,470,316 |
|
| Food & Staples Retailing - 1.5% | | | |
| Food Distributors - 0.7% | | | |
| Performance Food Group Co. (a) | | 78,200 | 2,671,312 |
| Food Retail - 0.1% | | | |
| Kroger Co. | | 13,300 | 376,789 |
| Hypermarkets & Super Centers - 0.7% | | | |
| BJ's Wholesale Club Holdings, Inc. | | 60,722 | 1,597,596 |
| Costco Wholesale Corp. | | 1,300 | 279,019 |
| Walmart, Inc. | | 10,000 | 958,300 |
| | | | 2,834,915 |
|
| TOTAL FOOD & STAPLES RETAILING | | | 5,883,016 |
|
| Health Care Providers & Services - 0.1% | | | |
| Health Care Services - 0.1% | | | |
| National Vision Holdings, Inc. (a) | | 6,400 | 203,264 |
| Hotels, Restaurants & Leisure - 24.1% | | | |
| Casinos & Gaming - 2.9% | | | |
| Boyd Gaming Corp. | | 22,600 | 617,432 |
| Caesars Entertainment Corp. (a)(b) | | 107,012 | 978,090 |
| Churchill Downs, Inc. | | 6,231 | 573,127 |
| Eldorado Resorts, Inc. (a) | | 49,354 | 2,300,883 |
| Las Vegas Sands Corp. | | 70,880 | 4,136,557 |
| MGM Mirage, Inc. | | 30,000 | 883,200 |
| Penn National Gaming, Inc. (a) | | 51,449 | 1,247,124 |
| PlayAGS, Inc. (a) | | 10,400 | 260,624 |
| | | | 10,997,037 |
| Hotels, Resorts & Cruise Lines - 8.3% | | | |
| Bluegreen Vacations Corp. | | 24,900 | 333,660 |
| Carnival Corp. | | 66,900 | 3,852,102 |
| Hilton Grand Vacations, Inc. (a) | | 49,500 | 1,501,830 |
| Hilton Worldwide Holdings, Inc. | | 74,200 | 5,526,416 |
| Marriott International, Inc. Class A | | 62,840 | 7,197,065 |
| Marriott Vacations Worldwide Corp. | | 24,300 | 2,151,522 |
| Royal Caribbean Cruises Ltd. | | 63,900 | 7,671,195 |
| Wyndham Destinations, Inc. | | 42,620 | 1,796,007 |
| Wyndham Hotels & Resorts, Inc. | | 31,880 | 1,564,989 |
| | | | 31,594,786 |
| Leisure Facilities - 1.4% | | | |
| Cedar Fair LP (depositary unit) | | 9,500 | 525,350 |
| Drive Shack, Inc. (a) | | 100,944 | 424,974 |
| Planet Fitness, Inc. (a) | | 38,900 | 2,253,088 |
| Vail Resorts, Inc. | | 12,040 | 2,266,650 |
| | | | 5,470,062 |
| Restaurants - 11.5% | | | |
| ARAMARK Holdings Corp. | | 68,700 | 2,263,665 |
| Chipotle Mexican Grill, Inc. (a) | | 3,500 | 1,853,635 |
| Darden Restaurants, Inc. | | 4,000 | 419,720 |
| Del Frisco's Restaurant Group, Inc. (a) | | 26,060 | 206,395 |
| Dine Brands Global, Inc. | | 4,100 | 312,707 |
| Domino's Pizza, Inc. | | 10,400 | 2,950,792 |
| Dunkin' Brands Group, Inc. | | 19,749 | 1,350,634 |
| McDonald's Corp. | | 105,800 | 18,914,924 |
| Restaurant Brands International, Inc. | | 30,000 | 1,880,437 |
| Shake Shack, Inc. Class A (a) | | 3,900 | 186,264 |
| Starbucks Corp. | | 99,925 | 6,808,890 |
| Texas Roadhouse, Inc. Class A | | 11,876 | 722,536 |
| U.S. Foods Holding Corp. (a) | | 59,800 | 2,016,456 |
| Wendy's Co. | | 42,689 | 739,373 |
| Wingstop, Inc. | | 8,667 | 568,989 |
| Yum! Brands, Inc. | | 26,000 | 2,443,480 |
| | | | 43,638,897 |
|
| TOTAL HOTELS, RESTAURANTS & LEISURE | | | 91,700,782 |
|
| Household Durables - 3.2% | | | |
| Home Furnishings - 0.4% | | | |
| Mohawk Industries, Inc. (a) | | 10,300 | 1,326,537 |
| Homebuilding - 2.7% | | | |
| Cavco Industries, Inc. (a) | | 4,987 | 829,288 |
| D.R. Horton, Inc. | | 81,200 | 3,122,140 |
| Lennar Corp. Class A | | 60,100 | 2,849,942 |
| NVR, Inc. (a) | | 980 | 2,606,800 |
| Taylor Morrison Home Corp. (a) | | 13,800 | 260,820 |
| TRI Pointe Homes, Inc. (a) | | 50,600 | 680,570 |
| | | | 10,349,560 |
| Household Appliances - 0.1% | | | |
| Techtronic Industries Co. Ltd. | | 76,500 | 446,572 |
|
| TOTAL HOUSEHOLD DURABLES | | | 12,122,669 |
|
| Household Products - 0.0% | | | |
| Household Products - 0.0% | | | |
| Energizer Holdings, Inc. | | 3,900 | 184,860 |
| Interactive Media & Services - 0.5% | | | |
| Interactive Media & Services - 0.5% | | | |
| Alphabet, Inc. Class A (a) | | 1,343 | 1,512,070 |
| Momo, Inc. ADR (a) | | 7,000 | 213,010 |
| | | | 1,725,080 |
| Internet & Direct Marketing Retail - 28.3% | | | |
| Internet & Direct Marketing Retail - 28.3% | | | |
| Amazon.com, Inc. (a) | | 52,903 | 90,925,972 |
| eBay, Inc. | | 57,189 | 1,924,410 |
| GrubHub, Inc. (a) | | 4,400 | 353,760 |
| Liberty Interactive Corp. QVC Group Series A (a) | | 89,572 | 1,948,191 |
| The Booking Holdings, Inc. (a) | | 6,353 | 11,643,842 |
| Wayfair LLC Class A (a) | | 3,431 | 375,557 |
| Zozo, Inc. | | 11,300 | 227,504 |
| | | | 107,399,236 |
| IT Services - 0.5% | | | |
| Data Processing & Outsourced Services - 0.5% | | | |
| Adyen BV (c) | | 410 | 303,957 |
| Global Payments, Inc. | | 4,200 | 471,576 |
| PayPal Holdings, Inc. (a) | | 10,644 | 944,761 |
| | | | 1,720,294 |
| Leisure Products - 0.3% | | | |
| Leisure Products - 0.3% | | | |
| Mattel, Inc. (a)(b) | | 102,747 | 1,216,524 |
| Media - 0.2% | | | |
| Cable & Satellite - 0.2% | | | |
| Naspers Ltd. Class N | | 3,800 | 870,945 |
| Multiline Retail - 4.4% | | | |
| Department Stores - 0.0% | | | |
| Future Retail Ltd. (a) | | 41,155 | 249,215 |
| General Merchandise Stores - 4.4% | | | |
| B&M European Value Retail S.A. | | 70,754 | 300,861 |
| Dollar General Corp. | | 58,000 | 6,694,940 |
| Dollar Tree, Inc. (a) | | 88,408 | 8,560,547 |
| Ollie's Bargain Outlet Holdings, Inc. (a) | | 13,153 | 1,028,170 |
| | | | 16,584,518 |
|
| TOTAL MULTILINE RETAIL | | | 16,833,733 |
|
| Personal Products - 0.0% | | | |
| Personal Products - 0.0% | | | |
| Estee Lauder Companies, Inc. Class A | | 1,400 | 190,988 |
| Real Estate Management & Development - 0.1% | | | |
| Real Estate Services - 0.1% | | | |
| Redfin Corp. (a)(b) | | 13,935 | 249,297 |
| Software - 0.3% | | | |
| Application Software - 0.3% | | | |
| 2U, Inc. (a) | | 14,200 | 807,270 |
| Adobe, Inc. (a) | | 1,085 | 268,885 |
| | | | 1,076,155 |
| Specialty Retail - 22.5% | | | |
| Apparel Retail - 6.4% | | | |
| Burlington Stores, Inc. (a) | | 41,500 | 7,125,965 |
| Ross Stores, Inc. | | 75,198 | 6,927,240 |
| The Children's Place Retail Stores, Inc. | | 10,137 | 980,856 |
| TJX Companies, Inc. | | 189,779 | 9,437,710 |
| | | | 24,471,771 |
| Automotive Retail - 2.8% | | | |
| AutoZone, Inc. (a) | | 4,500 | 3,813,030 |
| Monro, Inc. | | 13,238 | 948,635 |
| O'Reilly Automotive, Inc. (a) | | 16,735 | 5,767,885 |
| | | | 10,529,550 |
| Computer & Electronics Retail - 0.5% | | | |
| Best Buy Co., Inc. | | 34,000 | 2,014,160 |
| Home Improvement Retail - 11.5% | | | |
| Floor & Decor Holdings, Inc. Class A (a)(b) | | 22,911 | 785,618 |
| Home Depot, Inc. | | 164,220 | 30,139,297 |
| Lowe's Companies, Inc. | | 132,900 | 12,779,664 |
| | | | 43,704,579 |
| Specialty Stores - 1.3% | | | |
| Five Below, Inc. (a) | | 6,766 | 837,157 |
| Tiffany & Co., Inc. | | 13,600 | 1,206,728 |
| Ulta Beauty, Inc. (a) | | 9,676 | 2,824,618 |
| | | | 4,868,503 |
|
| TOTAL SPECIALTY RETAIL | | | 85,588,563 |
|
| Technology Hardware, Storage & Peripherals - 0.2% | | | |
| Technology Hardware, Storage & Peripherals - 0.2% | | | |
| Apple, Inc. | | 4,524 | 752,975 |
| Textiles, Apparel & Luxury Goods - 7.5% | | | |
| Apparel, Accessories & Luxury Goods - 4.1% | | | |
| adidas AG | | 4,028 | 957,590 |
| Canada Goose Holdings, Inc. (a) | | 6,400 | 329,218 |
| Capri Holdings Ltd. (a) | | 25,100 | 1,066,248 |
| Carter's, Inc. | | 11,500 | 953,350 |
| G-III Apparel Group Ltd. (a) | | 17,602 | 613,782 |
| Kering SA | | 1,480 | 741,129 |
| lululemon athletica, Inc. (a) | | 2,700 | 399,087 |
| LVMH Moet Hennessy - Louis Vuitton SA | | 3,399 | 1,090,401 |
| PVH Corp. | | 44,999 | 4,909,841 |
| Ralph Lauren Corp. | | 2,500 | 290,350 |
| Tapestry, Inc. | | 45,508 | 1,761,615 |
| VF Corp. | | 30,800 | 2,592,436 |
| | | | 15,705,047 |
| Footwear - 3.4% | | | |
| NIKE, Inc. Class B | | 151,234 | 12,383,040 |
| Wolverine World Wide, Inc. | | 9,300 | 319,083 |
| | | | 12,702,123 |
|
| TOTAL TEXTILES, APPAREL & LUXURY GOODS | | | 28,407,170 |
|
| Tobacco - 0.2% | | | |
| Tobacco - 0.2% | | | |
| Philip Morris International, Inc. | | 8,200 | 629,104 |
| TOTAL COMMON STOCKS | | | |
| (Cost $291,436,571) | | | 379,310,096 |
|
| Money Market Funds - 0.8% | | | |
| Fidelity Cash Central Fund, 2.43% (d) | | 158 | 158 |
| Fidelity Securities Lending Cash Central Fund 2.43% (d)(e) | | 3,189,807 | 3,190,126 |
| TOTAL MONEY MARKET FUNDS | | | |
| (Cost $3,190,284) | | | 3,190,284 |
| TOTAL INVESTMENT IN SECURITIES - 100.7% | | | |
| (Cost $294,626,855) | | | 382,500,380 |
| NET OTHER ASSETS (LIABILITIES) - (0.7)% | | | (2,717,563) |
| NET ASSETS - 100% | | | $379,782,817 |
Legend
(a) Non-income producing
(b) Security or a portion of the security is on loan at period end.
(c) Security exempt from registration under Rule 144A of the Securities Act of 1933. These securities may be resold in transactions exempt from registration, normally to qualified institutional buyers. At the end of the period, the value of these securities amounted to $303,957 or 0.1% of net assets.
(d) Affiliated fund that is generally available only to investment companies and other accounts managed by Fidelity Investments. The rate quoted is the annualized seven-day yield of the fund at period end. A complete unaudited listing of the fund's holdings as of its most recent quarter end is available upon request. In addition, each Fidelity Central Fund's financial statements are available on the SEC's website or upon request.
(e) Investment made with cash collateral received from securities on loan.
Affiliated Central Funds
Information regarding fiscal year to date income earned by the Fund from investments in Fidelity Central Funds is as follows:
| Fund | Income earned |
| Fidelity Cash Central Fund | $26,203 |
| Fidelity Securities Lending Cash Central Fund | 10,108 |
| Total | $36,311 |
Amounts in the income column in the above table include any capital gain distributions from underlying funds, which are presented in the corresponding line-item in the Statement of Operations, if applicable.
Investment Valuation
The following is a summary of the inputs used, as of January 31, 2019, involving the Fund's assets and liabilities carried at fair value. The inputs or methodology used for valuing securities may not be an indication of the risk associated with investing in those securities. For more information on valuation inputs, and their aggregation into the levels used below, please refer to the Investment Valuation section in the accompanying Notes to Financial Statements.
| | Valuation Inputs at Reporting Date: |
| Description | Total | Level 1 | Level 2 | Level 3 |
| Investments in Securities: | | | | |
| Common Stocks | $379,310,096 | $377,773,123 | $1,536,973 | $-- |
| Money Market Funds | 3,190,284 | 3,190,284 | -- | -- |
| Total Investments in Securities: | $382,500,380 | $380,963,407 | $1,536,973 | $-- |
See accompanying notes which are an integral part of the financial statements.
Fidelity Advisor® Consumer Discretionary Fund
Financial Statements
Statement of Assets and Liabilities
| | | January 31, 2019 (Unaudited) |
| Assets | | |
Investment in securities, at value (including securities loaned of $3,109,805) — See accompanying schedule:
Unaffiliated issuers (cost $291,436,571) | $379,310,096 | |
| Fidelity Central Funds (cost $3,190,284) | 3,190,284 | |
| Total Investment in Securities (cost $294,626,855) | | $382,500,380 |
| Cash | | 496 |
| Receivable for investments sold | | 3,372,073 |
| Receivable for fund shares sold | | 613,641 |
| Dividends receivable | | 77,904 |
| Distributions receivable from Fidelity Central Funds | | 3,740 |
| Prepaid expenses | | 3,015 |
| Other receivables | | 3,596 |
| Total assets | | 386,574,845 |
| Liabilities | | |
| Payable for investments purchased | $722,725 | |
| Payable for fund shares redeemed | 1,043,883 | |
| Accrued management fee | 168,306 | |
| Distribution and service plan fees payable | 98,972 | |
| Notes payable to affiliates | 1,464,000 | |
| Other affiliated payables | 74,448 | |
| Other payables and accrued expenses | 31,274 | |
| Collateral on securities loaned | 3,188,420 | |
| Total liabilities | | 6,792,028 |
| Net Assets | | $379,782,817 |
| Net Assets consist of: | | |
| Paid in capital | | $283,058,414 |
| Total distributable earnings (loss) | | 96,724,403 |
| Net Assets | | $379,782,817 |
| Net Asset Value and Maximum Offering Price | | |
| Class A: | | |
| Net Asset Value and redemption price per share ($140,611,501 ÷ 5,181,762 shares) | | $27.14 |
| Maximum offering price per share (100/94.25 of $27.14) | | $28.80 |
| Class M: | | |
| Net Asset Value and redemption price per share ($31,044,829 ÷ 1,226,984 shares) | | $25.30 |
| Maximum offering price per share (100/96.50 of $25.30) | | $26.22 |
| Class C: | | |
| Net Asset Value and offering price per share ($73,244,466 ÷ 3,346,680 shares)(a) | | $21.89 |
| Class I: | | |
| Net Asset Value, offering price and redemption price per share ($132,650,539 ÷ 4,525,326 shares) | | $29.31 |
| Class Z: | | |
| Net Asset Value, offering price and redemption price per share ($2,231,482 ÷ 76,090 shares) | | $29.33 |
(a) Redemption price per share is equal to net asset value less any applicable contingent deferred sales charge.
See accompanying notes which are an integral part of the financial statements.
Statement of Operations
| | | Six months ended January 31, 2019 (Unaudited) |
| Investment Income | | |
| Dividends | | $1,923,412 |
| Income from Fidelity Central Funds (including $10,108 from security lending) | | 36,311 |
| Total income | | 1,959,723 |
| Expenses | | |
| Management fee | $1,096,179 | |
| Transfer agent fees | 409,778 | |
| Distribution and service plan fees | 617,935 | |
| Accounting and security lending fees | 79,404 | |
| Custodian fees and expenses | 7,661 | |
| Independent trustees' fees and expenses | 1,267 | |
| Registration fees | 62,715 | |
| Audit | 22,118 | |
| Legal | 2,725 | |
| Interest | 1,745 | |
| Miscellaneous | 1,345 | |
| Total expenses before reductions | 2,302,872 | |
| Expense reductions | (2,147) | |
| Total expenses after reductions | | 2,300,725 |
| Net investment income (loss) | | (341,002) |
| Realized and Unrealized Gain (Loss) | | |
| Net realized gain (loss) on: | | |
| Investment securities: | | |
| Unaffiliated issuers | 10,354,882 | |
| Fidelity Central Funds | 1,243 | |
| Foreign currency transactions | 470 | |
| Total net realized gain (loss) | | 10,356,595 |
| Change in net unrealized appreciation (depreciation) on: | | |
| Investment securities: | | |
| Unaffiliated issuers | (25,957,722) | |
| Assets and liabilities in foreign currencies | (594) | |
| Total change in net unrealized appreciation (depreciation) | | (25,958,316) |
| Net gain (loss) | | (15,601,721) |
| Net increase (decrease) in net assets resulting from operations | | $(15,942,723) |
See accompanying notes which are an integral part of the financial statements.
Statement of Changes in Net Assets
| | Six months ended January 31, 2019 (Unaudited) | Year ended July 31, 2018 |
| Increase (Decrease) in Net Assets | | |
| Operations | | |
| Net investment income (loss) | $(341,002) | $(510,199) |
| Net realized gain (loss) | 10,356,595 | 5,159,841 |
| Change in net unrealized appreciation (depreciation) | (25,958,316) | 58,199,580 |
| Net increase (decrease) in net assets resulting from operations | (15,942,723) | 62,849,222 |
| Distributions to shareholders | (4,099,248) | – |
| Total distributions | (4,099,248) | – |
| Share transactions - net increase (decrease) | (5,229,619) | 64,351,041 |
| Total increase (decrease) in net assets | (25,271,590) | 127,200,263 |
| Net Assets | | |
| Beginning of period | 405,054,407 | 277,854,144 |
| End of period | $379,782,817 | $405,054,407 |
| Other Information | | |
| Distributions in excess of net investment income end of period | | $(96,301) |
See accompanying notes which are an integral part of the financial statements.
Financial Highlights
Fidelity Advisor Consumer Discretionary Fund Class A
| | Six months ended (Unaudited) January 31, | Years endedJuly 31, | | | | |
| | 2019 | 2018 | 2017 | 2016 | 2015 | 2014 |
| Selected Per–Share Data | | | | | | |
| Net asset value, beginning of period | $28.22 | $22.92 | $20.94 | $21.51 | $19.75 | $19.59 |
| Income from Investment Operations | | | | | | |
| Net investment income (loss)A | (.02) | (.02) | .06 | .10B | .05 | (.04) |
| Net realized and unrealized gain (loss) | (.79) | 5.32 | 2.01 | (.21) | 3.99 | 1.75 |
| Total from investment operations | (.81) | 5.30 | 2.07 | (.11) | 4.04 | 1.71 |
| Distributions from net investment income | – | – | (.09) | (.02) | – | – |
| Distributions from net realized gain | (.27) | – | – | (.44) | (2.28) | (1.55) |
| Total distributions | (.27) | – | (.09) | (.46) | (2.28) | (1.55) |
| Redemption fees added to paid in capitalA | – | – | –C | –C | –C | –C |
| Net asset value, end of period | $27.14 | $28.22 | $22.92 | $20.94 | $21.51 | $19.75 |
| Total ReturnD,E,F | (2.83)% | 23.12% | 9.93% | (.38)% | 22.26% | 9.28% |
| Ratios to Average Net AssetsG,H | | | | | | |
| Expenses before reductions | 1.09%I | 1.12% | 1.10% | 1.10% | 1.15% | 1.20% |
| Expenses net of fee waivers, if any | 1.09%I | 1.12% | 1.10% | 1.10% | 1.15% | 1.20% |
| Expenses net of all reductions | 1.09%I | 1.11% | 1.10% | 1.09% | 1.14% | 1.19% |
| Net investment income (loss) | (.13)%I | (.08)% | .26% | .49%B | .27% | (.21)% |
| Supplemental Data | | | | | | |
| Net assets, end of period (000 omitted) | $140,612 | $146,605 | $109,303 | $144,578 | $115,027 | $59,089 |
| Portfolio turnover rateJ | 69%I | 60% | 47% | 59% | 71% | 171% |
A Calculated based on average shares outstanding during the period.
B Net investment income per share reflects a large, non-recurring dividend which amounted to $.03 per share. Excluding this non-recurring dividend, the ratio of net investment income (loss) to average net assets would have been .33%.
C Amount represents less than $.005 per share.
D Total returns for periods of less than one year are not annualized.
E Total returns would have been lower if certain expenses had not been reduced during the applicable periods shown.
F Total returns do not include the effect of the sales charges.
G Fees and expenses of any underlying Fidelity Central Funds are not included in the Fund's expense ratio. The Fund indirectly bears its proportionate share of the expenses of any underlying Fidelity Central Funds.
H Expense ratios reflect operating expenses of the class. Expenses before reductions do not reflect amounts reimbursed by the investment adviser or reductions from brokerage service arrangements or reductions from other expense offset arrangements and do not represent the amount paid by the class during periods when reimbursements or reductions occur. Expenses net of fee waivers reflect expenses after reimbursement by the investment adviser but prior to reductions from brokerage service arrangements or other expense offset arrangements. Expenses net of all reductions represent the net expenses paid by the class.
I Annualized
J Amount does not include the portfolio activity of any underlying Fidelity Central Funds.
See accompanying notes which are an integral part of the financial statements.
Fidelity Advisor Consumer Discretionary Fund Class M
| | Six months ended (Unaudited) January 31, | Years endedJuly 31, | | | | |
| | 2019 | 2018 | 2017 | 2016 | 2015 | 2014 |
| Selected Per–Share Data | | | | | | |
| Net asset value, beginning of period | $26.36 | $21.47 | $19.66 | $20.26 | $18.75 | $18.68 |
| Income from Investment Operations | | | | | | |
| Net investment income (loss)A | (.05) | (.08) | –B | .03C | (.01) | (.10) |
| Net realized and unrealized gain (loss) | (.74) | 4.97 | 1.89 | (.19) | 3.77 | 1.67 |
| Total from investment operations | (.79) | 4.89 | 1.89 | (.16) | 3.76 | 1.57 |
| Distributions from net investment income | – | – | (.08) | – | – | – |
| Distributions from net realized gain | (.27) | – | – | (.44) | (2.25) | (1.50) |
| Total distributions | (.27) | – | (.08) | (.44) | (2.25) | (1.50) |
| Redemption fees added to paid in capitalA | – | – | –B | –B | –B | –B |
| Net asset value, end of period | $25.30 | $26.36 | $21.47 | $19.66 | $20.26 | $18.75 |
| Total ReturnD,E,F | (2.95)% | 22.78% | 9.62% | (.68)% | 21.92% | 8.94% |
| Ratios to Average Net AssetsG,H | | | | | | |
| Expenses before reductions | 1.35%I | 1.38% | 1.39% | 1.40% | 1.46% | 1.50% |
| Expenses net of fee waivers, if any | 1.35%I | 1.38% | 1.39% | 1.40% | 1.45% | 1.50% |
| Expenses net of all reductions | 1.35%I | 1.38% | 1.39% | 1.39% | 1.45% | 1.49% |
| Net investment income (loss) | (.39)%I | (.35)% | (.02)% | .19%C | (.03)% | (.51)% |
| Supplemental Data | | | | | | |
| Net assets, end of period (000 omitted) | $31,045 | $34,622 | $26,398 | $28,259 | $25,948 | $18,779 |
| Portfolio turnover rateJ | 69%I | 60% | 47% | 59% | 71% | 171% |
A Calculated based on average shares outstanding during the period.
B Amount represents less than $.005 per share.
C Net investment income per share reflects a large, non-recurring dividend which amounted to $.03 per share. Excluding this non-recurring dividend, the ratio of net investment income (loss) to average net assets would have been .03%.
D Total returns for periods of less than one year are not annualized.
E Total returns would have been lower if certain expenses had not been reduced during the applicable periods shown.
F Total returns do not include the effect of the sales charges.
G Fees and expenses of any underlying Fidelity Central Funds are not included in the Fund's expense ratio. The Fund indirectly bears its proportionate share of the expenses of any underlying Fidelity Central Funds.
H Expense ratios reflect operating expenses of the class. Expenses before reductions do not reflect amounts reimbursed by the investment adviser or reductions from brokerage service arrangements or reductions from other expense offset arrangements and do not represent the amount paid by the class during periods when reimbursements or reductions occur. Expenses net of fee waivers reflect expenses after reimbursement by the investment adviser but prior to reductions from brokerage service arrangements or other expense offset arrangements. Expenses net of all reductions represent the net expenses paid by the class.
I Annualized
J Amount does not include the portfolio activity of any underlying Fidelity Central Funds.
See accompanying notes which are an integral part of the financial statements.
Fidelity Advisor Consumer Discretionary Fund Class C
| | Six months ended (Unaudited) January 31, | Years endedJuly 31, | | | | |
| | 2019 | 2018 | 2017 | 2016 | 2015 | 2014�� |
| Selected Per–Share Data | | | | | | |
| Net asset value, beginning of period | $22.90 | $18.74 | $17.18 | $17.84 | $16.79 | $16.90 |
| Income from Investment Operations | | | | | | |
| Net investment income (loss)A | (.10) | (.17) | (.09) | (.04)B | (.08) | (.16) |
| Net realized and unrealized gain (loss) | (.64) | 4.33 | 1.65 | (.18) | 3.34 | 1.49 |
| Total from investment operations | (.74) | 4.16 | 1.56 | (.22) | 3.26 | 1.33 |
| Distributions from net investment income | – | – | – | – | – | – |
| Distributions from net realized gain | (.27) | – | – | (.44) | (2.21) | (1.44) |
| Total distributions | (.27) | – | – | (.44) | (2.21) | (1.44) |
| Redemption fees added to paid in capitalA | – | – | –C | –C | –C | –C |
| Net asset value, end of period | $21.89 | $22.90 | $18.74 | $17.18 | $17.84 | $16.79 |
| Total ReturnD,E,F | (3.18)% | 22.20% | 9.08% | (1.11)% | 21.37% | 8.44% |
| Ratios to Average Net AssetsG,H | | | | | | |
| Expenses before reductions | 1.84%I | 1.87% | 1.85% | 1.86% | 1.91% | 1.97% |
| Expenses net of fee waivers, if any | 1.84%I | 1.87% | 1.85% | 1.86% | 1.91% | 1.97% |
| Expenses net of all reductions | 1.83%I | 1.86% | 1.85% | 1.85% | 1.90% | 1.96% |
| Net investment income (loss) | (.87)%I | (.83)% | (.49)% | (.27)%B | (.49)% | (.97)% |
| Supplemental Data | | | | | | |
| Net assets, end of period (000 omitted) | $73,244 | $71,116 | $59,958 | $67,306 | $43,999 | $20,726 |
| Portfolio turnover rateJ | 69%I | 60% | 47% | 59% | 71% | 171% |
A Calculated based on average shares outstanding during the period.
B Net investment income per share reflects a large, non-recurring dividend which amounted to $.03 per share. Excluding this non-recurring dividend, the ratio of net investment income (loss) to average net assets would have been (.42) %.
C Amount represents less than $.005 per share.
D Total returns for periods of less than one year are not annualized.
E Total returns would have been lower if certain expenses had not been reduced during the applicable periods shown.
F Total returns do not include the effect of the contingent deferred sales charge.
G Fees and expenses of any underlying Fidelity Central Funds are not included in the Fund's expense ratio. The Fund indirectly bears its proportionate share of the expenses of any underlying Fidelity Central Funds.
H Expense ratios reflect operating expenses of the class. Expenses before reductions do not reflect amounts reimbursed by the investment adviser or reductions from brokerage service arrangements or reductions from other expense offset arrangements and do not represent the amount paid by the class during periods when reimbursements or reductions occur. Expenses net of fee waivers reflect expenses after reimbursement by the investment adviser but prior to reductions from brokerage service arrangements or other expense offset arrangements. Expenses net of all reductions represent the net expenses paid by the class.
I Annualized
J Amount does not include the portfolio activity of any underlying Fidelity Central Funds.
See accompanying notes which are an integral part of the financial statements.
Fidelity Advisor Consumer Discretionary Fund Class I
| | Six months ended (Unaudited) January 31, | Years endedJuly 31, | | | | |
| | 2019 | 2018 | 2017 | 2016 | 2015 | 2014 |
| Selected Per–Share Data | | | | | | |
| Net asset value, beginning of period | $30.42 | $24.64 | $22.48 | $23.06 | $21.00 | $20.72 |
| Income from Investment Operations | | | | | | |
| Net investment income (loss)A | .02 | .06 | .12 | .16B | .12 | .02 |
| Net realized and unrealized gain (loss) | (.86) | 5.72 | 2.18 | (.22) | 4.26 | 1.85 |
| Total from investment operations | (.84) | 5.78 | 2.30 | (.06) | 4.38 | 1.87 |
| Distributions from net investment income | – | – | (.14) | (.08) | – | – |
| Distributions from net realized gain | (.27) | – | – | (.44) | (2.32) | (1.59) |
| Total distributions | (.27) | – | (.14) | (.52) | (2.32) | (1.59) |
| Redemption fees added to paid in capitalA | – | – | –C | –C | –C | –C |
| Net asset value, end of period | $29.31 | $30.42 | $24.64 | $22.48 | $23.06 | $21.00 |
| Total ReturnD,E | (2.72)% | 23.46% | 10.27% | (.13)% | 22.60% | 9.61% |
| Ratios to Average Net AssetsF,G | | | | | | |
| Expenses before reductions | .81%H | .84% | .83% | .84% | .87% | .91% |
| Expenses net of fee waivers, if any | .81%H | .83% | .83% | .84% | .87% | .91% |
| Expenses net of all reductions | .81%H | .83% | .83% | .83% | .87% | .91% |
| Net investment income (loss) | .15%H | .20% | .54% | .75%B | .55% | .08% |
| Supplemental Data | | | | | | |
| Net assets, end of period (000 omitted) | $132,651 | $152,711 | $82,195 | $75,742 | $48,329 | $21,708 |
| Portfolio turnover rateI | 69%H | 60% | 47% | 59% | 71% | 171% |
A Calculated based on average shares outstanding during the period.
B Net investment income per share reflects a large, non-recurring dividend which amounted to $.03 per share. Excluding this non-recurring dividend, the ratio of net investment income (loss) to average net assets would have been .60%.
C Amount represents less than $.005 per share.
D Total returns for periods of less than one year are not annualized.
E Total returns would have been lower if certain expenses had not been reduced during the applicable periods shown.
F Fees and expenses of any underlying Fidelity Central Funds are not included in the Fund's expense ratio. The Fund indirectly bears its proportionate share of the expenses of any underlying Fidelity Central Funds.
G Expense ratios reflect operating expenses of the class. Expenses before reductions do not reflect amounts reimbursed by the investment adviser or reductions from brokerage service arrangements or reductions from other expense offset arrangements and do not represent the amount paid by the class during periods when reimbursements or reductions occur. Expenses net of fee waivers reflect expenses after reimbursement by the investment adviser but prior to reductions from brokerage service arrangements or other expense offset arrangements. Expenses net of all reductions represent the net expenses paid by the class.
H Annualized
I Amount does not include the portfolio activity of any underlying Fidelity Central Funds.
See accompanying notes which are an integral part of the financial statements.
Fidelity Advisor Consumer Discretionary Fund Class Z
| | Six months ended (Unaudited) January 31, |
| | 2019 A |
| Selected Per–Share Data | |
| Net asset value, beginning of period | $31.56 |
| Income from Investment Operations | |
| Net investment income (loss)B | .05 |
| Net realized and unrealized gain (loss) | (2.01) |
| Total from investment operations | (1.96) |
| Distributions from net realized gain | (.27) |
| Total distributions | (.27) |
| Net asset value, end of period | $29.33 |
| Total ReturnC,D | (6.17)% |
| Ratios to Average Net AssetsE,F | |
| Expenses before reductions | .67%G |
| Expenses net of fee waivers, if any | .67%G |
| Expenses net of all reductions | .67%G |
| Net investment income (loss) | .51%G |
| Supplemental Data | |
| Net assets, end of period (000 omitted) | $2,231 |
| Portfolio turnover rateH | 69%G |
A For the period October 2, 2018 (commencement of sale of shares) to January 31, 2019.
B Calculated based on average shares outstanding during the period.
C Total returns for periods of less than one year are not annualized.
D Total returns would have been lower if certain expenses had not been reduced during the applicable periods shown.
E Fees and expenses of any underlying Fidelity Central Funds are not included in the Fund's expense ratio. The Fund indirectly bears its proportionate share of the expenses of any underlying Fidelity Central Funds.
F Expense ratios reflect operating expenses of the class. Expenses before reductions do not reflect amounts reimbursed by the investment adviser or reductions from brokerage service arrangements or reductions from other expense offset arrangements and do not represent the amount paid by the class during periods when reimbursements or reductions occur. Expense ratios before reductions for start-up periods may not be representative of longer-term operating periods. Expenses net of fee waivers reflect expenses after reimbursement by the investment adviser but prior to reductions from brokerage service arrangements or other expense offset arrangements. Expenses net of all reductions represent the net expenses paid by the class.
G Annualized
H Amount does not include the portfolio activity of any underlying Fidelity Central Funds.
See accompanying notes which are an integral part of the financial statements.
Fidelity Advisor® Energy Fund
Investment Summary (Unaudited)
Top Ten Stocks as of January 31, 2019
| | % of fund's net assets |
| Chevron Corp. | 10.5 |
| EOG Resources, Inc. | 8.2 |
| Valero Energy Corp. | 5.1 |
| Diamondback Energy, Inc. | 4.6 |
| Anadarko Petroleum Corp. | 4.2 |
| Phillips 66 Co. | 4.2 |
| Exxon Mobil Corp. | 3.6 |
| Pioneer Natural Resources Co. | 3.6 |
| Marathon Petroleum Corp. | 3.3 |
| Delek U.S. Holdings, Inc. | 2.9 |
| | 50.2 |
Top Industries (% of fund's net assets)
| As of January 31, 2019 |
| | Oil, Gas & Consumable Fuels | 90.7% |
| | Energy Equipment & Services | 8.3% |
| | Machinery | 0.8% |
| | Chemicals | 0.2% |
| | Gas Utilities | 0.1% |
| | All Others** | (0.1)% |

* All Others are not included in the pie chart.
* Includes short-term investments and net other assets (liabilities).
Fidelity Advisor® Energy Fund
Schedule of Investments January 31, 2019 (Unaudited)
Showing Percentage of Net Assets
| Common Stocks - 100.1% | | | |
| | | Shares | Value |
| Chemicals - 0.2% | | | |
| Commodity Chemicals - 0.2% | | | |
| LG Chemical Ltd. | | 2,975 | $984,152 |
| Energy Equipment & Services - 8.3% | | | |
| Oil & Gas Drilling - 1.8% | | | |
| AKITA Drilling Ltd. Class A (non-vtg.) | | 277,272 | 713,253 |
| Nabors Industries Ltd. | | 1,351,052 | 3,999,114 |
| Odfjell Drilling Ltd. | | 564,256 | 1,659,193 |
| Precision Drilling Corp. (a) | | 899,100 | 1,977,548 |
| Shelf Drilling Ltd. (a)(b) | | 629,669 | 2,911,695 |
| Trinidad Drilling Ltd. (a) | | 843,400 | 1,078,361 |
| | | | 12,339,164 |
| Oil & Gas Equipment & Services - 6.5% | | | |
| Baker Hughes, a GE Co. Class A | | 273,900 | 6,455,823 |
| Forum Energy Technologies, Inc. (a) | | 134,300 | 659,413 |
| Halliburton Co. | | 333,000 | 10,442,880 |
| Helix Energy Solutions Group, Inc. (a) | | 99,700 | 680,951 |
| Liberty Oilfield Services, Inc. Class A (c) | | 187,100 | 2,845,791 |
| NCS Multistage Holdings, Inc. (a) | | 113,069 | 639,971 |
| RigNet, Inc. (a) | | 274,950 | 3,673,332 |
| Schlumberger Ltd. | | 386,318 | 17,079,119 |
| Smart Sand, Inc. (a)(c) | | 113,800 | 289,052 |
| Solaris Oilfield Infrastructure, Inc. Class A (c) | | 47,400 | 712,896 |
| | | | 43,479,228 |
|
| TOTAL ENERGY EQUIPMENT & SERVICES | | | 55,818,392 |
|
| Gas Utilities - 0.1% | | | |
| Gas Utilities - 0.1% | | | |
| Indraprastha Gas Ltd. (a) | | 140,560 | 561,666 |
| Machinery - 0.8% | | | |
| Industrial Machinery - 0.8% | | | |
| Apergy Corp. (a) | | 20,000 | 672,400 |
| Cactus, Inc. (a) | | 53,100 | 1,742,742 |
| Gardner Denver Holdings, Inc. (a) | | 39,500 | 974,465 |
| ProPetro Holding Corp. (a) | | 131,300 | 2,145,442 |
| | | | 5,535,049 |
| Oil, Gas & Consumable Fuels - 90.7% | | | |
| Coal & Consumable Fuels - 0.5% | | | |
| Peabody Energy Corp. | | 92,900 | 3,316,530 |
| Integrated Oil & Gas - 19.0% | | | |
| Chevron Corp. | | 615,709 | 70,591,039 |
| Exxon Mobil Corp. | | 333,961 | 24,472,662 |
| Occidental Petroleum Corp. | | 256,300 | 17,115,714 |
| Suncor Energy, Inc. | | 493,700 | 15,923,746 |
| | | | 128,103,161 |
| Oil & Gas Exploration & Production - 50.2% | | | |
| Aker Bp ASA | | 70,300 | 2,340,569 |
| Anadarko Petroleum Corp. | | 603,283 | 28,553,384 |
| Berry Petroleum Corp. | | 638,300 | 7,525,557 |
| Cabot Oil & Gas Corp. | | 774,400 | 19,321,280 |
| Canadian Natural Resources Ltd. | | 99,500 | 2,670,851 |
| Centennial Resource Development, Inc. Class A (a) | | 146,200 | 1,925,454 |
| Concho Resources, Inc. (a) | | 119,972 | 14,377,444 |
| ConocoPhillips Co. | | 169,000 | 11,439,610 |
| Continental Resources, Inc. (a) | | 336,600 | 15,540,822 |
| Devon Energy Corp. | | 596,300 | 15,891,395 |
| Diamondback Energy, Inc. | | 298,670 | 30,798,850 |
| Encana Corp. | | 2,118,000 | 14,539,640 |
| Enerplus Corp. | | 38,600 | 334,276 |
| EOG Resources, Inc. | | 553,486 | 54,905,811 |
| Gran Tierra Energy, Inc. (U.S.) (a) | | 983,800 | 2,331,606 |
| Hess Corp. | | 233,900 | 12,630,600 |
| Kosmos Energy Ltd. (a) | | 498,400 | 2,556,792 |
| Lundin Petroleum AB | | 42,200 | 1,350,180 |
| Magnolia Oil & Gas Corp. | | 424,000 | 5,104,960 |
| Magnolia Oil & Gas Corp. Class A (a)(c) | | 471,200 | 5,673,248 |
| Marathon Oil Corp. | | 45,700 | 721,603 |
| Noble Energy, Inc. | | 474,800 | 10,607,032 |
| Northern Oil & Gas, Inc. (a) | | 486,100 | 1,229,833 |
| Parex Resources, Inc. (a) | | 612,400 | 9,181,689 |
| Parsley Energy, Inc. Class A (a) | | 440,800 | 8,190,064 |
| PDC Energy, Inc. (a) | | 160,088 | 5,214,066 |
| Pioneer Natural Resources Co. | | 168,416 | 23,968,965 |
| Texas Pacific Land Trust (c) | | 600 | 417,246 |
| Viper Energy Partners LP | | 486,300 | 15,420,573 |
| W&T Offshore, Inc. (a) | | 315,000 | 1,587,600 |
| Whiting Petroleum Corp. (a) | | 344,700 | 9,868,761 |
| WPX Energy, Inc. (a) | | 99,621 | 1,221,353 |
| | | | 337,441,114 |
| Oil & Gas Refining & Marketing - 16.6% | | | |
| Delek U.S. Holdings, Inc. | | 599,400 | 19,486,494 |
| HollyFrontier Corp. | | 84,300 | 4,749,462 |
| Marathon Petroleum Corp. | | 331,178 | 21,943,854 |
| Phillips 66 Co. | | 295,218 | 28,166,749 |
| Reliance Industries Ltd. | | 178,235 | 3,082,315 |
| Valero Energy Corp. | | 388,500 | 34,118,070 |
| | | | 111,546,944 |
| Oil & Gas Storage & Transport - 4.4% | | | |
| Cheniere Energy, Inc. (a) | | 188,700 | 12,388,155 |
| Delek Logistics Partners LP | | 17,673 | 533,725 |
| Enterprise Products Partners LP | | 146,600 | 4,056,422 |
| Euronav NV | | 426,280 | 3,316,458 |
| Golar LNG Ltd. | | 155,400 | 3,460,758 |
| Noble Midstream Partners LP (a)(d) | | 48,372 | 1,557,578 |
| Teekay LNG Partners LP | | 38,300 | 492,538 |
| The Williams Companies, Inc. | | 143,000 | 3,850,990 |
| | | | 29,656,624 |
|
| TOTAL OIL, GAS & CONSUMABLE FUELS | | | 610,064,373 |
|
| TOTAL COMMON STOCKS | | | |
| (Cost $648,667,020) | | | 672,963,632 |
|
| Money Market Funds - 0.7% | | | |
| Fidelity Cash Central Fund, 2.43% (e) | | 764,041 | 764,193 |
| Fidelity Securities Lending Cash Central Fund 2.43% (e)(f) | | 4,130,362 | 4,130,775 |
| TOTAL MONEY MARKET FUNDS | | | |
| (Cost $4,894,968) | | | 4,894,968 |
| TOTAL INVESTMENT IN SECURITIES - 100.8% | | | |
| (Cost $653,561,988) | | | 677,858,600 |
| NET OTHER ASSETS (LIABILITIES) - (0.8)% | | | (5,132,897) |
| NET ASSETS - 100% | | | $672,725,703 |
Legend
(a) Non-income producing
(b) Security exempt from registration under Rule 144A of the Securities Act of 1933. These securities may be resold in transactions exempt from registration, normally to qualified institutional buyers. At the end of the period, the value of these securities amounted to $2,911,695 or 0.4% of net assets.
(c) Security or a portion of the security is on loan at period end.
(d) Restricted securities - Investment in securities not registered under the Securities Act of 1933 (excluding 144A issues). At the end of the period, the value of restricted securities (excluding 144A issues) amounted to $1,557,578 or 0.2% of net assets.
(e) Affiliated fund that is generally available only to investment companies and other accounts managed by Fidelity Investments. The rate quoted is the annualized seven-day yield of the fund at period end. A complete unaudited listing of the fund's holdings as of its most recent quarter end is available upon request. In addition, each Fidelity Central Fund's financial statements are available on the SEC's website or upon request.
(f) Investment made with cash collateral received from securities on loan.
Additional information on each restricted holding is as follows:
| Security | Acquisition Date | Acquisition Cost |
| Noble Midstream Partners LP | 6/21/17 | $1,956,647 |
Affiliated Central Funds
Information regarding fiscal year to date income earned by the Fund from investments in Fidelity Central Funds is as follows:
| Fund | Income earned |
| Fidelity Cash Central Fund | $65,403 |
| Fidelity Securities Lending Cash Central Fund | 39,884 |
| Total | $105,287 |
Amounts in the income column in the above table include any capital gain distributions from underlying funds, which are presented in the corresponding line-item in the Statement of Operations, if applicable.
Investment Valuation
All investments are categorized as Level 1 under the Fair Value Hierarchy. The inputs or methodology used for valuing securities may not be an indication of the risk associated with investing in those securities. For more information on valuation inputs please refer to the Investment Valuation section in the accompanying Notes to Financial Statements.
Other Information
Distribution of investments by country or territory of incorporation, as a percentage of Total Net Assets, is as follows (Unaudited):
| United States of America | 87.0% |
| Canada | 7.0% |
| Curacao | 2.5% |
| Bermuda | 1.3% |
| Others (Individually Less Than 1%) | 2.2% |
| | 100.0% |
See accompanying notes which are an integral part of the financial statements.
Fidelity Advisor® Energy Fund
Financial Statements
Statement of Assets and Liabilities
| | | January 31, 2019 (Unaudited) |
| Assets | | |
Investment in securities, at value (including securities loaned of $4,029,029) — See accompanying schedule:
Unaffiliated issuers (cost $648,667,020) | $672,963,632 | |
| Fidelity Central Funds (cost $4,894,968) | 4,894,968 | |
| Total Investment in Securities (cost $653,561,988) | | $677,858,600 |
| Receivable for investments sold | | 4,308,895 |
| Receivable for fund shares sold | | 691,444 |
| Dividends receivable | | 140,994 |
| Distributions receivable from Fidelity Central Funds | | 12,179 |
| Prepaid expenses | | 7,425 |
| Other receivables | | 119,208 |
| Total assets | | 683,138,745 |
| Liabilities | | |
| Payable for investments purchased | $3,344,166 | |
| Payable for fund shares redeemed | 2,180,508 | |
| Accrued management fee | 295,562 | |
| Distribution and service plan fees payable | 177,653 | |
| Other affiliated payables | 147,600 | |
| Other payables and accrued expenses | 145,603 | |
| Collateral on securities loaned | 4,121,950 | |
| Total liabilities | | 10,413,042 |
| Net Assets | | $672,725,703 |
| Net Assets consist of: | | |
| Paid in capital | | $850,770,991 |
| Total distributable earnings (loss) | | (178,045,288) |
| Net Assets | | $672,725,703 |
| Net Asset Value and Maximum Offering Price | | |
| Class A: | | |
| Net Asset Value and redemption price per share ($198,612,833 ÷ 6,918,523 shares) | | $28.71 |
| Maximum offering price per share (100/94.25 of $28.71) | | $30.46 |
| Class M: | | |
| Net Asset Value and redemption price per share ($95,609,229 ÷ 3,249,541 shares) | | $29.42 |
| Maximum offering price per share (100/96.50 of $29.42) | | $30.49 |
| Class C: | | |
| Net Asset Value and offering price per share ($120,718,825 ÷ 4,565,777 shares)(a) | | $26.44 |
| Class I: | | |
| Net Asset Value, offering price and redemption price per share ($246,669,901 ÷ 8,163,593 shares) | | $30.22 |
| Class Z: | | |
| Net Asset Value, offering price and redemption price per share ($11,114,915 ÷ 368,548 shares) | | $30.16 |
(a) Redemption price per share is equal to net asset value less any applicable contingent deferred sales charge.
See accompanying notes which are an integral part of the financial statements.
Statement of Operations
| | | Six months ended January 31, 2019 (Unaudited) |
| Investment Income | | |
| Dividends | | $8,158,307 |
| Income from Fidelity Central Funds (including $39,884 from security lending) | | 105,287 |
| Total income | | 8,263,594 |
| Expenses | | |
| Management fee | $2,167,421 | |
| Transfer agent fees | 898,899 | |
| Distribution and service plan fees | 1,292,804 | |
| Accounting and security lending fees | 139,977 | |
| Custodian fees and expenses | 12,654 | |
| Independent trustees' fees and expenses | 2,714 | |
| Registration fees | 64,637 | |
| Audit | 31,033 | |
| Legal | 1,072 | |
| Interest | 658 | |
| Miscellaneous | 2,881 | |
| Total expenses before reductions | 4,614,750 | |
| Expense reductions | (8,746) | |
| Total expenses after reductions | | 4,606,004 |
| Net investment income (loss) | | 3,657,590 |
| Realized and Unrealized Gain (Loss) | | |
| Net realized gain (loss) on: | | |
| Investment securities: | | |
| Unaffiliated issuers (net of foreign taxes of $87,481) | (27,243,278) | |
| Fidelity Central Funds | 1,914 | |
| Foreign currency transactions | (8,923) | |
| Total net realized gain (loss) | | (27,250,287) |
| Change in net unrealized appreciation (depreciation) on: | | |
| Investment securities: | | |
| Unaffiliated issuers (net of decrease in deferred foreign taxes of $416,263) | (198,004,703) | |
| Assets and liabilities in foreign currencies | 140 | |
| Total change in net unrealized appreciation (depreciation) | | (198,004,563) |
| Net gain (loss) | | (225,254,850) |
| Net increase (decrease) in net assets resulting from operations | | $(221,597,260) |
See accompanying notes which are an integral part of the financial statements.
Statement of Changes in Net Assets
| | Six months ended January 31, 2019 (Unaudited) | Year ended July 31, 2018 |
| Increase (Decrease) in Net Assets | | |
| Operations | | |
| Net investment income (loss) | $3,657,590 | $2,324,706 |
| Net realized gain (loss) | (27,250,287) | (1,469,949) |
| Change in net unrealized appreciation (depreciation) | (198,004,563) | 188,023,715 |
| Net increase (decrease) in net assets resulting from operations | (221,597,260) | 188,878,472 |
| Distributions to shareholders | (5,238,985) | – |
| Distributions to shareholders from net investment income | – | (11,701,838) |
| Distributions to shareholders from net realized gain | – | (106,751) |
| Total distributions | (5,238,985) | (11,808,589) |
| Share transactions - net increase (decrease) | (69,056,314) | (101,270,438) |
| Total increase (decrease) in net assets | (295,892,559) | 75,799,445 |
| Net Assets | | |
| Beginning of period | 968,618,262 | 892,818,817 |
| End of period | $672,725,703 | $968,618,262 |
| Other Information | | |
| Distributions in excess of net investment income end of period | | $(558,139) |
See accompanying notes which are an integral part of the financial statements.
Financial Highlights
Fidelity Advisor Energy Fund Class A
| | Six months ended (Unaudited) January 31, | Years endedJuly 31, | | | | |
| | 2019 | 2018 | 2017 | 2016 | 2015 | 2014 |
| Selected Per–Share Data | | | | | | |
| Net asset value, beginning of period | $37.52 | $30.70 | $31.12 | $30.96 | $45.71 | $40.59 |
| Income from Investment Operations | | | | | | |
| Net investment income (loss)A | .15 | .12 | .38B | .16 | .28 | .15 |
| Net realized and unrealized gain (loss) | (8.73) | 7.18 | (.72) | .20 | (12.89) | 7.06 |
| Total from investment operations | (8.58) | 7.30 | (.34) | .36 | (12.61) | 7.21 |
| Distributions from net investment income | (.21) | (.48) | – | (.20) | (.18)C | (.17) |
| Distributions from net realized gain | (.02) | –D | (.08) | – | (1.96)C | (1.93) |
| Total distributions | (.23) | (.48) | (.08) | (.20) | (2.14) | (2.09)E |
| Redemption fees added to paid in capitalA | – | – | –D | –D | –D | –D |
| Net asset value, end of period | $28.71 | $37.52 | $30.70 | $31.12 | $30.96 | $45.71 |
| Total ReturnF,G,H | (22.84)% | 24.07% | (1.14)% | 1.25% | (28.92)% | 18.46% |
| Ratios to Average Net AssetsI,J | | | | | | |
| Expenses before reductions | 1.09%K | 1.11% | 1.09% | 1.12% | 1.12% | 1.12% |
| Expenses net of fee waivers, if any | 1.09%K | 1.11% | 1.09% | 1.12% | 1.12% | 1.12% |
| Expenses net of all reductions | 1.09%K | 1.10% | 1.08% | 1.11% | 1.11% | 1.12% |
| Net investment income (loss) | .96%K | .36% | 1.15%B | .54% | .76% | .36% |
| Supplemental Data | | | | | | |
| Net assets, end of period (000 omitted) | $198,613 | $278,555 | $277,378 | $347,885 | $292,288 | $369,400 |
| Portfolio turnover rateL | 35%K | 56% | 90% | 85% | 61% | 112% |
A Calculated based on average shares outstanding during the period.
B Net investment income per share reflects a large, non-recurring dividend which amounted to $.35 per share. Excluding this non-recurring dividend, the ratio of net investment income (loss) to average net assets would have been .11%.
C The amounts shown reflect certain reclassifications related to book to tax differences that were made in the year shown.
D Amount represents less than $.005 per share.
E Total distributions of $2.09 per share is comprised of distributions from net investment income of $.165 and distributions from net realized gain of $1.929 per share.
F Total returns for periods of less than one year are not annualized.
G Total returns would have been lower if certain expenses had not been reduced during the applicable periods shown.
H Total returns do not include the effect of the sales charges.
I Fees and expenses of any underlying Fidelity Central Funds are not included in the Fund's expense ratio. The Fund indirectly bears its proportionate share of the expenses of any underlying Fidelity Central Funds.
J Expense ratios reflect operating expenses of the class. Expenses before reductions do not reflect amounts reimbursed by the investment adviser or reductions from brokerage service arrangements or reductions from other expense offset arrangements and do not represent the amount paid by the class during periods when reimbursements or reductions occur. Expenses net of fee waivers reflect expenses after reimbursement by the investment adviser but prior to reductions from brokerage service arrangements or other expense offset arrangements. Expenses net of all reductions represent the net expenses paid by the class.
K Annualized
L Amount does not include the portfolio activity of any underlying Fidelity Central Funds.
See accompanying notes which are an integral part of the financial statements.
Fidelity Advisor Energy Fund Class M
| | Six months ended (Unaudited) January 31, | Years endedJuly 31, | | | | |
| | 2019 | 2018 | 2017 | 2016 | 2015 | 2014 |
| Selected Per–Share Data | | | | | | |
| Net asset value, beginning of period | $38.36 | $31.37 | $31.82 | $31.63 | $46.64 | $41.38 |
| Income from Investment Operations | | | | | | |
| Net investment income (loss)A | .11 | .03 | .30B | .08 | .20 | .06 |
| Net realized and unrealized gain (loss) | (8.92) | 7.35 | (.75) | .22 | (13.18) | 7.21 |
| Total from investment operations | (8.81) | 7.38 | (.45) | .30 | (12.98) | 7.27 |
| Distributions from net investment income | (.11) | (.39) | – | (.11) | (.08)C | (.08) |
| Distributions from net realized gain | (.02) | –D | – | – | (1.95)C | (1.93) |
| Total distributions | (.13) | (.39) | – | (.11) | (2.03) | (2.01) |
| Redemption fees added to paid in capitalA | – | – | –D | –D | –D | –D |
| Net asset value, end of period | $29.42 | $38.36 | $31.37 | $31.82 | $31.63 | $46.64 |
| Total ReturnE,F,G | (22.95)% | 23.75% | (1.41)% | .98% | (29.09)% | 18.19% |
| Ratios to Average Net AssetsH,I | | | | | | |
| Expenses before reductions | 1.36%J | 1.38% | 1.36% | 1.38% | 1.36% | 1.34% |
| Expenses net of fee waivers, if any | 1.36%J | 1.38% | 1.36% | 1.38% | 1.35% | 1.34% |
| Expenses net of all reductions | 1.35%J | 1.37% | 1.35% | 1.37% | 1.35% | 1.34% |
| Net investment income (loss) | .69%J | .09% | .88%B | .28% | .52% | .14% |
| Supplemental Data | | | | | | |
| Net assets, end of period (000 omitted) | $95,609 | $136,828 | $125,951 | $155,856 | $164,848 | $245,828 |
| Portfolio turnover rateK | 35%J | 56% | 90% | 85% | 61% | 112% |
A Calculated based on average shares outstanding during the period.
B Net investment income per share reflects a large, non-recurring dividend which amounted to $.35 per share. Excluding this non-recurring dividend, the ratio of net investment income (loss) to average net assets would have been (.16) %.
C The amounts shown reflect certain reclassifications related to book to tax differences that were made in the year shown.
D Amount represents less than $.005 per share.
E Total returns for periods of less than one year are not annualized.
F Total returns would have been lower if certain expenses had not been reduced during the applicable periods shown.
G Total returns do not include the effect of the sales charges.
H Fees and expenses of any underlying Fidelity Central Funds are not included in the Fund's expense ratio. The Fund indirectly bears its proportionate share of the expenses of any underlying Fidelity Central Funds.
I Expense ratios reflect operating expenses of the class. Expenses before reductions do not reflect amounts reimbursed by the investment adviser or reductions from brokerage service arrangements or reductions from other expense offset arrangements and do not represent the amount paid by the class during periods when reimbursements or reductions occur. Expenses net of fee waivers reflect expenses after reimbursement by the investment adviser but prior to reductions from brokerage service arrangements or other expense offset arrangements. Expenses net of all reductions represent the net expenses paid by the class.
J Annualized
K Amount does not include the portfolio activity of any underlying Fidelity Central Funds.
See accompanying notes which are an integral part of the financial statements.
Fidelity Advisor Energy Fund Class C
| | Six months ended (Unaudited) January 31, | Years endedJuly 31, | | | | |
| | 2019 | 2018 | 2017 | 2016 | 2015 | 2014 |
| Selected Per–Share Data | | | | | | |
| Net asset value, beginning of period | $34.39 | $28.16 | $28.69 | $28.58 | $42.40 | $37.92 |
| Income from Investment Operations | | | | | | |
| Net investment income (loss)A | .04 | (.11) | .13B | (.05) | .01 | (.15) |
| Net realized and unrealized gain (loss) | (7.99) | 6.59 | (.66) | .19 | (11.93) | 6.57 |
| Total from investment operations | (7.95) | 6.48 | (.53) | .14 | (11.92) | 6.42 |
| Distributions from net investment income | – | (.24) | – | (.03) | (.03)C | (.01) |
| Distributions from net realized gain | – | –D | – | – | (1.88)C | (1.93) |
| Total distributions | – | (.25)E | – | (.03) | (1.90)F | (1.94) |
| Redemption fees added to paid in capitalA | – | – | –D | –D | –D | –D |
| Net asset value, end of period | $26.44 | $34.39 | $28.16 | $28.69 | $28.58 | $42.40 |
| Total ReturnG,H,I | (23.12)% | 23.16% | (1.85)% | .52% | (29.44)% | 17.57% |
| Ratios to Average Net AssetsJ,K | | | | | | |
| Expenses before reductions | 1.81%L | 1.84% | 1.82% | 1.84% | 1.85% | 1.86% |
| Expenses net of fee waivers, if any | 1.81%L | 1.83% | 1.81% | 1.84% | 1.85% | 1.86% |
| Expenses net of all reductions | 1.81%L | 1.83% | 1.80% | 1.83% | 1.85% | 1.86% |
| Net investment income (loss) | .24%L | (.37)% | .42%B | (.18)% | .02% | (.38)% |
| Supplemental Data | | | | | | |
| Net assets, end of period (000 omitted) | $120,719 | $179,521 | $212,105 | $240,949 | $162,322 | $130,881 |
| Portfolio turnover rateM | 35%L | 56% | 90% | 85% | 61% | 112% |
A Calculated based on average shares outstanding during the period.
B Net investment income per share reflects a large, non-recurring dividend which amounted to $.32 per share. Excluding this non-recurring dividend, the ratio of net investment income (loss) to average net assets would have been (.62) %.
C The amounts shown reflect certain reclassifications related to book to tax differences that were made in the year shown.
D Amount represents less than $.005 per share.
E Total distributions of $.25 per share is comprised of distributions from net investment income of $.244 and distributions from net realized gain of $.004 per share.
F Total distributions of $1.90 per share is comprised of distributions from net investment income of $.027 and distributions from net realized gain of $1.877 per share.
G Total returns for periods of less than one year are not annualized.
H Total returns would have been lower if certain expenses had not been reduced during the applicable periods shown.
I Total returns do not include the effect of the contingent deferred sales charge.
J Fees and expenses of any underlying Fidelity Central Funds are not included in the Fund's expense ratio. The Fund indirectly bears its proportionate share of the expenses of any underlying Fidelity Central Funds.
K Expense ratios reflect operating expenses of the class. Expenses before reductions do not reflect amounts reimbursed by the investment adviser or reductions from brokerage service arrangements or reductions from other expense offset arrangements and do not represent the amount paid by the class during periods when reimbursements or reductions occur. Expenses net of fee waivers reflect expenses after reimbursement by the investment adviser but prior to reductions from brokerage service arrangements or other expense offset arrangements. Expenses net of all reductions represent the net expenses paid by the class.
L Annualized
M Amount does not include the portfolio activity of any underlying Fidelity Central Funds.
See accompanying notes which are an integral part of the financial statements.
Fidelity Advisor Energy Fund Class I
| | Six months ended (Unaudited) January 31, | Years endedJuly 31, | | | | |
| | 2019 | 2018 | 2017 | 2016 | 2015 | 2014 |
| Selected Per–Share Data | | | | | | |
| Net asset value, beginning of period | $39.57 | $32.36 | $32.78 | $32.62 | $48.05 | $42.55 |
| Income from Investment Operations | | | | | | |
| Net investment income (loss)A | .21 | .23 | .50B | .25 | .39 | .28 |
| Net realized and unrealized gain (loss) | (9.22) | 7.57 | (.75) | .20 | (13.56) | 7.42 |
| Total from investment operations | (9.01) | 7.80 | (.25) | .45 | (13.17) | 7.70 |
| Distributions from net investment income | (.32) | (.58) | (.08) | (.29) | (.30)C | (.27) |
| Distributions from net realized gain | (.02) | –D | (.09) | – | (1.96)C | (1.93) |
| Total distributions | (.34) | (.59)E | (.17) | (.29) | (2.26) | (2.20) |
| Redemption fees added to paid in capitalA | – | – | –D | –D | –D | –D |
| Net asset value, end of period | $30.22 | $39.57 | $32.36 | $32.78 | $32.62 | $48.05 |
| Total ReturnF,G | (22.72)% | 24.43% | (.86)% | 1.50% | (28.73)% | 18.80% |
| Ratios to Average Net AssetsH,I | | | | | | |
| Expenses before reductions | .80%J | .83% | .81% | .85% | .85% | .85% |
| Expenses net of fee waivers, if any | .80%J | .83% | .81% | .85% | .85% | .85% |
| Expenses net of all reductions | .80%J | .82% | .80% | .83% | .85% | .85% |
| Net investment income (loss) | 1.25%J | .64% | 1.43%B | .82% | 1.02% | .63% |
| Supplemental Data | | | | | | |
| Net assets, end of period (000 omitted) | $246,670 | $373,714 | $277,385 | $193,683 | $130,308 | $110,795 |
| Portfolio turnover rateK | 35%J | 56% | 90% | 85% | 61% | 112% |
A Calculated based on average shares outstanding during the period.
B Net investment income per share reflects a large, non-recurring dividend which amounted to $.36 per share. Excluding this non-recurring dividend, the ratio of net investment income (loss) to average net assets would have been .39%.
C The amounts shown reflect certain reclassifications related to book to tax differences that were made in the year shown.
D Amount represents less than $.005 per share.
E Total distributions of $.59 per share is comprised of distributions from net investment income of $.584 and distributions from net realized gain of $.004 per share.
F Total returns for periods of less than one year are not annualized.
G Total returns would have been lower if certain expenses had not been reduced during the applicable periods shown.
H Fees and expenses of any underlying Fidelity Central Funds are not included in the Fund's expense ratio. The Fund indirectly bears its proportionate share of the expenses of any underlying Fidelity Central Funds.
I Expense ratios reflect operating expenses of the class. Expenses before reductions do not reflect amounts reimbursed by the investment adviser or reductions from brokerage service arrangements or reductions from other expense offset arrangements and do not represent the amount paid by the class during periods when reimbursements or reductions occur. Expenses net of fee waivers reflect expenses after reimbursement by the investment adviser but prior to reductions from brokerage service arrangements or other expense offset arrangements. Expenses net of all reductions represent the net expenses paid by the class.
J Annualized
K Amount does not include the portfolio activity of any underlying Fidelity Central Funds.
See accompanying notes which are an integral part of the financial statements.
Fidelity Advisor Energy Fund Class Z
| | Six months ended (Unaudited) January 31, |
| | 2019 A |
| Selected Per–Share Data | |
| Net asset value, beginning of period | $39.35 |
| Income from Investment Operations | |
| Net investment income (loss)B | .14 |
| Net realized and unrealized gain (loss) | (8.91) |
| Total from investment operations | (8.77) |
| Distributions from net investment income | (.39) |
| Distributions from net realized gain | (.02) |
| Total distributions | (.42)C |
| Net asset value, end of period | $30.16 |
| Total ReturnD,E | (22.25)% |
| Ratios to Average Net AssetsF,G | |
| Expenses before reductions | .65%H |
| Expenses net of fee waivers, if any | .65%H |
| Expenses net of all reductions | .64%H |
| Net investment income (loss) | 1.43%H |
| Supplemental Data | |
| Net assets, end of period (000 omitted) | $11,115 |
| Portfolio turnover rateI | 35%H |
A For the period October 2, 2018 (commencement of sale of shares) to January 31, 2019.
B Calculated based on average shares outstanding during the period.
C Total distributions of $.42 per share is comprised of distributions from net investment income of $.391 and distributions from net realized gain of $.024 per share.
D Total returns for periods of less than one year are not annualized.
E Total returns would have been lower if certain expenses had not been reduced during the applicable periods shown.
F Fees and expenses of any underlying Fidelity Central Funds are not included in the Fund's expense ratio. The Fund indirectly bears its proportionate share of the expenses of any underlying Fidelity Central Funds.
G Expense ratios reflect operating expenses of the class. Expenses before reductions do not reflect amounts reimbursed by the investment adviser or reductions from brokerage service arrangements or reductions from other expense offset arrangements and do not represent the amount paid by the class during periods when reimbursements or reductions occur. Expense ratios before reductions for start-up periods may not be representative of longer-term operating periods. Expenses net of fee waivers reflect expenses after reimbursement by the investment adviser but prior to reductions from brokerage service arrangements or other expense offset arrangements. Expenses net of all reductions represent the net expenses paid by the class.
H Annualized
I Amount does not include the portfolio activity of any underlying Fidelity Central Funds.
See accompanying notes which are an integral part of the financial statements.
Fidelity Advisor® Financial Services Fund
Investment Summary (Unaudited)
Top Ten Stocks as of January 31, 2019
| | % of fund's net assets |
| Citigroup, Inc. | 6.2 |
| Bank of America Corp. | 5.7 |
| Wells Fargo & Co. | 4.7 |
| Capital One Financial Corp. | 3.9 |
| Cboe Global Markets, Inc. | 3.8 |
| The Travelers Companies, Inc. | 3.5 |
| Hartford Financial Services Group, Inc. | 3.4 |
| PNC Financial Services Group, Inc. | 3.4 |
| Bank of New York Mellon Corp. | 3.3 |
| FNF Group | 3.3 |
| | 41.2 |
Top Industries (% of fund's net assets)
| As of January 31, 2019 |
| | Banks | 33.8% |
| | Insurance | 25.1% |
| | Capital Markets | 17.2% |
| | Consumer Finance | 10.7% |
| | Mortgage Real Estate Investment Trusts | 3.1% |
| | All Others* | 10.1% |
* Includes short-term investments and net other assets (liabilities).
Fidelity Advisor® Financial Services Fund
Schedule of Investments January 31, 2019 (Unaudited)
Showing Percentage of Net Assets
| Common Stocks - 97.5% | | | |
| | | Shares | Value |
| Banks - 33.8% | | | |
| Diversified Banks - 19.4% | | | |
| Bank of America Corp. | | 828,356 | $23,583,295 |
| Citigroup, Inc. | | 391,605 | 25,242,860 |
| JPMorgan Chase & Co. | | 79,431 | 8,221,109 |
| U.S. Bancorp | | 63,900 | 3,269,124 |
| Wells Fargo & Co. | | 396,478 | 19,391,739 |
| | | | 79,708,127 |
| Regional Banks - 14.4% | | | |
| BOK Financial Corp. | | 22,716 | 1,887,927 |
| First Citizens Bancshares, Inc. | | 7,100 | 2,893,463 |
| First Hawaiian, Inc. | | 108,500 | 2,791,705 |
| First Horizon National Corp. | | 416,516 | 6,114,455 |
| First Republic Bank | | 30,400 | 2,937,552 |
| Huntington Bancshares, Inc. | | 897,806 | 11,886,951 |
| M&T Bank Corp. | | 45,200 | 7,437,208 |
| PNC Financial Services Group, Inc. | | 113,631 | 13,939,115 |
| Popular, Inc. | | 94,317 | 5,150,651 |
| Signature Bank | | 33,053 | 4,207,977 |
| | | | 59,247,004 |
|
| TOTAL BANKS | | | 138,955,131 |
|
| Capital Markets - 17.2% | | | |
| Asset Management & Custody Banks - 4.8% | | | |
| Bank of New York Mellon Corp. | | 256,700 | 13,430,544 |
| Northern Trust Corp. | | 28,600 | 2,529,956 |
| Oaktree Capital Group LLC Class A | | 90,500 | 3,694,210 |
| | | | 19,654,710 |
| Financial Exchanges & Data - 3.8% | | | |
| Cboe Global Markets, Inc. | | 166,773 | 15,554,918 |
| Investment Banking & Brokerage - 8.6% | | | |
| E*TRADE Financial Corp. | | 214,580 | 10,012,303 |
| Goldman Sachs Group, Inc. | | 11,340 | 2,245,433 |
| Hamilton Lane, Inc. Class A | | 82,700 | 2,999,529 |
| Morgan Stanley | | 109,700 | 4,640,310 |
| PJT Partners, Inc. | | 48,800 | 2,121,824 |
| TD Ameritrade Holding Corp. | | 182,300 | 10,199,685 |
| Virtu Financial, Inc. Class A | | 124,500 | 3,180,975 |
| | | | 35,400,059 |
|
| TOTAL CAPITAL MARKETS | | | 70,609,687 |
|
| Consumer Finance - 10.7% | | | |
| Consumer Finance - 10.7% | | | |
| American Express Co. | | 107,400 | 11,029,980 |
| Capital One Financial Corp. | | 195,738 | 15,774,525 |
| OneMain Holdings, Inc. (a) | | 211,300 | 6,315,757 |
| SLM Corp. | | 999,700 | 10,706,787 |
| | | | 43,827,049 |
| Diversified Financial Services - 2.6% | | | |
| Multi-Sector Holdings - 2.6% | | | |
| Berkshire Hathaway, Inc. Class B (a) | | 51,819 | 10,650,877 |
| Household Durables - 0.9% | | | |
| Homebuilding - 0.9% | | | |
| D.R. Horton, Inc. | | 94,900 | 3,648,905 |
| Insurance - 25.1% | | | |
| Insurance Brokers - 2.3% | | | |
| Willis Group Holdings PLC | | 56,700 | 9,230,193 |
| Life & Health Insurance - 4.4% | | | |
| MetLife, Inc. | | 226,700 | 10,353,389 |
| Torchmark Corp. | | 94,480 | 7,913,645 |
| | | | 18,267,034 |
| Multi-Line Insurance - 5.8% | | | |
| American International Group, Inc. | | 225,900 | 9,765,657 |
| Hartford Financial Services Group, Inc. | | 302,500 | 14,193,300 |
| | | | 23,958,957 |
| Property & Casualty Insurance - 9.8% | | | |
| Axis Capital Holdings Ltd. | | 96,100 | 5,146,155 |
| Beazley PLC | | 461,000 | 2,986,959 |
| FNF Group | | 370,350 | 13,391,856 |
| Hiscox Ltd. | | 166,500 | 3,096,648 |
| RSA Insurance Group PLC | | 227,200 | 1,528,121 |
| The Travelers Companies, Inc. | | 113,300 | 14,223,682 |
| | | | 40,373,421 |
| Reinsurance - 2.8% | | | |
| Reinsurance Group of America, Inc. | | 79,300 | 11,454,885 |
|
| TOTAL INSURANCE | | | 103,284,490 |
|
| IT Services - 0.8% | | | |
| Data Processing & Outsourced Services - 0.8% | | | |
| Visa, Inc. Class A | | 22,600 | 3,051,226 |
| Mortgage Real Estate Investment Trusts - 3.1% | | | |
| Mortgage REITs - 3.1% | | | |
| AGNC Investment Corp. | | 316,900 | 5,675,679 |
| MFA Financial, Inc. | | 969,298 | 7,104,954 |
| | | | 12,780,633 |
| Software - 0.8% | | | |
| Application Software - 0.8% | | | |
| Black Knight, Inc. (a) | | 68,983 | 3,393,274 |
| Thrifts & Mortgage Finance - 2.5% | | | |
| Thrifts & Mortgage Finance - 2.5% | | | |
| Essent Group Ltd. (a) | | 133,700 | 5,314,575 |
| MGIC Investment Corp. (a) | | 398,200 | 4,969,536 |
| | | | 10,284,111 |
| TOTAL COMMON STOCKS | | | |
| (Cost $384,660,917) | | | 400,485,383 |
|
| Money Market Funds - 3.0% | | | |
| Fidelity Cash Central Fund, 2.43% (b) | | | |
| (Cost $12,276,631) | | 12,274,329 | 12,276,783 |
| TOTAL INVESTMENT IN SECURITIES - 100.5% | | | |
| (Cost $396,937,548) | | | 412,762,166 |
| NET OTHER ASSETS (LIABILITIES) - (0.5)% | | | (1,857,183) |
| NET ASSETS - 100% | | | $410,904,983 |
Legend
(a) Non-income producing
(b) Affiliated fund that is generally available only to investment companies and other accounts managed by Fidelity Investments. The rate quoted is the annualized seven-day yield of the fund at period end. A complete unaudited listing of the fund's holdings as of its most recent quarter end is available upon request. In addition, each Fidelity Central Fund's financial statements are available on the SEC's website or upon request.
Affiliated Central Funds
Information regarding fiscal year to date income earned by the Fund from investments in Fidelity Central Funds is as follows:
| Fund | Income earned |
| Fidelity Cash Central Fund | $120,827 |
| Fidelity Securities Lending Cash Central Fund | 359 |
| Total | $121,186 |
Amounts in the income column in the above table include any capital gain distributions from underlying funds, which are presented in the corresponding line-item in the Statement of Operations, if applicable.
Investment Valuation
All investments are categorized as Level 1 under the Fair Value Hierarchy. The inputs or methodology used for valuing securities may not be an indication of the risk associated with investing in those securities. For more information on valuation inputs please refer to the Investment Valuation section in the accompanying Notes to Financial Statements.
See accompanying notes which are an integral part of the financial statements.
Fidelity Advisor® Financial Services Fund
Financial Statements
Statement of Assets and Liabilities
| | | January 31, 2019 (Unaudited) |
| Assets | | |
Investment in securities, at value — See accompanying schedule:
Unaffiliated issuers (cost $384,660,917) | $400,485,383 | |
| Fidelity Central Funds (cost $12,276,631) | 12,276,783 | |
| Total Investment in Securities (cost $396,937,548) | | $412,762,166 |
| Receivable for investments sold | | 7,752,869 |
| Receivable for fund shares sold | | 245,054 |
| Dividends receivable | | 562,219 |
| Distributions receivable from Fidelity Central Funds | | 18,253 |
| Prepaid expenses | | 4,559 |
| Other receivables | | 10,476 |
| Total assets | | 421,355,596 |
| Liabilities | | |
| Payable for investments purchased | $6,630,100 | |
| Payable for fund shares redeemed | 3,399,215 | |
| Distributions payable | 82 | |
| Accrued management fee | 182,109 | |
| Distribution and service plan fees payable | 125,256 | |
| Other affiliated payables | 82,435 | |
| Other payables and accrued expenses | 31,416 | |
| Total liabilities | | 10,450,613 |
| Net Assets | | $410,904,983 |
| Net Assets consist of: | | |
| Paid in capital | | $405,947,486 |
| Total distributable earnings (loss) | | 4,957,497 |
| Net Assets | | $410,904,983 |
| Net Asset Value and Maximum Offering Price | | |
| Class A: | | |
| Net Asset Value and redemption price per share ($139,624,930 ÷ 7,206,108 shares) | | $19.38 |
| Maximum offering price per share (100/94.25 of $19.38) | | $20.56 |
| Class M: | | |
| Net Asset Value and redemption price per share ($46,584,317 ÷ 2,428,370 shares) | | $19.18 |
| Maximum offering price per share (100/96.50 of $19.18) | | $19.88 |
| Class C: | | |
| Net Asset Value and offering price per share ($95,567,319 ÷ 5,265,640 shares)(a) | | $18.15 |
| Class I: | | |
| Net Asset Value, offering price and redemption price per share ($126,753,180 ÷ 6,362,181 shares) | | $19.92 |
| Class Z: | | |
| Net Asset Value, offering price and redemption price per share ($2,375,237 ÷ 119,417 shares) | | $19.89 |
(a) Redemption price per share is equal to net asset value less any applicable contingent deferred sales charge.
See accompanying notes which are an integral part of the financial statements.
Statement of Operations
| | | Six months ended January 31, 2019 (Unaudited) |
| Investment Income | | |
| Dividends | | $5,393,113 |
| Income from Fidelity Central Funds (including $359 from security lending) | | 121,186 |
| Total income | | 5,514,299 |
| Expenses | | |
| Management fee | $1,234,885 | |
| Transfer agent fees | 468,054 | |
| Distribution and service plan fees | 852,826 | |
| Accounting and security lending fees | 88,876 | |
| Custodian fees and expenses | 6,713 | |
| Independent trustees' fees and expenses | 1,514 | |
| Registration fees | 51,885 | |
| Audit | 23,455 | |
| Legal | 594 | |
| Miscellaneous | 1,778 | |
| Total expenses before reductions | 2,730,580 | |
| Expense reductions | (14,737) | |
| Total expenses after reductions | | 2,715,843 |
| Net investment income (loss) | | 2,798,456 |
| Realized and Unrealized Gain (Loss) | | |
| Net realized gain (loss) on: | | |
| Investment securities: | | |
| Unaffiliated issuers | (7,919,011) | |
| Fidelity Central Funds | (380) | |
| Foreign currency transactions | 2,652 | |
| Total net realized gain (loss) | | (7,916,739) |
| Change in net unrealized appreciation (depreciation) on: | | |
| Investment securities: | | |
| Unaffiliated issuers | (35,976,733) | |
| Fidelity Central Funds | 152 | |
| Total change in net unrealized appreciation (depreciation) | | (35,976,581) |
| Net gain (loss) | | (43,893,320) |
| Net increase (decrease) in net assets resulting from operations | | $(41,094,864) |
See accompanying notes which are an integral part of the financial statements.
Statement of Changes in Net Assets
| | Six months ended January 31, 2019 (Unaudited) | Year ended July 31, 2018 |
| Increase (Decrease) in Net Assets | | |
| Operations | | |
| Net investment income (loss) | $2,798,456 | $1,996,291 |
| Net realized gain (loss) | (7,916,739) | 33,137,833 |
| Change in net unrealized appreciation (depreciation) | (35,976,581) | 8,327,838 |
| Net increase (decrease) in net assets resulting from operations | (41,094,864) | 43,461,962 |
| Distributions to shareholders | (15,043,367) | – |
| Distributions to shareholders from net investment income | – | (1,262,427) |
| Distributions to shareholders from net realized gain | – | (200,477) |
| Total distributions | (15,043,367) | (1,462,904) |
| Share transactions - net increase (decrease) | (44,592,712) | 90,190,966 |
| Total increase (decrease) in net assets | (100,730,943) | 132,190,024 |
| Net Assets | | |
| Beginning of period | 511,635,926 | 379,445,902 |
| End of period | $410,904,983 | $511,635,926 |
| Other Information | | |
| Undistributed net investment income end of period | | $817,591 |
See accompanying notes which are an integral part of the financial statements.
Financial Highlights
Fidelity Advisor Financial Services Fund Class A
| | Six months ended (Unaudited) January 31, | Years endedJuly 31, | | | | |
| | 2019 | 2018 | 2017 | 2016 | 2015 | 2014 |
| Selected Per–Share Data | | | | | | |
| Net asset value, beginning of period | $21.84 | $19.55 | $15.43 | $16.53 | $14.97 | $13.41 |
| Income from Investment Operations | | | | | | |
| Net investment income (loss)A | .14 | .12 | .08 | .11 | .10 | .10 |
| Net realized and unrealized gain (loss) | (1.89) | 2.25 | 4.08 | (1.13) | 1.59B | 1.55 |
| Total from investment operations | (1.75) | 2.37 | 4.16 | (1.02) | 1.69 | 1.65 |
| Distributions from net investment income | (.18) | (.07) | (.04) | (.07) | (.13) | (.08) |
| Distributions from net realized gain | (.53) | (.01) | – | (.01) | – | (.01) |
| Total distributions | (.71) | (.08) | (.04) | (.08) | (.13) | (.09) |
| Redemption fees added to paid in capitalA | – | – | –C | –C | –C | –C |
| Net asset value, end of period | $19.38 | $21.84 | $19.55 | $15.43 | $16.53 | $14.97 |
| Total ReturnD,E,F | (7.89)% | 12.13% | 26.97% | (6.15)% | 11.29%B | 12.39% |
| Ratios to Average Net AssetsG,H | | | | | | |
| Expenses before reductions | 1.08%I | 1.10% | 1.12% | 1.15% | 1.17% | 1.22% |
| Expenses net of fee waivers, if any | 1.08%I | 1.10% | 1.12% | 1.15% | 1.17% | 1.22% |
| Expenses net of all reductions | 1.07%I | 1.09% | 1.12% | 1.15% | 1.17% | 1.22% |
| Net investment income (loss) | 1.33%I | .55% | .48% | .77% | .61% | .68% |
| Supplemental Data | | | | | | |
| Net assets, end of period (000 omitted) | $139,625 | $174,786 | $144,144 | $97,011 | $102,983 | $77,674 |
| Portfolio turnover rateJ | 67%I | 46% | 81% | 63% | 44% | 49% |
A Calculated based on average shares outstanding during the period.
B Net realized and unrealized gain (loss) per share reflects proceeds received from litigation which amounted to $.05 per share. Excluding these litigation proceeds, the total return would have been 10.97%
C Amount represents less than $.005 per share.
D Total returns for periods of less than one year are not annualized.
E Total returns would have been lower if certain expenses had not been reduced during the applicable periods shown.
F Total returns do not include the effect of the sales charges.
G Fees and expenses of any underlying Fidelity Central Funds are not included in the Fund's expense ratio. The Fund indirectly bears its proportionate share of the expenses of any underlying Fidelity Central Funds.
H Expense ratios reflect operating expenses of the class. Expenses before reductions do not reflect amounts reimbursed by the investment adviser or reductions from brokerage service arrangements or reductions from other expense offset arrangements and do not represent the amount paid by the class during periods when reimbursements or reductions occur. Expenses net of fee waivers reflect expenses after reimbursement by the investment adviser but prior to reductions from brokerage service arrangements or other expense offset arrangements. Expenses net of all reductions represent the net expenses paid by the class.
I Annualized
J Amount does not include the portfolio activity of any underlying Fidelity Central Funds.
See accompanying notes which are an integral part of the financial statements.
Fidelity Advisor Financial Services Fund Class M
| | Six months ended (Unaudited) January 31, | Years endedJuly 31, | | | | |
| | 2019 | 2018 | 2017 | 2016 | 2015 | 2014 |
| Selected Per–Share Data | | | | | | |
| Net asset value, beginning of period | $21.60 | $19.34 | $15.29 | $16.41 | $14.86 | $13.31 |
| Income from Investment Operations | | | | | | |
| Net investment income (loss)A | .11 | .06 | .04 | .07 | .05 | .06 |
| Net realized and unrealized gain (loss) | (1.88) | 2.23 | 4.03 | (1.13) | 1.58B | 1.55 |
| Total from investment operations | (1.77) | 2.29 | 4.07 | (1.06) | 1.63 | 1.61 |
| Distributions from net investment income | (.13) | (.02) | (.02) | (.05) | (.08) | (.05) |
| Distributions from net realized gain | (.53) | (.01) | – | (.01) | – | (.01) |
| Total distributions | (.65)C | (.03) | (.02) | (.06) | (.08) | (.06) |
| Redemption fees added to paid in capitalA | – | – | –D | –D | –D | –D |
| Net asset value, end of period | $19.18 | $21.60 | $19.34 | $15.29 | $16.41 | $14.86 |
| Total ReturnE,F,G | (8.06)% | 11.84% | 26.63% | (6.43)% | 10.98%B | 12.10% |
| Ratios to Average Net AssetsH,I | | | | | | |
| Expenses before reductions | 1.34%J | 1.37% | 1.40% | 1.45% | 1.45% | 1.48% |
| Expenses net of fee waivers, if any | 1.34%J | 1.37% | 1.40% | 1.45% | 1.45% | 1.48% |
| Expenses net of all reductions | 1.34%J | 1.36% | 1.40% | 1.44% | 1.45% | 1.48% |
| Net investment income (loss) | 1.06%J | .28% | .20% | .47% | .33% | .42% |
| Supplemental Data | | | | | | |
| Net assets, end of period (000 omitted) | $46,584 | $53,178 | $45,920 | $30,044 | $34,314 | $31,596 |
| Portfolio turnover rateK | 67%J | 46% | 81% | 63% | 44% | 49% |
A Calculated based on average shares outstanding during the period.
B Net realized and unrealized gain (loss) per share reflects proceeds received from litigation which amounted to $.05 per share. Excluding these litigation proceeds, the total return would have been 10.66%
C Total distributions of $.65 per share is comprised of distributions from net investment income of $.128 and distributions from net realized gain of $.525 per share.
D Amount represents less than $.005 per share.
E Total returns for periods of less than one year are not annualized.
F Total returns would have been lower if certain expenses had not been reduced during the applicable periods shown.
G Total returns do not include the effect of the sales charges.
H Fees and expenses of any underlying Fidelity Central Funds are not included in the Fund's expense ratio. The Fund indirectly bears its proportionate share of the expenses of any underlying Fidelity Central Funds.
I Expense ratios reflect operating expenses of the class. Expenses before reductions do not reflect amounts reimbursed by the investment adviser or reductions from brokerage service arrangements or reductions from other expense offset arrangements and do not represent the amount paid by the class during periods when reimbursements or reductions occur. Expenses net of fee waivers reflect expenses after reimbursement by the investment adviser but prior to reductions from brokerage service arrangements or other expense offset arrangements. Expenses net of all reductions represent the net expenses paid by the class.
J Annualized
K Amount does not include the portfolio activity of any underlying Fidelity Central Funds.
See accompanying notes which are an integral part of the financial statements.
Fidelity Advisor Financial Services Fund Class C
| | Six months ended (Unaudited) January 31, | Years endedJuly 31, | | | | |
| | 2019 | 2018 | 2017 | 2016 | 2015 | 2014 |
| Selected Per–Share Data | | | | | | |
| Net asset value, beginning of period | $20.41 | $18.34 | $14.55 | $15.67 | $14.22 | $12.75 |
| Income from Investment Operations | | | | | | |
| Net investment income (loss)A | .06 | (.04) | (.05) | –B | (.02) | –B |
| Net realized and unrealized gain (loss) | (1.77) | 2.11 | 3.84 | (1.08) | 1.51C | 1.48 |
| Total from investment operations | (1.71) | 2.07 | 3.79 | (1.08) | 1.49 | 1.48 |
| Distributions from net investment income | (.03) | – | –B | (.03) | (.04) | (.01) |
| Distributions from net realized gain | (.53) | – | – | (.01) | – | – |
| Total distributions | (.55)D | – | –B | (.04) | (.04) | (.01) |
| Redemption fees added to paid in capitalA | – | – | –B | –B | –B | –B |
| Net asset value, end of period | $18.15 | $20.41 | $18.34 | $14.55 | $15.67 | $14.22 |
| Total ReturnE,F,G | (8.26)% | 11.29% | 26.06% | (6.88)% | 10.45%C | 11.65% |
| Ratios to Average Net AssetsH,I | | | | | | |
| Expenses before reductions | 1.82%J | 1.86% | 1.87% | 1.90% | 1.90% | 1.94% |
| Expenses net of fee waivers, if any | 1.82%J | 1.85% | 1.87% | 1.90% | 1.90% | 1.94% |
| Expenses net of all reductions | 1.82%J | 1.85% | 1.87% | 1.89% | 1.90% | 1.93% |
| Net investment income (loss) | .59%J | (.20)% | (.27)% | .02% | (.12)% | (.03)% |
| Supplemental Data | | | | | | |
| Net assets, end of period (000 omitted) | $95,567 | $120,947 | $92,593 | $47,505 | $50,206 | $36,740 |
| Portfolio turnover rateK | 67%J | 46% | 81% | 63% | 44% | 49% |
A Calculated based on average shares outstanding during the period.
B Amount represents less than $.005 per share.
C Net realized and unrealized gain (loss) per share reflects proceeds received from litigation which amounted to $.05 per share. Excluding these litigation proceeds, the total return would have been 10.13%
D Total distributions of $.55 per share is comprised of distributions from net investment income of $.027 and distributions from net realized gain of $.525 per share.
E Total returns for periods of less than one year are not annualized.
F Total returns would have been lower if certain expenses had not been reduced during the applicable periods shown.
G Total returns do not include the effect of the contingent deferred sales charge.
H Fees and expenses of any underlying Fidelity Central Funds are not included in the Fund's expense ratio. The Fund indirectly bears its proportionate share of the expenses of any underlying Fidelity Central Funds.
I Expense ratios reflect operating expenses of the class. Expenses before reductions do not reflect amounts reimbursed by the investment adviser or reductions from brokerage service arrangements or reductions from other expense offset arrangements and do not represent the amount paid by the class during periods when reimbursements or reductions occur. Expenses net of fee waivers reflect expenses after reimbursement by the investment adviser but prior to reductions from brokerage service arrangements or other expense offset arrangements. Expenses net of all reductions represent the net expenses paid by the class.
J Annualized
K Amount does not include the portfolio activity of any underlying Fidelity Central Funds.
See accompanying notes which are an integral part of the financial statements.
Fidelity Advisor Financial Services Fund Class I
| | Six months ended (Unaudited) January 31, | Years endedJuly 31, | | | | |
| | 2019 | 2018 | 2017 | 2016 | 2015 | 2014 |
| Selected Per–Share Data | | | | | | |
| Net asset value, beginning of period | $22.47 | $20.11 | $15.84 | $16.94 | $15.34 | $13.73 |
| Income from Investment Operations | | | | | | |
| Net investment income (loss)A | .17 | .18 | .14 | .17 | .15 | .15 |
| Net realized and unrealized gain (loss) | (1.95) | 2.32 | 4.19 | (1.17) | 1.62B | 1.60 |
| Total from investment operations | (1.78) | 2.50 | 4.33 | (1.00) | 1.77 | 1.75 |
| Distributions from net investment income | (.25) | (.13) | (.06) | (.09) | (.17) | (.13) |
| Distributions from net realized gain | (.53) | (.01) | – | (.01) | – | (.01) |
| Total distributions | (.77)C | (.14) | (.06) | (.10) | (.17) | (.14) |
| Redemption fees added to paid in capitalA | – | – | –D | –D | –D | –D |
| Net asset value, end of period | $19.92 | $22.47 | $20.11 | $15.84 | $16.94 | $15.34 |
| Total ReturnE,F | (7.78)% | 12.43% | 27.36% | (5.89)% | 11.61%B | 12.85% |
| Ratios to Average Net AssetsG,H | | | | | | |
| Expenses before reductions | .79%I | .83% | .84% | .85% | .84% | .87% |
| Expenses net of fee waivers, if any | .79%I | .83% | .84% | .85% | .84% | .87% |
| Expenses net of all reductions | .79%I | .82% | .83% | .84% | .84% | .86% |
| Net investment income (loss) | 1.61%I | .83% | .76% | 1.07% | .94% | 1.04% |
| Supplemental Data | | | | | | |
| Net assets, end of period (000 omitted) | $126,753 | $162,724 | $96,789 | $20,588 | $42,443 | $16,164 |
| Portfolio turnover rateJ | 67%I | 46% | 81% | 63% | 44% | 49% |
A Calculated based on average shares outstanding during the period.
B Net realized and unrealized gain (loss) per share reflects proceeds received from litigation which amounted to $.05 per share. Excluding these litigation proceeds, the total return would have been 11.29%
C Total distributions of $.77 per share is comprised of distributions from net investment income of $.245 and distributions from net realized gain of $.525 per share.
D Amount represents less than $.005 per share.
E Total returns for periods of less than one year are not annualized.
F Total returns would have been lower if certain expenses had not been reduced during the applicable periods shown.
G Fees and expenses of any underlying Fidelity Central Funds are not included in the Fund's expense ratio. The Fund indirectly bears its proportionate share of the expenses of any underlying Fidelity Central Funds.
H Expense ratios reflect operating expenses of the class. Expenses before reductions do not reflect amounts reimbursed by the investment adviser or reductions from brokerage service arrangements or reductions from other expense offset arrangements and do not represent the amount paid by the class during periods when reimbursements or reductions occur. Expenses net of fee waivers reflect expenses after reimbursement by the investment adviser but prior to reductions from brokerage service arrangements or other expense offset arrangements. Expenses net of all reductions represent the net expenses paid by the class.
I Annualized
J Amount does not include the portfolio activity of any underlying Fidelity Central Funds.
See accompanying notes which are an integral part of the financial statements.
Fidelity Advisor Financial Services Fund Class Z
| | Six months ended (Unaudited) January 31, |
| | 2019 A |
| Selected Per–Share Data | |
| Net asset value, beginning of period | $21.99 |
| Income from Investment Operations | |
| Net investment income (loss)B | .13 |
| Net realized and unrealized gain (loss) | (1.42) |
| Total from investment operations | (1.29) |
| Distributions from net investment income | (.29) |
| Distributions from net realized gain | (.53) |
| Total distributions | (.81)C |
| Net asset value, end of period | $19.89 |
| Total ReturnD,E | (5.71)% |
| Ratios to Average Net AssetsF,G | |
| Expenses before reductions | .66%H |
| Expenses net of fee waivers, if any | .66%H |
| Expenses net of all reductions | .65%H |
| Net investment income (loss) | 1.95%H |
| Supplemental Data | |
| Net assets, end of period (000 omitted) | $2,375 |
| Portfolio turnover rateI | 67%H |
A For the period October 2, 2018 (commencement of sale of shares) to January 31, 2019.
B Calculated based on average shares outstanding during the period.
C Total distributions of $.81 per share is comprised of distributions from net investment income of $.286 and distributions from net realized gain of $.525 per share.
D Total returns for periods of less than one year are not annualized.
E Total returns would have been lower if certain expenses had not been reduced during the applicable periods shown.
F Fees and expenses of any underlying Fidelity Central Funds are not included in the Fund's expense ratio. The Fund indirectly bears its proportionate share of the expenses of any underlying Fidelity Central Funds.
G Expense ratios reflect operating expenses of the class. Expenses before reductions do not reflect amounts reimbursed by the investment adviser or reductions from brokerage service arrangements or reductions from other expense offset arrangements and do not represent the amount paid by the class during periods when reimbursements or reductions occur. Expense ratios before reductions for start-up periods may not be representative of longer-term operating periods. Expenses net of fee waivers reflect expenses after reimbursement by the investment adviser but prior to reductions from brokerage service arrangements or other expense offset arrangements. Expenses net of all reductions represent the net expenses paid by the class.
H Annualized
I Amount does not include the portfolio activity of any underlying Fidelity Central Funds.
See accompanying notes which are an integral part of the financial statements.
Fidelity Advisor® Health Care Fund
Investment Summary (Unaudited)
Top Ten Stocks as of January 31, 2019
| | % of fund's net assets |
| UnitedHealth Group, Inc. | 9.0 |
| Becton, Dickinson & Co. | 7.6 |
| Boston Scientific Corp. | 6.7 |
| Humana, Inc. | 4.8 |
| Roche Holding AG (participation certificate) | 3.9 |
| AstraZeneca PLC (United Kingdom) | 3.7 |
| Cigna Corp. | 3.6 |
| Vertex Pharmaceuticals, Inc. | 3.1 |
| Sarepta Therapeutics, Inc. | 2.9 |
| HCA Holdings, Inc. | 2.9 |
| | 48.2 |
Top Industries (% of fund's net assets)
| As of January 31, 2019 |
| | Health Care Providers & Services | 28.3% |
| | Health Care Equipment & Supplies | 27.7% |
| | Biotechnology | 23.1% |
| | Pharmaceuticals | 16.6% |
| | Software | 1.2% |
| | All Others* | 3.1% |
* Includes short-term investments and net other assets (liabilities).
Fidelity Advisor® Health Care Fund
Schedule of Investments January 31, 2019 (Unaudited)
Showing Percentage of Net Assets
| Common Stocks - 98.0% | | | |
| | | Shares | Value |
| Biotechnology - 22.8% | | | |
| Biotechnology - 22.8% | | | |
| Abeona Therapeutics, Inc. (a) | | 860,000 | $5,839,400 |
| Acceleron Pharma, Inc. (a) | | 420,000 | 17,808,000 |
| Acorda Therapeutics, Inc. (a) | | 540,000 | 8,980,200 |
| Alexion Pharmaceuticals, Inc. (a) | | 820,000 | 100,827,200 |
| Allakos, Inc. (a)(b) | | 140,000 | 5,593,000 |
| Alnylam Pharmaceuticals, Inc. (a) | | 240,000 | 20,047,200 |
| Amgen, Inc. | | 530,000 | 99,168,300 |
| Amicus Therapeutics, Inc. (a) | | 900,000 | 10,836,000 |
| AnaptysBio, Inc. (a) | | 243,858 | 16,172,663 |
| Argenx SE ADR (a) | | 310,000 | 32,894,100 |
| Array BioPharma, Inc. (a) | | 1,391,841 | 25,985,671 |
| Ascendis Pharma A/S sponsored ADR(a) | | 339,018 | 24,226,226 |
| Atara Biotherapeutics, Inc. (a) | | 500,000 | 19,000,000 |
| BeiGene Ltd. ADR (a) | | 200,000 | 25,896,000 |
| Biogen, Inc. (a) | | 20,000 | 6,675,600 |
| bluebird bio, Inc. (a) | | 116,330 | 15,521,912 |
| Blueprint Medicines Corp. (a) | | 363,700 | 26,219,133 |
| Cellectis SA sponsored ADR (a) | | 256,526 | 4,532,814 |
| CytomX Therapeutics, Inc. (a) | | 207,106 | 3,516,660 |
| FibroGen, Inc. (a) | | 470,000 | 26,672,500 |
| GlycoMimetics, Inc. (a) | | 500,000 | 5,600,000 |
| Gritstone Oncology, Inc. | | 155,400 | 1,989,120 |
| Immunomedics, Inc. (a)(b) | | 1,140,000 | 16,860,600 |
| Insmed, Inc. (a) | | 1,140,000 | 27,713,400 |
| Intercept Pharmaceuticals, Inc. (a) | | 135,724 | 16,379,172 |
| La Jolla Pharmaceutical Co. (a) | | 240,000 | 1,449,600 |
| Neurocrine Biosciences, Inc. (a) | | 525,000 | 46,315,500 |
| Principia Biopharma, Inc. | | 44,857 | 1,359,616 |
| Sage Therapeutics, Inc. (a) | | 17,900 | 2,552,361 |
| Sarepta Therapeutics, Inc. (a)(b) | | 820,400 | 114,618,084 |
| Scholar Rock Holding Corp. | | 17,900 | 270,469 |
| uniQure B.V. (a) | | 220,000 | 7,535,000 |
| Vertex Pharmaceuticals, Inc. (a) | | 630,000 | 120,273,300 |
| Viking Therapeutics, Inc. (a)(b) | | 560,000 | 4,569,600 |
| Xencor, Inc. (a) | | 498,620 | 18,000,182 |
| Zymeworks, Inc. (a) | | 309,300 | 4,927,149 |
| | | | 886,825,732 |
| Diversified Consumer Services - 0.1% | | | |
| Specialized Consumer Services - 0.1% | | | |
| Carriage Services, Inc. | | 240,000 | 4,668,000 |
| Health Care Equipment & Supplies - 27.7% | | | |
| Health Care Equipment - 26.7% | | | |
| Atricure, Inc. (a) | | 690,000 | 21,355,500 |
| Becton, Dickinson & Co. | | 1,180,000 | 294,362,800 |
| Boston Scientific Corp. (a) | | 6,820,000 | 260,183,000 |
| Danaher Corp. | | 200,000 | 22,184,000 |
| Fisher & Paykel Healthcare Corp. | | 1,100,000 | 9,549,619 |
| Hologic, Inc. (a) | | 740,000 | 32,856,000 |
| Insulet Corp. (a) | | 488,700 | 39,677,553 |
| Integra LifeSciences Holdings Corp. (a) | | 500,000 | 23,680,000 |
| Intuitive Surgical, Inc. (a) | | 142,000 | 74,356,880 |
| Masimo Corp. (a) | | 327,811 | 40,776,410 |
| Penumbra, Inc. (a) | | 320,000 | 46,563,200 |
| Stryker Corp. | | 500,000 | 88,785,000 |
| Teleflex, Inc. | | 140,000 | 38,290,000 |
| Wright Medical Group NV (a) | | 1,600,000 | 47,744,000 |
| | | | 1,040,363,962 |
| Health Care Supplies - 1.0% | | | |
| Align Technology, Inc. (a) | | 100,000 | 24,895,000 |
| ICU Medical, Inc. (a) | | 50,000 | 12,440,000 |
| | | | 37,335,000 |
|
| TOTAL HEALTH CARE EQUIPMENT & SUPPLIES | | | 1,077,698,962 |
|
| Health Care Providers & Services - 28.2% | | | |
| Health Care Distributors & Services - 1.7% | | | |
| AmerisourceBergen Corp. | | 300,000 | 25,011,000 |
| EBOS Group Ltd. | | 1,290,000 | 19,339,845 |
| Henry Schein, Inc. (a) | | 300,000 | 23,310,000 |
| | | | 67,660,845 |
| Health Care Facilities - 2.9% | | | |
| HCA Holdings, Inc. | | 800,000 | 111,544,000 |
| Health Care Services - 4.4% | | | |
| 1Life Healthcare, Inc. (a)(c)(d) | | 160,901 | 1,999,999 |
| Cigna Corp. | | 700,000 | 139,867,000 |
| G1 Therapeutics, Inc. (a) | | 440,000 | 9,411,600 |
| Premier, Inc. (a) | | 300,000 | 11,937,000 |
| United Drug PLC (United Kingdom) | | 1,000,000 | 7,607,280 |
| | | | 170,822,879 |
| Managed Health Care - 19.2% | | | |
| Centene Corp. (a) | | 220,000 | 28,725,400 |
| Humana, Inc. | | 600,400 | 185,517,596 |
| Molina Healthcare, Inc. (a) | | 340,000 | 45,213,200 |
| Notre Dame Intermedica Participacoes SA | | 3,780,000 | 34,802,698 |
| UnitedHealth Group, Inc. | | 1,300,000 | 351,260,002 |
| Wellcare Health Plans, Inc. (a) | | 369,000 | 102,021,120 |
| | | | 747,540,016 |
|
| TOTAL HEALTH CARE PROVIDERS & SERVICES | | | 1,097,567,740 |
|
| Health Care Technology - 0.6% | | | |
| Health Care Technology - 0.6% | | | |
| Castlight Health, Inc. (a) | | 336,800 | 1,000,296 |
| Castlight Health, Inc. Class B (a) | | 800,000 | 2,376,000 |
| Teladoc Health, Inc. (a)(b) | | 300,000 | 19,260,000 |
| | | | 22,636,296 |
| Life Sciences Tools & Services - 1.0% | | | |
| Life Sciences Tools & Services - 1.0% | | | |
| Lonza Group AG | | 100,000 | 26,336,166 |
| Morphosys AG (a) | | 100,000 | 10,793,578 |
| | | | 37,129,744 |
| Pharmaceuticals - 16.5% | | | |
| Pharmaceuticals - 16.5% | | | |
| Allergan PLC | | 300,000 | 43,194,000 |
| Amneal Pharmaceuticals, Inc. (d) | | 675,676 | 8,297,301 |
| AstraZeneca PLC (United Kingdom) | | 2,000,000 | 144,883,921 |
| Bristol-Myers Squibb Co. | | 1,800,000 | 88,866,000 |
| Dechra Pharmaceuticals PLC | | 900,000 | 27,929,210 |
| Eli Lilly & Co. | | 450,000 | 53,937,000 |
| Mylan NV (a) | | 240,000 | 7,188,000 |
| MyoKardia, Inc. (a) | | 157,594 | 6,521,240 |
| Nektar Therapeutics (a) | | 1,090,000 | 46,150,600 |
| Recordati SpA | | 280,000 | 10,140,240 |
| Roche Holding AG (participation certificate) | | 575,000 | 152,970,555 |
| RPI International Holdings LP (a)(c)(d) | | 61,683 | 9,311,666 |
| The Medicines Company (a)(b) | | 528,400 | 12,211,324 |
| Theravance Biopharma, Inc. (a) | | 550,000 | 14,327,500 |
| Tonghua Dongbao Pharmaceutical Co. Ltd. Class A | | 1,000,000 | 1,671,442 |
| Zogenix, Inc. (a) | | 260,000 | 11,375,000 |
| | | | 638,974,999 |
| Software - 1.1% | | | |
| Application Software - 1.1% | | | |
| Benefitfocus, Inc. (a) | | 783,582 | 43,841,413 |
| TOTAL COMMON STOCKS | | | |
| (Cost $2,897,732,978) | | | 3,809,342,886 |
|
| Convertible Preferred Stocks - 0.6% | | | |
| Biotechnology - 0.3% | | | |
| Biotechnology - 0.3% | | | |
| BioNTech AG: | | | |
| Series A (a)(c)(d) | | 27,793 | 8,075,761 |
| Series A 0.00 (c) | | 6,787 | 1,972,086 |
| Generation Bio Series B (c)(d) | | 52,700 | 368,900 |
| | | | 10,416,747 |
| Health Care Providers & Services - 0.1% | | | |
| Health Care Services - 0.1% | | | |
| 1Life Healthcare, Inc. Series G (a)(c)(d) | | 322,145 | 4,004,262 |
| Pharmaceuticals - 0.1% | | | |
| Pharmaceuticals - 0.1% | | | |
| Harmony Biosciences II, Inc. Series A (a)(c)(d) | | 4,262,580 | 4,262,580 |
| Software - 0.1% | | | |
| Application Software - 0.1% | | | |
| Outset Medical, Inc.: | | | |
| Series C (a)(c)(d) | | 1,003,280 | 3,120,201 |
| Series D (c)(d) | | 884,245 | 2,750,002 |
| | | | 5,870,203 |
| TOTAL CONVERTIBLE PREFERRED STOCKS | | | |
| (Cost $20,254,547) | | | 24,553,792 |
|
| Money Market Funds - 3.2% | | | |
| Fidelity Cash Central Fund, 2.43% (e) | | 68,103,514 | 68,117,134 |
| Fidelity Securities Lending Cash Central Fund 2.43% (e)(f) | | 55,478,619 | 55,484,167 |
| TOTAL MONEY MARKET FUNDS | | | |
| (Cost $123,601,177) | | | 123,601,301 |
| TOTAL INVESTMENT IN SECURITIES - 101.8% | | | |
| (Cost $3,041,588,702) | | | 3,957,497,979 |
| NET OTHER ASSETS (LIABILITIES) - (1.8)% | | | (69,220,126) |
| NET ASSETS - 100% | | | $3,888,277,853 |
Legend
(a) Non-income producing
(b) Security or a portion of the security is on loan at period end.
(c) Level 3 security
(d) Restricted securities - Investment in securities not registered under the Securities Act of 1933 (excluding 144A issues). At the end of the period, the value of restricted securities (excluding 144A issues) amounted to $42,190,672 or 1.1% of net assets.
(e) Affiliated fund that is generally available only to investment companies and other accounts managed by Fidelity Investments. The rate quoted is the annualized seven-day yield of the fund at period end. A complete unaudited listing of the fund's holdings as of its most recent quarter end is available upon request. In addition, each Fidelity Central Fund's financial statements are available on the SEC's website or upon request.
(f) Investment made with cash collateral received from securities on loan.
Additional information on each restricted holding is as follows:
| Security | Acquisition Date | Acquisition Cost |
| 1Life Healthcare, Inc. | 9/28/18 | $1,999,999 |
| 1Life Healthcare, Inc. Series G | 4/10/14 | $2,121,583 |
| Amneal Pharmaceuticals, Inc. | 5/4/18 | $12,331,087 |
| BioNTech AG Series A | 12/29/17 | $6,086,907 |
| Generation Bio Series B | 2/21/18 | $481,978 |
| Harmony Biosciences II, Inc. Series A | 9/22/17 | $4,262,580 |
| Outset Medical, Inc. Series C | 4/19/17 | $2,600,000 |
| Outset Medical, Inc. Series D | 8/20/18 | $2,750,002 |
| RPI International Holdings LP | 5/21/15 - 3/23/16 | $8,207,868 |
Affiliated Central Funds
Information regarding fiscal year to date income earned by the Fund from investments in Fidelity Central Funds is as follows:
| Fund | Income earned |
| Fidelity Cash Central Fund | $724,556 |
| Fidelity Securities Lending Cash Central Fund | 89,278 |
| Total | $813,834 |
Amounts in the income column in the above table include any capital gain distributions from underlying funds, which are presented in the corresponding line-item in the Statement of Operations, if applicable.
Investment Valuation
The following is a summary of the inputs used, as of January 31, 2019, involving the Fund's assets and liabilities carried at fair value. The inputs or methodology used for valuing securities may not be an indication of the risk associated with investing in those securities. For more information on valuation inputs, and their aggregation into the levels used below, please refer to the Investment Valuation section in the accompanying Notes to Financial Statements.
| | Valuation Inputs at Reporting Date: |
| Description | Total | Level 1 | Level 2 | Level 3 |
| Investments in Securities: | | | | |
| Common Stocks | $3,809,342,886 | $3,500,176,745 | $297,854,476 | $11,311,665 |
| Convertible Preferred Stocks | 24,553,792 | -- | -- | 24,553,792 |
| Money Market Funds | 123,601,301 | 123,601,301 | -- | -- |
| Total Investments in Securities: | $3,957,497,979 | $3,623,778,046 | $297,854,476 | $35,865,457 |
Other Information
Distribution of investments by country or territory of incorporation, as a percentage of Total Net Assets, is as follows (Unaudited):
| United States of America | 82.6% |
| Switzerland | 4.6% |
| United Kingdom | 4.4% |
| Netherlands | 2.4% |
| Ireland | 1.3% |
| Cayman Islands | 1.3% |
| Others (Individually Less Than 1%) | 3.4% |
| | 100.0% |
See accompanying notes which are an integral part of the financial statements.
Fidelity Advisor® Health Care Fund
Financial Statements
Statement of Assets and Liabilities
| | | January 31, 2019 (Unaudited) |
| Assets | | |
Investment in securities, at value (including securities loaned of $55,479,749) — See accompanying schedule:
Unaffiliated issuers (cost $2,917,987,525) | $3,833,896,678 | |
| Fidelity Central Funds (cost $123,601,177) | 123,601,301 | |
| Total Investment in Securities (cost $3,041,588,702) | | $3,957,497,979 |
| Cash | | 533,428 |
| Receivable for investments sold | | 8,421,098 |
| Receivable for fund shares sold | | 13,643,347 |
| Dividends receivable | | 768,303 |
| Distributions receivable from Fidelity Central Funds | | 124,367 |
| Prepaid expenses | | 24,824 |
| Other receivables | | 32,108 |
| Total assets | | 3,981,045,454 |
| Liabilities | | |
| Payable for investments purchased | $28,576,393 | |
| Payable for fund shares redeemed | 5,532,848 | |
| Distributions payable | 316 | |
| Accrued management fee | 1,624,980 | |
| Distribution and service plan fees payable | 872,158 | |
| Other affiliated payables | 623,948 | |
| Other payables and accrued expenses | 58,453 | |
| Collateral on securities loaned | 55,478,505 | |
| Total liabilities | | 92,767,601 |
| Net Assets | | $3,888,277,853 |
| Net Assets consist of: | | |
| Paid in capital | | $3,019,601,369 |
| Total distributable earnings (loss) | | 868,676,484 |
| Net Assets | | $3,888,277,853 |
| Net Asset Value and Maximum Offering Price | | |
| Class A: | | |
| Net Asset Value and redemption price per share ($1,057,709,699 ÷ 22,025,723 shares) | | $48.02 |
| Maximum offering price per share (100/94.25 of $48.02) | | $50.95 |
| Class M: | | |
| Net Asset Value and redemption price per share ($303,215,757 ÷ 6,782,370 shares) | | $44.71 |
| Maximum offering price per share (100/96.50 of $44.71) | | $46.33 |
| Class C: | | |
| Net Asset Value and offering price per share ($687,675,638 ÷ 18,139,984 shares)(a) | | $37.91 |
| Class I: | | |
| Net Asset Value, offering price and redemption price per share ($1,678,670,064 ÷ 32,031,208 shares) | | $52.41 |
| Class Z: | | |
| Net Asset Value, offering price and redemption price per share ($161,006,695 ÷ 3,070,644 shares) | | $52.43 |
(a) Redemption price per share is equal to net asset value less any applicable contingent deferred sales charge.
See accompanying notes which are an integral part of the financial statements.
Statement of Operations
| | | Six months ended January 31, 2019 (Unaudited) |
| Investment Income | | |
| Dividends | | $11,141,746 |
| Income from Fidelity Central Funds (including $89,278 from security lending) | | 813,834 |
| Total income | | 11,955,580 |
| Expenses | | |
| Management fee | $9,524,802 | |
| Transfer agent fees | 3,313,574 | |
| Distribution and service plan fees | 5,384,917 | |
| Accounting and security lending fees | 511,302 | |
| Custodian fees and expenses | 48,570 | |
| Independent trustees' fees and expenses | 10,691 | |
| Registration fees | 133,856 | |
| Audit | 24,953 | |
| Legal | 13,379 | |
| Miscellaneous | 29,725 | |
| Total expenses before reductions | 18,995,769 | |
| Expense reductions | (18,455) | |
| Total expenses after reductions | | 18,977,314 |
| Net investment income (loss) | | (7,021,734) |
| Realized and Unrealized Gain (Loss) | | |
| Net realized gain (loss) on: | | |
| Investment securities: | | |
| Unaffiliated issuers | 12,436,517 | |
| Fidelity Central Funds | 3,114 | |
| Foreign currency transactions | 10,367 | |
| Total net realized gain (loss) | | 12,449,998 |
| Change in net unrealized appreciation (depreciation) on: | | |
| Investment securities: | | |
| Unaffiliated issuers | 7,185,935 | |
| Fidelity Central Funds | 124 | |
| Assets and liabilities in foreign currencies | (15,717) | |
| Total change in net unrealized appreciation (depreciation) | | 7,170,342 |
| Net gain (loss) | | 19,620,340 |
| Net increase (decrease) in net assets resulting from operations | | $12,598,606 |
See accompanying notes which are an integral part of the financial statements.
Statement of Changes in Net Assets
| | Six months ended January 31, 2019 (Unaudited) | Year ended July 31, 2018 |
| Increase (Decrease) in Net Assets | | |
| Operations | | |
| Net investment income (loss) | $(7,021,734) | $(7,253,427) |
| Net realized gain (loss) | 12,449,998 | 188,469,012 |
| Change in net unrealized appreciation (depreciation) | 7,170,342 | 338,700,272 |
| Net increase (decrease) in net assets resulting from operations | 12,598,606 | 519,915,857 |
| Distributions to shareholders | (164,980,431) | – |
| Distributions to shareholders from net realized gain | – | (585,049) |
| Total distributions | (164,980,431) | (585,049) |
| Share transactions - net increase (decrease) | 752,726,174 | 93,098,490 |
| Total increase (decrease) in net assets | 600,344,349 | 612,429,298 |
| Net Assets | | |
| Beginning of period | 3,287,933,504 | 2,675,504,206 |
| End of period | $3,888,277,853 | $3,287,933,504 |
| Other Information | | |
| Accumulated net investment loss end of period | | $(7,538,744) |
See accompanying notes which are an integral part of the financial statements.
Financial Highlights
Fidelity Advisor Health Care Fund Class A
| | Six months ended (Unaudited) January 31, | Years endedJuly 31, | | | | |
| | 2019 | 2018 | 2017 | 2016 | 2015 | 2014 |
| Selected Per–Share Data | | | | | | |
| Net asset value, beginning of period | $50.14 | $41.85 | $38.23 | $45.17 | $37.72 | $31.29 |
| Income from Investment Operations | | | | | | |
| Net investment income (loss)A | (.09) | (.07) | (.04) | (.09) | (.19) | (.18) |
| Net realized and unrealized gain (loss) | .19 | 8.36 | 3.66 | (4.30) | 12.03 | 10.13 |
| Total from investment operations | .10 | 8.29 | 3.62 | (4.39) | 11.84 | 9.95 |
| Distributions from net realized gain | (2.22) | – | – | (2.55) | (4.39) | (3.52) |
| Total distributions | (2.22) | – | – | (2.55) | (4.39) | (3.52) |
| Redemption fees added to paid in capitalA | – | – | –B | –B | –B | –B |
| Net asset value, end of period | $48.02 | $50.14 | $41.85 | $38.23 | $45.17 | $37.72 |
| Total ReturnC,D,E | .38% | 19.81% | 9.47% | (9.82)% | 34.07% | 34.79% |
| Ratios to Average Net AssetsF,G | | | | | | |
| Expenses before reductions | 1.03%H | 1.05% | 1.04% | 1.04% | 1.04% | 1.08% |
| Expenses net of fee waivers, if any | 1.03%H | 1.05% | 1.04% | 1.04% | 1.04% | 1.08% |
| Expenses net of all reductions | 1.03%H | 1.04% | 1.04% | 1.04% | 1.04% | 1.07% |
| Net investment income (loss) | (.35)%H | (.16)% | (.10)% | (.25)% | (.45)% | (.54)% |
| Supplemental Data | | | | | | |
| Net assets, end of period (000 omitted) | $1,057,710 | $1,003,430 | $875,176 | $1,159,614 | $1,374,654 | $613,995 |
| Portfolio turnover rateI | 47%H | 81% | 64% | 67% | 80% | 111% |
A Calculated based on average shares outstanding during the period.
B Amount represents less than $.005 per share.
C Total returns for periods of less than one year are not annualized.
D Total returns would have been lower if certain expenses had not been reduced during the applicable periods shown.
E Total returns do not include the effect of the sales charges.
F Fees and expenses of any underlying Fidelity Central Funds are not included in the Fund's expense ratio. The Fund indirectly bears its proportionate share of the expenses of any underlying Fidelity Central Funds.
G Expense ratios reflect operating expenses of the class. Expenses before reductions do not reflect amounts reimbursed by the investment adviser or reductions from brokerage service arrangements or reductions from other expense offset arrangements and do not represent the amount paid by the class during periods when reimbursements or reductions occur. Expenses net of fee waivers reflect expenses after reimbursement by the investment adviser but prior to reductions from brokerage service arrangements or other expense offset arrangements. Expenses net of all reductions represent the net expenses paid by the class.
H Annualized
I Amount does not include the portfolio activity of any underlying Fidelity Central Funds.
See accompanying notes which are an integral part of the financial statements.
Fidelity Advisor Health Care Fund Class M
| | Six months ended (Unaudited) January 31, | Years endedJuly 31, | | | | |
| | 2019 | 2018 | 2017 | 2016 | 2015 | 2014 |
| Selected Per–Share Data | | | | | | |
| Net asset value, beginning of period | $46.89 | $39.25 | $35.95 | $42.68 | $35.87 | $29.91 |
| Income from Investment Operations | | | | | | |
| Net investment income (loss)A | (.14) | (.18) | (.13) | (.18) | (.28) | (.26) |
| Net realized and unrealized gain (loss) | .18 | 7.82 | 3.43 | (4.06) | 11.39 | 9.67 |
| Total from investment operations | .04 | 7.64 | 3.30 | (4.24) | 11.11 | 9.41 |
| Distributions from net realized gain | (2.22) | – | – | (2.49) | (4.30) | (3.45) |
| Total distributions | (2.22) | – | – | (2.49) | (4.30) | (3.45) |
| Redemption fees added to paid in capitalA | – | – | –B | –B | –B | –B |
| Net asset value, end of period | $44.71 | $46.89 | $39.25 | $35.95 | $42.68 | $35.87 |
| Total ReturnC,D,E | .28% | 19.46% | 9.18% | (10.05)% | 33.69% | 34.49% |
| Ratios to Average Net AssetsF,G | | | | | | |
| Expenses before reductions | 1.29%H | 1.32% | 1.31% | 1.31% | 1.31% | 1.34% |
| Expenses net of fee waivers, if any | 1.29%H | 1.32% | 1.31% | 1.31% | 1.31% | 1.34% |
| Expenses net of all reductions | 1.29%H | 1.31% | 1.31% | 1.31% | 1.30% | 1.34% |
| Net investment income (loss) | (.61)%H | (.43)% | (.37)% | (.52)% | (.72)% | (.80)% |
| Supplemental Data | | | | | | |
| Net assets, end of period (000 omitted) | $303,216 | $298,061 | $269,332 | $293,556 | $348,886 | $216,973 |
| Portfolio turnover rateI | 47%H | 81% | 64% | 67% | 80% | 111% |
A Calculated based on average shares outstanding during the period.
B Amount represents less than $.005 per share.
C Total returns for periods of less than one year are not annualized.
D Total returns would have been lower if certain expenses had not been reduced during the applicable periods shown.
E Total returns do not include the effect of the sales charges.
F Fees and expenses of any underlying Fidelity Central Funds are not included in the Fund's expense ratio. The Fund indirectly bears its proportionate share of the expenses of any underlying Fidelity Central Funds.
G Expense ratios reflect operating expenses of the class. Expenses before reductions do not reflect amounts reimbursed by the investment adviser or reductions from brokerage service arrangements or reductions from other expense offset arrangements and do not represent the amount paid by the class during periods when reimbursements or reductions occur. Expenses net of fee waivers reflect expenses after reimbursement by the investment adviser but prior to reductions from brokerage service arrangements or other expense offset arrangements. Expenses net of all reductions represent the net expenses paid by the class.
H Annualized
I Amount does not include the portfolio activity of any underlying Fidelity Central Funds.
See accompanying notes which are an integral part of the financial statements.
Fidelity Advisor Health Care Fund Class C
| | Six months ended (Unaudited) January 31, | Years endedJuly 31, | | | | |
| | 2019 | 2018 | 2017 | 2016 | 2015 | 2014 |
| Selected Per–Share Data | | | | | | |
| Net asset value, beginning of period | $40.21 | $33.82 | $31.12 | $37.45 | $32.03 | $27.11 |
| Income from Investment Operations | | | | | | |
| Net investment income (loss)A | (.21) | (.33) | (.26) | (.30) | (.41) | (.38) |
| Net realized and unrealized gain (loss) | .13 | 6.72 | 2.96 | (3.57) | 10.05 | 8.68 |
| Total from investment operations | (.08) | 6.39 | 2.70 | (3.87) | 9.64 | 8.30 |
| Distributions from net realized gain | (2.22) | – | – | (2.46) | (4.22) | (3.38) |
| Total distributions | (2.22) | – | – | (2.46) | (4.22) | (3.38) |
| Redemption fees added to paid in capitalA | – | – | –B | –B | –B | –B |
| Net asset value, end of period | $37.91 | $40.21 | $33.82 | $31.12 | $37.45 | $32.03 |
| Total ReturnC,D,E | .02% | 18.89% | 8.68% | (10.50)% | 33.04% | 33.83% |
| Ratios to Average Net AssetsF,G | | | | | | |
| Expenses before reductions | 1.77%H | 1.80% | 1.79% | 1.79% | 1.79% | 1.83% |
| Expenses net of fee waivers, if any | 1.77%H | 1.80% | 1.79% | 1.79% | 1.79% | 1.83% |
| Expenses net of all reductions | 1.77%H | 1.79% | 1.79% | 1.79% | 1.79% | 1.82% |
| Net investment income (loss) | (1.09)%H | (.91)% | (.85)% | (1.00)% | (1.20)% | (1.29)% |
| Supplemental Data | | | | | | |
| Net assets, end of period (000 omitted) | $687,676 | $669,639 | $619,991 | $695,374 | $761,070 | $257,859 |
| Portfolio turnover rateI | 47%H | 81% | 64% | 67% | 80% | 111% |
A Calculated based on average shares outstanding during the period.
B Amount represents less than $.005 per share.
C Total returns for periods of less than one year are not annualized.
D Total returns would have been lower if certain expenses had not been reduced during the applicable periods shown.
E Total returns do not include the effect of the contingent deferred sales charge.
F Fees and expenses of any underlying Fidelity Central Funds are not included in the Fund's expense ratio. The Fund indirectly bears its proportionate share of the expenses of any underlying Fidelity Central Funds.
G Expense ratios reflect operating expenses of the class. Expenses before reductions do not reflect amounts reimbursed by the investment adviser or reductions from brokerage service arrangements or reductions from other expense offset arrangements and do not represent the amount paid by the class during periods when reimbursements or reductions occur. Expenses net of fee waivers reflect expenses after reimbursement by the investment adviser but prior to reductions from brokerage service arrangements or other expense offset arrangements. Expenses net of all reductions represent the net expenses paid by the class.
H Annualized
I Amount does not include the portfolio activity of any underlying Fidelity Central Funds.
See accompanying notes which are an integral part of the financial statements.
Fidelity Advisor Health Care Fund Class I
| | Six months ended (Unaudited) January 31, | Years endedJuly 31, | | | | |
| | 2019 | 2018 | 2017 | 2016 | 2015 | 2014 |
| Selected Per–Share Data | | | | | | |
| Net asset value, beginning of period | $54.43 | $45.35 | $41.31 | $48.53 | $40.22 | $33.12 |
| Income from Investment Operations | | | | | | |
| Net investment income (loss)A | (.02) | .05 | .07 | –B | (.09) | (.10) |
| Net realized and unrealized gain (loss) | .22 | 9.06 | 3.97 | (4.62) | 12.88 | 10.80 |
| Total from investment operations | .20 | 9.11 | 4.04 | (4.62) | 12.79 | 10.70 |
| Distributions from net realized gain | (2.22) | (.03) | – | (2.60) | (4.48) | (3.60) |
| Total distributions | (2.22) | (.03) | – | (2.60) | (4.48) | (3.60) |
| Redemption fees added to paid in capitalA | – | – | –B | –B | –B | –B |
| Net asset value, end of period | $52.41 | $54.43 | $45.35 | $41.31 | $48.53 | $40.22 |
| Total ReturnC,D | .54% | 20.09% | 9.78% | (9.60)% | 34.40% | 35.21% |
| Ratios to Average Net AssetsE,F | | | | | | |
| Expenses before reductions | .77%G | .79% | .78% | .78% | .79% | .81% |
| Expenses net of fee waivers, if any | .76%G | .79% | .78% | .78% | .79% | .81% |
| Expenses net of all reductions | .76%G | .78% | .78% | .78% | .78% | .81% |
| Net investment income (loss) | (.08)%G | .10% | .16% | .01% | (.20)% | (.27)% |
| Supplemental Data | | | | | | |
| Net assets, end of period (000 omitted) | $1,678,670 | $1,316,804 | $911,005 | $658,848 | $832,415 | $292,654 |
| Portfolio turnover rateH | 47%G | 81% | 64% | 67% | 80% | 111% |
A Calculated based on average shares outstanding during the period.
B Amount represents less than $.005 per share.
C Total returns for periods of less than one year are not annualized.
D Total returns would have been lower if certain expenses had not been reduced during the applicable periods shown.
E Fees and expenses of any underlying Fidelity Central Funds are not included in the Fund's expense ratio. The Fund indirectly bears its proportionate share of the expenses of any underlying Fidelity Central Funds.
F Expense ratios reflect operating expenses of the class. Expenses before reductions do not reflect amounts reimbursed by the investment adviser or reductions from brokerage service arrangements or reductions from other expense offset arrangements and do not represent the amount paid by the class during periods when reimbursements or reductions occur. Expenses net of fee waivers reflect expenses after reimbursement by the investment adviser but prior to reductions from brokerage service arrangements or other expense offset arrangements. Expenses net of all reductions represent the net expenses paid by the class.
G Annualized
H Amount does not include the portfolio activity of any underlying Fidelity Central Funds.
See accompanying notes which are an integral part of the financial statements.
Fidelity Advisor Health Care Fund Class Z
| | Six months ended (Unaudited) January 31, |
| | 2019 A |
| Selected Per–Share Data | |
| Net asset value, beginning of period | $57.87 |
| Income from Investment Operations | |
| Net investment income (loss)B | (.04) |
| Net realized and unrealized gain (loss) | (3.18) |
| Total from investment operations | (3.22) |
| Distributions from net realized gain | (2.22) |
| Total distributions | (2.22) |
| Net asset value, end of period | $52.43 |
| Total ReturnC,D | (5.41)% |
| Ratios to Average Net AssetsE,F | |
| Expenses before reductions | .63%G |
| Expenses net of fee waivers, if any | .63%G |
| Expenses net of all reductions | .63%G |
| Net investment income (loss) | (.22)%G |
| Supplemental Data | |
| Net assets, end of period (000 omitted) | $161,007 |
| Portfolio turnover rateH | 47%G |
A For the period October 2, 2018 (commencement of sale of shares) to January 31, 2019.
B Calculated based on average shares outstanding during the period.
C Total returns for periods of less than one year are not annualized.
D Total returns would have been lower if certain expenses had not been reduced during the applicable periods shown.
E Fees and expenses of any underlying Fidelity Central Funds are not included in the Fund's expense ratio. The Fund indirectly bears its proportionate share of the expenses of any underlying Fidelity Central Funds.
F Expense ratios reflect operating expenses of the class. Expenses before reductions do not reflect amounts reimbursed by the investment adviser or reductions from brokerage service arrangements or reductions from other expense offset arrangements and do not represent the amount paid by the class during periods when reimbursements or reductions occur. Expense ratios before reductions for start-up periods may not be representative of longer-term operating periods. Expenses net of fee waivers reflect expenses after reimbursement by the investment adviser but prior to reductions from brokerage service arrangements or other expense offset arrangements. Expenses net of all reductions represent the net expenses paid by the class.
G Annualized
H Amount does not include the portfolio activity of any underlying Fidelity Central Funds.
See accompanying notes which are an integral part of the financial statements.
Fidelity Advisor® Industrials Fund
Investment Summary (Unaudited)
Top Ten Stocks as of January 31, 2019
| | % of fund's net assets |
| The Boeing Co. | 9.2 |
| Union Pacific Corp. | 6.1 |
| AMETEK, Inc. | 5.0 |
| IDEX Corp. | 5.0 |
| HD Supply Holdings, Inc. | 4.5 |
| Ingersoll-Rand PLC | 4.3 |
| Emerson Electric Co. | 3.6 |
| Norfolk Southern Corp. | 3.5 |
| Honeywell International, Inc. | 3.5 |
| CSX Corp. | 3.3 |
| | 48.0 |
Top Industries (% of fund's net assets)
| As of January 31, 2019 |
| | Aerospace & Defense | 25.3% |
| | Machinery | 17.4% |
| | Road & Rail | 13.9% |
| | Industrial Conglomerates | 12.2% |
| | Electrical Equipment | 11.4% |
| | All Others* | 19.8% |

* Includes short-term investments and net other assets (liabilities).
Fidelity Advisor® Industrials Fund
Schedule of Investments January 31, 2019 (Unaudited)
Showing Percentage of Net Assets
| Common Stocks - 99.8% | | | |
| | | Shares | Value |
| Aerospace & Defense - 25.3% | | | |
| Aerospace & Defense - 25.3% | | | |
| Arconic, Inc. | | 306,300 | $5,764,566 |
| General Dynamics Corp. | | 91,262 | 15,621,317 |
| HEICO Corp. Class A | | 161,500 | 11,309,845 |
| Huntington Ingalls Industries, Inc. | | 27,900 | 5,759,955 |
| Northrop Grumman Corp. | | 49,600 | 13,667,280 |
| Raytheon Co. | | 88,000 | 14,498,880 |
| Teledyne Technologies, Inc. (a) | | 36,865 | 8,265,870 |
| Textron, Inc. | | 19,900 | 1,059,277 |
| The Boeing Co. | | 154,100 | 59,424,042 |
| TransDigm Group, Inc. (a) | | 35,000 | 13,685,000 |
| United Technologies Corp. | | 116,876 | 13,799,549 |
| | | | 162,855,581 |
| Air Freight & Logistics - 2.0% | | | |
| Air Freight & Logistics - 2.0% | | | |
| United Parcel Service, Inc. Class B | | 122,200 | 12,879,880 |
| Airlines - 4.2% | | | |
| Airlines - 4.2% | | | |
| Delta Air Lines, Inc. | | 203,500 | 10,059,005 |
| Southwest Airlines Co. | | 194,500 | 11,039,820 |
| Spirit Airlines, Inc. (a) | | 106,300 | 6,252,566 |
| | | | 27,351,391 |
| Building Products - 2.6% | | | |
| Building Products - 2.6% | | | |
| Allegion PLC | | 77,100 | 6,619,806 |
| Jeld-Wen Holding, Inc. (a) | | 109,761 | 1,958,136 |
| Lennox International, Inc. | | 34,500 | 7,910,160 |
| | | | 16,488,102 |
| Commercial Services & Supplies - 3.7% | | | |
| Diversified Support Services - 1.2% | | | |
| Cintas Corp. | | 41,341 | 7,751,851 |
| Environmental & Facility Services - 2.5% | | | |
| Waste Connection, Inc. (United States) | | 193,100 | 16,135,436 |
|
| TOTAL COMMERCIAL SERVICES & SUPPLIES | | | 23,887,287 |
|
| Construction & Engineering - 1.3% | | | |
| Construction & Engineering - 1.3% | | | |
| Jacobs Engineering Group, Inc. | | 88,700 | 5,747,760 |
| KBR, Inc. | | 162,600 | 2,796,720 |
| | | | 8,544,480 |
| Electrical Equipment - 11.4% | | | |
| Electrical Components & Equipment - 11.4% | | | |
| AMETEK, Inc. | | 442,226 | 32,238,275 |
| Emerson Electric Co. | | 360,100 | 23,575,747 |
| Fortive Corp. | | 239,666 | 17,972,553 |
| | | | 73,786,575 |
| Industrial Conglomerates - 12.2% | | | |
| Industrial Conglomerates - 12.2% | | | |
| 3M Co. | | 46,100 | 9,233,830 |
| General Electric Co. | | 1,625,848 | 16,518,616 |
| Honeywell International, Inc. | | 155,733 | 22,367,931 |
| ITT, Inc. | | 261,500 | 13,744,440 |
| Roper Technologies, Inc. | | 59,900 | 16,967,274 |
| | | | 78,832,091 |
| Machinery - 17.4% | | | |
| Agricultural & Farm Machinery - 2.7% | | | |
| Deere & Co. | | 105,000 | 17,220,000 |
| Construction Machinery & Heavy Trucks - 2.9% | | | |
| Allison Transmission Holdings, Inc. | | 66,300 | 3,226,821 |
| Caterpillar, Inc. | | 118,600 | 15,792,776 |
| | | | 19,019,597 |
| Industrial Machinery - 11.8% | | | |
| Flowserve Corp. | | 152,100 | 6,698,484 |
| Gardner Denver Holdings, Inc. (a) | | 227,000 | 5,600,090 |
| IDEX Corp. | | 233,129 | 32,139,164 |
| Ingersoll-Rand PLC | | 277,200 | 27,731,088 |
| Xylem, Inc. | | 55,900 | 3,983,434 |
| | | | 76,152,260 |
|
| TOTAL MACHINERY | | | 112,391,857 |
|
| Professional Services - 1.3% | | | |
| Research & Consulting Services - 1.3% | | | |
| IHS Markit Ltd. (a) | | 45,200 | 2,346,784 |
| Nielsen Holdings PLC | | 220,900 | 5,672,712 |
| | | | 8,019,496 |
| Road & Rail - 13.9% | | | |
| Railroads - 12.9% | | | |
| CSX Corp. | | 322,400 | 21,181,680 |
| Norfolk Southern Corp. | | 134,600 | 22,577,804 |
| Union Pacific Corp. | | 247,800 | 39,417,546 |
| | | | 83,177,030 |
| Trucking - 1.0% | | | |
| J.B. Hunt Transport Services, Inc. | | 57,600 | 6,165,504 |
|
| TOTAL ROAD & RAIL | | | 89,342,534 |
|
| Trading Companies & Distributors - 4.5% | | | |
| Trading Companies & Distributors - 4.5% | | | |
| HD Supply Holdings, Inc. (a) | | 687,000 | 28,812,780 |
| TOTAL COMMON STOCKS | | | |
| (Cost $534,587,968) | | | 643,192,054 |
|
| Money Market Funds - 0.4% | | | |
| Fidelity Cash Central Fund, 2.43% (b) | | | |
| (Cost $2,721,176) | | 2,720,632 | 2,721,176 |
| TOTAL INVESTMENT IN SECURITIES - 100.2% | | | |
| (Cost $537,309,144) | | | 645,913,230 |
| NET OTHER ASSETS (LIABILITIES) - (0.2)% | | | (1,082,133) |
| NET ASSETS - 100% | | | $644,831,097 |
Legend
(a) Non-income producing
(b) Affiliated fund that is generally available only to investment companies and other accounts managed by Fidelity Investments. The rate quoted is the annualized seven-day yield of the fund at period end. A complete unaudited listing of the fund's holdings as of its most recent quarter end is available upon request. In addition, each Fidelity Central Fund's financial statements are available on the SEC's website or upon request.
Affiliated Central Funds
Information regarding fiscal year to date income earned by the Fund from investments in Fidelity Central Funds is as follows:
| Fund | Income earned |
| Fidelity Cash Central Fund | $43,820 |
| Fidelity Securities Lending Cash Central Fund | 46,453 |
| Total | $90,273 |
Amounts in the income column in the above table include any capital gain distributions from underlying funds, which are presented in the corresponding line-item in the Statement of Operations, if applicable.
Investment Valuation
All investments are categorized as Level 1 under the Fair Value Hierarchy. The inputs or methodology used for valuing securities may not be an indication of the risk associated with investing in those securities. For more information on valuation inputs please refer to the Investment Valuation section in the accompanying Notes to Financial Statements.
See accompanying notes which are an integral part of the financial statements.
Fidelity Advisor® Industrials Fund
Financial Statements
Statement of Assets and Liabilities
| | | January 31, 2019 (Unaudited) |
| Assets | | |
Investment in securities, at value — See accompanying schedule:
Unaffiliated issuers (cost $534,587,968) | $643,192,054 | |
| Fidelity Central Funds (cost $2,721,176) | 2,721,176 | |
| Total Investment in Securities (cost $537,309,144) | | $645,913,230 |
| Receivable for investments sold | | 8,792,384 |
| Receivable for fund shares sold | | 336,856 |
| Dividends receivable | | 246,922 |
| Distributions receivable from Fidelity Central Funds | | 2,275 |
| Prepaid expenses | | 7,720 |
| Other receivables | | 6,885 |
| Total assets | | 655,306,272 |
| Liabilities | | |
| Payable for investments purchased | $6,989,418 | |
| Payable for fund shares redeemed | 2,890,977 | |
| Accrued management fee | 279,824 | |
| Distribution and service plan fees payable | 160,864 | |
| Other affiliated payables | 121,945 | |
| Other payables and accrued expenses | 32,147 | |
| Total liabilities | | 10,475,175 |
| Net Assets | | $644,831,097 |
| Net Assets consist of: | | |
| Paid in capital | | $533,378,751 |
| Total distributable earnings (loss) | | 111,452,346 |
| Net Assets | | $644,831,097 |
| Net Asset Value and Maximum Offering Price | | |
| Class A: | | |
| Net Asset Value and redemption price per share ($244,510,801 ÷ 6,969,673 shares) | | $35.08 |
| Maximum offering price per share (100/94.25 of $35.08) | | $37.22 |
| Class M: | | |
| Net Asset Value and redemption price per share ($59,411,260 ÷ 1,734,030 shares) | | $34.26 |
| Maximum offering price per share (100/96.50 of $34.26) | | $35.50 |
| Class C: | | |
| Net Asset Value and offering price per share ($110,616,928 ÷ 3,570,050 shares)(a) | | $30.98 |
| Class I: | | |
| Net Asset Value, offering price and redemption price per share ($222,178,513 ÷ 5,995,056 shares) | | $37.06 |
| Class Z: | | |
| Net Asset Value, offering price and redemption price per share ($8,113,595 ÷ 219,369 shares) | | $36.99 |
(a) Redemption price per share is equal to net asset value less any applicable contingent deferred sales charge.
See accompanying notes which are an integral part of the financial statements.
Statement of Operations
| | | Six months ended January 31, 2019 (Unaudited) |
| Investment Income | | |
| Dividends | | $5,995,439 |
| Income from Fidelity Central Funds (including $46,453 from security lending) | | 90,273 |
| Total income | | 6,085,712 |
| Expenses | | |
| Management fee | $2,016,535 | |
| Transfer agent fees | 707,808 | |
| Distribution and service plan fees | 1,125,555 | |
| Accounting and security lending fees | 131,640 | |
| Custodian fees and expenses | 9,225 | |
| Independent trustees' fees and expenses | 2,486 | |
| Registration fees | 55,508 | |
| Audit | 22,590 | |
| Legal | 1,250 | |
| Interest | 4,501 | |
| Miscellaneous | 2,613 | |
| Total expenses before reductions | 4,079,711 | |
| Expense reductions | (13,157) | |
| Total expenses after reductions | | 4,066,554 |
| Net investment income (loss) | | 2,019,158 |
| Realized and Unrealized Gain (Loss) | | |
| Net realized gain (loss) on: | | |
| Investment securities: | | |
| Unaffiliated issuers | 19,051,269 | |
| Fidelity Central Funds | 131 | |
| Foreign currency transactions | (12,573) | |
| Total net realized gain (loss) | | 19,038,827 |
| Change in net unrealized appreciation (depreciation) on investment securities | | (94,136,087) |
| Net gain (loss) | | (75,097,260) |
| Net increase (decrease) in net assets resulting from operations | | $(73,078,102) |
See accompanying notes which are an integral part of the financial statements.
Statement of Changes in Net Assets
| | Six months ended January 31, 2019 (Unaudited) | Year ended July 31, 2018 |
| Increase (Decrease) in Net Assets | | |
| Operations | | |
| Net investment income (loss) | $2,019,158 | $2,303,757 |
| Net realized gain (loss) | 19,038,827 | 70,245,358 |
| Change in net unrealized appreciation (depreciation) | (94,136,087) | 49,664,575 |
| Net increase (decrease) in net assets resulting from operations | (73,078,102) | 122,213,690 |
| Distributions to shareholders | (71,563,519) | – |
| Distributions to shareholders from net investment income | – | (2,287,828) |
| Distributions to shareholders from net realized gain | – | (23,731,779) |
| Total distributions | (71,563,519) | (26,019,607) |
| Share transactions - net increase (decrease) | (45,021,689) | (77,388,887) |
| Total increase (decrease) in net assets | (189,663,310) | 18,805,196 |
| Net Assets | | |
| Beginning of period | 834,494,407 | 815,689,211 |
| End of period | $644,831,097 | $834,494,407 |
| Other Information | | |
| Undistributed net investment income end of period | | $889,880 |
See accompanying notes which are an integral part of the financial statements.
Financial Highlights
Fidelity Advisor Industrials Fund Class A
| | Six months ended (Unaudited) January 31, | Years endedJuly 31, | | | | |
| | 2019 | 2018 | 2017 | 2016 | 2015 | 2014 |
| Selected Per–Share Data | | | | | | |
| Net asset value, beginning of period | $42.62 | $37.89 | $35.52 | $37.06 | $36.92 | $34.50 |
| Income from Investment Operations | | | | | | |
| Net investment income (loss)A | .11 | .13 | .19 | .15 | .17 | .13 |
| Net realized and unrealized gain (loss) | (3.76) | 5.87 | 4.24 | 1.34 | 2.76 | 4.01 |
| Total from investment operations | (3.65) | 6.00 | 4.43 | 1.49 | 2.93 | 4.14 |
| Distributions from net investment income | (.19) | (.10) | (.16) | (.14) | (.11) | (.15) |
| Distributions from net realized gain | (3.70) | (1.17) | (1.90) | (2.89) | (2.68) | (1.58) |
| Total distributions | (3.89) | (1.27) | (2.06) | (3.03) | (2.79) | (1.72)B |
| Redemption fees added to paid in capitalA | – | – | –C | –C | –C | –C |
| Net asset value, end of period | $35.08 | $42.62 | $37.89 | $35.52 | $37.06 | $36.92 |
| Total ReturnD,E,F | (8.08)% | 15.97% | 12.62% | 5.04% | 8.17% | 12.52% |
| Ratios to Average Net AssetsG,H | | | | | | |
| Expenses before reductions | 1.04%I | 1.06% | 1.06% | 1.06% | 1.06% | 1.09% |
| Expenses net of fee waivers, if any | 1.04%I | 1.06% | 1.06% | 1.06% | 1.06% | 1.09% |
| Expenses net of all reductions | 1.04%I | 1.05% | 1.06% | 1.06% | 1.06% | 1.09% |
| Net investment income (loss) | .59%I | .32% | .53% | .45% | .46% | .37% |
| Supplemental Data | | | | | | |
| Net assets, end of period (000 omitted) | $244,511 | $303,201 | $309,204 | $279,055 | $333,405 | $378,826 |
| Portfolio turnover rateJ | 140%I | 61% | 57% | 53% | 70% | 57% |
A Calculated based on average shares outstanding during the period.
B Total distributions of $1.72 per share is comprised of distributions from net investment income of $.146 and distributions from net realized gain of $1.577 per share.
C Amount represents less than $.005 per share.
D Total returns for periods of less than one year are not annualized.
E Total returns would have been lower if certain expenses had not been reduced during the applicable periods shown.
F Total returns do not include the effect of the sales charges.
G Fees and expenses of any underlying Fidelity Central Funds are not included in the Fund's expense ratio. The Fund indirectly bears its proportionate share of the expenses of any underlying Fidelity Central Funds.
H Expense ratios reflect operating expenses of the class. Expenses before reductions do not reflect amounts reimbursed by the investment adviser or reductions from brokerage service arrangements or reductions from other expense offset arrangements and do not represent the amount paid by the class during periods when reimbursements or reductions occur. Expenses net of fee waivers reflect expenses after reimbursement by the investment adviser but prior to reductions from brokerage service arrangements or other expense offset arrangements. Expenses net of all reductions represent the net expenses paid by the class.
I Annualized
J Amount does not include the portfolio activity of any underlying Fidelity Central Funds.
See accompanying notes which are an integral part of the financial statements.
Fidelity Advisor Industrials Fund Class M
| | Six months ended (Unaudited) January 31, | Years endedJuly 31, | | | | |
| | 2019 | 2018 | 2017 | 2016 | 2015 | 2014 |
| Selected Per–Share Data | | | | | | |
| Net asset value, beginning of period | $41.65 | $37.03 | $34.77 | $36.35 | $36.29 | $33.93 |
| Income from Investment Operations | | | | | | |
| Net investment income (loss)A | .06 | .03 | .10 | .06 | .07 | .04 |
| Net realized and unrealized gain (loss) | (3.68) | 5.74 | 4.14 | 1.31 | 2.71 | 3.95 |
| Total from investment operations | (3.62) | 5.77 | 4.24 | 1.37 | 2.78 | 3.99 |
| Distributions from net investment income | (.07) | – | (.08) | (.06) | (.05) | (.06) |
| Distributions from net realized gain | (3.70) | (1.15) | (1.90) | (2.89) | (2.67) | (1.58) |
| Total distributions | (3.77) | (1.15) | (1.98) | (2.95) | (2.72) | (1.63)B |
| Redemption fees added to paid in capitalA | – | – | –C | –C | –C | –C |
| Net asset value, end of period | $34.26 | $41.65 | $37.03 | $34.77 | $36.35 | $36.29 |
| Total ReturnD,E,F | (8.21)% | 15.70% | 12.33% | 4.74% | 7.88% | 12.27% |
| Ratios to Average Net AssetsG,H | | | | | | |
| Expenses before reductions | 1.31%I | 1.32% | 1.32% | 1.33% | 1.33% | 1.33% |
| Expenses net of fee waivers, if any | 1.31%I | 1.32% | 1.32% | 1.33% | 1.32% | 1.33% |
| Expenses net of all reductions | 1.30%I | 1.31% | 1.32% | 1.32% | 1.32% | 1.33% |
| Net investment income (loss) | .32%I | .07% | .27% | .19% | .20% | .12% |
| Supplemental Data | | | | | | |
| Net assets, end of period (000 omitted) | $59,411 | $72,143 | $87,253 | $79,196 | $88,116 | $90,509 |
| Portfolio turnover rateJ | 140%I | 61% | 57% | 53% | 70% | 57% |
A Calculated based on average shares outstanding during the period.
B Total distributions of $1.63 per share is comprised of distributions from net investment income of $.057 and distributions from net realized gain of $1.577 per share.
C Amount represents less than $.005 per share.
D Total returns for periods of less than one year are not annualized.
E Total returns would have been lower if certain expenses had not been reduced during the applicable periods shown.
F Total returns do not include the effect of the sales charges.
G Fees and expenses of any underlying Fidelity Central Funds are not included in the Fund's expense ratio. The Fund indirectly bears its proportionate share of the expenses of any underlying Fidelity Central Funds.
H Expense ratios reflect operating expenses of the class. Expenses before reductions do not reflect amounts reimbursed by the investment adviser or reductions from brokerage service arrangements or reductions from other expense offset arrangements and do not represent the amount paid by the class during periods when reimbursements or reductions occur. Expenses net of fee waivers reflect expenses after reimbursement by the investment adviser but prior to reductions from brokerage service arrangements or other expense offset arrangements. Expenses net of all reductions represent the net expenses paid by the class.
I Annualized
J Amount does not include the portfolio activity of any underlying Fidelity Central Funds.
See accompanying notes which are an integral part of the financial statements.
Fidelity Advisor Industrials Fund Class C
| | Six months ended (Unaudited) January 31, | Years endedJuly 31, | | | | |
| | 2019 | 2018 | 2017 | 2016 | 2015 | 2014 |
| Selected Per–Share Data | | | | | | |
| Net asset value, beginning of period | $38.09 | $34.09 | $32.24 | $34.02 | $34.13 | $32.08 |
| Income from Investment Operations | | | | | | |
| Net investment income (loss)A | (.03) | (.16) | (.08) | (.09) | (.10) | (.13) |
| Net realized and unrealized gain (loss) | (3.38) | 5.28 | 3.83 | 1.20 | 2.54 | 3.73 |
| Total from investment operations | (3.41) | 5.12 | 3.75 | 1.11 | 2.44 | 3.60 |
| Distributions from net investment income | – | – | – | – | – | – |
| Distributions from net realized gain | (3.70) | (1.12) | (1.90) | (2.89) | (2.55) | (1.55) |
| Total distributions | (3.70) | (1.12) | (1.90) | (2.89) | (2.55) | (1.55) |
| Redemption fees added to paid in capitalA | – | – | –B | –B | –B | –B |
| Net asset value, end of period | $30.98 | $38.09 | $34.09 | $32.24 | $34.02 | $34.13 |
| Total ReturnC,D,E | (8.45)% | 15.13% | 11.76% | 4.25% | 7.36% | 11.71% |
| Ratios to Average Net AssetsF,G | | | | | | |
| Expenses before reductions | 1.80%H | 1.82% | 1.82% | 1.82% | 1.82% | 1.83% |
| Expenses net of fee waivers, if any | 1.79%H | 1.82% | 1.82% | 1.82% | 1.82% | 1.83% |
| Expenses net of all reductions | 1.79%H | 1.81% | 1.81% | 1.81% | 1.81% | 1.83% |
| Net investment income (loss) | (.17)%H | (.43)% | (.23)% | (.30)% | (.30)% | (.38)% |
| Supplemental Data | | | | | | |
| Net assets, end of period (000 omitted) | $110,617 | $138,249 | $134,505 | $112,425 | $141,494 | $147,749 |
| Portfolio turnover rateI | 140%H | 61% | 57% | 53% | 70% | 57% |
A Calculated based on average shares outstanding during the period.
B Amount represents less than $.005 per share.
C Total returns for periods of less than one year are not annualized.
D Total returns would have been lower if certain expenses had not been reduced during the applicable periods shown.
E Total returns do not include the effect of the contingent deferred sales charge.
F Fees and expenses of any underlying Fidelity Central Funds are not included in the Fund's expense ratio. The Fund indirectly bears its proportionate share of the expenses of any underlying Fidelity Central Funds.
G Expense ratios reflect operating expenses of the class. Expenses before reductions do not reflect amounts reimbursed by the investment adviser or reductions from brokerage service arrangements or reductions from other expense offset arrangements and do not represent the amount paid by the class during periods when reimbursements or reductions occur. Expenses net of fee waivers reflect expenses after reimbursement by the investment adviser but prior to reductions from brokerage service arrangements or other expense offset arrangements. Expenses net of all reductions represent the net expenses paid by the class.
H Annualized
I Amount does not include the portfolio activity of any underlying Fidelity Central Funds.
See accompanying notes which are an integral part of the financial statements.
Fidelity Advisor Industrials Fund Class I
| | Six months ended (Unaudited) January 31, | Years endedJuly 31, | | | | |
| | 2019 | 2018 | 2017 | 2016 | 2015 | 2014 |
| Selected Per–Share Data | | | | | | |
| Net asset value, beginning of period | $44.85 | $39.80 | $37.21 | $38.67 | $38.42 | $35.83 |
| Income from Investment Operations | | | | | | |
| Net investment income (loss)A | .18 | .25 | .31 | .25 | .28 | .25 |
| Net realized and unrealized gain (loss) | (3.97) | 6.18 | 4.44 | 1.42 | 2.87 | 4.16 |
| Total from investment operations | (3.79) | 6.43 | 4.75 | 1.67 | 3.15 | 4.41 |
| Distributions from net investment income | (.30) | (.21) | (.25) | (.24) | (.22) | (.24) |
| Distributions from net realized gain | (3.70) | (1.17) | (1.90) | (2.89) | (2.68) | (1.58) |
| Total distributions | (4.00) | (1.38) | (2.16)B | (3.13) | (2.90) | (1.82) |
| Redemption fees added to paid in capitalA | – | – | –C | –C | –C | –C |
| Net asset value, end of period | $37.06 | $44.85 | $39.80 | $37.21 | $38.67 | $38.42 |
| Total ReturnD,E | (7.97)% | 16.30% | 12.91% | 5.33% | 8.45% | 12.82% |
| Ratios to Average Net AssetsF,G | | | | | | |
| Expenses before reductions | .78%H | .80% | .80% | .80% | .80% | .81% |
| Expenses net of fee waivers, if any | .78%H | .80% | .80% | .80% | .80% | .81% |
| Expenses net of all reductions | .77%H | .79% | .80% | .79% | .79% | .81% |
| Net investment income (loss) | .85%H | .59% | .79% | .72% | .72% | .64% |
| Supplemental Data | | | | | | |
| Net assets, end of period (000 omitted) | $222,179 | $320,902 | $284,727 | $133,176 | $207,462 | $242,772 |
| Portfolio turnover rateI | 140%H | 61% | 57% | 53% | 70% | 57% |
A Calculated based on average shares outstanding during the period.
B Total distributions of $2.16 per share is comprised of distributions from net investment income of $.254 and distributions from net realized gain of $1.901 per share.
C Amount represents less than $.005 per share.
D Total returns for periods of less than one year are not annualized.
E Total returns would have been lower if certain expenses had not been reduced during the applicable periods shown.
F Fees and expenses of any underlying Fidelity Central Funds are not included in the Fund's expense ratio. The Fund indirectly bears its proportionate share of the expenses of any underlying Fidelity Central Funds.
G Expense ratios reflect operating expenses of the class. Expenses before reductions do not reflect amounts reimbursed by the investment adviser or reductions from brokerage service arrangements or reductions from other expense offset arrangements and do not represent the amount paid by the class during periods when reimbursements or reductions occur. Expenses net of fee waivers reflect expenses after reimbursement by the investment adviser but prior to reductions from brokerage service arrangements or other expense offset arrangements. Expenses net of all reductions represent the net expenses paid by the class.
H Annualized
I Amount does not include the portfolio activity of any underlying Fidelity Central Funds.
See accompanying notes which are an integral part of the financial statements.
Fidelity Advisor Industrials Fund Class Z
| | Six months ended (Unaudited) January 31, |
| | 2019 A |
| Selected Per–Share Data | |
| Net asset value, beginning of period | $46.84 |
| Income from Investment Operations | |
| Net investment income (loss)B | .13 |
| Net realized and unrealized gain (loss) | (5.89) |
| Total from investment operations | (5.76) |
| Distributions from net investment income | (.39) |
| Distributions from net realized gain | (3.70) |
| Total distributions | (4.09) |
| Net asset value, end of period | $36.99 |
| Total ReturnC,D | (11.83)% |
| Ratios to Average Net AssetsE,F | |
| Expenses before reductions | .65%G |
| Expenses net of fee waivers, if any | .65%G |
| Expenses net of all reductions | .64%G |
| Net investment income (loss) | 1.05%G |
| Supplemental Data | |
| Net assets, end of period (000 omitted) | $8,114 |
| Portfolio turnover rateH | 140%G |
A For the period October 2, 2018 (commencement of sale of shares) to January 31, 2019.
B Calculated based on average shares outstanding during the period.
C Total returns for periods of less than one year are not annualized.
D Total returns would have been lower if certain expenses had not been reduced during the applicable periods shown.
E Fees and expenses of any underlying Fidelity Central Funds are not included in the Fund's expense ratio. The Fund indirectly bears its proportionate share of the expenses of any underlying Fidelity Central Funds.
F Expense ratios reflect operating expenses of the class. Expenses before reductions do not reflect amounts reimbursed by the investment adviser or reductions from brokerage service arrangements or reductions from other expense offset arrangements and do not represent the amount paid by the class during periods when reimbursements or reductions occur. Expense ratios before reductions for start-up periods may not be representative of longer-term operating periods. Expenses net of fee waivers reflect expenses after reimbursement by the investment adviser but prior to reductions from brokerage service arrangements or other expense offset arrangements. Expenses net of all reductions represent the net expenses paid by the class.
G Annualized
H Amount does not include the portfolio activity of any underlying Fidelity Central Funds.
See accompanying notes which are an integral part of the financial statements.
Fidelity Advisor® Semiconductors Fund
Investment Summary (Unaudited)
Top Ten Stocks as of January 31, 2019
| | % of fund's net assets |
| Broadcom, Inc. | 8.9 |
| Marvell Technology Group Ltd. | 8.5 |
| Intel Corp. | 8.3 |
| NVIDIA Corp. | 8.3 |
| Applied Materials, Inc. | 7.3 |
| Qualcomm, Inc. | 6.0 |
| Micron Technology, Inc. | 4.9 |
| Analog Devices, Inc. | 4.8 |
| Lam Research Corp. | 4.7 |
| ON Semiconductor Corp. | 4.7 |
| | 66.4 |
Top Industries (% of fund's net assets)
| As of January 31, 2019 |
| | Semiconductors & Semiconductor Equipment | 92.5% |
| | Electronic Equipment & Components | 5.4% |
| | Technology Hardware, Storage & Peripherals | 0.2% |
| | All Others* | 1.9% |

* Includes short-term investments and net other assets (liabilities).
Fidelity Advisor® Semiconductors Fund
Schedule of Investments January 31, 2019 (Unaudited)
Showing Percentage of Net Assets
| Common Stocks - 98.1% | | | |
| | | Shares | Value |
| Electronic Equipment & Components - 5.4% | | | |
| Electronic Manufacturing Services - 5.4% | | | |
| Flextronics International Ltd. (a) | | 432,800 | $4,163,536 |
| Jabil, Inc. | | 173,876 | 4,633,795 |
| TTM Technologies, Inc. (a) | | 281,700 | 3,233,916 |
| | | | 12,031,247 |
| Semiconductors & Semiconductor Equipment - 92.5% | | | |
| Semiconductor Equipment - 18.2% | | | |
| Advanced Energy Industries, Inc. (a) | | 76,500 | 3,923,685 |
| Applied Materials, Inc. | | 413,400 | 16,155,672 |
| KLA-Tencor Corp. | | 59,900 | 6,383,543 |
| Lam Research Corp. | | 62,311 | 10,566,699 |
| MKS Instruments, Inc. | | 41,800 | 3,412,134 |
| | | | 40,441,733 |
| Semiconductors - 74.3% | | | |
| Alpha & Omega Semiconductor Ltd. (a) | | 74,300 | 884,913 |
| Ambarella, Inc. (a)(b) | | 9,300 | 353,400 |
| Analog Devices, Inc. | | 109,070 | 10,782,660 |
| Broadcom, Inc. | | 74,200 | 19,904,149 |
| Cypress Semiconductor Corp. | | 113,500 | 1,574,245 |
| Dialog Semiconductor PLC (a) | | 24,600 | 718,852 |
| Inphi Corp. (a)(b) | | 106,938 | 4,217,635 |
| Intel Corp. | | 391,125 | 18,429,810 |
| MACOM Technology Solutions Holdings, Inc. (a) | | 180,200 | 3,249,006 |
| Marvell Technology Group Ltd. | | 1,024,967 | 18,992,639 |
| Maxim Integrated Products, Inc. | | 39,000 | 2,116,530 |
| MaxLinear, Inc. Class A (a) | | 58,149 | 1,140,883 |
| MediaTek, Inc. | | 27,000 | 218,854 |
| Mellanox Technologies Ltd. (a) | | 31,000 | 2,895,710 |
| Microchip Technology, Inc. (b) | | 113,700 | 9,138,069 |
| Micron Technology, Inc. (a) | | 286,812 | 10,961,955 |
| Nordic VLSI ASA (a) | | 47,700 | 165,430 |
| NVIDIA Corp. | | 128,123 | 18,417,681 |
| NXP Semiconductors NV | | 117,970 | 10,266,929 |
| O2Micro International Ltd. sponsored ADR (a) | | 16,100 | 25,599 |
| ON Semiconductor Corp. (a) | | 517,500 | 10,370,700 |
| Qorvo, Inc. (a) | | 37,346 | 2,440,935 |
| Qualcomm, Inc. | | 268,726 | 13,307,312 |
| Renesas Electronics Corp. (a) | | 303,500 | 1,741,451 |
| Sanken Electric Co. Ltd. | | 19,600 | 408,285 |
| Silicon Motion Technology Corp. sponsored ADR | | 6,600 | 257,202 |
| Skyworks Solutions, Inc. | | 11,900 | 869,176 |
| Synaptics, Inc. (a) | | 37,600 | 1,496,480 |
| | | | 165,346,490 |
|
| TOTAL SEMICONDUCTORS & SEMICONDUCTOR EQUIPMENT | | | 205,788,223 |
|
| Technology Hardware, Storage & Peripherals - 0.2% | | | |
| Technology Hardware, Storage & Peripherals - 0.2% | | | |
| Western Digital Corp. | | 7,600 | 341,924 |
| TOTAL COMMON STOCKS | | | |
| (Cost $196,160,684) | | | 218,161,394 |
|
| Money Market Funds - 7.5% | | | |
| Fidelity Cash Central Fund, 2.43% (c) | | 4,752,537 | 4,753,487 |
| Fidelity Securities Lending Cash Central Fund 2.43% (c)(d) | | 11,947,952 | 11,949,146 |
| TOTAL MONEY MARKET FUNDS | | | |
| (Cost $16,702,633) | | | 16,702,633 |
| TOTAL INVESTMENT IN SECURITIES - 105.6% | | | |
| (Cost $212,863,317) | | | 234,864,027 |
| NET OTHER ASSETS (LIABILITIES) - (5.6)% | | | (12,476,223) |
| NET ASSETS - 100% | | | $222,387,804 |
Legend
(a) Non-income producing
(b) Security or a portion of the security is on loan at period end.
(c) Affiliated fund that is generally available only to investment companies and other accounts managed by Fidelity Investments. The rate quoted is the annualized seven-day yield of the fund at period end. A complete unaudited listing of the fund's holdings as of its most recent quarter end is available upon request. In addition, each Fidelity Central Fund's financial statements are available on the SEC's website or upon request.
(d) Investment made with cash collateral received from securities on loan.
Affiliated Central Funds
Information regarding fiscal year to date income earned by the Fund from investments in Fidelity Central Funds is as follows:
| Fund | Income earned |
| Fidelity Cash Central Fund | $36,217 |
| Fidelity Securities Lending Cash Central Fund | 21,318 |
| Total | $57,535 |
Amounts in the income column in the above table include any capital gain distributions from underlying funds, which are presented in the corresponding line-item in the Statement of Operations, if applicable.
Investment Valuation
The following is a summary of the inputs used, as of January 31, 2019, involving the Fund's assets and liabilities carried at fair value. The inputs or methodology used for valuing securities may not be an indication of the risk associated with investing in those securities. For more information on valuation inputs, and their aggregation into the levels used below, please refer to the Investment Valuation section in the accompanying Notes to Financial Statements.
| | Valuation Inputs at Reporting Date: |
| Description | Total | Level 1 | Level 2 | Level 3 |
| Investments in Securities: | | | | |
| Common Stocks | $218,161,394 | $217,942,540 | $218,854 | $-- |
| Money Market Funds | 16,702,633 | 16,702,633 | -- | -- |
| Total Investments in Securities: | $234,864,027 | $234,645,173 | $218,854 | $-- |
Other Information
Distribution of investments by country or territory of incorporation, as a percentage of Total Net Assets, is as follows (Unaudited):
| United States of America | 81.5% |
| Bermuda | 8.9% |
| Netherlands | 4.6% |
| Singapore | 1.9% |
| Israel | 1.3% |
| Japan | 1.0% |
| Others (Individually Less Than 1%) | 0.8% |
| | 100.0% |
See accompanying notes which are an integral part of the financial statements.
Fidelity Advisor® Semiconductors Fund
Financial Statements
Statement of Assets and Liabilities
| | | January 31, 2019 (Unaudited) |
| Assets | | |
Investment in securities, at value (including securities loaned of $11,742,141) — See accompanying schedule:
Unaffiliated issuers (cost $196,160,684) | $218,161,394 | |
| Fidelity Central Funds (cost $16,702,633) | 16,702,633 | |
| Total Investment in Securities (cost $212,863,317) | | $234,864,027 |
| Foreign currency held at value (cost $111,273) | | 111,273 |
| Receivable for investments sold | | 3,238,347 |
| Receivable for fund shares sold | | 147,134 |
| Distributions receivable from Fidelity Central Funds | | 6,868 |
| Prepaid expenses | | 2,617 |
| Other receivables | | 8,454 |
| Total assets | | 238,378,720 |
| Liabilities | | |
| Payable for investments purchased | $3,403,682 | |
| Payable for fund shares redeemed | 408,894 | |
| Accrued management fee | 94,281 | |
| Distribution and service plan fees payable | 56,015 | |
| Other affiliated payables | 45,248 | |
| Other payables and accrued expenses | 33,631 | |
| Collateral on securities loaned | 11,949,165 | |
| Total liabilities | | 15,990,916 |
| Net Assets | | $222,387,804 |
| Net Assets consist of: | | |
| Paid in capital | | $210,403,635 |
| Total distributable earnings (loss) | | 11,984,169 |
| Net Assets | | $222,387,804 |
| Net Asset Value and Maximum Offering Price | | |
| Class A: | | |
| Net Asset Value and redemption price per share ($79,376,058 ÷ 4,148,631 shares) | | $19.13 |
| Maximum offering price per share (100/94.25 of $19.13) | | $20.30 |
| Class M: | | |
| Net Asset Value and redemption price per share ($18,589,655 ÷ 1,020,597 shares) | | $18.21 |
| Maximum offering price per share (100/96.50 of $18.21) | | $18.87 |
| Class C: | | |
| Net Asset Value and offering price per share ($41,620,109 ÷ 2,547,013 shares)(a) | | $16.34 |
| Class I: | | |
| Net Asset Value, offering price and redemption price per share ($80,792,597 ÷ 3,986,989 shares) | | $20.26 |
| Class Z: | | |
| Net Asset Value, offering price and redemption price per share ($2,009,385 ÷ 99,413 shares) | | $20.21 |
(a) Redemption price per share is equal to net asset value less any applicable contingent deferred sales charge.
See accompanying notes which are an integral part of the financial statements.
Statement of Operations
| | | Six months ended January 31, 2019 (Unaudited) |
| Investment Income | | |
| Dividends | | $2,399,180 |
| Income from Fidelity Central Funds (including $21,318 from security lending) | | 57,535 |
| Total income | | 2,456,715 |
| Expenses | | |
| Management fee | $686,774 | |
| Transfer agent fees | 273,368 | |
| Distribution and service plan fees | 395,861 | |
| Accounting and security lending fees | 50,975 | |
| Custodian fees and expenses | 24,067 | |
| Independent trustees' fees and expenses | 873 | |
| Registration fees | 62,520 | |
| Audit | 21,480 | |
| Legal | 2,311 | |
| Interest | 1,066 | |
| Miscellaneous | 1,024 | |
| Total expenses before reductions | 1,520,319 | |
| Expense reductions | (2,819) | |
| Total expenses after reductions | | 1,517,500 |
| Net investment income (loss) | | 939,215 |
| Realized and Unrealized Gain (Loss) | | |
| Net realized gain (loss) on: | | |
| Investment securities: | | |
| Unaffiliated issuers | (1,367,836) | |
| Fidelity Central Funds | (227) | |
| Foreign currency transactions | 2,650 | |
| Total net realized gain (loss) | | (1,365,413) |
| Change in net unrealized appreciation (depreciation) on: | | |
| Investment securities: | | |
| Unaffiliated issuers | (28,793,792) | |
| Fidelity Central Funds | (201) | |
| Assets and liabilities in foreign currencies | (306) | |
| Total change in net unrealized appreciation (depreciation) | | (28,794,299) |
| Net gain (loss) | | (30,159,712) |
| Net increase (decrease) in net assets resulting from operations | | $(29,220,497) |
See accompanying notes which are an integral part of the financial statements.
Statement of Changes in Net Assets
| | Six months ended January 31, 2019 (Unaudited) | Year ended July 31, 2018 |
| Increase (Decrease) in Net Assets | | |
| Operations | | |
| Net investment income (loss) | $939,215 | $140,691 |
| Net realized gain (loss) | (1,365,413) | 38,481,612 |
| Change in net unrealized appreciation (depreciation) | (28,794,299) | 21,918,816 |
| Net increase (decrease) in net assets resulting from operations | (29,220,497) | 60,541,119 |
| Distributions to shareholders | (36,359,564) | – |
| Distributions to shareholders from net investment income | – | (641,765) |
| Distributions to shareholders from net realized gain | – | (23,866,944) |
| Total distributions | (36,359,564) | (24,508,709) |
| Share transactions - net increase (decrease) | (30,022,141) | 60,021,575 |
| Redemption fees | – | 32,964 |
| Total increase (decrease) in net assets | (95,602,202) | 96,086,949 |
| Net Assets | | |
| Beginning of period | 317,990,006 | 221,903,057 |
| End of period | $222,387,804 | $317,990,006 |
See accompanying notes which are an integral part of the financial statements.
Financial Highlights
Fidelity Advisor Semiconductors Fund Class A
| | Six months ended (Unaudited) January 31, | Years endedJuly 31, | | | | |
| | 2019 | 2018 | 2017 | 2016 | 2015 | 2014 |
| Selected Per–Share Data | | | | | | |
| Net asset value, beginning of period | $25.06 | $21.57 | $16.50 | $15.29 | $13.86 | $10.33 |
| Income from Investment Operations | | | | | | |
| Net investment income (loss)A | .09 | .02 | .11 | .09 | .03 | (.02) |
| Net realized and unrealized gain (loss) | (2.59) | 5.73 | 5.03 | 2.67 | 1.48 | 3.55 |
| Total from investment operations | (2.50) | 5.75 | 5.14 | 2.76 | 1.51 | 3.53 |
| Distributions from net investment income | (.10) | (.05)B | (.05) | (.05) | (.01) | – |
| Distributions from net realized gain | (3.33) | (2.21)B | (.02) | (1.49) | (.07) | – |
| Total distributions | (3.43) | (2.26) | (.07) | (1.55)C | (.08) | – |
| Redemption fees added to paid in capitalA | – | –D | –D | –D | –D | –D |
| Net asset value, end of period | $19.13 | $25.06 | $21.57 | $16.50 | $15.29 | $13.86 |
| Total ReturnE,F,G | (8.48)% | 27.35% | 31.21% | 20.46% | 10.85% | 34.17% |
| Ratios to Average Net AssetsH,I | | | | | | |
| Expenses before reductions | 1.14%J | 1.15% | 1.17% | 1.31% | 1.28% | 1.84% |
| Expenses net of fee waivers, if any | 1.14%J | 1.15% | 1.17% | 1.31% | 1.28% | 1.40% |
| Expenses net of all reductions | 1.14%J | 1.13% | 1.16% | 1.28% | 1.27% | 1.39% |
| Net investment income (loss) | .78%J | .09% | .55% | .61% | .20% | (.16)% |
| Supplemental Data | | | | | | |
| Net assets, end of period (000 omitted) | $79,376 | $97,883 | $72,040 | $34,066 | $38,237 | $16,542 |
| Portfolio turnover rateK | 108%J | 133% | 99% | 185% | 156% | 156% |
A Calculated based on average shares outstanding during the period.
B The amounts shown reflect certain reclassifications related to book to tax differences that were made in the year shown.
C Total distributions of $1.55 per share is comprised of distributions from net investment income of $.053 and distributions from net realized gain of $1.494 per share.
D Amount represents less than $.005 per share.
E Total returns for periods of less than one year are not annualized.
F Total returns would have been lower if certain expenses had not been reduced during the applicable periods shown.
G Total returns do not include the effect of the sales charges.
H Fees and expenses of any underlying Fidelity Central Funds are not included in the Fund's expense ratio. The Fund indirectly bears its proportionate share of the expenses of any underlying Fidelity Central Funds.
I Expense ratios reflect operating expenses of the class. Expenses before reductions do not reflect amounts reimbursed by the investment adviser or reductions from brokerage service arrangements or reductions from other expense offset arrangements and do not represent the amount paid by the class during periods when reimbursements or reductions occur. Expenses net of fee waivers reflect expenses after reimbursement by the investment adviser but prior to reductions from brokerage service arrangements or other expense offset arrangements. Expenses net of all reductions represent the net expenses paid by the class.
J Annualized
K Amount does not include the portfolio activity of any underlying Fidelity Central Funds.
See accompanying notes which are an integral part of the financial statements.
Fidelity Advisor Semiconductors Fund Class M
| | Six months ended (Unaudited) January 31, | Years endedJuly 31, | | | | |
| | 2019 | 2018 | 2017 | 2016 | 2015 | 2014 |
| Selected Per–Share Data | | | | | | |
| Net asset value, beginning of period | $24.04 | $20.77 | $15.91 | $14.81 | $13.45 | $10.05 |
| Income from Investment Operations | | | | | | |
| Net investment income (loss)A | .05 | (.05) | .04 | .04 | (.02) | (.05) |
| Net realized and unrealized gain (loss) | (2.49) | 5.50 | 4.84 | 2.57 | 1.44 | 3.45 |
| Total from investment operations | (2.44) | 5.45 | 4.88 | 2.61 | 1.42 | 3.40 |
| Distributions from net investment income | (.06) | –B | – | (.04) | – | – |
| Distributions from net realized gain | (3.33) | (2.18)B | (.02) | (1.47) | (.06) | – |
| Total distributions | (3.39) | (2.18) | (.02) | (1.51) | (.06) | – |
| Redemption fees added to paid in capitalA | – | –C | –C | –C | –C | –C |
| Net asset value, end of period | $18.21 | $24.04 | $20.77 | $15.91 | $14.81 | $13.45 |
| Total ReturnD,E,F | (8.62)% | 26.95% | 30.72% | 20.01% | 10.55% | 33.83% |
| Ratios to Average Net AssetsG,H | | | | | | |
| Expenses before reductions | 1.47%I | 1.48% | 1.53% | 1.65% | 1.62% | 2.19% |
| Expenses net of fee waivers, if any | 1.46%I | 1.47% | 1.53% | 1.65% | 1.62% | 1.65% |
| Expenses net of all reductions | 1.46%I | 1.46% | 1.52% | 1.62% | 1.61% | 1.64% |
| Net investment income (loss) | .46%I | (.23)% | .20% | .27% | (.14)% | (.42)% |
| Supplemental Data | | | | | | |
| Net assets, end of period (000 omitted) | $18,590 | $21,830 | $16,127 | $9,766 | $10,826 | $7,144 |
| Portfolio turnover rateJ | 108%I | 133% | 99% | 185% | 156% | 156% |
A Calculated based on average shares outstanding during the period.
B The amounts shown reflect certain reclassifications related to book to tax differences that were made in the year shown.
C Amount represents less than $.005 per share.
D Total returns for periods of less than one year are not annualized.
E Total returns would have been lower if certain expenses had not been reduced during the applicable periods shown.
F Total returns do not include the effect of the sales charges.
G Fees and expenses of any underlying Fidelity Central Funds are not included in the Fund's expense ratio. The Fund indirectly bears its proportionate share of the expenses of any underlying Fidelity Central Funds.
H Expense ratios reflect operating expenses of the class. Expenses before reductions do not reflect amounts reimbursed by the investment adviser or reductions from brokerage service arrangements or reductions from other expense offset arrangements and do not represent the amount paid by the class during periods when reimbursements or reductions occur. Expenses net of fee waivers reflect expenses after reimbursement by the investment adviser but prior to reductions from brokerage service arrangements or other expense offset arrangements. Expenses net of all reductions represent the net expenses paid by the class.
I Annualized
J Amount does not include the portfolio activity of any underlying Fidelity Central Funds.
See accompanying notes which are an integral part of the financial statements.
Fidelity Advisor Semiconductors Fund Class C
| | Six months ended (Unaudited) January 31, | Years endedJuly 31, | | | | |
| | 2019 | 2018 | 2017 | 2016 | 2015 | 2014 |
| Selected Per–Share Data | | | | | | |
| Net asset value, beginning of period | $21.88 | $19.10 | $14.69 | $13.80 | $12.58 | $9.44 |
| Income from Investment Operations | | | | | | |
| Net investment income (loss)A | –B | (.14) | (.04) | (.02) | (.08) | (.10) |
| Net realized and unrealized gain (loss) | (2.28) | 5.05 | 4.47 | 2.37 | 1.34 | 3.24 |
| Total from investment operations | (2.28) | 4.91 | 4.43 | 2.35 | 1.26 | 3.14 |
| Distributions from net investment income | – | – | – | (.02) | – | – |
| Distributions from net realized gain | (3.26) | (2.13) | (.02) | (1.44) | (.04) | – |
| Total distributions | (3.26) | (2.13) | (.02) | (1.46) | (.04) | – |
| Redemption fees added to paid in capitalA | – | –B | –B | –B | –B | –B |
| Net asset value, end of period | $16.34 | $21.88 | $19.10 | $14.69 | $13.80 | $12.58 |
| Total ReturnC,D,E | (8.81)% | 26.38% | 30.21% | 19.48% | 10.03% | 33.26% |
| Ratios to Average Net AssetsF,G | | | | | | |
| Expenses before reductions | 1.89%H | 1.91% | 1.95% | 2.08% | 2.06% | 2.60% |
| Expenses net of fee waivers, if any | 1.89%H | 1.91% | 1.95% | 2.08% | 2.06% | 2.15% |
| Expenses net of all reductions | 1.89%H | 1.89% | 1.94% | 2.05% | 2.05% | 2.14% |
| Net investment income (loss) | .03%H | (.67)% | (.23)% | (.16)% | (.58)% | (.91)% |
| Supplemental Data | | | | | | |
| Net assets, end of period (000 omitted) | $41,620 | $57,915 | $42,684 | $21,088 | $20,864 | $7,381 |
| Portfolio turnover rateI | 108%H | 133% | 99% | 185% | 156% | 156% |
A Calculated based on average shares outstanding during the period.
B Amount represents less than $.005 per share.
C Total returns for periods of less than one year are not annualized.
D Total returns would have been lower if certain expenses had not been reduced during the applicable periods shown.
E Total returns do not include the effect of the contingent deferred sales charge.
F Fees and expenses of any underlying Fidelity Central Funds are not included in the Fund's expense ratio. The Fund indirectly bears its proportionate share of the expenses of any underlying Fidelity Central Funds.
G Expense ratios reflect operating expenses of the class. Expenses before reductions do not reflect amounts reimbursed by the investment adviser or reductions from brokerage service arrangements or reductions from other expense offset arrangements and do not represent the amount paid by the class during periods when reimbursements or reductions occur. Expenses net of fee waivers reflect expenses after reimbursement by the investment adviser but prior to reductions from brokerage service arrangements or other expense offset arrangements. Expenses net of all reductions represent the net expenses paid by the class.
H Annualized
I Amount does not include the portfolio activity of any underlying Fidelity Central Funds.
See accompanying notes which are an integral part of the financial statements.
Fidelity Advisor Semiconductors Fund Class I
| | Six months ended (Unaudited) January 31, | Years endedJuly 31, | | | | |
| | 2019 | 2018 | 2017 | 2016 | 2015 | 2014 |
| Selected Per–Share Data | | | | | | |
| Net asset value, beginning of period | $26.33 | $22.56 | $17.24 | $15.89 | $14.37 | $10.68 |
| Income from Investment Operations | | | | | | |
| Net investment income (loss)A | .13 | .10 | .17 | .14 | .08 | .01 |
| Net realized and unrealized gain (loss) | (2.71) | 5.99 | 5.26 | 2.79 | 1.53 | 3.68 |
| Total from investment operations | (2.58) | 6.09 | 5.43 | 2.93 | 1.61 | 3.69 |
| Distributions from net investment income | (.16) | (.11)B | (.09) | (.09) | (.02) | – |
| Distributions from net realized gain | (3.33) | (2.21)B | (.02) | (1.49) | (.07) | – |
| Total distributions | (3.49) | (2.32) | (.11) | (1.58) | (.09) | – |
| Redemption fees added to paid in capitalA | – | –C | –C | –C | –C | –C |
| Net asset value, end of period | $20.26 | $26.33 | $22.56 | $17.24 | $15.89 | $14.37 |
| Total ReturnD,E | (8.36)% | 27.74% | 31.62% | 20.85% | 11.17% | 34.55% |
| Ratios to Average Net AssetsF,G | | | | | | |
| Expenses before reductions | .85%H | .86% | .88% | .98% | .98% | 1.34% |
| Expenses net of fee waivers, if any | .85%H | .86% | .88% | .98% | .98% | 1.15% |
| Expenses net of all reductions | .84%H | .84% | .87% | .95% | .96% | 1.14% |
| Net investment income (loss) | 1.08%H | .38% | .84% | .94% | .51% | .10% |
| Supplemental Data | | | | | | |
| Net assets, end of period (000 omitted) | $80,793 | $140,362 | $91,052 | $25,827 | $35,943 | $25,050 |
| Portfolio turnover rateI | 108%H | 133% | 99% | 185% | 156% | 156% |
A Calculated based on average shares outstanding during the period.
B The amounts shown reflect certain reclassifications related to book to tax differences that were made in the year shown.
C Amount represents less than $.005 per share.
D Total returns for periods of less than one year are not annualized.
E Total returns would have been lower if certain expenses had not been reduced during the applicable periods shown.
F Fees and expenses of any underlying Fidelity Central Funds are not included in the Fund's expense ratio. The Fund indirectly bears its proportionate share of the expenses of any underlying Fidelity Central Funds.
G Expense ratios reflect operating expenses of the class. Expenses before reductions do not reflect amounts reimbursed by the investment adviser or reductions from brokerage service arrangements or reductions from other expense offset arrangements and do not represent the amount paid by the class during periods when reimbursements or reductions occur. Expenses net of fee waivers reflect expenses after reimbursement by the investment adviser but prior to reductions from brokerage service arrangements or other expense offset arrangements. Expenses net of all reductions represent the net expenses paid by the class.
H Annualized
I Amount does not include the portfolio activity of any underlying Fidelity Central Funds.
See accompanying notes which are an integral part of the financial statements.
Fidelity Advisor Semiconductors Fund Class Z
| | Six months ended (Unaudited) January 31, |
| | 2019 A |
| Selected Per–Share Data | |
| Net asset value, beginning of period | $26.00 |
| Income from Investment Operations | |
| Net investment income (loss)B | .06 |
| Net realized and unrealized gain (loss) | (2.30) |
| Total from investment operations | (2.24) |
| Distributions from net investment income | (.22) |
| Distributions from net realized gain | (3.33) |
| Total distributions | (3.55) |
| Net asset value, end of period | $20.21 |
| Total ReturnC,D | (7.13)% |
| Ratios to Average Net AssetsE,F | |
| Expenses before reductions | .71%G |
| Expenses net of fee waivers, if any | .71%G |
| Expenses net of all reductions | .71%G |
| Net investment income (loss) | .91%G |
| Supplemental Data | |
| Net assets, end of period (000 omitted) | $2,009 |
| Portfolio turnover rateH | 108%G |
A For the period October 2, 2018 (commencement of sale of shares) to January 31, 2019.
B Calculated based on average shares outstanding during the period.
C Total returns for periods of less than one year are not annualized.
D Total returns would have been lower if certain expenses had not been reduced during the applicable periods shown.
E Fees and expenses of any underlying Fidelity Central Funds are not included in the Fund's expense ratio. The Fund indirectly bears its proportionate share of the expenses of any underlying Fidelity Central Funds.
F Expense ratios reflect operating expenses of the class. Expenses before reductions do not reflect amounts reimbursed by the investment adviser or reductions from brokerage service arrangements or reductions from other expense offset arrangements and do not represent the amount paid by the class during periods when reimbursements or reductions occur. Expense ratios before reductions for start-up periods may not be representative of longer-term operating periods. Expenses net of fee waivers reflect expenses after reimbursement by the investment adviser but prior to reductions from brokerage service arrangements or other expense offset arrangements. Expenses net of all reductions represent the net expenses paid by the class.
G Annualized
H Amount does not include the portfolio activity of any underlying Fidelity Central Funds.
See accompanying notes which are an integral part of the financial statements.
Fidelity Advisor® Technology Fund
Investment Summary (Unaudited)
Top Ten Stocks as of January 31, 2019
| | % of fund's net assets |
| Apple, Inc. | 16.2 |
| Microsoft Corp. | 15.8 |
| Visa, Inc. Class A | 5.4 |
| MasterCard, Inc. Class A | 3.6 |
| Adobe, Inc. | 3.3 |
| Salesforce.com, Inc. | 2.9 |
| Broadcom, Inc. | 2.1 |
| Alphabet, Inc. Class C | 2.1 |
| Netflix, Inc. | 1.9 |
| PayPal Holdings, Inc. | 1.8 |
| | 55.1 |
Top Industries (% of fund's net assets)
| As of January 31, 2019 |
| | Software | 32.6% |
| | IT Services | 20.9% |
| | Technology Hardware, Storage & Peripherals | 18.0% |
| | Semiconductors & Semiconductor Equipment | 15.1% |
| | Internet & Direct Marketing Retail | 3.3% |
| | All Others* | 10.1% |
* Includes short-term investments and net other assets (liabilities).
Fidelity Advisor® Technology Fund
Schedule of Investments January 31, 2019 (Unaudited)
Showing Percentage of Net Assets
| Common Stocks - 99.1% | | | |
| | | Shares | Value |
| Communications Equipment - 2.3% | | | |
| Communications Equipment - 2.3% | | | |
| Arista Networks, Inc. (a) | | 18,400 | $3,951,952 |
| Cisco Systems, Inc. | | 591,313 | 27,963,192 |
| F5 Networks, Inc. (a) | | 20,036 | 3,224,794 |
| Motorola Solutions, Inc. | | 54,900 | 6,418,359 |
| | | | 41,558,297 |
| Electronic Equipment & Components - 2.7% | | | |
| Electronic Components - 1.0% | | | |
| Amphenol Corp. Class A | | 102,101 | 8,976,720 |
| Corning, Inc. | | 275,272 | 9,155,547 |
| | | | 18,132,267 |
| Electronic Equipment & Instruments - 0.6% | | | |
| Keysight Technologies, Inc. (a) | | 62,125 | 4,598,493 |
| Trimble, Inc. (a) | | 81,436 | 3,066,880 |
| Zebra Technologies Corp. Class A (a) | | 18,600 | 3,228,960 |
| | | | 10,894,333 |
| Electronic Manufacturing Services - 0.5% | | | |
| TE Connectivity Ltd. | | 118,300 | 9,576,385 |
| Technology Distributors - 0.6% | | | |
| CDW Corp. | | 50,800 | 4,230,116 |
| Dell Technologies, Inc. (a) | | 121,692 | 5,913,014 |
| | | | 10,143,130 |
|
| TOTAL ELECTRONIC EQUIPMENT & COMPONENTS | | | 48,746,115 |
|
| Entertainment - 2.5% | | | |
| Interactive Home Entertainment - 0.6% | | | |
| Activision Blizzard, Inc. | | 224,394 | 10,600,373 |
| Movies & Entertainment - 1.9% | | | |
| Netflix, Inc. (a) | | 103,166 | 35,024,857 |
|
| TOTAL ENTERTAINMENT | | | 45,625,230 |
|
| Equity Real Estate Investment Trusts (REITs) - 0.5% | | | |
| Diversified REITs - 0.5% | | | |
| Ant International Co. Ltd. Class C (b)(c) | | 1,469,829 | 8,245,741 |
| Interactive Media & Services - 2.1% | | | |
| Interactive Media & Services - 2.1% | | | |
| Alphabet, Inc. Class C (a) | | 34,155 | 38,129,617 |
| Internet & Direct Marketing Retail - 3.3% | | | |
| Internet & Direct Marketing Retail - 3.3% | | | |
| Amazon.com, Inc. (a) | | 11,200 | 19,249,776 |
| eBay, Inc. | | 524,300 | 17,642,695 |
| Meituan Dianping Class B | | 3,559,399 | 22,967,596 |
| | | | 59,860,067 |
| IT Services - 20.9% | | | |
| Data Processing & Outsourced Services - 16.4% | | | |
| Alliance Data Systems Corp. | | 16,100 | 2,859,199 |
| Automatic Data Processing, Inc. | | 148,485 | 20,764,142 |
| Broadridge Financial Solutions, Inc. | | 38,516 | 3,883,568 |
| Fidelity National Information Services, Inc. | | 112,391 | 11,748,231 |
| First Data Corp. Class A (a) | | 160,985 | 3,968,280 |
| Fiserv, Inc. (a) | | 138,000 | 11,444,340 |
| FleetCor Technologies, Inc. (a) | | 29,600 | 5,973,576 |
| Global Payments, Inc. | | 55,900 | 6,276,452 |
| Jack Henry & Associates, Inc. | | 25,508 | 3,406,593 |
| MasterCard, Inc. Class A | | 306,000 | 64,605,780 |
| Paychex, Inc. | | 109,313 | 7,739,360 |
| PayPal Holdings, Inc. (a) | | 374,100 | 33,205,116 |
| Square, Inc. (a) | | 106,600 | 7,605,910 |
| The Western Union Co. | | 142,523 | 2,601,045 |
| Total System Services, Inc. | | 58,453 | 5,237,973 |
| Visa, Inc. Class A | | 719,416 | 97,128,354 |
| Worldpay, Inc. (a) | | 102,400 | 8,548,352 |
| | | | 296,996,271 |
| Internet Services & Infrastructure - 2.0% | | | |
| Akamai Technologies, Inc. (a) | | 56,000 | 3,645,600 |
| GoDaddy, Inc. (a) | | 59,300 | 4,069,759 |
| MongoDB, Inc. Class A (a)(d) | | 163,136 | 15,067,241 |
| Okta, Inc. (a) | | 91,200 | 7,517,616 |
| VeriSign, Inc. (a) | | 36,857 | 6,238,784 |
| | | | 36,539,000 |
| IT Consulting & Other Services - 2.5% | | | |
| Accenture PLC Class A | | 213,111 | 32,723,194 |
| DXC Technology Co. | | 98,700 | 6,328,644 |
| Gartner, Inc. (a) | | 30,133 | 4,094,773 |
| Leidos Holdings, Inc. | | 41,660 | 2,416,280 |
| | | | 45,562,891 |
|
| TOTAL IT SERVICES | | | 379,098,162 |
|
| Life Sciences Tools & Services - 0.0% | | | |
| Life Sciences Tools & Services - 0.0% | | | |
| JHL Biotech, Inc. (a)(b) | | 387,462 | 620,726 |
| Semiconductors & Semiconductor Equipment - 15.1% | | | |
| Semiconductor Equipment - 2.5% | | | |
| Applied Materials, Inc. | | 608,500 | 23,780,180 |
| ASML Holding NV (Netherlands) | | 35,800 | 6,260,259 |
| KLA-Tencor Corp. | | 52,200 | 5,562,954 |
| Lam Research Corp. | | 54,700 | 9,276,026 |
| SunEdison, Inc. (a)(b) | | 500 | 0 |
| | | | 44,879,419 |
| Semiconductors - 12.6% | | | |
| Advanced Micro Devices, Inc. (a) | | 324,000 | 7,908,840 |
| Analog Devices, Inc. | | 124,900 | 12,347,614 |
| Broadcom, Inc. | | 142,555 | 38,240,379 |
| Intel Corp. | | 595,751 | 28,071,787 |
| Marvell Technology Group Ltd. | | 596,561 | 11,054,275 |
| Maxim Integrated Products, Inc. | | 98,500 | 5,345,595 |
| Microchip Technology, Inc. | | 79,100 | 6,357,267 |
| Micron Technology, Inc. (a) | | 397,000 | 15,173,340 |
| NVIDIA Corp. | | 193,250 | 27,779,688 |
| ON Semiconductor Corp. (a) | | 135,415 | 2,713,717 |
| Qorvo, Inc. (a) | | 46,300 | 3,026,168 |
| Qualcomm, Inc. | | 472,750 | 23,410,580 |
| Skyworks Solutions, Inc. | | 59,400 | 4,338,576 |
| Texas Instruments, Inc. | | 323,169 | 32,536,655 |
| Xilinx, Inc. | | 85,590 | 9,580,945 |
| | | | 227,885,426 |
|
| TOTAL SEMICONDUCTORS & SEMICONDUCTOR EQUIPMENT | | | 272,764,845 |
|
| Software - 31.7% | | | |
| Application Software - 13.4% | | | |
| Adobe, Inc. (a) | | 238,316 | 59,059,471 |
| ANSYS, Inc. (a) | | 26,080 | 4,286,248 |
| Atlassian Corp. PLC (a) | | 70,900 | 6,976,560 |
| Autodesk, Inc. (a) | | 74,400 | 10,951,680 |
| Cadence Design Systems, Inc. (a) | | 93,878 | 4,508,960 |
| Citrix Systems, Inc. | | 45,300 | 4,645,062 |
| Intuit, Inc. | | 126,300 | 27,258,066 |
| Nutanix, Inc.: | | | |
| Class A (a) | | 39,100 | 2,003,093 |
| Class B (a)(e) | | 39,963 | 2,047,304 |
| Parametric Technology Corp. (a) | | 247,550 | 20,989,765 |
| Salesforce.com, Inc. (a) | | 341,319 | 51,870,248 |
| Splunk, Inc. (a) | | 46,100 | 5,755,124 |
| SS&C Technologies Holdings, Inc. | | 183,800 | 9,463,862 |
| Synopsys, Inc. (a) | | 49,531 | 4,623,719 |
| Ultimate Software Group, Inc. (a) | | 63,344 | 17,297,346 |
| Workday, Inc. Class A (a) | | 50,100 | 9,094,653 |
| Xunlei Ltd. sponsored ADR (a) | | 454,336 | 1,572,003 |
| | | | 242,403,164 |
| Systems Software - 18.3% | | | |
| Fortinet, Inc. (a) | | 47,323 | 3,623,522 |
| Microsoft Corp. | | 2,750,800 | 287,266,044 |
| Palo Alto Networks, Inc. (a) | | 31,800 | 6,831,276 |
| Red Hat, Inc. (a) | | 60,500 | 10,759,320 |
| ServiceNow, Inc. (a) | | 59,700 | 13,135,194 |
| Symantec Corp. | | 207,200 | 4,355,344 |
| Tableau Software, Inc. (a) | | 23,500 | 3,004,240 |
| VMware, Inc. Class A | | 25,143 | 3,798,353 |
| | | | 332,773,293 |
|
| TOTAL SOFTWARE | | | 575,176,457 |
|
| Technology Hardware, Storage & Peripherals - 18.0% | | | |
| Technology Hardware, Storage & Peripherals - 18.0% | | | |
| Apple, Inc. | | 1,760,529 | 293,022,449 |
| Hewlett Packard Enterprise Co. | | 501,217 | 7,813,973 |
| HP, Inc. | | 549,100 | 12,096,673 |
| NetApp, Inc. | | 91,400 | 5,828,578 |
| Seagate Technology LLC | | 90,000 | 3,985,200 |
| Western Digital Corp. | | 96,500 | 4,341,535 |
| | | | 327,088,408 |
| TOTAL COMMON STOCKS | | | |
| (Cost $1,595,412,146) | | | 1,796,913,665 |
|
| Convertible Preferred Stocks - 0.9% | | | |
| Software - 0.9% | | | |
| Application Software - 0.9% | | | |
| Lyft, Inc. Series I (b)(c) | | 116,442 | 5,464,623 |
| Uber Technologies, Inc. Series D, 8.00% (a)(b)(c) | | 232,064 | 11,317,761 |
| TOTAL CONVERTIBLE PREFERRED STOCKS | | | |
| (Cost $9,114,003) | | | 16,782,384 |
|
| Money Market Funds - 0.6% | | | |
| Fidelity Cash Central Fund, 2.43% (f) | | 509 | 509 |
| Fidelity Securities Lending Cash Central Fund 2.43% (f)(g) | | 11,062,945 | 11,064,051 |
| TOTAL MONEY MARKET FUNDS | | | |
| (Cost $11,064,560) | | | 11,064,560 |
| TOTAL INVESTMENT IN SECURITIES - 100.6% | | | |
| (Cost $1,615,590,709) | | | 1,824,760,609 |
| NET OTHER ASSETS (LIABILITIES) - (0.6)% | | | (11,474,245) |
| NET ASSETS - 100% | | | $1,813,286,364 |
Legend
(a) Non-income producing
(b) Level 3 security
(c) Restricted securities - Investment in securities not registered under the Securities Act of 1933 (excluding 144A issues). At the end of the period, the value of restricted securities (excluding 144A issues) amounted to $25,028,125 or 1.4% of net assets.
(d) Security or a portion of the security is on loan at period end.
(e) Security exempt from registration under Rule 144A of the Securities Act of 1933. These securities may be resold in transactions exempt from registration, normally to qualified institutional buyers. At the end of the period, the value of these securities amounted to $2,047,304 or 0.1% of net assets.
(f) Affiliated fund that is generally available only to investment companies and other accounts managed by Fidelity Investments. The rate quoted is the annualized seven-day yield of the fund at period end. A complete unaudited listing of the fund's holdings as of its most recent quarter end is available upon request. In addition, each Fidelity Central Fund's financial statements are available on the SEC's website or upon request.
(g) Investment made with cash collateral received from securities on loan.
Additional information on each restricted holding is as follows:
| Security | Acquisition Date | Acquisition Cost |
| Ant International Co. Ltd. Class C | 5/16/18 | $8,245,741 |
| Lyft, Inc. Series I | 6/27/18 | $5,513,983 |
| Uber Technologies, Inc. Series D, 8.00% | 6/6/14 | $3,600,020 |
Affiliated Central Funds
Information regarding fiscal year to date income earned by the Fund from investments in Fidelity Central Funds is as follows:
| Fund | Income earned |
| Fidelity Cash Central Fund | $609,507 |
| Fidelity Securities Lending Cash Central Fund | 265,995 |
| Total | $875,502 |
Amounts in the income column in the above table include any capital gain distributions from underlying funds, which are presented in the corresponding line-item in the Statement of Operations, if applicable.
Investment Valuation
The following is a summary of the inputs used, as of January 31, 2019, involving the Fund's assets and liabilities carried at fair value. The inputs or methodology used for valuing securities may not be an indication of the risk associated with investing in those securities. For more information on valuation inputs, and their aggregation into the levels used below, please refer to the Investment Valuation section in the accompanying Notes to Financial Statements.
| | Valuation Inputs at Reporting Date: |
| Description | Total | Level 1 | Level 2 | Level 3 |
| Investments in Securities: | | | | |
| Common Stocks | $1,796,913,665 | $1,758,819,343 | $29,227,855 | $8,866,467 |
| Convertible Preferred Stocks | 16,782,384 | -- | -- | 16,782,384 |
| Money Market Funds | 11,064,560 | 11,064,560 | -- | -- |
| Total Investments in Securities: | $1,824,760,609 | $1,769,883,903 | $29,227,855 | $25,648,851 |
The following is a reconciliation of Investments in Securities and Derivative Instruments for which Level 3 inputs were used in determining value:
| Investments in Securities: | |
| Convertible Preferred Stocks | |
| Beginning Balance | $32,593,538 |
| Total Realized Gain (Loss) | -- |
| Total Unrealized Gain (Loss) | (3,130,993) |
| Cost of Purchases | -- |
| Proceeds of Sales | (12,680,161) |
| Amortization/Accretion | -- |
| Transfers in to Level 3 | -- |
| Transfers out of Level 3 | -- |
| Ending Balance | $16,782,384 |
| The change in unrealized gain (loss) for the period attributable to Level 3 securities held at January 31, 2019 | $1,985,842 |
| Other Investments in Securities | |
| Beginning Balance | $8,869,106 |
| Total Realized Gain (Loss) | -- |
| Total Unrealized Gain (Loss) | (2,639 ) |
| Cost of Purchases | -- |
| Proceeds of Sales | -- |
| Amortization/Accretion | -- |
| Transfers in to Level 3 | -- |
| Transfers out of Level 3 | -- |
| Ending Balance | $8,866,467 |
| The change in unrealized gain (loss) for the period attributable to Level 3 securities held at January 31, 2019 | $(2,639) |
The information used in the above reconciliations represents fiscal year to date activity for any Investments in Securities identified as using Level 3 inputs at either the beginning or the end of the current fiscal period. Transfers in or out of Level 3 represent the beginning value of any Security or Instrument where a change in the pricing level occurred from the beginning to the end of the period. The cost of purchases and the proceeds of sales may include securities received or delivered through corporate actions or exchanges. Realized and unrealized gains (losses) disclosed in the reconciliations are included in Net Gain (Loss) on the Fund's Statement of Operations.
See accompanying notes which are an integral part of the financial statements.
Fidelity Advisor® Technology Fund
Financial Statements
Statement of Assets and Liabilities
| | | January 31, 2019 (Unaudited) |
| Assets | | |
Investment in securities, at value (including securities loaned of $11,340,884) — See accompanying schedule:
Unaffiliated issuers (cost $1,604,526,149) | $1,813,696,049 | |
| Fidelity Central Funds (cost $11,064,560) | 11,064,560 | |
| Total Investment in Securities (cost $1,615,590,709) | | $1,824,760,609 |
| Cash | | 2,045,282 |
| Receivable for investments sold | | 1,470,878 |
| Receivable for fund shares sold | | 2,972,292 |
| Dividends receivable | | 418,676 |
| Distributions receivable from Fidelity Central Funds | | 6,079 |
| Prepaid expenses | | 17,605 |
| Other receivables | | 169,371 |
| Total assets | | 1,831,860,792 |
| Liabilities | | |
| Payable for investments purchased | $150,781 | |
| Payable for fund shares redeemed | 5,607,054 | |
| Distributions payable | 470 | |
| Accrued management fee | 786,321 | |
| Distribution and service plan fees payable | 460,024 | |
| Notes payable to affiliates | 40,000 | |
| Other affiliated payables | 333,501 | |
| Other payables and accrued expenses | 145,177 | |
| Collateral on securities loaned | 11,051,100 | |
| Total liabilities | | 18,574,428 |
| Net Assets | | $1,813,286,364 |
| Net Assets consist of: | | |
| Paid in capital | | $1,612,987,787 |
| Total distributable earnings (loss) | | 200,298,577 |
| Net Assets | | $1,813,286,364 |
| Net Asset Value and Maximum Offering Price | | |
| Class A: | | |
| Net Asset Value and redemption price per share ($693,593,552 ÷ 16,113,884 shares) | | $43.04 |
| Maximum offering price per share (100/94.25 of $43.04) | | $45.67 |
| Class M: | | |
| Net Asset Value and redemption price per share ($273,870,988 ÷ 6,784,004 shares) | | $40.37 |
| Maximum offering price per share (100/96.50 of $40.37) | | $41.83 |
| Class C: | | |
| Net Asset Value and offering price per share ($264,631,819 ÷ 7,526,134 shares)(a) | | $35.16 |
| Class I: | | |
| Net Asset Value, offering price and redemption price per share ($567,280,657 ÷ 12,094,077 shares) | | $46.91 |
| Class Z: | | |
| Net Asset Value, offering price and redemption price per share ($13,909,348 ÷ 297,095 shares) | | $46.82 |
(a) Redemption price per share is equal to net asset value less any applicable contingent deferred sales charge.
See accompanying notes which are an integral part of the financial statements.
Statement of Operations
| | | Six months ended January 31, 2019 (Unaudited) |
| Investment Income | | |
| Dividends | | $7,927,979 |
| Income from Fidelity Central Funds (including $265,995 from security lending) | | 875,502 |
| Total income | | 8,803,481 |
| Expenses | | |
| Management fee | $5,474,979 | |
| Transfer agent fees | 1,960,024 | |
| Distribution and service plan fees | 3,170,094 | |
| Accounting and security lending fees | 311,277 | |
| Custodian fees and expenses | 49,484 | |
| Independent trustees' fees and expenses | 6,633 | |
| Registration fees | 106,432 | |
| Audit | 23,982 | |
| Legal | 6,758 | |
| Interest | 9,546 | |
| Miscellaneous | 6,986 | |
| Total expenses before reductions | 11,126,195 | |
| Expense reductions | (55,080) | |
| Total expenses after reductions | | 11,071,115 |
| Net investment income (loss) | | (2,267,634) |
| Realized and Unrealized Gain (Loss) | | |
| Net realized gain (loss) on: | | |
| Investment securities: | | |
| Unaffiliated issuers | 10,215,614 | |
| Fidelity Central Funds | 346 | |
| Foreign currency transactions | (61,495) | |
| Total net realized gain (loss) | | 10,154,465 |
| Change in net unrealized appreciation (depreciation) on: | | |
| Investment securities: | | |
| Unaffiliated issuers | (288,005,768) | |
| Assets and liabilities in foreign currencies | (2,187) | |
| Total change in net unrealized appreciation (depreciation) | | (288,007,955) |
| Net gain (loss) | | (277,853,490) |
| Net increase (decrease) in net assets resulting from operations | | $(280,121,124) |
See accompanying notes which are an integral part of the financial statements.
Statement of Changes in Net Assets
| | Six months ended January 31, 2019 (Unaudited) | Year ended July 31, 2018 |
| Increase (Decrease) in Net Assets | | |
| Operations | | |
| Net investment income (loss) | $(2,267,634) | $(5,902,849) |
| Net realized gain (loss) | 10,154,465 | 407,510,734 |
| Change in net unrealized appreciation (depreciation) | (288,007,955) | 2,426,264 |
| Net increase (decrease) in net assets resulting from operations | (280,121,124) | 404,034,149 |
| Distributions to shareholders | (348,466,565) | – |
| Distributions to shareholders from net realized gain | – | (137,302,162) |
| Total distributions | (348,466,565) | (137,302,162) |
| Share transactions - net increase (decrease) | 231,770,780 | 390,532,086 |
| Total increase (decrease) in net assets | (396,816,909) | 657,264,073 |
| Net Assets | | |
| Beginning of period | 2,210,103,273 | 1,552,839,200 |
| End of period | $1,813,286,364 | $2,210,103,273 |
| Other Information | | |
| Accumulated net investment loss end of period | | $(98,578) |
See accompanying notes which are an integral part of the financial statements.
Financial Highlights
Fidelity Advisor Technology Fund Class A
| | Six months ended (Unaudited) January 31, | Years endedJuly 31, | | | | |
| | 2019 | 2018 | 2017 | 2016 | 2015 | 2014 |
| Selected Per–Share Data | | | | | | |
| Net asset value, beginning of period | $60.37 | $52.11 | $37.86 | $36.83 | $36.06 | $29.90 |
| Income from Investment Operations | | | | | | |
| Net investment income (loss)A | (.04) | (.13) | (.07) | (.10) | (.02)B | (.12) |
| Net realized and unrealized gain (loss) | (7.67) | 12.80 | 14.95 | 2.74 | 3.75 | 6.70 |
| Total from investment operations | (7.71) | 12.67 | 14.88 | 2.64 | 3.73 | 6.58 |
| Distributions from net investment income | – | – | – | – | (.02) | – |
| Distributions from net realized gain | (9.62) | (4.41) | (.63) | (1.61) | (2.94) | (.42) |
| Total distributions | (9.62) | (4.41) | (.63) | (1.61) | (2.96) | (.42) |
| Redemption fees added to paid in capitalA | – | – | –C | –C | –C | –C |
| Net asset value, end of period | $43.04 | $60.37 | $52.11 | $37.86 | $36.83 | $36.06 |
| Total ReturnD,E,F | (12.25)% | 25.43% | 39.85% | 7.86% | 10.94% | 22.15% |
| Ratios to Average Net AssetsG,H | | | | | | |
| Expenses before reductions | 1.03%I | 1.05% | 1.07% | 1.09% | 1.09% | 1.14% |
| Expenses net of fee waivers, if any | 1.03%I | 1.05% | 1.07% | 1.09% | 1.09% | 1.14% |
| Expenses net of all reductions | 1.03%I | 1.04% | 1.07% | 1.07% | 1.08% | 1.12% |
| Net investment income (loss) | (.17)%I | (.23)% | (.17)% | (.28)% | (.05)%B | (.35)% |
| Supplemental Data | | | | | | |
| Net assets, end of period (000 omitted) | $693,594 | $825,118 | $637,315 | $480,573 | $468,819 | $408,687 |
| Portfolio turnover rateJ | 169%I | 84% | 73%K | 102% | 142%K | 186% |
A Calculated based on average shares outstanding during the period.
B Net investment income per share reflects a large, non-recurring dividend which amounted to $.07 per share. Excluding this non-recurring dividend, the ratio of net investment income (loss) to average net assets would have been (.25) %.
C Amount represents less than $.005 per share.
D Total returns for periods of less than one year are not annualized.
E Total returns would have been lower if certain expenses had not been reduced during the applicable periods shown.
F Total returns do not include the effect of the sales charges.
G Fees and expenses of any underlying Fidelity Central Funds are not included in the Fund's expense ratio. The Fund indirectly bears its proportionate share of the expenses of any underlying Fidelity Central Funds.
H Expense ratios reflect operating expenses of the class. Expenses before reductions do not reflect amounts reimbursed by the investment adviser or reductions from brokerage service arrangements or reductions from other expense offset arrangements and do not represent the amount paid by the class during periods when reimbursements or reductions occur. Expenses net of fee waivers reflect expenses after reimbursement by the investment adviser but prior to reductions from brokerage service arrangements or other expense offset arrangements. Expenses net of all reductions represent the net expenses paid by the class.
I Annualized
J Amount does not include the portfolio activity of any underlying Fidelity Central Funds.
K Portfolio turnover rate excludes securities received or delivered in-kind.
See accompanying notes which are an integral part of the financial statements.
Fidelity Advisor Technology Fund Class M
| | Six months ended (Unaudited) January 31, | Years endedJuly 31, | | | | |
| | 2019 | 2018 | 2017 | 2016 | 2015 | 2014 |
| Selected Per–Share Data | | | | | | |
| Net asset value, beginning of period | $57.23 | $49.63 | $36.14 | $35.26 | $34.66 | $28.79 |
| Income from Investment Operations | | | | | | |
| Net investment income (loss)A | (.11) | (.27) | (.18) | (.18) | (.11)B | (.19) |
| Net realized and unrealized gain (loss) | (7.27) | 12.16 | 14.26 | 2.61 | 3.60 | 6.45 |
| Total from investment operations | (7.38) | 11.89 | 14.08 | 2.43 | 3.49 | 6.26 |
| Distributions from net investment income | – | – | – | – | – | – |
| Distributions from net realized gain | (9.48) | (4.29) | (.59) | (1.55) | (2.89) | (.39) |
| Total distributions | (9.48) | (4.29) | (.59) | (1.55) | (2.89) | (.39) |
| Redemption fees added to paid in capitalA | – | – | –C | –C | –C | –C |
| Net asset value, end of period | $40.37 | $57.23 | $49.63 | $36.14 | $35.26 | $34.66 |
| Total ReturnD,E,F | (12.35)% | 25.09% | 39.50% | 7.60% | 10.63% | 21.89% |
| Ratios to Average Net AssetsG,H | | | | | | |
| Expenses before reductions | 1.29%I | 1.31% | 1.33% | 1.35% | 1.35% | 1.38% |
| Expenses net of fee waivers, if any | 1.29%I | 1.31% | 1.33% | 1.35% | 1.35% | 1.38% |
| Expenses net of all reductions | 1.29%I | 1.30% | 1.33% | 1.34% | 1.34% | 1.37% |
| Net investment income (loss) | (.42)%I | (.49)% | (.43)% | (.54)% | (.31)%B | (.60)% |
| Supplemental Data | | | | | | |
| Net assets, end of period (000 omitted) | $273,871 | $328,709 | $274,918 | $203,727 | $208,192 | $196,067 |
| Portfolio turnover rateJ | 169%I | 84% | 73%K | 102% | 142%K | 186% |
A Calculated based on average shares outstanding during the period.
B Net investment income per share reflects a large, non-recurring dividend which amounted to $.07 per share. Excluding this non-recurring dividend, the ratio of net investment income (loss) to average net assets would have been (.51) %.
C Amount represents less than $.005 per share.
D Total returns for periods of less than one year are not annualized.
E Total returns would have been lower if certain expenses had not been reduced during the applicable periods shown.
F Total returns do not include the effect of the sales charges.
G Fees and expenses of any underlying Fidelity Central Funds are not included in the Fund's expense ratio. The Fund indirectly bears its proportionate share of the expenses of any underlying Fidelity Central Funds.
H Expense ratios reflect operating expenses of the class. Expenses before reductions do not reflect amounts reimbursed by the investment adviser or reductions from brokerage service arrangements or reductions from other expense offset arrangements and do not represent the amount paid by the class during periods when reimbursements or reductions occur. Expenses net of fee waivers reflect expenses after reimbursement by the investment adviser but prior to reductions from brokerage service arrangements or other expense offset arrangements. Expenses net of all reductions represent the net expenses paid by the class.
I Annualized
J Amount does not include the portfolio activity of any underlying Fidelity Central Funds.
K Portfolio turnover rate excludes securities received or delivered in-kind.
See accompanying notes which are an integral part of the financial statements.
Fidelity Advisor Technology Fund Class C
| | Six months ended (Unaudited) January 31, | Years endedJuly 31, | | | | |
| | 2019 | 2018 | 2017 | 2016 | 2015 | 2014 |
| Selected Per–Share Data | | | | | | |
| Net asset value, beginning of period | $51.18 | $44.86 | $32.83 | $32.27 | $31.99 | $26.68 |
| Income from Investment Operations | | | | | | |
| Net investment income (loss)A | (.20) | (.49) | (.35) | (.31) | (.25)B | (.33) |
| Net realized and unrealized gain (loss) | (6.53) | 10.95 | 12.92 | 2.37 | 3.29 | 5.98 |
| Total from investment operations | (6.73) | 10.46 | 12.57 | 2.06 | 3.04 | 5.65 |
| Distributions from net investment income | – | – | – | – | – | – |
| Distributions from net realized gain | (9.29) | (4.14) | (.54) | (1.50) | (2.76) | (.34) |
| Total distributions | (9.29) | (4.14) | (.54) | (1.50) | (2.76) | (.34) |
| Redemption fees added to paid in capitalA | – | – | –C | –C | –C | –C |
| Net asset value, end of period | $35.16 | $51.18 | $44.86 | $32.83 | $32.27 | $31.99 |
| Total ReturnD,E,F | (12.58)% | 24.48% | 38.79% | 7.08% | 10.07% | 21.31% |
| Ratios to Average Net AssetsG,H | | | | | | |
| Expenses before reductions | 1.79%I | 1.81% | 1.83% | 1.85% | 1.84% | 1.87% |
| Expenses net of fee waivers, if any | 1.79%I | 1.81% | 1.83% | 1.85% | 1.84% | 1.87% |
| Expenses net of all reductions | 1.78%I | 1.80% | 1.82% | 1.83% | 1.83% | 1.86% |
| Net investment income (loss) | (.92)%I | (.99)% | (.93)% | (1.04)% | (.80)%B | (1.09)% |
| Supplemental Data | | | | | | |
| Net assets, end of period (000 omitted) | $264,632 | $321,616 | $237,583 | $151,321 | $138,205 | $105,499 |
| Portfolio turnover rateJ | 169%I | 84% | 73%K | 102% | 142%K | 186% |
A Calculated based on average shares outstanding during the period.
B Net investment income per share reflects a large, non-recurring dividend which amounted to $.06 per share. Excluding this non-recurring dividend, the ratio of net investment income (loss) to average net assets would have been (1.00) %.
C Amount represents less than $.005 per share.
D Total returns for periods of less than one year are not annualized.
E Total returns would have been lower if certain expenses had not been reduced during the applicable periods shown.
F Total returns do not include the effect of the contingent deferred sales charge.
G Fees and expenses of any underlying Fidelity Central Funds are not included in the Fund's expense ratio. The Fund indirectly bears its proportionate share of the expenses of any underlying Fidelity Central Funds.
H Expense ratios reflect operating expenses of the class. Expenses before reductions do not reflect amounts reimbursed by the investment adviser or reductions from brokerage service arrangements or reductions from other expense offset arrangements and do not represent the amount paid by the class during periods when reimbursements or reductions occur. Expenses net of fee waivers reflect expenses after reimbursement by the investment adviser but prior to reductions from brokerage service arrangements or other expense offset arrangements. Expenses net of all reductions represent the net expenses paid by the class.
I Annualized
J Amount does not include the portfolio activity of any underlying Fidelity Central Funds.
K Portfolio turnover rate excludes securities received or delivered in-kind.
See accompanying notes which are an integral part of the financial statements.
Fidelity Advisor Technology Fund Class I
| | Six months ended (Unaudited) January 31, | Years endedJuly 31, | | | | |
| | 2019 | 2018 | 2017 | 2016 | 2015 | 2014 |
| Selected Per–Share Data | | | | | | |
| Net asset value, beginning of period | $64.86 | $55.69 | $40.30 | $39.03 | $38.06 | $31.47 |
| Income from Investment Operations | | | | | | |
| Net investment income (loss)A | .03 | .02 | .06 | .02 | .11B | (.02) |
| Net realized and unrealized gain (loss) | (8.21) | 13.71 | 15.96 | 2.92 | 3.96 | 7.06 |
| Total from investment operations | (8.18) | 13.73 | 16.02 | 2.94 | 4.07 | 7.04 |
| Distributions from net investment income | (.01) | – | – | – | (.07) | – |
| Distributions from net realized gain | (9.76) | (4.56) | (.63) | (1.67) | (3.03) | (.45) |
| Total distributions | (9.77) | (4.56) | (.63) | (1.67) | (3.10) | (.45) |
| Redemption fees added to paid in capitalA | – | – | –C | –C | –C | –C |
| Net asset value, end of period | $46.91 | $64.86 | $55.69 | $40.30 | $39.03 | $38.06 |
| Total ReturnD,E | (12.11)% | 25.75% | 40.26% | 8.24% | 11.30% | 22.55% |
| Ratios to Average Net AssetsF,G | | | | | | |
| Expenses before reductions | .77%H | .78% | .77% | .75% | .75% | .83% |
| Expenses net of fee waivers, if any | .77%H | .78% | .77% | .75% | .75% | .83% |
| Expenses net of all reductions | .76%H | .77% | .77% | .74% | .74% | .82% |
| Net investment income (loss) | .10%H | .03% | .13% | .06% | .29%B | (.05)% |
| Supplemental Data | | | | | | |
| Net assets, end of period (000 omitted) | $567,281 | $734,661 | $403,024 | $669,599 | $783,945 | $455,612 |
| Portfolio turnover rateI | 169%H | 84% | 73%J | 102% | 142%J | 186% |
A Calculated based on average shares outstanding during the period.
B Net investment income per share reflects a large, non-recurring dividend which amounted to $.08 per share. Excluding this non-recurring dividend, the ratio of net investment income (loss) to average net assets would have been .09%.
C Amount represents less than $.005 per share.
D Total returns for periods of less than one year are not annualized.
E Total returns would have been lower if certain expenses had not been reduced during the applicable periods shown.
F Fees and expenses of any underlying Fidelity Central Funds are not included in the Fund's expense ratio. The Fund indirectly bears its proportionate share of the expenses of any underlying Fidelity Central Funds.
G Expense ratios reflect operating expenses of the class. Expenses before reductions do not reflect amounts reimbursed by the investment adviser or reductions from brokerage service arrangements or reductions from other expense offset arrangements and do not represent the amount paid by the class during periods when reimbursements or reductions occur. Expenses net of fee waivers reflect expenses after reimbursement by the investment adviser but prior to reductions from brokerage service arrangements or other expense offset arrangements. Expenses net of all reductions represent the net expenses paid by the class.
H Annualized
I Amount does not include the portfolio activity of any underlying Fidelity Central Funds.
J Portfolio turnover rate excludes securities received or delivered in-kind.
See accompanying notes which are an integral part of the financial statements.
Fidelity Advisor Technology Fund Class Z
| | Six months ended (Unaudited) January 31, |
| | 2019 A |
| Selected Per–Share Data | |
| Net asset value, beginning of period | $67.88 |
| Income from Investment Operations | |
| Net investment income (loss)B | .07 |
| Net realized and unrealized gain (loss) | (11.26) |
| Total from investment operations | (11.19) |
| Distributions from net investment income | (.11) |
| Distributions from net realized gain | (9.76) |
| Total distributions | (9.87) |
| Net asset value, end of period | $46.82 |
| Total ReturnC,D | (15.99)% |
| Ratios to Average Net AssetsE,F | |
| Expenses before reductions | .64%G |
| Expenses net of fee waivers, if any | .63%G |
| Expenses net of all reductions | .63%G |
| Net investment income (loss) | .45%G |
| Supplemental Data | |
| Net assets, end of period (000 omitted) | $13,909 |
| Portfolio turnover rateH | 169%G |
A For the period October 2, 2018 (commencement of sale of shares) to January 31, 2019.
B Calculated based on average shares outstanding during the period.
C Total returns for periods of less than one year are not annualized.
D Total returns would have been lower if certain expenses had not been reduced during the applicable periods shown.
E Fees and expenses of any underlying Fidelity Central Funds are not included in the Fund's expense ratio. The Fund indirectly bears its proportionate share of the expenses of any underlying Fidelity Central Funds.
F Expense ratios reflect operating expenses of the class. Expenses before reductions do not reflect amounts reimbursed by the investment adviser or reductions from brokerage service arrangements or reductions from other expense offset arrangements and do not represent the amount paid by the class during periods when reimbursements or reductions occur. Expense ratios before reductions for start-up periods may not be representative of longer-term operating periods. Expenses net of fee waivers reflect expenses after reimbursement by the investment adviser but prior to reductions from brokerage service arrangements or other expense offset arrangements. Expenses net of all reductions represent the net expenses paid by the class.
G Annualized
H Amount does not include the portfolio activity of any underlying Fidelity Central Funds.
See accompanying notes which are an integral part of the financial statements.
Fidelity Advisor® Utilities Fund
Investment Summary (Unaudited)
Top Ten Stocks as of January 31, 2019
| | % of fund's net assets |
| Dominion Resources, Inc. | 11.0 |
| Exelon Corp. | 6.9 |
| Sempra Energy | 6.6 |
| Southern Co. | 5.9 |
| NextEra Energy, Inc. | 5.9 |
| FirstEnergy Corp. | 5.8 |
| Public Service Enterprise Group, Inc. | 4.4 |
| Entergy Corp. | 4.3 |
| Edison International | 4.2 |
| PPL Corp. | 3.9 |
| | 58.9 |
Top Industries (% of fund's net assets)
| As of January 31, 2019 |
| | Electric Utilities | 53.5% |
| | Multi-Utilities | 28.6% |
| | Gas Utilities | 5.7% |
| | Independent Power and Renewable Electricity Producers | 4.2% |
| | Diversified Telecommunication Services | 2.1% |
| | All Others* | 5.9% |

* Includes short-term investments and net other assets (liabilities).
Fidelity Advisor® Utilities Fund
Schedule of Investments January 31, 2019 (Unaudited)
Showing Percentage of Net Assets
| Common Stocks - 97.6% | | | |
| | | Shares | Value |
| Diversified Telecommunication Services - 2.1% | | | |
| Integrated Telecommunication Services - 2.1% | | | |
| AT&T, Inc. | | 324,000 | $9,739,440 |
| Electric Utilities - 53.5% | | | |
| Electric Utilities - 53.5% | | | |
| American Electric Power Co., Inc. | | 153,500 | 12,144,920 |
| Duke Energy Corp. | | 154,137 | 13,530,146 |
| Edison International | | 340,376 | 19,391,221 |
| Entergy Corp. | | 219,305 | 19,559,813 |
| Evergy, Inc. | | 265,123 | 15,196,850 |
| Eversource Energy | | 161,646 | 11,219,849 |
| Exelon Corp. | | 662,491 | 31,640,570 |
| FirstEnergy Corp. | | 676,460 | 26,517,232 |
| NextEra Energy, Inc. | | 150,186 | 26,880,290 |
| Pinnacle West Capital Corp. | | 79,300 | 6,987,916 |
| PPL Corp. | | 572,523 | 17,931,420 |
| Southern Co. | | 556,400 | 27,041,040 |
| Vistra Energy Corp. (a) | | 687,278 | 17,257,551 |
| | | | 245,298,818 |
| Gas Utilities - 5.7% | | | |
| Gas Utilities - 5.7% | | | |
| Atmos Energy Corp. | | 143,461 | 14,006,097 |
| Chesapeake Utilities Corp. | | 9,939 | 900,175 |
| South Jersey Industries, Inc. | | 239,304 | 7,126,473 |
| Southwest Gas Holdings, Inc. | | 50,500 | 3,955,160 |
| | | | 25,987,905 |
| Independent Power and Renewable Electricity Producers - 4.2% | | | |
| Independent Power Producers & Energy Traders - 2.6% | | | |
| NRG Energy, Inc. | | 222,515 | 9,103,089 |
| The AES Corp. | | 179,420 | 2,940,694 |
| | | | 12,043,783 |
| Renewable Electricity - 1.6% | | | |
| NextEra Energy Partners LP | | 179,922 | 7,225,668 |
|
| TOTAL INDEPENDENT POWER AND RENEWABLE ELECTRICITY PRODUCERS | | | 19,269,451 |
|
| Media - 0.6% | | | |
| Cable & Satellite - 0.6% | | | |
| Altice U.S.A., Inc. Class A | | 147,300 | 2,892,972 |
| Multi-Utilities - 28.6% | | | |
| Multi-Utilities - 28.6% | | | |
| Avangrid, Inc. | | 199,007 | 9,924,479 |
| CenterPoint Energy, Inc. | | 374,000 | 11,564,080 |
| Dominion Resources, Inc. | | 716,345 | 50,316,072 |
| NiSource, Inc. | | 322,470 | 8,796,982 |
| Public Service Enterprise Group, Inc. | | 367,538 | 20,049,198 |
| Sempra Energy | | 260,268 | 30,446,151 |
| | | | 131,096,962 |
| Oil, Gas & Consumable Fuels - 2.1% | | | |
| Oil & Gas Storage & Transport - 2.1% | | | |
| Cheniere Energy, Inc. (a) | | 106,751 | 7,008,203 |
| Noble Midstream Partners LP | | 9,136 | 294,179 |
| The Williams Companies, Inc. | | 92,600 | 2,493,718 |
| | | | 9,796,100 |
| Semiconductors & Semiconductor Equipment - 0.3% | | | |
| Semiconductors - 0.3% | | | |
| First Solar, Inc. (a) | | 27,110 | 1,371,495 |
| Water Utilities - 0.5% | | | |
| Water Utilities - 0.5% | | | |
| SJW Corp. | | 40,373 | 2,420,361 |
| TOTAL COMMON STOCKS | | | |
| (Cost $382,220,062) | | | 447,873,504 |
|
| Money Market Funds - 1.1% | | | |
| Fidelity Cash Central Fund, 2.43% (b) | | | |
| (Cost $5,196,573) | | 5,195,534 | 5,196,573 |
| TOTAL INVESTMENT IN SECURITIES - 98.7% | | | |
| (Cost $387,416,635) | | | 453,070,077 |
| NET OTHER ASSETS (LIABILITIES) - 1.3% | | | 5,958,210 |
| NET ASSETS - 100% | | | $459,028,287 |
Legend
(a) Non-income producing
(b) Affiliated fund that is generally available only to investment companies and other accounts managed by Fidelity Investments. The rate quoted is the annualized seven-day yield of the fund at period end. A complete unaudited listing of the fund's holdings as of its most recent quarter end is available upon request. In addition, each Fidelity Central Fund's financial statements are available on the SEC's website or upon request.
Affiliated Central Funds
Information regarding fiscal year to date income earned by the Fund from investments in Fidelity Central Funds is as follows:
| Fund | Income earned |
| Fidelity Cash Central Fund | $83,979 |
| Fidelity Securities Lending Cash Central Fund | 1,228 |
| Total | $85,207 |
Amounts in the income column in the above table include any capital gain distributions from underlying funds, which are presented in the corresponding line-item in the Statement of Operations, if applicable.
Investment Valuation
All investments are categorized as Level 1 under the Fair Value Hierarchy. The inputs or methodology used for valuing securities may not be an indication of the risk associated with investing in those securities. For more information on valuation inputs please refer to the Investment Valuation section in the accompanying Notes to Financial Statements.
See accompanying notes which are an integral part of the financial statements.
Fidelity Advisor® Utilities Fund
Financial Statements
Statement of Assets and Liabilities
| | | January 31, 2019 (Unaudited) |
| Assets | | |
Investment in securities, at value — See accompanying schedule:
Unaffiliated issuers (cost $382,220,062) | $447,873,504 | |
| Fidelity Central Funds (cost $5,196,573) | 5,196,573 | |
| Total Investment in Securities (cost $387,416,635) | | $453,070,077 |
| Receivable for investments sold | | 5,072,489 |
| Receivable for fund shares sold | | 2,751,310 |
| Dividends receivable | | 254,890 |
| Distributions receivable from Fidelity Central Funds | | 12,905 |
| Prepaid expenses | | 2,496 |
| Other receivables | | 23,314 |
| Total assets | | 461,187,481 |
| Liabilities | | |
| Payable for investments purchased | $801,748 | |
| Payable for fund shares redeemed | 926,534 | |
| Accrued management fee | 199,129 | |
| Distribution and service plan fees payable | 112,668 | |
| Other affiliated payables | 91,316 | |
| Other payables and accrued expenses | 27,799 | |
| Total liabilities | | 2,159,194 |
| Net Assets | | $459,028,287 |
| Net Assets consist of: | | |
| Paid in capital | | $410,789,781 |
| Total distributable earnings (loss) | | 48,238,506 |
| Net Assets | | $459,028,287 |
| Net Asset Value and Maximum Offering Price | | |
| Class A: | | |
| Net Asset Value and redemption price per share ($202,303,007 ÷ 6,945,712 shares) | | $29.13 |
| Maximum offering price per share (100/94.25 of $29.13) | | $30.91 |
| Class M: | | |
| Net Asset Value and redemption price per share ($53,676,462 ÷ 1,837,853 shares) | | $29.21 |
| Maximum offering price per share (100/96.50 of $29.21) | | $30.27 |
| Class C: | | |
| Net Asset Value and offering price per share ($63,435,003 ÷ 2,227,983 shares)(a) | | $28.47 |
| Class I: | | |
| Net Asset Value, offering price and redemption price per share ($134,571,859 ÷ 4,521,704 shares) | | $29.76 |
| Class Z: | | |
| Net Asset Value, offering price and redemption price per share ($5,041,956 ÷ 169,490 shares) | | $29.75 |
(a) Redemption price per share is equal to net asset value less any applicable contingent deferred sales charge.
See accompanying notes which are an integral part of the financial statements.
Statement of Operations
| | | Six months ended January 31, 2019 (Unaudited) |
| Investment Income | | |
| Dividends | | $5,902,658 |
| Income from Fidelity Central Funds (including $1,228 from security lending) | | 85,207 |
| Total income | | 5,987,865 |
| Expenses | | |
| Management fee | $1,058,269 | |
| Transfer agent fees | 424,109 | |
| Distribution and service plan fees | 641,726 | |
| Accounting and security lending fees | 76,326 | |
| Custodian fees and expenses | 3,963 | |
| Independent trustees' fees and expenses | 1,140 | |
| Registration fees | 73,742 | |
| Audit | 21,883 | |
| Legal | 419 | |
| Miscellaneous | 1,073 | |
| Total expenses before reductions | 2,302,650 | |
| Expense reductions | (41,528) | |
| Total expenses after reductions | | 2,261,122 |
| Net investment income (loss) | | 3,726,743 |
| Realized and Unrealized Gain (Loss) | | |
| Net realized gain (loss) on: | | |
| Investment securities: | | |
| Unaffiliated issuers | (8,412,071) | |
| Fidelity Central Funds | 450 | |
| Foreign currency transactions | 3,694 | |
| Total net realized gain (loss) | | (8,407,927) |
| Change in net unrealized appreciation (depreciation) on: | | |
| Investment securities: | | |
| Unaffiliated issuers | 12,891,692 | |
| Assets and liabilities in foreign currencies | (61) | |
| Total change in net unrealized appreciation (depreciation) | | 12,891,631 |
| Net gain (loss) | | 4,483,704 |
| Net increase (decrease) in net assets resulting from operations | | $8,210,447 |
See accompanying notes which are an integral part of the financial statements.
Statement of Changes in Net Assets
| | Six months ended January 31, 2019 (Unaudited) | Year ended July 31, 2018 |
| Increase (Decrease) in Net Assets | | |
| Operations | | |
| Net investment income (loss) | $3,726,743 | $4,695,184 |
| Net realized gain (loss) | (8,407,927) | 38,780,720 |
| Change in net unrealized appreciation (depreciation) | 12,891,631 | (15,073,803) |
| Net increase (decrease) in net assets resulting from operations | 8,210,447 | 28,402,101 |
| Distributions to shareholders | (43,917,001) | – |
| Distributions to shareholders from net investment income | – | (4,657,557) |
| Distributions to shareholders from net realized gain | – | (6,020,491) |
| Total distributions | (43,917,001) | (10,678,048) |
| Share transactions - net increase (decrease) | 165,506,401 | (595,170) |
| Total increase (decrease) in net assets | 129,799,847 | 17,128,883 |
| Net Assets | | |
| Beginning of period | 329,228,440 | 312,099,557 |
| End of period | $459,028,287 | $329,228,440 |
| Other Information | | |
| Undistributed net investment income end of period | | $1,958,037 |
See accompanying notes which are an integral part of the financial statements.
Financial Highlights
Fidelity Advisor Utilities Fund Class A
| | Six months ended (Unaudited) January 31, | Years endedJuly 31, | | | | |
| | 2019 | 2018 | 2017 | 2016 | 2015 | 2014 |
| Selected Per–Share Data | | | | | | |
| Net asset value, beginning of period | $31.54 | $29.74 | $27.59 | $25.48 | $26.77 | $23.48 |
| Income from Investment Operations | | | | | | |
| Net investment income (loss)A | .31 | .49 | .50 | .44 | .44 | .41 |
| Net realized and unrealized gain (loss) | .57 | 2.38 | 2.14 | 2.75 | .18 | 3.35 |
| Total from investment operations | .88 | 2.87 | 2.64 | 3.19 | .62 | 3.76 |
| Distributions from net investment income | (.48) | (.49) | (.49) | (.46) | (.38) | (.46) |
| Distributions from net realized gain | (2.81) | (.58) | – | (.61) | (1.52) | (.01) |
| Total distributions | (3.29) | (1.07) | (.49) | (1.08)B | (1.91)C | (.47) |
| Redemption fees added to paid in capitalA | – | – | –D | –D | –D | –D |
| Net asset value, end of period | $29.13 | $31.54 | $29.74 | $27.59 | $25.48 | $26.77 |
| Total ReturnE,F,G | 2.57% | 9.84% | 9.87% | 13.49% | 2.01% | 16.38% |
| Ratios to Average Net AssetsH,I | | | | | | |
| Expenses before reductions | 1.10%J | 1.12% | 1.12% | 1.13% | 1.13% | 1.16% |
| Expenses net of fee waivers, if any | 1.10%J | 1.11% | 1.12% | 1.13% | 1.13% | 1.16% |
| Expenses net of all reductions | 1.08%J | 1.09% | 1.11% | 1.12% | 1.11% | 1.15% |
| Net investment income (loss) | 1.99%J | 1.66% | 1.87% | 1.78% | 1.65% | 1.64% |
| Supplemental Data | | | | | | |
| Net assets, end of period (000 omitted) | $202,303 | $173,999 | $160,040 | $178,116 | $140,148 | $154,134 |
| Portfolio turnover rateK | 71%J | 106% | 37% | 73% | 105% | 112% |
A Calculated based on average shares outstanding during the period.
B Total distributions of $1.08 per share is comprised of distributions from net investment income of $.462 and distributions from net realized gain of $.613 per share.
C Total distributions of $1.91 per share is comprised of distributions from net investment income of $.384 and distributions from net realized gain of $1.524 per share.
D Amount represents less than $.005 per share.
E Total returns for periods of less than one year are not annualized.
F Total returns would have been lower if certain expenses had not been reduced during the applicable periods shown.
G Total returns do not include the effect of the sales charges.
H Fees and expenses of any underlying Fidelity Central Funds are not included in the Fund's expense ratio. The Fund indirectly bears its proportionate share of the expenses of any underlying Fidelity Central Funds.
I Expense ratios reflect operating expenses of the class. Expenses before reductions do not reflect amounts reimbursed by the investment adviser or reductions from brokerage service arrangements or reductions from other expense offset arrangements and do not represent the amount paid by the class during periods when reimbursements or reductions occur. Expenses net of fee waivers reflect expenses after reimbursement by the investment adviser but prior to reductions from brokerage service arrangements or other expense offset arrangements. Expenses net of all reductions represent the net expenses paid by the class.
J Annualized
K Amount does not include the portfolio activity of any underlying Fidelity Central Funds.
See accompanying notes which are an integral part of the financial statements.
Fidelity Advisor Utilities Fund Class M
| | Six months ended (Unaudited) January 31, | Years endedJuly 31, | | | | |
| | 2019 | 2018 | 2017 | 2016 | 2015 | 2014 |
| Selected Per–Share Data | | | | | | |
| Net asset value, beginning of period | $31.58 | $29.77 | $27.62 | $25.49 | $26.78 | $23.50 |
| Income from Investment Operations | | | | | | |
| Net investment income (loss)A | .26 | .41 | .42 | .36 | .36 | .34 |
| Net realized and unrealized gain (loss) | .57 | 2.38 | 2.14 | 2.77 | .18 | 3.35 |
| Total from investment operations | .83 | 2.79 | 2.56 | 3.13 | .54 | 3.69 |
| Distributions from net investment income | (.39) | (.40) | (.41) | (.39) | (.31) | (.40) |
| Distributions from net realized gain | (2.81) | (.58) | – | (.61) | (1.52) | (.01) |
| Total distributions | (3.20) | (.98) | (.41) | (1.00) | (1.83) | (.41) |
| Redemption fees added to paid in capitalA | – | – | –B | –B | –B | –B |
| Net asset value, end of period | $29.21 | $31.58 | $29.77 | $27.62 | $25.49 | $26.78 |
| Total ReturnC,D,E | 2.41% | 9.53% | 9.51% | 13.19% | 1.72% | 15.99% |
| Ratios to Average Net AssetsF,G | | | | | | |
| Expenses before reductions | 1.39%H | 1.41% | 1.41% | 1.43% | 1.42% | 1.45% |
| Expenses net of fee waivers, if any | 1.39%H | 1.41% | 1.41% | 1.43% | 1.42% | 1.45% |
| Expenses net of all reductions | 1.37%H | 1.39% | 1.41% | 1.42% | 1.41% | 1.44% |
| Net investment income (loss) | 1.69%H | 1.36% | 1.57% | 1.47% | 1.35% | 1.35% |
| Supplemental Data | | | | | | |
| Net assets, end of period (000 omitted) | $53,676 | $46,669 | $48,152 | $56,403 | $46,366 | $49,272 |
| Portfolio turnover rateI | 71%H | 106% | 37% | 73% | 105% | 112% |
A Calculated based on average shares outstanding during the period.
B Amount represents less than $.005 per share.
C Total returns for periods of less than one year are not annualized.
D Total returns would have been lower if certain expenses had not been reduced during the applicable periods shown.
E Total returns do not include the effect of the sales charges.
F Fees and expenses of any underlying Fidelity Central Funds are not included in the Fund's expense ratio. The Fund indirectly bears its proportionate share of the expenses of any underlying Fidelity Central Funds.
G Expense ratios reflect operating expenses of the class. Expenses before reductions do not reflect amounts reimbursed by the investment adviser or reductions from brokerage service arrangements or reductions from other expense offset arrangements and do not represent the amount paid by the class during periods when reimbursements or reductions occur. Expenses net of fee waivers reflect expenses after reimbursement by the investment adviser but prior to reductions from brokerage service arrangements or other expense offset arrangements. Expenses net of all reductions represent the net expenses paid by the class.
H Annualized
I Amount does not include the portfolio activity of any underlying Fidelity Central Funds.
See accompanying notes which are an integral part of the financial statements.
Fidelity Advisor Utilities Fund Class C
| | Six months ended (Unaudited) January 31, | Years endedJuly 31, | | | | |
| | 2019 | 2018 | 2017 | 2016 | 2015 | 2014 |
| Selected Per–Share Data | | | | | | |
| Net asset value, beginning of period | $30.81 | $29.07 | $26.98 | $24.91 | $26.23 | $23.03 |
| Income from Investment Operations | | | | | | |
| Net investment income (loss)A | .19 | .26 | .29 | .25 | .23 | .23 |
| Net realized and unrealized gain (loss) | .54 | 2.33 | 2.09 | 2.70 | .19 | 3.29 |
| Total from investment operations | .73 | 2.59 | 2.38 | 2.95 | .42 | 3.52 |
| Distributions from net investment income | (.26) | (.27) | (.29) | (.27) | (.22) | (.31) |
| Distributions from net realized gain | (2.81) | (.58) | – | (.61) | (1.52) | (.01) |
| Total distributions | (3.07) | (.85) | (.29) | (.88) | (1.74) | (.32) |
| Redemption fees added to paid in capitalA | – | – | –B | –B | –B | –B |
| Net asset value, end of period | $28.47 | $30.81 | $29.07 | $26.98 | $24.91 | $26.23 |
| Total ReturnC,D,E | 2.15% | 9.04% | 9.01% | 12.64% | 1.29% | 15.52% |
| Ratios to Average Net AssetsF,G | | | | | | |
| Expenses before reductions | 1.86%H | 1.87% | 1.87% | 1.88% | 1.88% | 1.89% |
| Expenses net of fee waivers, if any | 1.86%H | 1.87% | 1.87% | 1.88% | 1.88% | 1.89% |
| Expenses net of all reductions | 1.84%H | 1.85% | 1.86% | 1.88% | 1.86% | 1.88% |
| Net investment income (loss) | 1.23%H | .90% | 1.11% | 1.02% | .89% | .91% |
| Supplemental Data | | | | | | |
| Net assets, end of period (000 omitted) | $63,435 | $53,099 | $56,964 | $70,957 | $52,172 | $54,810 |
| Portfolio turnover rateI | 71%H | 106% | 37% | 73% | 105% | 112% |
A Calculated based on average shares outstanding during the period.
B Amount represents less than $.005 per share.
C Total returns for periods of less than one year are not annualized.
D Total returns would have been lower if certain expenses had not been reduced during the applicable periods shown.
E Total returns do not include the effect of the contingent deferred sales charge.
F Fees and expenses of any underlying Fidelity Central Funds are not included in the Fund's expense ratio. The Fund indirectly bears its proportionate share of the expenses of any underlying Fidelity Central Funds.
G Expense ratios reflect operating expenses of the class. Expenses before reductions do not reflect amounts reimbursed by the investment adviser or reductions from brokerage service arrangements or reductions from other expense offset arrangements and do not represent the amount paid by the class during periods when reimbursements or reductions occur. Expenses net of fee waivers reflect expenses after reimbursement by the investment adviser but prior to reductions from brokerage service arrangements or other expense offset arrangements. Expenses net of all reductions represent the net expenses paid by the class.
H Annualized
I Amount does not include the portfolio activity of any underlying Fidelity Central Funds.
See accompanying notes which are an integral part of the financial statements.
Fidelity Advisor Utilities Fund Class I
| | Six months ended (Unaudited) January 31, | Years endedJuly 31, | | | | |
| | 2019 | 2018 | 2017 | 2016 | 2015 | 2014 |
| Selected Per–Share Data | | | | | | |
| Net asset value, beginning of period | $32.21 | $30.35 | $28.14 | $25.97 | $27.24 | $23.87 |
| Income from Investment Operations | | | | | | |
| Net investment income (loss)A | .35 | .59 | .59 | .53 | .52 | .51 |
| Net realized and unrealized gain (loss) | .58 | 2.43 | 2.17 | 2.78 | .20 | 3.39 |
| Total from investment operations | .93 | 3.02 | 2.76 | 3.31 | .72 | 3.90 |
| Distributions from net investment income | (.58) | (.58) | (.55) | (.53) | (.46) | (.52) |
| Distributions from net realized gain | (2.81) | (.58) | – | (.61) | (1.52) | (.01) |
| Total distributions | (3.38)B | (1.16) | (.55) | (1.14) | (1.99)C | (.53) |
| Redemption fees added to paid in capitalA | – | – | –D | –D | –D | –D |
| Net asset value, end of period | $29.76 | $32.21 | $30.35 | $28.14 | $25.97 | $27.24 |
| Total ReturnE,F | 2.69% | 10.14% | 10.17% | 13.81% | 2.35% | 16.74% |
| Ratios to Average Net AssetsG,H | | | | | | |
| Expenses before reductions | .83%I | .84% | .85% | .84% | .83% | .85% |
| Expenses net of fee waivers, if any | .83%I | .84% | .85% | .84% | .83% | .85% |
| Expenses net of all reductions | .81%I | .82% | .84% | .84% | .81% | .84% |
| Net investment income (loss) | 2.26%I | 1.93% | 2.14% | 2.06% | 1.94% | 1.95% |
| Supplemental Data | | | | | | |
| Net assets, end of period (000 omitted) | $134,572 | $55,462 | $46,943 | $62,600 | $31,710 | $46,135 |
| Portfolio turnover rateJ | 71%I | 106% | 37% | 73% | 105% | 112% |
A Calculated based on average shares outstanding during the period.
B Total distributions of $3.38 per share is comprised of distributions from net investment income of $.578 and distributions from net realized gain of $2.805 per share.
C Total distributions of $1.99 per share is comprised of distributions from net investment income of $.463 and distributions from net realized gain of $1.524 per share.
D Amount represents less than $.005 per share.
E Total returns for periods of less than one year are not annualized.
F Total returns would have been lower if certain expenses had not been reduced during the applicable periods shown.
G Fees and expenses of any underlying Fidelity Central Funds are not included in the Fund's expense ratio. The Fund indirectly bears its proportionate share of the expenses of any underlying Fidelity Central Funds.
H Expense ratios reflect operating expenses of the class. Expenses before reductions do not reflect amounts reimbursed by the investment adviser or reductions from brokerage service arrangements or reductions from other expense offset arrangements and do not represent the amount paid by the class during periods when reimbursements or reductions occur. Expenses net of fee waivers reflect expenses after reimbursement by the investment adviser but prior to reductions from brokerage service arrangements or other expense offset arrangements. Expenses net of all reductions represent the net expenses paid by the class.
I Annualized
J Amount does not include the portfolio activity of any underlying Fidelity Central Funds.
See accompanying notes which are an integral part of the financial statements.
Fidelity Advisor Utilities Fund Class Z
| | Six months ended (Unaudited) January 31, |
| | 2019 A |
| Selected Per–Share Data | |
| Net asset value, beginning of period | $33.14 |
| Income from Investment Operations | |
| Net investment income (loss)B | .19 |
| Net realized and unrealized gain (loss) | (.16) |
| Total from investment operations | .03 |
| Distributions from net investment income | (.61) |
| Distributions from net realized gain | (2.81) |
| Total distributions | (3.42) |
| Net asset value, end of period | $29.75 |
| Total ReturnC,D | (.12)% |
| Ratios to Average Net AssetsE,F | |
| Expenses before reductions | .68%G |
| Expenses net of fee waivers, if any | .68%G |
| Expenses net of all reductions | .66%G |
| Net investment income (loss) | 1.94%G |
| Supplemental Data | |
| Net assets, end of period (000 omitted) | $5,042 |
| Portfolio turnover rateH | 71%G |
A For the period October 2, 2018 (commencement of sale of shares) to January 31, 2019.
B Calculated based on average shares outstanding during the period.
C Total returns for periods of less than one year are not annualized.
D Total returns would have been lower if certain expenses had not been reduced during the applicable periods shown.
E Fees and expenses of any underlying Fidelity Central Funds are not included in the Fund's expense ratio. The Fund indirectly bears its proportionate share of the expenses of any underlying Fidelity Central Funds.
F Expense ratios reflect operating expenses of the class. Expenses before reductions do not reflect amounts reimbursed by the investment adviser or reductions from brokerage service arrangements or reductions from other expense offset arrangements and do not represent the amount paid by the class during periods when reimbursements or reductions occur. Expense ratios before reductions for start-up periods may not be representative of longer-term operating periods. Expenses net of fee waivers reflect expenses after reimbursement by the investment adviser but prior to reductions from brokerage service arrangements or other expense offset arrangements. Expenses net of all reductions represent the net expenses paid by the class.
G Annualized
H Amount does not include the portfolio activity of any underlying Fidelity Central Funds.
See accompanying notes which are an integral part of the financial statements.
Notes to Financial Statements (Unaudited)
For the period ended January 31, 2019
1. Organization.
Fidelity Advisor Biotechnology Fund, Fidelity Advisor Communications Equipment Fund, Fidelity Advisor Consumer Discretionary Fund, Fidelity Advisor Energy Fund, Fidelity Advisor Financial Services Fund, Fidelity Advisor Health Care Fund, Fidelity Advisor Industrials Fund, Fidelity Advisor Semiconductors Fund, Fidelity Advisor Technology Fund and Fidelity Advisor Utilities Fund (the Funds) are funds of Fidelity Advisor Series VII (the Trust) and are authorized to issue an unlimited number of shares. The Trust is registered under the Investment Company Act of 1940, as amended (the 1940 Act), as an open-end management investment company organized as a Massachusetts business trust. The Funds are non-diversified with the exception of Fidelity Advisor Financial Services Fund and Fidelity Advisor Health Care Fund. The Funds, with the exception of Fidelity Advisor Communications Equipment Fund, commenced sale of Class Z shares on October 2, 2018. Each Fund offers Class A, Class M, Class C, Class I and Class Z shares, with the exception of Fidelity Advisor Communications Equipment Fund, each of which has equal rights as to assets and voting privileges. Each class has exclusive voting rights with respect to matters that affect that class.
Effective March 1, 2019, Class C shares will automatically convert to Class A shares after a holding period of ten years from the initial date of purchase, with certain exceptions.
2. Investments in Fidelity Central Funds.
The Funds invest in Fidelity Central Funds, which are open-end investment companies generally available only to other investment companies and accounts managed by the investment adviser and its affiliates. The Funds' Schedules of Investments list each of the Fidelity Central Funds held as of period end, if any, as an investment of each Fund, but do not include the underlying holdings of each Fidelity Central Fund. As an Investing Fund, each Fund indirectly bears its proportionate share of the expenses of the underlying Fidelity Central Funds.
The Money Market Central Funds seek preservation of capital and current income and are managed by Fidelity Investments Money Management, Inc. (FIMM), an affiliate of the investment adviser. Annualized expenses of the Money Market Central Funds as of their most recent shareholder report date are less than .005%.
A complete unaudited list of holdings for each Fidelity Central Fund is available upon request or at the Securities and Exchange Commission (the SEC) website at www.sec.gov. In addition, the financial statements of the Fidelity Central Funds are available on the SEC website or upon request.
3. Significant Accounting Policies.
Each Fund is an investment company and applies the accounting and reporting guidance of the Financial Accounting Standards Board (FASB) Accounting Standards Codification Topic 946 Financial Services – Investments Companies. The financial statements have been prepared in conformity with accounting principles generally accepted in the United States of America (GAAP), which require management to make certain estimates and assumptions at the date of the financial statements. Actual results could differ from those estimates. Subsequent events, if any, through the date that the financial statements were issued have been evaluated in the preparation of the financial statements. The following summarizes the significant accounting policies of the Funds:
Investment Valuation. Investments are valued as of 4:00 p.m. Eastern time on the last calendar day of the period. The Board of Trustees (the Board) has delegated the day to day responsibility for the valuation of each Fund's investments to the Fair Value Committee (the Committee) established by each Fund's investment adviser. In accordance with valuation policies and procedures approved by the Board, each Fund attempts to obtain prices from one or more third party pricing vendors or brokers to value its investments. When current market prices, quotations or currency exchange rates are not readily available or reliable, investments will be fair valued in good faith by the Committee, in accordance with procedures adopted by the Board. Factors used in determining fair value vary by investment type and may include market or investment specific events. The frequency with which these procedures are used cannot be predicted and they may be utilized to a significant extent. The Committee oversees each Fund's valuation policies and procedures and reports to the Board on the Committee's activities and fair value determinations. The Board monitors the appropriateness of the procedures used in valuing each Fund's investments and ratifies the fair value determinations of the Committee.
Each Fund categorizes the inputs to valuation techniques used to value its investments into a disclosure hierarchy consisting of three levels as shown below:
- Level 1 – quoted prices in active markets for identical investments
- Level 2 – other significant observable inputs (including quoted prices for similar investments, interest rates, prepayment speeds, etc.)
- Level 3 – unobservable inputs (including the Fund's own assumptions based on the best information available)
Valuation techniques used to value each Fund's investments by major category are as follows:
Equity securities, including restricted securities, for which market quotations are readily available, are valued at the last reported sale price or official closing price as reported by a third party pricing vendor on the primary market or exchange on which they are traded and are categorized as Level 1 in the hierarchy. In the event there were no sales during the day or closing prices are not available, securities are valued at the last quoted bid price or may be valued using the last available price and are generally categorized as Level 2 in the hierarchy. For foreign equity securities, when market or security specific events arise, comparisons to the valuation of American Depositary Receipts (ADRs), futures contracts, Exchange-Traded Funds (ETFs) and certain indexes as well as quoted prices for similar securities may be used and would be categorized as Level 2 in the hierarchy. For equity securities, including restricted securities, where observable inputs are limited, assumptions about market activity and risk are used and these securities may be categorized as Level 3 in the hierarchy. Equity securities, including restricted securities, for which observable inputs are not available are valued using alternate valuation approaches, including the market approach and the income approach and are categorized as Level 3 in the hierarchy. The market approach generally consists of using comparable market transactions while the income approach generally consists of using the net present value of estimated future cash flows, adjusted as appropriate for liquidity, credit, market and/or other risk factors.
Investments in open-end mutual funds, including the Fidelity Central Funds, are valued at their closing net asset value (NAV) each business day and are categorized as Level 1 in the hierarchy.
The following provides information on Level 3 securities held by Fidelity Advisor Biotechnology Fund and Fidelity Advisor Technology Fund that were valued at period end based on unobservable inputs. These amounts exclude valuations provided by a broker.
Fidelity Advisor Biotechnology Fund:
| Asset Type | Fair Value | Valuation Technique(s) | Unobservable Input | Amount or Range/Weighted Average | Impact to Valuation from an Increase in Input(a) |
| Equities | $26,249,717 | Market approach | Transaction price | $40.63 - $150.96 / $55.74 | Increase |
| | | Recovery value | Recovery value | 0.0% | Increase |
| | | Market comparable | Transaction price | $3.79 - $132.98 / $28.96 | Increase |
| | | | Proxy discount | 4.2% - 26.0% / 13.2% | Decrease |
| | | | Proxy premium | 10.8% | Increase |
| | | Discount cash flow | Discount rate | 8.0% | Decrease |
| | | | Discount for lack of marketability | 10.0% | Decrease |
(a) Represents the directional change in the fair value of the Level 3 investments that could have resulted from an increase in the corresponding input as of period end. A decrease to the unobservable input would have had the opposite effect. Significant changes in these inputs may have resulted in a significantly higher or lower fair value measurement at period end.
Fidelity Advisor Technology Fund:
| Asset Type | Fair Value | Valuation Technique(s) | Unobservable Input | Amount or Range/Weighted Average | Impact to Valuation from an Increase in Input(a) |
| Equities | $ 25,648,851 | Market approach | Transaction price | $5.61 - $48.77 / $30.58 | Increase |
| | | | Discount for lack of marketability | 20.0% | Decrease |
| | | Recovery value | Recovery value | 0.0% | Increase |
| | | Market comparable | Enterprise value/Sales multiple (EV/S) | 2.6 | Increase |
| | | | Discount rate | 30.0% | Decrease |
(a) Represents the directional change in the fair value of the Level 3 investments that could have resulted from an increase in the corresponding input as of period end. A decrease to the unobservable input would have had the opposite effect. Significant changes in these inputs may have resulted in a significantly higher or lower fair value measurement at period end.
Changes in valuation techniques may result in transfers in or out of an assigned level within the disclosure hierarchy. The aggregate value of investments by input level as of January 31, 2019, as well as a roll forward of Level 3 investments, is included at the end of each applicable Fund's Schedule of Investments.
Foreign Currency. The Funds may use foreign currency contracts to facilitate transactions in foreign-denominated securities. Gains and losses from these transactions may arise from changes in the value of the foreign currency or if the counterparties do not perform under the contracts' terms.
Foreign-denominated assets, including investment securities, and liabilities are translated into U.S. dollars at the exchange rates at period end. Purchases and sales of investment securities, income and dividends received and expenses denominated in foreign currencies are translated into U.S. dollars at the exchange rate in effect on the transaction date.
The effects of exchange rate fluctuations on investments are included with the net realized and unrealized gain (loss) on investment securities. Other foreign currency transactions resulting in realized and unrealized gain (loss) are disclosed separately.
Investment Transactions and Income. For financial reporting purposes, the Funds' investment holdings and NAV include trades executed through the end of the last business day of the period. The NAV per share for processing shareholder transactions is calculated as of the close of business of the New York Stock Exchange (NYSE), normally 4:00 p.m. Eastern time and includes trades executed through the end of the prior business day. Gains and losses on securities sold are determined on the basis of identified cost and for certain Funds include proceeds received from litigation. Dividend income is recorded on the ex-dividend date, except for certain dividends from foreign securities where the ex-dividend date may have passed, which are recorded as soon as the Funds are informed of the ex-dividend date. Non-cash dividends included in dividend income, if any, are recorded at the fair market value of the securities received. Income and capital gain distributions from Fidelity Central Funds, if any, are recorded on the ex-dividend date. Certain distributions received by the Funds represent a return of capital or capital gain. The Funds determine the components of these distributions subsequent to the ex-dividend date, based upon receipt of tax filings or other correspondence relating to the underlying investment. These distributions are recorded as a reduction of cost of investments and/or as a realized gain. Investment income is recorded net of foreign taxes withheld where recovery of such taxes is uncertain.
Class Allocations and Expenses. Investment income, realized and unrealized capital gains and losses, common expenses of each Fund, and certain fund-level expense reductions, if any, are allocated daily on a pro-rata basis to each class based on the relative net assets of each class to the total net assets of each Fund. Each class differs with respect to transfer agent and distribution and service plan fees incurred. Certain expense reductions may also differ by class. For the reporting period, the allocated portion of income and expenses to each class as a percent of its average net assets may vary due to the timing of recording these transactions in relation to fluctuating net assets of the classes. Expenses directly attributable to a fund are charged to that fund. Expenses attributable to more than one fund are allocated among the respective funds on the basis of relative net assets or other appropriate methods. Expense estimates are accrued in the period to which they relate and adjustments are made when actual amounts are known.
Deferred Trustee Compensation. Under a Deferred Compensation Plan (the Plan) for Fidelity Advisor Energy Fund and Fidelity Advisor Technology Fund, independent Trustees have elected to defer receipt of a portion of their annual compensation. Deferred amounts are invested in a cross-section of Fidelity funds, are marked-to-market and remain in each Fund until distributed in accordance with the Plan. The investment of deferred amounts and the offsetting payable to the Trustees presented below are included in each accompanying Statement of Assets and Liabilities in other receivables and other payables and accrued expenses, respectively.
| Fidelity Advisor Energy Fund | $53,881 |
| Fidelity Advisor Technology Fund | 86,240 |
Income Tax Information and Distributions to Shareholders. Each year, each Fund intends to qualify as a regulated investment company under Subchapter M of the Internal Revenue Code, including distributing substantially all of its taxable income and realized gains. As a result, no provision for U.S. Federal income taxes is required. Each Fund files a U.S. federal tax return, in addition to state and local tax returns as required. Each Fund's federal income tax returns are subject to examination by the Internal Revenue Service (IRS) for a period of three fiscal years after they are filed. State and local tax returns may be subject to examination for an additional fiscal year depending on the jurisdiction. Foreign taxes are provided for based on each Fund's understanding of the tax rules and rates that exist in the foreign markets in which it invests. Fidelity Advisor Energy Fund is subject to a tax imposed on capital gains by certain countries in which it invests. An estimated deferred tax liability for net unrealized appreciation on the applicable securities is included in Other payables and accrued expenses on each applicable Fund's Statement of Assets & Liabilities.
Distributions are declared and recorded on the ex-dividend date. Income and capital gain distributions are declared separately for each class. Income and capital gain distributions are determined in accordance with income tax regulations, which may differ from GAAP.
Capital accounts within the financial statements are adjusted for permanent book-tax differences. These adjustments have no impact on net assets or the results of operations. Capital accounts are not adjusted for temporary book-tax differences which will reverse in a subsequent period.
Book-tax differences are primarily due to foreign currency transactions, certain foreign taxes, passive foreign investment companies (PFIC), deferred trustees compensation, net operating losses, capital loss carryforwards, partnerships, losses deferred due to wash sales and excise tax regulations.
As of period end, the cost and unrealized appreciation (depreciation) in securities, and derivatives if applicable, for federal income tax purposes were as follows for each Fund:
| | Tax cost | Gross unrealized appreciation | Gross unrealized depreciation | Net unrealized appreciation (depreciation) |
| Fidelity Advisor Biotechnology Fund | $2,075,465,783 | $631,280,777 | $(142,585,597) | $488,695,180 |
| Fidelity Advisor Communications Equipment Fund | 29,881,674 | 5,392,145 | (1,019,787) | 4,372,358 |
| Fidelity Advisor Consumer Discretionary Fund | 296,876,424 | 100,592,522 | (14,968,566) | 85,623,956 |
| Fidelity Advisor Energy Fund | 661,487,384 | 87,157,346 | (70,786,130) | 16,371,216 |
| Fidelity Advisor Financial Services Fund | 398,069,540 | 35,082,671 | (20,390,045) | 14,692,626 |
| Fidelity Advisor Health Care Fund | 3,046,097,970 | 1,013,085,858 | (101,685,849) | 911,400,009 |
| Fidelity Advisor Industrials Fund | 541,740,516 | 123,898,449 | (19,725,735) | 104,172,714 |
| Fidelity Advisor Semiconductors Fund | 215,151,565 | 35,688,602 | (15,976,140) | 19,712,462 |
| Fidelity Advisor Technology Fund | 1,629,333,781 | 279,230,986 | (83,804,158) | 195,426,828 |
| Fidelity Advisor Utilities Fund | 388,537,675 | 68,492,967 | (3,960,565) | 64,532,402 |
Capital loss carryforwards are only available to offset future capital gains of the Funds to the extent provided by regulations and may be limited. Under the Regulated Investment Company Modernization Act of 2010 (the Act), the Funds are permitted to carry forward capital losses incurred in taxable years beginning after December 22, 2010 for an unlimited period and such capital losses are required to be used prior to any losses that expire. The capital loss carryforward information presented below, including any applicable limitation, is estimated as of prior fiscal period end and is subject to adjustment.
| | No expiration | | | |
| | Short-term | Long-term | Total no expiration | Total capital loss carryforward |
| Fidelity Advisor Biotechnology Fund | $(63,793,493) | $– | $(63,793,493) | $(63,793,493) |
| Fidelity Advisor Energy Fund | (104,186,750) | (65,931,921) | (170,118,671) | (170,118,671) |
Certain of the Funds elected to defer to the next fiscal year ordinary losses recognized during the period January 1, 2018 to July 31, 2018. Loss deferrals were as follows:
| | Ordinary losses |
| Fidelity Advisor Biotechnology Fund | $8,149,824 |
| Fidelity Advisor Consumer Discretionary Fund | 96,300 |
| Fidelity Advisor Health Care Fund | 7,538,744 |
Restricted Securities. The Funds may invest in securities that are subject to legal or contractual restrictions on resale. These securities generally may be resold in transactions exempt from registration or to the public if the securities are registered. Disposal of these securities may involve time-consuming negotiations and expense, and prompt sale at an acceptable price may be difficult. Information regarding restricted securities is included at the end of each applicable Fund's Schedule of Investments.
Consolidated Subsidiary. Fidelity Advisor Biotechnology Fund invests in certain investments through a wholly-owned subsidiary ("Subsidiary"), which may be subject to federal and state taxes upon disposition.
As of period end, the Fund held an investment of $11,618,612 in this Subsidiary, representing .47% of the Fund's net assets. The financial statements have been consolidated and include accounts of the Fund and the Subsidiary. Accordingly, all inter-company transactions and balances have been eliminated.
Any cash held by the Subsidiary is restricted as to its use and is presented as Restricted cash in the Statement of Assets and Liabilities.
New Rule Issuance. During August 2018, the U.S. Securities and Exchange Commission issued Final Rule Release No. 33-10532, Disclosure Update and Simplification. This Final Rule includes amendments specific to registered investment companies that are intended to eliminate overlap in disclosure requirements between Regulation S-X and GAAP. In accordance with these amendments, certain line-items in the Funds' financial statements have been combined or removed for the current period as outlined in the table below.
| Financial Statement | Current Line-Item Presentation (As Applicable) | Prior Line-Item Presentation (As Applicable) |
| Statement of Assets and Liabilities | Total distributable earnings (loss) | Undistributed/Distributions in excess of/Accumulated net investment income (loss)
Accumulated/Undistributed net realized gain (loss)
Net unrealized appreciation (depreciation) |
| Statement of Changes in Net Assets | N/A - removed | Undistributed/Distributions in excess of/Accumulated net investment income (loss) end of period |
| Statement of Changes in Net Assets | Distributions to shareholders | Distributions to shareholders from net investment income
Distributions to shareholders from net realized gain |
| Distributions to Shareholders Note to Financial Statements | Distributions to shareholders | Distributions to shareholders from net investment income
Distributions to shareholders from net realized gain |
4. Purchases and Sales of Investments.
Purchases and sales of securities, other than short-term securities, are noted in the table below.
| | Purchases ($) | Sales ($) |
| Fidelity Advisor Biotechnology Fund | 850,970,757 | 983,061,397 |
| Fidelity Advisor Communications Equipment Fund | 23,370,326 | 13,630,071 |
| Fidelity Advisor Consumer Discretionary Fund | 139,885,467 | 141,153,912 |
| Fidelity Advisor Energy Fund | 140,391,196 | 198,883,911 |
| Fidelity Advisor Financial Services Fund | 150,769,752 | 207,259,289 |
| Fidelity Advisor Health Care Fund | 1,426,467,329 | 829,742,501 |
| Fidelity Advisor Industrials Fund | 522,182,570 | 638,192,130 |
| Fidelity Advisor Semiconductors Fund | 137,751,332 | 198,687,091 |
| Fidelity Advisor Technology Fund | 1,679,508,659 | 1,752,792,812 |
| Fidelity Advisor Utilities Fund | 252,855,536 | 136,201,962 |
5. Fees and Other Transactions with Affiliates.
Management Fee. Fidelity SelectCo, LLC (the investment adviser) and its affiliates provide the Funds with investment management related services for which the Funds pay a monthly management fee. The management fee is the sum of an individual fund fee rate and an annualized group fee rate. The individual fund fee rate is applied to each Fund's average net assets. The group fee rate is based upon the average net assets of all the mutual funds advised by Fidelity Management & Research Company (FMR) and the investment adviser. The group fee rate decreases as assets under management increase and increases as assets under management decrease. For the reporting period, each Fund's annualized management fee rate expressed as a percentage of each Fund's average net assets was as follows:
| | Individual Rate | Group Rate | Total |
| Fidelity Advisor Biotechnology Fund | .30% | .24% | .54% |
| Fidelity Advisor Communications Equipment Fund | .30% | .24% | .54% |
| Fidelity Advisor Consumer Discretionary Fund | .30% | .24% | .54% |
| Fidelity Advisor Energy Fund | .30% | .24% | .54% |
| Fidelity Advisor Financial Services Fund | .30% | .24% | .54% |
| Fidelity Advisor Health Care Fund | .30% | .24% | .54% |
| Fidelity Advisor Industrials Fund | .30% | .24% | .54% |
| Fidelity Advisor Semiconductors Fund | .30% | .24% | .54% |
| Fidelity Advisor Technology Fund | .30% | .24% | .54% |
| Fidelity Advisor Utilities Fund | .30% | .24% | .54% |
Distribution and Service Plan Fees. In accordance with Rule 12b-1 of the 1940 Act, each Fund has adopted separate Distribution and Service Plans for each class of shares. Certain classes pay Fidelity Distributors Corporation (FDC), an affiliate of the investment adviser, separate Distribution and Service Fees, each of which is based on an annual percentage of each class' average net assets. In addition, FDC may pay financial intermediaries for selling shares of each Fund and providing shareholder support services. For the period, the Distribution and Service Fee rates, total fees and amounts retained by FDC were as follows:
| | Distribution Fee | Service Fee | Total Fees | Retained by FDC |
| Fidelity Advisor Biotechnology Fund | | | | |
| Class A | -% | .25% | $872,652 | $11,309 |
| Class M | .25% | .25% | 322,169 | – |
| Class C | .75% | .25% | 2,553,748 | 143,681 |
| | | | $3,748,569 | $154,990 |
| Fidelity Advisor Communications Equipment Fund | | | | |
| Class A | -% | .25% | $12,924 | $1,139 |
| Class M | .25% | .25% | 13,032 | – |
| Class C | .75% | .25% | 26,739 | 4,242 |
| | | | $52,695 | $5,381 |
| Fidelity Advisor Consumer Discretionary Fund | | | | |
| Class A | -% | .25% | $179,592 | $6,464 |
| Class M | .25% | .25% | 80,820 | – |
| Class C | .75% | .25% | 357,523 | 45,683 |
| | | | $617,935 | $52,147 |
| Fidelity Advisor Energy Fund | | | | |
| Class A | -% | .25% | $287,846 | $5,894 |
| Class M | .25% | .25% | 278,017 | 170 |
| Class C | .75% | .25% | 726,941 | 51,185 |
| | | | $1,292,804 | $57,249 |
| Fidelity Advisor Financial Services Fund | | | | |
| Class A | -% | .25% | $196,448 | $5,762 |
| Class M | .25% | .25% | 123,018 | – |
| Class C | .75% | .25% | 533,360 | 78,569 |
| | | | $852,826 | $84,331 |
| Fidelity Advisor Health Care Fund | | | | |
| Class A | -% | .25% | $1,276,329 | $19,308 |
| Class M | .25% | .25% | 743,216 | – |
| Class C | .75% | .25% | 3,365,372 | 295,318 |
| | | | $5,384,917 | $314,626 |
| Fidelity Advisor Industrials Fund | | | | |
| Class A | -% | .25% | $342,078 | $4,406 |
| Class M | .25% | .25% | 162,796 | – |
| Class C | .75% | .25% | 620,681 | 54,890 |
| | | | $1,125,555 | $59,296 |
| Fidelity Advisor Semiconductors Fund | | | | |
| Class A | -% | .25% | $106,774 | $1,638 |
| Class M | .25% | .25% | 48,310 | 616 |
| Class C | .75% | .25% | 240,777 | 35,234 |
| | | | $395,861 | $37,488 |
| Fidelity Advisor Technology Fund | | | | |
| Class A | -% | .25% | $948,027 | $23,987 |
| Class M | .25% | .25% | 748,987 | 2,176 |
| Class C | .75% | .25% | 1,473,080 | 249,535 |
| | | | $3,170,094 | $275,698 |
| Fidelity Advisor Utilities Fund | | | | |
| Class A | -% | .25% | $232,925 | $9,445 |
| Class M | .25% | .25% | 124,652 | 294 |
| Class C | .75% | .25% | 284,149 | 26,279 |
| | | | $641,726 | $36,018 |
Sales Load. FDC may receive a front-end sales charge of up to 5.75% for selling Class A shares and 3.50% for selling Class M shares, some of which is paid to financial intermediaries for selling shares of each Fund. Depending on the holding period, FDC may receive contingent deferred sales charges levied on Class A, Class M and Class C redemptions. The deferred sales charges are 1.00% for Class C shares, 1.00% for certain purchases of Class A shares and .25% for certain purchases of Class M shares.
For the period, sales charge amounts retained by FDC were as follows:
| | Retained by FDC |
| Fidelity Advisor Biotechnology Fund | |
| Class A | $159,598 |
| Class M | 13,235 |
| Class C(a) | 15,077 |
| | $187,910 |
| Fidelity Advisor Communications Equipment Fund | |
| Class A | $12,342 |
| Class M | 668 |
| Class C(a) | 521 |
| | $13,531 |
| Fidelity Advisor Consumer Discretionary Fund | |
| Class A | $77,732 |
| Class M | 5,259 |
| Class C(a) | 3,853 |
| | $86,844 |
| Fidelity Advisor Energy Fund | |
| Class A | $31,221 |
| Class C(a) | 8,058 |
| | $39,279 |
| Fidelity Advisor Financial Services Fund | |
| Class A | $29,711 |
| Class M | 3,955 |
| Class C(a) | 9,833 |
| | $43,499 |
| Fidelity Advisor Health Care Fund | |
| Class A | $390,328 |
| Class M | 39,749 |
| Class C(a) | 15,376 |
| | $445,453 |
| Fidelity Advisor Industrials Fund | |
| Class A | $30,342 |
| Class M | 2,367 |
| Class C(a) | 5,916 |
| | $38,625 |
| Fidelity Advisor Semiconductors Fund | |
| Class A | $32,400 |
| Class M | 3,027 |
| Class C(a) | 8,094 |
| | $43,521 |
| Fidelity Advisor Technology Fund | |
| Class A | $178,576 |
| Class M | 18,591 |
| Class C(a) | 30,433 |
| | $227,600 |
| Fidelity Advisor Utilities Fund | |
| Class A | $108,321 |
| Class M | 13,960 |
| Class C(a) | 2,644 |
| | $124,925 |
(a) When Class C shares are initially sold, FDC pays commissions from its own resources to financial intermediaries through which the sales are made.
Transfer Agent Fees. Fidelity Investments Institutional Operations Company, Inc., (FIIOC), an affiliate of the investment adviser, is the transfer, dividend disbursing and shareholder servicing agent for each class of the Funds. FIIOC receives account fees and asset-based fees that vary according to the account size and type of account of the shareholders of the respective classes of each Fund, except for Class Z. FIIOC receives an asset-based fee of Class Z's average net assets. FIIOC pays for typesetting, printing and mailing of shareholder reports, except proxy statements. For the period, transfer agent fees for each class were as follows:
| | Amount | % of Class-Level Average Net Assets(a) |
| Fidelity Advisor Biotechnology Fund | | |
| Class A | $701,104 | .20 |
| Class M | 169,431 | .26 |
| Class C | 488,748 | .19 |
| Class I | 1,104,181 | .18 |
| Class Z | 1,935 | .05 |
| | $2,465,399 | |
| Fidelity Advisor Communications Equipment Fund | | |
| Class A | $14,536 | .28 |
| Class M | 9,030 | .35 |
| Class C | 8,112 | .30 |
| Class I | 5,064 | .18 |
| | $36,742 | |
| Fidelity Advisor Consumer Discretionary Fund | | |
| Class A | $153,845 | .21 |
| Class M | 36,023 | .22 |
| Class C | 75,151 | .21 |
| Class I | 144,498 | .18 |
| Class Z | 261 | .05 |
| | $409,778 | |
| Fidelity Advisor Energy Fund | | |
| Class A | $278,929 | .24 |
| Class M | 144,667 | .26 |
| Class C | 157,815 | .22 |
| Class I | 316,566 | .20 |
| Class Z | 922 | .05 |
| | $898,899 | |
| Fidelity Advisor Financial Services Fund | | |
| Class A | $167,633 | .21 |
| Class M | 56,935 | .23 |
| Class C | 112,949 | .21 |
| Class I | 130,296 | .18 |
| Class Z | 241 | .05 |
| | $468,054 | |
| Fidelity Advisor Health Care Fund | | |
| Class A | $993,755 | .19 |
| Class M | 302,854 | .20 |
| Class C | 637,521 | .19 |
| Class I | 1,372,249 | .18 |
| Class Z | 7,195 | .05 |
| | $3,313,574 | |
| Fidelity Advisor Industrials Fund | | |
| Class A | $264,032 | .19 |
| Class M | 67,928 | .21 |
| Class C | 123,753 | .20 |
| Class I | 251,246 | .18 |
| Class Z | 849 | .05 |
| | $707,808 | |
| Fidelity Advisor Semiconductors Fund | | |
| Class A | $96,101 | .22 |
| Class M | 29,229 | .30 |
| Class C | 55,898 | .23 |
| Class I | 91,989 | .18 |
| Class Z | 151 | .05 |
| | $273,368 | |
| Fidelity Advisor Technology Fund | | |
| Class A | $747,658 | .20 |
| Class M | 305,067 | .20 |
| Class C | 301,689 | .20 |
| Class I | 604,346 | .18 |
| Class Z | 1,264 | .05 |
| | $1,960,024 | |
| Fidelity Advisor Utilities Fund | | |
| Class A | $201,003 | .22 |
| Class M | 64,543 | .26 |
| Class C | 63,555 | .22 |
| Class I | 94,590 | .20 |
| Class Z | 418 | .05 |
| | $424,109 | |
(a) Annualized
Accounting and Security Lending Fees. Fidelity Service Company, Inc. (FSC), an affiliate of the investment adviser, maintains each Fund's accounting records. The accounting fee is based on the level of average net assets for each month. Under a separate contract, FSC administers the security lending program. The security lending fee is based on the number and duration of lending transactions. For the period, the fees were equivalent to the following annualized rates:
| | % of Average Net Assets |
| Fidelity Advisor Biotechnology Fund | .03 |
| Fidelity Advisor Communications Equipment Fund | .04 |
| Fidelity Advisor Consumer Discretionary Fund | .04 |
| Fidelity Advisor Energy Fund | .03 |
| Fidelity Advisor Financial Services Fund | .04 |
| Fidelity Advisor Health Care Fund | .03 |
| Fidelity Advisor Industrials Fund | .04 |
| Fidelity Advisor Semiconductors Fund | .04 |
| Fidelity Advisor Technology Fund | .03 |
| Fidelity Advisor Utilities Fund | .04 |
Brokerage Commissions. Certain Funds placed a portion of their portfolio transactions with brokerage firms which are affiliates of the investment adviser. Brokerage commissions are included in net realized gain (loss) and change in net unrealized appreciation (depreciation) in the Statement of Operations. The commissions paid to these affiliated firms were as follows:
| | Amount |
| Fidelity Advisor Biotechnology Fund | $74,092 |
| Fidelity Advisor Communications Equipment Fund | 737 |
| Fidelity Advisor Consumer Discretionary Fund | 1,531 |
| Fidelity Advisor Energy Fund | 6,743 |
| Fidelity Advisor Financial Services Fund | 4,167 |
| Fidelity Advisor Health Care Fund | 24,505 |
| Fidelity Advisor Industrials Fund | 15,320 |
| Fidelity Advisor Semiconductors Fund | 5,788 |
| Fidelity Advisor Technology Fund | 40,448 |
| Fidelity Advisor Utilities Fund | 5,012 |
Interfund Lending Program. Pursuant to an Exemptive Order issued by the SEC, the Funds, along with other registered investment companies having management contracts with Fidelity Management & Research Company (FMR) or other affiliated entities of FMR, may participate in an interfund lending program. This program provides an alternative credit facility allowing the funds to borrow from, or lend money to, other participating affiliated funds. Fidelity Advisor Consumer Discretionary Fund's and Fidelity Advisor Technology Fund's open loans, including accrued interest, at period end are presented under the caption "Notes payable to affiliates" in their Statement of Assets and Liabilities. Each applicable fund's activity in this program during the period for which loans were outstanding was as follows:
| | Borrower or Lender | Average Loan Balance | Weighted Average Interest Rate | Interest Expense |
| Fidelity Advisor Biotechnology Fund | Borrower | $11,454,000 | 2.46% | $783 |
| Fidelity Advisor Consumer Discretionary Fund | Borrower | $5,011,800 | 2.51% | $1,745 |
| Fidelity Advisor Energy Fund | Borrower | $4,554,500 | 2.60% | $658 |
| Fidelity Advisor Industrials Fund | Borrower | $3,425,154 | 2.55% | $3,158 |
| Fidelity Advisor Semiconductors Fund | Borrower | $3,941,750 | 2.44% | $1,066 |
| Fidelity Advisor Technology Fund | Borrower | $6,497,000 | 2.58% | $9,296 |
Interfund Trades. The Funds may purchase from or sell securities to other Fidelity Funds under procedures adopted by the Board. The procedures have been designed to ensure these interfund trades are executed in accordance with Rule 17a-7 of the 1940 Act. Interfund trades are included within the respective purchases and sales amounts shown in the Purchases and Sales of Investments note.
Other. During the period, the investment adviser reimbursed the Funds for certain losses as follows:
| Fidelity Advisor Energy Fund | $11,444 |
| Fidelity Advisor Semiconductors Fund | 1,212 |
| Fidelity Advisor Technology Fund | 11,197 |
6. Committed Line of Credit.
Certain Funds participate with other funds managed by the investment adviser or an affiliate in a $4.25 billion credit facility (the "line of credit") to be utilized for temporary or emergency purposes to fund shareholder redemptions or for other short-term liquidity purposes. The participating funds have agreed to pay commitment fees on their pro-rata portion of the line of credit, which are reflected in Miscellaneous expenses on the Statement of Operations, and are as follows:
| Fidelity Advisor Biotechnology Fund | $3,504 |
| Fidelity Advisor Communications Equipment Fund | 33 |
| Fidelity Advisor Consumer Discretionary Fund | 539 |
| Fidelity Advisor Energy Fund | 1,137 |
| Fidelity Advisor Financial Services Fund | 632 |
| Fidelity Advisor Health Care Fund | 4,556 |
| Fidelity Advisor Industrials Fund | 1,031 |
| Fidelity Advisor Semiconductors Fund | 367 |
| Fidelity Advisor Technology Fund | 2,795 |
| Fidelity Advisor Utilities Fund | 491 |
During the period, the Funds did not borrow on this line of credit.
7. Security Lending.
Certain Funds lend portfolio securities through a lending agent from time to time in order to earn additional income. On the settlement date of the loan, each applicable Fund receives collateral (in the form of U.S. Treasury obligations, letters of credit and/or cash) against the loaned securities and maintains collateral in an amount not less than 100% of the market value of the loaned securities during the period of the loan. The market value of the loaned securities is determined at the close of business of the Funds and any additional required collateral is delivered to the Funds on the next business day. The Funds or borrower may terminate the loan at any time, and if the borrower defaults on its obligation to return the securities loaned because of insolvency or other reasons, the Funds may apply collateral received from the borrower against the obligation. The Funds may experience delays and costs in recovering the securities loaned. Any cash collateral received is invested in the Fidelity Securities Lending Cash Central Fund. The value of loaned securities and cash collateral at period end are disclosed on each applicable Fund's Statement of Assets and Liabilities. Security lending income represents the income earned on investing cash collateral, less rebates paid to borrowers and any lending agent fees associated with the loan, plus any premium payments received for lending certain types of securities. Security lending income is presented on each applicable Fund's Statement of Operations as a component of income from Fidelity Central Funds.
8. Bank Borrowings.
Each Fund is permitted to have bank borrowings for temporary or emergency purposes to fund shareholder redemptions or for other short-term liquidity requirements. Each Fund has established borrowing arrangements with certain banks. The interest rate on the borrowings is the bank's base rate, as revised from time to time. At period end, there were no bank borrowings outstanding. Each applicable Fund's activity in this program during the period for which loans were outstanding was as follows:
| | Average Loan Balance | Weighted Average Interest Rate | Interest Expense |
| Fidelity Advisor Industrials Fund | $8,335,500 | 2.90% | $1,343 |
| Fidelity Advisor Technology Fund | $3,328,000 | 2.70% | $250 |
9. Expense Reductions.
The investment adviser voluntarily agreed to reimburse each class of each Fund to the extent annual operating expenses exceeded certain levels of class-level average net assets as noted in the table below. Some expenses, for example the compensation of the independent Trustees, and certain other expenses such as interest expense, are excluded from this reimbursement.
The following classes of each applicable Fund were in reimbursement during the period:
| | Expense Limitations | Reimbursement |
| Fidelity Advisor Communications Equipment Fund | | |
| Class A | 1.40% | $15,203 |
| Class M | 1.65% | 9,363 |
| Class C | 2.15% | 8,512 |
| Class I | 1.15% | 5,833 |
Commissions paid to certain brokers with whom the investment adviser, or its affiliates, places trades on behalf of certain Funds include an amount in addition to trade execution, which may be rebated back to the Funds to offset certain expenses. In addition, through arrangements with each applicable Fund's custodian, credits realized as a result of certain uninvested cash balances were used to reduce the Fund's expenses. All of the applicable expense reductions are noted in the table below.
| | Brokerage Service reduction | Custody expense reduction |
| Fidelity Advisor Biotechnology Fund | $120,523 | $389 |
| Fidelity Advisor Communications Equipment Fund | 204 | 62 |
| Fidelity Advisor Consumer Discretionary Fund | 574 | 87 |
| Fidelity Advisor Energy Fund | 6,087 | – |
| Fidelity Advisor Financial Services Fund | 13,073 | 66 |
| Fidelity Advisor Health Care Fund | – | 4,781 |
| Fidelity Advisor Industrials Fund | 10,572 | – |
| Fidelity Advisor Semiconductors Fund | 1,975 | – |
| Fidelity Advisor Technology Fund | 46,676 | 1,347 |
| Fidelity Advisor Utilities Fund | 39,713 | 66 |
In addition, during the period the investment adviser reimbursed and/or waived a portion of fund-level operating expenses as follows:
| | Fund-Level Amount |
| Fidelity Advisor Biotechnology Fund | $9,336 |
| Fidelity Advisor Communications Equipment Fund | 115 |
| Fidelity Advisor Consumer Discretionary Fund | 1,486 |
| Fidelity Advisor Energy Fund | 2,659 |
| Fidelity Advisor Financial Services Fund | 1,598 |
| Fidelity Advisor Health Care Fund | 13,674 |
| Fidelity Advisor Industrials Fund | 2,585 |
| Fidelity Advisor Semiconductors Fund | 844 |
| Fidelity Advisor Technology Fund | 7,057 |
| Fidelity Advisor Utilities Fund | 1,749 |
10. Distributions to Shareholders.
Distributions to shareholders of each class were as follows:
| | Six months ended
January 31, 2019(a) | Year ended
July 31, 2018 |
| Fidelity Advisor Biotechnology Fund | | |
| Distributions to shareholders | | |
| Class A | $15,278,619 | $– |
| Class M | 3,010,454 | – |
| Class C | 12,975,391 | – |
| Class I | 25,315,247 | – |
| Class Z | 374,083 | – |
| Total | $56,953,794 | $– |
| Fidelity Advisor Communications Equipment Fund | | |
| Distributions to shareholders | | |
| Class A | $314,044 | $– |
| Class M | 151,777 | – |
| Class C | 185,133 | – |
| Class I | 261,417 | – |
| Total | $912,371 | $– |
| From net investment income | | |
| Class A | $– | $14,488 |
| Class M | – | 7,578 |
| Class I | – | 5,006 |
| Total | $– | $27,072 |
| From net realized gain | | |
| Class A | $– | $237,596 |
| Class M | – | 176,738 |
| Class C | – | 120,142 |
| Class I | – | 60,815 |
| Total | $– | $595,291 |
| Fidelity Advisor Consumer Discretionary Fund | | |
| Distributions to shareholders | | |
| Class A | $1,403,372 | $– |
| Class M | 329,482 | – |
| Class C | 874,278 | – |
| Class I | 1,462,671 | – |
| Class Z | 29,445 | – |
| Total | $4,099,248 | $– |
| Fidelity Advisor Energy Fund | | |
| Distributions to shareholders | | |
| Class A | $1,605,057 | $– |
| Class M | 429,349 | – |
| Class I | 3,087,399 | – |
| Class Z | 117,180 | – |
| Total | $5,238,985 | $– |
| From net investment income | | |
| Class A | $– | $3,962,831 |
| Class M | – | 1,446,535 |
| Class C | – | 1,622,297 |
| Class I | – | 4,670,175 |
| Total | $– | $11,701,838 |
| From net realized gain | | |
| Class A | $– | $33,167 |
| Class M | – | 15,002 |
| Class C | – | 26,595 |
| Class I | – | 31,987 |
| Total | $– | $106,751 |
| Fidelity Advisor Financial Services Fund | | |
| Distributions to shareholders | | |
| Class A | $5,373,068 | $– |
| Class M | 1,563,590 | – |
| Class C | 3,002,673 | – |
| Class I | 5,008,897 | – |
| Class Z | 95,139 | – |
| Total | $15,043,367 | $– |
| From net investment income | | |
| Class A | $– | $506,031 |
| Class M | – | 39,368 |
| Class C | – | – |
| Class I | – | 717,028 |
| Total | $– | $1,262,427 |
| From net realized gain | | |
| Class A | $– | $96,397 |
| Class M | – | 30,104 |
| Class I | – | 73,976 |
| Total | $– | $200,477 |
| Fidelity Advisor Health Care Fund | | |
| Distributions to shareholders | | |
| Class A | $45,988,004 | $– |
| Class M | 14,213,798 | – |
| Class C | 37,772,984 | – |
| Class I | 65,169,013 | – |
| Class Z | 1,836,632 | – |
| Total | $164,980,431 | $– |
| From net realized gain | | |
| Class I | – | 585,049 |
| Total | $– | $585,049 |
| Fidelity Advisor Industrials Fund | | |
| Distributions to shareholders | | |
| Class A | $26,486,734 | $– |
| Class M | 6,155,294 | – |
| Class C | 12,720,294 | – |
| Class I | 25,380,037 | – |
| Class Z | 821,160 | – |
| Total | $71,563,519 | $– |
| From net investment income | | |
| Class A | $– | $780,663 |
| Class I | – | 1,507,165 |
| Total | $– | $2,287,828 |
| From net realized gain | | |
| Class A | $– | $8,925,958 |
| Class M | – | 2,317,270 |
| Class C | – | 4,255,486 |
| Class I | – | 8,233,065 |
| Total | $– | $23,731,779 |
| Fidelity Advisor Semiconductors Fund | | |
| Distributions to shareholders | | |
| Class A | $12,594,471 | $– |
| Class M | 2,992,949 | – |
| Class C | 7,583,390 | – |
| Class I | 13,008,216 | – |
| Class Z | 180,538 | – |
| Total | $36,359,564 | $– |
| From net investment income | | |
| Class A | $– | $136,368 |
| Class I | – | 505,397 |
| Total | $– | $641,765 |
| From net realized gain | | |
| Class A | $– | $7,207,679 |
| Class M | – | 1,725,353 |
| Class C | – | 4,824,021 |
| Class I | – | 10,109,891 |
| Total | $– | $23,866,944 |
| Fidelity Advisor Technology Fund | | |
| Distributions to shareholders | | |
| Class A | $129,911,129 | $– |
| Class M | 53,119,111 | – |
| Class C | 57,302,122 | – |
| Class I | 105,941,248 | – |
| Class Z | 2,192,955 | – |
| Total | $348,466,565 | $– |
| From net realized gain | | |
| Class A | $– | $53,381,170 |
| Class M | – | 23,208,435 |
| Class C | – | 22,813,687 |
| Class I | – | 37,898,870 |
| Total | $– | $137,302,162 |
| Fidelity Advisor Utilities Fund | | |
| Distributions to shareholders | | |
| Class A | $19,834,363 | $– |
| Class M | 5,158,975 | – |
| Class C | 5,713,473 | – |
| Class I | 12,784,890 | – |
| Class Z | 425,300 | – |
| Total | $43,917,001 | $– |
| From net investment income | | |
| Class A | $– | $2,587,471 |
| Class M | – | 623,640 |
| Class C | – | 518,405 |
| Class I | – | 928,041 |
| Total | $– | $4,657,557 |
| From net realized gain | | |
| Class A | $– | $3,055,354 |
| Class M | – | 907,882 |
| Class C | – | 1,119,531 |
| Class I | – | 937,724 |
| Total | $– | $6,020,491 |
(a) Distributions for Class Z are for the period October 2, 2018 (commencement of sale of shares) to January 31, 2019.
11. Share Transactions.
Share transactions for each class were as follows and may contain automatic conversions between classes or exchanges between affiliated funds:
| | Shares | Shares | Dollars | Dollars |
| | Six months ended January 31, 2019(a) | Year endedJuly 31, 2018 | Six months ended January 31, 2019(a) | Year endedJuly 31, 2018 |
| Fidelity Advisor Biotechnology Fund | | | | |
| Class A | | | | |
| Shares sold | 1,686,543 | 4,489,461 | $44,481,068 | $117,335,379 |
| Reinvestment of distributions | 585,840 | – | 14,505,398 | – |
| Shares redeemed | (4,072,665) | (9,153,167) | (106,446,671) | (237,146,069) |
| Net increase (decrease) | (1,800,282) | (4,663,706) | $(47,460,205) | $(119,810,690) |
| Class M | | | | |
| Shares sold | 384,788 | 922,950 | $9,634,978 | $22,890,680 |
| Reinvestment of distributions | 127,735 | – | 2,987,733 | – |
| Shares redeemed | (499,457) | (1,262,202) | (12,257,648) | (31,094,295) |
| Net increase (decrease) | 13,066 | (339,252) | $365,063 | $(8,203,615) |
| Class C | | | | |
| Shares sold | 831,388 | 2,264,684 | $18,698,497 | $51,128,106 |
| Reinvestment of distributions | 563,764 | – | 11,951,803 | – |
| Shares redeemed | (2,859,193) | (6,920,490) | (63,736,469) | (154,651,855) |
| Net increase (decrease) | (1,464,041) | (4,655,806) | $(33,086,169) | $(103,523,749) |
| Class I | | | | |
| Shares sold | 6,072,948 | 14,300,108 | $169,997,859 | $394,886,039 |
| Reinvestment of distributions | 809,955 | – | 21,277,530 | – |
| Shares redeemed | (9,266,495) | (14,667,225) | (250,919,424) | (400,612,855) |
| Net increase (decrease) | (2,383,592) | (367,117) | $(59,644,035) | $(5,726,816) |
| Class Z | | | | |
| Shares sold | 845,634 | – | $22,527,548 | $– |
| Reinvestment of distributions | 13,350 | – | 350,695 | – |
| Shares redeemed | (65,580) | – | (1,746,390) | – |
| Net increase (decrease) | 793,404 | – | $21,131,853 | $– |
| Fidelity Advisor Communications Equipment Fund | | | | |
| Class A | | | | |
| Shares sold | 295,280 | 240,842 | $4,432,412 | $3,607,551 |
| Reinvestment of distributions | 21,922 | 18,317 | 312,384 | 249,841 |
| Shares redeemed | (82,348) | (131,537) | (1,221,644) | (1,894,331) |
| Net increase (decrease) | 234,854 | 127,622 | $3,523,152 | $1,963,061 |
| Class M | | | | |
| Shares sold | 100,775 | 124,711 | $1,460,366 | $1,797,699 |
| Reinvestment of distributions | 11,052 | 14,023 | 151,084 | 184,116 |
| Shares redeemed | (70,070) | (121,118) | (1,015,573) | (1,708,377) |
| Net increase (decrease) | 41,757 | 17,616 | $595,877 | $273,438 |
| Class C | | | | |
| Shares sold | 130,231 | 158,604 | $1,735,995 | $2,105,283 |
| Reinvestment of distributions | 14,837 | 9,839 | 184,570 | 118,457 |
| Shares redeemed | (41,097) | (70,659) | (535,832) | (888,706) |
| Net increase (decrease) | 103,971 | 97,784 | $1,384,733 | $1,335,034 |
| Class I | | | | |
| Shares sold | 497,815 | 180,193 | $7,931,242 | $2,805,233 |
| Reinvestment of distributions | 16,990 | 4,027 | 252,474 | 57,058 |
| Shares redeemed | (171,046) | (341,435) | (2,564,809) | (4,971,605) |
| Net increase (decrease) | 343,759 | (157,215) | $5,618,907 | $(2,109,314) |
| Fidelity Advisor Consumer Discretionary Fund | | | | |
| Class A | | | | |
| Shares sold | 1,009,755 | 2,248,158 | $28,087,616 | $59,989,967 |
| Reinvestment of distributions | 52,843 | – | 1,360,712 | – |
| Shares redeemed | (1,076,302) | (1,821,427) | (29,115,266) | (45,906,961) |
| Net increase (decrease) | (13,704) | 426,731 | $333,062 | $14,083,006 |
| Class M | | | | |
| Shares sold | 203,205 | 875,533 | $5,297,860 | $21,446,215 |
| Reinvestment of distributions | 13,674 | – | 328,456 | – |
| Shares redeemed | (303,098) | (791,689) | (7,922,169) | (19,230,008) |
| Net increase (decrease) | (86,219) | 83,844 | $(2,295,853) | $2,216,207 |
| Class C | | | | |
| Shares sold | 539,249 | 737,358 | $11,907,622 | $15,838,368 |
| Reinvestment of distributions | 40,828 | – | 848,804 | – |
| Shares redeemed | (338,979) | (831,010) | (7,360,349) | (17,067,044) |
| Net increase (decrease) | 241,098 | (93,652) | $5,396,077 | $(1,228,676) |
| Class I | | | | |
| Shares sold | 2,169,198 | 3,539,647 | $65,134,179 | $99,528,546 |
| Reinvestment of distributions | 48,353 | – | 1,344,706 | – |
| Shares redeemed | (2,712,987) | (1,855,164) | (77,420,232) | (50,248,042) |
| Net increase (decrease) | (495,436) | 1,684,483 | $(10,941,347) | $49,280,504 |
| Class Z | | | | |
| Shares sold | 130,381 | – | $3,812,808 | $– |
| Reinvestment of distributions | 837 | – | 23,276 | – |
| Shares redeemed | (55,128) | – | (1,557,642) | – |
| Net increase (decrease) | 76,090 | – | $2,278,442 | $– |
| Fidelity Advisor Energy Fund | | | | |
| Class A | | | | |
| Shares sold | 828,917 | 2,010,255 | $25,723,618 | $68,355,026 |
| Reinvestment of distributions | 56,702 | 122,986 | 1,558,168 | 3,904,807 |
| Shares redeemed | (1,391,460) | (3,744,347) | (43,624,408) | (126,255,245) |
| Net increase (decrease) | (505,841) | (1,611,106) | $(16,342,622) | $(53,995,412) |
| Class M | | | | |
| Shares sold | 166,545 | 661,725 | $5,506,943 | $23,576,811 |
| Reinvestment of distributions | 14,855 | 43,874 | 418,470 | 1,426,363 |
| Shares redeemed | (498,652) | (1,153,394) | (16,423,009) | (39,436,080) |
| Net increase (decrease) | (317,252) | (447,795) | $(10,497,596) | $(14,432,906) |
| Class C | | | | |
| Shares sold | 297,338 | 666,274 | $8,425,314 | $20,703,593 |
| Reinvestment of distributions | – | 54,288 | – | 1,586,840 |
| Shares redeemed | (951,238) | (3,033,482) | (27,039,897) | (92,256,812) |
| Net increase (decrease) | (653,900) | (2,312,920) | $(18,614,583) | $(69,966,379) |
| Class I | | | | |
| Shares sold | 3,271,012 | 5,429,294 | $107,007,992 | $193,924,922 |
| Reinvestment of distributions | 99,377 | 125,558 | 2,872,985 | 4,196,161 |
| Shares redeemed | (4,651,147) | (4,682,047) | (145,370,855) | (160,996,824) |
| Net increase (decrease) | (1,280,758) | 872,805 | $(35,489,878) | $37,124,259 |
| Class Z | | | | |
| Shares sold | 468,548 | – | $14,637,019 | $– |
| Reinvestment of distributions | 3,050 | – | 88,002 | – |
| Shares redeemed | (103,050) | – | (2,836,656) | – |
| Net increase (decrease) | 368,548 | – | $11,888,365 | $– |
| Fidelity Advisor Financial Services Fund | | | | |
| Class A | | | | |
| Shares sold | 537,558 | 2,694,850 | $10,940,574 | $58,668,845 |
| Reinvestment of distributions | 276,327 | 26,593 | 5,139,683 | 580,794 |
| Shares redeemed | (1,610,188) | (2,090,965) | (31,414,385) | (44,613,971) |
| Net increase (decrease) | (796,303) | 630,478 | $(15,334,128) | $14,635,668 |
| Class M | | | | |
| Shares sold | 186,225 | 758,763 | $3,791,124 | $16,347,774 |
| Reinvestment of distributions | 83,604 | 3,172 | 1,539,992 | 68,610 |
| Shares redeemed | (303,547) | (673,927) | (6,008,709) | (14,170,761) |
| Net increase (decrease) | (33,718) | 88,008 | $(677,593) | $2,245,623 |
| Class C | | | | |
| Shares sold | 294,146 | 2,105,833 | $5,634,372 | $43,305,642 |
| Reinvestment of distributions | 168,506 | – | 2,938,746 | – |
| Shares redeemed | (1,123,333) | (1,228,211) | (21,017,277) | (24,460,182) |
| Net increase (decrease) | (660,681) | 877,622 | $(12,444,159) | $18,845,460 |
| Class I | | | | |
| Shares sold | 1,366,044 | 5,000,148 | $27,931,139 | $111,196,062 |
| Reinvestment of distributions | 249,532 | 33,129 | 4,768,552 | 743,087 |
| Shares redeemed | (2,493,830) | (2,604,882) | (51,336,093) | (57,474,934) |
| Net increase (decrease) | (878,254) | 2,428,395 | $(18,636,402) | $54,464,215 |
| Class Z | | | | |
| Shares sold | 132,780 | – | $2,754,820 | $– |
| Reinvestment of distributions | 4,207 | – | 80,262 | – |
| Shares redeemed | (17,570) | – | (335,512) | – |
| Net increase (decrease) | 119,417 | – | $2,499,570 | $– |
| Fidelity Advisor Health Care Fund | | | | |
| Class A | | | | |
| Shares sold | 3,095,866 | 3,820,700 | $150,765,642 | $174,179,057 |
| Reinvestment of distributions | 946,173 | – | 43,618,555 | – |
| Shares redeemed | (2,030,309) | (4,717,099) | (98,223,993) | (210,240,925) |
| Net increase (decrease) | 2,011,730 | (896,399) | $96,160,204 | $(36,061,868) |
| Class M | | | | |
| Shares sold | 554,593 | 576,984 | $25,153,664 | $24,727,597 |
| Reinvestment of distributions | 325,989 | – | 13,994,691 | – |
| Shares redeemed | (454,251) | (1,082,800) | (20,716,723) | (45,253,288) |
| Net increase (decrease) | 426,331 | (505,816) | $18,431,632 | $(20,525,691) |
| Class C | | | | |
| Shares sold | 2,113,739 | 1,981,630 | $82,548,654 | $72,552,352 |
| Reinvestment of distributions | 994,675 | – | 36,236,009 | – |
| Shares redeemed | (1,621,874) | (3,660,984) | (62,821,402) | (131,526,868) |
| Net increase (decrease) | 1,486,540 | (1,679,354) | $55,963,261 | $(58,974,516) |
| Class I | | | | |
| Shares sold | 12,149,602 | 9,258,420 | $648,526,936 | $459,345,254 |
| Reinvestment of distributions | 1,142,636 | 10,985 | 57,463,164 | 509,046 |
| Shares redeemed | (5,451,634) | (5,167,599) | (279,910,262) | (251,193,735) |
| Net increase (decrease) | 7,840,604 | 4,101,806 | $426,079,838 | $208,660,565 |
| Class Z | | | | |
| Shares sold | 3,092,206 | – | $157,143,546 | $– |
| Reinvestment of distributions | 33,495 | – | 1,685,128 | – |
| Shares redeemed | (55,057) | – | (2,737,435) | – |
| Net increase (decrease) | 3,070,644 | – | $156,091,239 | $– |
| Fidelity Advisor Industrials Fund | | | | |
| Class A | | | | |
| Shares sold | 411,456 | 1,497,116 | $16,043,499 | $61,793,037 |
| Reinvestment of distributions | 760,156 | 226,150 | 25,335,988 | 9,283,440 |
| Shares redeemed | (1,315,229) | (2,770,461) | (47,585,464) | (113,411,149) |
| Net increase (decrease) | (143,617) | (1,047,195) | $(6,205,977) | $(42,334,672) |
| Class M | | | | |
| Shares sold | 64,528 | 286,248 | $2,409,297 | $11,557,916 |
| Reinvestment of distributions | 186,461 | 57,090 | 6,071,167 | 2,293,883 |
| Shares redeemed | (249,158) | (967,134) | (9,067,646) | (38,592,300) |
| Net increase (decrease) | 1,831 | (623,796) | $(587,182) | $(24,740,501) |
| Class C | | | | |
| Shares sold | 155,525 | 566,263 | $5,328,861 | $20,919,630 |
| Reinvestment of distributions | 408,102 | 107,041 | 12,026,751 | 3,945,516 |
| Shares redeemed | (623,254) | (988,699) | (20,225,575) | (36,415,774) |
| Net increase (decrease) | (59,627) | (315,395) | $(2,869,963) | $(11,550,628) |
| Class I | | | | |
| Shares sold | 987,031 | 2,581,269 | $40,283,918 | $111,557,552 |
| Reinvestment of distributions | 658,671 | 205,495 | 23,178,649 | 8,860,965 |
| Shares redeemed | (2,806,416) | (2,784,650) | (107,771,804) | (119,181,603) |
| Net increase (decrease) | (1,160,714) | 2,114 | $(44,309,237) | $1,236,914 |
| Class Z | | | | |
| Shares sold | 223,445 | – | $9,131,656 | $– |
| Reinvestment of distributions | 22,285 | – | 782,425 | – |
| Shares redeemed | (26,361) | – | (963,411) | – |
| Net increase (decrease) | 219,369 | – | $8,950,670 | $– |
| Fidelity Advisor Semiconductors Fund | | | | |
| Class A | | | | |
| Shares sold | 585,411 | 1,668,711 | $12,856,764 | $40,716,736 |
| Reinvestment of distributions | 709,289 | 305,588 | 12,235,231 | 7,166,032 |
| Shares redeemed | (1,052,052) | (1,408,788) | (21,753,272) | (34,081,400) |
| Net increase (decrease) | 242,648 | 565,511 | $3,338,723 | $13,801,368 |
| Class M | | | | |
| Shares sold | 93,447 | 316,181 | $1,973,911 | $7,446,796 |
| Reinvestment of distributions | 179,840 | 76,374 | 2,954,769 | 1,722,235 |
| Shares redeemed | (160,599) | (260,992) | (3,193,660) | (6,169,057) |
| Net increase (decrease) | 112,688 | 131,563 | $1,735,020 | $2,999,974 |
| Class C | | | | |
| Shares sold | 207,877 | 749,134 | $3,988,241 | $16,152,447 |
| Reinvestment of distributions | 500,354 | 227,506 | 7,380,215 | 4,682,073 |
| Shares redeemed | (807,952) | (564,806) | (14,416,066) | (11,999,565) |
| Net increase (decrease) | (99,721) | 411,834 | $(3,047,610) | $8,834,955 |
| Class I | | | | |
| Shares sold | 841,959 | 2,700,418 | $19,470,728 | $69,688,220 |
| Reinvestment of distributions | 694,346 | 411,599 | 12,678,766 | 10,121,229 |
| Shares redeemed | (2,881,017) | (1,816,854) | (66,209,978) | (45,424,171) |
| Net increase (decrease) | (1,344,712) | 1,295,163 | $(34,060,484) | $34,385,278 |
| Class Z | | | | |
| Shares sold | 114,945 | – | $2,393,965 | $– |
| Reinvestment of distributions | 9,898 | – | 180,240 | – |
| Shares redeemed | (25,430) | – | (561,995) | – |
| Net increase (decrease) | 99,413 | – | $2,012,210 | $– |
| Fidelity Advisor Technology Fund | | | | |
| Class A | | | | |
| Shares sold | 1,451,816 | 3,632,315 | $76,157,586 | $209,434,785 |
| Reinvestment of distributions | 2,975,892 | 960,124 | 124,005,535 | 51,174,597 |
| Shares redeemed | (1,982,101) | (3,153,557) | (99,985,526) | (179,792,848) |
| Net increase (decrease) | 2,445,607 | 1,438,882 | $100,177,595 | $80,816,534 |
| Class M | | | | |
| Shares sold | 434,707 | 989,362 | $21,837,281 | $54,150,425 |
| Reinvestment of distributions | 1,336,071 | 451,464 | 52,227,019 | 22,848,570 |
| Shares redeemed | (730,377) | (1,236,642) | (35,244,489) | (67,046,356) |
| Net increase (decrease) | 1,040,401 | 204,184 | $38,819,811 | $9,952,639 |
| Class C | | | | |
| Shares sold | 801,715 | 1,780,368 | $34,839,107 | $87,758,581 |
| Reinvestment of distributions | 1,628,065 | 474,339 | 55,468,159 | 21,535,003 |
| Shares redeemed | (1,188,189) | (1,266,229) | (48,616,413) | (61,788,663) |
| Net increase (decrease) | 1,241,591 | 988,478 | $41,690,853 | $47,504,921 |
| Class I | | | | |
| Shares sold | 3,003,147 | 6,670,752 | $174,610,128 | $412,237,755 |
| Reinvestment of distributions | 2,163,105 | 621,718 | 98,183,325 | 35,543,634 |
| Shares redeemed | (4,398,490) | (3,202,897) | (238,053,996) | (195,523,397) |
| Net increase (decrease) | 767,762 | 4,089,573 | $34,739,457 | $252,257,992 |
| Class Z | | | | |
| Shares sold | 283,599 | – | $15,739,911 | $– |
| Reinvestment of distributions | 41,765 | – | 1,891,557 | – |
| Shares redeemed | (28,269) | – | (1,288,404) | – |
| Net increase (decrease) | 297,095 | – | $16,343,064 | $– |
| Fidelity Advisor Utilities Fund | | | | |
| Class A | | | | |
| Shares sold | 1,757,425 | 1,188,046 | $53,664,286 | $35,486,347 |
| Reinvestment of distributions | 635,090 | 180,860 | 18,874,880 | 5,431,226 |
| Shares redeemed | (962,743) | (1,234,740) | (29,010,759) | (36,590,564) |
| Net increase (decrease) | 1,429,772 | 134,166 | $43,528,407 | $4,327,009 |
| Class M | | | | |
| Shares sold | 352,152 | 170,574 | $10,838,847 | $5,112,824 |
| Reinvestment of distributions | 170,880 | 50,196 | 5,095,634 | 1,511,910 |
| Shares redeemed | (162,833) | (360,617) | (4,902,886) | (10,729,871) |
| Net increase (decrease) | 360,199 | (139,847) | $11,031,595 | $(4,105,137) |
| Class C | | | | |
| Shares sold | 533,388 | 227,468 | $15,840,266 | $6,648,453 |
| Reinvestment of distributions | 192,852 | 52,741 | 5,610,064 | 1,554,276 |
| Shares redeemed | (221,687) | (516,236) | (6,600,496) | (14,887,168) |
| Net increase (decrease) | 504,553 | (236,027) | $14,849,834 | $(6,684,439) |
| Class I | | | | |
| Shares sold | 3,893,234 | 1,003,462 | $123,709,528 | $30,966,089 |
| Reinvestment of distributions | 409,312 | 56,328 | 12,426,708 | 1,724,202 |
| Shares redeemed | (1,502,498) | (885,101) | (45,521,223) | (26,822,894) |
| Net increase (decrease) | 2,800,048 | 174,689 | $90,615,013 | $5,867,397 |
| Class Z | | | | |
| Shares sold | 168,408 | – | $5,434,705 | $– |
| Reinvestment of distributions | 11,827 | – | 358,825 | – |
| Shares redeemed | (10,745) | – | (311,978) | – |
| Net increase (decrease) | 169,490 | – | $5,481,552 | $– |
(a) Share transactions for Class Z are for the period October 2, 2018 (commencement of sale of shares) to January 31, 2019.
12. Other.
The Funds' organizational documents provide former and current trustees and officers with a limited indemnification against liabilities arising in connection with the performance of their duties to the Funds. In the normal course of business, the Funds may also enter into contracts that provide general indemnifications. The Funds' maximum exposure under these arrangements is unknown as this would be dependent on future claims that may be made against the Funds. The risk of material loss from such claims is considered remote.
Shareholder Expense Example
As a shareholder of a Fund, you incur two types of costs: (1) transaction costs, including sales charges (loads) on purchase payments or redemption proceeds, and (2) ongoing costs, including management fees, distribution and/or service (12b-1) fees and other Fund expenses. This Example is intended to help you understand your ongoing costs (in dollars) of investing in the Funds and to compare these costs with the ongoing costs of investing in other mutual funds.
The actual expense Example is based on an investment of $1,000 invested at the beginning of the period and held for the entire period (August 1, 2018 to January 31, 2019) for Class A, Class M, Class C, and Class I and for the period (October 2, 2018 to January 31, 2019) for Class Z. The hypothetical expense Example is based on an investment of $1,000 invested for the one-half year period (August 1, 2018 to January 31, 2019).
Actual Expenses
The first line of the accompanying table for each Class of each fund provides information about actual account values and actual expenses. You may use the information in this line, together with the amount you invested, to estimate the expenses that you paid over the period. Simply divide your account value by $1,000.00 (for example, an $8,600 account value divided by $1,000.00 = 8.6), then multiply the result by the number in the first line for a Class of the fund under the heading entitled "Expenses Paid During Period" to estimate the expenses you paid on your account during this period. In addition, each Fund, as a shareholder in the underlying Fidelity Central Funds, will indirectly bear its pro-rata share of the fees and expenses incurred by the underlying Fidelity Central Funds. These fees and expenses are not included in the Fund's annualized expense ratio used to calculate the expense estimate in the table below.
Hypothetical Example for Comparison Purposes
The second line of the accompanying table for each Class of each fund provides information about hypothetical account values and hypothetical expenses based on a Class' actual expense ratio and an assumed rate of return of 5% per year before expenses, which is not the Class' actual return. The hypothetical account values and expenses may not be used to estimate the actual ending account balance or expenses you paid for the period. You may use this information to compare the ongoing costs of investing in the Fund and other funds. To do so, compare this 5% hypothetical example with the 5% hypothetical examples that appear in the shareholder reports of the other funds. In addition, each Fund, as a shareholder in the underlying Fidelity Central Funds, will indirectly bear its pro-rata share of the fees and expenses incurred by the underlying Fidelity Central Funds. These fees and expenses are not included in the Fund's annualized expense ratio used to calculate the expense estimate in the table below.
Please note that the expenses shown in the table are meant to highlight your ongoing costs only and do not reflect any transaction costs. Therefore, the second line of the table is useful in comparing ongoing costs only, and will not help you determine the relative total costs of owning different funds. In addition, if these transactional costs were included, your costs would have been higher.
| | Annualized Expense Ratio-A | Beginning
Account Value
| Ending
Account Value
January 31, 2019 | Expenses Paid
During Period
|
| Fidelity Advisor Biotechnology Fund | | | | |
| Class A | 1.03% | | | |
| Actual | | $1,000.00 | $958.60 | $5.08-B |
| Hypothetical-C | | $1,000.00 | $1,020.01 | $5.24-D |
| Class M | 1.35% | | | |
| Actual | | $1,000.00 | $957.40 | $6.66-B |
| Hypothetical-C | | $1,000.00 | $1,018.40 | $6.87-D |
| Class C | 1.77% | | | |
| Actual | | $1,000.00 | $955.30 | $8.72-B |
| Hypothetical-C | | $1,000.00 | $1,016.28 | $9.00-D |
| Class I | .76% | | | |
| Actual | | $1,000.00 | $959.90 | $3.75-B |
| Hypothetical-C | | $1,000.00 | $1,021.37 | $3.87-D |
| Class Z | .63% | | | |
| Actual | | $1,000.00 | $939.80 | $2.04-B |
| Hypothetical-C | | $1,000.00 | $1,022.03 | $3.21-D |
| Fidelity Advisor Communications Equipment Fund | | | | |
| Class A | 1.40% | | | |
| Actual | | $1,000.00 | $1,000.20 | $7.06-B |
| Hypothetical-C | | $1,000.00 | $1,018.15 | $7.12-D |
| Class M | 1.65% | | | |
| Actual | | $1,000.00 | $998.90 | $8.31-B |
| Hypothetical-C | | $1,000.00 | $1,016.89 | $8.39-D |
| Class C | 2.15% | | | |
| Actual | | $1,000.00 | $995.70 | $10.82-B |
| Hypothetical-C | | $1,000.00 | $1,014.37 | $10.92-D |
| Class I | 1.15% | | | |
| Actual | | $1,000.00 | $1,001.50 | $5.80-B |
| Hypothetical-C | | $1,000.00 | $1,019.41 | $5.85-D |
| Fidelity Advisor Consumer Discretionary Fund | | | | |
| Class A | 1.09% | | | |
| Actual | | $1,000.00 | $971.70 | $5.42-B |
| Hypothetical-C | | $1,000.00 | $1,019.71 | $5.55-D |
| Class M | 1.35% | | | |
| Actual | | $1,000.00 | $970.50 | $6.71-B |
| Hypothetical-C | | $1,000.00 | $1,018.40 | $6.87-D |
| Class C | 1.84% | | | |
| Actual | | $1,000.00 | $968.20 | $9.13-B |
| Hypothetical-C | | $1,000.00 | $1,015.93 | $9.35-D |
| Class I | .81% | | | |
| Actual | | $1,000.00 | $972.80 | $4.03-B |
| Hypothetical-C | | $1,000.00 | $1,021.12 | $4.13-D |
| Class Z | .67% | | | |
| Actual | | $1,000.00 | $938.30 | $2.17-B |
| Hypothetical-C | | $1,000.00 | $1,021.83 | $3.41-D |
| Fidelity Advisor Energy Fund | | | | |
| Class A | 1.09% | | | |
| Actual | | $1,000.00 | $771.60 | $4.87-B |
| Hypothetical-C | | $1,000.00 | $1,019.71 | $5.55-D |
| Class M | 1.36% | | | |
| Actual | | $1,000.00 | $770.50 | $6.07-B |
| Hypothetical-C | | $1,000.00 | $1,018.35 | $6.92-D |
| Class C | 1.81% | | | |
| Actual | | $1,000.00 | $768.80 | $8.07-B |
| Hypothetical-C | | $1,000.00 | $1,016.08 | $9.20-D |
| Class I | .80% | | | |
| Actual | | $1,000.00 | $772.80 | $3.57-B |
| Hypothetical-C | | $1,000.00 | $1,021.17 | $4.08-D |
| Class Z | .65% | | | |
| Actual | | $1,000.00 | $777.50 | $1.93-B |
| Hypothetical-C | | $1,000.00 | $1,021.93 | $3.31-D |
| Fidelity Advisor Financial Services Fund | | | | |
| Class A | 1.08% | | | |
| Actual | | $1,000.00 | $921.10 | $5.23-B |
| Hypothetical-C | | $1,000.00 | $1,019.76 | $5.50-D |
| Class M | 1.34% | | | |
| Actual | | $1,000.00 | $919.40 | $6.48-B |
| Hypothetical-C | | $1,000.00 | $1,018.45 | $6.82-D |
| Class C | 1.82% | | | |
| Actual | | $1,000.00 | $917.40 | $8.80-B |
| Hypothetical-C | | $1,000.00 | $1,016.03 | $9.25-D |
| Class I | .79% | | | |
| Actual | | $1,000.00 | $922.20 | $3.83-B |
| Hypothetical-C | | $1,000.00 | $1,021.22 | $4.02-D |
| Class Z | .66% | | | |
| Actual | | $1,000.00 | $942.90 | $2.14-B |
| Hypothetical-C | | $1,000.00 | $1,021.88 | $3.36-D |
| Fidelity Advisor Health Care Fund | | | | |
| Class A | 1.03% | | | |
| Actual | | $1,000.00 | $1,003.80 | $5.20-B |
| Hypothetical-C | | $1,000.00 | $1,020.01 | $5.24-D |
| Class M | 1.29% | | | |
| Actual | | $1,000.00 | $1,002.80 | $6.51-B |
| Hypothetical-C | | $1,000.00 | $1,018.70 | $6.56-D |
| Class C | 1.77% | | | |
| Actual | | $1,000.00 | $1,000.20 | $8.92-B |
| Hypothetical-C | | $1,000.00 | $1,016.28 | $9.00-D |
| Class I | .76% | | | |
| Actual | | $1,000.00 | $1,005.40 | $3.84-B |
| Hypothetical-C | | $1,000.00 | $1,021.37 | $3.87-D |
| Class Z | .63% | | | |
| Actual | | $1,000.00 | $945.90 | $2.05-B |
| Hypothetical-C | | $1,000.00 | $1,022.03 | $3.21-D |
| Fidelity Advisor Industrials Fund | | | | |
| Class A | 1.04% | | | |
| Actual | | $1,000.00 | $919.20 | $5.03-B |
| Hypothetical-C | | $1,000.00 | $1,019.96 | $5.30-D |
| Class M | 1.31% | | | |
| Actual | | $1,000.00 | $917.90 | $6.33-B |
| Hypothetical-C | | $1,000.00 | $1,018.60 | $6.67-D |
| Class C | 1.79% | | | |
| Actual | | $1,000.00 | $915.50 | $8.64-B |
| Hypothetical-C | | $1,000.00 | $1,016.18 | $9.10-D |
| Class I | .78% | | | |
| Actual | | $1,000.00 | $920.30 | $3.78-B |
| Hypothetical-C | | $1,000.00 | $1,021.27 | $3.97-D |
| Class Z | .65% | | | |
| Actual | | $1,000.00 | $881.70 | $2.04-B |
| Hypothetical-C | | $1,000.00 | $1,021.93 | $3.31-D |
| Fidelity Advisor Semiconductors Fund | | | | |
| Class A | 1.14% | | | |
| Actual | | $1,000.00 | $915.20 | $5.50-B |
| Hypothetical-C | | $1,000.00 | $1,019.46 | $5.80-D |
| Class M | 1.46% | | | |
| Actual | | $1,000.00 | $913.80 | $7.04-B |
| Hypothetical-C | | $1,000.00 | $1,017.85 | $7.43-D |
| Class C | 1.89% | | | |
| Actual | | $1,000.00 | $911.90 | $9.11-B |
| Hypothetical-C | | $1,000.00 | $1,015.68 | $9.60-D |
| Class I | .85% | | | |
| Actual | | $1,000.00 | $916.40 | $4.11-B |
| Hypothetical-C | | $1,000.00 | $1,020.92 | $4.33-D |
| Class Z | .71% | | | |
| Actual | | $1,000.00 | $928.70 | $2.29-B |
| Hypothetical-C | | $1,000.00 | $1,021.63 | $3.62-D |
| Fidelity Advisor Technology Fund | | | | |
| Class A | 1.03% | | | |
| Actual | | $1,000.00 | $877.50 | $4.87-B |
| Hypothetical-C | | $1,000.00 | $1,020.01 | $5.24-D |
| Class M | 1.29% | | | |
| Actual | | $1,000.00 | $876.50 | $6.10-B |
| Hypothetical-C | | $1,000.00 | $1,018.70 | $6.56-D |
| Class C | 1.79% | | | |
| Actual | | $1,000.00 | $874.20 | $8.46-B |
| Hypothetical-C | | $1,000.00 | $1,016.18 | $9.10-D |
| Class I | .77% | | | |
| Actual | | $1,000.00 | $878.90 | $3.65-B |
| Hypothetical-C | | $1,000.00 | $1,021.32 | $3.92-D |
| Class Z | .63% | | | |
| Actual | | $1,000.00 | $840.10 | $1.94-B |
| Hypothetical-C | | $1,000.00 | $1,022.03 | $3.21-D |
| Fidelity Advisor Utilities Fund | | | | |
| Class A | 1.10% | | | |
| Actual | | $1,000.00 | $1,025.70 | $5.62-B |
| Hypothetical-C | | $1,000.00 | $1,019.66 | $5.60-D |
| Class M | 1.39% | | | |
| Actual | | $1,000.00 | $1,024.10 | $7.09-B |
| Hypothetical-C | | $1,000.00 | $1,018.20 | $7.07-D |
| Class C | 1.86% | | | |
| Actual | | $1,000.00 | $1,021.50 | $9.48-B |
| Hypothetical-C | | $1,000.00 | $1,015.83 | $9.45-D |
| Class I | .83% | | | |
| Actual | | $1,000.00 | $1,026.90 | $4.24-B |
| Hypothetical-C | | $1,000.00 | $1,021.02 | $4.23-D |
| Class Z | .68% | | | |
| Actual | | $1,000.00 | $998.80 | $2.27-B |
| Hypothetical-C | | $1,000.00 | $1,021.78 | $3.47-D |
A Annualized expense ratio reflects expenses net of applicable fee waivers.
B Actual expenses are equal to each Class' annualized expense ratio, multiplied by the average account value over the period, multiplied by 184/365 (to reflect the one-half year period) for Class A, Class M, Class C and Class I and multiplied by 122/365 (to reflect the period October 2, 2018 to January 31, 2019) for Class Z.
C 5% return per year before expenses
D Hypothetical expenses are equal to each Class' annualized expense ratio, multiplied by the average account value over the period, multiplied by 184/365 (to reflect the one-half year period).
Board Approval of Investment Advisory Contracts and Management Fees
Fidelity Advisor Focus Funds
Each year, the Board of Trustees, including the Independent Trustees (together, the Board), votes on the renewal of the management contract with Fidelity SelectCo, LLC (SelectCo), an affiliate of Fidelity Management & Research Company (FMR), and the sub-advisory agreements with affiliates of FMR (together, the Advisory Contracts) for each fund. SelectCo and the sub-advisers are referred to herein as the Investment Advisers. The Board, assisted by the advice of fund counsel and Independent Trustees' counsel, requests and considers a broad range of information relevant to the renewal of the Advisory Contracts throughout the year.
The Board meets regularly and, at each of its meetings, covers an extensive agenda of topics and materials and considers factors that are relevant to its annual consideration of the renewal of each fund's Advisory Contracts, including the services and support provided to each fund and its shareholders. The Board has established various standing committees (Committees), each composed of and chaired by Independent Trustees with varying backgrounds, to which the Board has assigned specific subject matter responsibilities in order to enhance effective decision-making by the Board. The Board, acting directly and through its Committees, requests and receives information concerning the annual consideration of the renewal of each fund's Advisory Contracts. The Board also meets as needed to review matters specifically related to the Board's annual consideration of the renewal of the Advisory Contracts. Members of the Board may also meet with trustees of other Fidelity funds through joint ad hoc committees to discuss certain matters relevant to all of the Fidelity funds.
At its January 2019 meeting, the Board unanimously determined to renew each fund's Advisory Contracts. In reaching its determination, the Board considered all factors it believed relevant, including (i) the nature, extent, and quality of the services to be provided to each fund and its shareholders (including the investment performance of each fund); (ii) the competitiveness of each fund's management fee and total expense ratio relative to peer funds; (iii) the total costs of the services to be provided by and the profits to be realized by Fidelity from its relationships with each fund; and (iv) the extent to which, if any, economies of scale exist and would be realized as each fund grows, and whether any economies of scale are appropriately shared with fund shareholders.
In considering whether to renew the Advisory Contracts for each fund, the Board reached a determination, with the assistance of fund counsel and Independent Trustees' counsel and through the exercise of its business judgment, that the renewal of the Advisory Contracts was in the best interests of each fund and its shareholders and that the compensation payable under the Advisory Contracts was fair and reasonable. The Board's decision to renew the Advisory Contracts was not based on any single factor, but rather was based on a comprehensive consideration of all the information provided to the Board at its meetings throughout the year. The Board, in reaching its determination to renew the Advisory Contracts, was aware that shareholders of each fund have a broad range of investment choices available to them, including a wide choice among funds offered by Fidelity's competitors, and that each fund's shareholders, who have the opportunity to review and weigh the disclosure provided by the fund in its prospectus and other public disclosures, have chosen to invest in that fund, which is part of the Fidelity family of funds.
Nature, Extent, and Quality of Services Provided. The Board considered Fidelity's staffing as it relates to the funds, including the backgrounds of investment personnel of Fidelity, and also considered the funds' investment objectives, strategies, and related investment philosophies. The Independent Trustees also had discussions with senior management of Fidelity's investment operations and investment groups. The Board considered the structure of the investment personnel compensation program and whether this structure provides appropriate incentives to act in the best interests of each fund. Additionally, the Board considered the portfolio managers' investments, if any, in the funds that they manage.
Resources Dedicated to Investment Management and Support Services. The Board and the Fund Oversight and Research Committees reviewed the general qualifications and capabilities of Fidelity's investment staff, including its size, education, experience, and resources, as well as Fidelity's approach to recruiting, training, managing, and compensating investment personnel. The Board noted that Fidelity has continued to increase the resources devoted to non-U.S. offices, including expansion of Fidelity's global investment organization. The Board also noted that Fidelity's analysts have extensive resources, tools and capabilities that allow them to conduct sophisticated quantitative and fundamental analysis, as well as credit analysis of issuers, counterparties and guarantors. Further, the Board considered that Fidelity's investment professionals have sufficient access to global information and data so as to provide competitive investment results over time, and that those professionals also have access to sophisticated tools that permit them to assess portfolio construction and risk and performance attribution characteristics continuously, as well as to transmit new information and research conclusions rapidly around the world. Additionally, in its deliberations, the Board considered Fidelity's trading, risk management, compliance, and technology and operations capabilities and resources, which are integral parts of the investment management process.
Shareholder and Administrative Services. The Board considered (i) the nature, extent, quality, and cost of advisory, administrative, and shareholder services performed by the Investment Advisers and their affiliates under the Advisory Contracts and under separate agreements covering transfer agency, pricing and bookkeeping, and securities lending services for each fund; (ii) the nature and extent of the supervision of third party service providers, principally custodians, subcustodians, and pricing vendors; and (iii) the resources devoted to, and the record of compliance with, each fund's compliance policies and procedures. The Board also reviewed the allocation of fund brokerage, including allocations to brokers affiliated with the Investment Advisers, the use of brokerage commissions to pay fund expenses, and the use of "soft" commission dollars to pay for research services.
The Board noted that the growth of fund assets over time across the complex allows Fidelity to reinvest in the development of services designed to enhance the value and convenience of the Fidelity funds as investment vehicles. These services include 24-hour access to account information and market information through telephone representatives and over the Internet, investor education materials and asset allocation tools, and the expanded availability of Fidelity Investor Centers.
The Board noted that it and the boards of certain other Fidelity funds had formed an ad hoc Committee on Transfer Agency Fees to review the variety of transfer agency fee structures throughout the industry and Fidelity's competitive positioning with respect to industry participants.
Investment in a Large Fund Family. The Board considered the benefits to shareholders of investing in a Fidelity fund, including the benefits of investing in a fund that is part of a large family of funds offering a variety of investment disciplines and providing a large variety of mutual fund investor services. The Board noted that Fidelity had taken, or had made recommendations that resulted in the Fidelity funds taking, a number of actions over the previous year that benefited particular funds, including: (i) continuing to dedicate additional resources to Fidelity's investment research process, which includes meetings with management of issuers of securities in which the funds invest, and to the support of the senior management team that oversees asset management; (ii) continuing efforts to enhance Fidelity's global research capabilities; (iii) launching new funds and making other enhancements to meet client needs; (iv) launching new share classes of existing funds; (v) eliminating purchase minimums and broadening eligibility requirements for certain funds and share classes; (vi) reducing management fees and total expenses for certain growth equity funds and index funds; (vii) lowering expense caps for certain existing funds and classes, and converting certain voluntary expense caps to contractual caps to reduce expenses borne by shareholders; (viii) eliminating short-term redemption fees for funds that had such fees; (ix) rationalizing product lines and gaining increased efficiencies from fund mergers and share class consolidations; (x) continuing to develop, acquire and implement systems and technology to improve services to the funds and shareholders, strengthen information security, and increase efficiency; and (xi) continuing to implement enhancements to further strengthen Fidelity's product line to increase investors' probability of success in achieving their investment goals, including retirement income goals.
Investment Performance. The Board considered whether each fund has operated in accordance with its investment objective, as well as its record of compliance with its investment restrictions and its performance history. Fidelity Advisor Biotechnology Fund had a portfolio manager change in October 2018. Fidelity Advisor Communications Equipment Fund had a portfolio manager change in July 2018. Fidelity Advisor Industrials Fund had a portfolio manager change in November 2018. Fidelity Advisor Technology Fund had a portfolio manager change in July 2018. The Board will continue to monitor closely each fund's performance, taking into account the portfolio manager changes.
The Board took into account discussions that occur at Board meetings throughout the year with representatives of the Investment Advisers about fund investment performance. In this regard the Board noted that as part of regularly scheduled fund reviews and other reports to the Board on fund performance, the Board considers annualized return information for each fund for different time periods, measured against an appropriate securities market index ("benchmark index"). In its evaluation of fund investment performance, the Board gave particular attention to information indicating changes in performance of certain Fidelity funds for specific time periods and discussed with the Investment Advisers the reasons for any overperformance or underperformance.
In addition to reviewing absolute and relative fund performance, the Independent Trustees periodically consider the appropriateness of fund performance metrics in evaluating the results achieved. In general, the Independent Trustees believe that fund performance should be evaluated based on net performance (after fees and expenses) of both the highest performing and lowest performing fund share classes, where applicable, compared to appropriate benchmark indices, over appropriate time periods that may include full market cycles, taking into account relevant factors including the following: general market conditions; issuer-specific information; and fund cash flows and other factors.
The Independent Trustees recognize that shareholders evaluate performance on a net basis over their own holding periods, for which one-, three-, and five-year periods are often used as a proxy. For this reason, the performance information reviewed by the Board also included net cumulative total return information for each fund and an appropriate benchmark index for the most recent one-, three-, and five-year periods ended June 30, 2018, as shown below.
Fidelity Advisor Biotechnology Fund
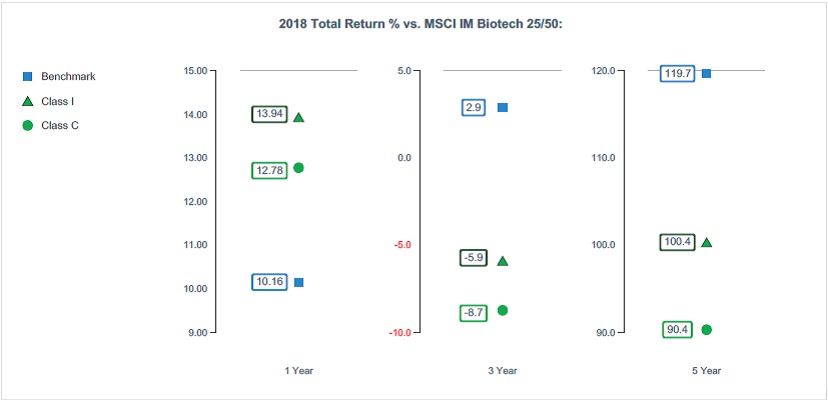
The Board considered the fund's underperformance for different time based on time periods ended prior to June 30, 2018 (which periods are not shown in the chart above). The Board noted that the fund's underperformance has continued since the Board approved the management contract in 2017 and 2018. The Board's discussions with SelectCo regarding underperformance cover topics including, but not limited to: the longer-term track record of a fund's portfolio manager(s); broader trends in the market that may adversely impact a fund's performance; attribution reports on contributors to the fund's underperformance; and the applicable portfolio manager's explanation of his or her underperformance. The Board engages with SelectCo on steps that might be taken to address a fund's underperformance. The Board noted that the fund's more recent performance had improved.
Fidelity Advisor Communications Equipment Fund

Fidelity Advisor Consumer Discretionary Fund
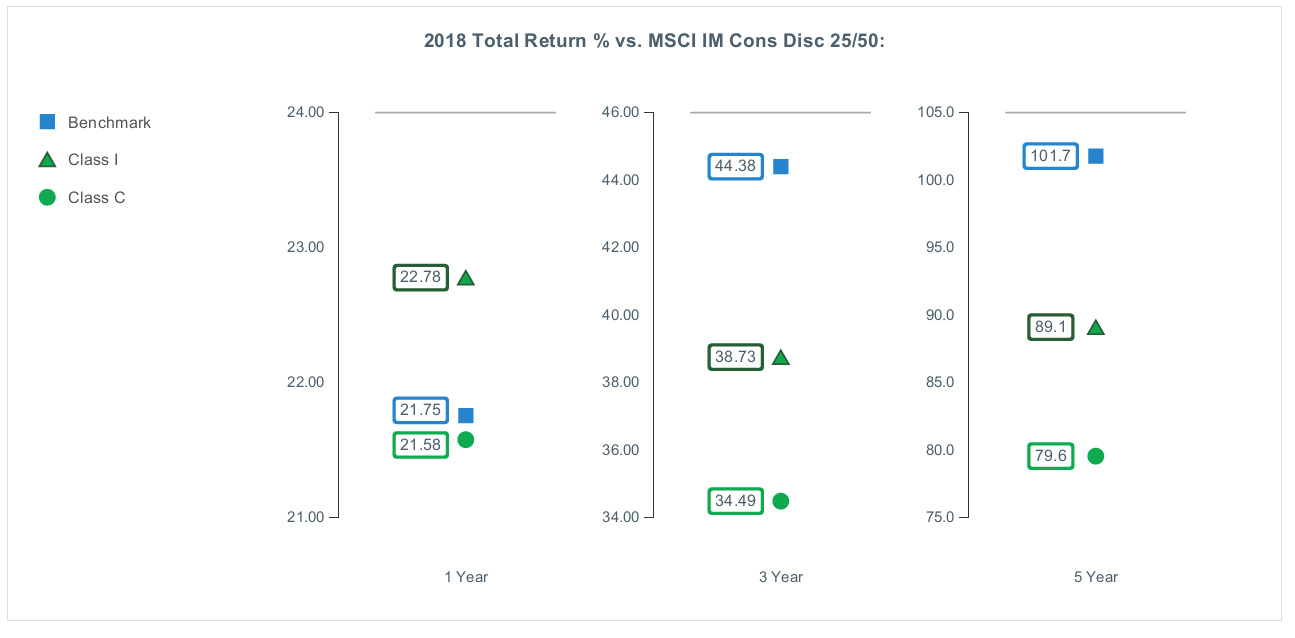
Fidelity Advisor Energy Fund
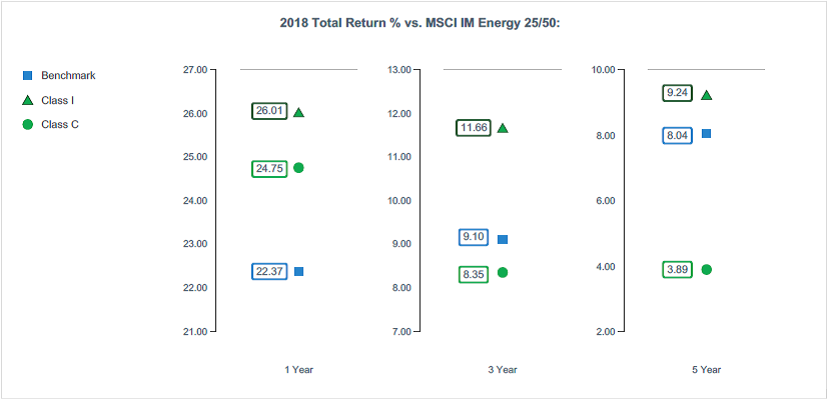
Fidelity Advisor Financial Services Fund
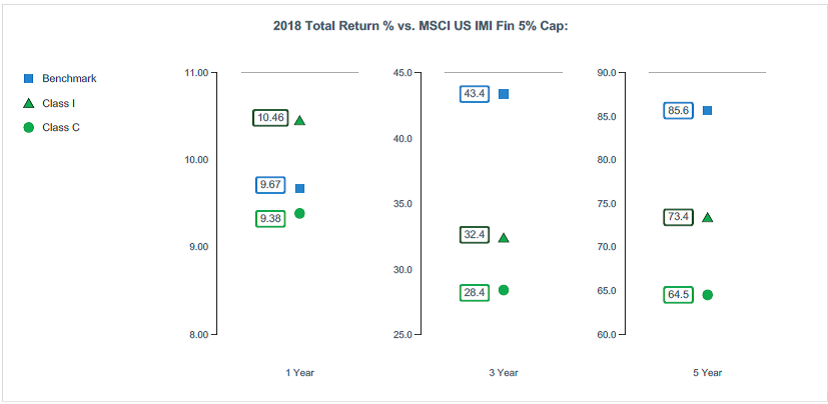
Fidelity Advisor Health Care Fund
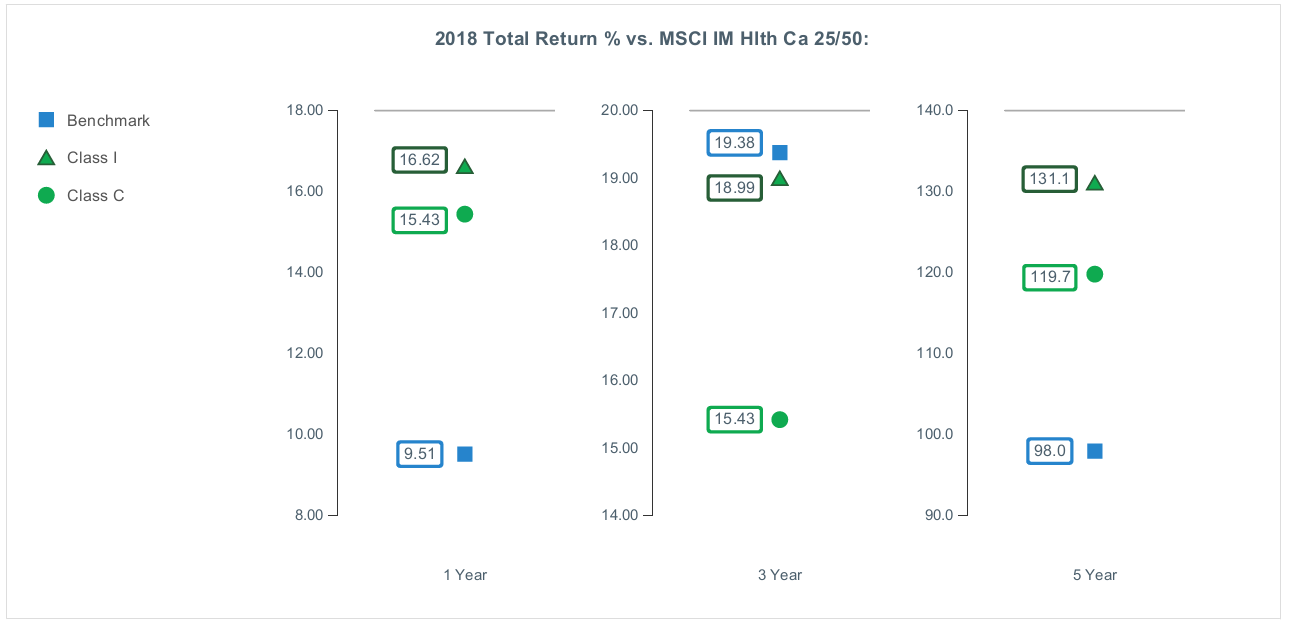
Fidelity Advisor Industrials Fund
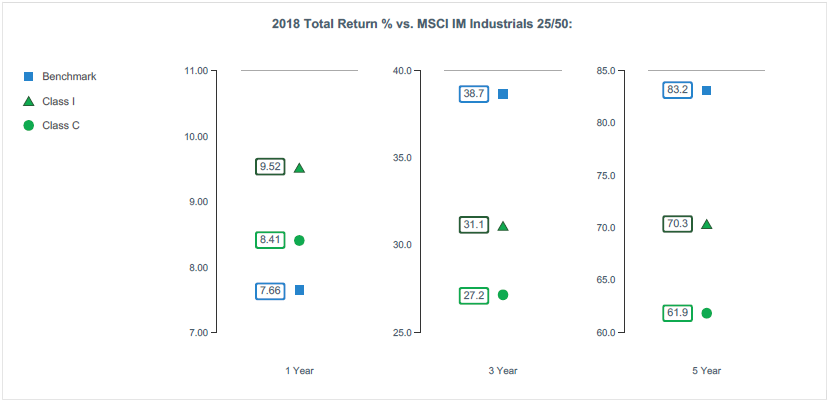
The Board considered the fund's underperformance for different time based on time periods ended prior to June 30, 2018 (which periods are not shown in the chart above). The Board noted that the fund's underperformance has continued since the Board approved the management contract in 2017 and 2018. The Board's discussions with SelectCo regarding underperformance cover topics including, but not limited to: the longer-term track record of a fund's portfolio manager(s); broader trends in the market that may adversely impact a fund's performance; attribution reports on contributors to the fund's underperformance; and the applicable portfolio manager's explanation of his or her underperformance. The Board engages with SelectCo on steps that might be taken to address a fund's underperformance. The Board noted that the fund's more recent performance had improved.
Fidelity Advisor Semiconductors Fund
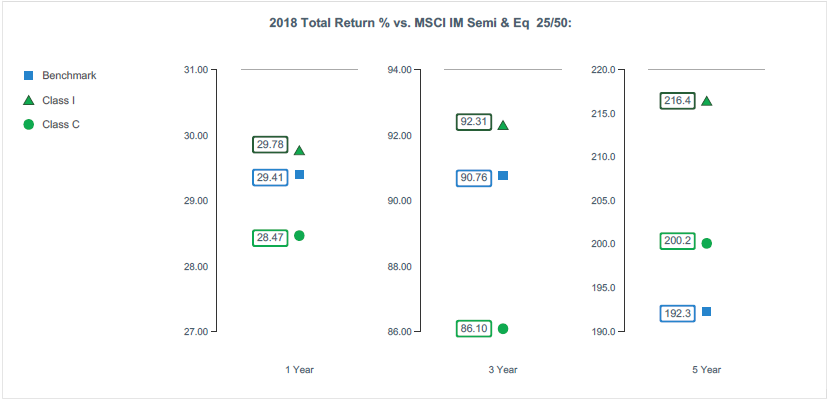
Fidelity Advisor Technology Fund

Fidelity Advisor Utilities Fund
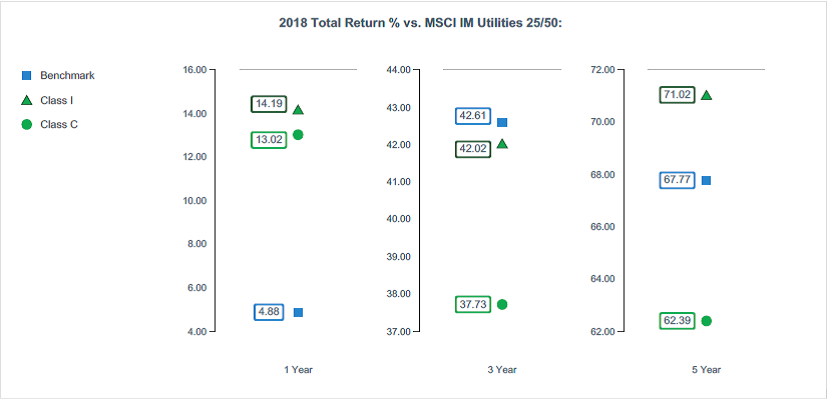
Based on its review, the Board concluded that the nature, extent, and quality of services provided to each fund under the Advisory Contracts should continue to benefit the shareholders of each fund.
Competitiveness of Management Fee and Total Expense Ratio. The Board considered each fund's management fee and total expense ratio compared to "mapped groups" of competitive funds and classes created for the purpose of facilitating the Trustees' competitive analysis of management fees and total expenses. Fidelity creates "mapped groups" by combining similar Lipper investment objective categories that have comparable investment mandates. For this purpose, all sector focused equity funds are grouped in the same mapped group. Combining Lipper investment objective categories aids the Board's management fee and total expense ratio comparisons by broadening the competitive group used for comparison.
Management Fee. The Board considered two proprietary management fee comparisons for the 12-month periods ended June 30 shown in basis points (BP) in the charts below. The group of Lipper funds used by the Board for management fee comparisons is referred to below as the "Total Mapped Group." The Total Mapped Group comparison focuses on a fund's standing in terms of gross management fees before expense reimbursements or caps relative to the total universe of funds with comparable investment mandates (i.e., sector equities), regardless of whether their management fee structures also are comparable. Funds with comparable management fee structures have similar management fee contractual arrangements (
e.g., flat rate charged for advisory services, all-inclusive fee rate,
etc.). "TMG %" represents the percentage of funds in the Total Mapped Group that had management fees that were lower than a fund's. For example, a hypothetical TMG % of 20% would mean that 80% of the funds in the Total Mapped Group had higher, and 20% had lower, management fees than a fund. The funds' actual TMG %s and the number of funds in the Total Mapped Group are in the charts below. The "Asset-Size Peer Group" (ASPG) comparison focuses on a fund's standing relative to a subset of non-Fidelity funds within the Total Mapped Group that are similar in size and management fee structure. For example, if a fund is in the first quartile of the ASPG, the fund's management fee ranks in the least expensive or lowest 25% of funds in the ASPG. The ASPG represents at least 15% of the funds in the Total Mapped Group with comparable asset size and management fee structures, subject to a minimum of 50 funds (or all funds in the Total Mapped Group if fewer than 50). Additional information, such as the ASPG quartile in which a fund's management fee rate ranked, is also included in the charts and was considered by the Board.
Fidelity Advisor Biotechnology Fund

Fidelity Advisor Communications Equipment Fund
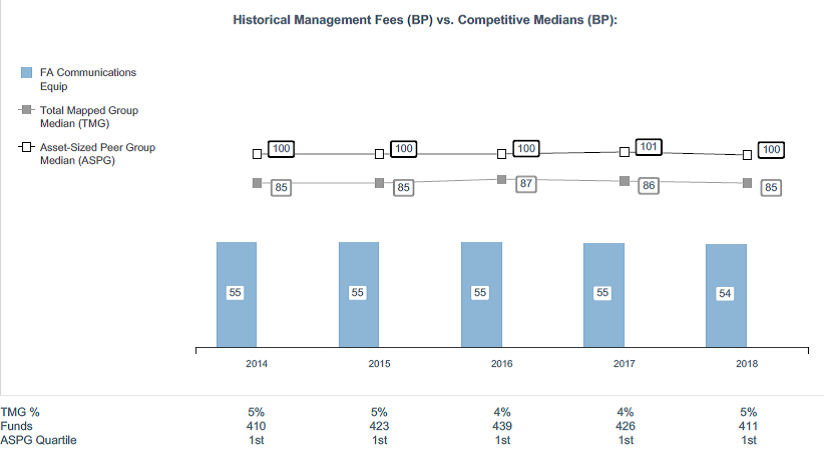
Fidelity Advisor Consumer Discretionary Fund
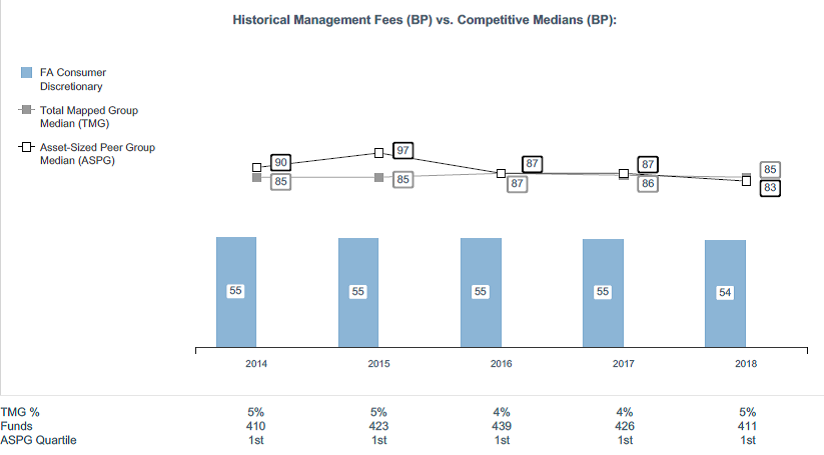
Fidelity Advisor Energy Fund

Fidelity Advisor Financial Services Fund
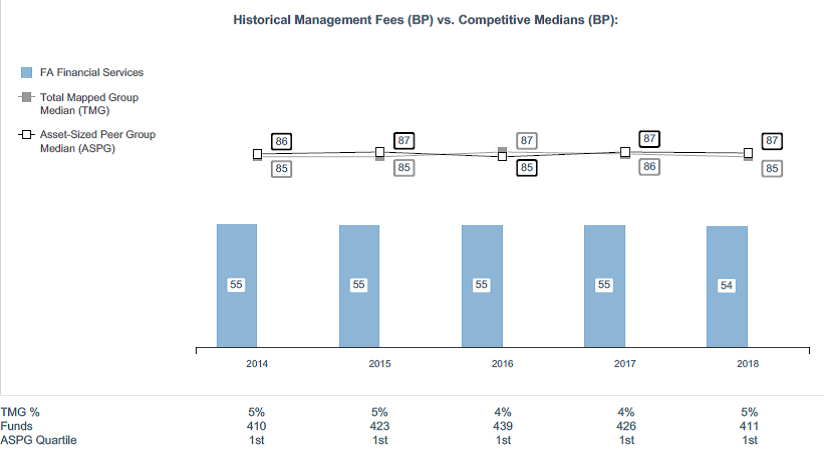
Fidelity Advisor Health Care Fund

Fidelity Advisor Industrials Fund
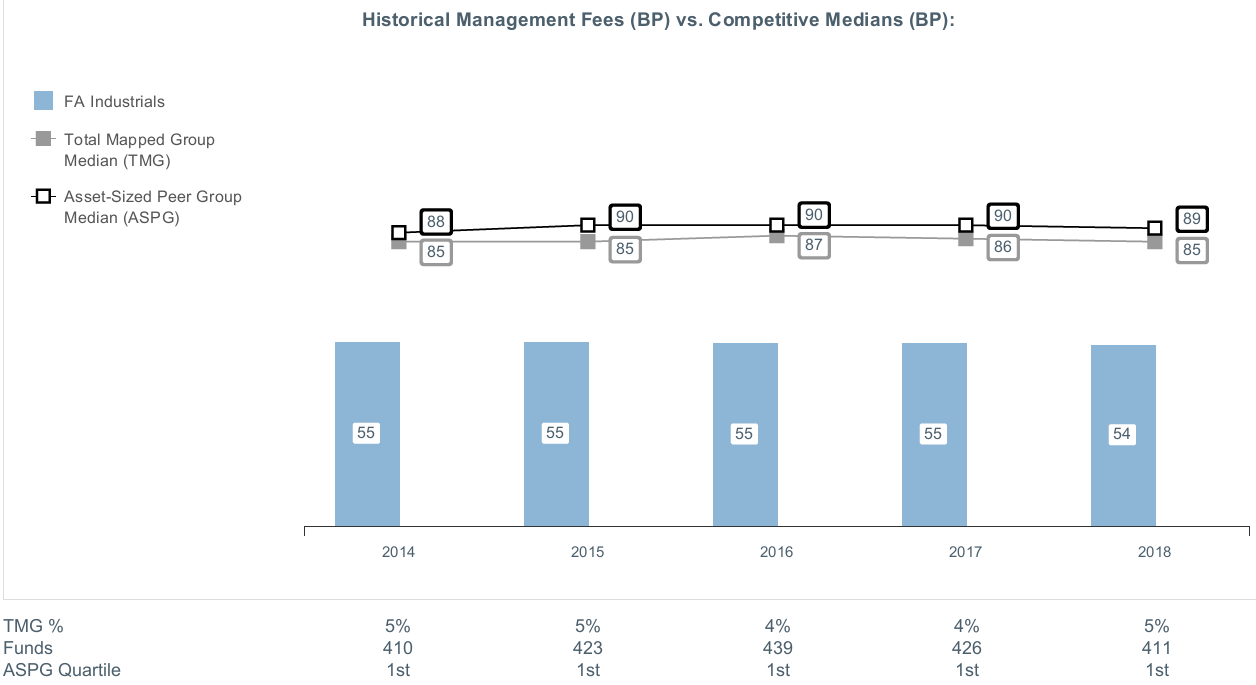
Fidelity Advisor Semiconductors Fund

Fidelity Advisor Technology Fund
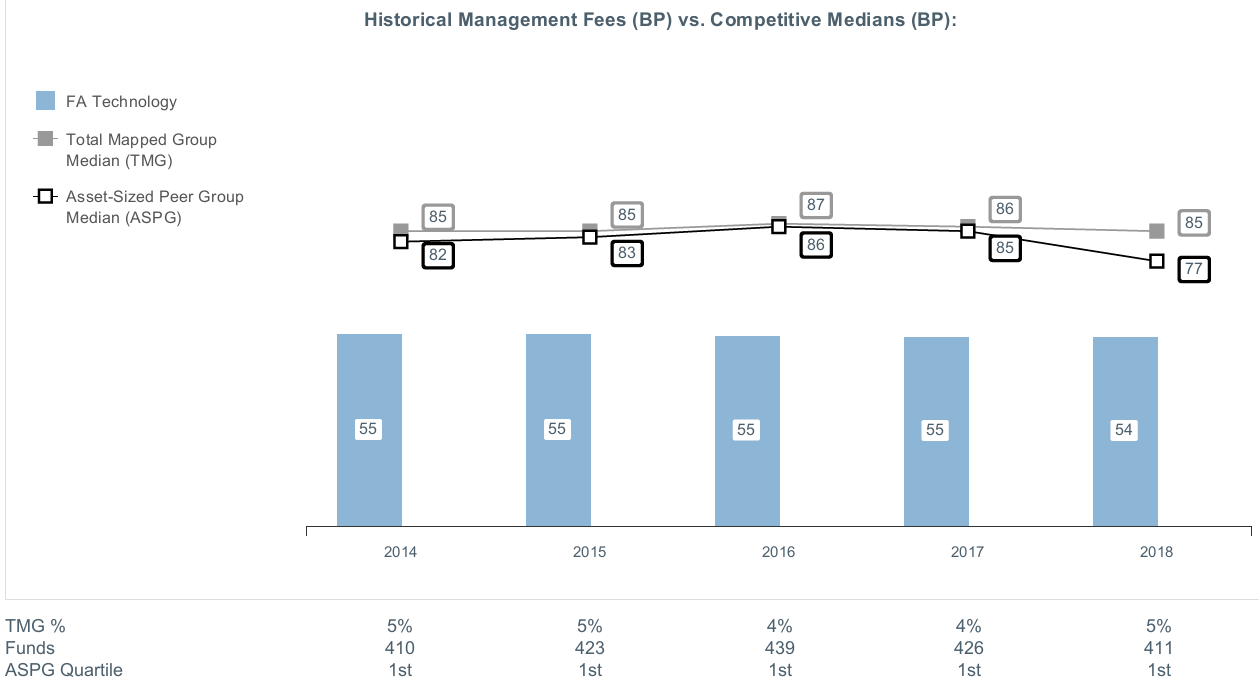
Fidelity Advisor Utilities Fund
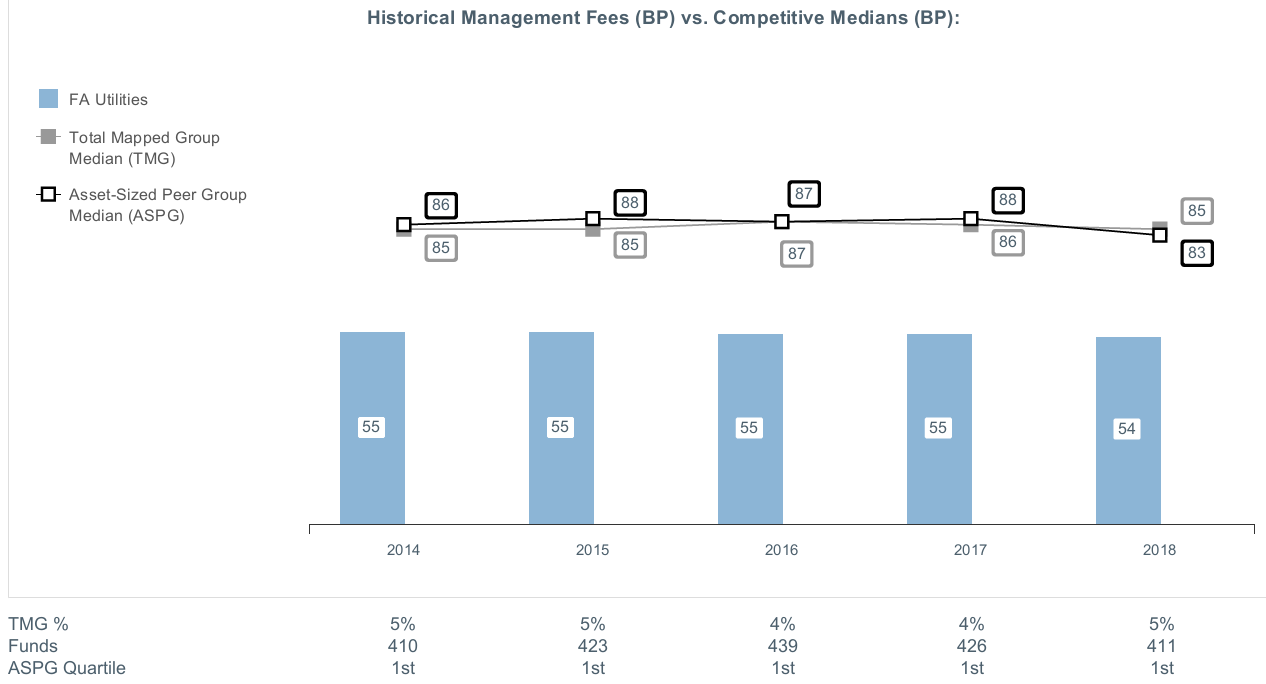
The Board noted that each fund's management fee rate ranked below the median of its Total Mapped Group and below the median of its ASPG for the 12-month period ended June 30, 2018.
The Board noted that it and the boards of other Fidelity funds formed an ad hoc Committee on Group Fee, which meets periodically, to conduct an in-depth review of the "group fee" component of the management fee of funds with such management fee structures. The Committee's focus included the mechanics of the group fee, the competitive landscape of group fee structures, Fidelity funds with no group fee component and investment products not included in group fee assets. The Board also considered that, for funds subject to the group fee, FMR agreed to voluntarily waive fees over a specified period of time in amounts designed to account for assets converted from certain funds to certain collective investment trusts.
Based on its review, the Board concluded that each fund's management fee is fair and reasonable in light of the services that the fund receives and the other factors considered.
Total Expense Ratio. In its review of the total expense ratio of each class of each fund, the Board considered the fund's management fee rate as well as other fund or class expenses, as applicable, such as transfer agent fees, pricing and bookkeeping fees, fund-paid 12b-1 fees, and custodial, legal, and audit fees. The Board also noted that Fidelity may agree to waive fees and expenses from time to time, and the extent to which, if any, it has done so for each fund. As part of its review, the Board also considered the current and historical total expense ratios of each class of each fund compared to competitive fund median expenses. Each class of each fund is compared to those funds and classes in the Total Mapped Group (used by the Board for management fee comparisons) that have a similar sales load structure.
For Advisor Health Care, Advisor Industrials, and Advisor Technology, the Board noted that the total expense ratio of each class ranked below the competitive median for the 12-month period ended June 30, 2018.
For Advisor Financial Services, the Board noted that the total expense ratio of each of Class A, Class C, and Class I ranked below the competitive median for the 12-month period ended June 30, 2018, and the total expense ratio of Class M ranked equal to the competitive median for the 12-month period ended June 30, 2018.
For Advisor Biotechnology, Advisor Consumer Discretionary, Advisor Energy, Advisor Semiconductors, and Advisor Utilities, the Board noted that the total expense ratio of each of Class A, Class C, and Class I ranked below the competitive median for the 12-month period ended June 30, 2018, and the total expense ratio of Class M ranked above the competitive median for the 12-month period ended June 30, 2018. The Board considered that, in general, various factors can affect total expense ratios. The Board noted that the total expense ratio of Class M of each such fund was above the competitive median primarily because of higher 12b-1 fees on Class M as compared to most competitor funds. Class M has a higher 12b-1 fee, but a lower front-end sales charge, than traditionally priced front-end sales charge classes. The Board considered that Class M is primarily sold load-waived to retirement plans and intermediary wrap programs where its 0.50% 12b-1 fee is comparable to competing no-load, higher 12b-1 fee classes designed specifically for retirement plans and wrap programs. The Board noted that, when compared with competitor funds that charge a 0.50% 12b-1 fee, the total expense ratio of Class M of Advisor Biotechnology, Advisor Consumer Discretionary, Advisor Energy, Advisor Semiconductor, and Advisor Utilities is below median.
For Advisor Communications Equipment, the Board noted that the total expense ratio of each class ranked above the competitive median for the 12-month period ended June 30, 2018. The Board considered that, in general, various factors can affect total expense ratios. The Board noted that the total expense ratio of Class A was above the competitive median because of relatively higher other expenses due to asset levels or small average account sizes. The Board noted that the total expense ratio of Class M was above the competitive median primarily because of higher 12b-1 fees on Class M as compared to most competitor funds. Class M has a higher 12b-1 fee, but a lower front-end sales charge, than traditionally priced front-end sales charge classes. The Board considered that Class M is primarily sold load-waived to retirement plans and intermediary wrap programs where its 0.50% 12b-1 fee is comparable to competing no-load, higher 12b-1 fee classes designed specifically for retirement plans and wrap programs. The Board noted that the total expense ratio of Class C was above the competitive median primarily because of its 1.00% 12b-1 fee. The Board noted that, although Class I is categorized by Lipper as an institutional class, Class I has a significantly lower investment minimum than most other funds and classes categorized as institutional. As a result, FMR believes Class I is generally more comparable to retail funds and classes.
The Board noted that each fund offers multiple classes, each of which has a different sales load and 12b-1 fee structure, and that the multiple structures are intended to offer a range of pricing options for the intermediary market. The Board also noted that the total expense ratios of the classes of each fund vary primarily by the level of their 12b-1 fees, although differences in transfer agent fees may also cause expenses to vary from class to class.
Fees Charged to Other Fidelity Clients. The Board also considered Fidelity fee structures and other information with respect to clients of Fidelity, such as other funds advised or subadvised by Fidelity, pension plan clients, and other institutional clients with similar mandates. The Board noted that a joint ad hoc committee created by it and the boards of other Fidelity funds periodically reviews and compares Fidelity's institutional investment advisory business with its business of providing services to the Fidelity funds and also noted the most recent findings of the committee. The Board noted that the committee's review included a consideration of the differences in services provided, fees charged, and costs incurred, as well as competition in the markets serving the different categories of clients.
Based on its review of total expense ratios and fees charged to other Fidelity clients, the Board concluded that the total expense ratio of each class of each fund was reasonable in light of the services that the fund and its shareholders receive and the other factors considered.
Costs of the Services and Profitability. The Board considered the revenues earned and the expenses incurred by Fidelity in conducting the business of developing, marketing, distributing, managing, administering and servicing each fund and servicing each fund's shareholders. The Board also considered the level of Fidelity's profits in respect of all the Fidelity funds.
On an annual basis, Fidelity presents to the Board information about the profitability of its relationships with each fund. Fidelity calculates profitability information for each fund, as well as aggregate profitability information for groups of Fidelity funds and all Fidelity funds, using a series of detailed revenue and cost allocation methodologies which originate with the books and records of Fidelity on which Fidelity's audited financial statements are based. The Audit Committee of the Board reviews any significant changes from the prior year's methodologies.
PricewaterhouseCoopers LLP (PwC), auditor to Fidelity and certain Fidelity funds, has been engaged annually by the Board as part of the Board's assessment of Fidelity's profitability analysis. PwC's engagement includes the review and assessment of the methodologies used by Fidelity in determining the revenues and expenses attributable to Fidelity's mutual fund business, and completion of agreed-upon procedures in respect of the mathematical accuracy of the fund profitability information and its conformity to established allocation methodologies. After considering PwC's reports issued under the engagement and information provided by Fidelity, the Board concluded that while other allocation methods may also be reasonable, Fidelity's profitability methodologies are reasonable in all material respects.
The Board also reviewed Fidelity's non-fund businesses and potential indirect benefits such businesses may have received as a result of their association with Fidelity's mutual fund business (i.e., fall-out benefits) as well as cases where Fidelity's affiliates may benefit from the funds' business. The Board noted that changes to fall-out benefits year-over-year reflect business developments at Fidelity's various businesses.
The Board considered the costs of the services provided by and the profits realized by Fidelity in connection with the operation of each fund and was satisfied that the profitability was not excessive.
Economies of Scale. The Board considered whether there have been economies of scale in respect of the management of the Fidelity funds, whether the Fidelity funds (including each fund) have appropriately benefited from any such economies of scale, and whether there is potential for realization of any further economies of scale. The Board considered the extent to which each fund will benefit from economies of scale as assets grow through increased services to the fund, through waivers or reimbursements, or through fee or expense ratio reductions. The Board also noted that a committee (the Economies of Scale Committee) created by it and the boards of other Fidelity funds periodically analyzes whether Fidelity attains economies of scale in respect of the management and servicing of the Fidelity funds, whether the Fidelity funds have appropriately benefited from such economies of scale, and whether there is potential for realization of any further economies of scale.
The Board recognized that each fund's management contract incorporates a "group fee" structure, which provides for lower group fee rates as total group assets increase, and for higher group fee rates as total group assets decrease (with "group assets" defined to include fund assets under SelectCo's management plus assets under FMR's management). SelectCo calculates the group fee rates based on a tiered asset "breakpoint" schedule that varies based on asset class. The Board considered that the group fee is designed to deliver the benefits of economies of scale to fund shareholders when total group assets increase, even if assets of any particular fund are unchanged or have declined, because some portion of Fidelity's costs are attributable to services provided to all Fidelity funds, and all funds benefit if those costs can be allocated among more assets. The Board concluded that, given the group fee structure, fund shareholders will benefit from lower management fees as group assets increase at the fund complex level, regardless of whether Fidelity achieves any such economies of scale.
The Board concluded, taking into account the analysis of the Economies of Scale Committee, that economies of scale, if any, are being appropriately shared between fund shareholders and Fidelity.
Additional Information Requested by the Board. In order to develop fully the factual basis for consideration of the Fidelity funds' advisory contracts, the Board requested and received additional information on certain topics, including: (i) fund performance trends, in particular the underperformance of certain funds, and Fidelity's long-term strategies for certain funds; (ii) Fidelity's fund profitability methodology, profitability trends for certain funds, and the impact of certain factors on fund profitability results; (iii) metrics for evaluating index fund and ETF performance and information about ETF trading characteristics; (iv) the methodology with respect to the evaluation of competitive fund data and peer group classifications and fee comparisons; (v) the expense structures for different funds and classes; (vi) information regarding other accounts managed by Fidelity, including collective investment trusts; and (vii) Fidelity's philosophies and strategies for evaluating funds and classes with lower or declining asset levels.
Based on its evaluation of all of the conclusions noted above, and after considering all factors it believed relevant, the Board concluded that the advisory fee arrangements are fair and reasonable, and that each fund's Advisory Contracts should be renewed.
AFOC-SANN-0319
1.700839.122
Fidelity Advisor® Global Real Estate Fund
Semi-Annual Report January 31, 2019 |
|
Beginning on January 1, 2021, as permitted by regulations adopted by the Securities and Exchange Commission, paper copies of a fund’s shareholder reports will no longer be sent by mail, unless you specifically request paper copies of the reports from the fund or from your financial intermediary, such as a financial advisor, broker-dealer or bank. Instead, the reports will be made available on a website, and you will be notified by mail each time a report is posted and provided with a website link to access the report.
If you already elected to receive shareholder reports electronically, you will not be affected by this change and you need not take any action. You may elect to receive shareholder reports and other communications from a fund electronically, by contacting your financial intermediary. For Fidelity customers, visit Fidelity's web site or call Fidelity using the contact information listed below.
You may elect to receive all future reports in paper free of charge. If you wish to continue receiving paper copies of your shareholder reports, you may contact your financial intermediary or, if you are a Fidelity customer, visit Fidelity’s website, or call Fidelity at the applicable toll-free number listed below. Your election to receive reports in paper will apply to all funds held with the fund complex/your financial intermediary.
| Account Type | Website | Phone Number |
| Brokerage, Mutual Fund, or Annuity Contracts: | fidelity.com/mailpreferences | 1-800-343-3548 |
| Employer Provided Retirement Accounts: | netbenefits.fidelity.com/preferences (choose 'no' under Required Disclosures to continue to print) | 1-800-343-0860 |
| Advisor Sold Accounts Serviced Through Your Financial Intermediary: | Contact Your Financial Intermediary | Your Financial Intermediary's phone number |
| Advisor Sold Accounts Serviced by Fidelity: | institutional.fidelity.com | 1-877-208-0098 |
Contents
To view a fund's proxy voting guidelines and proxy voting record for the 12-month period ended June 30, visit http://www.fidelity.com/proxyvotingresults or visit the Securities and Exchange Commission's (SEC) web site at http://www.sec.gov.
You may also call 1-877-208-0098 to request a free copy of the proxy voting guidelines.
Standard & Poor's, S&P and S&P 500 are registered service marks of The McGraw-Hill Companies, Inc. and have been licensed for use by Fidelity Distributors Corporation.
Other third-party marks appearing herein are the property of their respective owners.
All other marks appearing herein are registered or unregistered trademarks or service marks of FMR LLC or an affiliated company. © 2019 FMR LLC. All rights reserved.
This report and the financial statements contained herein are submitted for the general information of the shareholders of the Fund. This report is not authorized for distribution to prospective investors in the Fund unless preceded or accompanied by an effective prospectus.
A fund files its complete schedule of portfolio holdings with the SEC for the first and third quarters of each fiscal year on Form N-Q. Forms N-Q are available on the SEC’s web site at http://www.sec.gov. A fund's Forms N-Q may be reviewed and copied at the SEC’s Public Reference Room in Washington, DC. Information regarding the operation of the SEC's Public Reference Room may be obtained by calling 1-800-SEC-0330.
For a complete list of a fund's portfolio holdings, view the most recent holdings listing, semiannual report, or annual report on Fidelity's web site at http://www.fidelity.com, http://www.institutional.fidelity.com, or http://www.401k.com, as applicable.
NOT FDIC INSURED •MAY LOSE VALUE •NO BANK GUARANTEE
Neither the Fund nor Fidelity Distributors Corporation is a bank.
Note to Shareholders
During January 2019 the Board approved to change the investment advisor from Fidelity SelectCo, LLC (SelectCo) to Fidelity Management & Research Company (FMR) effective February 1, 2019. There was no change to the management fee.
Investment Summary (Unaudited)
Top Ten Stocks as of January 31, 2019
| | % of fund's net assets |
| Prologis, Inc. | 4.5 |
| Simon Property Group, Inc. | 4.4 |
| UDR, Inc. | 3.3 |
| Mitsui Fudosan Co. Ltd. | 2.7 |
| Boston Properties, Inc. | 2.6 |
| Sun Hung Kai Properties Ltd. | 2.6 |
| Equity Lifestyle Properties, Inc. | 2.3 |
| LEG Immobilien AG | 2.3 |
| Duke Realty Corp. | 2.2 |
| Welltower, Inc. | 2.1 |
| | 29.0 |
Top Five Countries as of January 31, 2019
| (excluding cash equivalents) | % of fund's net assets |
| United States of America | 49.9 |
| Japan | 11.0 |
| Australia | 5.8 |
| Germany | 5.3 |
| Singapore | 4.4 |
Top Five REIT Sectors as of January 31, 2019
| | % of fund's net assets |
| REITs - Apartments | 13.0 |
| REITs - Diversified | 12.6 |
| REITs - Office Property | 7.6 |
| REITs - Health Care | 7.1 |
| REITs - Management/Investment | 6.2 |
Asset Allocation (% of fund's net assets)
| As of January 31, 2019* |
| | Stocks | 99.6% |
| | Short-Term Investments and Net Other Assets (Liabilities) | 0.4% |

* Foreign investments - 49.7%
Schedule of Investments January 31, 2019 (Unaudited)
Showing Percentage of Net Assets
| Common Stocks - 99.6% | | | |
| | | Shares | Value |
| Australia - 5.8% | | | |
| Abacus Property Group unit | | 14,410 | $38,547 |
| Arena (REIT) unit | | 19,990 | 39,088 |
| Carindale Property Trust | | 3,000 | 15,592 |
| Goodman Group unit | | 4,541 | 38,488 |
| Ingenia Communities Group unit | | 18,135 | 40,470 |
| National Storage (REIT) unit | | 37,273 | 48,633 |
| Propertylink Group unit | | 27,708 | 23,364 |
| The GPT Group unit | | 17,043 | 71,854 |
|
| TOTAL AUSTRALIA | | | 316,036 |
|
| Austria - 0.6% | | | |
| CA Immobilien Anlagen AG | | 850 | 30,413 |
| Bailiwick of Guernsey - 0.7% | | | |
| Sirius Real Estate Ltd. | | 46,447 | 38,258 |
| Bermuda - 1.7% | | | |
| Hongkong Land Holdings Ltd. | | 13,130 | 94,142 |
| Canada - 2.0% | | | |
| Boardwalk (REIT) | | 604 | 18,447 |
| RioCan (REIT) | | 1,821 | 34,550 |
| Smart (REIT) | | 2,189 | 55,477 |
|
| TOTAL CANADA | | | 108,474 |
|
| Cayman Islands - 1.7% | | | |
| Cheung Kong Property Holdings Ltd. | | 11,180 | 94,122 |
| Finland - 0.2% | | | |
| Kojamo OYJ | | 1,300 | 13,390 |
| France - 1.5% | | | |
| Gecina SA | | 577 | 84,668 |
| Germany - 5.3% | | | |
| DIC Asset AG | | 1,870 | 21,104 |
| Instone Real Estate Group BV (a) | | 3,000 | 64,727 |
| LEG Immobilien AG | | 1,073 | 125,886 |
| Vonovia SE | | 1,560 | 78,226 |
|
| TOTAL GERMANY | | | 289,943 |
|
| Hong Kong - 4.2% | | | |
| Sino Land Ltd. | | 49,580 | 89,159 |
| Sun Hung Kai Properties Ltd. | | 8,344 | 139,950 |
|
| TOTAL HONG KONG | | | 229,109 |
|
| Ireland - 2.7% | | | |
| Hibernia (REIT) PLC | | 65,430 | 98,407 |
| Irish Residential Properties REIT PLC | | 30,300 | 52,022 |
|
| TOTAL IRELAND | | | 150,429 |
|
| Italy - 0.6% | | | |
| COIMA RES SpA (a) | | 3,900 | 33,390 |
| Japan - 11.0% | | | |
| Advance Residence Investment Corp. | | 26 | 76,860 |
| AEON MALL Co. Ltd. | | 970 | 16,083 |
| Japan Hotel REIT Investment Corp. | | 10 | 7,666 |
| Kenedix Office Investment Corp. | | 10 | 68,579 |
| Kenedix Residential Investment Corp. | | 22 | 36,375 |
| Kenedix, Inc. | | 4,000 | 20,969 |
| Mitsubishi Estate Co. Ltd. | | 5,698 | 100,673 |
| Mitsui Fudosan Co. Ltd. | | 6,210 | 150,340 |
| Nomura Real Estate Holdings, Inc. | | 800 | 15,519 |
| ORIX JREIT, Inc. | | 45 | 78,618 |
| Star Asia Investment Corp. | | 34 | 33,118 |
|
| TOTAL JAPAN | | | 604,800 |
|
| Luxembourg - 0.6% | | | |
| Aroundtown SA | | 3,729 | 32,951 |
| Mexico - 0.5% | | | |
| Concentradora Fibra Hotelera Mexicana SA de CV (a) | | 29,500 | 15,227 |
| Terrafina | | 10,100 | 14,409 |
|
| TOTAL MEXICO | | | 29,636 |
|
| Netherlands - 1.4% | | | |
| Unibail-Rodamco SE & WFD Unibail-Rodamco NV unit | | 419 | 75,372 |
| Singapore - 4.4% | | | |
| Mapletree Commercial Trust | | 48,700 | 63,670 |
| Parkway Life REIT | | 45,300 | 96,576 |
| UOL Group Ltd. | | 16,330 | 80,546 |
|
| TOTAL SINGAPORE | | | 240,792 |
|
| Sweden - 0.4% | | | |
| Cibus Nordic Real Estate AB | | 1,760 | 21,820 |
| United Kingdom - 4.4% | | | |
| Assura PLC | | 19,249 | 15,098 |
| Capital & Counties Properties PLC | | 8,825 | 28,868 |
| Derwent London PLC | | 2,101 | 89,256 |
| Grainger Trust PLC | | 8,999 | 26,958 |
| Londonmetric Properity PLC | | 15,820 | 38,947 |
| U & I Group PLC | | 14,905 | 39,685 |
|
| TOTAL UNITED KINGDOM | | | 238,812 |
|
| United States of America - 49.9% | | | |
| American Homes 4 Rent Class A | | 2,422 | 53,550 |
| Apartment Investment & Management Co. Class A | | 493 | 24,413 |
| AvalonBay Communities, Inc. | | 568 | 109,579 |
| Boston Properties, Inc. | | 1,088 | 143,475 |
| Braemar Hotels & Resorts, Inc. | | 800 | 8,896 |
| Brandywine Realty Trust (SBI) | | 2,798 | 42,110 |
| Camden Property Trust (SBI) | | 514 | 49,832 |
| Crown Castle International Corp. | | 360 | 42,142 |
| DiamondRock Hospitality Co. | | 3,831 | 38,923 |
| Digital Realty Trust, Inc. | | 979 | 106,065 |
| Duke Realty Corp. | | 4,208 | 123,042 |
| Equinix, Inc. | | 91 | 35,854 |
| Equity Lifestyle Properties, Inc. | | 1,195 | 126,527 |
| Equity Residential (SBI) | | 1,488 | 107,969 |
| Essex Property Trust, Inc. | | 186 | 50,443 |
| Extra Space Storage, Inc. | | 594 | 58,574 |
| Gaming & Leisure Properties | | 750 | 28,125 |
| Healthcare Trust of America, Inc. | | 1,479 | 42,033 |
| Highwoods Properties, Inc. (SBI) | | 543 | 24,066 |
| Host Hotels & Resorts, Inc. | | 4,626 | 83,546 |
| Kimco Realty Corp. | | 2,233 | 37,983 |
| Prologis, Inc. | | 3,606 | 249,390 |
| Public Storage | | 56 | 11,901 |
| Regency Centers Corp. | | 1,062 | 69,030 |
| RLJ Lodging Trust | | 1,092 | 20,257 |
| Simon Property Group, Inc. | | 1,325 | 241,309 |
| SL Green Realty Corp. | | 677 | 62,575 |
| Spirit Realty Capital, Inc. | | 1,054 | 41,865 |
| Sun Communities, Inc. | | 699 | 76,827 |
| Terreno Realty Corp. | | 350 | 14,119 |
| The Macerich Co. | | 912 | 42,098 |
| UDR, Inc. | | 4,091 | 178,981 |
| Ventas, Inc. | | 1,773 | 114,341 |
| VEREIT, Inc. | | 4,139 | 33,443 |
| VICI Properties, Inc. | | 2,137 | 46,010 |
| Vornado Realty Trust | | 856 | 59,843 |
| Washington REIT (SBI) | | 678 | 17,187 |
| Welltower, Inc. | | 1,516 | 117,475 |
|
| TOTAL UNITED STATES OF AMERICA | | | 2,733,798 |
|
| TOTAL COMMON STOCKS | | | |
| (Cost $5,041,875) | | | 5,460,355 |
|
| Money Market Funds - 4.6% | | | |
| Fidelity Cash Central Fund, 2.43% (b) | | | |
| (Cost $249,193) | | 249,144 | 249,193 |
| TOTAL INVESTMENT IN SECURITIES - 104.2% | | | |
| (Cost $5,291,068) | | | 5,709,548 |
| NET OTHER ASSETS (LIABILITIES) - (4.2)% | | | (227,833) |
| NET ASSETS - 100% | | | $5,481,715 |
Categorizations in the Schedule of Investments are based on country or territory of incorporation.
Legend
(a) Security exempt from registration under Rule 144A of the Securities Act of 1933. These securities may be resold in transactions exempt from registration, normally to qualified institutional buyers. At the end of the period, the value of these securities amounted to $113,344 or 2.1% of net assets.
(b) Affiliated fund that is generally available only to investment companies and other accounts managed by Fidelity Investments. The rate quoted is the annualized seven-day yield of the fund at period end. A complete unaudited listing of the fund's holdings as of its most recent quarter end is available upon request. In addition, each Fidelity Central Fund's financial statements are available on the SEC's website or upon request.
Affiliated Central Funds
Information regarding fiscal year to date income earned by the Fund from investments in Fidelity Central Funds is as follows:
| Fund | Income earned |
| Fidelity Cash Central Fund | $852 |
| Total | $852 |
Amounts in the income column in the above table include any capital gain distributions from underlying funds, which are presented in the corresponding line-item in the Statement of Operations, if applicable.
Investment Valuation
The following is a summary of the inputs used, as of January 31, 2019, involving the Fund's assets and liabilities carried at fair value. The inputs or methodology used for valuing securities may not be an indication of the risk associated with investing in those securities. For more information on valuation inputs, and their aggregation into the levels used below, please refer to the Investment Valuation section in the accompanying Notes to Financial Statements.
| | Valuation Inputs at Reporting Date: |
| Description | Total | Level 1 | Level 2 | Level 3 |
| Investments in Securities: | | | | |
| Equities: | | | | |
| Consumer Discretionary | $21,820 | $21,820 | $-- | $-- |
| Financials | 56,482 | 56,482 | -- | -- |
| Real Estate | 5,382,053 | 5,058,822 | 323,231 | -- |
| Money Market Funds | 249,193 | 249,193 | -- | -- |
| Total Investments in Securities: | $5,709,548 | $5,386,317 | $323,231 | $-- |
See accompanying notes which are an integral part of the financial statements.
Financial Statements
Statement of Assets and Liabilities
| | | January 31, 2019 (Unaudited) |
| Assets | | |
Investment in securities, at value — See accompanying schedule:
Unaffiliated issuers (cost $5,041,875) | $5,460,355 | |
| Fidelity Central Funds (cost $249,193) | 249,193 | |
| Total Investment in Securities (cost $5,291,068) | | $5,709,548 |
| Receivable for investments sold | | 3,198 |
| Receivable for fund shares sold | | 4,360 |
| Dividends receivable | | 9,320 |
| Distributions receivable from Fidelity Central Funds | | 152 |
| Prepaid expenses | | 25 |
| Receivable from investment adviser for expense reductions | | 8,598 |
| Other receivables | | 30 |
| Total assets | | 5,735,231 |
| Liabilities | | |
| Payable for investments purchased | $209,825 | |
| Accrued management fee | 2,825 | |
| Distribution and service plan fees payable | 1,816 | |
| Audit fees payable | 30,302 | |
| Other affiliated payables | 787 | |
| Other payables and accrued expenses | 7,961 | |
| Total liabilities | | 253,516 |
| Net Assets | | $5,481,715 |
| Net Assets consist of: | | |
| Paid in capital | | $5,217,017 |
| Total distributable earnings (loss) | | 264,698 |
| Net Assets | | $5,481,715 |
| Net Asset Value and Maximum Offering Price | | |
| Class A: | | |
| Net Asset Value and redemption price per share ($2,169,207 ÷ 210,969 shares) | | $10.28 |
| Maximum offering price per share (100/94.25 of $10.28) | | $10.91 |
| Class M: | | |
| Net Asset Value and redemption price per share ($710,401 ÷ 69,099 shares) | | $10.28 |
| Maximum offering price per share (100/96.50 of $10.28) | | $10.65 |
| Class C: | | |
| Net Asset Value and offering price per share ($1,490,072 ÷ 145,670 shares)(a) | | $10.23 |
| Class I: | | |
| Net Asset Value, offering price and redemption price per share ($946,129 ÷ 91,938 shares) | | $10.29 |
| Class Z: | | |
| Net Asset Value, offering price and redemption price per share ($165,906 ÷ 16,118 shares) | | $10.29 |
(a) Redemption price per share is equal to net asset value less any applicable contingent deferred sales charge.
See accompanying notes which are an integral part of the financial statements.
Statement of Operations
| | | Six months ended January 31, 2019 (Unaudited) |
| Investment Income | | |
| Dividends | | $56,303 |
| Non-Cash dividends | | 4,224 |
| Income from Fidelity Central Funds | | 852 |
| Income before foreign taxes withheld | | 61,379 |
| Less foreign taxes withheld | | (2,494) |
| Total income | | 58,885 |
| Expenses | | |
| Management fee | $12,784 | |
| Transfer agent fees | 3,393 | |
| Distribution and service plan fees | 7,531 | |
| Accounting fees and expenses | 721 | |
| Custodian fees and expenses | 13,142 | |
| Independent trustees' fees and expenses | 10 | |
| Registration fees | 17,936 | |
| Audit | 27,649 | |
| Legal | 4 | |
| Miscellaneous | 76 | |
| Total expenses before reductions | 83,246 | |
| Expense reductions | (54,761) | |
| Total expenses after reductions | | 28,485 |
| Net investment income (loss) | | 30,400 |
| Realized and Unrealized Gain (Loss) | | |
| Net realized gain (loss) on: | | |
| Investment securities: | | |
| Unaffiliated issuers | (7,749) | |
| Fidelity Central Funds | (6) | |
| Foreign currency transactions | (388) | |
| Total net realized gain (loss) | | (8,143) |
| Change in net unrealized appreciation (depreciation) on: | | |
| Investment securities: | | |
| Unaffiliated issuers | 259,894 | |
| Assets and liabilities in foreign currencies | 115 | |
| Total change in net unrealized appreciation (depreciation) | | 260,009 |
| Net gain (loss) | | 251,866 |
| Net increase (decrease) in net assets resulting from operations | | $282,266 |
See accompanying notes which are an integral part of the financial statements.
Statement of Changes in Net Assets
| | Six months ended January 31, 2019 (Unaudited) | Year ended July 31, 2018 |
| Increase (Decrease) in Net Assets | | |
| Operations | | |
| Net investment income (loss) | $30,400 | $48,971 |
| Net realized gain (loss) | (8,143) | 5,322 |
| Change in net unrealized appreciation (depreciation) | 260,009 | 115,480 |
| Net increase (decrease) in net assets resulting from operations | 282,266 | 169,773 |
| Distributions to shareholders | (86,970) | – |
| Distributions to shareholders from net investment income | – | (34,616) |
| Distributions to shareholders from net realized gain | – | (41,912) |
| Total distributions | (86,970) | (76,528) |
| Share transactions - net increase (decrease) | 2,114,474 | 271,453 |
| Total increase (decrease) in net assets | 2,309,770 | 364,698 |
| Net Assets | | |
| Beginning of period | 3,171,945 | 2,807,247 |
| End of period | $5,481,715 | $3,171,945 |
| Other Information | | |
| Undistributed net investment income end of period | | $33,111 |
See accompanying notes which are an integral part of the financial statements.
Financial Highlights
Fidelity Advisor Global Real Estate Fund Class A
| | Six months ended (Unaudited) January 31, | Years endedJuly 31, | |
| | 2019 | 2018 | 2017 A |
| Selected Per–Share Data | | | |
| Net asset value, beginning of period | $10.13 | $9.81 | $10.00 |
| Income from Investment Operations | | | |
| Net investment income (loss)B | .09 | .18 | .15 |
| Net realized and unrealized gain (loss) | .27 | .42 | (.26) |
| Total from investment operations | .36 | .60 | (.11) |
| Distributions from net investment income | (.15) | (.13) | (.07) |
| Distributions from net realized gain | (.06) | (.14) | (.01) |
| Total distributions | (.21)C | (.28) | (.08) |
| Net asset value, end of period | $10.28 | $10.13 | $9.81 |
| Total ReturnD,E,F | 3.80% | 6.16% | (1.00)% |
| Ratios to Average Net AssetsG,H | | | |
| Expenses before reductions | 4.46%I | 5.86% | 8.94%I |
| Expenses net of fee waivers, if any | 1.39%I,J | 1.40% | 1.40%I |
| Expenses net of all reductions | 1.39%I | 1.38% | 1.39%I |
| Net investment income (loss) | 1.79%I | 1.80% | 1.65%I |
| Supplemental Data | | | |
| Net assets, end of period (000 omitted) | $2,169 | $1,001 | $657 |
| Portfolio turnover rateK | 37%I | 46% | 59%I |
A For the period August 11, 2016 (commencement of operations) to July 31, 2017.
B Calculated based on average shares outstanding during the period.
C Total distributions of $.28 per share is comprised of distributions from net investment income of $.134 and distributions from net realized gain of $.142 per share.
D Total returns for periods of less than one year are not annualized.
E Total returns would have been lower if certain expenses had not been reduced during the applicable periods shown.
F Total returns do not include the effect of the sales charges.
G Fees and expenses of any underlying Fidelity Central Funds are not included in the Fund's expense ratio. The Fund indirectly bears its proportionate share of the expenses of any underlying Fidelity Central Funds.
H Expense ratios reflect operating expenses of the class. Expenses before reductions do not reflect amounts reimbursed by the investment adviser or reductions from brokerage service arrangements or reductions from other expense offset arrangements and do not represent the amount paid by the class during periods when reimbursements or reductions occur. Expenses net of fee waivers reflect expenses after reimbursement by the investment adviser but prior to reductions from brokerage service arrangements or other expense offset arrangements. Expenses net of all reductions represent the net expenses paid by the class.
I Annualized
J On certain classes, the size and fluctuation of net assets and expense amounts may cause ratios to differ from contractual rates.
K Amount does not include the portfolio activity of any underlying Fidelity Central Funds.
See accompanying notes which are an integral part of the financial statements.
Fidelity Advisor Global Real Estate Fund Class M
| | Six months ended (Unaudited) January 31, | Years endedJuly 31, | |
| | 2019 | 2018 | 2017 A |
| Selected Per–Share Data | | | |
| Net asset value, beginning of period | $10.11 | $9.79 | $10.00 |
| Income from Investment Operations | | | |
| Net investment income (loss)B | .08 | .15 | .13 |
| Net realized and unrealized gain (loss) | .28 | .42 | (.27) |
| Total from investment operations | .36 | .57 | (.14) |
| Distributions from net investment income | (.13) | (.11) | (.06) |
| Distributions from net realized gain | (.06) | (.14) | (.01) |
| Total distributions | (.19) | (.25) | (.07) |
| Net asset value, end of period | $10.28 | $10.11 | $9.79 |
| Total ReturnC,D,E | 3.72% | 5.90% | (1.30)% |
| Ratios to Average Net AssetsF,G | | | |
| Expenses before reductions | 4.75%H | 5.90% | 9.20%H |
| Expenses net of fee waivers, if any | 1.65%H | 1.65% | 1.65%H |
| Expenses net of all reductions | 1.64%H | 1.63% | 1.64%H |
| Net investment income (loss) | 1.54%H | 1.54% | 1.40%H |
| Supplemental Data | | | |
| Net assets, end of period (000 omitted) | $710 | $570 | $550 |
| Portfolio turnover rateI | 37%H | 46% | 59%H |
A For the period August 11, 2016 (commencement of operations) to July 31, 2017.
B Calculated based on average shares outstanding during the period.
C Total returns for periods of less than one year are not annualized.
D Total returns would have been lower if certain expenses had not been reduced during the applicable periods shown.
E Total returns do not include the effect of the sales charges.
F Fees and expenses of any underlying Fidelity Central Funds are not included in the Fund's expense ratio. The Fund indirectly bears its proportionate share of the expenses of any underlying Fidelity Central Funds.
G Expense ratios reflect operating expenses of the class. Expenses before reductions do not reflect amounts reimbursed by the investment adviser or reductions from brokerage service arrangements or reductions from other expense offset arrangements and do not represent the amount paid by the class during periods when reimbursements or reductions occur. Expenses net of fee waivers reflect expenses after reimbursement by the investment adviser but prior to reductions from brokerage service arrangements or other expense offset arrangements. Expenses net of all reductions represent the net expenses paid by the class.
H Annualized
I Amount does not include the portfolio activity of any underlying Fidelity Central Funds.
See accompanying notes which are an integral part of the financial statements.
Fidelity Advisor Global Real Estate Fund Class C
| | Six months ended (Unaudited) January 31, | Years endedJuly 31, | |
| | 2019 | 2018 | 2017 A |
| Selected Per–Share Data | | | |
| Net asset value, beginning of period | $10.08 | $9.76 | $10.00 |
| Income from Investment Operations | | | |
| Net investment income (loss)B | .05 | .10 | .08 |
| Net realized and unrealized gain (loss) | .28 | .42 | (.26) |
| Total from investment operations | .33 | .52 | (.18) |
| Distributions from net investment income | (.12) | (.06) | (.05) |
| Distributions from net realized gain | (.06) | (.14) | (.01) |
| Total distributions | (.18) | (.20) | (.06) |
| Net asset value, end of period | $10.23 | $10.08 | $9.76 |
| Total ReturnC,D,E | 3.47% | 5.38% | (1.77)% |
| Ratios to Average Net AssetsF,G | | | |
| Expenses before reductions | 4.79%H | 6.26% | 9.75%H |
| Expenses net of fee waivers, if any | 2.14%H,I | 2.15% | 2.15%H |
| Expenses net of all reductions | 2.13%H | 2.13% | 2.14%H |
| Net investment income (loss) | 1.05%H | 1.04% | .90%H |
| Supplemental Data | | | |
| Net assets, end of period (000 omitted) | $1,490 | $614 | $737 |
| Portfolio turnover rateJ | 37%H | 46% | 59%H |
A For the period August 11, 2016 (commencement of operations) to July 31, 2017.
B Calculated based on average shares outstanding during the period.
C Total returns for periods of less than one year are not annualized.
D Total returns would have been lower if certain expenses had not been reduced during the applicable periods shown.
E Total returns do not include the effect of the contingent deferred sales charge.
F Fees and expenses of any underlying Fidelity Central Funds are not included in the Fund's expense ratio. The Fund indirectly bears its proportionate share of the expenses of any underlying Fidelity Central Funds.
G Expense ratios reflect operating expenses of the class. Expenses before reductions do not reflect amounts reimbursed by the investment adviser or reductions from brokerage service arrangements or reductions from other expense offset arrangements and do not represent the amount paid by the class during periods when reimbursements or reductions occur. Expenses net of fee waivers reflect expenses after reimbursement by the investment adviser but prior to reductions from brokerage service arrangements or other expense offset arrangements. Expenses net of all reductions represent the net expenses paid by the class.
H Annualized
I On certain classes, the size and fluctuation of net assets and expense amounts may cause ratios to differ from contractual rates.
J Amount does not include the portfolio activity of any underlying Fidelity Central Funds.
See accompanying notes which are an integral part of the financial statements.
Fidelity Advisor Global Real Estate Fund Class I
| | Six months ended (Unaudited) January 31, | Years endedJuly 31, | |
| | 2019 | 2018 | 2017 A |
| Selected Per–Share Data | | | |
| Net asset value, beginning of period | $10.15 | $9.82 | $10.00 |
| Income from Investment Operations | | | |
| Net investment income (loss)B | .10 | .20 | .17 |
| Net realized and unrealized gain (loss) | .27 | .43 | (.26) |
| Total from investment operations | .37 | .63 | (.09) |
| Distributions from net investment income | (.17) | (.16) | (.08) |
| Distributions from net realized gain | (.06) | (.14) | (.01) |
| Total distributions | (.23) | (.30) | (.09) |
| Net asset value, end of period | $10.29 | $10.15 | $9.82 |
| Total ReturnC,D | 3.91% | 6.48% | (.80)% |
| Ratios to Average Net AssetsE,F | | | |
| Expenses before reductions | 4.25%G | 5.41% | 8.74%G |
| Expenses net of fee waivers, if any | 1.15%G | 1.15% | 1.15%G |
| Expenses net of all reductions | 1.14%G | 1.13% | 1.14%G |
| Net investment income (loss) | 2.04%G | 2.04% | 1.90%G |
| Supplemental Data | | | |
| Net assets, end of period (000 omitted) | $946 | $986 | $863 |
| Portfolio turnover rateH | 37%G | 46% | 59%G |
A For the period August 11, 2016 (commencement of operations) to July 31, 2017.
B Calculated based on average shares outstanding during the period.
C Total returns for periods of less than one year are not annualized.
D Total returns would have been lower if certain expenses had not been reduced during the applicable periods shown.
E Fees and expenses of any underlying Fidelity Central Funds are not included in the Fund's expense ratio. The Fund indirectly bears its proportionate share of the expenses of any underlying Fidelity Central Funds.
F Expense ratios reflect operating expenses of the class. Expenses before reductions do not reflect amounts reimbursed by the investment adviser or reductions from brokerage service arrangements or reductions from other expense offset arrangements and do not represent the amount paid by the class during periods when reimbursements or reductions occur. Expenses net of fee waivers reflect expenses after reimbursement by the investment adviser but prior to reductions from brokerage service arrangements or other expense offset arrangements. Expenses net of all reductions represent the net expenses paid by the class.
G Annualized
H Amount does not include the portfolio activity of any underlying Fidelity Central Funds.
See accompanying notes which are an integral part of the financial statements.
Fidelity Advisor Global Real Estate Fund Class Z
| | Six months ended (Unaudited) January 31, |
| | 2019 A |
| Selected Per–Share Data | |
| Net asset value, beginning of period | $10.01 |
| Income from Investment Operations | |
| Net investment income (loss)B | .07 |
| Net realized and unrealized gain (loss) | .44 |
| Total from investment operations | .51 |
| Distributions from net investment income | (.17) |
| Distributions from net realized gain | (.06) |
| Total distributions | (.23) |
| Net asset value, end of period | $10.29 |
| Total ReturnC,D | 5.36% |
| Ratios to Average Net AssetsE,F | |
| Expenses before reductions | 2.93%G |
| Expenses net of fee waivers, if any | 1.00%G |
| Expenses net of all reductions | .99%G |
| Net investment income (loss) | 2.23%G |
| Supplemental Data | |
| Net assets, end of period (000 omitted) | $166 |
| Portfolio turnover rateH | 37%G |
A For the period October 2, 2018 (commencement of sale of shares) to January 31, 2019.
B Calculated based on average shares outstanding during the period.
C Total returns for periods of less than one year are not annualized.
D Total returns would have been lower if certain expenses had not been reduced during the applicable periods shown.
E Fees and expenses of any underlying Fidelity Central Funds are not included in the Fund's expense ratio. The Fund indirectly bears its proportionate share of the expenses of any underlying Fidelity Central Funds.
F Expense ratios reflect operating expenses of the class. Expenses before reductions do not reflect amounts reimbursed by the investment adviser or reductions from brokerage service arrangements or reductions from other expense offset arrangements and do not represent the amount paid by the class during periods when reimbursements or reductions occur. Expenses net of fee waivers reflect expenses after reimbursement by the investment adviser but prior to reductions from brokerage service arrangements or other expense offset arrangements. Expenses net of all reductions represent the net expenses paid by the class.
G Annualized
H Amount does not include the portfolio activity of any underlying Fidelity Central Funds.
See accompanying notes which are an integral part of the financial statements.
Notes to Financial Statements (Unaudited)
For the period ended January 31, 2019
1. Organization.
Fidelity Advisor Global Real Estate Fund (the Fund) is a fund of Fidelity Advisor Series VII (the Trust) and is authorized to issue an unlimited number of shares. The Trust is registered under the Investment Company Act of 1940, as amended (the 1940 Act), as an open-end management investment company organized as a Massachusetts business trust. The Fund commenced sale of Class Z shares on October 2, 2018. The Fund offers Class A, Class M, Class C, Class I and Class Z shares, each of which has equal rights as to assets and voting privileges. Each class has exclusive voting rights with respect to matters that affect that class.
Effective March 1, 2019, Class C shares will automatically convert to Class A shares after a holding period of ten years from the initial date of purchase, with certain exceptions.
2. Investments in Fidelity Central Funds.
The Fund invests in Fidelity Central Funds, which are open-end investment companies generally available only to other investment companies and accounts managed by the investment adviser and its affiliates. The Fund's Schedule of Investments lists each of the Fidelity Central Funds held as of period end, if any, as an investment of the Fund, but does not include the underlying holdings of each Fidelity Central Fund. As an Investing Fund, the Fund indirectly bears its proportionate share of the expenses of the underlying Fidelity Central Funds.
The Money Market Central Funds seek preservation of capital and current income and are managed by Fidelity Investments Money Management, Inc. (FIMM), an affiliate of the investment adviser. Annualized expenses of the Money Market Central Funds as of their most recent shareholder report date are less than .005%.
A complete unaudited list of holdings for each Fidelity Central Fund is available upon request or at the Securities and Exchange Commission (the SEC) website at www.sec.gov. In addition, the financial statements of the Fidelity Central Funds are available on the SEC website or upon request.
3. Significant Accounting Policies.
The Fund is an investment company and applies the accounting and reporting guidance of the Financial Accounting Standards Board (FASB) Accounting Standards Codification Topic 946 Financial Services – Investments Companies. The financial statements have been prepared in conformity with accounting principles generally accepted in the United States of America (GAAP), which require management to make certain estimates and assumptions at the date of the financial statements. Actual results could differ from those estimates. Subsequent events, if any, through the date that the financial statements were issued have been evaluated in the preparation of the financial statements. The following summarizes the significant accounting policies of the Fund:
Investment Valuation. Investments are valued as of 4:00 p.m. Eastern time on the last calendar day of the period. The Board of Trustees (the Board) has delegated the day to day responsibility for the valuation of the Fund's investments to the Fair Value Committee (the Committee) established by the Fund's investment adviser. In accordance with valuation policies and procedures approved by the Board, the Fund attempts to obtain prices from one or more third party pricing vendors or brokers to value its investments. When current market prices, quotations or currency exchange rates are not readily available or reliable, investments will be fair valued in good faith by the Committee, in accordance with procedures adopted by the Board. Factors used in determining fair value vary by investment type and may include market or investment specific events. The frequency with which these procedures are used cannot be predicted and they may be utilized to a significant extent. The Committee oversees the Fund's valuation policies and procedures and reports to the Board on the Committee's activities and fair value determinations. The Board monitors the appropriateness of the procedures used in valuing the Fund's investments and ratifies the fair value determinations of the Committee.
The Fund categorizes the inputs to valuation techniques used to value its investments into a disclosure hierarchy consisting of three levels as shown below:
- Level 1 – quoted prices in active markets for identical investments
- Level 2 – other significant observable inputs (including quoted prices for similar investments, interest rates, prepayment speeds, etc.)
- Level 3 – unobservable inputs (including the Fund's own assumptions based on the best information available)
Valuation techniques used to value the Fund's investments by major category are as follows:
Equity securities, including restricted securities, for which market quotations are readily available, are valued at the last reported sale price or official closing price as reported by a third party pricing vendor on the primary market or exchange on which they are traded and are categorized as Level 1 in the hierarchy. In the event there were no sales during the day or closing prices are not available, securities are valued at the last quoted bid price or may be valued using the last available price and are generally categorized as Level 2 in the hierarchy. For foreign equity securities, when market or security specific events arise, comparisons to the valuation of American Depositary Receipts (ADRs), futures contracts, Exchange-Traded Funds (ETFs) and certain indexes as well as quoted prices for similar securities may be used and would be categorized as Level 2 in the hierarchy. For equity securities, including restricted securities, where observable inputs are limited, assumptions about market activity and risk are used and these securities may be categorized as Level 3 in the hierarchy.
Investments in open-end mutual funds, including the Fidelity Central Funds, are valued at their closing net asset value (NAV) each business day and are categorized as Level 1 in the hierarchy.
Changes in valuation techniques may result in transfers in or out of an assigned level within the disclosure hierarchy. The aggregate value of investments by input level as of January 31, 2019 is included at the end of the Fund's Schedule of Investments.
Foreign Currency. The Fund may use foreign currency contracts to facilitate transactions in foreign-denominated securities. Gains and losses from these transactions may arise from changes in the value of the foreign currency or if the counterparties do not perform under the contracts' terms.
Foreign-denominated assets, including investment securities, and liabilities are translated into U.S. dollars at the exchange rates at period end. Purchases and sales of investment securities, income and dividends received and expenses denominated in foreign currencies are translated into U.S. dollars at the exchange rate in effect on the transaction date.
The effects of exchange rate fluctuations on investments are included with the net realized and unrealized gain (loss) on investment securities. Other foreign currency transactions resulting in realized and unrealized gain (loss) are disclosed separately.
Investment Transactions and Income. For financial reporting purposes, the Fund's investment holdings and NAV include trades executed through the end of the last business day of the period. The NAV per share for processing shareholder transactions is calculated as of the close of business of the New York Stock Exchange (NYSE), normally 4:00 p.m. Eastern time and includes trades executed through the end of the prior business day. Gains and losses on securities sold are determined on the basis of identified cost. Dividend income is recorded on the ex-dividend date, except for certain dividends from foreign securities where the ex-dividend date may have passed, which are recorded as soon as the Fund is informed of the ex-dividend date. Non-cash dividends included in dividend income, if any, are recorded at the fair market value of the securities received. Income and capital gain distributions from Fidelity Central Funds, if any, are recorded on the ex-dividend date. Certain distributions received by the Fund represent a return of capital or capital gain. The Fund determines the components of these distributions subsequent to the ex-dividend date, based upon receipt of tax filings or other correspondence relating to the underlying investment. These distributions are recorded as a reduction of cost of investments and/or as a realized gain. Investment income is recorded net of foreign taxes withheld where recovery of such taxes is uncertain.
Class Allocations and Expenses. Investment income, realized and unrealized capital gains and losses, common expenses of the Fund, and certain fund-level expense reductions, if any, are allocated daily on a pro-rata basis to each class based on the relative net assets of each class to the total net assets of the Fund. Each class differs with respect to transfer agent and distribution and service plan fees incurred. Certain expense reductions may also differ by class. For the reporting period, the allocated portion of income and expenses to each class as a percent of its average net assets may vary due to the timing of recording these transactions in relation to fluctuating net assets of the classes. Expenses directly attributable to a fund are charged to that fund. Expenses attributable to more than one fund are allocated among the respective funds on the basis of relative net assets or other appropriate methods. Expense estimates are accrued in the period to which they relate and adjustments are made when actual amounts are known.
Income Tax Information and Distributions to Shareholders. Each year, the Fund intends to qualify as a regulated investment company under Subchapter M of the Internal Revenue Code, including distributing substantially all of its taxable income and realized gains. As a result, no provision for U.S. Federal income taxes is required. The Fund files a U.S. federal tax return, in addition to state and local tax returns as required. The Fund's federal income tax returns are subject to examination by the Internal Revenue Service (IRS) for a period of three fiscal years after they are filed. State and local tax returns may be subject to examination for an additional fiscal year depending on the jurisdiction. Foreign taxes are provided for based on the Fund's understanding of the tax rules and rates that exist in the foreign markets in which it invests.
Distributions are declared and recorded on the ex-dividend date. Income and capital gain distributions are declared separately for each class. Income and capital gain distributions are determined in accordance with income tax regulations, which may differ from GAAP.
Capital accounts within the financial statements are adjusted for permanent book-tax differences. These adjustments have no impact on net assets or the results of operations. Capital accounts are not adjusted for temporary book-tax differences which will reverse in a subsequent period.
Book-tax differences are primarily due to foreign currency transactions, passive foreign investment companies (PFIC), capital loss carryforwards and losses deferred due to wash sales.
As of period end, the cost and unrealized appreciation (depreciation) in securities, and derivatives if applicable, for federal income tax purposes were as follows:
| Gross unrealized appreciation | $463,882 |
| Gross unrealized depreciation | (124,516) |
| Net unrealized appreciation (depreciation) | $339,366 |
| Tax cost | $5,370,182 |
Capital loss carryforwards are only available to offset future capital gains of the Fund to the extent provided by regulations and may be limited. Under the Regulated Investment Company Modernization Act of 2010 (the Act), the Fund is permitted to carry forward capital losses incurred in taxable years beginning after December 22, 2010 for an unlimited period and such capital losses are required to be used prior to any losses that expire. The capital loss carryforward information presented below, including any applicable limitation, is estimated as of prior fiscal period end and is subject to adjustment.
| No expiration | |
| Short-term | $(75,280) |
| Long-term | (11,315) |
| Total capital loss carryforward | $(86,595) |
Restricted Securities. The Fund may invest in securities that are subject to legal or contractual restrictions on resale. These securities generally may be resold in transactions exempt from registration or to the public if the securities are registered. Disposal of these securities may involve time-consuming negotiations and expense, and prompt sale at an acceptable price may be difficult. Information regarding restricted securities is included at the end of the Fund's Schedule of Investments.
New Rule Issuance. During August 2018, the U.S. Securities and Exchange Commission issued Final Rule Release No. 33-10532, Disclosure Update and Simplification. This Final Rule includes amendments specific to registered investment companies that are intended to eliminate overlap in disclosure requirements between Regulation S-X and GAAP. In accordance with these amendments, certain line-items in the Fund's financial statements have been combined or removed for the current period as outlined in the table below.
| Financial Statement | Current Line-Item Presentation (As Applicable) | Prior Line-Item Presentation (As Applicable) |
| Statement of Assets and Liabilities | Total distributable earnings (loss) | Undistributed/Distributions in excess of/Accumulated net investment income (loss)
Accumulated/Undistributed net realized gain (loss)
Net unrealized appreciation (depreciation) |
| Statement of Changes in Net Assets | N/A - removed | Undistributed/Distributions in excess of/Accumulated net investment income (loss) end of period |
| Statement of Changes in Net Assets | Distributions to shareholders | Distributions to shareholders from net investment income
Distributions to shareholders from net realized gain |
| Distributions to Shareholders Note to Financial Statements | Distributions to shareholders | Distributions to shareholders from net investment income
Distributions to shareholders from net realized gain |
4. Purchases and Sales of Investments.
Purchases and sales of securities, other than short-term securities, aggregated $2,766,990 and $695,167, respectively.
5. Fees and Other Transactions with Affiliates.
Management Fee. Fidelity SelectCo, LLC (the investment adviser) and its affiliates provide the Fund with investment management related services for which the Fund pays a monthly management fee. The management fee is the sum of an individual fund fee rate that is based on an annual rate of .45% of the Fund's average net assets and an annualized group fee rate that averaged .24% during the period. The group fee rate is based upon the average net assets of all the mutual funds advised by Fidelity Management & Research Company (FMR) and the investment adviser. The group fee rate decreases as assets under management increase and increases as assets under management decrease. For the reporting period, the total annualized management fee rate was .69% of the Fund's average net assets.
During January 2019 the Board approved to change the investment adviser from Fidelity SelectCo, LLC to Fidelity Management & Research Company effective February 1, 2019. There was no change to the management fee.
Distribution and Service Plan Fees. In accordance with Rule 12b-1 of the 1940 Act, the Fund has adopted separate Distribution and Service Plans for each class of shares. Certain classes pay Fidelity Distributors Corporation (FDC), an affiliate of the investment adviser, separate Distribution and Service Fees, each of which is based on an annual percentage of each class' average net assets. In addition, FDC may pay financial intermediaries for selling shares of the Fund and providing shareholder support services. For the period, the Distribution and Service Fee rates, total fees and amounts retained by FDC were as follows:
| | Distribution Fee | Service Fee | Total Fees | Retained by FDC |
| Class A | -% | .25% | $1,460 | $589 |
| Class M | .25% | .25% | 1,466 | 1,210 |
| Class C | .75% | .25% | 4,605 | 2,611 |
| | | | $7,531 | $4,410 |
Sales Load. FDC may receive a front-end sales charge of up to 5.75% for selling Class A shares and 3.50% for selling Class M shares, some of which is paid to financial intermediaries for selling shares of the Fund. Depending on the holding period, FDC may receive contingent deferred sales charges levied on Class A, Class M and Class C redemptions. The deferred sales charges are 1.00% for Class C shares, 1.00% for certain purchases of Class A shares and .25% for certain purchases of Class M shares.
For the period, sales charge amounts retained by FDC were as follows:
| | Retained by FDC |
| Class A | $271 |
| Class M | 100 |
| | $371 |
Transfer Agent Fees. Fidelity Investments Institutional Operations Company, Inc., (FIIOC), an affiliate of the investment adviser, is the transfer, dividend disbursing and shareholder servicing agent for each class of the Fund. FIIOC receives account fees and asset-based fees that vary according to the account size and type of account of the shareholders of the respective classes of the Fund, except for Class Z. FIIOC receives an asset-based fee of Class Z's average net assets. FIIOC pays for typesetting, printing and mailing of shareholder reports, except proxy statements.
For the period, transfer agent fees for each class were as follows:
| | Amount | % of Class-Level Average Net Assets(a) |
| Class A | $1,438 | .25 |
| Class M | 634 | .22 |
| Class C | 620 | .14 |
| Class I | 680 | .14 |
| Class Z | 21 | .05 |
| | $3,393 | |
(a) Annualized
Accounting Fees. Fidelity Service Company, Inc. (FSC), an affiliate of the investment adviser, maintains the Fund's accounting records. The fee is based on the level of average net assets for each month. For the period, the fees were equivalent to an annualized rate of .04%.
Brokerage Commissions. The Fund placed a portion of its portfolio transactions with brokerage firms which are affiliates of the investment adviser. Brokerage commissions are included in net realized gain (loss) and change in net unrealized appreciation (depreciation) in the Statement of Operations. The commissions paid to these affiliated firms were $23 for the period.
Interfund Trades. The Fund may purchase from or sell securities to other Fidelity Funds under procedures adopted by the Board. The procedures have been designed to ensure these interfund trades are executed in accordance with Rule 17a-7 of the 1940 Act. Interfund trades are included within the respective purchases and sales amounts shown in the Purchases and Sales of Investments note.
6. Committed Line of Credit.
The Fund participates with other funds managed by the investment adviser or an affiliate in a $4.25 billion credit facility (the "line of credit") to be utilized for temporary or emergency purposes to fund shareholder redemptions or for other short-term liquidity purposes. The Fund has agreed to pay commitment fees on its pro-rata portion of the line of credit, which amounted to $5 and is reflected in Miscellaneous expenses on the Statement of Operations. During the period, the Fund did not borrow on this line of credit.
7. Expense Reductions.
The investment adviser contractually agreed to reimburse each class to the extent annual operating expenses exceeded certain levels of class-level average net assets as noted in the table below. This reimbursement will remain in place through November 30, 2020. Some expenses, for example the compensation of the independent Trustees, and certain miscellaneous expenses such as proxy and shareholder meeting expenses, are excluded from this reimbursement.
The following classes were in reimbursement during the period:
| | Expense Limitations | Reimbursement |
| Class A | 1.40% | $17,901 |
| Class M | 1.65% | 9,094 |
| Class C | 2.15% | 12,151 |
| Class I | 1.15% | 14,616 |
| Class Z | 1.00% | 859 |
| | | $54,621 |
Commissions paid to certain brokers with whom the investment adviser, or its affiliates, places trades on behalf of the Fund include an amount in addition to trade execution, which may be rebated back to the Fund to offset certain expenses. This amount totaled $1 for the period. In addition, through arrangements with the Fund's custodian, credits realized as a result of certain uninvested cash balances were used to reduce the Fund's expenses. During the period, these credits reduced the Fund's custody expenses by $124.
In addition, during the period the investment adviser reimbursed and/or waived a portion of fund-level operating expenses in the amount of $15.
8. Distributions to Shareholders.
Distributions to shareholders of each class were as follows:
| | Six months ended
January 31, 2019(a) | Year ended
July 31, 2018 |
| Distributions to shareholders | | |
| Class A | $25,954 | $– |
| Class M | 11,502 | – |
| Class C | 24,842 | – |
| Class I | 21,029 | – |
| Class Z | 3,643 | – |
| Total | $86,970 | $– |
| From net investment income | | |
| Class A | $– | $10,565 |
| Class M | – | 6,191 |
| Class C | – | 4,104 |
| Class I | – | 13,756 |
| Total | $– | $34,616 |
| From net realized gain | | |
| Class A | $– | $11,196 |
| Class M | – | 8,065 |
| Class C | – | 10,049 |
| Class I | – | 12,602 |
| Total | $– | $41,912 |
(a) Distributions for Class Z are for the period October 2, 2018 (commencement of sale of shares) to January 31, 2019.
9. Share Transactions.
Share transactions for each class were as follows and may contain automatic conversions between classes or exchanges between affiliated funds:
| | Shares | Shares | Dollars | Dollars |
| | Six months ended January 31, 2019(a) | Year ended July 31, 2018 | Six months ended January 31, 2019(a) | Year ended July 31, 2018 |
| Class A | | | | |
| Shares sold | 120,982 | 43,178 | $1,160,150 | $423,027 |
| Reinvestment of distributions | 2,803 | 2,212 | 25,954 | 21,761 |
| Shares redeemed | (11,693) | (13,506) | (112,544) | (131,704) |
| Net increase (decrease) | 112,092 | 31,884 | $1,073,560 | $313,084 |
| Class M | | | | |
| Shares sold | 11,455 | 5,975 | $108,483 | $59,008 |
| Reinvestment of distributions | 1,242 | 1,449 | 11,502 | 14,256 |
| Shares redeemed | (4) | (7,160) | (40) | (69,653) |
| Net increase (decrease) | 12,693 | 264 | $119,945 | $3,611 |
| Class C | | | | |
| Shares sold | 82,964 | 6,324 | $797,065 | $63,092 |
| Reinvestment of distributions | 2,694 | 1,438 | 24,842 | 14,153 |
| Shares redeemed | (896) | (22,353) | (8,305) | (213,557) |
| Net increase (decrease) | 84,762 | (14,591) | $813,602 | $(136,312) |
| Class I | | | | |
| Shares sold | 466 | 15,189 | $4,580 | $148,303 |
| Reinvestment of distributions | 2,066 | 2,624 | 19,150 | 25,818 |
| Shares redeemed | (7,765) | (8,521) | (77,169) | (83,051) |
| Net increase (decrease) | (5,233) | 9,292 | $(53,439) | $91,070 |
| Class Z | | | | |
| Shares sold | 15,770 | – | $157,579 | $– |
| Reinvestment of distributions | 348 | – | 3,227 | – |
| Net increase (decrease) | 16,118 | – | $160,806 | $– |
(a) Share transactions for Class Z are for the period October 2, 2018 (commencement of sale of shares) to January 31, 2019.
10. Other.
The Fund's organizational documents provide former and current trustees and officers with a limited indemnification against liabilities arising in connection with the performance of their duties to the Fund. In the normal course of business, the Fund may also enter into contracts that provide general indemnifications. The Fund's maximum exposure under these arrangements is unknown as this would be dependent on future claims that may be made against the Fund. The risk of material loss from such claims is considered remote.
At the end of the period, the investment adviser or its affiliates were the owners of record of 39% of the total outstanding shares of the Fund.
Shareholder Expense Example
As a shareholder of the Fund, you incur two types of costs: (1) transaction costs, including sales charges (loads) on purchase payments , and (2) ongoing costs, including management fees, distribution and/or service (12b-1) fees and other Fund expenses. This Example is intended to help you understand your ongoing costs (in dollars) of investing in the Fund and to compare these costs with the ongoing costs of investing in other mutual funds.
The actual expense Example is based on an investment of $1,000 invested at the beginning of the period and held for the entire period (August 1, 2018 to January 31, 2019) for Class A, Class M, Class C, and Class I and for the period (October 2, 2018 to January 31, 2019) for Class Z. The hypothetical expense Example is based on an investment of $1,000 invested for the one-half year period (August 1, 2018 to January 31, 2019).
Actual Expenses
The first line of the accompanying table for each class of the Fund provides information about actual account values and actual expenses. You may use the information in this line, together with the amount you invested, to estimate the expenses that you paid over the period. Simply divide your account value by $1,000.00 (for example, an $8,600 account value divided by $1,000.00 = 8.6), then multiply the result by the number in the first line for a class of the Fund under the heading entitled "Expenses Paid During Period" to estimate the expenses you paid on your account during this period. In addition, the Fund, as a shareholder in the underlying Fidelity Central Funds, will indirectly bear its pro-rata share of the fees and expenses incurred by the underlying Fidelity Central Funds. These fees and expenses are not included in the Fund's annualized expense ratio used to calculate the expense estimate in the table below.
Hypothetical Example for Comparison Purposes
The second line of the accompanying table for each class of the Fund provides information about hypothetical account values and hypothetical expenses based on a Class' actual expense ratio and an assumed rate of return of 5% per year before expenses, which is not the Class' actual return. The hypothetical account values and expenses may not be used to estimate the actual ending account balance or expenses you paid for the period. You may use this information to compare the ongoing costs of investing in the Fund and other funds. To do so, compare this 5% hypothetical example with the 5% hypothetical examples that appear in the shareholder reports of the other funds. In addition, the Fund, as a shareholder in the underlying Fidelity Central Funds, will indirectly bear its pro-rata share of the fees and expenses incurred by the underlying Fidelity Central Funds. These fees and expenses are not included in the Fund's annualized expense ratio used to calculate the expense estimate in the table below.
Please note that the expenses shown in the table are meant to highlight your ongoing costs only and do not reflect any transaction costs. Therefore, the second line of the table is useful in comparing ongoing costs only, and will not help you determine the relative total costs of owning different funds. In addition, if these transactional costs were included, your costs would have been higher.
| | Annualized Expense Ratio-A | Beginning
Account Value | Ending
Account Value
January 31, 2019 | Expenses Paid
During Period |
| Class A | 1.39% | | | |
| Actual | | $1,000.00 | $1,038.00 | $7.14-B |
| Hypothetical-C | | $1,000.00 | $1,018.20 | $7.07-D |
| Class M | 1.65% | | | |
| Actual | | $1,000.00 | $1,037.20 | $8.47-B |
| Hypothetical-C | | $1,000.00 | $1,016.94 | $8.39-D |
| Class C | 2.14% | | | |
| Actual | | $1,000.00 | $1,034.70 | $10.98-B |
| Hypothetical-C | | $1,000.00 | $1,014.47 | $10.87-D |
| Class I | 1.15% | | | |
| Actual | | $1,000.00 | $1,039.10 | $5.91-B |
| Hypothetical-C | | $1,000.00 | $1,019.41 | $5.85-D |
| Class Z | 1.00% | | | |
| Actual | | $1,000.00 | $1,053.60 | $3.43-B |
| Hypothetical-C | | $1,000.00 | $1,019.86 | $5.09-D |
A Annualized expense ratio reflects expenses net of applicable fee waivers.
B Actual expenses are equal to each Class' annualized expense ratio, multiplied by the average account value over the period, multiplied by 184/365 (to reflect the one-half year period) for Class A, Class M, Class C, and Class I and multiplied by 122/365 (to reflect the period October 2, 2018 to January 31, 2019) for Class Z.
C 5% return per year before expenses
D Hypothetical expenses are equal to each Class' annualized expense ratio, multiplied by the average account value over the period, multiplied by 184/365 (to reflect the one-half year period).
Board Approval of Investment Advisory Contracts and Management Fees
Fidelity Advisor Global Real Estate Fund
Each year, the Board of Trustees, including the Independent Trustees (together, the Board), votes on the management contract with Fidelity SelectCo, LLC (SelectCo), an affiliate of Fidelity Management & Research Company (FMR), and the sub-advisory agreements with affiliates of FMR for the fund. SelectCo and the sub-advisers are referred to herein as the Investment Advisers. The Board, assisted by the advice of fund counsel and Independent Trustees' counsel, requests and considers a broad range of information relevant to the advisory arrangements throughout the year.
The Board meets regularly and, at each of its meetings, covers an extensive agenda of topics and materials and considers factors that are relevant to its annual consideration of the fund's advisory arrangements, including the services and support provided to the fund and its shareholders. The Board has established various standing committees (Committees), each composed of and chaired by Independent Trustees with varying backgrounds, to which the Board has assigned specific subject matter responsibilities in order to enhance effective decision-making by the Board. The Board, acting directly and through its Committees, requests and receives information concerning the annual consideration of the fund's advisory arrangements. The Board also meets as needed to review matters specifically related to the Board's annual consideration of the advisory arrangements. Members of the Board may also meet with trustees of other Fidelity funds through joint ad hoc committees to discuss certain matters relevant to all of the Fidelity funds.
At its January 2019 meeting, the Board unanimously determined to approve an amended and restated management contract and sub-advisory agreements (together, the Advisory Contracts) for the fund to reflect the fact that, effective February 1, 2019, FMR would assume the duties and rights of SelectCo under the fund's then current management contract. The Board noted that, with the exception of the date, term, and entity name, the terms of the fund's Advisory Contracts, including the fees payable thereunder, would not change as a result of the approval of the Advisory Contracts. The Board considered that FMR would render the same services to the fund under the amended and restated management contract that SelectCo rendered to the fund under the then current management contract and that the sub-advisory agreements were simply being updated to reflect the change in investment adviser. The Board also considered that approval of the Advisory Contracts would not result in any changes to (i) the investment process or strategies employed in the management of the fund's assets; or (ii) the day-to-day management of the fund or the persons primarily responsible for such management. As a result, the Board considered that its prior experience with SelectCo as investment adviser for the fund was relevant to its consideration of the Advisory Contracts.
In reaching its determination, the Board considered all factors it believed relevant, including (i) the nature, extent, and quality of the services to be provided to the fund and its shareholders (including the investment performance of the fund); (ii) the competitiveness of the fund's management fee and total expense ratio relative to peer funds; (iii) the total costs of the services to be provided by and the profits to be realized by Fidelity from its relationships with the fund; and (iv) the extent to which, if any, economies of scale exist and would be realized as the fund grows, and whether any economies of scale are appropriately shared with fund shareholders.
In considering whether to approve the Advisory Contracts for the fund, the Board reached a determination, with the assistance of fund counsel and Independent Trustees' counsel and through the exercise of its business judgment, that the approval of the Advisory Contracts was in the best interests of the fund and its shareholders and that the compensation payable under the Advisory Contracts was fair and reasonable. The Board's decision to approve the Advisory Contracts was not based on any single factor, but rather was based on a comprehensive consideration of all the information provided to the Board at its meetings throughout the year. The Board, in reaching its determination to approve the Advisory Contracts, was aware that shareholders of the fund have a broad range of investment choices available to them, including a wide choice among funds offered by Fidelity's competitors, and that the fund's shareholders, who have the opportunity to review and weigh the disclosure provided by the fund in its prospectus and other public disclosures, have chosen to invest in this fund, which is part of the Fidelity family of funds.
Nature, Extent, and Quality of Services Provided. The Board considered Fidelity's staffing as it relates to the fund, including the backgrounds of investment personnel of Fidelity, and also considered the fund's investment objective, strategies, and related investment philosophy. The Independent Trustees also had discussions with senior management of Fidelity's investment operations and investment groups. The Board considered the structure of the investment personnel compensation program and whether this structure provides appropriate incentives to act in the best interests of the fund. Additionally, the Board considered the portfolio managers' investments, if any, in the funds that they manage.
Resources Dedicated to Investment Management and Support Services. The Board and the Fund Oversight and Research Committees reviewed the general qualifications and capabilities of Fidelity's investment staff, including its size, education, experience, and resources, as well as Fidelity's approach to recruiting, training, managing, and compensating investment personnel. The Board noted that Fidelity has continued to increase the resources devoted to non-U.S. offices, including expansion of Fidelity's global investment organization. The Board also noted that Fidelity's analysts have extensive resources, tools and capabilities that allow them to conduct sophisticated quantitative and fundamental analysis, as well as credit analysis of issuers, counterparties and guarantors. Further, the Board considered that Fidelity's investment professionals have sufficient access to global information and data so as to provide competitive investment results over time, and that those professionals also have access to sophisticated tools that permit them to assess portfolio construction and risk and performance attribution characteristics continuously, as well as to transmit new information and research conclusions rapidly around the world. Additionally, in its deliberations, the Board considered Fidelity's trading, risk management, compliance, and technology and operations capabilities and resources, which are integral parts of the investment management process.
Shareholder and Administrative Services. The Board considered (i) the nature, extent, quality, and cost of advisory, administrative, and shareholder services performed by the Investment Advisers and their affiliates under the Advisory Contracts and under separate agreements covering transfer agency, pricing and bookkeeping, and securities lending services for the fund; (ii) the nature and extent of the supervision of third party service providers, principally custodians, subcustodians, and pricing vendors; and (iii) the resources devoted to, and the record of compliance with, the fund's compliance policies and procedures. The Board also reviewed the allocation of fund brokerage, including allocations to brokers affiliated with the Investment Advisers, the use of brokerage commissions to pay fund expenses, and the use of "soft" commission dollars to pay for research services.
The Board noted that the growth of fund assets over time across the complex allows Fidelity to reinvest in the development of services designed to enhance the value and convenience of the Fidelity funds as investment vehicles. These services include 24-hour access to account information and market information through telephone representatives and over the Internet, investor education materials and asset allocation tools, and the expanded availability of Fidelity Investor Centers.
The Board noted that it and the boards of certain other Fidelity funds had formed an ad hoc Committee on Transfer Agency Fees to review the variety of transfer agency fee structures throughout the industry and Fidelity's competitive positioning with respect to industry participants.
Investment in a Large Fund Family. The Board considered the benefits to shareholders of investing in a Fidelity fund, including the benefits of investing in a fund that is part of a large family of funds offering a variety of investment disciplines and providing a large variety of mutual fund investor services. The Board noted that Fidelity had taken, or had made recommendations that resulted in the Fidelity funds taking, a number of actions over the previous year that benefited particular funds, including: (i) continuing to dedicate additional resources to Fidelity's investment research process, which includes meetings with management of issuers of securities in which the funds invest, and to the support of the senior management team that oversees asset management; (ii) continuing efforts to enhance Fidelity's global research capabilities; (iii) launching new funds and making other enhancements to meet client needs; (iv) launching new share classes of existing funds; (v) eliminating purchase minimums and broadening eligibility requirements for certain funds and share classes; (vi) reducing management fees and total expenses for certain growth equity funds and index funds; (vii) lowering expense caps for certain existing funds and classes, and converting certain voluntary expense caps to contractual caps, to reduce expenses borne by shareholders; (viii) eliminating short-term redemption fees for funds that had such fees; (ix) rationalizing product lines and gaining increased efficiencies from fund mergers and share class consolidations; (x) continuing to develop, acquire and implement systems and technology to improve services to the funds and shareholders, strengthen information security, and increase efficiency; and (xi) continuing to implement enhancements to further strengthen Fidelity's product line to increase investors' probability of success in achieving their investment goals, including retirement income goals.
Investment Performance. The Board considered whether the fund has operated in accordance with its investment objective, as well as its record of compliance with its investment restrictions and its performance history.
The Board took into account discussions that occur at Board meetings throughout the year with representatives of the Investment Advisers about fund investment performance. In this regard the Board noted that as part of regularly scheduled fund reviews and other reports to the Board on fund performance, the Board considers annualized return information for the fund for different time periods, measured against an appropriate securities market index ("benchmark index") and a peer group of funds with similar objectives ("peer group"), if any. In its evaluation of fund investment performance, the Board gave particular attention to information indicating changes in performance of certain Fidelity funds for specific time periods and discussed with the Investment Advisers the reasons for any overperformance or underperformance.
In addition to reviewing absolute and relative fund performance, the Independent Trustees periodically consider the appropriateness of fund performance metrics in evaluating the results achieved. In general, the Independent Trustees believe that fund performance should be evaluated based on net performance (after fees and expenses) of both the highest performing and lowest performing fund share classes, where applicable, compared to appropriate benchmark indices, over appropriate time periods that may include full market cycles, and compared to peer groups, as applicable, over the same periods, taking into account relevant factors including the following: general market conditions; issuer-specific information; and fund cash flows and other factors.
The Independent Trustees recognize that shareholders evaluate performance on a net basis over their own holding periods, for which one-, three-, and five-year periods are often used as a proxy. For this reason, the performance information reviewed by the Board also included net total return information for the fund and an appropriate benchmark index and peer group for the most recent one-year period ended June 30, 2018, as shown below. Returns are shown compared to the 25th percentile (top of box, 75% beaten) and 75th percentile (bottom of box, 25% beaten) of the peer universe.
Fidelity Advisor Global Real Estate Fund
Based on its review, the Board concluded that the nature, extent, and quality of services provided to the fund under the Advisory Contracts should continue to benefit the shareholders of the fund.
Competitiveness of Management Fee and Total Expense Ratio. The Board considered the fund's management fee and total expense ratio compared to "mapped groups" of competitive funds and classes created for the purpose of facilitating the Trustees' competitive analysis of management fees and total expenses. Fidelity creates "mapped groups" by combining similar Lipper investment objective categories that have comparable investment mandates. For this purpose, all sector focused equity funds are grouped in the same mapped group. Combining Lipper investment objective categories aids the Board's management fee and total expense ratio comparisons by broadening the competitive group used for comparison.
Management Fee. The Board considered two proprietary management fee comparisons for the 12-month (or shorter) periods ended June 30 shown in basis points (BP) in the chart below. The group of Lipper funds used by the Board for management fee comparisons is referred to below as the "Total Mapped Group." The Total Mapped Group is broader than the Lipper peer group used by the Board for performance comparisons because the Total Mapped Group combines several Lipper investment objective categories while the Lipper peer group does not. The Total Mapped Group comparison focuses on a fund's standing in terms of gross management fees before expense reimbursements or caps relative to the total universe of funds with comparable investment mandates (
i.e., sector equities), regardless of whether their management fee structures also are comparable. Funds with comparable management fee structures have similar management fee contractual arrangements (
e.g., flat rate charged for advisory services, all-inclusive fee rate,
etc.). "TMG %" represents the percentage of funds in the Total Mapped Group that had management fees that were lower than the fund's. For example, a hypothetical TMG % of 20% would mean that 80% of the funds in the Total Mapped Group had higher, and 20% had lower, management fees than the fund. The fund's actual TMG %s and the number of funds in the Total Mapped Group are in the chart below. The "Asset-Size Peer Group" (ASPG) comparison focuses on a fund's standing relative to a subset of non-Fidelity funds within the Total Mapped Group that are similar in size and management fee structure. For example, if a fund is in the first quartile of the ASPG, the fund's management fee ranks in the least expensive or lowest 25% of funds in the ASPG. The ASPG represents at least 15% of the funds in the Total Mapped Group with comparable asset size and management fee structures, subject to a minimum of 50 funds (or all funds in the Total Mapped Group if fewer than 50). Additional information, such as the ASPG quartile in which the fund's management fee rate ranked, is also included in the chart and was considered by the Board.
Fidelity Advisor Global Real Estate Fund
The Board noted that the fund's management fee rate ranked below the median of its Total Mapped Group and below the median of its ASPG for the 12-month period ended June 30, 2018.
The Board noted that it and the boards of other Fidelity funds formed an ad hoc Committee on Group Fee, which meets periodically, to conduct an in-depth review of the "group fee" component of the management fee of funds with such management fee structures. The Committee's focus included the mechanics of the group fee, the competitive landscape of group fee structures, Fidelity funds with no group fee component and investment products not included in group fee assets. The Board also considered that, for funds subject to the group fee, FMR agreed to voluntarily waive fees over a specified period of time in amounts designed to account for assets converted from certain funds to certain collective investment trusts.
Based on its review, the Board concluded that the fund's management fee is fair and reasonable in light of the services that the fund receives and the other factors considered.
Total Expense Ratio. In its review of each class's total expense ratio, the Board considered the fund's management fee rate as well as other fund or class expenses, as applicable, such as transfer agent fees, pricing and bookkeeping fees, fund-paid 12b-1 fees, and custodial, legal, and audit fees. The Board also noted that Fidelity may agree to waive fees and expenses from time to time, and the extent to which, if any, it has done so for the fund. As part of its review, the Board also considered the current and historical total expense ratios of each class of the fund compared to competitive fund median expenses. Each class of the fund is compared to those funds and classes in the Total Mapped Group (used by the Board for management fee comparisons) that have a similar sales load structure.
The Board noted that the total expense ratio of each class ranked above the competitive median for the 12-month period ended June 30, 2018. The Board considered that, in general, various factors can affect total expense ratios. The Board noted that the total expense ratio of Class A was above the competitive median because of relatively higher other expenses due to asset levels or small average account sizes. The Board noted that the total expense ratio of Class M was above the competitive median primarily because of higher 12b-1 fees on Class M as compared to most competitor funds. Class M has a higher 12b-1 fee, but a lower front-end sales charge, than traditionally priced front-end sales charge classes. The Board considered that Class M is primarily sold load-waived to retirement plans and intermediary wrap programs where its 0.50% 12b-1 fee is comparable to competing no-load, higher 12b-1 fee classes designed specifically for retirement plans and wrap programs. The Board noted that the total expense ratio of Class C was above the competitive median primarily because of its 1.00% 12b-1 fee. The Board noted that, although Class I is categorized by Lipper as an institutional class, Class I has a significantly lower investment minimum than most other funds and classes categorized as institutional. As a result, FMR believes Class I is generally more comparable to retail funds and classes. The Board noted that the fund offers multiple classes, each of which has a different sales load and 12b-1 fee structure, and that the multiple structures are intended to offer a range of pricing options for the intermediary market. The Board also noted that the total expense ratios of the classes vary primarily by the level of their 12b-1 fees, although differences in transfer agent fees may also cause expenses to vary from class to class.
The Board further considered that the investment adviser has contractually agreed to reimburse Class A, Class M, Class C, and Class I of the fund to the extent that total operating expenses, with certain exceptions, as a percentage of their respective average net assets, exceed 1.40%, 1.65%, 2.15%, and 1.15% through February 29, 2020.
Fees Charged to Other Fidelity Clients. The Board also considered Fidelity fee structures and other information with respect to clients of Fidelity, such as other funds advised or subadvised by Fidelity, pension plan clients, and other institutional clients with similar mandates. The Board noted that a joint ad hoc committee created by it and the boards of other Fidelity funds periodically reviews and compares Fidelity's institutional investment advisory business with its business of providing services to the Fidelity funds and also noted the most recent findings of the committee. The Board noted that the committee's review included a consideration of the differences in services provided, fees charged, and costs incurred, as well as competition in the markets serving the different categories of clients.
Based on its review of total expense ratios and fees charged to other Fidelity clients, the Board concluded that the total expense ratio of each class of the fund was reasonable in light of the services that the fund and its shareholders receive and the other factors considered.
Costs of the Services and Profitability. The Board considered the revenues earned and the expenses incurred by Fidelity in conducting the business of developing, marketing, distributing, managing, administering and servicing the fund and servicing the fund's shareholders. The Board also considered the level of Fidelity's profits in respect of all the Fidelity funds.
On an annual basis, Fidelity presents to the Board information about the profitability of its relationships with the fund. Fidelity calculates profitability information for each fund, as well as aggregate profitability information for groups of Fidelity funds and all Fidelity funds, using a series of detailed revenue and cost allocation methodologies which originate with the books and records of Fidelity on which Fidelity's audited financial statements are based. The Audit Committee of the Board reviews any significant changes from the prior year's methodologies.
PricewaterhouseCoopers LLP (PwC), auditor to Fidelity and certain Fidelity funds, has been engaged annually by the Board as part of the Board's assessment of Fidelity's profitability analysis. PwC's engagement includes the review and assessment of the methodologies used by Fidelity in determining the revenues and expenses attributable to Fidelity's mutual fund business, and completion of agreed-upon procedures in respect of the mathematical accuracy of the fund profitability information and its conformity to established allocation methodologies. After considering PwC's reports issued under the engagement and information provided by Fidelity, the Board concluded that while other allocation methods may also be reasonable, Fidelity's profitability methodologies are reasonable in all material respects.
The Board also reviewed Fidelity's non-fund businesses and potential indirect benefits such businesses may have received as a result of their association with Fidelity's mutual fund business (i.e., fall-out benefits) as well as cases where Fidelity's affiliates may benefit from the fund's business. The Board noted that changes to fall-out benefits year-over-year reflect business developments at Fidelity's various businesses.
The Board considered the costs of the services provided by and the profits realized by Fidelity in connection with the operation of the fund and was satisfied that the profitability was not excessive.
Economies of Scale. The Board considered whether there have been economies of scale in respect of the management of the Fidelity funds, whether the Fidelity funds (including the fund) have appropriately benefited from any such economies of scale, and whether there is potential for realization of any further economies of scale. The Board considered the extent to which the fund will benefit from economies of scale as assets grow through increased services to the fund, through waivers or reimbursements, or through fee or expense ratio reductions. The Board also noted that a committee (the Economies of Scale Committee) created by it and the boards of other Fidelity funds periodically analyzes whether Fidelity attains economies of scale in respect of the management and servicing of the Fidelity funds, whether the Fidelity funds have appropriately benefited from such economies of scale, and whether there is potential for realization of any further economies of scale.
The Board recognized that the fund's management contract incorporates a "group fee" structure, which provides for lower group fee rates as total group assets increase, and for higher group fee rates as total group assets decrease (with "group assets" defined to include fund assets under SelectCo's management plus assets under FMR's management). SelectCo calculates the group fee rates based on a tiered asset "breakpoint" schedule that varies based on asset class. The Board considered that the group fee is designed to deliver the benefits of economies of scale to fund shareholders when total group assets increase, even if assets of any particular fund are unchanged or have declined, because some portion of Fidelity's costs are attributable to services provided to all Fidelity funds, and all funds benefit if those costs can be allocated among more assets. The Board concluded that, given the group fee structure, fund shareholders will benefit from lower management fees as group assets increase at the fund complex level, regardless of whether Fidelity achieves any such economies of scale.
The Board concluded, taking into account the analysis of the Economies of Scale Committee, that economies of scale, if any, are being appropriately shared between fund shareholders and Fidelity.
Additional Information Requested by the Board. In order to develop fully the factual basis for consideration of the Fidelity funds' advisory contracts, the Board requested and received additional information on certain topics, including: (i) fund performance trends, in particular the underperformance of certain funds, and Fidelity's long-term strategies for certain funds; (ii) Fidelity's fund profitability methodology, profitability trends for certain funds, and the impact of certain factors on fund profitability results; (iii) metrics for evaluating index fund and ETF performance and information about ETF trading characteristics; (iv) the methodology with respect to the evaluation of competitive fund data and peer group classifications and fee comparisons; (v) the expense structures for different funds and classes; (vi) information regarding other accounts managed by Fidelity, including collective investment trusts; and (vii) Fidelity's philosophies and strategies for evaluating funds and classes with lower or declining asset levels.
Based on its evaluation of all of the conclusions noted above, and after considering all factors it believed relevant, the Board concluded that the advisory fee arrangements are fair and reasonable, and that the fund's Advisory Contracts should be approved.
AGRE-SANN-0319
1.9881281.102