Fidelity Advisor® Real Estate Fund
Semi-Annual Report
January 31, 2022


Contents
To view a fund's proxy voting guidelines and proxy voting record for the 12-month period ended June 30, visit http://www.fidelity.com/proxyvotingresults or visit the Securities and Exchange Commission's (SEC) web site at http://www.sec.gov.
You may also call 1-877-208-0098 to request a free copy of the proxy voting guidelines.
Standard & Poor's, S&P and S&P 500 are registered service marks of The McGraw-Hill Companies, Inc. and have been licensed for use by Fidelity Distributors Corporation.
Other third-party marks appearing herein are the property of their respective owners.
All other marks appearing herein are registered or unregistered trademarks or service marks of FMR LLC or an affiliated company. © 2022 FMR LLC. All rights reserved.
This report and the financial statements contained herein are submitted for the general information of the shareholders of the Fund. This report is not authorized for distribution to prospective investors in the Fund unless preceded or accompanied by an effective prospectus.
A fund files its complete schedule of portfolio holdings with the SEC for the first and third quarters of each fiscal year on Form N-PORT. Forms N-PORT are available on the SEC’s web site at http://www.sec.gov. A fund's Forms N-PORT may be reviewed and copied at the SEC’s Public Reference Room in Washington, DC. Information regarding the operation of the SEC's Public Reference Room may be obtained by calling 1-800-SEC-0330.
For a complete list of a fund's portfolio holdings, view the most recent holdings listing, semiannual report, or annual report on Fidelity's web site at http://www.fidelity.com, http://www.institutional.fidelity.com, or http://www.401k.com, as applicable.
NOT FDIC INSURED •MAY LOSE VALUE •NO BANK GUARANTEE
Neither the Fund nor Fidelity Distributors Corporation is a bank.
Note to Shareholders:
Early in 2020, the outbreak and spread of COVID-19 emerged as a public health emergency that had a major influence on financial markets, primarily based on its impact on the global economy and corporate earnings. On March 11, 2020, the World Health Organization declared the COVID-19 outbreak a pandemic, citing sustained risk of further global spread. The pandemic prompted a number of measures to limit the spread of COVID-19, including travel and border restrictions, quarantines, and restrictions on large gatherings. In turn, these resulted in lower consumer activity, diminished demand for a wide range of products and services, disruption in manufacturing and supply chains, and – given the wide variability in outcomes regarding the outbreak – significant market uncertainty and volatility. To help stem the turmoil, the U.S. government took unprecedented action – in concert with the U.S. Federal Reserve and central banks around the world – to help support consumers, businesses, and the broader economy, and to limit disruption to the financial system.
In general, the overall impact of the pandemic lessened in 2021, amid a resilient economy and widespread distribution of three COVID-19 vaccines granted emergency use authorization from the U.S. Food and Drug Administration (FDA) early in the year. Still, the situation remains dynamic, and the extent and duration of its influence on financial markets and the economy is highly uncertain, due in part to a recent spike in cases based on highly contagious variants of the coronavirus.
Extreme events such as the COVID-19 crisis are exogenous shocks that can have significant adverse effects on mutual funds and their investments. Although multiple asset classes may be affected by market disruption, the duration and impact may not be the same for all types of assets. Fidelity is committed to helping you stay informed amid news about COVID-19 and during increased market volatility, and we continue to take extra steps to be responsive to customer needs. We encourage you to visit us online, where we offer ongoing updates, commentary, and analysis on the markets and our funds.
Investment Summary (Unaudited)
Top Ten Stocks as of January 31, 2022
| | % of fund's net assets |
| Prologis (REIT), Inc. | 12.2 |
| American Tower Corp. | 9.9 |
| CubeSmart | 7.2 |
| Crown Castle International Corp. | 6.3 |
| Digital Realty Trust, Inc. | 5.5 |
| CBRE Group, Inc. | 4.8 |
| Essex Property Trust, Inc. | 4.8 |
| Ventas, Inc. | 4.7 |
| Mid-America Apartment Communities, Inc. | 4.5 |
| Equity Lifestyle Properties, Inc. | 3.5 |
| | 63.4 |
Top Five REIT Sectors as of January 31, 2022
| | % of fund's net assets |
| REITs - Diversified | 21.7 |
| REITs - Warehouse/Industrial | 14.0 |
| REITs - Apartments | 12.1 |
| REITs - Management/Investment | 9.9 |
| REITs - Health Care | 7.9 |
Asset Allocation (% of fund's net assets)
| As of January 31, 2022 |
| | Stocks | 99.8% |
| | Short-Term Investments and Net Other Assets (Liabilities) | 0.2% |

Schedule of Investments January 31, 2022 (Unaudited)
Showing Percentage of Net Assets
| Common Stocks - 99.8% | | | |
| | | Shares | Value |
| Commercial Services & Supplies - 0.5% | | | |
| REITs - Diversified - 0.5% | | | |
| CoreCivic, Inc. (a) | | 239,500 | $2,421,345 |
| Diversified Financial Services - 1.1% | | | |
| Multi-Sector Holdings - 1.1% | | | |
| WeWork, Inc. (a)(b) | | 706,600 | 5,250,038 |
| Equity Real Estate Investment Trusts (REITs) - 90.0% | | | |
| REITs - Apartments - 12.1% | | | |
| Essex Property Trust, Inc. | | 69,047 | 22,958,128 |
| Invitation Homes, Inc. | | 326,500 | 13,706,470 |
| Mid-America Apartment Communities, Inc. | | 104,100 | 21,515,388 |
| | | | 58,179,986 |
| REITs - Diversified - 21.2% | | | |
| Crown Castle International Corp. | | 166,300 | 30,351,413 |
| Digital Realty Trust, Inc. | | 176,700 | 26,368,941 |
| Digitalbridge Group, Inc. (a) | | 638,900 | 4,663,970 |
| Equinix, Inc. | | 9,600 | 6,959,040 |
| Lamar Advertising Co. Class A | | 108,200 | 11,984,232 |
| VICI Properties, Inc. | | 506,600 | 14,498,892 |
| Washington REIT (SBI) | | 279,000 | 6,868,980 |
| | | | 101,695,468 |
| REITs - Health Care - 7.9% | | | |
| Healthcare Trust of America, Inc. | | 136,200 | 4,433,310 |
| Ventas, Inc. | | 430,505 | 22,825,375 |
| Welltower, Inc. | | 125,200 | 10,846,076 |
| | | | 38,104,761 |
| REITs - Hotels - 3.8% | | | |
| Host Hotels & Resorts, Inc. (a) | | 22,000 | 381,480 |
| RLJ Lodging Trust | | 1,207,126 | 16,718,695 |
| Ryman Hospitality Properties, Inc. (a) | | 15,069 | 1,332,100 |
| | | | 18,432,275 |
| REITs - Management/Investment - 9.9% | | | |
| American Tower Corp. | | 189,600 | 47,684,400 |
| REITs - Manufactured Homes - 3.5% | | | |
| Equity Lifestyle Properties, Inc. | | 215,506 | 16,871,965 |
| REITs - Office Property - 3.8% | | | |
| Alexandria Real Estate Equities, Inc. | | 60,100 | 11,709,884 |
| Douglas Emmett, Inc. | | 205,500 | 6,415,710 |
| | | | 18,125,594 |
| REITs - Shopping Centers - 2.5% | | | |
| Phillips Edison & Co., Inc. | | 91,300 | 2,877,776 |
| SITE Centers Corp. | | 607,800 | 9,001,518 |
| | | | 11,879,294 |
| REITs - Single Tenant - 4.1% | | | |
| Four Corners Property Trust, Inc. | | 512,500 | 13,873,375 |
| Spirit Realty Capital, Inc. | | 126,200 | 5,989,452 |
| | | | 19,862,827 |
| REITs - Storage - 7.2% | | | |
| CubeSmart | | 677,900 | 34,396,646 |
| REITs - Warehouse/Industrial - 14.0% | | | |
| Americold Realty Trust | | 131,300 | 3,735,485 |
| Prologis (REIT), Inc. | | 374,254 | 58,690,511 |
| Terreno Realty Corp. | | 64,900 | 4,852,573 |
| | | | 67,278,569 |
|
| TOTAL EQUITY REAL ESTATE INVESTMENT TRUSTS (REITS) | | | 432,511,785 |
|
| Hotels, Restaurants & Leisure - 0.8% | | | |
| Casinos & Gaming - 0.8% | | | |
| Caesars Entertainment, Inc. (a) | | 47,890 | 3,646,345 |
| IT Services - 1.1% | | | |
| Internet Services & Infrastructure - 1.1% | | | |
| Cyxtera Technologies, Inc. (c) | | 180,025 | 2,154,899 |
| Cyxtera Technologies, Inc. Class A (a) | | 271,200 | 3,246,264 |
| | | | 5,401,163 |
| Real Estate Management & Development - 6.3% | | | |
| Real Estate Services - 6.3% | | | |
| CBRE Group, Inc. | | 230,100 | 23,318,334 |
| Jones Lang LaSalle, Inc. (a) | | 28,300 | 7,097,357 |
| | | | 30,415,691 |
| TOTAL COMMON STOCKS | | | |
| (Cost $323,203,899) | | | 479,646,367 |
|
| Money Market Funds - 1.2% | | | |
| Fidelity Cash Central Fund 0.08% (d) | | 1,171,394 | 1,171,628 |
| Fidelity Securities Lending Cash Central Fund 0.08% (d)(e) | | 4,646,060 | 4,646,525 |
| TOTAL MONEY MARKET FUNDS | | | |
| (Cost $5,818,153) | | | 5,818,153 |
| TOTAL INVESTMENT IN SECURITIES - 101.0% | | | |
| (Cost $329,022,052) | | | 485,464,520 |
| NET OTHER ASSETS (LIABILITIES) - (1.0)% | | | (4,768,860) |
| NET ASSETS - 100% | | | $480,695,660 |
Legend
(a) Non-income producing
(b) Security or a portion of the security is on loan at period end.
(c) Restricted securities (including private placements) - Investment in securities not registered under the Securities Act of 1933 (excluding 144A issues). At the end of the period, the value of restricted securities (excluding 144A issues) amounted to $2,154,899 or 0.4% of net assets.
(d) Affiliated fund that is generally available only to investment companies and other accounts managed by Fidelity Investments. The rate quoted is the annualized seven-day yield of the fund at period end. A complete unaudited listing of the fund's holdings as of its most recent quarter end is available upon request. In addition, each Fidelity Central Fund's financial statements are available on the SEC's website or upon request.
(e) Investment made with cash collateral received from securities on loan.
Additional information on each restricted holding is as follows:
| Security | Acquisition Date | Acquisition Cost |
| Cyxtera Technologies, Inc. | 2/21/21 | $1,800,250 |
Affiliated Central Funds
Fiscal year to date information regarding the Fund's investments in Fidelity Central Funds, including the ownership percentage, is presented below.
| Fund | Value, beginning of period | Purchases | Sales Proceeds | Dividend Income | Realized Gain/Loss | Change in Unrealized appreciation (depreciation) | Value, end of period | % ownership, end of period |
| Fidelity Cash Central Fund 0.08% | $-- | $64,410,115 | $63,238,487 | $1,176 | $-- | $-- | $1,171,628 | 0.0% |
| Fidelity Securities Lending Cash Central Fund 0.08% | 1,593,150 | 13,843,896 | 10,790,521 | 13,524 | -- | -- | 4,646,525 | 0.0% |
| Total | $1,593,150 | $78,254,011 | $74,029,008 | $14,700 | $-- | $-- | $5,818,153 | |
Amounts in the income column in the above table include any capital gain distributions from underlying funds, which are presented in the corresponding line-item in the Statement of Operations, if applicable. Amount for Fidelity Securities Lending Cash Central Fund represents the income earned on investing cash collateral, less rebates paid to borrowers and any lending agent fees associated with the loan, plus any premium payments received for lending certain types of securities.
Investment Valuation
The following is a summary of the inputs used, as of January 31, 2022, involving the Fund's assets and liabilities carried at fair value. The inputs or methodology used for valuing securities may not be an indication of the risk associated with investing in those securities. For more information on valuation inputs, and their aggregation into the levels used below, please refer to the Investment Valuation section in the accompanying Notes to Financial Statements.
| | Valuation Inputs at Reporting Date: |
| Description | Total | Level 1 | Level 2 | Level 3 |
| Investments in Securities: | | | | |
| Common Stocks | $479,646,367 | $479,646,367 | $-- | $-- |
| Money Market Funds | 5,818,153 | 5,818,153 | -- | -- |
| Total Investments in Securities: | $485,464,520 | $485,464,520 | $-- | $-- |
See accompanying notes which are an integral part of the financial statements.
Financial Statements
Statement of Assets and Liabilities
| | | January 31, 2022 (Unaudited) |
| Assets | | |
Investment in securities, at value (including securities loaned of $4,761,887) — See accompanying schedule:
Unaffiliated issuers (cost $323,203,899) | $479,646,367 | |
| Fidelity Central Funds (cost $5,818,153) | 5,818,153 | |
| Total Investment in Securities (cost $329,022,052) | | $485,464,520 |
| Receivable for investments sold | | 4,016,504 |
| Receivable for fund shares sold | | 393,524 |
| Dividends receivable | | 8,845 |
| Distributions receivable from Fidelity Central Funds | | 5,376 |
| Prepaid expenses | | 2,979 |
| Other receivables | | 101,767 |
| Total assets | | 489,993,515 |
| Liabilities | | |
| Payable for investments purchased | $3,335,513 | |
| Payable for fund shares redeemed | 766,826 | |
| Accrued management fee | 214,635 | |
| Distribution and service plan fees payable | 90,737 | |
| Other affiliated payables | 110,110 | |
| Other payables and accrued expenses | 133,509 | |
| Collateral on securities loaned | 4,646,525 | |
| Total liabilities | | 9,297,855 |
| Net Assets | | $480,695,660 |
| Net Assets consist of: | | |
| Paid in capital | | $315,786,300 |
| Total accumulated earnings (loss) | | 164,909,360 |
| Net Assets | | $480,695,660 |
| Net Asset Value and Maximum Offering Price | | |
| Class A: | | |
| Net Asset Value and redemption price per share ($136,861,439 ÷ 5,868,104 shares)(a) | | $23.32 |
| Maximum offering price per share (100/94.25 of $23.32) | | $24.74 |
| Class M: | | |
| Net Asset Value and redemption price per share ($112,677,987 ÷ 4,844,630 shares)(a) | | $23.26 |
| Maximum offering price per share (100/96.50 of $23.26) | | $24.10 |
| Class C: | | |
| Net Asset Value and offering price per share ($15,497,441 ÷ 691,930 shares)(a) | | $22.40 |
| Class I: | | |
| Net Asset Value, offering price and redemption price per share ($198,692,030 ÷ 8,410,110 shares) | | $23.63 |
| Class Z: | | |
| Net Asset Value, offering price and redemption price per share ($16,966,763 ÷ 718,041 shares) | | $23.63 |
(a) Redemption price per share is equal to net asset value less any applicable contingent deferred sales charge.
See accompanying notes which are an integral part of the financial statements.
Statement of Operations
| | | Six months ended January 31, 2022 (Unaudited) |
| Investment Income | | |
| Dividends | | $4,300,331 |
| Income from Fidelity Central Funds (including $13,524 from security lending) | | 14,700 |
| Total income | | 4,315,031 |
| Expenses | | |
| Management fee | $1,281,841 | |
| Transfer agent fees | 559,573 | |
| Distribution and service plan fees | 550,168 | |
| Accounting fees | 95,172 | |
| Custodian fees and expenses | 8,172 | |
| Independent trustees' fees and expenses | 850 | |
| Registration fees | 53,171 | |
| Audit | 26,827 | |
| Legal | 802 | |
| Interest | 515 | |
| Miscellaneous | 1,345 | |
| Total expenses before reductions | 2,578,436 | |
| Expense reductions | (7,481) | |
| Total expenses after reductions | | 2,570,955 |
| Net investment income (loss) | | 1,744,076 |
| Realized and Unrealized Gain (Loss) | | |
| Net realized gain (loss) on: | | |
| Investment securities: | | |
| Unaffiliated issuers | 18,849,809 | |
| Total net realized gain (loss) | | 18,849,809 |
| Change in net unrealized appreciation (depreciation) on investment securities | | (19,880,961) |
| Net gain (loss) | | (1,031,152) |
| Net increase (decrease) in net assets resulting from operations | | $712,924 |
See accompanying notes which are an integral part of the financial statements.
Statement of Changes in Net Assets
| | Six months ended January 31, 2022 (Unaudited) | Year ended July 31, 2021 |
| Increase (Decrease) in Net Assets | | |
| Operations | | |
| Net investment income (loss) | $1,744,076 | $5,417,710 |
| Net realized gain (loss) | 18,849,809 | 17,595,635 |
| Change in net unrealized appreciation (depreciation) | (19,880,961) | 93,330,329 |
| Net increase (decrease) in net assets resulting from operations | 712,924 | 116,343,674 |
| Distributions to shareholders | (28,289,350) | (14,644,950) |
| Share transactions - net increase (decrease) | 20,846,420 | (39,011,402) |
| Total increase (decrease) in net assets | (6,730,006) | 62,687,322 |
| Net Assets | | |
| Beginning of period | 487,425,666 | 424,738,344 |
| End of period | $480,695,660 | $487,425,666 |
See accompanying notes which are an integral part of the financial statements.
Financial Highlights
Fidelity Advisor Real Estate Fund Class A
| | Six months ended (Unaudited) January 31, | Years endedJuly 31, | | | | |
| | 2022 | 2021 | 2020 | 2019 | 2018 | 2017 |
| Selected Per–Share Data | | | | | | |
| Net asset value, beginning of period | $24.66 | $19.62 | $22.91 | $22.07 | $22.96 | $25.93 |
| Income from Investment Operations | | | | | | |
| Net investment income (loss)A,B | .09 | .26 | .41 | .37 | .37 | .33 |
| Net realized and unrealized gain (loss) | .03C | 5.50 | (1.91) | 1.63 | .21 | (1.82) |
| Total from investment operations | .12 | 5.76 | (1.50) | 2.00 | .58 | (1.49) |
| Distributions from net investment income | (.17) | (.24) | (.38) | (.43) | (.36) | (.30) |
| Distributions from net realized gain | (1.30) | (.48) | (1.41) | (.73) | (1.11) | (1.18) |
| Total distributions | (1.46)D | (.72) | (1.79) | (1.16) | (1.47) | (1.48) |
| Net asset value, end of period | $23.32 | $24.66 | $19.62 | $22.91 | $22.07 | $22.96 |
| Total ReturnE,F,G | .24% | 30.38% | (7.21)% | 9.62% | 2.55% | (5.63)% |
| Ratios to Average Net AssetsB,H,I | | | | | | |
| Expenses before reductions | 1.07%J | 1.09% | 1.10% | 1.10% | 1.10% | 1.09% |
| Expenses net of fee waivers, if any | 1.07%J | 1.09% | 1.10% | 1.09% | 1.10% | 1.09% |
| Expenses net of all reductions | 1.07%J | 1.08% | 1.09% | 1.09% | 1.10% | 1.08% |
| Net investment income (loss) | .70%J | 1.24% | 1.93% | 1.68% | 1.70% | 1.42% |
| Supplemental Data | | | | | | |
| Net assets, end of period (000 omitted) | $136,861 | $138,134 | $115,736 | $151,536 | $161,570 | $249,442 |
| Portfolio turnover rateK | 49%J | 53% | 56% | 49% | 41% | 69% |
A Calculated based on average shares outstanding during the period.
B Net investment income (loss) is affected by the timing of the declaration of dividends by any underlying mutual funds or exchange-traded funds (ETFs). Net investment income (loss) of any such underlying funds is not included in the Fund's net investment income (loss) ratio.
C The amount shown for a share outstanding does not correspond with the aggregate net gain (loss) on investments for the period due to the timing of sales and repurchases of shares in relation to fluctuating market values of the investments of the Fund.
D Total distributions per share do not sum due to rounding.
E Total returns for periods of less than one year are not annualized.
F Total returns would have been lower if certain expenses had not been reduced during the applicable periods shown.
G Total returns do not include the effect of the sales charges.
H Fees and expenses of any underlying mutual funds or exchange-traded funds (ETFs) are not included in the Fund's expense ratio. The Fund indirectly bears its proportionate share of these expenses. For additional expense information related to investments in Fidelity Central Funds, please refer to the "Investments in Fidelity Central Funds" note found in the Notes to Financial Statements section of the most recent Annual or Semi-Annual report.
I Expense ratios reflect operating expenses of the class. Expenses before reductions do not reflect amounts reimbursed, waived, or reduced through arrangements with the investment adviser, brokerage services, or other offset arrangements, if applicable, and do not represent the amount paid by the class during periods when reimbursements, waivers or reductions occur.
J Annualized
K Amount does not include the portfolio activity of any underlying mutual funds or exchange-traded funds (ETFs).
See accompanying notes which are an integral part of the financial statements.
Fidelity Advisor Real Estate Fund Class M
| | Six months ended (Unaudited) January 31, | Years endedJuly 31, | | | | |
| | 2022 | 2021 | 2020 | 2019 | 2018 | 2017 |
| Selected Per–Share Data | | | | | | |
| Net asset value, beginning of period | $24.59 | $19.58 | $22.87 | $22.05 | $22.94 | $25.90 |
| Income from Investment Operations | | | | | | |
| Net investment income (loss)A,B | .06 | .21 | .36 | .32 | .32 | .27 |
| Net realized and unrealized gain (loss) | .04C | 5.49 | (1.90) | 1.62 | .21 | (1.81) |
| Total from investment operations | .10 | 5.70 | (1.54) | 1.94 | .53 | (1.54) |
| Distributions from net investment income | (.13) | (.22) | (.34) | (.39) | (.31) | (.24) |
| Distributions from net realized gain | (1.30) | (.48) | (1.41) | (.73) | (1.11) | (1.18) |
| Total distributions | (1.43) | (.69)D | (1.75) | (1.12) | (1.42) | (1.42) |
| Net asset value, end of period | $23.26 | $24.59 | $19.58 | $22.87 | $22.05 | $22.94 |
| Total ReturnE,F,G | .16% | 30.14% | (7.42)% | 9.35% | 2.34% | (5.83)% |
| Ratios to Average Net AssetsB,H,I | | | | | | |
| Expenses before reductions | 1.29%J | 1.31% | 1.31% | 1.32% | 1.33% | 1.33% |
| Expenses net of fee waivers, if any | 1.29%J | 1.31% | 1.31% | 1.31% | 1.33% | 1.33% |
| Expenses net of all reductions | 1.29%J | 1.30% | 1.30% | 1.31% | 1.32% | 1.32% |
| Net investment income (loss) | .48%J | 1.03% | 1.71% | 1.46% | 1.47% | 1.18% |
| Supplemental Data | | | | | | |
| Net assets, end of period (000 omitted) | $112,678 | $118,778 | $98,724 | $128,754 | $127,038 | $153,285 |
| Portfolio turnover rateK | 49%J | 53% | 56% | 49% | 41% | 69% |
A Calculated based on average shares outstanding during the period.
B Net investment income (loss) is affected by the timing of the declaration of dividends by any underlying mutual funds or exchange-traded funds (ETFs). Net investment income (loss) of any such underlying funds is not included in the Fund's net investment income (loss) ratio.
C The amount shown for a share outstanding does not correspond with the aggregate net gain (loss) on investments for the period due to the timing of sales and repurchases of shares in relation to fluctuating market values of the investments of the Fund.
D Total distributions per share do not sum due to rounding.
E Total returns for periods of less than one year are not annualized.
F Total returns would have been lower if certain expenses had not been reduced during the applicable periods shown.
G Total returns do not include the effect of the sales charges.
H Fees and expenses of any underlying mutual funds or exchange-traded funds (ETFs) are not included in the Fund's expense ratio. The Fund indirectly bears its proportionate share of these expenses. For additional expense information related to investments in Fidelity Central Funds, please refer to the "Investments in Fidelity Central Funds" note found in the Notes to Financial Statements section of the most recent Annual or Semi-Annual report.
I Expense ratios reflect operating expenses of the class. Expenses before reductions do not reflect amounts reimbursed, waived, or reduced through arrangements with the investment adviser, brokerage services, or other offset arrangements, if applicable, and do not represent the amount paid by the class during periods when reimbursements, waivers or reductions occur.
J Annualized
K Amount does not include the portfolio activity of any underlying mutual funds or exchange-traded funds (ETFs).
See accompanying notes which are an integral part of the financial statements.
Fidelity Advisor Real Estate Fund Class C
| | Six months ended (Unaudited) January 31, | Years endedJuly 31, | | | | |
| | 2022 | 2021 | 2020 | 2019 | 2018 | 2017 |
| Selected Per–Share Data | | | | | | |
| Net asset value, beginning of period | $23.74 | $18.97 | $22.26 | $21.54 | $22.46 | $25.43 |
| Income from Investment Operations | | | | | | |
| Net investment income (loss)A,B | (.01) | .09 | .23 | .19 | .20 | .15 |
| Net realized and unrealized gain (loss) | .05C | 5.30 | (1.85) | 1.58 | .20 | (1.78) |
| Total from investment operations | .04 | 5.39 | (1.62) | 1.77 | .40 | (1.63) |
| Distributions from net investment income | (.08) | (.15) | (.26) | (.32) | (.21) | (.16) |
| Distributions from net realized gain | (1.30) | (.48) | (1.41) | (.73) | (1.11) | (1.18) |
| Total distributions | (1.38) | (.62)D | (1.67) | (1.05) | (1.32) | (1.34) |
| Net asset value, end of period | $22.40 | $23.74 | $18.97 | $22.26 | $21.54 | $22.46 |
| Total ReturnE,F,G | (.10)% | 29.36% | (7.95)% | 8.72% | 1.77% | (6.34)% |
| Ratios to Average Net AssetsB,H,I | | | | | | |
| Expenses before reductions | 1.87%J | 1.88% | 1.89% | 1.88% | 1.88% | 1.86% |
| Expenses net of fee waivers, if any | 1.87%J | 1.88% | 1.89% | 1.88% | 1.88% | 1.86% |
| Expenses net of all reductions | 1.87%J | 1.87% | 1.88% | 1.88% | 1.87% | 1.86% |
| Net investment income (loss) | (.10)%J | .46% | 1.14% | .89% | .92% | .65% |
| Supplemental Data | | | | | | |
| Net assets, end of period (000 omitted) | $15,497 | $16,069 | $20,774 | $28,982 | $43,690 | $62,551 |
| Portfolio turnover rateK | 49%J | 53% | 56% | 49% | 41% | 69% |
A Calculated based on average shares outstanding during the period.
B Net investment income (loss) is affected by the timing of the declaration of dividends by any underlying mutual funds or exchange-traded funds (ETFs). Net investment income (loss) of any such underlying funds is not included in the Fund's net investment income (loss) ratio.
C The amount shown for a share outstanding does not correspond with the aggregate net gain (loss) on investments for the period due to the timing of sales and repurchases of shares in relation to fluctuating market values of the investments of the Fund.
D Total distributions per share do not sum due to rounding.
E Total returns for periods of less than one year are not annualized.
F Total returns would have been lower if certain expenses had not been reduced during the applicable periods shown.
G Total returns do not include the effect of the contingent deferred sales charge.
H Fees and expenses of any underlying mutual funds or exchange-traded funds (ETFs) are not included in the Fund's expense ratio. The Fund indirectly bears its proportionate share of these expenses. For additional expense information related to investments in Fidelity Central Funds, please refer to the "Investments in Fidelity Central Funds" note found in the Notes to Financial Statements section of the most recent Annual or Semi-Annual report.
I Expense ratios reflect operating expenses of the class. Expenses before reductions do not reflect amounts reimbursed, waived, or reduced through arrangements with the investment adviser, brokerage services, or other offset arrangements, if applicable, and do not represent the amount paid by the class during periods when reimbursements, waivers or reductions occur.
J Annualized
K Amount does not include the portfolio activity of any underlying mutual funds or exchange-traded funds (ETFs).
See accompanying notes which are an integral part of the financial statements.
Fidelity Advisor Real Estate Fund Class I
| | Six months ended (Unaudited) January 31, | Years endedJuly 31, | | | | |
| | 2022 | 2021 | 2020 | 2019 | 2018 | 2017 |
| Selected Per–Share Data | | | | | | |
| Net asset value, beginning of period | $24.96 | $19.84 | $23.15 | $22.28 | $23.17 | $26.15 |
| Income from Investment Operations | | | | | | |
| Net investment income (loss)A,B | .11 | .31 | .46 | .43 | .43 | .39 |
| Net realized and unrealized gain (loss) | .05C | 5.56 | (1.92) | 1.65 | .21 | (1.83) |
| Total from investment operations | .16 | 5.87 | (1.46) | 2.08 | .64 | (1.44) |
| Distributions from net investment income | (.19) | (.27) | (.44) | (.48) | (.42) | (.36) |
| Distributions from net realized gain | (1.30) | (.48) | (1.41) | (.73) | (1.11) | (1.18) |
| Total distributions | (1.49) | (.75) | (1.85) | (1.21) | (1.53) | (1.54) |
| Net asset value, end of period | $23.63 | $24.96 | $19.84 | $23.15 | $22.28 | $23.17 |
| Total ReturnD,E | .39% | 30.65% | (6.99)% | 9.93% | 2.84% | (5.36)% |
| Ratios to Average Net AssetsB,F,G | | | | | | |
| Expenses before reductions | .87%H | .88% | .86% | .81% | .82% | .82% |
| Expenses net of fee waivers, if any | .87%H | .87% | .86% | .81% | .82% | .82% |
| Expenses net of all reductions | .87%H | .87% | .85% | .81% | .81% | .81% |
| Net investment income (loss) | .90%H | 1.46% | 2.17% | 1.96% | 1.98% | 1.69% |
| Supplemental Data | | | | | | |
| Net assets, end of period (000 omitted) | $198,692 | $197,873 | $180,346 | $225,407 | $284,857 | $399,578 |
| Portfolio turnover rateI | 49%H | 53% | 56% | 49% | 41% | 69% |
A Calculated based on average shares outstanding during the period.
B Net investment income (loss) is affected by the timing of the declaration of dividends by any underlying mutual funds or exchange-traded funds (ETFs). Net investment income (loss) of any such underlying funds is not included in the Fund's net investment income (loss) ratio.
C The amount shown for a share outstanding does not correspond with the aggregate net gain (loss) on investments for the period due to the timing of sales and repurchases of shares in relation to fluctuating market values of the investments of the Fund.
D Total returns for periods of less than one year are not annualized.
E Total returns would have been lower if certain expenses had not been reduced during the applicable periods shown.
F Fees and expenses of any underlying mutual funds or exchange-traded funds (ETFs) are not included in the Fund's expense ratio. The Fund indirectly bears its proportionate share of these expenses. For additional expense information related to investments in Fidelity Central Funds, please refer to the "Investments in Fidelity Central Funds" note found in the Notes to Financial Statements section of the most recent Annual or Semi-Annual report.
G Expense ratios reflect operating expenses of the class. Expenses before reductions do not reflect amounts reimbursed, waived, or reduced through arrangements with the investment adviser, brokerage services, or other offset arrangements, if applicable, and do not represent the amount paid by the class during periods when reimbursements, waivers or reductions occur.
H Annualized
I Amount does not include the portfolio activity of any underlying mutual funds or exchange-traded funds (ETFs).
See accompanying notes which are an integral part of the financial statements.
Fidelity Advisor Real Estate Fund Class Z
| | Six months ended (Unaudited) January 31, | Years endedJuly 31, | | |
| | 2022 | 2021 | 2020 | 2019 A |
| Selected Per–Share Data | | | | |
| Net asset value, beginning of period | $24.97 | $19.85 | $23.16 | $21.91 |
| Income from Investment Operations | | | | |
| Net investment income (loss)B,C | .14 | .36 | .50 | .40 |
| Net realized and unrealized gain (loss) | .05D | 5.56 | (1.92) | 1.94 |
| Total from investment operations | .19 | 5.92 | (1.42) | 2.34 |
| Distributions from net investment income | (.23) | (.32) | (.48) | (.36) |
| Distributions from net realized gain | (1.30) | (.48) | (1.41) | (.73) |
| Total distributions | (1.53) | (.80) | (1.89) | (1.09) |
| Net asset value, end of period | $23.63 | $24.97 | $19.85 | $23.16 |
| Total ReturnE,F | .49% | 30.95% | (6.80)% | 11.22% |
| Ratios to Average Net AssetsC,G,H | | | | |
| Expenses before reductions | .64%I | .64% | .65% | .65%I |
| Expenses net of fee waivers, if any | .64%I | .64% | .65% | .64%I |
| Expenses net of all reductions | .64%I | .64% | .64% | .64%I |
| Net investment income (loss) | 1.13%I | 1.69% | 2.38% | 2.20%I |
| Supplemental Data | | | | |
| Net assets, end of period (000 omitted) | $16,967 | $16,573 | $9,157 | $6,634 |
| Portfolio turnover rateJ | 49%I | 53% | 56% | 49% |
A For the period October 2, 2018 (commencement of sale of shares) through July 31, 2019.
B Calculated based on average shares outstanding during the period.
C Net investment income (loss) is affected by the timing of the declaration of dividends by any underlying mutual funds or exchange-traded funds (ETFs). Net investment income (loss) of any such underlying funds is not included in the Fund's net investment income (loss) ratio.
D The amount shown for a share outstanding does not correspond with the aggregate net gain (loss) on investments for the period due to the timing of sales and repurchases of shares in relation to fluctuating market values of the investments of the Fund.
E Total returns for periods of less than one year are not annualized.
F Total returns would have been lower if certain expenses had not been reduced during the applicable periods shown.
G Fees and expenses of any underlying mutual funds or exchange-traded funds (ETFs) are not included in the Fund's expense ratio. The Fund indirectly bears its proportionate share of these expenses. For additional expense information related to investments in Fidelity Central Funds, please refer to the "Investments in Fidelity Central Funds" note found in the Notes to Financial Statements section of the most recent Annual or Semi-Annual report.
H Expense ratios reflect operating expenses of the class. Expenses before reductions do not reflect amounts reimbursed, waived, or reduced through arrangements with the investment adviser, brokerage services, or other offset arrangements, if applicable, and do not represent the amount paid by the class during periods when reimbursements, waivers or reductions occur.
I Annualized
J Amount does not include the portfolio activity of any underlying mutual funds or exchange-traded funds (ETFs).
See accompanying notes which are an integral part of the financial statements.
Notes to Financial Statements (Unaudited)
For the period ended January 31, 2022
1. Organization.
Fidelity Advisor Real Estate Fund (the Fund) is a non-diversified fund of Fidelity Advisor Series VII (the Trust) and is authorized to issue an unlimited number of shares. The Trust is registered under the Investment Company Act of 1940, as amended (the 1940 Act), as an open-end management investment company organized as a Massachusetts business trust. The Fund offers Class A, Class M, Class C, Class I and Class Z shares, each of which has equal rights as to assets and voting privileges. Each class has exclusive voting rights with respect to matters that affect that class. Class C shares will automatically convert to Class A shares after a holding period of eight years from the initial date of purchase, with certain exceptions.
2. Investments in Fidelity Central Funds.
Funds may invest in Fidelity Central Funds, which are open-end investment companies generally available only to other investment companies and accounts managed by the investment adviser and its affiliates. The Schedule of Investments lists any Fidelity Central Funds held as an investment as of period end, but does not include the underlying holdings of each Fidelity Central Fund. An investing fund indirectly bears its proportionate share of the expenses of the underlying Fidelity Central Funds.
Based on its investment objective, each Fidelity Central Fund may invest or participate in various investment vehicles or strategies that are similar to those of the investing fund. These strategies are consistent with the investment objectives of the investing fund and may involve certain economic risks which may cause a decline in value of each of the Fidelity Central Funds and thus a decline in the value of the investing fund.
| Fidelity Central Fund | Investment Manager | Investment Objective | Investment Practices | Expense Ratio(a) |
| Fidelity Money Market Central Funds | Fidelity Management & Research Company LLC (FMR) | Each fund seeks to obtain a high level of current income consistent with the preservation of capital and liquidity. | Short-term Investments | Less than .005% |
(a) Expenses expressed as a percentage of average net assets and are as of each underlying Central Fund's most recent annual or semi-annual shareholder report.
A complete unaudited list of holdings for each Fidelity Central Fund is available upon request or at the Securities and Exchange Commission website at www.sec.gov. In addition, the financial statements of the Fidelity Central Funds which contain the significant accounting policies (including investment valuation policies) of those funds, and are not covered by the Report of Independent Registered Public Accounting Firm, are available on the Securities and Exchange Commission website or upon request.
3. Significant Accounting Policies.
The Fund is an investment company and applies the accounting and reporting guidance of the Financial Accounting Standards Board (FASB) Accounting Standards Codification Topic 946 Financial Services - Investment Companies. The financial statements have been prepared in conformity with accounting principles generally accepted in the United States of America (GAAP), which require management to make certain estimates and assumptions at the date of the financial statements. Actual results could differ from those estimates. Subsequent events, if any, through the date that the financial statements were issued have been evaluated in the preparation of the financial statements. The Fund's Schedule of Investments lists any underlying mutual funds or exchange-traded funds (ETFs) but does not include the underlying holdings of these funds. The following summarizes the significant accounting policies of the Fund:
Investment Valuation. Investments are valued as of 4:00 p.m. Eastern time on the last calendar day of the period. The Board of Trustees (the Board) has delegated the day to day responsibility for the valuation of the Fund's investments to the Fair Value Committee (the Committee) established by the Fund's investment adviser. In accordance with valuation policies and procedures approved by the Board, the Fund attempts to obtain prices from one or more third party pricing vendors or brokers to value its investments. When current market prices, quotations or currency exchange rates are not readily available or reliable, investments will be fair valued in good faith by the Committee, in accordance with procedures adopted by the Board. Factors used in determining fair value vary by investment type and may include market or investment specific events. The frequency with which these procedures are used cannot be predicted and they may be utilized to a significant extent. The Committee oversees the Fund's valuation policies and procedures and reports to the Board on the Committee's activities and fair value determinations. The Board monitors the appropriateness of the procedures used in valuing the Fund's investments and ratifies the fair value determinations of the Committee.
The Fund categorizes the inputs to valuation techniques used to value its investments into a disclosure hierarchy consisting of three levels as shown below:
- Level 1 – Unadjusted quoted prices in active markets for identical investments
- Level 2 – other significant observable inputs (including quoted prices for similar investments, interest rates, prepayment speeds, etc.)
- Level 3 – unobservable inputs (including the Fund's own assumptions based on the best information available)
Valuation techniques used to value the Fund's investments by major category are as follows:
Equity securities, including restricted securities, for which market quotations are readily available, are valued at the last reported sale price or official closing price as reported by a third party pricing vendor on the primary market or exchange on which they are traded and are categorized as Level 1 in the hierarchy. In the event there were no sales during the day or closing prices are not available, securities are valued at the last quoted bid price or may be valued using the last available price and are generally categorized as Level 2 in the hierarchy. For foreign equity securities, when market or security specific events arise, comparisons to the valuation of American Depositary Receipts (ADRs), futures contracts, ETFs and certain indexes as well as quoted prices for similar securities may be used and would be categorized as Level 2 in the hierarchy. For equity securities, including restricted securities, where observable inputs are limited, assumptions about market activity and risk are used and these securities may be categorized as Level 3 in the hierarchy.
Investments in open-end mutual funds, including the Fidelity Central Funds, are valued at their closing net asset value (NAV) each business day and are categorized as Level 1 in the hierarchy.
Changes in valuation techniques may result in transfers in or out of an assigned level within the disclosure hierarchy. The aggregate value of investments by input level as of January 31, 2022 is included at the end of the Fund's Schedule of Investments.
Investment Transactions and Income. For financial reporting purposes, the Fund's investment holdings and NAV include trades executed through the end of the last business day of the period. The NAV per share for processing shareholder transactions is calculated as of the close of business of the New York Stock Exchange (NYSE), normally 4:00 p.m. Eastern time and includes trades executed through the end of the prior business day. Gains and losses on securities sold are determined on the basis of identified cost. Commissions paid to certain brokers with whom the investment adviser, or its affiliates, places trades on behalf of a fund include an amount in addition to trade execution, which may be rebated back to a fund. Any such rebates are included in net realized gain (loss) on investments in the Statement of Operations. Dividend income is recorded on the ex-dividend date, except for certain dividends from foreign securities where the ex-dividend date may have passed, which are recorded as soon as the Fund is informed of the ex-dividend date. Non-cash dividends included in dividend income, if any, are recorded at the fair market value of the securities received. Income and capital gain distributions from Fidelity Central Funds, if any, are recorded on the ex-dividend date. Certain distributions received by the Fund represent a return of capital or capital gain. The Fund determines the components of these distributions subsequent to the ex-dividend date, based upon receipt of tax filings or other correspondence relating to the underlying investment. These distributions are recorded as a reduction of cost of investments and/or as a realized gain.
Class Allocations and Expenses. Investment income, realized and unrealized capital gains and losses, common expenses of a fund, and certain fund-level expense reductions, if any, are allocated daily on a pro-rata basis to each class based on the relative net assets of each class to the total net assets of a fund. Each class differs with respect to transfer agent and distribution and service plan fees incurred, as applicable. Certain expense reductions may also differ by class, if applicable. For the reporting period, the allocated portion of income and expenses to each class as a percent of its average net assets may vary due to the timing of recording these transactions in relation to fluctuating net assets of the classes. Expenses directly attributable to a fund are charged to that fund. Expenses attributable to more than one fund are allocated among the respective funds on the basis of relative net assets or other appropriate methods. Expenses included in the accompanying financial statements reflect the expenses of that fund and do not include any expenses associated with any underlying mutual funds or exchange-traded funds. Although not included in a fund's expenses, a fund indirectly bears its proportionate share of these expenses through the net asset value of each underlying mutual fund or exchange-traded fund. Expense estimates are accrued in the period to which they relate and adjustments are made when actual amounts are known.
Deferred Trustee Compensation. Under a Deferred Compensation Plan (the Plan) for certain Funds, certain independent Trustees have elected to defer receipt of a portion of their annual compensation. Deferred amounts are invested in affiliated mutual funds, are marked-to-market and remain in a fund until distributed in accordance with the Plan. The investment of deferred amounts and the offsetting payable to the Trustees presented below are included in the accompanying Statement of Assets and Liabilities in other receivables and other payables and accrued expenses, as applicable.
| Fidelity Advisor Real Estate Fund | $101,767 |
Income Tax Information and Distributions to Shareholders. Each year, the Fund intends to qualify as a regulated investment company under Subchapter M of the Internal Revenue Code, including distributing substantially all of its taxable income and realized gains. As a result, no provision for U.S. Federal income taxes is required. The Fund files a U.S. federal tax return, in addition to state and local tax returns as required. The Fund's federal income tax returns are subject to examination by the Internal Revenue Service (IRS) for a period of three fiscal years after they are filed. State and local tax returns may be subject to examination for an additional fiscal year depending on the jurisdiction.
Distributions are declared and recorded on the ex-dividend date. Income and capital gain distributions are declared separately for each class. Income and capital gain distributions are determined in accordance with income tax regulations, which may differ from GAAP.
Capital accounts within the financial statements are adjusted for permanent book-tax differences. These adjustments have no impact on net assets or the results of operations. Capital accounts are not adjusted for temporary book-tax differences which will reverse in a subsequent period.
Book-tax differences are primarily due to foreign currency transactions, deferred Trustee compensation and losses deferred due to wash sales.
As of period end, the cost and unrealized appreciation (depreciation) in securities, and derivatives if applicable, for federal income tax purposes were as follows:
| Gross unrealized appreciation | $160,524,707 |
| Gross unrealized depreciation | (5,316,394) |
| Net unrealized appreciation (depreciation) | $155,208,313 |
| Tax cost | $330,256,207 |
Restricted Securities (including Private Placements). Funds may invest in securities that are subject to legal or contractual restrictions on resale. These securities generally may be resold in transactions exempt from registration or to the public if the securities are registered. Disposal of these securities may involve time-consuming negotiations and expense, and prompt sale at an acceptable price may be difficult. Information regarding restricted securities held at period end is included at the end of the Schedule of Investments, if applicable.
4. Purchases and Sales of Investments.
Purchases and sales of securities, other than short-term securities and in-kind transactions, as applicable, are noted in the table below.
| | Purchases ($) | Sales ($) |
| Fidelity Advisor Real Estate Fund | 119,479,674 | 122,448,555 |
5. Fees and Other Transactions with Affiliates.
Management Fee. Fidelity Management & Research Company LLC (the investment adviser) and its affiliates provide the Fund with investment management related services for which the Fund pays a monthly management fee. The management fee is the sum of an individual fund fee rate that is based on an annual rate of .30% of the Fund's average net assets and an annualized group fee rate that averaged .22% during the period. The group fee rate is based upon the monthly average net assets of a group of registered investment companies with which the investment adviser has management contracts. The group fee rate decreases as assets under management increase and increases as assets under management decrease. For the reporting period, the total annualized management fee rate was .52% of the Fund's average net assets.
Distribution and Service Plan Fees. In accordance with Rule 12b-1 of the 1940 Act, the Fund has adopted separate Distribution and Service Plans for each class of shares. Certain classes pay Fidelity Distributors Company LLC (FDC), an affiliate of the investment adviser, separate Distribution and Service Fees, each of which is based on an annual percentage of each class' average net assets. In addition, FDC may pay financial intermediaries for selling shares of the Fund and providing shareholder support services. For the period, the Distribution and Service Fee rates, total fees and amounts retained by FDC were as follows:
| | Distribution Fee | Service Fee | Total Fees | Retained by FDC |
| Class A | -% | .25% | $174,113 | $1,264 |
| Class M | .25% | .25% | 296,466 | – |
| Class C | .75% | .25% | 79,589 | 8,617 |
| | | | $550,168 | $9,881 |
Sales Load. FDC may receive a front-end sales charge of up to 5.75% for selling Class A shares and 3.50% for selling Class M shares, some of which is paid to financial intermediaries for selling shares of the Fund. Depending on the holding period, FDC may receive contingent deferred sales charges levied on Class A, Class M and Class C redemptions. The deferred sales charges are 1.00% for Class C shares, 1.00% for certain purchases of Class A shares and .25% for certain purchases of Class M shares.
For the period, sales charge amounts retained by FDC were as follows:
| | Retained by FDC |
| Class A | $14,647 |
| Class M | 1,871 |
| Class C(a) | 280 |
| | $16,798 |
(a) When Class C shares are initially sold, FDC pays commissions from its own resources to financial intermediaries through which the sales are made.
Transfer Agent Fees. Fidelity Investments Institutional Operations Company LLC (FIIOC), an affiliate of the investment adviser, is the transfer, dividend disbursing and shareholder servicing agent for each class of the Fund. FIIOC receives account fees and asset-based fees that vary according to the account size and type of account of the shareholders of the respective classes of the Fund, except for Class Z. FIIOC receives an asset-based fee of Class Z's average net assets. FIIOC pays for typesetting, printing and mailing of shareholder reports, except proxy statements.
For the period, transfer agent fees for each class were as follows:
| | Amount | % of Class-Level Average Net Assets(a) |
| Class A | $152,657 | .22 |
| Class M | 111,810 | .19 |
| Class C | 21,331 | .27 |
| Class I | 270,517 | .27 |
| Class Z | 3,258 | .04 |
| | $559,573 | |
(a) Annualized
Accounting Fees. Fidelity Service Company, Inc. (FSC), an affiliate of the investment adviser, maintains the Fund's accounting records. The accounting fee is based on the level of average net assets for each month. For the period, the fees were equivalent to the following annualized rates:
| | % of Average Net Assets |
| Fidelity Advisor Real Estate Fund | .04 |
Brokerage Commissions. A portion of portfolio transactions were placed with brokerage firms which are affiliates of the investment adviser. Brokerage commissions are included in net realized gain (loss) and change in net unrealized appreciation (depreciation) in the Statement of Operations. The commissions paid to these affiliated firms were as follows:
| | Amount |
| Fidelity Advisor Real Estate Fund | $1,369 |
Interfund Lending Program. Pursuant to an Exemptive Order issued by the Securities and Exchange Commission (the SEC), the Fund, along with other registered investment companies having management contracts with Fidelity Management & Research Company LLC (FMR), or other affiliated entities of FMR, may participate in an interfund lending program. This program provides an alternative credit facility allowing the Fund to borrow from, or lend money to, other participating affiliated funds. At period end, there were no interfund loans outstanding. Activity in this program during the period for which loans were outstanding was as follows:
| | Borrower or Lender | Average Loan Balance | Weighted Average Interest Rate | Interest Expense |
| Fidelity Advisor Real Estate Fund | Borrower | $14,493,750 | .32% | $515 |
Interfund Trades. Funds may purchase from or sell securities to other Fidelity Funds under procedures adopted by the Board. The procedures have been designed to ensure these interfund trades are executed in accordance with Rule 17a-7 of the 1940 Act. Any interfund trades are included within the respective purchases and sales amounts shown in the Purchases and Sales of Investments note. Interfund trades during the period are noted in the table below.
| | Purchases ($) | Sales ($) | Realized Gain (Loss) ($) |
| Fidelity Advisor Real Estate Fund | 6,171,586 | 9,169,226 | 735,910 |
6. Committed Line of Credit.
Certain Funds participate with other funds managed by the investment adviser or an affiliate in a $4.25 billion credit facility (the "line of credit") to be utilized for temporary or emergency purposes to fund shareholder redemptions or for other short-term liquidity purposes. The participating funds have agreed to pay commitment fees on their pro-rata portion of the line of credit, which are reflected in Miscellaneous expenses on the Statement of Operations, and are listed below. During the period, there were no borrowings on this line of credit.
| | Amount |
| Fidelity Advisor Real Estate Fund | $384 |
7. Security Lending.
Funds lend portfolio securities from time to time in order to earn additional income. Lending agents are used, including National Financial Services (NFS), an affiliate of the investment adviser. Pursuant to a securities lending agreement, NFS will receive a fee, which is capped at 9.9% of a fund's daily lending revenue, for its services as lending agent. A fund may lend securities to certain qualified borrowers, including NFS. On the settlement date of the loan, a fund receives collateral (in the form of U.S. Treasury obligations, letters of credit and/or cash) against the loaned securities and maintains collateral in an amount not less than 100% of the market value of the loaned securities during the period of the loan. The market value of the loaned securities is determined at the close of business of a fund and any additional required collateral is delivered to a fund on the next business day. A fund or borrower may terminate the loan at any time, and if the borrower defaults on its obligation to return the securities loaned because of insolvency or other reasons, a fund may apply collateral received from the borrower against the obligation. A fund may experience delays and costs in recovering the securities loaned. Any cash collateral received is invested in the Fidelity Securities Lending Cash Central Fund. Any loaned securities are identified as such in the Schedule of Investments, and the value of loaned securities and cash collateral at period end, as applicable, are presented in the Statement of Assets and Liabilities. Security lending income represents the income earned on investing cash collateral, less rebates paid to borrowers and any lending agent fees associated with the loan, plus any premium payments received for lending certain types of securities. Security lending income is presented in the Statement of Operations as a component of income from Fidelity Central Funds. Affiliated security lending activity, if any, was as follows:
| | Total Security Lending Fees Paid to NFS | Security Lending Income From Securities Loaned to NFS | Value of Securities Loaned to NFS at Period End |
| Fidelity Advisor Real Estate Fund | $1,462 | $– | $– |
8. Expense Reductions.
During the period the investment adviser or an affiliate reimbursed and/or waived a portion of fund-level operating expenses in the amount of $7,481.
9. Distributions to Shareholders.
Distributions to shareholders of each class were as follows:
| | Six months ended
January 31, 2022 | Year ended
July 31, 2021 |
| Fidelity Advisor Real Estate Fund | | |
| Distributions to shareholders | | |
| Class A | $7,993,208 | $3,943,668 |
| Class M | 6,745,913 | 3,401,100 |
| Class C | 908,708 | 608,843 |
| Class I | 11,703,981 | 6,121,163 |
| Class Z | 937,540 | 570,176 |
| Total | $28,289,350 | $14,644,950 |
10. Share Transactions.
Share transactions for each class were as follows and may contain in-kind transactions, automatic conversions between classes or exchanges between affiliated funds:
| | Shares | Shares | Dollars | Dollars |
| | Six months ended January 31, 2022 | Year ended July 31, 2021 | Six months ended January 31, 2022 | Year ended July 31, 2021 |
| Fidelity Advisor Real Estate Fund | | | | |
| Class A | | | | |
| Shares sold | 612,169 | 1,114,030 | $15,143,578 | $23,635,557 |
| Reinvestment of distributions | 322,393 | 201,989 | 7,866,493 | 3,878,210 |
| Shares redeemed | (668,984) | (1,613,289) | (16,484,541) | (33,263,379) |
| Net increase (decrease) | 265,578 | (297,270) | $6,525,530 | $(5,749,612) |
| Class M | | | | |
| Shares sold | 226,126 | 567,797 | $5,576,945 | $11,739,646 |
| Reinvestment of distributions | 276,620 | 176,839 | 6,729,626 | 3,389,165 |
| Shares redeemed | (489,133) | (955,077) | (11,935,987) | (19,872,105) |
| Net increase (decrease) | 13,613 | (210,441) | $370,584 | $(4,743,294) |
| Class C | | | | |
| Shares sold | 70,245 | 105,065 | $1,668,468 | $2,128,502 |
| Reinvestment of distributions | 38,746 | 32,588 | 908,210 | 604,904 |
| Shares redeemed | (93,842) | (555,809) | (2,226,064) | (11,351,257) |
| Net increase (decrease) | 15,149 | (418,156) | $350,614 | $(8,617,851) |
| Class I | | | | |
| Shares sold | 1,744,154 | 2,357,850 | $43,825,257 | $48,485,384 |
| Reinvestment of distributions | 440,622 | 299,336 | 10,890,582 | 5,816,838 |
| Shares redeemed | (1,702,326) | (3,820,307) | (42,528,687) | (78,503,211) |
| Net increase (decrease) | 482,450 | (1,163,121) | $12,187,152 | $(24,200,989) |
| Class Z | | | | |
| Shares sold | 191,559 | 717,966 | $4,830,061 | $14,541,293 |
| Reinvestment of distributions | 31,131 | 15,167 | 769,941 | 296,100 |
| Shares redeemed | (168,362) | (530,812) | (4,187,462) | (10,537,049) |
| Net increase (decrease) | 54,328 | 202,321 | $1,412,540 | $4,300,344 |
11. Other.
A fund's organizational documents provide former and current trustees and officers with a limited indemnification against liabilities arising in connection with the performance of their duties to the fund. In the normal course of business, a fund may also enter into contracts that provide general indemnifications. A fund's maximum exposure under these arrangements is unknown as this would be dependent on future claims that may be made against a fund. The risk of material loss from such claims is considered remote.
12. Coronavirus (COVID-19) Pandemic.
An outbreak of COVID-19 first detected in China during December 2019 has since spread globally and was declared a pandemic by the World Health Organization during March 2020. Developments that disrupt global economies and financial markets, such as the COVID-19 pandemic, may magnify factors that affect the Fund's performance.
Shareholder Expense Example
As a shareholder, you incur two types of costs: (1) transaction costs, which may include sales charges (loads) on purchase payments or redemption proceeds, as applicable and (2) ongoing costs, which generally include management fees, distribution and/or service (12b-1) fees and other Fund expenses. This Example is intended to help you understand your ongoing costs (in dollars) of investing in a fund and to compare these costs with the ongoing costs of investing in other mutual funds.
The Example is based on an investment of $1,000 invested at the beginning of the period and held for the entire period (August 1, 2021 to January 31, 2022).
Actual Expenses
The first line of the accompanying table provides information about actual account values and actual expenses. You may use the information in this line, together with the amount you invested, to estimate the expenses that you paid over the period. Simply divide your account value by $1,000.00 (for example, an $8,600 account value divided by $1,000.00 = 8.6), then multiply the result by the number in the first line for a class/Fund under the heading entitled "Expenses Paid During Period" to estimate the expenses you paid on your account during this period. If any fund is a shareholder of any underlying mutual funds or exchange-traded funds (ETFs) (the Underlying Funds), such fund indirectly bears its proportional share of the expenses of the Underlying Funds in addition to the direct expenses incurred presented in the table. These fees and expenses are not included in the annualized expense ratio used to calculate the expense estimate in the table below.
Hypothetical Example for Comparison Purposes
The second line of the accompanying table provides information about hypothetical account values and hypothetical expenses based on the actual expense ratio and an assumed rate of return of 5% per year before expenses, which is not the actual return. The hypothetical account values and expenses may not be used to estimate the actual ending account balance or expenses you paid for the period. You may use this information to compare the ongoing costs of investing in the Fund and other funds. To do so, compare this 5% hypothetical example with the 5% hypothetical examples that appear in the shareholder reports of the other funds. If any fund is a shareholder of any Underlying Funds, such fund indirectly bears its proportional share of the expenses of the Underlying Funds in addition to the direct expenses as presented in the table. These fees and expenses are not included in the annualized expense ratio used to calculate the expense estimate in the table below.
Please note that the expenses shown in the table are meant to highlight your ongoing costs only and do not reflect any transaction costs. Therefore, the second line of the table is useful in comparing ongoing costs only, and will not help you determine the relative total costs of owning different funds. In addition, if these transactional costs were included, your costs would have been higher.
| | Annualized Expense Ratio-A | Beginning
Account Value
August 1, 2021 | Ending
Account Value
January 31, 2022 | Expenses Paid
During Period-B
August 1, 2021
to January 31, 2022 |
| Fidelity Advisor Real Estate Fund | | | | |
| Class A | 1.07% | | | |
| Actual | | $1,000.00 | $1,002.40 | $5.40 |
| Hypothetical-C | | $1,000.00 | $1,019.81 | $5.45 |
| Class M | 1.29% | | | |
| Actual | | $1,000.00 | $1,001.60 | $6.51 |
| Hypothetical-C | | $1,000.00 | $1,018.70 | $6.56 |
| Class C | 1.87% | | | |
| Actual | | $1,000.00 | $999.00 | $9.42 |
| Hypothetical-C | | $1,000.00 | $1,015.78 | $9.50 |
| Class I | .87% | | | |
| Actual | | $1,000.00 | $1,003.90 | $4.39 |
| Hypothetical-C | | $1,000.00 | $1,020.82 | $4.43 |
| Class Z | .64% | | | |
| Actual | | $1,000.00 | $1,004.90 | $3.23 |
| Hypothetical-C | | $1,000.00 | $1,021.98 | $3.26 |
A Annualized expense ratio reflects expenses net of applicable fee waivers.
B Expenses are equal to the annualized expense ratio, multiplied by the average account value over the period, multiplied by 184/ 365 (to reflect the one-half year period). The fees and expenses of any Underlying Funds are not included in each annualized expense ratio.
C 5% return per year before expenses

ARE-SANN-0422
1.783109.120
Fidelity Advisor® Global Real Estate Fund
Semi-Annual Report
January 31, 2022
Contents
To view a fund's proxy voting guidelines and proxy voting record for the 12-month period ended June 30, visit http://www.fidelity.com/proxyvotingresults or visit the Securities and Exchange Commission's (SEC) web site at http://www.sec.gov.
You may also call 1-877-208-0098 to request a free copy of the proxy voting guidelines.
Standard & Poor's, S&P and S&P 500 are registered service marks of The McGraw-Hill Companies, Inc. and have been licensed for use by Fidelity Distributors Corporation.
Other third-party marks appearing herein are the property of their respective owners.
All other marks appearing herein are registered or unregistered trademarks or service marks of FMR LLC or an affiliated company. © 2022 FMR LLC. All rights reserved.
This report and the financial statements contained herein are submitted for the general information of the shareholders of the Fund. This report is not authorized for distribution to prospective investors in the Fund unless preceded or accompanied by an effective prospectus.
A fund files its complete schedule of portfolio holdings with the SEC for the first and third quarters of each fiscal year on Form N-PORT. Forms N-PORT are available on the SEC’s web site at http://www.sec.gov. A fund's Forms N-PORT may be reviewed and copied at the SEC’s Public Reference Room in Washington, DC. Information regarding the operation of the SEC's Public Reference Room may be obtained by calling 1-800-SEC-0330.
For a complete list of a fund's portfolio holdings, view the most recent holdings listing, semiannual report, or annual report on Fidelity's web site at http://www.fidelity.com, http://www.institutional.fidelity.com, or http://www.401k.com, as applicable.
NOT FDIC INSURED •MAY LOSE VALUE •NO BANK GUARANTEE
Neither the Fund nor Fidelity Distributors Corporation is a bank.
Note to Shareholders:
Early in 2020, the outbreak and spread of COVID-19 emerged as a public health emergency that had a major influence on financial markets, primarily based on its impact on the global economy and corporate earnings. On March 11, 2020, the World Health Organization declared the COVID-19 outbreak a pandemic, citing sustained risk of further global spread. The pandemic prompted a number of measures to limit the spread of COVID-19, including travel and border restrictions, quarantines, and restrictions on large gatherings. In turn, these resulted in lower consumer activity, diminished demand for a wide range of products and services, disruption in manufacturing and supply chains, and – given the wide variability in outcomes regarding the outbreak – significant market uncertainty and volatility. To help stem the turmoil, the U.S. government took unprecedented action – in concert with the U.S. Federal Reserve and central banks around the world – to help support consumers, businesses, and the broader economy, and to limit disruption to the financial system.
In general, the overall impact of the pandemic lessened in 2021, amid a resilient economy and widespread distribution of three COVID-19 vaccines granted emergency use authorization from the U.S. Food and Drug Administration (FDA) early in the year. Still, the situation remains dynamic, and the extent and duration of its influence on financial markets and the economy is highly uncertain, due in part to a recent spike in cases based on highly contagious variants of the coronavirus.
Extreme events such as the COVID-19 crisis are exogenous shocks that can have significant adverse effects on mutual funds and their investments. Although multiple asset classes may be affected by market disruption, the duration and impact may not be the same for all types of assets. Fidelity is committed to helping you stay informed amid news about COVID-19 and during increased market volatility, and we continue to take extra steps to be responsive to customer needs. We encourage you to visit us online, where we offer ongoing updates, commentary, and analysis on the markets and our funds.
Investment Summary (Unaudited)
Top Ten Stocks as of January 31, 2022
| | % of fund's net assets |
| Prologis (REIT), Inc. | 6.0 |
| Welltower, Inc. | 3.9 |
| Digital Realty Trust, Inc. | 3.6 |
| Duke Realty Corp. | 3.4 |
| Vonovia SE | 3.0 |
| Mitsui Fudosan Co. Ltd. | 3.0 |
| UDR, Inc. | 2.6 |
| Ventas, Inc. | 2.5 |
| Equity Lifestyle Properties, Inc. | 2.4 |
| Mitsubishi Estate Co. Ltd. | 2.4 |
| | 32.8 |
Top Five Countries as of January 31, 2022
| (excluding cash equivalents) | % of fund's net assets |
| United States of America | 57.7 |
| Japan | 9.4 |
| Canada | 4.3 |
| Germany | 4.2 |
| United Kingdom | 4.2 |
Top Five REIT Sectors as of January 31, 2022
| | % of fund's net assets |
| REITs - Diversified | 23.2 |
| REITs - Apartments | 11.1 |
| REITs - Health Care | 8.7 |
| REITs - Shopping Centers | 7.6 |
| REITs - Warehouse/Industrial | 6.7 |
Asset Allocation (% of fund's net assets)
| As of January 31, 2022* |
| | Stocks | 99.8% |
| | Short-Term Investments and Net Other Assets (Liabilities) | 0.2% |

* Foreign investments - 42.1%
Schedule of Investments January 31, 2022 (Unaudited)
Showing Percentage of Net Assets
| Common Stocks - 99.8% | | | |
| | | Shares | Value |
| Australia - 4.2% | | | |
| Abacus Property Group unit | | 37,539 | $91,740 |
| Arena (REIT) unit | | 27,639 | 92,126 |
| Charter Hall Retail REIT | | 21,842 | 62,325 |
| National Storage REIT unit | | 50,397 | 88,349 |
|
| TOTAL AUSTRALIA | | | 334,540 |
|
| Bailiwick of Guernsey - 1.7% | | | |
| Sirius Real Estate Ltd. | | 75,666 | 132,257 |
| Canada - 4.3% | | | |
| Boardwalk (REIT) | | 3,516 | 154,730 |
| Dream Industrial (REIT) | | 9,614 | 119,272 |
| Flagship Communities (REIT) | | 3,650 | 67,343 |
|
| TOTAL CANADA | | | 341,345 |
|
| Cayman Islands - 0.6% | | | |
| ESR Cayman Ltd. (a)(b) | | 15,268 | 51,769 |
| France - 3.5% | | | |
| ARGAN SA | | 773 | 97,428 |
| Covivio | | 738 | 61,629 |
| Gecina SA | | 902 | 122,394 |
|
| TOTAL FRANCE | | | 281,451 |
|
| Germany - 4.2% | | | |
| Instone Real Estate Group BV (b) | | 5,721 | 101,803 |
| Vonovia SE | | 4,184 | 238,303 |
|
| TOTAL GERMANY | | | 340,106 |
|
| Hong Kong - 1.5% | | | |
| Hysan Development Co. Ltd. | | 16,592 | 50,931 |
| Link (REIT) | | 7,867 | 67,542 |
|
| TOTAL HONG KONG | | | 118,473 |
|
| Ireland - 2.2% | | | |
| Hibernia (REIT) PLC | | 121,824 | 174,006 |
| Italy - 0.6% | | | |
| COIMA RES SpA (b) | | 5,963 | 48,782 |
| Japan - 9.4% | | | |
| Activia Properties, Inc. | | 9 | 30,464 |
| Advance Residence Investment Corp. | | 15 | 44,224 |
| Kenedix Residential Investment Corp. | | 43 | 74,961 |
| LaSalle Logiport REIT | | 61 | 97,581 |
| Mitsubishi Estate Co. Ltd. | | 13,467 | 193,957 |
| Mitsui Fudosan Co. Ltd. | | 10,998 | 235,768 |
| Mitsui Fudosan Logistics Park, Inc. (c) | | 12 | 59,102 |
| SRE Holdings Corp. (a) | | 472 | 18,304 |
|
| TOTAL JAPAN | | | 754,361 |
|
| Luxembourg - 1.2% | | | |
| Aroundtown SA | | 15,620 | 96,477 |
| Singapore - 3.2% | | | |
| CapitaMall Trust | | 65,769 | 94,819 |
| Mapletree Commercial Trust | | 33,177 | 44,408 |
| UOL Group Ltd. | | 21,591 | 117,087 |
|
| TOTAL SINGAPORE | | | 256,314 |
|
| Sweden - 1.3% | | | |
| Catena AB | | 1,149 | 65,222 |
| KlaraBo Sverige AB | | 8,120 | 37,882 |
|
| TOTAL SWEDEN | | | 103,104 |
|
| United Kingdom - 4.2% | | | |
| Assura PLC | | 74,213 | 67,124 |
| Grainger Trust PLC | | 32,419 | 132,025 |
| Life Science (REIT) PLC | | 20,584 | 28,504 |
| Segro PLC | | 3,183 | 56,116 |
| Shaftesbury PLC | | 6,637 | 55,728 |
|
| TOTAL UNITED KINGDOM | | | 339,497 |
|
| United States of America - 57.7% | | | |
| American Assets Trust, Inc. | | 1,352 | 48,631 |
| American Homes 4 Rent Class A | | 2,709 | 106,003 |
| Apartment Income (REIT) Corp. | | 1,690 | 89,266 |
| Crown Castle International Corp. | | 808 | 147,468 |
| CubeSmart | | 2,885 | 146,385 |
| DiamondRock Hospitality Co. (a) | | 5,579 | 52,164 |
| Digital Realty Trust, Inc. | | 1,941 | 289,655 |
| Duke Realty Corp. | | 4,647 | 268,504 |
| Equinix, Inc. | | 165 | 119,609 |
| Equity Lifestyle Properties, Inc. | | 2,482 | 194,316 |
| Extra Space Storage, Inc. | | 910 | 180,353 |
| Gaming & Leisure Properties | | 3,063 | 138,386 |
| Healthcare Trust of America, Inc. | | 656 | 21,353 |
| Highwoods Properties, Inc. (SBI) | | 1,008 | 43,465 |
| Host Hotels & Resorts, Inc. (a) | | 5,993 | 103,919 |
| Invitation Homes, Inc. | | 3,024 | 126,948 |
| Kimco Realty Corp. | | 4,511 | 109,437 |
| LXP Industrial Trust (REIT) | | 3,164 | 47,112 |
| Medical Properties Trust, Inc. | | 4,293 | 97,709 |
| Mid-America Apartment Communities, Inc. | | 865 | 178,778 |
| National Retail Properties, Inc. | | 2,403 | 106,645 |
| Phillips Edison & Co., Inc. | | 1,159 | 36,532 |
| Piedmont Office Realty Trust, Inc. Class A | | 1,552 | 27,564 |
| Prologis (REIT), Inc. | | 3,062 | 480,182 |
| Realty Income Corp. | | 1,509 | 104,740 |
| Regency Centers Corp. | | 1,384 | 99,302 |
| RLJ Lodging Trust | | 3,338 | 46,231 |
| Ryman Hospitality Properties, Inc. (a) | | 422 | 37,305 |
| Spirit Realty Capital, Inc. | | 1,735 | 82,343 |
| Sun Communities, Inc. | | 788 | 148,900 |
| UDR, Inc. | | 3,707 | 210,706 |
| Urban Edge Properties | | 1,348 | 24,588 |
| Ventas, Inc. | | 3,776 | 200,204 |
| Veris Residential, Inc. (a) | | 2,050 | 33,825 |
| VICI Properties, Inc. | | 3,898 | 111,561 |
| Washington REIT (SBI) | | 2,154 | 53,031 |
| Welltower, Inc. | | 3,584 | 310,482 |
|
| TOTAL UNITED STATES OF AMERICA | | | 4,623,602 |
|
| TOTAL COMMON STOCKS | | | |
| (Cost $6,688,742) | | | 7,996,084 |
|
| Money Market Funds - 0.6% | | | |
| Fidelity Cash Central Fund 0.08% (d) | | | |
| (Cost $46,684) | | 46,674 | 46,684 |
| TOTAL INVESTMENT IN SECURITIES - 100.4% | | | |
| (Cost $6,735,426) | | | 8,042,768 |
| NET OTHER ASSETS (LIABILITIES) - (0.4)% | | | (28,806) |
| NET ASSETS - 100% | | | $8,013,962 |
Categorizations in the Schedule of Investments are based on country or territory of incorporation.
Legend
(a) Non-income producing
(b) Security exempt from registration under Rule 144A of the Securities Act of 1933. These securities may be resold in transactions exempt from registration, normally to qualified institutional buyers. At the end of the period, the value of these securities amounted to $202,354 or 2.5% of net assets.
(c) Security or a portion of the security purchased on a delayed delivery or when-issued basis.
(d) Affiliated fund that is generally available only to investment companies and other accounts managed by Fidelity Investments. The rate quoted is the annualized seven-day yield of the fund at period end. A complete unaudited listing of the fund's holdings as of its most recent quarter end is available upon request. In addition, each Fidelity Central Fund's financial statements are available on the SEC's website or upon request.
Affiliated Central Funds
Fiscal year to date information regarding the Fund's investments in Fidelity Central Funds, including the ownership percentage, is presented below.
| Fund | Value, beginning of period | Purchases | Sales Proceeds | Dividend Income | Realized Gain/Loss | Change in Unrealized appreciation (depreciation) | Value, end of period | % ownership, end of period |
| Fidelity Cash Central Fund 0.08% | $64,844 | $1,345,618 | $1,363,778 | $17 | $-- | $-- | $46,684 | 0.0% |
| Total | $64,844 | $1,345,618 | $1,363,778 | $17 | $-- | $-- | $46,684 | |
Amounts in the income column in the above table include any capital gain distributions from underlying funds, which are presented in the corresponding line-item in the Statement of Operations, if applicable.
Investment Valuation
The following is a summary of the inputs used, as of January 31, 2022, involving the Fund's assets and liabilities carried at fair value. The inputs or methodology used for valuing securities may not be an indication of the risk associated with investing in those securities. For more information on valuation inputs, and their aggregation into the levels used below, please refer to the Investment Valuation section in the accompanying Notes to Financial Statements.
| | Valuation Inputs at Reporting Date: |
| Description | Total | Level 1 | Level 2 | Level 3 |
| Investments in Securities: | | | | |
| Equities: | | | | |
| Real Estate | $7,996,084 | $4,964,947 | $3,031,137 | $-- |
| Money Market Funds | 46,684 | 46,684 | -- | -- |
| Total Investments in Securities: | $8,042,768 | $5,011,631 | $3,031,137 | $-- |
See accompanying notes which are an integral part of the financial statements.
Financial Statements
Statement of Assets and Liabilities
| | | January 31, 2022 (Unaudited) |
| Assets | | |
Investment in securities, at value — See accompanying schedule:
Unaffiliated issuers (cost $6,688,742) | $7,996,084 | |
| Fidelity Central Funds (cost $46,684) | 46,684 | |
| Total Investment in Securities (cost $6,735,426) | | $8,042,768 |
| Receivable for fund shares sold | | 6,011 |
| Dividends receivable | | 15,135 |
| Distributions receivable from Fidelity Central Funds | | 4 |
| Prepaid expenses | | 16 |
| Receivable from investment adviser for expense reductions | | 8,171 |
| Other receivables | | 16 |
| Total assets | | 8,072,121 |
| Liabilities | | |
| Audit fee | $31,017 | |
| Custody fee | 7,469 | |
| Payable for investments purchased | | |
| Regular delivery | 2,601 | |
| Delayed delivery | 9,475 | |
| Payable for fund shares redeemed | 177 | |
| Accrued management fee | 4,461 | |
| Distribution and service plan fees payable | 1,394 | |
| Other affiliated payables | 1,325 | |
| Other payables and accrued expenses | 240 | |
| Total liabilities | | 58,159 |
| Net Assets | | $8,013,962 |
| Net Assets consist of: | | |
| Paid in capital | | $6,859,957 |
| Total accumulated earnings (loss) | | 1,154,005 |
| Net Assets | | $8,013,962 |
| Net Asset Value and Maximum Offering Price | | |
| Class A: | | |
| Net Asset Value and redemption price per share ($3,454,835 ÷ 282,597 shares)(a) | | $12.23 |
| Maximum offering price per share (100/94.25 of $12.23) | | $12.98 |
| Class M: | | |
| Net Asset Value and redemption price per share ($1,139,889 ÷ 93,368 shares)(a) | | $12.21 |
| Maximum offering price per share (100/96.50 of $12.21) | | $12.65 |
| Class C: | | |
| Net Asset Value and offering price per share ($241,643 ÷ 19,722 shares)(a) | | $12.25 |
| Class I: | | |
| Net Asset Value, offering price and redemption price per share ($1,618,979 ÷ 132,247 shares) | | $12.24 |
| Class Z: | | |
| Net Asset Value, offering price and redemption price per share ($1,558,616 ÷ 126,702 shares) | | $12.30 |
(a) Redemption price per share is equal to net asset value less any applicable contingent deferred sales charge.
See accompanying notes which are an integral part of the financial statements.
Statement of Operations
| | | Six months ended January 31, 2022 (Unaudited) |
| Investment Income | | |
| Dividends | | $90,092 |
| Income from Fidelity Central Funds | | 17 |
| Income before foreign taxes withheld | | 90,109 |
| Less foreign taxes withheld | | (3,904) |
| Total income | | 86,205 |
| Expenses | | |
| Management fee | $24,656 | |
| Transfer agent fees | 6,105 | |
| Distribution and service plan fees | 7,647 | |
| Accounting fees and expenses | 1,423 | |
| Custodian fees and expenses | 13,034 | |
| Independent trustees' fees and expenses | 12 | |
| Registration fees | 27,014 | |
| Audit | 32,892 | |
| Legal | 4 | |
| Miscellaneous | 105 | |
| Total expenses before reductions | 112,892 | |
| Expense reductions | (68,012) | |
| Total expenses after reductions | | 44,880 |
| Net investment income (loss) | | 41,325 |
| Realized and Unrealized Gain (Loss) | | |
| Net realized gain (loss) on: | | |
| Investment securities: | | |
| Unaffiliated issuers | 63,061 | |
| Foreign currency transactions | (214) | |
| Total net realized gain (loss) | | 62,847 |
| Change in net unrealized appreciation (depreciation) on: | | |
| Investment securities: | | |
| Unaffiliated issuers | (186,733) | |
| Assets and liabilities in foreign currencies | (66) | |
| Total change in net unrealized appreciation (depreciation) | | (186,799) |
| Net gain (loss) | | (123,952) |
| Net increase (decrease) in net assets resulting from operations | | $(82,627) |
See accompanying notes which are an integral part of the financial statements.
Statement of Changes in Net Assets
| | Six months ended January 31, 2022 (Unaudited) | Year ended July 31, 2021 |
| Increase (Decrease) in Net Assets | | |
| Operations | | |
| Net investment income (loss) | $41,325 | $81,471 |
| Net realized gain (loss) | 62,847 | 134,898 |
| Change in net unrealized appreciation (depreciation) | (186,799) | 1,192,884 |
| Net increase (decrease) in net assets resulting from operations | (82,627) | 1,409,253 |
| Distributions to shareholders | (92,097) | (55,566) |
| Share transactions - net increase (decrease) | 1,679,939 | 1,280,270 |
| Total increase (decrease) in net assets | 1,505,215 | 2,633,957 |
| Net Assets | | |
| Beginning of period | 6,508,747 | 3,874,790 |
| End of period | $8,013,962 | $6,508,747 |
See accompanying notes which are an integral part of the financial statements.
Financial Highlights
Fidelity Advisor Global Real Estate Fund Class A
| | Six months ended (Unaudited) January 31, | Years endedJuly 31, | | | | |
| | 2022 | 2021 | 2020 | 2019 | 2018 | 2017 A |
| Selected Per–Share Data | | | | | | |
| Net asset value, beginning of period | $12.49 | $9.69 | $10.72 | $10.13 | $9.81 | $10.00 |
| Income from Investment Operations | | | | | | |
| Net investment income (loss)B,C | .07 | .17 | .15 | .22 | .18 | .15 |
| Net realized and unrealized gain (loss) | (.18) | 2.76 | (.58) | .58 | .42 | (.26) |
| Total from investment operations | (.11) | 2.93 | (.43) | .80 | .60 | (.11) |
| Distributions from net investment income | (.15) | (.13) | (.23) | (.15) | (.13) | (.07) |
| Distributions from net realized gain | – | – | (.37) | (.06) | (.14) | (.01) |
| Total distributions | (.15) | (.13) | (.60) | (.21) | (.28)D | (.08) |
| Net asset value, end of period | $12.23 | $12.49 | $9.69 | $10.72 | $10.13 | $9.81 |
| Total ReturnE,F,G | (.89)% | 30.59% | (4.61)% | 8.25% | 6.16% | (1.00)% |
| Ratios to Average Net AssetsC,H,I | | | | | | |
| Expenses before reductions | 3.19%J | 4.19% | 4.22% | 4.56% | 5.86% | 8.94%J |
| Expenses net of fee waivers, if any | 1.30%J | 1.38% | 1.40% | 1.40% | 1.40% | 1.40%J |
| Expenses net of all reductions | 1.30%J | 1.37% | 1.39% | 1.39% | 1.38% | 1.39%J |
| Net investment income (loss) | 1.06%J | 1.60% | 1.47% | 2.09% | 1.80% | 1.65%J |
| Supplemental Data | | | | | | |
| Net assets, end of period (000 omitted) | $3,455 | $2,747 | $1,732 | $3,290 | $1,001 | $657 |
| Portfolio turnover rateK | 29%J | 32% | 52% | 60% | 46% | 59%J |
A For the period August 11, 2016 (commencement of operations) through July 31, 2017.
B Calculated based on average shares outstanding during the period.
C Net investment income (loss) is affected by the timing of the declaration of dividends by any underlying mutual funds or exchange-traded funds (ETFs). Net investment income (loss) of any such underlying funds is not included in the Fund's net investment income (loss) ratio.
D Total distributions per share do not sum due to rounding.
E Total returns for periods of less than one year are not annualized.
F Total returns would have been lower if certain expenses had not been reduced during the applicable periods shown.
G Total returns do not include the effect of the sales charges.
H Fees and expenses of any underlying mutual funds or exchange-traded funds (ETFs) are not included in the Fund's expense ratio. The Fund indirectly bears its proportionate share of these expenses. For additional expense information related to investments in Fidelity Central Funds, please refer to the "Investments in Fidelity Central Funds" note found in the Notes to Financial Statements section of the most recent Annual or Semi-Annual report.
I Expense ratios reflect operating expenses of the class. Expenses before reductions do not reflect amounts reimbursed, waived, or reduced through arrangements with the investment adviser, brokerage services, or other offset arrangements, if applicable, and do not represent the amount paid by the class during periods when reimbursements, waivers or reductions occur.
J Annualized
K Amount does not include the portfolio activity of any underlying mutual funds or exchange-traded funds (ETFs).
See accompanying notes which are an integral part of the financial statements.
Fidelity Advisor Global Real Estate Fund Class M
| | Six months ended (Unaudited) January 31, | Years endedJuly 31, | | | | |
| | 2022 | 2021 | 2020 | 2019 | 2018 | 2017 A |
| Selected Per–Share Data | | | | | | |
| Net asset value, beginning of period | $12.46 | $9.67 | $10.71 | $10.11 | $9.79 | $10.00 |
| Income from Investment Operations | | | | | | |
| Net investment income (loss)B,C | .05 | .14 | .12 | .19 | .15 | .13 |
| Net realized and unrealized gain (loss) | (.17) | 2.76 | (.58) | .60 | .42 | (.27) |
| Total from investment operations | (.12) | 2.90 | (.46) | .79 | .57 | (.14) |
| Distributions from net investment income | (.13) | (.11) | (.21) | (.13) | (.11) | (.06) |
| Distributions from net realized gain | – | – | (.37) | (.06) | (.14) | (.01) |
| Total distributions | (.13) | (.11) | (.58) | (.19) | (.25) | (.07) |
| Net asset value, end of period | $12.21 | $12.46 | $9.67 | $10.71 | $10.11 | $9.79 |
| Total ReturnD,E,F | (1.00)% | 30.20% | (4.87)% | 8.06% | 5.90% | (1.30)% |
| Ratios to Average Net AssetsC,G,H | | | | | | |
| Expenses before reductions | 3.37%I | 4.41% | 4.46% | 4.79% | 5.90% | 9.20%I |
| Expenses net of fee waivers, if any | 1.55%I | 1.63% | 1.66% | 1.65% | 1.65% | 1.65%I |
| Expenses net of all reductions | 1.55%I | 1.62% | 1.64% | 1.64% | 1.63% | 1.64%I |
| Net investment income (loss) | .81%I | 1.35% | 1.22% | 1.84% | 1.54% | 1.40%I |
| Supplemental Data | | | | | | |
| Net assets, end of period (000 omitted) | $1,140 | $876 | $658 | $810 | $570 | $550 |
| Portfolio turnover rateJ | 29%I | 32% | 52% | 60% | 46% | 59%I |
A For the period August 11, 2016 (commencement of operations) through July 31, 2017.
B Calculated based on average shares outstanding during the period.
C Net investment income (loss) is affected by the timing of the declaration of dividends by any underlying mutual funds or exchange-traded funds (ETFs). Net investment income (loss) of any such underlying funds is not included in the Fund's net investment income (loss) ratio.
D Total returns for periods of less than one year are not annualized.
E Total returns would have been lower if certain expenses had not been reduced during the applicable periods shown.
F Total returns do not include the effect of the sales charges.
G Fees and expenses of any underlying mutual funds or exchange-traded funds (ETFs) are not included in the Fund's expense ratio. The Fund indirectly bears its proportionate share of these expenses. For additional expense information related to investments in Fidelity Central Funds, please refer to the "Investments in Fidelity Central Funds" note found in the Notes to Financial Statements section of the most recent Annual or Semi-Annual report.
H Expense ratios reflect operating expenses of the class. Expenses before reductions do not reflect amounts reimbursed, waived, or reduced through arrangements with the investment adviser, brokerage services, or other offset arrangements, if applicable, and do not represent the amount paid by the class during periods when reimbursements, waivers or reductions occur.
I Annualized
J Amount does not include the portfolio activity of any underlying mutual funds or exchange-traded funds (ETFs).
See accompanying notes which are an integral part of the financial statements.
Fidelity Advisor Global Real Estate Fund Class C
| | Six months ended (Unaudited) January 31, | Years endedJuly 31, | | | | |
| | 2022 | 2021 | 2020 | 2019 | 2018 | 2017 A |
| Selected Per–Share Data | | | | | | |
| Net asset value, beginning of period | $12.47 | $9.63 | $10.63 | $10.08 | $9.76 | $10.00 |
| Income from Investment Operations | | | | | | |
| Net investment income (loss)B,C | .02 | .09 | .07 | .14 | .10 | .08 |
| Net realized and unrealized gain (loss) | (.18) | 2.75 | (.58) | .59 | .42 | (.26) |
| Total from investment operations | (.16) | 2.84 | (.51) | .73 | .52 | (.18) |
| Distributions from net investment income | (.06) | – | (.12) | (.12) | (.06) | (.05) |
| Distributions from net realized gain | – | – | (.37) | (.06) | (.14) | (.01) |
| Total distributions | (.06) | – | (.49) | (.18) | (.20) | (.06) |
| Net asset value, end of period | $12.25 | $12.47 | $9.63 | $10.63 | $10.08 | $9.76 |
| Total ReturnD,E,F | (1.26)% | 29.49% | (5.31)% | 7.52% | 5.38% | (1.77)% |
| Ratios to Average Net AssetsC,G,H | | | | | | |
| Expenses before reductions | 4.03%I | 5.02% | 4.46% | 5.04% | 6.26% | 9.75%I |
| Expenses net of fee waivers, if any | 2.05%I | 2.14% | 2.16% | 2.15% | 2.15% | 2.15%I |
| Expenses net of all reductions | 2.05%I | 2.13% | 2.15% | 2.14% | 2.13% | 2.14%I |
| Net investment income (loss) | .31%I | .85% | .71% | 1.34% | 1.04% | .90%I |
| Supplemental Data | | | | | | |
| Net assets, end of period (000 omitted) | $242 | $223 | $185 | $1,060 | $614 | $737 |
| Portfolio turnover rateJ | 29%I | 32% | 52% | 60% | 46% | 59%I |
A For the period August 11, 2016 (commencement of operations) through July 31, 2017.
B Calculated based on average shares outstanding during the period.
C Net investment income (loss) is affected by the timing of the declaration of dividends by any underlying mutual funds or exchange-traded funds (ETFs). Net investment income (loss) of any such underlying funds is not included in the Fund's net investment income (loss) ratio.
D Total returns for periods of less than one year are not annualized.
E Total returns would have been lower if certain expenses had not been reduced during the applicable periods shown.
F Total returns do not include the effect of the contingent deferred sales charge.
G Fees and expenses of any underlying mutual funds or exchange-traded funds (ETFs) are not included in the Fund's expense ratio. The Fund indirectly bears its proportionate share of these expenses. For additional expense information related to investments in Fidelity Central Funds, please refer to the "Investments in Fidelity Central Funds" note found in the Notes to Financial Statements section of the most recent Annual or Semi-Annual report.
H Expense ratios reflect operating expenses of the class. Expenses before reductions do not reflect amounts reimbursed, waived, or reduced through arrangements with the investment adviser, brokerage services, or other offset arrangements, if applicable, and do not represent the amount paid by the class during periods when reimbursements, waivers or reductions occur.
I Annualized
J Amount does not include the portfolio activity of any underlying mutual funds or exchange-traded funds (ETFs).
See accompanying notes which are an integral part of the financial statements.
Fidelity Advisor Global Real Estate Fund Class I
| | Six months ended (Unaudited) January 31, | Years endedJuly 31, | | | | |
| | 2022 | 2021 | 2020 | 2019 | 2018 | 2017 A |
| Selected Per–Share Data | | | | | | |
| Net asset value, beginning of period | $12.51 | $9.71 | $10.75 | $10.15 | $9.82 | $10.00 |
| Income from Investment Operations | | | | | | |
| Net investment income (loss)B,C | .08 | .20 | .17 | .24 | .20 | .17 |
| Net realized and unrealized gain (loss) | (.17) | 2.76 | (.58) | .59 | .43 | (.26) |
| Total from investment operations | (.09) | 2.96 | (.41) | .83 | .63 | (.09) |
| Distributions from net investment income | (.18) | (.16) | (.26) | (.17) | (.16) | (.08) |
| Distributions from net realized gain | – | – | (.37) | (.06) | (.14) | (.01) |
| Total distributions | (.18) | (.16) | (.63) | (.23) | (.30) | (.09) |
| Net asset value, end of period | $12.24 | $12.51 | $9.71 | $10.75 | $10.15 | $9.82 |
| Total ReturnD,E | (.77)% | 30.82% | (4.40)% | 8.55% | 6.48% | (.80)% |
| Ratios to Average Net AssetsC,F,G | | | | | | |
| Expenses before reductions | 2.88%H | 3.81% | 3.97% | 4.20% | 5.41% | 8.74%H |
| Expenses net of fee waivers, if any | 1.05%H | 1.13% | 1.16% | 1.15% | 1.15% | 1.15%H |
| Expenses net of all reductions | 1.05%H | 1.12% | 1.14% | 1.14% | 1.13% | 1.14%H |
| Net investment income (loss) | 1.31%H | 1.85% | 1.71% | 2.34% | 2.04% | 1.90%H |
| Supplemental Data | | | | | | |
| Net assets, end of period (000 omitted) | $1,619 | $1,483 | $1,066 | $1,056 | $986 | $863 |
| Portfolio turnover rateI | 29%H | 32% | 52% | 60% | 46% | 59%H |
A For the period August 11, 2016 (commencement of operations) through July 31, 2017.
B Calculated based on average shares outstanding during the period.
C Net investment income (loss) is affected by the timing of the declaration of dividends by any underlying mutual funds or exchange-traded funds (ETFs). Net investment income (loss) of any such underlying funds is not included in the Fund's net investment income (loss) ratio.
D Total returns for periods of less than one year are not annualized.
E Total returns would have been lower if certain expenses had not been reduced during the applicable periods shown.
F Fees and expenses of any underlying mutual funds or exchange-traded funds (ETFs) are not included in the Fund's expense ratio. The Fund indirectly bears its proportionate share of these expenses. For additional expense information related to investments in Fidelity Central Funds, please refer to the "Investments in Fidelity Central Funds" note found in the Notes to Financial Statements section of the most recent Annual or Semi-Annual report.
G Expense ratios reflect operating expenses of the class. Expenses before reductions do not reflect amounts reimbursed, waived, or reduced through arrangements with the investment adviser, brokerage services, or other offset arrangements, if applicable, and do not represent the amount paid by the class during periods when reimbursements, waivers or reductions occur.
H Annualized
I Amount does not include the portfolio activity of any underlying mutual funds or exchange-traded funds (ETFs).
See accompanying notes which are an integral part of the financial statements.
Fidelity Advisor Global Real Estate Fund Class Z
| | Six months ended (Unaudited) January 31, | Years endedJuly 31, | | |
| | 2022 | 2021 | 2020 | 2019 A |
| Selected Per–Share Data | | | | |
| Net asset value, beginning of period | $12.56 | $9.73 | $10.76 | $10.01 |
| Income from Investment Operations | | | | |
| Net investment income (loss)B,C | .09 | .22 | .19 | .22 |
| Net realized and unrealized gain (loss) | (.17) | 2.77 | (.59) | .76 |
| Total from investment operations | (.08) | 2.99 | (.40) | .98 |
| Distributions from net investment income | (.18) | (.16) | (.26) | (.17) |
| Distributions from net realized gain | – | – | (.37) | (.06) |
| Total distributions | (.18) | (.16) | (.63) | (.23) |
| Net asset value, end of period | $12.30 | $12.56 | $9.73 | $10.76 |
| Total ReturnD,E | (.69)% | 31.07% | (4.29)% | 10.17% |
| Ratios to Average Net AssetsC,F,G | | | | |
| Expenses before reductions | 2.71%H | 3.72% | 3.54% | 3.87%H |
| Expenses net of fee waivers, if any | .90%H | .97% | 1.02% | 1.00%H |
| Expenses net of all reductions | .90%H | .96% | 1.00% | 1.00%H |
| Net investment income (loss) | 1.46%H | 2.01% | 1.86% | 2.50%H |
| Supplemental Data | | | | |
| Net assets, end of period (000 omitted) | $1,559 | $1,180 | $233 | $306 |
| Portfolio turnover rateI | 29%H | 32% | 52% | 60% |
A For the period October 2, 2018 (commencement of sale of shares) through July 31, 2019.
B Calculated based on average shares outstanding during the period.
C Net investment income (loss) is affected by the timing of the declaration of dividends by any underlying mutual funds or exchange-traded funds (ETFs). Net investment income (loss) of any such underlying funds is not included in the Fund's net investment income (loss) ratio.
D Total returns for periods of less than one year are not annualized.
E Total returns would have been lower if certain expenses had not been reduced during the applicable periods shown.
F Fees and expenses of any underlying mutual funds or exchange-traded funds (ETFs) are not included in the Fund's expense ratio. The Fund indirectly bears its proportionate share of these expenses. For additional expense information related to investments in Fidelity Central Funds, please refer to the "Investments in Fidelity Central Funds" note found in the Notes to Financial Statements section of the most recent Annual or Semi-Annual report.
G Expense ratios reflect operating expenses of the class. Expenses before reductions do not reflect amounts reimbursed, waived, or reduced through arrangements with the investment adviser, brokerage services, or other offset arrangements, if applicable, and do not represent the amount paid by the class during periods when reimbursements, waivers or reductions occur.
H Annualized
I Amount does not include the portfolio activity of any underlying mutual funds or exchange-traded funds (ETFs).
See accompanying notes which are an integral part of the financial statements.
Notes to Financial Statements (Unaudited)
For the period ended January 31, 2022
1. Organization.
Fidelity Advisor Global Real Estate Fund (the Fund) is a fund of Fidelity Advisor Series VII (the Trust) and is authorized to issue an unlimited number of shares. The Trust is registered under the Investment Company Act of 1940, as amended (the 1940 Act), as an open-end management investment company organized as a Massachusetts business trust. The Fund offers Class A, Class M, Class C, Class I and Class Z shares, each of which has equal rights as to assets and voting privileges. Each class has exclusive voting rights with respect to matters that affect that class. Class C shares will automatically convert to Class A shares after a holding period of eight years from the initial date of purchase, with certain exceptions.
2. Investments in Fidelity Central Funds.
Funds may invest in Fidelity Central Funds, which are open-end investment companies generally available only to other investment companies and accounts managed by the investment adviser and its affiliates. The Schedule of Investments lists any Fidelity Central Funds held as an investment as of period end, but does not include the underlying holdings of each Fidelity Central Fund. An investing fund indirectly bears its proportionate share of the expenses of the underlying Fidelity Central Funds.
Based on its investment objective, each Fidelity Central Fund may invest or participate in various investment vehicles or strategies that are similar to those of the investing fund. These strategies are consistent with the investment objectives of the investing fund and may involve certain economic risks which may cause a decline in value of each of the Fidelity Central Funds and thus a decline in the value of the investing fund.
| Fidelity Central Fund | Investment Manager | Investment Objective | Investment Practices | Expense Ratio(a) |
| Fidelity Money Market Central Funds | Fidelity Management & Research Company LLC (FMR) | Each fund seeks to obtain a high level of current income consistent with the preservation of capital and liquidity. | Short-term Investments | Less than .005% |
(a) Expenses expressed as a percentage of average net assets and are as of each underlying Central Fund's most recent annual or semi-annual shareholder report.
A complete unaudited list of holdings for each Fidelity Central Fund is available upon request or at the Securities and Exchange Commission website at www.sec.gov. In addition, the financial statements of the Fidelity Central Funds which contain the significant accounting policies (including investment valuation policies) of those funds, and are not covered by the Report of Independent Registered Public Accounting Firm, are available on the Securities and Exchange Commission website or upon request.
3. Significant Accounting Policies.
The Fund is an investment company and applies the accounting and reporting guidance of the Financial Accounting Standards Board (FASB) Accounting Standards Codification Topic 946 Financial Services - Investment Companies. The financial statements have been prepared in conformity with accounting principles generally accepted in the United States of America (GAAP), which require management to make certain estimates and assumptions at the date of the financial statements. Actual results could differ from those estimates. Subsequent events, if any, through the date that the financial statements were issued have been evaluated in the preparation of the financial statements. The Fund's Schedule of Investments lists any underlying mutual funds or exchange-traded funds (ETFs) but does not include the underlying holdings of these funds. The following summarizes the significant accounting policies of the Fund:
Investment Valuation. Investments are valued as of 4:00 p.m. Eastern time on the last calendar day of the period. The Board of Trustees (the Board) has delegated the day to day responsibility for the valuation of the Fund's investments to the Fair Value Committee (the Committee) established by the Fund's investment adviser. In accordance with valuation policies and procedures approved by the Board, the Fund attempts to obtain prices from one or more third party pricing vendors or brokers to value its investments. When current market prices, quotations or currency exchange rates are not readily available or reliable, investments will be fair valued in good faith by the Committee, in accordance with procedures adopted by the Board. Factors used in determining fair value vary by investment type and may include market or investment specific events. The frequency with which these procedures are used cannot be predicted and they may be utilized to a significant extent. The Committee oversees the Fund's valuation policies and procedures and reports to the Board on the Committee's activities and fair value determinations. The Board monitors the appropriateness of the procedures used in valuing the Fund's investments and ratifies the fair value determinations of the Committee.
The Fund categorizes the inputs to valuation techniques used to value its investments into a disclosure hierarchy consisting of three levels as shown below:
- Level 1 – Unadjusted quoted prices in active markets for identical investments
- Level 2 – other significant observable inputs (including quoted prices for similar investments, interest rates, prepayment speeds, etc.)
- Level 3 – unobservable inputs (including the Fund's own assumptions based on the best information available)
Valuation techniques used to value the Fund's investments by major category are as follows:
Equity securities, including restricted securities, for which market quotations are readily available, are valued at the last reported sale price or official closing price as reported by a third party pricing vendor on the primary market or exchange on which they are traded and are categorized as Level 1 in the hierarchy. In the event there were no sales during the day or closing prices are not available, securities are valued at the last quoted bid price or may be valued using the last available price and are generally categorized as Level 2 in the hierarchy. For foreign equity securities, when market or security specific events arise, comparisons to the valuation of American Depositary Receipts (ADRs), futures contracts, ETFs and certain indexes as well as quoted prices for similar securities may be used and would be categorized as Level 2 in the hierarchy. For equity securities, including restricted securities, where observable inputs are limited, assumptions about market activity and risk are used and these securities may be categorized as Level 3 in the hierarchy.
Investments in open-end mutual funds, including the Fidelity Central Funds, are valued at their closing net asset value (NAV) each business day and are categorized as Level 1 in the hierarchy.
Changes in valuation techniques may result in transfers in or out of an assigned level within the disclosure hierarchy. The aggregate value of investments by input level as of January 31, 2022 is included at the end of the Fund's Schedule of Investments.
Foreign Currency. Certain Funds may use foreign currency contracts to facilitate transactions in foreign-denominated securities. Gains and losses from these transactions may arise from changes in the value of the foreign currency or if the counterparties do not perform under the contracts' terms.
Foreign-denominated assets, including investment securities, and liabilities are translated into U.S. dollars at the exchange rates at period end. Purchases and sales of investment securities, income and dividends received, and expenses denominated in foreign currencies are translated into U.S. dollars at the exchange rate in effect on the transaction date.
The effects of exchange rate fluctuations on investments are included with the net realized and unrealized gain (loss) on investment securities. Other foreign currency transactions resulting in realized and unrealized gain (loss) are disclosed separately.
Investment Transactions and Income. For financial reporting purposes, the Fund's investment holdings and NAV include trades executed through the end of the last business day of the period. The NAV per share for processing shareholder transactions is calculated as of the close of business of the New York Stock Exchange (NYSE), normally 4:00 p.m. Eastern time and includes trades executed through the end of the prior business day. Gains and losses on securities sold are determined on the basis of identified cost. Commissions paid to certain brokers with whom the investment adviser, or its affiliates, places trades on behalf of a fund include an amount in addition to trade execution, which may be rebated back to a fund. Any such rebates are included in net realized gain (loss) on investments in the Statement of Operations. Dividend income is recorded on the ex-dividend date, except for certain dividends from foreign securities where the ex-dividend date may have passed, which are recorded as soon as the Fund is informed of the ex-dividend date. Non-cash dividends included in dividend income, if any, are recorded at the fair market value of the securities received. Income and capital gain distributions from Fidelity Central Funds, if any, are recorded on the ex-dividend date. Certain distributions received by the Fund represent a return of capital or capital gain. The Fund determines the components of these distributions subsequent to the ex-dividend date, based upon receipt of tax filings or other correspondence relating to the underlying investment. These distributions are recorded as a reduction of cost of investments and/or as a realized gain. Investment income is recorded net of foreign taxes withheld where recovery of such taxes is uncertain. Funds may file withholding tax reclaims in certain jurisdictions to recover a portion of amounts previously withheld. Any withholding tax reclaims income is included in the Statement of Operations in foreign taxes withheld. Any receivables for withholding tax reclaims are included in the Statement of Assets and Liabilities in dividends receivable.
Class Allocations and Expenses. Investment income, realized and unrealized capital gains and losses, common expenses of a fund, and certain fund-level expense reductions, if any, are allocated daily on a pro-rata basis to each class based on the relative net assets of each class to the total net assets of a fund. Each class differs with respect to transfer agent and distribution and service plan fees incurred, as applicable. Certain expense reductions may also differ by class, if applicable. For the reporting period, the allocated portion of income and expenses to each class as a percent of its average net assets may vary due to the timing of recording these transactions in relation to fluctuating net assets of the classes. Expenses directly attributable to a fund are charged to that fund. Expenses attributable to more than one fund are allocated among the respective funds on the basis of relative net assets or other appropriate methods. Expenses included in the accompanying financial statements reflect the expenses of that fund and do not include any expenses associated with any underlying mutual funds or exchange-traded funds. Although not included in a fund's expenses, a fund indirectly bears its proportionate share of these expenses through the net asset value of each underlying mutual fund or exchange-traded fund. Expense estimates are accrued in the period to which they relate and adjustments are made when actual amounts are known.
Income Tax Information and Distributions to Shareholders. Each year, the Fund intends to qualify as a regulated investment company under Subchapter M of the Internal Revenue Code, including distributing substantially all of its taxable income and realized gains. As a result, no provision for U.S. Federal income taxes is required. The Fund files a U.S. federal tax return, in addition to state and local tax returns as required. The Fund's federal income tax returns are subject to examination by the Internal Revenue Service (IRS) for a period of three fiscal years after they are filed. State and local tax returns may be subject to examination for an additional fiscal year depending on the jurisdiction. Foreign taxes are provided for based on the Fund's understanding of the tax rules and rates that exist in the foreign markets in which it invests.
Distributions are declared and recorded on the ex-dividend date. Income and capital gain distributions are declared separately for each class. Income and capital gain distributions are determined in accordance with income tax regulations, which may differ from GAAP.
Capital accounts within the financial statements are adjusted for permanent book-tax differences. These adjustments have no impact on net assets or the results of operations. Capital accounts are not adjusted for temporary book-tax differences which will reverse in a subsequent period.
Book-tax differences are primarily due to foreign currency transactions, passive foreign investment companies (PFIC), capital loss carryforwards and losses deferred due to wash sales and excise tax regulations.
As of period end, the cost and unrealized appreciation (depreciation) in securities, and derivatives if applicable, for federal income tax purposes were as follows:
| Gross unrealized appreciation | $1,476,806 |
| Gross unrealized depreciation | (271,864) |
| Net unrealized appreciation (depreciation) | $1,204,942 |
| Tax cost | $6,837,826 |
Capital loss carryforwards are only available to offset future capital gains of the Fund to the extent provided by regulations and may be limited. The capital loss carryforward information presented below, including any applicable limitation, is estimated as of prior fiscal period end and is subject to adjustment.
| No expiration | |
| Short-term | $(120,705) |
| Total capital loss carryforward | $(120,705) |
Delayed Delivery Transactions and When-Issued Securities. During the period, certain Funds transacted in securities on a delayed delivery or when-issued basis. Payment and delivery may take place after the customary settlement period for that security. The price of the underlying securities and the date when the securities will be delivered and paid for are fixed at the time the transaction is negotiated. Securities purchased on a delayed delivery or when-issued basis are identified as such in the Schedule of Investments. Compensation for interest forgone in the purchase of a delayed delivery or when-issued debt security may be received. With respect to purchase commitments, each applicable Fund identifies securities as segregated in its records with a value at least equal to the amount of the commitment. Payables and receivables associated with the purchases and sales of delayed delivery securities having the same coupon, settlement date and broker are offset. Delayed delivery or when-issued securities that have been purchased from and sold to different brokers are reflected as both payables and receivables in the Statement of Assets and Liabilities under the caption "Delayed delivery", as applicable. Losses may arise due to changes in the value of the underlying securities or if the counterparty does not perform under the contract's terms, or if the issuer does not issue the securities due to political, economic, or other factors.
Restricted Securities (including Private Placements). Funds may invest in securities that are subject to legal or contractual restrictions on resale. These securities generally may be resold in transactions exempt from registration or to the public if the securities are registered. Disposal of these securities may involve time-consuming negotiations and expense, and prompt sale at an acceptable price may be difficult. Information regarding restricted securities held at period end is included at the end of the Schedule of Investments, if applicable.
4. Purchases and Sales of Investments.
Purchases and sales of securities, other than short-term securities and in-kind transactions, as applicable, are noted in the table below.
| | Purchases ($) | Sales ($) |
| Fidelity Advisor Global Real Estate Fund | 2,738,294 | 1,062,222 |
5. Fees and Other Transactions with Affiliates.
Management Fee. Fidelity Management & Research Company LLC (the investment adviser) and its affiliates provide the Fund with investment management related services for which the Fund pays a monthly management fee. The management fee is the sum of an individual fund fee rate that is based on an annual rate of .45% of the Fund's average net assets and an annualized group fee rate that averaged .22% during the period. The group fee rate is based upon the monthly average net assets of a group of registered investment companies with which the investment adviser has management contracts. The group fee rate decreases as assets under management increase and increases as assets under management decrease. For the reporting period, the total annualized management fee rate was .67% of the Fund's average net assets.
Distribution and Service Plan Fees. In accordance with Rule 12b-1 of the 1940 Act, the Fund has adopted separate Distribution and Service Plans for each class of shares. Certain classes pay Fidelity Distributors Company LLC (FDC), an affiliate of the investment adviser, separate Distribution and Service Fees, each of which is based on an annual percentage of each class' average net assets. In addition, FDC may pay financial intermediaries for selling shares of the Fund and providing shareholder support services. For the period, the Distribution and Service Fee rates, total fees and amounts retained by FDC were as follows:
| | Distribution Fee | Service Fee | Total Fees | Retained by FDC |
| Class A | -% | .25% | $4,074 | $1,838 |
| Class M | .25% | .25% | 2,434 | 1,644 |
| Class C | .75% | .25% | 1,139 | 157 |
| | | | $7,647 | $3,639 |
Sales Load. FDC may receive a front-end sales charge of up to 5.75% for selling Class A shares and 3.50% for selling Class M shares, some of which is paid to financial intermediaries for selling shares of the Fund. Depending on the holding period, FDC may receive contingent deferred sales charges levied on Class A, Class M and Class C redemptions. The deferred sales charges are 1.00% for Class C shares, 1.00% for certain purchases of Class A shares and .25% for certain purchases of Class M shares.
For the period, sales charge amounts retained by FDC were as follows:
| | Retained by FDC |
| Class A | $1,513 |
| Class M | 41 |
| Class C(a) | 36 |
| | $1,590 |
(a) When Class C shares are initially sold, FDC pays commissions from its own resources to financial intermediaries through which the sales are made.
Transfer Agent Fees. Fidelity Investments Institutional Operations Company LLC (FIIOC), an affiliate of the investment adviser, is the transfer, dividend disbursing and shareholder servicing agent for each class of the Fund. FIIOC receives account fees and asset-based fees that vary according to the account size and type of account of the shareholders of the respective classes of the Fund, except for Class Z. FIIOC receives an asset-based fee of Class Z's average net assets. FIIOC pays for typesetting, printing and mailing of shareholder reports, except proxy statements.
For the period, transfer agent fees for each class were as follows:
| | Amount | % of Class-Level Average Net Assets(a) |
| Class A | $3,602 | .22 |
| Class M | 841 | .17 |
| Class C | 318 | .28 |
| Class I | 1,078 | .14 |
| Class Z | 266 | .04 |
| | $6,105 | |
(a) Annualized
Accounting Fees. Fidelity Service Company, Inc. (FSC), an affiliate of the investment adviser, maintains the Fund's accounting records. The accounting fee is based on the level of average net assets for each month. For the period, the fees were equivalent to the following annualized rates:
| | % of Average Net Assets |
| Fidelity Advisor Global Real Estate Fund | .04 |
Brokerage Commissions. A portion of portfolio transactions were placed with brokerage firms which are affiliates of the investment adviser. Brokerage commissions are included in net realized gain (loss) and change in net unrealized appreciation (depreciation) in the Statement of Operations. The commissions paid to these affiliated firms were as follows:
| | Amount |
| Fidelity Advisor Global Real Estate Fund | $26 |
Interfund Trades. Funds may purchase from or sell securities to other Fidelity Funds under procedures adopted by the Board. The procedures have been designed to ensure these interfund trades are executed in accordance with Rule 17a-7 of the 1940 Act. Any interfund trades are included within the respective purchases and sales amounts shown in the Purchases and Sales of Investments note. Interfund trades during the period are noted in the table below.
| | Purchases ($) | Sales ($) | Realized Gain (Loss) ($) |
| Fidelity Advisor Global Real Estate Fund | 11,964 | 20,144 | (76) |
6. Committed Line of Credit.
Certain Funds participate with other funds managed by the investment adviser or an affiliate in a $4.25 billion credit facility (the "line of credit") to be utilized for temporary or emergency purposes to fund shareholder redemptions or for other short-term liquidity purposes. The participating funds have agreed to pay commitment fees on their pro-rata portion of the line of credit, which are reflected in Miscellaneous expenses on the Statement of Operations, and are listed below. During the period, there were no borrowings on this line of credit.
| | Amount |
| Fidelity Advisor Global Real Estate Fund | $6 |
7. Expense Reductions.
The investment adviser contractually agreed to reimburse expenses of each class to the extent annual operating expenses exceeded certain levels of class-level average net assets as noted in the table below. This reimbursement will remain in place through November 30, 2022. Some expenses, for example the compensation of the independent Trustees, and certain miscellaneous expenses such as proxy and shareholder meeting expenses, are excluded from this reimbursement.
The following classes were in reimbursement during the period:
| | Expense Limitations | Reimbursement |
| Class A | 1.30% | $30,770 |
| Class M | 1.55% | 8,876 |
| Class C | 2.05% | 2,250 |
| Class I | 1.05% | 13,989 |
| Class Z | .90% | 12,011 |
| | | $67,896 |
Through arrangements with the Fund's custodian, credits realized as a result of certain uninvested cash balances were used to reduce the Fund's expenses. During the period, custodian credits reduced the Fund's expenses by $5.
In addition, during the period the investment adviser or an affiliate reimbursed and/or waived a portion of fund-level operating expenses in the amount of $111.
8. Distributions to Shareholders.
Distributions to shareholders of each class were as follows:
| | Six months ended
January 31, 2022 | Year ended
July 31, 2021 |
| Fidelity Advisor Global Real Estate Fund | | |
| Distributions to shareholders | | |
| Class A | $40,544 | $26,351 |
| Class M | 10,997 | 7,125 |
| Class C | 1,175 | – |
| Class I | 21,272 | 19,213 |
| Class Z | 18,109 | 2,877 |
| Total | $92,097 | $55,566 |
9. Share Transactions.
Share transactions for each class were as follows and may contain in-kind transactions, automatic conversions between classes or exchanges between affiliated funds:
| | Shares | Shares | Dollars | Dollars |
| | Six months ended January 31, 2022 | Year ended July 31, 2021 | Six months ended January 31, 2022 | Year ended July 31, 2021 |
| Fidelity Advisor Global Real Estate Fund | | | | |
| Class A | | | | |
| Shares sold | 70,333 | 56,801 | $881,919 | $613,618 |
| Reinvestment of distributions | 3,246 | 2,601 | 40,544 | 26,348 |
| Shares redeemed | (10,977) | (18,190) | (137,784) | (206,199) |
| Net increase (decrease) | 62,602 | 41,212 | $784,679 | $433,767 |
| Class M | | | | |
| Shares sold | 22,262 | 9,736 | $277,975 | $100,374 |
| Reinvestment of distributions | 881 | 704 | 10,997 | 7,125 |
| Shares redeemed | (103) | (8,197) | (1,303) | (82,487) |
| Net increase (decrease) | 23,040 | 2,243 | $287,669 | $25,012 |
| Class C | | | | |
| Shares sold | 3,203 | 6,163 | $40,514 | $63,461 |
| Reinvestment of distributions | 94 | – | 1,175 | – |
| Shares redeemed | (1,473) | (7,478) | (18,078) | (76,707) |
| Net increase (decrease) | 1,824 | (1,315) | $23,611 | $(13,246) |
| Class I | | | | |
| Shares sold | 14,052 | 25,794 | $176,810 | $266,297 |
| Reinvestment of distributions | 1,446 | 1,513 | 18,078 | 15,327 |
| Shares redeemed | (1,748) | (18,638) | (21,383) | (203,528) |
| Net increase (decrease) | 13,750 | 8,669 | $173,505 | $78,096 |
| Class Z | | | | |
| Shares sold | 77,955 | 80,366 | $990,427 | $868,084 |
| Reinvestment of distributions | 1,442 | 281 | 18,109 | 2,850 |
| Shares redeemed | (46,582) | (10,753) | (598,061) | (114,293) |
| Net increase (decrease) | 32,815 | 69,894 | $410,475 | $756,641 |
10. Other.
A fund's organizational documents provide former and current trustees and officers with a limited indemnification against liabilities arising in connection with the performance of their duties to the fund. In the normal course of business, a fund may also enter into contracts that provide general indemnifications. A fund's maximum exposure under these arrangements is unknown as this would be dependent on future claims that may be made against a fund. The risk of material loss from such claims is considered remote.
At the end of the period, the investment adviser or its affiliates were owners of record of more than 10% of the outstanding shares as follows:
| Fund | Affiliated % |
| Fidelity Advisor Global Real Estate Fund | 36% |
11. Coronavirus (COVID-19) Pandemic.
An outbreak of COVID-19 first detected in China during December 2019 has since spread globally and was declared a pandemic by the World Health Organization during March 2020. Developments that disrupt global economies and financial markets, such as the COVID-19 pandemic, may magnify factors that affect the Fund's performance.
Shareholder Expense Example
As a shareholder, you incur two types of costs: (1) transaction costs, which may include sales charges (loads) on purchase payments or redemption proceeds, as applicable and (2) ongoing costs, which generally include management fees, distribution and/or service (12b-1) fees and other Fund expenses. This Example is intended to help you understand your ongoing costs (in dollars) of investing in a fund and to compare these costs with the ongoing costs of investing in other mutual funds.
The Example is based on an investment of $1,000 invested at the beginning of the period and held for the entire period (August 1, 2021 to January 31, 2022).
Actual Expenses
The first line of the accompanying table provides information about actual account values and actual expenses. You may use the information in this line, together with the amount you invested, to estimate the expenses that you paid over the period. Simply divide your account value by $1,000.00 (for example, an $8,600 account value divided by $1,000.00 = 8.6), then multiply the result by the number in the first line for a class/Fund under the heading entitled "Expenses Paid During Period" to estimate the expenses you paid on your account during this period. If any fund is a shareholder of any underlying mutual funds or exchange-traded funds (ETFs) (the Underlying Funds), such fund indirectly bears its proportional share of the expenses of the Underlying Funds in addition to the direct expenses incurred presented in the table. These fees and expenses are not included in the annualized expense ratio used to calculate the expense estimate in the table below.
Hypothetical Example for Comparison Purposes
The second line of the accompanying table provides information about hypothetical account values and hypothetical expenses based on the actual expense ratio and an assumed rate of return of 5% per year before expenses, which is not the actual return. The hypothetical account values and expenses may not be used to estimate the actual ending account balance or expenses you paid for the period. You may use this information to compare the ongoing costs of investing in the Fund and other funds. To do so, compare this 5% hypothetical example with the 5% hypothetical examples that appear in the shareholder reports of the other funds. If any fund is a shareholder of any Underlying Funds, such fund indirectly bears its proportional share of the expenses of the Underlying Funds in addition to the direct expenses as presented in the table. These fees and expenses are not included in the annualized expense ratio used to calculate the expense estimate in the table below.
Please note that the expenses shown in the table are meant to highlight your ongoing costs only and do not reflect any transaction costs. Therefore, the second line of the table is useful in comparing ongoing costs only, and will not help you determine the relative total costs of owning different funds. In addition, if these transactional costs were included, your costs would have been higher.
| | Annualized Expense Ratio-A | Beginning
Account Value
August 1, 2021 | Ending
Account Value
January 31, 2022 | Expenses Paid
During Period-B
August 1, 2021
to January 31, 2022 |
| Fidelity Advisor Global Real Estate Fund | | | | |
| Class A | 1.30% | | | |
| Actual | | $1,000.00 | $991.10 | $6.52 |
| Hypothetical-C | | $1,000.00 | $1,018.65 | $6.61 |
| Class M | 1.55% | | | |
| Actual | | $1,000.00 | $990.00 | $7.77 |
| Hypothetical-C | | $1,000.00 | $1,017.39 | $7.88 |
| Class C | 2.05% | | | |
| Actual | | $1,000.00 | $987.40 | $10.27 |
| Hypothetical-C | | $1,000.00 | $1,014.87 | $10.41 |
| Class I | 1.05% | | | |
| Actual | | $1,000.00 | $992.30 | $5.27 |
| Hypothetical-C | | $1,000.00 | $1,019.91 | $5.35 |
| Class Z | .90% | | | |
| Actual | | $1,000.00 | $993.10 | $4.52 |
| Hypothetical-C | | $1,000.00 | $1,020.67 | $4.58 |
A Annualized expense ratio reflects expenses net of applicable fee waivers.
B Expenses are equal to the annualized expense ratio, multiplied by the average account value over the period, multiplied by 184/ 365 (to reflect the one-half year period). The fees and expenses of any Underlying Funds are not included in each annualized expense ratio.
C 5% return per year before expenses
AGRE-SANN-0422
1.9881281.105
Fidelity Advisor Focus Funds®
Fidelity Advisor® Biotechnology Fund
Fidelity Advisor® Consumer Discretionary Fund
Fidelity Advisor® Energy Fund
Fidelity Advisor® Financial Services Fund
Fidelity Advisor® Health Care Fund
Fidelity Advisor® Industrials Fund
Fidelity Advisor® Semiconductors Fund
Fidelity Advisor® Technology Fund
Fidelity Advisor® Utilities Fund
Semi-Annual Report
January 31, 2022
Contents
To view a fund's proxy voting guidelines and proxy voting record for the 12-month period ended June 30, visit http://www.fidelity.com/proxyvotingresults or visit the Securities and Exchange Commission's (SEC) web site at http://www.sec.gov.
You may also call 1-877-208-0098 to request a free copy of the proxy voting guidelines.
Standard & Poor's, S&P and S&P 500 are registered service marks of The McGraw-Hill Companies, Inc. and have been licensed for use by Fidelity Distributors Corporation.
Other third-party marks appearing herein are the property of their respective owners.
All other marks appearing herein are registered or unregistered trademarks or service marks of FMR LLC or an affiliated company. © 2022 FMR LLC. All rights reserved.
This report and the financial statements contained herein are submitted for the general information of the shareholders of the Funds. This report is not authorized for distribution to prospective investors in the Funds unless preceded or accompanied by an effective prospectus.
A fund files its complete schedule of portfolio holdings with the SEC for the first and third quarters of each fiscal year on Form N-PORT. Forms N-PORT are available on the SEC’s web site at http://www.sec.gov. A fund's Forms N-PORT may be reviewed and copied at the SEC’s Public Reference Room in Washington, DC. Information regarding the operation of the SEC's Public Reference Room may be obtained by calling 1-800-SEC-0330.
For a complete list of a fund's portfolio holdings, view the most recent holdings listing, semiannual report, or annual report on Fidelity's web site at http://www.fidelity.com, http://www.institutional.fidelity.com, or http://www.401k.com, as applicable.
NOT FDIC INSURED •MAY LOSE VALUE •NO BANK GUARANTEE
Neither the Funds nor Fidelity Distributors Corporation is a bank.
Note to Shareholders:
Early in 2020, the outbreak and spread of COVID-19 emerged as a public health emergency that had a major influence on financial markets, primarily based on its impact on the global economy and corporate earnings. On March 11, 2020, the World Health Organization declared the COVID-19 outbreak a pandemic, citing sustained risk of further global spread. The pandemic prompted a number of measures to limit the spread of COVID-19, including travel and border restrictions, quarantines, and restrictions on large gatherings. In turn, these resulted in lower consumer activity, diminished demand for a wide range of products and services, disruption in manufacturing and supply chains, and – given the wide variability in outcomes regarding the outbreak – significant market uncertainty and volatility. To help stem the turmoil, the U.S. government took unprecedented action – in concert with the U.S. Federal Reserve and central banks around the world – to help support consumers, businesses, and the broader economy, and to limit disruption to the financial system.
In general, the overall impact of the pandemic lessened in 2021, amid a resilient economy and widespread distribution of three COVID-19 vaccines granted emergency use authorization from the U.S. Food and Drug Administration (FDA) early in the year. Still, the situation remains dynamic, and the extent and duration of its influence on financial markets and the economy is highly uncertain, due in part to a recent spike in cases based on highly contagious variants of the coronavirus.
Extreme events such as the COVID-19 crisis are exogenous shocks that can have significant adverse effects on mutual funds and their investments. Although multiple asset classes may be affected by market disruption, the duration and impact may not be the same for all types of assets. Fidelity is committed to helping you stay informed amid news about COVID-19 and during increased market volatility, and we continue to take extra steps to be responsive to customer needs. We encourage you to visit us online, where we offer ongoing updates, commentary, and analysis on the markets and our funds.
Fidelity Advisor® Biotechnology Fund
Investment Summary (Unaudited)
Top Ten Stocks as of January 31, 2022
| | % of fund's net assets |
| AbbVie, Inc. | 16.9 |
| Vertex Pharmaceuticals, Inc. | 10.0 |
| Regeneron Pharmaceuticals, Inc. | 8.4 |
| Alnylam Pharmaceuticals, Inc. | 5.3 |
| Argenx SE ADR | 3.3 |
| Cytokinetics, Inc. | 3.2 |
| Ascendis Pharma A/S sponsored ADR | 3.2 |
| Seagen, Inc. | 2.2 |
| Protagonist Therapeutics, Inc. | 2.1 |
| PTC Therapeutics, Inc. | 1.6 |
| | 56.2 |
Top Industries (% of fund's net assets)
| As of January 31, 2022 |
| | Biotechnology | 93.5% |
| | Pharmaceuticals | 5.2% |
| | Diversified Financial Services | 0.6% |
| | Health Care Providers & Services | 0.2% |
| | Health Care Technology | 0.2% |
| | All Others* | 0.3% |

* Includes short-term investments and net other assets (liabilities).
Fidelity Advisor® Biotechnology Fund
Schedule of Investments January 31, 2022 (Unaudited)
Showing Percentage of Net Assets
| Common Stocks - 97.8% | | | |
| | | Shares | Value |
| Biotechnology - 92.3% | | | |
| Biotechnology - 92.3% | | | |
| AbbVie, Inc. | | 2,417,180 | $330,887,773 |
| ADC Therapeutics SA (a)(b) | | 262,723 | 4,174,668 |
| Aerovate Therapeutics, Inc. (b) | | 432,100 | 5,107,422 |
| Agios Pharmaceuticals, Inc. (a)(b) | | 504,343 | 15,579,155 |
| Alnylam Pharmaceuticals, Inc. (a) | | 754,186 | 103,775,994 |
| ALX Oncology Holdings, Inc. (a) | | 379,883 | 6,078,128 |
| Ambrx Biopharma, Inc. ADR | | 580,787 | 2,811,009 |
| Arcutis Biotherapeutics, Inc. (a) | | 821,633 | 12,414,875 |
| Argenx SE ADR (a) | | 241,600 | 65,053,216 |
| Ascendis Pharma A/S sponsored ADR (a) | | 506,125 | 61,565,045 |
| Astria Therapeutics, Inc. (a) | | 21,179 | 106,107 |
| Aurinia Pharmaceuticals, Inc. (a)(b) | | 813,000 | 13,544,580 |
| Autolus Therapeutics PLC ADR (a)(b) | | 996,000 | 3,974,040 |
| BeiGene Ltd. ADR (a) | | 20,300 | 4,924,374 |
| Bicycle Therapeutics PLC ADR (a) | | 120,100 | 5,864,483 |
| BioAtla, Inc. (a) | | 229,990 | 2,198,704 |
| Blueprint Medicines Corp. (a) | | 323,694 | 24,956,807 |
| Bolt Biotherapeutics, Inc. (b) | | 104,951 | 403,012 |
| C4 Therapeutics, Inc. (a) | | 69,700 | 1,702,771 |
| Celldex Therapeutics, Inc. (a) | | 872,200 | 27,046,922 |
| Celularity, Inc. Class A (a)(b) | | 374,219 | 1,683,986 |
| Century Therapeutics, Inc. | | 21,900 | 285,357 |
| Century Therapeutics, Inc. (c) | | 460,571 | 6,001,240 |
| Cerevel Therapeutics Holdings (a)(b) | | 852,028 | 22,186,809 |
| ChemoCentryx, Inc. (a) | | 548,074 | 14,737,710 |
| Connect Biopharma Holdings Ltd. ADR (a) | | 872,300 | 4,012,580 |
| Crinetics Pharmaceuticals, Inc. (a) | | 549,007 | 10,370,742 |
| Cullinan Oncology, Inc. | | 465,700 | 6,277,636 |
| Cyteir Therapeutics, Inc. (b) | | 1,419,670 | 8,631,594 |
| Cytokinetics, Inc. (a)(b) | | 1,897,971 | 62,993,657 |
| Erasca, Inc. (b) | | 1,695,700 | 20,094,045 |
| Exelixis, Inc. (a) | | 1,687,627 | 30,546,049 |
| Forma Therapeutics Holdings, Inc. (a)(b) | | 524,138 | 6,205,794 |
| Fusion Pharmaceuticals, Inc. (a)(b) | | 1,278,447 | 9,780,120 |
| Global Blood Therapeutics, Inc. (a) | | 960,689 | 27,715,878 |
| Gossamer Bio, Inc. (a)(b) | | 894,500 | 8,578,255 |
| Graphite Bio, Inc. (b) | | 692,400 | 6,467,016 |
| Graphite Bio, Inc. (c) | | 420,780 | 3,930,085 |
| Icosavax, Inc. (a) | | 476,300 | 7,268,338 |
| Imago BioSciences, Inc. (b) | | 652,006 | 13,183,561 |
| Instil Bio, Inc. (a)(b) | | 725,196 | 8,419,526 |
| Instil Bio, Inc. (c) | | 852,386 | 9,896,201 |
| Iovance Biotherapeutics, Inc. (a) | | 451,900 | 7,524,135 |
| Janux Therapeutics, Inc. (b) | | 584,300 | 8,898,889 |
| Keros Therapeutics, Inc. (a) | | 343,600 | 15,932,732 |
| Kronos Bio, Inc. (a)(b) | | 455,100 | 4,141,410 |
| Kura Oncology, Inc. (a) | | 412,500 | 5,812,125 |
| Mirati Therapeutics, Inc. (a) | | 260,920 | 31,127,756 |
| Monte Rosa Therapeutics, Inc. (b) | | 221,100 | 2,799,126 |
| Monte Rosa Therapeutics, Inc. (c) | | 477,858 | 6,049,682 |
| Morphic Holding, Inc. (a) | | 205,700 | 8,727,851 |
| Nuvalent, Inc. (c) | | 673,253 | 9,082,183 |
| Nuvalent, Inc. Class A (a) | | 54,153 | 730,524 |
| ORIC Pharmaceuticals, Inc. (a)(b) | | 831,016 | 8,218,748 |
| Passage Bio, Inc. (a)(b) | | 316,659 | 1,592,795 |
| Poseida Therapeutics, Inc. (a)(b) | | 428,946 | 2,037,494 |
| Praxis Precision Medicines, Inc. (a) | | 209,600 | 3,114,656 |
| Prelude Therapeutics, Inc. (a)(b) | | 533,870 | 5,301,329 |
| Protagonist Therapeutics, Inc. (a) | | 1,373,369 | 40,225,978 |
| PTC Therapeutics, Inc. (a) | | 789,040 | 31,735,189 |
| Regeneron Pharmaceuticals, Inc. (a) | | 270,292 | 164,497,008 |
| Relay Therapeutics, Inc. (a)(b) | | 796,000 | 17,615,480 |
| Repare Therapeutics, Inc. (a)(b) | | 512,400 | 7,906,332 |
| Revolution Medicines, Inc. (a)(b) | | 361,916 | 7,788,432 |
| Scholar Rock Holding Corp. (a)(b) | | 428,330 | 7,628,557 |
| Seagen, Inc. (a) | | 320,014 | 43,045,083 |
| Shattuck Labs, Inc. (a) | | 702,834 | 4,856,583 |
| Stoke Therapeutics, Inc. (a) | | 446,619 | 8,463,430 |
| Syros Pharmaceuticals, Inc. (a)(b) | | 581,640 | 1,151,647 |
| Tango Therapeutics, Inc. (a)(b) | | 1,217,500 | 10,385,275 |
| Taysha Gene Therapies, Inc. (a)(b) | | 202,543 | 1,610,217 |
| Tenaya Therapeutics, Inc. (a)(b) | | 978,612 | 11,665,055 |
| Tenaya Therapeutics, Inc. (c) | | 402,187 | 4,794,069 |
| TG Therapeutics, Inc. (a)(b) | | 2,054,900 | 23,775,193 |
| Tyra Biosciences, Inc. (b) | | 730,700 | 9,579,477 |
| Vaxcyte, Inc. (a)(b) | | 1,072,429 | 20,419,048 |
| Vera Therapeutics, Inc. (a) | | 980,468 | 19,540,727 |
| Vertex Pharmaceuticals, Inc. (a) | | 806,727 | 196,074,997 |
| Verve Therapeutics, Inc. | | 324,600 | 9,354,972 |
| Xenon Pharmaceuticals, Inc. (a) | | 849,835 | 23,047,525 |
| Zentalis Pharmaceuticals, Inc. (a)(b) | | 555,753 | 31,722,381 |
| Zymeworks, Inc. (a) | | 415,853 | 3,701,092 |
| | | | 1,803,110,446 |
| Diversified Financial Services - 0.6% | | | |
| Other Diversified Financial Services - 0.6% | | | |
| Helix Acquisition Corp. (a)(d) | | 1,193,000 | 11,786,840 |
| Health Care Providers & Services - 0.0% | | | |
| Health Care Services - 0.0% | | | |
| Precipio, Inc. (a)(e) | | 30 | 38 |
| Pharmaceuticals - 4.9% | | | |
| Pharmaceuticals - 4.9% | | | |
| Afferent Pharmaceuticals, Inc. rights 12/31/24 (a)(f) | | 1,915,787 | 1,800,840 |
| Arvinas Holding Co. LLC (a) | | 318,000 | 22,733,820 |
| Chiasma, Inc. warrants 12/16/24 (a)(f) | | 81,298 | 1 |
| DICE Therapeutics, Inc. (b) | | 9,900 | 168,597 |
| Edgewise Therapeutics, Inc. (a) | | 598,800 | 8,143,680 |
| Fulcrum Therapeutics, Inc. (a) | | 778,000 | 9,460,480 |
| GH Research PLC (b) | | 385,500 | 6,545,790 |
| Ikena Oncology, Inc. (a)(b) | | 763,659 | 7,430,402 |
| Ikena Oncology, Inc. (c) | | 282,736 | 2,751,021 |
| IMARA, Inc. (a) | | 246,146 | 342,143 |
| Longboard Pharmaceuticals, Inc. (a) | | 520,400 | 2,185,680 |
| NGM Biopharmaceuticals, Inc. (a)(b) | | 357,800 | 5,656,818 |
| Pharvaris BV | | 195,873 | 3,367,057 |
| Pliant Therapeutics, Inc. (a) | | 385,173 | 4,518,079 |
| Stemcentrx, Inc. rights 12/31/21 (a)(f) | | 208,907 | 2 |
| Terns Pharmaceuticals, Inc. (b) | | 906,792 | 5,685,586 |
| Theseus Pharmaceuticals, Inc. (b) | | 988,400 | 9,122,932 |
| Ventyx Biosciences, Inc. (b) | | 385,400 | 6,266,604 |
| | | | 96,179,532 |
| TOTAL COMMON STOCKS | | | |
| (Cost $1,652,652,672) | | | 1,911,076,856 |
|
| Convertible Preferred Stocks - 1.9% | | | |
| Biotechnology - 1.2% | | | |
| Biotechnology - 1.2% | | | |
| Bright Peak Therapeutics AG Series B (e)(f) | | 1,920,122 | 5,798,768 |
| Sonoma Biotherapeutics, Inc.: | | | |
| Series B (e)(f) | | 1,967,762 | 3,601,004 |
| Series B1 (e)(f) | | 1,049,456 | 1,920,504 |
| T-Knife Therapeutics, Inc. Series B (e)(f) | | 1,300,097 | 5,421,404 |
| Treeline Biosciences Series A (e)(f) | | 47,600 | 296,072 |
| ValenzaBio, Inc. Series A (e)(f) | | 951,971 | 6,149,733 |
| | | | 23,187,485 |
| Health Care Providers & Services - 0.2% | | | |
| Health Care Facilities - 0.2% | | | |
| Boundless Bio, Inc. Series B (e)(f) | | 3,703,704 | 3,666,667 |
| Health Care Technology - 0.2% | | | |
| Health Care Technology - 0.2% | | | |
| Wugen, Inc. Series B (e)(f) | | 580,277 | 3,295,973 |
| Pharmaceuticals - 0.3% | | | |
| Pharmaceuticals - 0.3% | | | |
| Afferent Pharmaceuticals, Inc. Series C (a)(e)(f) | | 1,915,787 | 19 |
| Aristea Therapeutics, Inc. Series B (a)(e)(f) | | 677,328 | 6,333,017 |
| | | | 6,333,036 |
| TOTAL CONVERTIBLE PREFERRED STOCKS | | | |
| (Cost $44,080,110) | | | 36,483,161 |
|
| Money Market Funds - 10.8% | | | |
| Fidelity Securities Lending Cash Central Fund 0.08% (g)(h) | | | |
| (Cost $211,678,963) | | 211,661,919 | 211,683,086 |
| TOTAL INVESTMENT IN SECURITIES - 110.5% | | | |
| (Cost $1,908,411,745) | | | 2,159,243,103 |
| NET OTHER ASSETS (LIABILITIES) - (10.5)% | | | (204,370,168) |
| NET ASSETS - 100% | | | $1,954,872,935 |
Legend
(a) Non-income producing
(b) Security or a portion of the security is on loan at period end.
(c) Security exempt from registration under Rule 144A of the Securities Act of 1933. These securities may be resold in transactions exempt from registration, normally to qualified institutional buyers. At the end of the period, the value of these securities amounted to $42,504,481 or 2.2% of net assets.
(d) Affiliated company
(e) Restricted securities (including private placements) - Investment in securities not registered under the Securities Act of 1933 (excluding 144A issues). At the end of the period, the value of restricted securities (excluding 144A issues) amounted to $36,483,199 or 1.9% of net assets.
(f) Level 3 security
(g) Affiliated fund that is generally available only to investment companies and other accounts managed by Fidelity Investments. The rate quoted is the annualized seven-day yield of the fund at period end. A complete unaudited listing of the fund's holdings as of its most recent quarter end is available upon request. In addition, each Fidelity Central Fund's financial statements are available on the SEC's website or upon request.
(h) Investment made with cash collateral received from securities on loan.
Additional information on each restricted holding is as follows:
| Security | Acquisition Date | Acquisition Cost |
| Afferent Pharmaceuticals, Inc. Series C | 7/1/15 | $0 |
| Aristea Therapeutics, Inc. Series B | 10/6/20 - 7/27/21 | $3,734,584 |
| Boundless Bio, Inc. Series B | 4/23/21 | $5,000,000 |
| Bright Peak Therapeutics AG Series B | 5/14/21 | $7,499,997 |
| Precipio, Inc. | 2/3/12 | $161,441 |
| Sonoma Biotherapeutics, Inc. Series B | 7/26/21 | $3,888,888 |
| Sonoma Biotherapeutics, Inc. Series B1 | 7/26/21 | $3,111,112 |
| T-Knife Therapeutics, Inc. Series B | 6/30/21 | $7,500,000 |
| Treeline Biosciences Series A | 7/30/21 | $372,589 |
| ValenzaBio, Inc. Series A | 3/25/21 | $8,472,951 |
| Wugen, Inc. Series B | 7/9/21 | $4,499,990 |
Affiliated Central Funds
Fiscal year to date information regarding the Fund's investments in Fidelity Central Funds, including the ownership percentage, is presented below.
| Fund | Value, beginning of period | Purchases | Sales Proceeds | Dividend Income | Realized Gain/Loss | Change in Unrealized appreciation (depreciation) | Value, end of period | % ownership, end of period |
| Fidelity Cash Central Fund 0.08% | $19,154,488 | $421,658,060 | $440,812,548 | $4,199 | $-- | $-- | $-- | 0.0% |
| Fidelity Securities Lending Cash Central Fund 0.08% | 217,621,603 | 584,918,035 | 590,856,552 | 1,499,251 | -- | -- | 211,683,086 | 0.7% |
| Total | $236,776,091 | $1,006,576,095 | $1,031,669,100 | $1,503,450 | $-- | $-- | $211,683,086 | |
Amounts in the income column in the above table include any capital gain distributions from underlying funds, which are presented in the corresponding line-item in the Statement of Operations, if applicable. Amount for Fidelity Securities Lending Cash Central Fund represents the income earned on investing cash collateral, less rebates paid to borrowers and any lending agent fees associated with the loan, plus any premium payments received for lending certain types of securities.
Other Affiliated Issuers
An affiliated company is a company in which the Fund has ownership of at least 5% of the voting securities. Fiscal year to date transactions with companies which are or were affiliates are as follows:
| Affiliate | Value, beginning of period | Purchases | Sales Proceeds | Dividend Income | Realized Gain (loss) | Change in Unrealized appreciation (depreciation) | Value, end of period |
| Helix Acquisition Corp. | $-- | $11,914,529 | $-- | $-- | $-- | $(127,689) | $11,786,840 |
| Total | $-- | $11,914,529 | $-- | $-- | $-- | $(127,689) | $11,786,840 |
Investment Valuation
The following is a summary of the inputs used, as of January 31, 2022, involving the Fund's assets and liabilities carried at fair value. The inputs or methodology used for valuing securities may not be an indication of the risk associated with investing in those securities. For more information on valuation inputs, and their aggregation into the levels used below, please refer to the Investment Valuation section in the accompanying Notes to Financial Statements.
| | Valuation Inputs at Reporting Date: |
| Description | Total | Level 1 | Level 2 | Level 3 |
| Investments in Securities: | | | | |
| Common Stocks | $1,911,076,856 | $1,909,276,013 | $-- | $1,800,843 |
| Convertible Preferred Stocks | 36,483,161 | -- | -- | 36,483,161 |
| Money Market Funds | 211,683,086 | 211,683,086 | -- | -- |
| Total Investments in Securities: | $2,159,243,103 | $2,120,959,099 | $-- | $38,284,004 |
The following is a reconciliation of Investments in Securities for which Level 3 inputs were used in determining value:
| Investments in Securities: | |
| Convertible Preferred Stocks | |
| Beginning Balance | $ 46,590,455 |
| Total Realized Gain (Loss) | -- |
| Total Unrealized Gain (Loss) | (10,107,294) |
| Cost of Purchases | -- |
| Proceeds of Sales | -- |
| Amortization/Accretion | -- |
| Transfers in to Level 3 | -- |
| Transfers out of Level 3 | -- |
| Ending Balance | $36,483,161 |
| The change in unrealized gain (loss) for the period attributable to Level 3 securities held at January 31, 2022 | $(10,107,294) |
| Other Investments in Securities | |
| Beginning Balance | $3,122,735 |
| Total Realized Gain (Loss) | -- |
| Total Unrealized Gain (Loss) | (1,365,849) |
| Cost of Purchases | -- |
| Proceeds of Sales | -- |
| Amortization/Accretion | -- |
| Transfers in to Level 3 | 43,957 |
| Transfers out of Level 3 | -- |
| Ending Balance | $1,800,843 |
| The change in unrealized gain (loss) for the period attributable to Level 3 securities held at January 31, 2022 | $(1,365,849) |
The information used in the above reconciliation represents fiscal year to date activity for any Investments in Securities identified as using Level 3 inputs at either the beginning or the end of the current fiscal period. Cost of purchases and proceeds of sales may include securities received and/or delivered through in-kind transactions. Transfers in or out of Level 3 represent the beginning value of any Security or Instrument where a change in the pricing level occurred from the beginning to the end of the period. The cost of purchases and the proceeds of sales may include securities received or delivered through corporate actions or exchanges. Realized and unrealized gains (losses) disclosed in the reconciliation{s} are included in Net Gain (Loss) on the Fund's Statement of Operations.
Other Information
Distribution of investments by country or territory of incorporation, as a percentage of Total Net Assets, is as follows (Unaudited):
| United States of America | 89.5% |
| Netherlands | 3.3% |
| Denmark | 3.2% |
| Canada | 2.1% |
| Cayman Islands | 1.2% |
| Others (Individually Less Than 1%) | 0.7% |
| | 100.0% |
See accompanying notes which are an integral part of the financial statements.
Fidelity Advisor® Biotechnology Fund
Financial Statements
Statement of Assets and Liabilities
| | | January 31, 2022 (Unaudited) |
| Assets | | |
Investment in securities, at value (including securities loaned of $219,290,065) — See accompanying schedule:
Unaffiliated issuers (cost $1,684,818,253) | $1,935,773,177 | |
| Fidelity Central Funds (cost $211,678,963) | 211,683,086 | |
| Other affiliated issuers (cost $11,914,529) | 11,786,840 | |
| Total Investment in Securities (cost $1,908,411,745) | | $2,159,243,103 |
| Receivable for investments sold | | 21,567,006 |
| Receivable for fund shares sold | | 1,482,267 |
| Dividends receivable | | 3,511,437 |
| Distributions receivable from Fidelity Central Funds | | 232,223 |
| Prepaid expenses | | 12,565 |
| Total assets | | 2,186,048,601 |
| Liabilities | | |
| Payable to custodian bank | $2,091,964 | |
| Payable for investments purchased | 4,170,955 | |
| Payable for fund shares redeemed | 11,532,384 | |
| Accrued management fee | 895,984 | |
| Distribution and service plan fees payable | 407,088 | |
| Other affiliated payables | 376,928 | |
| Other payables and accrued expenses | 50,380 | |
| Collateral on securities loaned | 211,649,983 | |
| Total liabilities | | 231,175,666 |
| Net Assets | | $1,954,872,935 |
| Net Assets consist of: | | |
| Paid in capital | | $1,734,887,256 |
| Total accumulated earnings (loss) | | 219,985,679 |
| Net Assets | | $1,954,872,935 |
| Net Asset Value and Maximum Offering Price | | |
| Class A: | | |
| Net Asset Value and redemption price per share ($673,815,324 ÷ 28,427,062 shares)(a) | | $23.70 |
| Maximum offering price per share (100/94.25 of $23.70) | | $25.15 |
| Class M: | | |
| Net Asset Value and redemption price per share ($132,328,336 ÷ 6,080,249 shares)(a) | | $21.76 |
| Maximum offering price per share (100/96.50 of $21.76) | | $22.55 |
| Class C: | | |
| Net Asset Value and offering price per share ($231,709,559 ÷ 12,405,182 shares)(a) | | $18.68 |
| Class I: | | |
| Net Asset Value, offering price and redemption price per share ($844,622,413 ÷ 32,717,212 shares) | | $25.82 |
| Class Z: | | |
| Net Asset Value, offering price and redemption price per share ($72,397,303 ÷ 2,800,401 shares) | | $25.85 |
(a) Redemption price per share is equal to net asset value less any applicable contingent deferred sales charge.
See accompanying notes which are an integral part of the financial statements.
Statement of Operations
| | | Six months ended January 31, 2022 (Unaudited) |
| Investment Income | | |
| Dividends | | $7,854,369 |
| Income from Fidelity Central Funds (including $1,499,251 from security lending) | | 1,503,450 |
| Total income | | 9,357,819 |
| Expenses | | |
| Management fee | $6,368,163 | |
| Transfer agent fees | 2,101,028 | |
| Distribution and service plan fees | 2,913,228 | |
| Accounting fees | 362,740 | |
| Custodian fees and expenses | 24,537 | |
| Independent trustees' fees and expenses | 4,445 | |
| Registration fees | 89,224 | |
| Audit | 47,822 | |
| Legal | 6,335 | |
| Interest | 747 | |
| Miscellaneous | 6,255 | |
| Total expenses before reductions | 11,924,524 | |
| Expense reductions | (37,310) | |
| Total expenses after reductions | | 11,887,214 |
| Net investment income (loss) | | (2,529,395) |
| Realized and Unrealized Gain (Loss) | | |
| Net realized gain (loss) on: | | |
| Investment securities: | | |
| Unaffiliated issuers | 75,785,430 | |
| Foreign currency transactions | 579 | |
| Total net realized gain (loss) | | 75,786,009 |
| Change in net unrealized appreciation (depreciation) on: | | |
| Investment securities: | | |
| Unaffiliated issuers | (360,933,972) | |
| Affiliated issuers | (127,689) | |
| Unfunded commitments | 215,400 | |
| Total change in net unrealized appreciation (depreciation) | | (360,846,261) |
| Net gain (loss) | | (285,060,252) |
| Net increase (decrease) in net assets resulting from operations | | $(287,589,647) |
See accompanying notes which are an integral part of the financial statements.
Statement of Changes in Net Assets
| | Six months ended January 31, 2022 (Unaudited) | Year ended July 31, 2021 |
| Increase (Decrease) in Net Assets | | |
| Operations | | |
| Net investment income (loss) | $(2,529,395) | $5,459,452 |
| Net realized gain (loss) | 75,786,009 | 577,411,240 |
| Change in net unrealized appreciation (depreciation) | (360,846,261) | (244,829,280) |
| Net increase (decrease) in net assets resulting from operations | (287,589,647) | 338,041,412 |
| Distributions to shareholders | (389,242,979) | (228,190,286) |
| Share transactions - net increase (decrease) | 113,926,968 | 1,156,643 |
| Total increase (decrease) in net assets | (562,905,658) | 111,007,769 |
| Net Assets | | |
| Beginning of period | 2,517,778,593 | 2,406,770,824 |
| End of period | $1,954,872,935 | $2,517,778,593 |
See accompanying notes which are an integral part of the financial statements.
Financial Highlights
Fidelity Advisor Biotechnology Fund Class A
| | Six months ended (Unaudited) January 31, | Years endedJuly 31, | | | | |
| | 2022 | 2021 | 2020 | 2019 | 2018 | 2017 |
| Selected Per–Share Data | | | | | | |
| Net asset value, beginning of period | $32.58 | $31.03 | $25.48 | $27.80 | $24.45 | $21.39 |
| Income from Investment Operations | | | | | | |
| Net investment income (loss)A,B | (.04) | .07 | .03 | .03 | (.14) | (.15)C |
| Net realized and unrealized gain (loss) | (3.48) | 4.42 | 7.40 | (1.76) | 3.49 | 3.21 |
| Total from investment operations | (3.52) | 4.49 | 7.43 | (1.73) | 3.35 | 3.06 |
| Distributions from net investment income | (.11) | (.13) | – | – | – | – |
| Distributions from net realized gain | (5.25) | (2.81) | (1.88) | (.59) | – | – |
| Total distributions | (5.36) | (2.94) | (1.88) | (.59) | – | – |
| Redemption fees added to paid in capitalA | – | – | – | – | – | –D |
| Net asset value, end of period | $23.70 | $32.58 | $31.03 | $25.48 | $27.80 | $24.45 |
| Total ReturnE,F,G | (12.69)% | 14.03% | 30.00% | (6.17)% | 13.70% | 14.31% |
| Ratios to Average Net AssetsB,H,I | | | | | | |
| Expenses before reductions | 1.00%J | 1.01% | 1.02% | 1.04% | 1.06% | 1.05% |
| Expenses net of fee waivers, if any | 1.00%J | 1.00% | 1.02% | 1.03% | 1.06% | 1.05% |
| Expenses net of all reductions | 1.00%J | 1.00% | 1.02% | 1.03% | 1.06% | 1.04% |
| Net investment income (loss) | (.23)%J | .20% | .11% | .13% | (.53)% | (.69)%C |
| Supplemental Data | | | | | | |
| Net assets, end of period (000 omitted) | $673,815 | $808,610 | $722,896 | $616,894 | $766,303 | $787,802 |
| Portfolio turnover rateK | 51%J | 72% | 66% | 62% | 45% | 30% |
A Calculated based on average shares outstanding during the period.
B Net investment income (loss) is affected by the timing of the declaration of dividends by any underlying mutual funds or exchange-traded funds (ETFs). Net investment income (loss) of any such underlying funds is not included in the Fund's net investment income (loss) ratio.
C Net investment income per share reflects one or more large, non-recurring dividend(s) which amounted to $.01 per share. Excluding such non-recurring dividend(s), the ratio of net investment income (loss) to average net assets would have been (.71) %.
D Amount represents less than $.005 per share.
E Total returns for periods of less than one year are not annualized.
F Total returns would have been lower if certain expenses had not been reduced during the applicable periods shown.
G Total returns do not include the effect of the sales charges.
H Fees and expenses of any underlying mutual funds or exchange-traded funds (ETFs) are not included in the Fund's expense ratio. The Fund indirectly bears its proportionate share of these expenses. For additional expense information related to investments in Fidelity Central Funds, please refer to the "Investments in Fidelity Central Funds" note found in the Notes to Financial Statements section of the most recent Annual or Semi-Annual report.
I Expense ratios reflect operating expenses of the class. Expenses before reductions do not reflect amounts reimbursed, waived, or reduced through arrangements with the investment adviser, brokerage services, or other offset arrangements, if applicable, and do not represent the amount paid by the class during periods when reimbursements, waivers or reductions occur.
J Annualized
K Amount does not include the portfolio activity of any underlying mutual funds or exchange-traded funds (ETFs).
See accompanying notes which are an integral part of the financial statements.
Fidelity Advisor Biotechnology Fund Class M
| | Six months ended (Unaudited) January 31, | Years endedJuly 31, | | | | |
| | 2022 | 2021 | 2020 | 2019 | 2018 | 2017 |
| Selected Per–Share Data | | | | | | |
| Net asset value, beginning of period | $30.35 | $29.08 | $24.02 | $26.32 | $23.22 | $20.39 |
| Income from Investment Operations | | | | | | |
| Net investment income (loss)A,B | (.07) | (.02) | (.05) | (.04) | (.21) | (.21)C |
| Net realized and unrealized gain (loss) | (3.20) | 4.14 | 6.96 | (1.67) | 3.31 | 3.04 |
| Total from investment operations | (3.27) | 4.12 | 6.91 | (1.71) | 3.10 | 2.83 |
| Distributions from net investment income | (.07) | (.07) | – | – | – | – |
| Distributions from net realized gain | (5.25) | (2.78) | (1.85) | (.59) | – | – |
| Total distributions | (5.32) | (2.85) | (1.85) | (.59) | – | – |
| Redemption fees added to paid in capitalA | – | – | – | – | – | –D |
| Net asset value, end of period | $21.76 | $30.35 | $29.08 | $24.02 | $26.32 | $23.22 |
| Total ReturnE,F,G | (12.80)% | 13.69% | 29.64% | (6.44)% | 13.35% | 13.88% |
| Ratios to Average Net AssetsB,H,I | | | | | | |
| Expenses before reductions | 1.27%J | 1.28% | 1.32% | 1.34% | 1.38% | 1.38% |
| Expenses net of fee waivers, if any | 1.27%J | 1.28% | 1.32% | 1.34% | 1.38% | 1.38% |
| Expenses net of all reductions | 1.27%J | 1.28% | 1.31% | 1.34% | 1.38% | 1.38% |
| Net investment income (loss) | (.50)%J | (.07)% | (.18)% | (.18)% | (.84)% | (1.02)%C |
| Supplemental Data | | | | | | |
| Net assets, end of period (000 omitted) | $132,328 | $161,619 | $144,568 | $119,312 | $135,879 | $127,734 |
| Portfolio turnover rateK | 51%J | 72% | 66% | 62% | 45% | 30% |
A Calculated based on average shares outstanding during the period.
B Net investment income (loss) is affected by the timing of the declaration of dividends by any underlying mutual funds or exchange-traded funds (ETFs). Net investment income (loss) of any such underlying funds is not included in the Fund's net investment income (loss) ratio.
C Net investment income per share reflects one or more large, non-recurring dividend(s) which amounted to $.01 per share. Excluding such non-recurring dividend(s), the ratio of net investment income (loss) to average net assets would have been (1.05) %.
D Amount represents less than $.005 per share.
E Total returns for periods of less than one year are not annualized.
F Total returns would have been lower if certain expenses had not been reduced during the applicable periods shown.
G Total returns do not include the effect of the sales charges.
H Fees and expenses of any underlying mutual funds or exchange-traded funds (ETFs) are not included in the Fund's expense ratio. The Fund indirectly bears its proportionate share of these expenses. For additional expense information related to investments in Fidelity Central Funds, please refer to the "Investments in Fidelity Central Funds" note found in the Notes to Financial Statements section of the most recent Annual or Semi-Annual report.
I Expense ratios reflect operating expenses of the class. Expenses before reductions do not reflect amounts reimbursed, waived, or reduced through arrangements with the investment adviser, brokerage services, or other offset arrangements, if applicable, and do not represent the amount paid by the class during periods when reimbursements, waivers or reductions occur.
J Annualized
K Amount does not include the portfolio activity of any underlying mutual funds or exchange-traded funds (ETFs).
See accompanying notes which are an integral part of the financial statements.
Fidelity Advisor Biotechnology Fund Class C
| | Six months ended (Unaudited) January 31, | Years endedJuly 31, | | | | |
| | 2022 | 2021 | 2020 | 2019 | 2018 | 2017 |
| Selected Per–Share Data | | | | | | |
| Net asset value, beginning of period | $26.79 | $25.97 | $21.71 | $23.96 | $21.23 | $18.71 |
| Income from Investment Operations | | | | | | |
| Net investment income (loss)A,B | (.13) | (.15) | (.15) | (.14) | (.29) | (.27)C |
| Net realized and unrealized gain (loss) | (2.74) | 3.71 | 6.26 | (1.52) | 3.02 | 2.79 |
| Total from investment operations | (2.87) | 3.56 | 6.11 | (1.66) | 2.73 | 2.52 |
| Distributions from net investment income | – | (.01) | – | – | – | – |
| Distributions from net realized gain | (5.24) | (2.73) | (1.85) | (.59) | – | – |
| Total distributions | (5.24) | (2.74) | (1.85) | (.59) | – | – |
| Redemption fees added to paid in capitalA | – | – | – | – | – | –D |
| Net asset value, end of period | $18.68 | $26.79 | $25.97 | $21.71 | $23.96 | $21.23 |
| Total ReturnE,F,G | (12.97)% | 13.15% | 29.07% | (6.87)% | 12.86% | 13.47% |
| Ratios to Average Net AssetsB,H,I | | | | | | |
| Expenses before reductions | 1.75%J | 1.75% | 1.77% | 1.78% | 1.80% | 1.79% |
| Expenses net of fee waivers, if any | 1.74%J | 1.75% | 1.77% | 1.77% | 1.80% | 1.79% |
| Expenses net of all reductions | 1.74%J | 1.75% | 1.76% | 1.77% | 1.80% | 1.79% |
| Net investment income (loss) | (.98)%J | (.55)% | (.63)% | (.61)% | (1.27)% | (1.43)%C |
| Supplemental Data | | | | | | |
| Net assets, end of period (000 omitted) | $231,710 | $328,417 | $384,420 | $398,749 | $558,420 | $593,489 |
| Portfolio turnover rateK | 51%J | 72% | 66% | 62% | 45% | 30% |
A Calculated based on average shares outstanding during the period.
B Net investment income (loss) is affected by the timing of the declaration of dividends by any underlying mutual funds or exchange-traded funds (ETFs). Net investment income (loss) of any such underlying funds is not included in the Fund's net investment income (loss) ratio.
C Net investment income per share reflects one or more large, non-recurring dividend(s) which amounted to $.01 per share. Excluding such non-recurring dividend(s), the ratio of net investment income (loss) to average net assets would have been (1.46) %.
D Amount represents less than $.005 per share.
E Total returns for periods of less than one year are not annualized.
F Total returns would have been lower if certain expenses had not been reduced during the applicable periods shown.
G Total returns do not include the effect of the contingent deferred sales charge.
H Fees and expenses of any underlying mutual funds or exchange-traded funds (ETFs) are not included in the Fund's expense ratio. The Fund indirectly bears its proportionate share of these expenses. For additional expense information related to investments in Fidelity Central Funds, please refer to the "Investments in Fidelity Central Funds" note found in the Notes to Financial Statements section of the most recent Annual or Semi-Annual report.
I Expense ratios reflect operating expenses of the class. Expenses before reductions do not reflect amounts reimbursed, waived, or reduced through arrangements with the investment adviser, brokerage services, or other offset arrangements, if applicable, and do not represent the amount paid by the class during periods when reimbursements, waivers or reductions occur.
J Annualized
K Amount does not include the portfolio activity of any underlying mutual funds or exchange-traded funds (ETFs).
See accompanying notes which are an integral part of the financial statements.
Fidelity Advisor Biotechnology Fund Class I
| | Six months ended (Unaudited) January 31, | Years endedJuly 31, | | | | |
| | 2022 | 2021 | 2020 | 2019 | 2018 | 2017 |
| Selected Per–Share Data | | | | | | |
| Net asset value, beginning of period | $35.00 | $33.16 | $27.08 | $29.42 | $25.80 | $22.52 |
| Income from Investment Operations | | | | | | |
| Net investment income (loss)A,B | .01 | .17 | .11 | .11 | (.07) | (.10)C |
| Net realized and unrealized gain (loss) | (3.78) | 4.72 | 7.88 | (1.86) | 3.69 | 3.38 |
| Total from investment operations | (3.77) | 4.89 | 7.99 | (1.75) | 3.62 | 3.28 |
| Distributions from net investment income | (.16) | (.21) | – | – | – | – |
| Distributions from net realized gain | (5.25) | (2.85) | (1.91) | (.59) | – | – |
| Total distributions | (5.41) | (3.05)D | (1.91) | (.59) | – | – |
| Redemption fees added to paid in capitalA | – | – | – | – | – | –E |
| Net asset value, end of period | $25.82 | $35.00 | $33.16 | $27.08 | $29.42 | $25.80 |
| Total ReturnF,G | (12.54)% | 14.34% | 30.32% | (5.89)% | 14.03% | 14.56% |
| Ratios to Average Net AssetsB,H,I | | | | | | |
| Expenses before reductions | .74%J | .74% | .75% | .76% | .79% | .78% |
| Expenses net of fee waivers, if any | .73%J | .74% | .75% | .76% | .79% | .78% |
| Expenses net of all reductions | .73%J | .74% | .75% | .76% | .79% | .77% |
| Net investment income (loss) | .03%J | .47% | .38% | .40% | (.26)% | (.42)%C |
| Supplemental Data | | | | | | |
| Net assets, end of period (000 omitted) | $844,622 | $1,129,492 | $1,092,145 | $1,006,084 | $1,307,833 | $1,156,358 |
| Portfolio turnover rateK | 51%J | 72% | 66% | 62% | 45% | 30% |
A Calculated based on average shares outstanding during the period.
B Net investment income (loss) is affected by the timing of the declaration of dividends by any underlying mutual funds or exchange-traded funds (ETFs). Net investment income (loss) of any such underlying funds is not included in the Fund's net investment income (loss) ratio.
C Net investment income per share reflects one or more large, non-recurring dividend(s) which amounted to $.01 per share. Excluding such non-recurring dividend(s), the ratio of net investment income (loss) to average net assets would have been (.44) %.
D Total distributions per share do not sum due to rounding.
E Amount represents less than $.005 per share.
F Total returns for periods of less than one year are not annualized.
G Total returns would have been lower if certain expenses had not been reduced during the applicable periods shown.
H Fees and expenses of any underlying mutual funds or exchange-traded funds (ETFs) are not included in the Fund's expense ratio. The Fund indirectly bears its proportionate share of these expenses. For additional expense information related to investments in Fidelity Central Funds, please refer to the "Investments in Fidelity Central Funds" note found in the Notes to Financial Statements section of the most recent Annual or Semi-Annual report.
I Expense ratios reflect operating expenses of the class. Expenses before reductions do not reflect amounts reimbursed, waived, or reduced through arrangements with the investment adviser, brokerage services, or other offset arrangements, if applicable, and do not represent the amount paid by the class during periods when reimbursements, waivers or reductions occur.
J Annualized
K Amount does not include the portfolio activity of any underlying mutual funds or exchange-traded funds (ETFs).
See accompanying notes which are an integral part of the financial statements.
Fidelity Advisor Biotechnology Fund Class Z
| | Six months ended (Unaudited) January 31, | Years endedJuly 31, | | |
| | 2022 | 2021 | 2020 | 2019 A |
| Selected Per–Share Data | | | | |
| Net asset value, beginning of period | $35.05 | $33.22 | $27.10 | $30.06 |
| Income from Investment Operations | | | | |
| Net investment income (loss)B,C | .03 | .21 | .15 | .16 |
| Net realized and unrealized gain (loss) | (3.79) | 4.74 | 7.90 | (2.53) |
| Total from investment operations | (3.76) | 4.95 | 8.05 | (2.37) |
| Distributions from net investment income | (.19) | (.26) | (.02) | – |
| Distributions from net realized gain | (5.25) | (2.87) | (1.91) | (.59) |
| Total distributions | (5.44) | (3.12)D | (1.93) | (.59) |
| Redemption fees added to paid in capitalB | – | – | – | – |
| Net asset value, end of period | $25.85 | $35.05 | $33.22 | $27.10 |
| Total ReturnE,F | (12.51)% | 14.49% | 30.53% | (7.83)% |
| Ratios to Average Net AssetsC,G,H | | | | |
| Expenses before reductions | .61%I | .61% | .62% | .63%I |
| Expenses net of fee waivers, if any | .61%I | .61% | .62% | .63%I |
| Expenses net of all reductions | .61%I | .61% | .62% | .62%I |
| Net investment income (loss) | .16%I | .60% | .51% | .73%I |
| Supplemental Data | | | | |
| Net assets, end of period (000 omitted) | $72,397 | $89,641 | $62,743 | $30,116 |
| Portfolio turnover rateJ | 51%I | 72% | 66% | 62%I |
A For the period October 2, 2018 (commencement of sale of shares) through July 31, 2019.
B Calculated based on average shares outstanding during the period.
C Net investment income (loss) is affected by the timing of the declaration of dividends by any underlying mutual funds or exchange-traded funds (ETFs). Net investment income (loss) of any such underlying funds is not included in the Fund's net investment income (loss) ratio.
D Total distributions per share do not sum due to rounding.
E Total returns for periods of less than one year are not annualized.
F Total returns would have been lower if certain expenses had not been reduced during the applicable periods shown.
G Fees and expenses of any underlying mutual funds or exchange-traded funds (ETFs) are not included in the Fund's expense ratio. The Fund indirectly bears its proportionate share of these expenses. For additional expense information related to investments in Fidelity Central Funds, please refer to the "Investments in Fidelity Central Funds" note found in the Notes to Financial Statements section of the most recent Annual or Semi-Annual report.
H Expense ratios reflect operating expenses of the class. Expenses before reductions do not reflect amounts reimbursed, waived, or reduced through arrangements with the investment adviser, brokerage services, or other offset arrangements, if applicable, and do not represent the amount paid by the class during periods when reimbursements, waivers or reductions occur.
I Annualized
J Amount does not include the portfolio activity of any underlying mutual funds or exchange-traded funds (ETFs).
See accompanying notes which are an integral part of the financial statements.
Fidelity Advisor® Consumer Discretionary Fund
Investment Summary (Unaudited)
Top Ten Stocks as of January 31, 2022
| | % of fund's net assets |
| Amazon.com, Inc. | 22.4 |
| Tesla, Inc. | 10.1 |
| The Home Depot, Inc. | 5.2 |
| Capri Holdings Ltd. | 4.3 |
| NIKE, Inc. Class B | 4.3 |
| Lowe's Companies, Inc. | 4.1 |
| Booking Holdings, Inc. | 3.2 |
| Burlington Stores, Inc. | 2.4 |
| PVH Corp. | 2.3 |
| Hilton Worldwide Holdings, Inc. | 2.2 |
| | 60.5 |
Top Industries (% of fund's net assets)
| As of January 31, 2022 |
| | Internet & Direct Marketing Retail | 24.1% |
| | Specialty Retail | 20.9% |
| | Textiles, Apparel & Luxury Goods | 17.8% |
| | Hotels, Restaurants & Leisure | 16.7% |
| | Automobiles | 10.6% |
| | All Others* | 9.9% |
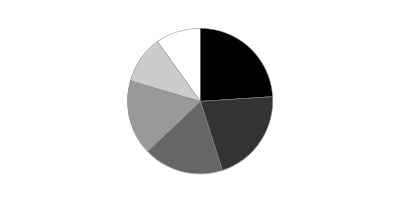
* Includes short-term investments and net other assets (liabilities).
Fidelity Advisor® Consumer Discretionary Fund
Schedule of Investments January 31, 2022 (Unaudited)
Showing Percentage of Net Assets
| Common Stocks - 99.8% | | | |
| | | Shares | Value |
| Auto Components - 0.3% | | | |
| Auto Parts & Equipment - 0.3% | | | |
| Adient PLC (a) | | 48,131 | $2,020,058 |
| Automobiles - 10.6% | | | |
| Automobile Manufacturers - 10.6% | | | |
| Ferrari NV | | 11,203 | 2,587,445 |
| Rivian Automotive, Inc. | | 6,400 | 420,736 |
| Tesla, Inc. (a) | | 64,300 | 60,231,096 |
| | | | 63,239,277 |
| Building Products - 0.3% | | | |
| Building Products - 0.3% | | | |
| The AZEK Co., Inc. (a) | | 50,800 | 1,677,924 |
| Commercial Services & Supplies - 0.2% | | | |
| Diversified Support Services - 0.2% | | | |
| Copart, Inc. (a) | | 11,551 | 1,492,967 |
| Food & Staples Retailing - 0.8% | | | |
| Food Distributors - 0.8% | | | |
| Performance Food Group Co. (a) | | 114,808 | 4,843,750 |
| Hotels, Restaurants & Leisure - 16.7% | | | |
| Casinos & Gaming - 3.1% | | | |
| Caesars Entertainment, Inc. (a) | | 109,885 | 8,366,644 |
| Churchill Downs, Inc. | | 35,209 | 7,404,453 |
| Penn National Gaming, Inc. (a) | | 62,800 | 2,864,308 |
| | | | 18,635,405 |
| Hotels, Resorts & Cruise Lines - 8.4% | | | |
| Airbnb, Inc. Class A (a) | | 22,500 | 3,464,325 |
| Booking Holdings, Inc. (a) | | 7,950 | 19,526,234 |
| Hilton Worldwide Holdings, Inc. (a) | | 90,600 | 13,146,966 |
| Lindblad Expeditions Holdings (a) | | 98,059 | 1,654,255 |
| Marriott International, Inc. Class A (a) | | 77,870 | 12,546,414 |
| | | | 50,338,194 |
| Leisure Facilities - 0.9% | | | |
| Planet Fitness, Inc. (a) | | 33,843 | 2,999,844 |
| Vail Resorts, Inc. | | 8,817 | 2,443,191 |
| | | | 5,443,035 |
| Restaurants - 4.3% | | | |
| ARAMARK Holdings Corp. | | 134,899 | 4,625,687 |
| Brinker International, Inc. (a) | | 40,000 | 1,328,400 |
| Chipotle Mexican Grill, Inc. (a) | | 3,628 | 5,389,684 |
| Domino's Pizza, Inc. | | 7,100 | 3,228,015 |
| McDonald's Corp. | | 15,308 | 3,971,661 |
| Noodles & Co. (a) | | 188,513 | 1,585,394 |
| Restaurant Brands International, Inc. | | 36,600 | 2,047,170 |
| Ruth's Hospitality Group, Inc. | | 36,331 | 727,710 |
| Starbucks Corp. | | 19,179 | 1,885,679 |
| Wingstop, Inc. | | 3,600 | 551,700 |
| | | | 25,341,100 |
|
| TOTAL HOTELS, RESTAURANTS & LEISURE | | | 99,757,734 |
|
| Household Durables - 2.1% | | | |
| Home Furnishings - 0.4% | | | |
| Tempur Sealy International, Inc. | | 63,000 | 2,508,030 |
| Homebuilding - 1.7% | | | |
| D.R. Horton, Inc. | | 53,019 | 4,730,355 |
| Lennar Corp. Class A | | 54,007 | 5,190,613 |
| | | | 9,920,968 |
|
| TOTAL HOUSEHOLD DURABLES | | | 12,428,998 |
|
| Interactive Media & Services - 0.6% | | | |
| Interactive Media & Services - 0.6% | | | |
| Alphabet, Inc. Class A (a) | | 1,253 | 3,390,706 |
| Internet & Direct Marketing Retail - 24.1% | | | |
| Internet & Direct Marketing Retail - 24.1% | | | |
| Amazon.com, Inc. (a) | | 44,750 | 133,868,280 |
| eBay, Inc. | | 117,900 | 7,082,253 |
| Farfetch Ltd. Class A (a)(b) | | 32,491 | 705,380 |
| Global-e Online Ltd. (a) | | 41,600 | 1,485,536 |
| Wayfair LLC Class A (a) | | 6,719 | 1,047,626 |
| | | | 144,189,075 |
| Multiline Retail - 5.1% | | | |
| Department Stores - 0.8% | | | |
| Kohl's Corp. | | 38,600 | 2,304,806 |
| Nordstrom, Inc. (a) | | 96,900 | 2,180,250 |
| | | | 4,485,056 |
| General Merchandise Stores - 4.3% | | | |
| B&M European Value Retail SA | | 101,076 | 774,002 |
| Dollar General Corp. | | 41,058 | 8,559,772 |
| Dollar Tree, Inc. (a) | | 51,016 | 6,694,320 |
| Ollie's Bargain Outlet Holdings, Inc. (a) | | 63,643 | 3,051,045 |
| Target Corp. | | 31,000 | 6,833,330 |
| | | | 25,912,469 |
|
| TOTAL MULTILINE RETAIL | | | 30,397,525 |
|
| Road & Rail - 0.3% | | | |
| Trucking - 0.3% | | | |
| Lyft, Inc. (a) | | 51,752 | 1,993,487 |
| Specialty Retail - 20.9% | | | |
| Apparel Retail - 7.6% | | | |
| American Eagle Outfitters, Inc. (b) | | 260,400 | 5,944,932 |
| Aritzia, Inc. (a) | | 33,400 | 1,549,462 |
| Burlington Stores, Inc. (a) | | 61,725 | 14,624,504 |
| Ross Stores, Inc. | | 72,211 | 7,058,625 |
| TJX Companies, Inc. | | 170,948 | 12,303,128 |
| Torrid Holdings, Inc. | | 10,261 | 94,401 |
| Victoria's Secret & Co. (a) | | 64,866 | 3,621,469 |
| | | | 45,196,521 |
| Automotive Retail - 0.5% | | | |
| Carvana Co. Class A (a) | | 18,315 | 2,968,129 |
| Home Improvement Retail - 10.4% | | | |
| Floor & Decor Holdings, Inc. Class A (a) | | 60,677 | 6,596,803 |
| Lowe's Companies, Inc. | | 101,872 | 24,179,319 |
| The Home Depot, Inc. | | 85,318 | 31,310,000 |
| | | | 62,086,122 |
| Specialty Stores - 2.4% | | | |
| Academy Sports & Outdoors, Inc. (a) | | 41,867 | 1,628,626 |
| Bath & Body Works, Inc. | | 49,133 | 2,754,887 |
| Dick's Sporting Goods, Inc. | | 24,800 | 2,861,920 |
| Five Below, Inc. (a) | | 37,463 | 6,143,932 |
| Sally Beauty Holdings, Inc. (a) | | 60,400 | 1,037,068 |
| | | | 14,426,433 |
|
| TOTAL SPECIALTY RETAIL | | | 124,677,205 |
|
| Textiles, Apparel & Luxury Goods - 17.8% | | | |
| Apparel, Accessories & Luxury Goods - 11.9% | | | |
| adidas AG | | 9,984 | 2,739,783 |
| Canada Goose Holdings, Inc. (a) | | 16,066 | 492,919 |
| Capri Holdings Ltd. (a)(b) | | 429,179 | 25,780,783 |
| Kontoor Brands, Inc. | | 54,545 | 2,688,523 |
| Levi Strauss & Co. Class A | | 108,200 | 2,372,826 |
| lululemon athletica, Inc. (a) | | 14,058 | 4,691,998 |
| LVMH Moet Hennessy Louis Vuitton SE | | 4,115 | 3,379,968 |
| PVH Corp. | | 141,916 | 13,483,439 |
| Ralph Lauren Corp. | | 27,000 | 2,992,680 |
| Tapestry, Inc. | | 322,152 | 12,225,668 |
| | | | 70,848,587 |
| Footwear - 5.9% | | | |
| Crocs, Inc. (a) | | 12,700 | 1,303,274 |
| Deckers Outdoor Corp. (a) | | 24,427 | 7,822,258 |
| NIKE, Inc. Class B | | 171,554 | 25,402,001 |
| On Holding AG | | 3,600 | 94,932 |
| Skechers U.S.A., Inc. Class A (sub. vtg.) (a) | | 19,500 | 819,000 |
| | | | 35,441,465 |
|
| TOTAL TEXTILES, APPAREL & LUXURY GOODS | | | 106,290,052 |
|
| TOTAL COMMON STOCKS | | | |
| (Cost $351,362,450) | | | 596,398,758 |
|
| Money Market Funds - 1.1% | | | |
| Fidelity Securities Lending Cash Central Fund 0.08% (c)(d) | | | |
| (Cost $6,314,900) | | 6,314,269 | 6,314,900 |
| TOTAL INVESTMENT IN SECURITIES - 100.9% | | | |
| (Cost $357,677,350) | | | 602,713,658 |
| NET OTHER ASSETS (LIABILITIES) - (0.9)% | | | (5,224,984) |
| NET ASSETS - 100% | | | $597,488,674 |
Legend
(a) Non-income producing
(b) Security or a portion of the security is on loan at period end.
(c) Investment made with cash collateral received from securities on loan.
(d) Affiliated fund that is generally available only to investment companies and other accounts managed by Fidelity Investments. The rate quoted is the annualized seven-day yield of the fund at period end. A complete unaudited listing of the fund's holdings as of its most recent quarter end is available upon request. In addition, each Fidelity Central Fund's financial statements are available on the SEC's website or upon request.
Affiliated Central Funds
Fiscal year to date information regarding the Fund's investments in Fidelity Central Funds, including the ownership percentage, is presented below.
| Fund | Value, beginning of period | Purchases | Sales Proceeds | Dividend Income | Realized Gain/Loss | Change in Unrealized appreciation (depreciation) | Value, end of period | % ownership, end of period |
| Fidelity Cash Central Fund 0.08% | $-- | $22,445,658 | $22,445,658 | $195 | $-- | $-- | $-- | 0.0% |
| Fidelity Securities Lending Cash Central Fund 0.08% | 13,937,765 | 52,364,136 | 59,987,001 | 7,976 | -- | -- | 6,314,900 | 0.0% |
| Total | $13,937,765 | $74,809,794 | $82,432,659 | $8,171 | $-- | $-- | $6,314,900 | |
Amounts in the income column in the above table include any capital gain distributions from underlying funds, which are presented in the corresponding line-item in the Statement of Operations, if applicable. Amount for Fidelity Securities Lending Cash Central Fund represents the income earned on investing cash collateral, less rebates paid to borrowers and any lending agent fees associated with the loan, plus any premium payments received for lending certain types of securities.
Investment Valuation
The following is a summary of the inputs used, as of January 31, 2022, involving the Fund's assets and liabilities carried at fair value. The inputs or methodology used for valuing securities may not be an indication of the risk associated with investing in those securities. For more information on valuation inputs, and their aggregation into the levels used below, please refer to the Investment Valuation section in the accompanying Notes to Financial Statements.
| | Valuation Inputs at Reporting Date: |
| Description | Total | Level 1 | Level 2 | Level 3 |
| Investments in Securities: | | | | |
| Common Stocks | $596,398,758 | $589,505,005 | $6,893,753 | $-- |
| Money Market Funds | 6,314,900 | 6,314,900 | -- | -- |
| Total Investments in Securities: | $602,713,658 | $595,819,905 | $6,893,753 | $-- |
See accompanying notes which are an integral part of the financial statements.
Fidelity Advisor® Consumer Discretionary Fund
Financial Statements
Statement of Assets and Liabilities
| | | January 31, 2022 (Unaudited) |
| Assets | | |
Investment in securities, at value (including securities loaned of $6,298,187) — See accompanying schedule:
Unaffiliated issuers (cost $351,362,450) | $596,398,758 | |
| Fidelity Central Funds (cost $6,314,900) | 6,314,900 | |
| Total Investment in Securities (cost $357,677,350) | | $602,713,658 |
| Receivable for investments sold | | 3,983,863 |
| Receivable for fund shares sold | | 252,270 |
| Dividends receivable | | 108,284 |
| Distributions receivable from Fidelity Central Funds | | 939 |
| Prepaid expenses | | 1,890 |
| Other receivables | | 2,711 |
| Total assets | | 607,063,615 |
| Liabilities | | |
| Payable to custodian bank | $151,253 | |
| Payable for investments purchased | 272,221 | |
| Payable for fund shares redeemed | 651,622 | |
| Accrued management fee | 281,412 | |
| Distribution and service plan fees payable | 136,147 | |
| Notes payable to affiliates | 1,625,000 | |
| Other affiliated payables | 110,166 | |
| Other payables and accrued expenses | 32,395 | |
| Collateral on securities loaned | 6,314,725 | |
| Total liabilities | | 9,574,941 |
| Net Assets | | $597,488,674 |
| Net Assets consist of: | | |
| Paid in capital | | $339,260,569 |
| Total accumulated earnings (loss) | | 258,228,105 |
| Net Assets | | $597,488,674 |
| Net Asset Value and Maximum Offering Price | | |
| Class A: | | |
| Net Asset Value and redemption price per share ($237,956,279 ÷ 5,833,204 shares)(a) | | $40.79 |
| Maximum offering price per share (100/94.25 of $40.79) | | $43.28 |
| Class M: | | |
| Net Asset Value and redemption price per share ($44,318,892 ÷ 1,180,800 shares)(a) | | $37.53 |
| Maximum offering price per share (100/96.50 of $37.53) | | $38.89 |
| Class C: | | |
| Net Asset Value and offering price per share ($75,183,964 ÷ 2,390,027 shares)(a) | | $31.46 |
| Class I: | | |
| Net Asset Value, offering price and redemption price per share ($187,664,737 ÷ 4,199,282 shares) | | $44.69 |
| Class Z: | | |
| Net Asset Value, offering price and redemption price per share ($52,364,802 ÷ 1,168,195 shares) | | $44.83 |
(a) Redemption price per share is equal to net asset value less any applicable contingent deferred sales charge.
See accompanying notes which are an integral part of the financial statements.
Statement of Operations
| | | Six months ended January 31, 2022 (Unaudited) |
| Investment Income | | |
| Dividends | | $2,063,915 |
| Income from Fidelity Central Funds (including $7,976 from security lending) | | 8,171 |
| Total income | | 2,072,086 |
| Expenses | | |
| Management fee | $1,877,908 | |
| Transfer agent fees | 560,664 | |
| Distribution and service plan fees | 868,847 | |
| Accounting fees | 127,067 | |
| Custodian fees and expenses | 2,506 | |
| Independent trustees' fees and expenses | 1,285 | |
| Registration fees | 64,595 | |
| Audit | 26,145 | |
| Legal | 1,211 | |
| Interest | 2,865 | |
| Miscellaneous | 1,618 | |
| Total expenses before reductions | 3,534,711 | |
| Expense reductions | (11,065) | |
| Total expenses after reductions | | 3,523,646 |
| Net investment income (loss) | | (1,451,560) |
| Realized and Unrealized Gain (Loss) | | |
| Net realized gain (loss) on: | | |
| Investment securities: | | |
| Unaffiliated issuers | 32,667,957 | |
| Foreign currency transactions | 2,699 | |
| Total net realized gain (loss) | | 32,670,656 |
| Change in net unrealized appreciation (depreciation) on: | | |
| Investment securities: | | |
| Unaffiliated issuers | (62,067,258) | |
| Assets and liabilities in foreign currencies | (589) | |
| Total change in net unrealized appreciation (depreciation) | | (62,067,847) |
| Net gain (loss) | | (29,397,191) |
| Net increase (decrease) in net assets resulting from operations | | $(30,848,751) |
See accompanying notes which are an integral part of the financial statements.
Statement of Changes in Net Assets
| | Six months ended January 31, 2022 (Unaudited) | Year ended July 31, 2021 |
| Increase (Decrease) in Net Assets | | |
| Operations | | |
| Net investment income (loss) | $(1,451,560) | $(2,823,328) |
| Net realized gain (loss) | 32,670,656 | 37,045,808 |
| Change in net unrealized appreciation (depreciation) | (62,067,847) | 139,568,170 |
| Net increase (decrease) in net assets resulting from operations | (30,848,751) | 173,790,650 |
| Distributions to shareholders | (44,840,542) | (7,826,027) |
| Share transactions - net increase (decrease) | (67,636,853) | 132,554,621 |
| Total increase (decrease) in net assets | (143,326,146) | 298,519,244 |
| Net Assets | | |
| Beginning of period | 740,814,820 | 442,295,576 |
| End of period | $597,488,674 | $740,814,820 |
See accompanying notes which are an integral part of the financial statements.
Financial Highlights
Fidelity Advisor Consumer Discretionary Fund Class A
| | Six months ended (Unaudited) January 31, | Years endedJuly 31, | | | | |
| | 2022 | 2021 | 2020 | 2019 | 2018 | 2017 |
| Selected Per–Share Data | | | | | | |
| Net asset value, beginning of period | $45.74 | $33.70 | $29.83 | $28.22 | $22.92 | $20.94 |
| Income from Investment Operations | | | | | | |
| Net investment income (loss)A,B | (.10) | (.20) | (.04) | (.02) | (.02) | .06 |
| Net realized and unrealized gain (loss) | (1.94) | 12.82 | 4.73 | 1.90 | 5.32 | 2.01 |
| Total from investment operations | (2.04) | 12.62 | 4.69 | 1.88 | 5.30 | 2.07 |
| Distributions from net investment income | – | – | – | – | – | (.09) |
| Distributions from net realized gain | (2.91) | (.58) | (.82) | (.27) | – | – |
| Total distributions | (2.91) | (.58) | (.82) | (.27) | – | (.09) |
| Redemption fees added to paid in capitalA | – | – | – | – | – | –C |
| Net asset value, end of period | $40.79 | $45.74 | $33.70 | $29.83 | $28.22 | $22.92 |
| Total ReturnD,E,F | (4.87)% | 37.68% | 16.03% | 6.81% | 23.12% | 9.93% |
| Ratios to Average Net AssetsB,G,H | | | | | | |
| Expenses before reductions | 1.01%I | 1.03% | 1.07% | 1.08% | 1.12% | 1.10% |
| Expenses net of fee waivers, if any | 1.01%I | 1.03% | 1.07% | 1.08% | 1.12% | 1.10% |
| Expenses net of all reductions | 1.01%I | 1.03% | 1.06% | 1.07% | 1.11% | 1.10% |
| Net investment income (loss) | (.43)%I | (.48)% | (.14)% | (.09)% | (.08)% | .26% |
| Supplemental Data | | | | | | |
| Net assets, end of period (000 omitted) | $237,956 | $259,488 | $159,603 | $159,298 | $146,605 | $109,303 |
| Portfolio turnover rateJ | 35%I | 35% | 41%K | 60% | 60% | 47% |
A Calculated based on average shares outstanding during the period.
B Net investment income (loss) is affected by the timing of the declaration of dividends by any underlying mutual funds or exchange-traded funds (ETFs). Net investment income (loss) of any such underlying funds is not included in the Fund's net investment income (loss) ratio.
C Amount represents less than $.005 per share.
D Total returns for periods of less than one year are not annualized.
E Total returns would have been lower if certain expenses had not been reduced during the applicable periods shown.
F Total returns do not include the effect of the sales charges.
G Fees and expenses of any underlying mutual funds or exchange-traded funds (ETFs) are not included in the Fund's expense ratio. The Fund indirectly bears its proportionate share of these expenses. For additional expense information related to investments in Fidelity Central Funds, please refer to the "Investments in Fidelity Central Funds" note found in the Notes to Financial Statements section of the most recent Annual or Semi-Annual report.
H Expense ratios reflect operating expenses of the class. Expenses before reductions do not reflect amounts reimbursed, waived, or reduced through arrangements with the investment adviser, brokerage services, or other offset arrangements, if applicable, and do not represent the amount paid by the class during periods when reimbursements, waivers or reductions occur.
I Annualized
J Amount does not include the portfolio activity of any underlying mutual funds or exchange-traded funds (ETFs).
K Portfolio turnover rate excludes securities received or delivered in-kind.
See accompanying notes which are an integral part of the financial statements.
Fidelity Advisor Consumer Discretionary Fund Class M
| | Six months ended (Unaudited) January 31, | Years endedJuly 31, | | | | |
| | 2022 | 2021 | 2020 | 2019 | 2018 | 2017 |
| Selected Per–Share Data | | | | | | |
| Net asset value, beginning of period | $42.23 | $31.23 | $27.78 | $26.36 | $21.47 | $19.66 |
| Income from Investment Operations | | | | | | |
| Net investment income (loss)A,B | (.15) | (.29) | (.11) | (.09) | (.08) | –C |
| Net realized and unrealized gain (loss) | (1.78) | 11.87 | 4.38 | 1.78 | 4.97 | 1.89 |
| Total from investment operations | (1.93) | 11.58 | 4.27 | 1.69 | 4.89 | 1.89 |
| Distributions from net investment income | – | – | – | – | – | (.08) |
| Distributions from net realized gain | (2.77) | (.58) | (.82) | (.27) | – | – |
| Total distributions | (2.77) | (.58) | (.82) | (.27) | – | (.08) |
| Redemption fees added to paid in capitalA | – | – | – | – | – | –C |
| Net asset value, end of period | $37.53 | $42.23 | $31.23 | $27.78 | $26.36 | $21.47 |
| Total ReturnD,E,F | (4.99)% | 37.32% | 15.70% | 6.56% | 22.78% | 9.62% |
| Ratios to Average Net AssetsB,G,H | | | | | | |
| Expenses before reductions | 1.27%I | 1.30% | 1.34% | 1.34% | 1.38% | 1.39% |
| Expenses net of fee waivers, if any | 1.27%I | 1.30% | 1.34% | 1.34% | 1.38% | 1.39% |
| Expenses net of all reductions | 1.27%I | 1.29% | 1.33% | 1.34% | 1.38% | 1.39% |
| Net investment income (loss) | (.69)%I | (.75)% | (.41)% | (.35)% | (.35)% | (.02)% |
| Supplemental Data | | | | | | |
| Net assets, end of period (000 omitted) | $44,319 | $48,288 | $33,896 | $32,792 | $34,622 | $26,398 |
| Portfolio turnover rateJ | 35%I | 35% | 41%K | 60% | 60% | 47% |
A Calculated based on average shares outstanding during the period.
B Net investment income (loss) is affected by the timing of the declaration of dividends by any underlying mutual funds or exchange-traded funds (ETFs). Net investment income (loss) of any such underlying funds is not included in the Fund's net investment income (loss) ratio.
C Amount represents less than $.005 per share.
D Total returns for periods of less than one year are not annualized.
E Total returns would have been lower if certain expenses had not been reduced during the applicable periods shown.
F Total returns do not include the effect of the sales charges.
G Fees and expenses of any underlying mutual funds or exchange-traded funds (ETFs) are not included in the Fund's expense ratio. The Fund indirectly bears its proportionate share of these expenses. For additional expense information related to investments in Fidelity Central Funds, please refer to the "Investments in Fidelity Central Funds" note found in the Notes to Financial Statements section of the most recent Annual or Semi-Annual report.
H Expense ratios reflect operating expenses of the class. Expenses before reductions do not reflect amounts reimbursed, waived, or reduced through arrangements with the investment adviser, brokerage services, or other offset arrangements, if applicable, and do not represent the amount paid by the class during periods when reimbursements, waivers or reductions occur.
I Annualized
J Amount does not include the portfolio activity of any underlying mutual funds or exchange-traded funds (ETFs).
K Portfolio turnover rate excludes securities received or delivered in-kind.
See accompanying notes which are an integral part of the financial statements.
Fidelity Advisor Consumer Discretionary Fund Class C
| | Six months ended (Unaudited) January 31, | Years endedJuly 31, | | | | |
| | 2022 | 2021 | 2020 | 2019 | 2018 | 2017 |
| Selected Per–Share Data | | | | | | |
| Net asset value, beginning of period | $35.82 | $26.69 | $23.97 | $22.90 | $18.74 | $17.18 |
| Income from Investment Operations | | | | | | |
| Net investment income (loss)A,B | (.21) | (.40) | (.21) | (.19) | (.17) | (.09) |
| Net realized and unrealized gain (loss) | (1.48) | 10.11 | 3.75 | 1.53 | 4.33 | 1.65 |
| Total from investment operations | (1.69) | 9.71 | 3.54 | 1.34 | 4.16 | 1.56 |
| Distributions from net investment income | – | – | – | – | – | – |
| Distributions from net realized gain | (2.67) | (.58) | (.82) | (.27) | – | – |
| Total distributions | (2.67) | (.58) | (.82) | (.27) | – | – |
| Redemption fees added to paid in capitalA | – | – | – | – | – | –C |
| Net asset value, end of period | $31.46 | $35.82 | $26.69 | $23.97 | $22.90 | $18.74 |
| Total ReturnD,E,F | (5.20)% | 36.66% | 15.14% | 6.02% | 22.20% | 9.08% |
| Ratios to Average Net AssetsB,G,H | | | | | | |
| Expenses before reductions | 1.77%I | 1.79% | 1.82% | 1.83% | 1.87% | 1.85% |
| Expenses net of fee waivers, if any | 1.76%I | 1.79% | 1.82% | 1.83% | 1.87% | 1.85% |
| Expenses net of all reductions | 1.76%I | 1.79% | 1.82% | 1.82% | 1.86% | 1.85% |
| Net investment income (loss) | (1.19)%I | (1.24)% | (.90)% | (.83)% | (.83)% | (.49)% |
| Supplemental Data | | | | | | |
| Net assets, end of period (000 omitted) | $75,184 | $85,549 | $65,223 | $70,890 | $71,116 | $59,958 |
| Portfolio turnover rateJ | 35%I | 35% | 41%K | 60% | 60% | 47% |
A Calculated based on average shares outstanding during the period.
B Net investment income (loss) is affected by the timing of the declaration of dividends by any underlying mutual funds or exchange-traded funds (ETFs). Net investment income (loss) of any such underlying funds is not included in the Fund's net investment income (loss) ratio.
C Amount represents less than $.005 per share.
D Total returns for periods of less than one year are not annualized.
E Total returns would have been lower if certain expenses had not been reduced during the applicable periods shown.
F Total returns do not include the effect of the contingent deferred sales charge.
G Fees and expenses of any underlying mutual funds or exchange-traded funds (ETFs) are not included in the Fund's expense ratio. The Fund indirectly bears its proportionate share of these expenses. For additional expense information related to investments in Fidelity Central Funds, please refer to the "Investments in Fidelity Central Funds" note found in the Notes to Financial Statements section of the most recent Annual or Semi-Annual report.
H Expense ratios reflect operating expenses of the class. Expenses before reductions do not reflect amounts reimbursed, waived, or reduced through arrangements with the investment adviser, brokerage services, or other offset arrangements, if applicable, and do not represent the amount paid by the class during periods when reimbursements, waivers or reductions occur.
I Annualized
J Amount does not include the portfolio activity of any underlying mutual funds or exchange-traded funds (ETFs).
K Portfolio turnover rate excludes securities received or delivered in-kind.
See accompanying notes which are an integral part of the financial statements.
Fidelity Advisor Consumer Discretionary Fund Class I
| | Six months ended (Unaudited) January 31, | Years endedJuly 31, | | | | |
| | 2022 | 2021 | 2020 | 2019 | 2018 | 2017 |
| Selected Per–Share Data | | | | | | |
| Net asset value, beginning of period | $49.91 | $36.63 | $32.27 | $30.42 | $24.64 | $22.48 |
| Income from Investment Operations | | | | | | |
| Net investment income (loss)A,B | (.04) | (.10) | .04 | .06 | .06 | .12 |
| Net realized and unrealized gain (loss) | (2.13) | 13.96 | 5.14 | 2.06 | 5.72 | 2.18 |
| Total from investment operations | (2.17) | 13.86 | 5.18 | 2.12 | 5.78 | 2.30 |
| Distributions from net investment income | – | – | – | – | – | (.14) |
| Distributions from net realized gain | (3.05) | (.58) | (.82) | (.27) | – | – |
| Total distributions | (3.05) | (.58) | (.82) | (.27) | – | (.14) |
| Redemption fees added to paid in capitalA | – | – | – | – | – | –C |
| Net asset value, end of period | $44.69 | $49.91 | $36.63 | $32.27 | $30.42 | $24.64 |
| Total ReturnD,E | (4.74)% | 38.05% | 16.34% | 7.10% | 23.46% | 10.27% |
| Ratios to Average Net AssetsB,F,G | | | | | | |
| Expenses before reductions | .75%H | .77% | .79% | .80% | .84% | .83% |
| Expenses net of fee waivers, if any | .75%H | .76% | .79% | .80% | .83% | .83% |
| Expenses net of all reductions | .75%H | .76% | .79% | .80% | .83% | .83% |
| Net investment income (loss) | (.17)%H | (.22)% | .13% | .19% | .20% | .54% |
| Supplemental Data | | | | | | |
| Net assets, end of period (000 omitted) | $187,665 | $259,846 | $134,907 | $159,613 | $152,711 | $82,195 |
| Portfolio turnover rateI | 35%H | 35% | 41%J | 60% | 60% | 47% |
A Calculated based on average shares outstanding during the period.
B Net investment income (loss) is affected by the timing of the declaration of dividends by any underlying mutual funds or exchange-traded funds (ETFs). Net investment income (loss) of any such underlying funds is not included in the Fund's net investment income (loss) ratio.
C Amount represents less than $.005 per share.
D Total returns for periods of less than one year are not annualized.
E Total returns would have been lower if certain expenses had not been reduced during the applicable periods shown.
F Fees and expenses of any underlying mutual funds or exchange-traded funds (ETFs) are not included in the Fund's expense ratio. The Fund indirectly bears its proportionate share of these expenses. For additional expense information related to investments in Fidelity Central Funds, please refer to the "Investments in Fidelity Central Funds" note found in the Notes to Financial Statements section of the most recent Annual or Semi-Annual report.
G Expense ratios reflect operating expenses of the class. Expenses before reductions do not reflect amounts reimbursed, waived, or reduced through arrangements with the investment adviser, brokerage services, or other offset arrangements, if applicable, and do not represent the amount paid by the class during periods when reimbursements, waivers or reductions occur.
H Annualized
I Amount does not include the portfolio activity of any underlying mutual funds or exchange-traded funds (ETFs).
J Portfolio turnover rate excludes securities received or delivered in-kind.
See accompanying notes which are an integral part of the financial statements.
Fidelity Advisor Consumer Discretionary Fund Class Z
| | Six months ended (Unaudited) January 31, | Years endedJuly 31, | | |
| | 2022 | 2021 | 2020 | 2019 A |
| Selected Per–Share Data | | | | |
| Net asset value, beginning of period | $50.10 | $36.72 | $32.31 | $31.56 |
| Income from Investment Operations | | | | |
| Net investment income (loss)B,C | (.01) | (.04) | .09 | .10 |
| Net realized and unrealized gain (loss) | (2.13) | 14.00 | 5.14 | .92 |
| Total from investment operations | (2.14) | 13.96 | 5.23 | 1.02 |
| Distributions from net investment income | – | – | – | – |
| Distributions from net realized gain | (3.13) | (.58) | (.82) | (.27) |
| Total distributions | (3.13) | (.58) | (.82) | (.27) |
| Redemption fees added to paid in capitalB | – | – | – | – |
| Net asset value, end of period | $44.83 | $50.10 | $36.72 | $32.31 |
| Total ReturnD,E | (4.66)% | 38.23% | 16.48% | 3.36% |
| Ratios to Average Net AssetsC,F,G | | | | |
| Expenses before reductions | .63%H | .64% | .66% | .67%H |
| Expenses net of fee waivers, if any | .62%H | .64% | .66% | .66%H |
| Expenses net of all reductions | .62%H | .64% | .66% | .66%H |
| Net investment income (loss) | (.05)%H | (.09)% | .26% | .39%H |
| Supplemental Data | | | | |
| Net assets, end of period (000 omitted) | $52,365 | $87,644 | $48,668 | $6,786 |
| Portfolio turnover rateI | 35%H | 35% | 41%J | 60%H |
A For the period October 2, 2018 (commencement of sale of shares) through July 31, 2019.
B Calculated based on average shares outstanding during the period.
C Net investment income (loss) is affected by the timing of the declaration of dividends by any underlying mutual funds or exchange-traded funds (ETFs). Net investment income (loss) of any such underlying funds is not included in the Fund's net investment income (loss) ratio.
D Total returns for periods of less than one year are not annualized.
E Total returns would have been lower if certain expenses had not been reduced during the applicable periods shown.
F Fees and expenses of any underlying mutual funds or exchange-traded funds (ETFs) are not included in the Fund's expense ratio. The Fund indirectly bears its proportionate share of these expenses. For additional expense information related to investments in Fidelity Central Funds, please refer to the "Investments in Fidelity Central Funds" note found in the Notes to Financial Statements section of the most recent Annual or Semi-Annual report.
G Expense ratios reflect operating expenses of the class. Expenses before reductions do not reflect amounts reimbursed, waived, or reduced through arrangements with the investment adviser, brokerage services, or other offset arrangements, if applicable, and do not represent the amount paid by the class during periods when reimbursements, waivers or reductions occur.
H Annualized
I Amount does not include the portfolio activity of any underlying mutual funds or exchange-traded funds (ETFs).
J Portfolio turnover rate excludes securities received or delivered in-kind.
See accompanying notes which are an integral part of the financial statements.
Fidelity Advisor® Energy Fund
Investment Summary (Unaudited)
Top Ten Stocks as of January 31, 2022
| | % of fund's net assets |
| Exxon Mobil Corp. | 21.9 |
| Chevron Corp. | 8.1 |
| ConocoPhillips Co. | 5.7 |
| Pioneer Natural Resources Co. | 4.6 |
| Canadian Natural Resources Ltd. | 4.5 |
| Devon Energy Corp. | 4.2 |
| Hess Corp. | 4.1 |
| Cheniere Energy, Inc. | 4.0 |
| Cenovus Energy, Inc. (Canada) | 3.1 |
| Valero Energy Corp. | 2.9 |
| | 63.1 |
Top Industries (% of fund's net assets)
| As of January 31, 2022 |
| | Oil, Gas & Consumable Fuels | 91.8% |
| | Energy Equipment & Services | 6.1% |
| | Independent Power and Renewable Electricity Producers | 1.0% |
| | All Others* | 1.1% |

* Includes short-term investments and net other assets (liabilities).
Fidelity Advisor® Energy Fund
Schedule of Investments January 31, 2022 (Unaudited)
Showing Percentage of Net Assets
| Common Stocks - 98.9% | | | |
| | | Shares | Value |
| Energy Equipment & Services - 6.1% | | | |
| Oil & Gas Drilling - 0.3% | | | |
| Nabors Industries Ltd. (a) | | 9,012 | $932,832 |
| Nabors Industries Ltd. warrants 6/11/26 (a) | | 6,604 | 57,884 |
| Odfjell Drilling Ltd. (a) | | 722,656 | 1,702,441 |
| Shelf Drilling Ltd. (a)(b) | | 609,128 | 503,981 |
| | | | 3,197,138 |
| Oil & Gas Equipment & Services - 5.8% | | | |
| Baker Hughes Co. Class A | | 565,500 | 15,517,320 |
| Cactus, Inc. | | 31,900 | 1,545,874 |
| Championx Corp. (a) | | 56,900 | 1,274,560 |
| Nextier Oilfield Solutions, Inc. (a) | | 923,900 | 5,561,878 |
| Oceaneering International, Inc. (a) | | 234,500 | 3,055,535 |
| ProPetro Holding Corp. (a) | | 431,200 | 4,531,912 |
| Schlumberger Ltd. | | 286,018 | 11,174,723 |
| Technip Energies NV (a) | | 207,620 | 3,176,898 |
| TechnipFMC PLC (a) | | 1,208,000 | 7,839,920 |
| | | | 53,678,620 |
|
| TOTAL ENERGY EQUIPMENT & SERVICES | | | 56,875,758 |
|
| Independent Power and Renewable Electricity Producers - 1.0% | | | |
| Independent Power Producers & Energy Traders - 1.0% | | | |
| The AES Corp. | | 38,400 | 851,712 |
| Vistra Corp. | | 393,200 | 8,575,692 |
| | | | 9,427,404 |
| Oil, Gas & Consumable Fuels - 91.8% | | | |
| Coal & Consumable Fuels - 0.2% | | | |
| Enviva, Inc. | | 26,600 | 1,861,468 |
| Integrated Oil & Gas - 38.0% | | | |
| Cenovus Energy, Inc. (Canada) | | 1,963,900 | 28,566,661 |
| Chevron Corp. | | 578,270 | 75,944,199 |
| Exxon Mobil Corp. | | 2,694,761 | 204,694,045 |
| Imperial Oil Ltd. | | 248,900 | 10,183,919 |
| Occidental Petroleum Corp. | | 633,500 | 23,863,945 |
| Occidental Petroleum Corp. warrants 8/3/27 (a) | | 36,987 | 681,301 |
| Suncor Energy, Inc. | | 380,300 | 10,866,142 |
| | | | 354,800,212 |
| Oil & Gas Exploration & Production - 38.6% | | | |
| Antero Resources Corp. (a) | | 576,700 | 11,262,951 |
| APA Corp. | | 503,700 | 16,727,877 |
| Callon Petroleum Co. (a)(c) | | 57,540 | 2,844,778 |
| Canadian Natural Resources Ltd. | | 821,400 | 41,782,421 |
| Chesapeake Energy Corp. | | 58,800 | 4,008,396 |
| Civitas Resources, Inc. (c) | | 100,244 | 5,463,298 |
| ConocoPhillips Co. | | 597,250 | 52,928,295 |
| Coterra Energy, Inc. | | 688,521 | 15,078,610 |
| Devon Energy Corp. | | 770,400 | 38,959,128 |
| Diamondback Energy, Inc. | | 84,300 | 10,635,288 |
| EOG Resources, Inc. | | 220,786 | 24,613,223 |
| Hess Corp. | | 414,300 | 38,235,747 |
| Magnolia Oil & Gas Corp. Class A | | 265,900 | 5,751,417 |
| National Energy Services Reunited Corp. (a) | | 534,000 | 5,302,620 |
| Northern Oil & Gas, Inc. | | 61,030 | 1,435,426 |
| Ovintiv, Inc. | | 233,500 | 9,059,800 |
| PDC Energy, Inc. | | 446,588 | 26,469,271 |
| Pioneer Natural Resources Co. | | 196,625 | 43,039,246 |
| Range Resources Corp. (a) | | 138,800 | 2,671,900 |
| SM Energy Co. | | 84,000 | 2,756,040 |
| Viper Energy Partners LP | | 59,400 | 1,606,176 |
| | | | 360,631,908 |
| Oil & Gas Refining & Marketing - 7.5% | | | |
| Marathon Petroleum Corp. | | 349,378 | 25,067,872 |
| Phillips 66 Co. | | 214,318 | 18,172,023 |
| Renewable Energy Group, Inc. (a) | | 11,700 | 471,042 |
| Valero Energy Corp. | | 320,900 | 26,625,073 |
| | | | 70,336,010 |
| Oil & Gas Storage & Transport - 7.5% | | | |
| Cheniere Energy, Inc. | | 332,500 | 37,206,750 |
| Energy Transfer LP | | 2,072,000 | 19,829,040 |
| Golar LNG Ltd. (a) | | 181,300 | 2,601,655 |
| Targa Resources Corp. | | 166,400 | 9,830,912 |
| | | | 69,468,357 |
|
| TOTAL OIL, GAS & CONSUMABLE FUELS | | | 857,097,955 |
|
| TOTAL COMMON STOCKS | | | |
| (Cost $650,579,028) | | | 923,401,117 |
|
| Money Market Funds - 1.9% | | | |
| Fidelity Cash Central Fund 0.08% (d) | | 14,970,036 | 14,973,030 |
| Fidelity Securities Lending Cash Central Fund 0.08% (d)(e) | | 3,103,039 | 3,103,349 |
| TOTAL MONEY MARKET FUNDS | | | |
| (Cost $18,076,379) | | | 18,076,379 |
| TOTAL INVESTMENT IN SECURITIES - 100.8% | | | |
| (Cost $668,655,407) | | | 941,477,496 |
| NET OTHER ASSETS (LIABILITIES) - (0.8)% | | | (7,899,796) |
| NET ASSETS - 100% | | | $933,577,700 |
Legend
(a) Non-income producing
(b) Security exempt from registration under Rule 144A of the Securities Act of 1933. These securities may be resold in transactions exempt from registration, normally to qualified institutional buyers. At the end of the period, the value of these securities amounted to $503,981 or 0.1% of net assets.
(c) Security or a portion of the security is on loan at period end.
(d) Affiliated fund that is generally available only to investment companies and other accounts managed by Fidelity Investments. The rate quoted is the annualized seven-day yield of the fund at period end. A complete unaudited listing of the fund's holdings as of its most recent quarter end is available upon request. In addition, each Fidelity Central Fund's financial statements are available on the SEC's website or upon request.
(e) Investment made with cash collateral received from securities on loan.
Affiliated Central Funds
Fiscal year to date information regarding the Fund's investments in Fidelity Central Funds, including the ownership percentage, is presented below.
| Fund | Value, beginning of period | Purchases | Sales Proceeds | Dividend Income | Realized Gain/Loss | Change in Unrealized appreciation (depreciation) | Value, end of period | % ownership, end of period |
| Fidelity Cash Central Fund 0.08% | $576,142 | $159,248,070 | $144,851,182 | $1,393 | $-- | $-- | $14,973,030 | 0.0% |
| Fidelity Securities Lending Cash Central Fund 0.08% | 1,345,124 | 62,941,528 | 61,183,303 | 9,726 | -- | -- | 3,103,349 | 0.0% |
| Total | $1,921,266 | $222,189,598 | $206,034,485 | $11,119 | $-- | $-- | $18,076,379 | |
Amounts in the income column in the above table include any capital gain distributions from underlying funds, which are presented in the corresponding line-item in the Statement of Operations, if applicable. Amount for Fidelity Securities Lending Cash Central Fund represents the income earned on investing cash collateral, less rebates paid to borrowers and any lending agent fees associated with the loan, plus any premium payments received for lending certain types of securities.
Investment Valuation
The following is a summary of the inputs used, as of January 31, 2022, involving the Fund's assets and liabilities carried at fair value. The inputs or methodology used for valuing securities may not be an indication of the risk associated with investing in those securities. For more information on valuation inputs, and their aggregation into the levels used below, please refer to the Investment Valuation section in the accompanying Notes to Financial Statements.
| | Valuation Inputs at Reporting Date: |
| Description | Total | Level 1 | Level 2 | Level 3 |
| Investments in Securities: | | | | |
| Common Stocks | $923,401,117 | $918,017,797 | $5,383,320 | $-- |
| Money Market Funds | 18,076,379 | 18,076,379 | -- | -- |
| Total Investments in Securities: | $941,477,496 | $936,094,176 | $5,383,320 | $-- |
Other Information
Distribution of investments by country or territory of incorporation, as a percentage of Total Net Assets, is as follows (Unaudited):
| United States of America | 86.5% |
| Canada | 9.9% |
| Curacao | 1.2% |
| Others (Individually Less Than 1%) | 2.4% |
| | 100.0% |
See accompanying notes which are an integral part of the financial statements.
Fidelity Advisor® Energy Fund
Financial Statements
Statement of Assets and Liabilities
| | | January 31, 2022 (Unaudited) |
| Assets | | |
Investment in securities, at value (including securities loaned of $3,004,508) — See accompanying schedule:
Unaffiliated issuers (cost $650,579,028) | $923,401,117 | |
| Fidelity Central Funds (cost $18,076,379) | 18,076,379 | |
| Total Investment in Securities (cost $668,655,407) | | $941,477,496 |
| Receivable for investments sold | | 10,031 |
| Receivable for fund shares sold | | 7,132,187 |
| Dividends receivable | | 138,544 |
| Distributions receivable from Fidelity Central Funds | | 1,242 |
| Prepaid expenses | | 3,698 |
| Other receivables | | 153,429 |
| Total assets | | 948,916,627 |
| Liabilities | | |
| Payable for investments purchased | $9,203,223 | |
| Payable for fund shares redeemed | 2,273,729 | |
| Accrued management fee | 359,699 | |
| Distribution and service plan fees payable | 139,126 | |
| Other affiliated payables | 122,465 | |
| Other payables and accrued expenses | 137,660 | |
| Collateral on securities loaned | 3,103,025 | |
| Total liabilities | | 15,338,927 |
| Net Assets | | $933,577,700 |
| Net Assets consist of: | | |
| Paid in capital | | $980,836,966 |
| Total accumulated earnings (loss) | | (47,259,266) |
| Net Assets | | $933,577,700 |
| Net Asset Value and Maximum Offering Price | | |
| Class A: | | |
| Net Asset Value and redemption price per share ($247,783,486 ÷ 7,710,755 shares)(a) | | $32.13 |
| Maximum offering price per share (100/94.25 of $32.13) | | $34.09 |
| Class M: | | |
| Net Asset Value and redemption price per share ($89,376,768 ÷ 2,706,565 shares)(a) | | $33.02 |
| Maximum offering price per share (100/96.50 of $33.02) | | $34.22 |
| Class C: | | |
| Net Asset Value and offering price per share ($72,668,181 ÷ 2,465,620 shares)(a) | | $29.47 |
| Class I: | | |
| Net Asset Value, offering price and redemption price per share ($317,382,510 ÷ 9,337,851 shares) | | $33.99 |
| Class Z: | | |
| Net Asset Value, offering price and redemption price per share ($206,366,755 ÷ 6,086,563 shares) | | $33.91 |
(a) Redemption price per share is equal to net asset value less any applicable contingent deferred sales charge.
See accompanying notes which are an integral part of the financial statements.
Statement of Operations
| | | Six months ended January 31, 2022 (Unaudited) |
| Investment Income | | |
| Dividends | | $11,155,641 |
| Income from Fidelity Central Funds (including $9,726 from security lending) | | 11,119 |
| Total income | | 11,166,760 |
| Expenses | | |
| Management fee | $1,727,783 | |
| Transfer agent fees | 567,609 | |
| Distribution and service plan fees | 728,566 | |
| Accounting fees | 119,193 | |
| Custodian fees and expenses | 6,252 | |
| Independent trustees' fees and expenses | 1,068 | |
| Registration fees | 75,638 | |
| Audit | 34,122 | |
| Legal | 1,783 | |
| Miscellaneous | 1,689 | |
| Total expenses before reductions | 3,263,703 | |
| Expense reductions | (9,636) | |
| Total expenses after reductions | | 3,254,067 |
| Net investment income (loss) | | 7,912,693 |
| Realized and Unrealized Gain (Loss) | | |
| Net realized gain (loss) on: | | |
| Investment securities: | | |
| Unaffiliated issuers | 20,096,643 | |
| Foreign currency transactions | (12,264) | |
| Total net realized gain (loss) | | 20,084,379 |
| Change in net unrealized appreciation (depreciation) on: | | |
| Investment securities: | | |
| Unaffiliated issuers | 195,112,672 | |
| Assets and liabilities in foreign currencies | (1,841) | |
| Total change in net unrealized appreciation (depreciation) | | 195,110,831 |
| Net gain (loss) | | 215,195,210 |
| Net increase (decrease) in net assets resulting from operations | | $223,107,903 |
See accompanying notes which are an integral part of the financial statements.
Statement of Changes in Net Assets
| | Six months ended January 31, 2022 (Unaudited) | Year ended July 31, 2021 |
| Increase (Decrease) in Net Assets | | |
| Operations | | |
| Net investment income (loss) | $7,912,693 | $15,413,377 |
| Net realized gain (loss) | 20,084,379 | (53,594,387) |
| Change in net unrealized appreciation (depreciation) | 195,110,831 | 210,754,325 |
| Net increase (decrease) in net assets resulting from operations | 223,107,903 | 172,573,315 |
| Distributions to shareholders | (14,774,381) | (13,506,451) |
| Share transactions - net increase (decrease) | 172,285,001 | (4,727,059) |
| Total increase (decrease) in net assets | 380,618,523 | 154,339,805 |
| Net Assets | | |
| Beginning of period | 552,959,177 | 398,619,372 |
| End of period | $933,577,700 | $552,959,177 |
See accompanying notes which are an integral part of the financial statements.
Financial Highlights
Fidelity Advisor Energy Fund Class A
| | Six months ended (Unaudited) January 31, | Years endedJuly 31, | | | | |
| | 2022 | 2021 | 2020 | 2019 | 2018 | 2017 |
| Selected Per–Share Data | | | | | | |
| Net asset value, beginning of period | $23.59 | $16.59 | $27.88 | $37.52 | $30.70 | $31.12 |
| Income from Investment Operations | | | | | | |
| Net investment income (loss)A,B | .31 | .65C | .57 | .35 | .12 | .38D |
| Net realized and unrealized gain (loss) | 8.81 | 6.94 | (11.42) | (9.76) | 7.18 | (.72) |
| Total from investment operations | 9.12 | 7.59 | (10.85) | (9.41) | 7.30 | (.34) |
| Distributions from net investment income | (.58) | (.59) | (.44) | (.18)E | (.48) | – |
| Distributions from net realized gain | – | – | – | (.05)E | –F | (.08) |
| Total distributions | (.58) | (.59) | (.44) | (.23) | (.48) | (.08) |
| Redemption fees added to paid in capitalA | – | – | – | – | – | –F |
| Net asset value, end of period | $32.13 | $23.59 | $16.59 | $27.88 | $37.52 | $30.70 |
| Total ReturnG,H,I | 39.23% | 46.78% | (39.54)% | (25.07)% | 24.07% | (1.14)% |
| Ratios to Average Net AssetsB,J,K | | | | | | |
| Expenses before reductions | 1.07%L | 1.11% | 1.14% | 1.10% | 1.11% | 1.09% |
| Expenses net of fee waivers, if any | 1.07%L | 1.11% | 1.14% | 1.10% | 1.11% | 1.09% |
| Expenses net of all reductions | 1.07%L | 1.11% | 1.12% | 1.09% | 1.10% | 1.08% |
| Net investment income (loss) | 2.32%L | 3.15%C | 2.62% | 1.14% | .36% | 1.15%D |
| Supplemental Data | | | | | | |
| Net assets, end of period (000 omitted) | $247,783 | $175,221 | $114,321 | $190,992 | $278,555 | $277,378 |
| Portfolio turnover rateM | 49%L | 45% | 84%N | 47% | 56% | 90% |
A Calculated based on average shares outstanding during the period.
B Net investment income (loss) is affected by the timing of the declaration of dividends by any underlying mutual funds or exchange-traded funds (ETFs). Net investment income (loss) of any such underlying funds is not included in the Fund's net investment income (loss) ratio.
C Net investment income per share reflects one or more large, non-recurring dividend(s) which amounted to $.11 per share. Excluding such non-recurring dividend(s), the ratio of net investment income (loss) to average net assets would have been 2.60%.
D Net investment income per share reflects one or more large, non-recurring dividend(s) which amounted to $.35 per share. Excluding such non-recurring dividend(s), the ratio of net investment income (loss) to average net assets would have been .11%.
E The amount shown reflects reclassifications related to book to tax differences that were made in the year shown.
F Amount represents less than $.005 per share.
G Total returns for periods of less than one year are not annualized.
H Total returns would have been lower if certain expenses had not been reduced during the applicable periods shown.
I Total returns do not include the effect of the sales charges.
J Fees and expenses of any underlying mutual funds or exchange-traded funds (ETFs) are not included in the Fund's expense ratio. The Fund indirectly bears its proportionate share of these expenses. For additional expense information related to investments in Fidelity Central Funds, please refer to the "Investments in Fidelity Central Funds" note found in the Notes to Financial Statements section of the most recent Annual or Semi-Annual report.
K Expense ratios reflect operating expenses of the class. Expenses before reductions do not reflect amounts reimbursed, waived, or reduced through arrangements with the investment adviser, brokerage services, or other offset arrangements, if applicable, and do not represent the amount paid by the class during periods when reimbursements, waivers or reductions occur.
L Annualized
M Amount does not include the portfolio activity of any underlying mutual funds or exchange-traded funds (ETFs).
N Portfolio turnover rate excludes securities received or delivered in-kind.
See accompanying notes which are an integral part of the financial statements.
Fidelity Advisor Energy Fund Class M
| | Six months ended (Unaudited) January 31, | Years endedJuly 31, | | | | |
| | 2022 | 2021 | 2020 | 2019 | 2018 | 2017 |
| Selected Per–Share Data | | | | | | |
| Net asset value, beginning of period | $24.20 | $17.00 | $28.53 | $38.36 | $31.37 | $31.82 |
| Income from Investment Operations | | | | | | |
| Net investment income (loss)A,B | .29 | .60C | .53 | .27 | .03 | .30D |
| Net realized and unrealized gain (loss) | 9.04 | 7.13 | (11.71) | (9.97) | 7.35 | (.75) |
| Total from investment operations | 9.33 | 7.73 | (11.18) | (9.70) | 7.38 | (.45) |
| Distributions from net investment income | (.51) | (.53) | (.35) | (.08)E | (.39) | – |
| Distributions from net realized gain | – | – | – | (.05)E | –F | – |
| Total distributions | (.51) | (.53) | (.35) | (.13) | (.39) | – |
| Redemption fees added to paid in capitalA | – | – | – | – | – | –F |
| Net asset value, end of period | $33.02 | $24.20 | $17.00 | $28.53 | $38.36 | $31.37 |
| Total ReturnG,H,I | 39.04% | 46.37% | (39.66)% | (25.28)% | 23.75% | (1.41)% |
| Ratios to Average Net AssetsB,J,K | | | | | | |
| Expenses before reductions | 1.34%L | 1.38% | 1.40% | 1.37% | 1.38% | 1.36% |
| Expenses net of fee waivers, if any | 1.34%L | 1.38% | 1.40% | 1.36% | 1.38% | 1.36% |
| Expenses net of all reductions | 1.34%L | 1.38% | 1.38% | 1.36% | 1.37% | 1.35% |
| Net investment income (loss) | 2.05%L | 2.88%C | 2.36% | .88% | .09% | .88%D |
| Supplemental Data | | | | | | |
| Net assets, end of period (000 omitted) | $89,377 | $62,519 | $43,768 | $87,147 | $136,828 | $125,951 |
| Portfolio turnover rateM | 49%L | 45% | 84%N | 47% | 56% | 90% |
A Calculated based on average shares outstanding during the period.
B Net investment income (loss) is affected by the timing of the declaration of dividends by any underlying mutual funds or exchange-traded funds (ETFs). Net investment income (loss) of any such underlying funds is not included in the Fund's net investment income (loss) ratio.
C Net investment income per share reflects one or more large, non-recurring dividend(s) which amounted to $.11 per share. Excluding such non-recurring dividend(s), the ratio of net investment income (loss) to average net assets would have been 2.34%.
D Net investment income per share reflects one or more large, non-recurring dividend(s) which amounted to $.35 per share. Excluding such non-recurring dividend(s), the ratio of net investment income (loss) to average net assets would have been (.16) %.
E The amount shown reflects reclassifications related to book to tax differences that were made in the year shown.
F Amount represents less than $.005 per share.
G Total returns for periods of less than one year are not annualized.
H Total returns would have been lower if certain expenses had not been reduced during the applicable periods shown.
I Total returns do not include the effect of the sales charges.
J Fees and expenses of any underlying mutual funds or exchange-traded funds (ETFs) are not included in the Fund's expense ratio. The Fund indirectly bears its proportionate share of these expenses. For additional expense information related to investments in Fidelity Central Funds, please refer to the "Investments in Fidelity Central Funds" note found in the Notes to Financial Statements section of the most recent Annual or Semi-Annual report.
K Expense ratios reflect operating expenses of the class. Expenses before reductions do not reflect amounts reimbursed, waived, or reduced through arrangements with the investment adviser, brokerage services, or other offset arrangements, if applicable, and do not represent the amount paid by the class during periods when reimbursements, waivers or reductions occur.
L Annualized
M Amount does not include the portfolio activity of any underlying mutual funds or exchange-traded funds (ETFs).
N Portfolio turnover rate excludes securities received or delivered in-kind.
See accompanying notes which are an integral part of the financial statements.
Fidelity Advisor Energy Fund Class C
| | Six months ended (Unaudited) January 31, | Years endedJuly 31, | | | | |
| | 2022 | 2021 | 2020 | 2019 | 2018 | 2017 |
| Selected Per–Share Data | | | | | | |
| Net asset value, beginning of period | $21.60 | $15.23 | $25.58 | $34.39 | $28.16 | $28.69 |
| Income from Investment Operations | | | | | | |
| Net investment income (loss)A,B | .20 | .45C | .39 | .12 | (.11) | .13D |
| Net realized and unrealized gain (loss) | 8.08 | 6.38 | (10.52) | (8.93) | 6.59 | (.66) |
| Total from investment operations | 8.28 | 6.83 | (10.13) | (8.81) | 6.48 | (.53) |
| Distributions from net investment income | (.41) | (.46) | (.22) | – | (.24) | – |
| Distributions from net realized gain | – | – | – | – | –E | – |
| Total distributions | (.41) | (.46) | (.22) | – | (.25)F | – |
| Redemption fees added to paid in capitalA | – | – | – | – | – | –E |
| Net asset value, end of period | $29.47 | $21.60 | $15.23 | $25.58 | $34.39 | $28.16 |
| Total ReturnG,H,I | 38.74% | 45.68% | (39.95)% | (25.62)% | 23.16% | (1.85)% |
| Ratios to Average Net AssetsB,J,K | | | | | | |
| Expenses before reductions | 1.80%L | 1.84% | 1.86% | 1.82% | 1.84% | 1.82% |
| Expenses net of fee waivers, if any | 1.80%L | 1.84% | 1.86% | 1.82% | 1.83% | 1.81% |
| Expenses net of all reductions | 1.80%L | 1.84% | 1.84% | 1.81% | 1.83% | 1.80% |
| Net investment income (loss) | 1.59%L | 2.42%C | 1.90% | .42% | (.37)% | .42%D |
| Supplemental Data | | | | | | |
| Net assets, end of period (000 omitted) | $72,668 | $56,068 | $45,212 | $90,437 | $179,521 | $212,105 |
| Portfolio turnover rateM | 49%L | 45% | 84%N | 47% | 56% | 90% |
A Calculated based on average shares outstanding during the period.
B Net investment income (loss) is affected by the timing of the declaration of dividends by any underlying mutual funds or exchange-traded funds (ETFs). Net investment income (loss) of any such underlying funds is not included in the Fund's net investment income (loss) ratio.
C Net investment income per share reflects one or more large, non-recurring dividend(s) which amounted to $.10 per share. Excluding such non-recurring dividend(s), the ratio of net investment income (loss) to average net assets would have been 1.88%.
D Net investment income per share reflects one or more large, non-recurring dividend(s) which amounted to $.32 per share. Excluding such non-recurring dividend(s), the ratio of net investment income (loss) to average net assets would have been (.62) %.
E Amount represents less than $.005 per share.
F Total distributions per share do not sum due to rounding.
G Total returns for periods of less than one year are not annualized.
H Total returns would have been lower if certain expenses had not been reduced during the applicable periods shown.
I Total returns do not include the effect of the contingent deferred sales charge.
J Fees and expenses of any underlying mutual funds or exchange-traded funds (ETFs) are not included in the Fund's expense ratio. The Fund indirectly bears its proportionate share of these expenses. For additional expense information related to investments in Fidelity Central Funds, please refer to the "Investments in Fidelity Central Funds" note found in the Notes to Financial Statements section of the most recent Annual or Semi-Annual report.
K Expense ratios reflect operating expenses of the class. Expenses before reductions do not reflect amounts reimbursed, waived, or reduced through arrangements with the investment adviser, brokerage services, or other offset arrangements, if applicable, and do not represent the amount paid by the class during periods when reimbursements, waivers or reductions occur.
L Annualized
M Amount does not include the portfolio activity of any underlying mutual funds or exchange-traded funds (ETFs).
N Portfolio turnover rate excludes securities received or delivered in-kind.
See accompanying notes which are an integral part of the financial statements.
Fidelity Advisor Energy Fund Class I
| | Six months ended (Unaudited) January 31, | Years endedJuly 31, | | | | |
| | 2022 | 2021 | 2020 | 2019 | 2018 | 2017 |
| Selected Per–Share Data | | | | | | |
| Net asset value, beginning of period | $24.95 | $17.51 | $29.39 | $39.57 | $32.36 | $32.78 |
| Income from Investment Operations | | | | | | |
| Net investment income (loss)A,B | .38 | .74C | .67 | .47 | .23 | .50D |
| Net realized and unrealized gain (loss) | 9.32 | 7.35 | (12.02) | (10.31) | 7.57 | (.75) |
| Total from investment operations | 9.70 | 8.09 | (11.35) | (9.84) | 7.80 | (.25) |
| Distributions from net investment income | (.66) | (.65) | (.53) | (.30)E | (.58) | (.08) |
| Distributions from net realized gain | – | – | – | (.05)E | –F | (.09) |
| Total distributions | (.66) | (.65) | (.53) | (.34)G | (.59)G | (.17) |
| Redemption fees added to paid in capitalA | – | – | – | – | – | –F |
| Net asset value, end of period | $33.99 | $24.95 | $17.51 | $29.39 | $39.57 | $32.36 |
| Total ReturnH,I | 39.46% | 47.26% | (39.33)% | (24.85)% | 24.43% | (.86)% |
| Ratios to Average Net AssetsB,J,K | | | | | | |
| Expenses before reductions | .77%L | .79% | .82% | .80% | .83% | .81% |
| Expenses net of fee waivers, if any | .76%L | .79% | .82% | .80% | .83% | .81% |
| Expenses net of all reductions | .76%L | .79% | .80% | .79% | .82% | .80% |
| Net investment income (loss) | 2.63%L | 3.47%C | 2.95% | 1.44% | .64% | 1.43%D |
| Supplemental Data | | | | | | |
| Net assets, end of period (000 omitted) | $317,383 | $177,248 | $154,575 | $224,599 | $373,714 | $277,385 |
| Portfolio turnover rateM | 49%L | 45% | 84%N | 47% | 56% | 90% |
A Calculated based on average shares outstanding during the period.
B Net investment income (loss) is affected by the timing of the declaration of dividends by any underlying mutual funds or exchange-traded funds (ETFs). Net investment income (loss) of any such underlying funds is not included in the Fund's net investment income (loss) ratio.
C Net investment income per share reflects one or more large, non-recurring dividend(s) which amounted to $.12 per share. Excluding such non-recurring dividend(s), the ratio of net investment income (loss) to average net assets would have been 2.93%.
D Net investment income per share reflects one or more large, non-recurring dividend(s) which amounted to $.36 per share. Excluding such non-recurring dividend(s), the ratio of net investment income (loss) to average net assets would have been .39%.
E The amount shown reflects reclassifications related to book to tax differences that were made in the year shown.
F Amount represents less than $.005 per share.
G Total distributions per share do not sum due to rounding.
H Total returns for periods of less than one year are not annualized.
I Total returns would have been lower if certain expenses had not been reduced during the applicable periods shown.
J Fees and expenses of any underlying mutual funds or exchange-traded funds (ETFs) are not included in the Fund's expense ratio. The Fund indirectly bears its proportionate share of these expenses. For additional expense information related to investments in Fidelity Central Funds, please refer to the "Investments in Fidelity Central Funds" note found in the Notes to Financial Statements section of the most recent Annual or Semi-Annual report.
K Expense ratios reflect operating expenses of the class. Expenses before reductions do not reflect amounts reimbursed, waived, or reduced through arrangements with the investment adviser, brokerage services, or other offset arrangements, if applicable, and do not represent the amount paid by the class during periods when reimbursements, waivers or reductions occur.
L Annualized
M Amount does not include the portfolio activity of any underlying mutual funds or exchange-traded funds (ETFs).
N Portfolio turnover rate excludes securities received or delivered in-kind.
See accompanying notes which are an integral part of the financial statements.
Fidelity Advisor Energy Fund Class Z
| | Six months ended (Unaudited) January 31, | Years endedJuly 31, | | |
| | 2022 | 2021 | 2020 | 2019 A |
| Selected Per–Share Data | | | | |
| Net asset value, beginning of period | $24.91 | $17.48 | $29.35 | $39.35 |
| Income from Investment Operations | | | | |
| Net investment income (loss)B,C | .40 | .80D | .69 | .45 |
| Net realized and unrealized gain (loss) | 9.30 | 7.30 | (11.97) | (10.03) |
| Total from investment operations | 9.70 | 8.10 | (11.28) | (9.58) |
| Distributions from net investment income | (.70) | (.67) | (.59) | (.37)E |
| Distributions from net realized gain | – | – | – | (.05)E |
| Total distributions | (.70) | (.67) | (.59) | (.42) |
| Redemption fees added to paid in capitalB | – | – | – | – |
| Net asset value, end of period | $33.91 | $24.91 | $17.48 | $29.35 |
| Total ReturnF,G | 39.57% | 47.47% | (39.22)% | (24.34)% |
| Ratios to Average Net AssetsC,H,I | | | | |
| Expenses before reductions | .64%J | .65% | .66% | .65%J |
| Expenses net of fee waivers, if any | .64%J | .64% | .66% | .64%J |
| Expenses net of all reductions | .64%J | .64% | .64% | .64%J |
| Net investment income (loss) | 2.76%J | 3.62%D | 3.10% | 1.82%J |
| Supplemental Data | | | | |
| Net assets, end of period (000 omitted) | $206,367 | $81,903 | $40,742 | $9,255 |
| Portfolio turnover rateK | 49%J | 45% | 84%L | 47%J |
A For the period October 2, 2018 (commencement of sale of shares) through July 31, 2019.
B Calculated based on average shares outstanding during the period.
C Net investment income (loss) is affected by the timing of the declaration of dividends by any underlying mutual funds or exchange-traded funds (ETFs). Net investment income (loss) of any such underlying funds is not included in the Fund's net investment income (loss) ratio.
D Net investment income per share reflects one or more large, non-recurring dividend(s) which amounted to $.12 per share. Excluding such non-recurring dividend(s), the ratio of net investment income (loss) to average net assets would have been 3.07%.
E The amount shown reflects reclassifications related to book to tax differences that were made in the year shown.
F Total returns for periods of less than one year are not annualized.
G Total returns would have been lower if certain expenses had not been reduced during the applicable periods shown.
H Fees and expenses of any underlying mutual funds or exchange-traded funds (ETFs) are not included in the Fund's expense ratio. The Fund indirectly bears its proportionate share of these expenses. For additional expense information related to investments in Fidelity Central Funds, please refer to the "Investments in Fidelity Central Funds" note found in the Notes to Financial Statements section of the most recent Annual or Semi-Annual report.
I Expense ratios reflect operating expenses of the class. Expenses before reductions do not reflect amounts reimbursed, waived, or reduced through arrangements with the investment adviser, brokerage services, or other offset arrangements, if applicable, and do not represent the amount paid by the class during periods when reimbursements, waivers or reductions occur.
J Annualized
K Amount does not include the portfolio activity of any underlying mutual funds or exchange-traded funds (ETFs).
L Portfolio turnover rate excludes securities received or delivered in-kind.
See accompanying notes which are an integral part of the financial statements.
Fidelity Advisor® Financial Services Fund
Investment Summary (Unaudited)
Top Ten Stocks as of January 31, 2022
| | % of fund's net assets |
| Wells Fargo & Co. | 5.5 |
| Bank of America Corp. | 4.3 |
| Morgan Stanley | 4.2 |
| Citigroup, Inc. | 4.1 |
| American Express Co. | 3.9 |
| The Travelers Companies, Inc. | 3.6 |
| State Street Corp. | 3.4 |
| M&T Bank Corp. | 3.3 |
| Capital One Financial Corp. | 3.2 |
| U.S. Bancorp | 2.5 |
| | 38.0 |
Top Industries (% of fund's net assets)
| As of January 31, 2022 |
| | Banks | 35.9% |
| | Insurance | 21.6% |
| | Capital Markets | 20.1% |
| | Consumer Finance | 7.9% |
| | Thrifts & Mortgage Finance | 4.8% |
| | All Others* | 9.7% |
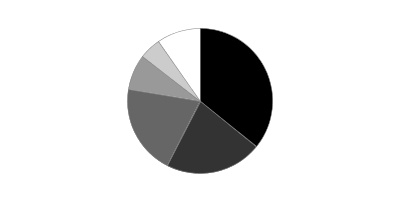
* Includes short-term investments and net other assets (liabilities).
Fidelity Advisor® Financial Services Fund
Schedule of Investments January 31, 2022 (Unaudited)
Showing Percentage of Net Assets
| Common Stocks - 98.9% | | | |
| | | Shares | Value |
| Banks - 35.9% | | | |
| Diversified Banks - 16.5% | | | |
| Bank of America Corp. | | 562,556 | $25,956,334 |
| Citigroup, Inc. | | 373,505 | 24,322,646 |
| Piraeus Financial Holdings SA (a) | | 315,000 | 530,069 |
| U.S. Bancorp | | 261,300 | 15,205,047 |
| Wells Fargo & Co. | | 605,128 | 32,555,885 |
| | | | 98,569,981 |
| Regional Banks - 19.4% | | | |
| Ameris Bancorp | | 49,400 | 2,435,914 |
| Associated Banc-Corp. | | 188,600 | 4,507,540 |
| Bank OZK | | 111,700 | 5,233,145 |
| BOK Financial Corp. | | 35,116 | 3,601,146 |
| Cadence Bank | | 144,124 | 4,492,345 |
| East West Bancorp, Inc. | | 72,900 | 6,294,186 |
| First Horizon National Corp. | | 330,079 | 5,647,652 |
| First Interstate Bancsystem, Inc. | | 78,400 | 2,881,200 |
| Great Western Bancorp, Inc. | | 53,000 | 1,636,640 |
| Heartland Financial U.S.A., Inc. | | 59,100 | 3,074,973 |
| Huntington Bancshares, Inc. | | 762,320 | 11,480,539 |
| M&T Bank Corp. | | 116,100 | 19,665,018 |
| PacWest Bancorp | | 91,200 | 4,234,416 |
| Peoples United Financial, Inc. | | 134,200 | 2,600,796 |
| Popular, Inc. | | 65,500 | 5,840,635 |
| Signature Bank | | 24,600 | 7,493,898 |
| Truist Financial Corp. | | 231,200 | 14,523,984 |
| WesBanco, Inc. | | 82,300 | 2,920,827 |
| Wintrust Financial Corp. | | 68,100 | 6,678,567 |
| | | | 115,243,421 |
|
| TOTAL BANKS | | | 213,813,402 |
|
| Capital Markets - 20.1% | | | |
| Asset Management & Custody Banks - 10.6% | | | |
| Affiliated Managers Group, Inc. | | 22,000 | 3,216,620 |
| AllianceBernstein Holding LP | | 47,205 | 2,216,275 |
| Bank of New York Mellon Corp. | | 254,900 | 15,105,374 |
| Brookfield Asset Management, Inc. Class A | | 137,200 | 7,559,720 |
| Carlyle Group LP | | 115,600 | 5,901,380 |
| Northern Trust Corp. | | 35,700 | 4,164,048 |
| Patria Investments Ltd. (b) | | 281,300 | 4,782,100 |
| State Street Corp. | | 211,200 | 19,958,400 |
| | | | 62,903,917 |
| Financial Exchanges & Data - 1.5% | | | |
| Bolsa Mexicana de Valores S.A.B. de CV | | 1,491,100 | 2,542,995 |
| Cboe Global Markets, Inc. | | 51,873 | 6,148,507 |
| | | | 8,691,502 |
| Investment Banking & Brokerage - 8.0% | | | |
| Lazard Ltd. Class A | | 181,000 | 7,898,840 |
| Morgan Stanley | | 246,000 | 25,224,840 |
| Raymond James Financial, Inc. | | 111,250 | 11,778,038 |
| Virtu Financial, Inc. Class A | | 98,600 | 3,049,698 |
| | | | 47,951,416 |
|
| TOTAL CAPITAL MARKETS | | | 119,546,835 |
|
| Consumer Finance - 7.9% | | | |
| Consumer Finance - 7.9% | | | |
| American Express Co. | | 129,200 | 23,232,744 |
| Capital One Financial Corp. | | 131,138 | 19,241,879 |
| OneMain Holdings, Inc. | | 91,400 | 4,721,724 |
| | | | 47,196,347 |
| Diversified Financial Services - 2.3% | | | |
| Multi-Sector Holdings - 1.0% | | | |
| Cannae Holdings, Inc. (a) | | 196,240 | 5,861,689 |
| Other Diversified Financial Services - 1.3% | | | |
| Apollo Global Management, Inc. | | 106,900 | 7,483,000 |
| Phoenix Vega Mezz PLC (a) | | 192,600 | 14,770 |
| | | | 7,497,770 |
|
| TOTAL DIVERSIFIED FINANCIAL SERVICES | | | 13,359,459 |
|
| Insurance - 21.6% | | | |
| Insurance Brokers - 3.6% | | | |
| Arthur J. Gallagher & Co. | | 87,500 | 13,819,750 |
| Willis Towers Watson PLC | | 31,800 | 7,439,928 |
| | | | 21,259,678 |
| Life & Health Insurance - 2.8% | | | |
| Globe Life, Inc. | | 102,700 | 10,506,210 |
| Primerica, Inc. | | 39,000 | 6,019,260 |
| | | | 16,525,470 |
| Multi-Line Insurance - 4.1% | | | |
| American International Group, Inc. | | 166,900 | 9,638,475 |
| Assurant, Inc. | | 51,700 | 7,884,767 |
| Hartford Financial Services Group, Inc. | | 98,500 | 7,079,195 |
| | | | 24,602,437 |
| Property & Casualty Insurance - 9.5% | | | |
| American Financial Group, Inc. | | 39,500 | 5,146,060 |
| Chubb Ltd. | | 66,600 | 13,138,848 |
| Fidelity National Financial, Inc. | | 160,900 | 8,101,315 |
| Hiscox Ltd. | | 348,000 | 4,574,243 |
| Old Republic International Corp. | | 172,300 | 4,416,049 |
| The Travelers Companies, Inc. | | 128,500 | 21,354,130 |
| | | | 56,730,645 |
| Reinsurance - 1.6% | | | |
| Reinsurance Group of America, Inc. | | 80,300 | 9,220,849 |
|
| TOTAL INSURANCE | | | 128,339,079 |
|
| IT Services - 3.6% | | | |
| Data Processing & Outsourced Services - 3.6% | | | |
| Computer Services, Inc. | | 22,391 | 1,253,896 |
| Global Payments, Inc. | | 66,800 | 10,011,984 |
| MasterCard, Inc. Class A | | 25,700 | 9,929,966 |
| | | | 21,195,846 |
| Professional Services - 1.7% | | | |
| Research & Consulting Services - 1.7% | | | |
| Dun & Bradstreet Holdings, Inc. (a) | | 285,100 | 5,719,106 |
| Equifax, Inc. | | 18,400 | 4,411,584 |
| | | | 10,130,690 |
| Software - 1.0% | | | |
| Application Software - 1.0% | | | |
| Black Knight, Inc. (a) | | 83,300 | 6,214,180 |
| Thrifts & Mortgage Finance - 4.8% | | | |
| Thrifts & Mortgage Finance - 4.8% | | | |
| Essent Group Ltd. | | 180,200 | 8,224,328 |
| MGIC Investment Corp. | | 532,500 | 8,083,350 |
| NMI Holdings, Inc. (a) | | 457,910 | 11,328,693 |
| Radian Group, Inc. | | 35,200 | 788,128 |
| | | | 28,424,499 |
| TOTAL COMMON STOCKS | | | |
| (Cost $444,667,165) | | | 588,220,337 |
|
| Money Market Funds - 1.3% | | | |
| Fidelity Cash Central Fund 0.08% (c) | | 7,009,095 | 7,010,497 |
| Fidelity Securities Lending Cash Central Fund 0.08% (c)(d) | | 762,049 | 762,125 |
| TOTAL MONEY MARKET FUNDS | | | |
| (Cost $7,772,622) | | | 7,772,622 |
| TOTAL INVESTMENT IN SECURITIES - 100.2% | | | |
| (Cost $452,439,787) | | | 595,992,959 |
| NET OTHER ASSETS (LIABILITIES) - (0.2)% | | | (917,732) |
| NET ASSETS - 100% | | | $595,075,227 |
Legend
(a) Non-income producing
(b) Security or a portion of the security is on loan at period end.
(c) Affiliated fund that is generally available only to investment companies and other accounts managed by Fidelity Investments. The rate quoted is the annualized seven-day yield of the fund at period end. A complete unaudited listing of the fund's holdings as of its most recent quarter end is available upon request. In addition, each Fidelity Central Fund's financial statements are available on the SEC's website or upon request.
(d) Investment made with cash collateral received from securities on loan.
Affiliated Central Funds
Fiscal year to date information regarding the Fund's investments in Fidelity Central Funds, including the ownership percentage, is presented below.
| Fund | Value, beginning of period | Purchases | Sales Proceeds | Dividend Income | Realized Gain/Loss | Change in Unrealized appreciation (depreciation) | Value, end of period | % ownership, end of period |
| Fidelity Cash Central Fund 0.08% | $2,916,314 | $87,425,755 | $83,331,572 | $1,555 | $-- | $-- | $7,010,497 | 0.0% |
| Fidelity Securities Lending Cash Central Fund 0.08% | 11,250 | 20,297,272 | 19,546,397 | 612 | -- | -- | 762,125 | 0.0% |
| Total | $2,927,564 | $107,723,027 | $102,877,969 | $2167 | $-- | $-- | $7,772,622 | |
Amounts in the income column in the above table include any capital gain distributions from underlying funds, which are presented in the corresponding line-item in the Statement of Operations, if applicable. Amount for Fidelity Securities Lending Cash Central Fund represents the income earned on investing cash collateral, less rebates paid to borrowers and any lending agent fees associated with the loan, plus any premium payments received for lending certain types of securities.
Investment Valuation
The following is a summary of the inputs used, as of January 31, 2022, involving the Fund's assets and liabilities carried at fair value. The inputs or methodology used for valuing securities may not be an indication of the risk associated with investing in those securities. For more information on valuation inputs, and their aggregation into the levels used below, please refer to the Investment Valuation section in the accompanying Notes to Financial Statements.
| | Valuation Inputs at Reporting Date: |
| Description | Total | Level 1 | Level 2 | Level 3 |
| Investments in Securities: | | | | |
| Common Stocks | $588,220,337 | $583,101,255 | $5,119,082 | $-- |
| Money Market Funds | 7,772,622 | 7,772,622 | -- | -- |
| Total Investments in Securities: | $595,992,959 | $590,873,877 | $5,119,082 | $-- |
See accompanying notes which are an integral part of the financial statements.
Fidelity Advisor® Financial Services Fund
Financial Statements
Statement of Assets and Liabilities
| | | January 31, 2022 (Unaudited) |
| Assets | | |
Investment in securities, at value (including securities loaned of $773,500) — See accompanying schedule:
Unaffiliated issuers (cost $444,667,165) | $588,220,337 | |
| Fidelity Central Funds (cost $7,772,622) | 7,772,622 | |
| Total Investment in Securities (cost $452,439,787) | | $595,992,959 |
| Receivable for fund shares sold | | 2,810,077 |
| Dividends receivable | | 366,978 |
| Distributions receivable from Fidelity Central Funds | | 607 |
| Prepaid expenses | | 2,412 |
| Total assets | | 599,173,033 |
| Liabilities | | |
| Payable for investments purchased | $2,333,070 | |
| Payable for fund shares redeemed | 501,357 | |
| Accrued management fee | 250,091 | |
| Distribution and service plan fees payable | 131,039 | |
| Other affiliated payables | 88,626 | |
| Other payables and accrued expenses | 31,498 | |
| Collateral on securities loaned | 762,125 | |
| Total liabilities | | 4,097,806 |
| Net Assets | | $595,075,227 |
| Net Assets consist of: | | |
| Paid in capital | | $446,578,939 |
| Total accumulated earnings (loss) | | 148,496,288 |
| Net Assets | | $595,075,227 |
| Net Asset Value and Maximum Offering Price | | |
| Class A: | | |
| Net Asset Value and redemption price per share ($217,804,277 ÷ 7,295,419 shares)(a) | | $29.85 |
| Maximum offering price per share (100/94.25 of $29.85) | | $31.67 |
| Class M: | | |
| Net Asset Value and redemption price per share ($76,328,700 ÷ 2,586,655 shares)(a) | | $29.51 |
| Maximum offering price per share (100/96.50 of $29.51) | | $30.58 |
| Class C: | | |
| Net Asset Value and offering price per share ($67,030,890 ÷ 2,407,987 shares)(a) | | $27.84 |
| Class I: | | |
| Net Asset Value, offering price and redemption price per share ($160,512,886 ÷ 5,207,576 shares) | | $30.82 |
| Class Z: | | |
| Net Asset Value, offering price and redemption price per share ($73,398,474 ÷ 2,386,627 shares) | | $30.75 |
(a) Redemption price per share is equal to net asset value less any applicable contingent deferred sales charge.
See accompanying notes which are an integral part of the financial statements.
Statement of Operations
| | | Six months ended January 31, 2022 (Unaudited) |
| Investment Income | | |
| Dividends | | $6,504,969 |
| Income from Fidelity Central Funds (including $612 from security lending) | | 2,167 |
| Total income | | 6,507,136 |
| Expenses | | |
| Management fee | $1,366,173 | |
| Transfer agent fees | 414,994 | |
| Distribution and service plan fees | 733,442 | |
| Accounting fees | 99,923 | |
| Custodian fees and expenses | 9,852 | |
| Independent trustees' fees and expenses | 874 | |
| Registration fees | 65,468 | |
| Audit | 26,227 | |
| Legal | 1,211 | |
| Interest | 168 | |
| Miscellaneous | 1,319 | |
| Total expenses before reductions | 2,719,651 | |
| Expense reductions | (7,675) | |
| Total expenses after reductions | | 2,711,976 |
| Net investment income (loss) | | 3,795,160 |
| Realized and Unrealized Gain (Loss) | | |
| Net realized gain (loss) on: | | |
| Investment securities: | | |
| Unaffiliated issuers | 16,813,864 | |
| Foreign currency transactions | (64) | |
| Total net realized gain (loss) | | 16,813,800 |
| Change in net unrealized appreciation (depreciation) on investment securities | | 22,251,794 |
| Net gain (loss) | | 39,065,594 |
| Net increase (decrease) in net assets resulting from operations | | $42,860,754 |
See accompanying notes which are an integral part of the financial statements.
Statement of Changes in Net Assets
| | Six months ended January 31, 2022 (Unaudited) | Year ended July 31, 2021 |
| Increase (Decrease) in Net Assets | | |
| Operations | | |
| Net investment income (loss) | $3,795,160 | $6,261,269 |
| Net realized gain (loss) | 16,813,800 | 6,257,144 |
| Change in net unrealized appreciation (depreciation) | 22,251,794 | 138,800,055 |
| Net increase (decrease) in net assets resulting from operations | 42,860,754 | 151,318,468 |
| Distributions to shareholders | (21,010,549) | (7,232,777) |
| Share transactions - net increase (decrease) | 105,972,207 | 25,541,998 |
| Total increase (decrease) in net assets | 127,822,412 | 169,627,689 |
| Net Assets | | |
| Beginning of period | 467,252,815 | 297,625,126 |
| End of period | $595,075,227 | $467,252,815 |
See accompanying notes which are an integral part of the financial statements.
Financial Highlights
Fidelity Advisor Financial Services Fund Class A
| | Six months ended (Unaudited) January 31, | Years endedJuly 31, | | | | |
| | 2022 | 2021 | 2020 | 2019 | 2018 | 2017 |
| Selected Per–Share Data | | | | | | |
| Net asset value, beginning of period | $28.41 | $18.00 | $21.47 | $21.84 | $19.55 | $15.43 |
| Income from Investment Operations | | | | | | |
| Net investment income (loss)A,B | .22 | .42 | .40 | .27 | .12 | .08 |
| Net realized and unrealized gain (loss) | 2.44 | 10.55 | (3.59) | .07 | 2.25 | 4.08 |
| Total from investment operations | 2.66 | 10.97 | (3.19) | .34 | 2.37 | 4.16 |
| Distributions from net investment income | (.43) | (.45) | (.28) | (.18) | (.07) | (.04) |
| Distributions from net realized gain | (.80) | (.11) | – | (.53) | (.01) | – |
| Total distributions | (1.22)C | (.56) | (.28) | (.71) | (.08) | (.04) |
| Redemption fees added to paid in capitalA | – | – | – | – | – | –D |
| Net asset value, end of period | $29.85 | $28.41 | $18.00 | $21.47 | $21.84 | $19.55 |
| Total ReturnE,F,G | 9.60% | 61.84% | (15.15)% | 2.05% | 12.13% | 26.97% |
| Ratios to Average Net AssetsB,H,I | | | | | | |
| Expenses before reductions | 1.04%J | 1.07% | 1.09% | 1.08% | 1.10% | 1.12% |
| Expenses net of fee waivers, if any | 1.03%J | 1.07% | 1.09% | 1.07% | 1.10% | 1.12% |
| Expenses net of all reductions | 1.03%J | 1.06% | 1.08% | 1.07% | 1.09% | 1.12% |
| Net investment income (loss) | 1.47%J | 1.76% | 1.97% | 1.31% | .55% | .48% |
| Supplemental Data | | | | | | |
| Net assets, end of period (000 omitted) | $217,804 | $181,251 | $104,761 | $145,799 | $174,786 | $144,144 |
| Portfolio turnover rateK | 36%J | 51% | 88%L | 51% | 46% | 81% |
A Calculated based on average shares outstanding during the period.
B Net investment income (loss) is affected by the timing of the declaration of dividends by any underlying mutual funds or exchange-traded funds (ETFs). Net investment income (loss) of any such underlying funds is not included in the Fund's net investment income (loss) ratio.
C Total distributions per share do not sum due to rounding.
D Amount represents less than $.005 per share.
E Total returns for periods of less than one year are not annualized.
F Total returns would have been lower if certain expenses had not been reduced during the applicable periods shown.
G Total returns do not include the effect of the sales charges.
H Fees and expenses of any underlying mutual funds or exchange-traded funds (ETFs) are not included in the Fund's expense ratio. The Fund indirectly bears its proportionate share of these expenses. For additional expense information related to investments in Fidelity Central Funds, please refer to the "Investments in Fidelity Central Funds" note found in the Notes to Financial Statements section of the most recent Annual or Semi-Annual report.
I Expense ratios reflect operating expenses of the class. Expenses before reductions do not reflect amounts reimbursed, waived, or reduced through arrangements with the investment adviser, brokerage services, or other offset arrangements, if applicable, and do not represent the amount paid by the class during periods when reimbursements, waivers or reductions occur.
J Annualized
K Amount does not include the portfolio activity of any underlying mutual funds or exchange-traded funds (ETFs).
L Portfolio turnover rate excludes securities received or delivered in-kind.
See accompanying notes which are an integral part of the financial statements.
Fidelity Advisor Financial Services Fund Class M
| | Six months ended (Unaudited) January 31, | Years endedJuly 31, | | | | |
| | 2022 | 2021 | 2020 | 2019 | 2018 | 2017 |
| Selected Per–Share Data | | | | | | |
| Net asset value, beginning of period | $28.08 | $17.79 | $21.23 | $21.60 | $19.34 | $15.29 |
| Income from Investment Operations | | | | | | |
| Net investment income (loss)A,B | .18 | .36 | .34 | .21 | .06 | .04 |
| Net realized and unrealized gain (loss) | 2.41 | 10.44 | (3.55) | .07 | 2.23 | 4.03 |
| Total from investment operations | 2.59 | 10.80 | (3.21) | .28 | 2.29 | 4.07 |
| Distributions from net investment income | (.37) | (.39) | (.23) | (.13) | (.02) | (.02) |
| Distributions from net realized gain | (.80) | (.11) | – | (.53) | (.01) | – |
| Total distributions | (1.16)C | (.51)C | (.23) | (.65)C | (.03) | (.02) |
| Redemption fees added to paid in capitalA | – | – | – | – | – | –D |
| Net asset value, end of period | $29.51 | $28.08 | $17.79 | $21.23 | $21.60 | $19.34 |
| Total ReturnE,F,G | 9.46% | 61.48% | (15.38)% | 1.77% | 11.84% | 26.63% |
| Ratios to Average Net AssetsB,H,I | | | | | | |
| Expenses before reductions | 1.28%J | 1.32% | 1.35% | 1.34% | 1.37% | 1.40% |
| Expenses net of fee waivers, if any | 1.28%J | 1.32% | 1.35% | 1.34% | 1.37% | 1.40% |
| Expenses net of all reductions | 1.28%J | 1.31% | 1.34% | 1.33% | 1.36% | 1.40% |
| Net investment income (loss) | 1.22%J | 1.51% | 1.72% | 1.04% | .28% | .20% |
| Supplemental Data | | | | | | |
| Net assets, end of period (000 omitted) | $76,329 | $60,508 | $34,828 | $48,210 | $53,178 | $45,920 |
| Portfolio turnover rateK | 36%J | 51% | 88%L | 51% | 46% | 81% |
A Calculated based on average shares outstanding during the period.
B Net investment income (loss) is affected by the timing of the declaration of dividends by any underlying mutual funds or exchange-traded funds (ETFs). Net investment income (loss) of any such underlying funds is not included in the Fund's net investment income (loss) ratio.
C Total distributions per share do not sum due to rounding.
D Amount represents less than $.005 per share.
E Total returns for periods of less than one year are not annualized.
F Total returns would have been lower if certain expenses had not been reduced during the applicable periods shown.
G Total returns do not include the effect of the sales charges.
H Fees and expenses of any underlying mutual funds or exchange-traded funds (ETFs) are not included in the Fund's expense ratio. The Fund indirectly bears its proportionate share of these expenses. For additional expense information related to investments in Fidelity Central Funds, please refer to the "Investments in Fidelity Central Funds" note found in the Notes to Financial Statements section of the most recent Annual or Semi-Annual report.
I Expense ratios reflect operating expenses of the class. Expenses before reductions do not reflect amounts reimbursed, waived, or reduced through arrangements with the investment adviser, brokerage services, or other offset arrangements, if applicable, and do not represent the amount paid by the class during periods when reimbursements, waivers or reductions occur.
J Annualized
K Amount does not include the portfolio activity of any underlying mutual funds or exchange-traded funds (ETFs).
L Portfolio turnover rate excludes securities received or delivered in-kind.
See accompanying notes which are an integral part of the financial statements.
Fidelity Advisor Financial Services Fund Class C
| | Six months ended (Unaudited) January 31, | Years endedJuly 31, | | | | |
| | 2022 | 2021 | 2020 | 2019 | 2018 | 2017 |
| Selected Per–Share Data | | | | | | |
| Net asset value, beginning of period | $26.48 | $16.80 | $20.04 | $20.41 | $18.34 | $14.55 |
| Income from Investment Operations | | | | | | |
| Net investment income (loss)A,B | .10 | .22 | .23 | .11 | (.04) | (.05) |
| Net realized and unrealized gain (loss) | 2.28 | 9.85 | (3.37) | .07 | 2.11 | 3.84 |
| Total from investment operations | 2.38 | 10.07 | (3.14) | .18 | 2.07 | 3.79 |
| Distributions from net investment income | (.23) | (.28) | (.10) | (.03) | – | –C |
| Distributions from net realized gain | (.80) | (.11) | – | (.53) | – | – |
| Total distributions | (1.02)D | (.39) | (.10) | (.55)D | – | –C |
| Redemption fees added to paid in capitalA | – | – | – | – | – | –C |
| Net asset value, end of period | $27.84 | $26.48 | $16.80 | $20.04 | $20.41 | $18.34 |
| Total ReturnE,F,G | 9.21% | 60.62% | (15.79)% | 1.29% | 11.29% | 26.06% |
| Ratios to Average Net AssetsB,H,I | | | | | | |
| Expenses before reductions | 1.79%J | 1.83% | 1.84% | 1.83% | 1.86% | 1.87% |
| Expenses net of fee waivers, if any | 1.79%J | 1.82% | 1.84% | 1.82% | 1.85% | 1.87% |
| Expenses net of all reductions | 1.79%J | 1.82% | 1.83% | 1.82% | 1.85% | 1.87% |
| Net investment income (loss) | .71%J | 1.00% | 1.22% | .56% | (.20)% | (.27)% |
| Supplemental Data | | | | | | |
| Net assets, end of period (000 omitted) | $67,031 | $57,856 | $41,947 | $71,609 | $120,947 | $92,593 |
| Portfolio turnover rateK | 36%J | 51% | 88%L | 51% | 46% | 81% |
A Calculated based on average shares outstanding during the period.
B Net investment income (loss) is affected by the timing of the declaration of dividends by any underlying mutual funds or exchange-traded funds (ETFs). Net investment income (loss) of any such underlying funds is not included in the Fund's net investment income (loss) ratio.
C Amount represents less than $.005 per share.
D Total distributions per share do not sum due to rounding.
E Total returns for periods of less than one year are not annualized.
F Total returns would have been lower if certain expenses had not been reduced during the applicable periods shown.
G Total returns do not include the effect of the contingent deferred sales charge.
H Fees and expenses of any underlying mutual funds or exchange-traded funds (ETFs) are not included in the Fund's expense ratio. The Fund indirectly bears its proportionate share of these expenses. For additional expense information related to investments in Fidelity Central Funds, please refer to the "Investments in Fidelity Central Funds" note found in the Notes to Financial Statements section of the most recent Annual or Semi-Annual report.
I Expense ratios reflect operating expenses of the class. Expenses before reductions do not reflect amounts reimbursed, waived, or reduced through arrangements with the investment adviser, brokerage services, or other offset arrangements, if applicable, and do not represent the amount paid by the class during periods when reimbursements, waivers or reductions occur.
J Annualized
K Amount does not include the portfolio activity of any underlying mutual funds or exchange-traded funds (ETFs).
L Portfolio turnover rate excludes securities received or delivered in-kind.
See accompanying notes which are an integral part of the financial statements.
Fidelity Advisor Financial Services Fund Class I
| | Six months ended (Unaudited) January 31, | Years endedJuly 31, | | | | |
| | 2022 | 2021 | 2020 | 2019 | 2018 | 2017 |
| Selected Per–Share Data | | | | | | |
| Net asset value, beginning of period | $29.32 | $18.55 | $22.11 | $22.47 | $20.11 | $15.84 |
| Income from Investment Operations | | | | | | |
| Net investment income (loss)A,B | .27 | .52 | .47 | .33 | .18 | .14 |
| Net realized and unrealized gain (loss) | 2.52 | 10.86 | (3.69) | .08 | 2.32 | 4.19 |
| Total from investment operations | 2.79 | 11.38 | (3.22) | .41 | 2.50 | 4.33 |
| Distributions from net investment income | (.50) | (.50) | (.34) | (.25) | (.13) | (.06) |
| Distributions from net realized gain | (.80) | (.11) | – | (.53) | (.01) | – |
| Total distributions | (1.29)C | (.61) | (.34) | (.77)C | (.14) | (.06) |
| Redemption fees added to paid in capitalA | – | – | – | – | – | –D |
| Net asset value, end of period | $30.82 | $29.32 | $18.55 | $22.11 | $22.47 | $20.11 |
| Total ReturnE,F | 9.76% | 62.31% | (14.91)% | 2.36% | 12.43% | 27.36% |
| Ratios to Average Net AssetsB,G,H | | | | | | |
| Expenses before reductions | .76%I | .79% | .80% | .80% | .83% | .84% |
| Expenses net of fee waivers, if any | .75%I | .79% | .80% | .79% | .83% | .84% |
| Expenses net of all reductions | .75%I | .78% | .78% | .79% | .82% | .83% |
| Net investment income (loss) | 1.74%I | 2.04% | 2.27% | 1.59% | .83% | .76% |
| Supplemental Data | | | | | | |
| Net assets, end of period (000 omitted) | $160,513 | $118,424 | $85,299 | $107,059 | $162,724 | $96,789 |
| Portfolio turnover rateJ | 36%I | 51% | 88%K | 51% | 46% | 81% |
A Calculated based on average shares outstanding during the period.
B Net investment income (loss) is affected by the timing of the declaration of dividends by any underlying mutual funds or exchange-traded funds (ETFs). Net investment income (loss) of any such underlying funds is not included in the Fund's net investment income (loss) ratio.
C Total distributions per share do not sum due to rounding.
D Amount represents less than $.005 per share.
E Total returns for periods of less than one year are not annualized.
F Total returns would have been lower if certain expenses had not been reduced during the applicable periods shown.
G Fees and expenses of any underlying mutual funds or exchange-traded funds (ETFs) are not included in the Fund's expense ratio. The Fund indirectly bears its proportionate share of these expenses. For additional expense information related to investments in Fidelity Central Funds, please refer to the "Investments in Fidelity Central Funds" note found in the Notes to Financial Statements section of the most recent Annual or Semi-Annual report.
H Expense ratios reflect operating expenses of the class. Expenses before reductions do not reflect amounts reimbursed, waived, or reduced through arrangements with the investment adviser, brokerage services, or other offset arrangements, if applicable, and do not represent the amount paid by the class during periods when reimbursements, waivers or reductions occur.
I Annualized
J Amount does not include the portfolio activity of any underlying mutual funds or exchange-traded funds (ETFs).
K Portfolio turnover rate excludes securities received or delivered in-kind.
See accompanying notes which are an integral part of the financial statements.
Fidelity Advisor Financial Services Fund Class Z
| | Six months ended (Unaudited) January 31, | Years endedJuly 31, | | |
| | 2022 | 2021 | 2020 | 2019 A |
| Selected Per–Share Data | | | | |
| Net asset value, beginning of period | $29.28 | $18.53 | $22.09 | $21.99 |
| Income from Investment Operations | | | | |
| Net investment income (loss)B,C | .29 | .54 | .49 | .25 |
| Net realized and unrealized gain (loss) | 2.50 | 10.86 | (3.67) | .66 |
| Total from investment operations | 2.79 | 11.40 | (3.18) | .91 |
| Distributions from net investment income | (.53) | (.54) | (.38) | (.29) |
| Distributions from net realized gain | (.80) | (.11) | – | (.53) |
| Total distributions | (1.32)D | (.65) | (.38) | (.81)D |
| Redemption fees added to paid in capitalB | – | – | – | – |
| Net asset value, end of period | $30.75 | $29.28 | $18.53 | $22.09 |
| Total ReturnE,F | 9.79% | 62.53% | (14.79)% | 4.72% |
| Ratios to Average Net AssetsC,G,H | | | | |
| Expenses before reductions | .64%I | .66% | .67% | .66%I |
| Expenses net of fee waivers, if any | .64%I | .66% | .67% | .65%I |
| Expenses net of all reductions | .64%I | .65% | .65% | .65%I |
| Net investment income (loss) | 1.86%I | 2.17% | 2.40% | 1.44%I |
| Supplemental Data | | | | |
| Net assets, end of period (000 omitted) | $73,398 | $49,214 | $30,790 | $7,041 |
| Portfolio turnover rateJ | 36%I | 51% | 88%K | 51%I |
A For the period October 2, 2018 (commencement of sale of shares) through July 31, 2019.
B Calculated based on average shares outstanding during the period.
C Net investment income (loss) is affected by the timing of the declaration of dividends by any underlying mutual funds or exchange-traded funds (ETFs). Net investment income (loss) of any such underlying funds is not included in the Fund's net investment income (loss) ratio.
D Total distributions per share do not sum due to rounding.
E Total returns for periods of less than one year are not annualized.
F Total returns would have been lower if certain expenses had not been reduced during the applicable periods shown.
G Fees and expenses of any underlying mutual funds or exchange-traded funds (ETFs) are not included in the Fund's expense ratio. The Fund indirectly bears its proportionate share of these expenses. For additional expense information related to investments in Fidelity Central Funds, please refer to the "Investments in Fidelity Central Funds" note found in the Notes to Financial Statements section of the most recent Annual or Semi-Annual report.
H Expense ratios reflect operating expenses of the class. Expenses before reductions do not reflect amounts reimbursed, waived, or reduced through arrangements with the investment adviser, brokerage services, or other offset arrangements, if applicable, and do not represent the amount paid by the class during periods when reimbursements, waivers or reductions occur.
I Annualized
J Amount does not include the portfolio activity of any underlying mutual funds or exchange-traded funds (ETFs).
K Portfolio turnover rate excludes securities received or delivered in-kind.
See accompanying notes which are an integral part of the financial statements.
Fidelity Advisor® Health Care Fund
Investment Summary (Unaudited)
Top Ten Stocks as of January 31, 2022
| | % of fund's net assets |
| UnitedHealth Group, Inc. | 11.2 |
| Danaher Corp. | 5.9 |
| Boston Scientific Corp. | 5.8 |
| Humana, Inc. | 5.1 |
| Eli Lilly & Co. | 5.0 |
| Thermo Fisher Scientific, Inc. | 3.9 |
| Cigna Corp. | 3.8 |
| Centene Corp. | 3.2 |
| Penumbra, Inc. | 2.9 |
| Insulet Corp. | 2.7 |
| | 49.5 |
Top Industries (% of fund's net assets)
| As of January 31, 2022 |
| | Health Care Providers & Services | 28.3% |
| | Biotechnology | 20.5% |
| | Life Sciences Tools & Services | 17.6% |
| | Health Care Equipment & Supplies | 16.6% |
| | Pharmaceuticals | 12.4% |
| | All Others* | 4.6% |
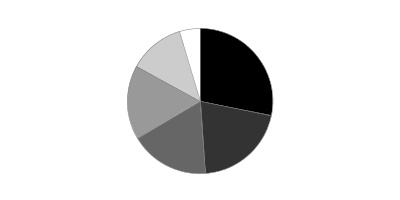
* Includes short-term investments and net other assets (liabilities).
Fidelity Advisor® Health Care Fund
Schedule of Investments January 31, 2022 (Unaudited)
Showing Percentage of Net Assets
| Common Stocks - 97.7% | | | |
| | | Shares | Value |
| Biotechnology - 20.0% | | | |
| Biotechnology - 20.0% | | | |
| ADC Therapeutics SA (a) | | 586,497 | $9,319,437 |
| Agios Pharmaceuticals, Inc. (a)(b) | | 500,000 | 15,445,000 |
| Alnylam Pharmaceuticals, Inc. (a) | | 740,000 | 101,824,000 |
| Ambrx Biopharma, Inc. ADR | | 230,000 | 1,113,200 |
| Arcutis Biotherapeutics, Inc. (a) | | 382,100 | 5,773,531 |
| Argenx SE ADR (a) | | 490,000 | 131,937,400 |
| Ascendis Pharma A/S sponsored ADR (a) | | 565,607 | 68,800,435 |
| Atara Biotherapeutics, Inc. (a) | | 1,180,000 | 18,124,800 |
| Avid Bioservices, Inc. (a) | | 900,000 | 16,983,000 |
| Beam Therapeutics, Inc. (a)(b) | | 210,000 | 14,534,100 |
| BeiGene Ltd. ADR (a) | | 80,000 | 19,406,400 |
| BioAtla, Inc. (a) | | 280,000 | 2,676,800 |
| BioNTech SE ADR (a) | | 70,000 | 12,045,600 |
| Celldex Therapeutics, Inc. (a) | | 434,141 | 13,462,712 |
| Century Therapeutics, Inc. (b) | | 600,000 | 7,818,000 |
| Cerevel Therapeutics Holdings (a) | | 850,000 | 22,134,000 |
| Cytokinetics, Inc. (a) | | 1,000,000 | 33,190,000 |
| Denali Therapeutics, Inc. (a) | | 450,000 | 15,399,000 |
| Erasca, Inc. (b) | | 1,800,000 | 21,330,000 |
| Exelixis, Inc. (a) | | 1,280,000 | 23,168,000 |
| Fate Therapeutics, Inc. (a) | | 280,000 | 11,622,800 |
| Forma Therapeutics Holdings, Inc. (a) | | 460,000 | 5,446,400 |
| Generation Bio Co. (a)(b) | | 288,243 | 1,873,580 |
| Graphite Bio, Inc. | | 600,000 | 5,604,000 |
| Imago BioSciences, Inc. | | 200,000 | 4,044,000 |
| Innovent Biologics, Inc. (a)(c) | | 5,600,000 | 23,714,910 |
| Instil Bio, Inc. (a)(b) | | 1,080,000 | 12,538,800 |
| Intellia Therapeutics, Inc. (a) | | 290,000 | 27,425,300 |
| Janux Therapeutics, Inc. | | 400,000 | 6,092,000 |
| Keros Therapeutics, Inc. (a) | | 320,000 | 14,838,400 |
| Kinnate Biopharma, Inc. (a) | | 174,653 | 1,917,690 |
| Kura Oncology, Inc. (a) | | 760,100 | 10,709,809 |
| Kymera Therapeutics, Inc. (a) | | 280,000 | 11,760,000 |
| Legend Biotech Corp. ADR (a) | | 17,700 | 754,728 |
| Mirati Therapeutics, Inc. (a) | | 390,000 | 46,527,000 |
| Morphic Holding, Inc. (a) | | 179,800 | 7,628,914 |
| Nuvalent, Inc. Class A (a)(b) | | 234,087 | 3,157,834 |
| ORIC Pharmaceuticals, Inc. (a) | | 440,000 | 4,351,600 |
| Passage Bio, Inc. (a) | | 68,294 | 343,519 |
| Poseida Therapeutics, Inc. (a) | | 981,854 | 4,663,807 |
| Prelude Therapeutics, Inc. (a)(b) | | 640,000 | 6,355,200 |
| PTC Therapeutics, Inc. (a) | | 800,000 | 32,176,000 |
| Regeneron Pharmaceuticals, Inc. (a) | | 224,000 | 136,324,160 |
| Relay Therapeutics, Inc. (a) | | 1,032,300 | 22,844,799 |
| Repare Therapeutics, Inc. (a) | | 284,700 | 4,392,921 |
| Revolution Medicines, Inc. (a) | | 600,000 | 12,912,000 |
| Sarepta Therapeutics, Inc. (a) | | 570,000 | 40,794,900 |
| Scholar Rock Holding Corp. (a)(b) | | 91,903 | 1,636,792 |
| Shattuck Labs, Inc. (a) | | 659,571 | 4,557,636 |
| Stoke Therapeutics, Inc. (a) | | 320,000 | 6,064,000 |
| Taysha Gene Therapies, Inc. (a) | | 134,561 | 1,069,760 |
| TG Therapeutics, Inc. (a) | | 2,280,000 | 26,379,600 |
| Twist Bioscience Corp. (a) | | 360,000 | 21,391,200 |
| uniQure B.V. (a) | | 440,000 | 7,942,000 |
| Vaxcyte, Inc. (a) | | 561,435 | 10,689,722 |
| Vertex Pharmaceuticals, Inc. (a) | | 200,000 | 48,610,000 |
| Verve Therapeutics, Inc. | | 180,000 | 5,187,600 |
| Xencor, Inc. (a) | | 900,000 | 30,933,000 |
| Xenon Pharmaceuticals, Inc. (a) | | 145,700 | 3,951,384 |
| Zai Lab Ltd. (a) | | 279,400 | 13,197,523 |
| Zentalis Pharmaceuticals, Inc. (a) | | 828,000 | 47,262,240 |
| Zymeworks, Inc. (a) | | 215,947 | 1,921,928 |
| | | | 1,246,094,871 |
| Health Care Equipment & Supplies - 16.6% | | | |
| Health Care Equipment - 16.6% | | | |
| Boston Scientific Corp. (a) | | 8,400,000 | 360,360,000 |
| DexCom, Inc. (a) | | 67,000 | 28,842,160 |
| Envista Holdings Corp. (a) | | 1,540,000 | 66,589,600 |
| Hologic, Inc. (a) | | 700,000 | 49,168,000 |
| Insulet Corp. (a) | | 669,837 | 166,119,576 |
| Intuitive Surgical, Inc. (a) | | 128,000 | 36,375,040 |
| Masimo Corp. (a) | | 260,000 | 57,166,200 |
| Novocure Ltd. (a) | | 50,000 | 3,432,500 |
| Outset Medical, Inc. (a) | | 590,266 | 21,951,993 |
| Penumbra, Inc. (a) | | 800,000 | 180,808,000 |
| PROCEPT BioRobotics Corp. (b) | | 350,000 | 6,489,000 |
| ResMed, Inc. | | 11,000 | 2,514,600 |
| Tandem Diabetes Care, Inc. (a) | | 460,000 | 54,330,600 |
| | | | 1,034,147,269 |
| Health Care Providers & Services - 28.3% | | | |
| Health Care Facilities - 2.4% | | | |
| Cano Health, Inc. (a)(b) | | 3,567,400 | 20,619,572 |
| HCA Holdings, Inc. | | 200,000 | 48,010,000 |
| Rede D'Oregon Sao Luiz SA (c) | | 3,750,000 | 31,298,846 |
| Surgery Partners, Inc. (a) | | 970,000 | 41,389,900 |
| The Oncology Institute, Inc. (d) | | 1,472,782 | 9,038,463 |
| | | | 150,356,781 |
| Health Care Services - 6.1% | | | |
| 1Life Healthcare, Inc. (a) | | 850,000 | 9,486,000 |
| agilon health, Inc. (a)(b) | | 2,615,006 | 43,356,799 |
| Cigna Corp. | | 1,020,000 | 235,069,200 |
| Guardant Health, Inc. (a) | | 440,000 | 30,602,000 |
| LifeStance Health Group, Inc. | | 2,100,000 | 16,023,000 |
| Oak Street Health, Inc. (a)(b) | | 2,700,000 | 46,926,000 |
| | | | 381,462,999 |
| Managed Health Care - 19.8% | | | |
| Alignment Healthcare, Inc. (a) | | 2,392,946 | 18,186,390 |
| Centene Corp. (a) | | 2,540,000 | 197,510,400 |
| Humana, Inc. | | 820,000 | 321,850,000 |
| UnitedHealth Group, Inc. | | 1,475,000 | 697,040,751 |
| | | | 1,234,587,541 |
|
| TOTAL HEALTH CARE PROVIDERS & SERVICES | | | 1,766,407,321 |
|
| Health Care Technology - 2.2% | | | |
| Health Care Technology - 2.2% | | | |
| Castlight Health, Inc. (a) | | 331,400 | 676,056 |
| Castlight Health, Inc. Class B (a) | | 2,800,000 | 5,712,000 |
| Change Healthcare, Inc. (a) | | 500,000 | 9,840,000 |
| Definitive Healthcare Corp. | | 330,000 | 7,220,400 |
| Doximity, Inc. (b) | | 370,000 | 16,860,900 |
| Evolent Health, Inc. (a) | | 280,000 | 6,638,800 |
| Health Catalyst, Inc. (a) | | 800,000 | 23,880,000 |
| Inspire Medical Systems, Inc. (a) | | 190,000 | 42,045,100 |
| Medlive Technology Co. Ltd. (c) | | 2,180,000 | 3,539,489 |
| Phreesia, Inc. (a) | | 600,000 | 18,714,000 |
| | | | 135,126,745 |
| Life Sciences Tools & Services - 17.6% | | | |
| Life Sciences Tools & Services - 17.6% | | | |
| 10X Genomics, Inc. (a) | | 400,000 | 38,508,000 |
| Avantor, Inc. (a) | | 1,180,000 | 44,049,400 |
| Bio-Rad Laboratories, Inc. Class A (a) | | 150,000 | 89,959,500 |
| Bruker Corp. | | 1,080,000 | 71,928,000 |
| Charles River Laboratories International, Inc. (a) | | 200,000 | 65,952,000 |
| Danaher Corp. | | 1,290,000 | 368,669,100 |
| Lonza Group AG | | 128,000 | 88,248,559 |
| Maravai LifeSciences Holdings, Inc. (a) | | 1,075,065 | 31,090,880 |
| Olink Holding AB ADR (a) | | 677,399 | 10,960,316 |
| Sartorius Stedim Biotech | | 20,500 | 8,989,482 |
| Seer, Inc. (a) | | 6,365 | 100,121 |
| Seer, Inc. Class A (a)(d) | | 273,935 | 4,308,998 |
| Stevanato Group SpA | | 850,000 | 14,764,500 |
| Thermo Fisher Scientific, Inc. | | 415,000 | 241,239,500 |
| West Pharmaceutical Services, Inc. | | 54,000 | 21,233,880 |
| | | | 1,100,002,236 |
| Personal Products - 0.4% | | | |
| Personal Products - 0.4% | | | |
| The Beauty Health Co. (a)(b) | | 724,177 | 10,283,313 |
| The Beauty Health Co. (d) | | 1,000,000 | 14,200,000 |
| | | | 24,483,313 |
| Pharmaceuticals - 12.3% | | | |
| Pharmaceuticals - 12.3% | | | |
| Arvinas Holding Co. LLC (a) | | 528,000 | 37,746,720 |
| AstraZeneca PLC (United Kingdom) | | 840,000 | 97,715,543 |
| Bristol-Myers Squibb Co. | | 1,210,300 | 78,536,367 |
| Eli Lilly & Co. | | 1,280,000 | 314,099,200 |
| Nektar Therapeutics (a) | | 600,000 | 6,672,000 |
| Pharvaris BV | | 400,000 | 6,876,000 |
| Pliant Therapeutics, Inc. (a) | | 575,321 | 6,748,515 |
| Roche Holding AG (participation certificate) | | 250,000 | 96,749,845 |
| Royalty Pharma PLC | | 2,582,000 | 103,305,820 |
| Theseus Pharmaceuticals, Inc. | | 400,000 | 3,692,000 |
| UCB SA | | 150,000 | 14,925,791 |
| | | | 767,067,801 |
| Specialty Retail - 0.3% | | | |
| Specialty Stores - 0.3% | | | |
| Warby Parker, Inc. (a)(b) | | 450,000 | 16,726,500 |
| TOTAL COMMON STOCKS | | | |
| (Cost $4,676,853,608) | | | 6,090,056,056 |
|
| Preferred Stocks - 1.0% | | | |
| Convertible Preferred Stocks - 0.9% | | | |
| Biotechnology - 0.5% | | | |
| Biotechnology - 0.5% | | | |
| Asimov, Inc. Series B (d)(e) | | 67,547 | 6,260,303 |
| Caris Life Sciences, Inc. Series D (d)(e) | | 2,082,481 | 13,869,323 |
| Element Biosciences, Inc. Series C (d)(e) | | 376,690 | 6,200,317 |
| ElevateBio LLC Series C (d)(e) | | 163,300 | 583,961 |
| Inscripta, Inc. Series E (d)(e) | | 826,424 | 6,041,159 |
| | | | 32,955,063 |
| Health Care Providers & Services - 0.0% | | | |
| Health Care Services - 0.0% | | | |
| dMed Biopharmaceutical Co. Ltd. Series C (a)(d)(e) | | 236,142 | 2,342,529 |
| Health Care Technology - 0.3% | | | |
| Health Care Technology - 0.3% | | | |
| Aledade, Inc. Series B1 (d)(e) | | 130,618 | 4,656,532 |
| Omada Health, Inc. Series E (d)(e) | | 1,456,953 | 8,734,725 |
| Wugen, Inc. Series B (d)(e) | | 300,054 | 1,704,307 |
| | | | 15,095,564 |
| Pharmaceuticals - 0.1% | | | |
| Pharmaceuticals - 0.1% | | | |
| Aristea Therapeutics, Inc. Series B (a)(d)(e) | | 638,900 | 5,973,715 |
|
| TOTAL CONVERTIBLE PREFERRED STOCKS | | | 56,366,871 |
|
| Nonconvertible Preferred Stocks - 0.1% | | | |
| Diversified Financial Services - 0.1% | | | |
| Other Diversified Financial Services - 0.1% | | | |
| Thriveworks TopCo LLC Series B (d)(e)(f) | | 195,000 | 5,597,126 |
| TOTAL PREFERRED STOCKS | | | |
| (Cost $67,391,128) | | | 61,963,997 |
|
| Money Market Funds - 3.0% | | | |
| Fidelity Cash Central Fund 0.08% (g) | | 34,871,094 | 34,878,068 |
| Fidelity Securities Lending Cash Central Fund 0.08% (g)(h) | | 151,124,239 | 151,139,352 |
| TOTAL MONEY MARKET FUNDS | | | |
| (Cost $186,017,420) | | | 186,017,420 |
| TOTAL INVESTMENT IN SECURITIES - 101.7% | | | |
| (Cost $4,930,262,156) | | | 6,338,037,473 |
| NET OTHER ASSETS (LIABILITIES) - (1.7)% | | | (104,873,115) |
| NET ASSETS - 100% | | | $6,233,164,358 |
Legend
(a) Non-income producing
(b) Security or a portion of the security is on loan at period end.
(c) Security exempt from registration under Rule 144A of the Securities Act of 1933. These securities may be resold in transactions exempt from registration, normally to qualified institutional buyers. At the end of the period, the value of these securities amounted to $58,553,245 or 0.9% of net assets.
(d) Restricted securities (including private placements) - Investment in securities not registered under the Securities Act of 1933 (excluding 144A issues). At the end of the period, the value of restricted securities (excluding 144A issues) amounted to $89,511,458 or 1.4% of net assets.
(e) Level 3 security
(f) Investment is owned by a wholly-owned subsidiary (Subsidiary) that is treated as a corporation for U.S. tax purposes.
(g) Affiliated fund that is generally available only to investment companies and other accounts managed by Fidelity Investments. The rate quoted is the annualized seven-day yield of the fund at period end. A complete unaudited listing of the fund's holdings as of its most recent quarter end is available upon request. In addition, each Fidelity Central Fund's financial statements are available on the SEC's website or upon request.
(h) Investment made with cash collateral received from securities on loan.
Additional information on each restricted holding is as follows:
| Security | Acquisition Date | Acquisition Cost |
| Aledade, Inc. Series B1 | 5/7/21 | $5,001,455 |
| Aristea Therapeutics, Inc. Series B | 10/6/20 | $3,522,703 |
| Asimov, Inc. Series B | 10/29/21 | $6,260,303 |
| Caris Life Sciences, Inc. Series D | 5/11/21 | $16,868,096 |
| dMed Biopharmaceutical Co. Ltd. Series C | 12/1/20 | $3,353,960 |
| Element Biosciences, Inc. Series C | 6/21/21 | $7,743,503 |
| ElevateBio LLC Series C | 3/9/21 | $685,044 |
| Inscripta, Inc. Series E | 3/30/21 | $7,297,324 |
| Omada Health, Inc. Series E | 12/22/21 | $8,734,725 |
| Seer, Inc. Class A | 12/8/20 | $5,204,765 |
| The Beauty Health Co. | 12/8/20 | $10,000,000 |
| The Oncology Institute, Inc. | 6/28/21 | $14,727,820 |
| Thriveworks TopCo LLC Series B | 7/23/21 | $5,597,126 |
| Wugen, Inc. Series B | 7/9/21 | $2,326,889 |
Affiliated Central Funds
Fiscal year to date information regarding the Fund's investments in Fidelity Central Funds, including the ownership percentage, is presented below.
| Fund | Value, beginning of period | Purchases | Sales Proceeds | Dividend Income | Realized Gain/Loss | Change in Unrealized appreciation (depreciation) | Value, end of period | % ownership, end of period |
| Fidelity Cash Central Fund 0.08% | $26,773,635 | $511,290,204 | $503,185,771 | $12,476 | $-- | $-- | $34,878,068 | 0.1% |
| Fidelity Securities Lending Cash Central Fund 0.08% | 90,896,753 | 410,547,864 | 350,305,265 | 320,894 | -- | -- | 151,139,352 | 0.5% |
| Total | $117,670,388 | $921,838,068 | $853,491,036 | $333,370 | $-- | $-- | $186,017,420 | |
Amounts in the income column in the above table include any capital gain distributions from underlying funds, which are presented in the corresponding line-item in the Statement of Operations, if applicable. Amount for Fidelity Securities Lending Cash Central Fund represents the income earned on investing cash collateral, less rebates paid to borrowers and any lending agent fees associated with the loan, plus any premium payments received for lending certain types of securities.
Investment Valuation
The following is a summary of the inputs used, as of January 31, 2022, involving the Fund's assets and liabilities carried at fair value. The inputs or methodology used for valuing securities may not be an indication of the risk associated with investing in those securities. For more information on valuation inputs, and their aggregation into the levels used below, please refer to the Investment Valuation section in the accompanying Notes to Financial Statements.
| | Valuation Inputs at Reporting Date: |
| Description | Total | Level 1 | Level 2 | Level 3 |
| Investments in Securities: | | | | |
| Common Stocks | $6,090,056,056 | $5,733,936,451 | $356,119,605 | $-- |
| Preferred Stocks | 61,963,997 | -- | -- | 61,963,997 |
| Money Market Funds | 186,017,420 | 186,017,420 | -- | -- |
| Total Investments in Securities: | $6,338,037,473 | $5,919,953,871 | $356,119,605 | $61,963,997 |
Other Information
Distribution of investments by country or territory of incorporation, as a percentage of Total Net Assets, is as follows (Unaudited):
| United States of America | 89.8% |
| Switzerland | 3.1% |
| Netherlands | 2.2% |
| United Kingdom | 1.6% |
| Denmark | 1.1% |
| Others (Individually Less Than 1%) | 2.2% |
| | 100.0% |
See accompanying notes which are an integral part of the financial statements.
Fidelity Advisor® Health Care Fund
Financial Statements
Statement of Assets and Liabilities
| | | January 31, 2022 (Unaudited) |
| Assets | | |
Investment in securities, at value (including securities loaned of $159,126,189) — See accompanying schedule:
Unaffiliated issuers (cost $4,744,244,736) | $6,152,020,053 | |
| Fidelity Central Funds (cost $186,017,420) | 186,017,420 | |
| Total Investment in Securities (cost $4,930,262,156) | | $6,338,037,473 |
| Cash | | 1,156,228 |
| Receivable for investments sold | | 86,014,760 |
| Receivable for fund shares sold | | 13,062,937 |
| Dividends receivable | | 1,589,726 |
| Distributions receivable from Fidelity Central Funds | | 77,921 |
| Prepaid expenses | | 16,477 |
| Total assets | | 6,439,955,522 |
| Liabilities | | |
| Payable for investments purchased | $41,286,330 | |
| Payable for fund shares redeemed | 9,468,216 | |
| Accrued management fee | 2,825,502 | |
| Distribution and service plan fees payable | 969,509 | |
| Other affiliated payables | 960,920 | |
| Other payables and accrued expenses | 143,213 | |
| Collateral on securities loaned | 151,137,474 | |
| Total liabilities | | 206,791,164 |
| Net Assets | | $6,233,164,358 |
| Net Assets consist of: | | |
| Paid in capital | | $4,763,939,964 |
| Total accumulated earnings (loss) | | 1,469,224,394 |
| Net Assets | | $6,233,164,358 |
| Net Asset Value and Maximum Offering Price | | |
| Class A: | | |
| Net Asset Value and redemption price per share ($1,523,664,992 ÷ 26,482,735 shares)(a) | | $57.53 |
| Maximum offering price per share (100/94.25 of $57.53) | | $61.04 |
| Class M: | | |
| Net Asset Value and redemption price per share ($343,862,158 ÷ 6,515,503 shares)(a) | | $52.78 |
| Maximum offering price per share (100/96.50 of $52.78) | | $54.69 |
| Class C: | | |
| Net Asset Value and offering price per share ($566,888,790 ÷ 13,145,980 shares)(a) | | $43.12 |
| Class I: | | |
| Net Asset Value, offering price and redemption price per share ($2,955,524,595 ÷ 46,405,457 shares) | | $63.69 |
| Class Z: | | |
| Net Asset Value, offering price and redemption price per share ($843,223,823 ÷ 13,226,882 shares) | | $63.75 |
(a) Redemption price per share is equal to net asset value less any applicable contingent deferred sales charge.
See accompanying notes which are an integral part of the financial statements.
Statement of Operations
| | | Six months ended January 31, 2022 (Unaudited) |
| Investment Income | | |
| Dividends | | $16,497,245 |
| Income from Fidelity Central Funds (including $320,894 from security lending) | | 333,370 |
| Total income | | 16,830,615 |
| Expenses | | |
| Management fee | $18,608,822 | |
| Transfer agent fees | 5,356,533 | |
| Distribution and service plan fees | 6,464,574 | |
| Accounting fees | 583,620 | |
| Custodian fees and expenses | 48,484 | |
| Independent trustees' fees and expenses | 12,628 | |
| Registration fees | 199,188 | |
| Audit | 28,298 | |
| Legal | 8,599 | |
| Interest | 1,245 | |
| Miscellaneous | 14,498 | |
| Total expenses before reductions | 31,326,489 | |
| Expense reductions | (109,601) | |
| Total expenses after reductions | | 31,216,888 |
| Net investment income (loss) | | (14,386,273) |
| Realized and Unrealized Gain (Loss) | | |
| Net realized gain (loss) on: | | |
| Investment securities: | | |
| Unaffiliated issuers | 186,295,290 | |
| Foreign currency transactions | 163,693 | |
| Total net realized gain (loss) | | 186,458,983 |
| Change in net unrealized appreciation (depreciation) on: | | |
| Investment securities: | | |
| Unaffiliated issuers | (1,028,636,658) | |
| Unfunded commitments | 1,565,567 | |
| Assets and liabilities in foreign currencies | (315,107) | |
| Total change in net unrealized appreciation (depreciation) | | (1,027,386,198) |
| Net gain (loss) | | (840,927,215) |
| Net increase (decrease) in net assets resulting from operations | | $(855,313,488) |
See accompanying notes which are an integral part of the financial statements.
Statement of Changes in Net Assets
| | Six months ended January 31, 2022 (Unaudited) | Year ended July 31, 2021 |
| Increase (Decrease) in Net Assets | | |
| Operations | | |
| Net investment income (loss) | $(14,386,273) | $(20,662,802) |
| Net realized gain (loss) | 186,458,983 | 545,420,950 |
| Change in net unrealized appreciation (depreciation) | (1,027,386,198) | 673,250,658 |
| Net increase (decrease) in net assets resulting from operations | (855,313,488) | 1,198,008,806 |
| Distributions to shareholders | (421,463,048) | (356,031,852) |
| Share transactions - net increase (decrease) | 311,657,416 | 823,653,502 |
| Total increase (decrease) in net assets | (965,119,120) | 1,665,630,456 |
| Net Assets | | |
| Beginning of period | 7,198,283,478 | 5,532,653,022 |
| End of period | $6,233,164,358 | $7,198,283,478 |
See accompanying notes which are an integral part of the financial statements.
Financial Highlights
Fidelity Advisor Health Care Fund Class A
| | Six months ended (Unaudited) January 31, | Years endedJuly 31, | | | | |
| | 2022 | 2021 | 2020 | 2019 | 2018 | 2017 |
| Selected Per–Share Data | | | | | | |
| Net asset value, beginning of period | $69.58 | $61.07 | $49.21 | $50.14 | $41.85 | $38.23 |
| Income from Investment Operations | | | | | | |
| Net investment income (loss)A,B | (.17) | (.26) | (.04) | (.07) | (.07) | (.04) |
| Net realized and unrealized gain (loss) | (7.73) | 12.55 | 12.08 | 1.36 | 8.36 | 3.66 |
| Total from investment operations | (7.90) | 12.29 | 12.04 | 1.29 | 8.29 | 3.62 |
| Distributions from net investment income | – | (.16) | – | – | – | – |
| Distributions from net realized gain | (4.15) | (3.62) | (.18) | (2.22) | – | – |
| Total distributions | (4.15) | (3.78) | (.18) | (2.22) | – | – |
| Redemption fees added to paid in capitalA | – | – | – | – | – | –C |
| Net asset value, end of period | $57.53 | $69.58 | $61.07 | $49.21 | $50.14 | $41.85 |
| Total ReturnD,E,F | (11.99)% | 20.70% | 24.50% | 2.87% | 19.81% | 9.47% |
| Ratios to Average Net AssetsB,G,H | | | | | | |
| Expenses before reductions | .97%I | .98% | 1.01% | 1.02% | 1.05% | 1.04% |
| Expenses net of fee waivers, if any | .97%I | .98% | 1.00% | 1.02% | 1.05% | 1.04% |
| Expenses net of all reductions | .97%I | .98% | 1.00% | 1.02% | 1.04% | 1.04% |
| Net investment income (loss) | (.49)%I | (.39)% | (.07)% | (.14)% | (.16)% | (.10)% |
| Supplemental Data | | | | | | |
| Net assets, end of period (000 omitted) | $1,523,665 | $1,735,235 | $1,372,082 | $1,121,411 | $1,003,430 | $875,176 |
| Portfolio turnover rateJ | 30%I | 38% | 53%K | 45% | 81% | 64% |
A Calculated based on average shares outstanding during the period.
B Net investment income (loss) is affected by the timing of the declaration of dividends by any underlying mutual funds or exchange-traded funds (ETFs). Net investment income (loss) of any such underlying funds is not included in the Fund's net investment income (loss) ratio.
C Amount represents less than $.005 per share.
D Total returns for periods of less than one year are not annualized.
E Total returns would have been lower if certain expenses had not been reduced during the applicable periods shown.
F Total returns do not include the effect of the sales charges.
G Fees and expenses of any underlying mutual funds or exchange-traded funds (ETFs) are not included in the Fund's expense ratio. The Fund indirectly bears its proportionate share of these expenses. For additional expense information related to investments in Fidelity Central Funds, please refer to the "Investments in Fidelity Central Funds" note found in the Notes to Financial Statements section of the most recent Annual or Semi-Annual report.
H Expense ratios reflect operating expenses of the class. Expenses before reductions do not reflect amounts reimbursed, waived, or reduced through arrangements with the investment adviser, brokerage services, or other offset arrangements, if applicable, and do not represent the amount paid by the class during periods when reimbursements, waivers or reductions occur.
I Annualized
J Amount does not include the portfolio activity of any underlying mutual funds or exchange-traded funds (ETFs).
K Portfolio turnover rate excludes securities received or delivered in-kind.
See accompanying notes which are an integral part of the financial statements.
Fidelity Advisor Health Care Fund Class M
| | Six months ended (Unaudited) January 31, | Years endedJuly 31, | | | | |
| | 2022 | 2021 | 2020 | 2019 | 2018 | 2017 |
| Selected Per–Share Data | | | | | | |
| Net asset value, beginning of period | $64.25 | $56.62 | $45.75 | $46.89 | $39.25 | $35.95 |
| Income from Investment Operations | | | | | | |
| Net investment income (loss)A,B | (.23) | (.39) | (.16) | (.18) | (.18) | (.13) |
| Net realized and unrealized gain (loss) | (7.09) | 11.61 | 11.21 | 1.26 | 7.82 | 3.43 |
| Total from investment operations | (7.32) | 11.22 | 11.05 | 1.08 | 7.64 | 3.30 |
| Distributions from net investment income | – | (.02) | – | – | – | – |
| Distributions from net realized gain | (4.15) | (3.57) | (.18) | (2.22) | – | – |
| Total distributions | (4.15) | (3.59) | (.18) | (2.22) | – | – |
| Redemption fees added to paid in capitalA | – | – | – | – | – | –C |
| Net asset value, end of period | $52.78 | $64.25 | $56.62 | $45.75 | $46.89 | $39.25 |
| Total ReturnD,E,F | (12.09)% | 20.39% | 24.19% | 2.61% | 19.46% | 9.18% |
| Ratios to Average Net AssetsB,G,H | | | | | | |
| Expenses before reductions | 1.22%I | 1.23% | 1.26% | 1.28% | 1.32% | 1.31% |
| Expenses net of fee waivers, if any | 1.22%I | 1.23% | 1.26% | 1.28% | 1.32% | 1.31% |
| Expenses net of all reductions | 1.22%I | 1.23% | 1.26% | 1.28% | 1.31% | 1.31% |
| Net investment income (loss) | (.74)%I | (.65)% | (.33)% | (.40)% | (.43)% | (.37)% |
| Supplemental Data | | | | | | |
| Net assets, end of period (000 omitted) | $343,862 | $402,175 | $349,280 | $306,758 | $298,061 | $269,332 |
| Portfolio turnover rateJ | 30%I | 38% | 53%K | 45% | 81% | 64% |
A Calculated based on average shares outstanding during the period.
B Net investment income (loss) is affected by the timing of the declaration of dividends by any underlying mutual funds or exchange-traded funds (ETFs). Net investment income (loss) of any such underlying funds is not included in the Fund's net investment income (loss) ratio.
C Amount represents less than $.005 per share.
D Total returns for periods of less than one year are not annualized.
E Total returns would have been lower if certain expenses had not been reduced during the applicable periods shown.
F Total returns do not include the effect of the sales charges.
G Fees and expenses of any underlying mutual funds or exchange-traded funds (ETFs) are not included in the Fund's expense ratio. The Fund indirectly bears its proportionate share of these expenses. For additional expense information related to investments in Fidelity Central Funds, please refer to the "Investments in Fidelity Central Funds" note found in the Notes to Financial Statements section of the most recent Annual or Semi-Annual report.
H Expense ratios reflect operating expenses of the class. Expenses before reductions do not reflect amounts reimbursed, waived, or reduced through arrangements with the investment adviser, brokerage services, or other offset arrangements, if applicable, and do not represent the amount paid by the class during periods when reimbursements, waivers or reductions occur.
I Annualized
J Amount does not include the portfolio activity of any underlying mutual funds or exchange-traded funds (ETFs).
K Portfolio turnover rate excludes securities received or delivered in-kind.
See accompanying notes which are an integral part of the financial statements.
Fidelity Advisor Health Care Fund Class C
| | Six months ended (Unaudited) January 31, | Years endedJuly 31, | | | | |
| | 2022 | 2021 | 2020 | 2019 | 2018 | 2017 |
| Selected Per–Share Data | | | | | | |
| Net asset value, beginning of period | $53.40 | $47.63 | $38.70 | $40.21 | $33.82 | $31.12 |
| Income from Investment Operations | | | | | | |
| Net investment income (loss)A,B | (.32) | (.58) | (.34) | (.34) | (.33) | (.26) |
| Net realized and unrealized gain (loss) | (5.81) | 9.71 | 9.45 | 1.05 | 6.72 | 2.96 |
| Total from investment operations | (6.13) | 9.13 | 9.11 | .71 | 6.39 | 2.70 |
| Distributions from net investment income | – | – | – | – | – | – |
| Distributions from net realized gain | (4.15) | (3.36) | (.18) | (2.22) | – | – |
| Total distributions | (4.15) | (3.36) | (.18) | (2.22) | – | – |
| Redemption fees added to paid in capitalA | – | – | – | – | – | –C |
| Net asset value, end of period | $43.12 | $53.40 | $47.63 | $38.70 | $40.21 | $33.82 |
| Total ReturnD,E,F | (12.32)% | 19.78% | 23.58% | 2.10% | 18.89% | 8.68% |
| Ratios to Average Net AssetsB,G,H | | | | | | |
| Expenses before reductions | 1.72%I | 1.73% | 1.76% | 1.77% | 1.80% | 1.79% |
| Expenses net of fee waivers, if any | 1.72%I | 1.73% | 1.76% | 1.77% | 1.80% | 1.79% |
| Expenses net of all reductions | 1.72%I | 1.73% | 1.75% | 1.77% | 1.79% | 1.79% |
| Net investment income (loss) | (1.25)%I | (1.15)% | (.82)% | (.88)% | (.91)% | (.85)% |
| Supplemental Data | | | | | | |
| Net assets, end of period (000 omitted) | $566,889 | $697,626 | $654,487 | $585,093 | $669,639 | $619,991 |
| Portfolio turnover rateJ | 30%I | 38% | 53%K | 45% | 81% | 64% |
A Calculated based on average shares outstanding during the period.
B Net investment income (loss) is affected by the timing of the declaration of dividends by any underlying mutual funds or exchange-traded funds (ETFs). Net investment income (loss) of any such underlying funds is not included in the Fund's net investment income (loss) ratio.
C Amount represents less than $.005 per share.
D Total returns for periods of less than one year are not annualized.
E Total returns would have been lower if certain expenses had not been reduced during the applicable periods shown.
F Total returns do not include the effect of the contingent deferred sales charge.
G Fees and expenses of any underlying mutual funds or exchange-traded funds (ETFs) are not included in the Fund's expense ratio. The Fund indirectly bears its proportionate share of these expenses. For additional expense information related to investments in Fidelity Central Funds, please refer to the "Investments in Fidelity Central Funds" note found in the Notes to Financial Statements section of the most recent Annual or Semi-Annual report.
H Expense ratios reflect operating expenses of the class. Expenses before reductions do not reflect amounts reimbursed, waived, or reduced through arrangements with the investment adviser, brokerage services, or other offset arrangements, if applicable, and do not represent the amount paid by the class during periods when reimbursements, waivers or reductions occur.
I Annualized
J Amount does not include the portfolio activity of any underlying mutual funds or exchange-traded funds (ETFs).
K Portfolio turnover rate excludes securities received or delivered in-kind.
See accompanying notes which are an integral part of the financial statements.
Fidelity Advisor Health Care Fund Class I
| | Six months ended (Unaudited) January 31, | Years endedJuly 31, | | | | |
| | 2022 | 2021 | 2020 | 2019 | 2018 | 2017 |
| Selected Per–Share Data | | | | | | |
| Net asset value, beginning of period | $76.48 | $66.81 | $53.77 | $54.43 | $45.35 | $41.31 |
| Income from Investment Operations | | | | | | |
| Net investment income (loss)A,B | (.09) | (.10) | .11 | .07 | .05 | .07 |
| Net realized and unrealized gain (loss) | (8.55) | 13.76 | 13.22 | 1.49 | 9.06 | 3.97 |
| Total from investment operations | (8.64) | 13.66 | 13.33 | 1.56 | 9.11 | 4.04 |
| Distributions from net investment income | – | (.30) | – | – | – | – |
| Distributions from net realized gain | (4.15) | (3.69) | (.29) | (2.22) | (.03) | – |
| Total distributions | (4.15) | (3.99) | (.29) | (2.22) | (.03) | – |
| Redemption fees added to paid in capitalA | – | – | – | – | – | –C |
| Net asset value, end of period | $63.69 | $76.48 | $66.81 | $53.77 | $54.43 | $45.35 |
| Total ReturnD,E | (11.87)% | 21.01% | 24.84% | 3.14% | 20.09% | 9.78% |
| Ratios to Average Net AssetsB,F,G | | | | | | |
| Expenses before reductions | .71%H | .72% | .74% | .76% | .79% | .78% |
| Expenses net of fee waivers, if any | .71%H | .72% | .74% | .76% | .79% | .78% |
| Expenses net of all reductions | .71%H | .72% | .74% | .76% | .78% | .78% |
| Net investment income (loss) | (.24)%H | (.13)% | .19% | .13% | .10% | .16% |
| Supplemental Data | | | | | | |
| Net assets, end of period (000 omitted) | $2,955,525 | $3,410,787 | $2,546,323 | $1,783,417 | $1,316,804 | $911,005 |
| Portfolio turnover rateI | 30%H | 38% | 53%J | 45% | 81% | 64% |
A Calculated based on average shares outstanding during the period.
B Net investment income (loss) is affected by the timing of the declaration of dividends by any underlying mutual funds or exchange-traded funds (ETFs). Net investment income (loss) of any such underlying funds is not included in the Fund's net investment income (loss) ratio.
C Amount represents less than $.005 per share.
D Total returns for periods of less than one year are not annualized.
E Total returns would have been lower if certain expenses had not been reduced during the applicable periods shown.
F Fees and expenses of any underlying mutual funds or exchange-traded funds (ETFs) are not included in the Fund's expense ratio. The Fund indirectly bears its proportionate share of these expenses. For additional expense information related to investments in Fidelity Central Funds, please refer to the "Investments in Fidelity Central Funds" note found in the Notes to Financial Statements section of the most recent Annual or Semi-Annual report.
G Expense ratios reflect operating expenses of the class. Expenses before reductions do not reflect amounts reimbursed, waived, or reduced through arrangements with the investment adviser, brokerage services, or other offset arrangements, if applicable, and do not represent the amount paid by the class during periods when reimbursements, waivers or reductions occur.
H Annualized
I Amount does not include the portfolio activity of any underlying mutual funds or exchange-traded funds (ETFs).
J Portfolio turnover rate excludes securities received or delivered in-kind.
See accompanying notes which are an integral part of the financial statements.
Fidelity Advisor Health Care Fund Class Z
| | Six months ended (Unaudited) January 31, | Years endedJuly 31, | | |
| | 2022 | 2021 | 2020 | 2019 A |
| Selected Per–Share Data | | | | |
| Net asset value, beginning of period | $76.55 | $66.88 | $53.84 | $57.87 |
| Income from Investment Operations | | | | |
| Net investment income (loss)B,C | (.04) | (.01) | .19 | .13 |
| Net realized and unrealized gain (loss) | (8.55) | 13.77 | 13.22 | (1.94) |
| Total from investment operations | (8.59) | 13.76 | 13.41 | (1.81) |
| Distributions from net investment income | – | (.37) | – | – |
| Distributions from net realized gain | (4.21) | (3.73) | (.37) | (2.22) |
| Total distributions | (4.21) | (4.09)D | (.37) | (2.22) |
| Redemption fees added to paid in capitalB | – | – | – | – |
| Net asset value, end of period | $63.75 | $76.55 | $66.88 | $53.84 |
| Total ReturnE,F | (11.81)% | 21.15% | 24.98% | (2.86)% |
| Ratios to Average Net AssetsC,G,H | | | | |
| Expenses before reductions | .59%I | .60% | .61% | .62%I |
| Expenses net of fee waivers, if any | .59%I | .60% | .61% | .62%I |
| Expenses net of all reductions | .59%I | .59% | .61% | .62%I |
| Net investment income (loss) | (.11)%I | (.01)% | .32% | .30%I |
| Supplemental Data | | | | |
| Net assets, end of period (000 omitted) | $843,224 | $952,460 | $610,481 | $238,873 |
| Portfolio turnover rateJ | 30%I | 38% | 53%K | 45%I |
A For the period October 2, 2018 (commencement of sale of shares) through July 31, 2019.
B Calculated based on average shares outstanding during the period.
C Net investment income (loss) is affected by the timing of the declaration of dividends by any underlying mutual funds or exchange-traded funds (ETFs). Net investment income (loss) of any such underlying funds is not included in the Fund's net investment income (loss) ratio.
D Total distributions per share do not sum due to rounding.
E Total returns for periods of less than one year are not annualized.
F Total returns would have been lower if certain expenses had not been reduced during the applicable periods shown.
G Fees and expenses of any underlying mutual funds or exchange-traded funds (ETFs) are not included in the Fund's expense ratio. The Fund indirectly bears its proportionate share of these expenses. For additional expense information related to investments in Fidelity Central Funds, please refer to the "Investments in Fidelity Central Funds" note found in the Notes to Financial Statements section of the most recent Annual or Semi-Annual report.
H Expense ratios reflect operating expenses of the class. Expenses before reductions do not reflect amounts reimbursed, waived, or reduced through arrangements with the investment adviser, brokerage services, or other offset arrangements, if applicable, and do not represent the amount paid by the class during periods when reimbursements, waivers or reductions occur.
I Annualized
J Amount does not include the portfolio activity of any underlying mutual funds or exchange-traded funds (ETFs).
K Portfolio turnover rate excludes securities received or delivered in-kind.
See accompanying notes which are an integral part of the financial statements.
Fidelity Advisor® Industrials Fund
Investment Summary (Unaudited)
Top Ten Stocks as of January 31, 2022
| | % of fund's net assets |
| Roper Technologies, Inc. | 10.3 |
| Crane Co. | 6.4 |
| Ingersoll Rand, Inc. | 6.1 |
| Willscot Mobile Mini Holdings | 6.0 |
| AMETEK, Inc. | 5.8 |
| Fortive Corp. | 5.3 |
| The Boeing Co. | 4.4 |
| Howmet Aerospace, Inc. | 4.3 |
| TransDigm Group, Inc. | 3.8 |
| Honeywell International, Inc. | 3.6 |
| | 56.0 |
Top Industries (% of fund's net assets)
| As of January 31, 2022 |
| | Aerospace & Defense | 23.6% |
| | Machinery | 20.0% |
| | Industrial Conglomerates | 13.9% |
| | Electrical Equipment | 11.6% |
| | Road & Rail | 10.0% |
| | All Others* | 20.9% |
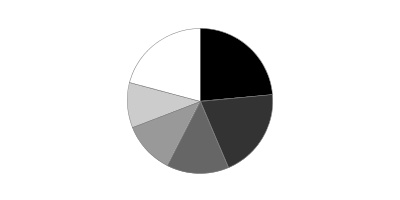
* Includes short-term investments and net other assets (liabilities).
Fidelity Advisor® Industrials Fund
Schedule of Investments January 31, 2022 (Unaudited)
Showing Percentage of Net Assets
| Common Stocks - 100.2% | | | |
| | | Shares | Value |
| Aerospace & Defense - 23.6% | | | |
| Aerospace & Defense - 23.6% | | | |
| Airbus Group NV (a) | | 83,200 | $10,624,073 |
| General Dynamics Corp. | | 18,100 | 3,839,010 |
| HEICO Corp. | | 8,800 | 1,200,232 |
| HEICO Corp. Class A | | 120,800 | 13,251,760 |
| Hexcel Corp. (b) | | 30,800 | 1,606,836 |
| Howmet Aerospace, Inc. | | 826,000 | 25,680,340 |
| Raytheon Technologies Corp. | | 184,900 | 16,676,131 |
| Spirit AeroSystems Holdings, Inc. Class A | | 54,500 | 2,388,735 |
| The Boeing Co. (a) | | 130,300 | 26,091,272 |
| TransDigm Group, Inc. (a) | | 37,114 | 22,869,276 |
| Triumph Group, Inc. (a) | | 890,347 | 16,222,122 |
| | | | 140,449,787 |
| Air Freight & Logistics - 0.0% | | | |
| Air Freight & Logistics - 0.0% | | | |
| FedEx Corp. | | 100 | 24,586 |
| Building Products - 4.2% | | | |
| Building Products - 4.2% | | | |
| Builders FirstSource, Inc. (a) | | 163,800 | 11,136,762 |
| Johnson Controls International PLC | | 182,100 | 13,233,207 |
| Zurn Water Solutions Corp. | | 24,800 | 757,392 |
| | | | 25,127,361 |
| Commercial Services & Supplies - 2.7% | | | |
| Diversified Support Services - 2.0% | | | |
| Copart, Inc. (a) | | 92,500 | 11,955,625 |
| Environmental & Facility Services - 0.7% | | | |
| GFL Environmental, Inc. | | 129,100 | 4,243,517 |
| Tetra Tech, Inc. | | 800 | 111,352 |
| | | | 4,354,869 |
|
| TOTAL COMMERCIAL SERVICES & SUPPLIES | | | 16,310,494 |
|
| Construction & Engineering - 6.4% | | | |
| Construction & Engineering - 6.4% | | | |
| AECOM | | 32,300 | 2,232,899 |
| Willscot Mobile Mini Holdings (a) | | 963,800 | 35,699,152 |
| | | | 37,932,051 |
| Electrical Equipment - 11.6% | | | |
| Electrical Components & Equipment - 11.6% | | | |
| Acuity Brands, Inc. | | 81,538 | 15,616,973 |
| AMETEK, Inc. | | 252,834 | 34,580,106 |
| nVent Electric PLC | | 456,748 | 15,798,913 |
| Regal Rexnord Corp. | | 21,123 | 3,347,573 |
| | | | 69,343,565 |
| Industrial Conglomerates - 13.9% | | | |
| Industrial Conglomerates - 13.9% | | | |
| Honeywell International, Inc. | | 103,894 | 21,244,245 |
| Roper Technologies, Inc. | | 141,132 | 61,697,265 |
| | | | 82,941,510 |
| Machinery - 20.0% | | | |
| Industrial Machinery - 20.0% | | | |
| Chart Industries, Inc. (a) | | 9,600 | 1,169,952 |
| Crane Co. | | 367,000 | 37,988,170 |
| Flowserve Corp. | | 19,500 | 636,090 |
| Fortive Corp. | | 444,175 | 31,332,105 |
| IDEX Corp. | | 41,300 | 8,897,672 |
| Ingersoll Rand, Inc. | | 647,200 | 36,379,112 |
| ITT, Inc. | | 29,451 | 2,707,136 |
| | | | 119,110,237 |
| Professional Services - 4.3% | | | |
| Human Resource & Employment Services - 1.1% | | | |
| TriNet Group, Inc. (a) | | 73,343 | 6,248,824 |
| Research & Consulting Services - 3.2% | | | |
| Clarivate Analytics PLC (a) | | 56,100 | 923,406 |
| CoStar Group, Inc. (a) | | 70,600 | 4,953,296 |
| Exponent, Inc. | | 33,100 | 3,143,838 |
| FTI Consulting, Inc. (a) | | 70,500 | 10,279,605 |
| | | | 19,300,145 |
|
| TOTAL PROFESSIONAL SERVICES | | | 25,548,969 |
|
| Road & Rail - 10.0% | | | |
| Railroads - 6.8% | | | |
| CSX Corp. | | 356,600 | 12,202,852 |
| Norfolk Southern Corp. | | 75,591 | 20,559,996 |
| Union Pacific Corp. | | 32,279 | 7,893,829 |
| | | | 40,656,677 |
| Trucking - 3.2% | | | |
| J.B. Hunt Transport Services, Inc. | | 96,053 | 18,494,045 |
| Old Dominion Freight Lines, Inc. | | 400 | 120,772 |
| | | | 18,614,817 |
|
| TOTAL ROAD & RAIL | | | 59,271,494 |
|
| Trading Companies & Distributors - 3.5% | | | |
| Trading Companies & Distributors - 3.5% | | | |
| H&E Equipment Services, Inc. | | 7,300 | 303,899 |
| Herc Holdings, Inc. | | 101,180 | 16,234,331 |
| United Rentals, Inc. (a) | | 13,500 | 4,321,620 |
| | | | 20,859,850 |
| TOTAL COMMON STOCKS | | | |
| (Cost $528,776,019) | | | 596,919,904 |
|
| Money Market Funds - 0.0% | | | |
| Fidelity Securities Lending Cash Central Fund 0.08% (c)(d) | | | |
| (Cost $10,300) | | 10,299 | 10,300 |
| TOTAL INVESTMENT IN SECURITIES - 100.2% | | | |
| (Cost $528,786,319) | | | 596,930,204 |
| NET OTHER ASSETS (LIABILITIES) - (0.2)% | | | (1,144,868) |
| NET ASSETS - 100% | | | $595,785,336 |
Legend
(a) Non-income producing
(b) Security or a portion of the security is on loan at period end.
(c) Investment made with cash collateral received from securities on loan.
(d) Affiliated fund that is generally available only to investment companies and other accounts managed by Fidelity Investments. The rate quoted is the annualized seven-day yield of the fund at period end. A complete unaudited listing of the fund's holdings as of its most recent quarter end is available upon request. In addition, each Fidelity Central Fund's financial statements are available on the SEC's website or upon request.
Affiliated Central Funds
Fiscal year to date information regarding the Fund's investments in Fidelity Central Funds, including the ownership percentage, is presented below.
| Fund | Value, beginning of period | Purchases | Sales Proceeds | Dividend Income | Realized Gain/Loss | Change in Unrealized appreciation (depreciation) | Value, end of period | % ownership, end of period |
| Fidelity Cash Central Fund 0.08% | $7,140,324 | $73,910,026 | $81,050,350 | $889 | $-- | $-- | $-- | 0.0% |
| Fidelity Securities Lending Cash Central Fund 0.08% | -- | 56,160,510 | 56,150,210 | 2,743 | -- | -- | 10,300 | 0.0% |
| Total | $7,140,324 | $130,070,536 | $137,200,560 | $3,632 | $-- | $-- | $10,300 | |
Amounts in the income column in the above table include any capital gain distributions from underlying funds, which are presented in the corresponding line-item in the Statement of Operations, if applicable. Amount for Fidelity Securities Lending Cash Central Fund represents the income earned on investing cash collateral, less rebates paid to borrowers and any lending agent fees associated with the loan, plus any premium payments received for lending certain types of securities.
Investment Valuation
The following is a summary of the inputs used, as of January 31, 2022, involving the Fund's assets and liabilities carried at fair value. The inputs or methodology used for valuing securities may not be an indication of the risk associated with investing in those securities. For more information on valuation inputs, and their aggregation into the levels used below, please refer to the Investment Valuation section in the accompanying Notes to Financial Statements.
| | Valuation Inputs at Reporting Date: |
| Description | Total | Level 1 | Level 2 | Level 3 |
| Investments in Securities: | | | | |
| Common Stocks | $596,919,904 | $586,295,831 | $10,624,073 | $-- |
| Money Market Funds | 10,300 | 10,300 | -- | -- |
| Total Investments in Securities: | $596,930,204 | $586,306,131 | $10,624,073 | $-- |
See accompanying notes which are an integral part of the financial statements.
Fidelity Advisor® Industrials Fund
Financial Statements
Statement of Assets and Liabilities
| | | January 31, 2022 (Unaudited) |
| Assets | | |
Investment in securities, at value (including securities loaned of $10,434) — See accompanying schedule:
Unaffiliated issuers (cost $528,776,019) | $596,919,904 | |
| Fidelity Central Funds (cost $10,300) | 10,300 | |
| Total Investment in Securities (cost $528,786,319) | | $596,930,204 |
| Receivable for investments sold | | 17,439,780 |
| Receivable for fund shares sold | | 350,651 |
| Dividends receivable | | 114,571 |
| Distributions receivable from Fidelity Central Funds | | 177 |
| Prepaid expenses | | 3,959 |
| Total assets | | 614,839,342 |
| Liabilities | | |
| Payable to custodian bank | $2,432,594 | |
| Payable for fund shares redeemed | 16,075,860 | |
| Accrued management fee | 278,268 | |
| Distribution and service plan fees payable | 117,018 | |
| Other affiliated payables | 107,999 | |
| Other payables and accrued expenses | 31,967 | |
| Collateral on securities loaned | 10,300 | |
| Total liabilities | | 19,054,006 |
| Net Assets | | $595,785,336 |
| Net Assets consist of: | | |
| Paid in capital | | $505,050,171 |
| Total accumulated earnings (loss) | | 90,735,165 |
| Net Assets | | $595,785,336 |
| Net Asset Value and Maximum Offering Price | | |
| Class A: | | |
| Net Asset Value and redemption price per share ($240,881,773 ÷ 6,674,560 shares)(a) | | $36.09 |
| Maximum offering price per share (100/94.25 of $36.09) | | $38.29 |
| Class M: | | |
| Net Asset Value and redemption price per share ($53,817,412 ÷ 1,542,347 shares)(a) | | $34.89 |
| Maximum offering price per share (100/96.50 of $34.89) | | $36.16 |
| Class C: | | |
| Net Asset Value and offering price per share ($46,525,051 ÷ 1,530,527 shares)(a) | | $30.40 |
| Class I: | | |
| Net Asset Value, offering price and redemption price per share ($221,705,855 ÷ 5,697,922 shares) | | $38.91 |
| Class Z: | | |
| Net Asset Value, offering price and redemption price per share ($32,855,245 ÷ 846,081 shares) | | $38.83 |
(a) Redemption price per share is equal to net asset value less any applicable contingent deferred sales charge.
See accompanying notes which are an integral part of the financial statements.
Statement of Operations
| | | Six months ended January 31, 2022 (Unaudited) |
| Investment Income | | |
| Dividends | | $2,019,760 |
| Income from Fidelity Central Funds (including $2,743 from security lending) | | 3,632 |
| Total income | | 2,023,392 |
| Expenses | | |
| Management fee | $1,747,461 | |
| Transfer agent fees | 545,783 | |
| Distribution and service plan fees | 737,878 | |
| Accounting fees | 120,220 | |
| Custodian fees and expenses | 9,386 | |
| Independent trustees' fees and expenses | 1,176 | |
| Registration fees | 60,158 | |
| Audit | 25,019 | |
| Legal | 2,624 | |
| Interest | 341 | |
| Miscellaneous | 1,840 | |
| Total expenses before reductions | 3,251,886 | |
| Expense reductions | (10,109) | |
| Total expenses after reductions | | 3,241,777 |
| Net investment income (loss) | | (1,218,385) |
| Realized and Unrealized Gain (Loss) | | |
| Net realized gain (loss) on: | | |
| Investment securities: | | |
| Unaffiliated issuers | 49,341,403 | |
| Foreign currency transactions | (6,892) | |
| Total net realized gain (loss) | | 49,334,511 |
| Change in net unrealized appreciation (depreciation) on: | | |
| Investment securities: | | |
| Unaffiliated issuers | (65,162,289) | |
| Assets and liabilities in foreign currencies | (6) | |
| Total change in net unrealized appreciation (depreciation) | | (65,162,295) |
| Net gain (loss) | | (15,827,784) |
| Net increase (decrease) in net assets resulting from operations | | $(17,046,169) |
See accompanying notes which are an integral part of the financial statements.
Statement of Changes in Net Assets
| | Six months ended January 31, 2022 (Unaudited) | Year ended July 31, 2021 |
| Increase (Decrease) in Net Assets | | |
| Operations | | |
| Net investment income (loss) | $(1,218,385) | $(2,253,821) |
| Net realized gain (loss) | 49,334,511 | 131,391,098 |
| Change in net unrealized appreciation (depreciation) | (65,162,295) | 39,130,944 |
| Net increase (decrease) in net assets resulting from operations | (17,046,169) | 168,268,221 |
| Distributions to shareholders | (121,901,510) | (3,415,748) |
| Share transactions - net increase (decrease) | 60,089,784 | 58,057,679 |
| Total increase (decrease) in net assets | (78,857,895) | 222,910,152 |
| Net Assets | | |
| Beginning of period | 674,643,231 | 451,733,079 |
| End of period | $595,785,336 | $674,643,231 |
See accompanying notes which are an integral part of the financial statements.
Financial Highlights
Fidelity Advisor Industrials Fund Class A
| | Six months ended (Unaudited) January 31, | Years endedJuly 31, | | | | |
| | 2022 | 2021 | 2020 | 2019 | 2018 | 2017 |
| Selected Per–Share Data | | | | | | |
| Net asset value, beginning of period | $45.64 | $33.85 | $38.95 | $42.62 | $37.89 | $35.52 |
| Income from Investment Operations | | | | | | |
| Net investment income (loss)A,B | (.09) | (.17) | .18C | .24 | .13 | .19 |
| Net realized and unrealized gain (loss) | (.81) | 12.20 | (2.46) | (.02) | 5.87 | 4.24 |
| Total from investment operations | (.90) | 12.03 | (2.28) | .22 | 6.00 | 4.43 |
| Distributions from net investment income | – | – | (.25) | (.19) | (.10) | (.16) |
| Distributions from net realized gain | (8.65) | (.24) | (2.57) | (3.70) | (1.17) | (1.90) |
| Total distributions | (8.65) | (.24) | (2.82) | (3.89) | (1.27) | (2.06) |
| Redemption fees added to paid in capitalA | – | – | – | – | – | –D |
| Net asset value, end of period | $36.09 | $45.64 | $33.85 | $38.95 | $42.62 | $37.89 |
| Total ReturnE,F,G | (2.78)% | 35.63% | (6.58)% | 2.06% | 15.97% | 12.62% |
| Ratios to Average Net AssetsB,H,I | | | | | | |
| Expenses before reductions | 1.02%J | 1.03% | 1.05% | 1.04% | 1.06% | 1.06% |
| Expenses net of fee waivers, if any | 1.02%J | 1.03% | 1.05% | 1.04% | 1.06% | 1.06% |
| Expenses net of all reductions | 1.02%J | 1.01% | 1.03% | 1.03% | 1.05% | 1.06% |
| Net investment income (loss) | (.41)%J | (.40)% | .49%C | .63% | .32% | .53% |
| Supplemental Data | | | | | | |
| Net assets, end of period (000 omitted) | $240,882 | $264,130 | $199,835 | $268,483 | $303,201 | $309,204 |
| Portfolio turnover rateK | 131%J | 205% | 219%L | 125% | 61% | 57% |
A Calculated based on average shares outstanding during the period.
B Net investment income (loss) is affected by the timing of the declaration of dividends by any underlying mutual funds or exchange-traded funds (ETFs). Net investment income (loss) of any such underlying funds is not included in the Fund's net investment income (loss) ratio.
C Net investment income per share reflects one or more large, non-recurring dividend(s) which amounted to $.07 per share. Excluding such non-recurring dividend(s), the ratio of net investment income (loss) to average net assets would have been .29%.
D Amount represents less than $.005 per share.
E Total returns for periods of less than one year are not annualized.
F Total returns would have been lower if certain expenses had not been reduced during the applicable periods shown.
G Total returns do not include the effect of the sales charges.
H Fees and expenses of any underlying mutual funds or exchange-traded funds (ETFs) are not included in the Fund's expense ratio. The Fund indirectly bears its proportionate share of these expenses. For additional expense information related to investments in Fidelity Central Funds, please refer to the "Investments in Fidelity Central Funds" note found in the Notes to Financial Statements section of the most recent Annual or Semi-Annual report.
I Expense ratios reflect operating expenses of the class. Expenses before reductions do not reflect amounts reimbursed, waived, or reduced through arrangements with the investment adviser, brokerage services, or other offset arrangements, if applicable, and do not represent the amount paid by the class during periods when reimbursements, waivers or reductions occur.
J Annualized
K Amount does not include the portfolio activity of any underlying mutual funds or exchange-traded funds (ETFs).
L Portfolio turnover rate excludes securities received or delivered in-kind.
See accompanying notes which are an integral part of the financial statements.
Fidelity Advisor Industrials Fund Class M
| | Six months ended (Unaudited) January 31, | Years endedJuly 31, | | | | |
| | 2022 | 2021 | 2020 | 2019 | 2018 | 2017 |
| Selected Per–Share Data | | | | | | |
| Net asset value, beginning of period | $44.31 | $32.96 | $37.99 | $41.65 | $37.03 | $34.77 |
| Income from Investment Operations | | | | | | |
| Net investment income (loss)A,B | (.14) | (.27) | .08C | .14 | .03 | .10 |
| Net realized and unrealized gain (loss) | (.78) | 11.86 | (2.39) | (.03) | 5.74 | 4.14 |
| Total from investment operations | (.92) | 11.59 | (2.31) | .11 | 5.77 | 4.24 |
| Distributions from net investment income | – | – | (.15) | (.07) | – | (.08) |
| Distributions from net realized gain | (8.50) | (.24) | (2.57) | (3.70) | (1.15) | (1.90) |
| Total distributions | (8.50) | (.24) | (2.72) | (3.77) | (1.15) | (1.98) |
| Redemption fees added to paid in capitalA | – | – | – | – | – | –D |
| Net asset value, end of period | $34.89 | $44.31 | $32.96 | $37.99 | $41.65 | $37.03 |
| Total ReturnE,F,G | (2.91)% | 35.25% | (6.82)% | 1.78% | 15.70% | 12.33% |
| Ratios to Average Net AssetsB,H,I | | | | | | |
| Expenses before reductions | 1.27%J | 1.29% | 1.31% | 1.31% | 1.32% | 1.32% |
| Expenses net of fee waivers, if any | 1.27%J | 1.29% | 1.31% | 1.30% | 1.32% | 1.32% |
| Expenses net of all reductions | 1.27%J | 1.27% | 1.30% | 1.30% | 1.31% | 1.32% |
| Net investment income (loss) | (.66)%J | (.66)% | .23%C | .37% | .07% | .27% |
| Supplemental Data | | | | | | |
| Net assets, end of period (000 omitted) | $53,817 | $56,680 | $45,157 | $61,570 | $72,143 | $87,253 |
| Portfolio turnover rateK | 131%J | 205% | 219%L | 125% | 61% | 57% |
A Calculated based on average shares outstanding during the period.
B Net investment income (loss) is affected by the timing of the declaration of dividends by any underlying mutual funds or exchange-traded funds (ETFs). Net investment income (loss) of any such underlying funds is not included in the Fund's net investment income (loss) ratio.
C Net investment income per share reflects one or more large, non-recurring dividend(s) which amounted to $.07 per share. Excluding such non-recurring dividend(s), the ratio of net investment income (loss) to average net assets would have been .03%.
D Amount represents less than $.005 per share.
E Total returns for periods of less than one year are not annualized.
F Total returns would have been lower if certain expenses had not been reduced during the applicable periods shown.
G Total returns do not include the effect of the sales charges.
H Fees and expenses of any underlying mutual funds or exchange-traded funds (ETFs) are not included in the Fund's expense ratio. The Fund indirectly bears its proportionate share of these expenses. For additional expense information related to investments in Fidelity Central Funds, please refer to the "Investments in Fidelity Central Funds" note found in the Notes to Financial Statements section of the most recent Annual or Semi-Annual report.
I Expense ratios reflect operating expenses of the class. Expenses before reductions do not reflect amounts reimbursed, waived, or reduced through arrangements with the investment adviser, brokerage services, or other offset arrangements, if applicable, and do not represent the amount paid by the class during periods when reimbursements, waivers or reductions occur.
J Annualized
K Amount does not include the portfolio activity of any underlying mutual funds or exchange-traded funds (ETFs).
L Portfolio turnover rate excludes securities received or delivered in-kind.
See accompanying notes which are an integral part of the financial statements.
Fidelity Advisor Industrials Fund Class C
| | Six months ended (Unaudited) January 31, | Years endedJuly 31, | | | | |
| | 2022 | 2021 | 2020 | 2019 | 2018 | 2017 |
| Selected Per–Share Data | | | | | | |
| Net asset value, beginning of period | $39.46 | $29.52 | $34.27 | $38.09 | $34.09 | $32.24 |
| Income from Investment Operations | | | | | | |
| Net investment income (loss)A,B | (.22) | (.41) | (.08)C | (.04) | (.16) | (.08) |
| Net realized and unrealized gain (loss) | (.66) | 10.59 | (2.15) | (.08) | 5.28 | 3.83 |
| Total from investment operations | (.88) | 10.18 | (2.23) | (.12) | 5.12 | 3.75 |
| Distributions from net investment income | – | – | (.03) | – | – | – |
| Distributions from net realized gain | (8.18) | (.24) | (2.49) | (3.70) | (1.12) | (1.90) |
| Total distributions | (8.18) | (.24) | (2.52) | (3.70) | (1.12) | (1.90) |
| Redemption fees added to paid in capitalA | – | – | – | – | – | –D |
| Net asset value, end of period | $30.40 | $39.46 | $29.52 | $34.27 | $38.09 | $34.09 |
| Total ReturnE,F,G | (3.13)% | 34.58% | (7.27)% | 1.28% | 15.13% | 11.76% |
| Ratios to Average Net AssetsB,H,I | | | | | | |
| Expenses before reductions | 1.77%J | 1.79% | 1.81% | 1.80% | 1.82% | 1.82% |
| Expenses net of fee waivers, if any | 1.77%J | 1.79% | 1.81% | 1.80% | 1.82% | 1.82% |
| Expenses net of all reductions | 1.77%J | 1.77% | 1.79% | 1.79% | 1.81% | 1.81% |
| Net investment income (loss) | (1.16)%J | (1.16)% | (.26)%C | (.12)% | (.43)% | (.23)% |
| Supplemental Data | | | | | | |
| Net assets, end of period (000 omitted) | $46,525 | $55,576 | $53,969 | $90,512 | $138,249 | $134,505 |
| Portfolio turnover rateK | 131%J | 205% | 219%L | 125% | 61% | 57% |
A Calculated based on average shares outstanding during the period.
B Net investment income (loss) is affected by the timing of the declaration of dividends by any underlying mutual funds or exchange-traded funds (ETFs). Net investment income (loss) of any such underlying funds is not included in the Fund's net investment income (loss) ratio.
C Net investment income per share reflects one or more large, non-recurring dividend(s) which amounted to $.06 per share. Excluding such non-recurring dividend(s), the ratio of net investment income (loss) to average net assets would have been (.46) %.
D Amount represents less than $.005 per share.
E Total returns for periods of less than one year are not annualized.
F Total returns would have been lower if certain expenses had not been reduced during the applicable periods shown.
G Total returns do not include the effect of the contingent deferred sales charge.
H Fees and expenses of any underlying mutual funds or exchange-traded funds (ETFs) are not included in the Fund's expense ratio. The Fund indirectly bears its proportionate share of these expenses. For additional expense information related to investments in Fidelity Central Funds, please refer to the "Investments in Fidelity Central Funds" note found in the Notes to Financial Statements section of the most recent Annual or Semi-Annual report.
I Expense ratios reflect operating expenses of the class. Expenses before reductions do not reflect amounts reimbursed, waived, or reduced through arrangements with the investment adviser, brokerage services, or other offset arrangements, if applicable, and do not represent the amount paid by the class during periods when reimbursements, waivers or reductions occur.
J Annualized
K Amount does not include the portfolio activity of any underlying mutual funds or exchange-traded funds (ETFs).
L Portfolio turnover rate excludes securities received or delivered in-kind.
See accompanying notes which are an integral part of the financial statements.
Fidelity Advisor Industrials Fund Class I
| | Six months ended (Unaudited) January 31, | Years endedJuly 31, | | | | |
| | 2022 | 2021 | 2020 | 2019 | 2018 | 2017 |
| Selected Per–Share Data | | | | | | |
| Net asset value, beginning of period | $48.64 | $35.97 | $41.20 | $44.85 | $39.80 | $37.21 |
| Income from Investment Operations | | | | | | |
| Net investment income (loss)A,B | (.03) | (.06) | .29C | .37 | .25 | .31 |
| Net realized and unrealized gain (loss) | (.88) | 12.97 | (2.60) | (.02) | 6.18 | 4.44 |
| Total from investment operations | (.91) | 12.91 | (2.31) | .35 | 6.43 | 4.75 |
| Distributions from net investment income | – | – | (.35) | (.30) | (.21) | (.25) |
| Distributions from net realized gain | (8.82) | (.24) | (2.57) | (3.70) | (1.17) | (1.90) |
| Total distributions | (8.82) | (.24) | (2.92) | (4.00) | (1.38) | (2.16)D |
| Redemption fees added to paid in capitalA | – | – | – | – | – | –E |
| Net asset value, end of period | $38.91 | $48.64 | $35.97 | $41.20 | $44.85 | $39.80 |
| Total ReturnF,G | (2.65)% | 35.98% | (6.32)% | 2.31% | 16.30% | 12.91% |
| Ratios to Average Net AssetsB,H,I | | | | | | |
| Expenses before reductions | .75%J | .76% | .78% | .78% | .80% | .80% |
| Expenses net of fee waivers, if any | .75%J | .76% | .78% | .77% | .80% | .80% |
| Expenses net of all reductions | .75%J | .74% | .76% | .77% | .79% | .80% |
| Net investment income (loss) | (.14)%J | (.14)% | .76%C | .90% | .59% | .79% |
| Supplemental Data | | | | | | |
| Net assets, end of period (000 omitted) | $221,706 | $248,090 | $123,603 | $219,218 | $320,902 | $284,727 |
| Portfolio turnover rateK | 131%J | 205% | 219%L | 125% | 61% | 57% |
A Calculated based on average shares outstanding during the period.
B Net investment income (loss) is affected by the timing of the declaration of dividends by any underlying mutual funds or exchange-traded funds (ETFs). Net investment income (loss) of any such underlying funds is not included in the Fund's net investment income (loss) ratio.
C Net investment income per share reflects one or more large, non-recurring dividend(s) which amounted to $.08 per share. Excluding such non-recurring dividend(s), the ratio of net investment income (loss) to average net assets would have been .56%.
D Total distributions per share do not sum due to rounding.
E Amount represents less than $.005 per share.
F Total returns for periods of less than one year are not annualized.
G Total returns would have been lower if certain expenses had not been reduced during the applicable periods shown.
H Fees and expenses of any underlying mutual funds or exchange-traded funds (ETFs) are not included in the Fund's expense ratio. The Fund indirectly bears its proportionate share of these expenses. For additional expense information related to investments in Fidelity Central Funds, please refer to the "Investments in Fidelity Central Funds" note found in the Notes to Financial Statements section of the most recent Annual or Semi-Annual report.
I Expense ratios reflect operating expenses of the class. Expenses before reductions do not reflect amounts reimbursed, waived, or reduced through arrangements with the investment adviser, brokerage services, or other offset arrangements, if applicable, and do not represent the amount paid by the class during periods when reimbursements, waivers or reductions occur.
J Annualized
K Amount does not include the portfolio activity of any underlying mutual funds or exchange-traded funds (ETFs).
L Portfolio turnover rate excludes securities received or delivered in-kind.
See accompanying notes which are an integral part of the financial statements.
Fidelity Advisor Industrials Fund Class Z
| | Six months ended (Unaudited) January 31, | Years endedJuly 31, | | |
| | 2022 | 2021 | 2020 | 2019 A |
| Selected Per–Share Data | | | | |
| Net asset value, beginning of period | $48.61 | $35.90 | $41.15 | $46.84 |
| Income from Investment Operations | | | | |
| Net investment income (loss)B,C | – | – | .34D | .34 |
| Net realized and unrealized gain (loss) | (.89) | 12.95 | (2.60) | (1.94) |
| Total from investment operations | (.89) | 12.95 | (2.26) | (1.60) |
| Distributions from net investment income | – | – | (.42) | (.39) |
| Distributions from net realized gain | (8.89) | (.24) | (2.57) | (3.70) |
| Total distributions | (8.89) | (.24) | (2.99) | (4.09) |
| Redemption fees added to paid in capitalB | – | – | – | – |
| Net asset value, end of period | $38.83 | $48.61 | $35.90 | $41.15 |
| Total ReturnE,F | (2.60)% | 36.16% | (6.21)% | (1.92)% |
| Ratios to Average Net AssetsC,G,H | | | | |
| Expenses before reductions | .63%I | .64% | .65% | .64%I |
| Expenses net of fee waivers, if any | .63%I | .64% | .65% | .64%I |
| Expenses net of all reductions | .63%I | .62% | .63% | .64%I |
| Net investment income (loss) | (.02)%I | (.01)% | .89%D | 1.04%I |
| Supplemental Data | | | | |
| Net assets, end of period (000 omitted) | $32,855 | $50,167 | $29,168 | $11,077 |
| Portfolio turnover rateJ | 131%I | 205% | 219% | 125%I,K |
A For the period October 2, 2018 (commencement of sale of shares) through July 31, 2019.
B Calculated based on average shares outstanding during the period.
C Net investment income (loss) is affected by the timing of the declaration of dividends by any underlying mutual funds or exchange-traded funds (ETFs). Net investment income (loss) of any such underlying funds is not included in the Fund's net investment income (loss) ratio.
D Net investment income per share reflects one or more large, non-recurring dividend(s) which amounted to $.08 per share. Excluding such non-recurring dividend(s), the ratio of net investment income (loss) to average net assets would have been .69%.
E Total returns for periods of less than one year are not annualized.
F Total returns would have been lower if certain expenses had not been reduced during the applicable periods shown.
G Fees and expenses of any underlying mutual funds or exchange-traded funds (ETFs) are not included in the Fund's expense ratio. The Fund indirectly bears its proportionate share of these expenses. For additional expense information related to investments in Fidelity Central Funds, please refer to the "Investments in Fidelity Central Funds" note found in the Notes to Financial Statements section of the most recent Annual or Semi-Annual report.
H Expense ratios reflect operating expenses of the class. Expenses before reductions do not reflect amounts reimbursed, waived, or reduced through arrangements with the investment adviser, brokerage services, or other offset arrangements, if applicable, and do not represent the amount paid by the class during periods when reimbursements, waivers or reductions occur.
I Annualized
J Amount does not include the portfolio activity of any underlying mutual funds or exchange-traded funds (ETFs).
K Portfolio turnover rate excludes securities received or delivered in-kind.
See accompanying notes which are an integral part of the financial statements.
Fidelity Advisor® Semiconductors Fund
Investment Summary (Unaudited)
Top Ten Stocks as of January 31, 2022
| | % of fund's net assets |
| NVIDIA Corp. | 21.5 |
| NXP Semiconductors NV | 8.6 |
| Marvell Technology, Inc. | 7.9 |
| Microchip Technology, Inc. | 5.9 |
| onsemi | 4.8 |
| Analog Devices, Inc. | 4.6 |
| Broadcom, Inc. | 4.2 |
| Teradyne, Inc. | 3.5 |
| Lam Research Corp. | 3.4 |
| Xilinx, Inc. | 3.2 |
| | 67.6 |
Top Industries (% of fund's net assets)
| As of January 31, 2022 |
| | Semiconductors & Semiconductor Equipment | 94.1% |
| | Software | 2.4% |
| | Electronic Equipment & Components | 1.3% |
| | Technology Hardware, Storage & Peripherals | 0.8% |
| | Electrical Equipment | 0.1% |
| | All Others* | 1.3% |

* Includes short-term investments and net other assets (liabilities).
Fidelity Advisor® Semiconductors Fund
Schedule of Investments January 31, 2022 (Unaudited)
Showing Percentage of Net Assets
| Common Stocks - 98.4% | | | |
| | | Shares | Value |
| Electrical Equipment - 0.1% | | | |
| Electrical Components & Equipment - 0.1% | | | |
| Array Technologies, Inc. (a) | | 94,900 | $1,000,246 |
| Electronic Equipment & Components - 1.3% | | | |
| Electronic Equipment & Instruments - 0.1% | | | |
| Aeva Technologies, Inc. (a)(b) | | 118,100 | 617,663 |
| Electronic Manufacturing Services - 1.2% | | | |
| Flex Ltd. (a) | | 169,827 | 2,747,801 |
| Jabil, Inc. | | 140,276 | 8,625,571 |
| | | | 11,373,372 |
|
| TOTAL ELECTRONIC EQUIPMENT & COMPONENTS | | | 11,991,035 |
|
| Semiconductors & Semiconductor Equipment - 93.8% | | | |
| Semiconductor Equipment - 10.9% | | | |
| Applied Materials, Inc. | | 98,500 | 13,610,730 |
| KLA Corp. | | 24,300 | 9,459,261 |
| Lam Research Corp. | | 53,046 | 31,292,896 |
| Nova Ltd. (a)(b) | | 118,532 | 14,022,336 |
| Teradyne, Inc. | | 273,700 | 32,140,591 |
| | | | 100,525,814 |
| Semiconductors - 82.9% | | | |
| Advanced Micro Devices, Inc. (a) | | 151,000 | 17,251,750 |
| Allegro MicroSystems LLC (a) | | 373,000 | 10,585,740 |
| Alpha & Omega Semiconductor Ltd. (a) | | 63,000 | 2,836,890 |
| Analog Devices, Inc. | | 256,706 | 42,092,083 |
| ASE Technology Holding Co. Ltd. ADR | | 119,500 | 846,060 |
| Broadcom, Inc. | | 66,725 | 39,092,843 |
| Cirrus Logic, Inc. (a) | | 120,328 | 10,762,136 |
| Diodes, Inc. (a) | | 87,100 | 8,082,009 |
| First Solar, Inc. (a) | | 1,871 | 146,649 |
| GlobalFoundries, Inc. | | 485,700 | 23,964,438 |
| Intel Corp. | | 233,864 | 11,417,240 |
| MACOM Technology Solutions Holdings, Inc. (a) | | 176,800 | 10,821,928 |
| Marvell Technology, Inc. | | 1,025,633 | 73,230,196 |
| MaxLinear, Inc. Class A (a) | | 70,349 | 4,222,347 |
| Microchip Technology, Inc. | | 699,709 | 54,213,453 |
| Micron Technology, Inc. | | 104,112 | 8,565,294 |
| Monolithic Power Systems, Inc. | | 15,100 | 6,084,243 |
| NVIDIA Corp. | | 810,692 | 198,506,045 |
| NXP Semiconductors NV | | 385,812 | 79,261,217 |
| onsemi (a) | | 746,136 | 44,022,024 |
| Qualcomm, Inc. | | 135,726 | 23,855,202 |
| Silicon Motion Tech Corp. sponsored ADR | | 74,800 | 5,909,200 |
| SMART Global Holdings, Inc. (a) | | 43,400 | 2,489,424 |
| Synaptics, Inc. (a) | | 22,300 | 4,690,805 |
| Taiwan Semiconductor Manufacturing Co. Ltd. sponsored ADR | | 225,600 | 27,665,328 |
| Texas Instruments, Inc. | | 120,600 | 21,646,494 |
| Wolfspeed, Inc. (a) | | 43,200 | 4,071,168 |
| Xilinx, Inc. | | 150,850 | 29,197,018 |
| | | | 765,529,224 |
|
| TOTAL SEMICONDUCTORS & SEMICONDUCTOR EQUIPMENT | | | 866,055,038 |
|
| Software - 2.4% | | | |
| Application Software - 2.4% | | | |
| Cadence Design Systems, Inc. (a) | | 147,800 | 22,486,292 |
| Technology Hardware, Storage & Peripherals - 0.8% | | | |
| Technology Hardware, Storage & Peripherals - 0.8% | | | |
| IonQ, Inc. (c) | | 15,000 | 171,600 |
| Samsung Electronics Co. Ltd. | | 116,360 | 7,236,496 |
| | | | 7,408,096 |
| TOTAL COMMON STOCKS | | | |
| (Cost $567,245,115) | | | 908,940,707 |
|
| Convertible Preferred Stocks - 0.2% | | | |
| Metals & Mining - 0.1% | | | |
| Precious Metals & Minerals - 0.1% | | | |
| Diamond Foundry, Inc. Series C (c)(d) | | 18,335 | 504,029 |
| Semiconductors & Semiconductor Equipment - 0.1% | | | |
| Semiconductor Equipment - 0.0% | | | |
| Astera Labs, Inc. Series C (c)(d) | | 19,433 | 78,509 |
| Semiconductors - 0.1% | | | |
| GaN Systems, Inc.: | | | |
| Series F1 (c)(d) | | 52,877 | 448,397 |
| Series F2 (c)(d) | | 27,921 | 236,770 |
| SiMa.ai Series B (c)(d) | | 30,638 | 200,066 |
| Tenstorrent, Inc. Series C1 (c)(d) | | 900 | 67,536 |
| | | | 952,769 |
|
| TOTAL SEMICONDUCTORS & SEMICONDUCTOR EQUIPMENT | | | 1,031,278 |
|
| TOTAL CONVERTIBLE PREFERRED STOCKS | | | |
| (Cost $1,401,139) | | | 1,535,307 |
| | | Principal Amount | Value |
|
| Convertible Bonds - 0.1% | | | |
| Semiconductors & Semiconductor Equipment - 0.1% | | | |
| Semiconductors - 0.1% | | | |
SMART Global Holdings, Inc. 2.25% 2/15/26
(Cost $310,000) | | 310,000 | 489,644 |
| | | Shares | Value |
|
| Preferred Securities - 0.1% | | | |
| Semiconductors & Semiconductor Equipment - 0.1% | | | |
| Semiconductors - 0.1% | | | |
| GaN Systems, Inc. 0% (c)(d)(e) | | 1,239,360 | 1,239,360 |
| Tenstorrent, Inc. 0% (c)(d)(e) | | 50,000 | 50,000 |
| (Cost $1,289,360) | | | 1,289,360 |
|
| Money Market Funds - 1.5% | | | |
| Fidelity Cash Central Fund 0.08% (f) | | 7,625,471 | 7,626,996 |
| Fidelity Securities Lending Cash Central Fund 0.08% (f)(g) | | 6,276,797 | 6,277,425 |
| TOTAL MONEY MARKET FUNDS | | | |
| (Cost $13,904,421) | | | 13,904,421 |
| TOTAL INVESTMENT IN SECURITIES - 100.3% | | | |
| (Cost $584,150,035) | | | 926,159,439 |
| NET OTHER ASSETS (LIABILITIES) - (0.3)% | | | (2,696,399) |
| NET ASSETS - 100% | | | $923,463,040 |
Legend
(a) Non-income producing
(b) Security or a portion of the security is on loan at period end.
(c) Restricted securities (including private placements) - Investment in securities not registered under the Securities Act of 1933 (excluding 144A issues). At the end of the period, the value of restricted securities (excluding 144A issues) amounted to $2,996,267 or 0.3% of net assets.
(d) Level 3 security
(e) Security is perpetual in nature with no stated maturity date.
(f) Affiliated fund that is generally available only to investment companies and other accounts managed by Fidelity Investments. The rate quoted is the annualized seven-day yield of the fund at period end. A complete unaudited listing of the fund's holdings as of its most recent quarter end is available upon request. In addition, each Fidelity Central Fund's financial statements are available on the SEC's website or upon request.
(g) Investment made with cash collateral received from securities on loan.
Additional information on each restricted holding is as follows:
| Security | Acquisition Date | Acquisition Cost |
| Astera Labs, Inc. Series C | 8/24/21 | $65,330 |
| Diamond Foundry, Inc. Series C | 3/15/21 | $440,040 |
| GaN Systems, Inc. Series F1 | 11/30/21 | $448,397 |
| GaN Systems, Inc. Series F2 | 11/30/21 | $236,770 |
| GaN Systems, Inc. 0% | 11/30/21 | $1,239,360 |
| IonQ, Inc. | 3/7/21 | $150,000 |
| SiMa.ai Series B | 5/10/21 | $157,093 |
| Tenstorrent, Inc. Series C1 | 4/23/21 | $53,509 |
| Tenstorrent, Inc. 0% | 4/23/21 | $50,000 |
Affiliated Central Funds
Fiscal year to date information regarding the Fund's investments in Fidelity Central Funds, including the ownership percentage, is presented below.
| Fund | Value, beginning of period | Purchases | Sales Proceeds | Dividend Income | Realized Gain/Loss | Change in Unrealized appreciation (depreciation) | Value, end of period | % ownership, end of period |
| Fidelity Cash Central Fund 0.08% | $17,931,298 | $150,508,680 | $160,812,982 | $7,542 | $-- | $-- | $7,626,996 | 0.0% |
| Fidelity Securities Lending Cash Central Fund 0.08% | 159,300 | 74,199,634 | 68,081,509 | 8,953 | -- | -- | 6,277,425 | 0.0% |
| Total | $18,090,598 | $224,708,314 | $228,894,491 | $16,495 | $-- | $-- | $13,904,421 | |
Amounts in the income column in the above table include any capital gain distributions from underlying funds, which are presented in the corresponding line-item in the Statement of Operations, if applicable. Amount for Fidelity Securities Lending Cash Central Fund represents the income earned on investing cash collateral, less rebates paid to borrowers and any lending agent fees associated with the loan, plus any premium payments received for lending certain types of securities.
Investment Valuation
The following is a summary of the inputs used, as of January 31, 2022, involving the Fund's assets and liabilities carried at fair value. The inputs or methodology used for valuing securities may not be an indication of the risk associated with investing in those securities. For more information on valuation inputs, and their aggregation into the levels used below, please refer to the Investment Valuation section in the accompanying Notes to Financial Statements.
| | Valuation Inputs at Reporting Date: |
| Description | Total | Level 1 | Level 2 | Level 3 |
| Investments in Securities: | | | | |
| Common Stocks | $908,940,707 | $901,704,211 | $7,236,496 | $-- |
| Convertible Preferred Stocks | 1,535,307 | -- | -- | 1,535,307 |
| Convertible Bonds | 489,644 | -- | 489,644 | -- |
| Preferred Securities | 1,289,360 | -- | -- | 1,289,360 |
| Money Market Funds | 13,904,421 | 13,904,421 | -- | -- |
| Total Investments in Securities: | $926,159,439 | $915,608,632 | $7,726,140 | $2,824,667 |
Other Information
Distribution of investments by country or territory of incorporation, as a percentage of Total Net Assets, is as follows (Unaudited):
| United States of America | 81.9% |
| Netherlands | 8.6% |
| Cayman Islands | 3.3% |
| Taiwan | 3.1% |
| Israel | 1.5% |
| Others (Individually Less Than 1%) | 1.6% |
| | 100.0% |
See accompanying notes which are an integral part of the financial statements.
Fidelity Advisor® Semiconductors Fund
Financial Statements
Statement of Assets and Liabilities
| | | January 31, 2022 (Unaudited) |
| Assets | | |
Investment in securities, at value (including securities loaned of $6,641,031) — See accompanying schedule:
Unaffiliated issuers (cost $570,245,614) | $912,255,018 | |
| Fidelity Central Funds (cost $13,904,421) | 13,904,421 | |
| Total Investment in Securities (cost $584,150,035) | | $926,159,439 |
| Foreign currency held at value (cost $37,772) | | 37,520 |
| Receivable for investments sold | | 6,459,210 |
| Receivable for fund shares sold | | 2,982,179 |
| Dividends receivable | | 174,801 |
| Interest receivable | | 3,216 |
| Distributions receivable from Fidelity Central Funds | | 2,181 |
| Prepaid expenses | | 1,656 |
| Total assets | | 935,820,202 |
| Liabilities | | |
| Payable for investments purchased | $1,725,971 | |
| Payable for fund shares redeemed | 3,517,594 | |
| Accrued management fee | 428,949 | |
| Distribution and service plan fees payable | 198,195 | |
| Other affiliated payables | 161,241 | |
| Other payables and accrued expenses | 47,787 | |
| Collateral on securities loaned | 6,277,425 | |
| Total liabilities | | 12,357,162 |
| Net Assets | | $923,463,040 |
| Net Assets consist of: | | |
| Paid in capital | | $571,696,804 |
| Total accumulated earnings (loss) | | 351,766,236 |
| Net Assets | | $923,463,040 |
| Net Asset Value and Maximum Offering Price | | |
| Class A: | | |
| Net Asset Value and redemption price per share ($363,837,787 ÷ 7,419,691 shares)(a) | | $49.04 |
| Maximum offering price per share (100/94.25 of $49.04) | | $52.03 |
| Class M: | | |
| Net Asset Value and redemption price per share ($58,029,073 ÷ 1,255,379 shares)(a) | | $46.22 |
| Maximum offering price per share (100/96.50 of $46.22) | | $47.90 |
| Class C: | | |
| Net Asset Value and offering price per share ($105,070,486 ÷ 2,595,667 shares)(a) | | $40.48 |
| Class I: | | |
| Net Asset Value, offering price and redemption price per share ($345,519,568 ÷ 6,582,022 shares) | | $52.49 |
| Class Z: | | |
| Net Asset Value, offering price and redemption price per share ($51,006,126 ÷ 972,332 shares) | | $52.46 |
(a) Redemption price per share is equal to net asset value less any applicable contingent deferred sales charge.
See accompanying notes which are an integral part of the financial statements.
Statement of Operations
| | | Six months ended January 31, 2022 (Unaudited) |
| Investment Income | | |
| Dividends | | $2,953,875 |
| Interest | | 3,490 |
| Income from Fidelity Central Funds (including $8,953 from security lending) | | 16,495 |
| Total income | | 2,973,860 |
| Expenses | | |
| Management fee | $2,279,735 | |
| Transfer agent fees | 706,845 | |
| Distribution and service plan fees | 1,081,157 | |
| Accounting fees | 148,166 | |
| Custodian fees and expenses | 9,198 | |
| Independent trustees' fees and expenses | 1,387 | |
| Registration fees | 111,950 | |
| Audit | 25,428 | |
| Legal | 1,026 | |
| Miscellaneous | 1,552 | |
| Total expenses before reductions | 4,366,444 | |
| Expense reductions | (13,948) | |
| Total expenses after reductions | | 4,352,496 |
| Net investment income (loss) | | (1,378,636) |
| Realized and Unrealized Gain (Loss) | | |
| Net realized gain (loss) on: | | |
| Investment securities: | | |
| Unaffiliated issuers | 21,626,897 | |
| Foreign currency transactions | (7,883) | |
| Total net realized gain (loss) | | 21,619,014 |
| Change in net unrealized appreciation (depreciation) on: | | |
| Investment securities: | | |
| Unaffiliated issuers | 46,228,521 | |
| Unfunded commitments | 16,080 | |
| Assets and liabilities in foreign currencies | 802 | |
| Total change in net unrealized appreciation (depreciation) | | 46,245,403 |
| Net gain (loss) | | 67,864,417 |
| Net increase (decrease) in net assets resulting from operations | | $66,485,781 |
See accompanying notes which are an integral part of the financial statements.
Statement of Changes in Net Assets
| | Six months ended January 31, 2022 (Unaudited) | Year ended July 31, 2021 |
| Increase (Decrease) in Net Assets | | |
| Operations | | |
| Net investment income (loss) | $(1,378,636) | $(1,163,580) |
| Net realized gain (loss) | 21,619,014 | 48,436,327 |
| Change in net unrealized appreciation (depreciation) | 46,245,403 | 185,045,770 |
| Net increase (decrease) in net assets resulting from operations | 66,485,781 | 232,318,517 |
| Distributions to shareholders | (43,908,353) | (20,932,303) |
| Share transactions - net increase (decrease) | 200,592,975 | 127,672,949 |
| Total increase (decrease) in net assets | 223,170,403 | 339,059,163 |
| Net Assets | | |
| Beginning of period | 700,292,637 | 361,233,474 |
| End of period | $923,463,040 | $700,292,637 |
See accompanying notes which are an integral part of the financial statements.
Financial Highlights
Fidelity Advisor Semiconductors Fund Class A
| | Six months ended (Unaudited) January 31, | Years endedJuly 31, | | | | |
| | 2022 | 2021 | 2020 | 2019 | 2018 | 2017 |
| Selected Per–Share Data | | | | | | |
| Net asset value, beginning of period | $46.29 | $29.79 | $23.03 | $25.06 | $21.57 | $16.50 |
| Income from Investment Operations | | | | | | |
| Net investment income (loss)A,B | (.09) | (.08) | .14 | .15 | .02 | .11 |
| Net realized and unrealized gain (loss) | 5.32 | 18.29 | 6.90 | 1.25 | 5.73 | 5.03 |
| Total from investment operations | 5.23 | 18.21 | 7.04 | 1.40 | 5.75 | 5.14 |
| Distributions from net investment income | – | (.04) | (.07) | (.10) | (.05)C | (.05) |
| Distributions from net realized gain | (2.48) | (1.67) | (.20) | (3.33) | (2.21)C | (.02) |
| Total distributions | (2.48) | (1.71) | (.28)D | (3.43) | (2.26) | (.07) |
| Redemption fees added to paid in capitalA | – | – | – | – | –E | –E |
| Net asset value, end of period | $49.04 | $46.29 | $29.79 | $23.03 | $25.06 | $21.57 |
| Total ReturnF,G,H | 10.78% | 62.45% | 30.65% | 10.18% | 27.35% | 31.21% |
| Ratios to Average Net AssetsB,I,J | | | | | | |
| Expenses before reductions | 1.02%K | 1.04% | 1.10% | 1.12% | 1.15% | 1.17% |
| Expenses net of fee waivers, if any | 1.01%K | 1.04% | 1.09% | 1.11% | 1.15% | 1.17% |
| Expenses net of all reductions | 1.01%K | 1.03% | 1.08% | 1.11% | 1.13% | 1.16% |
| Net investment income (loss) | (.33)%K | (.21)% | .53% | .70% | .09% | .55% |
| Supplemental Data | | | | | | |
| Net assets, end of period (000 omitted) | $363,838 | $279,755 | $140,072 | $98,459 | $97,883 | $72,040 |
| Portfolio turnover rateL | 26%K | 41% | 136% | 110% | 133% | 99% |
A Calculated based on average shares outstanding during the period.
B Net investment income (loss) is affected by the timing of the declaration of dividends by any underlying mutual funds or exchange-traded funds (ETFs). Net investment income (loss) of any such underlying funds is not included in the Fund's net investment income (loss) ratio.
C The amount shown reflects reclassifications related to book to tax differences that were made in the year shown.
D Total distributions per share do not sum due to rounding.
E Amount represents less than $.005 per share.
F Total returns for periods of less than one year are not annualized.
G Total returns would have been lower if certain expenses had not been reduced during the applicable periods shown.
H Total returns do not include the effect of the sales charges.
I Fees and expenses of any underlying mutual funds or exchange-traded funds (ETFs) are not included in the Fund's expense ratio. The Fund indirectly bears its proportionate share of these expenses. For additional expense information related to investments in Fidelity Central Funds, please refer to the "Investments in Fidelity Central Funds" note found in the Notes to Financial Statements section of the most recent Annual or Semi-Annual report.
J Expense ratios reflect operating expenses of the class. Expenses before reductions do not reflect amounts reimbursed, waived, or reduced through arrangements with the investment adviser, brokerage services, or other offset arrangements, if applicable, and do not represent the amount paid by the class during periods when reimbursements, waivers or reductions occur.
K Annualized
L Amount does not include the portfolio activity of any underlying mutual funds or exchange-traded funds (ETFs).
See accompanying notes which are an integral part of the financial statements.
Fidelity Advisor Semiconductors Fund Class M
| | Six months ended (Unaudited) January 31, | Years endedJuly 31, | | | | |
| | 2022 | 2021 | 2020 | 2019 | 2018 | 2017 |
| Selected Per–Share Data | | | | | | |
| Net asset value, beginning of period | $43.75 | $28.25 | $21.89 | $24.04 | $20.77 | $15.91 |
| Income from Investment Operations | | | | | | |
| Net investment income (loss)A,B | (.14) | (.17) | .06 | .08 | (.05) | .04 |
| Net realized and unrealized gain (loss) | 5.03 | 17.31 | 6.55 | 1.16 | 5.50 | 4.84 |
| Total from investment operations | 4.89 | 17.14 | 6.61 | 1.24 | 5.45 | 4.88 |
| Distributions from net investment income | – | – | (.05) | (.06) | –C | – |
| Distributions from net realized gain | (2.42) | (1.64) | (.20) | (3.33) | (2.18)C | (.02) |
| Total distributions | (2.42) | (1.64) | (.25) | (3.39) | (2.18) | (.02) |
| Redemption fees added to paid in capitalA | – | – | – | – | –D | –D |
| Net asset value, end of period | $46.22 | $43.75 | $28.25 | $21.89 | $24.04 | $20.77 |
| Total ReturnE,F,G | 10.64% | 61.98% | 30.28% | 9.84% | 26.95% | 30.72% |
| Ratios to Average Net AssetsB,H,I | | | | | | |
| Expenses before reductions | 1.26%J | 1.30% | 1.38% | 1.44% | 1.48% | 1.53% |
| Expenses net of fee waivers, if any | 1.26%J | 1.30% | 1.38% | 1.43% | 1.47% | 1.53% |
| Expenses net of all reductions | 1.26%J | 1.29% | 1.37% | 1.43% | 1.46% | 1.52% |
| Net investment income (loss) | (.57)%J | (.47)% | .24% | .38% | (.23)% | .20% |
| Supplemental Data | | | | | | |
| Net assets, end of period (000 omitted) | $58,029 | $49,963 | $29,262 | $22,587 | $21,830 | $16,127 |
| Portfolio turnover rateK | 26%J | 41% | 136% | 110% | 133% | 99% |
A Calculated based on average shares outstanding during the period.
B Net investment income (loss) is affected by the timing of the declaration of dividends by any underlying mutual funds or exchange-traded funds (ETFs). Net investment income (loss) of any such underlying funds is not included in the Fund's net investment income (loss) ratio.
C The amount shown reflects reclassifications related to book to tax differences that were made in the year shown.
D Amount represents less than $.005 per share.
E Total returns for periods of less than one year are not annualized.
F Total returns would have been lower if certain expenses had not been reduced during the applicable periods shown.
G Total returns do not include the effect of the sales charges.
H Fees and expenses of any underlying mutual funds or exchange-traded funds (ETFs) are not included in the Fund's expense ratio. The Fund indirectly bears its proportionate share of these expenses. For additional expense information related to investments in Fidelity Central Funds, please refer to the "Investments in Fidelity Central Funds" note found in the Notes to Financial Statements section of the most recent Annual or Semi-Annual report.
I Expense ratios reflect operating expenses of the class. Expenses before reductions do not reflect amounts reimbursed, waived, or reduced through arrangements with the investment adviser, brokerage services, or other offset arrangements, if applicable, and do not represent the amount paid by the class during periods when reimbursements, waivers or reductions occur.
J Annualized
K Amount does not include the portfolio activity of any underlying mutual funds or exchange-traded funds (ETFs).
See accompanying notes which are an integral part of the financial statements.
Fidelity Advisor Semiconductors Fund Class C
| | Six months ended (Unaudited) January 31, | Years endedJuly 31, | | | | |
| | 2022 | 2021 | 2020 | 2019 | 2018 | 2017 |
| Selected Per–Share Data | | | | | | |
| Net asset value, beginning of period | $38.59 | $25.18 | $19.59 | $21.88 | $19.10 | $14.69 |
| Income from Investment Operations | | | | | | |
| Net investment income (loss)A,B | (.23) | (.31) | (.05) | (.01) | (.14) | (.04) |
| Net realized and unrealized gain (loss) | 4.46 | 15.35 | 5.86 | .98 | 5.05 | 4.47 |
| Total from investment operations | 4.23 | 15.04 | 5.81 | .97 | 4.91 | 4.43 |
| Distributions from net investment income | – | – | (.01) | – | – | – |
| Distributions from net realized gain | (2.34) | (1.63) | (.20) | (3.26) | (2.13) | (.02) |
| Total distributions | (2.34) | (1.63) | (.22)C | (3.26) | (2.13) | (.02) |
| Redemption fees added to paid in capitalA | – | – | – | – | –D | –D |
| Net asset value, end of period | $40.48 | $38.59 | $25.18 | $19.59 | $21.88 | $19.10 |
| Total ReturnE,F,G | 10.36% | 61.17% | 29.73% | 9.33% | 26.38% | 30.21% |
| Ratios to Average Net AssetsB,H,I | | | | | | |
| Expenses before reductions | 1.77%J | 1.79% | 1.85% | 1.87% | 1.91% | 1.95% |
| Expenses net of fee waivers, if any | 1.77%J | 1.79% | 1.85% | 1.87% | 1.91% | 1.95% |
| Expenses net of all reductions | 1.77%J | 1.79% | 1.83% | 1.87% | 1.89% | 1.94% |
| Net investment income (loss) | (1.09)%J | (.97)% | (.23)% | (.06)% | (.67)% | (.23)% |
| Supplemental Data | | | | | | |
| Net assets, end of period (000 omitted) | $105,070 | $86,217 | $57,320 | $45,659 | $57,915 | $42,684 |
| Portfolio turnover rateK | 26%J | 41% | 136% | 110% | 133% | 99% |
A Calculated based on average shares outstanding during the period.
B Net investment income (loss) is affected by the timing of the declaration of dividends by any underlying mutual funds or exchange-traded funds (ETFs). Net investment income (loss) of any such underlying funds is not included in the Fund's net investment income (loss) ratio.
C Total distributions per share do not sum due to rounding.
D Amount represents less than $.005 per share.
E Total returns for periods of less than one year are not annualized.
F Total returns would have been lower if certain expenses had not been reduced during the applicable periods shown.
G Total returns do not include the effect of the contingent deferred sales charge.
H Fees and expenses of any underlying mutual funds or exchange-traded funds (ETFs) are not included in the Fund's expense ratio. The Fund indirectly bears its proportionate share of these expenses. For additional expense information related to investments in Fidelity Central Funds, please refer to the "Investments in Fidelity Central Funds" note found in the Notes to Financial Statements section of the most recent Annual or Semi-Annual report.
I Expense ratios reflect operating expenses of the class. Expenses before reductions do not reflect amounts reimbursed, waived, or reduced through arrangements with the investment adviser, brokerage services, or other offset arrangements, if applicable, and do not represent the amount paid by the class during periods when reimbursements, waivers or reductions occur.
J Annualized
K Amount does not include the portfolio activity of any underlying mutual funds or exchange-traded funds (ETFs).
See accompanying notes which are an integral part of the financial statements.
Fidelity Advisor Semiconductors Fund Class I
| | Six months ended (Unaudited) January 31, | Years endedJuly 31, | | | | |
| | 2022 | 2021 | 2020 | 2019 | 2018 | 2017 |
| Selected Per–Share Data | | | | | | |
| Net asset value, beginning of period | $49.39 | $31.68 | $24.42 | $26.33 | $22.56 | $17.24 |
| Income from Investment Operations | | | | | | |
| Net investment income (loss)A,B | (.02) | .03 | .22 | .23 | .10 | .17 |
| Net realized and unrealized gain (loss) | 5.65 | 19.47 | 7.34 | 1.35 | 5.99 | 5.26 |
| Total from investment operations | 5.63 | 19.50 | 7.56 | 1.58 | 6.09 | 5.43 |
| Distributions from net investment income | – | (.12) | (.10) | (.16) | (.11)C | (.09) |
| Distributions from net realized gain | (2.53) | (1.67) | (.20) | (3.33) | (2.21)C | (.02) |
| Total distributions | (2.53) | (1.79) | (.30) | (3.49) | (2.32) | (.11) |
| Redemption fees added to paid in capitalA | – | – | – | – | –D | –D |
| Net asset value, end of period | $52.49 | $49.39 | $31.68 | $24.42 | $26.33 | $22.56 |
| Total ReturnE,F | 10.91% | 62.86% | 31.08% | 10.46% | 27.74% | 31.62% |
| Ratios to Average Net AssetsB,G,H | | | | | | |
| Expenses before reductions | .76%I | .77% | .81% | .83% | .86% | .88% |
| Expenses net of fee waivers, if any | .75%I | .77% | .81% | .82% | .86% | .88% |
| Expenses net of all reductions | .75%I | .76% | .79% | .82% | .84% | .87% |
| Net investment income (loss) | (.07)%I | .06% | .81% | .98% | .38% | .84% |
| Supplemental Data | | | | | | |
| Net assets, end of period (000 omitted) | $345,520 | $257,502 | $126,660 | $98,451 | $140,362 | $91,052 |
| Portfolio turnover rateJ | 26%I | 41% | 136% | 110% | 133% | 99% |
A Calculated based on average shares outstanding during the period.
B Net investment income (loss) is affected by the timing of the declaration of dividends by any underlying mutual funds or exchange-traded funds (ETFs). Net investment income (loss) of any such underlying funds is not included in the Fund's net investment income (loss) ratio.
C The amount shown reflects reclassifications related to book to tax differences that were made in the year shown.
D Amount represents less than $.005 per share.
E Total returns for periods of less than one year are not annualized.
F Total returns would have been lower if certain expenses had not been reduced during the applicable periods shown.
G Fees and expenses of any underlying mutual funds or exchange-traded funds (ETFs) are not included in the Fund's expense ratio. The Fund indirectly bears its proportionate share of these expenses. For additional expense information related to investments in Fidelity Central Funds, please refer to the "Investments in Fidelity Central Funds" note found in the Notes to Financial Statements section of the most recent Annual or Semi-Annual report.
H Expense ratios reflect operating expenses of the class. Expenses before reductions do not reflect amounts reimbursed, waived, or reduced through arrangements with the investment adviser, brokerage services, or other offset arrangements, if applicable, and do not represent the amount paid by the class during periods when reimbursements, waivers or reductions occur.
I Annualized
J Amount does not include the portfolio activity of any underlying mutual funds or exchange-traded funds (ETFs).
See accompanying notes which are an integral part of the financial statements.
Fidelity Advisor Semiconductors Fund Class Z
| | Six months ended (Unaudited) January 31, | Years endedJuly 31, | | |
| | 2022 | 2021 | 2020 | 2019 A |
| Selected Per–Share Data | | | | |
| Net asset value, beginning of period | $49.35 | $31.65 | $24.38 | $26.00 |
| Income from Investment Operations | | | | |
| Net investment income (loss)B,C | .02 | .08 | .26 | .17 |
| Net realized and unrealized gain (loss) | 5.65 | 19.45 | 7.33 | 1.76 |
| Total from investment operations | 5.67 | 19.53 | 7.59 | 1.93 |
| Distributions from net investment income | – | (.16) | (.11) | (.22) |
| Distributions from net realized gain | (2.56) | (1.67) | (.20) | (3.33) |
| Total distributions | (2.56) | (1.83) | (.32)D | (3.55) |
| Redemption fees added to paid in capitalB | – | – | – | – |
| Net asset value, end of period | $52.46 | $49.35 | $31.65 | $24.38 |
| Total ReturnE,F | 10.99% | 63.06% | 31.22% | 12.03% |
| Ratios to Average Net AssetsC,G,H | | | | |
| Expenses before reductions | .63%I | .64% | .68% | .69%I |
| Expenses net of fee waivers, if any | .63%I | .64% | .68% | .69%I |
| Expenses net of all reductions | .63%I | .64% | .66% | .68%I |
| Net investment income (loss) | .05%I | .18% | .94% | .91%I |
| Supplemental Data | | | | |
| Net assets, end of period (000 omitted) | $51,006 | $26,856 | $7,920 | $2,629 |
| Portfolio turnover rateJ | 26%I | 41% | 136% | 110%I |
A For the period October 2, 2018 (commencement of sale of shares) through July 31, 2019.
B Calculated based on average shares outstanding during the period.
C Net investment income (loss) is affected by the timing of the declaration of dividends by any underlying mutual funds or exchange-traded funds (ETFs). Net investment income (loss) of any such underlying funds is not included in the Fund's net investment income (loss) ratio.
D Total distributions per share do not sum due to rounding.
E Total returns for periods of less than one year are not annualized.
F Total returns would have been lower if certain expenses had not been reduced during the applicable periods shown.
G Fees and expenses of any underlying mutual funds or exchange-traded funds (ETFs) are not included in the Fund's expense ratio. The Fund indirectly bears its proportionate share of these expenses. For additional expense information related to investments in Fidelity Central Funds, please refer to the "Investments in Fidelity Central Funds" note found in the Notes to Financial Statements section of the most recent Annual or Semi-Annual report.
H Expense ratios reflect operating expenses of the class. Expenses before reductions do not reflect amounts reimbursed, waived, or reduced through arrangements with the investment adviser, brokerage services, or other offset arrangements, if applicable, and do not represent the amount paid by the class during periods when reimbursements, waivers or reductions occur.
I Annualized
J Amount does not include the portfolio activity of any underlying mutual funds or exchange-traded funds (ETFs).
See accompanying notes which are an integral part of the financial statements.
Fidelity Advisor® Technology Fund
Investment Summary (Unaudited)
Top Ten Stocks as of January 31, 2022
| | % of fund's net assets |
| Apple, Inc. | 24.2 |
| Microsoft Corp. | 18.8 |
| NVIDIA Corp. | 5.6 |
| Marvell Technology, Inc. | 4.3 |
| Cisco Systems, Inc. | 3.9 |
| Salesforce.com, Inc. | 3.8 |
| MasterCard, Inc. Class A | 3.2 |
| Adobe, Inc. | 2.9 |
| NXP Semiconductors NV | 2.8 |
| PayPal Holdings, Inc. | 2.2 |
| | 71.7 |
Top Industries (% of fund's net assets)
| As of January 31, 2022 |
| | Software | 33.4% |
| | Technology Hardware, Storage & Peripherals | 24.7% |
| | Semiconductors & Semiconductor Equipment | 18.8% |
| | IT Services | 11.3% |
| | Communications Equipment | 4.2% |
| | All Others* | 7.6% |
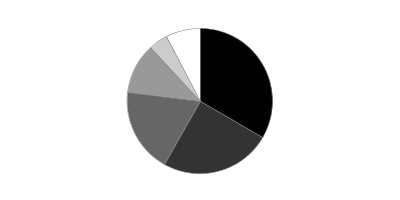
* Includes short-term investments and net other assets (liabilities).
Fidelity Advisor® Technology Fund
Schedule of Investments January 31, 2022 (Unaudited)
Showing Percentage of Net Assets
| Common Stocks - 97.6% | | | |
| | | Shares | Value |
| Capital Markets - 0.0% | | | |
| Financial Exchanges & Data - 0.0% | | | |
| Coinbase Global, Inc. (a) | | 3,600 | $684,540 |
| Chemicals - 0.2% | | | |
| Commodity Chemicals - 0.2% | | | |
| LG Chemical Ltd. | | 16,570 | 8,881,309 |
| Communications Equipment - 4.1% | | | |
| Communications Equipment - 4.1% | | | |
| Cisco Systems, Inc. | | 3,322,500 | 184,963,575 |
| F5, Inc. (a) | | 56,200 | 11,668,244 |
| | | | 196,631,819 |
| Diversified Financial Services - 0.1% | | | |
| Other Diversified Financial Services - 0.1% | | | |
| Ant International Co. Ltd. Class C (a)(b)(c) | | 2,163,455 | 3,850,950 |
| Electronic Equipment & Components - 0.8% | | | |
| Electronic Manufacturing Services - 0.8% | | | |
| Flex Ltd. (a) | | 2,322,803 | 37,582,953 |
| Entertainment - 0.8% | | | |
| Movies & Entertainment - 0.8% | | | |
| Netflix, Inc. (a) | | 92,066 | 39,325,071 |
| Hotels, Restaurants & Leisure - 1.0% | | | |
| Hotels, Resorts & Cruise Lines - 1.0% | | | |
| Airbnb, Inc. Class A (a) | | 306,700 | 47,222,599 |
| Interactive Media & Services - 0.8% | | | |
| Interactive Media & Services - 0.8% | | | |
| Kuaishou Technology Class B (d) | | 40,900 | 467,518 |
| Snap, Inc. Class A (a) | | 1,240,500 | 40,365,870 |
| | | | 40,833,388 |
| Internet & Direct Marketing Retail - 0.0% | | | |
| Internet & Direct Marketing Retail - 0.0% | | | |
| Deliveroo PLC Class A (a)(d) | | 307,100 | 645,206 |
| IT Services - 11.2% | | | |
| Data Processing & Outsourced Services - 7.9% | | | |
| Block, Inc. Class A (a) | | 116,700 | 14,271,243 |
| Genpact Ltd. | | 795,100 | 39,556,225 |
| MasterCard, Inc. Class A | | 395,800 | 152,929,204 |
| PayPal Holdings, Inc. (a) | | 605,800 | 104,161,252 |
| Visa, Inc. Class A | | 305,916 | 69,189,022 |
| | | | 380,106,946 |
| Internet Services & Infrastructure - 2.6% | | | |
| Okta, Inc. (a) | | 89,200 | 17,651,788 |
| Shopify, Inc. Class A (a) | | 23,700 | 22,852,488 |
| Twilio, Inc. Class A (a) | | 426,700 | 87,951,404 |
| | | | 128,455,680 |
| IT Consulting & Other Services - 0.7% | | | |
| Capgemini SA | | 143,500 | 32,261,138 |
|
| TOTAL IT SERVICES | | | 540,823,764 |
|
| Life Sciences Tools & Services - 0.0% | | | |
| Life Sciences Tools & Services - 0.0% | | | |
| Eden Biologics, Inc. (a)(b) | | 387,462 | 0 |
| Oil, Gas & Consumable Fuels - 0.9% | | | |
| Oil & Gas Refining & Marketing - 0.9% | | | |
| Reliance Industries Ltd. | | 1,299,046 | 41,890,794 |
| Pharmaceuticals - 0.0% | | | |
| Pharmaceuticals - 0.0% | | | |
| Chime Biologics Ltd. (a)(b) | | 387,462 | 201,802 |
| Road & Rail - 1.4% | | | |
| Trucking - 1.4% | | | |
| DiDi Global, Inc. ADR (e) | | 113,900 | 411,179 |
| Lyft, Inc. (a) | | 713,642 | 27,489,490 |
| TuSimple Holdings, Inc. (a)(e) | | 86,300 | 1,618,988 |
| Uber Technologies, Inc. (a) | | 967,864 | 36,198,114 |
| | | | 65,717,771 |
| Semiconductors & Semiconductor Equipment - 18.7% | | | |
| Semiconductor Equipment - 1.7% | | | |
| ASML Holding NV (Netherlands) | | 34,600 | 23,434,384 |
| Teradyne, Inc. | | 499,100 | 58,609,313 |
| | | | 82,043,697 |
| Semiconductors - 17.0% | | | |
| GlobalFoundries, Inc. | | 1,031,600 | 50,899,144 |
| Marvell Technology, Inc. | | 2,908,760 | 207,685,464 |
| Microchip Technology, Inc. | | 760,400 | 58,915,792 |
| NVIDIA Corp. | | 1,095,700 | 268,293,102 |
| NXP Semiconductors NV | | 654,800 | 134,522,112 |
| onsemi (a) | | 1,239,000 | 73,101,000 |
| Taiwan Semiconductor Manufacturing Co. Ltd. | | 1,145,000 | 26,495,640 |
| | | | 819,912,254 |
|
| TOTAL SEMICONDUCTORS & SEMICONDUCTOR EQUIPMENT | | | 901,955,951 |
|
| Software - 32.9% | | | |
| Application Software - 12.9% | | | |
| Adobe, Inc. (a) | | 262,916 | 140,476,019 |
| Autodesk, Inc. (a) | | 123,000 | 30,724,170 |
| Confluent, Inc. | | 11,500 | 751,985 |
| DocuSign, Inc. (a) | | 111,300 | 13,998,201 |
| Intuit, Inc. | | 151,700 | 84,228,391 |
| Pine Labs Private Ltd. (b)(c) | | 3,660 | 2,230,111 |
| Procore Technologies, Inc. (a)(e) | | 4,400 | 275,264 |
| Qualtrics International, Inc. | | 614,000 | 17,971,780 |
| Salesforce.com, Inc. (a) | | 775,539 | 180,413,638 |
| Workday, Inc. Class A (a) | | 282,300 | 71,424,723 |
| Zoom Video Communications, Inc. Class A (a) | | 504,964 | 77,905,846 |
| | | | 620,400,128 |
| Systems Software - 20.0% | | | |
| GitLab, Inc. | | 4,100 | 262,441 |
| Microsoft Corp. | | 2,910,800 | 905,200,584 |
| Rapid7, Inc. (a) | | 275,900 | 26,577,447 |
| Tenable Holdings, Inc. (a) | | 580,400 | 29,832,560 |
| UiPath, Inc. Class A (a) | | 46,100 | 1,684,033 |
| | | | 963,557,065 |
|
| TOTAL SOFTWARE | | | 1,583,957,193 |
|
| Technology Hardware, Storage & Peripherals - 24.7% | | | |
| Technology Hardware, Storage & Peripherals - 24.7% | | | |
| Apple, Inc. | | 6,649,416 | 1,162,184,928 |
| IonQ, Inc. (c) | | 119,300 | 1,364,792 |
| Samsung Electronics Co. Ltd. | | 367,700 | 22,867,476 |
| | | | 1,186,417,196 |
| TOTAL COMMON STOCKS | | | |
| (Cost $2,496,720,878) | | | 4,696,622,306 |
|
| Preferred Stocks - 1.8% | | | |
| Convertible Preferred Stocks - 1.5% | | | |
| Aerospace & Defense - 0.2% | | | |
| Aerospace & Defense - 0.2% | | | |
| Relativity Space, Inc. Series E (b)(c) | | 482,616 | 11,020,585 |
| Communications Equipment - 0.1% | | | |
| Communications Equipment - 0.1% | | | |
| Meesho Series F (b)(c) | | 46,600 | 3,572,929 |
| Xsight Labs Ltd. Series D (b)(c) | | 101,300 | 1,010,974 |
| | | | 4,583,903 |
| Electronic Equipment & Components - 0.2% | | | |
| Electronic Equipment & Instruments - 0.2% | | | |
| Enevate Corp. Series E (b)(c) | | 9,477,386 | 10,507,426 |
| Interactive Media & Services - 0.3% | | | |
| Interactive Media & Services - 0.3% | | | |
| Reddit, Inc.: | | | |
| Series D (a)(b)(c) | | 94,300 | 5,827,212 |
| Series E (b)(c) | | 5,300 | 327,510 |
| Series F (b)(c) | | 154,614 | 9,554,279 |
| | | | 15,709,001 |
| Internet & Direct Marketing Retail - 0.2% | | | |
| Internet & Direct Marketing Retail - 0.2% | | | |
| GoBrands, Inc. Series G (b)(c) | | 14,100 | 5,477,709 |
| Instacart, Inc. Series I (b)(c) | | 29,110 | 2,728,189 |
| | | | 8,205,898 |
| IT Services - 0.1% | | | |
| Internet Services & Infrastructure - 0.1% | | | |
| ByteDance Ltd. Series E1 (a)(b)(c) | | 26,036 | 3,870,512 |
| Metals & Mining - 0.1% | | | |
| Precious Metals & Minerals - 0.1% | | | |
| Diamond Foundry, Inc. Series C (b)(c) | | 151,757 | 4,171,800 |
| Road & Rail - 0.0% | | | |
| Trucking - 0.0% | | | |
| Convoy, Inc. Series D (a)(b)(c) | | 81,762 | 1,348,901 |
| Semiconductors & Semiconductor Equipment - 0.1% | | | |
| Semiconductor Equipment - 0.0% | | | |
| Astera Labs, Inc. Series C (b)(c) | | 135,400 | 547,016 |
| Semiconductors - 0.1% | | | |
| SiMa.ai Series B (b)(c) | | 231,000 | 1,508,430 |
| Tenstorrent, Inc. Series C1 (b)(c) | | 6,600 | 495,264 |
| | | | 2,003,694 |
| TOTAL SEMICONDUCTORS & SEMICONDUCTOR EQUIPMENT | | | 2,550,710 |
| Software - 0.2% | | | |
| Application Software - 0.2% | | | |
| Databricks, Inc.: | | | |
| Series G (b)(c) | | 12,600 | 2,777,700 |
| Series H (b)(c) | | 33,262 | 7,332,688 |
| | | | 10,110,388 |
| Systems Software - 0.0% | | | |
| Nuvia, Inc. Series B (a)(c) | | 678,052 | 554,118 |
| TOTAL SOFTWARE | | | 10,664,506 |
| Textiles, Apparel & Luxury Goods - 0.0% | | | |
| Textiles - 0.0% | | | |
| Discord, Inc. Series I (b)(c) | | 500 | 275,312 |
|
| TOTAL CONVERTIBLE PREFERRED STOCKS | | | 72,908,554 |
|
| Nonconvertible Preferred Stocks - 0.3% | | | |
| Software - 0.3% | | | |
| Application Software - 0.3% | | | |
| Pine Labs Private Ltd.: | | | |
| Series 1 (b)(c) | | 8,747 | 5,329,722 |
| Series A (b)(c) | | 2,186 | 1,331,974 |
| Series B (b)(c) | | 2,378 | 1,448,963 |
| Series B2 (b)(c) | | 1,923 | 1,171,722 |
| Series C (b)(c) | | 3,578 | 2,180,147 |
| Series C1 (b)(c) | | 754 | 459,427 |
| Series D (b)(c) | | 806 | 491,112 |
| | | | 12,413,067 |
| TOTAL PREFERRED STOCKS | | | |
| (Cost $72,522,086) | | | 85,321,621 |
|
| Preferred Securities - 0.1% | | | |
| Electronic Equipment & Components - 0.1% | | | |
| Electronic Equipment & Instruments - 0.1% | | | |
| Enevate Corp. 0% 1/29/23 (b)(c) | | 4,035,056 | 4,035,056 |
| Semiconductors & Semiconductor Equipment - 0.0% | | | |
| Semiconductors - 0.0% | | | |
| Tenstorrent, Inc. 0% (b)(c)(f) | | 370,000 | 370,000 |
| TOTAL PREFERRED SECURITIES | | | |
| (Cost $4,405,056) | | | 4,405,056 |
|
| Money Market Funds - 0.7% | | | |
| Fidelity Cash Central Fund 0.08% (g) | | 31,294,973 | 31,301,232 |
| Fidelity Securities Lending Cash Central Fund 0.08% (g)(h) | | 1,422,992 | 1,423,134 |
| TOTAL MONEY MARKET FUNDS | | | |
| (Cost $32,724,366) | | | 32,724,366 |
| TOTAL INVESTMENT IN SECURITIES - 100.2% | | | |
| (Cost $2,606,372,386) | | | 4,819,073,349 |
| NET OTHER ASSETS (LIABILITIES) - (0.2)% | | | (8,173,701) |
| NET ASSETS - 100% | | | $4,810,899,648 |
Legend
(a) Non-income producing
(b) Level 3 security
(c) Restricted securities (including private placements) - Investment in securities not registered under the Securities Act of 1933 (excluding 144A issues). At the end of the period, the value of restricted securities (excluding 144A issues) amounted to $97,172,530 or 2.0% of net assets.
(d) Security exempt from registration under Rule 144A of the Securities Act of 1933. These securities may be resold in transactions exempt from registration, normally to qualified institutional buyers. At the end of the period, the value of these securities amounted to $1,112,724 or 0.0% of net assets.
(e) Security or a portion of the security is on loan at period end.
(f) Security is perpetual in nature with no stated maturity date.
(g) Affiliated fund that is generally available only to investment companies and other accounts managed by Fidelity Investments. The rate quoted is the annualized seven-day yield of the fund at period end. A complete unaudited listing of the fund's holdings as of its most recent quarter end is available upon request. In addition, each Fidelity Central Fund's financial statements are available on the SEC's website or upon request.
(h) Investment made with cash collateral received from securities on loan.
Additional information on each restricted holding is as follows:
| Security | Acquisition Date | Acquisition Cost |
| Ant International Co. Ltd. Class C | 5/16/18 | $8,245,741 |
| Astera Labs, Inc. Series C | 8/24/21 | $455,188 |
| ByteDance Ltd. Series E1 | 11/18/20 | $2,852,873 |
| Convoy, Inc. Series D | 10/30/19 | $1,107,057 |
| Databricks, Inc. Series G | 2/1/21 | $2,234,836 |
| Databricks, Inc. Series H | 8/31/21 | $7,332,688 |
| Diamond Foundry, Inc. Series C | 3/15/21 | $3,642,168 |
| Discord, Inc. Series I | 9/15/21 | $275,312 |
| Enevate Corp. Series E | 1/29/21 | $10,507,436 |
| Enevate Corp. 0% 1/29/23 | 1/29/21 | $4,035,056 |
| GoBrands, Inc. Series G | 3/2/21 | $3,521,014 |
| Instacart, Inc. Series I | 2/26/21 | $3,638,750 |
| IonQ, Inc. | 3/7/21 | $1,193,000 |
| Meesho Series F | 9/21/21 | $3,572,929 |
| Nuvia, Inc. Series B | 3/16/21 | $554,115 |
| Pine Labs Private Ltd. | 6/30/21 | $1,364,668 |
| Pine Labs Private Ltd. Series 1 | 6/30/21 | $3,261,406 |
| Pine Labs Private Ltd. Series A | 6/30/21 | $815,072 |
| Pine Labs Private Ltd. Series B | 6/30/21 | $886,661 |
| Pine Labs Private Ltd. Series B2 | 6/30/21 | $717,010 |
| Pine Labs Private Ltd. Series C | 6/30/21 | $1,334,093 |
| Pine Labs Private Ltd. Series C1 | 6/30/21 | $281,136 |
| Pine Labs Private Ltd. Series D | 6/30/21 | $300,525 |
| Reddit, Inc. Series D | 2/4/19 | $2,045,018 |
| Reddit, Inc. Series E | 5/18/21 | $225,113 |
| Reddit, Inc. Series F | 8/11/21 | $9,554,279 |
| Relativity Space, Inc. Series E | 5/27/21 | $11,020,585 |
| SiMa.ai Series B | 5/10/21 | $1,184,429 |
| Tenstorrent, Inc. Series C1 | 4/23/21 | $392,398 |
| Tenstorrent, Inc. 0% | 4/23/21 | $370,000 |
| Xsight Labs Ltd. Series D | 2/16/21 | $809,995 |
Affiliated Central Funds
Fiscal year to date information regarding the Fund's investments in Fidelity Central Funds, including the ownership percentage, is presented below.
| Fund | Value, beginning of period | Purchases | Sales Proceeds | Dividend Income | Realized Gain/Loss | Change in Unrealized appreciation (depreciation) | Value, end of period | % ownership, end of period |
| Fidelity Cash Central Fund 0.08% | $24,905,035 | $314,502,848 | $308,106,651 | $4,234 | $-- | $-- | $31,301,232 | 0.1% |
| Fidelity Securities Lending Cash Central Fund 0.08% | 3,619,384 | 199,528,114 | 201,724,364 | 49,512 | -- | -- | 1,423,134 | 0.0% |
| Total | $28,524,419 | $514,030,962 | $509,831,015 | $53,746 | $-- | $-- | $32,724,366 | |
Amounts in the income column in the above table include any capital gain distributions from underlying funds, which are presented in the corresponding line-item in the Statement of Operations, if applicable. Amount for Fidelity Securities Lending Cash Central Fund represents the income earned on investing cash collateral, less rebates paid to borrowers and any lending agent fees associated with the loan, plus any premium payments received for lending certain types of securities.
Investment Valuation
The following is a summary of the inputs used, as of January 31, 2022, involving the Fund's assets and liabilities carried at fair value. The inputs or methodology used for valuing securities may not be an indication of the risk associated with investing in those securities. For more information on valuation inputs, and their aggregation into the levels used below, please refer to the Investment Valuation section in the accompanying Notes to Financial Statements.
| | Valuation Inputs at Reporting Date: |
| Description | Total | Level 1 | Level 2 | Level 3 |
| Investments in Securities: | | | | |
| Common Stocks | $4,696,622,306 | $4,533,395,978 | $156,943,465 | $6,282,863 |
| Preferred Stocks | 85,321,621 | 554,118 | -- | 84,767,503 |
| Preferred Securities | 4,405,056 | -- | -- | 4,405,056 |
| Money Market Funds | 32,724,366 | 32,724,366 | -- | -- |
| Total Investments in Securities: | $4,819,073,349 | $4,566,674,462 | $156,943,465 | $95,455,422 |
The following is a reconciliation of Investments in Securities for which Level 3 inputs were used in determining value:
| Investments in Securities: | |
| Preferred Stocks | |
| Beginning Balance | $56,779,615 |
| Total Realized Gain (Loss) | -- |
| Total Unrealized Gain (Loss) | 6,797,492 |
| Cost of Purchases | 21,190,396 |
| Proceeds of Sales | -- |
| Amortization/Accretion | -- |
| Transfers in to Level 3 | -- |
| Transfers out of Level 3 | -- |
| Ending Balance | $84,767,503 |
| The change in unrealized gain (loss) for the period attributable to Level 3 securities held at January 31, 2022 | $6,797,492 |
| Other Investments in Securities | |
| Beginning Balance | $9,646,099 |
| Total Realized Gain (Loss) | -- |
| Total Unrealized Gain (Loss) | 1,041,820 |
| Cost of Purchases | -- |
| Proceeds of Sales | -- |
| Amortization/Accretion | -- |
| Transfers in to Level 3 | -- |
| Transfers out of Level 3 | -- |
| Ending Balance | $10,687,919 |
| The change in unrealized gain (loss) for the period attributable to Level 3 securities held at January 31, 2022 | $1,041,820 |
The information used in the above reconciliations represents fiscal year to date activity for any Investments in Securities and Other Financial Instruments identified as using Level 3 inputs at either the beginning or the end of the current fiscal period. Cost of purchases and proceeds of sales may include securities received and/or delivered through in-kind transactions. Transfers in or out of Level 3 represent the beginning value of any Security or Instrument where a change in the pricing level occurred from the beginning to the end of the period. The cost of purchases and the proceeds of sales may include securities received or delivered through corporate actions or exchanges. Realized and unrealized gains (losses) disclosed in the reconciliations are included in Net Gain (Loss) on the Fund's Statement of Operations.
See accompanying notes which are an integral part of the financial statements.
Fidelity Advisor® Technology Fund
Financial Statements
Statement of Assets and Liabilities
| | | January 31, 2022 (Unaudited) |
| Assets | | |
Investment in securities, at value (including securities loaned of $1,457,828) — See accompanying schedule:
Unaffiliated issuers (cost $2,573,648,019) | $4,786,348,982 | |
| Fidelity Central Funds (cost $32,724,367) | 32,724,367 | |
| Total Investment in Securities (cost $2,606,372,386) | | $4,819,073,349 |
| Receivable for investments sold | | 14,014,975 |
| Receivable for fund shares sold | | 4,981,649 |
| Dividends receivable | | 353,258 |
| Distributions receivable from Fidelity Central Funds | | 3,454 |
| Prepaid expenses | | 11,315 |
| Other receivables | | 159,958 |
| Total assets | | 4,838,597,958 |
| Liabilities | | |
| Payable for investments purchased | $4,679,118 | |
| Payable for fund shares redeemed | 15,002,170 | |
| Accrued management fee | 2,143,652 | |
| Distribution and service plan fees payable | 982,602 | |
| Other affiliated payables | 720,725 | |
| Other payables and accrued expenses | 2,762,743 | |
| Collateral on securities loaned | 1,407,300 | |
| Total liabilities | | 27,698,310 |
| Net Assets | | $4,810,899,648 |
| Net Assets consist of: | | |
| Paid in capital | | $2,512,350,112 |
| Total accumulated earnings (loss) | | 2,298,549,536 |
| Net Assets | | $4,810,899,648 |
| Net Asset Value and Maximum Offering Price | | |
| Class A: | | |
| Net Asset Value and redemption price per share ($1,840,573,197 ÷ 20,113,491 shares)(a) | | $91.51 |
| Maximum offering price per share (100/94.25 of $91.51) | | $97.09 |
| Class M: | | |
| Net Asset Value and redemption price per share ($616,180,670 ÷ 7,322,900 shares)(a) | | $84.14 |
| Maximum offering price per share (100/96.50 of $84.14) | | $87.19 |
| Class C: | | |
| Net Asset Value and offering price per share ($385,896,164 ÷ 5,523,872 shares)(a) | | $69.86 |
| Class I: | | |
| Net Asset Value, offering price and redemption price per share ($1,453,120,363 ÷ 14,225,412 shares) | | $102.15 |
| Class Z: | | |
| Net Asset Value, offering price and redemption price per share ($515,129,254 ÷ 5,050,051 shares) | | $102.00 |
(a) Redemption price per share is equal to net asset value less any applicable contingent deferred sales charge.
See accompanying notes which are an integral part of the financial statements.
Statement of Operations
| | | Six months ended January 31, 2022 (Unaudited) |
| Investment Income | | |
| Dividends | | $12,028,008 |
| Income from Fidelity Central Funds (including $49,512 from security lending) | | 53,746 |
| Total income | | 12,081,754 |
| Expenses | | |
| Management fee | $13,291,314 | |
| Transfer agent fees | 3,751,425 | |
| Distribution and service plan fees | 6,123,124 | |
| Accounting fees | 542,011 | |
| Custodian fees and expenses | 24,446 | |
| Independent trustees' fees and expenses | 8,756 | |
| Registration fees | 144,323 | |
| Audit | 28,318 | |
| Legal | 7,216 | |
| Interest | 964 | |
| Miscellaneous | 9,813 | |
| Total expenses before reductions | 23,931,710 | |
| Expense reductions | (78,757) | |
| Total expenses after reductions | | 23,852,953 |
| Net investment income (loss) | | (11,771,199) |
| Realized and Unrealized Gain (Loss) | | |
| Net realized gain (loss) on: | | |
| Investment securities: | | |
| Unaffiliated issuers | 201,689,530 | |
| Foreign currency transactions | (34,053) | |
| Total net realized gain (loss) | | 201,655,477 |
| Change in net unrealized appreciation (depreciation) on: | | |
| Investment securities: | | |
| Unaffiliated issuers (net of increase in deferred foreign taxes of $708,109) | (139,371,027) | |
| Unfunded commitments | 127,890 | |
| Assets and liabilities in foreign currencies | (1,775) | |
| Total change in net unrealized appreciation (depreciation) | | (139,244,912) |
| Net gain (loss) | | 62,410,565 |
| Net increase (decrease) in net assets resulting from operations | | $50,639,366 |
See accompanying notes which are an integral part of the financial statements.
Statement of Changes in Net Assets
| | Six months ended January 31, 2022 (Unaudited) | Year ended July 31, 2021 |
| Increase (Decrease) in Net Assets | | |
| Operations | | |
| Net investment income (loss) | $(11,771,199) | $(17,925,221) |
| Net realized gain (loss) | 201,655,477 | 676,770,788 |
| Change in net unrealized appreciation (depreciation) | (139,244,912) | 874,752,198 |
| Net increase (decrease) in net assets resulting from operations | 50,639,366 | 1,533,597,765 |
| Distributions to shareholders | (600,971,440) | (319,176,570) |
| Share transactions - net increase (decrease) | 482,180,841 | 184,546,176 |
| Total increase (decrease) in net assets | (68,151,233) | 1,398,967,371 |
| Net Assets | | |
| Beginning of period | 4,879,050,881 | 3,480,083,510 |
| End of period | $4,810,899,648 | $4,879,050,881 |
See accompanying notes which are an integral part of the financial statements.
Financial Highlights
Fidelity Advisor Technology Fund Class A
| | Six months ended (Unaudited) January 31, | Years endedJuly 31, | | | | |
| | 2022 | 2021 | 2020 | 2019 | 2018 | 2017 |
| Selected Per–Share Data | | | | | | |
| Net asset value, beginning of period | $102.43 | $76.36 | $52.61 | $60.37 | $52.11 | $37.86 |
| Income from Investment Operations | | | | | | |
| Net investment income (loss)A,B | (.25) | (.39) | (.12) | .02 | (.13) | (.07) |
| Net realized and unrealized gain (loss) | 2.04 | 33.48 | 25.35 | 1.84 | 12.80 | 14.95 |
| Total from investment operations | 1.79 | 33.09 | 25.23 | 1.86 | 12.67 | 14.88 |
| Distributions from net investment income | – | – | – | – | – | – |
| Distributions from net realized gain | (12.71) | (7.02) | (1.48) | (9.62) | (4.41) | (.63) |
| Total distributions | (12.71) | (7.02) | (1.48) | (9.62) | (4.41) | (.63) |
| Redemption fees added to paid in capitalA | – | – | – | – | – | –C |
| Net asset value, end of period | $91.51 | $102.43 | $76.36 | $52.61 | $60.37 | $52.11 |
| Total ReturnD,E,F | .99% | 44.80% | 48.83% | 7.26% | 25.43% | 39.85% |
| Ratios to Average Net AssetsB,G,H | | | | | | |
| Expenses before reductions | .97%I | .98% | 1.01% | 1.03% | 1.05% | 1.07% |
| Expenses net of fee waivers, if any | .96%I | .98% | 1.01% | 1.03% | 1.05% | 1.07% |
| Expenses net of all reductions | .96%I | .98% | 1.01% | 1.02% | 1.04% | 1.07% |
| Net investment income (loss) | (.49)%I | (.43)% | (.20)% | .04% | (.23)% | (.17)% |
| Supplemental Data | | | | | | |
| Net assets, end of period (000 omitted) | $1,840,573 | $1,848,643 | $1,339,059 | $884,749 | $825,118 | $637,315 |
| Portfolio turnover rateJ | 19%I | 44% | 40%K | 88% | 84% | 73%K |
A Calculated based on average shares outstanding during the period.
B Net investment income (loss) is affected by the timing of the declaration of dividends by any underlying mutual funds or exchange-traded funds (ETFs). Net investment income (loss) of any such underlying funds is not included in the Fund's net investment income (loss) ratio.
C Amount represents less than $.005 per share.
D Total returns for periods of less than one year are not annualized.
E Total returns would have been lower if certain expenses had not been reduced during the applicable periods shown.
F Total returns do not include the effect of the sales charges.
G Fees and expenses of any underlying mutual funds or exchange-traded funds (ETFs) are not included in the Fund's expense ratio. The Fund indirectly bears its proportionate share of these expenses. For additional expense information related to investments in Fidelity Central Funds, please refer to the "Investments in Fidelity Central Funds" note found in the Notes to Financial Statements section of the most recent Annual or Semi-Annual report.
H Expense ratios reflect operating expenses of the class. Expenses before reductions do not reflect amounts reimbursed, waived, or reduced through arrangements with the investment adviser, brokerage services, or other offset arrangements, if applicable, and do not represent the amount paid by the class during periods when reimbursements, waivers or reductions occur.
I Annualized
J Amount does not include the portfolio activity of any underlying mutual funds or exchange-traded funds (ETFs).
K Portfolio turnover rate excludes securities received or delivered in-kind.
See accompanying notes which are an integral part of the financial statements.
Fidelity Advisor Technology Fund Class M
| | Six months ended (Unaudited) January 31, | Years endedJuly 31, | | | | |
| | 2022 | 2021 | 2020 | 2019 | 2018 | 2017 |
| Selected Per–Share Data | | | | | | |
| Net asset value, beginning of period | $95.15 | $71.37 | $49.28 | $57.23 | $49.63 | $36.14 |
| Income from Investment Operations | | | | | | |
| Net investment income (loss)A,B | (.35) | (.57) | (.25) | (.10) | (.27) | (.18) |
| Net realized and unrealized gain (loss) | 1.93 | 31.22 | 23.71 | 1.63 | 12.16 | 14.26 |
| Total from investment operations | 1.58 | 30.65 | 23.46 | 1.53 | 11.89 | 14.08 |
| Distributions from net investment income | – | – | – | – | – | – |
| Distributions from net realized gain | (12.59) | (6.87) | (1.37) | (9.48) | (4.29) | (.59) |
| Total distributions | (12.59) | (6.87) | (1.37) | (9.48) | (4.29) | (.59) |
| Redemption fees added to paid in capitalA | – | – | – | – | – | –C |
| Net asset value, end of period | $84.14 | $95.15 | $71.37 | $49.28 | $57.23 | $49.63 |
| Total ReturnD,E,F | .85% | 44.47% | 48.44% | 7.00% | 25.09% | 39.50% |
| Ratios to Average Net AssetsB,G,H | | | | | | |
| Expenses before reductions | 1.21%I | 1.23% | 1.26% | 1.28% | 1.31% | 1.33% |
| Expenses net of fee waivers, if any | 1.21%I | 1.23% | 1.26% | 1.28% | 1.31% | 1.33% |
| Expenses net of all reductions | 1.21%I | 1.22% | 1.26% | 1.28% | 1.30% | 1.33% |
| Net investment income (loss) | (.73)%I | (.68)% | (.45)% | (.22)% | (.49)% | (.43)% |
| Supplemental Data | | | | | | |
| Net assets, end of period (000 omitted) | $616,181 | $624,534 | $464,093 | $321,915 | $328,709 | $274,918 |
| Portfolio turnover rateJ | 19%I | 44% | 40%K | 88% | 84% | 73% |
A Calculated based on average shares outstanding during the period.
B Net investment income (loss) is affected by the timing of the declaration of dividends by any underlying mutual funds or exchange-traded funds (ETFs). Net investment income (loss) of any such underlying funds is not included in the Fund's net investment income (loss) ratio.
C Amount represents less than $.005 per share.
D Total returns for periods of less than one year are not annualized.
E Total returns would have been lower if certain expenses had not been reduced during the applicable periods shown.
F Total returns do not include the effect of the sales charges.
G Fees and expenses of any underlying mutual funds or exchange-traded funds (ETFs) are not included in the Fund's expense ratio. The Fund indirectly bears its proportionate share of these expenses. For additional expense information related to investments in Fidelity Central Funds, please refer to the "Investments in Fidelity Central Funds" note found in the Notes to Financial Statements section of the most recent Annual or Semi-Annual report.
H Expense ratios reflect operating expenses of the class. Expenses before reductions do not reflect amounts reimbursed, waived, or reduced through arrangements with the investment adviser, brokerage services, or other offset arrangements, if applicable, and do not represent the amount paid by the class during periods when reimbursements, waivers or reductions occur.
I Annualized
J Amount does not include the portfolio activity of any underlying mutual funds or exchange-traded funds (ETFs).
K Portfolio turnover rate excludes securities received or delivered in-kind.
See accompanying notes which are an integral part of the financial statements.
Fidelity Advisor Technology Fund Class C
| | Six months ended (Unaudited) January 31, | Years endedJuly 31, | | | | |
| | 2022 | 2021 | 2020 | 2019 | 2018 | 2017 |
| Selected Per–Share Data | | | | | | |
| Net asset value, beginning of period | $80.98 | $61.67 | $42.81 | $51.18 | $44.86 | $32.83 |
| Income from Investment Operations | | | | | | |
| Net investment income (loss)A,B | (.51) | (.85) | (.46) | (.30) | (.49) | (.35) |
| Net realized and unrealized gain (loss) | 1.76 | 26.79 | 20.52 | 1.22 | 10.95 | 12.92 |
| Total from investment operations | 1.25 | 25.94 | 20.06 | .92 | 10.46 | 12.57 |
| Distributions from net investment income | – | – | – | – | – | – |
| Distributions from net realized gain | (12.37) | (6.63) | (1.20) | (9.29) | (4.14) | (.54) |
| Total distributions | (12.37) | (6.63) | (1.20) | (9.29) | (4.14) | (.54) |
| Redemption fees added to paid in capitalA | – | – | – | – | – | –C |
| Net asset value, end of period | $69.86 | $80.98 | $61.67 | $42.81 | $51.18 | $44.86 |
| Total ReturnD,E,F | .60% | 43.73% | 47.69% | 6.44% | 24.48% | 38.79% |
| Ratios to Average Net AssetsB,G,H | | | | | | |
| Expenses before reductions | 1.73%I | 1.75% | 1.77% | 1.79% | 1.81% | 1.83% |
| Expenses net of fee waivers, if any | 1.73%I | 1.74% | 1.77% | 1.79% | 1.81% | 1.83% |
| Expenses net of all reductions | 1.73%I | 1.74% | 1.77% | 1.78% | 1.80% | 1.82% |
| Net investment income (loss) | (1.25)%I | (1.20)% | (.96)% | (.72)% | (.99)% | (.93)% |
| Supplemental Data | | | | | | |
| Net assets, end of period (000 omitted) | $385,896 | $410,661 | $343,585 | $240,358 | $321,616 | $237,583 |
| Portfolio turnover rateJ | 19%I | 44% | 40%K | 88% | 84% | 73%K |
A Calculated based on average shares outstanding during the period.
B Net investment income (loss) is affected by the timing of the declaration of dividends by any underlying mutual funds or exchange-traded funds (ETFs). Net investment income (loss) of any such underlying funds is not included in the Fund's net investment income (loss) ratio.
C Amount represents less than $.005 per share.
D Total returns for periods of less than one year are not annualized.
E Total returns would have been lower if certain expenses had not been reduced during the applicable periods shown.
F Total returns do not include the effect of the contingent deferred sales charge.
G Fees and expenses of any underlying mutual funds or exchange-traded funds (ETFs) are not included in the Fund's expense ratio. The Fund indirectly bears its proportionate share of these expenses. For additional expense information related to investments in Fidelity Central Funds, please refer to the "Investments in Fidelity Central Funds" note found in the Notes to Financial Statements section of the most recent Annual or Semi-Annual report.
H Expense ratios reflect operating expenses of the class. Expenses before reductions do not reflect amounts reimbursed, waived, or reduced through arrangements with the investment adviser, brokerage services, or other offset arrangements, if applicable, and do not represent the amount paid by the class during periods when reimbursements, waivers or reductions occur.
I Annualized
J Amount does not include the portfolio activity of any underlying mutual funds or exchange-traded funds (ETFs).
K Portfolio turnover rate excludes securities received or delivered in-kind.
See accompanying notes which are an integral part of the financial statements.
Fidelity Advisor Technology Fund Class I
| | Six months ended (Unaudited) January 31, | Years endedJuly 31, | | | | |
| | 2022 | 2021 | 2020 | 2019 | 2018 | 2017 |
| Selected Per–Share Data | | | | | | |
| Net asset value, beginning of period | $112.95 | $83.56 | $57.41 | $64.86 | $55.69 | $40.30 |
| Income from Investment Operations | | | | | | |
| Net investment income (loss)A,B | (.13) | (.17) | .04 | .17 | .02 | .06 |
| Net realized and unrealized gain (loss) | 2.17 | 36.76 | 27.72 | 2.15 | 13.71 | 15.96 |
| Total from investment operations | 2.04 | 36.59 | 27.76 | 2.32 | 13.73 | 16.02 |
| Distributions from net investment income | – | – | – | (.01) | – | – |
| Distributions from net realized gain | (12.84) | (7.20) | (1.61) | (9.76) | (4.56) | (.63) |
| Total distributions | (12.84) | (7.20) | (1.61) | (9.77) | (4.56) | (.63) |
| Redemption fees added to paid in capitalA | – | – | – | – | – | –C |
| Net asset value, end of period | $102.15 | $112.95 | $83.56 | $57.41 | $64.86 | $55.69 |
| Total ReturnD,E | 1.12% | 45.18% | 49.22% | 7.56% | 25.75% | 40.26% |
| Ratios to Average Net AssetsB,F,G | | | | | | |
| Expenses before reductions | .71%H | .72% | .74% | .76% | .78% | .77% |
| Expenses net of fee waivers, if any | .71%H | .72% | .74% | .76% | .78% | .77% |
| Expenses net of all reductions | .71%H | .72% | .74% | .76% | .77% | .77% |
| Net investment income (loss) | (.23)%H | (.18)% | .07% | .30% | .03% | .13% |
| Supplemental Data | | | | | | |
| Net assets, end of period (000 omitted) | $1,453,120 | $1,470,830 | $1,035,091 | $674,914 | $734,661 | $403,024 |
| Portfolio turnover rateI | 19%H | 44% | 40%J | 88% | 84% | 73% |
A Calculated based on average shares outstanding during the period.
B Net investment income (loss) is affected by the timing of the declaration of dividends by any underlying mutual funds or exchange-traded funds (ETFs). Net investment income (loss) of any such underlying funds is not included in the Fund's net investment income (loss) ratio.
C Amount represents less than $.005 per share.
D Total returns for periods of less than one year are not annualized.
E Total returns would have been lower if certain expenses had not been reduced during the applicable periods shown.
F Fees and expenses of any underlying mutual funds or exchange-traded funds (ETFs) are not included in the Fund's expense ratio. The Fund indirectly bears its proportionate share of these expenses. For additional expense information related to investments in Fidelity Central Funds, please refer to the "Investments in Fidelity Central Funds" note found in the Notes to Financial Statements section of the most recent Annual or Semi-Annual report.
G Expense ratios reflect operating expenses of the class. Expenses before reductions do not reflect amounts reimbursed, waived, or reduced through arrangements with the investment adviser, brokerage services, or other offset arrangements, if applicable, and do not represent the amount paid by the class during periods when reimbursements, waivers or reductions occur.
H Annualized
I Amount does not include the portfolio activity of any underlying mutual funds or exchange-traded funds (ETFs).
J Portfolio turnover rate excludes securities received or delivered in-kind.
See accompanying notes which are an integral part of the financial statements.
Fidelity Advisor Technology Fund Class Z
| | Six months ended (Unaudited) January 31, | Years endedJuly 31, | | |
| | 2022 | 2021 | 2020 | 2019 A |
| Selected Per–Share Data | | | | |
| Net asset value, beginning of period | $112.81 | $83.44 | $57.34 | $67.88 |
| Income from Investment Operations | | | | |
| Net investment income (loss)B,C | (.07) | (.06) | .12 | .23 |
| Net realized and unrealized gain (loss) | 2.18 | 36.72 | 27.68 | (.90) |
| Total from investment operations | 2.11 | 36.66 | 27.80 | (.67) |
| Distributions from net investment income | – | – | – | (.11) |
| Distributions from net realized gain | (12.92) | (7.29) | (1.70) | (9.76) |
| Total distributions | (12.92) | (7.29) | (1.70) | (9.87) |
| Redemption fees added to paid in capitalB | – | – | – | – |
| Net asset value, end of period | $102.00 | $112.81 | $83.44 | $57.34 |
| Total ReturnD,E | 1.17% | 45.37% | 49.39% | 2.88% |
| Ratios to Average Net AssetsC,F,G | | | | |
| Expenses before reductions | .59%H | .60% | .62% | .63%H |
| Expenses net of fee waivers, if any | .59%H | .60% | .62% | .63%H |
| Expenses net of all reductions | .59%H | .60% | .62% | .62%H |
| Net investment income (loss) | (.12)%H | (.06)% | .19% | .53%H |
| Supplemental Data | | | | |
| Net assets, end of period (000 omitted) | $515,129 | $524,383 | $298,255 | $31,619 |
| Portfolio turnover rateI | 19%H | 44% | 40%J | 88%H |
A For the period October 2, 2018 (commencement of sale of shares) through July 31, 2019.
B Calculated based on average shares outstanding during the period.
C Net investment income (loss) is affected by the timing of the declaration of dividends by any underlying mutual funds or exchange-traded funds (ETFs). Net investment income (loss) of any such underlying funds is not included in the Fund's net investment income (loss) ratio.
D Total returns for periods of less than one year are not annualized.
E Total returns would have been lower if certain expenses had not been reduced during the applicable periods shown.
F Fees and expenses of any underlying mutual funds or exchange-traded funds (ETFs) are not included in the Fund's expense ratio. The Fund indirectly bears its proportionate share of these expenses. For additional expense information related to investments in Fidelity Central Funds, please refer to the "Investments in Fidelity Central Funds" note found in the Notes to Financial Statements section of the most recent Annual or Semi-Annual report.
G Expense ratios reflect operating expenses of the class. Expenses before reductions do not reflect amounts reimbursed, waived, or reduced through arrangements with the investment adviser, brokerage services, or other offset arrangements, if applicable, and do not represent the amount paid by the class during periods when reimbursements, waivers or reductions occur.
H Annualized
I Amount does not include the portfolio activity of any underlying mutual funds or exchange-traded funds (ETFs).
J Portfolio turnover rate excludes securities received or delivered in-kind.
See accompanying notes which are an integral part of the financial statements.
Fidelity Advisor® Utilities Fund
Investment Summary (Unaudited)
Top Ten Stocks as of January 31, 2022
| | % of fund's net assets |
| NextEra Energy, Inc. | 15.2 |
| Exelon Corp. | 10.9 |
| Southern Co. | 9.2 |
| Sempra Energy | 7.3 |
| Public Service Enterprise Group, Inc. | 5.1 |
| FirstEnergy Corp. | 4.8 |
| PG&E Corp. | 4.8 |
| American Electric Power Co., Inc. | 4.7 |
| Edison International | 4.6 |
| Dominion Energy, Inc. | 4.4 |
| | 71.0 |
Top Industries (% of fund's net assets)
| As of January 31, 2022 |
| | Electric Utilities | 65.3% |
| | Multi-Utilities | 23.6% |
| | Independent Power and Renewable Electricity Producers | 9.4% |
| | Construction & Engineering | 0.3% |
| | All Others* | 1.4% |

* Includes short-term investments and net other assets (liabilities).
Fidelity Advisor® Utilities Fund
Schedule of Investments January 31, 2022 (Unaudited)
Showing Percentage of Net Assets
| Common Stocks - 98.6% | | | |
| | | Shares | Value |
| Construction & Engineering - 0.3% | | | |
| Construction & Engineering - 0.3% | | | |
| Quanta Services, Inc. | | 17,600 | $1,807,872 |
| Electric Utilities - 65.3% | | | |
| Electric Utilities - 65.3% | | | |
| American Electric Power Co., Inc. | | 334,217 | 30,213,217 |
| Duke Energy Corp. | | 84,640 | 8,892,278 |
| Edison International | | 472,590 | 29,673,926 |
| Entergy Corp. | | 133,800 | 14,954,826 |
| Evergy, Inc. | | 349,924 | 22,731,063 |
| Exelon Corp. | | 1,211,372 | 70,199,007 |
| FirstEnergy Corp. | | 744,916 | 31,256,675 |
| NextEra Energy, Inc. | | 1,250,548 | 97,692,809 |
| NRG Energy, Inc. | | 137,915 | 5,506,946 |
| OGE Energy Corp. | | 214,800 | 8,145,216 |
| PG&E Corp. (a) | | 2,442,389 | 31,238,155 |
| Southern Co. | | 854,288 | 59,364,473 |
| Xcel Energy, Inc. | | 156,800 | 10,922,688 |
| | | | 420,791,279 |
| Independent Power and Renewable Electricity Producers - 9.4% | | | |
| Independent Power Producers & Energy Traders - 7.5% | | | |
| Clearway Energy, Inc.: | | | |
| Class A | | 66,926 | 2,064,667 |
| Class C | | 42,898 | 1,444,805 |
| The AES Corp. | | 1,273,420 | 28,244,456 |
| Vistra Corp. | | 763,827 | 16,659,067 |
| | | | 48,412,995 |
| Renewable Electricity - 1.9% | | | |
| NextEra Energy Partners LP (b) | | 121,257 | 9,120,952 |
| Sunnova Energy International, Inc. (a) | | 134,095 | 2,636,308 |
| | | | 11,757,260 |
|
| TOTAL INDEPENDENT POWER AND RENEWABLE ELECTRICITY PRODUCERS | | | 60,170,255 |
|
| Multi-Utilities - 23.6% | | | |
| Multi-Utilities - 23.6% | | | |
| CenterPoint Energy, Inc. | | 808,969 | 22,942,361 |
| Dominion Energy, Inc. | | 355,376 | 28,664,628 |
| NiSource, Inc. | | 704,252 | 20,550,073 |
| Public Service Enterprise Group, Inc. | | 498,605 | 33,172,191 |
| Sempra Energy | | 339,000 | 46,836,240 |
| | | | 152,165,493 |
| TOTAL COMMON STOCKS | | | |
| (Cost $481,952,499) | | | 634,934,899 |
|
| Money Market Funds - 2.7% | | | |
| Fidelity Cash Central Fund 0.08% (c) | | 8,824,827 | 8,826,592 |
| Fidelity Securities Lending Cash Central Fund 0.08% (c)(d) | | 8,907,309 | 8,908,200 |
| TOTAL MONEY MARKET FUNDS | | | |
| (Cost $17,734,792) | | | 17,734,792 |
| TOTAL INVESTMENT IN SECURITIES - 101.3% | | | |
| (Cost $499,687,291) | | | 652,669,691 |
| NET OTHER ASSETS (LIABILITIES) - (1.3)% | | | (8,592,853) |
| NET ASSETS - 100% | | | $644,076,838 |
Legend
(a) Non-income producing
(b) Security or a portion of the security is on loan at period end.
(c) Affiliated fund that is generally available only to investment companies and other accounts managed by Fidelity Investments. The rate quoted is the annualized seven-day yield of the fund at period end. A complete unaudited listing of the fund's holdings as of its most recent quarter end is available upon request. In addition, each Fidelity Central Fund's financial statements are available on the SEC's website or upon request.
(d) Investment made with cash collateral received from securities on loan.
Affiliated Central Funds
Fiscal year to date information regarding the Fund's investments in Fidelity Central Funds, including the ownership percentage, is presented below.
| Fund | Value, beginning of period | Purchases | Sales Proceeds | Dividend Income | Realized Gain/Loss | Change in Unrealized appreciation (depreciation) | Value, end of period | % ownership, end of period |
| Fidelity Cash Central Fund 0.08% | $9,596,579 | $81,177,221 | $81,947,208 | $2,175 | $-- | $-- | $8,826,592 | 0.0% |
| Fidelity Securities Lending Cash Central Fund 0.08% | 21,565,325 | 24,167,472 | 36,824,597 | 4,169 | -- | -- | 8,908,200 | 0.0% |
| Total | $31,161,904 | $105,344,693 | $118,771,805 | $6,344 | $-- | $-- | $17,734,792 | |
Amounts in the income column in the above table include any capital gain distributions from underlying funds, which are presented in the corresponding line-item in the Statement of Operations, if applicable. Amount for Fidelity Securities Lending Cash Central Fund represents the income earned on investing cash collateral, less rebates paid to borrowers and any lending agent fees associated with the loan, plus any premium payments received for lending certain types of securities.
Investment Valuation
The following is a summary of the inputs used, as of January 31, 2022, involving the Fund's assets and liabilities carried at fair value. The inputs or methodology used for valuing securities may not be an indication of the risk associated with investing in those securities. For more information on valuation inputs, and their aggregation into the levels used below, please refer to the Investment Valuation section in the accompanying Notes to Financial Statements.
| | Valuation Inputs at Reporting Date: |
| Description | Total | Level 1 | Level 2 | Level 3 |
| Investments in Securities: | | | | |
| Common Stocks | $634,934,899 | $634,934,899 | $-- | $-- |
| Money Market Funds | 17,734,792 | 17,734,792 | -- | -- |
| Total Investments in Securities: | $652,669,691 | $652,669,691 | $-- | $-- |
See accompanying notes which are an integral part of the financial statements.
Fidelity Advisor® Utilities Fund
Financial Statements
Statement of Assets and Liabilities
| | | January 31, 2022 (Unaudited) |
| Assets | | |
Investment in securities, at value (including securities loaned of $9,116,664) — See accompanying schedule:
Unaffiliated issuers (cost $481,952,499) | $634,934,899 | |
| Fidelity Central Funds (cost $17,734,792) | 17,734,792 | |
| Total Investment in Securities (cost $499,687,291) | | $652,669,691 |
| Receivable for investments sold | | 247,286 |
| Receivable for fund shares sold | | 2,243,423 |
| Dividends receivable | | 257,924 |
| Distributions receivable from Fidelity Central Funds | | 1,451 |
| Prepaid expenses | | 1,538 |
| Total assets | | 655,421,313 |
| Liabilities | | |
| Payable for investments purchased | $745,087 | |
| Payable for fund shares redeemed | 1,157,328 | |
| Accrued management fee | 276,661 | |
| Distribution and service plan fees payable | 126,050 | |
| Other affiliated payables | 104,056 | |
| Other payables and accrued expenses | 27,093 | |
| Collateral on securities loaned | 8,908,200 | |
| Total liabilities | | 11,344,475 |
| Net Assets | | $644,076,838 |
| Net Assets consist of: | | |
| Paid in capital | | $489,958,043 |
| Total accumulated earnings (loss) | | 154,118,795 |
| Net Assets | | $644,076,838 |
| Net Asset Value and Maximum Offering Price | | |
| Class A: | | |
| Net Asset Value and redemption price per share ($275,434,442 ÷ 7,553,238 shares)(a) | | $36.47 |
| Maximum offering price per share (100/94.25 of $36.47) | | $38.69 |
| Class M: | | |
| Net Asset Value and redemption price per share ($61,615,195 ÷ 1,685,182 shares)(a) | | $36.56 |
| Maximum offering price per share (100/96.50 of $36.56) | | $37.89 |
| Class C: | | |
| Net Asset Value and offering price per share ($51,313,006 ÷ 1,441,593 shares)(a) | | $35.59 |
| Class I: | | |
| Net Asset Value, offering price and redemption price per share ($183,308,870 ÷ 4,908,229 shares) | | $37.35 |
| Class Z: | | |
| Net Asset Value, offering price and redemption price per share ($72,405,325 ÷ 1,940,014 shares) | | $37.32 |
(a) Redemption price per share is equal to net asset value less any applicable contingent deferred sales charge.
See accompanying notes which are an integral part of the financial statements.
Statement of Operations
| | | Six months ended January 31, 2022 (Unaudited) |
| Investment Income | | |
| Dividends | | $6,537,324 |
| Income from Fidelity Central Funds (including $4,169 from security lending) | | 6,344 |
| Total income | | 6,543,668 |
| Expenses | | |
| Management fee | $1,547,949 | |
| Transfer agent fees | 497,867 | |
| Distribution and service plan fees | 736,584 | |
| Accounting fees | 109,749 | |
| Custodian fees and expenses | 2,138 | |
| Independent trustees' fees and expenses | 1,011 | |
| Registration fees | 54,563 | |
| Audit | 24,549 | |
| Legal | 813 | |
| Miscellaneous | 1,226 | |
| Total expenses before reductions | 2,976,449 | |
| Expense reductions | (9,026) | |
| Total expenses after reductions | | 2,967,423 |
| Net investment income (loss) | | 3,576,245 |
| Realized and Unrealized Gain (Loss) | | |
| Net realized gain (loss) on: | | |
| Investment securities: | | |
| Unaffiliated issuers | 6,813,416 | |
| Total net realized gain (loss) | | 6,813,416 |
| Change in net unrealized appreciation (depreciation) on: | | |
| Investment securities: | | |
| Unaffiliated issuers | 36,119,537 | |
| Assets and liabilities in foreign currencies | (472) | |
| Total change in net unrealized appreciation (depreciation) | | 36,119,065 |
| Net gain (loss) | | 42,932,481 |
| Net increase (decrease) in net assets resulting from operations | | $46,508,726 |
See accompanying notes which are an integral part of the financial statements.
Statement of Changes in Net Assets
| | Six months ended January 31, 2022 (Unaudited) | Year ended July 31, 2021 |
| Increase (Decrease) in Net Assets | | |
| Operations | | |
| Net investment income (loss) | $3,576,245 | $9,817,556 |
| Net realized gain (loss) | 6,813,416 | 25,296,008 |
| Change in net unrealized appreciation (depreciation) | 36,119,065 | 44,043,923 |
| Net increase (decrease) in net assets resulting from operations | 46,508,726 | 79,157,487 |
| Distributions to shareholders | (16,002,297) | (12,048,409) |
| Share transactions - net increase (decrease) | 53,476,745 | (118,271,345) |
| Total increase (decrease) in net assets | 83,983,174 | (51,162,267) |
| Net Assets | | |
| Beginning of period | 560,093,664 | 611,255,931 |
| End of period | $644,076,838 | $560,093,664 |
See accompanying notes which are an integral part of the financial statements.
Financial Highlights
Fidelity Advisor Utilities Fund Class A
| | Six months ended (Unaudited) January 31, | Years endedJuly 31, | | | | |
| | 2022 | 2021 | 2020 | 2019 | 2018 | 2017 |
| Selected Per–Share Data | | | | | | |
| Net asset value, beginning of period | $34.53 | $30.67 | $31.73 | $31.54 | $29.74 | $27.59 |
| Income from Investment Operations | | | | | | |
| Net investment income (loss)A,B | .22 | .56 | .60 | .67 | .49 | .50 |
| Net realized and unrealized gain (loss) | 2.72 | 3.98 | (1.03) | 2.81 | 2.38 | 2.14 |
| Total from investment operations | 2.94 | 4.54 | (.43) | 3.48 | 2.87 | 2.64 |
| Distributions from net investment income | (.49) | (.68) | (.62) | (.48) | (.49) | (.49) |
| Distributions from net realized gain | (.51) | – | –C | (2.81) | (.58) | – |
| Total distributions | (1.00) | (.68) | (.63)D | (3.29) | (1.07) | (.49) |
| Redemption fees added to paid in capitalA | – | – | – | – | – | –C |
| Net asset value, end of period | $36.47 | $34.53 | $30.67 | $31.73 | $31.54 | $29.74 |
| Total ReturnE,F,G | 8.51% | 14.95% | (1.56)% | 11.73% | 9.84% | 9.87% |
| Ratios to Average Net AssetsB,H,I | | | | | | |
| Expenses before reductions | 1.02%J | 1.05% | 1.06% | 1.08% | 1.12% | 1.12% |
| Expenses net of fee waivers, if any | 1.02%J | 1.04% | 1.06% | 1.07% | 1.11% | 1.12% |
| Expenses net of all reductions | 1.02%J | 1.03% | 1.05% | 1.06% | 1.09% | 1.11% |
| Net investment income (loss) | 1.19%J | 1.70% | 1.88% | 2.14% | 1.66% | 1.87% |
| Supplemental Data | | | | | | |
| Net assets, end of period (000 omitted) | $275,434 | $254,388 | $249,158 | $268,246 | $173,999 | $160,040 |
| Portfolio turnover rateK | 20%J | 45% | 80%L | 56% | 106% | 37% |
A Calculated based on average shares outstanding during the period.
B Net investment income (loss) is affected by the timing of the declaration of dividends by any underlying mutual funds or exchange-traded funds (ETFs). Net investment income (loss) of any such underlying funds is not included in the Fund's net investment income (loss) ratio.
C Amount represents less than $.005 per share.
D Total distributions per share do not sum due to rounding.
E Total returns for periods of less than one year are not annualized.
F Total returns would have been lower if certain expenses had not been reduced during the applicable periods shown.
G Total returns do not include the effect of the sales charges.
H Fees and expenses of any underlying mutual funds or exchange-traded funds (ETFs) are not included in the Fund's expense ratio. The Fund indirectly bears its proportionate share of these expenses. For additional expense information related to investments in Fidelity Central Funds, please refer to the "Investments in Fidelity Central Funds" note found in the Notes to Financial Statements section of the most recent Annual or Semi-Annual report.
I Expense ratios reflect operating expenses of the class. Expenses before reductions do not reflect amounts reimbursed, waived, or reduced through arrangements with the investment adviser, brokerage services, or other offset arrangements, if applicable, and do not represent the amount paid by the class during periods when reimbursements, waivers or reductions occur.
J Annualized
K Amount does not include the portfolio activity of any underlying mutual funds or exchange-traded funds (ETFs).
L Portfolio turnover rate excludes securities received or delivered in-kind.
See accompanying notes which are an integral part of the financial statements.
Fidelity Advisor Utilities Fund Class M
| | Six months ended (Unaudited) January 31, | Years endedJuly 31, | | | | |
| | 2022 | 2021 | 2020 | 2019 | 2018 | 2017 |
| Selected Per–Share Data | | | | | | |
| Net asset value, beginning of period | $34.57 | $30.71 | $31.77 | $31.58 | $29.77 | $27.62 |
| Income from Investment Operations | | | | | | |
| Net investment income (loss)A,B | .17 | .47 | .51 | .58 | .41 | .42 |
| Net realized and unrealized gain (loss) | 2.71 | 3.99 | (1.03) | 2.81 | 2.38 | 2.14 |
| Total from investment operations | 2.88 | 4.46 | (.52) | 3.39 | 2.79 | 2.56 |
| Distributions from net investment income | (.38) | (.60) | (.53) | (.39) | (.40) | (.41) |
| Distributions from net realized gain | (.51) | – | –C | (2.81) | (.58) | – |
| Total distributions | (.89) | (.60) | (.54)D | (3.20) | (.98) | (.41) |
| Redemption fees added to paid in capitalA | – | – | – | – | – | –C |
| Net asset value, end of period | $36.56 | $34.57 | $30.71 | $31.77 | $31.58 | $29.77 |
| Total ReturnE,F,G | 8.33% | 14.63% | (1.82)% | 11.38% | 9.53% | 9.51% |
| Ratios to Average Net AssetsB,H,I | | | | | | |
| Expenses before reductions | 1.30%J | 1.32% | 1.33% | 1.36% | 1.41% | 1.41% |
| Expenses net of fee waivers, if any | 1.30%J | 1.32% | 1.33% | 1.36% | 1.41% | 1.41% |
| Expenses net of all reductions | 1.30%J | 1.31% | 1.33% | 1.35% | 1.39% | 1.41% |
| Net investment income (loss) | .92%J | 1.42% | 1.60% | 1.86% | 1.36% | 1.57% |
| Supplemental Data | | | | | | |
| Net assets, end of period (000 omitted) | $61,615 | $58,065 | $58,773 | $61,741 | $46,669 | $48,152 |
| Portfolio turnover rateK | 20%J | 45% | 80%L | 56% | 106% | 37% |
A Calculated based on average shares outstanding during the period.
B Net investment income (loss) is affected by the timing of the declaration of dividends by any underlying mutual funds or exchange-traded funds (ETFs). Net investment income (loss) of any such underlying funds is not included in the Fund's net investment income (loss) ratio.
C Amount represents less than $.005 per share.
D Total distributions per share do not sum due to rounding.
E Total returns for periods of less than one year are not annualized.
F Total returns would have been lower if certain expenses had not been reduced during the applicable periods shown.
G Total returns do not include the effect of the sales charges.
H Fees and expenses of any underlying mutual funds or exchange-traded funds (ETFs) are not included in the Fund's expense ratio. The Fund indirectly bears its proportionate share of these expenses. For additional expense information related to investments in Fidelity Central Funds, please refer to the "Investments in Fidelity Central Funds" note found in the Notes to Financial Statements section of the most recent Annual or Semi-Annual report.
I Expense ratios reflect operating expenses of the class. Expenses before reductions do not reflect amounts reimbursed, waived, or reduced through arrangements with the investment adviser, brokerage services, or other offset arrangements, if applicable, and do not represent the amount paid by the class during periods when reimbursements, waivers or reductions occur.
J Annualized
K Amount does not include the portfolio activity of any underlying mutual funds or exchange-traded funds (ETFs).
L Portfolio turnover rate excludes securities received or delivered in-kind.
See accompanying notes which are an integral part of the financial statements.
Fidelity Advisor Utilities Fund Class C
| | Six months ended (Unaudited) January 31, | Years endedJuly 31, | | | | |
| | 2022 | 2021 | 2020 | 2019 | 2018 | 2017 |
| Selected Per–Share Data | | | | | | |
| Net asset value, beginning of period | $33.60 | $29.83 | $30.90 | $30.81 | $29.07 | $26.98 |
| Income from Investment Operations | | | | | | |
| Net investment income (loss)A,B | .08 | .30 | .35 | .42 | .26 | .29 |
| Net realized and unrealized gain (loss) | 2.63 | 3.88 | (1.01) | 2.74 | 2.33 | 2.09 |
| Total from investment operations | 2.71 | 4.18 | (.66) | 3.16 | 2.59 | 2.38 |
| Distributions from net investment income | (.20) | (.41) | (.40) | (.26) | (.27) | (.29) |
| Distributions from net realized gain | (.51) | – | –C | (2.81) | (.58) | – |
| Total distributions | (.72)D | (.41) | (.41)D | (3.07) | (.85) | (.29) |
| Redemption fees added to paid in capitalA | – | – | – | – | – | –C |
| Net asset value, end of period | $35.59 | $33.60 | $29.83 | $30.90 | $30.81 | $29.07 |
| Total ReturnE,F,G | 8.04% | 14.10% | (2.28)% | 10.87% | 9.04% | 9.01% |
| Ratios to Average Net AssetsB,H,I | | | | | | |
| Expenses before reductions | 1.78%J | 1.80% | 1.81% | 1.83% | 1.87% | 1.87% |
| Expenses net of fee waivers, if any | 1.78%J | 1.80% | 1.81% | 1.83% | 1.87% | 1.87% |
| Expenses net of all reductions | 1.78%J | 1.79% | 1.80% | 1.82% | 1.85% | 1.86% |
| Net investment income (loss) | .44%J | .94% | 1.12% | 1.39% | .90% | 1.11% |
| Supplemental Data | | | | | | |
| Net assets, end of period (000 omitted) | $51,313 | $49,312 | $63,458 | $66,525 | $53,099 | $56,964 |
| Portfolio turnover rateK | 20%J | 45% | 80%L | 56% | 106% | 37% |
A Calculated based on average shares outstanding during the period.
B Net investment income (loss) is affected by the timing of the declaration of dividends by any underlying mutual funds or exchange-traded funds (ETFs). Net investment income (loss) of any such underlying funds is not included in the Fund's net investment income (loss) ratio.
C Amount represents less than $.005 per share.
D Total distributions per share do not sum due to rounding.
E Total returns for periods of less than one year are not annualized.
F Total returns would have been lower if certain expenses had not been reduced during the applicable periods shown.
G Total returns do not include the effect of the contingent deferred sales charge.
H Fees and expenses of any underlying mutual funds or exchange-traded funds (ETFs) are not included in the Fund's expense ratio. The Fund indirectly bears its proportionate share of these expenses. For additional expense information related to investments in Fidelity Central Funds, please refer to the "Investments in Fidelity Central Funds" note found in the Notes to Financial Statements section of the most recent Annual or Semi-Annual report.
I Expense ratios reflect operating expenses of the class. Expenses before reductions do not reflect amounts reimbursed, waived, or reduced through arrangements with the investment adviser, brokerage services, or other offset arrangements, if applicable, and do not represent the amount paid by the class during periods when reimbursements, waivers or reductions occur.
J Annualized
K Amount does not include the portfolio activity of any underlying mutual funds or exchange-traded funds (ETFs).
L Portfolio turnover rate excludes securities received or delivered in-kind.
See accompanying notes which are an integral part of the financial statements.
Fidelity Advisor Utilities Fund Class I
| | Six months ended (Unaudited) January 31, | Years endedJuly 31, | | | | |
| | 2022 | 2021 | 2020 | 2019 | 2018 | 2017 |
| Selected Per–Share Data | | | | | | |
| Net asset value, beginning of period | $35.39 | $31.40 | $32.47 | $32.21 | $30.35 | $28.14 |
| Income from Investment Operations | | | | | | |
| Net investment income (loss)A,B | .27 | .66 | .71 | .76 | .59 | .59 |
| Net realized and unrealized gain (loss) | 2.78 | 4.10 | (1.07) | 2.88 | 2.43 | 2.17 |
| Total from investment operations | 3.05 | 4.76 | (.36) | 3.64 | 3.02 | 2.76 |
| Distributions from net investment income | (.58) | (.77) | (.71) | (.58) | (.58) | (.55) |
| Distributions from net realized gain | (.51) | – | –C | (2.81) | (.58) | – |
| Total distributions | (1.09) | (.77) | (.71) | (3.38)D | (1.16) | (.55) |
| Redemption fees added to paid in capitalA | – | – | – | – | – | –C |
| Net asset value, end of period | $37.35 | $35.39 | $31.40 | $32.47 | $32.21 | $30.35 |
| Total ReturnE,F | 8.62% | 15.30% | (1.30)% | 12.04% | 10.14% | 10.17% |
| Ratios to Average Net AssetsB,G,H | �� | | | | | |
| Expenses before reductions | .75%I | .77% | .79% | .81% | .84% | .85% |
| Expenses net of fee waivers, if any | .75%I | .77% | .78% | .80% | .84% | .85% |
| Expenses net of all reductions | .75%I | .76% | .78% | .79% | .82% | .84% |
| Net investment income (loss) | 1.46%I | 1.97% | 2.15% | 2.41% | 1.93% | 2.14% |
| Supplemental Data | | | | | | |
| Net assets, end of period (000 omitted) | $183,309 | $143,582 | $187,833 | $229,777 | $55,462 | $46,943 |
| Portfolio turnover rateJ | 20%I | 45% | 80%K | 56% | 106% | 37% |
A Calculated based on average shares outstanding during the period.
B Net investment income (loss) is affected by the timing of the declaration of dividends by any underlying mutual funds or exchange-traded funds (ETFs). Net investment income (loss) of any such underlying funds is not included in the Fund's net investment income (loss) ratio.
C Amount represents less than $.005 per share.
D Total distributions per share do not sum due to rounding.
E Total returns for periods of less than one year are not annualized.
F Total returns would have been lower if certain expenses had not been reduced during the applicable periods shown.
G Fees and expenses of any underlying mutual funds or exchange-traded funds (ETFs) are not included in the Fund's expense ratio. The Fund indirectly bears its proportionate share of these expenses. For additional expense information related to investments in Fidelity Central Funds, please refer to the "Investments in Fidelity Central Funds" note found in the Notes to Financial Statements section of the most recent Annual or Semi-Annual report.
H Expense ratios reflect operating expenses of the class. Expenses before reductions do not reflect amounts reimbursed, waived, or reduced through arrangements with the investment adviser, brokerage services, or other offset arrangements, if applicable, and do not represent the amount paid by the class during periods when reimbursements, waivers or reductions occur.
I Annualized
J Amount does not include the portfolio activity of any underlying mutual funds or exchange-traded funds (ETFs).
K Portfolio turnover rate excludes securities received or delivered in-kind.
See accompanying notes which are an integral part of the financial statements.
Fidelity Advisor Utilities Fund Class Z
| | Six months ended (Unaudited) January 31, | Years endedJuly 31, | | |
| | 2022 | 2021 | 2020 | 2019 A |
| Selected Per–Share Data | | | | |
| Net asset value, beginning of period | $35.38 | $31.42 | $32.48 | $33.14 |
| Income from Investment Operations | | | | |
| Net investment income (loss)B,C | .29 | .71 | .74 | .63 |
| Net realized and unrealized gain (loss) | 2.79 | 4.08 | (1.04) | 2.13 |
| Total from investment operations | 3.08 | 4.79 | (.30) | 2.76 |
| Distributions from net investment income | (.63) | (.83) | (.75) | (.61) |
| Distributions from net realized gain | (.51) | – | –D | (2.81) |
| Total distributions | (1.14) | (.83) | (.76)E | (3.42) |
| Redemption fees added to paid in capitalB | – | – | – | – |
| Net asset value, end of period | $37.32 | $35.38 | $31.42 | $32.48 |
| Total ReturnF,G | 8.69% | 15.41% | (1.15)% | 9.04% |
| Ratios to Average Net AssetsC,H,I | | | | |
| Expenses before reductions | .63%J | .64% | .65% | .66%J |
| Expenses net of fee waivers, if any | .63%J | .64% | .65% | .66%J |
| Expenses net of all reductions | .63%J | .63% | .64% | .64%J |
| Net investment income (loss) | 1.59%J | 2.10% | 2.29% | 2.41%J |
| Supplemental Data | | | | |
| Net assets, end of period (000 omitted) | $72,405 | $54,746 | $52,034 | $17,071 |
| Portfolio turnover rateK | 20%J | 45% | 80%L | 56%J |
A For the period October 2, 2018 (commencement of sale of shares) through July 31, 2019.
B Calculated based on average shares outstanding during the period.
C Net investment income (loss) is affected by the timing of the declaration of dividends by any underlying mutual funds or exchange-traded funds (ETFs). Net investment income (loss) of any such underlying funds is not included in the Fund's net investment income (loss) ratio.
D Amount represents less than $.005 per share.
E Total distributions per share do not sum due to rounding.
F Total returns for periods of less than one year are not annualized.
G Total returns would have been lower if certain expenses had not been reduced during the applicable periods shown.
H Fees and expenses of any underlying mutual funds or exchange-traded funds (ETFs) are not included in the Fund's expense ratio. The Fund indirectly bears its proportionate share of these expenses. For additional expense information related to investments in Fidelity Central Funds, please refer to the "Investments in Fidelity Central Funds" note found in the Notes to Financial Statements section of the most recent Annual or Semi-Annual report.
I Expense ratios reflect operating expenses of the class. Expenses before reductions do not reflect amounts reimbursed, waived, or reduced through arrangements with the investment adviser, brokerage services, or other offset arrangements, if applicable, and do not represent the amount paid by the class during periods when reimbursements, waivers or reductions occur.
J Annualized
K Amount does not include the portfolio activity of any underlying mutual funds or exchange-traded funds (ETFs).
L Portfolio turnover rate excludes securities received or delivered in-kind.
See accompanying notes which are an integral part of the financial statements.
Notes to Financial Statements (Unaudited)
For the period ended January 31, 2022
1. Organization.
Fidelity Advisor Biotechnology Fund, Fidelity Advisor Consumer Discretionary Fund, Fidelity Advisor Energy Fund, Fidelity Advisor Financial Services Fund, Fidelity Advisor Health Care Fund, Fidelity Advisor Industrials Fund, Fidelity Advisor Semiconductors Fund, Fidelity Advisor Technology Fund and Fidelity Advisor Utilities Fund (the Funds) are funds of Fidelity Advisor Series VII (the Trust) and are authorized to issue an unlimited number of shares. The Trust is registered under the Investment Company Act of 1940, as amended (the 1940 Act), as an open-end management investment company organized as a Massachusetts business trust. The Funds are non-diversified with the exception of Fidelity Advisor Financial Services Fund and Fidelity Advisor Health Care Fund. Each Fund offers Class A, Class M, Class C, Class I and Class Z shares, each of which has equal rights as to assets and voting privileges. Each class has exclusive voting rights with respect to matters that affect that class. Class C shares will automatically convert to Class A shares after a holding period of eight years from the initial date of purchase, with certain exceptions.
2. Investments in Fidelity Central Funds.
Funds may invest in Fidelity Central Funds, which are open-end investment companies generally available only to other investment companies and accounts managed by the investment adviser and its affiliates. The Schedule of Investments lists any Fidelity Central Funds held as an investment as of period end, but does not include the underlying holdings of each Fidelity Central Fund. An investing fund indirectly bears its proportionate share of the expenses of the underlying Fidelity Central Funds.
Based on its investment objective, each Fidelity Central Fund may invest or participate in various investment vehicles or strategies that are similar to those of the investing fund. These strategies are consistent with the investment objectives of the investing fund and may involve certain economic risks which may cause a decline in value of each of the Fidelity Central Funds and thus a decline in the value of the investing fund.
| Fidelity Central Fund | Investment Manager | Investment Objective | Investment Practices | Expense Ratio(a) |
| Fidelity Money Market Central Funds | Fidelity Management & Research Company LLC (FMR) | Each fund seeks to obtain a high level of current income consistent with the preservation of capital and liquidity. | Short-term Investments | Less than .005% |
(a) Expenses expressed as a percentage of average net assets and are as of each underlying Central Fund's most recent annual or semi-annual shareholder report.
A complete unaudited list of holdings for each Fidelity Central Fund is available upon request or at the Securities and Exchange Commission website at www.sec.gov. In addition, the financial statements of the Fidelity Central Funds which contain the significant accounting policies (including investment valuation policies) of those funds, and are not covered by the Report of Independent Registered Public Accounting Firm, are available on the Securities and Exchange Commission website or upon request.
3. Significant Accounting Policies.
Each Fund is an investment company and applies the accounting and reporting guidance of the Financial Accounting Standards Board (FASB) Accounting Standards Codification Topic 946 Financial Services - Investment Companies. The financial statements have been prepared in conformity with accounting principles generally accepted in the United States of America (GAAP), which require management to make certain estimates and assumptions at the date of the financial statements. Actual results could differ from those estimates. Subsequent events, if any, through the date that the financial statements were issued have been evaluated in the preparation of the financial statements. Each Fund's Schedule of Investments lists any underlying mutual funds or exchange-traded funds (ETFs) but does not include the underlying holdings of these funds. The following summarizes the significant accounting policies of each Fund:
Investment Valuation. Investments are valued as of 4:00 p.m. Eastern time on the last calendar day of the period. The Board of Trustees (the Board) has delegated the day to day responsibility for the valuation of each Fund's investments to the Fair Value Committee (the Committee) established by each Fund's investment adviser. In accordance with valuation policies and procedures approved by the Board, each Fund attempts to obtain prices from one or more third party pricing vendors or brokers to value its investments. When current market prices, quotations or currency exchange rates are not readily available or reliable, investments will be fair valued in good faith by the Committee, in accordance with procedures adopted by the Board. Factors used in determining fair value vary by investment type and may include market or investment specific events, changes in interest rates and credit quality. The frequency with which these procedures are used cannot be predicted and they may be utilized to a significant extent. The Committee oversees each Fund's valuation policies and procedures and reports to the Board on the Committee's activities and fair value determinations. The Board monitors the appropriateness of the procedures used in valuing each Fund's investments and ratifies the fair value determinations of the Committee.
Each Fund categorizes the inputs to valuation techniques used to value its investments into a disclosure hierarchy consisting of three levels as shown below:
- Level 1 – Unadjusted quoted prices in active markets for identical investments
- Level 2 – other significant observable inputs (including quoted prices for similar investments, interest rates, prepayment speeds, etc.)
- Level 3 – unobservable inputs (including the Fund's own assumptions based on the best information available)
Valuation techniques used to value each Fund's investments by major category are as follows:
Equity securities, including restricted securities, for which market quotations are readily available, are valued at the last reported sale price or official closing price as reported by a third party pricing vendor on the primary market or exchange on which they are traded and are categorized as Level 1 in the hierarchy. In the event there were no sales during the day or closing prices are not available, securities are valued at the last quoted bid price or may be valued using the last available price and are generally categorized as Level 2 in the hierarchy. For foreign equity securities, when market or security specific events arise, comparisons to the valuation of American Depositary Receipts (ADRs), futures contracts, Exchange-Traded Funds (ETFs) and certain indexes as well as quoted prices for similar securities may be used and would be categorized as Level 2 in the hierarchy. For equity securities, including restricted securities, where observable inputs are limited, assumptions about market activity and risk are used and these securities may be categorized as Level 3 in the hierarchy. Securities, including private placements or other restricted securities, for which observable inputs are not available are valued using alternate valuation approaches, including the market approach, the income approach and cost approach, and are categorized as Level 3 in the hierarchy. The market approach considers factors including the price of recent investments in the same or a similar security or financial metrics of comparable securities. The income approach considers factors including expected future cash flows, security specific risks and corresponding discount rates. The cost approach considers factors including the value of the security's underlying assets and liabilities.
Debt securities, including restricted securities, are valued based on evaluated prices received from third party pricing vendors or from brokers who make markets in such securities. Corporate bonds and preferred securities are valued by pricing vendors who utilize matrix pricing which considers yield or price of bonds of comparable quality, coupon, maturity and type or by broker-supplied prices. When independent prices are unavailable or unreliable, debt securities may be valued utilizing pricing methodologies which consider similar factors that would be used by third party pricing vendors. Debt securities are generally categorized as Level 2 in the hierarchy but may be Level 3 depending on the circumstances.
Investments in open-end mutual funds, including the Fidelity Central Funds, are valued at their closing net asset value (NAV) each business day and are categorized as Level 1 in the hierarchy.
The following provides information on Level 3 securities held by the Fund that were valued at period end based on unobservable inputs. These amounts exclude valuations provided by a broker.
Fidelity Advisor Biotechnology
| Asset Type | Fair Value | Valuation Technique(s) | Unobservable Input | Amount or Range/Weighted Average | Impact to Valuation from an Increase in Input(a) |
| Equities | $ 38,284,004 | Recovery value | Recovery value | 0.0% | Increase |
| | | Market approach | Transaction price | $1.35 - $8.90/$5.12 | Increase |
| | | | Discount rate | 20.5% - 10.0%/9.3 | Decrease |
| | | Discounted cash flow | Discount rate | 8.0% - 10%/9.3% | Decrease |
| | | | Discount for lack of marketability | 10% | Decrease |
| | | | Probability rate | 0.6% - 50.0%/18.7% | Increase |
(a) Represents the directional change in the fair value of the Level 3 investments that could have resulted from an increase in the corresponding input as of period end. A decrease to the unobservable input would have had the opposite effect. Significant changes in these inputs may have resulted in a significantly higher or lower fair value measurement at period end.
Fidelity Advisor Technology
| Asset Type | Fair Value | Valuation Technique(s) | Unobservable Input | Amount or Range/Weighted Average | Impact to Valuation from an Increase in Input(a) | | | | | | |
| Equities | $91,050,366 | Market comparable | Enterprise value/Sales multiple
(EV/S) | 4.3 – 12.0/8.3 | Increase | | | | | | |
| | | | Price/Earnings multiple (P/E)
| 7.1 | Increase | | | | | | |
| | | | Enterprise value/Gross profit (EV/GP)
| 12.5 | Increase | | | | | | |
| | | | Discount for lack of marketability
| 15.0% | Decrease | | | | | | |
| | | Recovery value | Recovery value | 0.0% | Increase | | | | | | |
| | | Market approach | Transaction price | $1.11 - $609.32/$196.89 | Increase | | | | | | |
| | | | Discount rate | 75.0% | Decrease | | | | | | |
| | | | Premium Rate | 20.2% - 27.4%/25.4% | Increase | | | | | | |
| Preferred Securities | $4,405,056 | Market approach | Transaction price | $100.00 | Increase | | | | | | |
(a) Represents the directional change in the fair value of the Level 3 investments that could have resulted from an increase in the corresponding input as of period end. A decrease to the unobservable input would have had the opposite effect. Significant changes in these inputs may have resulted in a significantly higher or lower fair value measurement at period end.
Changes in valuation techniques may result in transfers in or out of an assigned level within the disclosure hierarchy. The aggregate value of investments by input level as of January 31, 2022, as well as a roll forward of Level 3 investments, is included at the end of each Fund's Schedule of Investments.
Foreign Currency. Certain Funds may use foreign currency contracts to facilitate transactions in foreign-denominated securities. Gains and losses from these transactions may arise from changes in the value of the foreign currency or if the counterparties do not perform under the contracts' terms.
Foreign-denominated assets, including investment securities, and liabilities are translated into U.S. dollars at the exchange rates at period end. Purchases and sales of investment securities, income and dividends received, and expenses denominated in foreign currencies are translated into U.S. dollars at the exchange rate in effect on the transaction date.
The effects of exchange rate fluctuations on investments are included with the net realized and unrealized gain (loss) on investment securities. Other foreign currency transactions resulting in realized and unrealized gain (loss) are disclosed separately.
Investment Transactions and Income. For financial reporting purposes, the Funds' investment holdings and NAV include trades executed through the end of the last business day of the period. The NAV per share for processing shareholder transactions is calculated as of the close of business of the New York Stock Exchange (NYSE), normally 4:00 p.m. Eastern time and includes trades executed through the end of the prior business day. Gains and losses on securities sold are determined on the basis of identified cost and for certain Funds include proceeds received from litigation. Commissions paid to certain brokers with whom the investment adviser, or its affiliates, places trades on behalf of a fund include an amount in addition to trade execution, which may be rebated back to a fund. Any such rebates are included in net realized gain (loss) on investments in the Statement of Operations. Dividend income is recorded on the ex-dividend date, except for certain dividends from foreign securities where the ex-dividend date may have passed, which are recorded as soon as the Funds are informed of the ex-dividend date. Non-cash dividends included in dividend income, if any, are recorded at the fair market value of the securities received. Income and capital gain distributions from Fidelity Central Funds, if any, are recorded on the ex-dividend date. Certain distributions received by the Funds represent a return of capital or capital gain. The Funds determine the components of these distributions subsequent to the ex-dividend date, based upon receipt of tax filings or other correspondence relating to the underlying investment. These distributions are recorded as a reduction of cost of investments and/or as a realized gain. Interest income is accrued as earned and includes coupon interest and amortization of premium and accretion of discount on debt securities as applicable. Investment income is recorded net of foreign taxes withheld where recovery of such taxes is uncertain.
Class Allocations and Expenses. Investment income, realized and unrealized capital gains and losses, common expenses of a fund, and certain fund-level expense reductions, if any, are allocated daily on a pro-rata basis to each class based on the relative net assets of each class to the total net assets of a fund. Each class differs with respect to transfer agent and distribution and service plan fees incurred, as applicable. Certain expense reductions may also differ by class, if applicable. For the reporting period, the allocated portion of income and expenses to each class as a percent of its average net assets may vary due to the timing of recording these transactions in relation to fluctuating net assets of the classes. Expenses directly attributable to a fund are charged to that fund. Expenses attributable to more than one fund are allocated among the respective funds on the basis of relative net assets or other appropriate methods. Expenses included in the accompanying financial statements reflect the expenses of that fund and do not include any expenses associated with any underlying mutual funds or exchange-traded funds. Although not included in a fund's expenses, a fund indirectly bears its proportionate share of these expenses through the net asset value of each underlying mutual fund or exchange-traded fund. Expense estimates are accrued in the period to which they relate and adjustments are made when actual amounts are known.
Deferred Trustee Compensation. Under a Deferred Compensation Plan (the Plan) for certain Funds, certain independent Trustees have elected to defer receipt of a portion of their annual compensation. Deferred amounts are invested in affiliated mutual funds, are marked-to-market and remain in a fund until distributed in accordance with the Plan. The investment of deferred amounts and the offsetting payable to the Trustees presented below are included in the accompanying Statement of Assets and Liabilities in other receivables and other payables and accrued expenses, as applicable.
| Fidelity Advisor Energy Fund | 99,824 |
| Fidelity Advisor Technology Fund | 159,958 |
Income Tax Information and Distributions to Shareholders. Each year, each Fund intends to qualify as a regulated investment company under Subchapter M of the Internal Revenue Code, including distributing substantially all of its taxable income and realized gains. As a result, no provision for U.S. Federal income taxes is required. Each Fund files a U.S. federal tax return, in addition to state and local tax returns as required. Each Fund's federal income tax returns are subject to examination by the Internal Revenue Service (IRS) for a period of three fiscal years after they are filed. State and local tax returns may be subject to examination for an additional fiscal year depending on the jurisdiction. Foreign taxes are provided for based on each Fund's understanding of the tax rules and rates that exist in the foreign markets in which it invests. An estimated deferred tax liability for net unrealized appreciation on the applicable securities is included in Other payables and accrued expenses on each applicable Fund's Statement of Assets & Liabilities.
Distributions are declared and recorded on the ex-dividend date. Income and capital gain distributions are declared separately for each class. Income and capital gain distributions are determined in accordance with income tax regulations, which may differ from GAAP.
Capital accounts within the financial statements are adjusted for permanent book-tax differences. These adjustments have no impact on net assets or the results of operations. Capital accounts are not adjusted for temporary book-tax differences which will reverse in a subsequent period.
Book-tax differences are primarily due to foreign currency transactions, passive foreign investment companies (PFIC), deferred Trustee compensation, net operating losses, capital loss carryforwards, partnerships, and losses deferred due to wash sales and excise tax regulations.
As of period end, the cost and unrealized appreciation (depreciation) in securities, and derivatives if applicable, for federal income tax purposes were as follows for each Fund:
| | Tax cost | Gross unrealized appreciation | Gross unrealized depreciation | Net unrealized appreciation (depreciation) |
| Fidelity Advisor Biotechnology Fund | $1,917,454,912 | $582,705,924 | $(340,917,733) | $241,788,191 |
| Fidelity Advisor Consumer Discretionary Fund | 360,211,830 | 258,956,549 | (16,454,721) | 242,501,828 |
| Fidelity Advisor Energy Fund | 680,561,211 | 268,651,094 | (7,734,809) | 260,916,285 |
| Fidelity Advisor Financial Services Fund | 455,790,286 | 146,855,635 | (6,652,962) | 140,202,673 |
| Fidelity Advisor Health Care Fund | 4,933,816,936 | 2,017,760,149 | (613,539,612) | 1,404,220,537 |
| Fidelity Advisor Industrials Fund | 529,790,154 | 85,345,061 | (18,205,011) | 67,140,050 |
| Fidelity Advisor Semiconductors Fund | 585,014,599 | 360,835,862 | (19,691,022) | 341,144,840 |
| Fidelity Advisor Technology Fund | 2,608,450,972 | 2,456,459,355 | (245,836,978) | 2,210,622,377 |
| Fidelity Advisor Utilities Fund | 500,862,897 | 158,009,005 | (6,202,211) | 151,806,794 |
Capital loss carryforwards are only available to offset future capital gains of the Funds to the extent provided by regulations and may be limited. The capital loss carryforward information presented below, including any applicable limitation, is estimated as of prior fiscal period end and is subject to adjustment.
| | No expiration | | |
| | Short-term | Long-term | Total capital loss carryforward |
| Fidelity Advisor Energy Fund | (174,302,264) | (155,928,212) | (330,230,476) |
Restricted Securities (including Private Placements). Funds may invest in securities that are subject to legal or contractual restrictions on resale. These securities generally may be resold in transactions exempt from registration or to the public if the securities are registered. Disposal of these securities may involve time-consuming negotiations and expense, and prompt sale at an acceptable price may be difficult. Information regarding restricted securities held at period end is included at the end of the Schedule of Investments, if applicable.
Special Purpose Acquisition Companies. Funds may invest in stock, warrants, and other securities of special purpose acquisition companies (SPACs) or similar special purpose entities. A SPAC is a publicly traded company that raises investment capital via an initial public offering (IPO) for the purpose of acquiring the equity securities of one or more existing companies via merger, business combination, acquisition or other similar transactions within a designated time frame.
Private Investment in Public Equity. Funds may acquire equity securities of an issuer through a private investment in a public equity (PIPE) transaction, including through commitments to purchase securities on a when-issued basis. A PIPE typically involves the purchase of securities directly from a publicly traded company in a private placement transaction. Securities purchased through PIPE transactions will be restricted from trading and considered illiquid until a resale registration statement for the shares is filed and declared effective.
At the current and/or prior period end, Fidelity Advisor Biotechnology Fund, Fidelity Advisor Health Care Fund, Fidelity Advisor Semiconductors Fund and Fidelity Advisor Technology Fund had commitments to purchase when-issued securities through PIPE transactions with SPACs. The commitments are contingent upon the SPACs acquiring the securities of target companies. Unrealized appreciation (depreciation) on any commitments outstanding at period end is separately presented in the Statements of Assets and Liabilities as Unrealized appreciation (depreciation) on unfunded commitments, and any change in unrealized appreciation (depreciation) on unfunded commitments during the period is separately presented in the Statement of Operations, as applicable.
Consolidated Subsidiary. The Funds included in the table below hold certain investments through a wholly-owned subsidiary ("Subsidiary"), which may be subject to federal and state taxes upon disposition.
As of period end, investments in Subsidiaries were as follows:
| | $ Amount | % of Net Assets |
| Fidelity Advisor Health Care Fund | 5,597,126 | .09 |
The financial statements have been consolidated to include the Subsidiary accounts where applicable. Accordingly, all inter-company transactions and balances have been eliminated.
At period end, any estimated tax liability for these investments is presented as "Deferred taxes" in the Statement of Assets and Liabilities and included in "Change in net unrealized appreciation (depreciation) on investment securities" in the Statement of Operations. The tax liability incurred may differ materially depending on conditions when these investments are disposed. Any cash held by a Subsidiary is restricted as to its use and is presented as "Restricted cash" in the Statement of Assets and Liabilities, if applicable.
4. Purchases and Sales of Investments.
Purchases and sales of securities, other than short-term securities and in-kind transactions, as applicable, are noted in the table below.
| | Purchases ($) | Sales ($) |
| Fidelity Advisor Biotechnology Fund | 608,116,672 | 889,701,926 |
| Fidelity Advisor Consumer Discretionary Fund | 123,610,288 | 238,742,324 |
| Fidelity Advisor Energy Fund | 320,133,610 | 162,927,115 |
| Fidelity Advisor Financial Services Fund | 176,661,521 | 91,265,434 |
| Fidelity Advisor Health Care Fund | 1,037,041,083 | 1,217,473,081 |
| Fidelity Advisor Industrials Fund | 428,760,899 | 484,571,854 |
| Fidelity Advisor Semiconductors Fund | 278,053,230 | 111,166,656 |
| Fidelity Advisor Technology Fund | 468,361,801 | 624,501,096 |
| Fidelity Advisor Utilities Fund | 105,754,746 | 58,077,568 |
5. Fees and Other Transactions with Affiliates.
Management Fee. Fidelity Management & Research Company LLC (the investment adviser) and its affiliates provide the Funds with investment management related services for which the Funds pay a monthly management fee. The management fee is the sum of an individual fund fee rate and an annualized group fee rate. The individual fund fee rate is applied to each Fund's average net assets. The group fee rate is based upon the monthly average net assets of a group of registered investment companies with which the investment adviser has management contracts. The group fee rate decreases as assets under management increase and increases as assets under management decrease. For the reporting period, each Fund's annualized management fee rate expressed as a percentage of each Fund's average net assets was as follows:
| | Individual Rate | Group Rate | Total |
| Fidelity Advisor Biotechnology Fund | .30% | .22% | .52% |
| Fidelity Advisor Consumer Discretionary Fund | .30% | .22% | .52% |
| Fidelity Advisor Energy Fund | .30% | .22% | .52% |
| Fidelity Advisor Financial Services Fund | .30% | .22% | .52% |
| Fidelity Advisor Health Care Fund | .30% | .22% | .52% |
| Fidelity Advisor Industrials Fund | .30% | .22% | .52% |
| Fidelity Advisor Semiconductors Fund | .30% | .22% | .52% |
| Fidelity Advisor Technology Fund | .30% | .22% | .52% |
| Fidelity Advisor Utilities Fund | .30% | .22% | .52% |
Distribution and Service Plan Fees. In accordance with Rule 12b-1 of the 1940 Act, each Fund has adopted separate Distribution and Service Plans for each class of shares. Certain classes pay Fidelity Distributors Company LLC (FDC), an affiliate of the investment adviser, separate Distribution and Service Fees, each of which is based on an annual percentage of each class' average net assets. In addition, FDC may pay financial intermediaries for selling shares of each Fund and providing shareholder support services. For the period, the Distribution and Service Fee rates, total fees and amounts retained by FDC were as follows:
| | Distribution Fee | Service Fee | Total Fees | Retained by FDC |
| Fidelity Advisor Biotechnology Fund | | | | |
| Class A | -% | .25% | $1,001,215 | $5,502 |
| Class M | .25% | .25% | 396,174 | – |
| Class C | .75% | .25% | 1,515,839 | 86,293 |
| | | | $2,913,228 | $91,795 |
| Fidelity Advisor Consumer Discretionary Fund | | | | |
| Class A | -% | .25% | $324,598 | $13,312 |
| Class M | .25% | .25% | 121,626 | – |
| Class C | .75% | .25% | 422,623 | 67,947 |
| | | | $868,847 | $81,259 |
| Fidelity Advisor Energy Fund | | | | |
| Class A | -% | .25% | $246,226 | $8,758 |
| Class M | .25% | .25% | 175,869 | – |
| Class C | .75% | .25% | 306,471 | 42,120 |
| | | | $728,566 | $50,878 |
| Fidelity Advisor Financial Services Fund | | | | |
| Class A | -% | .25% | $250,184 | $5,910 |
| Class M | .25% | .25% | 170,754 | – |
| Class C | .75% | .25% | 312,504 | 49,299 |
| | | | $733,442 | $55,209 |
| Fidelity Advisor Health Care Fund | | | | |
| Class A | -% | .25% | $2,145,729 | $54,575 |
| Class M | .25% | .25% | 981,038 | – |
| Class C | .75% | .25% | 3,337,807 | 352,584 |
| | | | $6,464,574 | $407,159 |
| Fidelity Advisor Industrials Fund | | | | |
| Class A | -% | .25% | $328,106 | $693 |
| Class M | .25% | .25% | 143,096 | – |
| Class C | .75% | .25% | 266,676 | 25,470 |
| | | | $737,878 | $26,163 |
| Fidelity Advisor Semiconductors Fund | | | | |
| Class A | -% | .25% | $425,979 | $14,245 |
| Class M | .25% | .25% | 147,434 | – |
| Class C | .75% | .25% | 507,744 | 93,496 |
| | | | $1,081,157 | $107,741 |
| Fidelity Advisor Technology Fund | | | | |
| Class A | -% | .25% | $2,404,185 | $18,945 |
| Class M | .25% | .25% | 1,624,312 | – |
| Class C | .75% | .25% | 2,094,627 | 208,044 |
| | | | $6,123,124 | $226,989 |
| Fidelity Advisor Utilities Fund | | | | |
| Class A | -% | .25% | $331,227 | $3,288 |
| Class M | .25% | .25% | 150,868 | – |
| Class C | .75% | .25% | 254,489 | 29,495 |
| | | | $736,584 | $32,783 |
Sales Load. FDC may receive a front-end sales charge of up to 5.75% for selling Class A shares and 3.50% for selling Class M shares, some of which is paid to financial intermediaries for selling shares of each Fund. Depending on the holding period, FDC may receive contingent deferred sales charges levied on Class A, Class M and Class C redemptions. The deferred sales charges are 1.00% for Class C shares, 1.00% for certain purchases of Class A shares and .25% for certain purchases of Class M shares.
For the period, sales charge amounts retained by FDC were as follows:
| | Retained by FDC |
| Fidelity Advisor Biotechnology Fund | |
| Class A | $74,998 |
| Class M | 7,077 |
| Class C(a) | 1,149 |
| | $83,224 |
| Fidelity Advisor Consumer Discretionary Fund | |
| Class A | $49,143 |
| Class M | 5,095 |
| Class C(a) | 1,633 |
| | $55,871 |
| Fidelity Advisor Energy Fund | |
| Class A | $63,554 |
| Class M | 4,583 |
| Class C(a) | 252 |
| | $68,389 |
| Fidelity Advisor Financial Services Fund | |
| Class A | $65,490 |
| Class M | 5,536 |
| Class C(a) | 882 |
| | $71,908 |
| Fidelity Advisor Health Care Fund | |
| Class A | $239,723 |
| Class M | 25,463 |
| Class C(a) | 2,888 |
| | $268,074 |
| Fidelity Advisor Industrials Fund | |
| Class A | $20,353 |
| Class M | 2,562 |
| Class C(a) | 251 |
| | $23,166 |
| Fidelity Advisor Semiconductors Fund | |
| Class A | $253,453 |
| Class M | 8,966 |
| Class C(a) | 634 |
| | $263,053 |
| Fidelity Advisor Technology Fund | |
| Class A | $293,824 |
| Class M | 22,328 |
| Class C(a) | 4,909 |
| | $321,061 |
| Fidelity Advisor Utilities Fund | |
| Class A | $33,362 |
| Class M | 5,623 |
| Class C(a) | 342 |
| | $39,327 |
(a) When Class C shares are initially sold, FDC pays commissions from its own resources to financial intermediaries through which the sales are made.
Transfer Agent Fees. Fidelity Investments Institutional Operations Company LLC (FIIOC), an affiliate of the investment adviser, is the transfer, dividend disbursing and shareholder servicing agent for each class of the Funds. FIIOC receives account fees and asset-based fees that vary according to the account size and type of account of the shareholders of the respective classes of each Fund, except for Class Z. FIIOC receives an asset-based fee of Class Z's average net assets. FIIOC pays for typesetting, printing and mailing of shareholder reports, except proxy statements. For the period, transfer agent fees for each class were as follows:
| | Amount | % of Class-Level Average Net Assets(a) |
| Fidelity Advisor Biotechnology Fund | | |
| Class A | $729,493 | .18 |
| Class M | 162,827 | .21 |
| Class C | 274,675 | .18 |
| Class I | 915,933 | .17 |
| Class Z | 18,100 | .04 |
| | $2,101,028 | |
| Fidelity Advisor Consumer Discretionary Fund | | |
| Class A | $229,809 | .18 |
| Class M | 45,481 | .19 |
| Class C | 76,162 | .18 |
| Class I | 191,673 | .16 |
| Class Z | 17,539 | .04 |
| | $560,664 | |
| Fidelity Advisor Energy Fund | | |
| Class A | $218,958 | .22 |
| Class M | 85,585 | .24 |
| Class C | 61,703 | .20 |
| Class I | 177,214 | .17 |
| Class Z | 24,149 | .04 |
| | $567,609 | |
| Fidelity Advisor Financial Services Fund | | |
| Class A | $182,740 | .18 |
| Class M | 60,888 | .18 |
| Class C | 58,506 | .19 |
| Class I | 101,043 | .15 |
| Class Z | 11,817 | .04 |
| | $414,994 | |
| Fidelity Advisor Health Care Fund | | |
| Class A | $1,478,488 | .17 |
| Class M | 335,960 | .17 |
| Class C | 580,568 | .17 |
| Class I | 2,769,358 | .16 |
| Class Z | 192,159 | .04 |
| | $5,356,533 | |
| Fidelity Advisor Industrials Fund | | |
| Class A | $234,160 | .18 |
| Class M | 52,483 | .18 |
| Class C | 49,009 | .18 |
| Class I | 200,243 | .16 |
| Class Z | 9,888 | .04 |
| | $545,783 | |
| Fidelity Advisor Semiconductors Fund | | |
| Class A | $295,366 | .17 |
| Class M | 49,046 | .17 |
| Class C | 90,379 | .18 |
| Class I | 263,474 | .16 |
| Class Z | 8,580 | .04 |
| | $706,845 | |
| Fidelity Advisor Technology Fund | | |
| Class A | $1,569,981 | .16 |
| Class M | 508,019 | .16 |
| Class C | 367,531 | .18 |
| Class I | 1,193,739 | .16 |
| Class Z | 112,155 | .04 |
| | $3,751,425 | |
| Fidelity Advisor Utilities Fund | | |
| Class A | $243,983 | .18 |
| Class M | 63,288 | .21 |
| Class C | 49,252 | .19 |
| Class I | 129,861 | .16 |
| Class Z | 11,483 | .04 |
| | $497,867 | |
(a) Annualized
Accounting Fees. Fidelity Service Company, Inc. (FSC), an affiliate of the investment adviser, maintains each Fund's accounting records. The accounting fee is based on the level of average net assets for each month. For the period, the fees were equivalent to the following annualized rates:
| | % of Average Net Assets |
| Fidelity Advisor Biotechnology Fund | .03 |
| Fidelity Advisor Consumer Discretionary Fund | .04 |
| Fidelity Advisor Energy Fund�� | .04 |
| Fidelity Advisor Financial Services Fund | .04 |
| Fidelity Advisor Health Care Fund | .02 |
| Fidelity Advisor Industrials Fund | .04 |
| Fidelity Advisor Semiconductors Fund | .03 |
| Fidelity Advisor Technology Fund | .02 |
| Fidelity Advisor Utilities Fund | .04 |
Brokerage Commissions. A portion of portfolio transactions were placed with brokerage firms which are affiliates of the investment adviser. Brokerage commissions are included in net realized gain (loss) and change in net unrealized appreciation (depreciation) in the Statement of Operations. The commissions paid to these affiliated firms were as follows:
| | Amount |
| Fidelity Advisor Biotechnology Fund | $25,254 |
| Fidelity Advisor Consumer Discretionary Fund | 1,259 |
| Fidelity Advisor Energy Fund | 7,771 |
| Fidelity Advisor Financial Services Fund | 1,495 |
| Fidelity Advisor Health Care Fund | 24,505 |
| Fidelity Advisor Industrials Fund | 7,245 |
| Fidelity Advisor Semiconductors Fund | 3,218 |
| Fidelity Advisor Technology Fund | 5,571 |
| Fidelity Advisor Utilities Fund | 1,315 |
Interfund Lending Program. Pursuant to an Exemptive Order issued by the Securities and Exchange Commission (the SEC), each Fund, along with other registered investment companies having management contracts with Fidelity Management & Research Company LLC (FMR), or other affiliated entities of FMR, may participate in an interfund lending program. This program provides an alternative credit facility allowing each Fund to borrow from, or lend money to, other participating affiliated funds. At period end, there were no interfund loans outstanding. Activity in this program during the period for which loans were outstanding was as follows:
| | Borrower or Lender | Average Loan Balance | Weighted Average Interest Rate | Interest Expense |
| Fidelity Advisor Biotechnology Fund | Borrower | $42,699,000 | .32% | $747 |
| Fidelity Advisor Consumer Discretionary Fund | Borrower | $6,369,490 | .31% | $2,728 |
| Fidelity Advisor Financial Services Fund | Borrower | $9,574,500 | .32% | $168 |
| Fidelity Advisor Health Care Fund | Borrower | $28,446,200 | .32% | $1,245 |
| Fidelity Advisor Industrials Fund | Borrower | $19,491,500 | .32% | $341 |
| Fidelity Advisor Technology Fund | Borrower | $10,017,727 | .32% | $964 |
Interfund Trades. Funds may purchase from or sell securities to other Fidelity Funds under procedures adopted by the Board. The procedures have been designed to ensure these interfund trades are executed in accordance with Rule 17a-7 of the 1940 Act. Interfund trades during the period are noted in the table below.
| | Purchases ($) | Sales ($) | Realized Gain (Loss) ($) |
| Fidelity Advisor Biotechnology Fund | 39,851,678 | 109,961,166 | 9,025,962 |
| Fidelity Advisor Consumer Discretionary Fund | 14,921,823 | 10,762,352 | 829,651 |
| Fidelity Advisor Energy Fund | 47,719,599 | 4,041,693 | 1,175,205 |
| Fidelity Advisor Financial Services Fund | 7,682,390 | 2,173,923 | 387,203 |
| Fidelity Advisor Health Care Fund | 109,782,495 | 54,959,838 | 9,861,838 |
| Fidelity Advisor Industrials Fund | 22,351,574 | 17,731,447 | 2,945,379 |
| Fidelity Advisor Semiconductors Fund | 18,017,818 | 3,488,914 | 755,970 |
| Fidelity Advisor Technology Fund | 63,772,338 | 42,312,608 | 5,711,382 |
| Fidelity Advisor Utilities Fund | 3,039,179 | 62,693 | 7,439 |
Other. During the period, the investment adviser reimbursed the Funds for certain losses as follows:
| | Amount ($) |
| Fidelity Advisor Health Care Fund | 1,437 |
| Fidelity Advisor Technology Fund | 1,212 |
6. Committed Line of Credit.
Certain Funds participate with other funds managed by the investment adviser or an affiliate in a $4.25 billion credit facility (the "line of credit") to be utilized for temporary or emergency purposes to fund shareholder redemptions or for other short-term liquidity purposes. The participating funds have agreed to pay commitment fees on their pro-rata portion of the line of credit, which are reflected in Miscellaneous expenses on the Statement of Operations, and are listed below. During the period, there were no borrowings on this line of credit.
| | Amount |
| Fidelity Advisor Biotechnology Fund | $2,027 |
| Fidelity Advisor Consumer Discretionary Fund | 577 |
| Fidelity Advisor Energy Fund | 483 |
| Fidelity Advisor Financial Services Fund | 397 |
| Fidelity Advisor Health Care Fund | 5,723 |
| Fidelity Advisor Industrials Fund | 532 |
| Fidelity Advisor Semiconductors Fund | 618 |
| Fidelity Advisor Technology Fund | 3,962 |
| Fidelity Advisor Utilities Fund | 455 |
7. Security Lending.
Funds lend portfolio securities from time to time in order to earn additional income. Lending agents are used, including National Financial Services (NFS), an affiliate of the investment adviser. Pursuant to a securities lending agreement, NFS will receive a fee, which is capped at 9.9% of a fund's daily lending revenue, for its services as lending agent. A fund may lend securities to certain qualified borrowers, including NFS. On the settlement date of the loan, a fund receives collateral (in the form of U.S. Treasury obligations, letters of credit and/or cash) against the loaned securities and maintains collateral in an amount not less than 100% of the market value of the loaned securities during the period of the loan. The market value of the loaned securities is determined at the close of business of a fund and any additional required collateral is delivered to a fund on the next business day. A fund or borrower may terminate the loan at any time, and if the borrower defaults on its obligation to return the securities loaned because of insolvency or other reasons, a fund may apply collateral received from the borrower against the obligation. A fund may experience delays and costs in recovering the securities loaned. Any cash collateral received is invested in the Fidelity Securities Lending Cash Central Fund. Any loaned securities are identified as such in the Schedule of Investments, and the value of loaned securities and cash collateral at period end, as applicable, are presented in the Statement of Assets and Liabilities. Security lending income represents the income earned on investing cash collateral, less rebates paid to borrowers and any lending agent fees associated with the loan, plus any premium payments received for lending certain types of securities. Security lending income is presented in the Statement of Operations as a component of income from Fidelity Central Funds. Affiliated security lending activity, if any, was as follows:
| | Total Security Lending Fees Paid to NFS | Security Lending Income From Securities Loaned to NFS | Value of Securities Loaned to NFS at Period End |
| Fidelity Advisor Biotechnology Fund | $155,624 | $76,614 | $1,746,550 |
| Fidelity Advisor Consumer Discretionary Fund | $763 | $– | $– |
| Fidelity Advisor Energy Fund | $899 | $– | $– |
| Fidelity Advisor Financial Services Fund | $65 | $– | $– |
| Fidelity Advisor Health Care Fund | $32,428 | $55,503 | $6,500,080 |
| Fidelity Advisor Industrials Fund | $297 | $– | $– |
| Fidelity Advisor Semiconductors Fund | $974 | $– | $– |
| Fidelity Advisor Technology Fund | $5,122 | $– | $– |
| Fidelity Advisor Utilities Fund | $408 | $– | $– |
8. Bank Borrowings.
Each Fund is permitted to have bank borrowings for temporary or emergency purposes to fund shareholder redemptions or for other short-term liquidity requirements. Each Fund has established borrowing arrangements with certain banks. The interest rate on the borrowings is the bank's base rate, as revised from time to time. Any open loans, including accrued interest, at period end are presented under the caption "Notes payable" in the Statement of Assets and Liabilities, if applicable. Activity in this program during the period for which loans were outstanding was as follows:
| | Average Loan Balance | Weighted Average Interest Rate | Interest Expense |
| Fidelity Advisor Consumer Discretionary Fund | $565,267 | .58% | $137 |
9. Expense Reductions.
Through arrangements with each applicable Fund's custodian, credits realized as a result of certain uninvested cash balances were used to reduce each applicable Fund's or class' expenses. All of the applicable expense reductions are noted in the table below.
| | Brokerage service rebates | Custodian credits |
| Fidelity Advisor Technology Fund | – | 3 |
In addition, during the period the investment adviser or an affiliate reimbursed and/or waived a portion of fund-level operating expenses as follows:
| | Fund-Level Amount |
| Fidelity Advisor Biotechnology Fund | $37,310 |
| Fidelity Advisor Consumer Discretionary Fund | 11,065 |
| Fidelity Advisor Energy Fund | 9,636 |
| Fidelity Advisor Financial Services Fund | 7,675 |
| Fidelity Advisor Health Care Fund | 109,601 |
| Fidelity Advisor Industrials Fund | 10,109 |
| Fidelity Advisor Semiconductors Fund | 13,948 |
| Fidelity Advisor Technology Fund | 78,754 |
| Fidelity Advisor Utilities Fund | 9,026 |
10. Distributions to Shareholders.
Distributions to shareholders of each class were as follows:
| | Six months ended
January 31, 2022 | Year ended
July 31, 2021 |
| Fidelity Advisor Biotechnology Fund | | |
| Distributions to shareholders | | |
| Class A | $130,319,244 | $67,637,073 |
| Class M | 27,260,186 | 14,175,139 |
| Class C | 56,696,827 | 38,418,019 |
| Class I | 161,275,421 | 101,042,657 |
| Class Z | 13,691,301 | 6,917,398 |
| Total | $389,242,979 | $228,190,286 |
| Fidelity Advisor Consumer Discretionary Fund | | |
| Distributions to shareholders | | |
| Class A | $16,168,903 | $2,799,807 |
| Class M | 3,125,065 | 644,893 |
| Class C | 6,086,253 | 1,412,829 |
| Class I | 13,848,199 | 2,190,120 |
| Class Z | 5,612,122 | 778,378 |
| Total | $44,840,542 | $7,826,027 |
| Fidelity Advisor Energy Fund | | |
| Distributions to shareholders | | |
| Class A | $4,229,996 | $3,957,441 |
| Class M | 1,304,332 | 1,322,704 |
| Class C | 978,471 | 1,232,239 |
| Class I | 4,763,295 | 5,542,085 |
| Class Z | 3,498,287 | 1,451,982 |
| Total | $14,774,381 | $13,506,451 |
| Fidelity Advisor Financial Services Fund | | |
| Distributions to shareholders | | |
| Class A | $8,215,339 | $3,032,802 |
| Class M | 2,766,606 | 897,549 |
| Class C | 2,294,171 | 858,669 |
| Class I | 5,648,531 | 1,637,605 |
| Class Z | 2,085,902 | 806,152 |
| Total | $21,010,549 | $7,232,777 |
| Fidelity Advisor Health Care Fund | | |
| Distributions to shareholders | | |
| Class A | $103,562,278 | $85,254,822 |
| Class M | 25,573,625 | 21,586,340 |
| Class C | 52,054,574 | 45,636,281 |
| Class I | 186,427,506 | 163,297,556 |
| Class Z | 53,845,065 | 40,256,853 |
| Total | $421,463,048 | $356,031,852 |
| Fidelity Advisor Industrials Fund | | |
| Distributions to shareholders | | |
| Class A | $48,588,149 | $1,360,586 |
| Class M | 10,790,177 | 326,687 |
| Class C | 10,635,221 | 410,014 |
| Class I | 43,185,214 | 1,091,334 |
| Class Z | 8,702,749 | 227,127 |
| Total | $121,901,510 | $3,415,748 |
| Fidelity Advisor Semiconductors Fund | | |
| Distributions to shareholders | | |
| Class A | $16,894,167 | $8,071,050 |
| Class M | 3,024,406 | 1,689,234 |
| Class C | 5,665,807 | 3,556,245 |
| Class I | 15,905,080 | 7,098,112 |
| Class Z | 2,418,893 | 517,662 |
| Total | $43,908,353 | $20,932,303 |
| Fidelity Advisor Technology Fund | | |
| Distributions to shareholders | | |
| Class A | $228,756,673 | $121,011,582 |
| Class M | 82,459,538 | 44,308,653 |
| Class C | 60,838,976 | 36,326,601 |
| Class I | 166,955,477 | 89,512,609 |
| Class Z | 61,960,776 | 28,017,125 |
| Total | $600,971,440 | $319,176,570 |
| Fidelity Advisor Utilities Fund | | |
| Distributions to shareholders | | |
| Class A | $7,261,470 | $5,044,520 |
| Class M | 1,469,572 | 1,092,413 |
| Class C | 1,031,681 | 758,565 |
| Class I | 4,601,450 | 3,725,913 |
| Class Z | 1,638,124 | 1,426,998 |
| Total | $16,002,297 | $12,048,409 |
11. Share Transactions.
Share transactions for each class were as follows and may contain in-kind transactions, automatic conversions between classes or exchanges between affiliated funds:
| | Shares | Shares | Dollars | Dollars |
| | Six months ended January 31, 2022 | Year endedJuly 31, 2021 | Six months ended January 31, 2022 | Year endedJuly 31, 2021 |
| Fidelity Advisor Biotechnology Fund | | | | |
| Class A | | | | |
| Shares sold | 2,358,636 | 4,988,031 | $70,709,561 | $167,392,479 |
| Reinvestment of distributions | 4,440,751 | 1,799,881 | 118,923,318 | 61,715,324 |
| Shares redeemed | (3,193,770) | (5,261,146) | (96,279,272) | (174,179,391) |
| Net increase (decrease) | 3,605,617 | 1,526,766 | $93,353,607 | $54,928,412 |
| Class M | | | | |
| Shares sold | 304,727 | 995,337 | $8,659,434 | $30,881,501 |
| Reinvestment of distributions | 1,096,054 | 439,075 | 26,962,923 | 14,041,249 |
| Shares redeemed | (645,926) | (1,081,193) | (18,103,842) | (33,432,255) |
| Net increase (decrease) | 754,855 | 353,219 | $17,518,515 | $11,490,495 |
| Class C | | | | |
| Shares sold | 481,596 | 1,153,351 | $11,869,476 | $31,874,274 |
| Reinvestment of distributions | 2,615,104 | 1,317,196 | 55,231,000 | 37,235,282 |
| Shares redeemed | (2,948,883) | (5,015,655) | (71,952,905) | (138,031,651) |
| Net increase (decrease) | 147,817 | (2,545,108) | $(4,852,429) | $(68,922,095) |
| Class I | | | | |
| Shares sold | 2,854,939 | 7,356,978 | $91,954,158 | $261,275,855 |
| Reinvestment of distributions | 4,712,583 | 2,327,200 | 137,418,921 | 85,623,933 |
| Shares redeemed | (7,122,505) | (10,342,724) | (228,446,294) | (368,212,581) |
| Net increase (decrease) | 445,017 | (658,546) | $926,785 | $(21,312,793) |
| Class Z | | | | |
| Shares sold | 449,729 | 1,700,116 | $14,600,439 | $60,995,095 |
| Reinvestment of distributions | 396,056 | 154,329 | 11,564,840 | 5,683,821 |
| Shares redeemed | (602,982) | (1,185,293) | (19,184,789) | (41,706,292) |
| Net increase (decrease) | 242,803 | 669,152 | $6,980,490 | $24,972,624 |
| Fidelity Advisor Consumer Discretionary Fund | | | | |
| Class A | | | | |
| Shares sold | 465,354 | 1,888,408 | $21,463,693 | $80,090,408 |
| Reinvestment of distributions | 360,795 | 66,769 | 15,705,415 | 2,706,144 |
| Shares redeemed | (666,041) | (1,018,441) | (30,516,636) | (42,259,203) |
| Net increase (decrease) | 160,108 | 936,736 | $6,652,472 | $40,537,349 |
| Class M | | | | |
| Shares sold | 50,518 | 259,712 | $2,179,589 | $9,990,943 |
| Reinvestment of distributions | 76,937 | 17,054 | 3,082,116 | 639,182 |
| Shares redeemed | (90,091) | (218,708) | (3,749,682) | (8,336,487) |
| Net increase (decrease) | 37,364 | 58,058 | $1,512,023 | $2,293,638 |
| Class C | | | | |
| Shares sold | 119,462 | 655,073 | $4,284,861 | $21,563,514 |
| Reinvestment of distributions | 180,010 | 43,840 | 6,046,548 | 1,398,073 |
| Shares redeemed | (297,574) | (754,233) | (10,467,036) | (24,941,149) |
| Net increase (decrease) | 1,898 | (55,320) | $(135,627) | $(1,979,562) |
| Class I | | | | |
| Shares sold | 592,772 | 3,455,093 | $29,923,178 | $157,028,268 |
| Reinvestment of distributions | 261,935 | 44,468 | 12,486,421 | 1,963,243 |
| Shares redeemed | (1,861,935) | (1,976,394) | (91,276,828) | (87,428,646) |
| Net increase (decrease) | (1,007,228) | 1,523,167 | $(48,867,229) | $71,562,865 |
| Class Z | | | | |
| Shares sold | 388,308 | 1,465,692 | $20,007,698 | $66,408,699 |
| Reinvestment of distributions | 92,881 | 14,813 | 4,440,626 | 656,091 |
| Shares redeemed | (1,062,305) | (1,056,481) | (51,246,816) | (46,924,459) |
| Net increase (decrease) | (581,116) | 424,024 | $(26,798,492) | $20,140,331 |
| Fidelity Advisor Energy Fund | | | | |
| Class A | | | | |
| Shares sold | 1,813,743 | 2,907,447 | $52,957,653 | $61,561,652 |
| Reinvestment of distributions | 154,395 | 210,429 | 4,035,886 | 3,850,848 |
| Shares redeemed | (1,684,383) | (2,580,719) | (45,317,855) | (51,778,100) |
| Net increase (decrease) | 283,755 | 537,157 | $11,675,684 | $13,634,400 |
| Class M | | | | |
| Shares sold | 501,984 | 839,687 | $14,654,609 | $18,722,946 |
| Reinvestment of distributions | 47,378 | 68,479 | 1,273,515 | 1,287,399 |
| Shares redeemed | (426,253) | (899,666) | (11,583,789) | (19,016,017) |
| Net increase (decrease) | 123,109 | 8,500 | $4,344,335 | $994,328 |
| Class C | | | | |
| Shares sold | 319,098 | 660,725 | $8,466,519 | $13,081,023 |
| Reinvestment of distributions | 39,776 | 71,624 | 954,633 | 1,205,425 |
| Shares redeemed | (488,492) | (1,105,766) | (12,070,570) | (20,525,961) |
| Net increase (decrease) | (129,618) | (373,417) | $(2,649,418) | $(6,239,513) |
| Class I | | | | |
| Shares sold | 3,987,750 | 5,149,259 | $124,433,465 | $116,152,508 |
| Reinvestment of distributions | 152,645 | 263,571 | 4,219,114 | 5,089,551 |
| Shares redeemed | (1,906,267) | (7,136,273) | (54,397,739) | (156,749,306) |
| Net increase (decrease) | 2,234,128 | (1,723,443) | $74,254,840 | $(35,507,247) |
| Class Z | | | | |
| Shares sold | 4,274,613 | 2,898,214 | $128,323,672 | $64,509,553 |
| Reinvestment of distributions | 121,637 | 73,062 | 3,353,536 | 1,407,175 |
| Shares redeemed | (1,597,362) | (2,014,101) | (47,017,648) | (43,525,755) |
| Net increase (decrease) | 2,798,888 | 957,175 | $84,659,560 | $22,390,973 |
| Fidelity Advisor Financial Services Fund | | | | |
| Class A | | | | |
| Shares sold | 1,160,280 | 1,796,629 | $34,962,348 | $47,892,115 |
| Reinvestment of distributions | 277,978 | 129,951 | 7,866,786 | 2,873,224 |
| Shares redeemed | (522,037) | (1,368,007) | (15,573,401) | (31,660,283) |
| Net increase (decrease) | 916,221 | 558,573 | $27,255,733 | $19,105,056 |
| Class M | | | | |
| Shares sold | 603,281 | 723,923 | $17,943,123 | $18,609,730 |
| Reinvestment of distributions | 97,289 | 40,416 | 2,722,139 | 884,297 |
| Shares redeemed | (269,048) | (566,967) | (7,822,579) | (12,817,995) |
| Net increase (decrease) | 431,522 | 197,372 | $12,842,683 | $6,676,032 |
| Class C | | | | |
| Shares sold | 413,933 | 492,379 | $11,627,457 | $11,952,885 |
| Reinvestment of distributions | 86,295 | 41,102 | 2,279,042 | 850,822 |
| Shares redeemed | (277,104) | (845,925) | (7,717,814) | (18,090,556) |
| Net increase (decrease) | 223,124 | (312,444) | $6,188,685 | $(5,286,849) |
| Class I | | | | |
| Shares sold | 2,018,073 | 3,715,913 | $63,406,254 | $99,892,222 |
| Reinvestment of distributions | 187,755 | 67,057 | 5,484,338 | 1,527,568 |
| Shares redeemed | (1,036,826) | (4,342,939) | (31,455,203) | (100,735,420) |
| Net increase (decrease) | 1,169,002 | (559,969) | $37,435,389 | $684,370 |
| Class Z | | | | |
| Shares sold | 1,458,657 | 1,013,230 | $45,206,174 | $26,606,909 |
| Reinvestment of distributions | 66,623 | 34,717 | 1,941,402 | 789,123 |
| Shares redeemed | (819,718) | (1,028,965) | (24,897,859) | (23,032,643) |
| Net increase (decrease) | 705,562 | 18,982 | $22,249,717 | $4,363,389 |
| Fidelity Advisor Health Care Fund | | | | |
| Class A | | | | |
| Shares sold | 2,128,177 | 5,308,631 | $142,636,293 | $348,242,413 |
| Reinvestment of distributions | 1,495,403 | 1,258,713 | 96,348,834 | 80,205,218 |
| Shares redeemed | (2,080,439) | (4,096,600) | (138,540,235) | (266,221,815) |
| Net increase (decrease) | 1,543,141 | 2,470,744 | $100,444,892 | $162,225,816 |
| Class M | | | | |
| Shares sold | 249,431 | 673,573 | $15,472,305 | $40,682,436 |
| Reinvestment of distributions | 424,496 | 359,459 | 25,096,220 | 21,182,904 |
| Shares redeemed | (417,976) | (942,777) | (25,629,337) | (56,902,516) |
| Net increase (decrease) | 255,951 | 90,255 | $14,939,188 | $4,962,824 |
| Class C | | | | |
| Shares sold | 653,098 | 2,054,175 | $33,655,653 | $103,378,959 |
| Reinvestment of distributions | 1,046,899 | 903,363 | 50,596,635 | 44,382,226 |
| Shares redeemed | (1,618,137) | (3,635,928) | (81,797,147) | (184,781,965) |
| Net increase (decrease) | 81,860 | (678,390) | $2,455,141 | $(37,020,780) |
| Class I | | | | |
| Shares sold | 5,675,036 | 16,464,289 | $415,935,013 | $1,172,808,851 |
| Reinvestment of distributions | 2,309,604 | 2,063,590 | 164,674,774 | 144,306,867 |
| Shares redeemed | (6,178,664) | (12,044,029) | (447,168,823) | (860,852,926) |
| Net increase (decrease) | 1,805,976 | 6,483,850 | $133,440,964 | $456,262,792 |
| Class Z | | | | |
| Shares sold | 2,205,611 | 5,525,911 | $160,729,640 | $396,687,588 |
| Reinvestment of distributions | 589,521 | 465,787 | 42,068,205 | 32,581,809 |
| Shares redeemed | (2,009,836) | (2,678,428) | (142,420,614) | (192,046,547) |
| Net increase (decrease) | 785,296 | 3,313,270 | $60,377,231 | $237,222,850 |
| Fidelity Advisor Industrials Fund | | | | |
| Class A | | | | |
| Shares sold | 336,645 | 1,076,584 | $14,303,795 | $45,468,071 |
| Reinvestment of distributions | 1,213,527 | 31,089 | 45,749,970 | 1,282,422 |
| Shares redeemed | (662,673) | (1,224,035) | (28,010,829) | (49,828,306) |
| Net increase (decrease) | 887,499 | (116,362) | $32,042,936 | $(3,077,813) |
| Class M | | | | |
| Shares sold | 87,310 | 206,166 | $3,700,323 | $8,359,636 |
| Reinvestment of distributions | 291,263 | 8,025 | 10,619,447 | 321,903 |
| Shares redeemed | (115,289) | (305,322) | (4,762,812) | (12,251,726) |
| Net increase (decrease) | 263,284 | (91,131) | $9,556,958 | $(3,570,187) |
| Class C | | | | |
| Shares sold | 52,505 | 294,036 | $1,914,815 | $10,618,840 |
| Reinvestment of distributions | 332,089 | 11,359 | 10,553,774 | 407,004 |
| Shares redeemed | (262,314) | (725,513) | (9,471,239) | (25,842,698) |
| Net increase (decrease) | 122,280 | (420,118) | $2,997,350 | $(14,816,854) |
| Class I | | | | |
| Shares sold | 916,889 | 3,168,353 | $41,355,703 | $136,049,117 |
| Reinvestment of distributions | 874,167 | 19,975 | 35,517,393 | 876,709 |
| Shares redeemed | (1,193,433) | (1,524,607) | (53,836,546) | (66,684,423) |
| Net increase (decrease) | 597,623 | 1,663,721 | $23,036,550 | $70,241,403 |
| Class Z | | | | |
| Shares sold | 288,915 | 750,481 | $12,883,218 | $33,098,948 |
| Reinvestment of distributions | 127,360 | 3,549 | 5,164,450 | 155,552 |
| Shares redeemed | (602,280) | (534,468) | (25,591,678) | (23,973,370) |
| Net increase (decrease) | (186,005) | 219,562 | $(7,544,010) | $9,281,130 |
| Fidelity Advisor Semiconductors Fund | | | | |
| Class A | | | | |
| Shares sold | 1,795,796 | 2,272,508 | $94,466,056 | $92,361,798 |
| Reinvestment of distributions | 305,158 | 209,688 | 16,570,062 | 7,894,748 |
| Shares redeemed | (725,354) | (1,139,468) | (36,710,226) | (44,250,742) |
| Net increase (decrease) | 1,375,600 | 1,342,728 | $74,325,892 | $56,005,804 |
| Class M | | | | |
| Shares sold | 200,331 | 264,285 | $10,140,765 | $10,045,601 |
| Reinvestment of distributions | 58,420 | 46,894 | 2,991,086 | 1,671,302 |
| Shares redeemed | (145,248) | (205,061) | (7,110,145) | (7,535,130) |
| Net increase (decrease) | 113,503 | 106,118 | $6,021,706 | $4,181,773 |
| Class C | | | | |
| Shares sold | 513,561 | 603,785 | $22,556,798 | $20,475,892 |
| Reinvestment of distributions | 126,023 | 112,361 | 5,653,413 | 3,542,734 |
| Shares redeemed | (278,094) | (758,704) | (11,807,943) | (24,960,249) |
| Net increase (decrease) | 361,490 | (42,558) | $16,402,268 | $(941,623) |
| Class I | | | | |
| Shares sold | 2,606,367 | 3,218,643 | $147,887,688 | $138,779,272 |
| Reinvestment of distributions | 250,734 | 170,390 | 14,570,164 | 6,832,623 |
| Shares redeemed | (1,489,053) | (2,173,312) | (83,757,362) | (89,960,875) |
| Net increase (decrease) | 1,368,048 | 1,215,721 | $78,700,490 | $55,651,020 |
| Class Z | | | | |
| Shares sold | 551,868 | 440,987 | $31,902,002 | $19,153,328 |
| Reinvestment of distributions | 35,604 | 11,859 | 2,067,182 | 474,851 |
| Shares redeemed | (159,385) | (158,845) | (8,826,565) | (6,852,204) |
| Net increase (decrease) | 428,087 | 294,001 | $25,142,619 | $12,775,975 |
| Fidelity Advisor Technology Fund | | | | |
| Class A | | | | |
| Shares sold | 1,401,547 | 3,227,692 | $144,565,381 | $287,807,384 |
| Reinvestment of distributions | 2,240,274 | 1,308,684 | 218,314,667 | 115,478,310 |
| Shares redeemed | (1,575,850) | (4,026,118) | (160,890,177) | (359,897,290) |
| Net increase (decrease) | 2,065,971 | 510,258 | $201,989,871 | $43,388,404 |
| Class M | | | | |
| Shares sold | 379,311 | 1,097,418 | $36,577,080 | $90,166,670 |
| Reinvestment of distributions | 907,716 | 530,803 | 81,358,571 | 43,573,593 |
| Shares redeemed | (528,121) | (1,566,784) | (49,470,219) | (129,813,793) |
| Net increase (decrease) | 758,906 | 61,437 | $68,465,432 | $3,926,470 |
| Class C | | | | |
| Shares sold | 309,343 | 926,376 | $25,056,573 | $65,390,790 |
| Reinvestment of distributions | 804,256 | 509,178 | 59,884,931 | 35,688,322 |
| Shares redeemed | (661,057) | (1,935,386) | (52,216,229) | (138,574,238) |
| Net increase (decrease) | 452,542 | (499,832) | $32,725,275 | $(37,495,126) |
| Class I | | | | |
| Shares sold | 1,772,363 | 4,485,105 | $201,860,243 | $437,609,448 |
| Reinvestment of distributions | 1,447,115 | 859,806 | 157,373,714 | 83,530,124 |
| Shares redeemed | (2,015,751) | (4,711,105) | (226,967,563) | (453,488,874) |
| Net increase (decrease) | 1,203,727 | 633,806 | $132,266,394 | $67,650,698 |
| Class Z | | | | |
| Shares sold | 855,214 | 2,665,827 | $97,881,870 | $261,760,082 |
| Reinvestment of distributions | 520,545 | 257,979 | 56,520,804 | 25,013,683 |
| Shares redeemed | (973,915) | (1,849,927) | (107,668,805) | (179,698,035) |
| Net increase (decrease) | 401,844 | 1,073,879 | $46,733,869 | $107,075,730 |
| Fidelity Advisor Utilities Fund | | | | |
| Class A | | | | |
| Shares sold | 659,139 | 1,125,170 | $23,935,998 | $37,451,800 |
| Reinvestment of distributions | 192,102 | 150,513 | 7,021,337 | 4,887,151 |
| Shares redeemed | (664,300) | (2,032,740) | (23,904,031) | (65,836,825) |
| Net increase (decrease) | 186,941 | (757,057) | $7,053,304 | $(23,497,874) |
| Class M | | | | |
| Shares sold | 74,454 | 192,689 | $2,688,609 | $6,319,115 |
| Reinvestment of distributions | 39,501 | 33,030 | 1,448,099 | 1,075,800 |
| Shares redeemed | (108,246) | (460,032) | (3,879,992) | (15,128,321) |
| Net increase (decrease) | 5,709 | (234,313) | $256,716 | $(7,733,406) |
| Class C | | | | |
| Shares sold | 129,014 | 244,717 | $4,513,530 | $7,862,719 |
| Reinvestment of distributions | 28,802 | 23,775 | 1,028,535 | 754,630 |
| Shares redeemed | (183,995) | (928,065) | (6,435,878) | (29,528,468) |
| Net increase (decrease) | (26,179) | (659,573) | $(893,813) | $(20,911,119) |
| Class I | | | | |
| Shares sold | 1,313,640 | 1,291,889 | $48,964,896 | $43,574,208 |
| Reinvestment of distributions | 120,516 | 110,504 | 4,509,703 | 3,670,947 |
| Shares redeemed | (583,460) | (3,326,028) | (21,490,211) | (109,800,472) |
| Net increase (decrease) | 850,696 | (1,923,635) | $31,984,388 | $(62,555,317) |
| Class Z | | | | |
| Shares sold | 718,200 | 776,806 | $26,955,766 | $25,983,383 |
| Reinvestment of distributions | 34,144 | 32,015 | 1,276,650 | 1,062,593 |
| Shares redeemed | (359,616) | (917,828) | (13,156,266) | (30,619,605) |
| Net increase (decrease) | 392,728 | (109,007) | $15,076,150 | $(3,573,629) |
12. Other.
A fund's organizational documents provide former and current trustees and officers with a limited indemnification against liabilities arising in connection with the performance of their duties to the fund. In the normal course of business, a fund may also enter into contracts that provide general indemnifications. A fund's maximum exposure under these arrangements is unknown as this would be dependent on future claims that may be made against a fund. The risk of material loss from such claims is considered remote.
13. Coronavirus (COVID-19) Pandemic.
An outbreak of COVID-19 first detected in China during December 2019 has since spread globally and was declared a pandemic by the World Health Organization during March 2020. Developments that disrupt global economies and financial markets, such as the COVID-19 pandemic, may magnify factors that affect the Funds' performance.
Shareholder Expense Example
As a shareholder, you incur two types of costs: (1) transaction costs, which may include sales charges (loads) on purchase payments or redemption proceeds, as applicable and (2) ongoing costs, which generally include management fees, distribution and/or service (12b-1) fees and other Fund expenses. This Example is intended to help you understand your ongoing costs (in dollars) of investing in a fund and to compare these costs with the ongoing costs of investing in other mutual funds.
The Example is based on an investment of $1,000 invested at the beginning of the period and held for the entire period (August 1, 2021 to January 31, 2022).
Actual Expenses
The first line of the accompanying table provides information about actual account values and actual expenses. You may use the information in this line, together with the amount you invested, to estimate the expenses that you paid over the period. Simply divide your account value by $1,000.00 (for example, an $8,600 account value divided by $1,000.00 = 8.6), then multiply the result by the number in the first line for a class/Fund under the heading entitled "Expenses Paid During Period" to estimate the expenses you paid on your account during this period. If any fund is a shareholder of any underlying mutual funds or exchange-traded funds (ETFs) (the Underlying Funds), such fund indirectly bears its proportional share of the expenses of the Underlying Funds in addition to the direct expenses incurred presented in the table. These fees and expenses are not included in the annualized expense ratio used to calculate the expense estimate in the table below.
Hypothetical Example for Comparison Purposes
The second line of the accompanying table provides information about hypothetical account values and hypothetical expenses based on the actual expense ratio and an assumed rate of return of 5% per year before expenses, which is not the actual return. The hypothetical account values and expenses may not be used to estimate the actual ending account balance or expenses you paid for the period. You may use this information to compare the ongoing costs of investing in the Fund and other funds. To do so, compare this 5% hypothetical example with the 5% hypothetical examples that appear in the shareholder reports of the other funds. If any fund is a shareholder of any Underlying Funds, such fund indirectly bears its proportional share of the expenses of the Underlying Funds in addition to the direct expenses as presented in the table. These fees and expenses are not included in the annualized expense ratio used to calculate the expense estimate in the table below.
Please note that the expenses shown in the table are meant to highlight your ongoing costs only and do not reflect any transaction costs. Therefore, the second line of the table is useful in comparing ongoing costs only, and will not help you determine the relative total costs of owning different funds. In addition, if these transactional costs were included, your costs would have been higher.
| | Annualized Expense Ratio-A | Beginning
Account Value
August 1, 2021 | Ending
Account Value
January 31, 2022 | Expenses Paid
During Period-B
August 1, 2021
to January 31, 2022 |
| Fidelity Advisor Biotechnology Fund | | | | |
| Class A | 1.00% | | | |
| Actual | | $1,000.00 | $873.10 | $4.72 |
| Hypothetical-C | | $1,000.00 | $1,020.16 | $5.09 |
| Class M | 1.27% | | | |
| Actual | | $1,000.00 | $872.00 | $5.99 |
| Hypothetical-C | | $1,000.00 | $1,018.80 | $6.46 |
| Class C | 1.74% | | | |
| Actual | | $1,000.00 | $870.30 | $8.20 |
| Hypothetical-C | | $1,000.00 | $1,016.43 | $8.84 |
| Class I | .73% | | | |
| Actual | | $1,000.00 | $874.60 | $3.45 |
| Hypothetical-C | | $1,000.00 | $1,021.53 | $3.72 |
| Class Z | .61% | | | |
| Actual | | $1,000.00 | $874.90 | $2.88 |
| Hypothetical-C | | $1,000.00 | $1,022.13 | $3.11 |
| Fidelity Advisor Consumer Discretionary Fund | | | | |
| Class A | 1.01% | | | |
| Actual | | $1,000.00 | $951.30 | $4.97 |
| Hypothetical-C | | $1,000.00 | $1,020.11 | $5.14 |
| Class M | 1.27% | | | |
| Actual | | $1,000.00 | $950.10 | $6.24 |
| Hypothetical-C | | $1,000.00 | $1,018.80 | $6.46 |
| Class C | 1.76% | | | |
| Actual | | $1,000.00 | $948.00 | $8.64 |
| Hypothetical-C | | $1,000.00 | $1,016.33 | $8.94 |
| Class I | .75% | | | |
| Actual | | $1,000.00 | $952.60 | $3.69 |
| Hypothetical-C | | $1,000.00 | $1,021.42 | $3.82 |
| Class Z | .62% | | | |
| Actual | | $1,000.00 | $953.40 | $3.05 |
| Hypothetical-C | | $1,000.00 | $1,022.08 | $3.16 |
| Fidelity Advisor Energy Fund | | | | |
| Class A | 1.07% | | | |
| Actual | | $1,000.00 | $1,392.30 | $6.45 |
| Hypothetical-C | | $1,000.00 | $1,019.81 | $5.45 |
| Class M | 1.34% | | | |
| Actual | | $1,000.00 | $1,390.40 | $8.07 |
| Hypothetical-C | | $1,000.00 | $1,018.45 | $6.82 |
| Class C | 1.80% | | | |
| Actual | | $1,000.00 | $1,387.40 | $10.83 |
| Hypothetical-C | | $1,000.00 | $1,016.13 | $9.15 |
| Class I | .76% | | | |
| Actual | | $1,000.00 | $1,394.60 | $4.59 |
| Hypothetical-C | | $1,000.00 | $1,021.37 | $3.87 |
| Class Z | .64% | | | |
| Actual | | $1,000.00 | $1,395.70 | $3.86 |
| Hypothetical-C | | $1,000.00 | $1,021.98 | $3.26 |
| Fidelity Advisor Financial Services Fund | | | | |
| Class A | 1.03% | | | |
| Actual | | $1,000.00 | $1,096.00 | $5.44 |
| Hypothetical-C | | $1,000.00 | $1,020.01 | $5.24 |
| Class M | 1.28% | | | |
| Actual | | $1,000.00 | $1,094.60 | $6.76 |
| Hypothetical-C | | $1,000.00 | $1,018.75 | $6.51 |
| Class C | 1.79% | | | |
| Actual | | $1,000.00 | $1,092.10 | $9.44 |
| Hypothetical-C | | $1,000.00 | $1,016.18 | $9.10 |
| Class I | .75% | | | |
| Actual | | $1,000.00 | $1,097.60 | $3.97 |
| Hypothetical-C | | $1,000.00 | $1,021.42 | $3.82 |
| Class Z | .64% | | | |
| Actual | | $1,000.00 | $1,097.90 | $3.38 |
| Hypothetical-C | | $1,000.00 | $1,021.98 | $3.26 |
| Fidelity Advisor Health Care Fund | | | | |
| Class A | .97% | | | |
| Actual | | $1,000.00 | $880.10 | $4.60 |
| Hypothetical-C | | $1,000.00 | $1,020.32 | $4.94 |
| Class M | 1.22% | | | |
| Actual | | $1,000.00 | $879.10 | $5.78 |
| Hypothetical-C | | $1,000.00 | $1,019.06 | $6.21 |
| Class C | 1.72% | | | |
| Actual | | $1,000.00 | $876.80 | $8.14 |
| Hypothetical-C | | $1,000.00 | $1,016.53 | $8.74 |
| Class I | .71% | | | |
| Actual | | $1,000.00 | $881.30 | $3.37 |
| Hypothetical-C | | $1,000.00 | $1,021.63 | $3.62 |
| Class Z | .59% | | | |
| Actual | | $1,000.00 | $881.90 | $2.80 |
| Hypothetical-C | | $1,000.00 | $1,022.23 | $3.01 |
| Fidelity Advisor Industrials Fund | | | | |
| Class A | 1.02% | | | |
| Actual | | $1,000.00 | $972.20 | $5.07 |
| Hypothetical-C | | $1,000.00 | $1,020.06 | $5.19 |
| Class M | 1.27% | | | |
| Actual | | $1,000.00 | $970.90 | $6.31 |
| Hypothetical-C | | $1,000.00 | $1,018.80 | $6.46 |
| Class C | 1.77% | | | |
| Actual | | $1,000.00 | $968.70 | $8.78 |
| Hypothetical-C | | $1,000.00 | $1,016.28 | $9.00 |
| Class I | .75% | | | |
| Actual | | $1,000.00 | $973.50 | $3.73 |
| Hypothetical-C | | $1,000.00 | $1,021.42 | $3.82 |
| Class Z | .63% | | | |
| Actual | | $1,000.00 | $974.00 | $3.13 |
| Hypothetical-C | | $1,000.00 | $1,022.03 | $3.21 |
| Fidelity Advisor Semiconductors Fund | | | | |
| Class A | 1.01% | | | |
| Actual | | $1,000.00 | $1,107.80 | $5.37 |
| Hypothetical-C | | $1,000.00 | $1,020.11 | $5.14 |
| Class M | 1.26% | | | |
| Actual | | $1,000.00 | $1,106.40 | $6.69 |
| Hypothetical-C | | $1,000.00 | $1,018.85 | $6.41 |
| Class C | 1.77% | | | |
| Actual | | $1,000.00 | $1,103.60 | $9.38 |
| Hypothetical-C | | $1,000.00 | $1,016.28 | $9.00 |
| Class I | .75% | | | |
| Actual | | $1,000.00 | $1,109.10 | $3.99 |
| Hypothetical-C | | $1,000.00 | $1,021.42 | $3.82 |
| Class Z | .63% | | | |
| Actual | | $1,000.00 | $1,109.90 | $3.35 |
| Hypothetical-C | | $1,000.00 | $1,022.03 | $3.21 |
| Fidelity Advisor Technology Fund | | | | |
| Class A | .96% | | | |
| Actual | | $1,000.00 | $1,009.90 | $4.86 |
| Hypothetical-C | | $1,000.00 | $1,020.37 | $4.89 |
| Class M | 1.21% | | | |
| Actual | | $1,000.00 | $1,008.50 | $6.13 |
| Hypothetical-C | | $1,000.00 | $1,019.11 | $6.16 |
| Class C | 1.73% | | | |
| Actual | | $1,000.00 | $1,006.00 | $8.75 |
| Hypothetical-C | | $1,000.00 | $1,016.48 | $8.79 |
| Class I | .71% | | | |
| Actual | | $1,000.00 | $1,011.20 | $3.60 |
| Hypothetical-C | | $1,000.00 | $1,021.63 | $3.62 |
| Class Z | .59% | | | |
| Actual | | $1,000.00 | $1,011.70 | $2.99 |
| Hypothetical-C | | $1,000.00 | $1,022.23 | $3.01 |
| Fidelity Advisor Utilities Fund | | | | |
| Class A | 1.02% | | | |
| Actual | | $1,000.00 | $1,085.10 | $5.36 |
| Hypothetical-C | | $1,000.00 | $1,020.06 | $5.19 |
| Class M | 1.30% | | | |
| Actual | | $1,000.00 | $1,083.30 | $6.83 |
| Hypothetical-C | | $1,000.00 | $1,018.65 | $6.61 |
| Class C | 1.78% | | | |
| Actual | | $1,000.00 | $1,080.40 | $9.33 |
| Hypothetical-C | | $1,000.00 | $1,016.23 | $9.05 |
| Class I | .75% | | | |
| Actual | | $1,000.00 | $1,086.20 | $3.94 |
| Hypothetical-C | | $1,000.00 | $1,021.42 | $3.82 |
| Class Z | .63% | | | |
| Actual | | $1,000.00 | $1,086.90 | $3.31 |
| Hypothetical-C | | $1,000.00 | $1,022.03 | $3.21 |
A Annualized expense ratio reflects expenses net of applicable fee waivers.
B Expenses are equal to the annualized expense ratio, multiplied by the average account value over the period, multiplied by 184/ 365 (to reflect the one-half year period). The fees and expenses of any Underlying Funds are not included in each annualized expense ratio.
C 5% return per year before expenses
AFOC-SANN-0422
1.700839.125