UNITED STATES
SECURITIES AND EXCHANGE COMMISSION
Washington, D.C. 20549
FORM N-CSR
CERTIFIED SHAREHOLDER REPORT OF REGISTERED
MANAGEMENT INVESTMENT COMPANIES
Investment Company Act file number 811-03010
Fidelity Advisor Series VII
(Exact name of registrant as specified in charter)
245 Summer St., Boston, MA 02210
(Address of principal executive offices) (Zip code)
Cynthia Lo Bessette, Secretary
245 Summer St.
Boston, Massachusetts 02210
(Name and address of agent for service)
Registrant's telephone number, including area code:
617-563-7000
| |
Date of fiscal year end: | July 31 |
|
|
Date of reporting period: | January 31, 2023 |
Item 1.
Reports to Stockholders
Fidelity Advisor Focus Funds®
Fidelity Advisor® Biotechnology Fund
Fidelity Advisor® Consumer Discretionary Fund
Fidelity Advisor® Energy Fund
Fidelity Advisor® Financial Services Fund
Fidelity Advisor® Health Care Fund
Fidelity Advisor® Industrials Fund
Fidelity Advisor® Semiconductors Fund
Fidelity Advisor® Technology Fund
Fidelity Advisor® Utilities Fund
(Fidelity Advisor® Financial Services Fund to be renamed Fidelity Advisor® Financials Fund effective April 28, 2023)
Semi-Annual Report
January 31, 2023
Contents
To view a fund's proxy voting guidelines and proxy voting record for the 12-month period ended June 30, visit http://www.fidelity.com/proxyvotingresults or visit the Securities and Exchange Commission's (SEC) web site at http://www.sec.gov.
You may also call 1-877-208-0098 to request a free copy of the proxy voting guidelines.
Standard & Poor's, S&P and S&P 500 are registered service marks of The McGraw-Hill Companies, Inc. and have been licensed for use by Fidelity Distributors Corporation.
Other third-party marks appearing herein are the property of their respective owners.
All other marks appearing herein are registered or unregistered trademarks or service marks of FMR LLC or an affiliated company. © 2023 FMR LLC. All rights reserved.
This report and the financial statements contained herein are submitted for the general information of the shareholders of the Funds. This report is not authorized for distribution to prospective investors in the Funds unless preceded or accompanied by an effective prospectus.
A fund files its complete schedule of portfolio holdings with the SEC for the first and third quarters of each fiscal year on Form N-PORT. Forms N-PORT are available on the SEC's web site at http://www.sec.gov. A fund's Forms N-PORT may be reviewed and copied at the SEC's Public Reference Room in Washington, DC. Information regarding the operation of the SEC's Public Reference Room may be obtained by calling 1-800-SEC-0330.
For a complete list of a fund's portfolio holdings, view the most recent holdings listing, semiannual report, or annual report on Fidelity's web site at http://www.fidelity.com, http://www.institutional.fidelity.com, or http://www.401k.com, as applicable.
NOT FDIC INSURED •MAY LOSE VALUE •NO BANK GUARANTEE
Neither the Funds nor Fidelity Distributors Corporation is a bank.
Top Holdings (% of Fund's net assets) |
| |
| AbbVie, Inc. | 18.0 | |
| Regeneron Pharmaceuticals, Inc. | 9.3 | |
| Vertex Pharmaceuticals, Inc. | 6.5 | |
| Alnylam Pharmaceuticals, Inc. | 4.5 | |
| Argenx SE ADR | 4.3 | |
| Ascendis Pharma A/S sponsored ADR | 3.5 | |
| Blueprint Medicines Corp. | 3.2 | |
| Cytokinetics, Inc. | 3.0 | |
| Xenon Pharmaceuticals, Inc. | 2.3 | |
| Gilead Sciences, Inc. | 2.3 | |
| | 56.9 | |
| |
| Industries (% of Fund's net assets) |
| |
| Biotechnology | 91.2 | |
| Pharmaceuticals | 8.3 | |
| Health Care Providers & Services | 0.2 | |
| Health Care Technology | 0.1 | |
| |
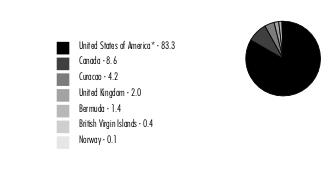
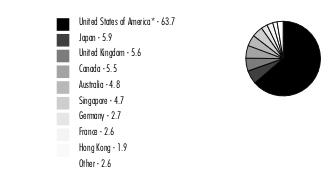
Geographic Diversification (% of Fund's net assets) |
|
* Includes Short-Term investments and Net Other Assets (Liabilities). Percentages are based on country or territory of incorporation and are adjusted for the effect of derivatives, if applicable. |
| |
Fidelity Advisor® Biotechnology Fund
Showing Percentage of Net Assets
| Common Stocks - 97.6% |
| | | Shares | Value ($) |
| Biotechnology - 89.5% | | | |
| Biotechnology - 89.5% | | | |
| AbbVie, Inc. | | 2,159,880 | 319,122,266 |
| Aerovate Therapeutics, Inc. (a)(b) | | 322,400 | 7,366,840 |
| Alkermes PLC (a) | | 484,200 | 13,867,488 |
| Alnylam Pharmaceuticals, Inc. (a) | | 350,686 | 79,395,310 |
| ALX Oncology Holdings, Inc. (a)(b) | | 1,191,906 | 11,084,726 |
| Amgen, Inc. | | 56,700 | 14,311,080 |
| Arcellx, Inc. | | 177,700 | 5,936,957 |
| Arcutis Biotherapeutics, Inc. (a)(b) | | 906,594 | 15,022,263 |
| Argenx SE ADR (a) | | 199,400 | 76,220,650 |
| Ascendis Pharma A/S sponsored ADR (a)(b) | | 506,125 | 62,799,990 |
| Astria Therapeutics, Inc. (a)(c) | | 1,411,190 | 19,403,863 |
| BioCryst Pharmaceuticals, Inc. (a) | | 884,000 | 9,326,200 |
| Biogen, Inc. (a) | | 30,400 | 8,843,360 |
| Biohaven Ltd. (a) | | 282,300 | 5,389,107 |
| Blueprint Medicines Corp. (a) | | 1,232,730 | 57,617,800 |
| Celldex Therapeutics, Inc. (a) | | 901,207 | 39,707,180 |
| Cerevel Therapeutics Holdings (a)(b) | | 613,338 | 20,945,493 |
| Cyteir Therapeutics, Inc. (a)(b) | | 1,419,670 | 2,172,095 |
| Cytokinetics, Inc. (a)(b) | | 1,273,471 | 54,097,048 |
| Day One Biopharmaceuticals, Inc. (a) | | 863,569 | 18,799,897 |
| Exact Sciences Corp. (a) | | 270,800 | 18,284,416 |
| Exelixis, Inc. (a) | | 1,824,200 | 32,142,404 |
| Fusion Pharmaceuticals, Inc. (a) | | 1,546,014 | 4,684,422 |
| Gilead Sciences, Inc. | | 484,900 | 40,702,506 |
| Icosavax, Inc. (a)(b) | | 1,907,714 | 20,126,383 |
| Instil Bio, Inc. (a)(b) | | 1,028,660 | 837,226 |
| Janux Therapeutics, Inc. (a)(b) | | 456,700 | 10,143,307 |
| Karuna Therapeutics, Inc. (a) | | 198,167 | 39,512,518 |
| Keros Therapeutics, Inc. (a) | | 599,500 | 35,112,715 |
| Madrigal Pharmaceuticals, Inc. (a) | | 18,100 | 5,217,325 |
| Monte Rosa Therapeutics, Inc. (a)(b) | | 698,958 | 5,172,289 |
| Moonlake Immunotherapeutics (a)(b) | | 185,500 | 2,216,725 |
| Morphic Holding, Inc. (a) | | 211,700 | 6,928,941 |
| Nuvalent, Inc. Class A (a)(b) | | 735,406 | 22,246,032 |
| ORIC Pharmaceuticals, Inc. (a)(b) | | 1,206,016 | 6,826,051 |
| PepGen, Inc. | | 697,100 | 10,888,702 |
| Poseida Therapeutics, Inc. (a) | | 482,846 | 3,360,608 |
| Prelude Therapeutics, Inc. (a)(b) | | 1,500,952 | 9,576,074 |
| Prothena Corp. PLC (a) | | 171,900 | 9,720,945 |
| PTC Therapeutics, Inc. (a) | | 486,440 | 22,322,732 |
| Regeneron Pharmaceuticals, Inc. (a) | | 216,992 | 164,581,922 |
| Relay Therapeutics, Inc. (a)(b) | | 360,400 | 7,734,184 |
| Sage Therapeutics, Inc. (a) | | 215,400 | 9,550,836 |
| Sarepta Therapeutics, Inc. (a) | | 71,500 | 8,935,355 |
| Scholar Rock Holding Corp. (a) | | 487,376 | 5,897,250 |
| Scholar Rock Holding Corp. warrants 12/31/25 (a)(d) | | 6,000 | 39,162 |
| Shattuck Labs, Inc. (a)(b) | | 706,434 | 2,945,830 |
| Stoke Therapeutics, Inc. (a)(b) | | 446,619 | 4,448,325 |
| Tango Therapeutics, Inc. (a) | | 1,530,891 | 10,103,881 |
| Tyra Biosciences, Inc. (a)(b) | | 730,700 | 7,760,034 |
| Vaxcyte, Inc. (a) | | 558,329 | 25,320,220 |
| Vera Therapeutics, Inc. (a)(b) | | 980,468 | 8,314,369 |
| Vertex Pharmaceuticals, Inc. (a) | | 356,227 | 115,096,944 |
| Verve Therapeutics, Inc. (a)(b) | | 630,594 | 14,346,014 |
| Viking Therapeutics, Inc. (a)(b) | | 547,600 | 4,796,976 |
| Xenon Pharmaceuticals, Inc. (a) | | 1,061,058 | 41,476,757 |
| Zentalis Pharmaceuticals, Inc. (a) | | 490,692 | 11,580,331 |
| | | | 1,590,380,324 |
| Pharmaceuticals - 8.1% | | | |
| Pharmaceuticals - 8.1% | | | |
| Acelyrin, Inc. (e) | | 1,343,629 | 8,357,507 |
| Acelyrin, Inc. rights (a)(e) | | 163,271 | 967,627 |
| Afferent Pharmaceuticals, Inc. rights 12/31/24 (a)(e) | | 1,915,787 | 2,145,681 |
| Arvinas Holding Co. LLC (a) | | 244,500 | 8,012,265 |
| Axsome Therapeutics, Inc. (a)(b) | | 237,500 | 17,812,500 |
| DICE Therapeutics, Inc. (a) | | 328,700 | 10,442,799 |
| Edgewise Therapeutics, Inc. (a) | | 1,459,200 | 14,927,616 |
| Enliven Therapeutics, Inc. (a)(c) | | 739,725 | 3,417,530 |
| Enliven Therapeutics, Inc. (c)(f) | | 2,110,376 | 8,774,943 |
| GH Research PLC (a)(b) | | 385,500 | 3,427,095 |
| Ikena Oncology, Inc. (a)(b)(c) | | 2,144,926 | 9,137,385 |
| Intra-Cellular Therapies, Inc. (a) | | 250,700 | 12,013,544 |
| Longboard Pharmaceuticals, Inc. (a)(b)(c) | | 968,917 | 4,127,586 |
| Pharvaris BV (a)(b) | | 372,633 | 3,353,697 |
| Terns Pharmaceuticals, Inc. (a)(b) | | 952,048 | 8,635,075 |
| Ventyx Biosciences, Inc. (a) | | 408,730 | 17,166,660 |
| Verona Pharma PLC ADR (a) | | 484,367 | 10,675,449 |
| | | | 143,394,959 |
| TOTAL COMMON STOCKS (Cost $1,261,692,455) | | | 1,733,775,283 |
| | | | |
| Convertible Preferred Stocks - 2.2% |
| | | Shares | Value ($) |
| Biotechnology - 1.7% | | | |
| Biotechnology - 1.7% | | | |
| Apogee Therapeutics Series B (d)(e) | | 1,039,132 | 3,433,874 |
| Bright Peak Therapeutics AG Series B (a)(d)(e) | | 1,920,122 | 5,645,159 |
| Dianthus Therapeutics, Inc. Series A (d)(e) | | 906,629 | 3,925,704 |
| Fog Pharmaceuticals, Inc. Series D (d)(e) | | 239,281 | 2,575,405 |
| LifeMine Therapeutics, Inc. Series C (d)(e) | | 1,950,028 | 3,588,052 |
| Sonoma Biotherapeutics, Inc.: | | | |
| Series B (a)(d)(e) | | 1,967,762 | 3,286,163 |
| Series B1 (a)(d)(e) | | 1,049,456 | 2,130,396 |
| T-Knife Therapeutics, Inc. Series B (a)(d)(e) | | 1,300,097 | 4,979,372 |
| Treeline Biosciences Series A (a)(d)(e) | | 47,600 | 400,316 |
| | | | 29,964,441 |
| Health Care Providers & Services - 0.2% | | | |
| Health Care Facilities - 0.2% | | | |
| Boundless Bio, Inc. Series B (a)(d)(e) | | 3,703,704 | 3,370,371 |
| Health Care Technology - 0.1% | | | |
| Health Care Technology - 0.1% | | | |
| Wugen, Inc. Series B (a)(d)(e) | | 580,277 | 3,029,046 |
| Pharmaceuticals - 0.2% | | | |
| Pharmaceuticals - 0.2% | | | |
| Afferent Pharmaceuticals, Inc. Series C (a)(d)(e) | | 1,915,787 | 19 |
| Aristea Therapeutics, Inc. Series B (a)(d)(e) | | 677,328 | 3,732,077 |
| | | | 3,732,096 |
| TOTAL CONVERTIBLE PREFERRED STOCKS (Cost $49,528,509) | | | 40,095,954 |
| | | | |
| Money Market Funds - 9.6% |
| | | Shares | Value ($) |
| Fidelity Cash Central Fund 4.38% (g) | | 12,408,387 | 12,410,869 |
| Fidelity Securities Lending Cash Central Fund 4.38% (g)(h) | | 157,427,085 | 157,442,828 |
| TOTAL MONEY MARKET FUNDS (Cost $169,849,574) | | | 169,853,697 |
| | | | |
| TOTAL INVESTMENT IN SECURITIES - 109.4% (Cost $1,481,070,538) | 1,943,724,934 |
NET OTHER ASSETS (LIABILITIES) - (9.4)% | (166,898,912) |
| NET ASSETS - 100.0% | 1,776,826,022 |
| | |
Legend
| (b) | Security or a portion of the security is on loan at period end. |
| (d) | Restricted securities (including private placements) - Investment in securities not registered under the Securities Act of 1933 (excluding 144A issues). At the end of the period, the value of restricted securities (excluding 144A issues) amounted to $40,135,116 or 2.3% of net assets. |
| (f) | Security or a portion of the security purchased on a delayed delivery or when-issued basis. |
| (g) | Affiliated fund that is generally available only to investment companies and other accounts managed by Fidelity Investments. The rate quoted is the annualized seven-day yield of the fund at period end. A complete unaudited listing of the fund's holdings as of its most recent quarter end is available upon request. In addition, each Fidelity Central Fund's financial statements are available on the SEC's website or upon request. |
| (h) | Investment made with cash collateral received from securities on loan. |
| Additional information on each restricted holding is as follows: |
| Security | Acquisition Date | Acquisition Cost ($) |
| Afferent Pharmaceuticals, Inc. Series C | 7/01/15 | 0 |
| | | |
| Apogee Therapeutics Series B | 11/15/22 | 3,433,874 |
| | | |
| Aristea Therapeutics, Inc. Series B | 10/06/20 - 7/27/21 | 3,734,584 |
| | | |
| Boundless Bio, Inc. Series B | 4/23/21 | 5,000,000 |
| | | |
| Bright Peak Therapeutics AG Series B | 5/14/21 | 7,499,997 |
| | | |
| Dianthus Therapeutics, Inc. Series A | 4/06/22 | 3,940,663 |
| | | |
| Fog Pharmaceuticals, Inc. Series D | 11/17/22 | 2,575,405 |
| | | |
| LifeMine Therapeutics, Inc. Series C | 2/15/22 | 3,971,408 |
| | | |
| Scholar Rock Holding Corp. warrants 12/31/25 | 6/17/22 | 0 |
| | | |
| Sonoma Biotherapeutics, Inc. Series B | 7/26/21 | 3,888,888 |
| | | |
| Sonoma Biotherapeutics, Inc. Series B1 | 7/26/21 | 3,111,112 |
| | | |
| T-Knife Therapeutics, Inc. Series B | 6/30/21 | 7,500,000 |
| | | |
| Treeline Biosciences Series A | 7/30/21 | 372,589 |
| | | |
| Wugen, Inc. Series B | 7/09/21 | 4,499,990 |
| | | |
Affiliated Central Funds
Fiscal year to date information regarding the Fund's investments in Fidelity Central Funds, including the ownership percentage, is presented below.
| Affiliate | Value, beginning of period ($) | Purchases ($) | Sales Proceeds ($) | Dividend Income ($) | Realized Gain (loss) ($) | Change in Unrealized appreciation (depreciation) ($) | Value, end of period ($) | % ownership, end of period |
| Fidelity Cash Central Fund 4.38% | 7,889,645 | 287,557,884 | 283,036,660 | 214,879 | - | - | 12,410,869 | 0.0% |
| Fidelity Securities Lending Cash Central Fund 4.38% | 195,515,949 | 392,411,762 | 430,484,883 | 947,916 | - | - | 157,442,828 | 0.5% |
| Total | 203,405,594 | 679,969,646 | 713,521,543 | 1,162,795 | - | - | 169,853,697 | |
| | | | | | | | | |
Amounts in the dividend income column in the above table include any capital gain distributions from underlying funds, which are presented in the corresponding line item in the Statement of Operations, if applicable.
Amount for Fidelity Securities Lending Cash Central Fund represents the income earned on investing cash collateral, less rebates paid to borrowers and any lending agent fees associated with the loan, plus any premium payments received for lending certain types of securities.
Amounts included in the purchases and sales proceeds columns may include in-kind transactions, if applicable.
Other Affiliated Issuers
An affiliated company is a company in which the Fund has ownership of at least 5% of the voting securities. Fiscal year to date transactions with companies which are or were affiliates are presented in the table below. Certain corporate actions, such as mergers, are excluded from the amounts in this table if applicable. A dash in the Value end of period ($) column means either the issuer is no longer held at period end, or the issuer is held at period end but is no longer an affiliate.
| Affiliate | Value, beginning of period ($) | Purchases ($) | Sales Proceeds ($) | Dividend Income ($) | Realized Gain (loss) ($) | Change in Unrealized appreciation (depreciation) ($) | Value, end of period ($) |
| Astria Therapeutics, Inc. | 1,547,525 | 13,000,003 | 1,436,842 | - | 504,461 | 5,788,716 | 19,403,863 |
| Enliven Therapeutics, Inc. | - | 2,958,666 | - | - | - | 458,864 | 3,417,530 |
| Enliven Therapeutics, Inc. | - | 8,105,912 | - | - | - | 669,031 | 8,774,943 |
| Ikena Oncology, Inc. | 5,294,759 | 2,643,313 | - | - | - | 1,199,313 | 9,137,385 |
| Longboard Pharmaceuticals, Inc. | 1,743,340 | 2,284,259 | - | - | - | 99,987 | 4,127,586 |
| Total | 8,585,624 | 28,992,153 | 1,436,842 | - | 504,461 | 8,215,911 | 44,861,307 |
Amounts included in the purchases and sales proceeds columns may include in-kind transactions, if applicable.
Investment Valuation
The following is a summary of the inputs used, as of January 31, 2023, involving the Fund's assets and liabilities carried at fair value. The inputs or methodology used for valuing securities may not be an indication of the risk associated with investing in those securities. For more information on valuation inputs, and their aggregation into the levels used below, please refer to the Investment Valuation section in the accompanying Notes to Financial Statements.
| Valuation Inputs at Reporting Date: |
| Description | Total ($) | Level 1 ($) | Level 2 ($) | Level 3 ($) |
Investments in Securities: | | | | |
|
| Common Stocks | 1,733,775,283 | 1,713,490,363 | 8,814,105 | 11,470,815 |
|
| Convertible Preferred Stocks | 40,095,954 | - | - | 40,095,954 |
|
| Money Market Funds | 169,853,697 | 169,853,697 | - | - |
| Total Investments in Securities: | 1,943,724,934 | 1,883,344,060 | 8,814,105 | 51,566,769 |
The following is a reconciliation of Investments in Securities for which Level 3 inputs were used in determining value:
| |
| Investments in Securities: | |
| Convertible Preferred Stocks | | | |
| Beginning Balance | $ | 36,066,970 | |
| Net Realized Gain (Loss) on Investment Securities | | - | |
| Net Unrealized Gain (Loss) on Investment Securities | | 2,703,402 | |
| Cost of Purchases | | 6,009,279 | |
| Proceeds of Sales | | - | |
| Amortization/Accretion | | - | |
| Transfers into Level 3 | | - | |
| Transfers out of Level 3 | | (4,683,697) | |
| Ending Balance | $ | 40,095,954 | |
| The change in unrealized gain (loss) for the period attributable to Level 3 securities held at January 31, 2023 | $ | 2,703,402 | |
| Other Investments in Securities | | | |
| Beginning Balance | $ | 1,800,841 | |
| Net Realized Gain (Loss) on Investment Securities | | (3) | |
| Net Unrealized Gain (Loss) on Investment Securities | | 4,986,280 | |
| Cost of Purchases | | - | |
| Proceeds of Sales | | - | |
| Amortization/Accretion | | - | |
| Transfers into Level 3 | | 4,683,697 | |
| Transfers out of Level 3 | | - | |
| Ending Balance | $ | 11,470,815 | |
| The change in unrealized gain (loss) for the period attributable to Level 3 securities held at January 31, 2023 | $ | 4,986,278 | |
| The information used in the above reconciliation represents fiscal year to date activity for any Investments in Securities identified as using Level 3 inputs at either the beginning or the end of the current fiscal period. Cost of purchases and proceeds of sales may include securities received and/or delivered through in-kind transactions. Transfers into Level 3 were attributable to a lack of observable market data resulting from decreases in market activity, decreases in liquidity, security restructurings or corporate actions. Transfers out of Level 3 were attributable to observable market data becoming available for those securities. Transfers in or out of Level 3 represent the beginning value of any Security or Instrument where a change in the pricing level occurred from the beginning to the end of the period. The cost of purchases and the proceeds of sales may include securities received or delivered through corporate actions or exchanges. Realized and unrealized gains (losses) disclosed in the reconciliation are included in Net Gain (Loss) on the Fund's Statement of Operations. | |
Fidelity Advisor® Biotechnology Fund
| Statement of Assets and Liabilities |
| | | | January 31, 2023 (Unaudited) |
| | | | | |
| Assets | | | | |
| Investment in securities, at value (including securities loaned of $158,019,783) - See accompanying schedule: | | | | |
Unaffiliated issuers (cost $1,255,729,661) | $ | 1,729,009,930 | | |
Fidelity Central Funds (cost $169,849,574) | | 169,853,697 | | |
Other affiliated issuers (cost $55,491,303) | | 44,861,307 | | |
| | | | | |
| | | | | |
| Total Investment in Securities (cost $1,481,070,538) | | | $ | 1,943,724,934 |
| Receivable for investments sold | | | | 208,912 |
| Receivable for fund shares sold | | | | 302,448 |
| Dividends receivable | | | | 3,196,623 |
| Distributions receivable from Fidelity Central Funds | | | | 151,503 |
| Prepaid expenses | | | | 8,677 |
Total assets | | | | 1,947,593,097 |
| Liabilities | | | | |
| Payable to custodian bank | $ | 23,428 | | |
| Payable for investments purchased | | | | |
Regular delivery | | 1,271,616 | | |
Delayed delivery | | 8,105,912 | | |
| Payable for fund shares redeemed | | 2,514,379 | | |
| Accrued management fee | | 772,816 | | |
| Distribution and service plan fees payable | | 321,753 | | |
| Other affiliated payables | | 301,889 | | |
| Other payables and accrued expenses | | 45,557 | | |
| Collateral on securities loaned | | 157,409,725 | | |
| Total Liabilities | | | | 170,767,075 |
| Net Assets | | | $ | 1,776,826,022 |
| Net Assets consist of: | | | | |
| Paid in capital | | | $ | 1,451,276,946 |
| Total accumulated earnings (loss) | | | | 325,549,076 |
| Net Assets | | | $ | 1,776,826,022 |
| | | | | |
| Net Asset Value and Maximum Offering Price | | | | |
| Class A : | | | | |
Net Asset Value and redemption price per share ($663,033,067 ÷ 26,221,216 shares) (a) | | | $ | 25.29 |
| Maximum offering price per share (100/94.25 of $25.29) | | | $ | 26.83 |
| Class M : | | | | |
Net Asset Value and redemption price per share ($122,360,148 ÷ 5,285,032 shares) (a) | | | $ | 23.15 |
| Maximum offering price per share (100/96.50 of $23.15) | | | $ | 23.99 |
| Class C : | | | | |
Net Asset Value and offering price per share ($159,808,401 ÷ 8,080,705 shares) (a) | | | $ | 19.78 |
| Class I : | | | | |
Net Asset Value , offering price and redemption price per share ($774,855,454 ÷ 28,059,468 shares) | | | $ | 27.61 |
| Class Z : | | | | |
Net Asset Value , offering price and redemption price per share ($56,768,952 ÷ 2,050,200 shares) | | | $ | 27.69 |
(a)Redemption price per share is equal to net asset value less any applicable contingent deferred sales charge. |
| Statement of Operations |
| | | | Six months ended January 31, 2023 (Unaudited) |
| Investment Income | | | | |
| Dividends | | | $ | 7,538,716 |
| Income from Fidelity Central Funds (including $947,916 from security lending) | | | | 1,162,795 |
| Total Income | | | | 8,701,511 |
| Expenses | | | | |
| Management fee | $ | 4,654,194 | | |
| Transfer agent fees | | 1,584,951 | | |
| Distribution and service plan fees | | 1,975,043 | | |
| Accounting fees | | 240,324 | | |
| Custodian fees and expenses | | 26,080 | | |
| Independent trustees' fees and expenses | | 3,066 | | |
| Registration fees | | 79,621 | | |
| Audit | | 36,801 | | |
| Legal | | 2,236 | | |
| Miscellaneous | | 7,350 | | |
| Total expenses before reductions | | 8,609,666 | | |
| Expense reductions | | (35,125) | | |
| Total expenses after reductions | | | | 8,574,541 |
| Net Investment income (loss) | | | | 126,970 |
| Realized and Unrealized Gain (Loss) | | | | |
| Net realized gain (loss) on: | | | | |
| Investment Securities: | | | | |
| Unaffiliated issuers | | (19,930,173) | | |
| Affiliated issuers | | 504,461 | | |
| Total net realized gain (loss) | | | | (19,425,712) |
| Change in net unrealized appreciation (depreciation) on: | | | | |
| Investment Securities: | | | | |
| Unaffiliated issuers | | 251,366,843 | | |
| Affiliated issuers | | 8,215,911 | | |
| Total change in net unrealized appreciation (depreciation) | | | | 259,582,754 |
| Net gain (loss) | | | | 240,157,042 |
| Net increase (decrease) in net assets resulting from operations | | | $ | 240,284,012 |
| Statement of Changes in Net Assets |
| |
| | Six months ended January 31, 2023 (Unaudited) | | Year ended July 31, 2022 |
| Increase (Decrease) in Net Assets | | | | |
| Operations | | | | |
| Net investment income (loss) | $ | 126,970 | $ | (4,304,003) |
| Net realized gain (loss) | | (19,425,712) | | (9,400,446) |
| Change in net unrealized appreciation (depreciation) | | 259,582,754 | | (408,605,977) |
| Net increase (decrease) in net assets resulting from operations | | 240,284,012 | | (422,310,426) |
| Distributions to shareholders | | - | | (389,242,813) |
| Share transactions - net increase (decrease) | | (96,789,209) | | (72,894,135) |
| Total increase (decrease) in net assets | | 143,494,803 | | (884,447,374) |
| | | | | |
| Net Assets | | | | |
| Beginning of period | | 1,633,331,219 | | 2,517,778,593 |
| End of period | $ | 1,776,826,022 | $ | 1,633,331,219 |
| | | | | |
| | | | | |
Financial Highlights
| Fidelity Advisor® Biotechnology Fund Class A |
| |
| | Six months ended (Unaudited) January 31, 2023 | | Years ended July 31, 2022 | | 2021 | | 2020 | | 2019 | | 2018 |
Selected Per-Share Data | | | | | | | | | | | | |
| Net asset value, beginning of period | $ | 22.00 | $ | 32.58 | $ | 31.03 | $ | 25.48 | $ | 27.80 | $ | 24.45 |
| Income from Investment Operations | | | | | | | | | | | | |
Net investment income (loss) A,B | | - C | | (.06) | | .07 | | .03 | | .03 | | (.14) |
| Net realized and unrealized gain (loss) | | 3.29 | | (5.16) | | 4.42 | | 7.40 | | (1.76) | | 3.49 |
| Total from investment operations | | 3.29 | | (5.22) | | 4.49 | | 7.43 | | (1.73) | | 3.35 |
| Distributions from net investment income | | - | | (.11) | | (.13) | | - | | - | | - |
| Distributions from net realized gain | | - | | (5.25) | | (2.81) | | (1.88) | | (.59) | | - |
| Total distributions | | - | | (5.36) | | (2.94) | | (1.88) | | (.59) | | - |
| Net asset value, end of period | $ | 25.29 | $ | 22.00 | $ | 32.58 | $ | 31.03 | $ | 25.48 | $ | 27.80 |
Total Return D,E,F | | 14.95% | | (18.95)% | | 14.03% | | 30.00% | | (6.17)% | | 13.70% |
Ratios to Average Net Assets B,G,H | | | | | | | | | | | | |
| Expenses before reductions | | 1.01% I | | 1.00% | | 1.01% | | 1.02% | | 1.04% | | 1.06% |
| Expenses net of fee waivers, if any | | 1.01% I | | 1.00% | | 1.00% | | 1.02% | | 1.03% | | 1.06% |
| Expenses net of all reductions | | 1.01% I | | 1.00% | | 1.00% | | 1.02% | | 1.03% | | 1.06% |
| Net investment income (loss) | | (.02)% I | | (.23)% | | .20% | | .11% | | .13% | | (.53)% |
| Supplemental Data | | | | | | | | | | | | |
| Net assets, end of period (000 omitted) | $ | 663,033 | $ | 594,911 | $ | 808,610 | $ | 722,896 | $ | 616,894 | $ | 766,303 |
Portfolio turnover rate J | | 70% I | | 43% | | 72% | | 66% | | 62% | | 45% |
A Calculated based on average shares outstanding during the period.
B Net investment income (loss) is affected by the timing of the declaration of dividends by any underlying mutual funds or exchange-traded funds (ETFs). Net investment income (loss) of any mutual funds or ETFs is not included in the Fund's net investment income (loss) ratio.
C Amount represents less than $.005 per share.
D Total returns for periods of less than one year are not annualized.
E Total returns would have been lower if certain expenses had not been reduced during the applicable periods shown.
F Total returns do not include the effect of the sales charges.
G Fees and expenses of any underlying mutual funds or exchange-traded funds (ETFs) are not included in the Fund's expense ratio. The Fund indirectly bears its proportionate share of these expenses. For additional expense information related to investments in Fidelity Central Funds, please refer to the "Investments in Fidelity Central Funds" note found in the Notes to Financial Statements section of the most recent Annual or Semi-Annual report.
H Expense ratios reflect operating expenses of the class. Expenses before reductions do not reflect amounts reimbursed, waived, or reduced through arrangements with the investment adviser, brokerage services, or other offset arrangements, if applicable, and do not represent the amount paid by the class during periods when reimbursements, waivers or reductions occur.
I Annualized.
J Amount does not include the portfolio activity of any underlying mutual funds or exchange-traded funds (ETFs).
| Fidelity Advisor® Biotechnology Fund Class M |
| |
| | Six months ended (Unaudited) January 31, 2023 | | Years ended July 31, 2022 | | 2021 | | 2020 | | 2019 | | 2018 |
Selected Per-Share Data | | | | | | | | | | | | |
| Net asset value, beginning of period | $ | 20.17 | $ | 30.35 | $ | 29.08 | $ | 24.02 | $ | 26.32 | $ | 23.22 |
| Income from Investment Operations | | | | | | | | | | | | |
Net investment income (loss) A,B | | (.03) | | (.13) | | (.02) | | (.05) | | (.04) | | (.21) |
| Net realized and unrealized gain (loss) | | 3.01 | | (4.73) | | 4.14 | | 6.96 | | (1.67) | | 3.31 |
| Total from investment operations | | 2.98 | | (4.86) | | 4.12 | | 6.91 | | (1.71) | | 3.10 |
| Distributions from net investment income | | - | | (.07) | | (.07) | | - | | - | | - |
| Distributions from net realized gain | | - | | (5.25) | | (2.78) | | (1.85) | | (.59) | | - |
| Total distributions | | - | | (5.32) | | (2.85) | | (1.85) | | (.59) | | - |
| Net asset value, end of period | $ | 23.15 | $ | 20.17 | $ | 30.35 | $ | 29.08 | $ | 24.02 | $ | 26.32 |
Total Return C,D,E | | 14.77% | | (19.18)% | | 13.69% | | 29.64% | | (6.44)% | | 13.35% |
Ratios to Average Net Assets B,F,G | | | | | | | | | | | | |
| Expenses before reductions | | 1.29% H | | 1.28% | | 1.28% | | 1.32% | | 1.34% | | 1.38% |
| Expenses net of fee waivers, if any | | 1.29% H | | 1.28% | | 1.28% | | 1.32% | | 1.34% | | 1.38% |
| Expenses net of all reductions | | 1.28% H | | 1.28% | | 1.28% | | 1.31% | | 1.34% | | 1.38% |
| Net investment income (loss) | | (.30)% H | | (.51)% | | (.07)% | | (.18)% | | (.18)% | | (.84)% |
| Supplemental Data | | | | | | | | | | | | |
| Net assets, end of period (000 omitted) | $ | 122,360 | $ | 109,815 | $ | 161,619 | $ | 144,568 | $ | 119,312 | $ | 135,879 |
Portfolio turnover rate I | | 70% H | | 43% | | 72% | | 66% | | 62% | | 45% |
A Calculated based on average shares outstanding during the period.
B Net investment income (loss) is affected by the timing of the declaration of dividends by any underlying mutual funds or exchange-traded funds (ETFs). Net investment income (loss) of any mutual funds or ETFs is not included in the Fund's net investment income (loss) ratio.
C Total returns for periods of less than one year are not annualized.
D Total returns would have been lower if certain expenses had not been reduced during the applicable periods shown.
E Total returns do not include the effect of the sales charges.
F Fees and expenses of any underlying mutual funds or exchange-traded funds (ETFs) are not included in the Fund's expense ratio. The Fund indirectly bears its proportionate share of these expenses. For additional expense information related to investments in Fidelity Central Funds, please refer to the "Investments in Fidelity Central Funds" note found in the Notes to Financial Statements section of the most recent Annual or Semi-Annual report.
G Expense ratios reflect operating expenses of the class. Expenses before reductions do not reflect amounts reimbursed, waived, or reduced through arrangements with the investment adviser, brokerage services, or other offset arrangements, if applicable, and do not represent the amount paid by the class during periods when reimbursements, waivers or reductions occur.
H Annualized.
I Amount does not include the portfolio activity of any underlying mutual funds or exchange-traded funds (ETFs).
| Fidelity Advisor® Biotechnology Fund Class C |
| |
| | Six months ended (Unaudited) January 31, 2023 | | Years ended July 31, 2022 | | 2021 | | 2020 | | 2019 | | 2018 |
Selected Per-Share Data | | | | | | | | | | | | |
| Net asset value, beginning of period | $ | 17.27 | $ | 26.79 | $ | 25.97 | $ | 21.71 | $ | 23.96 | $ | 21.23 |
| Income from Investment Operations | | | | | | | | | | | | |
Net investment income (loss) A,B | | (.07) | | (.21) | | (.15) | | (.15) | | (.14) | | (.29) |
| Net realized and unrealized gain (loss) | | 2.58 | | (4.07) | �� | 3.71 | | 6.26 | | (1.52) | | 3.02 |
| Total from investment operations | | 2.51 | | (4.28) | | 3.56 | | 6.11 | | (1.66) | | 2.73 |
| Distributions from net investment income | | - | | - | | (.01) | | - | | - | | - |
| Distributions from net realized gain | | - | | (5.24) | | (2.73) | | (1.85) | | (.59) | | - |
| Total distributions | | - | | (5.24) | | (2.74) | | (1.85) | | (.59) | | - |
| Net asset value, end of period | $ | 19.78 | $ | 17.27 | $ | 26.79 | $ | 25.97 | $ | 21.71 | $ | 23.96 |
Total Return C,D,E | | 14.53% | | (19.54)% | | 13.15% | | 29.07% | | (6.87)% | | 12.86% |
Ratios to Average Net Assets B,F,G | | | | | | | | | | | | |
| Expenses before reductions | | 1.77% H | | 1.75% | | 1.75% | | 1.77% | | 1.78% | | 1.80% |
| Expenses net of fee waivers, if any | | 1.76% H | | 1.74% | | 1.75% | | 1.77% | | 1.77% | | 1.80% |
| Expenses net of all reductions | | 1.76% H | | 1.74% | | 1.75% | | 1.76% | | 1.77% | | 1.80% |
| Net investment income (loss) | | (.78)% H | | (.97)% | | (.55)% | | (.63)% | | (.61)% | | (1.27)% |
| Supplemental Data | | | | | | | | | | | | |
| Net assets, end of period (000 omitted) | $ | 159,808 | $ | 168,797 | $ | 328,417 | $ | 384,420 | $ | 398,749 | $ | 558,420 |
Portfolio turnover rate I | | 70% H | | 43% | | 72% | | 66% | | 62% | | 45% |
A Calculated based on average shares outstanding during the period.
B Net investment income (loss) is affected by the timing of the declaration of dividends by any underlying mutual funds or exchange-traded funds (ETFs). Net investment income (loss) of any mutual funds or ETFs is not included in the Fund's net investment income (loss) ratio.
C Total returns for periods of less than one year are not annualized.
D Total returns would have been lower if certain expenses had not been reduced during the applicable periods shown.
E Total returns do not include the effect of the contingent deferred sales charge.
F Fees and expenses of any underlying mutual funds or exchange-traded funds (ETFs) are not included in the Fund's expense ratio. The Fund indirectly bears its proportionate share of these expenses. For additional expense information related to investments in Fidelity Central Funds, please refer to the "Investments in Fidelity Central Funds" note found in the Notes to Financial Statements section of the most recent Annual or Semi-Annual report.
G Expense ratios reflect operating expenses of the class. Expenses before reductions do not reflect amounts reimbursed, waived, or reduced through arrangements with the investment adviser, brokerage services, or other offset arrangements, if applicable, and do not represent the amount paid by the class during periods when reimbursements, waivers or reductions occur.
H Annualized.
I Amount does not include the portfolio activity of any underlying mutual funds or exchange-traded funds (ETFs).
| Fidelity Advisor® Biotechnology Fund Class I |
| |
| | Six months ended (Unaudited) January 31, 2023 | | Years ended July 31, 2022 | | 2021 | | 2020 | | 2019 | | 2018 |
Selected Per-Share Data | | | | | | | | | | | | |
| Net asset value, beginning of period | $ | 23.99 | $ | 35.00 | $ | 33.16 | $ | 27.08 | $ | 29.42 | $ | 25.80 |
| Income from Investment Operations | | | | | | | | | | | | |
Net investment income (loss) A,B | | .03 | | .01 | | .17 | | .11 | | .11 | | (.07) |
| Net realized and unrealized gain (loss) | | 3.59 | | (5.61) | | 4.72 | | 7.88 | | (1.86) | | 3.69 |
| Total from investment operations | | 3.62 | | (5.60) | | 4.89 | | 7.99 | | (1.75) | | 3.62 |
| Distributions from net investment income | | - | | (.16) | | (.21) | | - | | - | | - |
| Distributions from net realized gain | | - | | (5.25) | | (2.85) | | (1.91) | | (.59) | | - |
| Total distributions | | - | | (5.41) | | (3.05) C | | (1.91) | | (.59) | | - |
| Net asset value, end of period | $ | 27.61 | $ | 23.99 | $ | 35.00 | $ | 33.16 | $ | 27.08 | $ | 29.42 |
Total Return D,E | | 15.09% | | (18.74)% | | 14.34% | | 30.32% | | (5.89)% | | 14.03% |
Ratios to Average Net Assets B,F,G | | | | | | | | | | | | |
| Expenses before reductions | | .74% H | | .73% | | .74% | | .75% | | .76% | | .79% |
| Expenses net of fee waivers, if any | | .74% H | | .73% | | .74% | | .75% | | .76% | | .79% |
| Expenses net of all reductions | | .74% H | | .73% | | .74% | | .75% | | .76% | | .79% |
| Net investment income (loss) | | .25% H | | .04% | | .47% | | .38% | | .40% | | (.26)% |
| Supplemental Data | | | | | | | | | | | | |
| Net assets, end of period (000 omitted) | $ | 774,855 | $ | 697,079 | $ | 1,129,492 | $ | 1,092,145 | $ | 1,006,084 | $ | 1,307,833 |
Portfolio turnover rate I | | 70% H | | 43% | | 72% | | 66% | | 62% | | 45% |
A Calculated based on average shares outstanding during the period.
B Net investment income (loss) is affected by the timing of the declaration of dividends by any underlying mutual funds or exchange-traded funds (ETFs). Net investment income (loss) of any mutual funds or ETFs is not included in the Fund's net investment income (loss) ratio.
C Total distributions per share do not sum due to rounding.
D Total returns for periods of less than one year are not annualized.
E Total returns would have been lower if certain expenses had not been reduced during the applicable periods shown.
F Fees and expenses of any underlying mutual funds or exchange-traded funds (ETFs) are not included in the Fund's expense ratio. The Fund indirectly bears its proportionate share of these expenses. For additional expense information related to investments in Fidelity Central Funds, please refer to the "Investments in Fidelity Central Funds" note found in the Notes to Financial Statements section of the most recent Annual or Semi-Annual report.
G Expense ratios reflect operating expenses of the class. Expenses before reductions do not reflect amounts reimbursed, waived, or reduced through arrangements with the investment adviser, brokerage services, or other offset arrangements, if applicable, and do not represent the amount paid by the class during periods when reimbursements, waivers or reductions occur.
H Annualized.
I Amount does not include the portfolio activity of any underlying mutual funds or exchange-traded funds (ETFs).
| Fidelity Advisor® Biotechnology Fund Class Z |
| |
| | Six months ended (Unaudited) January 31, 2023 | | Years ended July 31, 2022 | | 2021 | | 2020 | | 2019 A |
Selected Per-Share Data | | | | | | | | | | |
| Net asset value, beginning of period | $ | 24.04 | $ | 35.05 | $ | 33.22 | $ | 27.10 | $ | 30.06 |
| Income from Investment Operations | | | | | | | | | | |
Net investment income (loss) B,C | | .05 | | .05 | | .21 | | .15 | | .16 |
| Net realized and unrealized gain (loss) | | 3.60 | | (5.62) | | 4.74 | | 7.90 | | (2.53) |
| Total from investment operations | | 3.65 | | (5.57) | | 4.95 | | 8.05 | | (2.37) |
| Distributions from net investment income | | - | | (.19) | | (.26) | | (.02) | | - |
| Distributions from net realized gain | | - | | (5.25) | | (2.87) | | (1.91) | | (.59) |
| Total distributions | | - | | (5.44) | | (3.12) D | | (1.93) | | (.59) |
| Net asset value, end of period | $ | 27.69 | $ | 24.04 | $ | 35.05 | $ | 33.22 | $ | 27.10 |
Total Return E,F | | 15.18% | | (18.63)% | | 14.49% | | 30.53% | | (7.83)% |
Ratios to Average Net Assets C,G,H | | | | | | | | | | |
| Expenses before reductions | | .61% I | | .61% | | .61% | | .62% | | .63% I |
| Expenses net of fee waivers, if any | | .61% I | | .60% | | .61% | | .62% | | .63% I |
| Expenses net of all reductions | | .61% I | | .60% | | .61% | | .62% | | .62% I |
| Net investment income (loss) | | .38% I | | .16% | | .60% | | .51% | | .73% I |
| Supplemental Data | | | | | | | | | | |
| Net assets, end of period (000 omitted) | $ | 56,769 | $ | 62,729 | $ | 89,641 | $ | 62,743 | $ | 30,116 |
Portfolio turnover rate J | | 70% I | | 43% | | 72% | | 66% | | 62% |
A For the period October 2, 2018 (commencement of sale of shares) through July 31, 2019.
B Calculated based on average shares outstanding during the period.
C Net investment income (loss) is affected by the timing of the declaration of dividends by any underlying mutual funds or exchange-traded funds (ETFs). Net investment income (loss) of any mutual funds or ETFs is not included in the Fund's net investment income (loss) ratio.
D Total distributions per share do not sum due to rounding.
E Total returns for periods of less than one year are not annualized.
F Total returns would have been lower if certain expenses had not been reduced during the applicable periods shown.
G Fees and expenses of any underlying mutual funds or exchange-traded funds (ETFs) are not included in the Fund's expense ratio. The Fund indirectly bears its proportionate share of these expenses. For additional expense information related to investments in Fidelity Central Funds, please refer to the "Investments in Fidelity Central Funds" note found in the Notes to Financial Statements section of the most recent Annual or Semi-Annual report.
H Expense ratios reflect operating expenses of the class. Expenses before reductions do not reflect amounts reimbursed, waived, or reduced through arrangements with the investment adviser, brokerage services, or other offset arrangements, if applicable, and do not represent the amount paid by the class during periods when reimbursements, waivers or reductions occur.
I Annualized.
J Amount does not include the portfolio activity of any underlying mutual funds or exchange-traded funds (ETFs).
Top Holdings (% of Fund's net assets) |
| |
| Amazon.com, Inc. | 22.4 | |
| Tesla, Inc. | 10.2 | |
| The Home Depot, Inc. | 5.2 | |
| Lowe's Companies, Inc. | 4.7 | |
| NIKE, Inc. Class B | 4.2 | |
| TJX Companies, Inc. | 3.9 | |
| Hilton Worldwide Holdings, Inc. | 2.8 | |
| Booking Holdings, Inc. | 2.5 | |
| Target Corp. | 2.2 | |
| Dick's Sporting Goods, Inc. | 2.1 | |
| | 60.2 | |
| |
| Industries (% of Fund's net assets) |
| |
| Internet & Direct Marketing Retail | 23.2 | |
| Specialty Retail | 21.8 | |
| Hotels, Restaurants & Leisure | 17.8 | |
| Textiles, Apparel & Luxury Goods | 13.8 | |
| Automobiles | 10.6 | |
| Multiline Retail | 6.7 | |
| Household Durables | 2.9 | |
| Auto Components | 1.6 | |
| Food & Staples Retailing | 0.8 | |
| Building Products | 0.4 | |
| |
Fidelity Advisor® Consumer Discretionary Fund
Showing Percentage of Net Assets
| Common Stocks - 99.6% |
| | | Shares | Value ($) |
| Auto Components - 1.6% | | | |
| Auto Parts & Equipment - 1.6% | | | |
| Adient PLC (a) | | 72,331 | 3,256,342 |
| Magna International, Inc. Class A (b) | | 50,700 | 3,292,458 |
| | | | 6,548,800 |
| Automobiles - 10.6% | | | |
| Automobile Manufacturers - 10.6% | | | |
| Ferrari NV | | 6,803 | 1,709,662 |
| Tesla, Inc. (a) | | 242,515 | 42,008,448 |
| | | | 43,718,110 |
| Building Products - 0.4% | | | |
| Building Products - 0.4% | | | |
| The AZEK Co., Inc. (a)(b) | | 64,011 | 1,544,585 |
| Food & Staples Retailing - 0.8% | | | |
| Food Distributors - 0.8% | | | |
| Performance Food Group Co. (a) | | 56,542 | 3,467,155 |
| Hotels, Restaurants & Leisure - 17.8% | | | |
| Casinos & Gaming - 3.2% | | | |
| Caesars Entertainment, Inc. (a) | | 57,651 | 3,001,311 |
| Churchill Downs, Inc. | | 24,967 | 6,194,313 |
| Penn Entertainment, Inc. (a) | | 111,635 | 3,957,461 |
| | | | 13,153,085 |
| Hotels, Resorts & Cruise Lines - 7.7% | | | |
| Booking Holdings, Inc. (a) | | 4,255 | 10,357,096 |
| Hilton Worldwide Holdings, Inc. | | 80,255 | 11,644,198 |
| Marriott International, Inc. Class A | | 48,744 | 8,490,230 |
| Royal Caribbean Cruises Ltd. (a) | | 17,200 | 1,116,968 |
| | | | 31,608,492 |
| Leisure Facilities - 0.6% | | | |
| Planet Fitness, Inc. (a) | | 28,027 | 2,372,486 |
| Restaurants - 6.3% | | | |
| ARAMARK Holdings Corp. | | 110,519 | 4,921,411 |
| Brinker International, Inc. (a) | | 25,120 | 991,235 |
| Chipotle Mexican Grill, Inc. (a) | | 3,764 | 6,196,974 |
| Domino's Pizza, Inc. | | 14,699 | 5,188,747 |
| Dutch Bros, Inc. (a)(b) | | 18,809 | 716,811 |
| McDonald's Corp. | | 29,991 | 8,019,593 |
| | | | 26,034,771 |
TOTAL HOTELS, RESTAURANTS & LEISURE | | | 73,168,834 |
| Household Durables - 2.9% | | | |
| Home Furnishings - 1.3% | | | |
| Tempur Sealy International, Inc. | | 129,285 | 5,268,364 |
| Homebuilding - 1.6% | | | |
| KB Home | | 62,400 | 2,399,280 |
| PulteGroup, Inc. | | 76,800 | 4,369,152 |
| | | | 6,768,432 |
TOTAL HOUSEHOLD DURABLES | | | 12,036,796 |
| Internet & Direct Marketing Retail - 23.2% | | | |
| Internet & Direct Marketing Retail - 23.2% | | | |
| Amazon.com, Inc. (a) | | 896,829 | 92,489,975 |
| eBay, Inc. | | 66,724 | 3,302,838 |
| | | | 95,792,813 |
| Multiline Retail - 6.7% | | | |
| General Merchandise Stores - 6.7% | | | |
| Dollar General Corp. | | 29,673 | 6,931,613 |
| Dollar Tree, Inc. (a) | | 55,824 | 8,383,648 |
| Ollie's Bargain Outlet Holdings, Inc. (a) | | 63,043 | 3,452,235 |
| Target Corp. | | 52,124 | 8,972,625 |
| | | | 27,740,121 |
| Specialty Retail - 21.8% | | | |
| Apparel Retail - 5.7% | | | |
| Burlington Stores, Inc. (a) | | 22,263 | 5,116,705 |
| TJX Companies, Inc. | | 196,089 | 16,051,846 |
| Victoria's Secret & Co. (a) | | 57,809 | 2,436,649 |
| | | | 23,605,200 |
| Automotive Retail - 0.4% | | | |
| O'Reilly Automotive, Inc. (a) | | 1,800 | 1,426,230 |
| Home Improvement Retail - 11.7% | | | |
| Floor & Decor Holdings, Inc. Class A (a)(b) | | 82,878 | 7,522,836 |
| Lowe's Companies, Inc. | | 91,977 | 19,154,210 |
| The Home Depot, Inc. | | 66,163 | 21,448,060 |
| | | | 48,125,106 |
| Homefurnishing Retail - 0.5% | | | |
| Williams-Sonoma, Inc. | | 14,400 | 1,943,136 |
| Specialty Stores - 3.5% | | | |
| Bath & Body Works, Inc. | | 34,218 | 1,574,370 |
| Dick's Sporting Goods, Inc. (b) | | 66,324 | 8,672,526 |
| Five Below, Inc. (a) | | 17,861 | 3,520,939 |
| Sally Beauty Holdings, Inc. (a) | | 50,990 | 794,424 |
| | | | 14,562,259 |
TOTAL SPECIALTY RETAIL | | | 89,661,931 |
| Textiles, Apparel & Luxury Goods - 13.8% | | | |
| Apparel, Accessories & Luxury Goods - 7.0% | | | |
| Capri Holdings Ltd. (a) | | 129,630 | 8,619,099 |
| lululemon athletica, Inc. (a) | | 20,770 | 6,373,898 |
| LVMH Moet Hennessy Louis Vuitton SE | | 2,692 | 2,350,050 |
| PVH Corp. | | 34,219 | 3,076,288 |
| Tapestry, Inc. | | 184,504 | 8,407,847 |
| | | | 28,827,182 |
| Footwear - 6.8% | | | |
| Crocs, Inc. (a) | | 8,420 | 1,025,303 |
| Deckers Outdoor Corp. (a) | | 18,527 | 7,919,922 |
| NIKE, Inc. Class B | | 135,882 | 17,301,855 |
| On Holding AG (a) | | 39,844 | 924,381 |
| Skechers U.S.A., Inc. Class A (sub. vtg.) (a) | | 18,800 | 905,220 |
| | | | 28,076,681 |
TOTAL TEXTILES, APPAREL & LUXURY GOODS | | | 56,903,863 |
| TOTAL COMMON STOCKS (Cost $249,657,680) | | | 410,583,008 |
| | | | |
| Money Market Funds - 4.3% |
| | | Shares | Value ($) |
| Fidelity Cash Central Fund 4.38% (c) | | 954,750 | 954,941 |
| Fidelity Securities Lending Cash Central Fund 4.38% (c)(d) | | 16,797,445 | 16,799,125 |
| TOTAL MONEY MARKET FUNDS (Cost $17,754,066) | | | 17,754,066 |
| | | | |
| TOTAL INVESTMENT IN SECURITIES - 103.9% (Cost $267,411,746) | 428,337,074 |
NET OTHER ASSETS (LIABILITIES) - (3.9)% | (16,259,864) |
| NET ASSETS - 100.0% | 412,077,210 |
| | |
Legend
| (b) | Security or a portion of the security is on loan at period end. |
| (c) | Affiliated fund that is generally available only to investment companies and other accounts managed by Fidelity Investments. The rate quoted is the annualized seven-day yield of the fund at period end. A complete unaudited listing of the fund's holdings as of its most recent quarter end is available upon request. In addition, each Fidelity Central Fund's financial statements are available on the SEC's website or upon request. |
| (d) | Investment made with cash collateral received from securities on loan. |
Affiliated Central Funds
Fiscal year to date information regarding the Fund's investments in Fidelity Central Funds, including the ownership percentage, is presented below.
| Affiliate | Value, beginning of period ($) | Purchases ($) | Sales Proceeds ($) | Dividend Income ($) | Realized Gain (loss) ($) | Change in Unrealized appreciation (depreciation) ($) | Value, end of period ($) | % ownership, end of period |
| Fidelity Cash Central Fund 4.38% | - | 67,017,065 | 66,062,124 | 18,290 | - | - | 954,941 | 0.0% |
| Fidelity Securities Lending Cash Central Fund 4.38% | 3,926,447 | 54,667,429 | 41,794,751 | 64,715 | - | - | 16,799,125 | 0.1% |
| Total | 3,926,447 | 121,684,494 | 107,856,875 | 83,005 | - | - | 17,754,066 | |
| | | | | | | | | |
Amounts in the dividend income column in the above table include any capital gain distributions from underlying funds, which are presented in the corresponding line item in the Statement of Operations, if applicable.
Amount for Fidelity Securities Lending Cash Central Fund represents the income earned on investing cash collateral, less rebates paid to borrowers and any lending agent fees associated with the loan, plus any premium payments received for lending certain types of securities.
Amounts included in the purchases and sales proceeds columns may include in-kind transactions, if applicable.
Investment Valuation
The following is a summary of the inputs used, as of January 31, 2023, involving the Fund's assets and liabilities carried at fair value. The inputs or methodology used for valuing securities may not be an indication of the risk associated with investing in those securities. For more information on valuation inputs, and their aggregation into the levels used below, please refer to the Investment Valuation section in the accompanying Notes to Financial Statements.
| Valuation Inputs at Reporting Date: |
| Description | Total ($) | Level 1 ($) | Level 2 ($) | Level 3 ($) |
Investments in Securities: | | | | |
|
| Common Stocks | 410,583,008 | 408,232,958 | 2,350,050 | - |
|
| Money Market Funds | 17,754,066 | 17,754,066 | - | - |
| Total Investments in Securities: | 428,337,074 | 425,987,024 | 2,350,050 | - |
Fidelity Advisor® Consumer Discretionary Fund
| Statement of Assets and Liabilities |
| | | | January 31, 2023 (Unaudited) |
| | | | | |
| Assets | | | | |
| Investment in securities, at value (including securities loaned of $17,149,541) - See accompanying schedule: | | | | |
Unaffiliated issuers (cost $249,657,680) | $ | 410,583,008 | | |
Fidelity Central Funds (cost $17,754,066) | | 17,754,066 | | |
| | | | | |
| | | | | |
| Total Investment in Securities (cost $267,411,746) | | | $ | 428,337,074 |
| Foreign currency held at value (cost $21,151) | | | | 19,178 |
| Receivable for investments sold | | | | 1,735,297 |
| Receivable for fund shares sold | | | | 160,447 |
| Dividends receivable | | | | 119,148 |
| Distributions receivable from Fidelity Central Funds | | | | 6,675 |
| Prepaid expenses | | | | 1,273 |
| Other receivables | | | | 2,352 |
Total assets | | | | 430,381,444 |
| Liabilities | | | | |
| Payable for investments purchased | $ | 819,477 | | |
| Payable for fund shares redeemed | | 345,413 | | |
| Accrued management fee | | 168,711 | | |
| Distribution and service plan fees payable | | 79,665 | | |
| Other affiliated payables | | 63,434 | | |
| Other payables and accrued expenses | | 28,584 | | |
| Collateral on securities loaned | | 16,798,950 | | |
| Total Liabilities | | | | 18,304,234 |
| Net Assets | | | $ | 412,077,210 |
| Net Assets consist of: | | | | |
| Paid in capital | | | $ | 269,665,524 |
| Total accumulated earnings (loss) | | | | 142,411,686 |
| Net Assets | | | $ | 412,077,210 |
| | | | | |
| Net Asset Value and Maximum Offering Price | | | | |
| Class A : | | | | |
Net Asset Value and redemption price per share ($169,781,662 ÷ 5,180,526 shares) (a) | | | $ | 32.77 |
| Maximum offering price per share (100/94.25 of $32.77) | | | $ | 34.77 |
| Class M : | | | | |
Net Asset Value and redemption price per share ($31,177,656 ÷ 1,040,727 shares) (a) | | | $ | 29.96 |
| Maximum offering price per share (100/96.50 of $29.96) | | | $ | 31.05 |
| Class C : | | | | |
Net Asset Value and offering price per share ($44,156,236 ÷ 1,783,903 shares) (a) | | | $ | 24.75 |
| Class I : | | | | |
Net Asset Value , offering price and redemption price per share ($96,839,601 ÷ 2,679,518 shares) | | | $ | 36.14 |
| Class Z : | | | | |
Net Asset Value , offering price and redemption price per share ($70,122,055 ÷ 1,931,714 shares) | | | $ | 36.30 |
(a)Redemption price per share is equal to net asset value less any applicable contingent deferred sales charge. |
| Statement of Operations |
| | | | Six months ended January 31, 2023 (Unaudited) |
| Investment Income | | | | |
| Dividends | | | $ | 1,451,922 |
| Income from Fidelity Central Funds (including $64,715 from security lending) | | | | 83,005 |
| Total Income | | | | 1,534,927 |
| Expenses | | | | |
| Management fee | $ | 1,070,355 | | |
| Transfer agent fees | | 336,092 | | |
| Distribution and service plan fees | | 520,973 | | |
| Accounting fees | | 71,855 | | |
| Custodian fees and expenses | | 9,316 | | |
| Independent trustees' fees and expenses | | 717 | | |
| Registration fees | | 63,596 | | |
| Audit | | 32,756 | | |
| Legal | | 2,315 | | |
| Miscellaneous | | 1,705 | | |
| Total expenses before reductions | | 2,109,680 | | |
| Expense reductions | | (7,585) | | |
| Total expenses after reductions | | | | 2,102,095 |
| Net Investment income (loss) | | | | (567,168) |
| Realized and Unrealized Gain (Loss) | | | | |
| Net realized gain (loss) on: | | | | |
| Investment Securities: | | | | |
| Unaffiliated issuers | | 4,724,880 | | |
| Foreign currency transactions | | (1,345) | | |
| Total net realized gain (loss) | | | | 4,723,535 |
| Change in net unrealized appreciation (depreciation) on: | | | | |
| Investment Securities: | | | | |
| Unaffiliated issuers | | (15,322,548) | | |
| Assets and liabilities in foreign currencies | | 778 | | |
| Total change in net unrealized appreciation (depreciation) | | | | (15,321,770) |
| Net gain (loss) | | | | (10,598,235) |
| Net increase (decrease) in net assets resulting from operations | | | $ | (11,165,403) |
| Statement of Changes in Net Assets |
| |
| | Six months ended January 31, 2023 (Unaudited) | | Year ended July 31, 2022 |
| Increase (Decrease) in Net Assets | | | | |
| Operations | | | | |
| Net investment income (loss) | $ | (567,168) | $ | (2,177,425) |
| Net realized gain (loss) | | 4,723,535 | | 22,343,203 |
| Change in net unrealized appreciation (depreciation) | | (15,321,770) | | (130,859,779) |
| Net increase (decrease) in net assets resulting from operations | | (11,165,403) | | (110,694,001) |
| Distributions to shareholders | | (17,163,454) | | (44,840,619) |
| Share transactions - net increase (decrease) | | (585,230) | | (144,288,903) |
| Total increase (decrease) in net assets | | (28,914,087) | | (299,823,523) |
| | | | | |
| Net Assets | | | | |
| Beginning of period | | 440,991,297 | | 740,814,820 |
| End of period | $ | 412,077,210 | $ | 440,991,297 |
| | | | | |
| | | | | |
Financial Highlights
| Fidelity Advisor® Consumer Discretionary Fund Class A |
| |
| | Six months ended (Unaudited) January 31, 2023 | | Years ended July 31, 2022 | | 2021 | | 2020 | | 2019 | | 2018 |
Selected Per-Share Data | | | | | | | | | | | | |
| Net asset value, beginning of period | $ | 35.05 | $ | 45.74 | $ | 33.70 | $ | 29.83 | $ | 28.22 | $ | 22.92 |
| Income from Investment Operations | | | | | | | | | | | | |
Net investment income (loss) A,B | | (.05) | | (.16) | | (.20) | | (.04) | | (.02) | | (.02) |
| Net realized and unrealized gain (loss) | | (.88) | | (7.62) | | 12.82 | | 4.73 | | 1.90 | | 5.32 |
| Total from investment operations | | (.93) | | (7.78) | | 12.62 | | 4.69 | | 1.88 | | 5.30 |
| Distributions from net realized gain | | (1.35) | | (2.91) | | (.58) | | (.82) | | (.27) | | - |
| Total distributions | | (1.35) | | (2.91) | | (.58) | | (.82) | | (.27) | | - |
| Net asset value, end of period | $ | 32.77 | $ | 35.05 | $ | 45.74 | $ | 33.70 | $ | 29.83 | $ | 28.22 |
Total Return C,D,E | | (2.47)% | | (18.26)% | | 37.68% | | 16.03% | | 6.81% | | 23.12% |
Ratios to Average Net Assets B,F,G | | | | | | | | | | | | |
| Expenses before reductions | | 1.06% H | | 1.01% | | 1.03% | | 1.07% | | 1.08% | | 1.12% |
| Expenses net of fee waivers, if any | | 1.05% H | | 1.01% | | 1.03% | | 1.07% | | 1.08% | | 1.12% |
| Expenses net of all reductions | | 1.05% H | | 1.01% | | 1.03% | | 1.06% | | 1.07% | | 1.11% |
| Net investment income (loss) | | (.30)% H | | (.38)% | | (.48)% | | (.14)% | | (.09)% | | (.08)% |
| Supplemental Data | | | | | | | | | | | | |
| Net assets, end of period (000 omitted) | $ | 169,782 | $ | 188,092 | $ | 259,488 | $ | 159,603 | $ | 159,298 | $ | 146,605 |
Portfolio turnover rate I | | 47% H | | 34% | | 35% | | 41% J | | 60% | | 60% |
A Calculated based on average shares outstanding during the period.
B Net investment income (loss) is affected by the timing of the declaration of dividends by any underlying mutual funds or exchange-traded funds (ETFs). Net investment income (loss) of any mutual funds or ETFs is not included in the Fund's net investment income (loss) ratio.
C Total returns for periods of less than one year are not annualized.
D Total returns would have been lower if certain expenses had not been reduced during the applicable periods shown.
E Total returns do not include the effect of the sales charges.
F Fees and expenses of any underlying mutual funds or exchange-traded funds (ETFs) are not included in the Fund's expense ratio. The Fund indirectly bears its proportionate share of these expenses. For additional expense information related to investments in Fidelity Central Funds, please refer to the "Investments in Fidelity Central Funds" note found in the Notes to Financial Statements section of the most recent Annual or Semi-Annual report.
G Expense ratios reflect operating expenses of the class. Expenses before reductions do not reflect amounts reimbursed, waived, or reduced through arrangements with the investment adviser, brokerage services, or other offset arrangements, if applicable, and do not represent the amount paid by the class during periods when reimbursements, waivers or reductions occur.
H Annualized.
I Amount does not include the portfolio activity of any underlying mutual funds or exchange-traded funds (ETFs).
J Portfolio turnover rate excludes securities received or delivered in-kind.
| Fidelity Advisor® Consumer Discretionary Fund Class M |
| |
| | Six months ended (Unaudited) January 31, 2023 | | Years ended July 31, 2022 | | 2021 | | 2020 | | 2019 | | 2018 |
Selected Per-Share Data | | | | | | | | | | | | |
| Net asset value, beginning of period | $ | 32.20 | $ | 42.23 | $ | 31.23 | $ | 27.78 | $ | 26.36 | $ | 21.47 |
| Income from Investment Operations | | | | | | | | | | | | |
Net investment income (loss) A,B | | (.08) | | (.24) | | (.29) | | (.11) | | (.09) | | (.08) |
| Net realized and unrealized gain (loss) | | (.81) | | (7.02) | | 11.87 | | 4.38 | | 1.78 | | 4.97 |
| Total from investment operations | | (.89) | | (7.26) | | 11.58 | | 4.27 | | 1.69 | | 4.89 |
| Distributions from net realized gain | | (1.35) | | (2.77) | | (.58) | | (.82) | | (.27) | | - |
| Total distributions | | (1.35) | | (2.77) | | (.58) | | (.82) | | (.27) | | - |
| Net asset value, end of period | $ | 29.96 | $ | 32.20 | $ | 42.23 | $ | 31.23 | $ | 27.78 | $ | 26.36 |
Total Return C,D,E | | (2.57)% | | (18.49)% | | 37.32% | | 15.70% | | 6.56% | | 22.78% |
Ratios to Average Net Assets B,F,G | | | | | | | | | | | | |
| Expenses before reductions | | 1.32% H | | 1.28% | | 1.30% | | 1.34% | | 1.34% | | 1.38% |
| Expenses net of fee waivers, if any | | 1.32% H | | 1.27% | | 1.30% | | 1.34% | | 1.34% | | 1.38% |
| Expenses net of all reductions | | 1.32% H | | 1.27% | | 1.29% | | 1.33% | | 1.34% | | 1.38% |
| Net investment income (loss) | | (.56)% H | | (.64)% | | (.75)% | | (.41)% | | (.35)% | | (.35)% |
| Supplemental Data | | | | | | | | | | | | |
| Net assets, end of period (000 omitted) | $ | 31,178 | $ | 35,219 | $ | 48,288 | $ | 33,896 | $ | 32,792 | $ | 34,622 |
Portfolio turnover rate I | | 47% H | | 34% | | 35% | | 41% J | | 60% | | 60% |
A Calculated based on average shares outstanding during the period.
B Net investment income (loss) is affected by the timing of the declaration of dividends by any underlying mutual funds or exchange-traded funds (ETFs). Net investment income (loss) of any mutual funds or ETFs is not included in the Fund's net investment income (loss) ratio.
C Total returns for periods of less than one year are not annualized.
D Total returns would have been lower if certain expenses had not been reduced during the applicable periods shown.
E Total returns do not include the effect of the sales charges.
F Fees and expenses of any underlying mutual funds or exchange-traded funds (ETFs) are not included in the Fund's expense ratio. The Fund indirectly bears its proportionate share of these expenses. For additional expense information related to investments in Fidelity Central Funds, please refer to the "Investments in Fidelity Central Funds" note found in the Notes to Financial Statements section of the most recent Annual or Semi-Annual report.
G Expense ratios reflect operating expenses of the class. Expenses before reductions do not reflect amounts reimbursed, waived, or reduced through arrangements with the investment adviser, brokerage services, or other offset arrangements, if applicable, and do not represent the amount paid by the class during periods when reimbursements, waivers or reductions occur.
H Annualized.
I Amount does not include the portfolio activity of any underlying mutual funds or exchange-traded funds (ETFs).
J Portfolio turnover rate excludes securities received or delivered in-kind.
| Fidelity Advisor® Consumer Discretionary Fund Class C |
| |
| | Six months ended (Unaudited) January 31, 2023 | | Years ended July 31, 2022 | | 2021 | | 2020 | | 2019 | | 2018 |
Selected Per-Share Data | | | | | | | | | | | | |
| Net asset value, beginning of period | $ | 26.92 | $ | 35.82 | $ | 26.69 | $ | 23.97 | $ | 22.90 | $ | 18.74 |
| Income from Investment Operations | | | | | | | | | | | | |
Net investment income (loss) A,B | | (.13) | | (.36) | | (.40) | | (.21) | | (.19) | | (.17) |
| Net realized and unrealized gain (loss) | | (.69) | | (5.87) | | 10.11 | | 3.75 | | 1.53 | | 4.33 |
| Total from investment operations | | (.82) | | (6.23) | | 9.71 | | 3.54 | | 1.34 | | 4.16 |
| Distributions from net realized gain | | (1.35) | | (2.67) | | (.58) | | (.82) | | (.27) | | - |
| Total distributions | | (1.35) | | (2.67) | | (.58) | | (.82) | | (.27) | | - |
| Net asset value, end of period | $ | 24.75 | $ | 26.92 | $ | 35.82 | $ | 26.69 | $ | 23.97 | $ | 22.90 |
Total Return C,D,E | | (2.82)% | | (18.88)% | | 36.66% | | 15.14% | | 6.02% | | 22.20% |
Ratios to Average Net Assets B,F,G | | | | | | | | | | | | |
| Expenses before reductions | | 1.81% H | | 1.77% | | 1.79% | | 1.82% | | 1.83% | | 1.87% |
| Expenses net of fee waivers, if any | | 1.81% H | | 1.76% | | 1.79% | | 1.82% | | 1.83% | | 1.87% |
| Expenses net of all reductions | | 1.81% H | | 1.76% | | 1.79% | | 1.82% | | 1.82% | | 1.86% |
| Net investment income (loss) | | (1.05)% H | | (1.13)% | | (1.24)% | | (.90)% | | (.83)% | | (.83)% |
| Supplemental Data | | | | | | | | | | | | |
| Net assets, end of period (000 omitted) | $ | 44,156 | $ | 54,035 | $ | 85,549 | $ | 65,223 | $ | 70,890 | $ | 71,116 |
Portfolio turnover rate I | | 47% H | | 34% | | 35% | | 41% J | | 60% | | 60% |
A Calculated based on average shares outstanding during the period.
B Net investment income (loss) is affected by the timing of the declaration of dividends by any underlying mutual funds or exchange-traded funds (ETFs). Net investment income (loss) of any mutual funds or ETFs is not included in the Fund's net investment income (loss) ratio.
C Total returns for periods of less than one year are not annualized.
D Total returns would have been lower if certain expenses had not been reduced during the applicable periods shown.
E Total returns do not include the effect of the contingent deferred sales charge.
F Fees and expenses of any underlying mutual funds or exchange-traded funds (ETFs) are not included in the Fund's expense ratio. The Fund indirectly bears its proportionate share of these expenses. For additional expense information related to investments in Fidelity Central Funds, please refer to the "Investments in Fidelity Central Funds" note found in the Notes to Financial Statements section of the most recent Annual or Semi-Annual report.
G Expense ratios reflect operating expenses of the class. Expenses before reductions do not reflect amounts reimbursed, waived, or reduced through arrangements with the investment adviser, brokerage services, or other offset arrangements, if applicable, and do not represent the amount paid by the class during periods when reimbursements, waivers or reductions occur.
H Annualized.
I Amount does not include the portfolio activity of any underlying mutual funds or exchange-traded funds (ETFs).
J Portfolio turnover rate excludes securities received or delivered in-kind.
| Fidelity Advisor® Consumer Discretionary Fund Class I |
| |
| | Six months ended (Unaudited) January 31, 2023 | | Years ended July 31, 2022 | | 2021 | | 2020 | | 2019 | | 2018 |
Selected Per-Share Data | | | | | | | | | | | | |
| Net asset value, beginning of period | $ | 38.45 | $ | 49.91 | $ | 36.63 | $ | 32.27 | $ | 30.42 | $ | 24.64 |
| Income from Investment Operations | | | | | | | | | | | | |
Net investment income (loss) A,B | | - C | | (.05) | | (.10) | | .04 | | .06 | | .06 |
| Net realized and unrealized gain (loss) | | (.96) | | (8.36) | | 13.96 | | 5.14 | | 2.06 | | 5.72 |
| Total from investment operations | | (.96) | | (8.41) | | 13.86 | | 5.18 | | 2.12 | | 5.78 |
| Distributions from net realized gain | | (1.35) | | (3.05) | | (.58) | | (.82) | | (.27) | | - |
| Total distributions | | (1.35) | | (3.05) | | (.58) | | (.82) | | (.27) | | - |
| Net asset value, end of period | $ | 36.14 | $ | 38.45 | $ | 49.91 | $ | 36.63 | $ | 32.27 | $ | 30.42 |
Total Return D,E | | (2.33)% | | (18.04)% | | 38.05% | | 16.34% | | 7.10% | | 23.46% |
Ratios to Average Net Assets B,F,G | | | | | | | | | | | | |
| Expenses before reductions | | .78% H | | .75% | | .77% | | .79% | | .80% | | .84% |
| Expenses net of fee waivers, if any | | .78% H | | .74% | | .76% | | .79% | | .80% | | .83% |
| Expenses net of all reductions | | .78% H | | .74% | | .76% | | .79% | | .80% | | .83% |
| Net investment income (loss) | | (.02)% H | | (.11)% | | (.22)% | | .13% | | .19% | | .20% |
| Supplemental Data | | | | | | | | | | | | |
| Net assets, end of period (000 omitted) | $ | 96,840 | $ | 118,859 | $ | 259,846 | $ | 134,907 | $ | 159,613 | $ | 152,711 |
Portfolio turnover rate I | | 47% H | | 34% | | 35% | | 41% J | | 60% | | 60% |
A Calculated based on average shares outstanding during the period.
B Net investment income (loss) is affected by the timing of the declaration of dividends by any underlying mutual funds or exchange-traded funds (ETFs). Net investment income (loss) of any mutual funds or ETFs is not included in the Fund's net investment income (loss) ratio.
C Amount represents less than $.005 per share.
D Total returns for periods of less than one year are not annualized.
E Total returns would have been lower if certain expenses had not been reduced during the applicable periods shown.
F Fees and expenses of any underlying mutual funds or exchange-traded funds (ETFs) are not included in the Fund's expense ratio. The Fund indirectly bears its proportionate share of these expenses. For additional expense information related to investments in Fidelity Central Funds, please refer to the "Investments in Fidelity Central Funds" note found in the Notes to Financial Statements section of the most recent Annual or Semi-Annual report.
G Expense ratios reflect operating expenses of the class. Expenses before reductions do not reflect amounts reimbursed, waived, or reduced through arrangements with the investment adviser, brokerage services, or other offset arrangements, if applicable, and do not represent the amount paid by the class during periods when reimbursements, waivers or reductions occur.
H Annualized.
I Amount does not include the portfolio activity of any underlying mutual funds or exchange-traded funds (ETFs).
J Portfolio turnover rate excludes securities received or delivered in-kind.
| Fidelity Advisor® Consumer Discretionary Fund Class Z |
| |
| | Six months ended (Unaudited) January 31, 2023 | | Years ended July 31, 2022 | | 2021 | | 2020 | | 2019 A |
Selected Per-Share Data | | | | | | | | | | |
| Net asset value, beginning of period | $ | 38.59 | $ | 50.10 | $ | 36.72 | $ | 32.31 | $ | 31.56 |
| Income from Investment Operations | | | | | | | | | | |
Net investment income (loss) B,C | | .02 | | - D | | (.04) | | .09 | | .10 |
| Net realized and unrealized gain (loss) | | (.96) | | (8.38) | | 14.00 | | 5.14 | | .92 |
| Total from investment operations | | (.94) | | (8.38) | | 13.96 | | 5.23 | | 1.02 |
| Distributions from net realized gain | | (1.35) | | (3.13) | | (.58) | | (.82) | | (.27) |
| Total distributions | | (1.35) | | (3.13) | | (.58) | | (.82) | | (.27) |
| Net asset value, end of period | $ | 36.30 | $ | 38.59 | $ | 50.10 | $ | 36.72 | $ | 32.31 |
Total Return E,F | | (2.27)% | | (17.93)% | | 38.23% | | 16.48% | | 3.36% |
Ratios to Average Net Assets C,G,H | | | | | | | | | | |
| Expenses before reductions | | .66% I | | .62% | | .64% | | .66% | | .67% I |
| Expenses net of fee waivers, if any | | .65% I | | .62% | | .64% | | .66% | | .66% I |
| Expenses net of all reductions | | .65% I | | .62% | | .64% | | .66% | | .66% I |
| Net investment income (loss) | | .10% I | | .01% | | (.09)% | | .26% | | .39% I |
| Supplemental Data | | | | | | | | | | |
| Net assets, end of period (000 omitted) | $ | 70,122 | $ | 44,785 | $ | 87,644 | $ | 48,668 | $ | 6,786 |
Portfolio turnover rate J | | 47% I | | 34% | | 35% | | 41% K | | 60% |
A For the period October 2, 2018 (commencement of sale of shares) through July 31, 2019.
B Calculated based on average shares outstanding during the period.
C Net investment income (loss) is affected by the timing of the declaration of dividends by any underlying mutual funds or exchange-traded funds (ETFs). Net investment income (loss) of any mutual funds or ETFs is not included in the Fund's net investment income (loss) ratio.
D Amount represents less than $.005 per share.
E Total returns for periods of less than one year are not annualized.
F Total returns would have been lower if certain expenses had not been reduced during the applicable periods shown.
G Fees and expenses of any underlying mutual funds or exchange-traded funds (ETFs) are not included in the Fund's expense ratio. The Fund indirectly bears its proportionate share of these expenses. For additional expense information related to investments in Fidelity Central Funds, please refer to the "Investments in Fidelity Central Funds" note found in the Notes to Financial Statements section of the most recent Annual or Semi-Annual report.
H Expense ratios reflect operating expenses of the class. Expenses before reductions do not reflect amounts reimbursed, waived, or reduced through arrangements with the investment adviser, brokerage services, or other offset arrangements, if applicable, and do not represent the amount paid by the class during periods when reimbursements, waivers or reductions occur.
I Annualized.
J Amount does not include the portfolio activity of any underlying mutual funds or exchange-traded funds (ETFs).
K Portfolio turnover rate excludes securities received or delivered in-kind.
Top Holdings (% of Fund's net assets) |
| |
| Exxon Mobil Corp. | 23.8 | |
| Chevron Corp. | 6.6 | |
| ConocoPhillips Co. | 5.1 | |
| Valero Energy Corp. | 5.0 | |
| Halliburton Co. | 4.6 | |
| Schlumberger Ltd. | 4.2 | |
| Marathon Petroleum Corp. | 4.1 | |
| Hess Corp. | 3.7 | |
| Canadian Natural Resources Ltd. | 3.4 | |
| Occidental Petroleum Corp. | 3.4 | |
| | 63.9 | |
| |
| Industries (% of Fund's net assets) |
| |
| Oil, Gas & Consumable Fuels | 84.4 | |
| Energy Equipment & Services | 15.1 | |
| Independent Power and Renewable Electricity Producers | 0.4 | |
| |
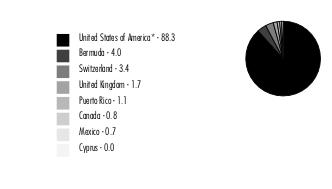
Geographic Diversification (% of Fund's net assets) |
|
* Includes Short-Term investments and Net Other Assets (Liabilities). Percentages are based on country or territory of incorporation and are adjusted for the effect of derivatives, if applicable. |
| |
Fidelity Advisor® Energy Fund
Showing Percentage of Net Assets
| Common Stocks - 99.9% |
| | | Shares | Value ($) |
| Energy Equipment & Services - 15.1% | | | |
| Oil & Gas Drilling - 1.5% | | | |
| Nabors Industries Ltd. (a) | | 7,112 | 1,262,664 |
| Nabors Industries Ltd. warrants 6/11/26 (a) | | 6,604 | 188,214 |
| Noble Corp. PLC (a) | | 106,400 | 4,329,416 |
| Odfjell Drilling Ltd. (a) | | 722,656 | 1,918,569 |
| Odfjell Technology Ltd. (a) | | 104,337 | 376,306 |
| Shelf Drilling Ltd. (a)(b) | | 579,628 | 1,713,055 |
| Valaris Ltd. (a) | | 210,900 | 15,319,776 |
| | | | 25,108,000 |
| Oil & Gas Equipment & Services - 13.6% | | | |
| Baker Hughes Co. Class A | | 8,700 | 276,138 |
| Cactus, Inc. | | 30,700 | 1,661,177 |
| Halliburton Co. | | 1,879,900 | 77,489,478 |
| Nextier Oilfield Solutions, Inc. (a) | | 2,218,200 | 20,895,444 |
| NOV, Inc. | | 417,000 | 10,191,480 |
| Oceaneering International, Inc. (a) | | 512,600 | 10,944,010 |
| ProPetro Holding Corp. (a) | | 727,100 | 7,234,645 |
| Schlumberger Ltd. | | 1,242,818 | 70,815,770 |
| TechnipFMC PLC (a) | | 2,102,400 | 29,202,336 |
| | | | 228,710,478 |
TOTAL ENERGY EQUIPMENT & SERVICES | | | 253,818,478 |
| Independent Power and Renewable Electricity Producers - 0.4% | | | |
| Independent Power Producers & Energy Traders - 0.4% | | | |
| The AES Corp. | | 13,200 | 361,812 |
| Vistra Corp. | | 304,100 | 7,012,546 |
| | | | 7,374,358 |
| Oil, Gas & Consumable Fuels - 84.4% | | | |
| Coal & Consumable Fuels - 0.8% | | | |
| Arch Resources, Inc. (c) | | 35,000 | 5,180,700 |
| CONSOL Energy, Inc. | | 21,400 | 1,237,562 |
| Enviva, Inc. | | 4,200 | 191,016 |
| Peabody Energy Corp. (a) | | 216,700 | 6,043,763 |
| | | | 12,653,041 |
| Integrated Oil & Gas - 39.1% | | | |
| Cenovus Energy, Inc. (Canada) (c) | | 2,564,600 | 51,232,248 |
| Chevron Corp. | | 637,870 | 111,002,137 |
| Exxon Mobil Corp. | | 3,448,261 | 400,032,756 |
| Imperial Oil Ltd. | | 265,800 | 14,527,057 |
| Occidental Petroleum Corp. (c) | | 881,500 | 57,112,385 |
| Occidental Petroleum Corp. warrants 8/3/27 (a) | | 36,987 | 1,587,482 |
| Suncor Energy, Inc. (c) | | 596,200 | 20,692,583 |
| | | | 656,186,648 |
| Oil & Gas Exploration & Production - 29.2% | | | |
| Antero Resources Corp. (a) | | 767,900 | 22,146,236 |
| APA Corp. | | 566,200 | 25,099,646 |
| Callon Petroleum Co. (a) | | 54,740 | 2,329,187 |
| Canadian Natural Resources Ltd. (c) | | 942,300 | 57,838,970 |
| Chesapeake Energy Corp. | | 73,200 | 6,347,904 |
| Chord Energy Corp. | | 39,830 | 5,708,834 |
| Civitas Resources, Inc. | | 120,744 | 8,035,513 |
| ConocoPhillips Co. | | 698,850 | 85,168,850 |
| Coterra Energy, Inc. | | 292,921 | 7,331,813 |
| Devon Energy Corp. | | 438,200 | 27,711,768 |
| Diamondback Energy, Inc. | | 92,800 | 13,559,936 |
| EOG Resources, Inc. | | 160,686 | 21,250,724 |
| EQT Corp. | | 428,600 | 14,002,362 |
| Hess Corp. | | 418,700 | 62,871,992 |
| Magnolia Oil & Gas Corp. Class A | | 235,200 | 5,553,072 |
| National Energy Services Reunited Corp. (a) | | 868,700 | 6,567,372 |
| Northern Oil & Gas, Inc. | | 76,930 | 2,578,694 |
| Ovintiv, Inc. | | 478,900 | 23,576,247 |
| PDC Energy, Inc. | | 551,088 | 37,325,190 |
| Pioneer Natural Resources Co. | | 124,125 | 28,592,194 |
| Range Resources Corp. | | 916,300 | 22,925,826 |
| SM Energy Co. | | 132,400 | 4,351,988 |
| Viper Energy Partners LP | | 3,900 | 123,825 |
| | | | 490,998,143 |
| Oil & Gas Refining & Marketing - 10.7% | | | |
| Marathon Petroleum Corp. | | 531,778 | 68,344,109 |
| Phillips 66 Co. | | 278,737 | 27,948,959 |
| Valero Energy Corp. | | 600,200 | 84,046,006 |
| | | | 180,339,074 |
| Oil & Gas Storage & Transport - 4.6% | | | |
| Cheniere Energy, Inc. | | 328,800 | 50,237,352 |
| Energy Transfer LP | | 1,624,300 | 21,570,704 |
| Golar LNG Ltd. (a) | | 195,700 | 4,587,208 |
| | | | 76,395,264 |
TOTAL OIL, GAS & CONSUMABLE FUELS | | | 1,416,572,170 |
| TOTAL COMMON STOCKS (Cost $1,024,251,116) | | | 1,677,765,006 |
| | | | |
| Money Market Funds - 3.3% |
| | | Shares | Value ($) |
| Fidelity Cash Central Fund 4.38% (d) | | 2,436,655 | 2,437,142 |
| Fidelity Securities Lending Cash Central Fund 4.38% (d)(e) | | 52,679,582 | 52,684,849 |
| TOTAL MONEY MARKET FUNDS (Cost $55,121,991) | | | 55,121,991 |
| | | | |
| TOTAL INVESTMENT IN SECURITIES - 103.2% (Cost $1,079,373,107) | 1,732,886,997 |
NET OTHER ASSETS (LIABILITIES) - (3.2)% | (53,626,104) |
| NET ASSETS - 100.0% | 1,679,260,893 |
| | |
Legend
| (b) | Security exempt from registration under Rule 144A of the Securities Act of 1933. These securities may be resold in transactions exempt from registration, normally to qualified institutional buyers. At the end of the period, the value of these securities amounted to $1,713,055 or 0.1% of net assets. |
| (c) | Security or a portion of the security is on loan at period end. |
| (d) | Affiliated fund that is generally available only to investment companies and other accounts managed by Fidelity Investments. The rate quoted is the annualized seven-day yield of the fund at period end. A complete unaudited listing of the fund's holdings as of its most recent quarter end is available upon request. In addition, each Fidelity Central Fund's financial statements are available on the SEC's website or upon request. |
| (e) | Investment made with cash collateral received from securities on loan. |
Affiliated Central Funds
Fiscal year to date information regarding the Fund's investments in Fidelity Central Funds, including the ownership percentage, is presented below.
| Affiliate | Value, beginning of period ($) | Purchases ($) | Sales Proceeds ($) | Dividend Income ($) | Realized Gain (loss) ($) | Change in Unrealized appreciation (depreciation) ($) | Value, end of period ($) | % ownership, end of period |
| Fidelity Cash Central Fund 4.38% | 5,552,227 | 121,973,334 | 125,088,419 | 71,976 | - | - | 2,437,142 | 0.0% |
| Fidelity Securities Lending Cash Central Fund 4.38% | 58,002,499 | 390,278,031 | 395,595,681 | 52,143 | - | - | 52,684,849 | 0.2% |
| Total | 63,554,726 | 512,251,365 | 520,684,100 | 124,119 | - | - | 55,121,991 | |
| | | | | | | | | |
Amounts in the dividend income column in the above table include any capital gain distributions from underlying funds, which are presented in the corresponding line item in the Statement of Operations, if applicable.
Amount for Fidelity Securities Lending Cash Central Fund represents the income earned on investing cash collateral, less rebates paid to borrowers and any lending agent fees associated with the loan, plus any premium payments received for lending certain types of securities.
Amounts included in the purchases and sales proceeds columns may include in-kind transactions, if applicable.
Investment Valuation
The following is a summary of the inputs used, as of January 31, 2023, involving the Fund's assets and liabilities carried at fair value. The inputs or methodology used for valuing securities may not be an indication of the risk associated with investing in those securities. For more information on valuation inputs, and their aggregation into the levels used below, please refer to the Investment Valuation section in the accompanying Notes to Financial Statements.
| Valuation Inputs at Reporting Date: |
| Description | Total ($) | Level 1 ($) | Level 2 ($) | Level 3 ($) |
Investments in Securities: | | | | |
|
| Common Stocks | 1,677,765,006 | 1,677,765,006 | - | - |
|
| Money Market Funds | 55,121,991 | 55,121,991 | - | - |
| Total Investments in Securities: | 1,732,886,997 | 1,732,886,997 | - | - |
Fidelity Advisor® Energy Fund
| Statement of Assets and Liabilities |
| | | | January 31, 2023 (Unaudited) |
| | | | | |
| Assets | | | | |
| Investment in securities, at value (including securities loaned of $50,630,106) - See accompanying schedule: | | | | |
Unaffiliated issuers (cost $1,024,251,116) | $ | 1,677,765,006 | | |
Fidelity Central Funds (cost $55,121,991) | | 55,121,991 | | |
| | | | | |
| | | | | |
| Total Investment in Securities (cost $1,079,373,107) | | | $ | 1,732,886,997 |
| Receivable for investments sold | | | | 2,986,182 |
| Receivable for fund shares sold | | | | 2,816,876 |
| Dividends receivable | | | | 182,293 |
| Distributions receivable from Fidelity Central Funds | | | | 16,254 |
| Prepaid expenses | | | | 3,388 |
| Other receivables | | | | 125,702 |
Total assets | | | | 1,739,017,692 |
| Liabilities | | | | |
| Payable for investments purchased | $ | 2,946,691 | | |
| Payable for fund shares redeemed | | 2,817,796 | | |
| Distributions payable | | 3,012 | | |
| Accrued management fee | | 721,189 | | |
| Distribution and service plan fees payable | | 235,279 | | |
| Other affiliated payables | | 237,101 | | |
| Other payables and accrued expenses | | 111,206 | | |
| Collateral on securities loaned | | 52,684,525 | | |
| Total Liabilities | | | | 59,756,799 |
| Net Assets | | | $ | 1,679,260,893 |
| Net Assets consist of: | | | | |
| Paid in capital | | | $ | 1,322,274,323 |
| Total accumulated earnings (loss) | | | | 356,986,570 |
| Net Assets | | | $ | 1,679,260,893 |
| | | | | |
| Net Asset Value and Maximum Offering Price | | | | |
| Class A : | | | | |
Net Asset Value and redemption price per share ($437,344,323 ÷ 9,720,994 shares) (a) | | | $ | 44.99 |
| Maximum offering price per share (100/94.25 of $44.99) | | | $ | 47.73 |
| Class M : | | | | |
Net Asset Value and redemption price per share ($125,564,398 ÷ 2,713,577 shares) (a) | | | $ | 46.27 |
| Maximum offering price per share (100/96.50 of $46.27) | | | $ | 47.95 |
| Class C : | | | | |
Net Asset Value and offering price per share ($115,689,492 ÷ 2,811,440 shares) (a) | | | $ | 41.15 |
| Class I : | | | | |
Net Asset Value , offering price and redemption price per share ($657,472,320 ÷ 13,793,300 shares) | | | $ | 47.67 |
| Class Z : | | | | |
Net Asset Value , offering price and redemption price per share ($343,190,360 ÷ 7,215,711 shares) | | | $ | 47.56 |
(a)Redemption price per share is equal to net asset value less any applicable contingent deferred sales charge. |
| Statement of Operations |
| | | | Six months ended January 31, 2023 (Unaudited) |
| Investment Income | | | | |
| Dividends | | | $ | 26,753,675 |
| Income from Fidelity Central Funds (including $52,143 from security lending) | | | | 124,119 |
| Total Income | | | | 26,877,794 |
| Expenses | | | | |
| Management fee | $ | 4,017,072 | | |
| Transfer agent fees | | 1,126,639 | | |
| Distribution and service plan fees | | 1,343,195 | | |
| Accounting fees | | 211,324 | | |
| Custodian fees and expenses | | 11,700 | | |
| Independent trustees' fees and expenses | | 2,556 | | |
| Registration fees | | 111,627 | | |
| Audit | | 26,957 | | |
| Legal | | 1,728 | | |
| Interest | | 2,749 | | |
| Miscellaneous | | 4,454 | | |
| Total expenses before reductions | | 6,860,001 | | |
| Expense reductions | | (28,969) | | |
| Total expenses after reductions | | | | 6,831,032 |
| Net Investment income (loss) | | | | 20,046,762 |
| Realized and Unrealized Gain (Loss) | | | | |
| Net realized gain (loss) on: | | | | |
| Investment Securities: | | | | |
| Unaffiliated issuers | | 31,370,399 | | |
| Foreign currency transactions | | (30,407) | | |
| Total net realized gain (loss) | | | | 31,339,992 |
| Change in net unrealized appreciation (depreciation) on: | | | | |
| Investment Securities: | | | | |
| Unaffiliated issuers | | 174,789,416 | | |
| Assets and liabilities in foreign currencies | | (1,245) | | |
| Total change in net unrealized appreciation (depreciation) | | | | 174,788,171 |
| Net gain (loss) | | | | 206,128,163 |
| Net increase (decrease) in net assets resulting from operations | | | $ | 226,174,925 |
| Statement of Changes in Net Assets |
| |
| | Six months ended January 31, 2023 (Unaudited) | | Year ended July 31, 2022 |
| Increase (Decrease) in Net Assets | | | | |
| Operations | | | | |
| Net investment income (loss) | $ | 20,046,762 | $ | 24,482,840 |
| Net realized gain (loss) | | 31,339,992 | | 12,411,332 |
| Change in net unrealized appreciation (depreciation) | | 174,788,171 | | 401,011,911 |
| Net increase (decrease) in net assets resulting from operations | | 226,174,925 | | 437,906,083 |
| Distributions to shareholders | | (33,437,833) | | (14,774,337) |
| Share transactions - net increase (decrease) | | 108,933,840 | | 401,499,038 |
| Total increase (decrease) in net assets | | 301,670,932 | | 824,630,784 |
| | | | | |
| Net Assets | | | | |
| Beginning of period | | 1,377,589,961 | | 552,959,177 |
| End of period | $ | 1,679,260,893 | $ | 1,377,589,961 |
| | | | | |
| | | | | |
Financial Highlights
| Fidelity Advisor® Energy Fund Class A |
| |
| | Six months ended (Unaudited) January 31, 2023 | | Years ended July 31, 2022 | | 2021 | | 2020 | | 2019 | | 2018 |
Selected Per-Share Data | | | | | | | | | | | | |
| Net asset value, beginning of period | $ | 39.49 | $ | 23.59 | $ | 16.59 | $ | 27.88 | $ | 37.52 | $ | 30.70 |
| Income from Investment Operations | | | | | | | | | | | | |
Net investment income (loss) A,B | | .53 | | .80 | | .65 C | | .57 | | .35 | | .12 |
| Net realized and unrealized gain (loss) | | 5.87 | | 15.68 | | 6.94 | | (11.42) | | (9.76) | | 7.18 |
| Total from investment operations | | 6.40 | | 16.48 | | 7.59 | | (10.85) | | (9.41) | | 7.30 |
| Distributions from net investment income | | (.90) | | (.58) | | (.59) | | (.44) | | (.18) D | | (.48) |
| Distributions from net realized gain | | - | | - | | - | | - | | (.05) D | | - E |
| Total distributions | | (.90) | | (.58) | | (.59) | | (.44) | | (.23) | | (.48) |
| Net asset value, end of period | $ | 44.99 | $ | 39.49 | $ | 23.59 | $ | 16.59 | $ | 27.88 | $ | 37.52 |
Total Return F,G,H | | 16.41% | | 71.12% | | 46.78% | | (39.54)% | | (25.07)% | | 24.07% |
Ratios to Average Net Assets B,I,J | | | | | | | | | | | | |
| Expenses before reductions | | 1.01% K | | 1.05% | | 1.11% | | 1.14% | | 1.10% | | 1.11% |
| Expenses net of fee waivers, if any | | 1.01% K | | 1.04% | | 1.11% | | 1.14% | | 1.10% | | 1.11% |
| Expenses net of all reductions | | 1.01% K | | 1.04% | | 1.11% | | 1.12% | | 1.09% | | 1.10% |
| Net investment income (loss) | | 2.53% K | | 2.43% | | 3.15% C | | 2.62% | | 1.14% | | .36% |
| Supplemental Data | | | | | | | | | | | | |
| Net assets, end of period (000 omitted) | $ | 437,344 | $ | 361,023 | $ | 175,221 | $ | 114,321 | $ | 190,992 | $ | 278,555 |
Portfolio turnover rate L | | 18% K | | 37% | | 45% | | 84% M | | 47% | | 56% |
A Calculated based on average shares outstanding during the period.
B Net investment income (loss) is affected by the timing of the declaration of dividends by any underlying mutual funds or exchange-traded funds (ETFs). Net investment income (loss) of any mutual funds or ETFs is not included in the Fund's net investment income (loss) ratio.
C Net investment income per share reflects one or more large, non-recurring dividend(s) which amounted to $.11 per share. Excluding such non-recurring dividend(s), the ratio of net investment income (loss) to average net assets would have been 2.60%.
D The amount shown reflects reclassifications related to book to tax differences that were made in the year shown.
E Amount represents less than $.005 per share.
F Total returns for periods of less than one year are not annualized.
G Total returns would have been lower if certain expenses had not been reduced during the applicable periods shown.
H Total returns do not include the effect of the sales charges.
I Fees and expenses of any underlying mutual funds or exchange-traded funds (ETFs) are not included in the Fund's expense ratio. The Fund indirectly bears its proportionate share of these expenses. For additional expense information related to investments in Fidelity Central Funds, please refer to the "Investments in Fidelity Central Funds" note found in the Notes to Financial Statements section of the most recent Annual or Semi-Annual report.
J Expense ratios reflect operating expenses of the class. Expenses before reductions do not reflect amounts reimbursed, waived, or reduced through arrangements with the investment adviser, brokerage services, or other offset arrangements, if applicable, and do not represent the amount paid by the class during periods when reimbursements, waivers or reductions occur.
K Annualized.
L Amount does not include the portfolio activity of any underlying mutual funds or exchange-traded funds (ETFs).
M Portfolio turnover rate excludes securities received or delivered in-kind.
| Fidelity Advisor® Energy Fund Class M |
| |
| | Six months ended (Unaudited) January 31, 2023 | | Years ended July 31, 2022 | | 2021 | | 2020 | | 2019 | | 2018 |
Selected Per-Share Data | | | | | | | | | | | | |
| Net asset value, beginning of period | $ | 40.53 | $ | 24.20 | $ | 17.00 | $ | 28.53 | $ | 38.36 | $ | 31.37 |
| Income from Investment Operations | | | | | | | | | | | | |
Net investment income (loss) A,B | | .49 | | .73 | | .60 C | | .53 | | .27 | | .03 |
| Net realized and unrealized gain (loss) | | 6.02 | | 16.11 | | 7.13 | | (11.71) | | (9.97) | | 7.35 |
| Total from investment operations | | 6.51 | | 16.84 | | 7.73 | | (11.18) | | (9.70) | | 7.38 |
| Distributions from net investment income | | (.77) | | (.51) | | (.53) | | (.35) | | (.08) D | | (.39) |
| Distributions from net realized gain | | - | | - | | - | | - | | (.05) D | | - E |
| Total distributions | | (.77) | | (.51) | | (.53) | | (.35) | | (.13) | | (.39) |
| Net asset value, end of period | $ | 46.27 | $ | 40.53 | $ | 24.20 | $ | 17.00 | $ | 28.53 | $ | 38.36 |
Total Return F,G,H | | 16.24% | | 70.66% | | 46.37% | | (39.66)% | | (25.28)% | | 23.75% |
Ratios to Average Net Assets B,I,J | | | | | | | | | | | | |
| Expenses before reductions | | 1.27% K | | 1.31% | | 1.38% | | 1.40% | | 1.37% | | 1.38% |
| Expenses net of fee waivers, if any | | 1.27% K | | 1.31% | | 1.38% | | 1.40% | | 1.36% | | 1.38% |
| Expenses net of all reductions | | 1.27% K | | 1.31% | | 1.38% | | 1.38% | | 1.36% | | 1.37% |
| Net investment income (loss) | | 2.27% K | | 2.16% | | 2.88% C | | 2.36% | | .88% | | .09% |
| Supplemental Data | | | | | | | | | | | | |
| Net assets, end of period (000 omitted) | $ | 125,564 | $ | 114,014 | $ | 62,519 | $ | 43,768 | $ | 87,147 | $ | 136,828 |
Portfolio turnover rate L | | 18% K | | 37% | | 45% | | 84% M | | 47% | | 56% |
A Calculated based on average shares outstanding during the period.
B Net investment income (loss) is affected by the timing of the declaration of dividends by any underlying mutual funds or exchange-traded funds (ETFs). Net investment income (loss) of any mutual funds or ETFs is not included in the Fund's net investment income (loss) ratio.
C Net investment income per share reflects one or more large, non-recurring dividend(s) which amounted to $.11 per share. Excluding such non-recurring dividend(s), the ratio of net investment income (loss) to average net assets would have been 2.34%.
D The amount shown reflects reclassifications related to book to tax differences that were made in the year shown.
E Amount represents less than $.005 per share.
F Total returns for periods of less than one year are not annualized.
G Total returns would have been lower if certain expenses had not been reduced during the applicable periods shown.
H Total returns do not include the effect of the sales charges.
I Fees and expenses of any underlying mutual funds or exchange-traded funds (ETFs) are not included in the Fund's expense ratio. The Fund indirectly bears its proportionate share of these expenses. For additional expense information related to investments in Fidelity Central Funds, please refer to the "Investments in Fidelity Central Funds" note found in the Notes to Financial Statements section of the most recent Annual or Semi-Annual report.
J Expense ratios reflect operating expenses of the class. Expenses before reductions do not reflect amounts reimbursed, waived, or reduced through arrangements with the investment adviser, brokerage services, or other offset arrangements, if applicable, and do not represent the amount paid by the class during periods when reimbursements, waivers or reductions occur.
K Annualized.
L Amount does not include the portfolio activity of any underlying mutual funds or exchange-traded funds (ETFs).
M Portfolio turnover rate excludes securities received or delivered in-kind.
| Fidelity Advisor® Energy Fund Class C |
| |
| | Six months ended (Unaudited) January 31, 2023 | | Years ended July 31, 2022 | | 2021 | | 2020 | | 2019 | | 2018 |
Selected Per-Share Data | | | | | | | | | | | | |
| Net asset value, beginning of period | $ | 36.08 | $ | 21.60 | $ | 15.23 | $ | 25.58 | $ | 34.39 | $ | 28.16 |
| Income from Investment Operations | | | | | | | | | | | | |
Net investment income (loss) A,B | | .34 | | .51 | | .45 C | | .39 | | .12 | | (.11) |
| Net realized and unrealized gain (loss) | | 5.37 | | 14.38 | | 6.38 | | (10.52) | | (8.93) | | 6.59 |
| Total from investment operations | | 5.71 | | 14.89 | | 6.83 | | (10.13) | | (8.81) | | 6.48 |
| Distributions from net investment income | | (.64) | | (.41) | | (.46) | | (.22) | | - | | (.24) |
| Distributions from net realized gain | | - | | - | | - | | - | | - | | - D |
| Total distributions | | (.64) | | (.41) | | (.46) | | (.22) | | - | | (.25) E |
| Net asset value, end of period | $ | 41.15 | $ | 36.08 | $ | 21.60 | $ | 15.23 | $ | 25.58 | $ | 34.39 |
Total Return F,G,H | | 15.99% | | 69.86% | | 45.68% | | (39.95)% | | (25.62)% | | 23.16% |
Ratios to Average Net Assets B,I,J | | | | | | | | | | | | |
| Expenses before reductions | | 1.76% K | | 1.79% | | 1.84% | | 1.86% | | 1.82% | | 1.84% |
| Expenses net of fee waivers, if any | | 1.76% K | | 1.78% | | 1.84% | | 1.86% | | 1.82% | | 1.83% |
| Expenses net of all reductions | | 1.76% K | | 1.78% | | 1.84% | | 1.84% | | 1.81% | | 1.83% |
| Net investment income (loss) | | 1.78% K | | 1.69% | | 2.42% C | | 1.90% | | .42% | | (.37)% |
| Supplemental Data | | | | | | | | | | | | |
| Net assets, end of period (000 omitted) | $ | 115,689 | $ | 105,747 | $ | 56,068 | $ | 45,212 | $ | 90,437 | $ | 179,521 |
Portfolio turnover rate L | | 18% K | | 37% | | 45% | | 84% M | | 47% | | 56% |
A Calculated based on average shares outstanding during the period.
B Net investment income (loss) is affected by the timing of the declaration of dividends by any underlying mutual funds or exchange-traded funds (ETFs). Net investment income (loss) of any mutual funds or ETFs is not included in the Fund's net investment income (loss) ratio.
C Net investment income per share reflects one or more large, non-recurring dividend(s) which amounted to $.10 per share. Excluding such non-recurring dividend(s), the ratio of net investment income (loss) to average net assets would have been 1.88%.
D Amount represents less than $.005 per share.
E Total distributions per share do not sum due to rounding.
F Total returns for periods of less than one year are not annualized.
G Total returns would have been lower if certain expenses had not been reduced during the applicable periods shown.
H Total returns do not include the effect of the contingent deferred sales charge.
I Fees and expenses of any underlying mutual funds or exchange-traded funds (ETFs) are not included in the Fund's expense ratio. The Fund indirectly bears its proportionate share of these expenses. For additional expense information related to investments in Fidelity Central Funds, please refer to the "Investments in Fidelity Central Funds" note found in the Notes to Financial Statements section of the most recent Annual or Semi-Annual report.
J Expense ratios reflect operating expenses of the class. Expenses before reductions do not reflect amounts reimbursed, waived, or reduced through arrangements with the investment adviser, brokerage services, or other offset arrangements, if applicable, and do not represent the amount paid by the class during periods when reimbursements, waivers or reductions occur.
K Annualized.
L Amount does not include the portfolio activity of any underlying mutual funds or exchange-traded funds (ETFs).
M Portfolio turnover rate excludes securities received or delivered in-kind.
| Fidelity Advisor® Energy Fund Class I |
| |
| | Six months ended (Unaudited) January 31, 2023 | | Years ended July 31, 2022 | | 2021 | | 2020 | | 2019 | | 2018 |
Selected Per-Share Data | | | | | | | | | | | | |
| Net asset value, beginning of period | $ | 41.83 | $ | 24.95 | $ | 17.51 | $ | 29.39 | $ | 39.57 | $ | 32.36 |
| Income from Investment Operations | | | | | | | | | | | | |
Net investment income (loss) A,B | | .63 | | .97 | | .74 C | | .67 | | .47 | | .23 |
| Net realized and unrealized gain (loss) | | 6.21 | | 16.57 | | 7.35 | | (12.02) | | (10.31) | | 7.57 |
| Total from investment operations | | 6.84 | | 17.54 | | 8.09 | | (11.35) | | (9.84) | | 7.80 |
| Distributions from net investment income | | (1.00) | | (.66) | | (.65) | | (.53) | | (.30) D | | (.58) |
| Distributions from net realized gain | | - | | - | | - | | - | | (.05) D | | - E |
| Total distributions | | (1.00) | | (.66) | | (.65) | | (.53) | | (.34) F | | (.59) F |
| Net asset value, end of period | $ | 47.67 | $ | 41.83 | $ | 24.95 | $ | 17.51 | $ | 29.39 | $ | 39.57 |
Total Return G,H | | 16.57% | | 71.63% | | 47.26% | | (39.33)% | | (24.85)% | | 24.43% |
Ratios to Average Net Assets B,I,J | | | | | | | | | | | | |
| Expenses before reductions | | .74% K | | .76% | | .79% | | .82% | | .80% | | .83% |
| Expenses net of fee waivers, if any | | .74% K | | .76% | | .79% | | .82% | | .80% | | .83% |
| Expenses net of all reductions | | .74% K | | .76% | | .79% | | .80% | | .79% | | .82% |
| Net investment income (loss) | | 2.80% K | | 2.71% | | 3.47% C | | 2.95% | | 1.44% | | .64% |
| Supplemental Data | | | | | | | | | | | | |
| Net assets, end of period (000 omitted) | $ | 657,472 | $ | 533,005 | $ | 177,248 | $ | 154,575 | $ | 224,599 | $ | 373,714 |
Portfolio turnover rate L | | 18% K | | 37% | | 45% | | 84% M | | 47% | | 56% |
A Calculated based on average shares outstanding during the period.
B Net investment income (loss) is affected by the timing of the declaration of dividends by any underlying mutual funds or exchange-traded funds (ETFs). Net investment income (loss) of any mutual funds or ETFs is not included in the Fund's net investment income (loss) ratio.
C Net investment income per share reflects one or more large, non-recurring dividend(s) which amounted to $.12 per share. Excluding such non-recurring dividend(s), the ratio of net investment income (loss) to average net assets would have been 2.93%.
D The amount shown reflects reclassifications related to book to tax differences that were made in the year shown.
E Amount represents less than $.005 per share.
F Total distributions per share do not sum due to rounding.
G Total returns for periods of less than one year are not annualized.
H Total returns would have been lower if certain expenses had not been reduced during the applicable periods shown.
I Fees and expenses of any underlying mutual funds or exchange-traded funds (ETFs) are not included in the Fund's expense ratio. The Fund indirectly bears its proportionate share of these expenses. For additional expense information related to investments in Fidelity Central Funds, please refer to the "Investments in Fidelity Central Funds" note found in the Notes to Financial Statements section of the most recent Annual or Semi-Annual report.
J Expense ratios reflect operating expenses of the class. Expenses before reductions do not reflect amounts reimbursed, waived, or reduced through arrangements with the investment adviser, brokerage services, or other offset arrangements, if applicable, and do not represent the amount paid by the class during periods when reimbursements, waivers or reductions occur.
K Annualized.
L Amount does not include the portfolio activity of any underlying mutual funds or exchange-traded funds (ETFs).
M Portfolio turnover rate excludes securities received or delivered in-kind.
| Fidelity Advisor® Energy Fund Class Z |
| |
| | Six months ended (Unaudited) January 31, 2023 | | Years ended July 31, 2022 | | 2021 | | 2020 | | 2019 A |
Selected Per-Share Data | | | | | | | | | | |
| Net asset value, beginning of period | $ | 41.75 | $ | 24.91 | $ | 17.48 | $ | 29.35 | $ | 39.35 |
| Income from Investment Operations | | | | | | | | | | |
Net investment income (loss) B,C | | .65 | | 1.02 | | .80 D | | .69 | | .45 |
| Net realized and unrealized gain (loss) | | 6.20 | | 16.52 | | 7.30 | | (11.97) | | (10.03) |
| Total from investment operations | | 6.85 | | 17.54 | | 8.10 | | (11.28) | | (9.58) |
| Distributions from net investment income | | (1.04) | | (.70) | | (.67) | | (.59) | | (.37) E |
| Distributions from net realized gain | | - | | - | | - | | - | | (.05) E |
| Total distributions | | (1.04) | | (.70) | | (.67) | | (.59) | | (.42) |
| Net asset value, end of period | $ | 47.56 | $ | 41.75 | $ | 24.91 | $ | 17.48 | $ | 29.35 |
Total Return F,G | | 16.64% | | 71.83% | | 47.47% | | (39.22)% | | (24.34)% |
Ratios to Average Net Assets C,H,I | | | | | | | | | | |
| Expenses before reductions | | .62% J | | .63% | | .65% | | .66% | | .65% J |
| Expenses net of fee waivers, if any | | .62% J | | .62% | | .64% | | .66% | | .64% J |
| Expenses net of all reductions | | .62% J | | .62% | | .64% | | .64% | | .64% J |
| Net investment income (loss) | | 2.92% J | | 2.85% | | 3.62% D | | 3.10% | | 1.82% J |
| Supplemental Data | | | | | | | | | | |
| Net assets, end of period (000 omitted) | $ | 343,190 | $ | 263,802 | $ | 81,903 | $ | 40,742 | $ | 9,255 |
Portfolio turnover rate K | | 18% J | | 37% | | 45% | | 84% L | | 47% |
A For the period October 2, 2018 (commencement of sale of shares) through July 31, 2019.
B Calculated based on average shares outstanding during the period.
C Net investment income (loss) is affected by the timing of the declaration of dividends by any underlying mutual funds or exchange-traded funds (ETFs). Net investment income (loss) of any mutual funds or ETFs is not included in the Fund's net investment income (loss) ratio.
D Net investment income per share reflects one or more large, non-recurring dividend(s) which amounted to $.12 per share. Excluding such non-recurring dividend(s), the ratio of net investment income (loss) to average net assets would have been 3.07%.
E The amount shown reflects reclassifications related to book to tax differences that were made in the year shown.
F Total returns for periods of less than one year are not annualized.
G Total returns would have been lower if certain expenses had not been reduced during the applicable periods shown.
H Fees and expenses of any underlying mutual funds or exchange-traded funds (ETFs) are not included in the Fund's expense ratio. The Fund indirectly bears its proportionate share of these expenses. For additional expense information related to investments in Fidelity Central Funds, please refer to the "Investments in Fidelity Central Funds" note found in the Notes to Financial Statements section of the most recent Annual or Semi-Annual report.
I Expense ratios reflect operating expenses of the class. Expenses before reductions do not reflect amounts reimbursed, waived, or reduced through arrangements with the investment adviser, brokerage services, or other offset arrangements, if applicable, and do not represent the amount paid by the class during periods when reimbursements, waivers or reductions occur.
J Annualized.
K Amount does not include the portfolio activity of any underlying mutual funds or exchange-traded funds (ETFs).
L Portfolio turnover rate excludes securities received or delivered in-kind.
Top Holdings (% of Fund's net assets) |
| |
| Wells Fargo & Co. | 5.2 | |
| Bank of America Corp. | 5.2 | |
| JPMorgan Chase & Co. | 4.6 | |
| Morgan Stanley | 3.7 | |
| Chubb Ltd. | 3.4 | |
| Citigroup, Inc. | 3.3 | |
| State Street Corp. | 3.3 | |
| U.S. Bancorp | 3.0 | |
| Marsh & McLennan Companies, Inc. | 2.9 | |
| Reinsurance Group of America, Inc. | 2.8 | |
| | 37.4 | |
| |
| Industries (% of Fund's net assets) |
| |
| Banks | 38.3 | |
| Insurance | 26.6 | |
| Capital Markets | 19.3 | |
| Consumer Finance | 4.7 | |
| IT Services | 3.7 | |
| Thrifts & Mortgage Finance | 3.3 | |
| Diversified Financial Services | 2.8 | |
| Professional Services | 0.9 | |
| Software | 0.4 | |
| |
Geographic Diversification (% of Fund's net assets) |
|
* Includes Short-Term investments and Net Other Assets (Liabilities). Percentages are based on country or territory of incorporation and are adjusted for the effect of derivatives, if applicable. |
| |
Fidelity Advisor® Financial Services Fund
Showing Percentage of Net Assets
| Common Stocks - 99.5% |
| | | Shares | Value ($) |
| Banks - 38.3% | | | |
| Diversified Banks - 21.3% | | | |
| Bank of America Corp. | | 855,556 | 30,355,127 |
| Citigroup, Inc. | | 371,405 | 19,394,769 |
| JPMorgan Chase & Co. | | 195,700 | 27,390,172 |
| U.S. Bancorp | | 359,800 | 17,918,040 |
| Wells Fargo & Co. | | 659,328 | 30,902,702 |
| | | | 125,960,810 |
| Regional Banks - 17.0% | | | |
| Associated Banc-Corp. | | 212,400 | 4,759,884 |
| BankUnited, Inc. | | 78,100 | 2,939,684 |
| Cadence Bank | | 162,524 | 4,157,364 |
| Comerica, Inc. | | 55,400 | 4,061,374 |
| East West Bancorp, Inc. | | 86,400 | 6,784,128 |
| First Citizens Bancshares, Inc. | | 10,300 | 8,010,104 |
| First Interstate Bancsystem, Inc. | | 131,752 | 4,727,262 |
| Heartland Financial U.S.A., Inc. | | 84,828 | 4,196,441 |
| KeyCorp | | 447,000 | 8,577,930 |
| M&T Bank Corp. | | 81,888 | 12,774,528 |
| PacWest Bancorp | | 115,700 | 3,200,262 |
| Popular, Inc. | | 93,071 | 6,388,393 |
| Signature Bank | | 46,200 | 5,957,490 |
| Truist Financial Corp. | | 226,100 | 11,167,079 |
| UMB Financial Corp. | | 39,500 | 3,562,505 |
| Wintrust Financial Corp. | | 50,466 | 4,616,125 |
| Zions Bancorp NA | | 80,400 | 4,274,064 |
| | | | 100,154,617 |
TOTAL BANKS | | | 226,115,427 |
| Capital Markets - 19.3% | | | |
| Asset Management & Custody Banks - 9.3% | | | |
| Affiliated Managers Group, Inc. | | 26,404 | 4,561,027 |
| Bank of New York Mellon Corp. | | 180,200 | 9,112,714 |
| Brookfield Asset Management Ltd. Class A (a) | | 26,175 | 854,614 |
| Brookfield Corp. Class A | | 104,700 | 3,894,840 |
| Carlyle Group LP | | 253,800 | 9,129,186 |
| Northern Trust Corp. | | 40,400 | 3,917,588 |
| Patria Investments Ltd. | | 281,300 | 4,340,459 |
| Phoenix Vega Mezz PLC | | 192,600 | 8,187 |
| State Street Corp. | | 212,200 | 19,380,226 |
| | | | 55,198,841 |
| Financial Exchanges & Data - 3.5% | | | |
| Bolsa Mexicana de Valores S.A.B. de CV | | 1,795,500 | 3,894,120 |
| Cboe Global Markets, Inc. | | 23,473 | 2,884,362 |
| CME Group, Inc. | | 78,400 | 13,850,144 |
| | | | 20,628,626 |
| Investment Banking & Brokerage - 6.5% | | | |
| Lazard Ltd. Class A | | 120,052 | 4,811,684 |
| Morgan Stanley | | 220,100 | 21,422,333 |
| Raymond James Financial, Inc. | | 74,050 | 8,350,619 |
| Virtu Financial, Inc. Class A | | 184,860 | 3,569,647 |
| | | | 38,154,283 |
TOTAL CAPITAL MARKETS | | | 113,981,750 |
| Consumer Finance - 4.7% | | | |
| Consumer Finance - 4.7% | | | |
| Capital One Financial Corp. | | 128,438 | 15,284,122 |
| FirstCash Holdings, Inc. | | 73,851 | 6,807,585 |
| OneMain Holdings, Inc. | | 126,100 | 5,439,954 |
| | | | 27,531,661 |
| Diversified Financial Services - 2.8% | | | |
| Multi-Sector Holdings - 0.8% | | | |
| Cannae Holdings, Inc. (a) | | 206,440 | 5,045,394 |
| Other Diversified Financial Services - 2.0% | | | |
| Apollo Global Management, Inc. | | 166,400 | 11,777,792 |
| Sunrisemezz Ltd. (a) | | 45,000 | 5,513 |
| | | | 11,783,305 |
TOTAL DIVERSIFIED FINANCIAL SERVICES | | | 16,828,699 |
| Insurance - 26.6% | | | |
| Insurance Brokers - 4.8% | | | |
| Arthur J. Gallagher & Co. | | 58,900 | 11,527,908 |
| Marsh & McLennan Companies, Inc. | | 97,200 | 17,001,252 |
| | | | 28,529,160 |
| Life & Health Insurance - 2.9% | | | |
| Globe Life, Inc. | | 93,027 | 11,242,313 |
| Primerica, Inc. | | 35,300 | 5,709,775 |
| | | | 16,952,088 |
| Multi-Line Insurance - 1.8% | | | |
| Assurant, Inc. | | 200 | 26,518 |
| Hartford Financial Services Group, Inc. | | 137,400 | 10,663,614 |
| | | | 10,690,132 |
| Property & Casualty Insurance - 14.3% | | | |
| American Financial Group, Inc. | | 48,400 | 6,901,356 |
| Beazley PLC | | 737,300 | 6,044,719 |
| Chubb Ltd. | | 88,300 | 20,087,367 |
| Direct Line Insurance Group PLC | | 2,035,800 | 4,453,704 |
| Fidelity National Financial, Inc. | | 176,700 | 7,780,101 |
| First American Financial Corp. | | 155,819 | 9,640,522 |
| Hiscox Ltd. | | 466,600 | 6,468,662 |
| Lancashire Holdings Ltd. | | 594,800 | 4,583,120 |
| Selective Insurance Group, Inc. | | 44,446 | 4,222,370 |
| The Travelers Companies, Inc. | | 76,303 | 14,583,029 |
| | | | 84,764,950 |
| Reinsurance - 2.8% | | | |
| Reinsurance Group of America, Inc. | | 108,700 | 16,497,399 |
TOTAL INSURANCE | | | 157,433,729 |
| IT Services - 3.2% | | | |
| Data Processing & Outsourced Services - 3.2% | | | |
| Fidelity National Information Services, Inc. | | 27,400 | 2,056,096 |
| Global Payments, Inc. | | 63,500 | 7,157,720 |
| MasterCard, Inc. Class A | | 26,500 | 9,820,900 |
| | | | 19,034,716 |
| Professional Services - 0.9% | | | |
| Research & Consulting Services - 0.9% | | | |
| Dun & Bradstreet Holdings, Inc. | | 198,700 | 2,910,955 |
| Equifax, Inc. | | 11,000 | 2,444,200 |
| | | | 5,355,155 |
| Software - 0.4% | | | |
| Application Software - 0.4% | | | |
| Black Knight, Inc. (a) | | 39,300 | 2,381,187 |
| Thrifts & Mortgage Finance - 3.3% | | | |
| Thrifts & Mortgage Finance - 3.3% | | | |
| Essent Group Ltd. | | 176,000 | 7,749,280 |
| NMI Holdings, Inc. (a) | | 342,989 | 7,967,634 |
| Walker & Dunlop, Inc. | | 36,900 | 3,519,522 |
| | | | 19,236,436 |
| TOTAL COMMON STOCKS (Cost $493,398,399) | | | 587,898,760 |
| | | | |
| Convertible Bonds - 0.5% |
| | | Principal Amount (b) | Value ($) |
| IT Services - 0.5% | | | |
| Data Processing & Outsourced Services - 0.5% | | | |
Affirm Holdings, Inc. 0% 11/15/26 (Cost $3,116,255) | | 4,915,000 | 3,105,789 |
| | | | |
| Money Market Funds - 0.5% |
| | | Shares | Value ($) |
Fidelity Cash Central Fund 4.38% (c) (Cost $2,575,881) | | 2,575,366 | 2,575,881 |
| | | | |
| TOTAL INVESTMENT IN SECURITIES - 100.5% (Cost $499,090,535) | 593,580,430 |
NET OTHER ASSETS (LIABILITIES) - (0.5)% | (2,927,783) |
| NET ASSETS - 100.0% | 590,652,647 |
| | |
Legend
| (b) | Amount is stated in United States dollars unless otherwise noted. |
| (c) | Affiliated fund that is generally available only to investment companies and other accounts managed by Fidelity Investments. The rate quoted is the annualized seven-day yield of the fund at period end. A complete unaudited listing of the fund's holdings as of its most recent quarter end is available upon request. In addition, each Fidelity Central Fund's financial statements are available on the SEC's website or upon request. |
Affiliated Central Funds
Fiscal year to date information regarding the Fund's investments in Fidelity Central Funds, including the ownership percentage, is presented below.
| Affiliate | Value, beginning of period ($) | Purchases ($) | Sales Proceeds ($) | Dividend Income ($) | Realized Gain (loss) ($) | Change in Unrealized appreciation (depreciation) ($) | Value, end of period ($) | % ownership, end of period |
| Fidelity Cash Central Fund 4.38% | 1,162,568 | 94,971,604 | 93,558,291 | 39,916 | - | - | 2,575,881 | 0.0% |
| Fidelity Securities Lending Cash Central Fund 4.38% | 4,928,049 | 38,191,452 | 43,119,501 | 3,057 | - | - | - | 0.0% |
| Total | 6,090,617 | 133,163,056 | 136,677,792 | 42,973 | - | - | 2,575,881 | |
| | | | | | | | | |
Amounts in the dividend income column in the above table include any capital gain distributions from underlying funds, which are presented in the corresponding line item in the Statement of Operations, if applicable.
Amount for Fidelity Securities Lending Cash Central Fund represents the income earned on investing cash collateral, less rebates paid to borrowers and any lending agent fees associated with the loan, plus any premium payments received for lending certain types of securities.
Amounts included in the purchases and sales proceeds columns may include in-kind transactions, if applicable.
Investment Valuation
The following is a summary of the inputs used, as of January 31, 2023, involving the Fund's assets and liabilities carried at fair value. The inputs or methodology used for valuing securities may not be an indication of the risk associated with investing in those securities. For more information on valuation inputs, and their aggregation into the levels used below, please refer to the Investment Valuation section in the accompanying Notes to Financial Statements.
| Valuation Inputs at Reporting Date: |
| Description | Total ($) | Level 1 ($) | Level 2 ($) | Level 3 ($) |
Investments in Securities: | | | | |
|
| Common Stocks | 587,898,760 | 587,898,760 | - | - |
|
| Convertible Bonds | 3,105,789 | - | 3,105,789 | - |
|
| Money Market Funds | 2,575,881 | 2,575,881 | - | - |
| Total Investments in Securities: | 593,580,430 | 590,474,641 | 3,105,789 | - |
Fidelity Advisor® Financial Services Fund
| Statement of Assets and Liabilities |
| | | | January 31, 2023 (Unaudited) |
| | | | | |
| Assets | | | | |
| Investment in securities, at value - See accompanying schedule: | | | | |
Unaffiliated issuers (cost $496,514,654) | $ | 591,004,549 | | |
Fidelity Central Funds (cost $2,575,881) | | 2,575,881 | | |
| | | | | |
| | | | | |
| Total Investment in Securities (cost $499,090,535) | | | $ | 593,580,430 |
| Receivable for investments sold | | | | 872,590 |
| Receivable for fund shares sold | | | | 406,469 |
| Dividends receivable | | | | 361,348 |
| Distributions receivable from Fidelity Central Funds | | | | 17,310 |
| Prepaid expenses | | | | 1,830 |
Total assets | | | | 595,239,977 |
| Liabilities | | | | |
| Payable for investments purchased | $ | 3,094,007 | | |
| Payable for fund shares redeemed | | 1,005,074 | | |
| Accrued management fee | | 250,751 | | |
| Distribution and service plan fees payable | | 115,011 | | |
| Other affiliated payables | | 87,508 | | |
| Other payables and accrued expenses | | 34,979 | | |
| Total Liabilities | | | | 4,587,330 |
| Net Assets | | | $ | 590,652,647 |
| Net Assets consist of: | | | | |
| Paid in capital | | | $ | 495,441,448 |
| Total accumulated earnings (loss) | | | | 95,211,199 |
| Net Assets | | | $ | 590,652,647 |
| | | | | |
| Net Asset Value and Maximum Offering Price | | | | |
| Class A : | | | | |
Net Asset Value and redemption price per share ($199,435,376 ÷ 7,312,587 shares) (a) | | | $ | 27.27 |
| Maximum offering price per share (100/94.25 of $27.27) | | | $ | 28.93 |
| Class M : | | | | |
Net Asset Value and redemption price per share ($73,493,295 ÷ 2,728,168 shares) (a) | | | $ | 26.94 |
| Maximum offering price per share (100/96.50 of $26.94) | | | $ | 27.92 |
| Class C : | | | | |
Net Asset Value and offering price per share ($55,639,628 ÷ 2,195,371 shares) (a) | | | $ | 25.34 |
| Class I : | | | | |
Net Asset Value , offering price and redemption price per share ($135,027,467 ÷ 4,786,493 shares) | | | $ | 28.21 |
| Class Z : | | | | |
Net Asset Value , offering price and redemption price per share ($127,056,881 ÷ 4,516,173 shares) | | | $ | 28.13 |
(a)Redemption price per share is equal to net asset value less any applicable contingent deferred sales charge. |
| Statement of Operations |
| | | | Six months ended January 31, 2023 (Unaudited) |
| Investment Income | | | | |
| Dividends | | | $ | 7,606,435 |
| Interest | | | | 178,534 |
| Income from Fidelity Central Funds (including $3,057 from security lending) | | | | 42,973 |
| Total Income | | | | 7,827,942 |
| Expenses | | | | |
| Management fee | $ | 1,411,005 | | |
| Transfer agent fees | | 427,539 | | |
| Distribution and service plan fees | | 681,389 | | |
| Accounting fees | | 92,676 | | |
| Custodian fees and expenses | | 13,053 | | |
| Independent trustees' fees and expenses | | 914 | | |
| Registration fees | | 66,678 | | |
| Audit | | 26,787 | | |
| Legal | | 575 | | |
| Miscellaneous | | 1,702 | | |
| Total expenses before reductions | | 2,722,318 | | |
| Expense reductions | | (10,169) | | |
| Total expenses after reductions | | | | 2,712,149 |
| Net Investment income (loss) | | | | 5,115,793 |
| Realized and Unrealized Gain (Loss) | | | | |
| Net realized gain (loss) on: | | | | |
| Investment Securities: | | | | |
| Unaffiliated issuers | | 7,967,780 | | |
| Foreign currency transactions | | 12,859 | | |
| Total net realized gain (loss) | | | | 7,980,639 |
| Change in net unrealized appreciation (depreciation) on investment securities | | | | 42,670,156 |
| Net gain (loss) | | | | 50,650,795 |
| Net increase (decrease) in net assets resulting from operations | | | $ | 55,766,588 |
| Statement of Changes in Net Assets |
| |
| | Six months ended January 31, 2023 (Unaudited) | | Year ended July 31, 2022 |
| Increase (Decrease) in Net Assets | | | | |
| Operations | | | | |
| Net investment income (loss) | $ | 5,115,793 | $ | 8,232,044 |
| Net realized gain (loss) | | 7,980,639 | | 30,550,934 |
| Change in net unrealized appreciation (depreciation) | | 42,670,156 | | (69,481,639) |
| Net increase (decrease) in net assets resulting from operations | | 55,766,588 | | (30,698,661) |
| Distributions to shareholders | | (30,785,439) | | (21,010,596) |
| Share transactions - net increase (decrease) | | 54,778,507 | | 95,349,433 |
| Total increase (decrease) in net assets | | 79,759,656 | | 43,640,176 |
| | | | | |
| Net Assets | | | | |
| Beginning of period | | 510,892,991 | | 467,252,815 |
| End of period | $ | 590,652,647 | $ | 510,892,991 |
| | | | | |
| | | | | |
Financial Highlights
| Fidelity Advisor® Financial Services Fund Class A |
| |
| | Six months ended (Unaudited) January 31, 2023 | | Years ended July 31, 2022 | | 2021 | | 2020 | | 2019 | | 2018 |
Selected Per-Share Data | | | | | | | | | | | | |
| Net asset value, beginning of period | $ | 26.31 | $ | 28.41 | $ | 18.00 | $ | 21.47 | $ | 21.84 | $ | 19.55 |
| Income from Investment Operations | | | | | | | | | | | | |
Net investment income (loss) A,B | | .25 | | .44 | | .42 | | .40 | | .27 | | .12 |
| Net realized and unrealized gain (loss) | | 2.19 | | (1.32) | | 10.55 | | (3.59) | | .07 | | 2.25 |
| Total from investment operations | | 2.44 | | (.88) | | 10.97 | | (3.19) | | .34 | | 2.37 |
| Distributions from net investment income | | (.45) | | (.43) | | (.45) | | (.28) | | (.18) | | (.07) |
| Distributions from net realized gain | | (1.03) | | (.80) | | (.11) | | - | | (.53) | | (.01) |
| Total distributions | | (1.48) | | (1.22) C | | (.56) | | (.28) | | (.71) | | (.08) |
| Net asset value, end of period | $ | 27.27 | $ | 26.31 | $ | 28.41 | $ | 18.00 | $ | 21.47 | $ | 21.84 |
Total Return D,E,F | | 9.93% | | (3.40)% | | 61.84% | | (15.15)% | | 2.05% | | 12.13% |
Ratios to Average Net Assets B,G,H | | | | | | | | | | | | |
| Expenses before reductions | | 1.05% I | | 1.03% | | 1.07% | | 1.09% | | 1.08% | | 1.10% |
| Expenses net of fee waivers, if any | | 1.04% I | | 1.03% | | 1.07% | | 1.09% | | 1.07% | | 1.10% |
| Expenses net of all reductions | | 1.04% I | | 1.03% | | 1.06% | | 1.08% | | 1.07% | | 1.09% |
| Net investment income (loss) | | 1.89% I | | 1.55% | | 1.76% | | 1.97% | | 1.31% | | .55% |
| Supplemental Data | | | | | | | | | | | | |
| Net assets, end of period (000 omitted) | $ | 199,435 | $ | 189,413 | $ | 181,251 | $ | 104,761 | $ | 145,799 | $ | 174,786 |
Portfolio turnover rate J | | 46% I | | 40% | | 51% | | 88% K | | 51% | | 46% |
A Calculated based on average shares outstanding during the period.
B Net investment income (loss) is affected by the timing of the declaration of dividends by any underlying mutual funds or exchange-traded funds (ETFs). Net investment income (loss) of any mutual funds or ETFs is not included in the Fund's net investment income (loss) ratio.
C Total distributions per share do not sum due to rounding.
D Total returns for periods of less than one year are not annualized.
E Total returns would have been lower if certain expenses had not been reduced during the applicable periods shown.
F Total returns do not include the effect of the sales charges.
G Fees and expenses of any underlying mutual funds or exchange-traded funds (ETFs) are not included in the Fund's expense ratio. The Fund indirectly bears its proportionate share of these expenses. For additional expense information related to investments in Fidelity Central Funds, please refer to the "Investments in Fidelity Central Funds" note found in the Notes to Financial Statements section of the most recent Annual or Semi-Annual report.
H Expense ratios reflect operating expenses of the class. Expenses before reductions do not reflect amounts reimbursed, waived, or reduced through arrangements with the investment adviser, brokerage services, or other offset arrangements, if applicable, and do not represent the amount paid by the class during periods when reimbursements, waivers or reductions occur.
I Annualized.
J Amount does not include the portfolio activity of any underlying mutual funds or exchange-traded funds (ETFs).
K Portfolio turnover rate excludes securities received or delivered in-kind.
| Fidelity Advisor® Financial Services Fund Class M |
| |
| | Six months ended (Unaudited) January 31, 2023 | | Years ended July 31, 2022 | | 2021 | | 2020 | | 2019 | | 2018 |
Selected Per-Share Data | | | | | | | | | | | | |
| Net asset value, beginning of period | $ | 25.98 | $ | 28.08 | $ | 17.79 | $ | 21.23 | $ | 21.60 | $ | 19.34 |
| Income from Investment Operations | | | | | | | | | | | | |
Net investment income (loss) A,B | | .21 | | .37 | | .36 | | .34 | | .21 | | .06 |
| Net realized and unrealized gain (loss) | | 2.17 | | (1.31) | | 10.44 | | (3.55) | | .07 | | 2.23 |
| Total from investment operations | | 2.38 | | (.94) | | 10.80 | | (3.21) | | .28 | | 2.29 |
| Distributions from net investment income | | (.39) | | (.37) | | (.39) | | (.23) | | (.13) | | (.02) |
| Distributions from net realized gain | | (1.03) | | (.80) | | (.11) | | - | | (.53) | | (.01) |
| Total distributions | | (1.42) | | (1.16) C | | (.51) C | | (.23) | | (.65) C | | (.03) |
| Net asset value, end of period | $ | 26.94 | $ | 25.98 | $ | 28.08 | $ | 17.79 | $ | 21.23 | $ | 21.60 |
Total Return D,E,F | | 9.79% | | (3.63)% | | 61.48% | | (15.38)% | | 1.77% | | 11.84% |
Ratios to Average Net Assets B,G,H | | | | | | | | | | | | |
| Expenses before reductions | | 1.29% I | | 1.28% | | 1.32% | | 1.35% | | 1.34% | | 1.37% |
| Expenses net of fee waivers, if any | | 1.29% I | | 1.28% | | 1.32% | | 1.35% | | 1.34% | | 1.37% |
| Expenses net of all reductions | | 1.29% I | | 1.28% | | 1.31% | | 1.34% | | 1.33% | | 1.36% |
| Net investment income (loss) | | 1.64% I | | 1.30% | | 1.51% | | 1.72% | | 1.04% | | .28% |
| Supplemental Data | | | | | | | | | | | | |
| Net assets, end of period (000 omitted) | $ | 73,493 | $ | 69,176 | $ | 60,508 | $ | 34,828 | $ | 48,210 | $ | 53,178 |
Portfolio turnover rate J | | 46% I | | 40% | | 51% | | 88% K | | 51% | | 46% |
A Calculated based on average shares outstanding during the period.
B Net investment income (loss) is affected by the timing of the declaration of dividends by any underlying mutual funds or exchange-traded funds (ETFs). Net investment income (loss) of any mutual funds or ETFs is not included in the Fund's net investment income (loss) ratio.
C Total distributions per share do not sum due to rounding.
D Total returns for periods of less than one year are not annualized.
E Total returns would have been lower if certain expenses had not been reduced during the applicable periods shown.
F Total returns do not include the effect of the sales charges.
G Fees and expenses of any underlying mutual funds or exchange-traded funds (ETFs) are not included in the Fund's expense ratio. The Fund indirectly bears its proportionate share of these expenses. For additional expense information related to investments in Fidelity Central Funds, please refer to the "Investments in Fidelity Central Funds" note found in the Notes to Financial Statements section of the most recent Annual or Semi-Annual report.
H Expense ratios reflect operating expenses of the class. Expenses before reductions do not reflect amounts reimbursed, waived, or reduced through arrangements with the investment adviser, brokerage services, or other offset arrangements, if applicable, and do not represent the amount paid by the class during periods when reimbursements, waivers or reductions occur.
I Annualized.
J Amount does not include the portfolio activity of any underlying mutual funds or exchange-traded funds (ETFs).
K Portfolio turnover rate excludes securities received or delivered in-kind.
| Fidelity Advisor® Financial Services Fund Class C |
| |
| | Six months ended (Unaudited) January 31, 2023 | | Years ended July 31, 2022 | | 2021 | | 2020 | | 2019 | | 2018 |
Selected Per-Share Data | | | | | | | | | | | | |
| Net asset value, beginning of period | $ | 24.44 | $ | 26.48 | $ | 16.80 | $ | 20.04 | $ | 20.41 | $ | 18.34 |
| Income from Investment Operations | | | | | | | | | | | | |
Net investment income (loss) A,B | | .14 | | .21 | | .22 | | .23 | | .11 | | (.04) |
| Net realized and unrealized gain (loss) | | 2.04 | | (1.23) | | 9.85 | | (3.37) | | .07 | | 2.11 |
| Total from investment operations | | 2.18 | | (1.02) | | 10.07 | | (3.14) | | .18 | | 2.07 |
| Distributions from net investment income | | (.25) | | (.23) | | (.28) | | (.10) | | (.03) | | - |
| Distributions from net realized gain | | (1.03) | | (.80) | | (.11) | | - | | (.53) | | - |
| Total distributions | | (1.28) | | (1.02) C | | (.39) | | (.10) | | (.55) C | | - |
| Net asset value, end of period | $ | 25.34 | $ | 24.44 | $ | 26.48 | $ | 16.80 | $ | 20.04 | $ | 20.41 |
Total Return D,E,F | | 9.52% | | (4.13)% | | 60.62% | | (15.79)% | | 1.29% | | 11.29% |
Ratios to Average Net Assets B,G,H | | | | | | | | | | | | |
| Expenses before reductions | | 1.79% I | | 1.79% | | 1.83% | | 1.84% | | 1.83% | | 1.86% |
| Expenses net of fee waivers, if any | | 1.79% I | | 1.78% | | 1.82% | | 1.84% | | 1.82% | | 1.85% |
| Expenses net of all reductions | | 1.79% I | | 1.78% | | 1.82% | | 1.83% | | 1.82% | | 1.85% |
| Net investment income (loss) | | 1.14% I | | .80% | | 1.00% | | 1.22% | | .56% | | (.20)% |
| Supplemental Data | | | | | | | | | | | | |
| Net assets, end of period (000 omitted) | $ | 55,640 | $ | 58,177 | $ | 57,856 | $ | 41,947 | $ | 71,609 | $ | 120,947 |
Portfolio turnover rate J | | 46% I | | 40% | | 51% | | 88% K | | 51% | | 46% |
A Calculated based on average shares outstanding during the period.
B Net investment income (loss) is affected by the timing of the declaration of dividends by any underlying mutual funds or exchange-traded funds (ETFs). Net investment income (loss) of any mutual funds or ETFs is not included in the Fund's net investment income (loss) ratio.
C Total distributions per share do not sum due to rounding.
D Total returns for periods of less than one year are not annualized.
E Total returns would have been lower if certain expenses had not been reduced during the applicable periods shown.
F Total returns do not include the effect of the contingent deferred sales charge.
G Fees and expenses of any underlying mutual funds or exchange-traded funds (ETFs) are not included in the Fund's expense ratio. The Fund indirectly bears its proportionate share of these expenses. For additional expense information related to investments in Fidelity Central Funds, please refer to the "Investments in Fidelity Central Funds" note found in the Notes to Financial Statements section of the most recent Annual or Semi-Annual report.
H Expense ratios reflect operating expenses of the class. Expenses before reductions do not reflect amounts reimbursed, waived, or reduced through arrangements with the investment adviser, brokerage services, or other offset arrangements, if applicable, and do not represent the amount paid by the class during periods when reimbursements, waivers or reductions occur.
I Annualized.
J Amount does not include the portfolio activity of any underlying mutual funds or exchange-traded funds (ETFs).
K Portfolio turnover rate excludes securities received or delivered in-kind.
| Fidelity Advisor® Financial Services Fund Class I |
| |
| | Six months ended (Unaudited) January 31, 2023 | | Years ended July 31, 2022 | | 2021 | | 2020 | | 2019 | | 2018 |
Selected Per-Share Data | | | | | | | | | | | | |
| Net asset value, beginning of period | $ | 27.20 | $ | 29.32 | $ | 18.55 | $ | 22.11 | $ | 22.47 | $ | 20.11 |
| Income from Investment Operations | | | | | | | | | | | | |
Net investment income (loss) A,B | | .29 | | .54 | | .52 | | .47 | | .33 | | .18 |
| Net realized and unrealized gain (loss) | | 2.27 | | (1.37) | | 10.86 | | (3.69) | | .08 | | 2.32 |
| Total from investment operations | | 2.56 | | (.83) | | 11.38 | | (3.22) | | .41 | | 2.50 |
| Distributions from net investment income | | (.53) | | (.50) | | (.50) | | (.34) | | (.25) | | (.13) |
| Distributions from net realized gain | | (1.03) | | (.80) | | (.11) | | - | | (.53) | | (.01) |
| Total distributions | | (1.55) C | | (1.29) C | | (.61) | | (.34) | | (.77) C | | (.14) |
| Net asset value, end of period | $ | 28.21 | $ | 27.20 | $ | 29.32 | $ | 18.55 | $ | 22.11 | $ | 22.47 |
Total Return D,E | | 10.09% | | (3.13)% | | 62.31% | | (14.91)% | | 2.36% | | 12.43% |
Ratios to Average Net Assets B,F,G | | | | | | | | | | | | |
| Expenses before reductions | | .77% H | | .76% | | .79% | | .80% | | .80% | | .83% |
| Expenses net of fee waivers, if any | | .77% H | | .76% | | .79% | | .80% | | .79% | | .83% |
| Expenses net of all reductions | | .77% H | | .76% | | .78% | | .78% | | .79% | | .82% |
| Net investment income (loss) | | 2.16% H | | 1.82% | | 2.04% | | 2.27% | | 1.59% | | .83% |
| Supplemental Data | | | | | | | | | | | | |
| Net assets, end of period (000 omitted) | $ | 135,027 | $ | 131,118 | $ | 118,424 | $ | 85,299 | $ | 107,059 | $ | 162,724 |
Portfolio turnover rate I | | 46% H | | 40% | | 51% | | 88% J | | 51% | | 46% |
A Calculated based on average shares outstanding during the period.
B Net investment income (loss) is affected by the timing of the declaration of dividends by any underlying mutual funds or exchange-traded funds (ETFs). Net investment income (loss) of any mutual funds or ETFs is not included in the Fund's net investment income (loss) ratio.
C Total distributions per share do not sum due to rounding.
D Total returns for periods of less than one year are not annualized.
E Total returns would have been lower if certain expenses had not been reduced during the applicable periods shown.
F Fees and expenses of any underlying mutual funds or exchange-traded funds (ETFs) are not included in the Fund's expense ratio. The Fund indirectly bears its proportionate share of these expenses. For additional expense information related to investments in Fidelity Central Funds, please refer to the "Investments in Fidelity Central Funds" note found in the Notes to Financial Statements section of the most recent Annual or Semi-Annual report.
G Expense ratios reflect operating expenses of the class. Expenses before reductions do not reflect amounts reimbursed, waived, or reduced through arrangements with the investment adviser, brokerage services, or other offset arrangements, if applicable, and do not represent the amount paid by the class during periods when reimbursements, waivers or reductions occur.
H Annualized.
I Amount does not include the portfolio activity of any underlying mutual funds or exchange-traded funds (ETFs).
J Portfolio turnover rate excludes securities received or delivered in-kind.
| Fidelity Advisor® Financial Services Fund Class Z |
| |
| | Six months ended (Unaudited) January 31, 2023 | | Years ended July 31, 2022 | | 2021 | | 2020 | | 2019 A |
Selected Per-Share Data | | | | | | | | | | |
| Net asset value, beginning of period | $ | 27.16 | $ | 29.28 | $ | 18.53 | $ | 22.09 | $ | 21.99 |
| Income from Investment Operations | | | | | | | | | | |
Net investment income (loss) B,C | | .31 | | .57 | | .54 | | .49 | | .25 |
| Net realized and unrealized gain (loss) | | 2.25 | | (1.37) | | 10.86 | | (3.67) | | .66 |
| Total from investment operations | | 2.56 | | (.80) | | 11.40 | | (3.18) | | .91 |
| Distributions from net investment income | | (.57) | | (.53) | | (.54) | | (.38) | | (.29) |
| Distributions from net realized gain | | (1.03) | | (.80) | | (.11) | | - | | (.53) |
| Total distributions | | (1.59) D | | (1.32) D | | (.65) | | (.38) | | (.81) D |
| Net asset value, end of period | $ | 28.13 | $ | 27.16 | $ | 29.28 | $ | 18.53 | $ | 22.09 |
Total Return E,F | | 10.14% | | (3.03)% | | 62.53% | | (14.79)% | | 4.72% |
Ratios to Average Net Assets C,G,H | | | | | | | | | | |
| Expenses before reductions | | .65% I | | .64% | | .66% | | .67% | | .66% I |
| Expenses net of fee waivers, if any | | .64% I | | .63% | | .66% | | .67% | | .65% I |
| Expenses net of all reductions | | .64% I | | .63% | | .65% | | .65% | | .65% I |
| Net investment income (loss) | | 2.29% I | | 1.95% | | 2.17% | | 2.40% | | 1.44% I |
| Supplemental Data | | | | | | | | | | |
| Net assets, end of period (000 omitted) | $ | 127,057 | $ | 63,009 | $ | 49,214 | $ | 30,790 | $ | 7,041 |
Portfolio turnover rate J | | 46% I | | 40% | | 51% | | 88% K | | 51% |
A For the period October 2, 2018 (commencement of sale of shares) through July 31, 2019.
B Calculated based on average shares outstanding during the period.
C Net investment income (loss) is affected by the timing of the declaration of dividends by any underlying mutual funds or exchange-traded funds (ETFs). Net investment income (loss) of any mutual funds or ETFs is not included in the Fund's net investment income (loss) ratio.
D Total distributions per share do not sum due to rounding.
E Total returns for periods of less than one year are not annualized.
F Total returns would have been lower if certain expenses had not been reduced during the applicable periods shown.
G Fees and expenses of any underlying mutual funds or exchange-traded funds (ETFs) are not included in the Fund's expense ratio. The Fund indirectly bears its proportionate share of these expenses. For additional expense information related to investments in Fidelity Central Funds, please refer to the "Investments in Fidelity Central Funds" note found in the Notes to Financial Statements section of the most recent Annual or Semi-Annual report.
H Expense ratios reflect operating expenses of the class. Expenses before reductions do not reflect amounts reimbursed, waived, or reduced through arrangements with the investment adviser, brokerage services, or other offset arrangements, if applicable, and do not represent the amount paid by the class during periods when reimbursements, waivers or reductions occur.
I Annualized.
J Amount does not include the portfolio activity of any underlying mutual funds or exchange-traded funds (ETFs).
K Portfolio turnover rate excludes securities received or delivered in-kind.
Top Holdings (% of Fund's net assets) |
| |
| UnitedHealth Group, Inc. | 9.5 | |
| Boston Scientific Corp. | 5.7 | |
| Eli Lilly & Co. | 5.6 | |
| Thermo Fisher Scientific, Inc. | 5.5 | |
| Danaher Corp. | 4.9 | |
| Penumbra, Inc. | 4.3 | |
| Cigna Corp. | 4.0 | |
| Regeneron Pharmaceuticals, Inc. | 3.7 | |
| Insulet Corp. | 3.2 | |
| Humana, Inc. | 2.9 | |
| | 49.3 | |
| |
| Industries (% of Fund's net assets) |
| |
| Health Care Providers & Services | 26.5 | |
| Health Care Equipment & Supplies | 21.1 | |
| Biotechnology | 20.7 | |
| Life Sciences Tools & Services | 15.4 | |
| Pharmaceuticals | 12.4 | |
| Health Care Technology | 2.4 | |
| Personal Products | 0.3 | |
| Specialty Retail | 0.2 | |
| Diversified Financial Services | 0.1 | |
| |
Fidelity Advisor® Health Care Fund
Showing Percentage of Net Assets
| Common Stocks - 98.0% |
| | | Shares | Value ($) |
| Biotechnology - 20.1% | | | |
| Biotechnology - 20.1% | | | |
| ADC Therapeutics SA (a) | | 700,000 | 3,577,000 |
| Agios Pharmaceuticals, Inc. (a)(b) | | 250,000 | 7,370,000 |
| Alnylam Pharmaceuticals, Inc. (a) | | 235,000 | 53,204,000 |
| Ambrx Biopharma, Inc. ADR (a)(b) | | 227,300 | 429,597 |
| Arcutis Biotherapeutics, Inc. (a) | | 600,000 | 9,942,000 |
| Argenx SE ADR (a) | | 340,000 | 129,965,000 |
| Ascendis Pharma A/S sponsored ADR (a) | | 565,607 | 70,180,517 |
| Avidity Biosciences, Inc. (a) | | 25,579 | 606,222 |
| Beam Therapeutics, Inc. (a)(b) | | 280,000 | 12,166,000 |
| Blueprint Medicines Corp. (a) | | 700,000 | 32,718,000 |
| Caris Life Sciences, Inc. (c)(d) | | 1,098,028 | 6,148,957 |
| Celldex Therapeutics, Inc. (a) | | 470,000 | 20,708,200 |
| Century Therapeutics, Inc. (a) | | 600,000 | 2,742,000 |
| Cerevel Therapeutics Holdings (a) | | 1,000,000 | 34,150,000 |
| Cytokinetics, Inc. (a) | | 1,080,000 | 45,878,400 |
| Denali Therapeutics, Inc. (a) | | 270,191 | 8,178,682 |
| Erasca, Inc. (a)(b) | | 1,251,756 | 5,007,024 |
| Exact Sciences Corp. (a)(b) | | 340,000 | 22,956,800 |
| Generation Bio Co. (a) | | 297,443 | 1,754,914 |
| Instil Bio, Inc. (a) | | 535,251 | 435,641 |
| Janux Therapeutics, Inc. (a) | | 400,000 | 8,884,000 |
| Karuna Therapeutics, Inc. (a) | | 165,000 | 32,899,350 |
| Keros Therapeutics, Inc. (a) | | 379,269 | 22,213,785 |
| Legend Biotech Corp. ADR (a) | | 1,250,000 | 63,125,000 |
| Morphic Holding, Inc. (a) | | 194,100 | 6,352,893 |
| Nuvalent, Inc. Class A (a) | | 256,087 | 7,746,632 |
| Poseida Therapeutics, Inc. (a) | | 1,152,120 | 8,018,755 |
| PTC Therapeutics, Inc. (a) | | 500,000 | 22,945,000 |
| Regeneron Pharmaceuticals, Inc. (a) | | 285,000 | 216,163,950 |
| Relay Therapeutics, Inc. (a)(b) | | 690,000 | 14,807,400 |
| Repligen Corp. (a)(b) | | 185,000 | 34,280,500 |
| Sarepta Therapeutics, Inc. (a) | | 385,000 | 48,113,450 |
| Scholar Rock Holding Corp. (a) | | 93,003 | 1,125,336 |
| Seagen, Inc. (a) | | 120,000 | 16,737,600 |
| Shattuck Labs, Inc. (a) | | 668,725 | 2,788,583 |
| Stoke Therapeutics, Inc. (a) | | 320,000 | 3,187,200 |
| uniQure B.V. (a) | | 440,000 | 9,350,000 |
| Vaxcyte, Inc. (a) | | 630,000 | 28,570,500 |
| Vertex Pharmaceuticals, Inc. (a) | | 240,000 | 77,544,000 |
| Verve Therapeutics, Inc. (a)(b) | | 180,000 | 4,095,000 |
| Xencor, Inc. (a) | | 1,000,000 | 32,920,000 |
| Xenon Pharmaceuticals, Inc. (a) | | 375,000 | 14,658,750 |
| Zai Lab Ltd. (a) | | 4,600,000 | 19,240,911 |
| Zentalis Pharmaceuticals, Inc. (a)(b) | | 850,000 | 20,060,000 |
| | | | 1,183,947,549 |
| Health Care Equipment & Supplies - 21.1% | | | |
| Health Care Equipment - 20.8% | | | |
| Boston Scientific Corp. (a) | | 7,200,000 | 333,000,000 |
| Inspire Medical Systems, Inc. (a) | | 118,000 | 29,861,080 |
| Insulet Corp. (a) | | 660,000 | 189,631,200 |
| Intuitive Surgical, Inc. (a) | | 75,000 | 18,426,750 |
| Masimo Corp. (a) | | 690,000 | 117,355,200 |
| Nevro Corp. (a) | | 640,000 | 23,500,800 |
| Novocure Ltd. (a) | | 339,627 | 30,967,190 |
| Outset Medical, Inc. (a) | | 600,000 | 16,872,000 |
| Penumbra, Inc. (a) | | 1,000,000 | 250,410,000 |
| PROCEPT BioRobotics Corp. (a) | | 400,000 | 15,556,000 |
| ResMed, Inc. | | 370,000 | 84,496,900 |
| Stryker Corp. | | 280,000 | 71,066,800 |
| Tandem Diabetes Care, Inc. (a) | | 1,040,000 | 42,369,600 |
| | | | 1,223,513,520 |
| Health Care Supplies - 0.3% | | | |
| The Cooper Companies, Inc. | | 45,000 | 15,701,850 |
TOTAL HEALTH CARE EQUIPMENT & SUPPLIES | | | 1,239,215,370 |
| Health Care Providers & Services - 26.5% | | | |
| Health Care Facilities - 2.3% | | | |
| Acadia Healthcare Co., Inc. (a) | | 384,700 | 32,322,494 |
| HCA Holdings, Inc. | | 60,000 | 15,304,200 |
| Surgery Partners, Inc. (a) | | 2,550,727 | 84,684,136 |
| The Oncology Institute, Inc. (a)(c) | | 1,472,782 | 2,179,717 |
| | | | 134,490,547 |
| Health Care Services - 8.0% | | | |
| agilon health, Inc. (a)(b) | | 6,690,000 | 145,574,400 |
| Cigna Corp. | | 740,000 | 234,335,800 |
| Guardant Health, Inc. (a) | | 500,000 | 15,715,000 |
| LifeStance Health Group, Inc. (a) | | 2,940,255 | 15,524,546 |
| Oak Street Health, Inc. (a)(b) | | 2,080,000 | 60,444,800 |
| | | | 471,594,546 |
| Managed Health Care - 16.2% | | | |
| Alignment Healthcare, Inc. (a) | | 2,290,700 | 28,290,145 |
| Centene Corp. (a) | | 1,850,000 | 141,044,000 |
| Humana, Inc. | | 330,000 | 168,861,000 |
| Molina Healthcare, Inc. (a) | | 169,000 | 52,699,270 |
| UnitedHealth Group, Inc. | | 1,120,000 | 559,092,800 |
| | | | 949,987,215 |
TOTAL HEALTH CARE PROVIDERS & SERVICES | | | 1,556,072,308 |
| Health Care Technology - 2.1% | | | |
| Health Care Technology - 2.1% | | | |
| Doximity, Inc. (a)(b) | | 970,000 | 34,211,900 |
| Medlive Technology Co. Ltd. (e) | | 2,180,000 | 3,011,414 |
| Phreesia, Inc. (a) | | 800,000 | 29,992,000 |
| Veeva Systems, Inc. Class A (a) | | 325,000 | 55,428,750 |
| | | | 122,644,064 |
| Life Sciences Tools & Services - 15.4% | | | |
| Life Sciences Tools & Services - 15.4% | | | |
| 10X Genomics, Inc. (a)(b) | | 210,000 | 9,834,300 |
| Bruker Corp. | | 900,000 | 63,108,000 |
| Danaher Corp. | | 1,100,000 | 290,818,000 |
| IQVIA Holdings, Inc. (a) | | 415,000 | 95,205,150 |
| Lonza Group AG | | 69,000 | 39,360,468 |
| Olink Holding AB ADR (a) | | 768,800 | 15,053,104 |
| Sartorius Stedim Biotech | | 40,000 | 13,867,685 |
| Seer, Inc. (a) | | 480,430 | 2,185,957 |
| Thermo Fisher Scientific, Inc. | | 570,000 | 325,088,100 |
| West Pharmaceutical Services, Inc. | | 190,000 | 50,464,000 |
| | | | 904,984,764 |
| Personal Products - 0.3% | | | |
| Personal Products - 0.3% | | | |
| The Beauty Health Co. (a)(b) | | 522,877 | 5,960,798 |
| The Beauty Health Co. (a)(c) | | 1,000,000 | 11,400,000 |
| | | | 17,360,798 |
| Pharmaceuticals - 12.3% | | | |
| Pharmaceuticals - 12.3% | | | |
| Arvinas Holding Co. LLC (a) | | 470,000 | 15,401,900 |
| AstraZeneca PLC (United Kingdom) | | 1,000,000 | 131,012,545 |
| Eli Lilly & Co. | | 960,000 | 330,384,000 |
| Pharvaris BV (a) | | 400,000 | 3,600,000 |
| Roche Holding AG (participation certificate) | | 180,000 | 56,190,672 |
| Royalty Pharma PLC | | 3,802,200 | 149,008,218 |
| UCB SA | | 425,000 | 34,828,481 |
| Verona Pharma PLC ADR (a) | | 280,000 | 6,171,200 |
| | | | 726,597,016 |
| Specialty Retail - 0.2% | | | |
| Specialty Stores - 0.2% | | | |
| Warby Parker, Inc. (a)(b) | | 870,000 | 14,050,500 |
| TOTAL COMMON STOCKS (Cost $3,956,122,084) | | | 5,764,872,369 |
| | | | |
| Preferred Stocks - 1.1% |
| | | Shares | Value ($) |
| Convertible Preferred Stocks - 1.0% | | | |
| Biotechnology - 0.6% | | | |
| Biotechnology - 0.6% | | | |
| Asimov, Inc. Series B (a)(c)(d) | | 67,547 | 3,958,254 |
| Caris Life Sciences, Inc. Series D (a)(c)(d) | | 2,082,481 | 11,661,894 |
| Cleerly, Inc. Series C (c)(d) | | 882,089 | 10,320,441 |
| Element Biosciences, Inc. Series C (a)(c)(d) | | 376,690 | 6,196,551 |
| ElevateBio LLC Series C (a)(c)(d) | | 163,300 | 596,045 |
| Inscripta, Inc. Series E (a)(c)(d) | | 826,424 | 3,727,172 |
| | | | 36,460,357 |
| Health Care Providers & Services - 0.0% | | | |
| Health Care Services - 0.0% | | | |
| dMed Biopharmaceutical Co. Ltd. Series C (a)(c)(d) | | 236,142 | 2,592,839 |
| | | | |
| Health Care Technology - 0.3% | | | |
| Health Care Technology - 0.3% | | | |
| Aledade, Inc.: | | | |
| Series B1(a)(c)(d) | | 130,618 | 6,601,434 |
| Series E1(c)(d) | | 46,526 | 2,351,424 |
| Omada Health, Inc. Series E (a)(c)(d) | | 1,456,953 | 4,662,250 |
| Wugen, Inc. Series B (a)(c)(d) | | 300,054 | 1,566,282 |
| | | | 15,181,390 |
| Pharmaceuticals - 0.1% | | | |
| Pharmaceuticals - 0.1% | | | |
| Aristea Therapeutics, Inc. Series B (a)(c)(d) | | 638,900 | 3,520,339 |
| Galvanize Therapeutics Series B (c)(d) | | 2,552,870 | 4,339,879 |
| | | | 7,860,218 |
| TOTAL CONVERTIBLE PREFERRED STOCKS | | | 62,094,804 |
| Nonconvertible Preferred Stocks - 0.1% | | | |
| Diversified Financial Services - 0.1% | | | |
| Other Diversified Financial Services - 0.1% | | | |
| Thriveworks TopCo LLC Series B (a)(c)(d)(f) | | 327,591 | 5,424,907 |
| | | | |
| TOTAL PREFERRED STOCKS (Cost $88,348,047) | | | 67,519,711 |
| | | | |
| Money Market Funds - 6.0% |
| | | Shares | Value ($) |
| Fidelity Cash Central Fund 4.38% (g) | | 56,668,892 | 56,680,226 |
| Fidelity Securities Lending Cash Central Fund 4.38% (g)(h) | | 294,572,942 | 294,602,399 |
| TOTAL MONEY MARKET FUNDS (Cost $351,282,625) | | | 351,282,625 |
| | | | |
| TOTAL INVESTMENT IN SECURITIES - 105.1% (Cost $4,395,752,756) | 6,183,674,705 |
NET OTHER ASSETS (LIABILITIES) - (5.1)% | (302,300,934) |
| NET ASSETS - 100.0% | 5,881,373,771 |
| | |
Legend
| (b) | Security or a portion of the security is on loan at period end. |
| (c) | Restricted securities (including private placements) - Investment in securities not registered under the Securities Act of 1933 (excluding 144A issues). At the end of the period, the value of restricted securities (excluding 144A issues) amounted to $87,248,385 or 1.5% of net assets. |
| (e) | Security exempt from registration under Rule 144A of the Securities Act of 1933. These securities may be resold in transactions exempt from registration, normally to qualified institutional buyers. At the end of the period, the value of these securities amounted to $3,011,414 or 0.1% of net assets. |
| (f) | Investment is owned by a wholly-owned subsidiary (Subsidiary) that is treated as a corporation for U.S. tax purposes. |
| (g) | Affiliated fund that is generally available only to investment companies and other accounts managed by Fidelity Investments. The rate quoted is the annualized seven-day yield of the fund at period end. A complete unaudited listing of the fund's holdings as of its most recent quarter end is available upon request. In addition, each Fidelity Central Fund's financial statements are available on the SEC's website or upon request. |
| (h) | Investment made with cash collateral received from securities on loan. |
| Additional information on each restricted holding is as follows: |
| Security | Acquisition Date | Acquisition Cost ($) |
| Aledade, Inc. Series B1 | 5/07/21 | 5,001,455 |
| | | |
| Aledade, Inc. Series E1 | 5/20/22 | 2,317,665 |
| | | |
| Aristea Therapeutics, Inc. Series B | 10/06/20 | 3,522,703 |
| | | |
| Asimov, Inc. Series B | 10/29/21 | 6,260,303 |
| | | |
| Caris Life Sciences, Inc. | 10/06/22 | 6,148,957 |
| | | |
| Caris Life Sciences, Inc. Series D | 5/11/21 | 16,868,096 |
| | | |
| Cleerly, Inc. Series C | 7/08/22 | 10,391,538 |
| | | |
| dMed Biopharmaceutical Co. Ltd. Series C | 12/01/20 | 3,353,960 |
| | | |
| Element Biosciences, Inc. Series C | 6/21/21 | 7,743,503 |
| | | |
| ElevateBio LLC Series C | 3/09/21 | 685,044 |
| | | |
| Galvanize Therapeutics Series B | 3/29/22 | 4,419,746 |
| | | |
| Inscripta, Inc. Series E | 3/30/21 | 7,297,324 |
| | | |
| Omada Health, Inc. Series E | 12/22/21 | 8,734,725 |
| | | |
| The Beauty Health Co. | 12/08/20 | 10,000,000 |
| | | |
| The Oncology Institute, Inc. | 6/28/21 | 14,727,820 |
| | | |
| Thriveworks TopCo LLC Series B | 7/23/21 - 2/25/22 | 9,402,913 |
| | | |
| Wugen, Inc. Series B | 7/09/21 | 2,326,889 |
| | | |
Affiliated Central Funds
Fiscal year to date information regarding the Fund's investments in Fidelity Central Funds, including the ownership percentage, is presented below.
| Affiliate | Value, beginning of period ($) | Purchases ($) | Sales Proceeds ($) | Dividend Income ($) | Realized Gain (loss) ($) | Change in Unrealized appreciation (depreciation) ($) | Value, end of period ($) | % ownership, end of period |
| Fidelity Cash Central Fund 4.38% | 37,778,923 | 449,812,807 | 430,911,504 | 609,983 | - | - | 56,680,226 | 0.1% |
| Fidelity Securities Lending Cash Central Fund 4.38% | 346,068,627 | 782,684,048 | 834,150,276 | 337,679 | - | - | 294,602,399 | 1.0% |
| Total | 383,847,550 | 1,232,496,855 | 1,265,061,780 | 947,662 | - | - | 351,282,625 | |
| | | | | | | | | |
Amounts in the dividend income column in the above table include any capital gain distributions from underlying funds, which are presented in the corresponding line item in the Statement of Operations, if applicable.
Amount for Fidelity Securities Lending Cash Central Fund represents the income earned on investing cash collateral, less rebates paid to borrowers and any lending agent fees associated with the loan, plus any premium payments received for lending certain types of securities.
Amounts included in the purchases and sales proceeds columns may include in-kind transactions, if applicable.
Investment Valuation
The following is a summary of the inputs used, as of January 31, 2023, involving the Fund's assets and liabilities carried at fair value. The inputs or methodology used for valuing securities may not be an indication of the risk associated with investing in those securities. For more information on valuation inputs, and their aggregation into the levels used below, please refer to the Investment Valuation section in the accompanying Notes to Financial Statements.
| Valuation Inputs at Reporting Date: |
| Description | Total ($) | Level 1 ($) | Level 2 ($) | Level 3 ($) |
Investments in Securities: | | | | |
|
| Common Stocks | 5,764,872,369 | 5,509,907,402 | 248,816,010 | 6,148,957 |
|
| Preferred Stocks | 67,519,711 | - | - | 67,519,711 |
|
| Money Market Funds | 351,282,625 | 351,282,625 | - | - |
| Total Investments in Securities: | 6,183,674,705 | 5,861,190,027 | 248,816,010 | 73,668,668 |
The following is a reconciliation of Investments in Securities for which Level 3 inputs were used in determining value:
| |
| Investments in Securities: | |
| Preferred Stocks | | | |
| Beginning Balance | $ | 73,588,926 | |
| Net Realized Gain (Loss) on Investment Securities | | - | |
| Net Unrealized Gain (Loss) on Investment Securities | | (6,069,365) | |
| Cost of Purchases | | 150 | |
| Proceeds of Sales | | - | |
| Amortization/Accretion | | - | |
| Transfers into Level 3 | | - | |
| Transfers out of Level 3 | | - | |
| Ending Balance | $ | 67,519,711 | |
| The change in unrealized gain (loss) for the period attributable to Level 3 securities held at January 31, 2023 | $ | (6,069,365) | |
| Other Investments in Securities | | | |
| Beginning Balance | $ | - | |
| Net Realized Gain (Loss) on Investment Securities | | - | |
| Net Unrealized Gain (Loss) on Investment Securities | | - | |
| Cost of Purchases | | 6,148,957 | |
| Proceeds of Sales | | - | |
| Amortization/Accretion | | - | |
| Transfers into Level 3 | | - | |
| Transfers out of Level 3 | | - | |
| Ending Balance | $ | 6,148,957 | |
| The change in unrealized gain (loss) for the period attributable to Level 3 securities held at January 31, 2023 | $ | - | |
| The information used in the above reconciliation represents fiscal year to date activity for any Investments in Securities identified as using Level 3 inputs at either the beginning or the end of the current fiscal period. Cost of purchases and proceeds of sales may include securities received and/or delivered through in-kind transactions. Transfers into Level 3 were attributable to a lack of observable market data resulting from decreases in market activity, decreases in liquidity, security restructurings or corporate actions. Transfers out of Level 3 were attributable to observable market data becoming available for those securities. Transfers in or out of Level 3 represent the beginning value of any Security or Instrument where a change in the pricing level occurred from the beginning to the end of the period. The cost of purchases and the proceeds of sales may include securities received or delivered through corporate actions or exchanges. Realized and unrealized gains (losses) disclosed in the reconciliation are included in Net Gain (Loss) on the Fund's Statement of Operations. | |
Fidelity Advisor® Health Care Fund
| Statement of Assets and Liabilities |
| | | | January 31, 2023 (Unaudited) |
| | | | | |
| Assets | | | | |
| Investment in securities, at value (including securities loaned of $298,108,794) - See accompanying schedule: | | | | |
Unaffiliated issuers (cost $4,044,470,131) | $ | 5,832,392,080 | | |
Fidelity Central Funds (cost $351,282,625) | | 351,282,625 | | |
| | | | | |
| | | | | |
| Total Investment in Securities (cost $4,395,752,756) | | | $ | 6,183,674,705 |
| Cash | | | | 74,965 |
| Foreign currency held at value (cost $4,770,608) | | | | 4,770,608 |
| Receivable for investments sold | | | | 22,594,381 |
| Receivable for fund shares sold | | | | 4,012,815 |
| Dividends receivable | | | | 744,273 |
| Distributions receivable from Fidelity Central Funds | | | | 303,478 |
| Prepaid expenses | | | | 12,770 |
Total assets | | | | 6,216,187,995 |
| Liabilities | | | | |
| Payable for investments purchased | $ | 26,817,752 | | |
| Payable for fund shares redeemed | | 9,150,159 | | |
| Accrued management fee | | 2,551,150 | | |
| Distribution and service plan fees payable | | 823,277 | | |
| Other affiliated payables | | 831,078 | | |
| Other payables and accrued expenses | | 40,286 | | |
| Collateral on securities loaned | | 294,600,522 | | |
| Total Liabilities | | | | 334,814,224 |
| Net Assets | | | $ | 5,881,373,771 |
| Net Assets consist of: | | | | |
| Paid in capital | | | $ | 4,242,061,693 |
| Total accumulated earnings (loss) | | | | 1,639,312,078 |
| Net Assets | | | $ | 5,881,373,771 |
| | | | | |
| Net Asset Value and Maximum Offering Price | | | | |
| Class A : | | | | |
Net Asset Value and redemption price per share ($1,527,652,675 ÷ 25,768,711 shares) (a) | | | $ | 59.28 |
| Maximum offering price per share (100/94.25 of $59.28) | | | $ | 62.90 |
| Class M : | | | | |
Net Asset Value and redemption price per share ($327,957,033 ÷ 6,046,091 shares) (a) | | | $ | 54.24 |
| Maximum offering price per share (100/96.50 of $54.24) | | | $ | 56.21 |
| Class C : | | | | |
Net Asset Value and offering price per share ($451,452,169 ÷ 10,236,878 shares) (a) | | | $ | 44.10 |
| Class I : | | | | |
Net Asset Value , offering price and redemption price per share ($2,732,280,999 ÷ 41,526,030 shares) | | | $ | 65.80 |
| Class Z : | | | | |
Net Asset Value , offering price and redemption price per share ($842,030,895 ÷ 12,769,134 shares) | | | $ | 65.94 |
(a)Redemption price per share is equal to net asset value less any applicable contingent deferred sales charge. |
| Statement of Operations |
| | | | Six months ended January 31, 2023 (Unaudited) |
| Investment Income | | | | |
| Dividends | | | $ | 13,150,741 |
| Income from Fidelity Central Funds (including $337,679 from security lending) | | | | 947,662 |
| Total Income | | | | 14,098,403 |
| Expenses | | | | |
| Management fee | $ | 15,260,761 | | |
| Transfer agent fees | | 4,500,290 | | |
| Distribution and service plan fees | | 5,005,789 | | |
| Accounting fees | | 495,404 | | |
| Custodian fees and expenses | | 33,427 | | |
| Independent trustees' fees and expenses | | 10,102 | | |
| Registration fees | | 123,348 | | |
| Audit | | 28,906 | | |
| Legal | | 5,058 | | |
| Miscellaneous | | 19,922 | | |
| Total expenses before reductions | | 25,483,007 | | |
| Expense reductions | | (111,889) | | |
| Total expenses after reductions | | | | 25,371,118 |
| Net Investment income (loss) | | | | (11,272,715) |
| Realized and Unrealized Gain (Loss) | | | | |
| Net realized gain (loss) on: | | | | |
| Investment Securities: | | | | |
| Unaffiliated issuers | | (34,996,905) | | |
| Foreign currency transactions | | (86,771) | | |
| Total net realized gain (loss) | | | | (35,083,676) |
| Change in net unrealized appreciation (depreciation) on: | | | | |
| Investment Securities: | | | | |
| Unaffiliated issuers | | 219,343,467 | | |
| Assets and liabilities in foreign currencies | | 62,990 | | |
| Total change in net unrealized appreciation (depreciation) | | | | 219,406,457 |
| Net gain (loss) | | | | 184,322,781 |
| Net increase (decrease) in net assets resulting from operations | | | $ | 173,050,066 |
| Statement of Changes in Net Assets |
| |
| | Six months ended January 31, 2023 (Unaudited) | | Year ended July 31, 2022 |
| Increase (Decrease) in Net Assets | | | | |
| Operations | | | | |
| Net investment income (loss) | $ | (11,272,715) | $ | (21,390,615) |
| Net realized gain (loss) | | (35,083,676) | | 27,533,492 |
| Change in net unrealized appreciation (depreciation) | | 219,406,457 | | (866,631,680) |
| Net increase (decrease) in net assets resulting from operations | | 173,050,066 | | (860,488,803) |
| Distributions to shareholders | | - | | (421,462,568) |
| Share transactions - net increase (decrease) | | (173,169,812) | | (34,838,590) |
| Total increase (decrease) in net assets | | (119,746) | | (1,316,789,961) |
| | | | | |
| Net Assets | | | | |
| Beginning of period | | 5,881,493,517 | | 7,198,283,478 |
| End of period | $ | 5,881,373,771 | $ | 5,881,493,517 |
| | | | | |
| | | | | |
Financial Highlights
| Fidelity Advisor® Health Care Fund Class A |
| |
| | Six months ended (Unaudited) January 31, 2023 | | Years ended July 31, 2022 | | 2021 | | 2020 | | 2019 | | 2018 |
Selected Per-Share Data | | | | | | | | | | | | |
| Net asset value, beginning of period | $ | 57.59 | $ | 69.58 | $ | 61.07 | $ | 49.21 | $ | 50.14 | $ | 41.85 |
| Income from Investment Operations | | | | | | | | | | | | |
Net investment income (loss) A,B | | (.14) | | (.26) | | (.26) | | (.04) | | (.07) | | (.07) |
| Net realized and unrealized gain (loss) | | 1.83 | | (7.58) | | 12.55 | | 12.08 | | 1.36 | | 8.36 |
| Total from investment operations | | 1.69 | | (7.84) | | 12.29 | | 12.04 | | 1.29 | | 8.29 |
| Distributions from net investment income | | - | | - | | (.16) | | - | | - | | - |
| Distributions from net realized gain | | - | | (4.15) | | (3.62) | | (.18) | | (2.22) | | - |
| Total distributions | | - | | (4.15) | | (3.78) | | (.18) | | (2.22) | | - |
| Net asset value, end of period | $ | 59.28 | $ | 57.59 | $ | 69.58 | $ | 61.07 | $ | 49.21 | $ | 50.14 |
Total Return C,D,E | | 2.93% | | (11.90)% | | 20.70% | | 24.50% | | 2.87% | | 19.81% |
Ratios to Average Net Assets B,F,G | | | | | | | | | | | | |
| Expenses before reductions | | .98% H | | .97% | | .98% | | 1.01% | | 1.02% | | 1.05% |
| Expenses net of fee waivers, if any | | .98% H | | .97% | | .98% | | 1.00% | | 1.02% | | 1.05% |
| Expenses net of all reductions | | .98% H | | .97% | | .98% | | 1.00% | | 1.02% | | 1.04% |
| Net investment income (loss) | | (.49)% H | | (.42)% | | (.39)% | | (.07)% | | (.14)% | | (.16)% |
| Supplemental Data | | | | | | | | | | | | |
| Net assets, end of period (000 omitted) | $ | 1,527,653 | $ | 1,488,238 | $ | 1,735,235 | $ | 1,372,082 | $ | 1,121,411 | $ | 1,003,430 |
Portfolio turnover rate I | | 42% H | | 33% | | 38% | | 53% J | | 45% | | 81% |
A Calculated based on average shares outstanding during the period.
B Net investment income (loss) is affected by the timing of the declaration of dividends by any underlying mutual funds or exchange-traded funds (ETFs). Net investment income (loss) of any mutual funds or ETFs is not included in the Fund's net investment income (loss) ratio.
C Total returns for periods of less than one year are not annualized.
D Total returns would have been lower if certain expenses had not been reduced during the applicable periods shown.
E Total returns do not include the effect of the sales charges.
F Fees and expenses of any underlying mutual funds or exchange-traded funds (ETFs) are not included in the Fund's expense ratio. The Fund indirectly bears its proportionate share of these expenses. For additional expense information related to investments in Fidelity Central Funds, please refer to the "Investments in Fidelity Central Funds" note found in the Notes to Financial Statements section of the most recent Annual or Semi-Annual report.
G Expense ratios reflect operating expenses of the class. Expenses before reductions do not reflect amounts reimbursed, waived, or reduced through arrangements with the investment adviser, brokerage services, or other offset arrangements, if applicable, and do not represent the amount paid by the class during periods when reimbursements, waivers or reductions occur.
H Annualized.
I Amount does not include the portfolio activity of any underlying mutual funds or exchange-traded funds (ETFs).
J Portfolio turnover rate excludes securities received or delivered in-kind.
| Fidelity Advisor® Health Care Fund Class M |
| |
| | Six months ended (Unaudited) January 31, 2023 | | Years ended July 31, 2022 | | 2021 | | 2020 | | 2019 | | 2018 |
Selected Per-Share Data | | | | | | | | | | | | |
| Net asset value, beginning of period | $ | 52.76 | $ | 64.25 | $ | 56.62 | $ | 45.75 | $ | 46.89 | $ | 39.25 |
| Income from Investment Operations | | | | | | | | | | | | |
Net investment income (loss) A,B | | (.19) | | (.38) | | (.39) | | (.16) | | (.18) | | (.18) |
| Net realized and unrealized gain (loss) | | 1.67 | | (6.96) | | 11.61 | | 11.21 | | 1.26 | | 7.82 |
| Total from investment operations | | 1.48 | | (7.34) | | 11.22 | | 11.05 | | 1.08 | | 7.64 |
| Distributions from net investment income | | - | | - | | (.02) | | - | | - | | - |
| Distributions from net realized gain | | - | | (4.15) | | (3.57) | | (.18) | | (2.22) | | - |
| Total distributions | | - | | (4.15) | | (3.59) | | (.18) | | (2.22) | | - |
| Net asset value, end of period | $ | 54.24 | $ | 52.76 | $ | 64.25 | $ | 56.62 | $ | 45.75 | $ | 46.89 |
Total Return C,D,E | | 2.81% | | (12.12)% | | 20.39% | | 24.19% | | 2.61% | | 19.46% |
Ratios to Average Net Assets B,F,G | | | | | | | | | | | | |
| Expenses before reductions | | 1.23% H | | 1.22% | | 1.23% | | 1.26% | | 1.28% | | 1.32% |
| Expenses net of fee waivers, if any | | 1.23% H | | 1.22% | | 1.23% | | 1.26% | | 1.28% | | 1.32% |
| Expenses net of all reductions | | 1.23% H | | 1.22% | | 1.23% | | 1.26% | | 1.28% | | 1.31% |
| Net investment income (loss) | | (.74)% H | | (.67)% | | (.65)% | | (.33)% | | (.40)% | | (.43)% |
| Supplemental Data | | | | | | | | | | | | |
| Net assets, end of period (000 omitted) | $ | 327,957 | $ | 330,452 | $ | 402,175 | $ | 349,280 | $ | 306,758 | $ | 298,061 |
Portfolio turnover rate I | | 42% H | | 33% | | 38% | | 53% J | | 45% | | 81% |
A Calculated based on average shares outstanding during the period.
B Net investment income (loss) is affected by the timing of the declaration of dividends by any underlying mutual funds or exchange-traded funds (ETFs). Net investment income (loss) of any mutual funds or ETFs is not included in the Fund's net investment income (loss) ratio.
C Total returns for periods of less than one year are not annualized.
D Total returns would have been lower if certain expenses had not been reduced during the applicable periods shown.
E Total returns do not include the effect of the sales charges.
F Fees and expenses of any underlying mutual funds or exchange-traded funds (ETFs) are not included in the Fund's expense ratio. The Fund indirectly bears its proportionate share of these expenses. For additional expense information related to investments in Fidelity Central Funds, please refer to the "Investments in Fidelity Central Funds" note found in the Notes to Financial Statements section of the most recent Annual or Semi-Annual report.
G Expense ratios reflect operating expenses of the class. Expenses before reductions do not reflect amounts reimbursed, waived, or reduced through arrangements with the investment adviser, brokerage services, or other offset arrangements, if applicable, and do not represent the amount paid by the class during periods when reimbursements, waivers or reductions occur.
H Annualized.
I Amount does not include the portfolio activity of any underlying mutual funds or exchange-traded funds (ETFs).
J Portfolio turnover rate excludes securities received or delivered in-kind.
| Fidelity Advisor® Health Care Fund Class C |
| |
| | Six months ended (Unaudited) January 31, 2023 | | Years ended July 31, 2022 | | 2021 | | 2020 | | 2019 | | 2018 |
Selected Per-Share Data | | | | | | | | | | | | |
| Net asset value, beginning of period | $ | 43.00 | $ | 53.40 | $ | 47.63 | $ | 38.70 | $ | 40.21 | $ | 33.82 |
| Income from Investment Operations | | | | | | | | | | | | |
Net investment income (loss) A,B | | (.27) | | (.55) | | (.58) | | (.34) | | (.34) | | (.33) |
| Net realized and unrealized gain (loss) | | 1.37 | | (5.70) | | 9.71 | | 9.45 | | 1.05 | | 6.72 |
| Total from investment operations | | 1.10 | | (6.25) | | 9.13 | | 9.11 | | .71 | | 6.39 |
| Distributions from net realized gain | | - | | (4.15) | | (3.36) | | (.18) | | (2.22) | | - |
| Total distributions | | - | | (4.15) | | (3.36) | | (.18) | | (2.22) | | - |
| Net asset value, end of period | $ | 44.10 | $ | 43.00 | $ | 53.40 | $ | 47.63 | $ | 38.70 | $ | 40.21 |
Total Return C,D,E | | 2.56% | | (12.56)% | | 19.78% | | 23.58% | | 2.10% | | 18.89% |
Ratios to Average Net Assets B,F,G | | | | | | | | | | | | |
| Expenses before reductions | | 1.73% H | | 1.72% | | 1.73% | | 1.76% | | 1.77% | | 1.80% |
| Expenses net of fee waivers, if any | | 1.73% H | | 1.72% | | 1.73% | | 1.76% | | 1.77% | | 1.80% |
| Expenses net of all reductions | | 1.73% H | | 1.72% | | 1.73% | | 1.75% | | 1.77% | | 1.79% |
| Net investment income (loss) | | (1.24)% H | | (1.17)% | | (1.15)% | | (.82)% | | (.88)% | | (.91)% |
| Supplemental Data | | | | | | | | | | | | |
| Net assets, end of period (000 omitted) | $ | 451,452 | $ | 501,742 | $ | 697,626 | $ | 654,487 | $ | 585,093 | $ | 669,639 |
Portfolio turnover rate I | | 42% H | | 33% | | 38% | | 53% J | | 45% | | 81% |
A Calculated based on average shares outstanding during the period.
B Net investment income (loss) is affected by the timing of the declaration of dividends by any underlying mutual funds or exchange-traded funds (ETFs). Net investment income (loss) of any mutual funds or ETFs is not included in the Fund's net investment income (loss) ratio.
C Total returns for periods of less than one year are not annualized.
D Total returns would have been lower if certain expenses had not been reduced during the applicable periods shown.
E Total returns do not include the effect of the contingent deferred sales charge.
F Fees and expenses of any underlying mutual funds or exchange-traded funds (ETFs) are not included in the Fund's expense ratio. The Fund indirectly bears its proportionate share of these expenses. For additional expense information related to investments in Fidelity Central Funds, please refer to the "Investments in Fidelity Central Funds" note found in the Notes to Financial Statements section of the most recent Annual or Semi-Annual report.
G Expense ratios reflect operating expenses of the class. Expenses before reductions do not reflect amounts reimbursed, waived, or reduced through arrangements with the investment adviser, brokerage services, or other offset arrangements, if applicable, and do not represent the amount paid by the class during periods when reimbursements, waivers or reductions occur.
H Annualized.
I Amount does not include the portfolio activity of any underlying mutual funds or exchange-traded funds (ETFs).
J Portfolio turnover rate excludes securities received or delivered in-kind.
| Fidelity Advisor® Health Care Fund Class I |
| |
| | Six months ended (Unaudited) January 31, 2023 | | Years ended July 31, 2022 | | 2021 | | 2020 | | 2019 | | 2018 |
Selected Per-Share Data | | | | | | | | | | | | |
| Net asset value, beginning of period | $ | 63.83 | $ | 76.48 | $ | 66.81 | $ | 53.77 | $ | 54.43 | $ | 45.35 |
| Income from Investment Operations | | | | | | | | | | | | |
Net investment income (loss) A,B | | (.07) | | (.11) | | (.10) | | .11 | | .07 | | .05 |
| Net realized and unrealized gain (loss) | | 2.04 | | (8.39) | | 13.76 | | 13.22 | | 1.49 | | 9.06 |
| Total from investment operations | | 1.97 | | (8.50) | | 13.66 | | 13.33 | | 1.56 | | 9.11 |
| Distributions from net investment income | | - | | - | | (.30) | | - | | - | | - |
| Distributions from net realized gain | | - | | (4.15) | | (3.69) | | (.29) | | (2.22) | | (.03) |
| Total distributions | | - | | (4.15) | | (3.99) | | (.29) | | (2.22) | | (.03) |
| Net asset value, end of period | $ | 65.80 | $ | 63.83 | $ | 76.48 | $ | 66.81 | $ | 53.77 | $ | 54.43 |
Total Return C,D | | 3.09% | | (11.68)% | | 21.01% | | 24.84% | | 3.14% | | 20.09% |
Ratios to Average Net Assets B,E,F | | | | | | | | | | | | |
| Expenses before reductions | | .72% G | | .71% | | .72% | | .74% | | .76% | | .79% |
| Expenses net of fee waivers, if any | | .72% G | | .71% | | .72% | | .74% | | .76% | | .79% |
| Expenses net of all reductions | | .72% G | | .71% | | .72% | | .74% | | .76% | | .78% |
| Net investment income (loss) | | (.23)% G | | (.16)% | | (.13)% | | .19% | | .13% | | .10% |
| Supplemental Data | | | | | | | | | | | | |
| Net assets, end of period (000 omitted) | $ | 2,732,281 | $ | 2,743,740 | $ | 3,410,787 | $ | 2,546,323 | $ | 1,783,417 | $ | 1,316,804 |
Portfolio turnover rate H | | 42% G | | 33% | | 38% | | 53% I | | 45% | | 81% |
A Calculated based on average shares outstanding during the period.
B Net investment income (loss) is affected by the timing of the declaration of dividends by any underlying mutual funds or exchange-traded funds (ETFs). Net investment income (loss) of any mutual funds or ETFs is not included in the Fund's net investment income (loss) ratio.
C Total returns for periods of less than one year are not annualized.
D Total returns would have been lower if certain expenses had not been reduced during the applicable periods shown.
E Fees and expenses of any underlying mutual funds or exchange-traded funds (ETFs) are not included in the Fund's expense ratio. The Fund indirectly bears its proportionate share of these expenses. For additional expense information related to investments in Fidelity Central Funds, please refer to the "Investments in Fidelity Central Funds" note found in the Notes to Financial Statements section of the most recent Annual or Semi-Annual report.
F Expense ratios reflect operating expenses of the class. Expenses before reductions do not reflect amounts reimbursed, waived, or reduced through arrangements with the investment adviser, brokerage services, or other offset arrangements, if applicable, and do not represent the amount paid by the class during periods when reimbursements, waivers or reductions occur.
G Annualized.
H Amount does not include the portfolio activity of any underlying mutual funds or exchange-traded funds (ETFs).
I Portfolio turnover rate excludes securities received or delivered in-kind.
| Fidelity Advisor® Health Care Fund Class Z |
| |
| | Six months ended (Unaudited) January 31, 2023 | | Years ended July 31, 2022 | | 2021 | | 2020 | | 2019 A |
Selected Per-Share Data | | | | | | | | | | |
| Net asset value, beginning of period | $ | 63.93 | $ | 76.55 | $ | 66.88 | $ | 53.84 | $ | 57.87 |
| Income from Investment Operations | | | | | | | | | | |
Net investment income (loss) B,C | | (.03) | | (.03) | | (.01) | | .19 | | .13 |
| Net realized and unrealized gain (loss) | | 2.04 | | (8.38) | | 13.77 | | 13.22 | | (1.94) |
| Total from investment operations | | 2.01 | | (8.41) | | 13.76 | | 13.41 | | (1.81) |
| Distributions from net investment income | | - | | - | | (.37) | | - | | - |
| Distributions from net realized gain | | - | | (4.21) | | (3.73) | | (.37) | | (2.22) |
| Total distributions | | - | | (4.21) | | (4.09) D | | (.37) | | (2.22) |
| Net asset value, end of period | $ | 65.94 | $ | 63.93 | $ | 76.55 | $ | 66.88 | $ | 53.84 |
Total Return E,F | | 3.14% | | (11.56)% | | 21.15% | | 24.98% | | (2.86)% |
Ratios to Average Net Assets C,G,H | | | | | | | | | | |
| Expenses before reductions | | .59% I | | .59% | | .60% | | .61% | | .62% I |
| Expenses net of fee waivers, if any | | .59% I | | .59% | | .60% | | .61% | | .62% I |
| Expenses net of all reductions | | .59% I | | .59% | | .59% | | .61% | | .62% I |
| Net investment income (loss) | | (.10)% I | | (.04)% | | (.01)% | | .32% | | .30% I |
| Supplemental Data | | | | | | | | | | |
| Net assets, end of period (000 omitted) | $ | 842,031 | $ | 817,321 | $ | 952,460 | $ | 610,481 | $ | 238,873 |
Portfolio turnover rate J | | 42% I | | 33% | | 38% | | 53% K | | 45% |
A For the period October 2, 2018 (commencement of sale of shares) through July 31, 2019.
B Calculated based on average shares outstanding during the period.
C Net investment income (loss) is affected by the timing of the declaration of dividends by any underlying mutual funds or exchange-traded funds (ETFs). Net investment income (loss) of any mutual funds or ETFs is not included in the Fund's net investment income (loss) ratio.
D Total distributions per share do not sum due to rounding.
E Total returns for periods of less than one year are not annualized.
F Total returns would have been lower if certain expenses had not been reduced during the applicable periods shown.
G Fees and expenses of any underlying mutual funds or exchange-traded funds (ETFs) are not included in the Fund's expense ratio. The Fund indirectly bears its proportionate share of these expenses. For additional expense information related to investments in Fidelity Central Funds, please refer to the "Investments in Fidelity Central Funds" note found in the Notes to Financial Statements section of the most recent Annual or Semi-Annual report.
H Expense ratios reflect operating expenses of the class. Expenses before reductions do not reflect amounts reimbursed, waived, or reduced through arrangements with the investment adviser, brokerage services, or other offset arrangements, if applicable, and do not represent the amount paid by the class during periods when reimbursements, waivers or reductions occur.
I Annualized.
J Amount does not include the portfolio activity of any underlying mutual funds or exchange-traded funds (ETFs).
K Portfolio turnover rate excludes securities received or delivered in-kind.
Top Holdings (% of Fund's net assets) |
| |
| Fortive Corp. | 7.2 | |
| AMETEK, Inc. | 7.2 | |
| Willscot Mobile Mini Holdings | 7.1 | |
| The Boeing Co. | 6.8 | |
| Roper Technologies, Inc. | 5.9 | |
| Saia, Inc. | 5.5 | |
| Honeywell International, Inc. | 5.5 | |
| Flowserve Corp. | 4.8 | |
| Howmet Aerospace, Inc. | 4.5 | |
| Ingersoll Rand, Inc. | 4.5 | |
| | 59.0 | |
| |
| Industries (% of Fund's net assets) |
| |
| Machinery | 31.9 | |
| Aerospace & Defense | 23.7 | |
| Road & Rail | 10.3 | |
| Electrical Equipment | 7.7 | |
| Construction & Engineering | 7.3 | |
| Software | 5.9 | |
| Industrial Conglomerates | 5.5 | |
| Air Freight & Logistics | 3.9 | |
| Commercial Services & Supplies | 3.6 | |
| Professional Services | 1.3 | |
| |
Fidelity Advisor® Industrials Fund
Showing Percentage of Net Assets
| Common Stocks - 101.1% |
| | | Shares | Value ($) |
| Aerospace & Defense - 23.7% | | | |
| Aerospace & Defense - 23.7% | | | |
| BAE Systems PLC | | 182,985 | 1,937,089 |
| Curtiss-Wright Corp. | | 4,000 | 663,200 |
| HEICO Corp. (a) | | 64,700 | 11,060,465 |
| HEICO Corp. Class A | | 41,900 | 5,601,192 |
| Hexcel Corp. (a) | | 29,200 | 2,060,936 |
| Howmet Aerospace, Inc. | | 604,600 | 24,601,174 |
| Raytheon Technologies Corp. | | 237,200 | 23,684,420 |
| The Boeing Co. (b) | | 173,900 | 37,040,700 |
| TransDigm Group, Inc. | | 30,614 | 21,973,199 |
| | | | 128,622,375 |
| Air Freight & Logistics - 3.9% | | | |
| Air Freight & Logistics - 3.9% | | | |
| FedEx Corp. | | 108,700 | 21,072,582 |
| Commercial Services & Supplies - 3.6% | | | |
| Environmental & Facility Services - 0.0% | | | |
| Tetra Tech, Inc. | | 800 | 124,416 |
| Security & Alarm Services - 3.6% | | | |
| CoreCivic, Inc. (b) | | 346,600 | 3,687,824 |
| The GEO Group, Inc. (a)(b) | | 1,351,000 | 15,536,500 |
| | | | 19,224,324 |
TOTAL COMMERCIAL SERVICES & SUPPLIES | | | 19,348,740 |
| Construction & Engineering - 7.3% | | | |
| Construction & Engineering - 7.3% | | | |
| AECOM | | 11,600 | 1,012,332 |
| Willscot Mobile Mini Holdings (b) | | 796,300 | 38,588,698 |
| | | | 39,601,030 |
| Electrical Equipment - 7.7% | | | |
| Electrical Components & Equipment - 7.7% | | | |
| AMETEK, Inc. | | 268,534 | 38,915,947 |
| nVent Electric PLC | | 14,400 | 572,400 |
| Regal Rexnord Corp. | | 10,000 | 1,392,000 |
| Vertiv Holdings Co. (a) | | 61,900 | 880,218 |
| | | | 41,760,565 |
| Industrial Conglomerates - 5.5% | | | |
| Industrial Conglomerates - 5.5% | | | |
| Honeywell International, Inc. | | 143,894 | 29,999,021 |
| Machinery - 31.9% | | | |
| Industrial Machinery - 31.9% | | | |
| Barnes Group, Inc. | | 366,200 | 16,208,012 |
| Crane Holdings Co. | | 203,258 | 23,559,635 |
| Flowserve Corp. | | 753,904 | 25,949,376 |
| Fortive Corp. | | 573,075 | 38,986,291 |
| IDEX Corp. | | 41,237 | 9,883,684 |
| Ingersoll Rand, Inc. | | 432,200 | 24,203,200 |
| Middleby Corp. (b) | | 26,600 | 4,134,970 |
| Parker Hannifin Corp. | | 22,400 | 7,302,400 |
| Pentair PLC (a) | | 225,900 | 12,510,342 |
| RBC Bearings, Inc. (b) | | 40,600 | 9,905,182 |
| | | | 172,643,092 |
| Professional Services - 1.3% | | | |
| Research & Consulting Services - 1.3% | | | |
| KBR, Inc. | | 25,500 | 1,306,365 |
| Science Applications International Corp. | | 53,817 | 5,585,128 |
| | | | 6,891,493 |
| Road & Rail - 10.3% | | | |
| Railroads - 1.2% | | | |
| CSX Corp. | | 53,900 | 1,666,588 |
| Norfolk Southern Corp. | | 19,491 | 4,791,083 |
| | | | 6,457,671 |
| Trucking - 9.1% | | | |
| J.B. Hunt Transport Services, Inc. | | 13,453 | 2,543,290 |
| Old Dominion Freight Lines, Inc. | | 51,000 | 16,995,240 |
| Saia, Inc. (a)(b) | | 110,200 | 30,060,356 |
| | | | 49,598,886 |
TOTAL ROAD & RAIL | | | 56,056,557 |
| Software - 5.9% | | | |
| Application Software - 5.9% | | | |
| Roper Technologies, Inc. | | 75,432 | 32,190,606 |
| TOTAL COMMON STOCKS (Cost $447,122,660) | | | 548,186,061 |
| | | | |
| Money Market Funds - 7.8% |
| | | Shares | Value ($) |
Fidelity Securities Lending Cash Central Fund 4.38% (c)(d) (Cost $42,211,375) | | 42,207,154 | 42,211,375 |
| | | | |
| TOTAL INVESTMENT IN SECURITIES - 108.9% (Cost $489,334,035) | 590,397,436 |
NET OTHER ASSETS (LIABILITIES) - (8.9)% | (48,184,354) |
| NET ASSETS - 100.0% | 542,213,082 |
| | |
Legend
| (a) | Security or a portion of the security is on loan at period end. |
| (c) | Affiliated fund that is generally available only to investment companies and other accounts managed by Fidelity Investments. The rate quoted is the annualized seven-day yield of the fund at period end. A complete unaudited listing of the fund's holdings as of its most recent quarter end is available upon request. In addition, each Fidelity Central Fund's financial statements are available on the SEC's website or upon request. |
| (d) | Investment made with cash collateral received from securities on loan. |
Affiliated Central Funds
Fiscal year to date information regarding the Fund's investments in Fidelity Central Funds, including the ownership percentage, is presented below.
| Affiliate | Value, beginning of period ($) | Purchases ($) | Sales Proceeds ($) | Dividend Income ($) | Realized Gain (loss) ($) | Change in Unrealized appreciation (depreciation) ($) | Value, end of period ($) | % ownership, end of period |
| Fidelity Cash Central Fund 4.38% | 1,335,472 | 129,276,237 | 130,611,709 | 32,309 | - | - | - | 0.0% |
| Fidelity Securities Lending Cash Central Fund 4.38% | 61,455,075 | 143,840,167 | 163,083,867 | 14,139 | - | - | 42,211,375 | 0.1% |
| Total | 62,790,547 | 273,116,404 | 293,695,576 | 46,448 | - | - | 42,211,375 | |
| | | | | | | | | |
Amounts in the dividend income column in the above table include any capital gain distributions from underlying funds, which are presented in the corresponding line item in the Statement of Operations, if applicable.
Amount for Fidelity Securities Lending Cash Central Fund represents the income earned on investing cash collateral, less rebates paid to borrowers and any lending agent fees associated with the loan, plus any premium payments received for lending certain types of securities.
Amounts included in the purchases and sales proceeds columns may include in-kind transactions, if applicable.
Investment Valuation
The following is a summary of the inputs used, as of January 31, 2023, involving the Fund's assets and liabilities carried at fair value. The inputs or methodology used for valuing securities may not be an indication of the risk associated with investing in those securities. For more information on valuation inputs, and their aggregation into the levels used below, please refer to the Investment Valuation section in the accompanying Notes to Financial Statements.
| Valuation Inputs at Reporting Date: |
| Description | Total ($) | Level 1 ($) | Level 2 ($) | Level 3 ($) |
Investments in Securities: | | | | |
|
| Common Stocks | 548,186,061 | 546,248,972 | 1,937,089 | - |
|
| Money Market Funds | 42,211,375 | 42,211,375 | - | - |
| Total Investments in Securities: | 590,397,436 | 588,460,347 | 1,937,089 | - |
Fidelity Advisor® Industrials Fund
| Statement of Assets and Liabilities |
| | | | January 31, 2023 (Unaudited) |
| | | | | |
| Assets | | | | |
| Investment in securities, at value (including securities loaned of $42,888,980) - See accompanying schedule: | | | | |
Unaffiliated issuers (cost $447,122,660) | $ | 548,186,061 | | |
Fidelity Central Funds (cost $42,211,375) | | 42,211,375 | | |
| | | | | |
| | | | | |
| Total Investment in Securities (cost $489,334,035) | | | $ | 590,397,436 |
| Cash | | | | 27,920 |
| Receivable for investments sold | | | | 21,939,688 |
| Receivable for fund shares sold | | | | 397,710 |
| Dividends receivable | | | | 32,399 |
| Distributions receivable from Fidelity Central Funds | | | | 6,570 |
| Prepaid expenses | | | | 2,743 |
Total assets | | | | 612,804,466 |
| Liabilities | | | | |
| Payable for investments purchased | $ | 17,907,745 | | |
| Payable for fund shares redeemed | | 630,369 | | |
| Accrued management fee | | 233,665 | | |
| Distribution and service plan fees payable | | 94,733 | | |
| Notes payable to affiliates | | 9,396,000 | | |
| Other affiliated payables | | 83,427 | | |
| Other payables and accrued expenses | | 34,070 | | |
| Collateral on securities loaned | | 42,211,375 | | |
| Total Liabilities | | | | 70,591,384 |
| Net Assets | | | $ | 542,213,082 |
| Net Assets consist of: | | | | |
| Paid in capital | | | $ | 457,455,802 |
| Total accumulated earnings (loss) | | | | 84,757,280 |
| Net Assets | | | $ | 542,213,082 |
| | | | | |
| Net Asset Value and Maximum Offering Price | | | | |
| Class A : | | | | |
Net Asset Value and redemption price per share ($218,937,799 ÷ 6,119,273 shares) (a) | | | $ | 35.78 |
| Maximum offering price per share (100/94.25 of $35.78) | | | $ | 37.96 |
| Class M : | | | | |
Net Asset Value and redemption price per share ($52,102,443 ÷ 1,511,114 shares) (a) | | | $ | 34.48 |
| Maximum offering price per share (100/96.50 of $34.48) | | | $ | 35.73 |
| Class C : | | | | |
Net Asset Value and offering price per share ($34,746,249 ÷ 1,168,942 shares) (a) | | | $ | 29.72 |
| Class I : | | | | |
Net Asset Value , offering price and redemption price per share ($136,554,719 ÷ 3,524,812 shares) | | | $ | 38.74 |
| Class Z : | | | | |
Net Asset Value , offering price and redemption price per share ($99,871,872 ÷ 2,581,378 shares) | | | $ | 38.69 |
(a)Redemption price per share is equal to net asset value less any applicable contingent deferred sales charge. |
| Statement of Operations |
| | | | Six months ended January 31, 2023 (Unaudited) |
| Investment Income | | | | |
| Dividends | | | $ | 2,087,554 |
| Special dividends | | | | 618,159 |
| Income from Fidelity Central Funds (including $14,139 from security lending) | | | | 46,448 |
| Total Income | | | | 2,752,161 |
| Expenses | | | | |
| Management fee | $ | 1,296,750 | | |
| Transfer agent fees | | 398,952 | | |
| Distribution and service plan fees | | 558,865 | | |
| Accounting fees | | 86,188 | | |
| Custodian fees and expenses | | 12,309 | | |
| Independent trustees' fees and expenses | | 836 | | |
| Registration fees | | 69,277 | | |
| Audit | | 25,562 | | |
| Legal | | 1,215 | | |
| Interest | | 1,191 | | |
| Miscellaneous | | 2,088 | | |
| Total expenses before reductions | | 2,453,233 | | |
| Expense reductions | | (9,570) | | |
| Total expenses after reductions | | | | 2,443,663 |
| Net Investment income (loss) | | | | 308,498 |
| Realized and Unrealized Gain (Loss) | | | | |
| Net realized gain (loss) on: | | | | |
| Investment Securities: | | | | |
| Unaffiliated issuers | | (8,728,730) | | |
| Foreign currency transactions | | 3,163 | | |
| Total net realized gain (loss) | | | | (8,725,567) |
| Change in net unrealized appreciation (depreciation) on investment securities | | | | 56,321,734 |
| Net gain (loss) | | | | 47,596,167 |
| Net increase (decrease) in net assets resulting from operations | | | $ | 47,904,665 |
| Statement of Changes in Net Assets |
| |
| | Six months ended January 31, 2023 (Unaudited) | | Year ended July 31, 2022 |
| Increase (Decrease) in Net Assets | | | | |
| Operations | | | | |
| Net investment income (loss) | $ | 308,498 | $ | (1,839,444) |
| Net realized gain (loss) | | (8,725,567) | | 43,048,318 |
| Change in net unrealized appreciation (depreciation) | | 56,321,734 | | (88,564,513) |
| Net increase (decrease) in net assets resulting from operations | | 47,904,665 | | (47,355,639) |
| Distributions to shareholders | | (17,549,942) | | (121,901,185) |
| Share transactions - net increase (decrease) | | 40,541,689 | | (34,069,737) |
| Total increase (decrease) in net assets | | 70,896,412 | | (203,326,561) |
| | | | | |
| Net Assets | | | | |
| Beginning of period | | 471,316,670 | | 674,643,231 |
| End of period | $ | 542,213,082 | $ | 471,316,670 |
| | | | | |
| | | | | |
Financial Highlights
| Fidelity Advisor® Industrials Fund Class A |
| |
| | Six months ended (Unaudited) January 31, 2023 | | Years ended July 31, 2022 | | 2021 | | 2020 | | 2019 | | 2018 |
Selected Per-Share Data | | | | | | | | | | | | |
| Net asset value, beginning of period | $ | 34.23 | $ | 45.64 | $ | 33.85 | $ | 38.95 | $ | 42.62 | $ | 37.89 |
| Income from Investment Operations | | | | | | | | | | | | |
Net investment income (loss) A,B | | .01 C | | (.14) | | (.17) | | .18 D | | .24 | | .13 |
| Net realized and unrealized gain (loss) | | 2.72 | | (2.62) | | 12.20 | | (2.46) | | (.02) | | 5.87 |
| Total from investment operations | | 2.73 | | (2.76) | | 12.03 | | (2.28) | | .22 | | 6.00 |
| Distributions from net investment income | | (.02) | | - | | - | | (.25) | | (.19) | | (.10) |
| Distributions from net realized gain | | (1.16) | | (8.65) | | (.24) | | (2.57) | | (3.70) | | (1.17) |
| Total distributions | | (1.18) | | (8.65) | | (.24) | | (2.82) | | (3.89) | | (1.27) |
| Net asset value, end of period | $ | 35.78 | $ | 34.23 | $ | 45.64 | $ | 33.85 | $ | 38.95 | $ | 42.62 |
Total Return E,F,G | | 8.21% | | (7.79)% | | 35.63% | | (6.58)% | | 2.06% | | 15.97% |
Ratios to Average Net Assets B,H,I | | | | | | | | | | | | |
| Expenses before reductions | | 1.04% J | | 1.02% | | 1.03% | | 1.05% | | 1.04% | | 1.06% |
| Expenses net of fee waivers, if any | | 1.04% J | | 1.01% | | 1.03% | | 1.05% | | 1.04% | | 1.06% |
| Expenses net of all reductions | | 1.04% J | | 1.01% | | 1.01% | | 1.03% | | 1.03% | | 1.05% |
| Net investment income (loss) | | (.05)% C,J | | (.35)% | | (.40)% | | .49% D | | .63% | | .32% |
| Supplemental Data | | | | | | | | | | | | |
| Net assets, end of period (000 omitted) | $ | 218,938 | $ | 214,576 | $ | 264,130 | $ | 199,835 | $ | 268,483 | $ | 303,201 |
Portfolio turnover rate K | | 114% J | | 106% | | 205% | | 219% L | | 125% | | 61% |
A Calculated based on average shares outstanding during the period.
B Net investment income (loss) is affected by the timing of the declaration of dividends by any underlying mutual funds or exchange-traded funds (ETFs). Net investment income (loss) of any mutual funds or ETFs is not included in the Fund's net investment income (loss) ratio.
C Net investment income per share reflects one or more large, non-recurring dividend(s) which amounted to $.04 per share. Such dividends are not annualized in the ratio of net investment income (loss) to average net assets. Excluding such non-recurring dividend(s) the ratio of net investment income (loss) to average net assets would have been (.17)%.
D Net investment income per share reflects one or more large, non-recurring dividend(s) which amounted to $.07 per share. Excluding such non-recurring dividend(s), the ratio of net investment income (loss) to average net assets would have been .29%.
E Total returns for periods of less than one year are not annualized.
F Total returns would have been lower if certain expenses had not been reduced during the applicable periods shown.
G Total returns do not include the effect of the sales charges.
H Fees and expenses of any underlying mutual funds or exchange-traded funds (ETFs) are not included in the Fund's expense ratio. The Fund indirectly bears its proportionate share of these expenses. For additional expense information related to investments in Fidelity Central Funds, please refer to the "Investments in Fidelity Central Funds" note found in the Notes to Financial Statements section of the most recent Annual or Semi-Annual report.
I Expense ratios reflect operating expenses of the class. Expenses before reductions do not reflect amounts reimbursed, waived, or reduced through arrangements with the investment adviser, brokerage services, or other offset arrangements, if applicable, and do not represent the amount paid by the class during periods when reimbursements, waivers or reductions occur.
J Annualized.
K Amount does not include the portfolio activity of any underlying mutual funds or exchange-traded funds (ETFs).
L Portfolio turnover rate excludes securities received or delivered in-kind.
| Fidelity Advisor® Industrials Fund Class M |
| |
| | Six months ended (Unaudited) January 31, 2023 | | Years ended July 31, 2022 | | 2021 | | 2020 | | 2019 | | 2018 |
Selected Per-Share Data | | | | | | | | | | | | |
| Net asset value, beginning of period | $ | 33.05 | $ | 44.31 | $ | 32.96 | $ | 37.99 | $ | 41.65 | $ | 37.03 |
| Income from Investment Operations | | | | | | | | | | | | |
Net investment income (loss) A,B | | (.03) C | | (.23) | | (.27) | | .08 D | | .14 | | .03 |
| Net realized and unrealized gain (loss) | | 2.62 | | (2.53) | | 11.86 | | (2.39) | | (.03) | | 5.74 |
| Total from investment operations | | 2.59 | | (2.76) | | 11.59 | | (2.31) | | .11 | | 5.77 |
| Distributions from net investment income | | - | | - | | - | | (.15) | | (.07) | | - |
| Distributions from net realized gain | | (1.16) | | (8.50) | | (.24) | | (2.57) | | (3.70) | | (1.15) |
| Total distributions | | (1.16) | | (8.50) | | (.24) | | (2.72) | | (3.77) | | (1.15) |
| Net asset value, end of period | $ | 34.48 | $ | 33.05 | $ | 44.31 | $ | 32.96 | $ | 37.99 | $ | 41.65 |
Total Return E,F,G | | 8.08% | | (8.03)% | | 35.25% | | (6.82)% | | 1.78% | | 15.70% |
Ratios to Average Net Assets B,H,I | | | | | | | | | | | | |
| Expenses before reductions | | 1.30% J | | 1.27% | | 1.29% | | 1.31% | | 1.31% | | 1.32% |
| Expenses net of fee waivers, if any | | 1.30% J | | 1.27% | | 1.29% | | 1.31% | | 1.30% | | 1.32% |
| Expenses net of all reductions | | 1.29% J | | 1.27% | | 1.27% | | 1.30% | | 1.30% | | 1.31% |
| Net investment income (loss) | | (.30)% C,J | | (.60)% | | (.66)% | | .23% D | | .37% | | .07% |
| Supplemental Data | | | | | | | | | | | | |
| Net assets, end of period (000 omitted) | $ | 52,102 | $ | 49,501 | $ | 56,680 | $ | 45,157 | $ | 61,570 | $ | 72,143 |
Portfolio turnover rate K | | 114% J | | 106% | | 205% | | 219% L | | 125% | | 61% |
A Calculated based on average shares outstanding during the period.
B Net investment income (loss) is affected by the timing of the declaration of dividends by any underlying mutual funds or exchange-traded funds (ETFs). Net investment income (loss) of any mutual funds or ETFs is not included in the Fund's net investment income (loss) ratio.
C Net investment income per share reflects one or more large, non-recurring dividend(s) which amounted to $.04 per share. Such dividends are not annualized in the ratio of net investment income (loss) to average net assets. Excluding such non-recurring dividend(s) the ratio of net investment income (loss) to average net assets would have been (.43)%.
D Net investment income per share reflects one or more large, non-recurring dividend(s) which amounted to $.07 per share. Excluding such non-recurring dividend(s), the ratio of net investment income (loss) to average net assets would have been .03%.
E Total returns for periods of less than one year are not annualized.
F Total returns would have been lower if certain expenses had not been reduced during the applicable periods shown.
G Total returns do not include the effect of the sales charges.
H Fees and expenses of any underlying mutual funds or exchange-traded funds (ETFs) are not included in the Fund's expense ratio. The Fund indirectly bears its proportionate share of these expenses. For additional expense information related to investments in Fidelity Central Funds, please refer to the "Investments in Fidelity Central Funds" note found in the Notes to Financial Statements section of the most recent Annual or Semi-Annual report.
I Expense ratios reflect operating expenses of the class. Expenses before reductions do not reflect amounts reimbursed, waived, or reduced through arrangements with the investment adviser, brokerage services, or other offset arrangements, if applicable, and do not represent the amount paid by the class during periods when reimbursements, waivers or reductions occur.
J Annualized.
K Amount does not include the portfolio activity of any underlying mutual funds or exchange-traded funds (ETFs).
L Portfolio turnover rate excludes securities received or delivered in-kind.
| Fidelity Advisor® Industrials Fund Class C |
| |
| | Six months ended (Unaudited) January 31, 2023 | | Years ended July 31, 2022 | | 2021 | | 2020 | | 2019 | | 2018 |
Selected Per-Share Data | | | | | | | | | | | | |
| Net asset value, beginning of period | $ | 28.72 | $ | 39.46 | $ | 29.52 | $ | 34.27 | $ | 38.09 | $ | 34.09 |
| Income from Investment Operations | | | | | | | | | | | | |
Net investment income (loss) A,B | | (.10) C | | (.37) | | (.41) | | (.08) D | | (.04) | | (.16) |
| Net realized and unrealized gain (loss) | | 2.26 | | (2.19) | | 10.59 | | (2.15) | | (.08) | | 5.28 |
| Total from investment operations | | 2.16 | | (2.56) | | 10.18 | | (2.23) | | (.12) | | 5.12 |
| Distributions from net investment income | | - | | - | | - | | (.03) | | - | | - |
| Distributions from net realized gain | | (1.16) | | (8.18) | | (.24) | | (2.49) | | (3.70) | | (1.12) |
| Total distributions | | (1.16) | | (8.18) | | (.24) | | (2.52) | | (3.70) | | (1.12) |
| Net asset value, end of period | $ | 29.72 | $ | 28.72 | $ | 39.46 | $ | 29.52 | $ | 34.27 | $ | 38.09 |
Total Return E,F,G | | 7.80% | | (8.48)% | | 34.58% | | (7.27)% | | 1.28% | | 15.13% |
Ratios to Average Net Assets B,H,I | | | | | | | | | | | | |
| Expenses before reductions | | 1.80% J | | 1.77% | | 1.79% | | 1.81% | | 1.80% | | 1.82% |
| Expenses net of fee waivers, if any | | 1.80% J | | 1.77% | | 1.79% | | 1.81% | | 1.80% | | 1.82% |
| Expenses net of all reductions | | 1.80% J | | 1.77% | | 1.77% | | 1.79% | | 1.79% | | 1.81% |
| Net investment income (loss) | | (.80)% C,J | | (1.10)% | | (1.16)% | | (.26)% D | | (.12)% | | (.43)% |
| Supplemental Data | | | | | | | | | | | | |
| Net assets, end of period (000 omitted) | $ | 34,746 | $ | 37,417 | $ | 55,576 | $ | 53,969 | $ | 90,512 | $ | 138,249 |
Portfolio turnover rate K | | 114% J | | 106% | | 205% | | 219% L | | 125% | | 61% |
A Calculated based on average shares outstanding during the period.
B Net investment income (loss) is affected by the timing of the declaration of dividends by any underlying mutual funds or exchange-traded funds (ETFs). Net investment income (loss) of any mutual funds or ETFs is not included in the Fund's net investment income (loss) ratio.
C Net investment income per share reflects one or more large, non-recurring dividend(s) which amounted to $.04 per share. Such dividends are not annualized in the ratio of net investment income (loss) to average net assets. Excluding such non-recurring dividend(s) the ratio of net investment income (loss) to average net assets would have been (.93)%.
D Net investment income per share reflects one or more large, non-recurring dividend(s) which amounted to $.06 per share. Excluding such non-recurring dividend(s), the ratio of net investment income (loss) to average net assets would have been (.46)%.
E Total returns for periods of less than one year are not annualized.
F Total returns would have been lower if certain expenses had not been reduced during the applicable periods shown.
G Total returns do not include the effect of the contingent deferred sales charge.
H Fees and expenses of any underlying mutual funds or exchange-traded funds (ETFs) are not included in the Fund's expense ratio. The Fund indirectly bears its proportionate share of these expenses. For additional expense information related to investments in Fidelity Central Funds, please refer to the "Investments in Fidelity Central Funds" note found in the Notes to Financial Statements section of the most recent Annual or Semi-Annual report.
I Expense ratios reflect operating expenses of the class. Expenses before reductions do not reflect amounts reimbursed, waived, or reduced through arrangements with the investment adviser, brokerage services, or other offset arrangements, if applicable, and do not represent the amount paid by the class during periods when reimbursements, waivers or reductions occur.
J Annualized.
K Amount does not include the portfolio activity of any underlying mutual funds or exchange-traded funds (ETFs).
L Portfolio turnover rate excludes securities received or delivered in-kind.
| Fidelity Advisor® Industrials Fund Class I |
| |
| | Six months ended (Unaudited) January 31, 2023 | | Years ended July 31, 2022 | | 2021 | | 2020 | | 2019 | | 2018 |
Selected Per-Share Data | | | | | | | | | | | | |
| Net asset value, beginning of period | $ | 36.95 | $ | 48.64 | $ | 35.97 | $ | 41.20 | $ | 44.85 | $ | 39.80 |
| Income from Investment Operations | | | | | | | | | | | | |
Net investment income (loss) A,B | | .06 C | | (.03) | | (.06) | | .29 D | | .37 | | .25 |
| Net realized and unrealized gain (loss) | | 2.95 | | (2.84) | | 12.97 | | (2.60) | | (.02) | | 6.18 |
| Total from investment operations | | 3.01 | | (2.87) | | 12.91 | | (2.31) | | .35 | | 6.43 |
| Distributions from net investment income | | (.06) | | - | | - | | (.35) | | (.30) | | (.21) |
| Distributions from net realized gain | | (1.16) | | (8.82) | | (.24) | | (2.57) | | (3.70) | | (1.17) |
| Total distributions | | (1.22) | | (8.82) | | (.24) | | (2.92) | | (4.00) | | (1.38) |
| Net asset value, end of period | $ | 38.74 | $ | 36.95 | $ | 48.64 | $ | 35.97 | $ | 41.20 | $ | 44.85 |
Total Return E,F | | 8.36% | | (7.55)% | | 35.98% | | (6.32)% | | 2.31% | | 16.30% |
Ratios to Average Net Assets B,G,H | | | | | | | | | | | | |
| Expenses before reductions | | .77% I | | .75% | | .76% | | .78% | | .78% | | .80% |
| Expenses net of fee waivers, if any | | .77% I | | .75% | | .76% | | .78% | | .77% | | .80% |
| Expenses net of all reductions | | .77% I | | .75% | | .74% | | .76% | | .77% | | .79% |
| Net investment income (loss) | | .22% C,I | | (.08)% | | (.14)% | | .76% D | | .90% | | .59% |
| Supplemental Data | | | | | | | | | | | | |
| Net assets, end of period (000 omitted) | $ | 136,555 | $ | 145,849 | $ | 248,090 | $ | 123,603 | $ | 219,218 | $ | 320,902 |
Portfolio turnover rate J | | 114% I | | 106% | | 205% | | 219% K | | 125% | | 61% |
A Calculated based on average shares outstanding during the period.
B Net investment income (loss) is affected by the timing of the declaration of dividends by any underlying mutual funds or exchange-traded funds (ETFs). Net investment income (loss) of any mutual funds or ETFs is not included in the Fund's net investment income (loss) ratio.
C Net investment income per share reflects one or more large, non-recurring dividend(s) which amounted to $.05 per share. Such dividends are not annualized in the ratio of net investment income (loss) to average net assets. Excluding such non-recurring dividend(s) the ratio of net investment income (loss) to average net assets would have been .10%.
D Net investment income per share reflects one or more large, non-recurring dividend(s) which amounted to $.08 per share. Excluding such non-recurring dividend(s), the ratio of net investment income (loss) to average net assets would have been .56%.
E Total returns for periods of less than one year are not annualized.
F Total returns would have been lower if certain expenses had not been reduced during the applicable periods shown.
G Fees and expenses of any underlying mutual funds or exchange-traded funds (ETFs) are not included in the Fund's expense ratio. The Fund indirectly bears its proportionate share of these expenses. For additional expense information related to investments in Fidelity Central Funds, please refer to the "Investments in Fidelity Central Funds" note found in the Notes to Financial Statements section of the most recent Annual or Semi-Annual report.
H Expense ratios reflect operating expenses of the class. Expenses before reductions do not reflect amounts reimbursed, waived, or reduced through arrangements with the investment adviser, brokerage services, or other offset arrangements, if applicable, and do not represent the amount paid by the class during periods when reimbursements, waivers or reductions occur.
I Annualized.
J Amount does not include the portfolio activity of any underlying mutual funds or exchange-traded funds (ETFs).
K Portfolio turnover rate excludes securities received or delivered in-kind.
| Fidelity Advisor® Industrials Fund Class Z |
| |
| | Six months ended (Unaudited) January 31, 2023 | | Years ended July 31, 2022 | | 2021 | | 2020 | | 2019 A |
Selected Per-Share Data | | | | | | | | | | |
| Net asset value, beginning of period | $ | 36.91 | $ | 48.61 | $ | 35.90 | $ | 41.15 | $ | 46.84 |
| Income from Investment Operations | | | | | | | | | | |
Net investment income (loss) B,C | | .09 D | | .02 | | - E | | .34 F | | .34 |
| Net realized and unrealized gain (loss) | | 2.93 | | (2.83) | | 12.95 | | (2.60) | | (1.94) |
| Total from investment operations | | 3.02 | | (2.81) | | 12.95 | | (2.26) | | (1.60) |
| Distributions from net investment income | | (.08) | | - | | - | | (.42) | | (.39) |
| Distributions from net realized gain | | (1.16) | | (8.89) | | (.24) | | (2.57) | | (3.70) |
| Total distributions | | (1.24) | | (8.89) | | (.24) | | (2.99) | | (4.09) |
| Net asset value, end of period | $ | 38.69 | $ | 36.91 | $ | 48.61 | $ | 35.90 | $ | 41.15 |
Total Return G,H | | 8.41% | | (7.42)% | | 36.16% | | (6.21)% | | (1.92)% |
Ratios to Average Net Assets C,I,J | | | | | | | | | | |
| Expenses before reductions | | .65% K | | .63% | | .64% | | .65% | | .64% K |
| Expenses net of fee waivers, if any | | .65% K | | .62% | | .64% | | .65% | | .64% K |
| Expenses net of all reductions | | .65% K | | .62% | | .62% | | .63% | | .64% K |
| Net investment income (loss) | | .35% D,K | | .04% | | (.01)% | | .89% F | | 1.04% K |
| Supplemental Data | | | | | | | | | | |
| Net assets, end of period (000 omitted) | $ | 99,872 | $ | 23,974 | $ | 50,167 | $ | 29,168 | $ | 11,077 |
Portfolio turnover rate L | | 114% K | | 106% | | 205% | | 219% M | | 125% |
A For the period October 2, 2018 (commencement of sale of shares) through July 31, 2019.
B Calculated based on average shares outstanding during the period.
C Net investment income (loss) is affected by the timing of the declaration of dividends by any underlying mutual funds or exchange-traded funds (ETFs). Net investment income (loss) of any mutual funds or ETFs is not included in the Fund's net investment income (loss) ratio.
D Net investment income per share reflects one or more large, non-recurring dividend(s) which amounted to $.05 per share. Such dividends are not annualized in the ratio of net investment income (loss) to average net assets. Excluding such non-recurring dividend(s) the ratio of net investment income (loss) to average net assets would have been .22%.
E Amount represents less than $.005 per share.
F Net investment income per share reflects one or more large, non-recurring dividend(s) which amounted to $.08 per share. Excluding such non-recurring dividend(s), the ratio of net investment income (loss) to average net assets would have been .69%.
G Total returns for periods of less than one year are not annualized.
H Total returns would have been lower if certain expenses had not been reduced during the applicable periods shown.
I Fees and expenses of any underlying mutual funds or exchange-traded funds (ETFs) are not included in the Fund's expense ratio. The Fund indirectly bears its proportionate share of these expenses. For additional expense information related to investments in Fidelity Central Funds, please refer to the "Investments in Fidelity Central Funds" note found in the Notes to Financial Statements section of the most recent Annual or Semi-Annual report.
J Expense ratios reflect operating expenses of the class. Expenses before reductions do not reflect amounts reimbursed, waived, or reduced through arrangements with the investment adviser, brokerage services, or other offset arrangements, if applicable, and do not represent the amount paid by the class during periods when reimbursements, waivers or reductions occur.
K Annualized.
L Amount does not include the portfolio activity of any underlying mutual funds or exchange-traded funds (ETFs).
M Portfolio turnover rate excludes securities received or delivered in-kind.
Top Holdings (% of Fund's net assets) |
| |
| NVIDIA Corp. | 24.6 | |
| NXP Semiconductors NV | 9.7 | |
| onsemi | 8.6 | |
| Marvell Technology, Inc. | 6.9 | |
| Taiwan Semiconductor Manufacturing Co. Ltd. sponsored ADR | 4.9 | |
| GlobalFoundries, Inc. | 4.5 | |
| Microchip Technology, Inc. | 4.5 | |
| Broadcom, Inc. | 4.3 | |
| Lam Research Corp. | 3.9 | |
| Teradyne, Inc. | 3.9 | |
| | 75.8 | |
| |
| Industries (% of Fund's net assets) |
| |
| Semiconductors & Semiconductor Equipment | 95.2 | |
| Technology Hardware, Storage & Peripherals | 0.5 | |
| Auto Components | 0.3 | |
| Electrical Equipment | 0.3 | |
| Metals & Mining | 0.1 | |
| Electronic Equipment & Components | 0.0 | |
| Software | 0.0 | |
| |
Geographic Diversification (% of Fund's net assets) |
|
* Includes Short-Term investments and Net Other Assets (Liabilities). Percentages are based on country or territory of incorporation and are adjusted for the effect of derivatives, if applicable. |
| |
Fidelity Advisor® Semiconductors Fund
Showing Percentage of Net Assets
| Common Stocks - 95.8% |
| | | Shares | Value ($) |
| Auto Components - 0.3% | | | |
| Auto Parts & Equipment - 0.3% | | | |
| Mobileye Global, Inc. (a) | | 56,487 | 2,180,398 |
| Electrical Equipment - 0.3% | | | |
| Electrical Components & Equipment - 0.3% | | | |
| Array Technologies, Inc. (b) | | 94,900 | 2,109,627 |
| Electronic Equipment & Components - 0.0% | | | |
| Electronic Equipment & Instruments - 0.0% | | | |
| Aeva Technologies, Inc. (b) | | 118,100 | 199,589 |
| Semiconductors & Semiconductor Equipment - 94.7% | | | |
| Semiconductor Equipment - 10.0% | | | |
| Applied Materials, Inc. | | 15,000 | 1,672,350 |
| Enphase Energy, Inc. (b) | | 12,100 | 2,678,698 |
| KLA Corp. | | 5,500 | 2,158,640 |
| Lam Research Corp. | | 63,746 | 31,879,375 |
| Nova Ltd. (a)(b) | | 122,932 | 11,149,932 |
| Teradyne, Inc. | | 309,400 | 31,465,980 |
| | | | 81,004,975 |
| Semiconductors - 84.7% | | | |
| Advanced Micro Devices, Inc. (b) | | 197,274 | 14,825,141 |
| Allegro MicroSystems LLC (b) | | 276,200 | 10,542,554 |
| Analog Devices, Inc. | | 103,606 | 17,765,321 |
| Broadcom, Inc. | | 59,625 | 34,881,221 |
| Cirrus Logic, Inc. (b) | | 98,228 | 8,878,829 |
| GlobalFoundries, Inc. (a)(b) | | 623,400 | 36,955,152 |
| Lattice Semiconductor Corp. (b) | | 170,400 | 12,914,616 |
| MACOM Technology Solutions Holdings, Inc. (b) | | 197,562 | 13,240,605 |
| Marvell Technology, Inc. | | 1,296,833 | 55,958,344 |
| Microchip Technology, Inc. | | 472,477 | 36,673,665 |
| Monolithic Power Systems, Inc. | | 43,424 | 18,522,941 |
| NVIDIA Corp. | | 1,027,527 | 200,747,951 |
| NXP Semiconductors NV | | 429,453 | 79,152,482 |
| onsemi (b) | | 950,336 | 69,802,179 |
| Qualcomm, Inc. | | 96,226 | 12,818,265 |
| Skyworks Solutions, Inc. | | 83,700 | 9,179,379 |
| Taiwan Semiconductor Manufacturing Co. Ltd. sponsored ADR | | 428,700 | 39,753,351 |
| Texas Instruments, Inc. | | 81,222 | 14,393,351 |
| Wolfspeed, Inc. (a)(b) | | 36,700 | 2,826,267 |
| | | | 689,831,614 |
TOTAL SEMICONDUCTORS & SEMICONDUCTOR EQUIPMENT | | | 770,836,589 |
| Technology Hardware, Storage & Peripherals - 0.5% | | | |
| Technology Hardware, Storage & Peripherals - 0.5% | | | |
| IonQ, Inc. (b)(c) | | 15,000 | 66,600 |
| Western Digital Corp. (b) | | 94,300 | 4,144,485 |
| | | | 4,211,085 |
| TOTAL COMMON STOCKS (Cost $544,409,988) | | | 779,537,288 |
| | | | |
| Convertible Preferred Stocks - 0.5% |
| | | Shares | Value ($) |
| Electronic Equipment & Components - 0.0% | | | |
| Electronic Components - 0.0% | | | |
| Menlo Micro, Inc. Series C (c)(d) | | 79,800 | 90,174 |
| Metals & Mining - 0.1% | | | |
| Precious Metals & Minerals - 0.1% | | | |
| Diamond Foundry, Inc. Series C (b)(c)(d) | | 18,335 | 650,342 |
| Semiconductors & Semiconductor Equipment - 0.4% | | | |
| Semiconductor Equipment - 0.2% | | | |
| Astera Labs, Inc.: | | | |
| Series A (c)(d) | | 30,452 | 306,652 |
| Series B (c)(d) | | 5,185 | 52,213 |
| Series C (b)(c)(d) | | 19,433 | 195,690 |
| Series D (c)(d) | | 123,852 | 1,247,190 |
| | | | 1,801,745 |
| Semiconductors - 0.2% | | | |
| Alif Semiconductor Series C (c)(d) | | 48,363 | 813,466 |
| GaN Systems, Inc.: | | | |
| Series F1 (b)(c)(d) | | 52,877 | 283,421 |
| Series F2 (b)(c)(d) | | 27,921 | 149,657 |
| SiMa.ai: | | | |
| Series B (b)(c)(d) | | 30,638 | 198,534 |
| Series B1 (c)(d) | | 18,145 | 136,632 |
| | | | 1,581,710 |
TOTAL SEMICONDUCTORS & SEMICONDUCTOR EQUIPMENT | | | 3,383,455 |
| Software - 0.0% | | | |
| Systems Software - 0.0% | | | |
| Tenstorrent, Inc. Series C1 (b)(c)(d) | | 900 | 46,962 |
| TOTAL CONVERTIBLE PREFERRED STOCKS (Cost $4,239,200) | | | 4,170,933 |
| | | | |
| Preferred Securities - 0.1% |
| | | Principal Amount (e) | Value ($) |
| Semiconductors & Semiconductor Equipment - 0.1% | | | |
| Semiconductors - 0.1% | | | |
| GaN Systems, Inc. 0% (c)(d)(f) | | 1,239,360 | 766,544 |
| Software - 0.0% | | | |
| Systems Software - 0.0% | | | |
| Tenstorrent, Inc. 0% (c)(d)(f) | | 50,000 | 43,900 |
| TOTAL PREFERRED SECURITIES (Cost $1,289,360) | | | 810,444 |
| | | | |
| Money Market Funds - 6.0% |
| | | Shares | Value ($) |
| Fidelity Cash Central Fund 4.38% (g) | | 17,993,870 | 17,997,468 |
| Fidelity Securities Lending Cash Central Fund 4.38% (g)(h) | | 30,895,960 | 30,899,050 |
| TOTAL MONEY MARKET FUNDS (Cost $48,896,518) | | | 48,896,518 |
| | | | |
| TOTAL INVESTMENT IN SECURITIES - 102.4% (Cost $598,835,066) | 833,415,183 |
NET OTHER ASSETS (LIABILITIES) - (2.4)% | (19,311,192) |
| NET ASSETS - 100.0% | 814,103,991 |
| | |
Legend
| (a) | Security or a portion of the security is on loan at period end. |
| (c) | Restricted securities (including private placements) - Investment in securities not registered under the Securities Act of 1933 (excluding 144A issues). At the end of the period, the value of restricted securities (excluding 144A issues) amounted to $5,047,977 or 0.6% of net assets. |
| (e) | Amount is stated in United States dollars unless otherwise noted. |
| (f) | Security is perpetual in nature with no stated maturity date. |
| (g) | Affiliated fund that is generally available only to investment companies and other accounts managed by Fidelity Investments. The rate quoted is the annualized seven-day yield of the fund at period end. A complete unaudited listing of the fund's holdings as of its most recent quarter end is available upon request. In addition, each Fidelity Central Fund's financial statements are available on the SEC's website or upon request. |
| (h) | Investment made with cash collateral received from securities on loan. |
| Additional information on each restricted holding is as follows: |
| Security | Acquisition Date | Acquisition Cost ($) |
| Alif Semiconductor Series C | 3/08/22 | 981,698 |
| | | |
| Astera Labs, Inc. Series A | 5/17/22 | 309,682 |
| | | |
| Astera Labs, Inc. Series B | 5/17/22 | 52,729 |
| | | |
| Astera Labs, Inc. Series C | 8/24/21 | 65,330 |
| | | |
| Astera Labs, Inc. Series D | 5/17/22 - 5/27/22 | 1,259,513 |
| | | |
| Diamond Foundry, Inc. Series C | 3/15/21 | 440,040 |
| | | |
| GaN Systems, Inc. Series F1 | 11/30/21 | 448,397 |
| | | |
| GaN Systems, Inc. Series F2 | 11/30/21 | 236,770 |
| | | |
| GaN Systems, Inc. 0% | 11/30/21 | 1,239,360 |
| | | |
| IonQ, Inc. | 3/07/21 | 150,000 |
| | | |
| Menlo Micro, Inc. Series C | 2/09/22 | 105,775 |
| | | |
| SiMa.ai Series B | 5/10/21 | 157,093 |
| | | |
| SiMa.ai Series B1 | 4/25/22 - 10/17/22 | 128,665 |
| | | |
| Tenstorrent, Inc. Series C1 | 4/23/21 | 53,509 |
| | | |
| Tenstorrent, Inc. 0% | 4/23/21 | 50,000 |
| | | |
Affiliated Central Funds
Fiscal year to date information regarding the Fund's investments in Fidelity Central Funds, including the ownership percentage, is presented below.
| Affiliate | Value, beginning of period ($) | Purchases ($) | Sales Proceeds ($) | Dividend Income ($) | Realized Gain (loss) ($) | Change in Unrealized appreciation (depreciation) ($) | Value, end of period ($) | % ownership, end of period |
| Fidelity Cash Central Fund 4.38% | 23,994,086 | 107,031,734 | 113,028,352 | 218,204 | - | - | 17,997,468 | 0.0% |
| Fidelity Securities Lending Cash Central Fund 4.38% | 43,554,325 | 184,204,890 | 196,860,165 | 466,313 | - | - | 30,899,050 | 0.1% |
| Total | 67,548,411 | 291,236,624 | 309,888,517 | 684,517 | - | - | 48,896,518 | |
| | | | | | | | | |
Amounts in the dividend income column in the above table include any capital gain distributions from underlying funds, which are presented in the corresponding line item in the Statement of Operations, if applicable.
Amount for Fidelity Securities Lending Cash Central Fund represents the income earned on investing cash collateral, less rebates paid to borrowers and any lending agent fees associated with the loan, plus any premium payments received for lending certain types of securities.
Amounts included in the purchases and sales proceeds columns may include in-kind transactions, if applicable.
Investment Valuation
The following is a summary of the inputs used, as of January 31, 2023, involving the Fund's assets and liabilities carried at fair value. The inputs or methodology used for valuing securities may not be an indication of the risk associated with investing in those securities. For more information on valuation inputs, and their aggregation into the levels used below, please refer to the Investment Valuation section in the accompanying Notes to Financial Statements.
| Valuation Inputs at Reporting Date: |
| Description | Total ($) | Level 1 ($) | Level 2 ($) | Level 3 ($) |
Investments in Securities: | | | | |
|
| Common Stocks | 779,537,288 | 779,537,288 | - | - |
|
| Convertible Preferred Stocks | 4,170,933 | - | - | 4,170,933 |
|
| Preferred Securities | 810,444 | - | - | 810,444 |
|
| Money Market Funds | 48,896,518 | 48,896,518 | - | - |
| Total Investments in Securities: | 833,415,183 | 828,433,806 | - | 4,981,377 |
Fidelity Advisor® Semiconductors Fund
| Statement of Assets and Liabilities |
| | | | January 31, 2023 (Unaudited) |
| | | | | |
| Assets | | | | |
| Investment in securities, at value (including securities loaned of $31,185,730) - See accompanying schedule: | | | | |
Unaffiliated issuers (cost $549,938,548) | $ | 784,518,665 | | |
Fidelity Central Funds (cost $48,896,518) | | 48,896,518 | | |
| | | | | |
| | | | | |
| Total Investment in Securities (cost $598,835,066) | | | $ | 833,415,183 |
| Receivable for investments sold | | | | 14,322,815 |
| Receivable for fund shares sold | | | | 1,333,400 |
| Dividends receivable | | | | 110,876 |
| Distributions receivable from Fidelity Central Funds | | | | 112,586 |
| Prepaid expenses | | | | 1,467 |
Total assets | | | | 849,296,327 |
| Liabilities | | | | |
| Payable for investments purchased | $ | 2,289,825 | | |
| Payable for fund shares redeemed | | 1,371,973 | | |
| Accrued management fee | | 327,376 | | |
| Distribution and service plan fees payable | | 148,124 | | |
| Other affiliated payables | | 123,224 | | |
| Other payables and accrued expenses | | 32,764 | | |
| Collateral on securities loaned | | 30,899,050 | | |
| Total Liabilities | | | | 35,192,336 |
| Net Assets | | | $ | 814,103,991 |
| Net Assets consist of: | | | | |
| Paid in capital | | | $ | 589,087,171 |
| Total accumulated earnings (loss) | | | | 225,016,820 |
| Net Assets | | | $ | 814,103,991 |
| | | | | |
| Net Asset Value and Maximum Offering Price | | | | |
| Class A : | | | | |
Net Asset Value and redemption price per share ($336,788,004 ÷ 7,824,044 shares) (a) | | | $ | 43.05 |
| Maximum offering price per share (100/94.25 of $43.05) | | | $ | 45.68 |
| Class M : | | | | |
Net Asset Value and redemption price per share ($53,593,986 ÷ 1,326,689 shares) (a) | | | $ | 40.40 |
| Maximum offering price per share (100/96.50 of $40.40) | | | $ | 41.87 |
| Class C : | | | | |
Net Asset Value and offering price per share ($85,928,755 ÷ 2,452,563 shares) (a) | | | $ | 35.04 |
| Class I : | | | | |
Net Asset Value , offering price and redemption price per share ($294,061,593 ÷ 6,351,541 shares) | | | $ | 46.30 |
| Class Z : | | | | |
Net Asset Value , offering price and redemption price per share ($43,731,653 ÷ 944,042 shares) | | | $ | 46.32 |
(a)Redemption price per share is equal to net asset value less any applicable contingent deferred sales charge. |
| Statement of Operations |
| | | | Six months ended January 31, 2023 (Unaudited) |
| Investment Income | | | | |
| Dividends | | | $ | 2,957,915 |
| Income from Fidelity Central Funds (including $466,313 from security lending) | | | | 684,517 |
| Total Income | | | | 3,642,432 |
| Expenses | | | | |
| Management fee | $ | 1,924,875 | | |
| Transfer agent fees | | 618,692 | | |
| Distribution and service plan fees | | 862,621 | | |
| Accounting fees | | 116,111 | | |
| Custodian fees and expenses | | 7,112 | | |
| Independent trustees' fees and expenses | | 1,270 | | |
| Registration fees | | 91,828 | | |
| Audit | | 24,326 | | |
| Legal | | 1,802 | | |
| Miscellaneous | | 2,557 | | |
| Total expenses before reductions | | 3,651,194 | | |
| Expense reductions | | (14,022) | | |
| Total expenses after reductions | | | | 3,637,172 |
| Net Investment income (loss) | | | | 5,260 |
| Realized and Unrealized Gain (Loss) | | | | |
| Net realized gain (loss) on: | | | | |
| Investment Securities: | | | | |
| Unaffiliated issuers | | (6,233,160) | | |
| Foreign currency transactions | | (3,236) | | |
| Total net realized gain (loss) | | | | (6,236,396) |
| Change in net unrealized appreciation (depreciation) on: | | | | |
| Investment Securities: | | | | |
| Unaffiliated issuers | | 26,539,508 | | |
| Assets and liabilities in foreign currencies | | 2,231 | | |
| Total change in net unrealized appreciation (depreciation) | | | | 26,541,739 |
| Net gain (loss) | | | | 20,305,343 |
| Net increase (decrease) in net assets resulting from operations | | | $ | 20,310,603 |
| Statement of Changes in Net Assets |
| |
| | Six months ended January 31, 2023 (Unaudited) | | Year ended July 31, 2022 |
| Increase (Decrease) in Net Assets | | | | |
| Operations | | | | |
| Net investment income (loss) | $ | 5,260 | $ | (2,178,215) |
| Net realized gain (loss) | | (6,236,396) | | 35,703,217 |
| Change in net unrealized appreciation (depreciation) | | 26,541,739 | | (87,724,624) |
| Net increase (decrease) in net assets resulting from operations | | 20,310,603 | | (54,199,622) |
| Distributions to shareholders | | (22,158,679) | | (43,908,446) |
| Share transactions - net increase (decrease) | | 1,803,236 | | 211,964,262 |
| Total increase (decrease) in net assets | | (44,840) | | 113,856,194 |
| | | | | |
| Net Assets | | | | |
| Beginning of period | | 814,148,831 | | 700,292,637 |
| End of period | $ | 814,103,991 | $ | 814,148,831 |
| | | | | |
| | | | | |
Financial Highlights
| Fidelity Advisor® Semiconductors Fund Class A |
| |
| | Six months ended (Unaudited) January 31, 2023 | | Years ended July 31, 2022 | | 2021 | | 2020 | | 2019 | | 2018 |
Selected Per-Share Data | | | | | | | | | | | | |
| Net asset value, beginning of period | $ | 42.85 | $ | 46.29 | $ | 29.79 | $ | 23.03 | $ | 25.06 | $ | 21.57 |
| Income from Investment Operations | | | | | | | | | | | | |
Net investment income (loss) A,B | | (.01) | | (.13) | | (.08) | | .14 | | .15 | | .02 |
| Net realized and unrealized gain (loss) | | 1.41 | | (.83) | | 18.29 | | 6.90 | | 1.25 | | 5.73 |
| Total from investment operations | | 1.40 | | (.96) | | 18.21 | | 7.04 | | 1.40 | | 5.75 |
| Distributions from net investment income | | - | | - | | (.04) | | (.07) | | (.10) | | (.05) C |
| Distributions from net realized gain | | (1.20) | | (2.48) | | (1.67) | | (.20) | | (3.33) | | (2.21) C |
| Total distributions | | (1.20) | | (2.48) | | (1.71) | | (.28) D | | (3.43) | | (2.26) |
Redemption fees added to paid in capital A | | - | | - | | - | | - | | - | | - E |
| Net asset value, end of period | $ | 43.05 | $ | 42.85 | $ | 46.29 | $ | 29.79 | $ | 23.03 | $ | 25.06 |
Total Return F,G,H | | 3.46% | | (3.21)% | | 62.45% | | 30.65% | | 10.18% | | 27.35% |
Ratios to Average Net Assets B,I,J | | | | | | | | | | | | |
| Expenses before reductions | | 1.03% K | | 1.01% | | 1.04% | | 1.10% | | 1.12% | | 1.15% |
| Expenses net of fee waivers, if any | | 1.02% K | | 1.01% | | 1.04% | | 1.09% | | 1.11% | | 1.15% |
| Expenses net of all reductions | | 1.02% K | | 1.01% | | 1.03% | | 1.08% | | 1.11% | | 1.13% |
| Net investment income (loss) | | (.03)% K | | (.27)% | | (.21)% | | .53% | | .70% | | .09% |
| Supplemental Data | | | | | | | | | | | | |
| Net assets, end of period (000 omitted) | $ | 336,788 | $ | 319,402 | $ | 279,755 | $ | 140,072 | $ | 98,459 | $ | 97,883 |
Portfolio turnover rate L | | 42% K | | 32% | | 41% | | 136% | | 110% | | 133% |
A Calculated based on average shares outstanding during the period.
B Net investment income (loss) is affected by the timing of the declaration of dividends by any underlying mutual funds or exchange-traded funds (ETFs). Net investment income (loss) of any mutual funds or ETFs is not included in the Fund's net investment income (loss) ratio.
C The amount shown reflects reclassifications related to book to tax differences that were made in the year shown.
D Total distributions per share do not sum due to rounding.
E Amount represents less than $.005 per share.
F Total returns for periods of less than one year are not annualized.
G Total returns would have been lower if certain expenses had not been reduced during the applicable periods shown.
H Total returns do not include the effect of the sales charges.
I Fees and expenses of any underlying mutual funds or exchange-traded funds (ETFs) are not included in the Fund's expense ratio. The Fund indirectly bears its proportionate share of these expenses. For additional expense information related to investments in Fidelity Central Funds, please refer to the "Investments in Fidelity Central Funds" note found in the Notes to Financial Statements section of the most recent Annual or Semi-Annual report.
J Expense ratios reflect operating expenses of the class. Expenses before reductions do not reflect amounts reimbursed, waived, or reduced through arrangements with the investment adviser, brokerage services, or other offset arrangements, if applicable, and do not represent the amount paid by the class during periods when reimbursements, waivers or reductions occur.
K Annualized.
L Amount does not include the portfolio activity of any underlying mutual funds or exchange-traded funds (ETFs).
| Fidelity Advisor® Semiconductors Fund Class M |
| |
| | Six months ended (Unaudited) January 31, 2023 | | Years ended July 31, 2022 | | 2021 | | 2020 | | 2019 | | 2018 |
Selected Per-Share Data | | | | | | | | | | | | |
| Net asset value, beginning of period | $ | 40.34 | $ | 43.75 | $ | 28.25 | $ | 21.89 | $ | 24.04 | $ | 20.77 |
| Income from Investment Operations | | | | | | | | | | | | |
Net investment income (loss) A,B | | (.05) | | (.23) | | (.17) | | .06 | | .08 | | (.05) |
| Net realized and unrealized gain (loss) | | 1.31 | | (.76) | | 17.31 | | 6.55 | | 1.16 | | 5.50 |
| Total from investment operations | | 1.26 | | (.99) | | 17.14 | | 6.61 | | 1.24 | | 5.45 |
| Distributions from net investment income | | - | | - | | - | | (.05) | | (.06) | | - C |
| Distributions from net realized gain | | (1.20) | | (2.42) | | (1.64) | | (.20) | | (3.33) | | (2.18) C |
| Total distributions | | (1.20) | | (2.42) | | (1.64) | | (.25) | | (3.39) | | (2.18) |
Redemption fees added to paid in capital A | | - | | - | | - | | - | | - | | - D |
| Net asset value, end of period | $ | 40.40 | $ | 40.34 | $ | 43.75 | $ | 28.25 | $ | 21.89 | $ | 24.04 |
Total Return E,F,G | | 3.32% | | (3.43)% | | 61.98% | | 30.28% | | 9.84% | | 26.95% |
Ratios to Average Net Assets B,H,I | | | | | | | | | | | | |
| Expenses before reductions | | 1.28% J | | 1.26% | | 1.30% | | 1.38% | | 1.44% | | 1.48% |
| Expenses net of fee waivers, if any | | 1.28% J | | 1.25% | | 1.30% | | 1.38% | | 1.43% | | 1.47% |
| Expenses net of all reductions | | 1.28% J | | 1.25% | | 1.29% | | 1.37% | | 1.43% | | 1.46% |
| Net investment income (loss) | | (.28)% J | | (.52)% | | (.47)% | | .24% | | .38% | | (.23)% |
| Supplemental Data | | | | | | | | | | | | |
| Net assets, end of period (000 omitted) | $ | 53,594 | $ | 48,499 | $ | 49,963 | $ | 29,262 | $ | 22,587 | $ | 21,830 |
Portfolio turnover rate K | | 42% J | | 32% | | 41% | | 136% | | 110% | | 133% |
A Calculated based on average shares outstanding during the period.
B Net investment income (loss) is affected by the timing of the declaration of dividends by any underlying mutual funds or exchange-traded funds (ETFs). Net investment income (loss) of any mutual funds or ETFs is not included in the Fund's net investment income (loss) ratio.
C The amount shown reflects reclassifications related to book to tax differences that were made in the year shown.
D Amount represents less than $.005 per share.
E Total returns for periods of less than one year are not annualized.
F Total returns would have been lower if certain expenses had not been reduced during the applicable periods shown.
G Total returns do not include the effect of the sales charges.
H Fees and expenses of any underlying mutual funds or exchange-traded funds (ETFs) are not included in the Fund's expense ratio. The Fund indirectly bears its proportionate share of these expenses. For additional expense information related to investments in Fidelity Central Funds, please refer to the "Investments in Fidelity Central Funds" note found in the Notes to Financial Statements section of the most recent Annual or Semi-Annual report.
I Expense ratios reflect operating expenses of the class. Expenses before reductions do not reflect amounts reimbursed, waived, or reduced through arrangements with the investment adviser, brokerage services, or other offset arrangements, if applicable, and do not represent the amount paid by the class during periods when reimbursements, waivers or reductions occur.
J Annualized.
K Amount does not include the portfolio activity of any underlying mutual funds or exchange-traded funds (ETFs).
| Fidelity Advisor® Semiconductors Fund Class C |
| |
| | Six months ended (Unaudited) January 31, 2023 | | Years ended July 31, 2022 | | 2021 | | 2020 | | 2019 | | 2018 |
Selected Per-Share Data | | | | | | | | | | | | |
| Net asset value, beginning of period | $ | 35.24 | $ | 38.59 | $ | 25.18 | $ | 19.59 | $ | 21.88 | $ | 19.10 |
| Income from Investment Operations | | | | | | | | | | | | |
Net investment income (loss) A,B | | (.12) | | (.40) | | (.31) | | (.05) | | (.01) | | (.14) |
| Net realized and unrealized gain (loss) | | 1.12 | | (.61) | | 15.35 | | 5.86 | | .98 | | 5.05 |
| Total from investment operations | | 1.00 | | (1.01) | | 15.04 | | 5.81 | | .97 | | 4.91 |
| Distributions from net investment income | | - | | - | | - | | (.01) | | - | | - |
| Distributions from net realized gain | | (1.20) | | (2.34) | | (1.63) | | (.20) | | (3.26) | | (2.13) |
| Total distributions | | (1.20) | | (2.34) | | (1.63) | | (.22) C | | (3.26) | | (2.13) |
Redemption fees added to paid in capital A | | - | | - | | - | | - | | - | | - D |
| Net asset value, end of period | $ | 35.04 | $ | 35.24 | $ | 38.59 | $ | 25.18 | $ | 19.59 | $ | 21.88 |
Total Return E,F,G | | 3.06% | | (3.93)% | | 61.17% | | 29.73% | | 9.33% | | 26.38% |
Ratios to Average Net Assets B,H,I | | | | | | | | | | | | |
| Expenses before reductions | | 1.78% J | | 1.76% | | 1.79% | | 1.85% | | 1.87% | | 1.91% |
| Expenses net of fee waivers, if any | | 1.78% J | | 1.76% | | 1.79% | | 1.85% | | 1.87% | | 1.91% |
| Expenses net of all reductions | | 1.78% J | | 1.76% | | 1.79% | | 1.83% | | 1.87% | | 1.89% |
| Net investment income (loss) | | (.78)% J | | (1.03)% | | (.97)% | | (.23)% | | (.06)% | | (.67)% |
| Supplemental Data | | | | | | | | | | | | |
| Net assets, end of period (000 omitted) | $ | 85,929 | $ | 88,592 | $ | 86,217 | $ | 57,320 | $ | 45,659 | $ | 57,915 |
Portfolio turnover rate K | | 42% J | | 32% | | 41% | | 136% | | 110% | | 133% |
A Calculated based on average shares outstanding during the period.
B Net investment income (loss) is affected by the timing of the declaration of dividends by any underlying mutual funds or exchange-traded funds (ETFs). Net investment income (loss) of any mutual funds or ETFs is not included in the Fund's net investment income (loss) ratio.
C Total distributions per share do not sum due to rounding.
D Amount represents less than $.005 per share.
E Total returns for periods of less than one year are not annualized.
F Total returns would have been lower if certain expenses had not been reduced during the applicable periods shown.
G Total returns do not include the effect of the contingent deferred sales charge.
H Fees and expenses of any underlying mutual funds or exchange-traded funds (ETFs) are not included in the Fund's expense ratio. The Fund indirectly bears its proportionate share of these expenses. For additional expense information related to investments in Fidelity Central Funds, please refer to the "Investments in Fidelity Central Funds" note found in the Notes to Financial Statements section of the most recent Annual or Semi-Annual report.
I Expense ratios reflect operating expenses of the class. Expenses before reductions do not reflect amounts reimbursed, waived, or reduced through arrangements with the investment adviser, brokerage services, or other offset arrangements, if applicable, and do not represent the amount paid by the class during periods when reimbursements, waivers or reductions occur.
J Annualized.
K Amount does not include the portfolio activity of any underlying mutual funds or exchange-traded funds (ETFs).
| Fidelity Advisor® Semiconductors Fund Class I |
| |
| | Six months ended (Unaudited) January 31, 2023 | | Years ended July 31, 2022 | | 2021 | | 2020 | | 2019 | | 2018 |
Selected Per-Share Data | | | | | | | | | | | | |
| Net asset value, beginning of period | $ | 45.93 | $ | 49.39 | $ | 31.68 | $ | 24.42 | $ | 26.33 | $ | 22.56 |
| Income from Investment Operations | | | | | | | | | | | | |
Net investment income (loss) A,B | | .05 | | (.01) | | .03 | | .22 | | .23 | | .10 |
| Net realized and unrealized gain (loss) | | 1.52 | | (.92) | | 19.47 | | 7.34 | | 1.35 | | 5.99 |
| Total from investment operations | | 1.57 | | (.93) | | 19.50 | | 7.56 | | 1.58 | | 6.09 |
| Distributions from net investment income | | - | | - | | (.12) | | (.10) | | (.16) | | (.11) C |
| Distributions from net realized gain | | (1.20) | | (2.53) | | (1.67) | | (.20) | | (3.33) | | (2.21) C |
| Total distributions | | (1.20) | | (2.53) | | (1.79) | | (.30) | | (3.49) | | (2.32) |
Redemption fees added to paid in capital A | | - | | - | | - | | - | | - | | - D |
| Net asset value, end of period | $ | 46.30 | $ | 45.93 | $ | 49.39 | $ | 31.68 | $ | 24.42 | $ | 26.33 |
Total Return E,F | | 3.60% | | (2.96)% | | 62.86% | | 31.08% | | 10.46% | | 27.74% |
Ratios to Average Net Assets B,G,H | | | | | | | | | | | | |
| Expenses before reductions | | .76% I | | .75% | | .77% | | .81% | | .83% | | .86% |
| Expenses net of fee waivers, if any | | .75% I | | .74% | | .77% | | .81% | | .82% | | .86% |
| Expenses net of all reductions | | .75% I | | .74% | | .76% | | .79% | | .82% | | .84% |
| Net investment income (loss) | | .24% I | | (.01)% | | .06% | | .81% | | .98% | | .38% |
| Supplemental Data | | | | | | | | | | | | |
| Net assets, end of period (000 omitted) | $ | 294,062 | $ | 309,873 | $ | 257,502 | $ | 126,660 | $ | 98,451 | $ | 140,362 |
Portfolio turnover rate J | | 42% I | | 32% | | 41% | | 136% | | 110% | | 133% |
A Calculated based on average shares outstanding during the period.
B Net investment income (loss) is affected by the timing of the declaration of dividends by any underlying mutual funds or exchange-traded funds (ETFs). Net investment income (loss) of any mutual funds or ETFs is not included in the Fund's net investment income (loss) ratio.
C The amount shown reflects reclassifications related to book to tax differences that were made in the year shown.
D Amount represents less than $.005 per share.
E Total returns for periods of less than one year are not annualized.
F Total returns would have been lower if certain expenses had not been reduced during the applicable periods shown.
G Fees and expenses of any underlying mutual funds or exchange-traded funds (ETFs) are not included in the Fund's expense ratio. The Fund indirectly bears its proportionate share of these expenses. For additional expense information related to investments in Fidelity Central Funds, please refer to the "Investments in Fidelity Central Funds" note found in the Notes to Financial Statements section of the most recent Annual or Semi-Annual report.
H Expense ratios reflect operating expenses of the class. Expenses before reductions do not reflect amounts reimbursed, waived, or reduced through arrangements with the investment adviser, brokerage services, or other offset arrangements, if applicable, and do not represent the amount paid by the class during periods when reimbursements, waivers or reductions occur.
I Annualized.
J Amount does not include the portfolio activity of any underlying mutual funds or exchange-traded funds (ETFs).
| Fidelity Advisor® Semiconductors Fund Class Z |
| |
| | Six months ended (Unaudited) January 31, 2023 | | Years ended July 31, 2022 | | 2021 | | 2020 | | 2019 A |
Selected Per-Share Data | | | | | | | | | | |
| Net asset value, beginning of period | $ | 45.93 | $ | 49.35 | $ | 31.65 | $ | 24.38 | $ | 26.00 |
| Income from Investment Operations | | | | | | | | | | |
Net investment income (loss) B,C | | .08 | | .06 | | .08 | | .26 | | .17 |
| Net realized and unrealized gain (loss) | | 1.51 | | (.92) | | 19.45 | | 7.33 | | 1.76 |
| Total from investment operations | | 1.59 | | (.86) | | 19.53 | | 7.59 | | 1.93 |
| Distributions from net investment income | | - | | - | | (.16) | | (.11) | | (.22) |
| Distributions from net realized gain | | (1.20) | | (2.56) | | (1.67) | | (.20) | | (3.33) |
| Total distributions | | (1.20) | | (2.56) | | (1.83) | | (.32) D | | (3.55) |
| Net asset value, end of period | $ | 46.32 | $ | 45.93 | $ | 49.35 | $ | 31.65 | $ | 24.38 |
Total Return E,F | | 3.64% | | (2.83)% | | 63.06% | | 31.22% | | 12.03% |
Ratios to Average Net Assets C,G,H | | | | | | | | | | |
| Expenses before reductions | | .64% I | | .62% | | .64% | | .68% | | .69% I |
| Expenses net of fee waivers, if any | | .63% I | | .62% | | .64% | | .68% | | .69% I |
| Expenses net of all reductions | | .63% I | | .62% | | .64% | | .66% | | .68% I |
| Net investment income (loss) | | .36% I | | .11% | | .18% | | .94% | | .91% I |
| Supplemental Data | | | | | | | | | | |
| Net assets, end of period (000 omitted) | $ | 43,732 | $ | 47,782 | $ | 26,856 | $ | 7,920 | $ | 2,629 |
Portfolio turnover rate J | | 42% I | | 32% | | 41% | | 136% | | 110% |
A For the period October 2, 2018 (commencement of sale of shares) through July 31, 2019.
B Calculated based on average shares outstanding during the period.
C Net investment income (loss) is affected by the timing of the declaration of dividends by any underlying mutual funds or exchange-traded funds (ETFs). Net investment income (loss) of any mutual funds or ETFs is not included in the Fund's net investment income (loss) ratio.
D Total distributions per share do not sum due to rounding.
E Total returns for periods of less than one year are not annualized.
F Total returns would have been lower if certain expenses had not been reduced during the applicable periods shown.
G Fees and expenses of any underlying mutual funds or exchange-traded funds (ETFs) are not included in the Fund's expense ratio. The Fund indirectly bears its proportionate share of these expenses. For additional expense information related to investments in Fidelity Central Funds, please refer to the "Investments in Fidelity Central Funds" note found in the Notes to Financial Statements section of the most recent Annual or Semi-Annual report.
H Expense ratios reflect operating expenses of the class. Expenses before reductions do not reflect amounts reimbursed, waived, or reduced through arrangements with the investment adviser, brokerage services, or other offset arrangements, if applicable, and do not represent the amount paid by the class during periods when reimbursements, waivers or reductions occur.
I Annualized.
J Amount does not include the portfolio activity of any underlying mutual funds or exchange-traded funds (ETFs).
Top Holdings (% of Fund's net assets) |
| |
| Apple, Inc. | 19.6 | |
| Microsoft Corp. | 14.9 | |
| NVIDIA Corp. | 7.6 | |
| MasterCard, Inc. Class A | 6.0 | |
| NXP Semiconductors NV | 4.5 | |
| Marvell Technology, Inc. | 4.1 | |
| onsemi | 3.9 | |
| Cisco Systems, Inc. | 3.7 | |
| GlobalFoundries, Inc. | 2.4 | |
| Okta, Inc. | 2.4 | |
| | 69.1 | |
| |
| Industries (% of Fund's net assets) |
| |
| Semiconductors & Semiconductor Equipment | 28.8 | |
| Software | 25.6 | |
| Technology Hardware, Storage & Peripherals | 19.6 | |
| IT Services | 13.5 | |
| Communications Equipment | 3.7 | |
| Internet & Direct Marketing Retail | 1.8 | |
| Interactive Media & Services | 1.3 | |
| Hotels, Restaurants & Leisure | 1.1 | |
| Entertainment | 1.0 | |
| Aerospace & Defense | 0.3 | |
| Chemicals | 0.2 | |
| Metals & Mining | 0.2 | |
| Diversified Financial Services | 0.1 | |
| Electronic Equipment & Components | 0.1 | |
| Food & Staples Retailing | 0.1 | |
| Life Sciences Tools & Services | 0.0 | |
| Pharmaceuticals | 0.0 | |
| Road & Rail | 0.0 | |
| |
Geographic Diversification (% of Fund's net assets) |
|
* Includes Short-Term investments and Net Other Assets (Liabilities). Percentages are based on country or territory of incorporation and are adjusted for the effect of derivatives, if applicable. |
| |
Fidelity Advisor® Technology Fund
Showing Percentage of Net Assets
| Common Stocks - 95.4% |
| | | Shares | Value ($) |
| Chemicals - 0.2% | | | |
| Commodity Chemicals - 0.2% | | | |
| LG Chemical Ltd. | | 16,570 | 9,340,749 |
| Communications Equipment - 3.7% | | | |
| Communications Equipment - 3.7% | | | |
| Cisco Systems, Inc. | | 2,775,000 | 135,059,250 |
| Diversified Financial Services - 0.1% | | | |
| Other Diversified Financial Services - 0.1% | | | |
| Ant International Co. Ltd. Class C (a)(b)(c) | | 2,163,455 | 3,418,259 |
| Entertainment - 1.0% | | | |
| Movies & Entertainment - 1.0% | | | |
| Netflix, Inc. (a) | | 104,466 | 36,966,339 |
| Hotels, Restaurants & Leisure - 1.1% | | | |
| Hotels, Resorts & Cruise Lines - 1.1% | | | |
| Airbnb, Inc. Class A (a) | | 368,800 | 40,977,368 |
| Interactive Media & Services - 0.9% | | | |
| Interactive Media & Services - 0.9% | | | |
| Snap, Inc. Class A (a) | | 2,769,067 | 32,010,415 |
| Internet & Direct Marketing Retail - 1.7% | | | |
| Internet & Direct Marketing Retail - 1.7% | | | |
| Lyft, Inc. (a) | | 713,642 | 11,596,683 |
| Uber Technologies, Inc. (a) | | 1,684,064 | 52,088,100 |
| | | | 63,684,783 |
| IT Services - 13.5% | | | |
| Data Processing & Outsourced Services - 8.2% | | | |
| Genpact Ltd. | | 212,991 | 10,070,214 |
| MasterCard, Inc. Class A | | 596,900 | 221,211,140 |
| Visa, Inc. Class A | | 305,916 | 70,424,922 |
| | | | 301,706,276 |
| Internet Services & Infrastructure - 4.6% | | | |
| MongoDB, Inc. Class A (a) | | 82,139 | 17,594,995 |
| Okta, Inc. (a) | | 1,190,300 | 87,617,983 |
| Shopify, Inc. Class A (a)(d) | | 367,000 | 18,082,090 |
| Snowflake, Inc. (a) | | 150,500 | 23,544,220 |
| Twilio, Inc. Class A (a) | | 388,300 | 23,235,872 |
| | | | 170,075,160 |
| IT Consulting & Other Services - 0.7% | | | |
| Capgemini SA | | 143,500 | 27,129,448 |
TOTAL IT SERVICES | | | 498,910,884 |
| Life Sciences Tools & Services - 0.0% | | | |
| Life Sciences Tools & Services - 0.0% | | | |
| Eden Biologics, Inc. (a)(c) | | 387,462 | 0 |
| Pharmaceuticals - 0.0% | | | |
| Pharmaceuticals - 0.0% | | | |
| Chime Biologics Wuhan Co. Ltd. (a)(c) | | 387,462 | 201,802 |
| Road & Rail - 0.0% | | | |
| Trucking - 0.0% | | | |
| TuSimple Holdings, Inc. (a)(d) | | 86,300 | 181,230 |
| Semiconductors & Semiconductor Equipment - 28.5% | | | |
| Semiconductor Equipment - 2.1% | | | |
| ASML Holding NV (Netherlands) | | 34,600 | 22,893,004 |
| Teradyne, Inc. | | 536,000 | 54,511,200 |
| | | | 77,404,204 |
| Semiconductors - 26.4% | | | |
| GlobalFoundries, Inc. (a)(d) | | 1,509,300 | 89,471,304 |
| Marvell Technology, Inc. | | 3,494,060 | 150,768,689 |
| Microchip Technology, Inc. | | 1,019,900 | 79,164,638 |
| NVIDIA Corp. | | 1,432,900 | 279,945,673 |
| NXP Semiconductors NV | | 896,045 | 165,150,054 |
| onsemi (a) | | 1,954,400 | 143,550,680 |
| Taiwan Semiconductor Manufacturing Co. Ltd. | | 3,564,000 | 62,838,770 |
| | | | 970,889,808 |
TOTAL SEMICONDUCTORS & SEMICONDUCTOR EQUIPMENT | | | 1,048,294,012 |
| Software - 25.1% | | | |
| Application Software - 7.1% | | | |
| HubSpot, Inc. (a) | | 75,203 | 26,096,193 |
| Intuit, Inc. | | 169,200 | 71,515,764 |
| Pine Labs Private Ltd. (a)(b)(c) | | 3,660 | 2,093,264 |
| Salesforce.com, Inc. (a) | | 484,739 | 81,421,610 |
| Splunk, Inc. (a) | | 824,380 | 78,950,873 |
| | | | 260,077,704 |
| Systems Software - 18.0% | | | |
| Microsoft Corp. | | 2,216,900 | 549,369,989 |
| Rapid7, Inc. (a) | | 275,900 | 11,000,133 |
| ServiceNow, Inc. (a) | | 175,900 | 80,057,367 |
| Tenable Holdings, Inc. (a) | | 565,900 | 22,766,157 |
| | | | 663,193,646 |
TOTAL SOFTWARE | | | 923,271,350 |
| Technology Hardware, Storage & Peripherals - 19.6% | | | |
| Technology Hardware, Storage & Peripherals - 19.6% | | | |
| Apple, Inc. | | 4,988,916 | 719,850,688 |
| IonQ, Inc. (a)(b) | | 119,300 | 529,692 |
| | | | 720,380,380 |
| TOTAL COMMON STOCKS (Cost $2,318,329,059) | | | 3,512,696,821 |
| | | | |
| Preferred Stocks - 2.0% |
| | | Shares | Value ($) |
| Convertible Preferred Stocks - 1.7% | | | |
| Aerospace & Defense - 0.3% | | | |
| Aerospace & Defense - 0.3% | | | |
| Relativity Space, Inc. Series E (a)(b)(c) | | 482,616 | 9,217,966 |
| | | | |
| Electronic Equipment & Components - 0.1% | | | |
| Electronic Equipment & Instruments - 0.1% | | | |
| Enevate Corp. Series E (a)(b)(c) | | 9,477,386 | 5,212,562 |
| | | | |
| Food & Staples Retailing - 0.1% | | | |
| Food Retail - 0.1% | | | |
| GoBrands, Inc. Series G (a)(b)(c) | | 14,100 | 2,219,904 |
| | | | |
| Hotels, Restaurants & Leisure - 0.0% | | | |
| Casinos & Gaming - 0.0% | | | |
| Discord, Inc. Series I (a)(b)(c) | | 500 | 191,495 |
| | | | |
| Interactive Media & Services - 0.4% | | | |
| Interactive Media & Services - 0.4% | | | |
| ByteDance Ltd. Series E1 (a)(b)(c) | | 26,036 | 5,153,045 |
| Reddit, Inc.: | | | |
| Series D(a)(b)(c) | | 94,300 | 3,540,965 |
| Series E(a)(b)(c) | | 5,300 | 199,015 |
| Series F(a)(b)(c) | | 154,614 | 5,805,756 |
| | | | 14,698,781 |
| Internet & Direct Marketing Retail - 0.1% | | | |
| Internet & Direct Marketing Retail - 0.1% | | | |
| Instacart, Inc. Series I (a)(b)(c) | | 29,110 | 1,283,751 |
| Meesho Series F (a)(b)(c) | | 46,600 | 3,692,118 |
| | | | 4,975,869 |
| Metals & Mining - 0.2% | | | |
| Precious Metals & Minerals - 0.2% | | | |
| Diamond Foundry, Inc. Series C (a)(b)(c) | | 151,757 | 5,382,821 |
| | | | |
| Semiconductors & Semiconductor Equipment - 0.3% | | | |
| Semiconductor Equipment - 0.2% | | | |
| Astera Labs, Inc.: | | | |
| Series A(b)(c) | | 144,502 | 1,455,135 |
| Series B(b)(c) | | 24,603 | 247,752 |
| Series C(a)(b)(c) | | 135,400 | 1,363,478 |
| Series D(b)(c) | | 590,802 | 5,949,376 |
| | | | 9,015,741 |
| Semiconductors - 0.1% | | | |
| SiMa.ai: | | | |
| Series B(a)(b)(c) | | 231,000 | 1,496,880 |
| Series B1(b)(c) | | 100,683 | 758,143 |
| Xsight Labs Ltd. Series D (a)(b)(c) | | 101,300 | 778,997 |
| | | | 3,034,020 |
TOTAL SEMICONDUCTORS & SEMICONDUCTOR EQUIPMENT | | | 12,049,761 |
| | | | |
| Software - 0.2% | | | |
| Application Software - 0.2% | | | |
| Convoy, Inc. Series D (a)(b)(c) | | 81,762 | 587,051 |
| Databricks, Inc.: | | | |
| Series G(a)(b)(c) | | 37,800 | 1,860,138 |
| Series H(a)(b)(c) | | 99,786 | 4,910,469 |
| | | | 7,357,658 |
| Systems Software - 0.0% | | | |
| Tenstorrent, Inc. Series C1 (a)(b)(c) | | 6,600 | 344,388 |
| | | | |
TOTAL SOFTWARE | | | 7,702,046 |
| | | | |
| TOTAL CONVERTIBLE PREFERRED STOCKS | | | 61,651,205 |
| Nonconvertible Preferred Stocks - 0.3% | | | |
| Software - 0.3% | | | |
| Application Software - 0.3% | | | |
| Pine Labs Private Ltd.: | | | |
| Series 1(a)(b)(c) | | 8,747 | 5,002,672 |
| Series A(a)(b)(c) | | 2,186 | 1,250,239 |
| Series B(a)(b)(c) | | 2,378 | 1,360,050 |
| Series B2(a)(b)(c) | | 1,923 | 1,099,821 |
| Series C(a)(b)(c) | | 3,578 | 2,046,366 |
| Series C1(a)(b)(c) | | 754 | 431,235 |
| Series D(a)(b)(c) | | 806 | 460,976 |
| | | | 11,651,359 |
| TOTAL PREFERRED STOCKS (Cost $80,409,778) | | | 73,302,564 |
| | | | |
| Preferred Securities - 0.0% |
| | | Principal Amount (e) | Value ($) |
| Software - 0.0% | | | |
| Systems Software - 0.0% | | | |
Tenstorrent, Inc. 0% (b)(c)(f) (Cost $370,000) | | 370,000 | 324,860 |
| | | | |
| Money Market Funds - 2.9% |
| | | Shares | Value ($) |
| Fidelity Cash Central Fund 4.38% (g) | | 74,122,507 | 74,137,332 |
| Fidelity Securities Lending Cash Central Fund 4.38% (g)(h) | | 31,433,916 | 31,437,059 |
| TOTAL MONEY MARKET FUNDS (Cost $105,574,391) | | | 105,574,391 |
| | | | |
| TOTAL INVESTMENT IN SECURITIES - 100.3% (Cost $2,504,683,228) | 3,691,898,636 |
NET OTHER ASSETS (LIABILITIES) - (0.3)% | (11,919,500) |
| NET ASSETS - 100.0% | 3,679,979,136 |
| | |
Legend
| (b) | Restricted securities (including private placements) - Investment in securities not registered under the Securities Act of 1933 (excluding 144A issues). At the end of the period, the value of restricted securities (excluding 144A issues) amounted to $79,668,639 or 2.2% of net assets. |
| (d) | Security or a portion of the security is on loan at period end. |
| (e) | Amount is stated in United States dollars unless otherwise noted. |
| (f) | Security is perpetual in nature with no stated maturity date. |
| (g) | Affiliated fund that is generally available only to investment companies and other accounts managed by Fidelity Investments. The rate quoted is the annualized seven-day yield of the fund at period end. A complete unaudited listing of the fund's holdings as of its most recent quarter end is available upon request. In addition, each Fidelity Central Fund's financial statements are available on the SEC's website or upon request. |
| (h) | Investment made with cash collateral received from securities on loan. |
| Additional information on each restricted holding is as follows: |
| Security | Acquisition Date | Acquisition Cost ($) |
| Ant International Co. Ltd. Class C | 5/16/18 | 8,245,741 |
| | | |
| Astera Labs, Inc. Series A | 5/17/22 | 1,469,513 |
| | | |
| Astera Labs, Inc. Series B | 5/17/22 | 250,200 |
| | | |
| Astera Labs, Inc. Series C | 8/24/21 | 455,188 |
| | | |
| Astera Labs, Inc. Series D | 5/17/22 - 5/27/22 | 6,008,161 |
| | | |
| ByteDance Ltd. Series E1 | 11/18/20 | 2,852,873 |
| | | |
| Convoy, Inc. Series D | 10/30/19 | 1,107,057 |
| | | |
| Databricks, Inc. Series G | 2/01/21 | 2,234,836 |
| | | |
| Databricks, Inc. Series H | 8/31/21 | 7,332,688 |
| | | |
| Diamond Foundry, Inc. Series C | 3/15/21 | 3,642,168 |
| | | |
| Discord, Inc. Series I | 9/15/21 | 275,312 |
| | | |
| Enevate Corp. Series E | 1/29/21 | 10,507,436 |
| | | |
| GoBrands, Inc. Series G | 3/02/21 | 3,521,014 |
| | | |
| Instacart, Inc. Series I | 2/26/21 | 3,638,750 |
| | | |
| IonQ, Inc. | 3/07/21 | 1,193,000 |
| | | |
| Meesho Series F | 9/21/21 | 3,572,929 |
| | | |
| Pine Labs Private Ltd. | 6/30/21 | 1,364,668 |
| | | |
| Pine Labs Private Ltd. Series 1 | 6/30/21 | 3,261,406 |
| | | |
| Pine Labs Private Ltd. Series A | 6/30/21 | 815,072 |
| | | |
| Pine Labs Private Ltd. Series B | 6/30/21 | 886,661 |
| | | |
| Pine Labs Private Ltd. Series B2 | 6/30/21 | 717,010 |
| | | |
| Pine Labs Private Ltd. Series C | 6/30/21 | 1,334,093 |
| | | |
| Pine Labs Private Ltd. Series C1 | 6/30/21 | 281,136 |
| | | |
| Pine Labs Private Ltd. Series D | 6/30/21 | 300,525 |
| | | |
| Reddit, Inc. Series D | 2/04/19 | 2,045,018 |
| | | |
| Reddit, Inc. Series E | 5/18/21 | 225,113 |
| | | |
| Reddit, Inc. Series F | 8/11/21 | 9,554,279 |
| | | |
| Relativity Space, Inc. Series E | 5/27/21 | 11,020,585 |
| | | |
| SiMa.ai Series B | 5/10/21 | 1,184,429 |
| | | |
| SiMa.ai Series B1 | 4/25/22 - 10/17/22 | 713,934 |
| | | |
| Tenstorrent, Inc. Series C1 | 4/23/21 | 392,398 |
| | | |
| Tenstorrent, Inc. 0% | 4/23/21 | 370,000 |
| | | |
| Xsight Labs Ltd. Series D | 2/16/21 | 809,995 |
| | | |
Affiliated Central Funds
Fiscal year to date information regarding the Fund's investments in Fidelity Central Funds, including the ownership percentage, is presented below.
| Affiliate | Value, beginning of period ($) | Purchases ($) | Sales Proceeds ($) | Dividend Income ($) | Realized Gain (loss) ($) | Change in Unrealized appreciation (depreciation) ($) | Value, end of period ($) | % ownership, end of period |
| Fidelity Cash Central Fund 4.38% | 66,682,813 | 411,474,180 | 404,019,661 | 1,323,679 | - | - | 74,137,332 | 0.2% |
| Fidelity Securities Lending Cash Central Fund 4.38% | 3,262,284 | 200,298,699 | 172,123,924 | 284,015 | - | - | 31,437,059 | 0.1% |
| Total | 69,945,097 | 611,772,879 | 576,143,585 | 1,607,694 | - | - | 105,574,391 | |
| | | | | | | | | |
Amounts in the dividend income column in the above table include any capital gain distributions from underlying funds, which are presented in the corresponding line item in the Statement of Operations, if applicable.
Amount for Fidelity Securities Lending Cash Central Fund represents the income earned on investing cash collateral, less rebates paid to borrowers and any lending agent fees associated with the loan, plus any premium payments received for lending certain types of securities.
Amounts included in the purchases and sales proceeds columns may include in-kind transactions, if applicable.
Investment Valuation
The following is a summary of the inputs used, as of January 31, 2023, involving the Fund's assets and liabilities carried at fair value. The inputs or methodology used for valuing securities may not be an indication of the risk associated with investing in those securities. For more information on valuation inputs, and their aggregation into the levels used below, please refer to the Investment Valuation section in the accompanying Notes to Financial Statements.
| Valuation Inputs at Reporting Date: |
| Description | Total ($) | Level 1 ($) | Level 2 ($) | Level 3 ($) |
Investments in Securities: | | | | |
|
| Common Stocks | 3,512,696,821 | 3,411,910,973 | 95,072,523 | 5,713,325 |
|
| Preferred Stocks | 73,302,564 | - | - | 73,302,564 |
|
| Preferred Securities | 324,860 | - | - | 324,860 |
|
| Money Market Funds | 105,574,391 | 105,574,391 | - | - |
| Total Investments in Securities: | 3,691,898,636 | 3,517,485,364 | 95,072,523 | 79,340,749 |
The following is a reconciliation of Investments in Securities for which Level 3 inputs were used in determining value:
| |
| Investments in Securities: | |
| Preferred Stocks | | | |
| Beginning Balance | $ | 78,187,657 | |
| Net Realized Gain (Loss) on Investment Securities | | - | |
| Net Unrealized Gain (Loss) on Investment Securities | | (5,489,309) | |
| Cost of Purchases | | 604,216 | |
| Proceeds of Sales | | - | |
| Amortization/Accretion | | - | |
| Transfers into Level 3 | | - | |
| Transfers out of Level 3 | | - | |
| Ending Balance | $ | 73,302,564 | |
| The change in unrealized gain (loss) for the period attributable to Level 3 securities held at January 31, 2023 | $ | (5,489,309) | |
| Other Investments in Securities | | | |
| Beginning Balance | $ | 10,743,924 | |
| Net Realized Gain (Loss) on Investment Securities | | - | |
| Net Unrealized Gain (Loss) on Investment Securities | | (670,683) | |
| Cost of Purchases | | - | |
| Proceeds of Sales | | (4,035,056) | |
| Amortization/Accretion | | - | |
| Transfers into Level 3 | | - | |
| Transfers out of Level 3 | | - | |
| Ending Balance | $ | 6,038,185 | |
| The change in unrealized gain (loss) for the period attributable to Level 3 securities held at January 31, 2023 | $ | (670,683) | |
| The information used in the above reconciliation represents fiscal year to date activity for any Investments in Securities identified as using Level 3 inputs at either the beginning or the end of the current fiscal period. Cost of purchases and proceeds of sales may include securities received and/or delivered through in-kind transactions. Transfers into Level 3 were attributable to a lack of observable market data resulting from decreases in market activity, decreases in liquidity, security restructurings or corporate actions. Transfers out of Level 3 were attributable to observable market data becoming available for those securities. Transfers in or out of Level 3 represent the beginning value of any Security or Instrument where a change in the pricing level occurred from the beginning to the end of the period. The cost of purchases and the proceeds of sales may include securities received or delivered through corporate actions or exchanges. Realized and unrealized gains (losses) disclosed in the reconciliation are included in Net Gain (Loss) on the Fund's Statement of Operations. | |
Fidelity Advisor® Technology Fund
| Statement of Assets and Liabilities |
| | | | January 31, 2023 (Unaudited) |
| | | | | |
| Assets | | | | |
| Investment in securities, at value (including securities loaned of $31,758,097) - See accompanying schedule: | | | | |
Unaffiliated issuers (cost $2,399,108,837) | $ | 3,586,324,245 | | |
Fidelity Central Funds (cost $105,574,391) | | 105,574,391 | | |
| | | | | |
| | | | | |
| Total Investment in Securities (cost $2,504,683,228) | | | $ | 3,691,898,636 |
| Receivable for investments sold | | | | 22,852,441 |
| Receivable for fund shares sold | | | | 3,477,178 |
| Dividends receivable | | | | 487,981 |
| Distributions receivable from Fidelity Central Funds | | | | 368,471 |
| Prepaid expenses | | | | 8,614 |
| Other receivables | | | | 123,337 |
Total assets | | | | 3,719,216,658 |
| Liabilities | | | | |
| Payable for investments purchased | $ | 1,702,560 | | |
| Payable for fund shares redeemed | | 3,281,071 | | |
| Accrued management fee | | 1,516,367 | | |
| Distribution and service plan fees payable | | 641,458 | | |
| Other affiliated payables | | 515,690 | | |
| Other payables and accrued expenses | | 159,151 | | |
| Collateral on securities loaned | | 31,421,225 | | |
| Total Liabilities | | | | 39,237,522 |
| Net Assets | | | $ | 3,679,979,136 |
| Net Assets consist of: | | | | |
| Paid in capital | | | $ | 2,500,416,501 |
| Total accumulated earnings (loss) | | | | 1,179,562,635 |
| Net Assets | | | $ | 3,679,979,136 |
| | | | | |
| Net Asset Value and Maximum Offering Price | | | | |
| Class A : | | | | |
Net Asset Value and redemption price per share ($1,376,077,374 ÷ 19,694,199 shares) (a) | | | $ | 69.87 |
| Maximum offering price per share (100/94.25 of $69.87) | | | $ | 74.13 |
| Class M : | | | | |
Net Asset Value and redemption price per share ($448,858,120 ÷ 7,024,836 shares) (a) | | | $ | 63.90 |
| Maximum offering price per share (100/96.50 of $63.90) | | | $ | 66.22 |
| Class C : | | | | |
Net Asset Value and offering price per share ($249,611,448 ÷ 4,767,160 shares) (a) | | | $ | 52.36 |
| Class I : | | | | |
Net Asset Value , offering price and redemption price per share ($1,089,458,227 ÷ 13,881,274 shares) | | | $ | 78.48 |
| Class Z : | | | | |
Net Asset Value , offering price and redemption price per share ($515,973,967 ÷ 6,575,771 shares) | | | $ | 78.47 |
(a)Redemption price per share is equal to net asset value less any applicable contingent deferred sales charge. |
| Statement of Operations |
| | | | Six months ended January 31, 2023 (Unaudited) |
| Investment Income | | | | |
| Dividends | | | $ | 11,771,280 |
| Income from Fidelity Central Funds (including $284,015 from security lending) | | | | 1,607,694 |
| Total Income | | | | 13,378,974 |
| Expenses | | | | |
| Management fee | $ | 9,230,390 | | |
| Transfer agent fees | | 2,717,143 | | |
| Distribution and service plan fees | | 3,991,111 | | |
| Accounting fees | | 441,732 | | |
| Custodian fees and expenses | | 19,577 | | |
| Independent trustees' fees and expenses | | 6,164 | | |
| Registration fees | | 112,857 | | |
| Audit | | 40,130 | | |
| Legal | | 5,895 | | |
| Miscellaneous | | 12,805 | | |
| Total expenses before reductions | | 16,577,804 | | |
| Expense reductions | | (66,353) | | |
| Total expenses after reductions | | | | 16,511,451 |
| Net Investment income (loss) | | | | (3,132,477) |
| Realized and Unrealized Gain (Loss) | | | | |
| Net realized gain (loss) on: | | | | |
| Investment Securities: | | | | |
| Unaffiliated issuers (net of foreign taxes of $880,311) | | 45,905,749 | | |
| Foreign currency transactions | | (47,385) | | |
| Total net realized gain (loss) | | | | 45,858,364 |
| Change in net unrealized appreciation (depreciation) on: | | | | |
| Investment Securities: | | | | |
| Unaffiliated issuers (net of decrease in deferred foreign taxes of $875,019) | | (197,804,269) | | |
| Assets and liabilities in foreign currencies | | 6,506 | | |
| Total change in net unrealized appreciation (depreciation) | | | | (197,797,763) |
| Net gain (loss) | | | | (151,939,399) |
| Net increase (decrease) in net assets resulting from operations | | | $ | (155,071,876) |
| Statement of Changes in Net Assets |
| |
| | Six months ended January 31, 2023 (Unaudited) | | Year ended July 31, 2022 |
| Increase (Decrease) in Net Assets | | | | |
| Operations | | | | |
| Net investment income (loss) | $ | (3,132,477) | $ | (17,513,519) |
| Net realized gain (loss) | | 45,858,364 | | 197,665,080 |
| Change in net unrealized appreciation (depreciation) | | (197,797,763) | | (964,396,406) |
| Net increase (decrease) in net assets resulting from operations | | (155,071,876) | | (784,244,845) |
| Distributions to shareholders | | (117,623,120) | | (600,971,502) |
| Share transactions - net increase (decrease) | | 120,885,416 | | 337,954,182 |
| Total increase (decrease) in net assets | | (151,809,580) | | (1,047,262,165) |
| | | | | |
| Net Assets | | | | |
| Beginning of period | | 3,831,788,716 | | 4,879,050,881 |
| End of period | $ | 3,679,979,136 | $ | 3,831,788,716 |
| | | | | |
| | | | | |
Financial Highlights
| Fidelity Advisor® Technology Fund Class A |
| |
| | Six months ended (Unaudited) January 31, 2023 | | Years ended July 31, 2022 | | 2021 | | 2020 | | 2019 | | 2018 |
Selected Per-Share Data | | | | | | | | | | | | |
| Net asset value, beginning of period | $ | 75.41 | $ | 102.43 | $ | 76.36 | $ | 52.61 | $ | 60.37 | $ | 52.11 |
| Income from Investment Operations | | | | | | | | | | | | |
Net investment income (loss) A,B | | (.08) | | (.37) | | (.39) | | (.12) | | .02 | | (.13) |
| Net realized and unrealized gain (loss) | | (3.15) | | (13.94) | | 33.48 | | 25.35 | | 1.84 | | 12.80 |
| Total from investment operations | | (3.23) | | (14.31) | | 33.09 | | 25.23 | | 1.86 | | 12.67 |
| Distributions from net realized gain | | (2.31) | | (12.71) | | (7.02) | | (1.48) | | (9.62) | | (4.41) |
| Total distributions | | (2.31) | | (12.71) | | (7.02) | | (1.48) | | (9.62) | | (4.41) |
| Net asset value, end of period | $ | 69.87 | $ | 75.41 | $ | 102.43 | $ | 76.36 | $ | 52.61 | $ | 60.37 |
Total Return C,D,E | | (4.19)% | | (16.78)% | | 44.80% | | 48.83% | | 7.26% | | 25.43% |
Ratios to Average Net Assets B,F,G | | | | | | | | | | | | |
| Expenses before reductions | | .99% H | | .97% | | .98% | | 1.01% | | 1.03% | | 1.05% |
| Expenses net of fee waivers, if any | | .98% H | | .97% | | .98% | | 1.01% | | 1.03% | | 1.05% |
| Expenses net of all reductions | | .98% H | | .97% | | .98% | | 1.01% | | 1.02% | | 1.04% |
| Net investment income (loss) | | (.22)% H | | (.41)% | | (.43)% | | (.20)% | | .04% | | (.23)% |
| Supplemental Data | | | | | | | | | | | | |
| Net assets, end of period (000 omitted) | $ | 1,376,077 | $ | 1,467,792 | $ | 1,848,643 | $ | 1,339,059 | $ | 884,749 | $ | 825,118 |
Portfolio turnover rate I | | 31% H | | 20% | | 44% | | 40% J | | 88% | | 84% |
A Calculated based on average shares outstanding during the period.
B Net investment income (loss) is affected by the timing of the declaration of dividends by any underlying mutual funds or exchange-traded funds (ETFs). Net investment income (loss) of any mutual funds or ETFs is not included in the Fund's net investment income (loss) ratio.
C Total returns for periods of less than one year are not annualized.
D Total returns would have been lower if certain expenses had not been reduced during the applicable periods shown.
E Total returns do not include the effect of the sales charges.
F Fees and expenses of any underlying mutual funds or exchange-traded funds (ETFs) are not included in the Fund's expense ratio. The Fund indirectly bears its proportionate share of these expenses. For additional expense information related to investments in Fidelity Central Funds, please refer to the "Investments in Fidelity Central Funds" note found in the Notes to Financial Statements section of the most recent Annual or Semi-Annual report.
G Expense ratios reflect operating expenses of the class. Expenses before reductions do not reflect amounts reimbursed, waived, or reduced through arrangements with the investment adviser, brokerage services, or other offset arrangements, if applicable, and do not represent the amount paid by the class during periods when reimbursements, waivers or reductions occur.
H Annualized.
I Amount does not include the portfolio activity of any underlying mutual funds or exchange-traded funds (ETFs).
J Portfolio turnover rate excludes securities received or delivered in-kind.
| Fidelity Advisor® Technology Fund Class M |
| |
| | Six months ended (Unaudited) January 31, 2023 | | Years ended July 31, 2022 | | 2021 | | 2020 | | 2019 | | 2018 |
Selected Per-Share Data | | | | | | | | | | | | |
| Net asset value, beginning of period | $ | 69.25 | $ | 95.15 | $ | 71.37 | $ | 49.28 | $ | 57.23 | $ | 49.63 |
| Income from Investment Operations | | | | | | | | | | | | |
Net investment income (loss) A,B | | (.14) | | (.55) | | (.57) | | (.25) | | (.10) | | (.27) |
| Net realized and unrealized gain (loss) | | (2.90) | | (12.76) | | 31.22 | | 23.71 | | 1.63 | | 12.16 |
| Total from investment operations | | (3.04) | | (13.31) | | 30.65 | | 23.46 | | 1.53 | | 11.89 |
| Distributions from net realized gain | | (2.31) | | (12.59) | | (6.87) | | (1.37) | | (9.48) | | (4.29) |
| Total distributions | | (2.31) | | (12.59) | | (6.87) | | (1.37) | | (9.48) | | (4.29) |
| Net asset value, end of period | $ | 63.90 | $ | 69.25 | $ | 95.15 | $ | 71.37 | $ | 49.28 | $ | 57.23 |
Total Return C,D,E | | (4.29)% | | (16.99)% | | 44.47% | | 48.44% | | 7.00% | | 25.09% |
Ratios to Average Net Assets B,F,G | | | | | | | | | | | | |
| Expenses before reductions | | 1.23% H | | 1.21% | | 1.23% | | 1.26% | | 1.28% | | 1.31% |
| Expenses net of fee waivers, if any | | 1.23% H | | 1.21% | | 1.23% | | 1.26% | | 1.28% | | 1.31% |
| Expenses net of all reductions | | 1.23% H | | 1.21% | | 1.22% | | 1.26% | | 1.28% | | 1.30% |
| Net investment income (loss) | | (.47)% H | | (.65)% | | (.68)% | | (.45)% | | (.22)% | | (.49)% |
| Supplemental Data | | | | | | | | | | | | |
| Net assets, end of period (000 omitted) | $ | 448,858 | $ | 484,293 | $ | 624,534 | $ | 464,093 | $ | 321,915 | $ | 328,709 |
Portfolio turnover rate I | | 31% H | | 20% | | 44% | | 40% J | | 88% | | 84% |
A Calculated based on average shares outstanding during the period.
B Net investment income (loss) is affected by the timing of the declaration of dividends by any underlying mutual funds or exchange-traded funds (ETFs). Net investment income (loss) of any mutual funds or ETFs is not included in the Fund's net investment income (loss) ratio.
C Total returns for periods of less than one year are not annualized.
D Total returns would have been lower if certain expenses had not been reduced during the applicable periods shown.
E Total returns do not include the effect of the sales charges.
F Fees and expenses of any underlying mutual funds or exchange-traded funds (ETFs) are not included in the Fund's expense ratio. The Fund indirectly bears its proportionate share of these expenses. For additional expense information related to investments in Fidelity Central Funds, please refer to the "Investments in Fidelity Central Funds" note found in the Notes to Financial Statements section of the most recent Annual or Semi-Annual report.
G Expense ratios reflect operating expenses of the class. Expenses before reductions do not reflect amounts reimbursed, waived, or reduced through arrangements with the investment adviser, brokerage services, or other offset arrangements, if applicable, and do not represent the amount paid by the class during periods when reimbursements, waivers or reductions occur.
H Annualized.
I Amount does not include the portfolio activity of any underlying mutual funds or exchange-traded funds (ETFs).
J Portfolio turnover rate excludes securities received or delivered in-kind.
| Fidelity Advisor® Technology Fund Class C |
| |
| | Six months ended (Unaudited) January 31, 2023 | | Years ended July 31, 2022 | | 2021 | | 2020 | | 2019 | | 2018 |
Selected Per-Share Data | | | | | | | | | | | | |
| Net asset value, beginning of period | $ | 57.35 | $ | 80.98 | $ | 61.67 | $ | 42.81 | $ | 51.18 | $ | 44.86 |
| Income from Investment Operations | | | | | | | | | | | | |
Net investment income (loss) A,B | | (.25) | | (.83) | | (.85) | | (.46) | | (.30) | | (.49) |
| Net realized and unrealized gain (loss) | | (2.43) | | (10.43) | | 26.79 | | 20.52 | | 1.22 | | 10.95 |
| Total from investment operations | | (2.68) | | (11.26) | | 25.94 | | 20.06 | | .92 | | 10.46 |
| Distributions from net realized gain | | (2.31) | | (12.37) | | (6.63) | | (1.20) | | (9.29) | | (4.14) |
| Total distributions | | (2.31) | | (12.37) | | (6.63) | | (1.20) | | (9.29) | | (4.14) |
| Net asset value, end of period | $ | 52.36 | $ | 57.35 | $ | 80.98 | $ | 61.67 | $ | 42.81 | $ | 51.18 |
Total Return C,D,E | | (4.55)% | | (17.41)% | | 43.73% | | 47.69% | | 6.44% | | 24.48% |
Ratios to Average Net Assets B,F,G | | | | | | | | | | | | |
| Expenses before reductions | | 1.75% H | | 1.73% | | 1.75% | | 1.77% | | 1.79% | | 1.81% |
| Expenses net of fee waivers, if any | | 1.75% H | | 1.73% | | 1.74% | | 1.77% | | 1.79% | | 1.81% |
| Expenses net of all reductions | | 1.75% H | | 1.73% | | 1.74% | | 1.77% | | 1.78% | | 1.80% |
| Net investment income (loss) | | (.98)% H | | (1.17)% | | (1.20)% | | (.96)% | | (.72)% | | (.99)% |
| Supplemental Data | | | | | | | | | | | | |
| Net assets, end of period (000 omitted) | $ | 249,611 | $ | 288,008 | $ | 410,661 | $ | 343,585 | $ | 240,358 | $ | 321,616 |
Portfolio turnover rate I | | 31% H | | 20% | | 44% | | 40% J | | 88% | | 84% |
A Calculated based on average shares outstanding during the period.
B Net investment income (loss) is affected by the timing of the declaration of dividends by any underlying mutual funds or exchange-traded funds (ETFs). Net investment income (loss) of any mutual funds or ETFs is not included in the Fund's net investment income (loss) ratio.
C Total returns for periods of less than one year are not annualized.
D Total returns would have been lower if certain expenses had not been reduced during the applicable periods shown.
E Total returns do not include the effect of the contingent deferred sales charge.
F Fees and expenses of any underlying mutual funds or exchange-traded funds (ETFs) are not included in the Fund's expense ratio. The Fund indirectly bears its proportionate share of these expenses. For additional expense information related to investments in Fidelity Central Funds, please refer to the "Investments in Fidelity Central Funds" note found in the Notes to Financial Statements section of the most recent Annual or Semi-Annual report.
G Expense ratios reflect operating expenses of the class. Expenses before reductions do not reflect amounts reimbursed, waived, or reduced through arrangements with the investment adviser, brokerage services, or other offset arrangements, if applicable, and do not represent the amount paid by the class during periods when reimbursements, waivers or reductions occur.
H Annualized.
I Amount does not include the portfolio activity of any underlying mutual funds or exchange-traded funds (ETFs).
J Portfolio turnover rate excludes securities received or delivered in-kind.
| Fidelity Advisor® Technology Fund Class I |
| |
| | Six months ended (Unaudited) January 31, 2023 | | Years ended July 31, 2022 | | 2021 | | 2020 | | 2019 | | 2018 |
Selected Per-Share Data | | | | | | | | | | | | |
| Net asset value, beginning of period | $ | 84.29 | $ | 112.95 | $ | 83.56 | $ | 57.41 | $ | 64.86 | $ | 55.69 |
| Income from Investment Operations | | | | | | | | | | | | |
Net investment income (loss) A,B | | .02 | | (.15) | | (.17) | | .04 | | .17 | | .02 |
| Net realized and unrealized gain (loss) | | (3.52) | | (15.67) | | 36.76 | | 27.72 | | 2.15 | | 13.71 |
| Total from investment operations | | (3.50) | | (15.82) | | 36.59 | | 27.76 | | 2.32 | | 13.73 |
| Distributions from net investment income | | - | | - | | - | | - | | (.01) | | - |
| Distributions from net realized gain | | (2.31) | | (12.84) | | (7.20) | | (1.61) | | (9.76) | | (4.56) |
| Total distributions | | (2.31) | | (12.84) | | (7.20) | | (1.61) | | (9.77) | | (4.56) |
| Net asset value, end of period | $ | 78.48 | $ | 84.29 | $ | 112.95 | $ | 83.56 | $ | 57.41 | $ | 64.86 |
Total Return C,D | | (4.06)% | | (16.56)% | | 45.18% | | 49.22% | | 7.56% | | 25.75% |
Ratios to Average Net Assets B,E,F | | | | | | | | | | | | |
| Expenses before reductions | | .73% G | | .71% | | .72% | | .74% | | .76% | | .78% |
| Expenses net of fee waivers, if any | | .72% G | | .71% | | .72% | | .74% | | .76% | | .78% |
| Expenses net of all reductions | | .72% G | | .71% | | .72% | | .74% | | .76% | | .77% |
| Net investment income (loss) | | .04% G | | (.15)% | | (.18)% | | .07% | | .30% | | .03% |
| Supplemental Data | | | | | | | | | | | | |
| Net assets, end of period (000 omitted) | $ | 1,089,458 | $ | 1,129,418 | $ | 1,470,830 | $ | 1,035,091 | $ | 674,914 | $ | 734,661 |
Portfolio turnover rate H | | 31% G | | 20% | | 44% | | 40% I | | 88% | | 84% |
A Calculated based on average shares outstanding during the period.
B Net investment income (loss) is affected by the timing of the declaration of dividends by any underlying mutual funds or exchange-traded funds (ETFs). Net investment income (loss) of any mutual funds or ETFs is not included in the Fund's net investment income (loss) ratio.
C Total returns for periods of less than one year are not annualized.
D Total returns would have been lower if certain expenses had not been reduced during the applicable periods shown.
E Fees and expenses of any underlying mutual funds or exchange-traded funds (ETFs) are not included in the Fund's expense ratio. The Fund indirectly bears its proportionate share of these expenses. For additional expense information related to investments in Fidelity Central Funds, please refer to the "Investments in Fidelity Central Funds" note found in the Notes to Financial Statements section of the most recent Annual or Semi-Annual report.
F Expense ratios reflect operating expenses of the class. Expenses before reductions do not reflect amounts reimbursed, waived, or reduced through arrangements with the investment adviser, brokerage services, or other offset arrangements, if applicable, and do not represent the amount paid by the class during periods when reimbursements, waivers or reductions occur.
G Annualized.
H Amount does not include the portfolio activity of any underlying mutual funds or exchange-traded funds (ETFs).
I Portfolio turnover rate excludes securities received or delivered in-kind.
| Fidelity Advisor® Technology Fund Class Z |
| |
| | Six months ended (Unaudited) January 31, 2023 | | Years ended July 31, 2022 | | 2021 | | 2020 | | 2019 A |
Selected Per-Share Data | | | | | | | | | | |
| Net asset value, beginning of period | $ | 84.22 | $ | 112.81 | $ | 83.44 | $ | 57.34 | $ | 67.88 |
| Income from Investment Operations | | | | | | | | | | |
Net investment income (loss) B,C | | .06 | | (.04) | | (.06) | | .12 | | .23 |
| Net realized and unrealized gain (loss) | | (3.50) | | (15.63) | | 36.72 | | 27.68 | | (.90) |
| Total from investment operations | | (3.44) | | (15.67) | | 36.66 | | 27.80 | | (.67) |
| Distributions from net investment income | | - | | - | | - | | - | | (.11) |
| Distributions from net realized gain | | (2.31) | | (12.92) | | (7.29) | | (1.70) | | (9.76) |
| Total distributions | | (2.31) | | (12.92) | | (7.29) | | (1.70) | | (9.87) |
| Net asset value, end of period | $ | 78.47 | $ | 84.22 | $ | 112.81 | $ | 83.44 | $ | 57.34 |
Total Return D,E | | (4.00)% | | (16.46)% | | 45.37% | | 49.39% | | 2.88% |
Ratios to Average Net Assets C,F,G | | | | | | | | | | |
| Expenses before reductions | | .60% H | | .59% | | .60% | | .62% | | .63% H |
| Expenses net of fee waivers, if any | | .60% H | | .59% | | .60% | | .62% | | .63% H |
| Expenses net of all reductions | | .60% H | | .59% | | .60% | | .62% | | .62% H |
| Net investment income (loss) | | .16% H | | (.04)% | | (.06)% | | .19% | | .53% H |
| Supplemental Data | | | | | | | | | | |
| Net assets, end of period (000 omitted) | $ | 515,974 | $ | 462,278 | $ | 524,383 | $ | 298,255 | $ | 31,619 |
Portfolio turnover rate I | | 31% H | | 20% | | 44% | | 40% J | | 88% |
A For the period October 2, 2018 (commencement of sale of shares) through July 31, 2019.
B Calculated based on average shares outstanding during the period.
C Net investment income (loss) is affected by the timing of the declaration of dividends by any underlying mutual funds or exchange-traded funds (ETFs). Net investment income (loss) of any mutual funds or ETFs is not included in the Fund's net investment income (loss) ratio.
D Total returns for periods of less than one year are not annualized.
E Total returns would have been lower if certain expenses had not been reduced during the applicable periods shown.
F Fees and expenses of any underlying mutual funds or exchange-traded funds (ETFs) are not included in the Fund's expense ratio. The Fund indirectly bears its proportionate share of these expenses. For additional expense information related to investments in Fidelity Central Funds, please refer to the "Investments in Fidelity Central Funds" note found in the Notes to Financial Statements section of the most recent Annual or Semi-Annual report.
G Expense ratios reflect operating expenses of the class. Expenses before reductions do not reflect amounts reimbursed, waived, or reduced through arrangements with the investment adviser, brokerage services, or other offset arrangements, if applicable, and do not represent the amount paid by the class during periods when reimbursements, waivers or reductions occur.
H Annualized.
I Amount does not include the portfolio activity of any underlying mutual funds or exchange-traded funds (ETFs).
J Portfolio turnover rate excludes securities received or delivered in-kind.
Top Holdings (% of Fund's net assets) |
| |
| NextEra Energy, Inc. | 16.0 | |
| Southern Co. | 11.6 | |
| Sempra Energy | 7.7 | |
| Constellation Energy Corp. | 7.1 | |
| PG&E Corp. | 5.1 | |
| Dominion Energy, Inc. | 5.0 | |
| Edison International | 4.9 | |
| Exelon Corp. | 4.8 | |
| FirstEnergy Corp. | 4.7 | |
| PPL Corp. | 4.2 | |
| | 71.1 | |
| |
| Industries (% of Fund's net assets) |
| |
| Electric Utilities | 73.3 | |
| Multi-Utilities | 20.4 | |
| Independent Power and Renewable Electricity Producers | 4.3 | |
| |
Fidelity Advisor® Utilities Fund
Showing Percentage of Net Assets
| Common Stocks - 98.0% |
| | | Shares | Value ($) |
| Electric Utilities - 73.3% | | | |
| Electric Utilities - 73.3% | | | |
| Constellation Energy Corp. | | 746,877 | 63,753,421 |
| Duke Energy Corp. | | 287,785 | 29,483,573 |
| Edison International | | 644,090 | 44,377,801 |
| Entergy Corp. | | 300,294 | 32,515,834 |
| Eversource Energy | | 321,167 | 26,441,679 |
| Exelon Corp. | | 1,022,872 | 43,154,970 |
| FirstEnergy Corp. | | 1,022,778 | 41,882,759 |
| NextEra Energy, Inc. | | 1,930,548 | 144,076,797 |
| OGE Energy Corp. | | 206,447 | 8,117,496 |
| PG&E Corp. (a) | | 2,854,189 | 45,381,605 |
| Pinnacle West Capital Corp. | | 86,072 | 6,416,668 |
| PPL Corp. | | 1,264,800 | 37,438,080 |
| Southern Co. | | 1,533,272 | 103,771,849 |
| Xcel Energy, Inc. | | 456,200 | 31,372,874 |
| | | | 658,185,406 |
| Independent Power and Renewable Electricity Producers - 4.3% | | | |
| Independent Power Producers & Energy Traders - 2.3% | | | |
| Energy Harbor Corp. (a)(b) | | 115,400 | 8,828,100 |
| Vistra Corp. | | 512,952 | 11,828,673 |
| | | | 20,656,773 |
| Renewable Electricity - 2.0% | | | |
| Clearway Energy, Inc. Class A | | 93,226 | 2,987,893 |
| NextEra Energy Partners LP | | 198,190 | 14,527,327 |
| | | | 17,515,220 |
TOTAL INDEPENDENT POWER AND RENEWABLE ELECTRICITY PRODUCERS | | | 38,171,993 |
| Multi-Utilities - 20.4% | | | |
| Multi-Utilities - 20.4% | | | |
| Consolidated Edison, Inc. | | 58,609 | 5,586,024 |
| Dominion Energy, Inc. | | 701,076 | 44,616,477 |
| NiSource, Inc. | | 1,156,052 | 32,080,443 |
| Public Service Enterprise Group, Inc. | | 503,005 | 31,151,100 |
| Sempra Energy | | 435,000 | 69,743,550 |
| | | | 183,177,594 |
| TOTAL COMMON STOCKS (Cost $739,894,920) | | | 879,534,993 |
| | | | |
| Money Market Funds - 2.1% |
| | | Shares | Value ($) |
| Fidelity Cash Central Fund 4.38% (c) | | 16,021,767 | 16,024,971 |
| Fidelity Securities Lending Cash Central Fund 4.38% (c)(d) | | 2,702,730 | 2,703,000 |
| TOTAL MONEY MARKET FUNDS (Cost $18,727,971) | | | 18,727,971 |
| | | | |
| TOTAL INVESTMENT IN SECURITIES - 100.1% (Cost $758,622,891) | 898,262,964 |
NET OTHER ASSETS (LIABILITIES) - (0.1)% | (560,731) |
| NET ASSETS - 100.0% | 897,702,233 |
| | |
Legend
| (b) | Security or a portion of the security is on loan at period end. |
| (c) | Affiliated fund that is generally available only to investment companies and other accounts managed by Fidelity Investments. The rate quoted is the annualized seven-day yield of the fund at period end. A complete unaudited listing of the fund's holdings as of its most recent quarter end is available upon request. In addition, each Fidelity Central Fund's financial statements are available on the SEC's website or upon request. |
| (d) | Investment made with cash collateral received from securities on loan. |
Affiliated Central Funds
Fiscal year to date information regarding the Fund's investments in Fidelity Central Funds, including the ownership percentage, is presented below.
| Affiliate | Value, beginning of period ($) | Purchases ($) | Sales Proceeds ($) | Dividend Income ($) | Realized Gain (loss) ($) | Change in Unrealized appreciation (depreciation) ($) | Value, end of period ($) | % ownership, end of period |
| Fidelity Cash Central Fund 4.38% | 19,544,478 | 202,765,934 | 206,285,441 | 401,874 | - | - | 16,024,971 | 0.0% |
| Fidelity Securities Lending Cash Central Fund 4.38% | 16,918,340 | 102,861,714 | 117,077,054 | 8,193 | - | - | 2,703,000 | 0.0% |
| Total | 36,462,818 | 305,627,648 | 323,362,495 | 410,067 | - | - | 18,727,971 | |
| | | | | | | | | |
Amounts in the dividend income column in the above table include any capital gain distributions from underlying funds, which are presented in the corresponding line item in the Statement of Operations, if applicable.
Amount for Fidelity Securities Lending Cash Central Fund represents the income earned on investing cash collateral, less rebates paid to borrowers and any lending agent fees associated with the loan, plus any premium payments received for lending certain types of securities.
Amounts included in the purchases and sales proceeds columns may include in-kind transactions, if applicable.
Investment Valuation
The following is a summary of the inputs used, as of January 31, 2023, involving the Fund's assets and liabilities carried at fair value. The inputs or methodology used for valuing securities may not be an indication of the risk associated with investing in those securities. For more information on valuation inputs, and their aggregation into the levels used below, please refer to the Investment Valuation section in the accompanying Notes to Financial Statements.
| Valuation Inputs at Reporting Date: |
| Description | Total ($) | Level 1 ($) | Level 2 ($) | Level 3 ($) |
Investments in Securities: | | | | |
|
| Common Stocks | 879,534,993 | 879,534,993 | - | - |
|
| Money Market Funds | 18,727,971 | 18,727,971 | - | - |
| Total Investments in Securities: | 898,262,964 | 898,262,964 | - | - |
Fidelity Advisor® Utilities Fund
| Statement of Assets and Liabilities |
| | | | January 31, 2023 (Unaudited) |
| | | | | |
| Assets | | | | |
| Investment in securities, at value (including securities loaned of $2,601,000) - See accompanying schedule: | | | | |
Unaffiliated issuers (cost $739,894,920) | $ | 879,534,993 | | |
Fidelity Central Funds (cost $18,727,971) | | 18,727,971 | | |
| | | | | |
| | | | | |
| Total Investment in Securities (cost $758,622,891) | | | $ | 898,262,964 |
| Receivable for investments sold | | | | 3,617,900 |
| Receivable for fund shares sold | | | | 1,091,810 |
| Dividends receivable | | | | 82,631 |
| Distributions receivable from Fidelity Central Funds | | | | 71,754 |
| Prepaid expenses | | | | 1,482 |
Total assets | | | | 903,128,541 |
| Liabilities | | | | |
| Payable for fund shares redeemed | $ | 1,981,653 | | |
| Accrued management fee | | 406,971 | | |
| Distribution and service plan fees payable | | 157,966 | | |
| Other affiliated payables | | 147,001 | | |
| Other payables and accrued expenses | | 29,717 | | |
| Collateral on securities loaned | | 2,703,000 | | |
| Total Liabilities | | | | 5,426,308 |
| Net Assets | | | $ | 897,702,233 |
| Net Assets consist of: | | | | |
| Paid in capital | | | $ | 752,647,121 |
| Total accumulated earnings (loss) | | | | 145,055,112 |
| Net Assets | | | $ | 897,702,233 |
| | | | | |
| Net Asset Value and Maximum Offering Price | | | | |
| Class A : | | | | |
Net Asset Value and redemption price per share ($342,849,325 ÷ 9,272,067 shares) (a) | | | $ | 36.98 |
| Maximum offering price per share (100/94.25 of $36.98) | | | $ | 39.24 |
| Class M : | | | | |
Net Asset Value and redemption price per share ($71,258,830 ÷ 1,921,802 shares) (a) | | | $ | 37.08 |
| Maximum offering price per share (100/96.50 of $37.08) | | | $ | 38.42 |
| Class C : | | | | |
Net Asset Value and offering price per share ($64,901,200 ÷ 1,801,440 shares) (a) | | | $ | 36.03 |
| Class I : | | | | |
Net Asset Value , offering price and redemption price per share ($319,753,288 ÷ 8,433,847 shares) | | | $ | 37.91 |
| Class Z : | | | | |
Net Asset Value , offering price and redemption price per share ($98,939,590 ÷ 2,611,145 shares) | | | $ | 37.89 |
(a)Redemption price per share is equal to net asset value less any applicable contingent deferred sales charge. |
| Statement of Operations |
| | | | Six months ended January 31, 2023 (Unaudited) |
| Investment Income | | | | |
| Dividends | | | $ | 9,947,556 |
| Income from Fidelity Central Funds (including $8,193 from security lending) | | | | 410,067 |
| Total Income | | | | 10,357,623 |
| Expenses | | | | |
| Management fee | $ | 2,342,249 | | |
| Transfer agent fees | | 719,329 | | |
| Distribution and service plan fees | | 914,167 | | |
| Accounting fees | | 135,103 | | |
| Custodian fees and expenses | | 3,046 | | |
| Independent trustees' fees and expenses | | 1,510 | | |
| Registration fees | | 88,117 | | |
| Audit | | 25,037 | | |
| Legal | | 626 | | |
| Interest | | 2,589 | | |
| Miscellaneous | | 2,627 | | |
| Total expenses before reductions | | 4,234,400 | | |
| Expense reductions | | (17,995) | | |
| Total expenses after reductions | | | | 4,216,405 |
| Net Investment income (loss) | | | | 6,141,218 |
| Realized and Unrealized Gain (Loss) | | | | |
| Net realized gain (loss) on: | | | | |
| Investment Securities: | | | | |
| Unaffiliated issuers | | 18,090,330 | | |
| Foreign currency transactions | | (39) | | |
| Total net realized gain (loss) | | | | 18,090,291 |
| Change in net unrealized appreciation (depreciation) on: | | | | |
| Investment Securities: | | | | |
| Unaffiliated issuers | | (52,660,771) | | |
| Assets and liabilities in foreign currencies | | 489 | | |
| Total change in net unrealized appreciation (depreciation) | | | | (52,660,282) |
| Net gain (loss) | | | | (34,569,991) |
| Net increase (decrease) in net assets resulting from operations | | | $ | (28,428,773) |
| Statement of Changes in Net Assets |
| |
| | Six months ended January 31, 2023 (Unaudited) | | Year ended July 31, 2022 |
| Increase (Decrease) in Net Assets | | | | |
| Operations | | | | |
| Net investment income (loss) | $ | 6,141,218 | $ | 9,352,235 |
| Net realized gain (loss) | | 18,090,291 | | 20,793,548 |
| Change in net unrealized appreciation (depreciation) | | (52,660,282) | | 75,436,746 |
| Net increase (decrease) in net assets resulting from operations | | (28,428,773) | | 105,582,529 |
| Distributions to shareholders | | (36,009,866) | | (19,701,144) |
| Share transactions - net increase (decrease) | | 131,369,442 | | 184,796,381 |
| Total increase (decrease) in net assets | | 66,930,803 | | 270,677,766 |
| | | | | |
| Net Assets | | | | |
| Beginning of period | | 830,771,430 | | 560,093,664 |
| End of period | $ | 897,702,233 | $ | 830,771,430 |
| | | | | |
| | | | | |
Financial Highlights
| Fidelity Advisor® Utilities Fund Class A |
| |
| | Six months ended (Unaudited) January 31, 2023 | | Years ended July 31, 2022 | | 2021 | | 2020 | | 2019 | | 2018 |
Selected Per-Share Data | | | | | | | | | | | | |
| Net asset value, beginning of period | $ | 39.71 | $ | 34.53 | $ | 30.67 | $ | 31.73 | $ | 31.54 | $ | 29.74 |
| Income from Investment Operations | | | | | | | | | | | | |
Net investment income (loss) A,B | | .25 | | .52 | | .56 | | .60 | | .67 | | .49 |
| Net realized and unrealized gain (loss) | | (1.45) | | 5.84 | | 3.98 | | (1.03) | | 2.81 | | 2.38 |
| Total from investment operations | | (1.20) | | 6.36 | | 4.54 | | (.43) | | 3.48 | | 2.87 |
| Distributions from net investment income | | (.38) | | (.67) | | (.68) | | (.62) | | (.48) | | (.49) |
| Distributions from net realized gain | | (1.15) | | (.51) | | - | | - C | | (2.81) | | (.58) |
| Total distributions | | (1.53) | | (1.18) | | (.68) | | (.63) D | | (3.29) | | (1.07) |
| Net asset value, end of period | $ | 36.98 | $ | 39.71 | $ | 34.53 | $ | 30.67 | $ | 31.73 | $ | 31.54 |
Total Return E,F,G | | (3.05)% | | 18.70% | | 14.95% | | (1.56)% | | 11.73% | | 9.84% |
Ratios to Average Net Assets B,H,I | | | | | | | | | | | | |
| Expenses before reductions | | 1.02% J | | 1.02% | | 1.05% | | 1.06% | | 1.08% | | 1.12% |
| Expenses net of fee waivers, if any | | 1.02% J | | 1.02% | | 1.04% | | 1.06% | | 1.07% | | 1.11% |
| Expenses net of all reductions | | 1.02% J | | 1.02% | | 1.03% | | 1.05% | | 1.06% | | 1.09% |
| Net investment income (loss) | | 1.32% J | | 1.41% | | 1.70% | | 1.88% | | 2.14% | | 1.66% |
| Supplemental Data | | | | | | | | | | | | |
| Net assets, end of period (000 omitted) | $ | 342,849 | $ | 322,060 | $ | 254,388 | $ | 249,158 | $ | 268,246 | $ | 173,999 |
Portfolio turnover rate K | | 50% J | | 36% | | 45% | | 80% L | | 56% | | 106% |
A Calculated based on average shares outstanding during the period.
B Net investment income (loss) is affected by the timing of the declaration of dividends by any underlying mutual funds or exchange-traded funds (ETFs). Net investment income (loss) of any mutual funds or ETFs is not included in the Fund's net investment income (loss) ratio.
C Amount represents less than $.005 per share.
D Total distributions per share do not sum due to rounding.
E Total returns for periods of less than one year are not annualized.
F Total returns would have been lower if certain expenses had not been reduced during the applicable periods shown.
G Total returns do not include the effect of the sales charges.
H Fees and expenses of any underlying mutual funds or exchange-traded funds (ETFs) are not included in the Fund's expense ratio. The Fund indirectly bears its proportionate share of these expenses. For additional expense information related to investments in Fidelity Central Funds, please refer to the "Investments in Fidelity Central Funds" note found in the Notes to Financial Statements section of the most recent Annual or Semi-Annual report.
I Expense ratios reflect operating expenses of the class. Expenses before reductions do not reflect amounts reimbursed, waived, or reduced through arrangements with the investment adviser, brokerage services, or other offset arrangements, if applicable, and do not represent the amount paid by the class during periods when reimbursements, waivers or reductions occur.
J Annualized.
K Amount does not include the portfolio activity of any underlying mutual funds or exchange-traded funds (ETFs).
L Portfolio turnover rate excludes securities received or delivered in-kind.
| Fidelity Advisor® Utilities Fund Class M |
| |
| | Six months ended (Unaudited) January 31, 2023 | | Years ended July 31, 2022 | | 2021 | | 2020 | | 2019 | | 2018 |
Selected Per-Share Data | | | | | | | | | | | | |
| Net asset value, beginning of period | $ | 39.81 | $ | 34.57 | $ | 30.71 | $ | 31.77 | $ | 31.58 | $ | 29.77 |
| Income from Investment Operations | | | | | | | | | | | | |
Net investment income (loss) A,B | | .20 | | .42 | | .47 | | .51 | | .58 | | .41 |
| Net realized and unrealized gain (loss) | | (1.45) | | 5.85 | | 3.99 | | (1.03) | | 2.81 | | 2.38 |
| Total from investment operations | | (1.25) | | 6.27 | | 4.46 | | (.52) | | 3.39 | | 2.79 |
| Distributions from net investment income | | (.32) | | (.51) | | (.60) | | (.53) | | (.39) | | (.40) |
| Distributions from net realized gain | | (1.15) | | (.51) | | - | | - C | | (2.81) | | (.58) |
| Total distributions | | (1.48) D | | (1.03) D | | (.60) | | (.54) D | | (3.20) | | (.98) |
| Net asset value, end of period | $ | 37.08 | $ | 39.81 | $ | 34.57 | $ | 30.71 | $ | 31.77 | $ | 31.58 |
Total Return E,F,G | | (3.18)% | | 18.37% | | 14.63% | | (1.82)% | | 11.38% | | 9.53% |
Ratios to Average Net Assets B,H,I | | | | | | | | | | | | |
| Expenses before reductions | | 1.29% J | | 1.30% | | 1.32% | | 1.33% | | 1.36% | | 1.41% |
| Expenses net of fee waivers, if any | | 1.28% J | | 1.29% | | 1.32% | | 1.33% | | 1.36% | | 1.41% |
| Expenses net of all reductions | | 1.28% J | | 1.29% | | 1.31% | | 1.33% | | 1.35% | | 1.39% |
| Net investment income (loss) | | 1.05% J | | 1.14% | | 1.42% | | 1.60% | | 1.86% | | 1.36% |
| Supplemental Data | | | | | | | | | | | | |
| Net assets, end of period (000 omitted) | $ | 71,259 | $ | 71,690 | $ | 58,065 | $ | 58,773 | $ | 61,741 | $ | 46,669 |
Portfolio turnover rate K | | 50% J | | 36% | | 45% | | 80% L | | 56% | | 106% |
A Calculated based on average shares outstanding during the period.
B Net investment income (loss) is affected by the timing of the declaration of dividends by any underlying mutual funds or exchange-traded funds (ETFs). Net investment income (loss) of any mutual funds or ETFs is not included in the Fund's net investment income (loss) ratio.
C Amount represents less than $.005 per share.
D Total distributions per share do not sum due to rounding.
E Total returns for periods of less than one year are not annualized.
F Total returns would have been lower if certain expenses had not been reduced during the applicable periods shown.
G Total returns do not include the effect of the sales charges.
H Fees and expenses of any underlying mutual funds or exchange-traded funds (ETFs) are not included in the Fund's expense ratio. The Fund indirectly bears its proportionate share of these expenses. For additional expense information related to investments in Fidelity Central Funds, please refer to the "Investments in Fidelity Central Funds" note found in the Notes to Financial Statements section of the most recent Annual or Semi-Annual report.
I Expense ratios reflect operating expenses of the class. Expenses before reductions do not reflect amounts reimbursed, waived, or reduced through arrangements with the investment adviser, brokerage services, or other offset arrangements, if applicable, and do not represent the amount paid by the class during periods when reimbursements, waivers or reductions occur.
J Annualized.
K Amount does not include the portfolio activity of any underlying mutual funds or exchange-traded funds (ETFs).
L Portfolio turnover rate excludes securities received or delivered in-kind.
| Fidelity Advisor® Utilities Fund Class C |
| |
| | Six months ended (Unaudited) January 31, 2023 | | Years ended July 31, 2022 | | 2021 | | 2020 | | 2019 | | 2018 |
Selected Per-Share Data | | | | | | | | | | | | |
| Net asset value, beginning of period | $ | 38.73 | $ | 33.60 | $ | 29.83 | $ | 30.90 | $ | 30.81 | $ | 29.07 |
| Income from Investment Operations | | | | | | | | | | | | |
Net investment income (loss) A,B | | .11 | | .24 | | .30 | | .35 | | .42 | | .26 |
| Net realized and unrealized gain (loss) | | (1.42) | | 5.67 | | 3.88 | | (1.01) | | 2.74 | | 2.33 |
| Total from investment operations | | (1.31) | | 5.91 | | 4.18 | | (.66) | | 3.16 | | 2.59 |
| Distributions from net investment income | | (.24) | | (.27) | | (.41) | | (.40) | | (.26) | | (.27) |
| Distributions from net realized gain | | (1.15) | | (.51) | | - | | - C | | (2.81) | | (.58) |
| Total distributions | | (1.39) | | (.78) | | (.41) | | (.41) D | | (3.07) | | (.85) |
| Net asset value, end of period | $ | 36.03 | $ | 38.73 | $ | 33.60 | $ | 29.83 | $ | 30.90 | $ | 30.81 |
Total Return E,F,G | | (3.42)% | | 17.78% | | 14.10% | | (2.28)% | | 10.87% | | 9.04% |
Ratios to Average Net Assets B,H,I | | | | | | | | | | | | |
| Expenses before reductions | | 1.78% J | | 1.78% | | 1.80% | | 1.81% | | 1.83% | | 1.87% |
| Expenses net of fee waivers, if any | | 1.77% J | | 1.78% | | 1.80% | | 1.81% | | 1.83% | | 1.87% |
| Expenses net of all reductions | | 1.77% J | | 1.78% | | 1.79% | | 1.80% | | 1.82% | | 1.85% |
| Net investment income (loss) | | .56% J | | .65% | | .94% | | 1.12% | | 1.39% | | .90% |
| Supplemental Data | | | | | | | | | | | | |
| Net assets, end of period (000 omitted) | $ | 64,901 | $ | 61,087 | $ | 49,312 | $ | 63,458 | $ | 66,525 | $ | 53,099 |
Portfolio turnover rate K | | 50% J | | 36% | | 45% | | 80% L | | 56% | | 106% |
A Calculated based on average shares outstanding during the period.
B Net investment income (loss) is affected by the timing of the declaration of dividends by any underlying mutual funds or exchange-traded funds (ETFs). Net investment income (loss) of any mutual funds or ETFs is not included in the Fund's net investment income (loss) ratio.
C Amount represents less than $.005 per share.
D Total distributions per share do not sum due to rounding.
E Total returns for periods of less than one year are not annualized.
F Total returns would have been lower if certain expenses had not been reduced during the applicable periods shown.
G Total returns do not include the effect of the contingent deferred sales charge.
H Fees and expenses of any underlying mutual funds or exchange-traded funds (ETFs) are not included in the Fund's expense ratio. The Fund indirectly bears its proportionate share of these expenses. For additional expense information related to investments in Fidelity Central Funds, please refer to the "Investments in Fidelity Central Funds" note found in the Notes to Financial Statements section of the most recent Annual or Semi-Annual report.
I Expense ratios reflect operating expenses of the class. Expenses before reductions do not reflect amounts reimbursed, waived, or reduced through arrangements with the investment adviser, brokerage services, or other offset arrangements, if applicable, and do not represent the amount paid by the class during periods when reimbursements, waivers or reductions occur.
J Annualized.
K Amount does not include the portfolio activity of any underlying mutual funds or exchange-traded funds (ETFs).
L Portfolio turnover rate excludes securities received or delivered in-kind.
| Fidelity Advisor® Utilities Fund Class I |
| |
| | Six months ended (Unaudited) January 31, 2023 | | Years ended July 31, 2022 | | 2021 | | 2020 | | 2019 | | 2018 |
Selected Per-Share Data | | | | | | | | | | | | |
| Net asset value, beginning of period | $ | 40.68 | $ | 35.39 | $ | 31.40 | $ | 32.47 | $ | 32.21 | $ | 30.35 |
| Income from Investment Operations | | | | | | | | | | | | |
Net investment income (loss) A,B | | .31 | | .64 | | .66 | | .71 | | .76 | | .59 |
| Net realized and unrealized gain (loss) | | (1.50) | | 5.98 | | 4.10 | | (1.07) | | 2.88 | | 2.43 |
| Total from investment operations | | (1.19) | | 6.62 | | 4.76 | | (.36) | | 3.64 | | 3.02 |
| Distributions from net investment income | | (.43) | | (.81) | | (.77) | | (.71) | | (.58) | | (.58) |
| Distributions from net realized gain | | (1.15) | | (.51) | | - | | - C | | (2.81) | | (.58) |
| Total distributions | | (1.58) | | (1.33) D | | (.77) | | (.71) | | (3.38) D | | (1.16) |
| Net asset value, end of period | $ | 37.91 | $ | 40.68 | $ | 35.39 | $ | 31.40 | $ | 32.47 | $ | 32.21 |
Total Return E,F | | (2.95)% | | 19.00% | | 15.30% | | (1.30)% | | 12.04% | | 10.14% |
Ratios to Average Net Assets B,G,H | | | | | | | | | | | | |
| Expenses before reductions | | .76% I | | .76% | | .77% | | .79% | | .81% | | .84% |
| Expenses net of fee waivers, if any | | .75% I | | .75% | | .77% | | .78% | | .80% | | .84% |
| Expenses net of all reductions | | .75% I | | .75% | | .76% | | .78% | | .79% | | .82% |
| Net investment income (loss) | | 1.58% I | | 1.68% | | 1.97% | | 2.15% | | 2.41% | | 1.93% |
| Supplemental Data | | | | | | | | | | | | |
| Net assets, end of period (000 omitted) | $ | 319,753 | $ | 269,667 | $ | 143,582 | $ | 187,833 | $ | 229,777 | $ | 55,462 |
Portfolio turnover rate J | | 50% I | | 36% | | 45% | | 80% K | | 56% | | 106% |
A Calculated based on average shares outstanding during the period.
B Net investment income (loss) is affected by the timing of the declaration of dividends by any underlying mutual funds or exchange-traded funds (ETFs). Net investment income (loss) of any mutual funds or ETFs is not included in the Fund's net investment income (loss) ratio.
C Amount represents less than $.005 per share.
D Total distributions per share do not sum due to rounding.
E Total returns for periods of less than one year are not annualized.
F Total returns would have been lower if certain expenses had not been reduced during the applicable periods shown.
G Fees and expenses of any underlying mutual funds or exchange-traded funds (ETFs) are not included in the Fund's expense ratio. The Fund indirectly bears its proportionate share of these expenses. For additional expense information related to investments in Fidelity Central Funds, please refer to the "Investments in Fidelity Central Funds" note found in the Notes to Financial Statements section of the most recent Annual or Semi-Annual report.
H Expense ratios reflect operating expenses of the class. Expenses before reductions do not reflect amounts reimbursed, waived, or reduced through arrangements with the investment adviser, brokerage services, or other offset arrangements, if applicable, and do not represent the amount paid by the class during periods when reimbursements, waivers or reductions occur.
I Annualized.
J Amount does not include the portfolio activity of any underlying mutual funds or exchange-traded funds (ETFs).
K Portfolio turnover rate excludes securities received or delivered in-kind.
| Fidelity Advisor® Utilities Fund Class Z |
| |
| | Six months ended (Unaudited) January 31, 2023 | | Years ended July 31, 2022 | | 2021 | | 2020 | | 2019 A |
Selected Per-Share Data | | | | | | | | | | |
| Net asset value, beginning of period | $ | 40.66 | $ | 35.38 | $ | 31.42 | $ | 32.48 | $ | 33.14 |
| Income from Investment Operations | | | | | | | | | | |
Net investment income (loss) B,C | | .34 | | .69 | | .71 | | .74 | | .63 |
| Net realized and unrealized gain (loss) | | (1.50) | | 5.98 | | 4.08 | | (1.04) | | 2.13 |
| Total from investment operations | | (1.16) | | 6.67 | | 4.79 | | (.30) | | 2.76 |
| Distributions from net investment income | | (.45) | | (.88) | | (.83) | | (.75) | | (.61) |
| Distributions from net realized gain | | (1.15) | | (.51) | | - | | - D | | (2.81) |
| Total distributions | | (1.61) E | | (1.39) | | (.83) | | (.76) E | | (3.42) |
| Net asset value, end of period | $ | 37.89 | $ | 40.66 | $ | 35.38 | $ | 31.42 | $ | 32.48 |
Total Return F,G | | (2.88)% | | 19.17% | | 15.41% | | (1.15)% | | 9.04% |
Ratios to Average Net Assets C,H,I | | | | | | | | | | |
| Expenses before reductions | | .63% J | | .63% | | .64% | | .65% | | .66% J |
| Expenses net of fee waivers, if any | | .62% J | | .63% | | .64% | | .65% | | .66% J |
| Expenses net of all reductions | | .62% J | | .63% | | .63% | | .64% | | .64% J |
| Net investment income (loss) | | 1.71% J | | 1.81% | | 2.10% | | 2.29% | | 2.41% J |
| Supplemental Data | | | | | | | | | | |
| Net assets, end of period (000 omitted) | $ | 98,940 | $ | 106,266 | $ | 54,746 | $ | 52,034 | $ | 17,071 |
Portfolio turnover rate K | | 50% J | | 36% | | 45% | | 80% L | | 56% |
A For the period October 2, 2018 (commencement of sale of shares) through July 31, 2019.
B Calculated based on average shares outstanding during the period.
C Net investment income (loss) is affected by the timing of the declaration of dividends by any underlying mutual funds or exchange-traded funds (ETFs). Net investment income (loss) of any mutual funds or ETFs is not included in the Fund's net investment income (loss) ratio.
D Amount represents less than $.005 per share.
E Total distributions per share do not sum due to rounding.
F Total returns for periods of less than one year are not annualized.
G Total returns would have been lower if certain expenses had not been reduced during the applicable periods shown.
H Fees and expenses of any underlying mutual funds or exchange-traded funds (ETFs) are not included in the Fund's expense ratio. The Fund indirectly bears its proportionate share of these expenses. For additional expense information related to investments in Fidelity Central Funds, please refer to the "Investments in Fidelity Central Funds" note found in the Notes to Financial Statements section of the most recent Annual or Semi-Annual report.
I Expense ratios reflect operating expenses of the class. Expenses before reductions do not reflect amounts reimbursed, waived, or reduced through arrangements with the investment adviser, brokerage services, or other offset arrangements, if applicable, and do not represent the amount paid by the class during periods when reimbursements, waivers or reductions occur.
J Annualized.
K Amount does not include the portfolio activity of any underlying mutual funds or exchange-traded funds (ETFs).
L Portfolio turnover rate excludes securities received or delivered in-kind.
For the period ended January 31, 2023
1. Organization.
Fidelity Advisor Biotechnology Fund, Fidelity Advisor Consumer Discretionary Fund, Fidelity Advisor Energy Fund, Fidelity Advisor Financial Services Fund (to be renamed Fidelity Advisor Financials Fund effective April 28, 2023), Fidelity Advisor Health Care Fund, Fidelity Advisor Industrials Fund, Fidelity Advisor Semiconductors Fund, Fidelity Advisor Technology Fund and Fidelity Advisor Utilities Fund (the Funds) are funds of Fidelity Advisor Series VII (the Trust) and are authorized to issue an unlimited number of shares. The Trust is registered under the Investment Company Act of 1940, as amended (the 1940 Act), as an open-end management investment company organized as a Massachusetts business trust. The Funds are non-diversified with the exception of Fidelity Advisor Financial Services Fund and Fidelity Adviser Health Care Fund. Each Fund offers Class A, Class M, Class C, Class I and Class Z shares, each of which has equal rights as to assets and voting privileges. Each class has exclusive voting rights with respect to matters that affect that class. Class C shares will automatically convert to Class A shares after a holding period of eight years from the initial date of purchase, with certain exceptions.
2. Investments in Fidelity Central Funds.
Funds may invest in Fidelity Central Funds, which are open-end investment companies generally available only to other investment companies and accounts managed by the investment adviser and its affiliates. The Schedule of Investments lists any Fidelity Central Funds held as an investment as of period end, but does not include the underlying holdings of each Fidelity Central Fund. An investing fund indirectly bears its proportionate share of the expenses of the underlying Fidelity Central Funds.
Based on its investment objective, each Fidelity Central Fund may invest or participate in various investment vehicles or strategies that are similar to those of the investing fund. These strategies are consistent with the investment objectives of the investing fund and may involve certain economic risks which may cause a decline in value of each of the Fidelity Central Funds and thus a decline in the value of the investing fund.
| Fidelity Central Fund | Investment Manager | Investment Objective | Investment Practices | Expense Ratio A |
| Fidelity Money Market Central Funds | Fidelity Management & Research Company LLC (FMR) | Each fund seeks to obtain a high level of current income consistent with the preservation of capital and liquidity. | Short-term Investments | Less than .005% |
A Expenses expressed as a percentage of average net assets and are as of each underlying Central Fund's most recent annual or semi-annual shareholder report.
A complete unaudited list of holdings for each Fidelity Central Fund is available upon request or at the Securities and Exchange Commission website at www.sec.gov. In addition, the financial statements of the Fidelity Central Funds which contain the significant accounting policies (including investment valuation policies) of those funds, and are not covered by the Report of Independent Registered Public Accounting Firm, are available on the Securities and Exchange Commission website or upon request.
3. Significant Accounting Policies.
Each Fund is an investment company and applies the accounting and reporting guidance of the Financial Accounting Standards Board (FASB) Accounting Standards Codification Topic 946 Financial Services - Investment Companies . The financial statements have been prepared in conformity with accounting principles generally accepted in the United States of America (GAAP), which require management to make certain estimates and assumptions at the date of the financial statements. Actual results could differ from those estimates. Subsequent events, if any, through the date that the financial statements were issued have been evaluated in the preparation of the financial statements. Each Fund's Schedule of Investments lists any underlying mutual funds or exchange-traded funds (ETFs) but does not include the underlying holdings of these funds. The following summarizes the significant accounting policies of each Fund:
Investment Valuation. Investments are valued as of 4:00 p.m. Eastern time on the last calendar day of the period. The Board of Trustees (the Board) has designated each Fund's investment adviser as the valuation designee responsible for the fair valuation function and performing fair value determinations as needed. The investment adviser has established a Fair Value Committee (the Committee) to carry out the day-to-day fair valuation responsibilities and has adopted policies and procedures to govern the fair valuation process and the activities of the Committee. In accordance with these fair valuation policies and procedures, which have been approved by the Board, each Fund attempts to obtain prices from one or more third party pricing services or brokers to value its investments. When current market prices, quotations or currency exchange rates are not readily available or reliable, investments will be fair valued in good faith by the Committee, in accordance with the policies and procedures. Factors used in determining fair value vary by investment type and may include market or investment specific events, transaction data, estimated cash flows, and market observations of comparable investments. The frequency that the fair valuation procedures are used cannot be predicted and they may be utilized to a significant extent. The Committee manages each Fund's fair valuation practices and maintains the fair valuation policies and procedures. Each Fund's investment adviser reports to the Board information regarding the fair valuation process and related material matters.
Each Fund categorizes the inputs to valuation techniques used to value its investments into a disclosure hierarchy consisting of three levels as shown below:
Level 1 - unadjusted quoted prices in active markets for identical investments
Level 2 - other significant observable inputs (including quoted prices for similar investments, interest rates, prepayment speeds, etc.)
Level 3 - unobservable inputs (including the Fund's own assumptions based on the best information available)
Valuation techniques used to value each Fund's investments by major category are as follows:
Equity securities, including restricted securities, for which market quotations are readily available, are valued at the last reported sale price or official closing price as reported by a third party pricing service on the primary market or exchange on which they are traded and are categorized as Level 1 in the hierarchy. In the event there were no sales during the day or closing prices are not available, securities are valued at the last quoted bid price or may be valued using the last available price and are generally categorized as Level 2 in the hierarchy. For foreign equity securities, when market or security specific events arise, comparisons to the valuation of American Depositary Receipts (ADRs), futures contracts, ETFs and certain indexes as well as quoted prices for similar securities may be used and would be categorized as Level 2 in the hierarchy. For equity securities, including restricted securities, where observable inputs are limited, assumptions about market activity and risk are used and these securities may be categorized as Level 3 in the hierarchy. Securities, including private placements or other restricted securities, for which observable inputs are not available are valued using alternate valuation approaches, including the market approach, the income approach and cost approach, and are categorized as Level 3 in the hierarchy. The market approach considers factors including the price of recent investments in the same or a similar security or financial metrics of comparable securities. The income approach considers factors including expected future cash flows, security specific risks and corresponding discount rates. The cost approach considers factors including the value of the security's underlying assets and liabilities.
Debt securities, including restricted securities, are valued based on evaluated prices received from third party pricing services or from brokers who make markets in such securities. Corporate bonds and preferred securities are valued by pricing services who utilize matrix pricing which considers yield or price of bonds of comparable quality, coupon, maturity and type or by broker-supplied prices. When independent prices are unavailable or unreliable, debt securities may be valued utilizing pricing methodologies which consider similar factors that would be used by third party pricing services. Debt securities are generally categorized as Level 2 in the hierarchy but may be Level 3 depending on the circumstances.
Investments in open-end mutual funds, including the Fidelity Central Funds, are valued at their closing net asset value (NAV) each business day and are categorized as Level 1 in the hierarchy.
The following provides information on Level 3 securities held by the Fund that were valued at period end based on unobservable inputs. These amounts exclude valuations provided by a broker.
Fidelity Advisor Biotechnology Fund
| Asset Type | Fair Value | Valuation Technique(s) | Unobservable Input | Amount or Range/Weighted Average | Impact to Valuation from an Increase in Input A |
| Equities | $51,566,769 | Recovery value | Recovery value | $0.00 - $5.51 / $5.51 | Increase |
| | | Market approach | Transaction price | $1.35 - $10.76 / $4.81 | Increase |
| | | | Discount rate | 4.7% - 33.6% / 26.7% | Decrease |
| | | Discounted cash flow | Discount rate | 4.4% - 5.6% / 4.8% | Decrease |
| | | | Probability rate | 0.0% - 90.0% / 39.0% | Increase |
| | | | Term | 0.2 - 7.9 / 4.3 | Increase |
| | | Black scholes | Discount rate | 3.9% | Increase |
| | | | Volatility | 75.0% - 90.0% / 81.5% | Increase |
| | | | Term | 3.0 | Increase |
A Represents the directional change in the fair value of the Level 3 investments that could have resulted from an increase in the corresponding input as of period end. A decrease to the unobservable input would have had the opposite effect. Significant changes in these inputs may have resulted in a significantly higher or lower fair value measurement at period end.
Fidelity Advisor Health Care
| Asset Type | Fair Value | Valuation Technique(s) | Unobservable Input | Amount or Range/Weighted Average | Impact to Valuation from an Increase in Input A |
| Equities | $73,668,668 | Market comparable | Enterprise value/Revenue multiple (EV/R) | 3.6 - 16.0 / 6.9 | Increase |
| | | Recovery value | Recovery value | $5.51 | Increase |
| | | Market approach | Transaction price | $7.75 - $20.56 / $14.44 | Increase |
| | | | Discount rate | 20.0% - 32.7% / 22.6% | Decrease |
| | | Black scholes | Discount rate | 3.7% - 4.4% / 3.9% | Increase |
| | | | Volatility | 45.0% - 55.0% / 48.0% | Increase |
| | | | Term | 1.5 - 4.0 / 3.3 | Increase |
A Represents the directional change in the fair value of the Level 3 investments that could have resulted from an increase in the corresponding input as of period end. A decrease to the unobservable input would have had the opposite effect. Significant changes in these inputs may have resulted in a significantly higher or lower fair value measurement at period end.
Fidelity Advisor Technology
| Asset Type | Fair Value | Valuation Technique(s) | Unobservable Input | Amount or Range/Weighted Average | Impact to Valuation from an Increase in Input A |
| Equities | $79,015,889 | Market comparable | Enterprise value/Revenue multiple (EV/R) | 2.0 - 25.0 / 12.4 | Increase |
| | | | Enterprise value/Gross profit multiple (EV/GP) | 7.5 | Increase |
| | | Recovery value | Recovery value | $0.00 | Increase |
| | | Market approach | Transaction price | $1.11 - $59.45 / $5.64 | Increase |
| | | | Discount rate | 5.0% - 75.0% / 43.6% | Decrease |
| | | | Premium rate | 10.0% | Increase |
| | | Book value | Book value multiple | 1.5 | Increase |
| | | Discounted cash flow | Weighted average cost of capital (WACC) | 30.0% | Decrease |
| | | | Exit multiple | 2.0 | Increase |
| | | Black scholes | Discount rate | 3.6% - 4.1% / 3.7% | Increase |
| | | | Volatility | 50.0% - 100.0% / 81.4% | Increase |
| | | | Term | 2.0 - 5.0 / 4.0 | Increase |
| Preferred Securities | $324,860 | Market approach | Transaction price | $100.00 | Increase |
| | | | Discount rate | 15.0% | Decrease |
| | | Black scholes | Discount rate | 4.1% | Increase |
| | | | Volatility | 70.0% | Increase |
| | | | Term | 2.0 | Increase |
A Represents the directional change in the fair value of the Level 3 investments that could have resulted from an increase in the corresponding input as of period end. A decrease to the unobservable input would have had the opposite effect. Significant changes in these inputs may have resulted in a significantly higher or lower fair value measurement at period end.
Changes in valuation techniques may result in transfers in or out of an assigned level within the disclosure hierarchy. The aggregate value of investments by input level as of January 31, 2023, as well as a roll forward of Level 3 investments, is included at the end of each Fund's Schedule of Investments.
Foreign Currency. Certain Funds may use foreign currency contracts to facilitate transactions in foreign-denominated securities. Gains and losses from these transactions may arise from changes in the value of the foreign currency or if the counterparties do not perform under the contracts' terms.
Foreign-denominated assets, including investment securities, and liabilities are translated into U.S. dollars at the exchange rates at period end. Purchases and sales of investment securities, income and dividends received, and expenses denominated in foreign currencies are translated into U.S. dollars at the exchange rate in effect on the transaction date.
The effects of exchange rate fluctuations on investments are included with the net realized and unrealized gain (loss) on investment securities. Other foreign currency transactions resulting in realized and unrealized gain (loss) are disclosed separately.
Investment Transactions and Income. For financial reporting purposes, the Funds' investment holdings and NAV include trades executed through the end of the last business day of the period. The NAV per share for processing shareholder transactions is calculated as of the close of business of the New York Stock Exchange (NYSE), normally 4:00 p.m. Eastern time and includes trades executed through the end of the prior business day. Gains and losses on securities sold are determined on the basis of identified cost and for certain Funds include proceeds received from litigation. Commissions paid to certain brokers with whom the investment adviser, or its affiliates, places trades on behalf of a fund include an amount in addition to trade execution, which may be rebated back to a fund. Any such rebates are included in net realized gain (loss) on investments in the Statement of Operations. Dividend income is recorded on the ex-dividend date, except for certain dividends from foreign securities where the ex-dividend date may have passed, which are recorded as soon as the Funds are informed of the ex-dividend date. Non-cash dividends included in dividend income, if any, are recorded at the fair market value of the securities received. Income and capital gain distributions from Fidelity Central Funds, if any, are recorded on the ex-dividend date. Certain distributions received by the Funds represent a return of capital or capital gain. The Funds determine the components of these distributions subsequent to the ex-dividend date, based upon receipt of tax filings or other correspondence relating to the underlying investment. These distributions are recorded as a reduction of cost of investments and/or as a realized gain. Large, non-recurring dividends recognized by the Funds are presented separately on the Statement of Operations as "Special Dividends" and the impact of these dividends is presented in the Financial Highlights. Interest income is accrued as earned and includes coupon interest and amortization of premium and accretion of discount on debt securities as applicable. Investment income is recorded net of foreign taxes withheld where recovery of such taxes is uncertain. Funds may file withholding tax reclaims in certain jurisdictions to recover a portion of amounts previously withheld. Any withholding tax reclaims income is included in the Statement of Operations in dividends. Any receivables for withholding tax reclaims are included in the Statement of Assets and Liabilities in dividends receivable.
Class Allocations and Expenses. Investment income, realized and unrealized capital gains and losses, common expenses of a fund, and certain fund-level expense reductions, if any, are allocated daily on a pro-rata basis to each class based on the relative net assets of each class to the total net assets of a fund. Each class differs with respect to transfer agent and distribution and service plan fees incurred, as applicable. Certain expense reductions may also differ by class, if applicable. For the reporting period, the allocated portion of income and expenses to each class as a percent of its average net assets may vary due to the timing of recording these transactions in relation to fluctuating net assets of the classes. Expenses directly attributable to a fund are charged to that fund. Expenses attributable to more than one fund are allocated among the respective funds on the basis of relative net assets or other appropriate methods. Expenses included in the accompanying financial statements reflect the expenses of that fund and do not include any expenses associated with any underlying mutual funds or exchange-traded funds. Although not included in a fund's expenses, a fund indirectly bears its proportionate share of these expenses through the net asset value of each underlying mutual fund or exchange-traded fund. Expense estimates are accrued in the period to which they relate and adjustments are made when actual amounts are known.
Deferred Trustee Compensation. Under a Deferred Compensation Plan (the Plan) for certain Funds, certain independent Trustees have elected to defer receipt of a portion of their annual compensation. Deferred amounts are invested in affiliated mutual funds, are marked-to-market and remain in a fund until distributed in accordance with the Plan. The investment of deferred amounts and the offsetting payable to the Trustees presented below are included in the accompanying Statement of Assets and Liabilities in other receivables and other payables and accrued expenses, as applicable.
| Fidelity Advisor Energy Fund | 76,927 |
| Fidelity Advisor Technology Fund | 123,337 |
Income Tax Information and Distributions to Shareholders. Each year, each Fund intends to qualify as a regulated investment company under Subchapter M of the Internal Revenue Code, including distributing substantially all of its taxable income and realized gains. As a result, no provision for U.S. Federal income taxes is required. Each Fund files a U.S. federal tax return, in addition to state and local tax returns as required. Each Fund's federal income tax returns are subject to examination by the Internal Revenue Service (IRS) for a period of three fiscal years after they are filed. State and local tax returns may be subject to examination for an additional fiscal year depending on the jurisdiction. Foreign taxes are provided for based on each Fund's understanding of the tax rules and rates that exist in the foreign markets in which it invests.
Distributions are declared and recorded on the ex-dividend date. Income and capital gain distributions are declared separately for each class. Income and capital gain distributions are determined in accordance with income tax regulations, which may differ from GAAP.
Capital accounts within the financial statements are adjusted for permanent book-tax differences. These adjustments have no impact on net assets or the results of operations. Capital accounts are not adjusted for temporary book-tax differences which will reverse in a subsequent period.
Book-tax differences are primarily due to foreign currency transactions, partnerships, certain foreign taxes, passive foreign investment companies (PFIC), deferred Trustee compensation, net operating losses, capital loss carryforwards and losses deferred due to wash sales and excise tax regulations.
As of period end, the cost and unrealized appreciation (depreciation) in securities, and derivatives if applicable, for federal income tax purposes were as follows for each Fund:
| | Tax cost | Gross unrealized appreciation | Gross unrealized depreciation | Net unrealized appreciation (depreciation) |
| Fidelity Advisor Biotechnology Fund | $1,481,262,113 | $647,780,731 | $ (185,317,910) | $462,462,821 |
Fidelity Advisor Consumer Discretionary Fund | 272,679,855 | 172,490,539 | (16,833,320) | 155,657,219 |
| Fidelity Advisor Energy Fund | 1,089,790,169 | 662,764,825 | (19,667,997) | 643,096,828 |
| Fidelity Advisor Financial Services Fund | 502,398,777 | 113,765,279 | (22,583,626) | 91,181,653 |
| Fidelity Advisor Health Care Fund | 4,419,946,445 | 2,134,614,058 | (370,885,798) | 1,763,728,260 |
| Fidelity Advisor Industrials Fund | 491,618,715 | 103,185,217 | (4,406,496) | 98,778,721 |
Fidelity Advisor Semiconductors Fund | 602,347,304 | 263,319,492 | (32,251,613) | 231,067,879 |
| Fidelity Advisor Technology Fund | 2,506,542,808 | 1,473,661,199 | (288,305,371) | 1,185,355,828 |
| Fidelity Advisor Utilities Fund | 762,096,546 | 153,949,036 | (17,782,618) | 136,166,418 |
Capital loss carryforwards are only available to offset future capital gains of the Funds to the extent provided by regulations and may be limited. The capital loss carryforward information presented below, including any applicable limitation, is estimated as of prior fiscal period end and is subject to adjustment.
| | Short-term | Long-term | Total capital loss carryforward |
| Fidelity Advisor Energy Fund | $(176,483,466) | $(140,360,404) | $(316,843,870) |
| | | | |
| | | | |
Certain of the Funds elected to defer to the next fiscal year capital losses recognized during the period November 1, 2021 to July 31, 2022, and ordinary losses recognized during the period January 1, 2022 to July 31, 2022. Loss deferrals were as follows:
| | Capital losses | Ordinary losses |
| | | |
| Fidelity Advisor Biotechnology Fund | $(112,199,146) | $- |
Fidelity Advisor Consumer Discretionary Fund | (17,015,738) | (1,142,847) |
| Fidelity Advisor Financial Services Fund | (4,572,117) | - |
| Fidelity Advisor Health Care Fund | (69,569,948) | (11,301,927) |
| Fidelity Advisor Industrials Fund | (5,993,316) | - |
Fidelity Advisor Semiconductors Fund | - | (1,400,384) |
| Fidelity Advisor Technology Fund | - | (9,615,782) |
Delayed Delivery Transactions and When-Issued Securities. During the period, certain Funds transacted in securities on a delayed delivery or when-issued basis. Payment and delivery may take place after the customary settlement period for that security. The price of the underlying securities and the date when the securities will be delivered and paid for are fixed at the time the transaction is negotiated. Securities purchased on a delayed delivery or when-issued basis are identified as such in the Schedule of Investments. Compensation for interest forgone in the purchase of a delayed delivery or when-issued debt security may be received. With respect to purchase commitments, each applicable Fund identifies securities as segregated in its records with a value at least equal to the amount of the commitment. Payables and receivables associated with the purchases and sales of delayed delivery securities having the same coupon, settlement date and broker are offset. Delayed delivery or when-issued securities that have been purchased from and sold to different brokers are reflected as both payables and receivables in the Statement of Assets and Liabilities under the caption "Delayed delivery", as applicable. Losses may arise due to changes in the value of the underlying securities or if the counterparty does not perform under the contract's terms, or if the issuer does not issue the securities due to political, economic, or other factors.
Restricted Securities (including Private Placements). Funds may invest in securities that are subject to legal or contractual restrictions on resale. These securities generally may be resold in transactions exempt from registration or to the public if the securities are registered. Disposal of these securities may involve time-consuming negotiations and expense, and prompt sale at an acceptable price may be difficult. Information regarding restricted securities held at period end is included at the end of the Schedule of Investments, if applicable.
Consolidated Subsidiary. The Funds included in the table below hold certain investments through a wholly-owned subsidiary ("Subsidiary"), which may be subject to federal and state taxes upon disposition.
As of period end, investments in Subsidiaries were as follows:
| | $ Amount | % of Net Assets |
Fidelity Advisor Health Care Fund | 5,424,907 | .09 |
The financial statements have been consolidated to include the Subsidiary accounts where applicable. Accordingly, all inter-company transactions and balances have been eliminated.
At period end, any estimated tax liability for these investments is presented as "Deferred taxes" in the Statement of Assets and Liabilities and included in "Change in net unrealized appreciation (depreciation) on investment securities" in the Statement of Operations. The tax liability incurred may differ materially depending on conditions when these investments are disposed. Any cash held by a Subsidiary is restricted as to its use and is presented as "Restricted cash" in the Statement of Assets and Liabilities, if applicable.
New Accounting Pronouncement. In June 2022, the Financial Accounting Standards Board (FASB) issued Accounting Standards Update (ASU) 2022-03 Fair Value Measurement (Topic 820): Fair Value Measurement of Equity Securities Subject to Contractual Sale Restrictions. The amendments in this ASU clarify that a contractual restriction on the sale of an equity security is not considered part of the unit of account of the equity security and, therefore, is not considered in measuring fair value. They also clarify that an entity cannot, as a separate unit of account, recognize and measure a contractual sale restriction. They also require additional disclosures for equity securities subject to contractual sale restrictions. ASU 2022-03 will be effective for fiscal years, including interim periods within those fiscal years, beginning after December 15, 2023, and allows for early adoption. ASU 2022-03 will only be applicable to an equity security in which the contractual arrangement that restricts its sale is executed or modified on or after the adoption date. Management is currently evaluating the potential impact of ASU 2022-03 to the financial statements.
4. Purchases and Sales of Investments.
Purchases and sales of securities, other than short-term securities and in-kind transactions, as applicable, are noted in the table below.
| | Purchases ($) | Sales ($) |
| Fidelity Advisor Biotechnology Fund | 605,767,850 | 697,358,197 |
| Fidelity Advisor Consumer Discretionary Fund | 94,840,517 | 107,785,197 |
| Fidelity Advisor Energy Fund | 240,672,443 | 139,963,685 |
| Fidelity Advisor Financial Services Fund | 152,294,599 | 121,611,653 |
| Fidelity Advisor Health Care Fund | 1,197,150,520 | 1,385,334,016 |
| Fidelity Advisor Industrials Fund | 309,399,070 | 279,815,995 |
| Fidelity Advisor Semiconductors Fund | 150,967,788 | 173,120,854 |
| Fidelity Advisor Technology Fund | 527,542,557 | 555,808,026 |
| Fidelity Advisor Utilities Fund | 329,685,293 | 215,617,252 |
5. Fees and Other Transactions with Affiliates.
Management Fee. Fidelity Management & Research Company LLC (the investment adviser) and its affiliates provide the Funds with investment management related services for which the Funds pay a monthly management fee. The management fee is the sum of an individual fund fee rate and an annualized group fee rate. The individual fund fee rate is applied to each Fund's average net assets. The group fee rate is based upon the monthly average net assets of a group of registered investment companies with which the investment adviser has management contracts. The group fee rate decreases as assets under management increase and increases as assets under management decrease. For the reporting period, each Fund's annualized management fee rate expressed as a percentage of each Fund's average net assets was as follows:
| | Individual Rate | Group Rate | Total |
| Fidelity Advisor Biotechnology Fund | .30% | .23% | .53% |
| Fidelity Advisor Consumer Discretionary Fund | .30% | .23% | .53% |
| Fidelity Advisor Energy Fund | .30% | .23% | .53% |
| Fidelity Advisor Financial Services Fund | .30% | .23% | .53% |
| Fidelity Advisor Health Care Fund | .30% | .23% | .53% |
| Fidelity Advisor Industrials Fund | .30% | .23% | .53% |
| Fidelity Advisor Semiconductors Fund | .30% | .23% | .53% |
| Fidelity Advisor Technology Fund | .30% | .23% | .53% |
| Fidelity Advisor Utilities Fund | .30% | .23% | .53% |
Distribution and Service Plan Fees. In accordance with Rule 12b-1 of the 1940 Act, each Fund has adopted separate Distribution and Service Plans for each class of shares. Certain classes pay Fidelity Distributors Company LLC (FDC), an affiliate of the investment adviser, separate Distribution and Service Fees, each of which is based on an annual percentage of each class' average net assets. In addition, FDC may pay financial intermediaries for selling shares of each Fund and providing shareholder support services. For the period, the Distribution and Service Fee rates, total fees and amounts retained by FDC were as follows:
| | Distribution Fee | Service Fee | Total Fees | Retained by FDC |
| Fidelity Advisor Biotechnology Fund | | | | |
Class A | - % | .25% | $813,769 | $1,088 |
Class M | .25% | .25% | 300,851 | - |
Class C | .75% | .25% | 860,423 | 37,982 |
| | | | $1,975,043 | $39,070 |
| Fidelity Advisor Consumer Discretionary Fund | | | | |
Class A | - % | .25% | $209,678 | $473 |
Class M | .25% | .25% | 78,168 | - |
Class C | .75% | .25% | 233,127 | 11,856 |
| | | | $520,973 | $12,329 |
| Fidelity Advisor Energy Fund | | | | |
Class A | - % | .25% | $495,463 | $12,484 |
Class M | .25% | .25% | 294,744 | - |
Class C | .75% | .25% | 552,988 | 127,556 |
| | | | $1,343,195 | $140,040 |
| Fidelity Advisor Financial Services Fund | | | | |
Class A | - % | .25% | $233,745 | $3,494 |
Class M | .25% | .25% | 171,480 | - |
Class C | .75% | .25% | 276,164 | 41,018 |
| | | | $681,389 | $44,512 |
| Fidelity Advisor Health Care Fund | | | | |
Class A | - % | .25% | $ 1,846,699 | $8,342 |
Class M | .25% | .25% | 810,639 | - |
Class C | .75% | .25% | 2,348,451 | 128,580 |
| | | | $5,005,789 | $136,922 |
| Fidelity Advisor Industrials Fund | | | | |
Class A | - % | .25% | $261,370 | $364 |
Class M | .25% | .25% | 121,586 | - |
Class C | .75% | .25% | 175,909 | 8,134 |
| | | | $558,865 | $8,498 |
| Fidelity Advisor Semiconductors Fund | | | | |
Class A | - % | .25% | $363,208 | $8,378 |
Class M | .25% | .25% | 109,293 | - |
Class C | .75% | .25% | 390,120 | 69,953 |
| | | | $862,621 | $78,331 |
| Fidelity Advisor Technology Fund | | | | |
Class A | - % | .25% | $ 1,651,722 | $8,621 |
Class M | .25% | .25% | 1,082,256 | - |
Class C | .75% | .25% | 1,257,133 | 88,031 |
| | | | $3,991,111 | $96,652 |
| Fidelity Advisor Utilities Fund | | | | |
Class A | - % | .25% | $416,691 | $8,264 |
Class M | .25% | .25% | 179,712 | - |
Class C | .75% | .25% | 317,764 | 56,432 |
| | | | $914,167 | $64,696 |
Sales Load. FDC may receive a front-end sales charge of up to 5.75% for selling Class A shares and 3.50% for selling Class M shares, some of which is paid to financial intermediaries for selling shares of each Fund. Depending on the holding period, FDC may receive contingent deferred sales charges levied on Class A, Class M and Class C redemptions. The deferred sales charges are 1.00% for Class C shares, 1.00% for certain purchases of Class A shares and .25% for certain purchases of Class M shares.
For the period, sales charge amounts retained by FDC were as follows:
| | Retained by FDC |
| Fidelity Advisor Biotechnology Fund | |
Class A | $42,119 |
Class M | 4,407 |
Class C A | 621 |
| | $47,147 |
| Fidelity Advisor Consumer Discretionary Fund | |
Class A | $11,824 |
Class M | 1,280 |
Class C A | 213 |
| | $13,317 |
| Fidelity Advisor Energy Fund | |
Class A | $168,990 |
Class M | 10,458 |
Class C A | 532 |
| | $179,980 |
| Fidelity Advisor Financial Services Fund | |
Class A | $19,303 |
Class M | 1,528 |
Class C A | 179 |
| | $21,010 |
| Fidelity Advisor Health Care Fund | |
Class A | $147,388 |
Class M | 12,831 |
Class C A | 899 |
| | $161,118 |
| Fidelity Advisor Industrials Fund | |
Class A | $9,643 |
Class M | 1,221 |
Class C A | 84 |
| | $10,948 |
| Fidelity Advisor Semiconductors Fund | |
Class A | $102,281 |
Class M | 2,931 |
Class C A | 1,136 |
| | $106,348 |
| Fidelity Advisor Technology Fund | |
Class A | $150,957 |
Class M | 11,993 |
Class C A | 959 |
| | $163,909 |
| Fidelity Advisor Utilities Fund | |
Class A | $154,863 |
Class M | 8,457 |
Class C A | 787 |
| | $164,107 |
A When Class C shares are initially sold, FDC pays commissions from its own resources to financial intermediaries through which the sales are made.
Transfer Agent Fees. Fidelity Investments Institutional Operations Company LLC (FIIOC), an affiliate of the investment adviser, is the transfer, dividend disbursing and shareholder servicing agent for each class of the Funds. FIIOC receives account fees and asset-based fees that vary according to the account size and type of account of the shareholders of the respective classes of each Fund, except for Class Z. FIIOC receives an asset-based fee of Class Z's average net assets. FIIOC pays for typesetting, printing and mailing of shareholder reports, except proxy statements. For the period, transfer agent fees for each class were as follows:
| | Amount | % of Class-Level Average Net Assets A |
| Fidelity Advisor Biotechnology Fund | | |
Class A | $620,994 | .19 |
Class M | 130,827 | .22 |
Class C | 169,847 | .20 |
Class I | 650,532 | .17 |
Class Z | 12,751 | .04 |
| | $1,584,951 | |
| Fidelity Advisor Consumer Discretionary Fund | | |
Class A | $160,093 | .19 |
Class M | 32,637 | .21 |
Class C | 45,862 | .20 |
Class I | 85,583 | .16 |
Class Z | 11,917 | .04 |
| | $336,092 | |
| Fidelity Advisor Energy Fund | | |
Class A | $365,563 | .18 |
Class M | 115,389 | .20 |
Class C | 99,618 | .18 |
Class I | 482,566 | .16 |
Class Z | 63,503 | .04 |
| | $1,126,639 | |
| Fidelity Advisor Financial Services Fund | | |
Class A | $181,046 | .19 |
Class M | 63,774 | .19 |
Class C | 53,120 | .19 |
Class I | 109,462 | .17 |
Class Z | 20,137 | .04 |
| | $427,539 | |
| Fidelity Advisor Health Care Fund | | |
Class A | $ 1,325,693 | .18 |
Class M | 295,327 | .18 |
Class C | 429,744 | .18 |
Class I | 2,276,463 | .17 |
Class Z | 173,063 | .04 |
| | $4,500,290 | |
| Fidelity Advisor Industrials Fund | | |
Class A | $194,434 | .19 |
Class M | 46,331 | .19 |
Class C | 34,023 | .19 |
Class I | 110,332 | .17 |
Class Z | 13,832 | .04 |
| | $398,952 | |
| Fidelity Advisor Semiconductors Fund | | |
Class A | $266,352 | .18 |
Class M | 41,900 | .19 |
Class C | 74,568 | .19 |
Class I | 227,298 | .16 |
Class Z | 8,574 | .04 |
| | $618,692 | |
| Fidelity Advisor Technology Fund | | |
Class A | $ 1,163,552 | .18 |
Class M | 369,562 | .17 |
Class C | 241,004 | .19 |
Class I | 845,817 | .16 |
Class Z | 97,208 | .04 |
| | $2,717,143 | |
| Fidelity Advisor Utilities Fund | | |
Class A | $306,639 | .18 |
Class M | 72,060 | .20 |
Class C | 60,136 | .19 |
Class I | 256,019 | .17 |
Class Z | 24,475 | .04 |
| | $719,329 | |
A Annualized
Accounting Fees. Fidelity Service Company, Inc. (FSC), an affiliate of the investment adviser, maintains each Fund's accounting records. The accounting fee is based on the level of average net assets for each month. For the period, the fees were equivalent to the following annualized rates:
| | % of Average Net Assets |
| Fidelity Advisor Biotechnology Fund | .03 |
| Fidelity Advisor Consumer Discretionary Fund | .04 |
| Fidelity Advisor Energy Fund | .03 |
| Fidelity Advisor Financial Services Fund | .03 |
| Fidelity Advisor Health Care Fund | .02 |
| Fidelity Advisor Industrials Fund | .04 |
| Fidelity Advisor Semiconductors Fund | .03 |
| Fidelity Advisor Technology Fund | .03 |
| Fidelity Advisor Utilities Fund | .03 |
Brokerage Commissions. A portion of portfolio transactions were placed with brokerage firms which are affiliates of the investment adviser. Brokerage commissions are included in net realized gain (loss) and change in net unrealized appreciation (depreciation) in the Statement of Operations. The commissions paid to these affiliated firms were as follows:
| | Amount |
| Fidelity Advisor Biotechnology Fund | $22,737 |
| Fidelity Advisor Consumer Discretionary Fund | 2,077 |
| Fidelity Advisor Energy Fund | 4,328 |
| Fidelity Advisor Financial Services Fund | 2,464 |
| Fidelity Advisor Health Care Fund | 26,904 |
| Fidelity Advisor Industrials Fund | 5,006 |
| Fidelity Advisor Semiconductors Fund | 2,379 |
| Fidelity Advisor Technology Fund | 6,837 |
| Fidelity Advisor Utilities Fund | 4,792 |
Interfund Lending Program. Pursuant to an Exemptive Order issued by the Securities and Exchange Commission (the SEC), each Fund, along with other registered investment companies having management contracts with Fidelity Management & Research Company LLC (FMR), or other affiliated entities of FMR, may participate in an interfund lending program. This program provides an alternative credit facility allowing each Fund to borrow from, or lend money to, other participating affiliated funds. At period end, there were no interfund loans outstanding. Any open loans, including accrued interest, at period end are presented as Notes payable to affiliates in the Statement of Assets and Liabilities. Activity in this program during the period for which loans were outstanding was as follows:
| | Borrower or Lender | Average Loan Balance | Weighted Average Interest Rate | Interest Expense |
| Fidelity Advisor Energy Fund | Borrower | $7,462,500 | 3.32% | $2,749 |
| Fidelity Advisor Industrials Fund | Borrower | $ 9,396,000 | 4.57% | $1,191 |
| Fidelity Advisor Utilities Fund | Borrower | $ 5,105,000 | 4.57% | $2,589 |
Interfund Trades. Funds may purchase from or sell securities to other Fidelity Funds under procedures adopted by the Board. The procedures have been designed to ensure these interfund trades are executed in accordance with Rule 17a-7 of the 1940 Act. Any interfund trades are included within the respective purchases and sales amounts shown in the Purchases and Sales of Investments note. Interfund trades during the period are noted in the table below.
| | Purchases ($) | Sales ($) | Realized Gain (Loss) ($) |
| Fidelity Advisor Biotechnology Fund | 45,849,995 | 55,223,932 | (34,186) |
| Fidelity Advisor Consumer Discretionary Fund | 5,125,234 | 3,105,882 | 138,938 |
| Fidelity Advisor Energy Fund | 19,322,235 | 8,584,392 | 1,125,724 |
| Fidelity Advisor Financial Services Fund | 5,137,662 | 11,405,182 | 187,571 |
| Fidelity Advisor Health Care Fund | 109,850,766 | 95,708,724 | 10,070,566 |
| Fidelity Advisor Industrials Fund | 10,388,588 | 8,390,431 | 246,790 |
| Fidelity Advisor Semiconductors Fund | 7,478,305 | 9,877,983 | (521,260) |
| Fidelity Advisor Technology Fund | 23,923,549 | 45,555,356 | 13,639,079 |
| Fidelity Advisor Utilities Fund | 6,316,583 | 3,783,156 | (233,282) |
| | | | |
Other. During the period, the investment adviser reimbursed the Funds for certain losses as follows:
| | Amount ($) |
| Fidelity Advisor Biotechnology Fund | 33,577 |
6. Committed Line of Credit.
Certain Funds participate with other funds managed by the investment adviser or an affiliate in a $4.25 billion credit facility (the "line of credit") to be utilized for temporary or emergency purposes to fund shareholder redemptions or for other short-term liquidity purposes. The participating funds have agreed to pay commitment fees on their pro-rata portion of the line of credit, which are reflected in Miscellaneous expenses on the Statement of Operations, and are listed below. During the period, there were no borrowings on this line of credit.
| | Amount |
| Fidelity Advisor Biotechnology Fund | $2,313 |
| Fidelity Advisor Consumer Discretionary Fund | 567 |
| Fidelity Advisor Energy Fund | 1,926 |
| Fidelity Advisor Financial Services Fund | 700 |
| Fidelity Advisor Health Care Fund | 7,679 |
| Fidelity Advisor Industrials Fund | 644 |
| Fidelity Advisor Semiconductors Fund | 1,003 |
| Fidelity Advisor Technology Fund | 4,845 |
| Fidelity Advisor Utilities Fund | 1,096 |
7. Security Lending.
Funds lend portfolio securities from time to time in order to earn additional income. Lending agents are used, including National Financial Services (NFS), an affiliate of the investment adviser. Pursuant to a securities lending agreement, NFS will receive a fee, which is capped at 9.9% of a fund's daily lending revenue, for its services as lending agent. A fund may lend securities to certain qualified borrowers, including NFS. On the settlement date of the loan, a fund receives collateral (in the form of U.S. Treasury obligations, letters of credit and/or cash) against the loaned securities and maintains collateral in an amount not less than 100% of the market value of the loaned securities during the period of the loan. The market value of the loaned securities is determined at the close of business of a fund and any additional required collateral is delivered to a fund on the next business day. A fund or borrower may terminate the loan at any time, and if the borrower defaults on its obligation to return the securities loaned because of insolvency or other reasons, a fund may apply collateral received from the borrower against the obligation. A fund may experience delays and costs in recovering the securities loaned. Any cash collateral received is invested in the Fidelity Securities Lending Cash Central Fund. Any loaned securities are identified as such in the Schedule of Investments, and the value of loaned securities and cash collateral at period end, as applicable, are presented in the Statement of Assets and Liabilities. Security lending income represents the income earned on investing cash collateral, less rebates paid to borrowers and any lending agent fees associated with the loan, plus any premium payments received for lending certain types of securities. Security lending income is presented in the Statement of Operations as a component of income from Fidelity Central Funds. Affiliated security lending activity, if any, was as follows:
| | Total Security Lending Fees Paid to NFS | Security Lending Income From Securities Loaned to NFS | Value of Securities Loaned to NFS at Period End |
| Fidelity Advisor Biotechnology Fund | $99,961 | $18,439 | $143,435 |
| Fidelity Advisor Consumer Discretionary Fund | $6,162 | $5,645 | $632,626 |
| Fidelity Advisor Energy Fund | $5,391 | $- | $- |
| Fidelity Advisor Financial Services Fund | $328 | $- | $- |
| Fidelity Advisor Health Care Fund | $34,318 | $8,938 | $26,082 |
| Fidelity Advisor Industrials Fund | $1,479 | $- | $- |
| Fidelity Advisor Semiconductors Fund | $49,914 | $14,388 | $- |
| Fidelity Advisor Technology Fund | $30,480 | $5,569 | $- |
| Fidelity Advisor Utilities Fund | $821 | $- | $- |
8. Expense Reductions.
Through arrangements with each applicable Fund's custodian and each class' transfer agent, credits realized as a result of certain uninvested cash balances were used to reduce each applicable Fund's or class' expenses. All of the applicable expense reductions are noted in the table below.
| | Custodian credits | Transfer Agent credits |
| Fidelity Advisor Biotechnology Fund | $- | $1,499 |
| Fidelity Advisor Consumer Discretionary Fund | - | 46 |
| Fidelity Advisor Energy Fund | - | 721 |
| Fidelity Advisor Financial Services Fund | - | 173 |
| Fidelity Advisor Health Care Fund | 1,116 | 827 |
| Fidelity Advisor Industrials Fund | - | 334 |
Fidelity Advisor Semiconductors Fund | 30 | 331 |
| Fidelity Advisor Technology Fund | 347 | 674 |
| Fidelity Advisor Utilities Fund | 205 | 414 |
In addition, during the period the investment adviser or an affiliate reimbursed and/or waived a portion of fund-level operating expenses as follows:
| | Fund-Level Amount |
| Fidelity Advisor Biotechnology Fund | $33,626 |
| Fidelity Advisor Consumer Discretionary Fund | 7,539 |
| Fidelity Advisor Energy Fund | 28,248 |
| Fidelity Advisor Financial Services Fund | 9,996 |
| Fidelity Advisor Health Care Fund | 109,946 |
| Fidelity Advisor Industrials Fund | 9,236 |
| Fidelity Advisor Semiconductors Fund | 13,661 |
| Fidelity Advisor Technology Fund | 65,332 |
| Fidelity Advisor Utilities Fund | 17,376 |
9. Distributions to Shareholders.
Distributions to shareholders of each class were as follows:
| | Six months ended January 31, 2023 | Year ended July 31, 2022 |
| Fidelity Advisor Biotechnology Fund | | |
| Distributions to shareholders | | |
| Class A | $- | $130,319,328 |
| Class M | - | 27,259,940 |
| Class C | - | 56,696,827 |
| Class I | - | 161,275,417 |
| Class Z | - | 13,691,301 |
Total | $- | $389,242,813 |
| Fidelity Advisor Consumer Discretionary Fund | | |
| Distributions to shareholders | | |
| Class A | $ 6,879,290 | $ 16,168,980 |
| Class M | 1,398,366 | 3,125,065 |
| Class C | 2,491,017 | 6,086,253 |
| Class I | 3,782,125 | 13,848,199 |
| Class Z | 2,612,656 | 5,612,122 |
Total | $17,163,454 | $44,840,619 |
| Fidelity Advisor Energy Fund | | |
| Distributions to shareholders | | |
| Class A | $ 8,548,484 | $ 4,229,952 |
| Class M | 2,095,293 | 1,304,332 |
| Class C | 1,833,534 | 978,471 |
| Class I | 13,584,550 | 4,763,295 |
| Class Z | 7,375,972 | 3,498,287 |
Total | $33,437,833 | $14,774,337 |
| Fidelity Advisor Financial Services Fund | | |
| Distributions to shareholders | | |
| Class A | $ 10,343,819 | $ 8,215,386 |
| Class M | 3,691,281 | 2,766,606 |
| Class C | 2,770,639 | 2,294,171 |
| Class I | 7,089,508 | 5,648,531 |
| Class Z | 6,890,192 | 2,085,902 |
Total | $30,785,439 | $21,010,596 |
| Fidelity Advisor Health Care Fund | | |
| Distributions to shareholders | | |
| Class A | $- | $ 103,562,390 |
| Class M | - | 25,573,033 |
| Class C | - | 52,054,574 |
| Class I | - | 186,427,506 |
| Class Z | - | 53,845,065 |
Total | $- | $421,462,568 |
| Fidelity Advisor Industrials Fund | | |
| Distributions to shareholders | | |
| Class A | $ 7,071,012 | $ 48,588,464 |
| Class M | 1,678,793 | 10,790,903 |
| Class C | 1,387,568 | 10,633,855 |
| Class I | 4,233,189 | 43,185,214 |
| Class Z | 3,179,380 | 8,702,749 |
Total | $17,549,942 | $121,901,185 |
| Fidelity Advisor Semiconductors Fund | | |
| Distributions to shareholders | | |
| Class A | $ 8,928,808 | $ 16,894,260 |
| Class M | 1,417,206 | 3,024,406 |
| Class C | 2,898,996 | 5,665,807 |
| Class I | 7,802,658 | 15,905,080 |
| Class Z | 1,111,011 | 2,418,893 |
Total | $22,158,679 | $43,908,446 |
| Fidelity Advisor Technology Fund | | |
| Distributions to shareholders | | |
| Class A | $ 44,657,947 | $ 228,756,732 |
| Class M | 15,873,514 | 82,459,541 |
| Class C | 11,031,237 | 60,838,976 |
| Class I | 31,149,239 | 166,955,477 |
| Class Z | 14,911,183 | 61,960,776 |
Total | $117,623,120 | $600,971,502 |
| Fidelity Advisor Utilities Fund | | |
| Distributions to shareholders | | |
| Class A | $ 13,450,986 | $ 8,686,807 |
| Class M | 2,770,809 | 1,704,212 |
| Class C | 2,380,194 | 1,133,319 |
| Class I | 12,463,344 | 5,976,790 |
| Class Z | 4,944,533 | 2,200,016 |
Total | $36,009,866 | $19,701,144 |
10. Share Transactions.
Share transactions for each class were as follows and may contain in-kind transactions, automatic conversions between classes or exchanges between affiliated funds:
| | Shares | Shares | Dollars | Dollars |
| | Six months ended January 31, 2023 | Year ended July 31, 2022 | Six months ended January 31, 2023 | Year ended July 31, 2022 |
| Fidelity Advisor Biotechnology Fund | | | | |
| Class A | | | | |
| Shares sold | 1,555,561 | 4,418,691 | $38,269,969 | $117,800,031 |
| Reinvestment of distributions | - | 4,440,754 | - | 118,923,402 |
| Shares redeemed | (2,379,019) | (6,636,216) | (58,126,576) | (173,909,401) |
| Net increase (decrease) | (823,458) | 2,223,229 | $(19,856,607) | $62,814,032 |
| Class M | | | | |
| Shares sold | 416,390 | 525,275 | $9,358,812 | $13,292,225 |
| Reinvestment of distributions | - | 1,096,046 | - | 26,962,677 |
| Shares redeemed | (576,207) | (1,501,866) | (12,982,236) | (35,974,200) |
| Net increase (decrease) | (159,817) | 119,455 | $(3,623,424) | $4,280,702 |
| Class C | | | | |
| Shares sold | 244,706 | 766,454 | $4,686,599 | $16,982,361 |
| Reinvestment of distributions | - | 2,615,104 | - | 55,231,000 |
| Shares redeemed | (1,938,245) | (5,864,679) | (37,274,942) | (124,192,429) |
| Net increase (decrease) | (1,693,539) | (2,483,121) | $(32,588,343) | $(51,979,068) |
| Class I | | | | |
| Shares sold | 2,460,591 | 6,204,658 | $65,863,168 | $172,889,033 |
| Reinvestment of distributions | - | 4,712,583 | - | 137,418,918 |
| Shares redeemed | (3,457,205) | (14,133,354) | (92,064,150) | (400,482,702) |
| Net increase (decrease) | (996,614) | (3,216,113) | $(26,200,982) | $(90,174,751) |
| Class Z | | | | |
| Shares sold | 248,781 | 880,421 | $6,692,996 | $25,302,163 |
| Reinvestment of distributions | - | 396,056 | - | 11,564,840 |
| Shares redeemed | (807,986) | (1,224,670) | (21,212,849) | (34,702,053) |
| Net increase (decrease) | (559,205) | 51,807 | $(14,519,853) | $2,164,950 |
| Fidelity Advisor Consumer Discretionary Fund | | | | |
| Class A | | | | |
| Shares sold | 331,238 | 723,542 | $10,851,389 | $30,840,312 |
| Reinvestment of distributions | 213,123 | 360,797 | 6,683,534 | 15,705,493 |
| Shares redeemed | (730,709) | (1,390,561) | (23,112,774) | (56,239,450) |
| Net increase (decrease) | (186,348) | (306,222) | $(5,577,851) | $(9,693,645) |
| Class M | | | | |
| Shares sold | 24,177 | 86,533 | $734,920 | $3,353,263 |
| Reinvestment of distributions | 48,202 | 76,937 | 1,382,434 | 3,082,116 |
| Shares redeemed | (125,322) | (213,236) | (3,594,638) | (7,704,372) |
| Net increase (decrease) | (52,943) | (49,766) | $(1,477,284) | $(1,268,993) |
| Class C | | | | |
| Shares sold | 74,929 | 194,917 | $1,910,124 | $6,446,705 |
| Reinvestment of distributions | 104,635 | 180,010 | 2,480,887 | 6,046,548 |
| Shares redeemed | (402,592) | (756,125) | (9,710,102) | (23,161,684) |
| Net increase (decrease) | (223,028) | (381,198) | $(5,319,091) | $(10,668,431) |
| Class I | | | | |
| Shares sold | 436,884 | 957,939 | $16,282,730 | $43,970,719 |
| Reinvestment of distributions | 105,097 | 261,935 | 3,632,142 | 12,486,421 |
| Shares redeemed | (953,979) | (3,334,868) | (33,129,951) | (149,620,424) |
| Net increase (decrease) | (411,998) | (2,114,994) | $(13,215,079) | $(93,163,284) |
| Class Z | | | | |
| Shares sold | 1,098,873 | 921,806 | $36,405,979 | $38,859,222 |
| Reinvestment of distributions | 73,211 | 92,881 | 2,541,170 | 4,440,626 |
| Shares redeemed | (401,001) | (1,603,367) | (13,943,074) | (72,794,398) |
| Net increase (decrease) | 771,083 | (588,680) | $25,004,075 | $(29,494,550) |
| Fidelity Advisor Energy Fund | | | | |
| Class A | | | | |
| Shares sold | 2,003,203 | 5,586,497 | $85,452,338 | $197,644,201 |
| Reinvestment of distributions | 200,786 | 154,393 | 8,284,422 | 4,035,842 |
| Shares redeemed | (1,625,068) | (4,025,817) | (67,847,289) | (132,157,901) |
| Net increase (decrease) | 578,921 | 1,715,073 | $25,889,471 | $69,522,142 |
| Class M | | | | |
| Shares sold | 256,776 | 1,108,281 | $11,179,271 | $38,124,228 |
| Reinvestment of distributions | 48,467 | 47,378 | 2,057,403 | 1,273,515 |
| Shares redeemed | (404,928) | (925,853) | (17,167,133) | (30,500,389) |
| Net increase (decrease) | (99,685) | 229,806 | $(3,930,459) | $8,897,354 |
| Class C | | | | |
| Shares sold | 434,409 | 1,487,293 | $17,001,388 | $49,538,922 |
| Reinvestment of distributions | 46,957 | 39,776 | 1,773,567 | 954,633 |
| Shares redeemed | (600,478) | (1,191,755) | (22,967,554) | (35,900,925) |
| Net increase (decrease) | (119,112) | 335,314 | $(4,192,599) | $14,592,630 |
| Class I | | | | |
| Shares sold | 4,179,142 | 11,878,651 | $188,191,989 | $442,734,533 |
| Reinvestment of distributions | 282,440 | 152,645 | 12,342,610 | 4,219,114 |
| Shares redeemed | (3,411,701) | (6,391,600) | (149,981,337) | (232,390,112) |
| Net increase (decrease) | 1,049,881 | 5,639,696 | $50,553,262 | $214,563,535 |
| Class Z | | | | |
| Shares sold | 2,741,781 | 8,049,496 | $121,836,098 | $277,617,915 |
| Reinvestment of distributions | 162,239 | 121,637 | 7,071,987 | 3,353,536 |
| Shares redeemed | (2,006,671) | (5,140,446) | (88,293,920) | (187,048,074) |
| Net increase (decrease) | 897,349 | 3,030,687 | $40,614,165 | $93,923,377 |
| Fidelity Advisor Financial Services Fund | | | | |
| Class A | | | | |
| Shares sold | 577,320 | 2,078,376 | $15,197,313 | $61,073,336 |
| Reinvestment of distributions | 408,291 | 277,980 | 9,950,057 | 7,866,833 |
| Shares redeemed | (871,112) | (1,537,466) | (22,619,452) | (43,023,094) |
| Net increase (decrease) | 114,499 | 818,890 | $2,527,918 | $25,917,075 |
| Class M | | | | |
| Shares sold | 180,795 | 1,004,137 | $4,670,486 | $29,329,128 |
| Reinvestment of distributions | 150,930 | 97,289 | 3,634,395 | 2,722,139 |
| Shares redeemed | (266,522) | (593,594) | (6,806,009) | (16,539,094) |
| Net increase (decrease) | 65,203 | 507,832 | $1,498,872 | $15,512,173 |
| Class C | | | | |
| Shares sold | 89,129 | 727,321 | $2,173,090 | $19,854,552 |
| Reinvestment of distributions | 121,519 | 86,295 | 2,753,627 | 2,279,042 |
| Shares redeemed | (395,313) | (618,443) | (9,661,291) | (16,237,901) |
| Net increase (decrease) | (184,665) | 195,173 | $(4,734,574) | $5,895,693 |
| Class I | | | | |
| Shares sold | 867,348 | 3,616,649 | $23,565,606 | $109,262,113 |
| Reinvestment of distributions | 277,356 | 187,755 | 6,989,374 | 5,484,338 |
| Shares redeemed | (1,177,985) | (3,023,204) | (31,653,474) | (87,083,084) |
| Net increase (decrease) | (33,281) | 781,200 | $(1,098,494) | $27,663,367 |
| Class Z | | | | |
| Shares sold | 2,980,012 | 2,119,564 | $78,117,742 | $63,792,422 |
| Reinvestment of distributions | 239,686 | 66,623 | 6,020,924 | 1,941,402 |
| Shares redeemed | (1,023,317) | (1,547,460) | (27,553,881) | (45,372,699) |
| Net increase (decrease) | 2,196,381 | 638,727 | $56,584,785 | $20,361,125 |
| Fidelity Advisor Health Care Fund | | | | |
| Class A | | | | |
| Shares sold | 1,847,803 | 3,747,789 | $105,922,981 | $233,179,014 |
| Reinvestment of distributions | - | 1,495,405 | - | 96,348,946 |
| Shares redeemed | (1,922,614) | (4,339,266) | (110,121,630) | (264,349,157) |
| Net increase (decrease) | (74,811) | 903,928 | $(4,198,649) | $65,178,803 |
| Class M | | | | |
| Shares sold | 177,561 | 435,333 | $9,322,910 | $25,121,427 |
| Reinvestment of distributions | - | 424,487 | - | 25,095,629 |
| Shares redeemed | (395,159) | (855,683) | (20,821,798) | (48,110,063) |
| Net increase (decrease) | (217,598) | 4,137 | $(11,498,888) | $2,106,993 |
| Class C | | | | |
| Shares sold | 430,094 | 1,035,114 | $18,389,489 | $49,790,284 |
| Reinvestment of distributions | - | 1,046,899 | - | 50,596,635 |
| Shares redeemed | (1,861,641) | (3,477,708) | (79,474,300) | (158,966,919) |
| Net increase (decrease) | (1,431,547) | (1,395,695) | $(61,084,811) | $(58,580,000) |
| Class I | | | | |
| Shares sold | 3,986,271 | 10,728,410 | $253,527,282 | $730,079,020 |
| Reinvestment of distributions | - | 2,309,604 | - | 164,674,774 |
| Shares redeemed | (5,445,046) | (14,652,690) | (346,155,197) | (969,895,308) |
| Net increase (decrease) | (1,458,775) | (1,614,676) | $(92,627,915) | $(75,141,514) |
| Class Z | | | | |
| Shares sold | 3,102,498 | 4,032,990 | $193,441,308 | $272,822,935 |
| Reinvestment of distributions | - | 589,521 | - | 42,068,205 |
| Shares redeemed | (3,117,750) | (4,279,711) | (197,200,857) | (283,294,012) |
| Net increase (decrease) | (15,252) | 342,800 | $(3,759,549) | $31,597,128 |
| Fidelity Advisor Industrials Fund | | | | |
| Class A | | | | |
| Shares sold | 199,466 | 603,316 | $6,808,354 | $23,516,059 |
| Reinvestment of distributions | 199,881 | 1,213,535 | 6,692,020 | 45,750,285 |
| Shares redeemed | (548,789) | (1,335,197) | (18,658,513) | (50,895,928) |
| Net increase (decrease) | (149,442) | 481,654 | $(5,158,139) | $18,370,416 |
| Class M | | | | |
| Shares sold | 59,456 | 174,759 | $1,955,031 | $6,661,118 |
| Reinvestment of distributions | 51,559 | 291,480 | 1,664,332 | 10,627,377 |
| Shares redeemed | (97,558) | (247,645) | (3,204,841) | (9,084,966) |
| Net increase (decrease) | 13,457 | 218,594 | $414,522 | $8,203,529 |
| Class C | | | | |
| Shares sold | 30,615 | 111,395 | $872,289 | $3,612,202 |
| Reinvestment of distributions | 49,445 | 331,819 | 1,376,542 | 10,545,204 |
| Shares redeemed | (213,777) | (548,802) | (6,072,258) | (17,779,500) |
| Net increase (decrease) | (133,717) | (105,588) | $(3,823,427) | $(3,622,094) |
| Class I | | | | |
| Shares sold | 410,481 | 1,309,576 | $15,280,806 | $56,025,544 |
| Reinvestment of distributions | 106,079 | 874,167 | 3,845,348 | 35,517,393 |
| Shares redeemed | (938,464) | (3,337,326) | (34,177,161) | (133,702,575) |
| Net increase (decrease) | (421,904) | (1,153,583) | $(15,051,007) | $(42,159,638) |
| Class Z | | | | |
| Shares sold | 2,239,818 | 414,017 | $75,612,984 | $17,587,181 |
| Reinvestment of distributions | 86,441 | 127,360 | 3,128,307 | 5,164,450 |
| Shares redeemed | (394,476) | (923,868) | (14,581,551) | (37,613,581) |
| Net increase (decrease) | 1,931,783 | (382,491) | $64,159,740 | $(14,861,950) |
| Fidelity Advisor Semiconductors Fund | | | | |
| Class A | | | | |
| Shares sold | 937,338 | 2,860,692 | $36,937,529 | $141,379,185 |
| Reinvestment of distributions | 219,674 | 305,160 | 8,824,286 | 16,570,155 |
| Shares redeemed | (786,936) | (1,755,975) | (29,896,756) | (81,055,946) |
| Net increase (decrease) | 370,076 | 1,409,877 | $15,865,059 | $76,893,394 |
| Class M | | | | |
| Shares sold | 171,842 | 274,328 | $6,576,710 | $13,314,173 |
| Reinvestment of distributions | 37,061 | 58,420 | 1,398,675 | 2,991,086 |
| Shares redeemed | (84,436) | (272,402) | (2,976,671) | (12,460,105) |
| Net increase (decrease) | 124,467 | 60,346 | $4,998,714 | $3,845,154 |
| Class C | | | | |
| Shares sold | 218,422 | 848,794 | $7,168,804 | $34,916,166 |
| Reinvestment of distributions | 88,413 | 126,023 | 2,894,656 | 5,653,413 |
| Shares redeemed | (368,271) | (694,995) | (11,547,093) | (26,741,267) |
| Net increase (decrease) | (61,436) | 279,822 | $(1,483,633) | $13,828,312 |
| Class I | | | | |
| Shares sold | 1,130,643 | 4,659,880 | $47,867,875 | $244,049,201 |
| Reinvestment of distributions | 177,505 | 250,734 | 7,666,452 | 14,570,164 |
| Shares redeemed | (1,702,887) | (3,378,308) | (69,321,509) | (169,937,377) |
| Net increase (decrease) | (394,739) | 1,532,306 | $(13,787,182) | $88,681,988 |
| Class Z | | | | |
| Shares sold | 133,708 | 955,357 | $5,443,302 | $50,804,090 |
| Reinvestment of distributions | 20,319 | 35,604 | 877,292 | 2,067,182 |
| Shares redeemed | (250,330) | (494,861) | (10,110,316) | (24,155,858) |
| Net increase (decrease) | (96,303) | 496,100 | $(3,789,722) | $28,715,414 |
| Fidelity Advisor Technology Fund | | | | |
| Class A | | | | |
| Shares sold | 1,151,193 | 2,519,136 | $78,093,205 | $232,706,169 |
| Reinvestment of distributions | 628,818 | 2,240,274 | 42,659,028 | 218,314,727 |
| Shares redeemed | (1,550,470) | (3,342,272) | (103,626,782) | (298,760,229) |
| Net increase (decrease) | 229,541 | 1,417,138 | $17,125,451 | $152,260,667 |
| Class M | | | | |
| Shares sold | 267,891 | 697,044 | $16,875,526 | $59,786,363 |
| Reinvestment of distributions | 252,456 | 907,716 | 15,667,386 | 81,358,575 |
| Shares redeemed | (488,456) | (1,175,809) | (30,269,340) | (96,678,322) |
| Net increase (decrease) | 31,891 | 428,951 | $2,273,572 | $44,466,616 |
| Class C | | | | |
| Shares sold | 234,842 | 583,339 | $12,049,774 | $41,708,463 |
| Reinvestment of distributions | 213,030 | 804,256 | 10,843,236 | 59,884,931 |
| Shares redeemed | (702,777) | (1,436,860) | (35,471,575) | (98,189,544) |
| Net increase (decrease) | (254,905) | (49,265) | $(12,578,565) | $3,403,850 |
| Class I | | | | |
| Shares sold | 2,069,911 | 3,867,129 | $157,663,262 | $384,870,571 |
| Reinvestment of distributions | 387,393 | 1,447,115 | 29,507,702 | 157,373,714 |
| Shares redeemed | (1,975,873) | (4,936,086) | (149,567,621) | (483,932,095) |
| Net increase (decrease) | 481,431 | 378,158 | $37,603,343 | $58,312,190 |
| Class Z | | | | |
| Shares sold | 1,914,043 | 2,088,418 | $139,112,498 | $199,301,687 |
| Reinvestment of distributions | 169,093 | 520,545 | 12,873,087 | 56,520,804 |
| Shares redeemed | (996,573) | (1,767,962) | (75,523,970) | (176,311,632) |
| Net increase (decrease) | 1,086,563 | 841,001 | $76,461,615 | $79,510,859 |
| Fidelity Advisor Utilities Fund | | | | |
| Class A | | | | |
| Shares sold | 1,620,632 | 2,038,098 | $62,444,633 | $76,451,481 |
| Reinvestment of distributions | 350,346 | 227,863 | 13,101,448 | 8,404,572 |
| Shares redeemed | (808,707) | (1,522,462) | (30,839,158) | (55,946,312) |
| Net increase (decrease) | 1,162,271 | 743,499 | $44,706,923 | $28,909,741 |
| Class M | | | | |
| Shares sold | 195,928 | 280,727 | $7,610,215 | $10,659,633 |
| Reinvestment of distributions | 72,367 | 45,465 | 2,716,197 | 1,678,440 |
| Shares redeemed | (147,163) | (204,995) | (5,616,686) | (7,562,685) |
| Net increase (decrease) | 121,132 | 121,197 | $4,709,726 | $4,775,388 |
| Class C | | | | |
| Shares sold | 401,407 | 455,467 | $15,172,257 | $16,708,391 |
| Reinvestment of distributions | 64,901 | 31,528 | 2,371,380 | 1,129,916 |
| Shares redeemed | (242,162) | (377,473) | (8,980,294) | (13,548,566) |
| Net increase (decrease) | 224,146 | 109,522 | $8,563,343 | $4,289,741 |
| Class I | | | | |
| Shares sold | 3,512,961 | 4,333,877 | $139,667,315 | $167,495,499 |
| Reinvestment of distributions | 318,170 | 154,482 | 12,185,006 | 5,854,917 |
| Shares redeemed | (2,026,354) | (1,916,822) | (78,469,224) | (71,914,451) |
| Net increase (decrease) | 1,804,777 | 2,571,537 | $73,383,097 | $101,435,965 |
| Class Z | | | | |
| Shares sold | 1,275,147 | 2,215,889 | $49,759,477 | $87,714,810 |
| Reinvestment of distributions | 113,957 | 46,255 | 4,361,291 | 1,754,820 |
| Shares redeemed | (1,391,640) | (1,195,749) | (54,114,415) | (44,084,084) |
| Net increase (decrease) | (2,536) | 1,066,395 | $6,353 | $45,385,546 |
11. Other.
A fund's organizational documents provide former and current trustees and officers with a limited indemnification against liabilities arising in connection with the performance of their duties to the fund. In the normal course of business, a fund may also enter into contracts that provide general indemnifications. A fund's maximum exposure under these arrangements is unknown as this would be dependent on future claims that may be made against a fund. The risk of material loss from such claims is considered remote.
12. Risk and Uncertainties.
Many factors affect a fund's performance. Developments that disrupt global economies and financial markets, such as pandemics, epidemics, outbreaks of infectious diseases, war, terrorism, and environmental disasters, may significantly affect a fund's investment performance. The effects of these developments to a fund will be impacted by the types of securities in which a fund invests, the financial condition, industry, economic sector, and geographic location of an issuer, and a fund's level of investment in the securities of that issuer.
As a shareholder, you incur two types of costs: (1) transaction costs, which may include sales charges (loads) on purchase payments or redemption proceeds, as applicable and (2) ongoing costs, which generally include management fees, distribution and/or service (12b-1) fees and other Fund expenses. This Example is intended to help you understand your ongoing costs (in dollars) of investing in a fund and to compare these costs with the ongoing costs of investing in other mutual funds.
| The Example is based on an investment of $1,000 invested at the beginning of the period and held for the entire period (August 1, 2022 to January 31, 2023). |
Actual Expenses
The first line of the accompanying table provides information about actual account values and actual expenses. You may use the information in this line, together with the amount you invested, to estimate the expenses that you paid over the period. Simply divide your account value by $1,000.00 (for example, an $8,600 account value divided by $1,000.00 = 8.6), then multiply the result by the number in the first line for a class/Fund under the heading entitled "Expenses Paid During Period" to estimate the expenses you paid on your account during this period. If any fund is a shareholder of any underlying mutual funds or exchange-traded funds (ETFs) (the Underlying Funds), such fund indirectly bears its proportional share of the expenses of the Underlying Funds in addition to the direct expenses incurred presented in the table. These fees and expenses are not included in the annualized expense ratio used to calculate the expense estimate in the table below.
Hypothetical Example for Comparison Purposes
The second line of the accompanying table provides information about hypothetical account values and hypothetical expenses based on the actual expense ratio and an assumed rate of return of 5% per year before expenses, which is not the actual return. The hypothetical account values and expenses may not be used to estimate the actual ending account balance or expenses you paid for the period. You may use this information to compare the ongoing costs of investing in the Fund and other funds. To do so, compare this 5% hypothetical example with the 5% hypothetical examples that appear in the shareholder reports of the other funds. If any fund is a shareholder of any Underlying Funds, such fund indirectly bears its proportional share of the expenses of the Underlying Funds in addition to the direct expenses as presented in the table. These fees and expenses are not included in the annualized expense ratio used to calculate the expense estimate in the table below.
Please note that the expenses shown in the table are meant to highlight your ongoing costs only and do not reflect any transaction costs. Therefore, the second line of the table is useful in comparing ongoing costs only, and will not help you determine the relative total costs of owning different funds. In addition, if these transactional costs were included, your costs would have been higher.
| | | | | Annualized Expense Ratio- A | | Beginning Account Value August 1, 2022 | | Ending Account Value January 31, 2023 | | Expenses Paid During Period- C August 1, 2022 to January 31, 2023 |
| Fidelity Advisor® Biotechnology Fund | | | | | | | | | | |
| Class A | | | | 1.01% | | | | | | |
| Actual | | | | | | $ 1,000 | | $ 1,149.50 | | $ 5.47 |
Hypothetical- B | | | | | | $ 1,000 | | $ 1,020.11 | | $ 5.14 |
| Class M | | | | 1.29% | | | | | | |
| Actual | | | | | | $ 1,000 | | $ 1,147.70 | | $ 6.98 |
Hypothetical- B | | | | | | $ 1,000 | | $ 1,018.70 | | $ 6.56 |
| Class C | | | | 1.76% | | | | | | |
| Actual | | | | | | $ 1,000 | | $ 1,145.30 | | $ 9.52 |
Hypothetical- B | | | | | | $ 1,000 | | $ 1,016.33 | | $ 8.94 |
| Class I | | | | .74% | | | | | | |
| Actual | | | | | | $ 1,000 | | $ 1,150.90 | | $ 4.01 |
Hypothetical- B | | | | | | $ 1,000 | | $ 1,021.48 | | $ 3.77 |
| Class Z | | | | .61% | | | | | | |
| Actual | | | | | | $ 1,000 | | $ 1,151.80 | | $ 3.31 |
Hypothetical- B | | | | | | $ 1,000 | | $ 1,022.13 | | $ 3.11 |
| Fidelity Advisor® Consumer Discretionary Fund | | | | | | | | | | |
| Class A | | | | 1.05% | | | | | | |
| Actual | | | | | | $ 1,000 | | $ 975.30 | | $ 5.23 |
Hypothetical- B | | | | | | $ 1,000 | | $ 1,019.91 | | $ 5.35 |
| Class M | | | | 1.32% | | | | | | |
| Actual | | | | | | $ 1,000 | | $ 974.30 | | $ 6.57 |
Hypothetical- B | | | | | | $ 1,000 | | $ 1,018.55 | | $ 6.72 |
| Class C | | | | 1.81% | | | | | | |
| Actual | | | | | | $ 1,000 | | $ 971.80 | | $ 9.00 |
Hypothetical- B | | | | | | $ 1,000 | | $ 1,016.08 | | $ 9.20 |
| Class I | | | | .78% | | | | | | |
| Actual | | | | | | $ 1,000 | | $ 976.70 | | $ 3.89 |
Hypothetical- B | | | | | | $ 1,000 | | $ 1,021.27 | | $ 3.97 |
| Class Z | | | | .65% | | | | | | |
| Actual | | | | | | $ 1,000 | | $ 977.30 | | $ 3.24 |
Hypothetical- B | | | | | | $ 1,000 | | $ 1,021.93 | | $ 3.31 |
| Fidelity Advisor® Energy Fund | | | | | | | | | | |
| Class A | | | | 1.01% | | | | | | |
| Actual | | | | | | $ 1,000 | | $ 1,164.10 | | $ 5.51 |
Hypothetical- B | | | | | | $ 1,000 | | $ 1,020.11 | | $ 5.14 |
| Class M | | | | 1.27% | | | | | | |
| Actual | | | | | | $ 1,000 | | $ 1,162.40 | | $ 6.92 |
Hypothetical- B | | | | | | $ 1,000 | | $ 1,018.80 | | $ 6.46 |
| Class C | | | | 1.76% | | | | | | |
| Actual | | | | | | $ 1,000 | | $ 1,159.90 | | $ 9.58 |
Hypothetical- B | | | | | | $ 1,000 | | $ 1,016.33 | | $ 8.94 |
| Class I | | | | .74% | | | | | | |
| Actual | | | | | | $ 1,000 | | $ 1,165.70 | | $ 4.04 |
Hypothetical- B | | | | | | $ 1,000 | | $ 1,021.48 | | $ 3.77 |
| Class Z | | | | .62% | | | | | | |
| Actual | | | | | | $ 1,000 | | $ 1,166.40 | | $ 3.39 |
Hypothetical- B | | | | | | $ 1,000 | | $ 1,022.08 | | $ 3.16 |
| Fidelity Advisor® Financial Services Fund | | | | | | | | | | |
| Class A | | | | 1.04% | | | | | | |
| Actual | | | | | | $ 1,000 | | $ 1,099.30 | | $ 5.50 |
Hypothetical- B | | | | | | $ 1,000 | | $ 1,019.96 | | $ 5.30 |
| Class M | | | | 1.29% | | | | | | |
| Actual | | | | | | $ 1,000 | | $ 1,097.90 | | $ 6.82 |
Hypothetical- B | | | | | | $ 1,000 | | $ 1,018.70 | | $ 6.56 |
| Class C | | | | 1.79% | | | | | | |
| Actual | | | | | | $ 1,000 | | $ 1,095.20 | | $ 9.45 |
Hypothetical- B | | | | | | $ 1,000 | | $ 1,016.18 | | $ 9.10 |
| Class I | | | | .77% | | | | | | |
| Actual | | | | | | $ 1,000 | | $ 1,100.90 | | $ 4.08 |
Hypothetical- B | | | | | | $ 1,000 | | $ 1,021.32 | | $ 3.92 |
| Class Z | | | | .64% | | | | | | |
| Actual | | | | | | $ 1,000 | | $ 1,101.40 | | $ 3.39 |
Hypothetical- B | | | | | | $ 1,000 | | $ 1,021.98 | | $ 3.26 |
| Fidelity Advisor® Health Care Fund | | | | | | | | | | |
| Class A | | | | .98% | | | | | | |
| Actual | | | | | | $ 1,000 | | $ 1,029.30 | | $ 5.01 |
Hypothetical- B | | | | | | $ 1,000 | | $ 1,020.27 | | $ 4.99 |
| Class M | | | | 1.23% | | | | | | |
| Actual | | | | | | $ 1,000 | | $ 1,028.10 | | $ 6.29 |
Hypothetical- B | | | | | | $ 1,000 | | $ 1,019.00 | | $ 6.26 |
| Class C | | | | 1.73% | | | | | | |
| Actual | | | | | | $ 1,000 | | $ 1,025.60 | | $ 8.83 |
Hypothetical- B | | | | | | $ 1,000 | | $ 1,016.48 | | $ 8.79 |
| Class I | | | | .72% | | | | | | |
| Actual | | | | | | $ 1,000 | | $ 1,030.90 | | $ 3.69 |
Hypothetical- B | | | | | | $ 1,000 | | $ 1,021.58 | | $ 3.67 |
| Class Z | | | | .59% | | | | | | |
| Actual | | | | | | $ 1,000 | | $ 1,031.40 | | $ 3.02 |
Hypothetical- B | | | | | | $ 1,000 | | $ 1,022.23 | | $ 3.01 |
| Fidelity Advisor® Industrials Fund | | | | | | | | | | |
| Class A | | | | 1.04% | | | | | | |
| Actual | | | | | | $ 1,000 | | $ 1,082.10 | | $ 5.46 |
Hypothetical- B | | | | | | $ 1,000 | | $ 1,019.96 | | $ 5.30 |
| Class M | | | | 1.30% | | | | | | |
| Actual | | | | | | $ 1,000 | | $ 1,080.80 | | $ 6.82 |
Hypothetical- B | | | | | | $ 1,000 | | $ 1,018.65 | | $ 6.61 |
| Class C | | | | 1.80% | | | | | | |
| Actual | | | | | | $ 1,000 | | $ 1,078.00 | | $ 9.43 |
Hypothetical- B | | | | | | $ 1,000 | | $ 1,016.13 | | $ 9.15 |
| Class I | | | | .77% | | | | | | |
| Actual | | | | | | $ 1,000 | | $ 1,083.60 | | $ 4.04 |
Hypothetical- B | | | | | | $ 1,000 | | $ 1,021.32 | | $ 3.92 |
| Class Z | | | | .65% | | | | | | |
| Actual | | | | | | $ 1,000 | | $ 1,084.10 | | $ 3.41 |
Hypothetical- B | | | | | | $ 1,000 | | $ 1,021.93 | | $ 3.31 |
| Fidelity Advisor® Semiconductors Fund | | | | | | | | | | |
| Class A | | | | 1.02% | | | | | | |
| Actual | | | | | | $ 1,000 | | $ 1,034.60 | | $ 5.23 |
Hypothetical- B | | | | | | $ 1,000 | | $ 1,020.06 | | $ 5.19 |
| Class M | | | | 1.28% | | | | | | |
| Actual | | | | | | $ 1,000 | | $ 1,033.20 | | $ 6.56 |
Hypothetical- B | | | | | | $ 1,000 | | $ 1,018.75 | | $ 6.51 |
| Class C | | | | 1.78% | | | | | | |
| Actual | | | | | | $ 1,000 | | $ 1,030.60 | | $ 9.11 |
Hypothetical- B | | | | | | $ 1,000 | | $ 1,016.23 | | $ 9.05 |
| Class I | | | | .75% | | | | | | |
| Actual | | | | | | $ 1,000 | | $ 1,036.00 | | $ 3.85 |
Hypothetical- B | | | | | | $ 1,000 | | $ 1,021.42 | | $ 3.82 |
| Class Z | | | | .63% | | | | | | |
| Actual | | | | | | $ 1,000 | | $ 1,036.40 | | $ 3.23 |
Hypothetical- B | | | | | | $ 1,000 | | $ 1,022.03 | | $ 3.21 |
| Fidelity Advisor® Technology Fund | | | | | | | | | | |
| Class A | | | | .98% | | | | | | |
| Actual | | | | | | $ 1,000 | | $ 958.10 | | $ 4.84 |
Hypothetical- B | | | | | | $ 1,000 | | $ 1,020.27 | | $ 4.99 |
| Class M | | | | 1.23% | | | | | | |
| Actual | | | | | | $ 1,000 | | $ 957.10 | | $ 6.07 |
Hypothetical- B | | | | | | $ 1,000 | | $ 1,019.00 | | $ 6.26 |
| Class C | | | | 1.75% | | | | | | |
| Actual | | | | | | $ 1,000 | | $ 954.50 | | $ 8.62 |
Hypothetical- B | | | | | | $ 1,000 | | $ 1,016.38 | | $ 8.89 |
| Class I | | | | .72% | | | | | | |
| Actual | | | | | | $ 1,000 | | $ 959.40 | | $ 3.56 |
Hypothetical- B | | | | | | $ 1,000 | | $ 1,021.58 | | $ 3.67 |
| Class Z | | | | .60% | | | | | | |
| Actual | | | | | | $ 1,000 | | $ 960.00 | | $ 2.96 |
Hypothetical- B | | | | | | $ 1,000 | | $ 1,022.18 | | $ 3.06 |
| Fidelity Advisor® Utilities Fund | | | | | | | | | | |
| Class A | | | | 1.02% | | | | | | |
| Actual | | | | | | $ 1,000 | | $ 969.50 | | $ 5.06 |
Hypothetical- B | | | | | | $ 1,000 | | $ 1,020.06 | | $ 5.19 |
| Class M | | | | 1.28% | | | | | | |
| Actual | | | | | | $ 1,000 | | $ 968.20 | | $ 6.35 |
Hypothetical- B | | | | | | $ 1,000 | | $ 1,018.75 | | $ 6.51 |
| Class C | | | | 1.77% | | | | | | |
| Actual | | | | | | $ 1,000 | | $ 965.80 | | $ 8.77 |
Hypothetical- B | | | | | | $ 1,000 | | $ 1,016.28 | | $ 9.00 |
| Class I | | | | .75% | | | | | | |
| Actual | | | | | | $ 1,000 | | $ 970.50 | | $ 3.73 |
Hypothetical- B | | | | | | $ 1,000 | | $ 1,021.42 | | $ 3.82 |
| Class Z | | | | .62% | | | | | | |
| Actual | | | | | | $ 1,000 | | $ 971.20 | | $ 3.08 |
Hypothetical- B | | | | | | $ 1,000 | | $ 1,022.08 | | $ 3.16 |
| |
A Annualized expense ratio reflects expenses net of applicable fee waivers.
B 5% return per year before expenses
C Expenses are equal to the annualized expense ratio, multiplied by the average account value over the period, multiplied by 184/ 365 (to reflect the one-half year period). The fees and expenses of any Underlying Funds are not included in each annualized expense ratio.
The Securities and Exchange Commission adopted Rule 22e-4 under the Investment Company Act of 1940 (the Liquidity Rule) to promote effective liquidity risk management throughout the open-end investment company industry, thereby reducing the risk that funds will be unable to meet their redemption obligations and mitigating dilution of the interests of fund shareholders.
The Funds have adopted and implemented a liquidity risk management program (the Program) reasonably designed to assess and manage each Fund's liquidity risk and to comply with the requirements of the Liquidity Rule. Each Fund's Board of Trustees (the Board) has designated each Fund's investment adviser as administrator of the Program. The Fidelity advisers have established a Liquidity Risk Management Committee (the LRM Committee) to manage the Program for each of the Fidelity Funds. The LRM Committee monitors the adequacy and effectiveness of implementation of the Program and on a periodic basis assesses each Fund's liquidity risk based on a variety of factors including (1) the Fund's investment strategy, (2) portfolio liquidity and cash flow projections during normal and reasonably foreseeable stressed conditions, (3) shareholder redemptions, (4) borrowings and other funding sources and (5) certain factor specific to ETFs including the effect of the Fund's prices and spreads, market participants, and basket compositions on the overall liquidity of the Fund's portfolio, as applicable.
In accordance with the Program, each of the Fund's portfolio investments is classified into one of four defined liquidity categories based on a determination of a reasonable expectation for how long it would take to convert the investment to cash (or sell or dispose of the investment) without significantly changing its market value.
- Highly liquid investments - cash or convertible to cash within three business days or less
- Moderately liquid investments - convertible to cash in three to seven calendar days
- Less liquid investments - can be sold or disposed of, but not settled, within seven calendar days
- Illiquid investments - cannot be sold or disposed of within seven calendar days
Liquidity classification determinations take into account a variety of factors including various market, trading and investment-specific considerations, as well as market depth, and generally utilize analysis from a third-party liquidity metrics service.
The Liquidity Rule places a 15% limit on a fund's illiquid investments and requires funds that do not primarily hold assets that are highly liquid investments to determine and maintain a minimum percentage of the fund's net assets to be invested in highly liquid investments (highly liquid investment minimum or HLIM). The Program includes provisions reasonably designed to comply with the 15% limit on illiquid investments and for determining, periodically reviewing and complying with the HLIM requirement as applicable.
At a recent meeting of the Fund's Board of Trustees, the LRM Committee provided a written report to the Board pertaining to the operation, adequacy, and effectiveness of the Program for the period December 1, 2021 through November 30, 2022. The report concluded that the Program is operating effectively and is reasonably designed to assess and manage the Fund's liquidity risk.
1.700839.126
AFOC-SANN-0423
Fidelity Advisor® Real Estate Fund
Semi-Annual Report
January 31, 2023
Contents
To view a fund's proxy voting guidelines and proxy voting record for the 12-month period ended June 30, visit http://www.fidelity.com/proxyvotingresults or visit the Securities and Exchange Commission's (SEC) web site at http://www.sec.gov.
You may also call 1-877-208-0098 to request a free copy of the proxy voting guidelines.
Standard & Poor's, S&P and S&P 500 are registered service marks of The McGraw-Hill Companies, Inc. and have been licensed for use by Fidelity Distributors Corporation.
Other third-party marks appearing herein are the property of their respective owners.
All other marks appearing herein are registered or unregistered trademarks or service marks of FMR LLC or an affiliated company. © 2023 FMR LLC. All rights reserved.
This report and the financial statements contained herein are submitted for the general information of the shareholders of the Fund. This report is not authorized for distribution to prospective investors in the Fund unless preceded or accompanied by an effective prospectus.
A fund files its complete schedule of portfolio holdings with the SEC for the first and third quarters of each fiscal year on Form N-PORT. Forms N-PORT are available on the SEC's web site at http://www.sec.gov. A fund's Forms N-PORT may be reviewed and copied at the SEC's Public Reference Room in Washington, DC. Information regarding the operation of the SEC's Public Reference Room may be obtained by calling 1-800-SEC-0330.
For a complete list of a fund's portfolio holdings, view the most recent holdings listing, semiannual report, or annual report on Fidelity's web site at http://www.fidelity.com, http://www.institutional.fidelity.com, or http://www.401k.com, as applicable.
NOT FDIC INSURED •MAY LOSE VALUE •NO BANK GUARANTEE
Neither the Fund nor Fidelity Distributors Corporation is a bank.
Top Holdings (% of Fund's net assets) |
| |
| Prologis (REIT), Inc. | 10.9 | |
| Crown Castle International Corp. | 9.2 | |
| Equinix, Inc. | 7.7 | |
| American Tower Corp. | 7.2 | |
| CubeSmart | 7.2 | |
| Ventas, Inc. | 5.5 | |
| CBRE Group, Inc. | 4.8 | |
| Mid-America Apartment Communities, Inc. | 4.7 | |
| Equity Lifestyle Properties, Inc. | 3.7 | |
| Essex Property Trust, Inc. | 3.6 | |
| | 64.5 | |
| |
| Top Five REIT Sectors (% of Fund's net assets) |
| |
| REITs - Diversified | 21.7 | |
| REITs - Warehouse/Industrial | 14.3 | |
| REITs - Apartments | 13.3 | |
| REITs - Health Care | 8.7 | |
| REITs - Storage | 8.5 | |
| |
Asset Allocation (% of Fund's net assets) |
|
|
Showing Percentage of Net Assets
| Common Stocks - 98.7% |
| | | Shares | Value ($) |
| Commercial Services & Supplies - 0.8% | | | |
| REITs - Diversified - 0.8% | | | |
| CoreCivic, Inc. (a) | | 101,653 | 1,081,588 |
| The GEO Group, Inc. (a) | | 109,600 | 1,260,400 |
| | | | 2,341,988 |
| Equity Real Estate Investment Trusts (REITs) - 92.0% | | | |
| REITs - Apartments - 13.3% | | | |
| Essex Property Trust, Inc. | | 46,547 | 10,522,880 |
| Invitation Homes, Inc. | | 279,400 | 9,080,500 |
| Mid-America Apartment Communities, Inc. | | 82,100 | 13,687,712 |
| UDR, Inc. | | 132,100 | 5,626,139 |
| | | | 38,917,231 |
| REITs - Diversified - 20.9% | | | |
| Crown Castle International Corp. | | 180,700 | 26,763,477 |
| Equinix, Inc. | | 30,700 | 22,660,591 |
| Lamar Advertising Co. Class A | | 77,300 | 8,235,542 |
| VICI Properties, Inc. | | 98,900 | 3,380,402 |
| | | | 61,040,012 |
| REITs - Health Care - 8.7% | | | |
| Ventas, Inc. | | 309,405 | 16,030,273 |
| Welltower, Inc. | | 126,600 | 9,500,064 |
| | | | 25,530,337 |
| REITs - Hotels - 3.3% | | | |
| Host Hotels & Resorts, Inc. | | 136,300 | 2,569,255 |
| Ryman Hospitality Properties, Inc. | | 77,800 | 7,226,842 |
| | | | 9,796,097 |
| REITs - Management/Investment - 7.2% | | | |
| American Tower Corp. | | 94,600 | 21,132,694 |
| REITs - Manufactured Homes - 3.7% | | | |
| Equity Lifestyle Properties, Inc. | | 149,806 | 10,753,075 |
| REITs - Office Property - 3.0% | | | |
| Alexandria Real Estate Equities, Inc. | | 55,600 | 8,937,144 |
| REITs - Shopping Centers - 4.4% | | | |
| Phillips Edison & Co., Inc. (b) | | 72,700 | 2,436,904 |
| SITE Centers Corp. | | 424,700 | 5,797,155 |
| Urban Edge Properties | | 303,500 | 4,780,125 |
| | | | 13,014,184 |
| REITs - Single Tenant - 4.7% | | | |
| Four Corners Property Trust, Inc. | | 300,600 | 8,645,256 |
| Spirit Realty Capital, Inc. | | 118,100 | 5,182,228 |
| | | | 13,827,484 |
| REITs - Storage - 8.5% | | | |
| CubeSmart | | 458,600 | 20,999,294 |
| Public Storage | | 12,400 | 3,773,816 |
| | | | 24,773,110 |
| REITs - Warehouse/Industrial - 14.3% | | | |
| EastGroup Properties, Inc. | | 33,200 | 5,585,900 |
| Prologis (REIT), Inc. | | 246,516 | 31,869,588 |
| Terreno Realty Corp. | | 66,600 | 4,291,038 |
| | | | 41,746,526 |
TOTAL EQUITY REAL ESTATE INVESTMENT TRUSTS (REITS) | | | 269,467,894 |
| IT Services - 0.7% | | | |
| Internet Services & Infrastructure - 0.7% | | | |
| Cyxtera Technologies, Inc. Class A (a) | | 612,625 | 1,972,653 |
| Real Estate Management & Development - 5.2% | | | |
| Real Estate Operating Companies - 0.4% | | | |
| WeWork, Inc. (a)(b) | | 716,600 | 1,139,394 |
| Real Estate Services - 4.8% | | | |
| CBRE Group, Inc. (a) | | 164,100 | 14,032,191 |
TOTAL REAL ESTATE MANAGEMENT & DEVELOPMENT | | | 15,171,585 |
| TOTAL COMMON STOCKS (Cost $226,950,466) | | | 288,954,120 |
| | | | |
| Money Market Funds - 1.7% |
| | | Shares | Value ($) |
| Fidelity Cash Central Fund 4.38% (c) | | 4,183,283 | 4,184,119 |
| Fidelity Securities Lending Cash Central Fund 4.38% (c)(d) | | 621,204 | 621,266 |
| TOTAL MONEY MARKET FUNDS (Cost $4,805,385) | | | 4,805,385 |
| | | | |
| TOTAL INVESTMENT IN SECURITIES - 100.4% (Cost $231,755,851) | 293,759,505 |
NET OTHER ASSETS (LIABILITIES) - (0.4)% | (1,064,272) |
| NET ASSETS - 100.0% | 292,695,233 |
| | |
Legend
| (b) | Security or a portion of the security is on loan at period end. |
| (c) | Affiliated fund that is generally available only to investment companies and other accounts managed by Fidelity Investments. The rate quoted is the annualized seven-day yield of the fund at period end. A complete unaudited listing of the fund's holdings as of its most recent quarter end is available upon request. In addition, each Fidelity Central Fund's financial statements are available on the SEC's website or upon request. |
| (d) | Investment made with cash collateral received from securities on loan. |
Affiliated Central Funds
Fiscal year to date information regarding the Fund's investments in Fidelity Central Funds, including the ownership percentage, is presented below.
| Affiliate | Value, beginning of period ($) | Purchases ($) | Sales Proceeds ($) | Dividend Income ($) | Realized Gain (loss) ($) | Change in Unrealized appreciation (depreciation) ($) | Value, end of period ($) | % ownership, end of period |
| Fidelity Cash Central Fund 4.38% | 1,565,719 | 41,348,478 | 38,730,078 | 50,792 | - | - | 4,184,119 | 0.0% |
| Fidelity Securities Lending Cash Central Fund 4.38% | 5,187,000 | 13,108,294 | 17,674,028 | 42,481 | - | - | 621,266 | 0.0% |
| Total | 6,752,719 | 54,456,772 | 56,404,106 | 93,273 | - | - | 4,805,385 | |
| | | | | | | | | |
Amounts in the dividend income column in the above table include any capital gain distributions from underlying funds, which are presented in the corresponding line item in the Statement of Operations, if applicable.
Amount for Fidelity Securities Lending Cash Central Fund represents the income earned on investing cash collateral, less rebates paid to borrowers and any lending agent fees associated with the loan, plus any premium payments received for lending certain types of securities.
Amounts included in the purchases and sales proceeds columns may include in-kind transactions, if applicable.
Investment Valuation
The following is a summary of the inputs used, as of January 31, 2023, involving the Fund's assets and liabilities carried at fair value. The inputs or methodology used for valuing securities may not be an indication of the risk associated with investing in those securities. For more information on valuation inputs, and their aggregation into the levels used below, please refer to the Investment Valuation section in the accompanying Notes to Financial Statements.
| Valuation Inputs at Reporting Date: |
| Description | Total ($) | Level 1 ($) | Level 2 ($) | Level 3 ($) |
Investments in Securities: | | | | |
|
| Common Stocks | 288,954,120 | 288,954,120 | - | - |
|
| Money Market Funds | 4,805,385 | 4,805,385 | - | - |
| Total Investments in Securities: | 293,759,505 | 293,759,505 | - | - |
| Statement of Assets and Liabilities |
| | | | January 31, 2023 (Unaudited) |
| | | | | |
| Assets | | | | |
| Investment in securities, at value (including securities loaned of $567,856) - See accompanying schedule: | | | | |
Unaffiliated issuers (cost $226,950,466) | $ | 288,954,120 | | |
Fidelity Central Funds (cost $4,805,385) | | 4,805,385 | | |
| | | | | |
| | | | | |
| Total Investment in Securities (cost $231,755,851) | | | $ | 293,759,505 |
| Receivable for investments sold | | | | 126,427 |
| Receivable for fund shares sold | | | | 39,238 |
| Dividends receivable | | | | 158,189 |
| Distributions receivable from Fidelity Central Funds | | | | 14,886 |
| Prepaid expenses | | | | 2,130 |
| Other receivables | | | | 78,543 |
Total assets | | | | 294,178,918 |
| Liabilities | | | | |
| Payable for investments purchased | $ | 132,920 | | |
| Payable for fund shares redeemed | | 371,572 | | |
| Accrued management fee | | 123,246 | | |
| Distribution and service plan fees payable | | 64,197 | | |
| Other affiliated payables | | 58,491 | | |
| Deferred independent trustees' fees payable | | 78,543 | | |
| Other payables and accrued expenses | | 33,450 | | |
| Collateral on securities loaned | | 621,266 | | |
| Total Liabilities | | | | 1,483,685 |
| Net Assets | | | $ | 292,695,233 |
| Net Assets consist of: | | | | |
| Paid in capital | | | $ | 238,221,875 |
| Total accumulated earnings (loss) | | | | 54,473,358 |
| Net Assets | | | $ | 292,695,233 |
| | | | | |
| Net Asset Value and Maximum Offering Price | | | | |
| Class A : | | | | |
Net Asset Value and redemption price per share ($103,069,464 ÷ 6,026,936 shares) (a) | | | $ | 17.10 |
| Maximum offering price per share (100/94.25 of $17.10) | | | $ | 18.14 |
| Class M : | | | | |
Net Asset Value and redemption price per share ($90,445,274 ÷ 5,315,276 shares) (a) | | | $ | 17.02 |
| Maximum offering price per share (100/96.50 of $17.02) | | | $ | 17.64 |
| Class C : | | | | |
Net Asset Value and offering price per share ($9,282,808 ÷ 572,890 shares) (a) | | | $ | 16.20 |
| Class I : | | | | |
Net Asset Value , offering price and redemption price per share ($82,591,676 ÷ 4,745,097 shares) | | | $ | 17.41 |
| Class Z : | | | | |
Net Asset Value , offering price and redemption price per share ($7,306,011 ÷ 420,190 shares) | | | $ | 17.39 |
(a)Redemption price per share is equal to net asset value less any applicable contingent deferred sales charge. |
| Statement of Operations |
| | | | Six months ended January 31, 2023 (Unaudited) |
| Investment Income | | | | |
| Dividends | | | $ | 4,641,132 |
| Income from Fidelity Central Funds (including $42,481 from security lending) | | | | 93,273 |
| Total Income | | | | 4,734,405 |
| Expenses | | | | |
| Management fee | $ | 867,209 | | |
| Transfer agent fees | | 375,614 | | |
| Distribution and service plan fees | | 394,690 | | |
| Accounting fees | | 58,218 | | |
| Custodian fees and expenses | | 6,148 | | |
| Independent trustees' fees and expenses | | 608 | | |
| Registration fees | | 61,493 | | |
| Audit | | 27,360 | | |
| Legal | | 552 | | |
| Miscellaneous | | 1,463 | | |
| Total expenses before reductions | | 1,793,355 | | |
| Expense reductions | | (6,576) | | |
| Total expenses after reductions | | | | 1,786,779 |
| Net Investment income (loss) | | | | 2,947,626 |
| Realized and Unrealized Gain (Loss) | | | | |
| Net realized gain (loss) on: | | | | |
| Investment Securities: | | | | |
| Unaffiliated issuers | | (3,159,494) | | |
| Total net realized gain (loss) | | | | (3,159,494) |
| Change in net unrealized appreciation (depreciation) on investment securities | | | | (36,543,107) |
| Net gain (loss) | | | | (39,702,601) |
| Net increase (decrease) in net assets resulting from operations | | | $ | (36,754,975) |
| Statement of Changes in Net Assets |
| |
| | Six months ended January 31, 2023 (Unaudited) | | Year ended July 31, 2022 |
| Increase (Decrease) in Net Assets | | | | |
| Operations | | | | |
| Net investment income (loss) | $ | 2,947,626 | $ | 4,457,219 |
| Net realized gain (loss) | | (3,159,494) | | 46,296,510 |
| Change in net unrealized appreciation (depreciation) | | (36,543,107) | | (77,776,668) |
| Net increase (decrease) in net assets resulting from operations | | (36,754,975) | | (27,022,939) |
| Distributions to shareholders | | (42,285,368) | | (28,289,351) |
| Share transactions - net increase (decrease) | | (38,583,707) | | (21,794,093) |
| Total increase (decrease) in net assets | | (117,624,050) | | (77,106,383) |
| | | | | |
| Net Assets | | | | |
| Beginning of period | | 410,319,283 | | 487,425,666 |
| End of period | $ | 292,695,233 | $ | 410,319,283 |
| | | | | |
| | | | | |
Financial Highlights
| Fidelity Advisor® Real Estate Fund Class A |
| |
| | Six months ended (Unaudited) January 31, 2023 | | Years ended July 31, 2022 | | 2021 | | 2020 | | 2019 | | 2018 |
Selected Per-Share Data | | | | | | | | | | | | |
| Net asset value, beginning of period | $ | 21.95 | $ | 24.66 | $ | 19.62 | $ | 22.91 | $ | 22.07 | $ | 22.96 |
| Income from Investment Operations | | | | | | | | | | | | |
Net investment income (loss) A,B | | .16 | | .22 | | .26 | | .41 | | .37 | | .37 |
| Net realized and unrealized gain (loss) | | (2.13) | | (1.47) | | 5.50 | | (1.91) | | 1.63 | | .21 |
| Total from investment operations | | (1.97) | | (1.25) | | 5.76 | | (1.50) | | 2.00 | | .58 |
| Distributions from net investment income | | (.19) | | (.17) | | (.24) | | (.38) | | (.43) | | (.36) |
| Distributions from net realized gain | | (2.69) | | (1.30) | | (.48) | | (1.41) | | (.73) | | (1.11) |
| Total distributions | | (2.88) | | (1.46) C | | (.72) | | (1.79) | | (1.16) | | (1.47) |
| Net asset value, end of period | $ | 17.10 | $ | 21.95 | $ | 24.66 | $ | 19.62 | $ | 22.91 | $ | 22.07 |
Total Return D,E,F | | (7.46)% | | (5.65)% | | 30.38% | | (7.21)% | | 9.62% | | 2.55% |
Ratios to Average Net Assets B,G,H | | | | | | | | | | | | |
| Expenses before reductions | | 1.11% I | | 1.07% | | 1.09% | | 1.10% | | 1.10% | | 1.10% |
| Expenses net of fee waivers, if any | | 1.11% I | | 1.07% | | 1.09% | | 1.10% | | 1.09% | | 1.10% |
| Expenses net of all reductions | | 1.11% I | | 1.07% | | 1.08% | | 1.09% | | 1.09% | | 1.10% |
| Net investment income (loss) | | 1.76% I | | .95% | | 1.24% | | 1.93% | | 1.68% | | 1.70% |
| Supplemental Data | | | | | | | | | | | | |
| Net assets, end of period (000 omitted) | $ | 103,069 | $ | 122,949 | $ | 138,134 | $ | 115,736 | $ | 151,536 | $ | 161,570 |
Portfolio turnover rate J | | 34% I | | 48% | | 53% | | 56% | | 49% | | 41% |
A Calculated based on average shares outstanding during the period.
B Net investment income (loss) is affected by the timing of the declaration of dividends by any underlying mutual funds or exchange-traded funds (ETFs). Net investment income (loss) of any mutual funds or ETFs is not included in the Fund's net investment income (loss) ratio.
C Total distributions per share do not sum due to rounding.
D Total returns would have been lower if certain expenses had not been reduced during the applicable periods shown.
E Total returns do not include the effect of the sales charges.
F Total returns for periods of less than one year are not annualized.
G Fees and expenses of any underlying mutual funds or exchange-traded funds (ETFs) are not included in the Fund's expense ratio. The Fund indirectly bears its proportionate share of these expenses. For additional expense information related to investments in Fidelity Central Funds, please refer to the "Investments in Fidelity Central Funds" note found in the Notes to Financial Statements section of the most recent Annual or Semi-Annual report.
H Expense ratios reflect operating expenses of the class. Expenses before reductions do not reflect amounts reimbursed, waived, or reduced through arrangements with the investment adviser, brokerage services, or other offset arrangements, if applicable, and do not represent the amount paid by the class during periods when reimbursements, waivers or reductions occur.
I Annualized.
J Amount does not include the portfolio activity of any underlying mutual funds or exchange-traded funds (ETFs).
| Fidelity Advisor® Real Estate Fund Class M |
| |
| | Six months ended (Unaudited) January 31, 2023 | | Years ended July 31, 2022 | | 2021 | | 2020 | | 2019 | | 2018 |
Selected Per-Share Data | | | | | | | | | | | | |
| Net asset value, beginning of period | $ | 21.87 | $ | 24.59 | $ | 19.58 | $ | 22.87 | $ | 22.05 | $ | 22.94 |
| Income from Investment Operations | | | | | | | | | | | | |
Net investment income (loss) A,B | | .14 | | .17 | | .21 | | .36 | | .32 | | .32 |
| Net realized and unrealized gain (loss) | | (2.12) | | (1.46) | | 5.49 | | (1.90) | | 1.62 | | .21 |
| Total from investment operations | | (1.98) | | (1.29) | | 5.70 | | (1.54) | | 1.94 | | .53 |
| Distributions from net investment income | | (.18) | | (.13) | | (.22) | | (.34) | | (.39) | | (.31) |
| Distributions from net realized gain | | (2.69) | | (1.30) | | (.48) | | (1.41) | | (.73) | | (1.11) |
| Total distributions | | (2.87) | | (1.43) | | (.69) C | | (1.75) | | (1.12) | | (1.42) |
| Net asset value, end of period | $ | 17.02 | $ | 21.87 | $ | 24.59 | $ | 19.58 | $ | 22.87 | $ | 22.05 |
Total Return D,E,F | | (7.55)% | | (5.83)% | | 30.14% | | (7.42)% | | 9.35% | | 2.34% |
Ratios to Average Net Assets B,G,H | | | | | | | | | | | | |
| Expenses before reductions | | 1.32% I | | 1.29% | | 1.31% | | 1.31% | | 1.32% | | 1.33% |
| Expenses net of fee waivers, if any | | 1.32% I | | 1.28% | | 1.31% | | 1.31% | | 1.31% | | 1.33% |
| Expenses net of all reductions | | 1.31% I | | 1.28% | | 1.30% | | 1.30% | | 1.31% | | 1.32% |
| Net investment income (loss) | | 1.55% I | | .73% | | 1.03% | | 1.71% | | 1.46% | | 1.47% |
| Supplemental Data | | | | | | | | | | | | |
| Net assets, end of period (000 omitted) | $ | 90,445 | $ | 100,892 | $ | 118,778 | $ | 98,724 | $ | 128,754 | $ | 127,038 |
Portfolio turnover rate J | | 34% I | | 48% | | 53% | | 56% | | 49% | | 41% |
A Calculated based on average shares outstanding during the period.
B Net investment income (loss) is affected by the timing of the declaration of dividends by any underlying mutual funds or exchange-traded funds (ETFs). Net investment income (loss) of any mutual funds or ETFs is not included in the Fund's net investment income (loss) ratio.
C Total distributions per share do not sum due to rounding.
D Total returns for periods of less than one year are not annualized.
E Total returns would have been lower if certain expenses had not been reduced during the applicable periods shown.
F Total returns do not include the effect of the sales charges.
G Fees and expenses of any underlying mutual funds or exchange-traded funds (ETFs) are not included in the Fund's expense ratio. The Fund indirectly bears its proportionate share of these expenses. For additional expense information related to investments in Fidelity Central Funds, please refer to the "Investments in Fidelity Central Funds" note found in the Notes to Financial Statements section of the most recent Annual or Semi-Annual report.
H Expense ratios reflect operating expenses of the class. Expenses before reductions do not reflect amounts reimbursed, waived, or reduced through arrangements with the investment adviser, brokerage services, or other offset arrangements, if applicable, and do not represent the amount paid by the class during periods when reimbursements, waivers or reductions occur.
I Annualized.
J Amount does not include the portfolio activity of any underlying mutual funds or exchange-traded funds (ETFs).
| Fidelity Advisor® Real Estate Fund Class C |
| |
| | Six months ended (Unaudited) January 31, 2023 | | Years ended July 31, 2022 | | 2021 | | 2020 | | 2019 | | 2018 |
Selected Per-Share Data | | | | | | | | | | | | |
| Net asset value, beginning of period | $ | 21.00 | $ | 23.74 | $ | 18.97 | $ | 22.26 | $ | 21.54 | $ | 22.46 |
| Income from Investment Operations | | | | | | | | | | | | |
Net investment income (loss) A,B | | .09 | | .03 | | .09 | | .23 | | .19 | | .20 |
| Net realized and unrealized gain (loss) | | (2.06) | | (1.39) | | 5.30 | | (1.85) | | 1.58 | | .20 |
| Total from investment operations | | (1.97) | | (1.36) | | 5.39 | | (1.62) | | 1.77 | | .40 |
| Distributions from net investment income | | (.14) | | (.08) | | (.15) | | (.26) | | (.32) | | (.21) |
| Distributions from net realized gain | | (2.69) | | (1.30) | | (.48) | | (1.41) | | (.73) | | (1.11) |
| Total distributions | | (2.83) | | (1.38) | | (.62) C | | (1.67) | | (1.05) | | (1.32) |
| Net asset value, end of period | $ | 16.20 | $ | 21.00 | $ | 23.74 | $ | 18.97 | $ | 22.26 | $ | 21.54 |
Total Return D,E,F | | (7.84)% | | (6.35)% | | 29.36% | | (7.95)% | | 8.72% | | 1.77% |
Ratios to Average Net Assets B,G,H | | | | | | | | | | | | |
| Expenses before reductions | | 1.87% I | | 1.86% | | 1.88% | | 1.89% | | 1.88% | | 1.88% |
| Expenses net of fee waivers, if any | | 1.87% I | | 1.86% | | 1.88% | | 1.89% | | 1.88% | | 1.88% |
| Expenses net of all reductions | | 1.87% I | | 1.86% | | 1.87% | | 1.88% | | 1.88% | | 1.87% |
| Net investment income (loss) | | 1.00% I | | .15% | | .46% | | 1.14% | | .89% | | .92% |
| Supplemental Data | | | | | | | | | | | | |
| Net assets, end of period (000 omitted) | $ | 9,283 | $ | 12,375 | $ | 16,069 | $ | 20,774 | $ | 28,982 | $ | 43,690 |
Portfolio turnover rate J | | 34% I | | 48% | | 53% | | 56% | | 49% | | 41% |
A Calculated based on average shares outstanding during the period.
B Net investment income (loss) is affected by the timing of the declaration of dividends by any underlying mutual funds or exchange-traded funds (ETFs). Net investment income (loss) of any mutual funds or ETFs is not included in the Fund's net investment income (loss) ratio.
C Total distributions per share do not sum due to rounding.
D Total returns for periods of less than one year are not annualized.
E Total returns would have been lower if certain expenses had not been reduced during the applicable periods shown.
F Total returns do not include the effect of the contingent deferred sales charge.
G Fees and expenses of any underlying mutual funds or exchange-traded funds (ETFs) are not included in the Fund's expense ratio. The Fund indirectly bears its proportionate share of these expenses. For additional expense information related to investments in Fidelity Central Funds, please refer to the "Investments in Fidelity Central Funds" note found in the Notes to Financial Statements section of the most recent Annual or Semi-Annual report.
H Expense ratios reflect operating expenses of the class. Expenses before reductions do not reflect amounts reimbursed, waived, or reduced through arrangements with the investment adviser, brokerage services, or other offset arrangements, if applicable, and do not represent the amount paid by the class during periods when reimbursements, waivers or reductions occur.
I Annualized.
J Amount does not include the portfolio activity of any underlying mutual funds or exchange-traded funds (ETFs).
| Fidelity Advisor® Real Estate Fund Class I |
| |
| | Six months ended (Unaudited) January 31, 2023 | | Years ended July 31, 2022 | | 2021 | | 2020 | | 2019 | | 2018 |
Selected Per-Share Data | | | | | | | | | | | | |
| Net asset value, beginning of period | $ | 22.26 | $ | 24.96 | $ | 19.84 | $ | 23.15 | $ | 22.28 | $ | 23.17 |
| Income from Investment Operations | | | | | | | | | | | | |
Net investment income (loss) A,B | | .19 | | .27 | | .31 | | .46 | | .43 | | .43 |
| Net realized and unrealized gain (loss) | | (2.15) | | (1.48) | | 5.56 | | (1.92) | | 1.65 | �� | .21 |
| Total from investment operations | | (1.96) | | (1.21) | | 5.87 | | (1.46) | | 2.08 | | .64 |
| Distributions from net investment income | | (.19) | | (.19) | | (.27) | | (.44) | | (.48) | | (.42) |
| Distributions from net realized gain | | (2.69) | | (1.30) | | (.48) | | (1.41) | | (.73) | | (1.11) |
| Total distributions | | (2.89) C | | (1.49) | | (.75) | | (1.85) | | (1.21) | | (1.53) |
| Net asset value, end of period | $ | 17.41 | $ | 22.26 | $ | 24.96 | $ | 19.84 | $ | 23.15 | $ | 22.28 |
Total Return D,E | | (7.32)% | | (5.43)% | | 30.65% | | (6.99)% | | 9.93% | | 2.84% |
Ratios to Average Net Assets B,F,G | | | | | | | | | | | | |
| Expenses before reductions | | .86% H | | .86% | | .88% | | .86% | | .81% | | .82% |
| Expenses net of fee waivers, if any | | .86% H | | .86% | | .87% | | .86% | | .81% | | .82% |
| Expenses net of all reductions | | .86% H | | .86% | | .87% | | .85% | | .81% | | .81% |
| Net investment income (loss) | | 2.01% H | | 1.15% | | 1.46% | | 2.17% | | 1.96% | | 1.98% |
| Supplemental Data | | | | | | | | | | | | |
| Net assets, end of period (000 omitted) | $ | 82,592 | $ | 160,565 | $ | 197,873 | $ | 180,346 | $ | 225,407 | $ | 284,857 |
Portfolio turnover rate I | | 34% H | | 48% | | 53% | | 56% | | 49% | | 41% |
A Calculated based on average shares outstanding during the period.
B Net investment income (loss) is affected by the timing of the declaration of dividends by any underlying mutual funds or exchange-traded funds (ETFs). Net investment income (loss) of any mutual funds or ETFs is not included in the Fund's net investment income (loss) ratio.
C Total distributions per share do not sum due to rounding.
D Total returns for periods of less than one year are not annualized.
E Total returns would have been lower if certain expenses had not been reduced during the applicable periods shown.
F Fees and expenses of any underlying mutual funds or exchange-traded funds (ETFs) are not included in the Fund's expense ratio. The Fund indirectly bears its proportionate share of these expenses. For additional expense information related to investments in Fidelity Central Funds, please refer to the "Investments in Fidelity Central Funds" note found in the Notes to Financial Statements section of the most recent Annual or Semi-Annual report.
G Expense ratios reflect operating expenses of the class. Expenses before reductions do not reflect amounts reimbursed, waived, or reduced through arrangements with the investment adviser, brokerage services, or other offset arrangements, if applicable, and do not represent the amount paid by the class during periods when reimbursements, waivers or reductions occur.
H Annualized.
I Amount does not include the portfolio activity of any underlying mutual funds or exchange-traded funds (ETFs).
| Fidelity Advisor® Real Estate Fund Class Z |
| |
| | Six months ended (Unaudited) January 31, 2023 | | Years ended July 31, 2022 | | 2021 | | 2020 | | 2019 A |
Selected Per-Share Data | | | | | | | | | | |
| Net asset value, beginning of period | $ | 22.29 | $ | 24.97 | $ | 19.85 | $ | 23.16 | $ | 21.91 |
| Income from Investment Operations | | | | | | | | | | |
Net investment income (loss) B,C | | .21 | | .33 | | .36 | | .50 | | .40 |
| Net realized and unrealized gain (loss) | | (2.16) | | (1.48) | | 5.56 | | (1.92) | | 1.94 |
| Total from investment operations | | (1.95) | | (1.15) | | 5.92 | | (1.42) | | 2.34 |
| Distributions from net investment income | | (.25) | | (.23) | | (.32) | | (.48) | | (.36) |
| Distributions from net realized gain | | (2.69) | | (1.30) | | (.48) | | (1.41) | | (.73) |
| Total distributions | | (2.95) D | | (1.53) | | (.80) | | (1.89) | | (1.09) |
| Net asset value, end of period | $ | 17.39 | $ | 22.29 | $ | 24.97 | $ | 19.85 | $ | 23.16 |
Total Return E,F | | (7.24)% | | (5.21)% | | 30.95% | | (6.80)% | | 11.22% |
Ratios to Average Net Assets C,G,H | | | | | | | | | | |
| Expenses before reductions | | .66% I | | .64% | | .64% | | .65% | | .65% I |
| Expenses net of fee waivers, if any | | .66% I | | .63% | | .64% | | .65% | | .64% I |
| Expenses net of all reductions | | .66% I | | .63% | | .64% | | .64% | | .64% I |
| Net investment income (loss) | | 2.21% I | | 1.38% | | 1.69% | | 2.38% | | 2.20% I |
| Supplemental Data | | | | | | | | | | |
| Net assets, end of period (000 omitted) | $ | 7,306 | $ | 13,539 | $ | 16,573 | $ | 9,157 | $ | 6,634 |
Portfolio turnover rate J | | 34% I | | 48% | | 53% | | 56% | | 49% I |
A For the period October 2, 2018 (commencement of sale of shares) through July 31, 2019.
B Calculated based on average shares outstanding during the period.
C Net investment income (loss) is affected by the timing of the declaration of dividends by any underlying mutual funds or exchange-traded funds (ETFs). Net investment income (loss) of any mutual funds or ETFs is not included in the Fund's net investment income (loss) ratio.
D Total distributions per share do not sum due to rounding.
E Total returns for periods of less than one year are not annualized.
F Total returns would have been lower if certain expenses had not been reduced during the applicable periods shown.
G Fees and expenses of any underlying mutual funds or exchange-traded funds (ETFs) are not included in the Fund's expense ratio. The Fund indirectly bears its proportionate share of these expenses. For additional expense information related to investments in Fidelity Central Funds, please refer to the "Investments in Fidelity Central Funds" note found in the Notes to Financial Statements section of the most recent Annual or Semi-Annual report.
H Expense ratios reflect operating expenses of the class. Expenses before reductions do not reflect amounts reimbursed, waived, or reduced through arrangements with the investment adviser, brokerage services, or other offset arrangements, if applicable, and do not represent the amount paid by the class during periods when reimbursements, waivers or reductions occur.
I Annualized.
J Amount does not include the portfolio activity of any underlying mutual funds or exchange-traded funds (ETFs).
For the period ended January 31, 2023
1. Organization.
Fidelity Advisor Real Estate Fund (the Fund) is a non-diversified fund of Fidelity Advisor Series VII (the Trust) and is authorized to issue an unlimited number of shares. The Trust is registered under the Investment Company Act of 1940, as amended (the 1940 Act), as an open-end management investment company organized as a Massachusetts business trust. The Fund offers Class A, Class M, Class C, Class I and Class Z shares, each of which has equal rights as to assets and voting privileges. Each class has exclusive voting rights with respect to matters that affect that class. Class C shares will automatically convert to Class A shares after a holding period of eight years from the initial date of purchase, with certain exceptions.
2. Investments in Fidelity Central Funds.
Funds may invest in Fidelity Central Funds, which are open-end investment companies generally available only to other investment companies and accounts managed by the investment adviser and its affiliates. The Schedule of Investments lists any Fidelity Central Funds held as an investment as of period end, but does not include the underlying holdings of each Fidelity Central Fund. An investing fund indirectly bears its proportionate share of the expenses of the underlying Fidelity Central Funds.
Based on its investment objective, each Fidelity Central Fund may invest or participate in various investment vehicles or strategies that are similar to those of the investing fund. These strategies are consistent with the investment objectives of the investing fund and may involve certain economic risks which may cause a decline in value of each of the Fidelity Central Funds and thus a decline in the value of the investing fund.
| Fidelity Central Fund | Investment Manager | Investment Objective | Investment Practices | Expense Ratio A |
| Fidelity Money Market Central Funds | Fidelity Management & Research Company LLC (FMR) | Each fund seeks to obtain a high level of current income consistent with the preservation of capital and liquidity. | Short-term Investments | Less than .005% |
A Expenses expressed as a percentage of average net assets and are as of each underlying Central Fund's most recent annual or semi-annual shareholder report.
A complete unaudited list of holdings for each Fidelity Central Fund is available upon request or at the Securities and Exchange Commission website at www.sec.gov. In addition, the financial statements of the Fidelity Central Funds which contain the significant accounting policies (including investment valuation policies) of those funds, and are not covered by the Report of Independent Registered Public Accounting Firm, are available on the Securities and Exchange Commission website or upon request.
3. Significant Accounting Policies.
The Fund is an investment company and applies the accounting and reporting guidance of the Financial Accounting Standards Board (FASB) Accounting Standards Codification Topic 946 Financial Services - Investment Companies . The financial statements have been prepared in conformity with accounting principles generally accepted in the United States of America (GAAP), which require management to make certain estimates and assumptions at the date of the financial statements. Actual results could differ from those estimates. Subsequent events, if any, through the date that the financial statements were issued have been evaluated in the preparation of the financial statements. The Fund's Schedule of Investments lists any underlying mutual funds or exchange-traded funds (ETFs) but does not include the underlying holdings of these funds. The following summarizes the significant accounting policies of the Fund:
Investment Valuation. Investments are valued as of 4:00 p.m. Eastern time on the last calendar day of the period. The Board of Trustees (the Board) has designated the Fund's investment adviser as the valuation designee responsible for the fair valuation function and performing fair value determinations as needed. The investment adviser has established a Fair Value Committee (the Committee) to carry out the day-to-day fair valuation responsibilities and has adopted policies and procedures to govern the fair valuation process and the activities of the Committee. In accordance with these fair valuation policies and procedures, which have been approved by the Board, the Fund attempts to obtain prices from one or more third party pricing services or brokers to value its investments. When current market prices, quotations or currency exchange rates are not readily available or reliable, investments will be fair valued in good faith by the Committee, in accordance with the policies and procedures. Factors used in determining fair value vary by investment type and may include market or investment specific events, transaction data, estimated cash flows, and market observations of comparable investments. The frequency that the fair valuation procedures are used cannot be predicted and they may be utilized to a significant extent. The Committee manages the Fund's fair valuation practices and maintains the fair valuation policies and procedures. The Fund's investment adviser reports to the Board information regarding the fair valuation process and related material matters.
The Fund categorizes the inputs to valuation techniques used to value its investments into a disclosure hierarchy consisting of three levels as shown below:
Level 1 - unadjusted quoted prices in active markets for identical investments
Level 2 - other significant observable inputs (including quoted prices for similar investments, interest rates, prepayment speeds, etc.)
Level 3 - unobservable inputs (including the Fund's own assumptions based on the best information available)
Valuation techniques used to value the Fund's investments by major category are as follows:
Equity securities, including restricted securities, for which market quotations are readily available, are valued at the last reported sale price or official closing price as reported by a third party pricing service on the primary market or exchange on which they are traded and are categorized as Level 1 in the hierarchy. In the event there were no sales during the day or closing prices are not available, securities are valued at the last quoted bid price or may be valued using the last available price and are generally categorized as Level 2 in the hierarchy. For foreign equity securities, when market or security specific events arise, comparisons to the valuation of American Depositary Receipts (ADRs), futures contracts, ETFs and certain indexes as well as quoted prices for similar securities may be used and would be categorized as Level 2 in the hierarchy. For equity securities, including restricted securities, where observable inputs are limited, assumptions about market activity and risk are used and these securities may be categorized as Level 3 in the hierarchy.
Investments in open-end mutual funds, including the Fidelity Central Funds, are valued at their closing net asset value (NAV) each business day and are categorized as Level 1 in the hierarchy.
Changes in valuation techniques may result in transfers in or out of an assigned level within the disclosure hierarchy. The aggregate value of investments by input level as of January 31, 2023 is included at the end of the Fund's Schedule of Investments.
Investment Transactions and Income. For financial reporting purposes, the Fund's investment holdings and NAV include trades executed through the end of the last business day of the period. The NAV per share for processing shareholder transactions is calculated as of the close of business of the New York Stock Exchange (NYSE), normally 4:00 p.m. Eastern time and includes trades executed through the end of the prior business day. Gains and losses on securities sold are determined on the basis of identified cost. Commissions paid to certain brokers with whom the investment adviser, or its affiliates, places trades on behalf of a fund include an amount in addition to trade execution, which may be rebated back to a fund. Any such rebates are included in net realized gain (loss) on investments in the Statement of Operations. Dividend income is recorded on the ex-dividend date, except for certain dividends from foreign securities where the ex-dividend date may have passed, which are recorded as soon as the Fund is informed of the ex-dividend date. Non-cash dividends included in dividend income, if any, are recorded at the fair market value of the securities received. Income and capital gain distributions from Fidelity Central Funds, if any, are recorded on the ex-dividend date. Certain distributions received by the Fund represent a return of capital or capital gain. The Fund determines the components of these distributions subsequent to the ex-dividend date, based upon receipt of tax filings or other correspondence relating to the underlying investment. These distributions are recorded as a reduction of cost of investments and/or as a realized gain.
Class Allocations and Expenses. Investment income, realized and unrealized capital gains and losses, common expenses of a fund, and certain fund-level expense reductions, if any, are allocated daily on a pro-rata basis to each class based on the relative net assets of each class to the total net assets of a fund. Each class differs with respect to transfer agent and distribution and service plan fees incurred, as applicable. Certain expense reductions may also differ by class, if applicable. For the reporting period, the allocated portion of income and expenses to each class as a percent of its average net assets may vary due to the timing of recording these transactions in relation to fluctuating net assets of the classes. Expenses directly attributable to a fund are charged to that fund. Expenses attributable to more than one fund are allocated among the respective funds on the basis of relative net assets or other appropriate methods. Expenses included in the accompanying financial statements reflect the expenses of that fund and do not include any expenses associated with any underlying mutual funds or exchange-traded funds. Although not included in a fund's expenses, a fund indirectly bears its proportionate share of these expenses through the net asset value of each underlying mutual fund or exchange-traded fund. Expense estimates are accrued in the period to which they relate and adjustments are made when actual amounts are known.
Deferred Trustee Compensation. Under a Deferred Compensation Plan (the Plan) for certain Funds, certain independent Trustees have elected to defer receipt of a portion of their annual compensation. Deferred amounts are invested in affiliated mutual funds, are marked-to-market and remain in a fund until distributed in accordance with the Plan. The investment of deferred amounts and the offsetting payable to the Trustees presented below are included in the accompanying Statement of Assets and Liabilities in other receivables and other payables and accrued expenses, as applicable.
| Fidelity Advisor Real Estate Fund | $78,543 |
Income Tax Information and Distributions to Shareholders. Each year, the Fund intends to qualify as a regulated investment company under Subchapter M of the Internal Revenue Code, including distributing substantially all of its taxable income and realized gains. As a result, no provision for U.S. Federal income taxes is required. The Fund files a U.S. federal tax return, in addition to state and local tax returns as required. The Fund's federal income tax returns are subject to examination by the Internal Revenue Service (IRS) for a period of three fiscal years after they are filed. State and local tax returns may be subject to examination for an additional fiscal year depending on the jurisdiction.
Distributions are declared and recorded on the ex-dividend date. Income and capital gain distributions are declared separately for each class. Income and capital gain distributions are determined in accordance with income tax regulations, which may differ from GAAP.
Capital accounts within the financial statements are adjusted for permanent book-tax differences. These adjustments have no impact on net assets or the results of operations. Capital accounts are not adjusted for temporary book-tax differences which will reverse in a subsequent period.
Book-tax differences are primarily due to deferred Trustee compensation and losses deferred due to wash sales and excise tax regulations.
As of period end, the cost and unrealized appreciation (depreciation) in securities, and derivatives if applicable, for federal income tax purposes were as follows:
| Gross unrealized appreciation | $75,114,571 |
| Gross unrealized depreciation | (15,059,172) |
| Net unrealized appreciation (depreciation) | $60,055,399 |
| Tax cost | $233,704,106 |
The Fund elected to defer to its next fiscal year approximately $70,890 of capital losses recognized during the period November 1, 2021 to July 31, 2022.
4. Purchases and Sales of Investments.
Purchases and sales of securities, other than short-term securities and in-kind transactions, as applicable, are noted in the table below.
| | Purchases ($) | Sales ($) |
| Fidelity Advisor Real Estate Fund | 56,032,342 | 136,296,718 |
5. Fees and Other Transactions with Affiliates.
Management Fee. Fidelity Management & Research Company LLC (the investment adviser) and its affiliates provide the Fund with investment management related services for which the Fund pays a monthly management fee. The management fee is the sum of an individual fund fee rate that is based on an annual rate of .30% of the Fund's average net assets and an annualized group fee rate that averaged .23% during the period. The group fee rate is based upon the monthly average net assets of a group of registered investment companies with which the investment adviser has management contracts. The group fee rate decreases as assets under management increase and increases as assets under management decrease. For the reporting period, the total annualized management fee rate was .53% of the Fund's average net assets.
Distribution and Service Plan Fees. In accordance with Rule 12b-1 of the 1940 Act, the Fund has adopted separate Distribution and Service Plans for each class of shares. Certain classes pay Fidelity Distributors Company LLC (FDC), an affiliate of the investment adviser, separate Distribution and Service Fees, each of which is based on an annual percentage of each class' average net assets. In addition, FDC may pay financial intermediaries for selling shares of the Fund and providing shareholder support services. For the period, the Distribution and Service Fee rates, total fees and amounts retained by FDC were as follows:
| | Distribution Fee | Service Fee | Total Fees | Retained by FDC |
| Class A | - % | .25% | $128,675 | $746 |
| Class M | .25% | .25% | 216,730 | - |
| Class C | .75% | .25% | 49,285 | 4,364 |
| | | | $394,690 | $5,110 |
Sales Load. FDC may receive a front-end sales charge of up to 5.75% for selling Class A shares and 3.50% for selling Class M shares, some of which is paid to financial intermediaries for selling shares of the Fund. Depending on the holding period, FDC may receive contingent deferred sales charges levied on Class A, Class M and Class C redemptions. The deferred sales charges are 1.00% for Class C shares, 1.00% for certain purchases of Class A shares and .25% for certain purchases of Class M shares.
For the period, sales charge amounts retained by FDC were as follows:
| | Retained by FDC |
| Class A | $6,551 |
| Class M | 996 |
Class C A | 98 |
| | $7,645 |
A When Class C shares are initially sold, FDC pays commissions from its own resources to financial intermediaries through which the sales are made.
Transfer Agent Fees. Fidelity Investments Institutional Operations Company LLC (FIIOC), an affiliate of the investment adviser, is the transfer, dividend disbursing and shareholder servicing agent for each class of the Fund. FIIOC receives account fees and asset-based fees that vary according to the account size and type of account of the shareholders of the respective classes of the Fund, except for Class Z. FIIOC receives an asset-based fee of Class Z's average net assets. FIIOC pays for typesetting, printing and mailing of shareholder reports, except proxy statements.
For the period, transfer agent fees for each class were as follows:
| | Amount | % of Class-Level Average Net Assets A |
| Class A | $125,326 | .24 |
| Class M | 87,405 | .20 |
| Class C | 12,724 | .26 |
| Class I | 148,260 | .24 |
| Class Z | 1,899 | .04 |
| | $375,614 | |
A Annualized
Accounting Fees. Fidelity Service Company, Inc. (FSC), an affiliate of the investment adviser, maintains the Fund's accounting records. The accounting fee is based on the level of average net assets for each month. For the period, the fees were equivalent to the following annualized rates:
| | % of Average Net Assets |
| Fidelity Advisor Real Estate Fund | .04 |
Brokerage Commissions. A portion of portfolio transactions were placed with brokerage firms which are affiliates of the investment adviser. Brokerage commissions are included in net realized gain (loss) and change in net unrealized appreciation (depreciation) in the Statement of Operations. The commissions paid to these affiliated firms were as follows:
| | Amount |
| Fidelity Advisor Real Estate Fund | $1,239 |
Interfund Trades. Funds may purchase from or sell securities to other Fidelity Funds under procedures adopted by the Board. The procedures have been designed to ensure these interfund trades are executed in accordance with Rule 17a-7 of the 1940 Act. Any interfund trades are included within the respective purchases and sales amounts shown in the Purchases and Sales of Investments note. Interfund trades during the period are noted in the table below.
| | Purchases ($) | Sales ($) | Realized Gain (Loss) ($) |
| Fidelity Advisor Real Estate Fund | 5,666,628 | 5,450,447 | (969,278) |
5. Committed Line of Credit.
Certain Funds participate with other funds managed by the investment adviser or an affiliate in a $4.25 billion credit facility (the "line of credit") to be utilized for temporary or emergency purposes to fund shareholder redemptions or for other short-term liquidity purposes. The participating funds have agreed to pay commitment fees on their pro-rata portion of the line of credit, which are reflected in Miscellaneous expenses on the Statement of Operations, and are listed below. During the period, there were no borrowings on this line of credit.
| | Amount |
| Fidelity Advisor Real Estate Fund | $499 |
6. Security Lending.
Funds lend portfolio securities from time to time in order to earn additional income. Lending agents are used, including National Financial Services (NFS), an affiliate of the investment adviser. Pursuant to a securities lending agreement, NFS will receive a fee, which is capped at 9.9% of a fund's daily lending revenue, for its services as lending agent. A fund may lend securities to certain qualified borrowers, including NFS. On the settlement date of the loan, a fund receives collateral (in the form of U.S. Treasury obligations, letters of credit and/or cash) against the loaned securities and maintains collateral in an amount not less than 100% of the market value of the loaned securities during the period of the loan. The market value of the loaned securities is determined at the close of business of a fund and any additional required collateral is delivered to a fund on the next business day. A fund or borrower may terminate the loan at any time, and if the borrower defaults on its obligation to return the securities loaned because of insolvency or other reasons, a fund may apply collateral received from the borrower against the obligation. A fund may experience delays and costs in recovering the securities loaned. Any cash collateral received is invested in the Fidelity Securities Lending Cash Central Fund. Any loaned securities are identified as such in the Schedule of Investments, and the value of loaned securities and cash collateral at period end, as applicable, are presented in the Statement of Assets and Liabilities. Security lending income represents the income earned on investing cash collateral, less rebates paid to borrowers and any lending agent fees associated with the loan, plus any premium payments received for lending certain types of securities. Security lending income is presented in the Statement of Operations as a component of income from Fidelity Central Funds. Affiliated security lending activity, if any, was as follows:
| | Total Security Lending Fees Paid to NFS | Security Lending Income From Securities Loaned to NFS | Value of Securities Loaned to NFS at Period End |
| Fidelity Advisor Real Estate Fund | $4,220 | $- | $- |
7. Expense Reductions.
Through arrangements with each class' transfer agent, credits realized as a result of certain uninvested cash balances were used to reduce the Fund's expenses. During the period, transfer agent credits reduced each class' expenses as noted in the table below.
| | Expense reduction |
| Class A | $103 |
| Class M | 508 |
| | $611 |
In addition, during the period the investment adviser or an affiliate reimbursed and/or waived a portion of fund-level operating expenses in the amount of $5,965.
8. Distributions to Shareholders.
Distributions to shareholders of each class were as follows:
| | Six months ended January 31, 2023 | Year ended July 31, 2022 |
| Fidelity Advisor Real Estate Fund | | |
| Distributions to shareholders | | |
| Class A | $14,969,406 | $7,993,209 |
| Class M | 12,970,936 | 6,745,913 |
| Class C | 1,427,489 | 908,708 |
| Class I | 11,839,759 | 11,703,981 |
| Class Z | 1,077,778 | 937,540 |
| Total | $42,285,368 | $28,289,351 |
9. Share Transactions.
Share transactions for each class were as follows and may contain in-kind transactions, automatic conversions between classes or exchanges between affiliated funds:
| | Shares | Shares | Dollars | Dollars |
| | Six months ended January 31, 2023 | Year ended July 31, 2022 | Six months ended January 31, 2023 | Year ended July 31, 2022 |
| Fidelity Advisor Real Estate Fund | | | | |
| Class A | | | | |
| Shares sold | 291,960 | 994,036 | $5,298,247 | $23,589,069 |
| Reinvestment of distributions | 961,670 | 322,393 | 14,752,010 | 7,866,495 |
| Shares redeemed | (826,968) | (1,318,681) | (15,005,286) | (30,889,788) |
| Net increase (decrease) | 426,662 | (2,252) | $5,044,971 | $565,776 |
| Class M | | | | |
| Shares sold | 218,882 | 392,434 | $3,921,609 | $9,212,673 |
| Reinvestment of distributions | 848,031 | 276,620 | 12,940,952 | 6,729,626 |
| Shares redeemed | (365,066) | (886,642) | (6,638,435) | (20,661,409) |
| Net increase (decrease) | 701,847 | (217,588) | $10,224,126 | $(4,719,110) |
| Class C | | | | |
| Shares sold | 18,768 | 106,372 | $314,829 | $2,458,841 |
| Reinvestment of distributions | 96,548 | 38,746 | 1,403,801 | 908,210 |
| Shares redeemed | (131,713) | (232,612) | (2,300,441) | (5,110,047) |
| Net increase (decrease) | (16,397) | (87,494) | $(581,811) | $(1,742,996) |
| Class I | | | | |
| Shares sold | 819,323 | 2,116,894 | $14,835,138 | $52,046,309 |
| Reinvestment of distributions | 748,076 | 440,622 | 11,669,986 | 10,890,582 |
| Shares redeemed | (4,034,851) | (3,272,627) | (76,325,813) | (77,697,577) |
| Net increase (decrease) | (2,467,452) | (715,111) | $(49,820,689) | $(14,760,686) |
| Class Z | | | | |
| Shares sold | 48,280 | 345,140 | $899,634 | $8,205,866 |
| Reinvestment of distributions | 63,421 | 31,131 | 992,466 | 769,941 |
| Shares redeemed | (298,892) | (432,603) | (5,342,404) | (10,112,884) |
| Net increase (decrease) | (187,191) | (56,332) | $(3,450,304) | $(1,137,077) |
10. Other.
A fund's organizational documents provide former and current trustees and officers with a limited indemnification against liabilities arising in connection with the performance of their duties to the fund. In the normal course of business, a fund may also enter into contracts that provide general indemnifications. A fund's maximum exposure under these arrangements is unknown as this would be dependent on future claims that may be made against a fund. The risk of material loss from such claims is considered remote.
11. Risk and Uncertainties.
Many factors affect a fund's performance. Developments that disrupt global economies and financial markets, such as pandemics, epidemics, outbreaks of infectious diseases, war, terrorism, and environmental disasters, may significantly affect a fund's investment performance. The effects of these developments to a fund will be impacted by the types of securities in which a fund invests, the financial condition, industry, economic sector, and geographic location of an issuer, and a fund's level of investment in the securities of that issuer.
As a shareholder, you incur two types of costs: (1) transaction costs, which may include sales charges (loads) on purchase payments or redemption proceeds, as applicable and (2) ongoing costs, which generally include management fees, distribution and/or service (12b-1) fees and other Fund expenses. This Example is intended to help you understand your ongoing costs (in dollars) of investing in a fund and to compare these costs with the ongoing costs of investing in other mutual funds.
| The Example is based on an investment of $1,000 invested at the beginning of the period and held for the entire period (August 1, 2022 to January 31, 2023). |
Actual Expenses
The first line of the accompanying table provides information about actual account values and actual expenses. You may use the information in this line, together with the amount you invested, to estimate the expenses that you paid over the period. Simply divide your account value by $1,000.00 (for example, an $8,600 account value divided by $1,000.00 = 8.6), then multiply the result by the number in the first line for a class/Fund under the heading entitled "Expenses Paid During Period" to estimate the expenses you paid on your account during this period. If any fund is a shareholder of any underlying mutual funds or exchange-traded funds (ETFs) (the Underlying Funds), such fund indirectly bears its proportional share of the expenses of the Underlying Funds in addition to the direct expenses incurred presented in the table. These fees and expenses are not included in the annualized expense ratio used to calculate the expense estimate in the table below.
Hypothetical Example for Comparison Purposes
The second line of the accompanying table provides information about hypothetical account values and hypothetical expenses based on the actual expense ratio and an assumed rate of return of 5% per year before expenses, which is not the actual return. The hypothetical account values and expenses may not be used to estimate the actual ending account balance or expenses you paid for the period. You may use this information to compare the ongoing costs of investing in the Fund and other funds. To do so, compare this 5% hypothetical example with the 5% hypothetical examples that appear in the shareholder reports of the other funds. If any fund is a shareholder of any Underlying Funds, such fund indirectly bears its proportional share of the expenses of the Underlying Funds in addition to the direct expenses as presented in the table. These fees and expenses are not included in the annualized expense ratio used to calculate the expense estimate in the table below.
Please note that the expenses shown in the table are meant to highlight your ongoing costs only and do not reflect any transaction costs. Therefore, the second line of the table is useful in comparing ongoing costs only, and will not help you determine the relative total costs of owning different funds. In addition, if these transactional costs were included, your costs would have been higher.
| | | | | Annualized Expense Ratio- A | | Beginning Account Value August 1, 2022 | | Ending Account Value January 31, 2023 | | Expenses Paid During Period- C August 1, 2022 to January 31, 2023 |
| Fidelity Advisor® Real Estate Fund | | | | | | | | | | |
| Class A | | | | 1.11% | | | | | | |
| Actual | | | | | | $ 1,000 | | $ 925.40 | | $ 5.39 |
Hypothetical- B | | | | | | $ 1,000 | | $ 1,019.61 | | $ 5.65 |
| Class M | | | | 1.32% | | | | | | |
| Actual | | | | | | $ 1,000 | | $ 924.50 | | $ 6.40 |
Hypothetical- B | | | | | | $ 1,000 | | $ 1,018.55 | | $ 6.72 |
| Class C | | | | 1.87% | | | | | | |
| Actual | | | | | | $ 1,000 | | $ 921.60 | | $ 9.06 |
Hypothetical- B | | | | | | $ 1,000 | | $ 1,015.78 | | $ 9.50 |
| Class I | | | | .86% | | | | | | |
| Actual | | | | | | $ 1,000 | | $ 926.80 | | $ 4.18 |
Hypothetical- B | | | | | | $ 1,000 | | $ 1,020.87 | | $ 4.38 |
| Class Z | | | | .66% | | | | | | |
| Actual | | | | | | $ 1,000 | | $ 927.60 | | $ 3.21 |
Hypothetical- B | | | | | | $ 1,000 | | $ 1,021.88 | | $ 3.36 |
| |
A Annualized expense ratio reflects expenses net of applicable fee waivers.
B 5% return per year before expenses
C Expenses are equal to the annualized expense ratio, multiplied by the average account value over the period, multiplied by 184/ 365 (to reflect the one-half year period). The fees and expenses of any Underlying Funds are not included in each annualized expense ratio.
The Securities and Exchange Commission adopted Rule 22e-4 under the Investment Company Act of 1940 (the Liquidity Rule) to promote effective liquidity risk management throughout the open-end investment company industry, thereby reducing the risk that funds will be unable to meet their redemption obligations and mitigating dilution of the interests of fund shareholders.
The Fund has adopted and implemented a liquidity risk management program (the Program) reasonably designed to assess and manage the Fund's liquidity risk and to comply with the requirements of the Liquidity Rule. The Fund's Board of Trustees (the Board) has designated the Fund's investment adviser as administrator of the Program. The Fidelity advisers have established a Liquidity Risk Management Committee (the LRM Committee) to manage the Program for each of the Fidelity Funds. The LRM Committee monitors the adequacy and effectiveness of implementation of the Program and on a periodic basis assesses each Fund's liquidity risk based on a variety of factors including (1) the Fund's investment strategy, (2) portfolio liquidity and cash flow projections during normal and reasonably foreseeable stressed conditions, (3) shareholder redemptions, (4) borrowings and other funding sources and (5) certain factors specific to ETFs including the effect of the Fund's prices and spreads, market participants, and basket compositions on the overall liquidity of the Fund's portfolio, as applicable.
In accordance with the Program, each of the Fund's portfolio investments is classified into one of four defined liquidity categories based on a determination of a reasonable expectation for how long it would take to convert the investment to cash (or sell or dispose of the investment) without significantly changing its market value.
- Highly liquid investments - cash or convertible to cash within three business days or less
- Moderately liquid investments - convertible to cash in three to seven calendar days
- Less liquid investments - can be sold or disposed of, but not settled, within seven calendar days
- Illiquid investments - cannot be sold or disposed of within seven calendar days
Liquidity classification determinations take into account a variety of factors including various market, trading and investment-specific considerations, as well as market depth, and generally utilize analysis from a third-party liquidity metrics service.
The Liquidity Rule places a 15% limit on a fund's illiquid investments and requires funds that do not primarily hold assets that are highly liquid investments to determine and maintain a minimum percentage of the fund's net assets to be invested in highly liquid investments (highly liquid investment minimum or HLIM). The Program includes provisions reasonably designed to comply with the 15% limit on illiquid investments and for determining, periodically reviewing and complying with the HLIM requirement as applicable.
At a recent meeting of the Fund's Board of Trustees, the LRM Committee provided a written report to the Board pertaining to the operation, adequacy, and effectiveness of the Program for the period December 1, 2021 through November 30, 2022. The report concluded that the Program is operating effectively and is reasonably designed to assess and manage the Fund's liquidity risk.
1.783109.121
ARE-SANN-0423
Fidelity Advisor® Global Real Estate Fund
Semi-Annual Report
January 31, 2023
Contents
To view a fund's proxy voting guidelines and proxy voting record for the 12-month period ended June 30, visit http://www.fidelity.com/proxyvotingresults or visit the Securities and Exchange Commission's (SEC) web site at http://www.sec.gov.
You may also call 1-877-208-0098 to request a free copy of the proxy voting guidelines.
Standard & Poor's, S&P and S&P 500 are registered service marks of The McGraw-Hill Companies, Inc. and have been licensed for use by Fidelity Distributors Corporation.
Other third-party marks appearing herein are the property of their respective owners.
All other marks appearing herein are registered or unregistered trademarks or service marks of FMR LLC or an affiliated company. © 2023 FMR LLC. All rights reserved.
This report and the financial statements contained herein are submitted for the general information of the shareholders of the Fund. This report is not authorized for distribution to prospective investors in the Fund unless preceded or accompanied by an effective prospectus.
A fund files its complete schedule of portfolio holdings with the SEC for the first and third quarters of each fiscal year on Form N-PORT. Forms N-PORT are available on the SEC's web site at http://www.sec.gov. A fund's Forms N-PORT may be reviewed and copied at the SEC's Public Reference Room in Washington, DC. Information regarding the operation of the SEC's Public Reference Room may be obtained by calling 1-800-SEC-0330.
For a complete list of a fund's portfolio holdings, view the most recent holdings listing, semiannual report, or annual report on Fidelity's web site at http://www.fidelity.com, http://www.institutional.fidelity.com, or http://www.401k.com, as applicable.
NOT FDIC INSURED •MAY LOSE VALUE •NO BANK GUARANTEE
Neither the Fund nor Fidelity Distributors Corporation is a bank.
Top Holdings (% of Fund's net assets) |
| |
| Prologis (REIT), Inc. | 8.9 | |
| Equinix, Inc. | 5.4 | |
| Digital Realty Trust, Inc. | 3.7 | |
| Ventas, Inc. | 3.6 | |
| Welltower, Inc. | 3.3 | |
| UDR, Inc. | 2.8 | |
| Vonovia SE | 2.7 | |
| Equity Lifestyle Properties, Inc. | 2.6 | |
| Extra Space Storage, Inc. | 2.6 | |
| Mid-America Apartment Communities, Inc. | 2.6 | |
| | 38.2 | |
| |
| Top Five REIT Sectors (% of Fund's net assets) |
| |
| REITs - Diversified | 20.7 | |
| REITs - Apartments | 13.5 | |
| REITs - Shopping Centers | 10.3 | |
| REITs - Warehouse/Industrial | 9.8 | |
| REITs - Health Care | 7.9 | |
| |
Asset Allocation (% of Fund's net assets) |
|
Foreign investments - 36.3% |
|
Geographic Diversification (% of Fund's net assets) |
|
* Includes Short-Term investments and Net Other Assets (Liabilities). Percentages are based on country or territory of incorporation and are adjusted for the effect of derivatives, if applicable. |
| |
Showing Percentage of Net Assets
| Common Stocks - 99.8% |
| | | Shares | Value ($) |
| Australia - 4.8% | | | |
| Abacus Property Group unit | | 12,329 | 24,431 |
| Arena (REIT) unit | | 25,116 | 66,627 |
| Charter Hall Retail REIT | | 24,491 | 69,550 |
| National Storage REIT unit | | 42,324 | 69,654 |
| Scentre Group unit | | 30,695 | 66,602 |
TOTAL AUSTRALIA | | | 296,864 |
| Canada - 5.5% | | | |
| Boardwalk (REIT) | | 3,696 | 156,168 |
| Dream Industrial (REIT) | | 11,194 | 117,783 |
| Flagship Communities (REIT) | | 4,401 | 70,372 |
TOTAL CANADA | | | 344,323 |
| France - 2.6% | | | |
| ARGAN SA | | 794 | 67,416 |
| Covivio | | 856 | 58,581 |
| Gecina SA | | 293 | 34,593 |
TOTAL FRANCE | | | 160,590 |
| Germany - 2.7% | | | |
| Vonovia SE | | 5,889 | 166,352 |
| Hong Kong - 1.9% | | | |
| Hysan Development Co. Ltd. | | 10,619 | 35,727 |
| Link (REIT) | | 10,663 | 85,351 |
TOTAL HONG KONG | | | 121,078 |
| Ireland - 0.5% | | | |
| Dalata Hotel Group PLC (a) | | 7,083 | 29,839 |
| Japan - 5.9% | | | |
| Advance Residence Investment Corp. | | 16 | 39,084 |
| Kenedix Residential Investment Corp. | | 45 | 67,071 |
| LaSalle Logiport REIT | | 63 | 76,331 |
| Mitsubishi Estate Co. Ltd. | | 10,697 | 137,490 |
| Mitsui Fudosan Logistics Park, Inc. | | 14 | 48,861 |
TOTAL JAPAN | | | 368,837 |
| Singapore - 4.7% | | | |
| CapitaMall Trust | | 68,389 | 111,894 |
| CDL Hospitality Trusts unit | | 22,144 | 22,850 |
| Mapletree Pan Asia Commercial Trust | | 21,333 | 29,683 |
| UOL Group Ltd. | | 23,554 | 125,674 |
TOTAL SINGAPORE | | | 290,101 |
| Spain - 1.0% | | | |
| Lar Espana Real Estate Socimi SA | | 2,276 | 11,357 |
| Merlin Properties Socimi SA | | 5,472 | 53,332 |
TOTAL SPAIN | | | 64,689 |
| Sweden - 1.1% | | | |
| Catena AB | | 1,605 | 66,824 |
| United Kingdom - 5.6% | | | |
| Assura PLC | | 90,098 | 61,926 |
| Grainger Trust PLC | | 37,311 | 119,413 |
| Helical PLC | | 4,052 | 17,984 |
| Life Science (REIT) PLC | | 13,294 | 11,210 |
| Segro PLC | | 5,837 | 59,742 |
| Shaftesbury PLC | | 7,907 | 38,369 |
| Unite Group PLC | | 3,561 | 43,770 |
TOTAL UNITED KINGDOM | | | 352,414 |
| United States of America - 63.5% | | | |
| American Assets Trust, Inc. | | 1,445 | 41,125 |
| American Homes 4 Rent Class A | | 3,014 | 103,350 |
| Apartment Income (REIT) Corp. | | 1,925 | 73,651 |
| Crown Castle International Corp. | | 926 | 137,150 |
| CubeSmart | | 3,194 | 146,253 |
| DiamondRock Hospitality Co. | | 7,011 | 67,516 |
| Digital Realty Trust, Inc. | | 2,017 | 231,189 |
| Elme Communities (SBI) | | 2,285 | 43,872 |
| Equinix, Inc. | | 453 | 334,373 |
| Equity Lifestyle Properties, Inc. | | 2,309 | 165,740 |
| Extra Space Storage, Inc. | | 1,027 | 162,091 |
| Gaming & Leisure Properties | | 1,633 | 87,463 |
| Host Hotels & Resorts, Inc. | | 6,913 | 130,310 |
| Invitation Homes, Inc. | | 3,009 | 97,793 |
| Kimco Realty Corp. | | 5,049 | 113,401 |
| LXP Industrial Trust (REIT) | | 4,303 | 49,700 |
| Mid-America Apartment Communities, Inc. | | 964 | 160,718 |
| National Retail Properties, Inc. | | 2,647 | 125,335 |
| Phillips Edison & Co., Inc. | | 1,605 | 53,800 |
| Prologis (REIT), Inc. | | 4,274 | 552,538 |
| Regency Centers Corp. | | 1,577 | 105,076 |
| RLJ Lodging Trust | | 4,187 | 52,631 |
| Ryman Hospitality Properties, Inc. | | 518 | 48,117 |
| Spirit Realty Capital, Inc. | | 2,150 | 94,342 |
| Sun Communities, Inc. | | 884 | 138,664 |
| UDR, Inc. | | 4,122 | 175,556 |
| Urban Edge Properties | | 2,298 | 36,194 |
| Ventas, Inc. | | 4,323 | 223,975 |
| Welltower, Inc. | | 2,778 | 208,461 |
TOTAL UNITED STATES OF AMERICA | | | 3,960,384 |
| TOTAL COMMON STOCKS (Cost $5,277,449) | | | 6,222,295 |
| | | | |
| Money Market Funds - 1.1% |
| | | Shares | Value ($) |
Fidelity Cash Central Fund 4.38% (b) (Cost $68,818) | | 68,804 | 68,818 |
| | | | |
| TOTAL INVESTMENT IN SECURITIES - 100.9% (Cost $5,346,267) | 6,291,113 |
NET OTHER ASSETS (LIABILITIES) - (0.9)% | (57,590) |
| NET ASSETS - 100.0% | 6,233,523 |
| | |
Categorizations in the Schedule of Investments are based on country or territory of incorporation.
Legend
| (b) | Affiliated fund that is generally available only to investment companies and other accounts managed by Fidelity Investments. The rate quoted is the annualized seven-day yield of the fund at period end. A complete unaudited listing of the fund's holdings as of its most recent quarter end is available upon request. In addition, each Fidelity Central Fund's financial statements are available on the SEC's website or upon request. |
Affiliated Central Funds
Fiscal year to date information regarding the Fund's investments in Fidelity Central Funds, including the ownership percentage, is presented below.
| Affiliate | Value, beginning of period ($) | Purchases ($) | Sales Proceeds ($) | Dividend Income ($) | Realized Gain (loss) ($) | Change in Unrealized appreciation (depreciation) ($) | Value, end of period ($) | % ownership, end of period |
| Fidelity Cash Central Fund 4.38% | 80,792 | 3,681,299 | 3,693,273 | 1,635 | - | - | 68,818 | 0.0% |
| Total | 80,792 | 3,681,299 | 3,693,273 | 1,635 | - | - | 68,818 | |
| | | | | | | | | |
Amounts in the dividend income column in the above table include any capital gain distributions from underlying funds, which are presented in the corresponding line item in the Statement of Operations, if applicable.
Amounts included in the purchases and sales proceeds columns may include in-kind transactions, if applicable.
Investment Valuation
The following is a summary of the inputs used, as of January 31, 2023, involving the Fund's assets and liabilities carried at fair value. The inputs or methodology used for valuing securities may not be an indication of the risk associated with investing in those securities. For more information on valuation inputs, and their aggregation into the levels used below, please refer to the Investment Valuation section in the accompanying Notes to Financial Statements.
| Valuation Inputs at Reporting Date: |
| Description | Total ($) | Level 1 ($) | Level 2 ($) | Level 3 ($) |
Investments in Securities: | | | | |
|
| Equities: | | | | |
Consumer Discretionary | 29,839 | 29,839 | - | - |
Real Estate | 6,192,456 | 4,949,224 | 1,243,232 | - |
|
| Money Market Funds | 68,818 | 68,818 | - | - |
| Total Investments in Securities: | 6,291,113 | 5,047,881 | 1,243,232 | - |
| Statement of Assets and Liabilities |
| | | | January 31, 2023 (Unaudited) |
| | | | | |
| Assets | | | | |
| Investment in securities, at value - See accompanying schedule: | | | | |
Unaffiliated issuers (cost $5,277,449) | $ | 6,222,295 | | |
Fidelity Central Funds (cost $68,818) | | 68,818 | | |
| | | | | |
| | | | | |
| Total Investment in Securities (cost $5,346,267) | | | $ | 6,291,113 |
| Cash | | | | 13,688 |
| Receivable for investments sold | | | | 38,660 |
| Receivable for fund shares sold | | | | 15,267 |
| Dividends receivable | | | | 18,282 |
| Distributions receivable from Fidelity Central Funds | | | | 311 |
| Prepaid expenses | | | | 14 |
| Receivable from investment adviser for expense reductions | | | | 9,768 |
| Other receivables | | | | 7 |
Total assets | | | | 6,387,110 |
| Liabilities | | | | |
| Payable for investments purchased | $ | 56,001 | | |
| Payable for fund shares redeemed | | 55,904 | | |
| Accrued management fee | | 4,284 | | |
| Distribution and service plan fees payable | | 1,112 | | |
| Other affiliated payables | | 1,489 | | |
| Other payables and accrued expenses | | 34,797 | | |
| Total Liabilities | | | | 153,587 |
| Net Assets | | | $ | 6,233,523 |
| Net Assets consist of: | | | | |
| Paid in capital | | | $ | 6,212,817 |
| Total accumulated earnings (loss) | | | | 20,706 |
| Net Assets | | | $ | 6,233,523 |
| | | | | |
| Net Asset Value and Maximum Offering Price | | | | |
| Class A : | | | | |
Net Asset Value and redemption price per share ($2,857,726 ÷ 270,578 shares) (a) | | | $ | 10.56 |
| Maximum offering price per share (100/94.25 of $10.56) | | | $ | 11.20 |
| Class M : | | | | |
Net Asset Value and redemption price per share ($942,573 ÷ 89,342 shares) (a) | | | $ | 10.55 |
| Maximum offering price per share (100/96.50 of $10.55) | | | $ | 10.93 |
| Class C : | | | | |
Net Asset Value and offering price per share ($193,203 ÷ 18,231 shares) (a) | | | $ | 10.60 |
| Class I : | | | | |
Net Asset Value , offering price and redemption price per share ($1,302,171 ÷ 123,181 shares) | | | $ | 10.57 |
| Class Z : | | | | |
Net Asset Value , offering price and redemption price per share ($937,850 ÷ 88,147 shares) | | | $ | 10.64 |
(a)Redemption price per share is equal to net asset value less any applicable contingent deferred sales charge. |
| Statement of Operations |
| | | | Six months ended January 31, 2023 (Unaudited) |
| Investment Income | | | | |
| Dividends | | | $ | 102,662 |
| Income from Fidelity Central Funds | | | | 1,635 |
| Income before foreign taxes withheld | | | $ | 104,297 |
| Less foreign taxes withheld | | | | (3,704) |
| Total Income | | | | 100,593 |
| Expenses | | | | |
| Management fee | $ | 21,033 | | |
| Transfer agent fees | | 6,515 | | |
| Distribution and service plan fees | | 6,572 | | |
| Accounting fees and expenses | | 1,099 | | |
| Custodian fees and expenses | | 9,303 | | |
| Independent trustees' fees and expenses | | 11 | | |
| Registration fees | | 28,075 | | |
| Audit | | 31,688 | | |
| Legal | | 5 | | |
| Miscellaneous | | 110 | | |
| Total expenses before reductions | | 104,411 | | |
| Expense reductions | | (69,173) | | |
| Total expenses after reductions | | | | 35,238 |
| Net Investment income (loss) | | | | 65,355 |
| Realized and Unrealized Gain (Loss) | | | | |
| Net realized gain (loss) on: | | | | |
| Investment Securities: | | | | |
| Unaffiliated issuers | | (707,347) | | |
| Foreign currency transactions | | (2,490) | | |
| Total net realized gain (loss) | | | | (709,837) |
| Change in net unrealized appreciation (depreciation) on: | | | | |
| Investment Securities: | | | | |
| Unaffiliated issuers | | 289,181 | | |
| Assets and liabilities in foreign currencies | | 411 | | |
| Total change in net unrealized appreciation (depreciation) | | | | 289,592 |
| Net gain (loss) | | | | (420,245) |
| Net increase (decrease) in net assets resulting from operations | | | $ | (354,890) |
| Statement of Changes in Net Assets |
| |
| | Six months ended January 31, 2023 (Unaudited) | | Year ended July 31, 2022 |
| Increase (Decrease) in Net Assets | | | | |
| Operations | | | | |
| Net investment income (loss) | $ | 65,355 | $ | 113,743 |
| Net realized gain (loss) | | (709,837) | | (60,440) |
| Change in net unrealized appreciation (depreciation) | | 289,592 | | (838,298) |
| Net increase (decrease) in net assets resulting from operations | | (354,890) | | (784,995) |
| Distributions to shareholders | | (76,041) | | (92,097) |
| Share transactions - net increase (decrease) | | (699,383) | | 1,732,182 |
| Total increase (decrease) in net assets | | (1,130,314) | | 855,090 |
| | | | | |
| Net Assets | | | | |
| Beginning of period | | 7,363,837 | | 6,508,747 |
| End of period | $ | 6,233,523 | $ | 7,363,837 |
| | | | | |
| | | | | |
Financial Highlights
| Fidelity Advisor® Global Real Estate Fund Class A |
| |
| | Six months ended (Unaudited) January 31, 2023 | | Years ended July 31, 2022 | | 2021 | | 2020 | | 2019 | | 2018 |
Selected Per-Share Data | | | | | | | | | | | | |
| Net asset value, beginning of period | $ | 11.18 | $ | 12.49 | $ | 9.69 | $ | 10.72 | $ | 10.13 | $ | 9.81 |
| Income from Investment Operations | | | | | | | | | | | | |
Net investment income (loss) A,B | | .10 | | .17 | | .17 | | .15 | | .22 | | .18 |
| Net realized and unrealized gain (loss) | | (.63) | | (1.33) | | 2.76 | | (.58) | | .58 | | .42 |
| Total from investment operations | | (.53) | | (1.16) | | 2.93 | | (.43) | | .80 | | .60 |
| Distributions from net investment income | | (.09) | | (.15) | | (.13) | | (.23) | | (.15) | | (.13) |
| Distributions from net realized gain | | - | | - | | - | | (.37) | | (.06) | | (.14) |
| Total distributions | | (.09) | | (.15) | | (.13) | | (.60) | | (.21) | | (.28) C |
| Net asset value, end of period | $ | 10.56 | $ | 11.18 | $ | 12.49 | $ | 9.69 | $ | 10.72 | $ | 10.13 |
Total Return D,E,F | | (4.65)% | | (9.40)% | | 30.59% | | (4.61)% | | 8.25% | | 6.16% |
Ratios to Average Net Assets B,G,H | | | | | | | | | | | | |
| Expenses before reductions | | 3.43% I | | 3.19% | | 4.19% | | 4.22% | | 4.56% | | 5.86% |
| Expenses net of fee waivers, if any | | 1.19% I | | 1.28% | | 1.38% | | 1.40% | | 1.40% | | 1.40% |
| Expenses net of all reductions | | 1.19% I | | 1.28% | | 1.37% | | 1.39% | | 1.39% | | 1.38% |
| Net investment income (loss) | | 2.06% I | | 1.45% | | 1.60% | | 1.47% | | 2.09% | | 1.80% |
| Supplemental Data | | | | | | | | | | | | |
| Net assets, end of period (000 omitted) | $ | 2,858 | $ | 3,021 | $ | 2,747 | $ | 1,732 | $ | 3,290 | $ | 1,001 |
Portfolio turnover rate J | | 125% I | | 33% | | 32% | | 52% | | 60% | | 46% |
A Calculated based on average shares outstanding during the period.
B Net investment income (loss) is affected by the timing of the declaration of dividends by any underlying mutual funds or exchange-traded funds (ETFs). Net investment income (loss) of any mutual funds or ETFs is not included in the Fund's net investment income (loss) ratio.
C Total distributions per share do not sum due to rounding.
D Total returns for periods of less than one year are not annualized.
E Total returns would have been lower if certain expenses had not been reduced during the applicable periods shown.
F Total returns do not include the effect of the sales charges.
G Fees and expenses of any underlying mutual funds or exchange-traded funds (ETFs) are not included in the Fund's expense ratio. The Fund indirectly bears its proportionate share of these expenses. For additional expense information related to investments in Fidelity Central Funds, please refer to the "Investments in Fidelity Central Funds" note found in the Notes to Financial Statements section of the most recent Annual or Semi-Annual report.
H Expense ratios reflect operating expenses of the class. Expenses before reductions do not reflect amounts reimbursed, waived, or reduced through arrangements with the investment adviser, brokerage services, or other offset arrangements, if applicable, and do not represent the amount paid by the class during periods when reimbursements, waivers or reductions occur.
I Annualized.
J Amount does not include the portfolio activity of any underlying mutual funds or exchange-traded funds (ETFs).
| Fidelity Advisor® Global Real Estate Fund Class M |
| |
| | Six months ended (Unaudited) January 31, 2023 | | Years ended July 31, 2022 | | 2021 | | 2020 | | 2019 | | 2018 |
Selected Per-Share Data | | | | | | | | | | | | |
| Net asset value, beginning of period | $ | 11.16 | $ | 12.46 | $ | 9.67 | $ | 10.71 | $ | 10.11 | $ | 9.79 |
| Income from Investment Operations | | | | | | | | | | | | |
Net investment income (loss) A,B | | .09 | | .14 | | .14 | | .12 | | .19 | | .15 |
| Net realized and unrealized gain (loss) | | (.64) | | (1.31) | | 2.76 | | (.58) | | .60 | | .42 |
| Total from investment operations | | (.55) | | (1.17) | | 2.90 | | (.46) | | .79 | | .57 |
| Distributions from net investment income | | (.06) | | (.13) | | (.11) | | (.21) | | (.13) | | (.11) |
| Distributions from net realized gain | | - | | - | | - | | (.37) | | (.06) | | (.14) |
| Total distributions | | (.06) | | (.13) | | (.11) | | (.58) | | (.19) | | (.25) |
| Net asset value, end of period | $ | 10.55 | $ | 11.16 | $ | 12.46 | $ | 9.67 | $ | 10.71 | $ | 10.11 |
Total Return C,D,E | | (4.84)% | | (9.51)% | | 30.20% | | (4.87)% | | 8.06% | | 5.90% |
Ratios to Average Net Assets B,F,G | | | | | | | | | | | | |
| Expenses before reductions | | 3.64% H | | 3.39% | | 4.41% | | 4.46% | | 4.79% | | 5.90% |
| Expenses net of fee waivers, if any | | 1.45% H | | 1.52% | | 1.63% | | 1.66% | | 1.65% | | 1.65% |
| Expenses net of all reductions | | 1.44% H | | 1.52% | | 1.62% | | 1.64% | | 1.64% | | 1.63% |
| Net investment income (loss) | | 1.80% H | | 1.21% | | 1.35% | | 1.22% | | 1.84% | | 1.54% |
| Supplemental Data | | | | | | | | | | | | |
| Net assets, end of period (000 omitted) | $ | 943 | $ | 1,070 | $ | 876 | $ | 658 | $ | 810 | $ | 570 |
Portfolio turnover rate I | | 125% H | | 33% | | 32% | | 52% | | 60% | | 46% |
A Calculated based on average shares outstanding during the period.
B Net investment income (loss) is affected by the timing of the declaration of dividends by any underlying mutual funds or exchange-traded funds (ETFs). Net investment income (loss) of any mutual funds or ETFs is not included in the Fund's net investment income (loss) ratio.
C Total returns for periods of less than one year are not annualized.
D Total returns would have been lower if certain expenses had not been reduced during the applicable periods shown.
E Total returns do not include the effect of the sales charges.
F Fees and expenses of any underlying mutual funds or exchange-traded funds (ETFs) are not included in the Fund's expense ratio. The Fund indirectly bears its proportionate share of these expenses. For additional expense information related to investments in Fidelity Central Funds, please refer to the "Investments in Fidelity Central Funds" note found in the Notes to Financial Statements section of the most recent Annual or Semi-Annual report.
G Expense ratios reflect operating expenses of the class. Expenses before reductions do not reflect amounts reimbursed, waived, or reduced through arrangements with the investment adviser, brokerage services, or other offset arrangements, if applicable, and do not represent the amount paid by the class during periods when reimbursements, waivers or reductions occur.
H Annualized.
I Amount does not include the portfolio activity of any underlying mutual funds or exchange-traded funds (ETFs).
| Fidelity Advisor® Global Real Estate Fund Class C |
| |
| | Six months ended (Unaudited) January 31, 2023 | | Years ended July 31, 2022 | | 2021 | | 2020 | | 2019 | | 2018 |
Selected Per-Share Data | | | | | | | | | | | | |
| Net asset value, beginning of period | $ | 11.17 | $ | 12.47 | $ | 9.63 | $ | 10.63 | $ | 10.08 | $ | 9.76 |
| Income from Investment Operations | | | | | | | | | | | | |
Net investment income (loss) A,B | | .07 | | .09 | | .09 | | .07 | | .14 | | .10 |
| Net realized and unrealized gain (loss) | | (.63) | | (1.33) | | 2.75 | | (.58) | | .59 | | .42 |
| Total from investment operations | | (.56) | | (1.24) | | 2.84 | | (.51) | | .73 | | .52 |
| Distributions from net investment income | | (.01) | | (.06) | | - | | (.12) | | (.12) | | (.06) |
| Distributions from net realized gain | | - | | - | | - | | (.37) | | (.06) | | (.14) |
| Total distributions | | (.01) | | (.06) | | - | | (.49) | | (.18) | | (.20) |
| Net asset value, end of period | $ | 10.60 | $ | 11.17 | $ | 12.47 | $ | 9.63 | $ | 10.63 | $ | 10.08 |
Total Return C,D,E | | (5.03)% | | (9.97)% | | 29.49% | | (5.31)% | | 7.52% | | 5.38% |
Ratios to Average Net Assets B,F,G | | | | | | | | | | | | |
| Expenses before reductions | | 4.16% H | | 3.93% | | 5.02% | | 4.46% | | 5.04% | | 6.26% |
| Expenses net of fee waivers, if any | | 1.94% H | | 2.02% | | 2.14% | | 2.16% | | 2.15% | | 2.15% |
| Expenses net of all reductions | | 1.92% H | | 2.02% | | 2.13% | | 2.15% | | 2.14% | | 2.13% |
| Net investment income (loss) | | 1.32% H | | .72% | | .85% | | .71% | | 1.34% | | 1.04% |
| Supplemental Data | | | | | | | | | | | | |
| Net assets, end of period (000 omitted) | $ | 193 | $ | 203 | $ | 223 | $ | 185 | $ | 1,060 | $ | 614 |
Portfolio turnover rate I | | 125% H | | 33% | | 32% | | 52% | | 60% | | 46% |
A Calculated based on average shares outstanding during the period.
B Net investment income (loss) is affected by the timing of the declaration of dividends by any underlying mutual funds or exchange-traded funds (ETFs). Net investment income (loss) of any mutual funds or ETFs is not included in the Fund's net investment income (loss) ratio.
C Total returns for periods of less than one year are not annualized.
D Total returns would have been lower if certain expenses had not been reduced during the applicable periods shown.
E Total returns do not include the effect of the contingent deferred sales charge.
F Fees and expenses of any underlying mutual funds or exchange-traded funds (ETFs) are not included in the Fund's expense ratio. The Fund indirectly bears its proportionate share of these expenses. For additional expense information related to investments in Fidelity Central Funds, please refer to the "Investments in Fidelity Central Funds" note found in the Notes to Financial Statements section of the most recent Annual or Semi-Annual report.
G Expense ratios reflect operating expenses of the class. Expenses before reductions do not reflect amounts reimbursed, waived, or reduced through arrangements with the investment adviser, brokerage services, or other offset arrangements, if applicable, and do not represent the amount paid by the class during periods when reimbursements, waivers or reductions occur.
H Annualized.
I Amount does not include the portfolio activity of any underlying mutual funds or exchange-traded funds (ETFs).
| Fidelity Advisor® Global Real Estate Fund Class I |
| |
| | Six months ended (Unaudited) January 31, 2023 | | Years ended July 31, 2022 | | 2021 | | 2020 | | 2019 | | 2018 |
Selected Per-Share Data | | | | | | | | | | | | |
| Net asset value, beginning of period | $ | 11.21 | $ | 12.51 | $ | 9.71 | $ | 10.75 | $ | 10.15 | $ | 9.82 |
| Income from Investment Operations | | | | | | | | | | | | |
Net investment income (loss) A,B | | .11 | | .20 | | .20 | | .17 | | .24 | | .20 |
| Net realized and unrealized gain (loss) | | (.63) | | (1.32) | | 2.76 | | (.58) | | .59 | | .43 |
| Total from investment operations | | (.52) | | (1.12) | | 2.96 | | (.41) | | .83 | | .63 |
| Distributions from net investment income | | (.12) | | (.18) | | (.16) | | (.26) | | (.17) | | (.16) |
| Distributions from net realized gain | | - | | - | | - | | (.37) | | (.06) | | (.14) |
| Total distributions | | (.12) | | (.18) | | (.16) | | (.63) | | (.23) | | (.30) |
| Net asset value, end of period | $ | 10.57 | $ | 11.21 | $ | 12.51 | $ | 9.71 | $ | 10.75 | $ | 10.15 |
Total Return C,D | | (4.54)% | | (9.12)% | | 30.82% | | (4.40)% | | 8.55% | | 6.48% |
Ratios to Average Net Assets B,E,F | | | | | | | | | | | | |
| Expenses before reductions | | 3.01% G | | 2.94% | | 3.81% | | 3.97% | | 4.20% | | 5.41% |
| Expenses net of fee waivers, if any | | .95% G | | 1.02% | | 1.13% | | 1.16% | | 1.15% | | 1.15% |
| Expenses net of all reductions | | .94% G | | 1.02% | | 1.12% | | 1.14% | | 1.14% | | 1.13% |
| Net investment income (loss) | | 2.30% G | | 1.71% | | 1.85% | | 1.71% | | 2.34% | | 2.04% |
| Supplemental Data | | | | | | | | | | | | |
| Net assets, end of period (000 omitted) | $ | 1,302 | $ | 1,766 | $ | 1,483 | $ | 1,066 | $ | 1,056 | $ | 986 |
Portfolio turnover rate H | | 125% G | | 33% | | 32% | | 52% | | 60% | | 46% |
A Calculated based on average shares outstanding during the period.
B Net investment income (loss) is affected by the timing of the declaration of dividends by any underlying mutual funds or exchange-traded funds (ETFs). Net investment income (loss) of any mutual funds or ETFs is not included in the Fund's net investment income (loss) ratio.
C Total returns for periods of less than one year are not annualized.
D Total returns would have been lower if certain expenses had not been reduced during the applicable periods shown.
E Fees and expenses of any underlying mutual funds or exchange-traded funds (ETFs) are not included in the Fund's expense ratio. The Fund indirectly bears its proportionate share of these expenses. For additional expense information related to investments in Fidelity Central Funds, please refer to the "Investments in Fidelity Central Funds" note found in the Notes to Financial Statements section of the most recent Annual or Semi-Annual report.
F Expense ratios reflect operating expenses of the class. Expenses before reductions do not reflect amounts reimbursed, waived, or reduced through arrangements with the investment adviser, brokerage services, or other offset arrangements, if applicable, and do not represent the amount paid by the class during periods when reimbursements, waivers or reductions occur.
G Annualized.
H Amount does not include the portfolio activity of any underlying mutual funds or exchange-traded funds (ETFs).
| Fidelity Advisor® Global Real Estate Fund Class Z |
| |
| | Six months ended (Unaudited) January 31, 2023 | | Years ended July 31, 2022 | | 2021 | | 2020 | | 2019 A |
Selected Per-Share Data | | | | | | | | | | |
| Net asset value, beginning of period | $ | 11.28 | $ | 12.56 | $ | 9.73 | $ | 10.76 | $ | 10.01 |
| Income from Investment Operations | | | | | | | | | | |
Net investment income (loss) B,C | | .13 | | .22 | | .22 | | .19 | | .22 |
| Net realized and unrealized gain (loss) | | (.65) | | (1.32) | | 2.77 | | (.59) | | .76 |
| Total from investment operations | | (.52) | | (1.10) | | 2.99 | | (.40) | | .98 |
| Distributions from net investment income | | (.12) | | (.18) | | (.16) | | (.26) | | (.17) |
| Distributions from net realized gain | | - | | - | | - | | (.37) | | (.06) |
| Total distributions | | (.12) | | (.18) | | (.16) | | (.63) | | (.23) |
| Net asset value, end of period | $ | 10.64 | $ | 11.28 | $ | 12.56 | $ | 9.73 | $ | 10.76 |
Total Return D,E | | (4.51)% | | (8.93)% | | 31.07% | | (4.29)% | | 10.17% |
Ratios to Average Net Assets C,F,G | | | | | | | | | | |
| Expenses before reductions | | 3.47% H | | 2.71% | | 3.72% | | 3.54% | | 3.87% H |
| Expenses net of fee waivers, if any | | .80% H | | .89% | | .97% | | 1.02% | | 1.00% H |
| Expenses net of all reductions | | .79% H | | .89% | | .96% | | 1.00% | | 1.00% H |
| Net investment income (loss) | | 2.45% H | | 1.84% | | 2.01% | | 1.86% | | 2.50% H |
| Supplemental Data | | | | | | | | | | |
| Net assets, end of period (000 omitted) | $ | 938 | $ | 1,303 | $ | 1,180 | $ | 233 | $ | 306 |
Portfolio turnover rate I | | 125% H | | 33% | | 32% | | 52% | | 60% |
A For the period October 2, 2018 (commencement of sale of shares) through July 31, 2019.
B Calculated based on average shares outstanding during the period.
C Net investment income (loss) is affected by the timing of the declaration of dividends by any underlying mutual funds or exchange-traded funds (ETFs). Net investment income (loss) of any mutual funds or ETFs is not included in the Fund's net investment income (loss) ratio.
D Total returns for periods of less than one year are not annualized.
E Total returns would have been lower if certain expenses had not been reduced during the applicable periods shown.
F Fees and expenses of any underlying mutual funds or exchange-traded funds (ETFs) are not included in the Fund's expense ratio. The Fund indirectly bears its proportionate share of these expenses. For additional expense information related to investments in Fidelity Central Funds, please refer to the "Investments in Fidelity Central Funds" note found in the Notes to Financial Statements section of the most recent Annual or Semi-Annual report.
G Expense ratios reflect operating expenses of the class. Expenses before reductions do not reflect amounts reimbursed, waived, or reduced through arrangements with the investment adviser, brokerage services, or other offset arrangements, if applicable, and do not represent the amount paid by the class during periods when reimbursements, waivers or reductions occur.
H Annualized.
I Amount does not include the portfolio activity of any underlying mutual funds or exchange-traded funds (ETFs).
For the period ended January 31, 2023
1. Organization.
Fidelity Advisor Global Real Estate Fund (the Fund) is a fund of Fidelity Advisor Series VII (the Trust) and is authorized to issue an unlimited number of shares. The Trust is registered under the Investment Company Act of 1940, as amended (the 1940 Act), as an open-end management investment company organized as a Massachusetts business trust. The Fund offers Class A, Class M, Class C, Class I and Class Z shares, each of which has equal rights as to assets and voting privileges. Each class has exclusive voting rights with respect to matters that affect that class. Class C shares will automatically convert to Class A shares after a holding period of eight years from the initial date of purchase, with certain exceptions.
2. Investments in Fidelity Central Funds.
Funds may invest in Fidelity Central Funds, which are open-end investment companies generally available only to other investment companies and accounts managed by the investment adviser and its affiliates. The Schedule of Investments lists any Fidelity Central Funds held as an investment as of period end, but does not include the underlying holdings of each Fidelity Central Fund. An investing fund indirectly bears its proportionate share of the expenses of the underlying Fidelity Central Funds.
Based on its investment objective, each Fidelity Central Fund may invest or participate in various investment vehicles or strategies that are similar to those of the investing fund. These strategies are consistent with the investment objectives of the investing fund and may involve certain economic risks which may cause a decline in value of each of the Fidelity Central Funds and thus a decline in the value of the investing fund.
| Fidelity Central Fund | Investment Manager | Investment Objective | Investment Practices | Expense Ratio A |
| Fidelity Money Market Central Funds | Fidelity Management & Research Company LLC (FMR) | Each fund seeks to obtain a high level of current income consistent with the preservation of capital and liquidity. | Short-term Investments | Less than .005% |
A Expenses expressed as a percentage of average net assets and are as of each underlying Central Fund's most recent annual or semi-annual shareholder report.
A complete unaudited list of holdings for each Fidelity Central Fund is available upon request or at the Securities and Exchange Commission website at www.sec.gov. In addition, the financial statements of the Fidelity Central Funds which contain the significant accounting policies (including investment valuation policies) of those funds, and are not covered by the Report of Independent Registered Public Accounting Firm, are available on the Securities and Exchange Commission website or upon request.
3. Significant Accounting Policies.
The Fund is an investment company and applies the accounting and reporting guidance of the Financial Accounting Standards Board (FASB) Accounting Standards Codification Topic 946 Financial Services - Investment Companies . The financial statements have been prepared in conformity with accounting principles generally accepted in the United States of America (GAAP), which require management to make certain estimates and assumptions at the date of the financial statements. Actual results could differ from those estimates. Subsequent events, if any, through the date that the financial statements were issued have been evaluated in the preparation of the financial statements. The Fund's Schedule of Investments lists any underlying mutual funds or exchange-traded funds (ETFs) but does not include the underlying holdings of these funds. The following summarizes the significant accounting policies of the Fund:
Investment Valuation. Investments are valued as of 4:00 p.m. Eastern time on the last calendar day of the period. The Board of Trustees (the Board) has designated the Fund's investment adviser as the valuation designee responsible for the fair valuation function and performing fair value determinations as needed. The investment adviser has established a Fair Value Committee (the Committee) to carry out the day-to-day fair valuation responsibilities and has adopted policies and procedures to govern the fair valuation process and the activities of the Committee. In accordance with these fair valuation policies and procedures, which have been approved by the Board, the Fund attempts to obtain prices from one or more third party pricing services or brokers to value its investments. When current market prices, quotations or currency exchange rates are not readily available or reliable, investments will be fair valued in good faith by the Committee, in accordance with the policies and procedures. Factors used in determining fair value vary by investment type and may include market or investment specific events, transaction data, estimated cash flows, and market observations of comparable investments. The frequency that the fair valuation procedures are used cannot be predicted and they may be utilized to a significant extent. The Committee manages the Fund's fair valuation practices and maintains the fair valuation policies and procedures. The Fund's investment adviser reports to the Board information regarding the fair valuation process and related material matters.
The Fund categorizes the inputs to valuation techniques used to value its investments into a disclosure hierarchy consisting of three levels as shown below:
Level 1 - unadjusted quoted prices in active markets for identical investments
Level 2 - other significant observable inputs (including quoted prices for similar investments, interest rates, prepayment speeds, etc.)
Level 3 - unobservable inputs (including the Fund's own assumptions based on the best information available)
Valuation techniques used to value the Fund's investments by major category are as follows:
Equity securities, including restricted securities, for which market quotations are readily available, are valued at the last reported sale price or official closing price as reported by a third party pricing service on the primary market or exchange on which they are traded and are categorized as Level 1 in the hierarchy. In the event there were no sales during the day or closing prices are not available, securities are valued at the last quoted bid price or may be valued using the last available price and are generally categorized as Level 2 in the hierarchy. For foreign equity securities, when market or security specific events arise, comparisons to the valuation of American Depositary Receipts (ADRs), futures contracts, ETFs and certain indexes as well as quoted prices for similar securities may be used and would be categorized as Level 2 in the hierarchy. For equity securities, including restricted securities, where observable inputs are limited, assumptions about market activity and risk are used and these securities may be categorized as Level 3 in the hierarchy.
Investments in open-end mutual funds, including the Fidelity Central Funds, are valued at their closing net asset value (NAV) each business day and are categorized as Level 1 in the hierarchy.
Changes in valuation techniques may result in transfers in or out of an assigned level within the disclosure hierarchy. The aggregate value of investments by input level as of January 31, 2023 is included at the end of the Fund's Schedule of Investments.
Foreign Currency. Certain Funds may use foreign currency contracts to facilitate transactions in foreign-denominated securities. Gains and losses from these transactions may arise from changes in the value of the foreign currency or if the counterparties do not perform under the contracts' terms.
Foreign-denominated assets, including investment securities, and liabilities are translated into U.S. dollars at the exchange rates at period end. Purchases and sales of investment securities, income and dividends received, and expenses denominated in foreign currencies are translated into U.S. dollars at the exchange rate in effect on the transaction date.
The effects of exchange rate fluctuations on investments are included with the net realized and unrealized gain (loss) on investment securities. Other foreign currency transactions resulting in realized and unrealized gain (loss) are disclosed separately.
Investment Transactions and Income. For financial reporting purposes, the Fund's investment holdings and NAV include trades executed through the end of the last business day of the period. The NAV per share for processing shareholder transactions is calculated as of the close of business of the New York Stock Exchange (NYSE), normally 4:00 p.m. Eastern time and includes trades executed through the end of the prior business day. Gains and losses on securities sold are determined on the basis of identified cost. Commissions paid to certain brokers with whom the investment adviser, or its affiliates, places trades on behalf of a fund include an amount in addition to trade execution, which may be rebated back to a fund. Any such rebates are included in net realized gain (loss) on investments in the Statement of Operations. Dividend income is recorded on the ex-dividend date, except for certain dividends from foreign securities where the ex-dividend date may have passed, which are recorded as soon as the Fund is informed of the ex-dividend date. Non-cash dividends included in dividend income, if any, are recorded at the fair market value of the securities received. Income and capital gain distributions from Fidelity Central Funds, if any, are recorded on the ex-dividend date. Certain distributions received by the Fund represent a return of capital or capital gain. The Fund determines the components of these distributions subsequent to the ex-dividend date, based upon receipt of tax filings or other correspondence relating to the underlying investment. These distributions are recorded as a reduction of cost of investments and/or as a realized gain. Investment income is recorded net of foreign taxes withheld where recovery of such taxes is uncertain. Funds may file withholding tax reclaims in certain jurisdictions to recover a portion of amounts previously withheld. Any withholding tax reclaims income is included in the Statement of Operations in dividends. Any receivables for withholding tax reclaims are included in the Statement of Assets and Liabilities in dividends receivable.
Class Allocations and Expenses. Investment income, realized and unrealized capital gains and losses, common expenses of a fund, and certain fund-level expense reductions, if any, are allocated daily on a pro-rata basis to each class based on the relative net assets of each class to the total net assets of a fund. Each class differs with respect to transfer agent and distribution and service plan fees incurred, as applicable. Certain expense reductions may also differ by class, if applicable. For the reporting period, the allocated portion of income and expenses to each class as a percent of its average net assets may vary due to the timing of recording these transactions in relation to fluctuating net assets of the classes. Expenses directly attributable to a fund are charged to that fund. Expenses attributable to more than one fund are allocated among the respective funds on the basis of relative net assets or other appropriate methods. Expenses included in the accompanying financial statements reflect the expenses of that fund and do not include any expenses associated with any underlying mutual funds or exchange-traded funds. Although not included in a fund's expenses, a fund indirectly bears its proportionate share of these expenses through the net asset value of each underlying mutual fund or exchange-traded fund. Expense estimates are accrued in the period to which they relate and adjustments are made when actual amounts are known.
Income Tax Information and Distributions to Shareholders. Each year, the Fund intends to qualify as a regulated investment company under Subchapter M of the Internal Revenue Code, including distributing substantially all of its taxable income and realized gains. As a result, no provision for U.S. Federal income taxes is required. The Fund files a U.S. federal tax return, in addition to state and local tax returns as required. The Fund's federal income tax returns are subject to examination by the Internal Revenue Service (IRS) for a period of three fiscal years after they are filed. State and local tax returns may be subject to examination for an additional fiscal year depending on the jurisdiction. Foreign taxes are provided for based on the Fund's understanding of the tax rules and rates that exist in the foreign markets in which it invests.
Distributions are declared and recorded on the ex-dividend date. Income and capital gain distributions are declared separately for each class. Income and capital gain distributions are determined in accordance with income tax regulations, which may differ from GAAP.
Capital accounts within the financial statements are adjusted for permanent book-tax differences. These adjustments have no impact on net assets or the results of operations. Capital accounts are not adjusted for temporary book-tax differences which will reverse in a subsequent period.
Book-tax differences are primarily due to foreign currency transactions, passive foreign investment companies (PFIC), capital loss carryforwards and losses deferred due to wash sales.
As of period end, the cost and unrealized appreciation (depreciation) in securities, and derivatives if applicable, for federal income tax purposes were as follows:
| Gross unrealized appreciation | $995,600 |
| Gross unrealized depreciation | (251,021) |
| Net unrealized appreciation (depreciation) | $744,579 |
| Tax cost | $5,546,534 |
Capital loss carryforwards are only available to offset future capital gains of the Fund to the extent provided by regulations and may be limited. The capital loss carryforward information presented below, including any applicable limitation, is estimated as of prior fiscal period end and is subject to adjustment.
4. Purchases and Sales of Investments.
Purchases and sales of securities, other than short-term securities and in-kind transactions, as applicable, are noted in the table below.
| | Purchases ($) | Sales ($) |
| Fidelity Advisor Global Real Estate Fund | 3,891,346 | 4,485,368 |
5. Fees and Other Transactions with Affiliates.
Management Fee. Fidelity Management & Research Company LLC (the investment adviser) and its affiliates provide the Fund with investment management related services for which the Fund pays a monthly management fee. The management fee is the sum of an individual fund fee rate that is based on an annual rate of .45% of the Fund's average net assets and an annualized group fee rate that averaged .23% during the period. The group fee rate is based upon the monthly average net assets of a group of registered investment companies with which the investment adviser has management contracts. The group fee rate decreases as assets under management increase and increases as assets under management decrease. For the reporting period, the total annualized management fee rate was .68% of the Fund's average net assets.
Distribution and Service Plan Fees. In accordance with Rule 12b-1 of the 1940 Act, the Fund has adopted separate Distribution and Service Plans for each class of shares. Certain classes pay Fidelity Distributors Company LLC (FDC), an affiliate of the investment adviser, separate Distribution and Service Fees, each of which is based on an annual percentage of each class' average net assets. In addition, FDC may pay financial intermediaries for selling shares of the Fund and providing shareholder support services. For the period, the Distribution and Service Fee rates, total fees and amounts retained by FDC were as follows:
| | Distribution Fee | Service Fee | Total Fees | Retained by FDC |
| Class A | - % | .25% | $3,311 | $1,356 |
| Class M | .25% | .25% | 2,338 | 1,320 |
| Class C | .75% | .25% | 923 | 288 |
| | | | $6,572 | $2,964 |
Sales Load. FDC may receive a front-end sales charge of up to 5.75% for selling Class A shares and 3.50% for selling Class M shares, some of which is paid to financial intermediaries for selling shares of the Fund. Depending on the holding period, FDC may receive contingent deferred sales charges levied on Class A, Class M and Class C redemptions. The deferred sales charges are 1.00% for Class C shares, 1.00% for certain purchases of Class A shares and .25% for certain purchases of Class M shares.
For the period, sales charge amounts retained by FDC were as follows:
| | Retained by FDC |
| Class A | $562 |
| Class M | 54 |
Class C A | 1 |
| | $617 |
A When Class C shares are initially sold, FDC pays commissions from its own resources to financial intermediaries through which the sales are made.
Transfer Agent Fees. Fidelity Investments Institutional Operations Company LLC (FIIOC), an affiliate of the investment adviser, is the transfer, dividend disbursing and shareholder servicing agent for each class of the Fund. FIIOC receives account fees and asset-based fees that vary according to the account size and type of account of the shareholders of the respective classes of the Fund, except for Class Z. FIIOC receives an asset-based fee of Class Z's average net assets. FIIOC pays for typesetting, printing and mailing of shareholder reports, except proxy statements.
For the period, transfer agent fees for each class were as follows:
| | Amount | % of Class-Level Average Net Assets A |
| Class A | $3,308 | .25 |
| Class M | 969 | .21 |
| Class C | 234 | .25 |
| Class I | 1,869 | .21 |
| Class Z | 135 | .04 |
| | $6,515 | |
A Annualized
Accounting Fees. Fidelity Service Company, Inc. (FSC), an affiliate of the investment adviser, maintains the Fund's accounting records. The accounting fee is based on the level of average net assets for each month. For the period, the fees were equivalent to the following annualized rates:
| | % of Average Net Assets |
| Fidelity Advisor Global Real Estate Fund | .04 |
Brokerage Commissions. A portion of portfolio transactions were placed with brokerage firms which are affiliates of the investment adviser. Brokerage commissions are included in net realized gain (loss) and change in net unrealized appreciation (depreciation) in the Statement of Operations. The commissions paid to these affiliated firms were as follows:
| | Amount |
| Fidelity Advisor Global Real Estate Fund | $55 |
Interfund Trades. Funds may purchase from or sell securities to other Fidelity Funds under procedures adopted by the Board. The procedures have been designed to ensure these interfund trades are executed in accordance with Rule 17a-7 of the 1940 Act. Any interfund trades are included within the respective purchases and sales amounts shown in the Purchases and Sales of Investments note. Interfund trades during the period are noted in the table below.
| | Purchases ($) | Sales ($) | Realized Gain (Loss) ($) |
| Fidelity Advisor Global Real Estate Fund | 85,614 | 44,709 | 21 |
6. Committed Line of Credit.
Certain Funds participate with other funds managed by the investment adviser or an affiliate in a $4.25 billion credit facility (the "line of credit") to be utilized for temporary or emergency purposes to fund shareholder redemptions or for other short-term liquidity purposes. The participating funds have agreed to pay commitment fees on their pro-rata portion of the line of credit, which are reflected in Miscellaneous expenses on the Statement of Operations, and are listed below. During the period, there were no borrowings on this line of credit.
| | Amount |
| Fidelity Advisor Global Real Estate Fund | $9 |
7. Expense Reductions.
The investment adviser contractually agreed to reimburse expenses of each class to the extent annual operating expenses exceeded certain levels of class-level average net assets as noted in the table below. This reimbursement will remain in place through November 30, 2023. Some expenses, for example the compensation of the independent Trustees, and certain miscellaneous expenses such as proxy and shareholder meeting expenses, are excluded from this reimbursement.
The following classes were in reimbursement during the period:
| | Expense Limitations | Reimbursement |
| Class A | 1.20% | $29,585 |
| Class M | 1.45% | 10,260 |
| Class C | 1.95% | 2,049 |
| Class I | .95% | 18,334 |
| Class Z | .80% | 8,625 |
| | | $68,853 |
Through arrangements with the Fund's custodian, credits realized as a result of certain uninvested cash balances were used to reduce the Fund's expenses. During the period, custodian credits reduced the Fund's expenses by $182. During the period, transfer agent credits reduced each class' expenses as noted in the table below.
| | Expense reduction |
| Class A | $14 |
| Class C | 7 |
| | $21 |
In addition, during the period the investment adviser or an affiliate reimbursed and/or waived a portion of fund-level operating expenses in the amount of $117.
8. Distributions to Shareholders.
Distributions to shareholders of each class were as follows:
| | Six months ended January 31, 2023 | Year ended July 31, 2022 |
| Fidelity Advisor Global Real Estate Fund | | |
| Distributions to shareholders | | |
| Class A | $23,736 | $40,544 |
| Class M | 5,995 | 10,997 |
| Class C | 136 | 1,175 |
| Class I | 43,870 | 21,272 |
| Class Z | 2,304 | 18,109 |
Total | $76,041 | $92,097 |
9. Share Transactions.
Share transactions for each class were as follows and may contain in-kind transactions, automatic conversions between classes or exchanges between affiliated funds:
| | Shares | Shares | Dollars | Dollars |
| | Six months ended January 31, 2023 | Year ended July 31, 2022 | Six months ended January 31, 2023 | Year ended July 31, 2022 |
| Fidelity Advisor Global Real Estate Fund | | | | |
| Class A | | | | |
| Shares sold | 29,756 | 92,564 | $291,875 | $1,135,946 |
| Reinvestment of distributions | 2,489 | 3,246 | 23,736 | 40,544 |
| Shares redeemed | (31,793) | (45,679) | (315,146) | (547,402) |
| Net increase (decrease) | 452 | 50,131 | $465 | $629,088 |
| Class M | | | | |
| Shares sold | 1,680 | 31,478 | $16,580 | $387,783 |
| Reinvestment of distributions | 629 | 881 | 5,995 | 10,997 |
| Shares redeemed | (8,893) | (6,761) | (85,169) | (71,550) |
| Net increase (decrease) | (6,584) | 25,598 | $(62,594) | $327,230 |
| Class C | | | | |
| Shares sold | 2,624 | 7,240 | $26,012 | $88,337 |
| Reinvestment of distributions | 14 | 94 | 136 | 1,175 |
| Shares redeemed | (2,612) | (7,027) | (26,361) | (75,141) |
| Net increase (decrease) | 26 | 307 | $(213) | $14,371 |
| Class I | | | | |
| Shares sold | 257,336 | 45,989 | $2,511,835 | $534,191 |
| Reinvestment of distributions | 4,304 | 1,446 | 41,084 | 18,078 |
| Shares redeemed | (295,934) | (8,457) | (2,946,361) | (90,325) |
| Net increase (decrease) | (34,294) | 38,978 | $(393,442) | $461,944 |
| Class Z | | | | |
| Shares sold | 78,380 | 127,231 | $753,031 | $1,565,852 |
| Reinvestment of distributions | 240 | 1,442 | 2,304 | 18,109 |
| Shares redeemed | (106,051) | (106,982) | (998,934) | (1,284,412) |
| Net increase (decrease) | (27,431) | 21,691 | $(243,599) | $299,549 |
10. Other.
A fund's organizational documents provide former and current trustees and officers with a limited indemnification against liabilities arising in connection with the performance of their duties to the fund. In the normal course of business, a fund may also enter into contracts that provide general indemnifications. A fund's maximum exposure under these arrangements is unknown as this would be dependent on future claims that may be made against a fund. The risk of material loss from such claims is considered remote.
At the end of the period, the investment adviser or its affiliates were owners of record of more than 10% of the outstanding shares as follows:
| Fund | Affiliated % |
Fidelity Advisor Global Real Estate Fund | 40% |
11. Risk and Uncertainties.
Many factors affect a fund's performance. Developments that disrupt global economies and financial markets, such as pandemics, epidemics, outbreaks of infectious diseases, war, terrorism, and environmental disasters, may significantly affect a fund's investment performance. The effects of these developments to a fund will be impacted by the types of securities in which a fund invests, the financial condition, industry, economic sector, and geographic location of an issuer, and a fund's level of investment in the securities of that issuer.
As a shareholder, you incur two types of costs: (1) transaction costs, which may include sales charges (loads) on purchase payments or redemption proceeds, as applicable and (2) ongoing costs, which generally include management fees, distribution and/or service (12b-1) fees and other Fund expenses. This Example is intended to help you understand your ongoing costs (in dollars) of investing in a fund and to compare these costs with the ongoing costs of investing in other mutual funds.
| The Example is based on an investment of $1,000 invested at the beginning of the period and held for the entire period (August 1, 2022 to January 31, 2023). |
Actual Expenses
The first line of the accompanying table provides information about actual account values and actual expenses. You may use the information in this line, together with the amount you invested, to estimate the expenses that you paid over the period. Simply divide your account value by $1,000.00 (for example, an $8,600 account value divided by $1,000.00 = 8.6), then multiply the result by the number in the first line for a class/Fund under the heading entitled "Expenses Paid During Period" to estimate the expenses you paid on your account during this period. If any fund is a shareholder of any underlying mutual funds or exchange-traded funds (ETFs) (the Underlying Funds), such fund indirectly bears its proportional share of the expenses of the Underlying Funds in addition to the direct expenses incurred presented in the table. These fees and expenses are not included in the annualized expense ratio used to calculate the expense estimate in the table below.
Hypothetical Example for Comparison Purposes
The second line of the accompanying table provides information about hypothetical account values and hypothetical expenses based on the actual expense ratio and an assumed rate of return of 5% per year before expenses, which is not the actual return. The hypothetical account values and expenses may not be used to estimate the actual ending account balance or expenses you paid for the period. You may use this information to compare the ongoing costs of investing in the Fund and other funds. To do so, compare this 5% hypothetical example with the 5% hypothetical examples that appear in the shareholder reports of the other funds. If any fund is a shareholder of any Underlying Funds, such fund indirectly bears its proportional share of the expenses of the Underlying Funds in addition to the direct expenses as presented in the table. These fees and expenses are not included in the annualized expense ratio used to calculate the expense estimate in the table below.
Please note that the expenses shown in the table are meant to highlight your ongoing costs only and do not reflect any transaction costs. Therefore, the second line of the table is useful in comparing ongoing costs only, and will not help you determine the relative total costs of owning different funds. In addition, if these transactional costs were included, your costs would have been higher.
| | | | | Annualized Expense Ratio- A | | Beginning Account Value August 1, 2022 | | Ending Account Value January 31, 2023 | | Expenses Paid During Period- C August 1, 2022 to January 31, 2023 |
| Fidelity Advisor® Global Real Estate Fund | | | | | | | | | | |
| Class A | | | | 1.19% | | | | | | |
| Actual | | | | | | $ 1,000 | | $ 953.50 | | $ 5.86 |
Hypothetical- B | | | | | | $ 1,000 | | $ 1,019.21 | | $ 6.06 |
| Class M | | | | 1.45% | | | | | | |
| Actual | | | | | | $ 1,000 | | $ 951.60 | | $ 7.13 |
Hypothetical- B | | | | | | $ 1,000 | | $ 1,017.90 | | $ 7.38 |
| Class C | | | | 1.94% | | | | | | |
| Actual | | | | | | $ 1,000 | | $ 949.70 | | $ 9.53 |
Hypothetical- B | | | | | | $ 1,000 | | $ 1,015.43 | | $ 9.86 |
| Class I | | | | .95% | | | | | | |
| Actual | | | | | | $ 1,000 | | $ 954.60 | | $ 4.68 |
Hypothetical- B | | | | | | $ 1,000 | | $ 1,020.42 | | $ 4.84 |
| Class Z | | | | .80% | | | | | | |
| Actual | | | | | | $ 1,000 | | $ 954.90 | | $ 3.94 |
Hypothetical- B | | | | | | $ 1,000 | | $ 1,021.17 | | $ 4.08 |
| |
A Annualized expense ratio reflects expenses net of applicable fee waivers.
B 5% return per year before expenses
C Expenses are equal to the annualized expense ratio, multiplied by the average account value over the period, multiplied by 184/ 365 (to reflect the one-half year period). The fees and expenses of any Underlying Funds are not included in each annualized expense ratio.
The Securities and Exchange Commission adopted Rule 22e-4 under the Investment Company Act of 1940 (the Liquidity Rule) to promote effective liquidity risk management throughout the open-end investment company industry, thereby reducing the risk that funds will be unable to meet their redemption obligations and mitigating dilution of the interests of fund shareholders.
The Fund has adopted and implemented a liquidity risk management program (the Program) reasonably designed to assess and manage the Fund's liquidity risk and to comply with the requirements of the Liquidity Rule. The Fund's Board of Trustees (the Board) has designated the Fund's investment adviser as administrator of the Program. The Fidelity advisers have established a Liquidity Risk Management Committee (the LRM Committee) to manage the Program for each of the Fidelity Funds. The LRM Committee monitors the adequacy and effectiveness of implementation of the Program and on a periodic basis assesses each Fund's liquidity risk based on a variety of factors including (1) the Fund's investment strategy, (2) portfolio liquidity and cash flow projections during normal and reasonably foreseeable stressed conditions, (3) shareholder redemptions, (4) borrowings and other funding sources and (5) certain factors specific to ETFs including the effect of the Fund's prices and spreads, market participants, and basket compositions on the overall liquidity of the Fund's portfolio, as applicable.
In accordance with the Program, each of the Fund's portfolio investments is classified into one of four defined liquidity categories based on a determination of a reasonable expectation for how long it would take to convert the investment to cash (or sell or dispose of the investment) without significantly changing its market value.
- Highly liquid investments - cash or convertible to cash within three business days or less
- Moderately liquid investments - convertible to cash in three to seven calendar days
- Less liquid investments - can be sold or disposed of, but not settled, within seven calendar days
- Illiquid investments - cannot be sold or disposed of within seven calendar days
Liquidity classification determinations take into account a variety of factors including various market, trading and investment-specific considerations, as well as market depth, and generally utilize analysis from a third-party liquidity metrics service.
The Liquidity Rule places a 15% limit on a fund's illiquid investments and requires funds that do not primarily hold assets that are highly liquid investments to determine and maintain a minimum percentage of the fund's net assets to be invested in highly liquid investments (highly liquid investment minimum or HLIM). The Program includes provisions reasonably designed to comply with the 15% limit on illiquid investments and for determining, periodically reviewing and complying with the HLIM requirement as applicable.
At a recent meeting of the Fund's Board of Trustees, the LRM Committee provided a written report to the Board pertaining to the operation, adequacy, and effectiveness of the Program for the period December 1, 2021 through November 30, 2022. The report concluded that the Program is operating effectively and is reasonably designed to assess and manage the Fund's liquidity risk.
1.9881281.106
AGRE-SANN-0423
Item 2.
Code of Ethics
Not applicable.
Item 3.
Audit Committee Financial Expert
Not applicable.
Item 4.
Principal Accountant Fees and Services
Not applicable.
Item 5.
Audit Committee of Listed Registrants
Not applicable.
Item 6.
Investments
(a)
Not applicable.
(b)
Not applicable
Item 7.
Disclosure of Proxy Voting Policies and Procedures for Closed-End Management Investment Companies
Not applicable.
Item 8.
Portfolio Managers of Closed-End Management Investment Companies
Not applicable.
Item 9.
Purchase of Equity Securities by Closed-End Management Investment Company and Affiliated Purchasers
Not applicable.
Item 10.
Submission of Matters to a Vote of Security Holders
There were no material changes to the procedures by which shareholders may recommend nominees to the Fidelity Advisor Series VII’s Board of Trustees.
Item 11.
Controls and Procedures
(a)(i) The President and Treasurer and the Chief Financial Officer have concluded that the Fidelity Advisor Series VII’s (the “Trust”) disclosure controls and procedures (as
defined in Rule 30a-3(c) under the Investment Company Act) provide reasonable assurances that material information relating to the Trust is made known to them by the appropriate persons, based on their evaluation of these controls and procedures as of a date within 90 days of the filing date of this report.
(a)(ii) There was no change in the Trust’s internal control over financial reporting (as defined in Rule 30a-3(d) under the Investment Company Act) that occurred during the period covered by this report that has materially affected, or is reasonably likely to materially affect, the Trust’s internal control over financial reporting.
Item 12.
Disclosure of Securities Lending Activities for Closed-End Management
Investment Companies
Not applicable.
Item 13.
Exhibits
SIGNATURES
Pursuant to the requirements of the Securities Exchange Act of 1934 and the Investment Company Act of 1940, the registrant has duly caused this report to be signed on its behalf by the undersigned, thereunto duly authorized.
Fidelity Advisor Series VII
| |
By: | /s/Stacie M. Smith |
| Stacie M. Smith |
| President and Treasurer |
|
|
Date: | March 23, 2023 |
Pursuant to the requirements of the Securities Exchange Act of 1934 and the Investment Company Act of 1940, this report has been signed below by the following persons on behalf of the registrant and in the capacities and on the dates indicated.
| |
By: | /s/Stacie M. Smith |
| Stacie M. Smith |
| President and Treasurer |
|
|
Date: | March 23, 2023 |
| |
By: | /s/John J. Burke III |
| John J. Burke III |
| Chief Financial Officer |
|
|
Date: | March 23, 2023 |