Fidelity Advisor® Real Estate Fund
Semi-Annual Report
January 31, 2021


Contents
To view a fund's proxy voting guidelines and proxy voting record for the 12-month period ended June 30, visit http://www.fidelity.com/proxyvotingresults or visit the Securities and Exchange Commission's (SEC) web site at http://www.sec.gov.
You may also call 1-877-208-0098 to request a free copy of the proxy voting guidelines.
Standard & Poor's, S&P and S&P 500 are registered service marks of The McGraw-Hill Companies, Inc. and have been licensed for use by Fidelity Distributors Corporation.
Other third-party marks appearing herein are the property of their respective owners.
All other marks appearing herein are registered or unregistered trademarks or service marks of FMR LLC or an affiliated company. © 2021 FMR LLC. All rights reserved.
This report and the financial statements contained herein are submitted for the general information of the shareholders of the Fund. This report is not authorized for distribution to prospective investors in the Fund unless preceded or accompanied by an effective prospectus.
A fund files its complete schedule of portfolio holdings with the SEC for the first and third quarters of each fiscal year on Form N-PORT. Forms N-PORT are available on the SEC’s web site at http://www.sec.gov. A fund's Forms N-PORT may be reviewed and copied at the SEC’s Public Reference Room in Washington, DC. Information regarding the operation of the SEC's Public Reference Room may be obtained by calling 1-800-SEC-0330.
For a complete list of a fund's portfolio holdings, view the most recent holdings listing, semiannual report, or annual report on Fidelity's web site at http://www.fidelity.com, http://www.institutional.fidelity.com, or http://www.401k.com, as applicable.
NOT FDIC INSURED •MAY LOSE VALUE •NO BANK GUARANTEE
Neither the Fund nor Fidelity Distributors Corporation is a bank.
Note to Shareholders:
Early in 2020, the outbreak and spread of a new coronavirus emerged as a public health emergency that had a major influence on financial markets, primarily based on its impact on the global economy and the outlook for corporate earnings. The virus causes a respiratory disease known as COVID-19. On March 11, the World Health Organization declared the COVID-19 outbreak a pandemic, citing sustained risk of further global spread.
In the weeks following, as the crisis worsened, we witnessed an escalating human tragedy with wide-scale social and economic consequences from coronavirus-containment measures. The outbreak of COVID-19 prompted a number of measures to limit the spread, including travel and border restrictions, quarantines, and restrictions on large gatherings. In turn, these resulted in lower consumer activity, diminished demand for a wide range of products and services, disruption in manufacturing and supply chains, and – given the wide variability in outcomes regarding the outbreak – significant market uncertainty and volatility. Amid the turmoil, global governments and central banks took unprecedented action to help support consumers, businesses, and the broader economies, and to limit disruption to financial systems.
The situation continues to unfold, and the extent and duration of its impact on financial markets and the economy remain highly uncertain. Extreme events such as the coronavirus crisis are “exogenous shocks” that can have significant adverse effects on mutual funds and their investments. Although multiple asset classes may be affected by market disruption, the duration and impact may not be the same for all types of assets.
Fidelity is committed to helping you stay informed amid news about COVID-19 and during increased market volatility, and we’re taking extra steps to be responsive to customer needs. We encourage you to visit our websites, where we offer ongoing updates, commentary, and analysis on the markets and our funds.
Investment Summary (Unaudited)
Top Ten Stocks as of January 31, 2021
| | % of fund's net assets |
| American Tower Corp. | 15.9 |
| Digital Realty Trust, Inc. | 10.8 |
| Prologis (REIT), Inc. | 10.5 |
| CubeSmart | 6.6 |
| CBRE Group, Inc. | 5.0 |
| VICI Properties, Inc. | 4.8 |
| Mid-America Apartment Communities, Inc. | 4.7 |
| Essex Property Trust, Inc. | 4.6 |
| Ventas, Inc. | 4.5 |
| Four Corners Property Trust, Inc. | 4.3 |
| | 71.7 |
Top Five REIT Sectors as of January 31, 2021
| | % of fund's net assets |
| REITs - Diversified | 19.4 |
| REITs - Management/Investment | 17.6 |
| REITs - Apartments | 13.2 |
| REITs - Warehouse/Industrial | 13.0 |
| REITs - Storage | 7.7 |
Asset Allocation (% of fund's net assets)
| As of January 31, 2021 |
| | Stocks | 99.6% |
| | Short-Term Investments and Net Other Assets (Liabilities) | 0.4% |

Schedule of Investments January 31, 2021 (Unaudited)
Showing Percentage of Net Assets
| Common Stocks - 99.6% | | | |
| | | Shares | Value |
| Equity Real Estate Investment Trusts (REITs) - 93.8% | | | |
| REITs - Apartments - 13.2% | | | |
| Essex Property Trust, Inc. | | 76,747 | $18,389,349 |
| Invitation Homes, Inc. | | 536,200 | 15,807,176 |
| Mid-America Apartment Communities, Inc. | | 142,600 | 18,930,150 |
| | | | 53,126,675 |
| REITs - Diversified - 19.4% | | | |
| Digital Realty Trust, Inc. | | 303,500 | 43,688,825 |
| Lamar Advertising Co. Class A | | 101,100 | 8,166,858 |
| SBA Communications Corp. Class A | | 26,700 | 7,173,489 |
| VICI Properties, Inc. | | 760,100 | 19,215,328 |
| | | | 78,244,500 |
| REITs - Health Care - 7.7% | | | |
| Healthcare Realty Trust, Inc. | | 423,300 | 12,703,233 |
| Ventas, Inc. | | 393,605 | 18,133,382 |
| | | | 30,836,615 |
| REITs - Hotels - 3.5% | | | |
| RLJ Lodging Trust | | 1,093,026 | 14,110,966 |
| REITs - Management/Investment - 17.6% | | | |
| American Tower Corp. | | 280,800 | 63,842,688 |
| Weyerhaeuser Co. | | 224,800 | 7,011,512 |
| | | | 70,854,200 |
| REITs - Manufactured Homes - 2.5% | | | |
| Equity Lifestyle Properties, Inc. | | 165,706 | 10,081,553 |
| REITs - Office Property - 4.9% | | | |
| Alexandria Real Estate Equities, Inc. | | 69,900 | 11,680,989 |
| Douglas Emmett, Inc. | | 293,900 | 8,143,969 |
| | | | 19,824,958 |
| REITs - Single Tenant - 4.3% | | | |
| Four Corners Property Trust, Inc. | | 664,300 | 17,510,948 |
| REITs - Storage - 7.7% | | | |
| CubeSmart | | 759,200 | 26,450,528 |
| Iron Mountain, Inc. (a) | | 135,000 | 4,545,450 |
| | | | 30,995,978 |
| REITs - Warehouse/Industrial - 13.0% | | | |
| Americold Realty Trust (a) | | 289,700 | 10,113,427 |
| Prologis (REIT), Inc. | | 411,354 | 42,451,733 |
| | | | 52,565,160 |
|
| TOTAL EQUITY REAL ESTATE INVESTMENT TRUSTS (REITS) | | | 378,151,553 |
|
| Hotels, Restaurants & Leisure - 0.8% | | | |
| Casinos & Gaming - 0.8% | | | |
| Caesars Entertainment, Inc. (b) | | 42,800 | 3,012,692 |
| Real Estate Management & Development - 5.0% | | | |
| Real Estate Services - 5.0% | | | |
| CBRE Group, Inc. (b) | | 331,900 | 20,239,262 |
| TOTAL COMMON STOCKS | | | |
| (Cost $314,884,350) | | | 401,403,507 |
|
| Money Market Funds - 3.6% | | | |
| Fidelity Cash Central Fund 0.09% (c) | | 3,246,727 | 3,247,376 |
| Fidelity Securities Lending Cash Central Fund 0.09% (c)(d) | | 11,168,958 | 11,170,075 |
| TOTAL MONEY MARKET FUNDS | | | |
| (Cost $14,417,451) | | | 14,417,451 |
| TOTAL INVESTMENT IN SECURITIES - 103.2% | | | |
| (Cost $329,301,801) | | | 415,820,958 |
| NET OTHER ASSETS (LIABILITIES) - (3.2)% | | | (12,842,587) |
| NET ASSETS - 100% | | | $402,978,371 |
Legend
(a) Security or a portion of the security is on loan at period end.
(b) Non-income producing
(c) Affiliated fund that is generally available only to investment companies and other accounts managed by Fidelity Investments. The rate quoted is the annualized seven-day yield of the fund at period end. A complete unaudited listing of the fund's holdings as of its most recent quarter end is available upon request. In addition, each Fidelity Central Fund's financial statements are available on the SEC's website or upon request.
(d) Investment made with cash collateral received from securities on loan.
Affiliated Central Funds
Information regarding fiscal year to date income earned by the Fund from investments in Fidelity Central Funds is as follows:
| Fund | Income earned |
| Fidelity Cash Central Fund | $925 |
| Fidelity Securities Lending Cash Central Fund | 3,269 |
| Total | $4,194 |
Amounts in the income column in the above table include any capital gain distributions from underlying funds, which are presented in the corresponding line-item in the Statement of Operations, if applicable. Amount for Fidelity Securities Lending Cash Central Fund represents the income earned on investing cash collateral, less rebates paid to borrowers and any lending agent fees associated with the loan, plus any premium payments received for lending certain types of securities.
Investment Valuation
The following is a summary of the inputs used, as of January 31, 2021, involving the Fund's assets and liabilities carried at fair value. The inputs or methodology used for valuing securities may not be an indication of the risk associated with investing in those securities. For more information on valuation inputs, and their aggregation into the levels used below, please refer to the Investment Valuation section in the accompanying Notes to Financial Statements.
| | Valuation Inputs at Reporting Date: |
| Description | Total | Level 1 | Level 2 | Level 3 |
| Investments in Securities: | | | | |
| Common Stocks | $401,403,507 | $401,403,507 | $-- | $-- |
| Money Market Funds | 14,417,451 | 14,417,451 | -- | -- |
| Total Investments in Securities: | $415,820,958 | $415,820,958 | $-- | $-- |
See accompanying notes which are an integral part of the financial statements.
Financial Statements
Statement of Assets and Liabilities
| | | January 31, 2021 (Unaudited) |
| Assets | | |
Investment in securities, at value (including securities loaned of $10,982,978) — See accompanying schedule:
Unaffiliated issuers (cost $314,884,350) | $401,403,507 | |
| Fidelity Central Funds (cost $14,417,451) | 14,417,451 | |
| Total Investment in Securities (cost $329,301,801) | | $415,820,958 |
| Cash | | 14,412 |
| Receivable for investments sold | | 1,010,695 |
| Receivable for fund shares sold | | 311,799 |
| Dividends receivable | | 339,647 |
| Distributions receivable from Fidelity Central Funds | | 1,085 |
| Prepaid expenses | | 3,906 |
| Other receivables | | 103,194 |
| Total assets | | 417,605,696 |
| Liabilities | | |
| Payable for investments purchased | $2,245,795 | |
| Payable for fund shares redeemed | 743,277 | |
| Accrued management fee | 176,742 | |
| Distribution and service plan fees payable | 78,453 | |
| Other affiliated payables | 95,008 | |
| Other payables and accrued expenses | 117,975 | |
| Collateral on securities loaned | 11,170,075 | |
| Total liabilities | | 14,627,325 |
| Net Assets | | $402,978,371 |
| Net Assets consist of: | | |
| Paid in capital | | $316,384,026 |
| Total accumulated earnings (loss) | | 86,594,345 |
| Net Assets | | $402,978,371 |
| Net Asset Value and Maximum Offering Price | | |
| Class A: | | |
Net Asset Value and redemption price per share ($110,831,515 ÷
5,710,959 shares)(a) | | $19.41 |
| Maximum offering price per share (100/94.25 of $19.41) | | $20.59 |
| Class M: | | |
| Net Asset Value and redemption price per share ($97,611,544 ÷ 5,038,337 shares)(a) | | $19.37 |
| Maximum offering price per share (100/96.50 of $19.37) | | $20.07 |
| Class C: | | |
| Net Asset Value and offering price per share ($17,240,014 ÷ 918,832 shares)(a) | | $18.76 |
| Class I: | | |
| Net Asset Value, offering price and redemption price per share ($167,023,753 ÷ 8,508,778 shares) | | $19.63 |
| Class Z: | | |
| Net Asset Value, offering price and redemption price per share ($10,271,545 ÷ 523,203 shares) | | $19.63 |
(a) Redemption price per share is equal to net asset value less any applicable contingent deferred sales charge.
See accompanying notes which are an integral part of the financial statements.
Statement of Operations
| | | Six months ended January 31, 2021 (Unaudited) |
| Investment Income | | |
| Dividends | | $4,946,067 |
| Income from Fidelity Central Funds (including $3,269 from security lending) | | 4,194 |
| Total income | | 4,950,261 |
| Expenses | | |
| Management fee | $1,079,002 | |
| Transfer agent fees | 504,180 | |
| Distribution and service plan fees | 476,776 | |
| Accounting fees | 79,385 | |
| Custodian fees and expenses | 5,478 | |
| Independent trustees' fees and expenses | 1,012 | |
| Registration fees | 53,812 | |
| Audit | 26,897 | |
| Legal | 513 | |
| Interest | 259 | |
| Miscellaneous | 7,177 | |
| Total expenses before reductions | 2,234,491 | |
| Expense reductions | (24,124) | |
| Total expenses after reductions | | 2,210,367 |
| Net investment income (loss) | | 2,739,894 |
| Realized and Unrealized Gain (Loss) | | |
| Net realized gain (loss) on: | | |
| Investment securities: | | |
| Unaffiliated issuers | 3,180,076 | |
| Fidelity Central Funds | (129) | |
| Total net realized gain (loss) | | 3,179,947 |
| Change in net unrealized appreciation (depreciation) on: | | |
| Investment securities: | | |
| Unaffiliated issuers | 3,526,147 | |
| Fidelity Central Funds | (90) | |
| Total change in net unrealized appreciation (depreciation) | | 3,526,057 |
| Net gain (loss) | | 6,706,004 |
| Net increase (decrease) in net assets resulting from operations | | $9,445,898 |
See accompanying notes which are an integral part of the financial statements.
Statement of Changes in Net Assets
| | Six months ended January 31, 2021 (Unaudited) | Year ended July 31, 2020 |
| Increase (Decrease) in Net Assets | | |
| Operations | | |
| Net investment income (loss) | $2,739,894 | $9,437,114 |
| Net realized gain (loss) | 3,179,947 | 16,496,833 |
| Change in net unrealized appreciation (depreciation) | 3,526,057 | (61,855,882) |
| Net increase (decrease) in net assets resulting from operations | 9,445,898 | (35,921,935) |
| Distributions to shareholders | (14,596,486) | (41,051,862) |
| Share transactions - net increase (decrease) | (16,609,385) | (39,601,264) |
| Total increase (decrease) in net assets | (21,759,973) | (116,575,061) |
| Net Assets | | |
| Beginning of period | 424,738,344 | 541,313,405 |
| End of period | $402,978,371 | $424,738,344 |
See accompanying notes which are an integral part of the financial statements.
Financial Highlights
Fidelity Advisor Real Estate Fund Class A
| | Six months ended (Unaudited) January 31, | Years endedJuly 31, | | | | |
| | 2021 | 2020 | 2019 | 2018 | 2017 | 2016 |
| Selected Per–Share Data | | | | | | |
| Net asset value, beginning of period | $19.62 | $22.91 | $22.07 | $22.96 | $25.93 | $22.90 |
| Income from Investment Operations | | | | | | |
| Net investment income (loss)A | .13 | .41 | .37 | .37 | .33 | .37 |
| Net realized and unrealized gain (loss) | .38 | (1.91) | 1.63 | .21 | (1.82) | 3.61 |
| Total from investment operations | .51 | (1.50) | 2.00 | .58 | (1.49) | 3.98 |
| Distributions from net investment income | (.24) | (.38) | (.43) | (.36) | (.30) | (.36) |
| Distributions from net realized gain | (.48) | (1.41) | (.73) | (1.11) | (1.18) | (.59) |
| Total distributions | (.72) | (1.79) | (1.16) | (1.47) | (1.48) | (.95) |
| Net asset value, end of period | $19.41 | $19.62 | $22.91 | $22.07 | $22.96 | $25.93 |
| Total ReturnB,C,D | 2.63% | (7.21)% | 9.62% | 2.55% | (5.63)% | 18.33% |
| Ratios to Average Net AssetsE,F | | | | | | |
| Expenses before reductions | 1.11%G | 1.10% | 1.10% | 1.10% | 1.09% | 1.09% |
| Expenses net of fee waivers, if any | 1.11%G | 1.10% | 1.09% | 1.10% | 1.09% | 1.09% |
| Expenses net of all reductions | 1.10%G | 1.09% | 1.09% | 1.10% | 1.08% | 1.08% |
| Net investment income (loss) | 1.32%G | 1.93% | 1.68% | 1.70% | 1.42% | 1.62% |
| Supplemental Data | | | | | | |
| Net assets, end of period (000 omitted) | $110,832 | $115,736 | $151,536 | $161,570 | $249,442 | $370,408 |
| Portfolio turnover rateH | 83%G | 56% | 49% | 41% | 69% | 62% |
A Calculated based on average shares outstanding during the period.
B Total returns for periods of less than one year are not annualized.
C Total returns would have been lower if certain expenses had not been reduced during the applicable periods shown.
D Total returns do not include the effect of the sales charges.
E Fees and expenses of any underlying mutual funds or exchange-traded funds (ETFs) are not included in the Fund's expense ratio. The Fund indirectly bears its proportionate share of these expenses. For additional expense information related to investments in Fidelity Central Funds, please refer to the "Investments in Fidelity Central Funds" note found in the Notes to Financial Statements section of the most recent Annual or Semi-Annual report.
F Expense ratios reflect operating expenses of the class. Expenses before reductions do not reflect amounts reimbursed, waived, or reduced through arrangements with the investment adviser, brokerage services, or other offset arrangements, if applicable, and do not represent the amount paid by the class during periods when reimbursements, waivers or reductions occur.
G Annualized
H Amount does not include the portfolio activity of any underlying mutual funds or exchange-traded funds (ETFs).
See accompanying notes which are an integral part of the financial statements.
Fidelity Advisor Real Estate Fund Class M
| | Six months ended (Unaudited) January 31, | Years endedJuly 31, | | | | |
| | 2021 | 2020 | 2019 | 2018 | 2017 | 2016 |
| Selected Per–Share Data | | | | | | |
| Net asset value, beginning of period | $19.58 | $22.87 | $22.05 | $22.94 | $25.90 | $22.88 |
| Income from Investment Operations | | | | | | |
| Net investment income (loss)A | .11 | .36 | .32 | .32 | .27 | .32 |
| Net realized and unrealized gain (loss) | .37 | (1.90) | 1.62 | .21 | (1.81) | 3.60 |
| Total from investment operations | .48 | (1.54) | 1.94 | .53 | (1.54) | 3.92 |
| Distributions from net investment income | (.22) | (.34) | (.39) | (.31) | (.24) | (.30) |
| Distributions from net realized gain | (.48) | (1.41) | (.73) | (1.11) | (1.18) | (.59) |
| Total distributions | (.69)B | (1.75) | (1.12) | (1.42) | (1.42) | (.90)B |
| Net asset value, end of period | $19.37 | $19.58 | $22.87 | $22.05 | $22.94 | $25.90 |
| Total ReturnC,D,E | 2.51% | (7.42)% | 9.35% | 2.34% | (5.83)% | 18.02% |
| Ratios to Average Net AssetsF,G | | | | | | |
| Expenses before reductions | 1.33%H | 1.31% | 1.32% | 1.33% | 1.33% | 1.33% |
| Expenses net of fee waivers, if any | 1.33%H | 1.31% | 1.31% | 1.33% | 1.33% | 1.33% |
| Expenses net of all reductions | 1.31%H | 1.30% | 1.31% | 1.32% | 1.32% | 1.32% |
| Net investment income (loss) | 1.11%H | 1.71% | 1.46% | 1.47% | 1.18% | 1.38% |
| Supplemental Data | | | | | | |
| Net assets, end of period (000 omitted) | $97,612 | $98,724 | $128,754 | $127,038 | $153,285 | $199,431 |
| Portfolio turnover rateI | 83%H | 56% | 49% | 41% | 69% | 62% |
A Calculated based on average shares outstanding during the period.
B Total distributions per share do not sum due to rounding.
C Total returns for periods of less than one year are not annualized.
D Total returns would have been lower if certain expenses had not been reduced during the applicable periods shown.
E Total returns do not include the effect of the sales charges.
F Fees and expenses of any underlying mutual funds or exchange-traded funds (ETFs) are not included in the Fund's expense ratio. The Fund indirectly bears its proportionate share of these expenses. For additional expense information related to investments in Fidelity Central Funds, please refer to the "Investments in Fidelity Central Funds" note found in the Notes to Financial Statements section of the most recent Annual or Semi-Annual report.
G Expense ratios reflect operating expenses of the class. Expenses before reductions do not reflect amounts reimbursed, waived, or reduced through arrangements with the investment adviser, brokerage services, or other offset arrangements, if applicable, and do not represent the amount paid by the class during periods when reimbursements, waivers or reductions occur.
H Annualized
I Amount does not include the portfolio activity of any underlying mutual funds or exchange-traded funds (ETFs).
See accompanying notes which are an integral part of the financial statements.
Fidelity Advisor Real Estate Fund Class C
| | Six months ended (Unaudited) January 31, | Years endedJuly 31, | | | | |
| | 2021 | 2020 | 2019 | 2018 | 2017 | 2016 |
| Selected Per–Share Data | | | | | | |
| Net asset value, beginning of period | $18.97 | $22.26 | $21.54 | $22.46 | $25.43 | $22.49 |
| Income from Investment Operations | | | | | | |
| Net investment income (loss)A | .05 | .23 | .19 | .20 | .15 | .19 |
| Net realized and unrealized gain (loss) | .36 | (1.85) | 1.58 | .20 | (1.78) | 3.54 |
| Total from investment operations | .41 | (1.62) | 1.77 | .40 | (1.63) | 3.73 |
| Distributions from net investment income | (.15) | (.26) | (.32) | (.21) | (.16) | (.20) |
| Distributions from net realized gain | (.48) | (1.41) | (.73) | (1.11) | (1.18) | (.59) |
| Total distributions | (.62)B | (1.67) | (1.05) | (1.32) | (1.34) | (.79) |
| Net asset value, end of period | $18.76 | $18.97 | $22.26 | $21.54 | $22.46 | $25.43 |
| Total ReturnC,D,E | 2.22% | (7.95)% | 8.72% | 1.77% | (6.34)% | 17.40% |
| Ratios to Average Net AssetsF,G | | | | | | |
| Expenses before reductions | 1.89%H | 1.89% | 1.88% | 1.88% | 1.86% | 1.86% |
| Expenses net of fee waivers, if any | 1.89%H | 1.89% | 1.88% | 1.88% | 1.86% | 1.86% |
| Expenses net of all reductions | 1.88%H | 1.88% | 1.88% | 1.87% | 1.86% | 1.85% |
| Net investment income (loss) | .54%H | 1.14% | .89% | .92% | .65% | .85% |
| Supplemental Data | | | | | | |
| Net assets, end of period (000 omitted) | $17,240 | $20,774 | $28,982 | $43,690 | $62,551 | $86,755 |
| Portfolio turnover rateI | 83%H | 56% | 49% | 41% | 69% | 62% |
A Calculated based on average shares outstanding during the period.
B Total distributions per share do not sum due to rounding.
C Total returns for periods of less than one year are not annualized.
D Total returns would have been lower if certain expenses had not been reduced during the applicable periods shown.
E Total returns do not include the effect of the contingent deferred sales charge.
F Fees and expenses of any underlying mutual funds or exchange-traded funds (ETFs) are not included in the Fund's expense ratio. The Fund indirectly bears its proportionate share of these expenses. For additional expense information related to investments in Fidelity Central Funds, please refer to the "Investments in Fidelity Central Funds" note found in the Notes to Financial Statements section of the most recent Annual or Semi-Annual report.
G Expense ratios reflect operating expenses of the class. Expenses before reductions do not reflect amounts reimbursed, waived, or reduced through arrangements with the investment adviser, brokerage services, or other offset arrangements, if applicable, and do not represent the amount paid by the class during periods when reimbursements, waivers or reductions occur.
H Annualized
I Amount does not include the portfolio activity of any underlying mutual funds or exchange-traded funds (ETFs).
See accompanying notes which are an integral part of the financial statements.
Fidelity Advisor Real Estate Fund Class I
| | Six months ended (Unaudited) January 31, | Years endedJuly 31, | | | | |
| | 2021 | 2020 | 2019 | 2018 | 2017 | 2016 |
| Selected Per–Share Data | | | | | | |
| Net asset value, beginning of period | $19.84 | $23.15 | $22.28 | $23.17 | $26.15 | $23.09 |
| Income from Investment Operations | | | | | | |
| Net investment income (loss)A | .15 | .46 | .43 | .43 | .39 | .43 |
| Net realized and unrealized gain (loss) | .38 | (1.92) | 1.65 | .21 | (1.83) | 3.64 |
| Total from investment operations | .53 | (1.46) | 2.08 | .64 | (1.44) | 4.07 |
| Distributions from net investment income | (.27) | (.44) | (.48) | (.42) | (.36) | (.41) |
| Distributions from net realized gain | (.48) | (1.41) | (.73) | (1.11) | (1.18) | (.59) |
| Total distributions | (.74)B | (1.85) | (1.21) | (1.53) | (1.54) | (1.01)B |
| Net asset value, end of period | $19.63 | $19.84 | $23.15 | $22.28 | $23.17 | $26.15 |
| Total ReturnC,D | 2.73% | (6.99)% | 9.93% | 2.84% | (5.36)% | 18.61% |
| Ratios to Average Net AssetsE,F | | | | | | |
| Expenses before reductions | .89%G | .86% | .81% | .82% | .82% | .84% |
| Expenses net of fee waivers, if any | .89%G | .86% | .81% | .82% | .82% | .83% |
| Expenses net of all reductions | .88%G | .85% | .81% | .81% | .81% | .83% |
| Net investment income (loss) | 1.55%G | 2.17% | 1.96% | 1.98% | 1.69% | 1.87% |
| Supplemental Data | | | | | | |
| Net assets, end of period (000 omitted) | $167,024 | $180,346 | $225,407 | $284,857 | $399,578 | $422,848 |
| Portfolio turnover rateH | 83%G | 56% | 49% | 41% | 69% | 62% |
A Calculated based on average shares outstanding during the period.
B Total distributions per share do not sum due to rounding.
C Total returns for periods of less than one year are not annualized.
D Total returns would have been lower if certain expenses had not been reduced during the applicable periods shown.
E Fees and expenses of any underlying mutual funds or exchange-traded funds (ETFs) are not included in the Fund's expense ratio. The Fund indirectly bears its proportionate share of these expenses. For additional expense information related to investments in Fidelity Central Funds, please refer to the "Investments in Fidelity Central Funds" note found in the Notes to Financial Statements section of the most recent Annual or Semi-Annual report.
F Expense ratios reflect operating expenses of the class. Expenses before reductions do not reflect amounts reimbursed, waived, or reduced through arrangements with the investment adviser, brokerage services, or other offset arrangements, if applicable, and do not represent the amount paid by the class during periods when reimbursements, waivers or reductions occur.
G Annualized
H Amount does not include the portfolio activity of any underlying mutual funds or exchange-traded funds (ETFs).
See accompanying notes which are an integral part of the financial statements.
Fidelity Advisor Real Estate Fund Class Z
| | Six months ended (Unaudited) January 31, | Years endedJuly 31, | |
| | 2021 | 2020 | 2019 A |
| Selected Per–Share Data | | | |
| Net asset value, beginning of period | $19.85 | $23.16 | $21.91 |
| Income from Investment Operations | | | |
| Net investment income (loss)B | .17 | .50 | .40 |
| Net realized and unrealized gain (loss) | .38 | (1.92) | 1.94 |
| Total from investment operations | .55 | (1.42) | 2.34 |
| Distributions from net investment income | (.30) | (.48) | (.36) |
| Distributions from net realized gain | (.48) | (1.41) | (.73) |
| Total distributions | (.77)C | (1.89) | (1.09) |
| Net asset value, end of period | $19.63 | $19.85 | $23.16 |
| Total ReturnD,E | 2.83% | (6.80)% | 11.22% |
| Ratios to Average Net AssetsF,G | | | |
| Expenses before reductions | .66%H | .65% | .65%H |
| Expenses net of fee waivers, if any | .66%H | .65% | .64%H |
| Expenses net of all reductions | .65%H | .64% | .64%H |
| Net investment income (loss) | 1.78%H | 2.38% | 2.20%H |
| Supplemental Data | | | |
| Net assets, end of period (000 omitted) | $10,272 | $9,157 | $6,634 |
| Portfolio turnover rateI | 83%H | 56% | 49% |
A For the period October 2, 2018 (commencement of sale of shares) to July 31, 2019.
B Calculated based on average shares outstanding during the period.
C Total distributions per share do not sum due to rounding.
D Total returns for periods of less than one year are not annualized.
E Total returns would have been lower if certain expenses had not been reduced during the applicable periods shown.
F Fees and expenses of any underlying mutual funds or exchange-traded funds (ETFs) are not included in the Fund's expense ratio. The Fund indirectly bears its proportionate share of these expenses. For additional expense information related to investments in Fidelity Central Funds, please refer to the "Investments in Fidelity Central Funds" note found in the Notes to Financial Statements section of the most recent Annual or Semi-Annual report.
G Expense ratios reflect operating expenses of the class. Expenses before reductions do not reflect amounts reimbursed, waived, or reduced through arrangements with the investment adviser, brokerage services, or other offset arrangements, if applicable, and do not represent the amount paid by the class during periods when reimbursements, waivers or reductions occur.
H Annualized
I Amount does not include the portfolio activity of any underlying mutual funds or exchange-traded funds (ETFs).
See accompanying notes which are an integral part of the financial statements.
Notes to Financial Statements (Unaudited)
For the period ended January 31, 2021
1. Organization.
Fidelity Advisor Real Estate Fund (the Fund) is a non-diversified fund of Fidelity Advisor Series VII (the Trust) and is authorized to issue an unlimited number of shares. The Trust is registered under the Investment Company Act of 1940, as amended (the 1940 Act), as an open-end management investment company organized as a Massachusetts business trust. The Fund offers Class A, Class M, Class C, Class I and Class Z shares, each of which has equal rights as to assets and voting privileges. Each class has exclusive voting rights with respect to matters that affect that class. Class C shares will automatically convert to Class A shares after a holding period of ten years from the initial date of purchase, with certain exceptions.
2. Investments in Fidelity Central Funds.
The Fund invests in Fidelity Central Funds, which are open-end investment companies generally available only to other investment companies and accounts managed by the investment adviser and its affiliates. The Fund's Schedule of Investments lists each of the Fidelity Central Funds held as of period end, if any, as an investment of the Fund, but does not include the underlying holdings of each Fidelity Central Fund. As an Investing Fund, the Fund indirectly bears its proportionate share of the expenses of the underlying Fidelity Central Funds.
The Money Market Central Funds seek preservation of capital and current income and are managed by the investment adviser. Annualized expenses of the Money Market Central Funds as of their most recent shareholder report date ranged from less than .005% to .01%.
A complete unaudited list of holdings for each Fidelity Central Fund is available upon request or at the Securities and Exchange Commission (the SEC) website at www.sec.gov. In addition, the financial statements of the Fidelity Central Funds are available on the SEC website or upon request.
3. Significant Accounting Policies.
The Fund is an investment company and applies the accounting and reporting guidance of the Financial Accounting Standards Board (FASB) Accounting Standards Codification Topic 946 Financial Services - Investment Companies. The financial statements have been prepared in conformity with accounting principles generally accepted in the United States of America (GAAP), which require management to make certain estimates and assumptions at the date of the financial statements. Actual results could differ from those estimates. Subsequent events, if any, through the date that the financial statements were issued have been evaluated in the preparation of the financial statements. The following summarizes the significant accounting policies of the Fund:
Investment Valuation. Investments are valued as of 4:00 p.m. Eastern time on the last calendar day of the period. The Board of Trustees (the Board) has delegated the day to day responsibility for the valuation of the Fund's investments to the Fair Value Committee (the Committee) established by the Fund's investment adviser. In accordance with valuation policies and procedures approved by the Board, the Fund attempts to obtain prices from one or more third party pricing vendors or brokers to value its investments. When current market prices, quotations or currency exchange rates are not readily available or reliable, investments will be fair valued in good faith by the Committee, in accordance with procedures adopted by the Board. Factors used in determining fair value vary by investment type and may include market or investment specific events. The frequency with which these procedures are used cannot be predicted and they may be utilized to a significant extent. The Committee oversees the Fund's valuation policies and procedures and reports to the Board on the Committee's activities and fair value determinations. The Board monitors the appropriateness of the procedures used in valuing the Fund's investments and ratifies the fair value determinations of the Committee.
The Fund categorizes the inputs to valuation techniques used to value its investments into a disclosure hierarchy consisting of three levels as shown below:
- Level 1 – quoted prices in active markets for identical investments
- Level 2 – other significant observable inputs (including quoted prices for similar investments, interest rates, prepayment speeds, etc.)
- Level 3 – unobservable inputs (including the Fund's own assumptions based on the best information available)
Valuation techniques used to value the Fund's investments by major category are as follows:
Equity securities, including restricted securities, for which market quotations are readily available, are valued at the last reported sale price or official closing price as reported by a third party pricing vendor on the primary market or exchange on which they are traded and are categorized as Level 1 in the hierarchy. In the event there were no sales during the day or closing prices are not available, securities are valued at the last quoted bid price or may be valued using the last available price and are generally categorized as Level 2 in the hierarchy. For foreign equity securities, when market or security specific events arise, comparisons to the valuation of American Depositary Receipts (ADRs), futures contracts, Exchange-Traded Funds (ETFs) and certain indexes as well as quoted prices for similar securities may be used and would be categorized as Level 2 in the hierarchy. For equity securities, including restricted securities, where observable inputs are limited, assumptions about market activity and risk are used and these securities may be categorized as Level 3 in the hierarchy.
Investments in open-end mutual funds, including the Fidelity Central Funds, are valued at their closing net asset value (NAV) each business day and are categorized as Level 1 in the hierarchy.
Changes in valuation techniques may result in transfers in or out of an assigned level within the disclosure hierarchy. The aggregate value of investments by input level as of January 31, 2021 is included at the end of the Fund's Schedule of Investments.
Investment Transactions and Income. For financial reporting purposes, the Fund's investment holdings and NAV include trades executed through the end of the last business day of the period. The NAV per share for processing shareholder transactions is calculated as of the close of business of the New York Stock Exchange (NYSE), normally 4:00 p.m. Eastern time and includes trades executed through the end of the prior business day. Gains and losses on securities sold are determined on the basis of identified cost. Dividend income is recorded on the ex-dividend date, except for certain dividends from foreign securities where the ex-dividend date may have passed, which are recorded as soon as the Fund is informed of the ex-dividend date. Non-cash dividends included in dividend income, if any, are recorded at the fair market value of the securities received. Income and capital gain distributions from Fidelity Central Funds, if any, are recorded on the ex-dividend date. Certain distributions received by the Fund represent a return of capital or capital gain. The Fund determines the components of these distributions subsequent to the ex-dividend date, based upon receipt of tax filings or other correspondence relating to the underlying investment. These distributions are recorded as a reduction of cost of investments and/or as a realized gain.
Class Allocations and Expenses. Investment income, realized and unrealized capital gains and losses, common expenses of the Fund, and certain fund-level expense reductions, if any, are allocated daily on a pro-rata basis to each class based on the relative net assets of each class to the total net assets of the Fund. Each class differs with respect to transfer agent and distribution and service plan fees incurred. Certain expense reductions may also differ by class. For the reporting period, the allocated portion of income and expenses to each class as a percent of its average net assets may vary due to the timing of recording these transactions in relation to fluctuating net assets of the classes. Expenses directly attributable to a fund are charged to that fund. Expenses attributable to more than one fund are allocated among the respective funds on the basis of relative net assets or other appropriate methods. Expense estimates are accrued in the period to which they relate and adjustments are made when actual amounts are known.
Deferred Trustee Compensation. Under a Deferred Compensation Plan (the Plan) for certain Funds, certain independent Trustees have elected to defer receipt of a portion of their annual compensation. Deferred amounts are invested in affiliated mutual funds, are marked-to-market and remain in a fund until distributed in accordance with the Plan. The investment of deferred amounts and the offsetting payable to the Trustees presented below are included in the accompanying Statement of Assets and Liabilities in other receivables and other payables and accrued expenses, as applicable.
| Fidelity Advisor Real Estate Fund | $88,069 |
Income Tax Information and Distributions to Shareholders. Each year, the Fund intends to qualify as a regulated investment company under Subchapter M of the Internal Revenue Code, including distributing substantially all of its taxable income and realized gains. As a result, no provision for U.S. Federal income taxes is required. The Fund files a U.S. federal tax return, in addition to state and local tax returns as required. The Fund's federal income tax returns are subject to examination by the Internal Revenue Service (IRS) for a period of three fiscal years after they are filed. State and local tax returns may be subject to examination for an additional fiscal year depending on the jurisdiction.
Distributions are declared and recorded on the ex-dividend date. Income and capital gain distributions are declared separately for each class. Income and capital gain distributions are determined in accordance with income tax regulations, which may differ from GAAP.
Capital accounts within the financial statements are adjusted for permanent book-tax differences. These adjustments have no impact on net assets or the results of operations. Capital accounts are not adjusted for temporary book-tax differences which will reverse in a subsequent period.
Book-tax differences are primarily due to foreign currency transactions, deferred trustees compensation and losses deferred due to wash sales.
As of period end, the cost and unrealized appreciation (depreciation) in securities, and derivatives if applicable, for federal income tax purposes were as follows:
| Gross unrealized appreciation | $95,891,761 |
| Gross unrealized depreciation | (10,635,360) |
| Net unrealized appreciation (depreciation) | $85,256,401 |
| Tax cost | $330,564,557 |
4. Purchases and Sales of Investments.
Purchases and sales of securities, other than short-term securities, are noted in the table below.
| | Purchases ($) | Sales ($) |
| Fidelity Advisor Real Estate Fund | 167,579,610 | 195,149,119 |
5. Fees and Other Transactions with Affiliates.
Management Fee. Fidelity Management & Research Company LLC (the investment adviser) and its affiliates provide the Fund with investment management related services for which the Fund pays a monthly management fee. The management fee is the sum of an individual fund fee rate that is based on an annual rate of .30% of the Fund's average net assets and an annualized group fee rate that averaged .23% during the period. The group fee rate is based upon the monthly average net assets of a group of registered investment companies with which the investment adviser has management contracts. The group fee rate decreases as assets under management increase and increases as assets under management decrease. For the reporting period, the total annualized management fee rate was .53% of the Fund's average net assets.
Distribution and Service Plan Fees. In accordance with Rule 12b-1 of the 1940 Act, the Fund has adopted separate Distribution and Service Plans for each class of shares. Certain classes pay Fidelity Distributors Company LLC (FDC), an affiliate of the investment adviser, separate Distribution and Service Fees, each of which is based on an annual percentage of each class' average net assets. In addition, FDC may pay financial intermediaries for selling shares of the Fund and providing shareholder support services. For the period, the Distribution and Service Fee rates, total fees and amounts retained by FDC were as follows:
| | Distribution Fee | Service Fee | Total Fees | Retained by FDC |
| Class A | -% | .25% | $138,501 | $1,272 |
| Class M | .25% | .25% | 242,348 | – |
| Class C | .75% | .25% | 95,927 | 7,789 |
| | | | $476,776 | $9,061 |
Sales Load. FDC may receive a front-end sales charge of up to 5.75% for selling Class A shares and 3.50% for selling Class M shares, some of which is paid to financial intermediaries for selling shares of the Fund. Depending on the holding period, FDC may receive contingent deferred sales charges levied on Class A, Class M and Class C redemptions. The deferred sales charges are 1.00% for Class C shares, 1.00% for certain purchases of Class A shares and .25% for certain purchases of Class M shares.
For the period, sales charge amounts retained by FDC were as follows:
| | Retained by FDC |
| Class A | $8,307 |
| Class M | 1,440 |
| Class C(a) | 1,048 |
| | $10,795 |
(a) When Class C shares are initially sold, FDC pays commissions from its own resources to financial intermediaries through which the sales are made.
Transfer Agent Fees. Fidelity Investments Institutional Operations Company LLC (FIIOC), an affiliate of the investment adviser, is the transfer, dividend disbursing and shareholder servicing agent for each class of the Fund. FIIOC receives account fees and asset-based fees that vary according to the account size and type of account of the shareholders of the respective classes of the Fund, except for Class Z. FIIOC receives an asset-based fee of Class Z's average net assets. FIIOC pays for typesetting, printing and mailing of shareholder reports, except proxy statements.
For the period, transfer agent fees for each class were as follows:
| | Amount | % of Class-Level Average Net Assets(a) |
| Class A | $138,497 | .25 |
| Class M | 102,261 | .21 |
| Class C | 26,907 | .28 |
| Class I | 233,635 | .28 |
| Class Z | 2,880 | .04 |
| | $504,180 | |
(a) Annualized
Accounting Fees. Fidelity Service Company, Inc. (FSC), an affiliate of the investment adviser, maintains the Fund's accounting records. The accounting fee is based on the level of average net assets for each month. For the period, the fees were equivalent to the following annualized rates:
| | % of Average Net Assets |
| Fidelity Advisor Real Estate Fund | .04 |
Brokerage Commissions. A portion of portfolio transactions were placed with brokerage firms which are affiliates of the investment adviser. Brokerage commissions are included in net realized gain (loss) and change in net unrealized appreciation (depreciation) in the Statement of Operations. The commissions paid to these affiliated firms were as follows:
| | Amount |
| Fidelity Advisor Real Estate Fund | $2,358 |
Interfund Lending Program. Pursuant to an Exemptive Order issued by the SEC, the Fund, along with other registered investment companies having management contracts with Fidelity Management & Research Company LLC (FMR), or other affiliated entities of FMR, may participate in an interfund lending program. This program provides an alternative credit facility allowing the Fund to borrow from, or lend money to, other participating affiliated funds. At period end, there were no interfund loans outstanding. Activity in this program during the period for which loans were outstanding was as follows:
| | Borrower or Lender | Average Loan Balance | Weighted Average Interest Rate | Interest Expense |
| Fidelity Advisor Real Estate Fund | Borrower | $4,674,500 | .33% | $259 |
Interfund Trades. Funds may purchase from or sell securities to other Fidelity Funds under procedures adopted by the Board. The procedures have been designed to ensure these interfund trades are executed in accordance with Rule 17a-7 of the 1940 Act. Interfund trades are included within the respective purchases and sales amounts shown in the Purchases and Sales of Investments note, and amounted to $58,430,122 and $18,934,504, respectively.
6. Committed Line of Credit.
Certain Funds participate with other funds managed by the investment adviser or an affiliate in a $4.25 billion credit facility (the "line of credit") to be utilized for temporary or emergency purposes to fund shareholder redemptions or for other short-term liquidity purposes. The participating funds have agreed to pay commitment fees on their pro-rata portion of the line of credit, which are reflected in Miscellaneous expenses on the Statement of Operations, and are listed below.
| | Amount |
| Fidelity Advisor Real Estate Fund | $420 |
During the period, there were no borrowings on this line of credit.
7. Security Lending.
Funds lend portfolio securities from time to time in order to earn additional income. Lending agents are used, including National Financial Services (NFS), an affiliate of the investment adviser. Pursuant to a securities lending agreement, NFS will receive a fee, which is capped at 9.9% of a fund's daily lending revenue, for its services as lending agent. A fund may lend securities to certain qualified borrowers, including NFS. On the settlement date of the loan, a fund receives collateral (in the form of U.S. Treasury obligations, letters of credit and/or cash) against the loaned securities and maintains collateral in an amount not less than 100% of the market value of the loaned securities during the period of the loan. The market value of the loaned securities is determined at the close of business of a fund and any additional required collateral is delivered to a fund on the next business day. A fund or borrower may terminate the loan at any time, and if the borrower defaults on its obligation to return the securities loaned because of insolvency or other reasons, a fund may apply collateral received from the borrower against the obligation. A fund may experience delays and costs in recovering the securities loaned. Any cash collateral received is invested in the Fidelity Securities Lending Cash Central Fund. Any loaned securities are identified as such in the Schedule of Investments, and the value of loaned securities and cash collateral at period end, as applicable, are presented in the Statement of Assets and Liabilities. Security lending income represents the income earned on investing cash collateral, less rebates paid to borrowers and any lending agent fees associated with the loan, plus any premium payments received for lending certain types of securities. Security lending income is presented in the Statement of Operations as a component of income from Fidelity Central Funds. Affiliated security lending activity, if any, was as follows:
| | Total Security Lending Income Fees Paid to NFS | Security Lending Income From Securities Loaned to NFS | Value of Securities Loaned to NFS at Period End |
| Fidelity Advisor Real Estate Fund | $363 | $– | $– |
8. Expense Reductions.
Commissions paid to certain brokers with whom the investment adviser, or its affiliates, places trades on behalf of the Fund include an amount in addition to trade execution, which may be rebated back to the Fund to offset expenses. This amount totaled $23,520 for the period.
In addition, during the period the investment adviser or an affiliate reimbursed and/or waived a portion of fund-level operating expenses in the amount of $604.
9. Distributions to Shareholders.
Distributions to shareholders of each class were as follows:
| | Six months ended
January 31, 2021 | Year ended
July 31, 2020 |
| Distributions to shareholders | | |
| Class A | $3,943,668 | $11,351,149 |
| Class M | 3,401,104 | 9,900,861 |
| Class C | 608,843 | 2,212,295 |
| Class I | 6,087,322 | 16,797,330 |
| Class Z | 555,549 | 790,227 |
| Total | $14,596,486 | $41,051,862 |
10. Share Transactions.
Share transactions for each class were as follows and may contain automatic conversions between classes or exchanges between affiliated funds:
| | Shares | Shares | Dollars | Dollars |
| | Six months ended January 31, 2021 | Year ended July 31, 2020 | Six months ended January 31, 2021 | Year ended July 31, 2020 |
| Class A | | | | |
| Shares sold | 490,164 | 1,177,605 | $9,482,161 | $24,680,361 |
| Reinvestment of distributions | 201,989 | 518,941 | 3,878,210 | 11,204,406 |
| Shares redeemed | (880,990) | (2,412,107) | (17,121,919) | (50,221,247) |
| Net increase (decrease) | (188,837) | (715,561) | $(3,761,548) | $(14,336,480) |
| Class M | | | | |
| Shares sold | 306,148 | 950,286 | $5,949,267 | $20,331,432 |
| Reinvestment of distributions | 176,839 | 456,913 | 3,389,170 | 9,847,117 |
| Shares redeemed | (486,108) | (1,995,286) | (9,427,792) | (42,434,132) |
| Net increase (decrease) | (3,121) | (588,087) | $(89,355) | $(12,255,583) |
| Class C | | | | |
| Shares sold | 46,707 | 220,320 | $880,758 | $4,724,593 |
| Reinvestment of distributions | 32,588 | 101,651 | 604,904 | 2,127,235 |
| Shares redeemed | (255,400) | (528,900) | (4,798,238) | (10,184,069) |
| Net increase (decrease) | (176,105) | (206,929) | $(3,312,576) | $(3,332,241) |
| Class I | | | | |
| Shares sold | 1,467,242 | 3,925,859 | $28,855,196 | $80,680,448 |
| Reinvestment of distributions | 297,785 | 746,499 | 5,784,721 | 16,292,429 |
| Shares redeemed | (2,347,030) | (5,319,374) | (45,271,066) | (110,572,461) |
| Net increase (decrease) | (582,003) | (647,016) | $(10,631,149) | $(13,599,584) |
| Class Z | | | | |
| Shares sold | 478,175 | 430,251 | $9,204,607 | $9,103,828 |
| Reinvestment of distributions | 14,639 | 33,911 | 284,395 | 738,465 |
| Shares redeemed | (431,003) | (289,280) | (8,303,759) | (5,919,669) |
| Net increase (decrease) | 61,811 | 174,882 | $1,185,243 | $3,922,624 |
11. Other.
The Fund's organizational documents provide former and current trustees and officers with a limited indemnification against liabilities arising in connection with the performance of their duties to the Fund. In the normal course of business, the Fund may also enter into contracts that provide general indemnifications. The Fund's maximum exposure under these arrangements is unknown as this would be dependent on future claims that may be made against the Fund. The risk of material loss from such claims is considered remote.
12. Coronavirus (COVID-19) Pandemic.
An outbreak of COVID-19 first detected in China during December 2019 has since spread globally and was declared a pandemic by the World Health Organization during March 2020. Developments that disrupt global economies and financial markets, such as the COVID-19 pandemic, may magnify factors that affect the Fund's performance.
Shareholder Expense Example
As a shareholder, you incur two types of costs: (1) transaction costs, which may include sales charges (loads) on purchase payments or redemption proceeds, as applicable and (2) ongoing costs, which generally include management fees, distribution and/or service (12b-1) fees and other Fund expenses. This Example is intended to help you understand your ongoing costs (in dollars) of investing in a fund and to compare these costs with the ongoing costs of investing in other mutual funds.
The Example is based on an investment of $1,000 invested at the beginning of the period and held for the entire period (August 1, 2020 to January 31, 2021).
Actual Expenses
The first line of the accompanying table provides information about actual account values and actual expenses. You may use the information in this line, together with the amount you invested, to estimate the expenses that you paid over the period. Simply divide your account value by $1,000.00 (for example, an $8,600 account value divided by $1,000.00 = 8.6), then multiply the result by the number in the first line for a class/Fund under the heading entitled "Expenses Paid During Period" to estimate the expenses you paid on your account during this period. If any fund is a shareholder of any underlying mutual funds or exchange-traded funds (ETFs) (the Underlying Funds), such fund indirectly bears its proportional share of the expenses of the Underlying Funds in addition to the direct expenses incurred presented in the table. These fees and expenses are not included in the annualized expense ratio used to calculate the expense estimate in the table below.
Hypothetical Example for Comparison Purposes
The second line of the accompanying table provides information about hypothetical account values and hypothetical expenses based on the actual expense ratio and an assumed rate of return of 5% per year before expenses, which is not the actual return. The hypothetical account values and expenses may not be used to estimate the actual ending account balance or expenses you paid for the period. You may use this information to compare the ongoing costs of investing in the Fund and other funds. To do so, compare this 5% hypothetical example with the 5% hypothetical examples that appear in the shareholder reports of the other funds. If any fund is a shareholder of any Underlying Funds, such fund indirectly bears its proportional share of the expenses of the Underlying Funds in addition to the direct expenses as presented in the table. These fees and expenses are not included in the annualized expense ratio used to calculate the expense estimate in the table below.
Please note that the expenses shown in the table are meant to highlight your ongoing costs only and do not reflect any transaction costs. Therefore, the second line of the table is useful in comparing ongoing costs only, and will not help you determine the relative total costs of owning different funds. In addition, if these transactional costs were included, your costs would have been higher.
| | Annualized Expense Ratio-A | Beginning
Account Value
August 1, 2020 | Ending
Account Value
January 31, 2021 | Expenses Paid
During Period-B
August 1, 2020
to January 31, 2021 |
| Fidelity Advisor Real Estate Fund | | | | |
| Class A | 1.11% | | | |
| Actual | | $1,000.00 | $1,026.30 | $5.67 |
| Hypothetical-C | | $1,000.00 | $1,019.61 | $5.65 |
| Class M | 1.33% | | | |
| Actual | | $1,000.00 | $1,025.10 | $6.79 |
| Hypothetical-C | | $1,000.00 | $1,018.50 | $6.77 |
| Class C | 1.89% | | | |
| Actual | | $1,000.00 | $1,022.20 | $9.63 |
| Hypothetical-C | | $1,000.00 | $1,015.68 | $9.60 |
| Class I | .89% | | | |
| Actual | | $1,000.00 | $1,027.30 | $4.55 |
| Hypothetical-C | | $1,000.00 | $1,020.72 | $4.53 |
| Class Z | .66% | | | |
| Actual | | $1,000.00 | $1,028.30 | $3.37 |
| Hypothetical-C | | $1,000.00 | $1,021.88 | $3.36 |
A Annualized expense ratio reflects expenses net of applicable fee waivers.
B Expenses are equal to the annualized expense ratio, multiplied by the average account value over the period, multiplied by 184/ 365 (to reflect the one-half year period). The fees and expenses of any Underlying Funds are not included in each annualized expense ratio.
C 5% return per year before expenses
Board Approval of Investment Advisory Contracts and Management Fees
Fidelity Advisor Real Estate Fund
At its January 2021 meeting, the Board of Trustees, including the Independent Trustees (together, the Board), voted to continue the management contract with Fidelity Management & Research Company LLC (FMR), and the sub-advisory agreements and sub-subadvisory agreements, in each case, where applicable (together, the Advisory Contracts) for the fund for four months from February 1, 2021 through May 31, 2021, in connection with changes to the Board's meeting calendar.
The Board considered that the approval of the fund's Advisory Contracts will not result in any changes in (i) the investment process or strategies employed in the management of the fund's assets; (ii) the fees and expenses paid by shareholders; (iii) the nature, extent or quality of services provided under the fund's Advisory Contracts; or (iv) the day-to-day management of the fund or the persons primarily responsible for such management. The Board also considered that since its last approval of the fund's Advisory Contracts, FMR had provided additional information on the fund in support of the annual contract renewal process, including competitive analyses on total expenses and management fees and in-depth reviews of fund performance and fund profitability information. The Board also considered the findings of certain ad hoc committees that had been previously formed to discuss matters relevant to all of the Fidelity funds, including economies of scale, fall-out benefits and retail vs. institutional funds. The Board concluded that the fund's Advisory Contracts are fair and reasonable, and that the fund's Advisory Contracts should be renewed, without modification, through May 31, 2021, with the understanding that the Board will consider the annual renewal for a full one year period in May 2021.
In connection with its consideration of future renewals of the fund's Advisory Contracts, the Board will consider: (i) the nature, extent and quality of services provided to the funds, including shareholder and administrative services and investment performance; (ii) the competitiveness of the management fee and total expenses for the fund; (iii) the costs of the services and profitability, including the revenues earned and the expenses incurred in conducting the business of developing, marketing, distributing, managing, administering, and servicing the fund and its shareholders, to the extent applicable; and (iv) whether there have been economies of scale in respect of the Fidelity funds, whether the Fidelity funds (including the fund) have appropriately benefited from any such economies of scale, and whether there is the potential for realization of any further economies.
Based on its evaluation of all of the conclusions noted above, and after considering all factors it believed relevant, the Board ultimately concluded that the fund's management fee structure is fair and reasonable, and that the continuation of the fund's Advisory Contracts should be approved for four months from February 1, 2021 through May 31, 2021.

ARE-SANN-0321
1.783109.119
Fidelity Advisor Focus Funds®
Fidelity Advisor® Biotechnology Fund
Fidelity Advisor® Communications Equipment Fund
Fidelity Advisor® Consumer Discretionary Fund
Fidelity Advisor® Energy Fund
Fidelity Advisor® Financial Services Fund
Fidelity Advisor® Health Care Fund
Fidelity Advisor® Industrials Fund
Fidelity Advisor® Semiconductors Fund
Fidelity Advisor® Technology Fund
Fidelity Advisor® Utilities Fund
Semi-Annual Report
January 31, 2021
Contents
To view a fund's proxy voting guidelines and proxy voting record for the 12-month period ended June 30, visit http://www.fidelity.com/proxyvotingresults or visit the Securities and Exchange Commission's (SEC) web site at http://www.sec.gov.
You may also call 1-877-208-0098 to request a free copy of the proxy voting guidelines.
Standard & Poor's, S&P and S&P 500 are registered service marks of The McGraw-Hill Companies, Inc. and have been licensed for use by Fidelity Distributors Corporation.
Other third-party marks appearing herein are the property of their respective owners.
All other marks appearing herein are registered or unregistered trademarks or service marks of FMR LLC or an affiliated company. © 2021 FMR LLC. All rights reserved.
This report and the financial statements contained herein are submitted for the general information of the shareholders of the Funds. This report is not authorized for distribution to prospective investors in the Funds unless preceded or accompanied by an effective prospectus.
A fund files its complete schedule of portfolio holdings with the SEC for the first and third quarters of each fiscal year on Form N-PORT. Forms N-PORT are available on the SEC’s web site at http://www.sec.gov. A fund's Forms N-PORT may be reviewed and copied at the SEC’s Public Reference Room in Washington, DC. Information regarding the operation of the SEC's Public Reference Room may be obtained by calling 1-800-SEC-0330.
For a complete list of a fund's portfolio holdings, view the most recent holdings listing, semiannual report, or annual report on Fidelity's web site at http://www.fidelity.com, http://www.institutional.fidelity.com, or http://www.401k.com, as applicable.
NOT FDIC INSURED •MAY LOSE VALUE •NO BANK GUARANTEE
Neither the Funds nor Fidelity Distributors Corporation is a bank.
Note to Shareholders:
Early in 2020, the outbreak and spread of a new coronavirus emerged as a public health emergency that had a major influence on financial markets, primarily based on its impact on the global economy and the outlook for corporate earnings. The virus causes a respiratory disease known as COVID-19. On March 11, the World Health Organization declared the COVID-19 outbreak a pandemic, citing sustained risk of further global spread.
In the weeks following, as the crisis worsened, we witnessed an escalating human tragedy with wide-scale social and economic consequences from coronavirus-containment measures. The outbreak of COVID-19 prompted a number of measures to limit the spread, including travel and border restrictions, quarantines, and restrictions on large gatherings. In turn, these resulted in lower consumer activity, diminished demand for a wide range of products and services, disruption in manufacturing and supply chains, and – given the wide variability in outcomes regarding the outbreak – significant market uncertainty and volatility. Amid the turmoil, global governments and central banks took unprecedented action to help support consumers, businesses, and the broader economies, and to limit disruption to financial systems.
The situation continues to unfold, and the extent and duration of its impact on financial markets and the economy remain highly uncertain. Extreme events such as the coronavirus crisis are “exogenous shocks” that can have significant adverse effects on mutual funds and their investments. Although multiple asset classes may be affected by market disruption, the duration and impact may not be the same for all types of assets.
Fidelity is committed to helping you stay informed amid news about COVID-19 and during increased market volatility, and we’re taking extra steps to be responsive to customer needs. We encourage you to visit our websites, where we offer ongoing updates, commentary, and analysis on the markets and our funds.
Fidelity Advisor® Biotechnology Fund
Investment Summary (Unaudited)
Top Ten Stocks as of January 31, 2021
| | % of fund's net assets |
| AbbVie, Inc. | 20.5 |
| Regeneron Pharmaceuticals, Inc. | 7.6 |
| Alnylam Pharmaceuticals, Inc. | 5.2 |
| Novavax, Inc. | 4.4 |
| Vertex Pharmaceuticals, Inc. | 3.8 |
| Argenx SE ADR | 3.7 |
| AstraZeneca PLC sponsored ADR | 2.9 |
| TG Therapeutics, Inc. | 2.7 |
| Ascendis Pharma A/S sponsored ADR | 2.6 |
| Agios Pharmaceuticals, Inc. | 2.5 |
| | 55.9 |
Top Industries (% of fund's net assets)
| As of January 31, 2021 |
| | Biotechnology | 92.5% |
| | Pharmaceuticals | 6.8% |
| | Health Care Providers & Services | 0.1% |
| | All Others* | 0.6% |

* Includes short-term investments and net other assets (liabilities).
Fidelity Advisor® Biotechnology Fund
Schedule of Investments January 31, 2021 (Unaudited)
Showing Percentage of Net Assets
| Common Stocks - 98.5% | | | |
| | | Shares | Value |
| Biotechnology - 92.0% | | | |
| Biotechnology - 92.0% | | | |
| AbbVie, Inc. | | 5,632,380 | $577,206,303 |
| ADC Therapeutics SA (a)(b) | | 262,223 | 7,491,711 |
| Agios Pharmaceuticals, Inc. (a) | | 1,471,795 | 69,130,211 |
| Alnylam Pharmaceuticals, Inc. (a) | | 976,386 | 146,926,565 |
| Amicus Therapeutics, Inc. (a) | | 835,800 | 15,804,978 |
| Annexon, Inc. (a) | | 175,199 | 3,854,378 |
| Arcutis Biotherapeutics, Inc. (a) | | 818,733 | 22,343,224 |
| Argenx SE ADR (a) | | 353,200 | 103,494,664 |
| Ascendis Pharma A/S sponsored ADR (a) | | 496,039 | 74,480,256 |
| Aurinia Pharmaceuticals, Inc. (a)(b) | | 1,377,900 | 23,024,709 |
| Autolus Therapeutics Ltd. ADR (a)(b) | | 996,000 | 7,320,600 |
| BeiGene Ltd. (a) | | 109,800 | 2,692,159 |
| BeiGene Ltd. ADR (a) | | 57,900 | 18,528,000 |
| BioAtla, Inc. | | 43,744 | 1,923,424 |
| Biogen, Inc. (a) | | 193,500 | 54,685,035 |
| Black Diamond Therapeutics, Inc. (a)(b) | | 228,061 | 5,649,071 |
| ChemoCentryx, Inc. (a) | | 548,074 | 31,245,699 |
| Codiak Biosciences, Inc. | | 124,578 | 2,826,177 |
| Crinetics Pharmaceuticals, Inc. (a) | | 732,707 | 10,514,345 |
| Cullinan Management, Inc. | | 212,924 | 8,093,241 |
| Eledon Pharmaceuticals, Inc. (a) | | 345,100 | 5,117,833 |
| Exact Sciences Corp. (a) | | 157,282 | 21,572,799 |
| Exelixis, Inc. (a) | | 2,884,900 | 64,073,629 |
| FibroGen, Inc. (a) | | 606,901 | 29,240,490 |
| Forma Therapeutics Holdings, Inc. (b) | | 499,852 | 19,309,283 |
| Fusion Pharmaceuticals, Inc. (a) | | 226,735 | 2,562,106 |
| Global Blood Therapeutics, Inc. (a)(b) | | 822,718 | 41,234,626 |
| Intercept Pharmaceuticals, Inc. (a)(b) | | 213,604 | 7,527,405 |
| Ionis Pharmaceuticals, Inc. (a) | | 468,238 | 28,127,057 |
| Keros Therapeutics, Inc. (b) | | 298,700 | 17,040,835 |
| Kezar Life Sciences, Inc. (a) | | 638,139 | 3,388,518 |
| Kinnate Biopharma, Inc. | | 208,710 | 6,161,119 |
| Kinnate Biopharma, Inc. | | 8,800 | 288,640 |
| Kura Oncology, Inc. (a) | | 522,300 | 15,642,885 |
| Mirati Therapeutics, Inc. (a) | | 204,720 | 42,035,158 |
| Morphic Holding, Inc. (a) | | 191,600 | 6,449,256 |
| Neurocrine Biosciences, Inc. (a) | | 622,652 | 68,336,057 |
| Novavax, Inc. (a) | | 562,600 | 124,300,844 |
| ORIC Pharmaceuticals, Inc. (a)(b) | | 433,400 | 12,707,288 |
| Passage Bio, Inc. (b) | | 438,459 | 8,181,645 |
| Poseida Therapeutics, Inc. (a)(b) | | 58,300 | 507,210 |
| Poseida Therapeutics, Inc. (c) | | 366,846 | 3,191,560 |
| Praxis Precision Medicines, Inc. (b) | | 102,700 | 5,226,403 |
| Prelude Therapeutics, Inc. | | 120,636 | 7,835,308 |
| Prelude Therapeutics, Inc. | | 413,234 | 25,497,571 |
| Protagonist Therapeutics, Inc. (a) | | 1,018,933 | 21,102,102 |
| PTC Therapeutics, Inc. (a) | | 789,040 | 45,622,293 |
| Regeneron Pharmaceuticals, Inc. (a) | | 426,992 | 215,135,649 |
| Relay Therapeutics, Inc. (a) | | 185,800 | 9,211,964 |
| Repare Therapeutics, Inc. (b) | | 420,469 | 15,603,605 |
| Revolution Medicines, Inc. (b) | | 535,116 | 22,549,788 |
| Sage Therapeutics, Inc. (a)(b) | | 307,387 | 24,790,762 |
| Sarepta Therapeutics, Inc. (a) | | 361,681 | 32,334,281 |
| Scholar Rock Holding Corp. (a)(b) | | 422,409 | 25,200,921 |
| Shattuck Labs, Inc. | | 56,101 | 2,783,171 |
| Shattuck Labs, Inc. | | 637,933 | 30,065,463 |
| Silverback Therapeutics, Inc. | | 16,200 | 711,504 |
| Silverback Therapeutics, Inc. | | 98,114 | 3,878,250 |
| Stoke Therapeutics, Inc. (a)(b) | | 311,770 | 19,042,912 |
| Syros Pharmaceuticals, Inc. (a) | | 666,504 | 7,294,886 |
| Taysha Gene Therapies, Inc. | | 79,800 | 2,074,800 |
| Taysha Gene Therapies, Inc. | | 257,339 | 6,356,273 |
| TG Therapeutics, Inc. (a) | | 1,556,200 | 75,117,774 |
| Turning Point Therapeutics, Inc. (a) | | 434,868 | 54,571,585 |
| uniQure B.V. (a) | | 333,500 | 11,809,235 |
| Vaxcyte, Inc. (b) | | 657,413 | 16,126,341 |
| Vertex Pharmaceuticals, Inc. (a) | | 465,927 | 106,734,557 |
| Viela Bio, Inc. (a)(b) | | 1,189,196 | 41,241,317 |
| Xenon Pharmaceuticals, Inc. (a) | | 479,680 | 6,883,408 |
| Y-mAbs Therapeutics, Inc. (a) | | 194,803 | 8,183,674 |
| Yumanity Therapeutics, Inc. | | 33,894 | 546,032 |
| Zentalis Pharmaceuticals, Inc. (b) | | 430,721 | 16,526,765 |
| Zymeworks, Inc. (a)(b) | | 415,853 | 14,064,148 |
| | | | 2,588,353,735 |
| Health Care Providers & Services - 0.0% | | | |
| Health Care Services - 0.0% | | | |
| Precipio, Inc. (a)(d) | | 30 | 85 |
| Pharmaceuticals - 6.5% | | | |
| Pharmaceuticals - 6.5% | | | |
| Adimab LLC (a)(d)(e)(f) | | 285,956 | 14,522,990 |
| Afferent Pharmaceuticals, Inc. rights 12/31/24 (a)(f) | | 1,915,787 | 3,410,101 |
| Arvinas Holding Co. LLC (a) | | 349,900 | 26,396,456 |
| AstraZeneca PLC sponsored ADR (b) | | 1,617,500 | 81,845,500 |
| Chiasma, Inc. warrants 12/16/24 (a) | | 81,298 | 28,432 |
| Graybug Vision, Inc. (b) | | 511,326 | 15,672,142 |
| IMARA, Inc. (b) | | 310,346 | 4,040,705 |
| Intra-Cellular Therapies, Inc. (a) | | 356,318 | 11,455,624 |
| Kala Pharmaceuticals, Inc. (a)(b) | | 502,200 | 3,731,346 |
| Pliant Therapeutics, Inc. (b) | | 380,573 | 9,365,902 |
| Stemcentrx, Inc. rights 12/31/21 (a)(f) | | 208,907 | 2 |
| Theravance Biopharma, Inc. (a)(b) | | 738,426 | 13,764,261 |
| | | | 184,233,461 |
| TOTAL COMMON STOCKS | | | |
| (Cost $1,880,629,422) | | | 2,772,587,281 |
|
| Convertible Preferred Stocks - 0.9% | | | |
| Biotechnology - 0.5% | | | |
| Biotechnology - 0.5% | | | |
| Ambrx, Inc.: | | | |
| Series A (d)(f) | | 1,599,306 | 3,294,570 |
| Series B (d)(f) | | 1,439,375 | 2,965,113 |
| Immunocore Ltd. Series A (a)(d) | | 17,857 | 2,193,941 |
| Tenaya Therapeutics, Inc. Series C (d)(f) | | 2,413,127 | 4,999,999 |
| | | | 13,453,623 |
| Health Care Providers & Services - 0.1% | | | |
| Health Care Services - 0.1% | | | |
| Ikena Oncology, Inc. Series B (d)(f) | | 2,022,700 | 2,828,746 |
| Pharmaceuticals - 0.3% | | | |
| Pharmaceuticals - 0.3% | | | |
| Afferent Pharmaceuticals, Inc. Series C (a)(d)(f) | | 1,915,787 | 19 |
| Aristea Therapeutics, Inc. Series B (d)(f) | | 278,600 | 2,008,706 |
| Vera Therapeutics, Inc. Series C (d)(f) | | 8,448,800 | 6,505,576 |
| | | | 8,514,301 |
| TOTAL CONVERTIBLE PREFERRED STOCKS | | | |
| (Cost $22,591,947) | | | 24,796,670 |
|
| Money Market Funds - 7.7% | | | |
| Fidelity Cash Central Fund 0.09% (g) | | 4,880,418 | 4,881,394 |
| Fidelity Securities Lending Cash Central Fund 0.09% (g)(h) | | 212,067,060 | 212,088,267 |
| TOTAL MONEY MARKET FUNDS | | | |
| (Cost $216,965,538) | | | 216,969,661 |
| TOTAL INVESTMENT IN SECURITIES - 107.1% | | | |
| (Cost $2,120,186,907) | | | 3,014,353,612 |
| NET OTHER ASSETS (LIABILITIES) - (7.1)% | | | (200,943,751) |
| NET ASSETS - 100% | | | $2,813,409,861 |
Legend
(a) Non-income producing
(b) Security or a portion of the security is on loan at period end.
(c) Security exempt from registration under Rule 144A of the Securities Act of 1933. These securities may be resold in transactions exempt from registration, normally to qualified institutional buyers. At the end of the period, the value of these securities amounted to $3,191,560 or 0.1% of net assets.
(d) Restricted securities (including private placements) - Investment in securities not registered under the Securities Act of 1933 (excluding 144A issues). At the end of the period, the value of restricted securities (excluding 144A issues) amounted to $39,319,745 or 1.4% of net assets.
(e) Investment is owned by a wholly-owned subsidiary (Subsidiary) that is treated as a corporation for U.S. tax purposes.
(f) Level 3 security
(g) Affiliated fund that is generally available only to investment companies and other accounts managed by Fidelity Investments. The rate quoted is the annualized seven-day yield of the fund at period end. A complete unaudited listing of the fund's holdings as of its most recent quarter end is available upon request. In addition, each Fidelity Central Fund's financial statements are available on the SEC's website or upon request.
(h) Investment made with cash collateral received from securities on loan.
Additional information on each restricted holding is as follows:
| Security | Acquisition Date | Acquisition Cost |
| Adimab LLC | 9/17/14 - 6/5/15 | $5,384,114 |
| Afferent Pharmaceuticals, Inc. Series C | 7/1/15 | $0 |
| Ambrx, Inc. Series A | 11/6/20 | $2,500,000 |
| Ambrx, Inc. Series B | 11/6/20 | $2,500,000 |
| Aristea Therapeutics, Inc. Series B | 10/6/20 | $1,536,117 |
| Ikena Oncology, Inc. Series B | 12/21/20 | $2,828,746 |
| Immunocore Ltd. Series A | 7/27/15 | $3,227,085 |
| Precipio, Inc. | 2/3/12 | $161,441 |
| Tenaya Therapeutics, Inc. Series C | 1/12/21 | $4,999,999 |
| Vera Therapeutics, Inc. Series C | 10/29/20 | $5,000,000 |
Affiliated Central Funds
Information regarding fiscal year to date income earned by the Fund from investments in Fidelity Central Funds is as follows:
| Fund | Income earned |
| Fidelity Cash Central Fund | $15,754 |
| Fidelity Securities Lending Cash Central Fund | 295,723 |
| Total | $311,477 |
Amounts in the income column in the above table include any capital gain distributions from underlying funds, which are presented in the corresponding line-item in the Statement of Operations, if applicable. Amount for Fidelity Securities Lending Cash Central Fund represents the income earned on investing cash collateral, less rebates paid to borrowers and any lending agent fees associated with the loan, plus any premium payments received for lending certain types of securities.
The value, beginning of period, for the Fidelity Securities Lending Cash Central Fund was $81,419,588. Net realized gain (loss) and change in net unrealized appreciation (depreciation) on Fidelity Cash Central Fund is presented in the Statement of Operations, if applicable. Purchases and sales of the Fidelity Cash Central Fund were $590,707,329 and $460,038,650, respectively, during the period.
Investment Valuation
The following is a summary of the inputs used, as of January 31, 2021, involving the Fund's assets and liabilities carried at fair value. The inputs or methodology used for valuing securities may not be an indication of the risk associated with investing in those securities. For more information on valuation inputs, and their aggregation into the levels used below, please refer to the Investment Valuation section in the accompanying Notes to Financial Statements.
| | Valuation Inputs at Reporting Date: |
| Description | Total | Level 1 | Level 2 | Level 3 |
| Investments in Securities: | | | | |
| Common Stocks | $2,772,587,281 | $2,679,294,871 | $75,359,317 | $17,933,093 |
| Convertible Preferred Stocks | 24,796,670 | -- | 2,193,941 | 22,602,729 |
| Money Market Funds | 216,969,661 | 216,969,661 | -- | -- |
| Total Investments in Securities: | $3,014,353,612 | $2,896,264,532 | $77,553,258 | $40,535,822 |
The following is a reconciliation of Investments in Securities for which Level 3 inputs were used in determining value:
| Investments in Securities: | |
| Beginning Balance | $33,099,919 |
| Total Realized Gain (Loss) | -- |
| Total Unrealized Gain (Loss) | 5,999,983 |
| Cost of Purchases | 19,364,862 |
| Proceeds of Sales | (60,001) |
| Amortization/Accretion | -- |
| Transfers in to Level 3 | -- |
| Transfers out of Level 3 | (17,868,941) |
| Ending Balance | $40,535,822 |
| The change in unrealized gain (loss) for the period attributable to Level 3 securities held at January 31, 2021 | $5,999,983 |
The information used in the above reconciliation represents fiscal year to date activity for any Investments in Securities identified as using Level 3 inputs at either the beginning or the end of the current fiscal period. Cost of purchases and proceeds of sales may include securities received and/or delivered through in-kind transactions. Transfers in or out of Level 3 represent the beginning value of any Security or Instrument where a change in the pricing level occurred from the beginning to the end of the period. The cost of purchases and the proceeds of sales may include securities received or delivered through corporate actions or exchanges. Realized and unrealized gains (losses) disclosed in the reconciliation are included in Net Gain (Loss) on the Fund's Statement of Operations.
Other Information
Distribution of investments by country or territory of incorporation, as a percentage of Total Net Assets, is as follows (Unaudited):
| United States of America | 89.8% |
| Netherlands | 4.1% |
| Denmark | 2.6% |
| Canada | 1.5% |
| Cayman Islands | 1.3% |
| Others (Individually Less Than 1%) | 0.7% |
| | 100.0% |
See accompanying notes which are an integral part of the financial statements.
Fidelity Advisor® Biotechnology Fund
Financial Statements
Statement of Assets and Liabilities
| | | January 31, 2021 (Unaudited) |
| Assets | | |
Investment in securities, at value (including securities loaned of $204,657,024) — See accompanying schedule:
Unaffiliated issuers (cost $1,903,221,369) | $2,797,383,951 | |
| Fidelity Central Funds (cost $216,965,538) | 216,969,661 | |
| Total Investment in Securities (cost $2,120,186,907) | | $3,014,353,612 |
| Receivable for investments sold | | 27,759,844 |
| Receivable for fund shares sold | | 3,372,232 |
| Dividends receivable | | 8,049,444 |
| Distributions receivable from Fidelity Central Funds | | 51,462 |
| Prepaid expenses | | 16,528 |
| Other receivables | | 41,648 |
| Total assets | | 3,053,644,770 |
| Liabilities | | |
| Payable for investments purchased | $21,675,991 | |
| Payable for fund shares redeemed | 4,096,126 | |
| Accrued management fee | 1,263,426 | |
| Distribution and service plan fees payable | 611,899 | |
| Other affiliated payables | 474,044 | |
| Other payables and accrued expenses | 58,259 | |
| Collateral on securities loaned | 212,055,164 | |
| Total liabilities | | 240,234,909 |
| Net Assets | | $2,813,409,861 |
| Net Assets consist of: | | |
| Paid in capital | | $1,741,995,681 |
| Total accumulated earnings (loss) | | 1,071,414,180 |
| Net Assets | | $2,813,409,861 |
| Net Asset Value and Maximum Offering Price | | |
| Class A: | | |
| Net Asset Value and redemption price per share ($845,614,664 ÷ 24,788,929 shares)(a) | | $34.11 |
| Maximum offering price per share (100/94.25 of $34.11) | | $36.19 |
| Class M: | | |
| Net Asset Value and redemption price per share ($172,345,348 ÷ 5,420,299 shares)(a) | | $31.80 |
| Maximum offering price per share (100/96.50 of $31.80) | | $32.95 |
| Class C: | | |
| Net Asset Value and offering price per share ($414,910,427 ÷ 14,775,231 shares)(a) | | $28.08 |
| Class I: | | |
| Net Asset Value, offering price and redemption price per share ($1,297,095,097 ÷ 35,415,191 shares) | | $36.63 |
| Class Z: | | |
| Net Asset Value, offering price and redemption price per share ($83,444,325 ÷ 2,275,165 shares) | | $36.68 |
(a) Redemption price per share is equal to net asset value less any applicable contingent deferred sales charge.
See accompanying notes which are an integral part of the financial statements.
Statement of Operations
| | | Six months ended January 31, 2021 (Unaudited) |
| Investment Income | | |
| Dividends | | $15,601,074 |
| Income from Fidelity Central Funds (including $295,723 from security lending) | | 311,477 |
| Total income | | 15,912,551 |
| Expenses | | |
| Management fee | $6,869,158 | |
| Transfer agent fees | 2,311,915 | |
| Distribution and service plan fees | 3,367,229 | |
| Accounting fees | 385,820 | |
| Custodian fees and expenses | 28,282 | |
| Independent trustees' fees and expenses | 6,170 | |
| Registration fees | 101,581 | |
| Audit | 33,737 | |
| Legal | 4,488 | |
| Interest | 315 | |
| Miscellaneous | 6,035 | |
| Total expenses before reductions | 13,114,730 | |
| Expense reductions | (37,945) | |
| Total expenses after reductions | | 13,076,785 |
| Net investment income (loss) | | 2,835,766 |
| Realized and Unrealized Gain (Loss) | | |
| Net realized gain (loss) on: | | |
| Investment securities: | | |
| Unaffiliated issuers | 414,070,646 | |
| Fidelity Central Funds | 1,063 | |
| Total net realized gain (loss) | | 414,071,709 |
| Change in net unrealized appreciation (depreciation) on: | | |
| Investment securities: | | |
| Unaffiliated issuers | 37,663,489 | |
| Fidelity Central Funds | (3,683) | |
| Total change in net unrealized appreciation (depreciation) | | 37,659,806 |
| Net gain (loss) | | 451,731,515 |
| Net increase (decrease) in net assets resulting from operations | | $454,567,281 |
See accompanying notes which are an integral part of the financial statements.
Statement of Changes in Net Assets
| | Six months ended January 31, 2021 (Unaudited) | Year ended July 31, 2020 |
| Increase (Decrease) in Net Assets | | |
| Operations | | |
| Net investment income (loss) | $2,835,766 | $1,962,344 |
| Net realized gain (loss) | 414,071,709 | 5,639,561 |
| Change in net unrealized appreciation (depreciation) | 37,659,806 | 538,898,836 |
| Net increase (decrease) in net assets resulting from operations | 454,567,281 | 546,500,741 |
| Distributions to shareholders | (220,369,640) | (142,937,680) |
| Share transactions - net increase (decrease) | 172,441,396 | (167,947,129) |
| Total increase (decrease) in net assets | 406,639,037 | 235,615,932 |
| Net Assets | | |
| Beginning of period | 2,406,770,824 | 2,171,154,892 |
| End of period | $2,813,409,861 | $2,406,770,824 |
See accompanying notes which are an integral part of the financial statements.
Financial Highlights
Fidelity Advisor Biotechnology Fund Class A
| | Six months ended (Unaudited) January 31, | Years endedJuly 31, | | | | |
| | 2021 | 2020 | 2019 | 2018 | 2017 | 2016 |
| Selected Per–Share Data | | | | | | |
| Net asset value, beginning of period | $31.03 | $25.48 | $27.80 | $24.45 | $21.39 | $31.43 |
| Income from Investment Operations | | | | | | |
| Net investment income (loss)A | .04 | .03 | .03 | (.14) | (.15)B | (.16) |
| Net realized and unrealized gain (loss) | 5.88 | 7.40 | (1.76) | 3.49 | 3.21 | (8.48) |
| Total from investment operations | 5.92 | 7.43 | (1.73) | 3.35 | 3.06 | (8.64) |
| Distributions from net investment income | (.03) | – | – | – | – | – |
| Distributions from net realized gain | (2.81) | (1.88) | (.59) | – | – | (1.40) |
| Total distributions | (2.84) | (1.88) | (.59) | – | – | (1.40) |
| Redemption fees added to paid in capitalA | – | – | – | – | –C | –C |
| Net asset value, end of period | $34.11 | $31.03 | $25.48 | $27.80 | $24.45 | $21.39 |
| Total ReturnD,E,F | 19.02% | 30.00% | (6.17)% | 13.70% | 14.31% | (28.55)% |
| Ratios to Average Net AssetsG,H | | | | | | |
| Expenses before reductions | 1.01%I | 1.02% | 1.04% | 1.06% | 1.05% | 1.05% |
| Expenses net of fee waivers, if any | 1.01%I | 1.02% | 1.03% | 1.06% | 1.05% | 1.05% |
| Expenses net of all reductions | 1.01%I | 1.02% | 1.03% | 1.06% | 1.04% | 1.04% |
| Net investment income (loss) | .22%I | .11% | .13% | (.53)% | (.69)%B | (.69)% |
| Supplemental Data | | | | | | |
| Net assets, end of period (000 omitted) | $845,615 | $722,896 | $616,894 | $766,303 | $787,802 | $1,080,733 |
| Portfolio turnover rateJ | 90%I | 66% | 62% | 45% | 30% | 29% |
A Calculated based on average shares outstanding during the period.
B Net investment income per share reflects one or more large, non-recurring dividend(s) which amounted to $.01 per share. Excluding such non-recurring dividend(s), the ratio of net investment income (loss) to average net assets would have been (.71) %.
C Amount represents less than $.005 per share.
D Total returns for periods of less than one year are not annualized.
E Total returns would have been lower if certain expenses had not been reduced during the applicable periods shown.
F Total returns do not include the effect of the sales charges.
G Fees and expenses of any underlying mutual funds or exchange-traded funds (ETFs) are not included in the Fund's expense ratio. The Fund indirectly bears its proportionate share of these expenses. For additional expense information related to investments in Fidelity Central Funds, please refer to the "Investments in Fidelity Central Funds" note found in the Notes to Financial Statements section of the most recent Annual or Semi-Annual report.
H Expense ratios reflect operating expenses of the class. Expenses before reductions do not reflect amounts reimbursed, waived, or reduced through arrangements with the investment adviser, brokerage services, or other offset arrangements, if applicable, and do not represent the amount paid by the class during periods when reimbursements, waivers or reductions occur.
I Annualized
J Amount does not include the portfolio activity of any underlying mutual funds or exchange-traded funds (ETFs).
See accompanying notes which are an integral part of the financial statements.
Fidelity Advisor Biotechnology Fund Class M
| | Six months ended (Unaudited) January 31, | Years endedJuly 31, | | | | |
| | 2021 | 2020 | 2019 | 2018 | 2017 | 2016 |
| Selected Per–Share Data | | | | | | |
| Net asset value, beginning of period | $29.08 | $24.02 | $26.32 | $23.22 | $20.39 | $30.06 |
| Income from Investment Operations | | | | | | |
| Net investment income (loss)A | (.01) | (.05) | (.04) | (.21) | (.21)B | (.22) |
| Net realized and unrealized gain (loss) | 5.51 | 6.96 | (1.67) | 3.31 | 3.04 | (8.10) |
| Total from investment operations | 5.50 | 6.91 | (1.71) | 3.10 | 2.83 | (8.32) |
| Distributions from net investment income | – | – | – | – | – | – |
| Distributions from net realized gain | (2.78) | (1.85) | (.59) | – | – | (1.35) |
| Total distributions | (2.78) | (1.85) | (.59) | – | – | (1.35) |
| Redemption fees added to paid in capitalA | – | – | – | – | –C | –C |
| Net asset value, end of period | $31.80 | $29.08 | $24.02 | $26.32 | $23.22 | $20.39 |
| Total ReturnD,E,F | 18.85% | 29.64% | (6.44)% | 13.35% | 13.88% | (28.75)% |
| Ratios to Average Net AssetsG,H | | | | | | |
| Expenses before reductions | 1.29%I | 1.32% | 1.34% | 1.38% | 1.38% | 1.37% |
| Expenses net of fee waivers, if any | 1.29%I | 1.32% | 1.34% | 1.38% | 1.38% | 1.37% |
| Expenses net of all reductions | 1.29%I | 1.31% | 1.34% | 1.38% | 1.38% | 1.37% |
| Net investment income (loss) | (.06)%I | (.18)% | (.18)% | (.84)% | (1.02)%B | (1.01)% |
| Supplemental Data | | | | | | |
| Net assets, end of period (000 omitted) | $172,345 | $144,568 | $119,312 | $135,879 | $127,734 | $131,928 |
| Portfolio turnover rateJ | 90%I | 66% | 62% | 45% | 30% | 29% |
A Calculated based on average shares outstanding during the period.
B Net investment income per share reflects one or more large, non-recurring dividend(s) which amounted to $.01 per share. Excluding such non-recurring dividend(s), the ratio of net investment income (loss) to average net assets would have been (1.05) %.
C Amount represents less than $.005 per share.
D Total returns for periods of less than one year are not annualized.
E Total returns would have been lower if certain expenses had not been reduced during the applicable periods shown.
F Total returns do not include the effect of the sales charges.
G Fees and expenses of any underlying mutual funds or exchange-traded funds (ETFs) are not included in the Fund's expense ratio. The Fund indirectly bears its proportionate share of these expenses. For additional expense information related to investments in Fidelity Central Funds, please refer to the "Investments in Fidelity Central Funds" note found in the Notes to Financial Statements section of the most recent Annual or Semi-Annual report.
H Expense ratios reflect operating expenses of the class. Expenses before reductions do not reflect amounts reimbursed, waived, or reduced through arrangements with the investment adviser, brokerage services, or other offset arrangements, if applicable, and do not represent the amount paid by the class during periods when reimbursements, waivers or reductions occur.
I Annualized
J Amount does not include the portfolio activity of any underlying mutual funds or exchange-traded funds (ETFs).
See accompanying notes which are an integral part of the financial statements.
Fidelity Advisor Biotechnology Fund Class C
| | Six months ended (Unaudited) January 31, | Years endedJuly 31, | | | | |
| | 2021 | 2020 | 2019 | 2018 | 2017 | 2016 |
| Selected Per–Share Data | | | | | | |
| Net asset value, beginning of period | $25.97 | $21.71 | $23.96 | $21.23 | $18.71 | $27.78 |
| Income from Investment Operations | | | | | | |
| Net investment income (loss)A | (.07) | (.15) | (.14) | (.29) | (.27)B | (.29) |
| Net realized and unrealized gain (loss) | 4.91 | 6.26 | (1.52) | 3.02 | 2.79 | (7.46) |
| Total from investment operations | 4.84 | 6.11 | (1.66) | 2.73 | 2.52 | (7.75) |
| Distributions from net investment income | – | – | – | – | – | – |
| Distributions from net realized gain | (2.73) | (1.85) | (.59) | – | – | (1.32) |
| Total distributions | (2.73) | (1.85) | (.59) | – | – | (1.32) |
| Redemption fees added to paid in capitalA | – | – | – | – | –C | –C |
| Net asset value, end of period | $28.08 | $25.97 | $21.71 | $23.96 | $21.23 | $18.71 |
| Total ReturnD,E,F | 18.57% | 29.07% | (6.87)% | 12.86% | 13.47% | (29.06)% |
| Ratios to Average Net AssetsG,H | | | | | | |
| Expenses before reductions | 1.76%I | 1.77% | 1.78% | 1.80% | 1.79% | 1.80% |
| Expenses net of fee waivers, if any | 1.76%I | 1.77% | 1.77% | 1.80% | 1.79% | 1.80% |
| Expenses net of all reductions | 1.76%I | 1.76% | 1.77% | 1.80% | 1.79% | 1.79% |
| Net investment income (loss) | (.53)%I | (.63)% | (.61)% | (1.27)% | (1.43)%B | (1.44)% |
| Supplemental Data | | | | | | |
| Net assets, end of period (000 omitted) | $414,910 | $384,420 | $398,749 | $558,420 | $593,489 | $665,036 |
| Portfolio turnover rateJ | 90%I | 66% | 62% | 45% | 30% | 29% |
A Calculated based on average shares outstanding during the period.
B Net investment income per share reflects one or more large, non-recurring dividend(s) which amounted to $.01 per share. Excluding such non-recurring dividend(s), the ratio of net investment income (loss) to average net assets would have been (1.46) %.
C Amount represents less than $.005 per share.
D Total returns for periods of less than one year are not annualized.
E Total returns would have been lower if certain expenses had not been reduced during the applicable periods shown.
F Total returns do not include the effect of the contingent deferred sales charge.
G Fees and expenses of any underlying mutual funds or exchange-traded funds (ETFs) are not included in the Fund's expense ratio. The Fund indirectly bears its proportionate share of these expenses. For additional expense information related to investments in Fidelity Central Funds, please refer to the "Investments in Fidelity Central Funds" note found in the Notes to Financial Statements section of the most recent Annual or Semi-Annual report.
H Expense ratios reflect operating expenses of the class. Expenses before reductions do not reflect amounts reimbursed, waived, or reduced through arrangements with the investment adviser, brokerage services, or other offset arrangements, if applicable, and do not represent the amount paid by the class during periods when reimbursements, waivers or reductions occur.
I Annualized
J Amount does not include the portfolio activity of any underlying mutual funds or exchange-traded funds (ETFs).
See accompanying notes which are an integral part of the financial statements.
Fidelity Advisor Biotechnology Fund Class I
| | Six months ended (Unaudited) January 31, | Years endedJuly 31, | | | | |
| | 2021 | 2020 | 2019 | 2018 | 2017 | 2016 |
| Selected Per–Share Data | | | | | | |
| Net asset value, beginning of period | $33.16 | $27.08 | $29.42 | $25.80 | $22.52 | $32.95 |
| Income from Investment Operations | | | | | | |
| Net investment income (loss)A | .09 | .11 | .11 | (.07) | (.10)B | (.10) |
| Net realized and unrealized gain (loss) | 6.30 | 7.88 | (1.86) | 3.69 | 3.38 | (8.89) |
| Total from investment operations | 6.39 | 7.99 | (1.75) | 3.62 | 3.28 | (8.99) |
| Distributions from net investment income | (.07) | –C | – | – | – | – |
| Distributions from net realized gain | (2.85) | (1.91) | (.59) | – | – | (1.44) |
| Total distributions | (2.92) | (1.91) | (.59) | – | – | (1.44) |
| Redemption fees added to paid in capitalA | – | – | – | – | –C | –C |
| Net asset value, end of period | $36.63 | $33.16 | $27.08 | $29.42 | $25.80 | $22.52 |
| Total ReturnD,E | 19.21% | 30.32% | (5.89)% | 14.03% | 14.56% | (28.32)% |
| Ratios to Average Net AssetsF,G | | | | | | |
| Expenses before reductions | .75%H | .75% | .76% | .79% | .78% | .78% |
| Expenses net of fee waivers, if any | .75%H | .75% | .76% | .79% | .78% | .78% |
| Expenses net of all reductions | .74%H | .75% | .76% | .79% | .77% | .78% |
| Net investment income (loss) | .48%H | .38% | .40% | (.26)% | (.42)%B | (.42)% |
| Supplemental Data | | | | | | |
| Net assets, end of period (000 omitted) | $1,297,095 | $1,092,145 | $1,006,084 | $1,307,833 | $1,156,358 | $908,234 |
| Portfolio turnover rateI | 90%H | 66% | 62% | 45% | 30% | 29% |
A Calculated based on average shares outstanding during the period.
B Net investment income per share reflects one or more large, non-recurring dividend(s) which amounted to $.01 per share. Excluding such non-recurring dividend(s), the ratio of net investment income (loss) to average net assets would have been (.44) %.
C Amount represents less than $.005 per share.
D Total returns for periods of less than one year are not annualized.
E Total returns would have been lower if certain expenses had not been reduced during the applicable periods shown.
F Fees and expenses of any underlying mutual funds or exchange-traded funds (ETFs) are not included in the Fund's expense ratio. The Fund indirectly bears its proportionate share of these expenses. For additional expense information related to investments in Fidelity Central Funds, please refer to the "Investments in Fidelity Central Funds" note found in the Notes to Financial Statements section of the most recent Annual or Semi-Annual report.
G Expense ratios reflect operating expenses of the class. Expenses before reductions do not reflect amounts reimbursed, waived, or reduced through arrangements with the investment adviser, brokerage services, or other offset arrangements, if applicable, and do not represent the amount paid by the class during periods when reimbursements, waivers or reductions occur.
H Annualized
I Amount does not include the portfolio activity of any underlying mutual funds or exchange-traded funds (ETFs).
See accompanying notes which are an integral part of the financial statements.
Fidelity Advisor Biotechnology Fund Class Z
| | Six months ended (Unaudited) January 31, | Years endedJuly 31, | |
| | 2021 | 2020 | 2019 A |
| Selected Per–Share Data | | | |
| Net asset value, beginning of period | $33.22 | $27.10 | $30.06 |
| Income from Investment Operations | | | |
| Net investment income (loss)B | .11 | .15 | .16 |
| Net realized and unrealized gain (loss) | 6.31 | 7.90 | (2.53) |
| Total from investment operations | 6.42 | 8.05 | (2.37) |
| Distributions from net investment income | (.10) | (.02) | – |
| Distributions from net realized gain | (2.87) | (1.91) | (.59) |
| Total distributions | (2.96)C | (1.93) | (.59) |
| Net asset value, end of period | $36.68 | $33.22 | $27.10 |
| Total ReturnD,E | 19.29% | 30.53% | (7.83)% |
| Ratios to Average Net AssetsF,G | | | |
| Expenses before reductions | .62%H | .62% | .63%H |
| Expenses net of fee waivers, if any | .62%H | .62% | .63%H |
| Expenses net of all reductions | .61%H | .62% | .62%H |
| Net investment income (loss) | .61%H | .51% | .73%H |
| Supplemental Data | | | |
| Net assets, end of period (000 omitted) | $83,444 | $62,743 | $30,116 |
| Portfolio turnover rateI | 90%H | 66% | 62% |
A For the period October 2, 2018 (commencement of sale of shares) to July 31, 2019.
B Calculated based on average shares outstanding during the period.
C Total distributions per share do not sum due to rounding.
D Total returns for periods of less than one year are not annualized.
E Total returns would have been lower if certain expenses had not been reduced during the applicable periods shown.
F Fees and expenses of any underlying mutual funds or exchange-traded funds (ETFs) are not included in the Fund's expense ratio. The Fund indirectly bears its proportionate share of these expenses. For additional expense information related to investments in Fidelity Central Funds, please refer to the "Investments in Fidelity Central Funds" note found in the Notes to Financial Statements section of the most recent Annual or Semi-Annual report.
G Expense ratios reflect operating expenses of the class. Expenses before reductions do not reflect amounts reimbursed, waived, or reduced through arrangements with the investment adviser, brokerage services, or other offset arrangements, if applicable, and do not represent the amount paid by the class during periods when reimbursements, waivers or reductions occur.
H Annualized
I Amount does not include the portfolio activity of any underlying mutual funds or exchange-traded funds (ETFs).
See accompanying notes which are an integral part of the financial statements.
Fidelity Advisor® Communications Equipment Fund
Investment Summary (Unaudited)
Top Ten Stocks as of January 31, 2021
| | % of fund's net assets |
| Cisco Systems, Inc. | 17.1 |
| Ericsson (B Shares) sponsored ADR | 11.4 |
| Motorola Solutions, Inc. | 10.4 |
| F5 Networks, Inc. | 5.9 |
| Ciena Corp. | 5.1 |
| Acacia Communications, Inc. | 4.7 |
| Lumentum Holdings, Inc. | 4.5 |
| Juniper Networks, Inc. | 4.5 |
| Calix Networks, Inc. | 3.8 |
| CommScope Holding Co., Inc. | 3.6 |
| | 71.0 |
Top Industries (% of fund's net assets)
| As of January 31, 2021 |
| | Communications Equipment | 91.4% |
| | Software | 6.2% |
| | IT Services | 0.3% |
| | Entertainment | 0.2% |
| | All Others* | 1.9% |

* Includes short-term investments and net other assets (liabilities).
Fidelity Advisor® Communications Equipment Fund
Schedule of Investments January 31, 2021 (Unaudited)
Showing Percentage of Net Assets
| Common Stocks - 98.1% | | | |
| | | Shares | Value |
| Communications Equipment - 91.4% | | | |
| Communications Equipment - 91.4% | | | |
| Acacia Communications, Inc. (a) | | 8,082 | $924,581 |
| ADTRAN, Inc. | | 9,062 | 155,866 |
| Arista Networks, Inc. (a) | | 1,715 | 527,465 |
| Calix Networks, Inc. (a) | | 24,955 | 753,641 |
| Cambium Networks Corp. (a) | | 4,200 | 154,350 |
| Casa Systems, Inc. (a) | | 8,310 | 64,070 |
| Ciena Corp. (a) | | 18,884 | 1,008,217 |
| Cisco Systems, Inc. | | 75,016 | 3,344,214 |
| CommScope Holding Co., Inc. (a) | | 47,428 | 696,717 |
| EchoStar Holding Corp. Class A (a) | | 15,814 | 331,145 |
| Ericsson (B Shares) sponsored ADR | | 178,600 | 2,227,142 |
| Evertz Technologies Ltd. | | 5,208 | 52,131 |
| Extreme Networks, Inc. (a) | | 30,568 | 247,295 |
| F5 Networks, Inc. (a) | | 5,867 | 1,149,639 |
| Harmonic, Inc. (a) | | 18,184 | 141,108 |
| Inseego Corp. (a)(b) | | 8,481 | 155,711 |
| Juniper Networks, Inc. | | 35,855 | 875,579 |
| Lumentum Holdings, Inc. (a) | | 9,379 | 879,750 |
| Motorola Solutions, Inc. | | 12,167 | 2,038,581 |
| NetScout Systems, Inc. (a) | | 14,025 | 410,021 |
| Nokia Corp. sponsored ADR (a)(b) | | 132,897 | 606,010 |
| Radware Ltd. (a) | | 19 | 539 |
| Ribbon Communications, Inc. (a) | | 11,745 | 85,856 |
| Sierra Wireless, Inc. (a) | | 7,315 | 135,403 |
| ViaSat, Inc. (a)(b) | | 7,509 | 326,942 |
| Viavi Solutions, Inc. (a) | | 37,493 | 579,267 |
| | | | 17,871,240 |
| Electronic Equipment & Components - 0.0% | | | |
| Electronic Components - 0.0% | | | |
| Corning, Inc. | | 33 | 1,184 |
| Entertainment - 0.2% | | | |
| Movies & Entertainment - 0.2% | | | |
| The Walt Disney Co. | | 287 | 48,265 |
| IT Services - 0.3% | | | |
| Internet Services & Infrastructure - 0.3% | | | |
| Rackspace Technology, Inc. (a) | | 2,958 | 68,359 |
| Software - 6.2% | | | |
| Application Software - 0.0% | | | |
| Citrix Systems, Inc. | | 1 | 133 |
| Systems Software - 6.2% | | | |
| Cloudflare, Inc. (a) | | 4,565 | 349,953 |
| CommVault Systems, Inc. (a) | | 2,426 | 152,304 |
| Fortinet, Inc. (a) | | 452 | 65,427 |
| Palo Alto Networks, Inc. (a) | | 657 | 230,443 |
| Ping Identity Holding Corp. (a) | | 7,740 | 231,503 |
| Rapid7, Inc. (a) | | 2,098 | 182,148 |
| | | | 1,211,778 |
|
| TOTAL SOFTWARE | | | 1,211,911 |
|
| TOTAL COMMON STOCKS | | | |
| (Cost $12,454,306) | | | 19,200,959 |
|
| Money Market Funds - 7.7% | | | |
| Fidelity Cash Central Fund 0.09% (c) | | 477,981 | 478,076 |
| Fidelity Securities Lending Cash Central Fund 0.09% (c)(d) | | 1,022,348 | 1,022,450 |
| TOTAL MONEY MARKET FUNDS | | | |
| (Cost $1,500,526) | | | 1,500,526 |
| TOTAL INVESTMENT IN SECURITIES - 105.8% | | | |
| (Cost $13,954,832) | | | 20,701,485 |
| NET OTHER ASSETS (LIABILITIES) - (5.8)% | | | (1,140,408) |
| NET ASSETS - 100% | | | $19,561,077 |
Legend
(a) Non-income producing
(b) Security or a portion of the security is on loan at period end.
(c) Affiliated fund that is generally available only to investment companies and other accounts managed by Fidelity Investments. The rate quoted is the annualized seven-day yield of the fund at period end. A complete unaudited listing of the fund's holdings as of its most recent quarter end is available upon request. In addition, each Fidelity Central Fund's financial statements are available on the SEC's website or upon request.
(d) Investment made with cash collateral received from securities on loan.
Affiliated Central Funds
Information regarding fiscal year to date income earned by the Fund from investments in Fidelity Central Funds is as follows:
| Fund | Income earned |
| Fidelity Cash Central Fund | $131 |
| Fidelity Securities Lending Cash Central Fund | 5,204 |
| Total | $5,335 |
Amounts in the income column in the above table include any capital gain distributions from underlying funds, which are presented in the corresponding line-item in the Statement of Operations, if applicable. Amount for Fidelity Securities Lending Cash Central Fund represents the income earned on investing cash collateral, less rebates paid to borrowers and any lending agent fees associated with the loan, plus any premium payments received for lending certain types of securities.
Investment Valuation
The following is a summary of the inputs used, as of January 31, 2021, involving the Fund's assets and liabilities carried at fair value. The inputs or methodology used for valuing securities may not be an indication of the risk associated with investing in those securities. For more information on valuation inputs, and their aggregation into the levels used below, please refer to the Investment Valuation section in the accompanying Notes to Financial Statements.
| | Valuation Inputs at Reporting Date: |
| Description | Total | Level 1 | Level 2 | Level 3 |
| Investments in Securities: | | | | |
| Common Stocks | $19,200,959 | $19,200,959 | $-- | $-- |
| Money Market Funds | 1,500,526 | 1,500,526 | -- | -- |
| Total Investments in Securities: | $20,701,485 | $20,701,485 | $-- | $-- |
Other Information
Distribution of investments by country or territory of incorporation, as a percentage of Total Net Assets, is as follows (Unaudited):
| United States of America | 83.7% |
| Sweden | 11.4% |
| Finland | 3.1% |
| Canada | 1.0% |
| Others (Individually Less Than 1%) | 0.8% |
| | 100.0% |
See accompanying notes which are an integral part of the financial statements.
Fidelity Advisor® Communications Equipment Fund
Financial Statements
Statement of Assets and Liabilities
| | | January 31, 2021 (Unaudited) |
| Assets | | |
Investment in securities, at value (including securities loaned of $945,908) — See accompanying schedule:
Unaffiliated issuers (cost $12,454,306) | $19,200,959 | |
| Fidelity Central Funds (cost $1,500,526) | 1,500,526 | |
| Total Investment in Securities (cost $13,954,832) | | $20,701,485 |
| Receivable for investments sold | | 171,029 |
| Receivable for fund shares sold | | 43,981 |
| Distributions receivable from Fidelity Central Funds | | 603 |
| Prepaid expenses | | 101 |
| Other receivables | | 542 |
| Total assets | | 20,917,741 |
| Liabilities | | |
| Payable for investments purchased | $254,914 | |
| Payable for fund shares redeemed | 28,987 | |
| Accrued management fee | 8,518 | |
| Distribution and service plan fees payable | 6,182 | |
| Other affiliated payables | 4,612 | |
| Other payables and accrued expenses | 31,226 | |
| Collateral on securities loaned | 1,022,225 | |
| Total liabilities | | 1,356,664 |
| Net Assets | | $19,561,077 |
| Net Assets consist of: | | |
| Paid in capital | | $13,565,382 |
| Total accumulated earnings (loss) | | 5,995,695 |
| Net Assets | | $19,561,077 |
| Net Asset Value and Maximum Offering Price | | |
| Class A: | | |
| Net Asset Value and redemption price per share ($10,656,010 ÷ 646,787 shares)(a) | | $16.48 |
| Maximum offering price per share (100/94.25 of $16.48) | | $17.49 |
| Class M: | | |
| Net Asset Value and redemption price per share ($4,339,463 ÷ 276,071 shares)(a) | | $15.72 |
| Maximum offering price per share (100/96.50 of $15.72) | | $16.29 |
| Class C: | | |
| Net Asset Value and offering price per share ($2,649,318 ÷ 187,227 shares)(a) | | $14.15 |
| Class I: | | |
| Net Asset Value, offering price and redemption price per share ($1,916,286 ÷ 110,908 shares) | | $17.28 |
(a) Redemption price per share is equal to net asset value less any applicable contingent deferred sales charge.
See accompanying notes which are an integral part of the financial statements.
Statement of Operations
| | | Six months ended January 31, 2021 (Unaudited) |
| Investment Income | | |
| Dividends | | $103,321 |
| Income from Fidelity Central Funds (including $5,204 from security lending) | | 5,335 |
| Total income | | 108,656 |
| Expenses | | |
| Management fee | $46,299 | |
| Transfer agent fees | 23,978 | |
| Distribution and service plan fees | 34,326 | |
| Accounting fees | 3,407 | |
| Custodian fees and expenses | 6,376 | |
| Independent trustees' fees and expenses | 43 | |
| Registration fees | 47,243 | |
| Audit | 24,036 | |
| Legal | 21 | |
| Miscellaneous | 94 | |
| Total expenses before reductions | 185,823 | |
| Expense reductions | (51,501) | |
| Total expenses after reductions | | 134,322 |
| Net investment income (loss) | | (25,666) |
| Realized and Unrealized Gain (Loss) | | |
| Net realized gain (loss) on: | | |
| Investment securities: | | |
| Unaffiliated issuers | 545,703 | |
| Fidelity Central Funds | (36) | |
| Foreign currency transactions | (16) | |
| Total net realized gain (loss) | | 545,651 |
| Change in net unrealized appreciation (depreciation) on investment securities | | 1,356,574 |
| Net gain (loss) | | 1,902,225 |
| Net increase (decrease) in net assets resulting from operations | | $1,876,559 |
See accompanying notes which are an integral part of the financial statements.
Statement of Changes in Net Assets
| | Six months ended January 31, 2021 (Unaudited) | Year ended July 31, 2020 |
| Increase (Decrease) in Net Assets | | |
| Operations | | |
| Net investment income (loss) | $(25,666) | $(73,819) |
| Net realized gain (loss) | 545,651 | (974,368) |
| Change in net unrealized appreciation (depreciation) | 1,356,574 | (1,126,563) |
| Net increase (decrease) in net assets resulting from operations | 1,876,559 | (2,174,750) |
| Share transactions - net increase (decrease) | (1,426,324) | (8,916,500) |
| Total increase (decrease) in net assets | 450,235 | (11,091,250) |
| Net Assets | | |
| Beginning of period | 19,110,842 | 30,202,092 |
| End of period | $19,561,077 | $19,110,842 |
See accompanying notes which are an integral part of the financial statements.
Financial Highlights
Fidelity Advisor Communications Equipment Fund Class A
| | Six months ended (Unaudited) January 31, | Years endedJuly 31, | | | | |
| | 2021 | 2020 | 2019 | 2018 | 2017 | 2016 |
| Selected Per–Share Data | | | | | | |
| Net asset value, beginning of period | $14.75 | $15.76 | $15.17 | $13.69 | $12.09 | $12.57 |
| Income from Investment Operations | | | | | | |
| Net investment income (loss)A | (.01) | (.03) | (.01) | .03 | .07 | .09 |
| Net realized and unrealized gain (loss) | 1.74 | (.98) | 1.04 | 2.08 | 1.76 | (.20) |
| Total from investment operations | 1.73 | (1.01) | 1.03 | 2.11 | 1.83 | (.11) |
| Distributions from net investment income | – | – | – | (.04)B | (.05) | – |
| Distributions from net realized gain | – | – | (.44) | (.59)B | (.18) | (.37) |
| Total distributions | – | – | (.44) | (.63) | (.23) | (.37) |
| Redemption fees added to paid in capitalA | – | – | – | –C | –C | –C |
| Net asset value, end of period | $16.48 | $14.75 | $15.76 | $15.17 | $13.69 | $12.09 |
| Total ReturnD,E,F | 11.73% | (6.41)% | 7.09% | 15.86% | 15.24% | (.53)% |
| Ratios to Average Net AssetsG,H | | | | | | |
| Expenses before reductions | 1.99%I | 1.64% | 1.47% | 1.76% | 1.78% | 2.10% |
| Expenses net of fee waivers, if any | 1.39%I | 1.41% | 1.40% | 1.40% | 1.40% | 1.40% |
| Expenses net of all reductions | 1.39%I | 1.37% | 1.39% | 1.39% | 1.39% | 1.40% |
| Net investment income (loss) | (.15)%I | (.20)% | (.09)% | .21% | .56% | .81% |
| Supplemental Data | | | | | | |
| Net assets, end of period (000 omitted) | $10,656 | $10,654 | $14,991 | $8,860 | $6,247 | $4,536 |
| Portfolio turnover rateJ | 64%I | 138% | 98% | 60% | 71% | 29% |
A Calculated based on average shares outstanding during the period.
B The amounts shown reflect certain reclassifications related to book to tax differences that were made in the year shown.
C Amount represents less than $.005 per share.
D Total returns for periods of less than one year are not annualized.
E Total returns would have been lower if certain expenses had not been reduced during the applicable periods shown.
F Total returns do not include the effect of the sales charges.
G Fees and expenses of any underlying mutual funds or exchange-traded funds (ETFs) are not included in the Fund's expense ratio. The Fund indirectly bears its proportionate share of these expenses. For additional expense information related to investments in Fidelity Central Funds, please refer to the "Investments in Fidelity Central Funds" note found in the Notes to Financial Statements section of the most recent Annual or Semi-Annual report.
H Expense ratios reflect operating expenses of the class. Expenses before reductions do not reflect amounts reimbursed, waived, or reduced through arrangements with the investment adviser, brokerage services, or other offset arrangements, if applicable, and do not represent the amount paid by the class during periods when reimbursements, waivers or reductions occur.
I Annualized
J Amount does not include the portfolio activity of any underlying mutual funds or exchange-traded funds (ETFs).
See accompanying notes which are an integral part of the financial statements.
Fidelity Advisor Communications Equipment Fund Class M
| | Six months ended (Unaudited) January 31, | Years endedJuly 31, | | | | |
| | 2021 | 2020 | 2019 | 2018 | 2017 | 2016 |
| Selected Per–Share Data | | | | | | |
| Net asset value, beginning of period | $14.09 | $15.09 | $14.59 | $13.18 | $11.65 | $12.15 |
| Income from Investment Operations | | | | | | |
| Net investment income (loss)A | (.03) | (.06) | (.05) | – | .04 | .06 |
| Net realized and unrealized gain (loss) | 1.66 | (.94) | .99 | 2.00 | 1.69 | (.20) |
| Total from investment operations | 1.63 | (1.00) | .94 | 2.00 | 1.73 | (.14) |
| Distributions from net investment income | – | – | – | (.02)B | (.02) | – |
| Distributions from net realized gain | – | – | (.44) | (.57)B | (.18) | (.36) |
| Total distributions | – | – | (.44) | (.59) | (.20) | (.36) |
| Redemption fees added to paid in capitalA | – | – | – | –C | –C | –C |
| Net asset value, end of period | $15.72 | $14.09 | $15.09 | $14.59 | $13.18 | $11.65 |
| Total ReturnD,E,F | 11.57% | (6.63)% | 6.75% | 15.69% | 14.94% | (.83)% |
| Ratios to Average Net AssetsG,H | | | | | | |
| Expenses before reductions | 2.25%I | 1.91% | 1.80% | 2.11% | 2.11% | 2.41% |
| Expenses net of fee waivers, if any | 1.64%I | 1.66% | 1.65% | 1.65% | 1.65% | 1.65% |
| Expenses net of all reductions | 1.64%I | 1.62% | 1.64% | 1.64% | 1.64% | 1.65% |
| Net investment income (loss) | (.40)%I | (.45)% | (.34)% | (.04)% | .31% | .56% |
| Supplemental Data | | | | | | |
| Net assets, end of period (000 omitted) | $4,339 | $4,197 | $5,242 | $4,943 | $4,236 | $3,674 |
| Portfolio turnover rateJ | 64%I | 138% | 98% | 60% | 71% | 29% |
A Calculated based on average shares outstanding during the period.
B The amounts shown reflect certain reclassifications related to book to tax differences that were made in the year shown.
C Amount represents less than $.005 per share.
D Total returns for periods of less than one year are not annualized.
E Total returns would have been lower if certain expenses had not been reduced during the applicable periods shown.
F Total returns do not include the effect of the sales charges.
G Fees and expenses of any underlying mutual funds or exchange-traded funds (ETFs) are not included in the Fund's expense ratio. The Fund indirectly bears its proportionate share of these expenses. For additional expense information related to investments in Fidelity Central Funds, please refer to the "Investments in Fidelity Central Funds" note found in the Notes to Financial Statements section of the most recent Annual or Semi-Annual report.
H Expense ratios reflect operating expenses of the class. Expenses before reductions do not reflect amounts reimbursed, waived, or reduced through arrangements with the investment adviser, brokerage services, or other offset arrangements, if applicable, and do not represent the amount paid by the class during periods when reimbursements, waivers or reductions occur.
I Annualized
J Amount does not include the portfolio activity of any underlying mutual funds or exchange-traded funds (ETFs).
See accompanying notes which are an integral part of the financial statements.
Fidelity Advisor Communications Equipment Fund Class C
| | Six months ended (Unaudited) January 31, | Years endedJuly 31, | | | | |
| | 2021 | 2020 | 2019 | 2018 | 2017 | 2016 |
| Selected Per–Share Data | | | | | | |
| Net asset value, beginning of period | $12.72 | $13.69 | $13.34 | $12.10 | $10.74 | $11.27 |
| Income from Investment Operations | | | | | | |
| Net investment income (loss)A | (.06) | (.12) | (.11) | (.07) | (.02) | .01 |
| Net realized and unrealized gain (loss) | 1.49 | (.85) | .90 | 1.84 | 1.56 | (.19) |
| Total from investment operations | 1.43 | (.97) | .79 | 1.77 | 1.54 | (.18) |
| Distributions from net investment income | – | – | – | – | – | – |
| Distributions from net realized gain | – | – | (.44) | (.53) | (.18) | (.35) |
| Total distributions | – | – | (.44) | (.53) | (.18) | (.35) |
| Redemption fees added to paid in capitalA | – | – | – | –B | –B | –B |
| Net asset value, end of period | $14.15 | $12.72 | $13.69 | $13.34 | $12.10 | $10.74 |
| Total ReturnC,D,E | 11.24% | (7.09)% | 6.25% | 15.06% | 14.39% | (1.29)% |
| Ratios to Average Net AssetsF,G | | | | | | |
| Expenses before reductions | 2.75%H | 2.42% | 2.28% | 2.54% | 2.55% | 2.86% |
| Expenses net of fee waivers, if any | 2.14%H | 2.16% | 2.15% | 2.15% | 2.15% | 2.15% |
| Expenses net of all reductions | 2.14%H | 2.12% | 2.14% | 2.14% | 2.14% | 2.15% |
| Net investment income (loss) | (.90)%H | (.95)% | (.84)% | (.54)% | (.19)% | .06% |
| Supplemental Data | | | | | | |
| Net assets, end of period (000 omitted) | $2,649 | $2,695 | $5,264 | $4,684 | $3,066 | $2,479 |
| Portfolio turnover rateI | 64%H | 138% | 98% | 60% | 71% | 29% |
A Calculated based on average shares outstanding during the period.
B Amount represents less than $.005 per share.
C Total returns for periods of less than one year are not annualized.
D Total returns would have been lower if certain expenses had not been reduced during the applicable periods shown.
E Total returns do not include the effect of the contingent deferred sales charge.
F Fees and expenses of any underlying mutual funds or exchange-traded funds (ETFs) are not included in the Fund's expense ratio. The Fund indirectly bears its proportionate share of these expenses. For additional expense information related to investments in Fidelity Central Funds, please refer to the "Investments in Fidelity Central Funds" note found in the Notes to Financial Statements section of the most recent Annual or Semi-Annual report.
G Expense ratios reflect operating expenses of the class. Expenses before reductions do not reflect amounts reimbursed, waived, or reduced through arrangements with the investment adviser, brokerage services, or other offset arrangements, if applicable, and do not represent the amount paid by the class during periods when reimbursements, waivers or reductions occur.
H Annualized
I Amount does not include the portfolio activity of any underlying mutual funds or exchange-traded funds (ETFs).
See accompanying notes which are an integral part of the financial statements.
Fidelity Advisor Communications Equipment Fund Class I
| | Six months ended (Unaudited) January 31, | Years endedJuly 31, | | | | |
| | 2021 | 2020 | 2019 | 2018 | 2017 | 2016 |
| Selected Per–Share Data | | | | | | |
| Net asset value, beginning of period | $15.45 | $16.47 | $15.79 | $14.22 | $12.54 | $13.01 |
| Income from Investment Operations | | | | | | |
| Net investment income (loss)A | .01 | .01 | .03 | .07 | .11 | .12 |
| Net realized and unrealized gain (loss) | 1.82 | (1.03) | 1.09 | 2.16 | 1.83 | (.20) |
| Total from investment operations | 1.83 | (1.02) | 1.12 | 2.23 | 1.94 | (.08) |
| Distributions from net investment income | – | – | – | (.05)B | (.08) | – |
| Distributions from net realized gain | – | – | (.44) | (.61)B | (.18) | (.39) |
| Total distributions | – | – | (.44) | (.66) | (.26) | (.39) |
| Redemption fees added to paid in capitalA | – | – | – | –C | –C | –C |
| Net asset value, end of period | $17.28 | $15.45 | $16.47 | $15.79 | $14.22 | $12.54 |
| Total ReturnD,E | 11.84% | (6.19)% | 7.39% | 16.21% | 15.55% | (.33)% |
| Ratios to Average Net AssetsF,G | | | | | | |
| Expenses before reductions | 1.61%H | 1.27% | 1.12% | 1.42% | 1.46% | 1.69% |
| Expenses net of fee waivers, if any | 1.14%H | 1.16% | 1.12% | 1.15% | 1.15% | 1.15% |
| Expenses net of all reductions | 1.14%H | 1.12% | 1.11% | 1.14% | 1.14% | 1.14% |
| Net investment income (loss) | .10%H | .05% | .19% | .47% | .81% | 1.06% |
| Supplemental Data | | | | | | |
| Net assets, end of period (000 omitted) | $1,916 | $1,565 | $4,705 | $2,773 | $4,733 | $1,209 |
| Portfolio turnover rateI | 64%H | 138% | 98% | 60% | 71% | 29% |
A Calculated based on average shares outstanding during the period.
B The amounts shown reflect certain reclassifications related to book to tax differences that were made in the year shown.
C Amount represents less than $.005 per share.
D Total returns for periods of less than one year are not annualized.
E Total returns would have been lower if certain expenses had not been reduced during the applicable periods shown.
F Fees and expenses of any underlying mutual funds or exchange-traded funds (ETFs) are not included in the Fund's expense ratio. The Fund indirectly bears its proportionate share of these expenses. For additional expense information related to investments in Fidelity Central Funds, please refer to the "Investments in Fidelity Central Funds" note found in the Notes to Financial Statements section of the most recent Annual or Semi-Annual report.
G Expense ratios reflect operating expenses of the class. Expenses before reductions do not reflect amounts reimbursed, waived, or reduced through arrangements with the investment adviser, brokerage services, or other offset arrangements, if applicable, and do not represent the amount paid by the class during periods when reimbursements, waivers or reductions occur.
H Annualized
I Amount does not include the portfolio activity of any underlying mutual funds or exchange-traded funds (ETFs).
See accompanying notes which are an integral part of the financial statements.
Fidelity Advisor® Consumer Discretionary Fund
Investment Summary (Unaudited)
Top Ten Stocks as of January 31, 2021
| | % of fund's net assets |
| Amazon.com, Inc. | 21.1 |
| Tesla, Inc. | 9.0 |
| The Home Depot, Inc. | 5.9 |
| NIKE, Inc. Class B | 4.0 |
| Lowe's Companies, Inc. | 3.3 |
| Starbucks Corp. | 2.9 |
| Capri Holdings Ltd. | 2.7 |
| TJX Companies, Inc. | 2.1 |
| Dollar General Corp. | 2.1 |
| McDonald's Corp. | 2.0 |
| | 55.1 |
Top Industries (% of fund's net assets)
| As of January 31, 2021 |
| | Internet & Direct Marketing Retail | 26.7% |
| | Specialty Retail | 20.6% |
| | Hotels, Restaurants & Leisure | 14.9% |
| | Textiles, Apparel & Luxury Goods | 14.2% |
| | Automobiles | 9.3% |
| | All Others* | 14.3% |

* Includes short-term investments and net other assets (liabilities).
Fidelity Advisor® Consumer Discretionary Fund
Schedule of Investments January 31, 2021 (Unaudited)
Showing Percentage of Net Assets
| Common Stocks - 100.2% | | | |
| | | Shares | Value |
| Automobiles - 9.3% | | | |
| Automobile Manufacturers - 9.3% | | | |
| Ferrari NV | | 7,203 | $1,499,521 |
| Tesla, Inc. (a) | | 64,900 | 51,500,097 |
| Thor Industries, Inc. | | 2,700 | 326,727 |
| | | | 53,326,345 |
| Commercial Services & Supplies - 0.3% | | | |
| Diversified Support Services - 0.3% | | | |
| Copart, Inc. (a) | | 17,251 | 1,893,297 |
| MYT Netherlands Parent BV ADR | | 2,600 | 85,592 |
| | | | 1,978,889 |
| Diversified Consumer Services - 0.6% | | | |
| Education Services - 0.6% | | | |
| Grand Canyon Education, Inc. (a) | | 26,903 | 2,285,141 |
| New Oriental Education & Technology Group, Inc. sponsored ADR (a) | | 8,010 | 1,341,675 |
| | | | 3,626,816 |
| Entertainment - 0.9% | | | |
| Movies & Entertainment - 0.9% | | | |
| Cinemark Holdings, Inc. | | 138,300 | 2,799,192 |
| Live Nation Entertainment, Inc. (a) | | 31,300 | 2,079,885 |
| | | | 4,879,077 |
| Food & Staples Retailing - 1.6% | | | |
| Food Distributors - 1.3% | | | |
| Performance Food Group Co. (a) | | 85,808 | 4,022,679 |
| U.S. Foods Holding Corp. (a) | | 102,200 | 3,167,178 |
| | | | 7,189,857 |
| Hypermarkets & Super Centers - 0.3% | | | |
| BJ's Wholesale Club Holdings, Inc. (a) | | 40,490 | 1,703,414 |
|
| TOTAL FOOD & STAPLES RETAILING | | | 8,893,271 |
|
| Hotels, Restaurants & Leisure - 14.9% | | | |
| Casinos & Gaming - 3.4% | | | |
| Caesars Entertainment, Inc. (a) | | 117,485 | 8,269,769 |
| Churchill Downs, Inc. | | 30,409 | 5,700,167 |
| Flutter Entertainment PLC | | 2,100 | 392,034 |
| MGM Resorts International | | 10,100 | 288,456 |
| Penn National Gaming, Inc. (a) | | 48,200 | 4,999,304 |
| | | | 19,649,730 |
| Hotels, Resorts & Cruise Lines - 3.4% | | | |
| Airbnb, Inc. Class A | | 11,100 | 2,038,293 |
| Extended Stay America, Inc. unit | | 186,500 | 2,737,820 |
| Hilton Worldwide Holdings, Inc. | | 84,400 | 8,557,316 |
| Lindblad Expeditions Holdings (a) | | 4,300 | 67,510 |
| Marriott International, Inc. Class A | | 26,700 | 3,105,477 |
| Marriott Vacations Worldwide Corp. | | 25,246 | 3,099,199 |
| | | | 19,605,615 |
| Leisure Facilities - 0.8% | | | |
| Planet Fitness, Inc. (a) | | 31,143 | 2,242,296 |
| Vail Resorts, Inc. | | 8,517 | 2,265,181 |
| | | | 4,507,477 |
| Restaurants - 7.3% | | | |
| ARAMARK Holdings Corp. | | 72,717 | 2,493,466 |
| Chipotle Mexican Grill, Inc. (a) | | 5,028 | 7,441,440 |
| McDonald's Corp. | | 54,208 | 11,266,591 |
| Noodles & Co. (a) | | 171,313 | 1,451,021 |
| Restaurant Brands International, Inc. | | 43,500 | 2,509,138 |
| Ruth's Hospitality Group, Inc. | | 6,500 | 118,235 |
| Starbucks Corp. | | 171,570 | 16,609,692 |
| | | | 41,889,583 |
|
| TOTAL HOTELS, RESTAURANTS & LEISURE | | | 85,652,405 |
|
| Household Durables - 3.0% | | | |
| Home Furnishings - 0.2% | | | |
| Purple Innovation, Inc. (a) | | 12,100 | 411,884 |
| Tempur Sealy International, Inc. (a) | | 19,600 | 517,440 |
| | | | 929,324 |
| Homebuilding - 2.8% | | | |
| D.R. Horton, Inc. | | 83,519 | 6,414,259 |
| Lennar Corp. Class A | | 59,307 | 4,931,377 |
| NVR, Inc. (a) | | 1,124 | 4,997,844 |
| | | | 16,343,480 |
|
| TOTAL HOUSEHOLD DURABLES | | | 17,272,804 |
|
| Interactive Media & Services - 0.7% | | | |
| Interactive Media & Services - 0.7% | | | |
| Alphabet, Inc. Class A (a) | | 1,153 | 2,106,946 |
| Facebook, Inc. Class A (a) | | 6,900 | 1,782,477 |
| | | | 3,889,423 |
| Internet & Direct Marketing Retail - 26.7% | | | |
| Internet & Direct Marketing Retail - 26.7% | | | |
| Alibaba Group Holding Ltd. sponsored ADR (a) | | 7,900 | 2,005,257 |
| Amazon.com, Inc. (a) | | 37,800 | 121,194,360 |
| Expedia, Inc. | | 80,300 | 9,965,230 |
| Farfetch Ltd. Class A (a) | | 38,191 | 2,338,817 |
| MercadoLibre, Inc. (a) | | 3,900 | 6,940,089 |
| Ocado Group PLC (a) | | 37,200 | 1,415,425 |
| The Booking Holdings, Inc. (a) | | 2,300 | 4,471,959 |
| The RealReal, Inc. (a) | | 114,405 | 2,709,110 |
| Wayfair LLC Class A (a) | | 6,719 | 1,829,718 |
| | | | 152,869,965 |
| IT Services - 0.2% | | | |
| Data Processing & Outsourced Services - 0.2% | | | |
| Visa, Inc. Class A | | 5,200 | 1,004,900 |
| Multiline Retail - 6.6% | | | |
| Department Stores - 0.5% | | | |
| Kohl's Corp. | | 14,300 | 630,058 |
| Nordstrom, Inc. (b) | | 69,400 | 2,460,230 |
| | | | 3,090,288 |
| General Merchandise Stores - 6.1% | | | |
| B&M European Value Retail SA | | 200,676 | 1,471,566 |
| Dollar General Corp. | | 62,158 | 12,096,568 |
| Dollar Tree, Inc. (a) | | 80,458 | 8,179,360 |
| Ollie's Bargain Outlet Holdings, Inc. (a)(b) | | 46,143 | 4,371,126 |
| Target Corp. | | 48,400 | 8,768,628 |
| | | | 34,887,248 |
|
| TOTAL MULTILINE RETAIL | | | 37,977,536 |
|
| Personal Products - 0.1% | | | |
| Personal Products - 0.1% | | | |
| Herbalife Nutrition Ltd. (a) | | 5,100 | 259,896 |
| Road & Rail - 0.5% | | | |
| Trucking - 0.5% | | | |
| Lyft, Inc. (a) | | 37,152 | 1,651,778 |
| Uber Technologies, Inc. (a) | | 28,300 | 1,441,319 |
| | | | 3,093,097 |
| Specialty Retail - 20.6% | | | |
| Apparel Retail - 6.5% | | | |
| American Eagle Outfitters, Inc. | | 172,300 | 3,909,487 |
| Aritzia LP (a) | | 27,400 | 569,963 |
| Burlington Stores, Inc. (a) | | 42,025 | 10,460,023 |
| L Brands, Inc. | | 16,933 | 690,189 |
| Ross Stores, Inc. | | 84,411 | 9,394,100 |
| TJX Companies, Inc. | | 190,048 | 12,170,674 |
| | | | 37,194,436 |
| Automotive Retail - 1.1% | | | |
| AutoZone, Inc. (a) | | 1,407 | 1,573,547 |
| Carvana Co. Class A (a) | | 4,000 | 1,044,760 |
| O'Reilly Automotive, Inc. (a) | | 9,683 | 4,119,826 |
| | | | 6,738,133 |
| Computer & Electronics Retail - 0.7% | | | |
| Best Buy Co., Inc. | | 36,972 | 4,023,293 |
| Home Improvement Retail - 10.0% | | | |
| Floor & Decor Holdings, Inc. Class A (a) | | 48,577 | 4,472,484 |
| Lowe's Companies, Inc. | | 112,772 | 18,816,008 |
| The Home Depot, Inc. | | 125,618 | 34,019,867 |
| | | | 57,308,359 |
| Specialty Stores - 2.3% | | | |
| Dick's Sporting Goods, Inc. | | 38,800 | 2,599,988 |
| Five Below, Inc. (a) | | 25,663 | 4,509,759 |
| National Vision Holdings, Inc. (a) | | 37,389 | 1,733,728 |
| Sally Beauty Holdings, Inc. (a) | | 60,400 | 912,040 |
| Ulta Beauty, Inc. (a) | | 11,800 | 3,301,168 |
| | | | 13,056,683 |
|
| TOTAL SPECIALTY RETAIL | | | 118,320,904 |
|
| Textiles, Apparel & Luxury Goods - 14.2% | | | |
| Apparel, Accessories & Luxury Goods - 9.2% | | | |
| adidas AG | | 6,784 | 2,156,973 |
| Canada Goose Holdings, Inc. (a) | | 17,066 | 570,802 |
| Capri Holdings Ltd. (a) | | 378,779 | 15,779,933 |
| G-III Apparel Group Ltd. (a)(b) | | 54,805 | 1,481,927 |
| Hermes International SCA | | 726 | 742,362 |
| Levi Strauss & Co. Class A | | 72,000 | 1,419,120 |
| lululemon athletica, Inc. (a) | | 9,775 | 3,212,847 |
| LVMH Moet Hennessy Louis Vuitton SE | | 6,515 | 3,938,940 |
| PVH Corp. | | 121,916 | 10,394,558 |
| Ralph Lauren Corp. | | 37,100 | 3,748,955 |
| Tapestry, Inc. | | 230,424 | 7,286,007 |
| VF Corp. | | 25,434 | 1,955,112 |
| | | | 52,687,536 |
| Footwear - 5.0% | | | |
| Crocs, Inc. (a) | | 1,900 | 133,038 |
| Deckers Outdoor Corp. (a) | | 17,000 | 4,963,660 |
| NIKE, Inc. Class B | | 169,754 | 22,677,437 |
| Skechers U.S.A., Inc. Class A (sub. vtg.) (a) | | 20,000 | 689,600 |
| | | | 28,463,735 |
|
| TOTAL TEXTILES, APPAREL & LUXURY GOODS | | | 81,151,271 |
|
| TOTAL COMMON STOCKS | | | |
| (Cost $326,891,347) | | | 574,196,599 |
|
| Convertible Preferred Stocks - 0.0% | | | |
| Food & Staples Retailing - 0.0% | | | |
| Food Retail - 0.0% | | | |
| Roofoods Ltd. Series H (c)(d) | | | |
| (Cost $87,775) | | 100 | 87,775 |
|
| Money Market Funds - 2.1% | | | |
| Fidelity Cash Central Fund 0.09% (e) | | 4,922,672 | 4,923,657 |
| Fidelity Securities Lending Cash Central Fund 0.09% (e)(f) | | 7,336,491 | 7,337,225 |
| TOTAL MONEY MARKET FUNDS | | | |
| (Cost $12,260,882) | | | 12,260,882 |
| TOTAL INVESTMENT IN SECURITIES - 102.3% | | | |
| (Cost $339,240,004) | | | 586,545,256 |
| NET OTHER ASSETS (LIABILITIES) - (2.3)% | | | (13,223,210) |
| NET ASSETS - 100% | | | $573,322,046 |
Legend
(a) Non-income producing
(b) Security or a portion of the security is on loan at period end.
(c) Level 3 security
(d) Restricted securities (including private placements) - Investment in securities not registered under the Securities Act of 1933 (excluding 144A issues). At the end of the period, the value of restricted securities (excluding 144A issues) amounted to $87,775 or 0.0% of net assets.
(e) Affiliated fund that is generally available only to investment companies and other accounts managed by Fidelity Investments. The rate quoted is the annualized seven-day yield of the fund at period end. A complete unaudited listing of the fund's holdings as of its most recent quarter end is available upon request. In addition, each Fidelity Central Fund's financial statements are available on the SEC's website or upon request.
(f) Investment made with cash collateral received from securities on loan.
Additional information on each restricted holding is as follows:
| Security | Acquisition Date | Acquisition Cost |
| Roofoods Ltd. Series H | 1/15/21 | $87,775 |
Affiliated Central Funds
Information regarding fiscal year to date income earned by the Fund from investments in Fidelity Central Funds is as follows:
| Fund | Income earned |
| Fidelity Cash Central Fund | $1,258 |
| Fidelity Securities Lending Cash Central Fund | 1,189 |
| Total | $2,447 |
Amounts in the income column in the above table include any capital gain distributions from underlying funds, which are presented in the corresponding line-item in the Statement of Operations, if applicable. Amount for Fidelity Securities Lending Cash Central Fund represents the income earned on investing cash collateral, less rebates paid to borrowers and any lending agent fees associated with the loan, plus any premium payments received for lending certain types of securities.
Investment Valuation
The following is a summary of the inputs used, as of January 31, 2021, involving the Fund's assets and liabilities carried at fair value. The inputs or methodology used for valuing securities may not be an indication of the risk associated with investing in those securities. For more information on valuation inputs, and their aggregation into the levels used below, please refer to the Investment Valuation section in the accompanying Notes to Financial Statements.
| | Valuation Inputs at Reporting Date: |
| Description | Total | Level 1 | Level 2 | Level 3 |
| Investments in Securities: | | | | |
| Common Stocks | $574,196,599 | $570,257,659 | $3,938,940 | $-- |
| Convertible Preferred Stocks | 87,775 | -- | -- | 87,775 |
| Money Market Funds | 12,260,882 | 12,260,882 | -- | -- |
| Total Investments in Securities: | $586,545,256 | $582,518,541 | $3,938,940 | $87,775 |
See accompanying notes which are an integral part of the financial statements.
Fidelity Advisor® Consumer Discretionary Fund
Financial Statements
Statement of Assets and Liabilities
| | | January 31, 2021 (Unaudited) |
| Assets | | |
Investment in securities, at value (including securities loaned of $6,910,575) — See accompanying schedule:
Unaffiliated issuers (cost $326,979,122) | $574,284,374 | |
| Fidelity Central Funds (cost $12,260,882) | 12,260,882 | |
| Total Investment in Securities (cost $339,240,004) | | $586,545,256 |
| Receivable for investments sold | | 4,514,525 |
| Receivable for fund shares sold | | 1,605,961 |
| Dividends receivable | | 135,119 |
| Distributions receivable from Fidelity Central Funds | | 1,408 |
| Prepaid expenses | | 2,166 |
| Other receivables | | 5,933 |
| Total assets | | 592,810,368 |
| Liabilities | | |
| Payable for investments purchased | $3,084,865 | |
| Payable for fund shares redeemed | 8,551,200 | |
| Accrued management fee | 257,336 | |
| Distribution and service plan fees payable | 129,275 | |
| Other affiliated payables | 92,130 | |
| Other payables and accrued expenses | 36,466 | |
| Collateral on securities loaned | 7,337,050 | |
| Total liabilities | | 19,488,322 |
| Net Assets | | $573,322,046 |
| Net Assets consist of: | | |
| Paid in capital | | $309,236,259 |
| Total accumulated earnings (loss) | | 264,085,787 |
| Net Assets | | $573,322,046 |
| Net Asset Value and Maximum Offering Price | | |
| Class A: | | |
| Net Asset Value and redemption price per share ($203,364,391 ÷ 4,990,352 shares)(a) | | $40.75 |
| Maximum offering price per share (100/94.25 of $40.75) | | $43.24 |
| Class M: | | |
| Net Asset Value and redemption price per share ($43,009,043 ÷ 1,141,621 shares)(a) | | $37.67 |
| Maximum offering price per share (100/96.50 of $37.67) | | $39.04 |
| Class C: | | |
| Net Asset Value and offering price per share ($78,944,689 ÷ 2,464,213 shares)(a) | | $32.04 |
| Class I: | | |
| Net Asset Value, offering price and redemption price per share ($187,947,642 ÷ 4,232,509 shares) | | $44.41 |
| Class Z: | | |
| Net Asset Value, offering price and redemption price per share ($60,056,281 ÷ 1,348,040 shares) | | $44.55 |
(a) Redemption price per share is equal to net asset value less any applicable contingent deferred sales charge.
See accompanying notes which are an integral part of the financial statements.
Statement of Operations
| | | Six months ended January 31, 2021 (Unaudited) |
| Investment Income | | |
| Dividends | | $1,632,151 |
| Income from Fidelity Central Funds (including $1,189 from security lending) | | 2,447 |
| Total income | | 1,634,598 |
| Expenses | | |
| Management fee | $1,345,076 | |
| Transfer agent fees | 423,733 | |
| Distribution and service plan fees | 693,230 | |
| Accounting fees | 97,813 | |
| Custodian fees and expenses | 7,372 | |
| Independent trustees' fees and expenses | 1,157 | |
| Registration fees | 94,382 | |
| Audit | 26,951 | |
| Legal | 2,196 | |
| Interest | 204 | |
| Miscellaneous | 1,513 | |
| Total expenses before reductions | 2,693,627 | |
| Expense reductions | (3,756) | |
| Total expenses after reductions | | 2,689,871 |
| Net investment income (loss) | | (1,055,273) |
| Realized and Unrealized Gain (Loss) | | |
| Net realized gain (loss) on: | | |
| Investment securities: | | |
| Unaffiliated issuers | 21,156,735 | |
| Fidelity Central Funds | 154 | |
| Foreign currency transactions | 1,335 | |
| Total net realized gain (loss) | | 21,158,224 |
| Change in net unrealized appreciation (depreciation) on: | | |
| Investment securities: | | |
| Unaffiliated issuers | 79,769,878 | |
| Fidelity Central Funds | (155) | |
| Assets and liabilities in foreign currencies | 510 | |
| Total change in net unrealized appreciation (depreciation) | | 79,770,233 |
| Net gain (loss) | | 100,928,457 |
| Net increase (decrease) in net assets resulting from operations | | $99,873,184 |
See accompanying notes which are an integral part of the financial statements.
Statement of Changes in Net Assets
| | Six months ended January 31, 2021 (Unaudited) | Year ended July 31, 2020 |
| Increase (Decrease) in Net Assets | | |
| Operations | | |
| Net investment income (loss) | $(1,055,273) | $(691,258) |
| Net realized gain (loss) | 21,158,224 | 7,551,819 |
| Change in net unrealized appreciation (depreciation) | 79,770,233 | 44,691,635 |
| Net increase (decrease) in net assets resulting from operations | 99,873,184 | 51,552,196 |
| Distributions to shareholders | (7,826,027) | (11,256,995) |
| Share transactions - net increase (decrease) | 38,979,313 | (27,377,411) |
| Total increase (decrease) in net assets | 131,026,470 | 12,917,790 |
| Net Assets | | |
| Beginning of period | 442,295,576 | 429,377,786 |
| End of period | $573,322,046 | $442,295,576 |
See accompanying notes which are an integral part of the financial statements.
Financial Highlights
Fidelity Advisor Consumer Discretionary Fund Class A
| | Six months ended (Unaudited) January 31, | Years endedJuly 31, | | | | |
| | 2021 | 2020 | 2019 | 2018 | 2017 | 2016 |
| Selected Per–Share Data | | | | | | |
| Net asset value, beginning of period | $33.70 | $29.83 | $28.22 | $22.92 | $20.94 | $21.51 |
| Income from Investment Operations | | | | | | |
| Net investment income (loss)A | (.08) | (.04) | (.02) | (.02) | .06 | .10B |
| Net realized and unrealized gain (loss) | 7.71 | 4.73 | 1.90 | 5.32 | 2.01 | (.21) |
| Total from investment operations | 7.63 | 4.69 | 1.88 | 5.30 | 2.07 | (.11) |
| Distributions from net investment income | – | – | – | – | (.09) | (.02) |
| Distributions from net realized gain | (.58) | (.82) | (.27) | – | – | (.44) |
| Total distributions | (.58) | (.82) | (.27) | – | (.09) | (.46) |
| Redemption fees added to paid in capitalA | – | – | – | – | –C | –C |
| Net asset value, end of period | $40.75 | $33.70 | $29.83 | $28.22 | $22.92 | $20.94 |
| Total ReturnD,E,F | 22.66% | 16.03% | 6.81% | 23.12% | 9.93% | (.38)% |
| Ratios to Average Net AssetsG,H | | | | | | |
| Expenses before reductions | 1.06%I | 1.07% | 1.08% | 1.12% | 1.10% | 1.10% |
| Expenses net of fee waivers, if any | 1.06%I | 1.07% | 1.08% | 1.12% | 1.10% | 1.10% |
| Expenses net of all reductions | 1.06%I | 1.06% | 1.07% | 1.11% | 1.10% | 1.09% |
| Net investment income (loss) | (.41)%I | (.14)% | (.09)% | (.08)% | .26% | .49%B |
| Supplemental Data | | | | | | |
| Net assets, end of period (000 omitted) | $203,364 | $159,603 | $159,298 | $146,605 | $109,303 | $144,578 |
| Portfolio turnover rateJ | 57%I | 41%K | 60% | 60% | 47% | 59% |
A Calculated based on average shares outstanding during the period.
B Net investment income per share reflects one or more large, non-recurring dividend(s) which amounted to $.03 per share. Excluding such non-recurring dividend(s), the ratio of net investment income (loss) to average net assets would have been .33%.
C Amount represents less than $.005 per share.
D Total returns for periods of less than one year are not annualized.
E Total returns would have been lower if certain expenses had not been reduced during the applicable periods shown.
F Total returns do not include the effect of the sales charges.
G Fees and expenses of any underlying mutual funds or exchange-traded funds (ETFs) are not included in the Fund's expense ratio. The Fund indirectly bears its proportionate share of these expenses. For additional expense information related to investments in Fidelity Central Funds, please refer to the "Investments in Fidelity Central Funds" note found in the Notes to Financial Statements section of the most recent Annual or Semi-Annual report.
H Expense ratios reflect operating expenses of the class. Expenses before reductions do not reflect amounts reimbursed, waived, or reduced through arrangements with the investment adviser, brokerage services, or other offset arrangements, if applicable, and do not represent the amount paid by the class during periods when reimbursements, waivers or reductions occur.
I Annualized
J Amount does not include the portfolio activity of any underlying mutual funds or exchange-traded funds (ETFs).
K Portfolio turnover rate excludes securities received or delivered in-kind.
See accompanying notes which are an integral part of the financial statements.
Fidelity Advisor Consumer Discretionary Fund Class M
| | Six months ended (Unaudited) January 31, | Years endedJuly 31, | | | | |
| | 2021 | 2020 | 2019 | 2018 | 2017 | 2016 |
| Selected Per–Share Data | | | | | | |
| Net asset value, beginning of period | $31.23 | $27.78 | $26.36 | $21.47 | $19.66 | $20.26 |
| Income from Investment Operations | | | | | | |
| Net investment income (loss)A | (.12) | (.11) | (.09) | (.08) | –B | .03C |
| Net realized and unrealized gain (loss) | 7.14 | 4.38 | 1.78 | 4.97 | 1.89 | (.19) |
| Total from investment operations | 7.02 | 4.27 | 1.69 | 4.89 | 1.89 | (.16) |
| Distributions from net investment income | – | – | – | – | (.08) | – |
| Distributions from net realized gain | (.58) | (.82) | (.27) | – | – | (.44) |
| Total distributions | (.58) | (.82) | (.27) | – | (.08) | (.44) |
| Redemption fees added to paid in capitalA | – | – | – | – | –B | –B |
| Net asset value, end of period | $37.67 | $31.23 | $27.78 | $26.36 | $21.47 | $19.66 |
| Total ReturnD,E,F | 22.49% | 15.70% | 6.56% | 22.78% | 9.62% | (.68)% |
| Ratios to Average Net AssetsG,H | | | | | | |
| Expenses before reductions | 1.32%I | 1.34% | 1.34% | 1.38% | 1.39% | 1.40% |
| Expenses net of fee waivers, if any | 1.32%I | 1.34% | 1.34% | 1.38% | 1.39% | 1.40% |
| Expenses net of all reductions | 1.32%I | 1.33% | 1.34% | 1.38% | 1.39% | 1.39% |
| Net investment income (loss) | (.68)%I | (.41)% | (.35)% | (.35)% | (.02)% | .19%C |
| Supplemental Data | | | | | | |
| Net assets, end of period (000 omitted) | $43,009 | $33,896 | $32,792 | $34,622 | $26,398 | $28,259 |
| Portfolio turnover rateJ | 57%I | 41%K | 60% | 60% | 47% | 59% |
A Calculated based on average shares outstanding during the period.
B Amount represents less than $.005 per share.
C Net investment income per share reflects one or more large, non-recurring dividend(s) which amounted to $.03 per share. Excluding such non-recurring dividend(s), the ratio of net investment income (loss) to average net assets would have been .03%.
D Total returns for periods of less than one year are not annualized.
E Total returns would have been lower if certain expenses had not been reduced during the applicable periods shown.
F Total returns do not include the effect of the sales charges.
G Fees and expenses of any underlying mutual funds or exchange-traded funds (ETFs) are not included in the Fund's expense ratio. The Fund indirectly bears its proportionate share of these expenses. For additional expense information related to investments in Fidelity Central Funds, please refer to the "Investments in Fidelity Central Funds" note found in the Notes to Financial Statements section of the most recent Annual or Semi-Annual report.
H Expense ratios reflect operating expenses of the class. Expenses before reductions do not reflect amounts reimbursed, waived, or reduced through arrangements with the investment adviser, brokerage services, or other offset arrangements, if applicable, and do not represent the amount paid by the class during periods when reimbursements, waivers or reductions occur.
I Annualized
J Amount does not include the portfolio activity of any underlying mutual funds or exchange-traded funds (ETFs).
K Portfolio turnover rate excludes securities received or delivered in-kind.
See accompanying notes which are an integral part of the financial statements.
Fidelity Advisor Consumer Discretionary Fund Class C
| | Six months ended (Unaudited) January 31, | Years endedJuly 31, | | | | |
| | 2021 | 2020 | 2019 | 2018 | 2017 | 2016 |
| Selected Per–Share Data | | | | | | |
| Net asset value, beginning of period | $26.69 | $23.97 | $22.90 | $18.74 | $17.18 | $17.84 |
| Income from Investment Operations | | | | | | |
| Net investment income (loss)A | (.18) | (.21) | (.19) | (.17) | (.09) | (.04)B |
| Net realized and unrealized gain (loss) | 6.11 | 3.75 | 1.53 | 4.33 | 1.65 | (.18) |
| Total from investment operations | 5.93 | 3.54 | 1.34 | 4.16 | 1.56 | (.22) |
| Distributions from net investment income | – | – | – | – | – | – |
| Distributions from net realized gain | (.58) | (.82) | (.27) | – | – | (.44) |
| Total distributions | (.58) | (.82) | (.27) | – | – | (.44) |
| Redemption fees added to paid in capitalA | – | – | – | – | –C | –C |
| Net asset value, end of period | $32.04 | $26.69 | $23.97 | $22.90 | $18.74 | $17.18 |
| Total ReturnD,E,F | 22.24% | 15.14% | 6.02% | 22.20% | 9.08% | (1.11)% |
| Ratios to Average Net AssetsG,H | | | | | | |
| Expenses before reductions | 1.82%I | 1.82% | 1.83% | 1.87% | 1.85% | 1.86% |
| Expenses net of fee waivers, if any | 1.82%I | 1.82% | 1.83% | 1.87% | 1.85% | 1.86% |
| Expenses net of all reductions | 1.81%I | 1.82% | 1.82% | 1.86% | 1.85% | 1.85% |
| Net investment income (loss) | (1.17)%I | (.90)% | (.83)% | (.83)% | (.49)% | (.27)%B |
| Supplemental Data | | | | | | |
| Net assets, end of period (000 omitted) | $78,945 | $65,223 | $70,890 | $71,116 | $59,958 | $67,306 |
| Portfolio turnover rateJ | 57%I | 41%K | 60% | 60% | 47% | 59% |
A Calculated based on average shares outstanding during the period.
B Net investment income per share reflects one or more large, non-recurring dividend(s) which amounted to $.03 per share. Excluding such non-recurring dividend(s), the ratio of net investment income (loss) to average net assets would have been (.42) %.
C Amount represents less than $.005 per share.
D Total returns for periods of less than one year are not annualized.
E Total returns would have been lower if certain expenses had not been reduced during the applicable periods shown.
F Total returns do not include the effect of the contingent deferred sales charge.
G Fees and expenses of any underlying mutual funds or exchange-traded funds (ETFs) are not included in the Fund's expense ratio. The Fund indirectly bears its proportionate share of these expenses. For additional expense information related to investments in Fidelity Central Funds, please refer to the "Investments in Fidelity Central Funds" note found in the Notes to Financial Statements section of the most recent Annual or Semi-Annual report.
H Expense ratios reflect operating expenses of the class. Expenses before reductions do not reflect amounts reimbursed, waived, or reduced through arrangements with the investment adviser, brokerage services, or other offset arrangements, if applicable, and do not represent the amount paid by the class during periods when reimbursements, waivers or reductions occur.
I Annualized
J Amount does not include the portfolio activity of any underlying mutual funds or exchange-traded funds (ETFs).
K Portfolio turnover rate excludes securities received or delivered in-kind.
See accompanying notes which are an integral part of the financial statements.
Fidelity Advisor Consumer Discretionary Fund Class I
| | Six months ended (Unaudited) January 31, | Years endedJuly 31, | | | | |
| | 2021 | 2020 | 2019 | 2018 | 2017 | 2016 |
| Selected Per–Share Data | | | | | | |
| Net asset value, beginning of period | $36.63 | $32.27 | $30.42 | $24.64 | $22.48 | $23.06 |
| Income from Investment Operations | | | | | | |
| Net investment income (loss)A | (.03) | .04 | .06 | .06 | .12 | .16B |
| Net realized and unrealized gain (loss) | 8.39 | 5.14 | 2.06 | 5.72 | 2.18 | (.22) |
| Total from investment operations | 8.36 | 5.18 | 2.12 | 5.78 | 2.30 | (.06) |
| Distributions from net investment income | – | – | – | – | (.14) | (.08) |
| Distributions from net realized gain | (.58) | (.82) | (.27) | – | – | (.44) |
| Total distributions | (.58) | (.82) | (.27) | – | (.14) | (.52) |
| Redemption fees added to paid in capitalA | – | – | – | – | –C | –C |
| Net asset value, end of period | $44.41 | $36.63 | $32.27 | $30.42 | $24.64 | $22.48 |
| Total ReturnD,E | 22.84% | 16.34% | 7.10% | 23.46% | 10.27% | (.13)% |
| Ratios to Average Net AssetsF,G | | | | | | |
| Expenses before reductions | .79%H | .79% | .80% | .84% | .83% | .84% |
| Expenses net of fee waivers, if any | .79%H | .79% | .80% | .83% | .83% | .84% |
| Expenses net of all reductions | .78%H | .79% | .80% | .83% | .83% | .83% |
| Net investment income (loss) | (.14)%H | .13% | .19% | .20% | .54% | .75%B |
| Supplemental Data | | | | | | |
| Net assets, end of period (000 omitted) | $187,948 | $134,907 | $159,613 | $152,711 | $82,195 | $75,742 |
| Portfolio turnover rateI | 57%H | 41%J | 60% | 60% | 47% | 59% |
A Calculated based on average shares outstanding during the period.
B Net investment income per share reflects one or more large, non-recurring dividend(s) which amounted to $.03 per share. Excluding such non-recurring dividend(s), the ratio of net investment income (loss) to average net assets would have been .60%.
C Amount represents less than $.005 per share.
D Total returns for periods of less than one year are not annualized.
E Total returns would have been lower if certain expenses had not been reduced during the applicable periods shown.
F Fees and expenses of any underlying mutual funds or exchange-traded funds (ETFs) are not included in the Fund's expense ratio. The Fund indirectly bears its proportionate share of these expenses. For additional expense information related to investments in Fidelity Central Funds, please refer to the "Investments in Fidelity Central Funds" note found in the Notes to Financial Statements section of the most recent Annual or Semi-Annual report.
G Expense ratios reflect operating expenses of the class. Expenses before reductions do not reflect amounts reimbursed, waived, or reduced through arrangements with the investment adviser, brokerage services, or other offset arrangements, if applicable, and do not represent the amount paid by the class during periods when reimbursements, waivers or reductions occur.
H Annualized
I Amount does not include the portfolio activity of any underlying mutual funds or exchange-traded funds (ETFs).
J Portfolio turnover rate excludes securities received or delivered in-kind.
See accompanying notes which are an integral part of the financial statements.
Fidelity Advisor Consumer Discretionary Fund Class Z
| | Six months ended (Unaudited) January 31, | Years endedJuly 31, | |
| | 2021 | 2020 | 2019 A |
| Selected Per–Share Data | | | |
| Net asset value, beginning of period | $36.72 | $32.31 | $31.56 |
| Income from Investment Operations | | | |
| Net investment income (loss)B | –C | .09 | .10 |
| Net realized and unrealized gain (loss) | 8.41 | 5.14 | .92 |
| Total from investment operations | 8.41 | 5.23 | 1.02 |
| Distributions from net investment income | – | – | – |
| Distributions from net realized gain | (.58) | (.82) | (.27) |
| Total distributions | (.58) | (.82) | (.27) |
| Net asset value, end of period | $44.55 | $36.72 | $32.31 |
| Total ReturnD,E | 22.92% | 16.48% | 3.36% |
| Ratios to Average Net AssetsF,G | | | |
| Expenses before reductions | .67%H | .66% | .67%H |
| Expenses net of fee waivers, if any | .66%H | .66% | .66%H |
| Expenses net of all reductions | .66%H | .66% | .66%H |
| Net investment income (loss) | (.02)%H | .26% | .39%H |
| Supplemental Data | | | |
| Net assets, end of period (000 omitted) | $60,056 | $48,668 | $6,786 |
| Portfolio turnover rateI | 57%H | 41%J | 60% |
A For the period October 2, 2018 (commencement of sale of shares) to July 31, 2019.
B Calculated based on average shares outstanding during the period.
C Amount represents less than $.005 per share.
D Total returns for periods of less than one year are not annualized.
E Total returns would have been lower if certain expenses had not been reduced during the applicable periods shown.
F Fees and expenses of any underlying mutual funds or exchange-traded funds (ETFs) are not included in the Fund's expense ratio. The Fund indirectly bears its proportionate share of these expenses. For additional expense information related to investments in Fidelity Central Funds, please refer to the "Investments in Fidelity Central Funds" note found in the Notes to Financial Statements section of the most recent Annual or Semi-Annual report.
G Expense ratios reflect operating expenses of the class. Expenses before reductions do not reflect amounts reimbursed, waived, or reduced through arrangements with the investment adviser, brokerage services, or other offset arrangements, if applicable, and do not represent the amount paid by the class during periods when reimbursements, waivers or reductions occur.
H Annualized
I Amount does not include the portfolio activity of any underlying mutual funds or exchange-traded funds (ETFs).
J Portfolio turnover rate excludes securities received or delivered in-kind.
See accompanying notes which are an integral part of the financial statements.
Fidelity Advisor® Energy Fund
Investment Summary (Unaudited)
Top Ten Stocks as of January 31, 2021
| | % of fund's net assets |
| Chevron Corp. | 13.4 |
| Exxon Mobil Corp. | 12.5 |
| BP PLC sponsored ADR | 5.8 |
| Cheniere Energy, Inc. | 5.7 |
| Pioneer Natural Resources Co. | 4.8 |
| Royal Dutch Shell PLC Class B sponsored ADR | 4.2 |
| EOG Resources, Inc. | 3.7 |
| ConocoPhillips Co. | 3.7 |
| Marathon Petroleum Corp. | 3.6 |
| Valero Energy Corp. | 3.1 |
| | 60.5 |
Top Industries (% of fund's net assets)
| As of January 31, 2021 |
| | Oil, Gas & Consumable Fuels | 86.0% |
| | Energy Equipment & Services | 10.8% |
| | Independent Power and Renewable Electricity Producers | 2.4% |
| | Food Products | 0.7% |
| | All Others* | 0.1% |

* Includes short-term investments and net other assets (liabilities).
Fidelity Advisor® Energy Fund
Schedule of Investments January 31, 2021 (Unaudited)
Showing Percentage of Net Assets
| Common Stocks - 99.9% | | | |
| | | Shares | Value |
| Energy Equipment & Services - 10.8% | | | |
| Oil & Gas Drilling - 1.0% | | | |
| Nabors Industries Ltd. | | 19,612 | $1,400,689 |
| Odfjell Drilling Ltd. (a) | | 1,031,756 | 2,038,084 |
| Patterson-UTI Energy, Inc. | | 115,200 | 708,480 |
| Shelf Drilling Ltd. (a)(b) | | 786,528 | 248,845 |
| | | | 4,396,098 |
| Oil & Gas Equipment & Services - 9.8% | | | |
| Baker Hughes Co. Class A | | 659,500 | 13,249,355 |
| Cactus, Inc. | | 50,800 | 1,330,960 |
| Championx Corp. (a) | | 144,200 | 2,204,818 |
| Nextier Oilfield Solutions, Inc. (a) | | 987,200 | 3,277,504 |
| Oceaneering International, Inc. (a) | | 247,700 | 2,093,065 |
| ProPetro Holding Corp. (a) | | 581,000 | 4,642,190 |
| RigNet, Inc. (a) | | 128,051 | 1,006,481 |
| Schlumberger Ltd. | | 260,018 | 5,775,000 |
| TechnipFMC PLC | | 896,500 | 9,583,585 |
| | | | 43,162,958 |
|
| TOTAL ENERGY EQUIPMENT & SERVICES | | | 47,559,056 |
|
| Food Products - 0.7% | | | |
| Agricultural Products - 0.7% | | | |
| Darling Ingredients, Inc. (a) | | 48,500 | 3,007,485 |
| Independent Power and Renewable Electricity Producers - 2.4% | | | |
| Independent Power Producers & Energy Traders - 2.4% | | | |
| The AES Corp. | | 39,700 | 968,283 |
| Vistra Corp. | | 488,800 | 9,761,336 |
| | | | 10,729,619 |
| Oil, Gas & Consumable Fuels - 86.0% | | | |
| Coal & Consumable Fuels - 0.2% | | | |
| Enviva Partners LP | | 22,200 | 1,106,004 |
| Integrated Oil & Gas - 40.6% | | | |
| BP PLC sponsored ADR | | 1,159,400 | 25,761,868 |
| Chevron Corp. | | 697,837 | 59,455,712 |
| Exxon Mobil Corp. | | 1,228,161 | 55,070,739 |
| Occidental Petroleum Corp. | | 309,200 | 6,202,552 |
| Occidental Petroleum Corp. warrants 8/3/27 (a) | | 36,987 | 323,636 |
| Royal Dutch Shell PLC Class B sponsored ADR | | 530,700 | 18,516,123 |
| Suncor Energy, Inc. | | 493,200 | 8,249,891 |
| Total SA sponsored ADR | | 138,600 | 5,832,288 |
| | | | 179,412,809 |
| Oil & Gas Exploration & Production - 25.3% | | | |
| Apache Corp. | | 622,900 | 8,895,012 |
| Callon Petroleum Co. (a)(c) | | 44,040 | 609,514 |
| Canadian Natural Resources Ltd. | | 417,800 | 9,439,094 |
| Cimarex Energy Co. | | 148,200 | 6,251,076 |
| ConocoPhillips Co. | | 401,650 | 16,078,050 |
| Devon Energy Corp. | | 560,700 | 9,229,122 |
| EOG Resources, Inc. | | 322,986 | 16,459,367 |
| Hess Corp. | | 128,700 | 6,947,226 |
| Magnolia Oil & Gas Corp. Class A (a) | | 245,700 | 2,081,079 |
| National Energy Services Reunited Corp. (a) | | 502,800 | 5,420,184 |
| Northern Oil & Gas, Inc. (a)(c) | | 85,030 | 867,306 |
| PDC Energy, Inc. (a) | | 285,688 | 6,202,286 |
| Pioneer Natural Resources Co. | | 176,625 | 21,353,963 |
| Viper Energy Partners LP (c) | | 128,100 | 1,760,094 |
| | | | 111,593,373 |
| Oil & Gas Refining & Marketing - 9.6% | | | |
| Marathon Petroleum Corp. | | 370,778 | 16,002,778 |
| Phillips 66 Co. | | 158,918 | 10,774,640 |
| Renewable Energy Group, Inc. (a) | | 24,700 | 2,213,120 |
| Valero Energy Corp. | | 241,500 | 13,627,845 |
| | | | 42,618,383 |
| Oil & Gas Storage & Transport - 10.3% | | | |
| Cheniere Energy, Inc. (a) | | 397,300 | 25,161,009 |
| Enterprise Products Partners LP | | 237,700 | 4,808,671 |
| Golar LNG Ltd. (a)(c) | | 234,300 | 2,537,469 |
| Noble Midstream Partners LP | | 171,888 | 1,988,744 |
| Teekay LNG Partners LP | | 202,900 | 2,513,931 |
| The Williams Companies, Inc. | | 392,800 | 8,339,144 |
| | | | 45,348,968 |
|
| TOTAL OIL, GAS & CONSUMABLE FUELS | | | 380,079,537 |
|
| TOTAL COMMON STOCKS | | | |
| (Cost $474,938,915) | | | 441,375,697 |
|
| Money Market Funds - 0.9% | | | |
| Fidelity Cash Central Fund 0.09% (d) | | 1,095,148 | 1,095,368 |
| Fidelity Securities Lending Cash Central Fund 0.09% (d)(e) | | 2,797,210 | 2,797,489 |
| TOTAL MONEY MARKET FUNDS | | | |
| (Cost $3,892,857) | | | 3,892,857 |
| TOTAL INVESTMENT IN SECURITIES - 100.8% | | | |
| (Cost $478,831,772) | | | 445,268,554 |
| NET OTHER ASSETS (LIABILITIES) - (0.8)% | | | (3,602,998) |
| NET ASSETS - 100% | | | $441,665,556 |
Legend
(a) Non-income producing
(b) Security exempt from registration under Rule 144A of the Securities Act of 1933. These securities may be resold in transactions exempt from registration, normally to qualified institutional buyers. At the end of the period, the value of these securities amounted to $248,845 or 0.1% of net assets.
(c) Security or a portion of the security is on loan at period end.
(d) Affiliated fund that is generally available only to investment companies and other accounts managed by Fidelity Investments. The rate quoted is the annualized seven-day yield of the fund at period end. A complete unaudited listing of the fund's holdings as of its most recent quarter end is available upon request. In addition, each Fidelity Central Fund's financial statements are available on the SEC's website or upon request.
(e) Investment made with cash collateral received from securities on loan.
Affiliated Central Funds
Information regarding fiscal year to date income earned by the Fund from investments in Fidelity Central Funds is as follows:
| Fund | Income earned |
| Fidelity Cash Central Fund | $638 |
| Fidelity Securities Lending Cash Central Fund | 17,022 |
| Total | $17,660 |
Amounts in the income column in the above table include any capital gain distributions from underlying funds, which are presented in the corresponding line-item in the Statement of Operations, if applicable. Amount for Fidelity Securities Lending Cash Central Fund represents the income earned on investing cash collateral, less rebates paid to borrowers and any lending agent fees associated with the loan, plus any premium payments received for lending certain types of securities.
Investment Valuation
The following is a summary of the inputs used, as of January 31, 2021, involving the Fund's assets and liabilities carried at fair value. The inputs or methodology used for valuing securities may not be an indication of the risk associated with investing in those securities. For more information on valuation inputs, and their aggregation into the levels used below, please refer to the Investment Valuation section in the accompanying Notes to Financial Statements.
| | Valuation Inputs at Reporting Date: |
| Description | Total | Level 1 | Level 2 | Level 3 |
| Investments in Securities: | | | | |
| Common Stocks | $441,375,697 | $441,375,697 | $-- | $-- |
| Money Market Funds | 3,892,857 | 3,892,857 | -- | -- |
| Total Investments in Securities: | $445,268,554 | $445,268,554 | $-- | $-- |
Other Information
Distribution of investments by country or territory of incorporation, as a percentage of Total Net Assets, is as follows (Unaudited):
| United States of America | 78.0% |
| United Kingdom | 12.2% |
| Canada | 4.0% |
| Bermuda | 1.4% |
| France | 1.3% |
| Curacao | 1.3% |
| British Virgin Islands | 1.2% |
| Others (Individually Less Than 1%) | 0.6% |
| | 100.0% |
See accompanying notes which are an integral part of the financial statements.
Fidelity Advisor® Energy Fund
Financial Statements
Statement of Assets and Liabilities
| | | January 31, 2021 (Unaudited) |
| Assets | | |
Investment in securities, at value (including securities loaned of $2,671,748) — See accompanying schedule:
Unaffiliated issuers (cost $474,938,915) | $441,375,697 | |
| Fidelity Central Funds (cost $3,892,857) | 3,892,857 | |
| Total Investment in Securities (cost $478,831,772) | | $445,268,554 |
| Cash | | 55 |
| Receivable for fund shares sold | | 754,373 |
| Dividends receivable | | 152,254 |
| Distributions receivable from Fidelity Central Funds | | 3,198 |
| Prepaid expenses | | 4,737 |
| Other receivables | | 146,102 |
| Total assets | | 446,329,273 |
| Liabilities | | |
| Payable for fund shares redeemed | $1,357,038 | |
| Accrued management fee | 205,806 | |
| Distribution and service plan fees payable | 91,845 | |
| Other affiliated payables | 94,131 | |
| Other payables and accrued expenses | 117,732 | |
| Collateral on securities loaned | 2,797,165 | |
| Total liabilities | | 4,663,717 |
| Net Assets | | $441,665,556 |
| Net Assets consist of: | | |
| Paid in capital | | $808,193,405 |
| Total accumulated earnings (loss) | | (366,527,849) |
| Net Assets | | $441,665,556 |
| Net Asset Value and Maximum Offering Price | | |
| Class A: | | |
| Net Asset Value and redemption price per share ($129,528,902 ÷ 6,912,578 shares)(a) | | $18.74 |
| Maximum offering price per share (100/94.25 of $18.74) | | $19.88 |
| Class M: | | |
| Net Asset Value and redemption price per share ($48,498,069 ÷ 2,519,822 shares)(a) | | $19.25 |
| Maximum offering price per share (100/96.50 of $19.25) | | $19.95 |
| Class C: | | |
| Net Asset Value and offering price per share ($46,645,258 ÷ 2,708,585 shares)(a) | | $17.22 |
| Class I: | | |
| Net Asset Value, offering price and redemption price per share ($164,034,951 ÷ 8,290,746 shares) | | $19.79 |
| Class Z: | | |
| Net Asset Value, offering price and redemption price per share ($52,958,376 ÷ 2,682,715 shares) | | $19.74 |
(a) Redemption price per share is equal to net asset value less any applicable contingent deferred sales charge.
See accompanying notes which are an integral part of the financial statements.
Statement of Operations
| | | Six months ended January 31, 2021 (Unaudited) |
| Investment Income | | |
| Dividends | | $8,208,750 |
| Income from Fidelity Central Funds (including $17,022 from security lending) | | 17,660 |
| Total income | | 8,226,410 |
| Expenses | | |
| Management fee | $1,043,554 | |
| Transfer agent fees | 428,251 | |
| Distribution and service plan fees | 470,741 | |
| Accounting fees | 76,791 | |
| Custodian fees and expenses | 3,223 | |
| Independent trustees' fees and expenses | 954 | |
| Registration fees | 61,788 | |
| Audit | 33,837 | |
| Legal | 1,032 | |
| Interest | 189 | |
| Miscellaneous | 28,178 | |
| Total expenses before reductions | 2,148,538 | |
| Expense reductions | (651) | |
| Total expenses after reductions | | 2,147,887 |
| Net investment income (loss) | | 6,078,523 |
| Realized and Unrealized Gain (Loss) | | |
| Net realized gain (loss) on: | | |
| Investment securities: | | |
| Unaffiliated issuers | (44,287,757) | |
| Fidelity Central Funds | (48) | |
| Foreign currency transactions | (2,265) | |
| Total net realized gain (loss) | | (44,290,070) |
| Change in net unrealized appreciation (depreciation) on: | | |
| Investment securities: | | |
| Unaffiliated issuers | 99,481,776 | |
| Assets and liabilities in foreign currencies | 1,505 | |
| Total change in net unrealized appreciation (depreciation) | | 99,483,281 |
| Net gain (loss) | | 55,193,211 |
| Net increase (decrease) in net assets resulting from operations | | $61,271,734 |
See accompanying notes which are an integral part of the financial statements.
Statement of Changes in Net Assets
| | Six months ended January 31, 2021 (Unaudited) | Year ended July 31, 2020 |
| Increase (Decrease) in Net Assets | | |
| Operations | | |
| Net investment income (loss) | $6,078,523 | $12,678,859 |
| Net realized gain (loss) | (44,290,070) | (62,521,551) |
| Change in net unrealized appreciation (depreciation) | 99,483,281 | (157,224,576) |
| Net increase (decrease) in net assets resulting from operations | 61,271,734 | (207,067,268) |
| Distributions to shareholders | (13,506,451) | (8,780,599) |
| Share transactions - net increase (decrease) | (4,719,099) | 12,036,839 |
| Total increase (decrease) in net assets | 43,046,184 | (203,811,028) |
| Net Assets | | |
| Beginning of period | 398,619,372 | 602,430,400 |
| End of period | $441,665,556 | $398,619,372 |
See accompanying notes which are an integral part of the financial statements.
Financial Highlights
Fidelity Advisor Energy Fund Class A
| | Six months ended (Unaudited) January 31, | Years endedJuly 31, | | | �� | |
| | 2021 | 2020 | 2019 | 2018 | 2017 | 2016 |
| Selected Per–Share Data | | | | | | |
| Net asset value, beginning of period | $16.59 | $27.88 | $37.52 | $30.70 | $31.12 | $30.96 |
| Income from Investment Operations | | | | | | |
| Net investment income (loss)A | .26 | .57 | .35 | .12 | .38B | .16 |
| Net realized and unrealized gain (loss) | 2.48 | (11.42) | (9.76) | 7.18 | (.72) | .20 |
| Total from investment operations | 2.74 | (10.85) | (9.41) | 7.30 | (.34) | .36 |
| Distributions from net investment income | (.59) | (.44) | (.18)C | (.48) | – | (.20) |
| Distributions from net realized gain | – | – | (.05)C | –D | (.08) | – |
| Total distributions | (.59) | (.44) | (.23) | (.48) | (.08) | (.20) |
| Redemption fees added to paid in capitalA | – | – | – | – | –D | –D |
| Net asset value, end of period | $18.74 | $16.59 | $27.88 | $37.52 | $30.70 | $31.12 |
| Total ReturnE,F,G | 16.60% | (39.54)% | (25.07)% | 24.07% | (1.14)% | 1.25% |
| Ratios to Average Net AssetsH,I | | | | | | |
| Expenses before reductions | 1.16%J | 1.14% | 1.10% | 1.11% | 1.09% | 1.12% |
| Expenses net of fee waivers, if any | 1.16%J | 1.14% | 1.10% | 1.11% | 1.09% | 1.12% |
| Expenses net of all reductions | 1.16%J | 1.12% | 1.09% | 1.10% | 1.08% | 1.11% |
| Net investment income (loss) | 3.02%J | 2.62% | 1.14% | .36% | 1.15%B | .54% |
| Supplemental Data | | | | | | |
| Net assets, end of period (000 omitted) | $129,529 | $114,321 | $190,992 | $278,555 | $277,378 | $347,885 |
| Portfolio turnover rateK | 36%J | 84%L | 47% | 56% | 90% | 85% |
A Calculated based on average shares outstanding during the period.
B Net investment income per share reflects one or more large, non-recurring dividend(s) which amounted to $.35 per share. Excluding such non-recurring dividend(s), the ratio of net investment income (loss) to average net assets would have been .11%.
C The amounts shown reflect certain reclassifications related to book to tax differences that were made in the year shown.
D Amount represents less than $.005 per share.
E Total returns for periods of less than one year are not annualized.
F Total returns would have been lower if certain expenses had not been reduced during the applicable periods shown.
G Total returns do not include the effect of the sales charges.
H Fees and expenses of any underlying mutual funds or exchange-traded funds (ETFs) are not included in the Fund's expense ratio. The Fund indirectly bears its proportionate share of these expenses. For additional expense information related to investments in Fidelity Central Funds, please refer to the "Investments in Fidelity Central Funds" note found in the Notes to Financial Statements section of the most recent Annual or Semi-Annual report.
I Expense ratios reflect operating expenses of the class. Expenses before reductions do not reflect amounts reimbursed, waived, or reduced through arrangements with the investment adviser, brokerage services, or other offset arrangements, if applicable, and do not represent the amount paid by the class during periods when reimbursements, waivers or reductions occur.
J Annualized
K Amount does not include the portfolio activity of any underlying mutual funds or exchange-traded funds (ETFs).
L Portfolio turnover rate excludes securities received or delivered in-kind.
See accompanying notes which are an integral part of the financial statements.
Fidelity Advisor Energy Fund Class M
| | Six months ended (Unaudited) January 31, | Years endedJuly 31, | | | | |
| | 2021 | 2020 | 2019 | 2018 | 2017 | 2016 |
| Selected Per–Share Data | | | | | | |
| Net asset value, beginning of period | $17.00 | $28.53 | $38.36 | $31.37 | $31.82 | $31.63 |
| Income from Investment Operations | | | | | | |
| Net investment income (loss)A | .24 | .53 | .27 | .03 | .30B | .08 |
| Net realized and unrealized gain (loss) | 2.54 | (11.71) | (9.97) | 7.35 | (.75) | .22 |
| Total from investment operations | 2.78 | (11.18) | (9.70) | 7.38 | (.45) | .30 |
| Distributions from net investment income | (.53) | (.35) | (.08)C | (.39) | – | (.11) |
| Distributions from net realized gain | – | – | (.05)C | –D | – | – |
| Total distributions | (.53) | (.35) | (.13) | (.39) | – | (.11) |
| Redemption fees added to paid in capitalA | – | – | – | – | –D | –D |
| Net asset value, end of period | $19.25 | $17.00 | $28.53 | $38.36 | $31.37 | $31.82 |
| Total ReturnE,F,G | 16.43% | (39.66)% | (25.28)% | 23.75% | (1.41)% | .98% |
| Ratios to Average Net AssetsH,I | | | | | | |
| Expenses before reductions | 1.42%J | 1.40% | 1.37% | 1.38% | 1.36% | 1.38% |
| Expenses net of fee waivers, if any | 1.41%J | 1.40% | 1.36% | 1.38% | 1.36% | 1.38% |
| Expenses net of all reductions | 1.41%J | 1.38% | 1.36% | 1.37% | 1.35% | 1.37% |
| Net investment income (loss) | 2.77%J | 2.36% | .88% | .09% | .88%B | .28% |
| Supplemental Data | | | | | | |
| Net assets, end of period (000 omitted) | $48,498 | $43,768 | $87,147 | $136,828 | $125,951 | $155,856 |
| Portfolio turnover rateK | 36%J | 84%L | 47% | 56% | 90% | 85% |
A Calculated based on average shares outstanding during the period.
B Net investment income per share reflects one or more large, non-recurring dividend(s) which amounted to $.35 per share. Excluding such non-recurring dividend(s), the ratio of net investment income (loss) to average net assets would have been (.16) %.
C The amounts shown reflect certain reclassifications related to book to tax differences that were made in the year shown.
D Amount represents less than $.005 per share.
E Total returns for periods of less than one year are not annualized.
F Total returns would have been lower if certain expenses had not been reduced during the applicable periods shown.
G Total returns do not include the effect of the sales charges.
H Fees and expenses of any underlying mutual funds or exchange-traded funds (ETFs) are not included in the Fund's expense ratio. The Fund indirectly bears its proportionate share of these expenses. For additional expense information related to investments in Fidelity Central Funds, please refer to the "Investments in Fidelity Central Funds" note found in the Notes to Financial Statements section of the most recent Annual or Semi-Annual report.
I Expense ratios reflect operating expenses of the class. Expenses before reductions do not reflect amounts reimbursed, waived, or reduced through arrangements with the investment adviser, brokerage services, or other offset arrangements, if applicable, and do not represent the amount paid by the class during periods when reimbursements, waivers or reductions occur.
J Annualized
K Amount does not include the portfolio activity of any underlying mutual funds or exchange-traded funds (ETFs).
L Portfolio turnover rate excludes securities received or delivered in-kind.
See accompanying notes which are an integral part of the financial statements.
Fidelity Advisor Energy Fund Class C
| | Six months ended (Unaudited) January 31, | Years endedJuly 31, | | | | |
| | 2021 | 2020 | 2019 | 2018 | 2017 | 2016 |
| Selected Per–Share Data | | | | | | |
| Net asset value, beginning of period | $15.23 | $25.58 | $34.39 | $28.16 | $28.69 | $28.58 |
| Income from Investment Operations | | | | | | |
| Net investment income (loss)A | .18 | .39 | .12 | (.11) | .13B | (.05) |
| Net realized and unrealized gain (loss) | 2.27 | (10.52) | (8.93) | 6.59 | (.66) | .19 |
| Total from investment operations | 2.45 | (10.13) | (8.81) | 6.48 | (.53) | .14 |
| Distributions from net investment income | (.46) | (.22) | – | (.24) | – | (.03) |
| Distributions from net realized gain | – | – | – | –C | – | – |
| Total distributions | (.46) | (.22) | – | (.25)D | – | (.03) |
| Redemption fees added to paid in capitalA | – | – | – | – | –C | –C |
| Net asset value, end of period | $17.22 | $15.23 | $25.58 | $34.39 | $28.16 | $28.69 |
| Total ReturnE,F,G | 16.14% | (39.95)% | (25.62)% | 23.16% | (1.85)% | .52% |
| Ratios to Average Net AssetsH,I | | | | | | |
| Expenses before reductions | 1.89%J | 1.86% | 1.82% | 1.84% | 1.82% | 1.84% |
| Expenses net of fee waivers, if any | 1.89%J | 1.86% | 1.82% | 1.83% | 1.81% | 1.84% |
| Expenses net of all reductions | 1.89%J | 1.84% | 1.81% | 1.83% | 1.80% | 1.83% |
| Net investment income (loss) | 2.29%J | 1.90% | .42% | (.37)% | .42%B | (.18)% |
| Supplemental Data | | | | | | |
| Net assets, end of period (000 omitted) | $46,645 | $45,212 | $90,437 | $179,521 | $212,105 | $240,949 |
| Portfolio turnover rateK | 36%J | 84%L | 47% | 56% | 90% | 85% |
A Calculated based on average shares outstanding during the period.
B Net investment income per share reflects one or more large, non-recurring dividend(s) which amounted to $.32 per share. Excluding such non-recurring dividend(s), the ratio of net investment income (loss) to average net assets would have been (.62) %.
C Amount represents less than $.005 per share.
D Total distributions per share do not sum due to rounding.
E Total returns for periods of less than one year are not annualized.
F Total returns would have been lower if certain expenses had not been reduced during the applicable periods shown.
G Total returns do not include the effect of the contingent deferred sales charge.
H Fees and expenses of any underlying mutual funds or exchange-traded funds (ETFs) are not included in the Fund's expense ratio. The Fund indirectly bears its proportionate share of these expenses. For additional expense information related to investments in Fidelity Central Funds, please refer to the "Investments in Fidelity Central Funds" note found in the Notes to Financial Statements section of the most recent Annual or Semi-Annual report.
I Expense ratios reflect operating expenses of the class. Expenses before reductions do not reflect amounts reimbursed, waived, or reduced through arrangements with the investment adviser, brokerage services, or other offset arrangements, if applicable, and do not represent the amount paid by the class during periods when reimbursements, waivers or reductions occur.
J Annualized
K Amount does not include the portfolio activity of any underlying mutual funds or exchange-traded funds (ETFs).
L Portfolio turnover rate excludes securities received or delivered in-kind.
See accompanying notes which are an integral part of the financial statements.
Fidelity Advisor Energy Fund Class I
| | Six months ended (Unaudited) January 31, | Years endedJuly 31, | | | | |
| | 2021 | 2020 | 2019 | 2018 | 2017 | 2016 |
| Selected Per–Share Data | | | | | | |
| Net asset value, beginning of period | $17.51 | $29.39 | $39.57 | $32.36 | $32.78 | $32.62 |
| Income from Investment Operations | | | | | | |
| Net investment income (loss)A | .30 | .67 | .47 | .23 | .50B | .25 |
| Net realized and unrealized gain (loss) | 2.63 | (12.02) | (10.31) | 7.57 | (.75) | .20 |
| Total from investment operations | 2.93 | (11.35) | (9.84) | 7.80 | (.25) | .45 |
| Distributions from net investment income | (.65) | (.53) | (.30)C | (.58) | (.08) | (.29) |
| Distributions from net realized gain | – | – | (.05)C | –D | (.09) | – |
| Total distributions | (.65) | (.53) | (.34)E | (.59)E | (.17) | (.29) |
| Redemption fees added to paid in capitalA | – | – | – | – | –D | –D |
| Net asset value, end of period | $19.79 | $17.51 | $29.39 | $39.57 | $32.36 | $32.78 |
| Total ReturnF,G | 16.80% | (39.33)% | (24.85)% | 24.43% | (.86)% | 1.50% |
| Ratios to Average Net AssetsH,I | | | | | | |
| Expenses before reductions | .83%J | .82% | .80% | .83% | .81% | .85% |
| Expenses net of fee waivers, if any | .83%J | .82% | .80% | .83% | .81% | .85% |
| Expenses net of all reductions | .83%J | .80% | .79% | .82% | .80% | .83% |
| Net investment income (loss) | 3.36%J | 2.95% | 1.44% | .64% | 1.43%B | .82% |
| Supplemental Data | | | | | | |
| Net assets, end of period (000 omitted) | $164,035 | $154,575 | $224,599 | $373,714 | $277,385 | $193,683 |
| Portfolio turnover rateK | 36%J | 84%L | 47% | 56% | 90% | 85% |
A Calculated based on average shares outstanding during the period.
B Net investment income per share reflects one or more large, non-recurring dividend(s) which amounted to $.36 per share. Excluding such non-recurring dividend(s), the ratio of net investment income (loss) to average net assets would have been .39%.
C The amounts shown reflect certain reclassifications related to book to tax differences that were made in the year shown.
D Amount represents less than $.005 per share.
E Total distributions per share do not sum due to rounding.
F Total returns for periods of less than one year are not annualized.
G Total returns would have been lower if certain expenses had not been reduced during the applicable periods shown.
H Fees and expenses of any underlying mutual funds or exchange-traded funds (ETFs) are not included in the Fund's expense ratio. The Fund indirectly bears its proportionate share of these expenses. For additional expense information related to investments in Fidelity Central Funds, please refer to the "Investments in Fidelity Central Funds" note found in the Notes to Financial Statements section of the most recent Annual or Semi-Annual report.
I Expense ratios reflect operating expenses of the class. Expenses before reductions do not reflect amounts reimbursed, waived, or reduced through arrangements with the investment adviser, brokerage services, or other offset arrangements, if applicable, and do not represent the amount paid by the class during periods when reimbursements, waivers or reductions occur.
J Annualized
K Amount does not include the portfolio activity of any underlying mutual funds or exchange-traded funds (ETFs).
L Portfolio turnover rate excludes securities received or delivered in-kind.
See accompanying notes which are an integral part of the financial statements.
Fidelity Advisor Energy Fund Class Z
| | Six months ended (Unaudited) January 31, | Years endedJuly 31, | |
| | 2021 | 2020 | 2019 A |
| Selected Per–Share Data | | | |
| Net asset value, beginning of period | $17.48 | $29.35 | $39.35 |
| Income from Investment Operations | | | |
| Net investment income (loss)B | .31 | .69 | .45 |
| Net realized and unrealized gain (loss) | 2.62 | (11.97) | (10.03) |
| Total from investment operations | 2.93 | (11.28) | (9.58) |
| Distributions from net investment income | (.67) | (.59) | (.37)C |
| Distributions from net realized gain | – | – | (.05)C |
| Total distributions | (.67) | (.59) | (.42) |
| Net asset value, end of period | $19.74 | $17.48 | $29.35 |
| Total ReturnD,E | 16.86% | (39.22)% | (24.34)% |
| Ratios to Average Net AssetsF,G | | | |
| Expenses before reductions | .68%H | .66% | .65%H |
| Expenses net of fee waivers, if any | .68%H | .66% | .64%H |
| Expenses net of all reductions | .68%H | .64% | .64%H |
| Net investment income (loss) | 3.50%H | 3.10% | 1.82%H |
| Supplemental Data | | | |
| Net assets, end of period (000 omitted) | $52,958 | $40,742 | $9,255 |
| Portfolio turnover rateI | 36%H | 84%J | 47% |
A For the period October 2, 2018 (commencement of sale of shares) to July 31, 2019.
B Calculated based on average shares outstanding during the period.
C The amounts shown reflect certain reclassifications related to book to tax differences that were made in the year shown.
D Total returns for periods of less than one year are not annualized.
E Total returns would have been lower if certain expenses had not been reduced during the applicable periods shown.
F Fees and expenses of any underlying mutual funds or exchange-traded funds (ETFs) are not included in the Fund's expense ratio. The Fund indirectly bears its proportionate share of these expenses. For additional expense information related to investments in Fidelity Central Funds, please refer to the "Investments in Fidelity Central Funds" note found in the Notes to Financial Statements section of the most recent Annual or Semi-Annual report.
G Expense ratios reflect operating expenses of the class. Expenses before reductions do not reflect amounts reimbursed, waived, or reduced through arrangements with the investment adviser, brokerage services, or other offset arrangements, if applicable, and do not represent the amount paid by the class during periods when reimbursements, waivers or reductions occur.
H Annualized
I Amount does not include the portfolio activity of any underlying mutual funds or exchange-traded funds (ETFs).
J Portfolio turnover rate excludes securities received or delivered in-kind.
See accompanying notes which are an integral part of the financial statements.
Fidelity Advisor® Financial Services Fund
Investment Summary (Unaudited)
Top Ten Stocks as of January 31, 2021
| | % of fund's net assets |
| Citigroup, Inc. | 5.7 |
| Wells Fargo & Co. | 5.6 |
| Bank of America Corp. | 4.9 |
| Morgan Stanley | 4.7 |
| The Travelers Companies, Inc. | 4.3 |
| American Express Co. | 4.2 |
| Capital One Financial Corp. | 4.1 |
| PNC Financial Services Group, Inc. | 2.7 |
| U.S. Bancorp | 2.6 |
| Bank of New York Mellon Corp. | 2.5 |
| | 41.3 |
Top Industries (% of fund's net assets)
| As of January 31, 2021 |
| | Banks | 35.9% |
| | Insurance | 25.5% |
| | Capital Markets | 19.1% |
| | Consumer Finance | 10.6% |
| | Thrifts & Mortgage Finance | 3.9% |
| | All Others* | 5.0% |

* Includes short-term investments and net other assets (liabilities).
Fidelity Advisor® Financial Services Fund
Schedule of Investments January 31, 2021 (Unaudited)
Showing Percentage of Net Assets
| Common Stocks - 99.9% | | | |
| | | Shares | Value |
| Banks - 35.9% | | | |
| Diversified Banks - 18.8% | | | |
| Bank of America Corp. | | 535,656 | $15,882,200 |
| Citigroup, Inc. | | 318,305 | 18,458,507 |
| U.S. Bancorp | | 190,500 | 8,162,925 |
| Wells Fargo & Co. | | 605,128 | 18,081,225 |
| | | | 60,584,857 |
| Regional Banks - 17.1% | | | |
| Ameris Bancorp | | 44,900 | 1,756,039 |
| Associated Banc-Corp. | | 54,800 | 983,112 |
| Bank OZK | | 93,700 | 3,481,892 |
| BOK Financial Corp. | | 27,116 | 2,002,788 |
| Cadence Bancorp Class A | | 152,264 | 2,728,571 |
| East West Bancorp, Inc. | | 36,800 | 2,205,792 |
| First Horizon National Corp. | | 295,879 | 4,109,759 |
| First Interstate Bancsystem, Inc. | | 45,600 | 1,762,896 |
| Great Western Bancorp, Inc. | | 49,400 | 1,185,600 |
| Huntington Bancshares, Inc. | | 443,920 | 5,870,842 |
| KeyCorp | | 165,100 | 2,783,586 |
| M&T Bank Corp. | | 36,700 | 4,861,649 |
| PacWest Bancorp | | 24,300 | 733,617 |
| Peoples United Financial, Inc. | | 117,300 | 1,602,318 |
| PNC Financial Services Group, Inc. | | 61,000 | 8,754,720 |
| Signature Bank | | 29,000 | 4,790,510 |
| WesBanco, Inc. | | 67,300 | 1,951,700 |
| Wintrust Financial Corp. | | 63,600 | 3,828,084 |
| | | | 55,393,475 |
|
| TOTAL BANKS | | | 115,978,332 |
|
| Capital Markets - 19.1% | | | |
| Asset Management & Custody Banks - 9.8% | | | |
| Affiliated Managers Group, Inc. | | 30,700 | 3,382,833 |
| AllianceBernstein Holding LP | | 122,105 | 4,316,412 |
| Bank of New York Mellon Corp. | | 203,200 | 8,093,456 |
| Brookfield Asset Management, Inc. Class A | | 125,700 | 4,882,188 |
| Carlyle Group LP | | 125,800 | 4,059,566 |
| Northern Trust Corp. | | 22,200 | 1,980,018 |
| State Street Corp. | | 69,400 | 4,858,000 |
| | | | 31,572,473 |
| Financial Exchanges & Data - 1.9% | | | |
| Cboe Global Markets, Inc. | | 65,073 | 5,969,146 |
| Investment Banking & Brokerage - 7.4% | | | |
| Lazard Ltd. Class A | | 46,200 | 1,903,440 |
| Morgan Stanley | | 225,900 | 15,146,595 |
| Raymond James Financial, Inc. | | 39,800 | 3,977,214 |
| Virtu Financial, Inc. Class A | | 108,000 | 2,999,160 |
| | | | 24,026,409 |
|
| TOTAL CAPITAL MARKETS | | | 61,568,028 |
|
| Consumer Finance - 10.6% | | | |
| Consumer Finance - 10.6% | | | |
| American Express Co. | | 117,300 | 13,637,298 |
| Capital One Financial Corp. | | 125,538 | 13,088,592 |
| Navient Corp. | | 211,600 | 2,381,558 |
| OneMain Holdings, Inc. | | 93,200 | 4,339,392 |
| SLM Corp. | | 42,600 | 591,288 |
| | | | 34,038,128 |
| Diversified Financial Services - 1.1% | | | |
| Multi-Sector Holdings - 1.1% | | | |
| Cannae Holdings, Inc. (a) | | 94,740 | 3,599,173 |
| Insurance - 25.5% | | | |
| Insurance Brokers - 3.6% | | | |
| Arthur J. Gallagher & Co. | | 59,500 | 6,866,895 |
| Willis Towers Watson PLC | | 22,800 | 4,627,032 |
| | | | 11,493,927 |
| Life & Health Insurance - 3.1% | | | |
| CNO Financial Group, Inc. | | 134,700 | 2,856,987 |
| MetLife, Inc. | | 104,600 | 5,036,490 |
| Primerica, Inc. | | 16,500 | 2,298,615 |
| | | | 10,192,092 |
| Multi-Line Insurance - 5.7% | | | |
| American Financial Group, Inc. | | 47,300 | 4,452,822 |
| American International Group, Inc. | | 151,500 | 5,672,160 |
| Assurant, Inc. | | 32,700 | 4,429,869 |
| Hartford Financial Services Group, Inc. | | 77,500 | 3,721,550 |
| | | | 18,276,401 |
| Property & Casualty Insurance - 10.5% | | | |
| Allstate Corp. | | 58,600 | 6,280,748 |
| Chubb Ltd. | | 36,100 | 5,258,687 |
| First American Financial Corp. | | 104,000 | 5,438,160 |
| Old Republic International Corp. | | 160,800 | 2,910,480 |
| The Travelers Companies, Inc. | | 102,200 | 13,929,860 |
| | | | 33,817,935 |
| Reinsurance - 2.6% | | | |
| Reinsurance Group of America, Inc. | | 53,900 | 5,662,195 |
| RenaissanceRe Holdings Ltd. | | 18,300 | 2,753,052 |
| | | | 8,415,247 |
|
| TOTAL INSURANCE | | | 82,195,602 |
|
| IT Services - 2.3% | | | |
| Data Processing & Outsourced Services - 2.3% | | | |
| Computer Services, Inc. | | 19,591 | 1,214,642 |
| Fidelity National Information Services, Inc. | | 23,200 | 2,864,272 |
| Visa, Inc. Class A | | 17,300 | 3,343,225 |
| | | | 7,422,139 |
| Professional Services - 1.5% | | | |
| Research & Consulting Services - 1.5% | | | |
| Dun & Bradstreet Holdings, Inc. (a) | | 33,800 | 799,370 |
| Equifax, Inc. | | 23,500 | 4,162,085 |
| | | | 4,961,455 |
| Thrifts & Mortgage Finance - 3.9% | | | |
| Thrifts & Mortgage Finance - 3.9% | | | |
| Essent Group Ltd. | | 84,600 | 3,538,818 |
| MGIC Investment Corp. | | 438,600 | 5,140,392 |
| NMI Holdings, Inc. (a) | | 155,000 | 3,287,550 |
| Radian Group, Inc. | | 36,800 | 706,560 |
| | | | 12,673,320 |
| TOTAL COMMON STOCKS | | | |
| (Cost $277,474,527) | | | 322,436,177 |
|
| Money Market Funds - 0.4% | | | |
| Fidelity Cash Central Fund 0.09% (b) | | | |
| (Cost $1,078,314) | | 1,078,099 | 1,078,314 |
| TOTAL INVESTMENT IN SECURITIES - 100.3% | | | |
| (Cost $278,552,841) | | | 323,514,491 |
| NET OTHER ASSETS (LIABILITIES) - (0.3)% | | | (819,776) |
| NET ASSETS - 100% | | | $322,694,715 |
Legend
(a) Non-income producing
(b) Affiliated fund that is generally available only to investment companies and other accounts managed by Fidelity Investments. The rate quoted is the annualized seven-day yield of the fund at period end. A complete unaudited listing of the fund's holdings as of its most recent quarter end is available upon request. In addition, each Fidelity Central Fund's financial statements are available on the SEC's website or upon request.
Affiliated Central Funds
Information regarding fiscal year to date income earned by the Fund from investments in Fidelity Central Funds is as follows:
| Fund | Income earned |
| Fidelity Cash Central Fund | $640 |
| Fidelity Securities Lending Cash Central Fund | 367 |
| Total | $1,007 |
Amounts in the income column in the above table include any capital gain distributions from underlying funds, which are presented in the corresponding line-item in the Statement of Operations, if applicable. Amount for Fidelity Securities Lending Cash Central Fund represents the income earned on investing cash collateral, less rebates paid to borrowers and any lending agent fees associated with the loan, plus any premium payments received for lending certain types of securities.
Investment Valuation
The following is a summary of the inputs used, as of January 31, 2021, involving the Fund's assets and liabilities carried at fair value. The inputs or methodology used for valuing securities may not be an indication of the risk associated with investing in those securities. For more information on valuation inputs, and their aggregation into the levels used below, please refer to the Investment Valuation section in the accompanying Notes to Financial Statements.
| | Valuation Inputs at Reporting Date: |
| Description | Total | Level 1 | Level 2 | Level 3 |
| Investments in Securities: | | | | |
| Common Stocks | $322,436,177 | $322,436,177 | $-- | $-- |
| Money Market Funds | 1,078,314 | 1,078,314 | -- | -- |
| Total Investments in Securities: | $323,514,491 | $323,514,491 | $-- | $-- |
See accompanying notes which are an integral part of the financial statements.
Fidelity Advisor® Financial Services Fund
Financial Statements
Statement of Assets and Liabilities
| | | January 31, 2021 (Unaudited) |
| Assets | | |
Investment in securities, at value — See accompanying schedule:
Unaffiliated issuers (cost $277,474,527) | $322,436,177 | |
| Fidelity Central Funds (cost $1,078,314) | 1,078,314 | |
| Total Investment in Securities (cost $278,552,841) | | $323,514,491 |
| Receivable for fund shares sold | | 292,668 |
| Dividends receivable | | 412,242 |
| Distributions receivable from Fidelity Central Funds | | 521 |
| Prepaid expenses | | 2,992 |
| Other receivables | | 8,253 |
| Total assets | | 324,231,167 |
| Liabilities | | |
| Payable for fund shares redeemed | $1,215,446 | |
| Accrued management fee | 147,088 | |
| Distribution and service plan fees payable | 85,525 | |
| Other affiliated payables | 58,129 | |
| Other payables and accrued expenses | 30,264 | |
| Total liabilities | | 1,536,452 |
| Net Assets | | $322,694,715 |
| Net Assets consist of: | | |
| Paid in capital | | $279,997,571 |
| Total accumulated earnings (loss) | | 42,697,144 |
| Net Assets | | $322,694,715 |
| Net Asset Value and Maximum Offering Price | | |
| Class A: | | |
| Net Asset Value and redemption price per share ($125,019,121 ÷ 5,553,607 shares)(a) | | $22.51 |
| Maximum offering price per share (100/94.25 of $22.51) | | $23.88 |
| Class M: | | |
| Net Asset Value and redemption price per share ($41,014,258 ÷ 1,841,505 shares)(a) | | $22.27 |
| Maximum offering price per share (100/96.50 of $22.27) | | $23.08 |
| Class C: | | |
| Net Asset Value and offering price per share ($45,646,432 ÷ 2,167,428 shares)(a) | | $21.06 |
| Class I: | | |
| Net Asset Value, offering price and redemption price per share ($80,785,054 ÷ 3,481,835 shares) | | $23.20 |
| Class Z: | | |
| Net Asset Value, offering price and redemption price per share ($30,229,850 ÷ 1,306,003 shares) | | $23.15 |
(a) Redemption price per share is equal to net asset value less any applicable contingent deferred sales charge.
See accompanying notes which are an integral part of the financial statements.
Statement of Operations
| | | Six months ended January 31, 2021 (Unaudited) |
| Investment Income | | |
| Dividends | | $4,259,920 |
| Income from Fidelity Central Funds (including $367 from security lending) | | 1,007 |
| Total income | | 4,260,927 |
| Expenses | | |
| Management fee | $748,014 | |
| Transfer agent fees | 270,182 | |
| Distribution and service plan fees | 451,072 | |
| Accounting fees | 55,043 | |
| Custodian fees and expenses | 4,112 | |
| Independent trustees' fees and expenses | 683 | |
| Registration fees | 69,095 | |
| Audit | 28,617 | |
| Legal | 971 | |
| Interest | 891 | |
| Miscellaneous | 2,704 | |
| Total expenses before reductions | 1,631,384 | |
| Expense reductions | (10,019) | |
| Total expenses after reductions | | 1,621,365 |
| Net investment income (loss) | | 2,639,562 |
| Realized and Unrealized Gain (Loss) | | |
| Net realized gain (loss) on: | | |
| Investment securities: | | |
| Unaffiliated issuers | 1,643,230 | |
| Fidelity Central Funds | 28 | |
| Foreign currency transactions | (17) | |
| Total net realized gain (loss) | | 1,643,241 |
| Change in net unrealized appreciation (depreciation) on: | | |
| Investment securities: | | |
| Unaffiliated issuers | 62,460,370 | |
| Fidelity Central Funds | (43) | |
| Total change in net unrealized appreciation (depreciation) | | 62,460,327 |
| Net gain (loss) | | 64,103,568 |
| Net increase (decrease) in net assets resulting from operations | | $66,743,130 |
See accompanying notes which are an integral part of the financial statements.
Statement of Changes in Net Assets
| | Six months ended January 31, 2021 (Unaudited) | Year ended July 31, 2020 |
| Increase (Decrease) in Net Assets | | |
| Operations | | |
| Net investment income (loss) | $2,639,562 | $6,650,433 |
| Net realized gain (loss) | 1,643,241 | 13,281,773 |
| Change in net unrealized appreciation (depreciation) | 62,460,327 | (73,279,249) |
| Net increase (decrease) in net assets resulting from operations | 66,743,130 | (53,347,043) |
| Distributions to shareholders | (7,232,804) | (4,735,011) |
| Share transactions - net increase (decrease) | (34,440,737) | (24,010,625) |
| Total increase (decrease) in net assets | 25,069,589 | (82,092,679) |
| Net Assets | | |
| Beginning of period | 297,625,126 | 379,717,805 |
| End of period | $322,694,715 | $297,625,126 |
See accompanying notes which are an integral part of the financial statements.
Financial Highlights
Fidelity Advisor Financial Services Fund Class A
| | Six months ended (Unaudited) January 31, | Years endedJuly 31, | | | | |
| | 2021 | 2020 | 2019 | 2018 | 2017 | 2016 |
| Selected Per–Share Data | | | | | | |
| Net asset value, beginning of period | $18.00 | $21.47 | $21.84 | $19.55 | $15.43 | $16.53 |
| Income from Investment Operations | | | | | | |
| Net investment income (loss)A | .19 | .40 | .27 | .12 | .08 | .11 |
| Net realized and unrealized gain (loss) | 4.88 | (3.59) | .07 | 2.25 | 4.08 | (1.13) |
| Total from investment operations | 5.07 | (3.19) | .34 | 2.37 | 4.16 | (1.02) |
| Distributions from net investment income | (.45) | (.28) | (.18) | (.07) | (.04) | (.07) |
| Distributions from net realized gain | (.11) | – | (.53) | (.01) | – | (.01) |
| Total distributions | (.56) | (.28) | (.71) | (.08) | (.04) | (.08) |
| Redemption fees added to paid in capitalA | – | – | – | – | –B | –B |
| Net asset value, end of period | $22.51 | $18.00 | $21.47 | $21.84 | $19.55 | $15.43 |
| Total ReturnC,D,E | 28.23% | (15.15)% | 2.05% | 12.13% | 26.97% | (6.15)% |
| Ratios to Average Net AssetsF,G | | | | | | |
| Expenses before reductions | 1.11%H | 1.09% | 1.08% | 1.10% | 1.12% | 1.15% |
| Expenses net of fee waivers, if any | 1.11%H | 1.09% | 1.07% | 1.10% | 1.12% | 1.15% |
| Expenses net of all reductions | 1.11%H | 1.08% | 1.07% | 1.09% | 1.12% | 1.15% |
| Net investment income (loss) | 1.91%H | 1.97% | 1.31% | .55% | .48% | .77% |
| Supplemental Data | | | | | | |
| Net assets, end of period (000 omitted) | $125,019 | $104,761 | $145,799 | $174,786 | $144,144 | $97,011 |
| Portfolio turnover rateI | 61%H | 88%J | 51% | 46% | 81% | 63% |
A Calculated based on average shares outstanding during the period.
B Amount represents less than $.005 per share.
C Total returns for periods of less than one year are not annualized.
D Total returns would have been lower if certain expenses had not been reduced during the applicable periods shown.
E Total returns do not include the effect of the sales charges.
F Fees and expenses of any underlying mutual funds or exchange-traded funds (ETFs) are not included in the Fund's expense ratio. The Fund indirectly bears its proportionate share of these expenses. For additional expense information related to investments in Fidelity Central Funds, please refer to the "Investments in Fidelity Central Funds" note found in the Notes to Financial Statements section of the most recent Annual or Semi-Annual report.
G Expense ratios reflect operating expenses of the class. Expenses before reductions do not reflect amounts reimbursed, waived, or reduced through arrangements with the investment adviser, brokerage services, or other offset arrangements, if applicable, and do not represent the amount paid by the class during periods when reimbursements, waivers or reductions occur.
H Annualized
I Amount does not include the portfolio activity of any underlying mutual funds or exchange-traded funds (ETFs).
J Portfolio turnover rate excludes securities received or delivered in-kind.
See accompanying notes which are an integral part of the financial statements.
Fidelity Advisor Financial Services Fund Class M
| | Six months ended (Unaudited) January 31, | Years endedJuly 31, | | | | |
| | 2021 | 2020 | 2019 | 2018 | 2017 | 2016 |
| Selected Per–Share Data | | | | | | |
| Net asset value, beginning of period | $17.79 | $21.23 | $21.60 | $19.34 | $15.29 | $16.41 |
| Income from Investment Operations | | | | | | |
| Net investment income (loss)A | .17 | .34 | .21 | .06 | .04 | .07 |
| Net realized and unrealized gain (loss) | 4.82 | (3.55) | .07 | 2.23 | 4.03 | (1.13) |
| Total from investment operations | 4.99 | (3.21) | .28 | 2.29 | 4.07 | (1.06) |
| Distributions from net investment income | (.39) | (.23) | (.13) | (.02) | (.02) | (.05) |
| Distributions from net realized gain | (.11) | – | (.53) | (.01) | – | (.01) |
| Total distributions | (.51)B | (.23) | (.65)B | (.03) | (.02) | (.06) |
| Redemption fees added to paid in capitalA | – | – | – | – | –C | –C |
| Net asset value, end of period | $22.27 | $17.79 | $21.23 | $21.60 | $19.34 | $15.29 |
| Total ReturnD,E,F | 28.07% | (15.38)% | 1.77% | 11.84% | 26.63% | (6.43)% |
| Ratios to Average Net AssetsG,H | | | | | | |
| Expenses before reductions | 1.37%I | 1.35% | 1.34% | 1.37% | 1.40% | 1.45% |
| Expenses net of fee waivers, if any | 1.37%I | 1.35% | 1.34% | 1.37% | 1.40% | 1.45% |
| Expenses net of all reductions | 1.36%I | 1.34% | 1.33% | 1.36% | 1.40% | 1.44% |
| Net investment income (loss) | 1.66%I | 1.72% | 1.04% | .28% | .20% | .47% |
| Supplemental Data | | | | | | |
| Net assets, end of period (000 omitted) | $41,014 | $34,828 | $48,210 | $53,178 | $45,920 | $30,044 |
| Portfolio turnover rateJ | 61%I | 88%K | 51% | 46% | 81% | 63% |
A Calculated based on average shares outstanding during the period.
B Total distributions per share do not sum due to rounding.
C Amount represents less than $.005 per share.
D Total returns for periods of less than one year are not annualized.
E Total returns would have been lower if certain expenses had not been reduced during the applicable periods shown.
F Total returns do not include the effect of the sales charges.
G Fees and expenses of any underlying mutual funds or exchange-traded funds (ETFs) are not included in the Fund's expense ratio. The Fund indirectly bears its proportionate share of these expenses. For additional expense information related to investments in Fidelity Central Funds, please refer to the "Investments in Fidelity Central Funds" note found in the Notes to Financial Statements section of the most recent Annual or Semi-Annual report.
H Expense ratios reflect operating expenses of the class. Expenses before reductions do not reflect amounts reimbursed, waived, or reduced through arrangements with the investment adviser, brokerage services, or other offset arrangements, if applicable, and do not represent the amount paid by the class during periods when reimbursements, waivers or reductions occur.
I Annualized
J Amount does not include the portfolio activity of any underlying mutual funds or exchange-traded funds (ETFs).
K Portfolio turnover rate excludes securities received or delivered in-kind.
See accompanying notes which are an integral part of the financial statements.
Fidelity Advisor Financial Services Fund Class C
| | Six months ended (Unaudited) January 31, | Years endedJuly 31, | | | | |
| | 2021 | 2020 | 2019 | 2018 | 2017 | 2016 |
| Selected Per–Share Data | | | | | | |
| Net asset value, beginning of period | $16.80 | $20.04 | $20.41 | $18.34 | $14.55 | $15.67 |
| Income from Investment Operations | | | | | | |
| Net investment income (loss)A | .11 | .23 | .11 | (.04) | (.05) | –B |
| Net realized and unrealized gain (loss) | 4.54 | (3.37) | .07 | 2.11 | 3.84 | (1.08) |
| Total from investment operations | 4.65 | (3.14) | .18 | 2.07 | 3.79 | (1.08) |
| Distributions from net investment income | (.28) | (.10) | (.03) | – | –B | (.03) |
| Distributions from net realized gain | (.11) | – | (.53) | – | – | (.01) |
| Total distributions | (.39) | (.10) | (.55)C | – | –B | (.04) |
| Redemption fees added to paid in capitalA | – | – | – | – | –B | –B |
| Net asset value, end of period | $21.06 | $16.80 | $20.04 | $20.41 | $18.34 | $14.55 |
| Total ReturnD,E,F | 27.74% | (15.79)% | 1.29% | 11.29% | 26.06% | (6.88)% |
| Ratios to Average Net AssetsG,H | | | | | | |
| Expenses before reductions | 1.87%I | 1.84% | 1.83% | 1.86% | 1.87% | 1.90% |
| Expenses net of fee waivers, if any | 1.87%I | 1.84% | 1.82% | 1.85% | 1.87% | 1.90% |
| Expenses net of all reductions | 1.86%I | 1.83% | 1.82% | 1.85% | 1.87% | 1.89% |
| Net investment income (loss) | 1.16%I | 1.22% | .56% | (.20)% | (.27)% | .02% |
| Supplemental Data | | | | | | |
| Net assets, end of period (000 omitted) | $45,646 | $41,947 | $71,609 | $120,947 | $92,593 | $47,505 |
| Portfolio turnover rateJ | 61%I | 88%K | 51% | 46% | 81% | 63% |
A Calculated based on average shares outstanding during the period.
B Amount represents less than $.005 per share.
C Total distributions per share do not sum due to rounding.
D Total returns for periods of less than one year are not annualized.
E Total returns would have been lower if certain expenses had not been reduced during the applicable periods shown.
F Total returns do not include the effect of the contingent deferred sales charge.
G Fees and expenses of any underlying mutual funds or exchange-traded funds (ETFs) are not included in the Fund's expense ratio. The Fund indirectly bears its proportionate share of these expenses. For additional expense information related to investments in Fidelity Central Funds, please refer to the "Investments in Fidelity Central Funds" note found in the Notes to Financial Statements section of the most recent Annual or Semi-Annual report.
H Expense ratios reflect operating expenses of the class. Expenses before reductions do not reflect amounts reimbursed, waived, or reduced through arrangements with the investment adviser, brokerage services, or other offset arrangements, if applicable, and do not represent the amount paid by the class during periods when reimbursements, waivers or reductions occur.
I Annualized
J Amount does not include the portfolio activity of any underlying mutual funds or exchange-traded funds (ETFs).
K Portfolio turnover rate excludes securities received or delivered in-kind.
See accompanying notes which are an integral part of the financial statements.
Fidelity Advisor Financial Services Fund Class I
| | Six months ended (Unaudited) January 31, | Years endedJuly 31, | | | | |
| | 2021 | 2020 | 2019 | 2018 | 2017 | 2016 |
| Selected Per–Share Data | | | | | | |
| Net asset value, beginning of period | $18.55 | $22.11 | $22.47 | $20.11 | $15.84 | $16.94 |
| Income from Investment Operations | | | | | | |
| Net investment income (loss)A | .23 | .47 | .33 | .18 | .14 | .17 |
| Net realized and unrealized gain (loss) | 5.03 | (3.69) | .08 | 2.32 | 4.19 | (1.17) |
| Total from investment operations | 5.26 | (3.22) | .41 | 2.50 | 4.33 | (1.00) |
| Distributions from net investment income | (.50) | (.34) | (.25) | (.13) | (.06) | (.09) |
| Distributions from net realized gain | (.11) | – | (.53) | (.01) | – | (.01) |
| Total distributions | (.61) | (.34) | (.77)B | (.14) | (.06) | (.10) |
| Redemption fees added to paid in capitalA | – | – | – | – | –C | –C |
| Net asset value, end of period | $23.20 | $18.55 | $22.11 | $22.47 | $20.11 | $15.84 |
| Total ReturnD,E | 28.43% | (14.91)% | 2.36% | 12.43% | 27.36% | (5.89)% |
| Ratios to Average Net AssetsF,G | | | | | | |
| Expenses before reductions | .81%H | .80% | .80% | .83% | .84% | .85% |
| Expenses net of fee waivers, if any | .81%H | .80% | .79% | .83% | .84% | .85% |
| Expenses net of all reductions | .81%H | .78% | .79% | .82% | .83% | .84% |
| Net investment income (loss) | 2.22%H | 2.27% | 1.59% | .83% | .76% | 1.07% |
| Supplemental Data | | | | | | |
| Net assets, end of period (000 omitted) | $80,785 | $85,299 | $107,059 | $162,724 | $96,789 | $20,588 |
| Portfolio turnover rateI | 61%H | 88%J | 51% | 46% | 81% | 63% |
A Calculated based on average shares outstanding during the period.
B Total distributions per share do not sum due to rounding.
C Amount represents less than $.005 per share.
D Total returns for periods of less than one year are not annualized.
E Total returns would have been lower if certain expenses had not been reduced during the applicable periods shown.
F Fees and expenses of any underlying mutual funds or exchange-traded funds (ETFs) are not included in the Fund's expense ratio. The Fund indirectly bears its proportionate share of these expenses. For additional expense information related to investments in Fidelity Central Funds, please refer to the "Investments in Fidelity Central Funds" note found in the Notes to Financial Statements section of the most recent Annual or Semi-Annual report.
G Expense ratios reflect operating expenses of the class. Expenses before reductions do not reflect amounts reimbursed, waived, or reduced through arrangements with the investment adviser, brokerage services, or other offset arrangements, if applicable, and do not represent the amount paid by the class during periods when reimbursements, waivers or reductions occur.
H Annualized
I Amount does not include the portfolio activity of any underlying mutual funds or exchange-traded funds (ETFs).
J Portfolio turnover rate excludes securities received or delivered in-kind.
See accompanying notes which are an integral part of the financial statements.
Fidelity Advisor Financial Services Fund Class Z
| | Six months ended (Unaudited) January 31, | Years endedJuly 31, | |
| | 2021 | 2020 | 2019 A |
| Selected Per–Share Data | | | |
| Net asset value, beginning of period | $18.53 | $22.09 | $21.99 |
| Income from Investment Operations | | | |
| Net investment income (loss)B | .24 | .49 | .25 |
| Net realized and unrealized gain (loss) | 5.03 | (3.67) | .66 |
| Total from investment operations | 5.27 | (3.18) | .91 |
| Distributions from net investment income | (.54) | (.38) | (.29) |
| Distributions from net realized gain | (.11) | – | (.53) |
| Total distributions | (.65) | (.38) | (.81)C |
| Net asset value, end of period | $23.15 | $18.53 | $22.09 |
| Total ReturnD,E | 28.51% | (14.79)% | 4.72% |
| Ratios to Average Net AssetsF,G | | | |
| Expenses before reductions | .69%H | .67% | .66%H |
| Expenses net of fee waivers, if any | .69%H | .67% | .65%H |
| Expenses net of all reductions | .68%H | .65% | .65%H |
| Net investment income (loss) | 2.34%H | 2.40% | 1.44%H |
| Supplemental Data | | | |
| Net assets, end of period (000 omitted) | $30,230 | $30,790 | $7,041 |
| Portfolio turnover rateI | 61%H | 88%J | 51% |
A For the period October 2, 2018 (commencement of sale of shares) to July 31, 2019.
B Calculated based on average shares outstanding during the period.
C Total distributions per share do not sum due to rounding.
D Total returns for periods of less than one year are not annualized.
E Total returns would have been lower if certain expenses had not been reduced during the applicable periods shown.
F Fees and expenses of any underlying mutual funds or exchange-traded funds (ETFs) are not included in the Fund's expense ratio. The Fund indirectly bears its proportionate share of these expenses. For additional expense information related to investments in Fidelity Central Funds, please refer to the "Investments in Fidelity Central Funds" note found in the Notes to Financial Statements section of the most recent Annual or Semi-Annual report.
G Expense ratios reflect operating expenses of the class. Expenses before reductions do not reflect amounts reimbursed, waived, or reduced through arrangements with the investment adviser, brokerage services, or other offset arrangements, if applicable, and do not represent the amount paid by the class during periods when reimbursements, waivers or reductions occur.
H Annualized
I Amount does not include the portfolio activity of any underlying mutual funds or exchange-traded funds (ETFs).
J Portfolio turnover rate excludes securities received or delivered in-kind.
See accompanying notes which are an integral part of the financial statements.
Fidelity Advisor® Health Care Fund
Investment Summary (Unaudited)
Top Ten Stocks as of January 31, 2021
| | % of fund's net assets |
| UnitedHealth Group, Inc. | 7.7 |
| Cigna Corp. | 5.3 |
| Humana, Inc. | 5.1 |
| Danaher Corp. | 5.0 |
| Eli Lilly & Co. | 4.9 |
| Boston Scientific Corp. | 4.1 |
| Roche Holding AG (participation certificate) | 3.9 |
| Regeneron Pharmaceuticals, Inc. | 3.8 |
| AstraZeneca PLC (United Kingdom) | 3.1 |
| Centene Corp. | 2.9 |
| | 45.8 |
Top Industries (% of fund's net assets)
| As of January 31, 2021 |
| | Health Care Providers & Services | 26.9% |
| | Biotechnology | 24.5% |
| | Health Care Equipment & Supplies | 21.6% |
| | Pharmaceuticals | 16.8% |
| | Life Sciences Tools & Services | 6.9% |
| | All Others* | 3.3% |
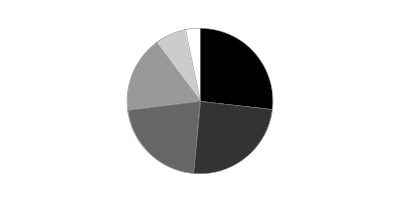
* Includes Short-Term investments and Net Other Assets (Liabilities).
Fidelity Advisor® Health Care Fund
Schedule of Investments January 31, 2021 (Unaudited)
Showing Percentage of Net Assets
| Common Stocks - 99.5% | | | |
| | | Shares | Value |
| Biotechnology - 24.5% | | | |
| Biotechnology - 24.5% | | | |
| Abcam PLC | | 600,000 | $13,630,252 |
| Acceleron Pharma, Inc. (a) | | 300,000 | 34,659,000 |
| ADC Therapeutics SA (a) | | 586,597 | 16,759,076 |
| Agios Pharmaceuticals, Inc. (a) | | 184,782 | 8,679,211 |
| Alnylam Pharmaceuticals, Inc. (a) | | 600,000 | 90,288,000 |
| Arcutis Biotherapeutics, Inc. (a) | | 360,000 | 9,824,400 |
| Argenx SE ADR (a) | | 440,000 | 128,928,800 |
| Ascendis Pharma A/S sponsored ADR (a) | | 541,054 | 81,239,258 |
| Avid Bioservices, Inc. (a) | | 506,300 | 7,386,917 |
| BeiGene Ltd. ADR (a) | | 100,000 | 32,000,000 |
| BioAtla, Inc. | | 97,300 | 4,278,281 |
| Black Diamond Therapeutics, Inc. (a) | | 200,000 | 4,954,000 |
| Blueprint Medicines Corp. (a) | | 230,000 | 22,252,500 |
| Denali Therapeutics, Inc. (a) | | 208,000 | 14,248,000 |
| Exelixis, Inc. (a) | | 1,140,000 | 25,319,400 |
| Fate Therapeutics, Inc. (a) | | 500,000 | 45,315,000 |
| Forma Therapeutics Holdings, Inc. | | 460,000 | 17,769,800 |
| Fusion Pharmaceuticals, Inc. (a) | | 76,000 | 858,800 |
| Generation Bio Co. | | 201,420 | 5,303,389 |
| Innovent Biologics, Inc. (a)(b) | | 4,000,000 | 45,709,864 |
| Insmed, Inc. (a) | | 800,000 | 30,072,000 |
| Keros Therapeutics, Inc. | | 200,000 | 11,410,000 |
| Kinnate Biopharma, Inc. | | 180,000 | 5,904,000 |
| Kura Oncology, Inc. (a) | | 940,000 | 28,153,000 |
| Kymera Therapeutics, Inc. (a) | | 280,000 | 17,346,000 |
| Mirati Therapeutics, Inc. (a) | | 232,000 | 47,636,560 |
| Morphic Holding, Inc. (a) | | 147,500 | 4,964,850 |
| Neurocrine Biosciences, Inc. (a) | | 600,000 | 65,850,000 |
| Novavax, Inc. (a) | | 128,000 | 28,280,320 |
| ORIC Pharmaceuticals, Inc. (a) | | 423,300 | 12,411,156 |
| Passage Bio, Inc. | | 387,800 | 7,236,348 |
| Poseida Therapeutics, Inc. (a) | | 132,094 | 1,149,218 |
| Poseida Therapeutics, Inc. (b) | | 836,860 | 7,280,682 |
| Prelude Therapeutics, Inc. (c) | | 383,200 | 24,888,840 |
| PTC Therapeutics, Inc. (a) | | 346,500 | 20,034,630 |
| Regeneron Pharmaceuticals, Inc. (a) | | 495,000 | 249,400,800 |
| Relay Therapeutics, Inc. (a)(c) | | 300,000 | 14,874,000 |
| Repare Therapeutics, Inc. | | 284,700 | 10,565,217 |
| Revolution Medicines, Inc. | | 800,000 | 33,712,000 |
| Sage Therapeutics, Inc. (a) | | 105,767 | 8,530,109 |
| Sarepta Therapeutics, Inc. (a) | | 440,000 | 39,336,000 |
| Scholar Rock Holding Corp. (a) | | 78,575 | 4,687,785 |
| Seer, Inc. | | 6,065 | 378,456 |
| Shattuck Labs, Inc. | | 75,000 | 3,720,750 |
| Shattuck Labs, Inc. | | 560,371 | 26,410,005 |
| Stoke Therapeutics, Inc. (a) | | 400,000 | 24,432,000 |
| Taysha Gene Therapies, Inc. | | 168,521 | 4,381,546 |
| TG Therapeutics, Inc. (a) | | 1,431,558 | 69,101,305 |
| Turning Point Therapeutics, Inc. (a) | | 350,000 | 43,921,500 |
| uniQure B.V. (a) | | 321,999 | 11,401,985 |
| Vaxcyte, Inc. | | 408,810 | 10,028,109 |
| Vertex Pharmaceuticals, Inc. (a) | | 180,000 | 41,234,400 |
| Viela Bio, Inc. (a) | | 670,000 | 23,235,600 |
| Xencor, Inc. (a) | | 740,000 | 33,855,000 |
| Zentalis Pharmaceuticals, Inc. | | 700,000 | 26,859,000 |
| Zymeworks, Inc. (a) | | 480,848 | 16,262,279 |
| | | | 1,618,349,398 |
| Capital Markets - 0.1% | | | |
| Investment Banking & Brokerage - 0.1% | | | |
| Vesper Healthcare Acquisition Corp. Class A (a) | | 416,300 | 4,358,661 |
| Diversified Financial Services - 0.1% | | | |
| Other Diversified Financial Services - 0.1% | | | |
| Jaws Acquisition Corp. (a) | | 500,000 | 6,505,000 |
| Health Care Equipment & Supplies - 21.6% | | | |
| Health Care Equipment - 21.6% | | | |
| Becton, Dickinson & Co. | | 200,000 | 52,358,000 |
| Boston Scientific Corp. (a) | | 7,600,000 | 269,344,000 |
| Danaher Corp. | | 1,400,000 | 332,976,000 |
| DexCom, Inc. (a) | | 72,000 | 26,989,200 |
| Envista Holdings Corp. (a) | | 354,367 | 12,594,203 |
| Genmark Diagnostics, Inc. (a) | | 850,000 | 11,738,500 |
| Hologic, Inc. (a) | | 1,800,000 | 143,514,000 |
| Insulet Corp. (a) | | 648,600 | 173,292,948 |
| Intuitive Surgical, Inc. (a) | | 75,000 | 56,073,000 |
| Masimo Corp. (a) | | 287,100 | 73,474,632 |
| Outset Medical, Inc. | | 48,393 | 2,508,209 |
| Outset Medical, Inc. | | 487,069 | 23,982,547 |
| Penumbra, Inc. (a)(c) | | 700,000 | 182,763,000 |
| Shockwave Medical, Inc. (a) | | 145,000 | 16,825,800 |
| Tandem Diabetes Care, Inc. (a) | | 480,000 | 44,472,000 |
| | | | 1,422,906,039 |
| Health Care Providers & Services - 26.9% | | | |
| Health Care Facilities - 1.9% | | | |
| HCA Holdings, Inc. | | 460,000 | 74,740,800 |
| Rede D'Oregon Sao Luiz SA (b) | | 3,600,000 | 43,228,424 |
| Surgery Partners, Inc. (a) | | 201,277 | 7,503,607 |
| | | | 125,472,831 |
| Health Care Services - 8.4% | | | |
| 1Life Healthcare, Inc. (a) | | 920,000 | 46,552,000 |
| Alignment Healthcare Partners unit (d)(e) | | 1,155,248 | 22,816,148 |
| Cigna Corp. | | 1,620,000 | 351,621,000 |
| Guardant Health, Inc. (a) | | 328,000 | 51,004,000 |
| Oak Street Health, Inc. | | 1,521,680 | 78,140,246 |
| Option Care Health, Inc. (a) | | 241,081 | 4,455,177 |
| | | | 554,588,571 |
| Managed Health Care - 16.6% | | | |
| Anthem, Inc. | | 190,000 | 56,426,200 |
| Centene Corp. (a) | | 3,220,000 | 194,166,000 |
| Humana, Inc. | | 880,000 | 337,136,800 |
| UnitedHealth Group, Inc. | | 1,515,000 | 505,373,697 |
| | | | 1,093,102,697 |
|
| TOTAL HEALTH CARE PROVIDERS & SERVICES | | | 1,773,164,099 |
|
| Health Care Technology - 1.7% | | | |
| Health Care Technology - 1.7% | | | |
| Castlight Health, Inc. (a) | | 331,400 | 589,892 |
| Castlight Health, Inc. Class B (a) | | 1,700,000 | 3,026,000 |
| Inspire Medical Systems, Inc. (a) | | 340,000 | 68,513,400 |
| Phreesia, Inc. (a) | | 440,000 | 28,727,600 |
| Veeva Systems, Inc. Class A (a) | | 54,000 | 14,927,760 |
| | | | 115,784,652 |
| Life Sciences Tools & Services - 6.9% | | | |
| Life Sciences Tools & Services - 6.9% | | | |
| 10X Genomics, Inc. (a) | | 489,651 | 83,803,769 |
| Bio-Rad Laboratories, Inc. Class A (a) | | 100,000 | 57,377,000 |
| Bruker Corp. | | 1,670,000 | 96,676,300 |
| Lonza Group AG | | 121,800 | 77,793,620 |
| Maravai LifeSciences Holdings, Inc. | | 720,000 | 25,084,800 |
| Seer, Inc. Class A (e) | | 273,935 | 17,093,544 |
| Thermo Fisher Scientific, Inc. | | 194,000 | 98,881,800 |
| | | | 456,710,833 |
| Pharmaceuticals - 16.7% | | | |
| Pharmaceuticals - 16.7% | | | |
| Arvinas Holding Co. LLC (a) | | 300,000 | 22,632,000 |
| AstraZeneca PLC (United Kingdom) | | 2,000,000 | 204,022,396 |
| Atea Pharmaceuticals, Inc. | | 139,522 | 10,185,106 |
| Bristol-Myers Squibb Co. | | 1,200,000 | 73,716,000 |
| Eli Lilly & Co. | | 1,560,000 | 324,433,200 |
| Harmony Biosciences Holdings, Inc. (a)(c) | | 220,000 | 7,889,200 |
| Harmony Biosciences Holdings, Inc. | | 845,884 | 28,816,730 |
| Nektar Therapeutics (a)(c) | | 1,280,000 | 25,216,000 |
| Pliant Therapeutics, Inc. | | 568,921 | 14,001,146 |
| Revance Therapeutics, Inc. (a) | | 400,000 | 10,176,000 |
| Roche Holding AG (participation certificate) | | 740,000 | 255,382,943 |
| Royalty Pharma PLC (a)(d)(e) | | 4,463 | 0 |
| Royalty Pharma PLC (c) | | 1,000,000 | 47,010,000 |
| Royalty Pharma PLC (b) | | 572,200 | 26,899,122 |
| Theravance Biopharma, Inc. (a) | | 645,220 | 12,026,901 |
| UCB SA | | 420,000 | 43,588,774 |
| | | | 1,105,995,518 |
| Professional Services - 0.3% | | | |
| Research & Consulting Services - 0.3% | | | |
| Clarivate Analytics PLC (a) | | 670,000 | 19,389,800 |
| Software - 0.7% | | | |
| Application Software - 0.7% | | | |
| Nuance Communications, Inc. (a) | | 1,000,000 | 45,540,000 |
| TOTAL COMMON STOCKS | | | |
| (Cost $4,372,112,902) | | | 6,568,704,000 |
|
| Convertible Preferred Stocks - 0.1% | | | |
| Health Care Providers & Services - 0.0% | | | |
| Health Care Services - 0.0% | | | |
| dMed Biopharmaceutical Co. Ltd. (Class C) (d)(e) | | 236,142 | 3,353,960 |
| Pharmaceuticals - 0.1% | | | |
| Pharmaceuticals - 0.1% | | | |
| Aristea Therapeutics, Inc. Series B (d)(e) | | 638,900 | 4,606,469 |
| TOTAL CONVERTIBLE PREFERRED STOCKS | | | |
| (Cost $6,876,663) | | | 7,960,429 |
|
| Money Market Funds - 2.8% | | | |
| Fidelity Cash Central Fund 0.09% (f) | | 122,483,969 | 122,508,465 |
| Fidelity Securities Lending Cash Central Fund 0.09% (f)(g) | | 60,906,312 | 60,912,403 |
| TOTAL MONEY MARKET FUNDS | | | |
| (Cost $183,420,868) | | | 183,420,868 |
| TOTAL INVESTMENT IN SECURITIES - 102.4% | | | |
| (Cost $4,562,410,433) | | | 6,760,085,297 |
| NET OTHER ASSETS (LIABILITIES) - (2.4)% | | | (161,021,107) |
| NET ASSETS - 100% | | | $6,599,064,190 |
Legend
(a) Non-income producing
(b) Security exempt from registration under Rule 144A of the Securities Act of 1933. These securities may be resold in transactions exempt from registration, normally to qualified institutional buyers. At the end of the period, the value of these securities amounted to $123,118,092 or 1.9% of net assets.
(c) Security or a portion of the security is on loan at period end.
(d) Level 3 security
(e) Restricted securities (including private placements) - Investment in securities not registered under the Securities Act of 1933 (excluding 144A issues). At the end of the period, the value of restricted securities (excluding 144A issues) amounted to $47,870,121 or 0.7% of net assets.
(f) Affiliated fund that is generally available only to investment companies and other accounts managed by Fidelity Investments. The rate quoted is the annualized seven-day yield of the fund at period end. A complete unaudited listing of the fund's holdings as of its most recent quarter end is available upon request. In addition, each Fidelity Central Fund's financial statements are available on the SEC's website or upon request.
(g) Investment made with cash collateral received from securities on loan.
Additional information on each restricted holding is as follows:
| Security | Acquisition Date | Acquisition Cost |
| Alignment Healthcare Partners unit | 2/28/20 | $14,000,005 |
| Aristea Therapeutics, Inc. Series B | 10/6/20 | $3,522,703 |
| dMed Biopharmaceutical Co. Ltd. (Class C) | 12/1/20 | $3,353,960 |
| Royalty Pharma PLC | 5/21/15 | $526,188 |
| Seer, Inc. Class A | 12/8/20 | $5,204,765 |
Affiliated Central Funds
Information regarding fiscal year to date income earned by the Fund from investments in Fidelity Central Funds is as follows:
| Fund | Income earned |
| Fidelity Cash Central Fund | $16,649 |
| Fidelity Securities Lending Cash Central Fund | 164,891 |
| Total | $181,540 |
Amounts in the income column in the above table include any capital gain distributions from underlying funds, which are presented in the corresponding line-item in the Statement of Operations, if applicable. Amount for Fidelity Securities Lending Cash Central Fund represents the income earned on investing cash collateral, less rebates paid to borrowers and any lending agent fees associated with the loan, plus any premium payments received for lending certain types of securities.
Investment Valuation
The following is a summary of the inputs used, as of January 31, 2021, involving the Fund's assets and liabilities carried at fair value. The inputs or methodology used for valuing securities may not be an indication of the risk associated with investing in those securities. For more information on valuation inputs, and their aggregation into the levels used below, please refer to the Investment Valuation section in the accompanying Notes to Financial Statements.
| | Valuation Inputs at Reporting Date: |
| Description | Total | Level 1 | Level 2 | Level 3 |
| Investments in Securities: | | | | |
| Common Stocks | $6,568,704,000 | $5,851,339,365 | $694,548,487 | $22,816,148 |
| Convertible Preferred Stocks | 7,960,429 | -- | -- | 7,960,429 |
| Money Market Funds | 183,420,868 | 183,420,868 | -- | -- |
| Total Investments in Securities: | $6,760,085,297 | $6,034,760,233 | $694,548,487 | $30,776,577 |
Other Information
Distribution of investments by country or territory of incorporation, as a percentage of Total Net Assets, is as follows (Unaudited):
| United States of America | 84.3% |
| Switzerland | 5.4% |
| United Kingdom | 3.7% |
| Netherlands | 2.1% |
| Cayman Islands | 1.4% |
| Denmark | 1.2% |
| Others (Individually Less Than 1%) | 1.9% |
| | 100.0% |
See accompanying notes which are an integral part of the financial statements.
Fidelity Advisor® Health Care Fund
Financial Statements
Statement of Assets and Liabilities
| | | January 31, 2021 (Unaudited) |
| Assets | | |
Investment in securities, at value (including securities loaned of $58,975,475) — See accompanying schedule:
Unaffiliated issuers (cost $4,388,748,937) | $6,576,664,429 | |
| Fidelity Central Funds (cost $183,420,868) | 183,420,868 | |
| Total Investment in Securities (cost $4,572,169,805) | | $6,760,085,297 |
| Cash | | 19,833 |
| Receivable for investments sold | | 12,394,969 |
| Receivable for fund shares sold | | 13,997,584 |
| Dividends receivable | | 4,398,580 |
| Distributions receivable from Fidelity Central Funds | | 18,245 |
| Prepaid expenses | | 19,956 |
| Other receivables | | 64,266 |
| Total assets | | 6,790,998,730 |
| Liabilities | | |
| Payable for investments purchased | $116,877,372 | |
| Payable for fund shares redeemed | 9,056,954 | |
| Accrued management fee | 2,913,937 | |
| Distribution and service plan fees payable | 1,100,885 | |
| Other affiliated payables | 917,262 | |
| Other payables and accrued expenses | 157,605 | |
| Collateral on securities loaned | 60,910,525 | |
| Total liabilities | | 191,934,540 |
| Net Assets | | $6,599,064,190 |
| Net Assets consist of: | | |
| Paid in capital | | $4,308,275,954 |
| Total accumulated earnings (loss) | | 2,290,788,236 |
| Net Assets | | $6,599,064,190 |
| Net Asset Value and Maximum Offering Price | | |
| Class A: | | |
| Net Asset Value and redemption price per share ($1,565,947,748 ÷ 24,157,100 shares)(a) | | $64.82 |
| Maximum offering price per share (100/94.25 of $64.82) | | $68.77 |
| Class M: | | |
| Net Asset Value and redemption price per share ($380,500,996 ÷ 6,348,569 shares)(a) | | $59.93 |
| Maximum offering price per share (100/96.50 of $59.93) | | $62.10 |
| Class C: | | |
| Net Asset Value and offering price per share ($713,119,049 ÷ 14,279,757 shares)(a) | | $49.94 |
| Class I: | | |
| Net Asset Value, offering price and redemption price per share ($3,174,506,870 ÷ 44,611,478 shares) | | $71.16 |
| Class Z: | | |
| Net Asset Value, offering price and redemption price per share ($764,989,527 ÷ 10,746,274 shares) | | $71.19 |
(a) Redemption price per share is equal to net asset value less any applicable contingent deferred sales charge.
See accompanying notes which are an integral part of the financial statements.
Statement of Operations
| | | Six months ended January 31, 2021 (Unaudited) |
| Investment Income | | |
| Dividends | | $12,625,870 |
| Income from Fidelity Central Funds (including $164,891 from security lending) | | 181,540 |
| Total income | | 12,807,410 |
| Expenses | | |
| Management fee | $15,889,197 | |
| Transfer agent fees | 4,779,368 | |
| Distribution and service plan fees | 6,158,890 | |
| Accounting fees | 561,225 | |
| Custodian fees and expenses | 68,395 | |
| Independent trustees' fees and expenses | 14,075 | |
| Registration fees | 231,546 | |
| Audit | 28,391 | |
| Legal | 11,392 | |
| Interest | 1,024 | |
| Miscellaneous | 12,414 | |
| Total expenses before reductions | 27,755,917 | |
| Expense reductions | (73,949) | |
| Total expenses after reductions | | 27,681,968 |
| Net investment income (loss) | | (14,874,558) |
| Realized and Unrealized Gain (Loss) | | |
| Net realized gain (loss) on: | | |
| Investment securities: | | |
| Unaffiliated issuers | 295,016,024 | |
| Fidelity Central Funds | (1,379) | |
| Foreign currency transactions | (523,738) | |
| Total net realized gain (loss) | | 294,490,907 |
| Change in net unrealized appreciation (depreciation) on: | | |
| Investment securities: | | |
| Unaffiliated issuers | 426,261,413 | |
| Fidelity Central Funds | (4,410) | |
| Assets and liabilities in foreign currencies | 106,163 | |
| Total change in net unrealized appreciation (depreciation) | | 426,363,166 |
| Net gain (loss) | | 720,854,073 |
| Net increase (decrease) in net assets resulting from operations | | $705,979,515 |
See accompanying notes which are an integral part of the financial statements.
Statement of Changes in Net Assets
| | Six months ended January 31, 2021 (Unaudited) | Year ended July 31, 2020 |
| Increase (Decrease) in Net Assets | | |
| Operations | | |
| Net investment income (loss) | $(14,874,558) | $(1,532,281) |
| Net realized gain (loss) | 294,490,907 | 204,524,782 |
| Change in net unrealized appreciation (depreciation) | 426,363,166 | 806,862,491 |
| Net increase (decrease) in net assets resulting from operations | 705,979,515 | 1,009,854,992 |
| Distributions to shareholders | (356,031,462) | (19,320,902) |
| Share transactions - net increase (decrease) | 716,463,115 | 506,568,084 |
| Total increase (decrease) in net assets | 1,066,411,168 | 1,497,102,174 |
| Net Assets | | |
| Beginning of period | 5,532,653,022 | 4,035,550,848 |
| End of period | $6,599,064,190 | $5,532,653,022 |
See accompanying notes which are an integral part of the financial statements.
Financial Highlights
Fidelity Advisor Health Care Fund Class A
| | Six months ended (Unaudited) January 31, | Years endedJuly 31, | | | | |
| | 2021 | 2020 | 2019 | 2018 | 2017 | 2016 |
| Selected Per–Share Data | | | | | | |
| Net asset value, beginning of period | $61.07 | $49.21 | $50.14 | $41.85 | $38.23 | $45.17 |
| Income from Investment Operations | | | | | | |
| Net investment income (loss)A | (.18) | (.04) | (.07) | (.07) | (.04) | (.09) |
| Net realized and unrealized gain (loss) | 7.71 | 12.08 | 1.36 | 8.36 | 3.66 | (4.30) |
| Total from investment operations | 7.53 | 12.04 | 1.29 | 8.29 | 3.62 | (4.39) |
| Distributions from net investment income | (.16) | – | – | – | – | – |
| Distributions from net realized gain | (3.62) | (.18) | (2.22) | – | – | (2.55) |
| Total distributions | (3.78) | (.18) | (2.22) | – | – | (2.55) |
| Redemption fees added to paid in capitalA | – | – | – | – | –B | –B |
| Net asset value, end of period | $64.82 | $61.07 | $49.21 | $50.14 | $41.85 | $38.23 |
| Total ReturnC,D,E | 12.44% | 24.50% | 2.87% | 19.81% | 9.47% | (9.82)% |
| Ratios to Average Net AssetsF,G | | | | | | |
| Expenses before reductions | .99%H | 1.01% | 1.02% | 1.05% | 1.04% | 1.04% |
| Expenses net of fee waivers, if any | .99%H | 1.00% | 1.02% | 1.05% | 1.04% | 1.04% |
| Expenses net of all reductions | .99%H | 1.00% | 1.02% | 1.04% | 1.04% | 1.04% |
| Net investment income (loss) | (.56)%H | (.07)% | (.14)% | (.16)% | (.10)% | (.25)% |
| Supplemental Data | | | | | | |
| Net assets, end of period (000 omitted) | $1,565,948 | $1,372,082 | $1,121,411 | $1,003,430 | $875,176 | $1,159,614 |
| Portfolio turnover rateI | 43%H | 53%J | 45% | 81% | 64% | 67% |
A Calculated based on average shares outstanding during the period.
B Amount represents less than $.005 per share.
C Total returns for periods of less than one year are not annualized.
D Total returns would have been lower if certain expenses had not been reduced during the applicable periods shown.
E Total returns do not include the effect of the sales charges.
F Fees and expenses of any underlying mutual funds or exchange-traded funds (ETFs) are not included in the Fund's expense ratio. The Fund indirectly bears its proportionate share of these expenses. For additional expense information related to investments in Fidelity Central Funds, please refer to the "Investments in Fidelity Central Funds" note found in the Notes to Financial Statements section of the most recent Annual or Semi-Annual report.
G Expense ratios reflect operating expenses of the class. Expenses before reductions do not reflect amounts reimbursed, waived, or reduced through arrangements with the investment adviser, brokerage services, or other offset arrangements, if applicable, and do not represent the amount paid by the class during periods when reimbursements, waivers or reductions occur.
H Annualized
I Amount does not include the portfolio activity of any underlying mutual funds or exchange-traded funds (ETFs).
J Portfolio turnover rate excludes securities received or delivered in-kind.
See accompanying notes which are an integral part of the financial statements.
Fidelity Advisor Health Care Fund Class M
| | Six months ended (Unaudited) January 31, | Years endedJuly 31, | | | | |
| | 2021 | 2020 | 2019 | 2018 | 2017 | 2016 |
| Selected Per–Share Data | | | | | | |
| Net asset value, beginning of period | $56.62 | $45.75 | $46.89 | $39.25 | $35.95 | $42.68 |
| Income from Investment Operations | | | | | | |
| Net investment income (loss)A | (.24) | (.16) | (.18) | (.18) | (.13) | (.18) |
| Net realized and unrealized gain (loss) | 7.14 | 11.21 | 1.26 | 7.82 | 3.43 | (4.06) |
| Total from investment operations | 6.90 | 11.05 | 1.08 | 7.64 | 3.30 | (4.24) |
| Distributions from net investment income | (.02) | – | – | – | – | – |
| Distributions from net realized gain | (3.57) | (.18) | (2.22) | – | – | (2.49) |
| Total distributions | (3.59) | (.18) | (2.22) | – | – | (2.49) |
| Redemption fees added to paid in capitalA | – | – | – | – | –B | –B |
| Net asset value, end of period | $59.93 | $56.62 | $45.75 | $46.89 | $39.25 | $35.95 |
| Total ReturnC,D,E | 12.29% | 24.19% | 2.61% | 19.46% | 9.18% | (10.05)% |
| Ratios to Average Net AssetsF,G | | | | | | |
| Expenses before reductions | 1.24%H | 1.26% | 1.28% | 1.32% | 1.31% | 1.31% |
| Expenses net of fee waivers, if any | 1.24%H | 1.26% | 1.28% | 1.32% | 1.31% | 1.31% |
| Expenses net of all reductions | 1.24%H | 1.26% | 1.28% | 1.31% | 1.31% | 1.31% |
| Net investment income (loss) | (.81)%H | (.33)% | (.40)% | (.43)% | (.37)% | (.52)% |
| Supplemental Data | | | | | | |
| Net assets, end of period (000 omitted) | $380,501 | $349,280 | $306,758 | $298,061 | $269,332 | $293,556 |
| Portfolio turnover rateI | 43%H | 53%J | 45% | 81% | 64% | 67% |
A Calculated based on average shares outstanding during the period.
B Amount represents less than $.005 per share.
C Total returns for periods of less than one year are not annualized.
D Total returns would have been lower if certain expenses had not been reduced during the applicable periods shown.
E Total returns do not include the effect of the sales charges.
F Fees and expenses of any underlying mutual funds or exchange-traded funds (ETFs) are not included in the Fund's expense ratio. The Fund indirectly bears its proportionate share of these expenses. For additional expense information related to investments in Fidelity Central Funds, please refer to the "Investments in Fidelity Central Funds" note found in the Notes to Financial Statements section of the most recent Annual or Semi-Annual report.
G Expense ratios reflect operating expenses of the class. Expenses before reductions do not reflect amounts reimbursed, waived, or reduced through arrangements with the investment adviser, brokerage services, or other offset arrangements, if applicable, and do not represent the amount paid by the class during periods when reimbursements, waivers or reductions occur.
H Annualized
I Amount does not include the portfolio activity of any underlying mutual funds or exchange-traded funds (ETFs).
J Portfolio turnover rate excludes securities received or delivered in-kind.
See accompanying notes which are an integral part of the financial statements.
Fidelity Advisor Health Care Fund Class C
| | Six months ended (Unaudited) January 31, | Years endedJuly 31, | | | | |
| | 2021 | 2020 | 2019 | 2018 | 2017 | 2016 |
| Selected Per–Share Data | | | | | | |
| Net asset value, beginning of period | $47.63 | $38.70 | $40.21 | $33.82 | $31.12 | $37.45 |
| Income from Investment Operations | | | | | | |
| Net investment income (loss)A | (.33) | (.34) | (.34) | (.33) | (.26) | (.30) |
| Net realized and unrealized gain (loss) | 6.00 | 9.45 | 1.05 | 6.72 | 2.96 | (3.57) |
| Total from investment operations | 5.67 | 9.11 | .71 | 6.39 | 2.70 | (3.87) |
| Distributions from net realized gain | (3.36) | (.18) | (2.22) | – | – | (2.46) |
| Total distributions | (3.36) | (.18) | (2.22) | – | – | (2.46) |
| Redemption fees added to paid in capitalA | – | – | – | – | –B | –B |
| Net asset value, end of period | $49.94 | $47.63 | $38.70 | $40.21 | $33.82 | $31.12 |
| Total ReturnC,D,E | 12.02% | 23.58% | 2.10% | 18.89% | 8.68% | (10.50)% |
| Ratios to Average Net AssetsF,G | | | | | | |
| Expenses before reductions | 1.74%H | 1.76% | 1.77% | 1.80% | 1.79% | 1.79% |
| Expenses net of fee waivers, if any | 1.74%H | 1.76% | 1.77% | 1.80% | 1.79% | 1.79% |
| Expenses net of all reductions | 1.74%H | 1.75% | 1.77% | 1.79% | 1.79% | 1.79% |
| Net investment income (loss) | (1.31)%H | (.82)% | (.88)% | (.91)% | (.85)% | (1.00)% |
| Supplemental Data | | | | | | |
| Net assets, end of period (000 omitted) | $713,119 | $654,487 | $585,093 | $669,639 | $619,991 | $695,374 |
| Portfolio turnover rateI | 43%H | 53%J | 45% | 81% | 64% | 67% |
A Calculated based on average shares outstanding during the period.
B Amount represents less than $.005 per share.
C Total returns for periods of less than one year are not annualized.
D Total returns would have been lower if certain expenses had not been reduced during the applicable periods shown.
E Total returns do not include the effect of the contingent deferred sales charge.
F Fees and expenses of any underlying mutual funds or exchange-traded funds (ETFs) are not included in the Fund's expense ratio. The Fund indirectly bears its proportionate share of these expenses. For additional expense information related to investments in Fidelity Central Funds, please refer to the "Investments in Fidelity Central Funds" note found in the Notes to Financial Statements section of the most recent Annual or Semi-Annual report.
G Expense ratios reflect operating expenses of the class. Expenses before reductions do not reflect amounts reimbursed, waived, or reduced through arrangements with the investment adviser, brokerage services, or other offset arrangements, if applicable, and do not represent the amount paid by the class during periods when reimbursements, waivers or reductions occur.
H Annualized
I Amount does not include the portfolio activity of any underlying mutual funds or exchange-traded funds (ETFs).
J Portfolio turnover rate excludes securities received or delivered in-kind.
See accompanying notes which are an integral part of the financial statements.
Fidelity Advisor Health Care Fund Class I
| | Six months ended (Unaudited) January 31, | Years endedJuly 31, | | | | |
| | 2021 | 2020 | 2019 | 2018 | 2017 | 2016 |
| Selected Per–Share Data | | | | | | |
| Net asset value, beginning of period | $66.81 | $53.77 | $54.43 | $45.35 | $41.31 | $48.53 |
| Income from Investment Operations | | | | | | |
| Net investment income (loss)A | (.10) | .11 | .07 | .05 | .07 | –B |
| Net realized and unrealized gain (loss) | 8.44 | 13.22 | 1.49 | 9.06 | 3.97 | (4.62) |
| Total from investment operations | 8.34 | 13.33 | 1.56 | 9.11 | 4.04 | (4.62) |
| Distributions from net investment income | (.30) | – | – | – | – | – |
| Distributions from net realized gain | (3.69) | (.29) | (2.22) | (.03) | – | (2.60) |
| Total distributions | (3.99) | (.29) | (2.22) | (.03) | – | (2.60) |
| Redemption fees added to paid in capitalA | – | – | – | – | –B | –B |
| Net asset value, end of period | $71.16 | $66.81 | $53.77 | $54.43 | $45.35 | $41.31 |
| Total ReturnC,D | 12.59% | 24.84% | 3.14% | 20.09% | 9.78% | (9.60)% |
| Ratios to Average Net AssetsE,F | | | | | | |
| Expenses before reductions | .73%G | .74% | .76% | .79% | .78% | .78% |
| Expenses net of fee waivers, if any | .73%G | .74% | .76% | .79% | .78% | .78% |
| Expenses net of all reductions | .73%G | .74% | .76% | .78% | .78% | .78% |
| Net investment income (loss) | (.30)%G | .19% | .13% | .10% | .16% | .01%B |
| Supplemental Data | | | | | | |
| Net assets, end of period (000 omitted) | $3,174,507 | $2,546,323 | $1,783,417 | $1,316,804 | $911,005 | $658,848 |
| Portfolio turnover rateH | 43%G | 53%I | 45% | 81% | 64% | 67% |
A Calculated based on average shares outstanding during the period.
B Amount represents less than $.005 per share.
C Total returns for periods of less than one year are not annualized.
D Total returns would have been lower if certain expenses had not been reduced during the applicable periods shown.
E Fees and expenses of any underlying mutual funds or exchange-traded funds (ETFs) are not included in the Fund's expense ratio. The Fund indirectly bears its proportionate share of these expenses. For additional expense information related to investments in Fidelity Central Funds, please refer to the "Investments in Fidelity Central Funds" note found in the Notes to Financial Statements section of the most recent Annual or Semi-Annual report.
F Expense ratios reflect operating expenses of the class. Expenses before reductions do not reflect amounts reimbursed, waived, or reduced through arrangements with the investment adviser, brokerage services, or other offset arrangements, if applicable, and do not represent the amount paid by the class during periods when reimbursements, waivers or reductions occur.
G Annualized
H Amount does not include the portfolio activity of any underlying mutual funds or exchange-traded funds (ETFs).
I Portfolio turnover rate excludes securities received or delivered in-kind.
See accompanying notes which are an integral part of the financial statements.
Fidelity Advisor Health Care Fund Class Z
| | Six months ended (Unaudited) January 31, | Years endedJuly 31, | |
| | 2021 | 2020 | 2019 A |
| Selected Per–Share Data | | | |
| Net asset value, beginning of period | $66.88 | $53.84 | $57.87 |
| Income from Investment Operations | | | |
| Net investment income (loss)B | (.06) | .19 | .13 |
| Net realized and unrealized gain (loss) | 8.46 | 13.22 | (1.94)C |
| Total from investment operations | 8.40 | 13.41 | (1.81) |
| Distributions from net investment income | (.37) | – | – |
| Distributions from net realized gain | (3.73) | (.37) | (2.22) |
| Total distributions | (4.09)D | (.37) | (2.22) |
| Net asset value, end of period | $71.19 | $66.88 | $53.84 |
| Total ReturnE,F | 12.67% | 24.98% | (2.86)% |
| Ratios to Average Net AssetsG,H | | | |
| Expenses before reductions | .60%I | .61% | .62%I |
| Expenses net of fee waivers, if any | .60%I | .61% | .62%I |
| Expenses net of all reductions | .60%I | .61% | .62%I |
| Net investment income (loss) | (.18)%I | .32% | .30%I |
| Supplemental Data | | | |
| Net assets, end of period (000 omitted) | $764,990 | $610,481 | $238,873 |
| Portfolio turnover rateJ | 43%I | 53%K | 45% |
A For the period October 2, 2018 (commencement of sale of shares) to July 31, 2019.
B Calculated based on average shares outstanding during the period.
C The amount shown for a share outstanding does not correspond with the aggregate net gain (loss) on investments for the period due to the timing of sales and repurchases of shares in relation to fluctuating market values of the investments of the Fund.
D Total distributions per share do not sum due to rounding.
E Total returns for periods of less than one year are not annualized.
F Total returns would have been lower if certain expenses had not been reduced during the applicable periods shown.
G Fees and expenses of any underlying mutual funds or exchange-traded funds (ETFs) are not included in the Fund's expense ratio. The Fund indirectly bears its proportionate share of these expenses. For additional expense information related to investments in Fidelity Central Funds, please refer to the "Investments in Fidelity Central Funds" note found in the Notes to Financial Statements section of the most recent Annual or Semi-Annual report.
H Expense ratios reflect operating expenses of the class. Expenses before reductions do not reflect amounts reimbursed, waived, or reduced through arrangements with the investment adviser, brokerage services, or other offset arrangements, if applicable, and do not represent the amount paid by the class during periods when reimbursements, waivers or reductions occur.
I Annualized
J Amount does not include the portfolio activity of any underlying mutual funds or exchange-traded funds (ETFs).
K Portfolio turnover rate excludes securities received or delivered in-kind.
See accompanying notes which are an integral part of the financial statements.
Fidelity Advisor® Industrials Fund
Investment Summary (Unaudited)
Top Ten Stocks as of January 31, 2021
| | % of fund's net assets |
| Roper Technologies, Inc. | 10.2 |
| XPO Logistics, Inc. | 6.3 |
| Parker Hannifin Corp. | 6.2 |
| TransDigm Group, Inc. | 6.2 |
| AMETEK, Inc. | 6.2 |
| Honeywell International, Inc. | 5.8 |
| Colfax Corp. | 4.2 |
| TriNet Group, Inc. | 4.0 |
| Uber Technologies, Inc. | 4.0 |
| Woodward, Inc. | 3.8 |
| | 56.9 |
Top Industries (% of fund's net assets)
| As of January 31, 2021 |
| | Machinery | 20.3% |
| | Industrial Conglomerates | 18.8% |
| | Electrical Equipment | 14.6% |
| | Aerospace & Defense | 10.8% |
| | Road & Rail | 10.6% |
| | All Others* | 24.9% |
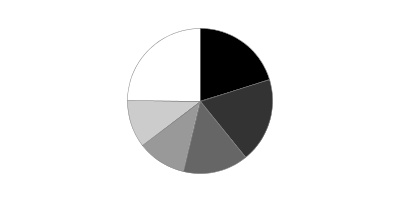
* Includes short-term investments and net other assets (liabilities).
Fidelity Advisor® Industrials Fund
Schedule of Investments January 31, 2021 (Unaudited)
Showing Percentage of Net Assets
| Common Stocks - 99.3% | | | |
| | | Shares | Value |
| Aerospace & Defense - 10.8% | | | |
| Aerospace & Defense - 10.8% | | | |
| Curtiss-Wright Corp. | | 1,100 | $114,169 |
| HEICO Corp. Class A | | 71,415 | 7,592,129 |
| Maxar Technologies, Inc. | | 55,200 | 2,311,224 |
| Teledyne Technologies, Inc. (a) | | 6,100 | 2,177,761 |
| Textron, Inc. | | 48,598 | 2,199,545 |
| The Boeing Co. | | 59,500 | 11,554,305 |
| TransDigm Group, Inc. | | 63,514 | 35,141,026 |
| | | | 61,090,159 |
| Air Freight & Logistics - 6.3% | | | |
| Air Freight & Logistics - 6.3% | | | |
| XPO Logistics, Inc. (a) | | 320,838 | 35,423,724 |
| Building Products - 5.4% | | | |
| Building Products - 5.4% | | | |
| Advanced Drain Systems, Inc. | | 57,400 | 4,734,352 |
| Carrier Global Corp. | | 48,300 | 1,859,550 |
| Johnson Controls International PLC | | 249,300 | 12,420,126 |
| Trane Technologies PLC | | 57,635 | 8,261,977 |
| Trex Co., Inc. (a) | | 38,500 | 3,533,145 |
| | | | 30,809,150 |
| Commercial Services & Supplies - 2.3% | | | |
| Environmental & Facility Services - 2.3% | | | |
| Tetra Tech, Inc. (b) | | 107,900 | 13,117,403 |
| Construction & Engineering - 0.4% | | | |
| Construction & Engineering - 0.4% | | | |
| AECOM (a) | | 23,600 | 1,182,360 |
| Quanta Services, Inc. | | 14,800 | 1,042,956 |
| | | | 2,225,316 |
| Electrical Equipment - 14.6% | | | |
| Electrical Components & Equipment - 14.6% | | | |
| AMETEK, Inc. | | 309,534 | 35,057,821 |
| Generac Holdings, Inc. (a) | | 26,100 | 6,431,562 |
| Plug Power, Inc. (a)(b) | | 253,300 | 16,000,961 |
| Regal Beloit Corp. | | 133,799 | 16,789,099 |
| Rockwell Automation, Inc. | | 3,800 | 944,414 |
| Vertiv Holdings Co. | | 375,500 | 7,555,060 |
| | | | 82,778,917 |
| Industrial Conglomerates - 18.8% | | | |
| Industrial Conglomerates - 18.8% | | | |
| General Electric Co. | | 1,497,200 | 15,990,096 |
| Honeywell International, Inc. | | 168,294 | 32,879,599 |
| Roper Technologies, Inc. | | 146,132 | 57,416,725 |
| | | | 106,286,420 |
| Machinery - 20.3% | | | |
| Industrial Machinery - 20.3% | | | |
| Chart Industries, Inc. (a) | | 22,100 | 2,654,431 |
| Colfax Corp. (a) | | 641,443 | 23,810,364 |
| Evoqua Water Technologies Corp. (a) | | 49,000 | 1,335,250 |
| Fortive Corp. | | 192,775 | 12,738,572 |
| Ingersoll Rand, Inc. (a) | | 198,100 | 8,288,504 |
| ITT, Inc. | | 94,151 | 7,034,021 |
| Parker Hannifin Corp. | | 133,400 | 35,298,974 |
| Pentair PLC | | 39,400 | 2,145,724 |
| RBC Bearings, Inc. (a) | | 3,400 | 568,922 |
| Woodward, Inc. | | 190,117 | 21,283,598 |
| | | | 115,158,360 |
| Professional Services - 7.0% | | | |
| Human Resource & Employment Services - 4.0% | | | |
| TriNet Group, Inc. (a) | | 306,031 | 22,679,957 |
| Research & Consulting Services - 3.0% | | | |
| Clarivate Analytics PLC (a) | | 90,100 | 2,607,494 |
| CoreLogic, Inc. | | 94,700 | 7,129,963 |
| CoStar Group, Inc. (a) | | 7,700 | 6,927,767 |
| | | | 16,665,224 |
|
| TOTAL PROFESSIONAL SERVICES | | | 39,345,181 |
|
| Road & Rail - 10.6% | | | |
| Railroads - 6.2% | | | |
| CSX Corp. | | 10,595 | 908,574 |
| Kansas City Southern | | 53,984 | 10,940,937 |
| Norfolk Southern Corp. | | 63,691 | 15,070,564 |
| Union Pacific Corp. | | 41,679 | 8,230,352 |
| | | | 35,150,427 |
| Trucking - 4.4% | | | |
| Saia, Inc. (a) | | 14,000 | 2,474,500 |
| Uber Technologies, Inc. (a) | | 443,300 | 22,577,269 |
| | | | 25,051,769 |
|
| TOTAL ROAD & RAIL | | | 60,202,196 |
|
| Trading Companies & Distributors - 2.8% | | | |
| Trading Companies & Distributors - 2.8% | | | |
| Fastenal Co. | | 53,400 | 2,434,506 |
| United Rentals, Inc. (a) | | 54,200 | 13,171,142 |
| | | | 15,605,648 |
| TOTAL COMMON STOCKS | | | |
| (Cost $464,712,701) | | | 562,042,474 |
|
| Money Market Funds - 0.9% | | | |
| Fidelity Cash Central Fund 0.09% (c) | | 4,192,222 | 4,193,061 |
| Fidelity Securities Lending Cash Central Fund 0.09% (c)(d) | | 941,231 | 941,325 |
| TOTAL MONEY MARKET FUNDS | | | |
| (Cost $5,134,386) | | | 5,134,386 |
| TOTAL INVESTMENT IN SECURITIES - 100.2% | | | |
| (Cost $469,847,087) | | | 567,176,860 |
| NET OTHER ASSETS (LIABILITIES) - (0.2)% | | | (1,340,335) |
| NET ASSETS - 100% | | | $565,836,525 |
Legend
(a) Non-income producing
(b) Security or a portion of the security is on loan at period end.
(c) Affiliated fund that is generally available only to investment companies and other accounts managed by Fidelity Investments. The rate quoted is the annualized seven-day yield of the fund at period end. A complete unaudited listing of the fund's holdings as of its most recent quarter end is available upon request. In addition, each Fidelity Central Fund's financial statements are available on the SEC's website or upon request.
(d) Investment made with cash collateral received from securities on loan.
Affiliated Central Funds
Information regarding fiscal year to date income earned by the Fund from investments in Fidelity Central Funds is as follows:
| Fund | Income earned |
| Fidelity Cash Central Fund | $2,307 |
| Fidelity Securities Lending Cash Central Fund | 507 |
| Total | $2,814 |
Amounts in the income column in the above table include any capital gain distributions from underlying funds, which are presented in the corresponding line-item in the Statement of Operations, if applicable. Amount for Fidelity Securities Lending Cash Central Fund represents the income earned on investing cash collateral, less rebates paid to borrowers and any lending agent fees associated with the loan, plus any premium payments received for lending certain types of securities.
Investment Valuation
The following is a summary of the inputs used, as of January 31, 2021, involving the Fund's assets and liabilities carried at fair value. The inputs or methodology used for valuing securities may not be an indication of the risk associated with investing in those securities. For more information on valuation inputs, and their aggregation into the levels used below, please refer to the Investment Valuation section in the accompanying Notes to Financial Statements.
| | Valuation Inputs at Reporting Date: |
| Description | Total | Level 1 | Level 2 | Level 3 |
| Investments in Securities: | | | | |
| Common Stocks | $562,042,474 | $562,042,474 | $-- | $-- |
| Money Market Funds | 5,134,386 | 5,134,386 | -- | -- |
| Total Investments in Securities: | $567,176,860 | $567,176,860 | $-- | $-- |
See accompanying notes which are an integral part of the financial statements.
Fidelity Advisor® Industrials Fund
Financial Statements
Statement of Assets and Liabilities
| | | January 31, 2021 (Unaudited) |
| Assets | | |
Investment in securities, at value (including securities loaned of $884,367) — See accompanying schedule:
Unaffiliated issuers (cost $464,712,701) | $562,042,474 | |
| Fidelity Central Funds (cost $5,134,386) | 5,134,386 | |
| Total Investment in Securities (cost $469,847,087) | | $567,176,860 |
| Receivable for investments sold | | 19,160,128 |
| Receivable for fund shares sold | | 631,221 |
| Dividends receivable | | 21,348 |
| Distributions receivable from Fidelity Central Funds | | 784 |
| Prepaid expenses | | 5,011 |
| Other receivables | | 5,691 |
| Total assets | | 587,001,043 |
| Liabilities | | |
| Payable for investments purchased | $18,323,109 | |
| Payable for fund shares redeemed | 1,380,497 | |
| Accrued management fee | 264,690 | |
| Distribution and service plan fees payable | 121,404 | |
| Other affiliated payables | 102,286 | |
| Other payables and accrued expenses | 31,207 | |
| Collateral on securities loaned | 941,325 | |
| Total liabilities | | 21,164,518 |
| Net Assets | | $565,836,525 |
| Net Assets consist of: | | |
| Paid in capital | | $417,381,060 |
| Total accumulated earnings (loss) | | 148,455,465 |
| Net Assets | | $565,836,525 |
| Net Asset Value and Maximum Offering Price | | |
| Class A: | | |
| Net Asset Value and redemption price per share ($219,984,510 ÷ 5,627,541 shares)(a) | | $39.09 |
| Maximum offering price per share (100/94.25 of $39.09) | | $41.47 |
| Class M: | | |
| Net Asset Value and redemption price per share ($50,736,830 ÷ 1,335,103 shares)(a) | | $38.00 |
| Maximum offering price per share (100/96.50 of $38.00) | | $39.38 |
| Class C: | | |
| Net Asset Value and offering price per share ($54,919,474 ÷ 1,618,709 shares)(a) | | $33.93 |
| Class I: | | |
| Net Asset Value, offering price and redemption price per share ($195,972,141 ÷ 4,710,257 shares) | | $41.61 |
| Class Z: | | |
| Net Asset Value, offering price and redemption price per share ($44,223,570 ÷ 1,064,281 shares) | | $41.55 |
(a) Redemption price per share is equal to net asset value less any applicable contingent deferred sales charge.
See accompanying notes which are an integral part of the financial statements.
Statement of Operations
| | | Six months ended January 31, 2021 (Unaudited) |
| Investment Income | | |
| Dividends | | $1,722,467 |
| Income from Fidelity Central Funds (including $507 from security lending) | | 2,814 |
| Total income | | 1,725,281 |
| Expenses | | |
| Management fee | $1,419,400 | |
| Transfer agent fees | 472,343 | |
| Distribution and service plan fees | 690,561 | |
| Accounting fees | 102,120 | |
| Custodian fees and expenses | 4,915 | |
| Independent trustees' fees and expenses | 1,227 | |
| Registration fees | 72,153 | |
| Audit | 27,404 | |
| Legal | 2,275 | |
| Miscellaneous | 1,600 | |
| Total expenses before reductions | 2,793,998 | |
| Expense reductions | (3,700) | |
| Total expenses after reductions | | 2,790,298 |
| Net investment income (loss) | | (1,065,017) |
| Realized and Unrealized Gain (Loss) | | |
| Net realized gain (loss) on: | | |
| Investment securities: | | |
| Unaffiliated issuers | 70,712,900 | |
| Fidelity Central Funds | (177) | |
| Total net realized gain (loss) | | 70,712,723 |
| Change in net unrealized appreciation (depreciation) on investment securities | | 3,154,537 |
| Net gain (loss) | | 73,867,260 |
| Net increase (decrease) in net assets resulting from operations | | $72,802,243 |
See accompanying notes which are an integral part of the financial statements.
Statement of Changes in Net Assets
| | Six months ended January 31, 2021 (Unaudited) | Year ended July 31, 2020 |
| Increase (Decrease) in Net Assets | | |
| Operations | | |
| Net investment income (loss) | $(1,065,017) | $2,527,790 |
| Net realized gain (loss) | 70,712,723 | 953,381 |
| Change in net unrealized appreciation (depreciation) | 3,154,537 | (55,718,333) |
| Net increase (decrease) in net assets resulting from operations | 72,802,243 | (52,237,162) |
| Distributions to shareholders | (3,415,746) | (43,927,430) |
| Share transactions - net increase (decrease) | 44,716,949 | (102,963,693) |
| Total increase (decrease) in net assets | 114,103,446 | (199,128,285) |
| Net Assets | | |
| Beginning of period | 451,733,079 | 650,861,364 |
| End of period | $565,836,525 | $451,733,079 |
See accompanying notes which are an integral part of the financial statements.
Financial Highlights
Fidelity Advisor Industrials Fund Class A
| | Six months ended (Unaudited) January 31, | Years endedJuly 31, | | | | |
| | 2021 | 2020 | 2019 | 2018 | 2017 | 2016 |
| Selected Per–Share Data | | | | | | |
| Net asset value, beginning of period | $33.85 | $38.95 | $42.62 | $37.89 | $35.52 | $37.06 |
| Income from Investment Operations | | | | | | |
| Net investment income (loss)A | (.08) | .18B | .24 | .13 | .19 | .15 |
| Net realized and unrealized gain (loss) | 5.56 | (2.46) | (.02) | 5.87 | 4.24 | 1.34 |
| Total from investment operations | 5.48 | (2.28) | .22 | 6.00 | 4.43 | 1.49 |
| Distributions from net investment income | – | (.25) | (.19) | (.10) | (.16) | (.14) |
| Distributions from net realized gain | (.24) | (2.57) | (3.70) | (1.17) | (1.90) | (2.89) |
| Total distributions | (.24) | (2.82) | (3.89) | (1.27) | (2.06) | (3.03) |
| Redemption fees added to paid in capitalA | – | – | – | – | –C | –C |
| Net asset value, end of period | $39.09 | $33.85 | $38.95 | $42.62 | $37.89 | $35.52 |
| Total ReturnD,E,F | 16.16% | (6.58)% | 2.06% | 15.97% | 12.62% | 5.04% |
| Ratios to Average Net AssetsG,H | | | | | | |
| Expenses before reductions | 1.05%I | 1.05% | 1.04% | 1.06% | 1.06% | 1.06% |
| Expenses net of fee waivers, if any | 1.05%I | 1.05% | 1.04% | 1.06% | 1.06% | 1.06% |
| Expenses net of all reductions | 1.05%I | 1.03% | 1.03% | 1.05% | 1.06% | 1.06% |
| Net investment income (loss) | (.40)%I | .49%B | .63% | .32% | .53% | .45% |
| Supplemental Data | | | | | | |
| Net assets, end of period (000 omitted) | $219,985 | $199,835 | $268,483 | $303,201 | $309,204 | $279,055 |
| Portfolio turnover rateJ | 179%I | 219%K | 125% | 61% | 57% | 53% |
A Calculated based on average shares outstanding during the period.
B Net investment income per share reflects one or more large, non-recurring dividend(s) which amounted to $.07 per share. Excluding such non-recurring dividend(s), the ratio of net investment income (loss) to average net assets would have been .29%.
C Amount represents less than $.005 per share.
D Total returns for periods of less than one year are not annualized.
E Total returns would have been lower if certain expenses had not been reduced during the applicable periods shown.
F Total returns do not include the effect of the sales charges.
G Fees and expenses of any underlying mutual funds or exchange-traded funds (ETFs) are not included in the Fund's expense ratio. The Fund indirectly bears its proportionate share of these expenses. For additional expense information related to investments in Fidelity Central Funds, please refer to the "Investments in Fidelity Central Funds" note found in the Notes to Financial Statements section of the most recent Annual or Semi-Annual report.
H Expense ratios reflect operating expenses of the class. Expenses before reductions do not reflect amounts reimbursed, waived, or reduced through arrangements with the investment adviser, brokerage services, or other offset arrangements, if applicable, and do not represent the amount paid by the class during periods when reimbursements, waivers or reductions occur.
I Annualized
J Amount does not include the portfolio activity of any underlying mutual funds or exchange-traded funds (ETFs).
K Portfolio turnover rate excludes securities received or delivered in-kind.
See accompanying notes which are an integral part of the financial statements.
Fidelity Advisor Industrials Fund Class M
| | Six months ended (Unaudited) January 31, | Years endedJuly 31, | | | | |
| | 2021 | 2020 | 2019 | 2018 | 2017 | 2016 |
| Selected Per–Share Data | | | | | | |
| Net asset value, beginning of period | $32.96 | $37.99 | $41.65 | $37.03 | $34.77 | $36.35 |
| Income from Investment Operations | | | | | | |
| Net investment income (loss)A | (.12) | .08B | .14 | .03 | .10 | .06 |
| Net realized and unrealized gain (loss) | 5.40 | (2.39) | (.03) | 5.74 | 4.14 | 1.31 |
| Total from investment operations | 5.28 | (2.31) | .11 | 5.77 | 4.24 | 1.37 |
| Distributions from net investment income | – | (.15) | (.07) | – | (.08) | (.06) |
| Distributions from net realized gain | (.24) | (2.57) | (3.70) | (1.15) | (1.90) | (2.89) |
| Total distributions | (.24) | (2.72) | (3.77) | (1.15) | (1.98) | (2.95) |
| Redemption fees added to paid in capitalA | – | – | – | – | –C | –C |
| Net asset value, end of period | $38.00 | $32.96 | $37.99 | $41.65 | $37.03 | $34.77 |
| Total ReturnD,E,F | 15.99% | (6.82)% | 1.78% | 15.70% | 12.33% | 4.74% |
| Ratios to Average Net AssetsG,H | | | | | | |
| Expenses before reductions | 1.31%I | 1.31% | 1.31% | 1.32% | 1.32% | 1.33% |
| Expenses net of fee waivers, if any | 1.31%I | 1.31% | 1.30% | 1.32% | 1.32% | 1.33% |
| Expenses net of all reductions | 1.31%I | 1.30% | 1.30% | 1.31% | 1.32% | 1.32% |
| Net investment income (loss) | (.67)%I | .23%B | .37% | .07% | .27% | .19% |
| Supplemental Data | | | | | | |
| Net assets, end of period (000 omitted) | $50,737 | $45,157 | $61,570 | $72,143 | $87,253 | $79,196 |
| Portfolio turnover rateJ | 179%I | 219%K | 125% | 61% | 57% | 53% |
A Calculated based on average shares outstanding during the period.
B Net investment income per share reflects one or more large, non-recurring dividend(s) which amounted to $.07 per share. Excluding such non-recurring dividend(s), the ratio of net investment income (loss) to average net assets would have been .03%.
C Amount represents less than $.005 per share.
D Total returns for periods of less than one year are not annualized.
E Total returns would have been lower if certain expenses had not been reduced during the applicable periods shown.
F Total returns do not include the effect of the sales charges.
G Fees and expenses of any underlying mutual funds or exchange-traded funds (ETFs) are not included in the Fund's expense ratio. The Fund indirectly bears its proportionate share of these expenses. For additional expense information related to investments in Fidelity Central Funds, please refer to the "Investments in Fidelity Central Funds" note found in the Notes to Financial Statements section of the most recent Annual or Semi-Annual report.
H Expense ratios reflect operating expenses of the class. Expenses before reductions do not reflect amounts reimbursed, waived, or reduced through arrangements with the investment adviser, brokerage services, or other offset arrangements, if applicable, and do not represent the amount paid by the class during periods when reimbursements, waivers or reductions occur.
I Annualized
J Amount does not include the portfolio activity of any underlying mutual funds or exchange-traded funds (ETFs).
K Portfolio turnover rate excludes securities received or delivered in-kind.
See accompanying notes which are an integral part of the financial statements.
Fidelity Advisor Industrials Fund Class C
| | Six months ended (Unaudited) January 31, | Years endedJuly 31, | | | | |
| | 2021 | 2020 | 2019 | 2018 | 2017 | 2016 |
| Selected Per–Share Data | | | | | | |
| Net asset value, beginning of period | $29.52 | $34.27 | $38.09 | $34.09 | $32.24 | $34.02 |
| Income from Investment Operations | | | | | | |
| Net investment income (loss)A | (.20) | (.08)B | (.04) | (.16) | (.08) | (.09) |
| Net realized and unrealized gain (loss) | 4.85 | (2.15) | (.08) | 5.28 | 3.83 | 1.20 |
| Total from investment operations | 4.65 | (2.23) | (.12) | 5.12 | 3.75 | 1.11 |
| Distributions from net investment income | – | (.03) | – | – | – | – |
| Distributions from net realized gain | (.24) | (2.49) | (3.70) | (1.12) | (1.90) | (2.89) |
| Total distributions | (.24) | (2.52) | (3.70) | (1.12) | (1.90) | (2.89) |
| Redemption fees added to paid in capitalA | – | – | – | – | –C | –C |
| Net asset value, end of period | $33.93 | $29.52 | $34.27 | $38.09 | $34.09 | $32.24 |
| Total ReturnD,E,F | 15.72% | (7.27)% | 1.28% | 15.13% | 11.76% | 4.25% |
| Ratios to Average Net AssetsG,H | | | | | | |
| Expenses before reductions | 1.81%I | 1.81% | 1.80% | 1.82% | 1.82% | 1.82% |
| Expenses net of fee waivers, if any | 1.81%I | 1.81% | 1.80% | 1.82% | 1.82% | 1.82% |
| Expenses net of all reductions | 1.81%I | 1.79% | 1.79% | 1.81% | 1.81% | 1.81% |
| Net investment income (loss) | (1.16)%I | (.26)%B | (.12)% | (.43)% | (.23)% | (.30)% |
| Supplemental Data | | | | | | |
| Net assets, end of period (000 omitted) | $54,919 | $53,969 | $90,512 | $138,249 | $134,505 | $112,425 |
| Portfolio turnover rateJ | 179%I | 219%K | 125% | 61% | 57% | 53% |
A Calculated based on average shares outstanding during the period.
B Net investment income per share reflects one or more large, non-recurring dividend(s) which amounted to $.06 per share. Excluding such non-recurring dividend(s), the ratio of net investment income (loss) to average net assets would have been (.46) %.
C Amount represents less than $.005 per share.
D Total returns for periods of less than one year are not annualized.
E Total returns would have been lower if certain expenses had not been reduced during the applicable periods shown.
F Total returns do not include the effect of the contingent deferred sales charge.
G Fees and expenses of any underlying mutual funds or exchange-traded funds (ETFs) are not included in the Fund's expense ratio. The Fund indirectly bears its proportionate share of these expenses. For additional expense information related to investments in Fidelity Central Funds, please refer to the "Investments in Fidelity Central Funds" note found in the Notes to Financial Statements section of the most recent Annual or Semi-Annual report.
H Expense ratios reflect operating expenses of the class. Expenses before reductions do not reflect amounts reimbursed, waived, or reduced through arrangements with the investment adviser, brokerage services, or other offset arrangements, if applicable, and do not represent the amount paid by the class during periods when reimbursements, waivers or reductions occur.
I Annualized
J Amount does not include the portfolio activity of any underlying mutual funds or exchange-traded funds (ETFs).
K Portfolio turnover rate excludes securities received or delivered in-kind.
See accompanying notes which are an integral part of the financial statements.
Fidelity Advisor Industrials Fund Class I
| | Six months ended (Unaudited) January 31, | Years endedJuly 31, | | | | |
| | 2021 | 2020 | 2019 | 2018 | 2017 | 2016 |
| Selected Per–Share Data | | | | | | |
| Net asset value, beginning of period | $35.97 | $41.20 | $44.85 | $39.80 | $37.21 | $38.67 |
| Income from Investment Operations | | | | | | |
| Net investment income (loss)A | (.03) | .29B | .37 | .25 | .31 | .25 |
| Net realized and unrealized gain (loss) | 5.91 | (2.60) | (.02) | 6.18 | 4.44 | 1.42 |
| Total from investment operations | 5.88 | (2.31) | .35 | 6.43 | 4.75 | 1.67 |
| Distributions from net investment income | – | (.35) | (.30) | (.21) | (.25) | (.24) |
| Distributions from net realized gain | (.24) | (2.57) | (3.70) | (1.17) | (1.90) | (2.89) |
| Total distributions | (.24) | (2.92) | (4.00) | (1.38) | (2.16)C | (3.13) |
| Redemption fees added to paid in capitalA | – | – | – | – | –D | –D |
| Net asset value, end of period | $41.61 | $35.97 | $41.20 | $44.85 | $39.80 | $37.21 |
| Total ReturnE,F | 16.32% | (6.32)% | 2.31% | 16.30% | 12.91% | 5.33% |
| Ratios to Average Net AssetsG,H | | | | | | |
| Expenses before reductions | .78%I | .78% | .78% | .80% | .80% | .80% |
| Expenses net of fee waivers, if any | .78%I | .78% | .77% | .80% | .80% | .80% |
| Expenses net of all reductions | .78%I | .76% | .77% | .79% | .80% | .79% |
| Net investment income (loss) | (.13)%I | .76%B | .90% | .59% | .79% | .72% |
| Supplemental Data | | | | | | |
| Net assets, end of period (000 omitted) | $195,972 | $123,603 | $219,218 | $320,902 | $284,727 | $133,176 |
| Portfolio turnover rateJ | 179%I | 219%K | 125% | 61% | 57% | 53% |
A Calculated based on average shares outstanding during the period.
B Net investment income per share reflects one or more large, non-recurring dividend(s) which amounted to $.08 per share. Excluding such non-recurring dividend(s), the ratio of net investment income (loss) to average net assets would have been .56%.
C Total distributions per share do not sum due to rounding.
D Amount represents less than $.005 per share.
E Total returns for periods of less than one year are not annualized.
F Total returns would have been lower if certain expenses had not been reduced during the applicable periods shown.
G Fees and expenses of any underlying mutual funds or exchange-traded funds (ETFs) are not included in the Fund's expense ratio. The Fund indirectly bears its proportionate share of these expenses. For additional expense information related to investments in Fidelity Central Funds, please refer to the "Investments in Fidelity Central Funds" note found in the Notes to Financial Statements section of the most recent Annual or Semi-Annual report.
H Expense ratios reflect operating expenses of the class. Expenses before reductions do not reflect amounts reimbursed, waived, or reduced through arrangements with the investment adviser, brokerage services, or other offset arrangements, if applicable, and do not represent the amount paid by the class during periods when reimbursements, waivers or reductions occur.
I Annualized
J Amount does not include the portfolio activity of any underlying mutual funds or exchange-traded funds (ETFs).
K Portfolio turnover rate excludes securities received or delivered in-kind.
See accompanying notes which are an integral part of the financial statements.
Fidelity Advisor Industrials Fund Class Z
| | Six months ended (Unaudited) January 31, | Years endedJuly 31, | |
| | 2021 | 2020 | 2019 A |
| Selected Per–Share Data | | | |
| Net asset value, beginning of period | $35.90 | $41.15 | $46.84 |
| Income from Investment Operations | | | |
| Net investment income (loss)B | –C | .34D | .34 |
| Net realized and unrealized gain (loss) | 5.89 | (2.60) | (1.94) |
| Total from investment operations | 5.89 | (2.26) | (1.60) |
| Distributions from net investment income | – | (.42) | (.39) |
| Distributions from net realized gain | (.24) | (2.57) | (3.70) |
| Total distributions | (.24) | (2.99) | (4.09) |
| Net asset value, end of period | $41.55 | $35.90 | $41.15 |
| Total ReturnE,F | 16.38% | (6.21)% | (1.92)% |
| Ratios to Average Net AssetsG,H | | | |
| Expenses before reductions | .65%I | .65% | .64%I |
| Expenses net of fee waivers, if any | .65%I | .65% | .64%I |
| Expenses net of all reductions | .65%I | .63% | .64%I |
| Net investment income (loss) | (.01)%I | .89% | 1.04%I |
| Supplemental Data | | | |
| Net assets, end of period (000 omitted) | $44,224 | $29,168 | $11,077 |
| Portfolio turnover rateJ | 179%I | 219%K | 125% |
A For the period October 2, 2018 (commencement of sale of shares) to July 31, 2019.
B Calculated based on average shares outstanding during the period.
C Amount represents less than $.005 per share.
D Net investment income per share reflects one or more large, non-recurring dividend(s) which amounted to $.08 per share. Excluding such non-recurring dividend(s), the ratio of net investment income (loss) to average net assets would have been .69%.
E Total returns for periods of less than one year are not annualized.
F Total returns would have been lower if certain expenses had not been reduced during the applicable periods shown.
G Fees and expenses of any underlying mutual funds or exchange-traded funds (ETFs) are not included in the Fund's expense ratio. The Fund indirectly bears its proportionate share of these expenses. For additional expense information related to investments in Fidelity Central Funds, please refer to the "Investments in Fidelity Central Funds" note found in the Notes to Financial Statements section of the most recent Annual or Semi-Annual report.
H Expense ratios reflect operating expenses of the class. Expenses before reductions do not reflect amounts reimbursed, waived, or reduced through arrangements with the investment adviser, brokerage services, or other offset arrangements, if applicable, and do not represent the amount paid by the class during periods when reimbursements, waivers or reductions occur.
I Annualized
J Amount does not include the portfolio activity of any underlying mutual funds or exchange-traded funds (ETFs).
K Portfolio turnover rate excludes securities received or delivered in-kind.
See accompanying notes which are an integral part of the financial statements.
Fidelity Advisor® Semiconductors Fund
Investment Summary (Unaudited)
Top Ten Stocks as of January 31, 2021
| | % of fund's net assets |
| NVIDIA Corp. | 18.5 |
| Qualcomm, Inc. | 6.5 |
| Micron Technology, Inc. | 6.3 |
| NXP Semiconductors NV | 6.2 |
| Intel Corp. | 5.9 |
| Marvell Technology Group Ltd. | 5.5 |
| Broadcom, Inc. | 4.6 |
| Microchip Technology, Inc. | 4.6 |
| Lam Research Corp. | 4.5 |
| ON Semiconductor Corp. | 4.4 |
| | 67.0 |
Top Industries (% of fund's net assets)
| As of January 31, 2021 |
| | Semiconductors & Semiconductor Equipment | 92.6% |
| | Electronic Equipment & Components | 3.4% |
| | Technology Hardware, Storage & Peripherals | 0.8% |
| | All Others* | 3.2% |

* Includes short-term investments and net other assets (liabilities).
Fidelity Advisor® Semiconductors Fund
Schedule of Investments January 31, 2021 (Unaudited)
Showing Percentage of Net Assets
| Common Stocks - 96.7% | | | |
| | | Shares | Value |
| Electronic Equipment & Components - 3.4% | | | |
| Electronic Components - 0.9% | | | |
| II-VI, Inc. (a)(b) | | 54,600 | $4,590,222 |
| Electronic Manufacturing Services - 2.5% | | | |
| Flex Ltd. (a) | | 176,327 | 3,110,408 |
| Jabil, Inc. | | 157,576 | 6,518,919 |
| TTM Technologies, Inc. (a) | | 233,190 | 3,127,078 |
| | | | 12,756,405 |
|
| TOTAL ELECTRONIC EQUIPMENT & COMPONENTS | | | 17,346,627 |
|
| Semiconductors & Semiconductor Equipment - 92.5% | | | |
| Semiconductor Equipment - 10.6% | | | |
| Advanced Energy Industries, Inc. | | 39,864 | 4,089,249 |
| Applied Materials, Inc. | | 118,600 | 11,466,248 |
| Enphase Energy, Inc. (a) | | 45,500 | 8,296,925 |
| KLA Corp. | | 20,800 | 5,825,456 |
| Lam Research Corp. | | 46,546 | 22,525,937 |
| SolarEdge Technologies, Inc. (a) | | 4,600 | 1,326,318 |
| | | | 53,530,133 |
| Semiconductors - 81.9% | | | |
| Advanced Micro Devices, Inc. (a) | | 218,700 | 18,729,468 |
| Alpha & Omega Semiconductor Ltd. (a) | | 63,000 | 1,810,620 |
| Ambarella, Inc. (a) | | 8,600 | 811,496 |
| Analog Devices, Inc. | | 41,870 | 6,168,707 |
| ASE Technology Holding Co. Ltd. ADR | | 119,500 | 795,870 |
| Broadcom, Inc. | | 51,125 | 23,031,813 |
| Cirrus Logic, Inc. (a) | | 115,528 | 10,823,818 |
| Dialog Semiconductor PLC (a) | | 16,100 | 1,015,593 |
| Diodes, Inc. (a) | | 61,900 | 4,381,282 |
| Inphi Corp. (a) | | 36,000 | 6,069,960 |
| Intel Corp. | | 534,264 | 29,656,995 |
| MACOM Technology Solutions Holdings, Inc. (a) | | 59,100 | 3,360,426 |
| Marvell Technology Group Ltd. | | 542,387 | 27,911,235 |
| MaxLinear, Inc. Class A (a) | | 70,349 | 2,208,255 |
| Microchip Technology, Inc. | | 169,201 | 23,029,948 |
| Micron Technology, Inc. (a) | | 402,112 | 31,473,306 |
| NVIDIA Corp. | | 179,023 | 93,018,560 |
| NXP Semiconductors NV | | 195,812 | 31,421,952 |
| ON Semiconductor Corp. (a) | | 647,306 | 22,325,584 |
| Qualcomm, Inc. | | 210,726 | 32,932,259 |
| Semtech Corp. (a) | | 35,000 | 2,483,250 |
| Skyworks Solutions, Inc. | | 3,950 | 668,538 |
| SMART Global Holdings, Inc. (a) | | 52,800 | 1,961,520 |
| Synaptics, Inc. (a) | | 22,300 | 2,212,606 |
| Texas Instruments, Inc. | | 94,900 | 15,723,981 |
| Universal Display Corp. | | 24,671 | 5,694,560 |
| Xilinx, Inc. | | 95,350 | 12,449,850 |
| | | | 412,171,452 |
|
| TOTAL SEMICONDUCTORS & SEMICONDUCTOR EQUIPMENT | | | 465,701,585 |
|
| Technology Hardware, Storage & Peripherals - 0.8% | | | |
| Technology Hardware, Storage & Peripherals - 0.8% | | | |
| Samsung Electronics Co. Ltd. | | 56,390 | 4,134,497 |
| TOTAL COMMON STOCKS | | | |
| (Cost $270,880,700) | | | 487,182,709 |
| | | Principal Amount | Value |
|
| Convertible Bonds - 0.1% | | | |
| Semiconductors & Semiconductor Equipment - 0.1% | | | |
| Semiconductors - 0.1% | | | |
| SMART Global Holdings, Inc. 2.25% 2/15/26 (c) | | | |
| (Cost $310,000) | | 310,000 | 358,050 |
| | | Shares | Value |
|
| Money Market Funds - 2.6% | | | |
| Fidelity Cash Central Fund 0.09% (d) | | 10,366,123 | 10,368,197 |
| Fidelity Securities Lending Cash Central Fund 0.09% (d)(e) | | 2,651,935 | 2,652,200 |
| TOTAL MONEY MARKET FUNDS | | | |
| (Cost $13,020,397) | | | 13,020,397 |
| TOTAL INVESTMENT IN SECURITIES - 99.4% | | | |
| (Cost $284,211,097) | | | 500,561,156 |
| NET OTHER ASSETS (LIABILITIES) - 0.6% | | | 3,104,607 |
| NET ASSETS - 100% | | | $503,665,763 |
Legend
(a) Non-income producing
(b) Security or a portion of the security is on loan at period end.
(c) Security exempt from registration under Rule 144A of the Securities Act of 1933. These securities may be resold in transactions exempt from registration, normally to qualified institutional buyers. At the end of the period, the value of these securities amounted to $358,050 or 0.1% of net assets.
(d) Affiliated fund that is generally available only to investment companies and other accounts managed by Fidelity Investments. The rate quoted is the annualized seven-day yield of the fund at period end. A complete unaudited listing of the fund's holdings as of its most recent quarter end is available upon request. In addition, each Fidelity Central Fund's financial statements are available on the SEC's website or upon request.
(e) Investment made with cash collateral received from securities on loan.
Affiliated Central Funds
Information regarding fiscal year to date income earned by the Fund from investments in Fidelity Central Funds is as follows:
| Fund | Income earned |
| Fidelity Cash Central Fund | $3,623 |
| Fidelity Securities Lending Cash Central Fund | 1,870 |
| Total | $5,493 |
Amounts in the income column in the above table include any capital gain distributions from underlying funds, which are presented in the corresponding line-item in the Statement of Operations, if applicable. Amount for Fidelity Securities Lending Cash Central Fund represents the income earned on investing cash collateral, less rebates paid to borrowers and any lending agent fees associated with the loan, plus any premium payments received for lending certain types of securities.
Investment Valuation
The following is a summary of the inputs used, as of January 31, 2021, involving the Fund's assets and liabilities carried at fair value. The inputs or methodology used for valuing securities may not be an indication of the risk associated with investing in those securities. For more information on valuation inputs, and their aggregation into the levels used below, please refer to the Investment Valuation section in the accompanying Notes to Financial Statements.
| | Valuation Inputs at Reporting Date: |
| Description | Total | Level 1 | Level 2 | Level 3 |
| Investments in Securities: | | | | |
| Common Stocks | $487,182,709 | $487,182,709 | $-- | $-- |
| Convertible Bonds | 358,050 | -- | 358,050 | -- |
| Money Market Funds | 13,020,397 | 13,020,397 | -- | -- |
| Total Investments in Securities: | $500,561,156 | $500,203,106 | $358,050 | $-- |
Other Information
Distribution of investments by country or territory of incorporation, as a percentage of Total Net Assets, is as follows (Unaudited):
| United States of America | 85.8% |
| Netherlands | 6.2% |
| Bermuda | 5.9% |
| Others (Individually Less Than 1%) | 2.1% |
| | 100.0% |
See accompanying notes which are an integral part of the financial statements.
Fidelity Advisor® Semiconductors Fund
Financial Statements
Statement of Assets and Liabilities
| | | January 31, 2021 (Unaudited) |
| Assets | | |
Investment in securities, at value (including securities loaned of $2,505,286) — See accompanying schedule:
Unaffiliated issuers (cost $271,190,700) | $487,540,759 | |
| Fidelity Central Funds (cost $13,020,397) | 13,020,397 | |
| Total Investment in Securities (cost $284,211,097) | | $500,561,156 |
| Foreign currency held at value (cost $508,770) | | 508,770 |
| Receivable for investments sold | | 408,282 |
| Receivable for fund shares sold | | 6,476,326 |
| Dividends receivable | | 137,245 |
| Interest receivable | | 3,216 |
| Distributions receivable from Fidelity Central Funds | | 1,040 |
| Prepaid expenses | | 1,881 |
| Other receivables | | 7,508 |
| Total assets | | 508,105,424 |
| Liabilities | | |
| Payable for investments purchased | $524,471 | |
| Payable for fund shares redeemed | 794,006 | |
| Accrued management fee | 224,919 | |
| Distribution and service plan fees payable | 122,271 | |
| Other affiliated payables | 85,496 | |
| Other payables and accrued expenses | 36,298 | |
| Collateral on securities loaned | 2,652,200 | |
| Total liabilities | | 4,439,661 |
| Net Assets | | $503,665,763 |
| Net Assets consist of: | | |
| Paid in capital | | $273,613,414 |
| Total accumulated earnings (loss) | | 230,052,349 |
| Net Assets | | $503,665,763 |
| Net Asset Value and Maximum Offering Price | | |
| Class A: | | |
| Net Asset Value and redemption price per share ($196,158,377 ÷ 5,066,805 shares)(a) | | $38.71 |
| Maximum offering price per share (100/94.25 of $38.71) | | $41.07 |
| Class M: | | |
| Net Asset Value and redemption price per share ($39,606,154 ÷ 1,080,840 shares)(a) | | $36.64 |
| Maximum offering price per share (100/96.50 of $36.64) | | $37.97 |
| Class C: | | |
| Net Asset Value and offering price per share ($72,438,746 ÷ 2,235,783 shares)(a) | | $32.40 |
| Class I: | | |
| Net Asset Value, offering price and redemption price per share ($181,756,132 ÷ 4,405,918 shares) | | $41.25 |
| Class Z: | | |
| Net Asset Value, offering price and redemption price per share ($13,706,354 ÷ 332,734 shares) | | $41.19 |
(a) Redemption price per share is equal to net asset value less any applicable contingent deferred sales charge.
See accompanying notes which are an integral part of the financial statements.
Statement of Operations
| | | Six months ended January 31, 2021 (Unaudited) |
| Investment Income | | |
| Dividends | | $2,081,253 |
| Interest | | 3,488 |
| Income from Fidelity Central Funds (including $1,870 from security lending) | | 5,493 |
| Total income | | 2,090,234 |
| Expenses | | |
| Management fee | $1,136,231 | |
| Transfer agent fees | 386,497 | |
| Distribution and service plan fees | 624,768 | |
| Accounting fees | 83,501 | |
| Custodian fees and expenses | 1,484 | |
| Independent trustees' fees and expenses | 964 | |
| Registration fees | 78,478 | |
| Audit | 25,336 | |
| Legal | 1,575 | |
| Miscellaneous | 6,226 | |
| Total expenses before reductions | 2,345,060 | |
| Expense reductions | (705) | |
| Total expenses after reductions | | 2,344,355 |
| Net investment income (loss) | | (254,121) |
| Realized and Unrealized Gain (Loss) | | |
| Net realized gain (loss) on: | | |
| Investment securities: | | |
| Unaffiliated issuers | 22,931,612 | |
| Fidelity Central Funds | (198) | |
| Foreign currency transactions | 1,791 | |
| Total net realized gain (loss) | | 22,933,205 |
| Change in net unrealized appreciation (depreciation) on: | | |
| Investment securities: | | |
| Unaffiliated issuers | 105,633,900 | |
| Fidelity Central Funds | (1,381) | |
| Assets and liabilities in foreign currencies | (386) | |
| Total change in net unrealized appreciation (depreciation) | | 105,632,133 |
| Net gain (loss) | | 128,565,338 |
| Net increase (decrease) in net assets resulting from operations | | $128,311,217 |
See accompanying notes which are an integral part of the financial statements.
Statement of Changes in Net Assets
| | Six months ended January 31, 2021 (Unaudited) | Year ended July 31, 2020 |
| Increase (Decrease) in Net Assets | | |
| Operations | | |
| Net investment income (loss) | $(254,121) | $1,525,542 |
| Net realized gain (loss) | 22,933,205 | 25,181,646 |
| Change in net unrealized appreciation (depreciation) | 105,632,133 | 51,353,113 |
| Net increase (decrease) in net assets resulting from operations | 128,311,217 | 78,060,301 |
| Distributions to shareholders | (20,932,422) | (3,496,901) |
| Share transactions - net increase (decrease) | 35,053,494 | 18,884,510 |
| Total increase (decrease) in net assets | 142,432,289 | 93,447,910 |
| Net Assets | | |
| Beginning of period | 361,233,474 | 267,785,564 |
| End of period | $503,665,763 | $361,233,474 |
See accompanying notes which are an integral part of the financial statements.
Financial Highlights
Fidelity Advisor Semiconductors Fund Class A
| | Six months ended (Unaudited) January 31, | Years endedJuly 31, | | | | |
| | 2021 | 2020 | 2019 | 2018 | 2017 | 2016 |
| Selected Per–Share Data | | | | | | |
| Net asset value, beginning of period | $29.79 | $23.03 | $25.06 | $21.57 | $16.50 | $15.29 |
| Income from Investment Operations | | | | | | |
| Net investment income (loss)A | (.02) | .14 | .15 | .02 | .11 | .09 |
| Net realized and unrealized gain (loss) | 10.65 | 6.90 | 1.25 | 5.73 | 5.03 | 2.67 |
| Total from investment operations | 10.63 | 7.04 | 1.40 | 5.75 | 5.14 | 2.76 |
| Distributions from net investment income | (.04) | (.07) | (.10) | (.05)B | (.05) | (.05) |
| Distributions from net realized gain | (1.67) | (.20) | (3.33) | (2.21)B | (.02) | (1.49) |
| Total distributions | (1.71) | (.28)C | (3.43) | (2.26) | (.07) | (1.55)C |
| Redemption fees added to paid in capitalA | – | – | – | –D | –D | –D |
| Net asset value, end of period | $38.71 | $29.79 | $23.03 | $25.06 | $21.57 | $16.50 |
| Total ReturnE,F,G | 35.85% | 30.65% | 10.18% | 27.35% | 31.21% | 20.46% |
| Ratios to Average Net AssetsH,I | | | | | | |
| Expenses before reductions | 1.06%J | 1.10% | 1.12% | 1.15% | 1.17% | 1.31% |
| Expenses net of fee waivers, if any | 1.06%J | 1.09% | 1.11% | 1.15% | 1.17% | 1.31% |
| Expenses net of all reductions | 1.06%J | 1.08% | 1.11% | 1.13% | 1.16% | 1.28% |
| Net investment income (loss) | (.09)%J | .53% | .70% | .09% | .55% | .61% |
| Supplemental Data | | | | | | |
| Net assets, end of period (000 omitted) | $196,158 | $140,072 | $98,459 | $97,883 | $72,040 | $34,066 |
| Portfolio turnover rateK | 53%J | 136% | 110% | 133% | 99% | 185% |
A Calculated based on average shares outstanding during the period.
B The amounts shown reflect certain reclassifications related to book to tax differences that were made in the year shown.
C Total distributions per share do not sum due to rounding.
D Amount represents less than $.005 per share.
E Total returns for periods of less than one year are not annualized.
F Total returns would have been lower if certain expenses had not been reduced during the applicable periods shown.
G Total returns do not include the effect of the sales charges.
H Fees and expenses of any underlying mutual funds or exchange-traded funds (ETFs) are not included in the Fund's expense ratio. The Fund indirectly bears its proportionate share of these expenses. For additional expense information related to investments in Fidelity Central Funds, please refer to the "Investments in Fidelity Central Funds" note found in the Notes to Financial Statements section of the most recent Annual or Semi-Annual report.
I Expense ratios reflect operating expenses of the class. Expenses before reductions do not reflect amounts reimbursed, waived, or reduced through arrangements with the investment adviser, brokerage services, or other offset arrangements, if applicable, and do not represent the amount paid by the class during periods when reimbursements, waivers or reductions occur.
J Annualized
K Amount does not include the portfolio activity of any underlying mutual funds or exchange-traded funds (ETFs).
See accompanying notes which are an integral part of the financial statements.
Fidelity Advisor Semiconductors Fund Class M
| | Six months ended (Unaudited) January 31, | Years endedJuly 31, | | | | |
| | 2021 | 2020 | 2019 | 2018 | 2017 | 2016 |
| Selected Per–Share Data | | | | | | |
| Net asset value, beginning of period | $28.25 | $21.89 | $24.04 | $20.77 | $15.91 | $14.81 |
| Income from Investment Operations | | | | | | |
| Net investment income (loss)A | (.06) | .06 | .08 | (.05) | .04 | .04 |
| Net realized and unrealized gain (loss) | 10.09 | 6.55 | 1.16 | 5.50 | 4.84 | 2.57 |
| Total from investment operations | 10.03 | 6.61 | 1.24 | 5.45 | 4.88 | 2.61 |
| Distributions from net investment income | – | (.05) | (.06) | –B | – | (.04) |
| Distributions from net realized gain | (1.64) | (.20) | (3.33) | (2.18)B | (.02) | (1.47) |
| Total distributions | (1.64) | (.25) | (3.39) | (2.18) | (.02) | (1.51) |
| Redemption fees added to paid in capitalA | – | – | – | –C | –C | –C |
| Net asset value, end of period | $36.64 | $28.25 | $21.89 | $24.04 | $20.77 | $15.91 |
| Total ReturnD,E,F | 35.66% | 30.28% | 9.84% | 26.95% | 30.72% | 20.01% |
| Ratios to Average Net AssetsG,H | | | | | | |
| Expenses before reductions | 1.33%I | 1.38% | 1.44% | 1.48% | 1.53% | 1.65% |
| Expenses net of fee waivers, if any | 1.33%I | 1.38% | 1.43% | 1.47% | 1.53% | 1.65% |
| Expenses net of all reductions | 1.33%I | 1.37% | 1.43% | 1.46% | 1.52% | 1.62% |
| Net investment income (loss) | (.36)%I | .24% | .38% | (.23)% | .20% | .27% |
| Supplemental Data | | | | | | |
| Net assets, end of period (000 omitted) | $39,606 | $29,262 | $22,587 | $21,830 | $16,127 | $9,766 |
| Portfolio turnover rateJ | 53%I | 136% | 110% | 133% | 99% | 185% |
A Calculated based on average shares outstanding during the period.
B The amounts shown reflect certain reclassifications related to book to tax differences that were made in the year shown.
C Amount represents less than $.005 per share.
D Total returns for periods of less than one year are not annualized.
E Total returns would have been lower if certain expenses had not been reduced during the applicable periods shown.
F Total returns do not include the effect of the sales charges.
G Fees and expenses of any underlying mutual funds or exchange-traded funds (ETFs) are not included in the Fund's expense ratio. The Fund indirectly bears its proportionate share of these expenses. For additional expense information related to investments in Fidelity Central Funds, please refer to the "Investments in Fidelity Central Funds" note found in the Notes to Financial Statements section of the most recent Annual or Semi-Annual report.
H Expense ratios reflect operating expenses of the class. Expenses before reductions do not reflect amounts reimbursed, waived, or reduced through arrangements with the investment adviser, brokerage services, or other offset arrangements, if applicable, and do not represent the amount paid by the class during periods when reimbursements, waivers or reductions occur.
I Annualized
J Amount does not include the portfolio activity of any underlying mutual funds or exchange-traded funds (ETFs).
See accompanying notes which are an integral part of the financial statements.
Fidelity Advisor Semiconductors Fund Class C
| | Six months ended (Unaudited) January 31, | Years endedJuly 31, | | | | |
| | 2021 | 2020 | 2019 | 2018 | 2017 | 2016 |
| Selected Per–Share Data | | | | | | |
| Net asset value, beginning of period | $25.18 | $19.59 | $21.88 | $19.10 | $14.69 | $13.80 |
| Income from Investment Operations | | | | | | |
| Net investment income (loss)A | (.12) | (.05) | (.01) | (.14) | (.04) | (.02) |
| Net realized and unrealized gain (loss) | 8.97 | 5.86 | .98 | 5.05 | 4.47 | 2.37 |
| Total from investment operations | 8.85 | 5.81 | .97 | 4.91 | 4.43 | 2.35 |
| Distributions from net investment income | – | (.01) | – | – | – | (.02) |
| Distributions from net realized gain | (1.63) | (.20) | (3.26) | (2.13) | (.02) | (1.44) |
| Total distributions | (1.63) | (.22)B | (3.26) | (2.13) | (.02) | (1.46) |
| Redemption fees added to paid in capitalA | – | – | – | –C | –C | –C |
| Net asset value, end of period | $32.40 | $25.18 | $19.59 | $21.88 | $19.10 | $14.69 |
| Total ReturnD,E,F | 35.32% | 29.73% | 9.33% | 26.38% | 30.21% | 19.48% |
| Ratios to Average Net AssetsG,H | | | | | | |
| Expenses before reductions | 1.82%I | 1.85% | 1.87% | 1.91% | 1.95% | 2.08% |
| Expenses net of fee waivers, if any | 1.82%I | 1.85% | 1.87% | 1.91% | 1.95% | 2.08% |
| Expenses net of all reductions | 1.82%I | 1.83% | 1.87% | 1.89% | 1.94% | 2.05% |
| Net investment income (loss) | (.85)%I | (.23)% | (.06)% | (.67)% | (.23)% | (.16)% |
| Supplemental Data | | | | | | |
| Net assets, end of period (000 omitted) | $72,439 | $57,320 | $45,659 | $57,915 | $42,684 | $21,088 |
| Portfolio turnover rateJ | 53%I | 136% | 110% | 133% | 99% | 185% |
A Calculated based on average shares outstanding during the period.
B Total distributions per share do not sum due to rounding.
C Amount represents less than $.005 per share.
D Total returns for periods of less than one year are not annualized.
E Total returns would have been lower if certain expenses had not been reduced during the applicable periods shown.
F Total returns do not include the effect of the contingent deferred sales charge.
G Fees and expenses of any underlying mutual funds or exchange-traded funds (ETFs) are not included in the Fund's expense ratio. The Fund indirectly bears its proportionate share of these expenses. For additional expense information related to investments in Fidelity Central Funds, please refer to the "Investments in Fidelity Central Funds" note found in the Notes to Financial Statements section of the most recent Annual or Semi-Annual report.
H Expense ratios reflect operating expenses of the class. Expenses before reductions do not reflect amounts reimbursed, waived, or reduced through arrangements with the investment adviser, brokerage services, or other offset arrangements, if applicable, and do not represent the amount paid by the class during periods when reimbursements, waivers or reductions occur.
I Annualized
J Amount does not include the portfolio activity of any underlying mutual funds or exchange-traded funds (ETFs).
See accompanying notes which are an integral part of the financial statements.
Fidelity Advisor Semiconductors Fund Class I
| | Six months ended (Unaudited) January 31, | Years endedJuly 31, | | | | |
| | 2021 | 2020 | 2019 | 2018 | 2017 | 2016 |
| Selected Per–Share Data | | | | | | |
| Net asset value, beginning of period | $31.68 | $24.42 | $26.33 | $22.56 | $17.24 | $15.89 |
| Income from Investment Operations | | | | | | |
| Net investment income (loss)A | .03 | .22 | .23 | .10 | .17 | .14 |
| Net realized and unrealized gain (loss) | 11.33 | 7.34 | 1.35 | 5.99 | 5.26 | 2.79 |
| Total from investment operations | 11.36 | 7.56 | 1.58 | 6.09 | 5.43 | 2.93 |
| Distributions from net investment income | (.12) | (.10) | (.16) | (.11)B | (.09) | (.09) |
| Distributions from net realized gain | (1.67) | (.20) | (3.33) | (2.21)B | (.02) | (1.49) |
| Total distributions | (1.79) | (.30) | (3.49) | (2.32) | (.11) | (1.58) |
| Redemption fees added to paid in capitalA | – | – | – | –C | –C | –C |
| Net asset value, end of period | $41.25 | $31.68 | $24.42 | $26.33 | $22.56 | $17.24 |
| Total ReturnD,E | 36.02% | 31.08% | 10.46% | 27.74% | 31.62% | 20.85% |
| Ratios to Average Net AssetsF,G | | | | | | |
| Expenses before reductions | .79%H | .81% | .83% | .86% | .88% | .98% |
| Expenses net of fee waivers, if any | .79%H | .81% | .82% | .86% | .88% | .98% |
| Expenses net of all reductions | .79%H | .79% | .82% | .84% | .87% | .95% |
| Net investment income (loss) | .19%H | .81% | .98% | .38% | .84% | .94% |
| Supplemental Data | | | | | | |
| Net assets, end of period (000 omitted) | $181,756 | $126,660 | $98,451 | $140,362 | $91,052 | $25,827 |
| Portfolio turnover rateI | 53%H | 136% | 110% | 133% | 99% | 185% |
A Calculated based on average shares outstanding during the period.
B The amounts shown reflect certain reclassifications related to book to tax differences that were made in the year shown.
C Amount represents less than $.005 per share.
D Total returns for periods of less than one year are not annualized.
E Total returns would have been lower if certain expenses had not been reduced during the applicable periods shown.
F Fees and expenses of any underlying mutual funds or exchange-traded funds (ETFs) are not included in the Fund's expense ratio. The Fund indirectly bears its proportionate share of these expenses. For additional expense information related to investments in Fidelity Central Funds, please refer to the "Investments in Fidelity Central Funds" note found in the Notes to Financial Statements section of the most recent Annual or Semi-Annual report.
G Expense ratios reflect operating expenses of the class. Expenses before reductions do not reflect amounts reimbursed, waived, or reduced through arrangements with the investment adviser, brokerage services, or other offset arrangements, if applicable, and do not represent the amount paid by the class during periods when reimbursements, waivers or reductions occur.
H Annualized
I Amount does not include the portfolio activity of any underlying mutual funds or exchange-traded funds (ETFs).
See accompanying notes which are an integral part of the financial statements.
Fidelity Advisor Semiconductors Fund Class Z
| | Six months ended (Unaudited) January 31, | Years endedJuly 31, | |
| | 2021 | 2020 | 2019 A |
| Selected Per–Share Data | | | |
| Net asset value, beginning of period | $31.65 | $24.38 | $26.00 |
| Income from Investment Operations | | | |
| Net investment income (loss)B | .06 | .26 | .17 |
| Net realized and unrealized gain (loss) | 11.31 | 7.33 | 1.76 |
| Total from investment operations | 11.37 | 7.59 | 1.93 |
| Distributions from net investment income | (.16) | (.11) | (.22) |
| Distributions from net realized gain | (1.67) | (.20) | (3.33) |
| Total distributions | (1.83) | (.32)C | (3.55) |
| Net asset value, end of period | $41.19 | $31.65 | $24.38 |
| Total ReturnD,E | 36.10% | 31.22% | 12.03% |
| Ratios to Average Net AssetsF,G | | | |
| Expenses before reductions | .67%H | .68% | .69%H |
| Expenses net of fee waivers, if any | .67%H | .68% | .69%H |
| Expenses net of all reductions | .67%H | .66% | .68%H |
| Net investment income (loss) | .31%H | .94% | .91%H |
| Supplemental Data | | | |
| Net assets, end of period (000 omitted) | $13,706 | $7,920 | $2,629 |
| Portfolio turnover rateI | 53%H | 136% | 110% |
A For the period October 2, 2018 (commencement of sale of shares) to July 31, 2019.
B Calculated based on average shares outstanding during the period.
C Total distributions per share do not sum due to rounding.
D Total returns for periods of less than one year are not annualized.
E Total returns would have been lower if certain expenses had not been reduced during the applicable periods shown.
F Fees and expenses of any underlying mutual funds or exchange-traded funds (ETFs) are not included in the Fund's expense ratio. The Fund indirectly bears its proportionate share of these expenses. For additional expense information related to investments in Fidelity Central Funds, please refer to the "Investments in Fidelity Central Funds" note found in the Notes to Financial Statements section of the most recent Annual or Semi-Annual report.
G Expense ratios reflect operating expenses of the class. Expenses before reductions do not reflect amounts reimbursed, waived, or reduced through arrangements with the investment adviser, brokerage services, or other offset arrangements, if applicable, and do not represent the amount paid by the class during periods when reimbursements, waivers or reductions occur.
H Annualized
I Amount does not include the portfolio activity of any underlying mutual funds or exchange-traded funds (ETFs).
See accompanying notes which are an integral part of the financial statements.
Fidelity Advisor® Technology Fund
Investment Summary (Unaudited)
Top Ten Stocks as of January 31, 2021
| | % of fund's net assets |
| Apple, Inc. | 23.6 |
| Microsoft Corp. | 17.0 |
| NVIDIA Corp. | 4.1 |
| Salesforce.com, Inc. | 3.4 |
| Adobe, Inc. | 2.8 |
| Marvell Technology Group Ltd. | 2.7 |
| PayPal Holdings, Inc. | 2.3 |
| Micron Technology, Inc. | 2.2 |
| Cisco Systems, Inc. | 2.0 |
| NXP Semiconductors NV | 1.9 |
| | 62.0 |
Top Industries (% of fund's net assets)
| As of January 31, 2021 |
| | Software | 31.4% |
| | Technology Hardware, Storage & Peripherals | 24.7% |
| | Semiconductors & Semiconductor Equipment | 18.5% |
| | IT Services | 13.1% |
| | Communications Equipment | 3.1% |
| | All Others* | 9.2% |

* Includes short-term investments and net other assets (liabilities).
Fidelity Advisor® Technology Fund
Schedule of Investments January 31, 2021 (Unaudited)
Showing Percentage of Net Assets
| Common Stocks - 98.5% | | | |
| | | Shares | Value |
| Auto Components - 0.3% | | | |
| Auto Parts & Equipment - 0.3% | | | |
| QuantumScape Corp. Class A (a) | | 272,600 | 11,926,250 |
| Chemicals - 0.3% | | | |
| Commodity Chemicals - 0.3% | | | |
| LG Chemical Ltd. | | 16,570 | 13,586,218 |
| Communications Equipment - 3.1% | | | |
| Communications Equipment - 3.1% | | | |
| Cisco Systems, Inc. | | 1,931,600 | 86,110,728 |
| F5 Networks, Inc. (a) | | 239,200 | 46,871,240 |
| | | | 132,981,968 |
| Diversified Financial Services - 0.3% | | | |
| Other Diversified Financial Services - 0.3% | | | |
| Ant International Co. Ltd. Class C (a)(b)(c) | | 1,469,829 | 12,640,529 |
| Electronic Equipment & Components - 1.6% | | | |
| Electronic Components - 0.6% | | | |
| II-VI, Inc. (a)(d) | | 301,687 | 25,362,826 |
| Electronic Manufacturing Services - 1.0% | | | |
| Flex Ltd. (a) | | 2,396,500 | 42,274,260 |
|
| TOTAL ELECTRONIC EQUIPMENT & COMPONENTS | | | 67,637,086 |
|
| Entertainment - 0.5% | | | |
| Movies & Entertainment - 0.5% | | | |
| Netflix, Inc. (a) | | 40,366 | 21,490,455 |
| Interactive Media & Services - 0.6% | | | |
| Interactive Media & Services - 0.6% | | | |
| Facebook, Inc. Class A (a) | | 97,300 | 25,135,509 |
| Internet & Direct Marketing Retail - 1.4% | | | |
| Internet & Direct Marketing Retail - 1.4% | | | |
| Amazon.com, Inc. (a) | | 10,300 | 33,023,860 |
| MercadoLibre, Inc. (a) | | 14,200 | 25,269,042 |
| | | | 58,292,902 |
| IT Services - 13.0% | | | |
| Data Processing & Outsourced Services - 9.3% | | | |
| Fiserv, Inc. (a) | | 661,778 | 67,957,983 |
| Genpact Ltd. | | 862,800 | 33,027,984 |
| MasterCard, Inc. Class A | | 239,500 | 75,751,455 |
| PayPal Holdings, Inc. (a) | | 421,100 | 98,667,941 |
| Square, Inc. (a) | | 245,900 | 53,104,564 |
| Visa, Inc. Class A | | 358,916 | 69,360,517 |
| | | | 397,870,444 |
| Internet Services & Infrastructure - 3.2% | | | |
| GoDaddy, Inc. (a) | | 406,700 | 31,958,486 |
| Shopify, Inc. (a) | | 24,000 | 26,366,160 |
| Snowflake Computing, Inc.: | | | |
| Class B | | 1,495 | 386,947 |
| Class B (e) | | 498 | 135,680 |
| Twilio, Inc. Class A (a) | | 216,400 | 77,780,652 |
| | | | 136,627,925 |
| IT Consulting & Other Services - 0.5% | | | |
| Capgemini SA | | 143,500 | 20,810,259 |
|
| TOTAL IT SERVICES | | | 555,308,628 |
|
| Life Sciences Tools & Services - 0.0% | | | |
| Life Sciences Tools & Services - 0.0% | | | |
| JHL Biotech, Inc. (a)(b) | | 387,462 | 0 |
| Oil, Gas & Consumable Fuels - 0.7% | | | |
| Oil & Gas Refining & Marketing - 0.7% | | | |
| Reliance Industries Ltd. | | 1,218,700 | 30,809,559 |
| Reliance Industries Ltd. | | 80,346 | 1,066,796 |
| | | | 31,876,355 |
| Pharmaceuticals - 0.0% | | | |
| Pharmaceuticals - 0.0% | | | |
| Chime Biologics Ltd. (b) | | 387,462 | 201,802 |
| Road & Rail - 1.9% | | | |
| Trucking - 1.9% | | | |
| Lyft, Inc. (a) | | 544,742 | 24,219,229 |
| Uber Technologies, Inc. (a) | | 1,084,164 | 55,216,473 |
| | | | 79,435,702 |
| Semiconductors & Semiconductor Equipment - 18.5% | | | |
| Semiconductor Equipment - 2.3% | | | |
| ASML Holding NV (Netherlands) | | 41,400 | 22,101,557 |
| Lam Research Corp. | | 161,500 | 78,157,925 |
| | | | 100,259,482 |
| Semiconductors - 16.2% | | | |
| Advanced Micro Devices, Inc. (a) | | 334,800 | 28,672,272 |
| Inphi Corp. (a) | | 145,600 | 24,549,616 |
| Marvell Technology Group Ltd. | | 2,245,751 | 115,566,346 |
| Microchip Technology, Inc. | | 327,700 | 44,603,247 |
| Micron Technology, Inc. (a) | | 1,201,800 | 94,064,886 |
| NVIDIA Corp. | | 340,750 | 177,050,293 |
| NXP Semiconductors NV | | 518,300 | 83,171,601 |
| ON Semiconductor Corp. (a) | | 1,093,200 | 37,704,468 |
| Qualcomm, Inc. | | 267,850 | 41,859,598 |
| Taiwan Semiconductor Manufacturing Co. Ltd. | | 1,145,000 | 24,190,393 |
| Universal Display Corp. | | 85,159 | 19,656,400 |
| | | | 691,089,120 |
|
| TOTAL SEMICONDUCTORS & SEMICONDUCTOR EQUIPMENT | | | 791,348,602 |
|
| Software - 31.2% | | | |
| Application Software - 13.0% | | | |
| Adobe, Inc. (a) | | 260,916 | 119,700,433 |
| Autodesk, Inc. (a) | | 221,100 | 61,339,773 |
| HubSpot, Inc. (a) | | 103,900 | 38,671,580 |
| Intuit, Inc. | | 143,200 | 51,728,136 |
| Kuaishou Technology (a) | | 40,900 | 606,649 |
| Qualtrics International, Inc. | | 20,900 | 919,600 |
| Salesforce.com, Inc. (a) | | 645,639 | 145,630,333 |
| Workday, Inc. Class A (a) | | 282,300 | 64,231,719 |
| Zoom Video Communications, Inc. Class A (a) | | 198,464 | 73,842,500 |
| | | | 556,670,723 |
| Systems Software - 18.2% | | | |
| Microsoft Corp. | | 3,140,700 | 728,516,772 |
| Rapid7, Inc. (a) | | 275,900 | 23,953,638 |
| Tenable Holdings, Inc. (a) | | 580,400 | 28,723,996 |
| | | | 781,194,406 |
|
| TOTAL SOFTWARE | | | 1,337,865,129 |
|
| Technology Hardware, Storage & Peripherals - 24.7% | | | |
| Technology Hardware, Storage & Peripherals - 24.7% | | | |
| Apple, Inc. | | 7,663,516 | 1,011,277,573 |
| Pure Storage, Inc. Class A (a) | | 867,800 | 20,072,214 |
| Samsung Electronics Co. Ltd. | | 367,700 | 26,959,647 |
| | | | 1,058,309,434 |
| Wireless Telecommunication Services - 0.4% | | | |
| Wireless Telecommunication Services - 0.4% | | | |
| T-Mobile U.S., Inc. | | 149,800 | 18,886,784 |
| TOTAL COMMON STOCKS | | | |
| (Cost $2,284,926,819) | | | 4,216,923,353 |
|
| Convertible Preferred Stocks - 0.6% | | | |
| Electronic Equipment & Components - 0.2% | | | |
| Electronic Equipment & Instruments - 0.2% | | | |
| Enevate Corp. Series E (b)(c) | | 9,477,386 | 10,507,426 |
| Internet & Direct Marketing Retail - 0.1% | | | |
| Internet & Direct Marketing Retail - 0.1% | | | |
| Reddit, Inc. Series D (a)(b)(c) | | 94,300 | 5,343,981 |
| IT Services - 0.1% | | | |
| Internet Services & Infrastructure - 0.1% | | | |
| ByteDance Ltd. Series E1 (b)(c) | | 26,036 | 2,852,873 |
| Road & Rail - 0.0% | | | |
| Trucking - 0.0% | | | |
| Convoy, Inc. Series D (a)(b)(c) | | 81,762 | 1,348,255 |
| Software - 0.2% | | | |
| Application Software - 0.1% | | | |
| UiPath, Inc.: | | | |
| Series A1 (a)(b)(c) | | 28,893 | 1,799,334 |
| Series B1 (a)(b)(c) | | 1,440 | 89,677 |
| Series B2 (a)(b)(c) | | 7,167 | 446,330 |
| | | | 2,335,341 |
| Systems Software - 0.1% | | | |
| Nuvia, Inc. Series B (b)(c) | | 678,052 | 4,983,682 |
|
| TOTAL SOFTWARE | | | 7,319,023 |
|
| TOTAL CONVERTIBLE PREFERRED STOCKS | | | |
| (Cost $19,179,028) | | | 27,371,558 |
|
| Preferred Stocks - 0.1% | | | |
| Enevate Corp. 0% 1/29/23 (b)(c) | | | |
| (Cost $4,035,056) | | 4,035,056 | 4,035,056 |
|
| Money Market Funds - 0.1% | | | |
| Fidelity Securities Lending Cash Central Fund 0.09%(f)(g) | | | |
| (Cost $2,105,084) | | 2,104,874 | 2,105,084 |
| TOTAL INVESTMENT IN SECURITIES - 99.3% | | | |
| (Cost $2,310,245,987) | | | 4,250,435,051 |
| NET OTHER ASSETS (LIABILITIES) - 0.7% | | | 30,131,509 |
| NET ASSETS - 100% | | | $4,280,566,560 |
Legend
(a) Non-income producing
(b) Level 3 security
(c) Restricted securities (including private placements) - Investment in securities not registered under the Securities Act of 1933 (excluding 144A issues). At the end of the period, the value of restricted securities (excluding 144A issues) amounted to $44,047,143 or 1.0% of net assets.
(d) Security or a portion of the security is on loan at period end.
(e) Security exempt from registration under Rule 144A of the Securities Act of 1933. These securities may be resold in transactions exempt from registration, normally to qualified institutional buyers. At the end of the period, the value of these securities amounted to $135,680 or 0.0% of net assets.
(f) Investment made with cash collateral received from securities on loan.
(g) Affiliated fund that is generally available only to investment companies and other accounts managed by Fidelity Investments. The rate quoted is the annualized seven-day yield of the fund at period end. A complete unaudited listing of the fund's holdings as of its most recent quarter end is available upon request. In addition, each Fidelity Central Fund's financial statements are available on the SEC's website or upon request.
Additional information on each restricted holding is as follows:
| Security | Acquisition Date | Acquisition Cost |
| Ant International Co. Ltd. Class C | 5/16/18 | $8,245,741 |
| ByteDance Ltd. Series E1 | 11/18/20 | $2,852,873 |
| Convoy, Inc. Series D | 10/30/19 | $1,107,057 |
| Enevate Corp. Series E | 1/29/21 | $10,507,436 |
| Enevate Corp. 0% 1/29/23 | 1/29/21 | $4,035,056 |
| Nuvia, Inc. Series B | 9/18/20 | $2,174,748 |
| Reddit, Inc. Series D | 2/4/19 | $2,045,018 |
| UiPath, Inc. Series A1 | 6/14/19 | $378,996 |
| UiPath, Inc. Series B1 | 6/14/19 | $18,889 |
| UiPath, Inc. Series B2 | 6/14/19 | $94,011 |
Affiliated Central Funds
Information regarding fiscal year to date income earned by the Fund from investments in Fidelity Central Funds is as follows:
| Fund | Income earned |
| Fidelity Cash Central Fund | $20,524 |
| Fidelity Securities Lending Cash Central Fund | 14,749 |
| Total | $35,273 |
Amounts in the income column in the above table include any capital gain distributions from underlying funds, which are presented in the corresponding line-item in the Statement of Operations, if applicable. Amount for Fidelity Securities Lending Cash Central Fund represents the income earned on investing cash collateral, less rebates paid to borrowers and any lending agent fees associated with the loan, plus any premium payments received for lending certain types of securities.
Investment Valuation
The following is a summary of the inputs used, as of January 31, 2021, involving the Fund's assets and liabilities carried at fair value. The inputs or methodology used for valuing securities may not be an indication of the risk associated with investing in those securities. For more information on valuation inputs, and their aggregation into the levels used below, please refer to the Investment Valuation section in the accompanying Notes to Financial Statements.
| | Valuation Inputs at Reporting Date: |
| Description | Total | Level 1 | Level 2 | Level 3 |
| Investments in Securities: | | | | |
| Common Stocks | $4,216,923,353 | $4,156,795,476 | $47,285,546 | $12,842,331 |
| Convertible Preferred Stocks | 27,371,558 | -- | -- | 27,371,558 |
| Money Market Funds | 2,105,084 | 2,105,084 | -- | -- |
| Preferred Securities | 4,035,056 | -- | -- | 4,035,056 |
| Total Investments in Securities: | $4,250,435,051 | $4,158,900,560 | $47,285,546 | $44,248,945 |
The following is a reconciliation of Investments in Securities for which Level 3 inputs were used in determining value:
| Investments in Securities: | |
| Beginning Balance | $22,141,610 |
| Total Realized Gain (Loss) | (10,626) |
| Total Unrealized Gain (Loss) | 2,625,117 |
| Cost of Purchases | 19,570,113 |
| Proceeds of Sales | -- |
| Amortization/Accretion | -- |
| Transfers in to Level 3 | -- |
| Transfers out of Level 3 | (77,269) |
| Ending Balance | $44,248,945 |
| The change in unrealized gain (loss) for the period attributable to Level 3 securities held at January 31, 2021 | $2,614,491 |
The information used in the above reconciliations represents fiscal year to date activity for any Investments in Securities identified as using Level 3 inputs at either the beginning or the end of the current fiscal period. Cost of purchases and proceeds of sales may include securities received and/or delivered through in-kind transactions. Transfers in or out of Level 3 represent the beginning value of any Security or Instrument where a change in the pricing level occurred from the beginning to the end of the period. The cost of purchases and the proceeds of sales may include securities received or delivered through corporate actions or exchanges. Realized and unrealized gains (losses) disclosed in the reconciliations are included in Net Gain (Loss) on the Fund's Statement of Operations.
Other Information
Distribution of investments by country or territory of incorporation, as a percentage of Total Net Assets, is as follows (Unaudited):
| United States of America | 89.4% |
| Bermuda | 3.5% |
| Netherlands | 2.4% |
| Singapore | 1.0% |
| Others (Individually Less Than 1%) | 3.7% |
| | 100.0% |
See accompanying notes which are an integral part of the financial statements.
Fidelity Advisor® Technology Fund
Financial Statements
Statement of Assets and Liabilities
| | | January 31, 2021 (Unaudited) |
| Assets | | |
Investment in securities, at value (including securities loaned of $2,012,500) — See accompanying schedule:
Unaffiliated issuers (cost $2,308,140,903) | $4,248,329,967 | |
| Fidelity Central Funds (cost $2,105,084) | 2,105,084 | |
| Total Investment in Securities (cost $2,310,245,987) | | $4,250,435,051 |
| Foreign currency held at value (cost $38,008) | | 39,114 |
| Receivable for investments sold | | 109,168,323 |
| Receivable for fund shares sold | | 5,988,380 |
| Dividends receivable | | 768,427 |
| Distributions receivable from Fidelity Central Funds | | 1,942 |
| Prepaid expenses | | 13,494 |
| Other receivables | | 190,576 |
| Total assets | | 4,366,605,307 |
| Liabilities | | |
| Payable to custodian bank | $437,345 | |
| Payable for investments purchased | 70,217,820 | |
| Payable for fund shares redeemed | 7,499,481 | |
| Accrued management fee | 1,914,023 | |
| Distribution and service plan fees payable | 930,830 | |
| Other affiliated payables | 635,428 | |
| Other payables and accrued expenses | 2,314,570 | |
| Collateral on securities loaned | 2,089,250 | |
| Total liabilities | | 86,038,747 |
| Net Assets | | $4,280,566,560 |
| Net Assets consist of: | | |
| Paid in capital | | $2,108,007,447 |
| Total accumulated earnings (loss) | | 2,172,559,113 |
| Net Assets | | $4,280,566,560 |
| Net Asset Value and Maximum Offering Price | | |
| Class A: | | |
| Net Asset Value and redemption price per share ($1,628,245,036 ÷ 18,468,899 shares)(a) | | $88.16 |
| Maximum offering price per share (100/94.25 of $88.16) | | $93.54 |
| Class M: | | |
| Net Asset Value and redemption price per share ($560,502,041 ÷ 6,836,202 shares)(a) | | $81.99 |
| Maximum offering price per share (100/96.50 of $81.99) | | $84.96 |
| Class C: | | |
| Net Asset Value and offering price per share ($405,067,513 ÷ 5,789,805 shares)(a) | | $69.96 |
| Class I: | | |
| Net Asset Value, offering price and redemption price per share ($1,276,899,429 ÷ 13,151,625 shares) | | $97.09 |
| Class Z: | | |
| Net Asset Value, offering price and redemption price per share ($409,852,541 ÷ 4,228,994 shares) | | $96.91 |
(a) Redemption price per share is equal to net asset value less any applicable contingent deferred sales charge.
See accompanying notes which are an integral part of the financial statements.
Statement of Operations
| | | Six months ended January 31, 2021 (Unaudited) |
| Investment Income | | |
| Dividends | | $10,550,541 |
| Income from Fidelity Central Funds (including $14,749 from security lending) | | 35,273 |
| Total income | | 10,585,814 |
| Expenses | | |
| Management fee | $10,415,548 | |
| Transfer agent fees | 3,123,488 | |
| Distribution and service plan fees | 5,099,413 | |
| Accounting fees | 518,902 | |
| Custodian fees and expenses | 38,324 | |
| Independent trustees' fees and expenses | 9,000 | |
| Registration fees | 158,057 | |
| Audit | 29,147 | |
| Legal | 6,811 | |
| Interest | 1,590 | |
| Miscellaneous | 11,984 | |
| Total expenses before reductions | 19,412,264 | |
| Expense reductions | (65,923) | |
| Total expenses after reductions | | 19,346,341 |
| Net investment income (loss) | | (8,760,527) |
| Realized and Unrealized Gain (Loss) | | |
| Net realized gain (loss) on: | | |
| Investment securities: | | |
| Unaffiliated issuers | 399,097,037 | |
| Fidelity Central Funds | (6,808) | |
| Foreign currency transactions | 28,896 | |
| Total net realized gain (loss) | | 399,119,125 |
| Change in net unrealized appreciation (depreciation) on: | | |
| Investment securities: | | |
| Unaffiliated issuers (net of decrease in deferred foreign taxes of $612,008) | 463,404,925 | |
| Fidelity Central Funds | (2,761) | |
| Assets and liabilities in foreign currencies | (397) | |
| Total change in net unrealized appreciation (depreciation) | | 463,401,767 |
| Net gain (loss) | | 862,520,892 |
| Net increase (decrease) in net assets resulting from operations | | $853,760,365 |
See accompanying notes which are an integral part of the financial statements.
Statement of Changes in Net Assets
| | Six months ended January 31, 2021 (Unaudited) | Year ended July 31, 2020 |
| Increase (Decrease) in Net Assets | | |
| Operations | | |
| Net investment income (loss) | $(8,760,527) | $(5,301,466) |
| Net realized gain (loss) | 399,119,125 | 215,447,351 |
| Change in net unrealized appreciation (depreciation) | 463,401,767 | 892,209,504 |
| Net increase (decrease) in net assets resulting from operations | 853,760,365 | 1,102,355,389 |
| Distributions to shareholders | (319,176,590) | (62,368,648) |
| Share transactions - net increase (decrease) | 265,899,275 | 286,541,904 |
| Total increase (decrease) in net assets | 800,483,050 | 1,326,528,645 |
| Net Assets | | |
| Beginning of period | 3,480,083,510 | 2,153,554,865 |
| End of period | $4,280,566,560 | $3,480,083,510 |
See accompanying notes which are an integral part of the financial statements.
Financial Highlights
Fidelity Advisor Technology Fund Class A
| | Six months ended (Unaudited) January 31, | Years endedJuly 31, | | | | |
| | 2021 | 2020 | 2019 | 2018 | 2017 | 2016 |
| Selected Per–Share Data | | | | | | |
| Net asset value, beginning of period | $76.36 | $52.61 | $60.37 | $52.11 | $37.86 | $36.83 |
| Income from Investment Operations | | | | | | |
| Net investment income (loss)A | (.19) | (.12) | .02 | (.13) | (.07) | (.10) |
| Net realized and unrealized gain (loss) | 19.01 | 25.35 | 1.84 | 12.80 | 14.95 | 2.74 |
| Total from investment operations | 18.82 | 25.23 | 1.86 | 12.67 | 14.88 | 2.64 |
| Distributions from net investment income | – | – | – | – | – | – |
| Distributions from net realized gain | (7.02) | (1.48) | (9.62) | (4.41) | (.63) | (1.61) |
| Total distributions | (7.02) | (1.48) | (9.62) | (4.41) | (.63) | (1.61) |
| Redemption fees added to paid in capitalA | – | – | – | – | –B | –B |
| Net asset value, end of period | $88.16 | $76.36 | $52.61 | $60.37 | $52.11 | $37.86 |
| Total ReturnC,D,E | 24.63% | 48.83% | 7.26% | 25.43% | 39.85% | 7.86% |
| Ratios to Average Net AssetsF,G | | | | | | |
| Expenses before reductions | .99%H | 1.01% | 1.03% | 1.05% | 1.07% | 1.09% |
| Expenses net of fee waivers, if any | .99%H | 1.01% | 1.03% | 1.05% | 1.07% | 1.09% |
| Expenses net of all reductions | .99%H | 1.01% | 1.02% | 1.04% | 1.07% | 1.07% |
| Net investment income (loss) | (.45)%H | (.20)% | .04% | (.23)% | (.17)% | (.28)% |
| Supplemental Data | | | | | | |
| Net assets, end of period (000 omitted) | $1,628,245 | $1,339,059 | $884,749 | $825,118 | $637,315 | $480,573 |
| Portfolio turnover rateI | 59%H | 40%J | 88% | 84% | 73%J | 102% |
A Calculated based on average shares outstanding during the period.
B Amount represents less than $.005 per share.
C Total returns for periods of less than one year are not annualized.
D Total returns would have been lower if certain expenses had not been reduced during the applicable periods shown.
E Total returns do not include the effect of the sales charges.
F Fees and expenses of any underlying mutual funds or exchange-traded funds (ETFs) are not included in the Fund's expense ratio. The Fund indirectly bears its proportionate share of these expenses. For additional expense information related to investments in Fidelity Central Funds, please refer to the "Investments in Fidelity Central Funds" note found in the Notes to Financial Statements section of the most recent Annual or Semi-Annual report.
G Expense ratios reflect operating expenses of the class. Expenses before reductions do not reflect amounts reimbursed, waived, or reduced through arrangements with the investment adviser, brokerage services, or other offset arrangements, if applicable, and do not represent the amount paid by the class during periods when reimbursements, waivers or reductions occur.
H Annualized
I Amount does not include the portfolio activity of any underlying mutual funds or exchange-traded funds (ETFs).
J Portfolio turnover rate excludes securities received or delivered in-kind.
See accompanying notes which are an integral part of the financial statements.
Fidelity Advisor Technology Fund Class M
| | Six months ended (Unaudited) January 31, | Years endedJuly 31, | | | | |
| | 2021 | 2020 | 2019 | 2018 | 2017 | 2016 |
| Selected Per–Share Data | | | | | | |
| Net asset value, beginning of period | $71.37 | $49.28 | $57.23 | $49.63 | $36.14 | $35.26 |
| Income from Investment Operations | | | | | | |
| Net investment income (loss)A | (.28) | (.25) | (.10) | (.27) | (.18) | (.18) |
| Net realized and unrealized gain (loss) | 17.77 | 23.71 | 1.63 | 12.16 | 14.26 | 2.61 |
| Total from investment operations | 17.49 | 23.46 | 1.53 | 11.89 | 14.08 | 2.43 |
| Distributions from net investment income | – | – | – | – | – | – |
| Distributions from net realized gain | (6.87) | (1.37) | (9.48) | (4.29) | (.59) | (1.55) |
| Total distributions | (6.87) | (1.37) | (9.48) | (4.29) | (.59) | (1.55) |
| Redemption fees added to paid in capitalA | – | – | – | – | –B | –B |
| Net asset value, end of period | $81.99 | $71.37 | $49.28 | $57.23 | $49.63 | $36.14 |
| Total ReturnC,D,E | 24.49% | 48.44% | 7.00% | 25.09% | 39.50% | 7.60% |
| Ratios to Average Net AssetsF,G | | | | | | |
| Expenses before reductions | 1.24%H | 1.26% | 1.28% | 1.31% | 1.33% | 1.35% |
| Expenses net of fee waivers, if any | 1.24%H | 1.26% | 1.28% | 1.31% | 1.33% | 1.35% |
| Expenses net of all reductions | 1.24%H | 1.26% | 1.28% | 1.30% | 1.33% | 1.34% |
| Net investment income (loss) | (.70)%H | (.45)% | (.22)% | (.49)% | (.43)% | (.54)% |
| Supplemental Data | | | | | | |
| Net assets, end of period (000 omitted) | $560,502 | $464,093 | $321,915 | $328,709 | $274,918 | $203,727 |
| Portfolio turnover rateI | 59%H | 40%J | 88% | 84% | 73% | 102% |
A Calculated based on average shares outstanding during the period.
B Amount represents less than $.005 per share.
C Total returns for periods of less than one year are not annualized.
D Total returns would have been lower if certain expenses had not been reduced during the applicable periods shown.
E Total returns do not include the effect of the sales charges.
F Fees and expenses of any underlying mutual funds or exchange-traded funds (ETFs) are not included in the Fund's expense ratio. The Fund indirectly bears its proportionate share of these expenses. For additional expense information related to investments in Fidelity Central Funds, please refer to the "Investments in Fidelity Central Funds" note found in the Notes to Financial Statements section of the most recent Annual or Semi-Annual report.
G Expense ratios reflect operating expenses of the class. Expenses before reductions do not reflect amounts reimbursed, waived, or reduced through arrangements with the investment adviser, brokerage services, or other offset arrangements, if applicable, and do not represent the amount paid by the class during periods when reimbursements, waivers or reductions occur.
H Annualized
I Amount does not include the portfolio activity of any underlying mutual funds or exchange-traded funds (ETFs).
J Portfolio turnover rate excludes securities received or delivered in-kind.
See accompanying notes which are an integral part of the financial statements.
Fidelity Advisor Technology Fund Class C
| | Six months ended (Unaudited) January 31, | Years endedJuly 31, | | | | |
| | 2021 | 2020 | 2019 | 2018 | 2017 | 2016 |
| Selected Per–Share Data | | | | | | |
| Net asset value, beginning of period | $61.67 | $42.81 | $51.18 | $44.86 | $32.83 | $32.27 |
| Income from Investment Operations | | | | | | |
| Net investment income (loss)A | (.41) | (.46) | (.30) | (.49) | (.35) | (.31) |
| Net realized and unrealized gain (loss) | 15.33 | 20.52 | 1.22 | 10.95 | 12.92 | 2.37 |
| Total from investment operations | 14.92 | 20.06 | .92 | 10.46 | 12.57 | 2.06 |
| Distributions from net investment income | – | – | – | – | – | – |
| Distributions from net realized gain | (6.63) | (1.20) | (9.29) | (4.14) | (.54) | (1.50) |
| Total distributions | (6.63) | (1.20) | (9.29) | (4.14) | (.54) | (1.50) |
| Redemption fees added to paid in capitalA | – | – | – | – | –B | –B |
| Net asset value, end of period | $69.96 | $61.67 | $42.81 | $51.18 | $44.86 | $32.83 |
| Total ReturnC,D,E | 24.17% | 47.69% | 6.44% | 24.48% | 38.79% | 7.08% |
| Ratios to Average Net AssetsF,G | | | | | | |
| Expenses before reductions | 1.75%H | 1.77% | 1.79% | 1.81% | 1.83% | 1.85% |
| Expenses net of fee waivers, if any | 1.75%H | 1.77% | 1.79% | 1.81% | 1.83% | 1.85% |
| Expenses net of all reductions | 1.75%H | 1.77% | 1.78% | 1.80% | 1.82% | 1.83% |
| Net investment income (loss) | (1.21)%H | (.96)% | (.72)% | (.99)% | (.93)% | (1.04)% |
| Supplemental Data | | | | | | |
| Net assets, end of period (000 omitted) | $405,068 | $343,585 | $240,358 | $321,616 | $237,583 | $151,321 |
| Portfolio turnover rateI | 59%H | 40%J | 88% | 84% | 73%J | 102% |
A Calculated based on average shares outstanding during the period.
B Amount represents less than $.005 per share.
C Total returns for periods of less than one year are not annualized.
D Total returns would have been lower if certain expenses had not been reduced during the applicable periods shown.
E Total returns do not include the effect of the contingent deferred sales charge.
F Fees and expenses of any underlying mutual funds or exchange-traded funds (ETFs) are not included in the Fund's expense ratio. The Fund indirectly bears its proportionate share of these expenses. For additional expense information related to investments in Fidelity Central Funds, please refer to the "Investments in Fidelity Central Funds" note found in the Notes to Financial Statements section of the most recent Annual or Semi-Annual report.
G Expense ratios reflect operating expenses of the class. Expenses before reductions do not reflect amounts reimbursed, waived, or reduced through arrangements with the investment adviser, brokerage services, or other offset arrangements, if applicable, and do not represent the amount paid by the class during periods when reimbursements, waivers or reductions occur.
H Annualized
I Amount does not include the portfolio activity of any underlying mutual funds or exchange-traded funds (ETFs).
J Portfolio turnover rate excludes securities received or delivered in-kind.
See accompanying notes which are an integral part of the financial statements.
Fidelity Advisor Technology Fund Class I
| | Six months ended (Unaudited) January 31, | Years endedJuly 31, | | | | |
| | 2021 | 2020 | 2019 | 2018 | 2017 | 2016 |
| Selected Per–Share Data | | | | | | |
| Net asset value, beginning of period | $83.56 | $57.41 | $64.86 | $55.69 | $40.30 | $39.03 |
| Income from Investment Operations | | | | | | |
| Net investment income (loss)A | (.09) | .04 | .17 | .02 | .06 | .02 |
| Net realized and unrealized gain (loss) | 20.82 | 27.72 | 2.15 | 13.71 | 15.96 | 2.92 |
| Total from investment operations | 20.73 | 27.76 | 2.32 | 13.73 | 16.02 | 2.94 |
| Distributions from net investment income | – | – | (.01) | – | – | – |
| Distributions from net realized gain | (7.20) | (1.61) | (9.76) | (4.56) | (.63) | (1.67) |
| Total distributions | (7.20) | (1.61) | (9.77) | (4.56) | (.63) | (1.67) |
| Redemption fees added to paid in capitalA | – | – | – | – | –B | –B |
| Net asset value, end of period | $97.09 | $83.56 | $57.41 | $64.86 | $55.69 | $40.30 |
| Total ReturnC,D | 24.80% | 49.22% | 7.56% | 25.75% | 40.26% | 8.24% |
| Ratios to Average Net AssetsE,F | | | | | | |
| Expenses before reductions | .73%G | .74% | .76% | .78% | .77% | .75% |
| Expenses net of fee waivers, if any | .73%G | .74% | .76% | .78% | .77% | .75% |
| Expenses net of all reductions | .73%G | .74% | .76% | .77% | .77% | .74% |
| Net investment income (loss) | (.19)%G | .07% | .30% | .03% | .13% | .06% |
| Supplemental Data | | | | | | |
| Net assets, end of period (000 omitted) | $1,276,899 | $1,035,091 | $674,914 | $734,661 | $403,024 | $669,599 |
| Portfolio turnover rateH | 59%G | 40%I | 88% | 84% | 73% | 102% |
A Calculated based on average shares outstanding during the period.
B Amount represents less than $.005 per share.
C Total returns for periods of less than one year are not annualized.
D Total returns would have been lower if certain expenses had not been reduced during the applicable periods shown.
E Fees and expenses of any underlying mutual funds or exchange-traded funds (ETFs) are not included in the Fund's expense ratio. The Fund indirectly bears its proportionate share of these expenses. For additional expense information related to investments in Fidelity Central Funds, please refer to the "Investments in Fidelity Central Funds" note found in the Notes to Financial Statements section of the most recent Annual or Semi-Annual report.
F Expense ratios reflect operating expenses of the class. Expenses before reductions do not reflect amounts reimbursed, waived, or reduced through arrangements with the investment adviser, brokerage services, or other offset arrangements, if applicable, and do not represent the amount paid by the class during periods when reimbursements, waivers or reductions occur.
G Annualized
H Amount does not include the portfolio activity of any underlying mutual funds or exchange-traded funds (ETFs).
I Portfolio turnover rate excludes securities received or delivered in-kind.
See accompanying notes which are an integral part of the financial statements.
Fidelity Advisor Technology Fund Class Z
| | Six months ended (Unaudited) January 31, | Years endedJuly 31, | |
| | 2021 | 2020 | 2019 A |
| Selected Per–Share Data | | | |
| Net asset value, beginning of period | $83.44 | $57.34 | $67.88 |
| Income from Investment Operations | | | |
| Net investment income (loss)B | (.03) | .12 | .23 |
| Net realized and unrealized gain (loss) | 20.79 | 27.68 | (.90)C |
| Total from investment operations | 20.76 | 27.80 | (.67) |
| Distributions from net investment income | – | – | (.11) |
| Distributions from net realized gain | (7.29) | (1.70) | (9.76) |
| Total distributions | (7.29) | (1.70) | (9.87) |
| Redemption fees added to paid in capitalB | – | – | – |
| Net asset value, end of period | $96.91 | $83.44 | $57.34 |
| Total ReturnD,E | 24.88% | 49.39% | 2.88% |
| Ratios to Average Net AssetsF,G | | | |
| Expenses before reductions | .61%H | .62% | .63%H |
| Expenses net of fee waivers, if any | .61%H | .62% | .63%H |
| Expenses net of all reductions | .61%H | .62% | .62%H |
| Net investment income (loss) | (.07)%H | .19% | .53%H |
| Supplemental Data | | | |
| Net assets, end of period (000 omitted) | $409,853 | $298,255 | $31,619 |
| Portfolio turnover rateI | 59%H | 40%J | 88% |
A For the period October 2, 2018 (commencement of sale of shares) to July 31, 2019.
B Calculated based on average shares outstanding during the period.
C The amount shown for a share outstanding does not correspond with the aggregate net gain (loss) on investments for the period due to the timing of sales and repurchases of shares in relation to fluctuating market values of the investments of the Fund.
D Total returns for periods of less than one year are not annualized.
E Total returns would have been lower if certain expenses had not been reduced during the applicable periods shown.
F Fees and expenses of any underlying mutual funds or exchange-traded funds (ETFs) are not included in the Fund's expense ratio. The Fund indirectly bears its proportionate share of these expenses. For additional expense information related to investments in Fidelity Central Funds, please refer to the "Investments in Fidelity Central Funds" note found in the Notes to Financial Statements section of the most recent Annual or Semi-Annual report.
G Expense ratios reflect operating expenses of the class. Expenses before reductions do not reflect amounts reimbursed, waived, or reduced through arrangements with the investment adviser, brokerage services, or other offset arrangements, if applicable, and do not represent the amount paid by the class during periods when reimbursements, waivers or reductions occur.
H Annualized
I Amount does not include the portfolio activity of any underlying mutual funds or exchange-traded funds (ETFs).
J Portfolio turnover rate excludes securities received or delivered in-kind.
See accompanying notes which are an integral part of the financial statements.
Fidelity Advisor® Utilities Fund
Investment Summary (Unaudited)
Top Ten Stocks as of January 31, 2021
| | % of fund's net assets |
| NextEra Energy, Inc. | 14.6 |
| Edison International | 7.6 |
| Southern Co. | 7.3 |
| Sempra Energy | 6.7 |
| PG&E Corp. | 6.0 |
| The AES Corp. | 5.5 |
| Exelon Corp. | 4.9 |
| Duke Energy Corp. | 4.8 |
| FirstEnergy Corp. | 4.8 |
| American Electric Power Co., Inc. | 4.8 |
| | 67.0 |
Top Industries (% of fund's net assets)
| As of January 31, 2021 |
| | Electric Utilities | 63.4% |
| | Multi-Utilities | 21.1% |
| | Independent Power and Renewable Electricity Producers | 13.1% |
| | All Others* | 2.4% |

* Includes short-term investments and net other assets (liabilities).
Fidelity Advisor® Utilities Fund
Schedule of Investments January 31, 2021 (Unaudited)
Showing Percentage of Net Assets
| Common Stocks - 97.6% | | | |
| | | Shares | Value |
| Electric Utilities - 63.4% | | | |
| Electric Utilities - 63.4% | | | |
| American Electric Power Co., Inc. | | 337,417 | $27,300,409 |
| Duke Energy Corp. | | 294,851 | 27,715,994 |
| Edison International | | 747,090 | 43,450,754 |
| Evergy, Inc. | | 369,089 | 19,831,152 |
| Exelon Corp. | | 669,572 | 27,827,412 |
| FirstEnergy Corp. | | 895,116 | 27,533,768 |
| NextEra Energy, Inc. | | 1,035,348 | 83,728,594 |
| NRG Energy, Inc. | | 401,915 | 16,643,300 |
| PG&E Corp. (a) | | 3,019,689 | 34,515,045 |
| Portland General Electric Co. | | 33,625 | 1,422,001 |
| PPL Corp. | | 397,888 | 11,009,561 |
| Southern Co. | | 705,987 | 41,596,754 |
| | | | 362,574,744 |
| Independent Power and Renewable Electricity Producers - 13.1% | | | |
| Independent Power Producers & Energy Traders - 9.7% | | | |
| Clearway Energy, Inc.: | | | |
| Class A | | 66,926 | 1,929,477 |
| Class C | | 305,178 | 9,454,414 |
| The AES Corp. | | 1,291,120 | 31,490,417 |
| Vistra Corp. | | 622,327 | 12,427,870 |
| | | | 55,302,178 |
| Renewable Electricity - 3.4% | | | |
| NextEra Energy Partners LP (b) | | 146,785 | 11,962,978 |
| Sunnova Energy International, Inc. (a) | | 175,600 | 7,700,060 |
| | | | 19,663,038 |
|
| TOTAL INDEPENDENT POWER AND RENEWABLE ELECTRICITY PRODUCERS | | | 74,965,216 |
|
| Multi-Utilities - 21.1% | | | |
| Multi-Utilities - 21.1% | | | |
| CenterPoint Energy, Inc. (b) | | 1,267,469 | 26,730,921 |
| Dominion Energy, Inc. | | 373,776 | 27,244,533 |
| NiSource, Inc. | | 353,252 | 7,824,532 |
| Public Service Enterprise Group, Inc. | | 370,505 | 20,907,597 |
| Sempra Energy | | 309,900 | 38,353,224 |
| | | | 121,060,807 |
| TOTAL COMMON STOCKS | | | |
| (Cost $455,487,758) | | | 558,600,767 |
|
| Money Market Funds - 4.6% | | | |
| Fidelity Cash Central Fund 0.09% (c) | | 11,598,610 | 11,600,929 |
| Fidelity Securities Lending Cash Central Fund 0.09% (c)(d) | | 14,680,757 | 14,682,225 |
| TOTAL MONEY MARKET FUNDS | | | |
| (Cost $26,283,154) | | | 26,283,154 |
| TOTAL INVESTMENT IN SECURITIES - 102.2% | | | |
| (Cost $481,770,912) | | | 584,883,921 |
| NET OTHER ASSETS (LIABILITIES) - (2.2)% | | | (12,725,418) |
| NET ASSETS - 100% | | | $572,158,503 |
Legend
(a) Non-income producing
(b) Security or a portion of the security is on loan at period end.
(c) Affiliated fund that is generally available only to investment companies and other accounts managed by Fidelity Investments. The rate quoted is the annualized seven-day yield of the fund at period end. A complete unaudited listing of the fund's holdings as of its most recent quarter end is available upon request. In addition, each Fidelity Central Fund's financial statements are available on the SEC's website or upon request.
(d) Investment made with cash collateral received from securities on loan.
Affiliated Central Funds
Information regarding fiscal year to date income earned by the Fund from investments in Fidelity Central Funds is as follows:
| Fund | Income earned |
| Fidelity Cash Central Fund | $1,592 |
| Fidelity Securities Lending Cash Central Fund | 1,600 |
| Total | $3,192 |
Amounts in the income column in the above table include any capital gain distributions from underlying funds, which are presented in the corresponding line-item in the Statement of Operations, if applicable. Amount for Fidelity Securities Lending Cash Central Fund represents the income earned on investing cash collateral, less rebates paid to borrowers and any lending agent fees associated with the loan, plus any premium payments received for lending certain types of securities.
Investment Valuation
The following is a summary of the inputs used, as of January 31, 2021, involving the Fund's assets and liabilities carried at fair value. The inputs or methodology used for valuing securities may not be an indication of the risk associated with investing in those securities. For more information on valuation inputs, and their aggregation into the levels used below, please refer to the Investment Valuation section in the accompanying Notes to Financial Statements.
| | Valuation Inputs at Reporting Date: |
| Description | Total | Level 1 | Level 2 | Level 3 |
| Investments in Securities: | | | | |
| Common Stocks | $558,600,767 | $558,600,767 | $-- | $-- |
| Money Market Funds | 26,283,154 | 26,283,154 | -- | -- |
| Total Investments in Securities: | $584,883,921 | $584,883,921 | $-- | $-- |
See accompanying notes which are an integral part of the financial statements.
Fidelity Advisor® Utilities Fund
Financial Statements
Statement of Assets and Liabilities
| | | January 31, 2021 (Unaudited) |
| Assets | | |
Investment in securities, at value (including securities loaned of $14,303,459) — See accompanying schedule:
Unaffiliated issuers (cost $455,487,758) | $558,600,767 | |
| Fidelity Central Funds (cost $26,283,154) | 26,283,154 | |
| Total Investment in Securities (cost $481,770,912) | | $584,883,921 |
| Receivable for investments sold | | 2,666,718 |
| Receivable for fund shares sold | | 470,155 |
| Dividends receivable | | 986,464 |
| Distributions receivable from Fidelity Central Funds | | 415 |
| Prepaid expenses | | 2,120 |
| Other receivables | | 17,989 |
| Total assets | | 589,027,782 |
| Liabilities | | |
| Payable for fund shares redeemed | $1,669,805 | |
| Accrued management fee | 257,216 | |
| Distribution and service plan fees payable | 126,594 | |
| Other affiliated payables | 105,420 | |
| Other payables and accrued expenses | 28,019 | |
| Collateral on securities loaned | 14,682,225 | |
| Total liabilities | | 16,869,279 |
| Net Assets | | $572,158,503 |
| Net Assets consist of: | | |
| Paid in capital | | $477,059,223 |
| Total accumulated earnings (loss) | | 95,099,280 |
| Net Assets | | $572,158,503 |
| Net Asset Value and Maximum Offering Price | | |
| Class A: | | |
| Net Asset Value and redemption price per share ($245,745,509 ÷ 7,493,766 shares)(a) | | $32.79 |
| Maximum offering price per share (100/94.25 of $32.79) | | $34.79 |
| Class M: | | |
| Net Asset Value and redemption price per share ($60,639,073 ÷ 1,844,456 shares)(a) | | $32.88 |
| Maximum offering price per share (100/96.50 of $32.88) | | $34.07 |
| Class C: | | |
| Net Asset Value and offering price per share ($56,588,305 ÷ 1,767,041 shares)(a) | | $32.02 |
| Class I: | | |
| Net Asset Value, offering price and redemption price per share ($153,401,233 ÷ 4,571,383 shares) | | $33.56 |
| Class Z: | | |
| Net Asset Value, offering price and redemption price per share ($55,784,383 ÷ 1,663,683 shares) | | $33.53 |
(a) Redemption price per share is equal to net asset value less any applicable contingent deferred sales charge.
See accompanying notes which are an integral part of the financial statements.
Statement of Operations
| | | Six months ended January 31, 2021 (Unaudited) |
| Investment Income | | |
| Dividends | | $6,950,908 |
| Income from Fidelity Central Funds (including $1,600 from security lending) | | 3,192 |
| Total income | | 6,954,100 |
| Expenses | | |
| Management fee | $1,554,872 | |
| Transfer agent fees | 535,069 | |
| Distribution and service plan fees | 753,703 | |
| Accounting fees | 109,374 | |
| Custodian fees and expenses | 4,265 | |
| Independent trustees' fees and expenses | 1,462 | |
| Registration fees | 65,561 | |
| Audit | 26,973 | |
| Legal | 28,568 | |
| Interest | 391 | |
| Miscellaneous | 1,809 | |
| Total expenses before reductions | 3,082,047 | |
| Expense reductions | (25,508) | |
| Total expenses after reductions | | 3,056,539 |
| Net investment income (loss) | | 3,897,561 |
| Realized and Unrealized Gain (Loss) | | |
| Net realized gain (loss) on: | | |
| Investment securities: | | |
| Unaffiliated issuers | 16,452,818 | |
| Fidelity Central Funds | (255) | |
| Total net realized gain (loss) | | 16,452,563 |
| Change in net unrealized appreciation (depreciation) on: | | |
| Investment securities: | | |
| Unaffiliated issuers | 30,294,397 | |
| Fidelity Central Funds | (390) | |
| Assets and liabilities in foreign currencies | 268 | |
| Total change in net unrealized appreciation (depreciation) | | 30,294,275 |
| Net gain (loss) | | 46,746,838 |
| Net increase (decrease) in net assets resulting from operations | | $50,644,399 |
See accompanying notes which are an integral part of the financial statements.
Statement of Changes in Net Assets
| | Six months ended January 31, 2021 (Unaudited) | Year ended July 31, 2020 |
| Increase (Decrease) in Net Assets | | |
| Operations | | |
| Net investment income (loss) | $3,897,561 | $13,100,736 |
| Net realized gain (loss) | 16,452,563 | (12,378,282) |
| Change in net unrealized appreciation (depreciation) | 30,294,275 | (24,427,855) |
| Net increase (decrease) in net assets resulting from operations | 50,644,399 | (23,705,401) |
| Distributions to shareholders | (12,048,406) | (13,931,390) |
| Share transactions - net increase (decrease) | (77,693,421) | 5,532,255 |
| Total increase (decrease) in net assets | (39,097,428) | (32,104,536) |
| Net Assets | | |
| Beginning of period | 611,255,931 | 643,360,467 |
| End of period | $572,158,503 | $611,255,931 |
See accompanying notes which are an integral part of the financial statements.
Financial Highlights
Fidelity Advisor Utilities Fund Class A
| | Six months ended (Unaudited) January 31, | Years endedJuly 31, | | | | |
| | 2021 | 2020 | 2019 | 2018 | 2017 | 2016 |
| Selected Per–Share Data | | | | | | |
| Net asset value, beginning of period | $30.67 | $31.73 | $31.54 | $29.74 | $27.59 | $25.48 |
| Income from Investment Operations | | | | | | |
| Net investment income (loss)A | .21 | .60 | .67 | .49 | .50 | .44 |
| Net realized and unrealized gain (loss) | 2.59 | (1.03) | 2.81 | 2.38 | 2.14 | 2.75 |
| Total from investment operations | 2.80 | (.43) | 3.48 | 2.87 | 2.64 | 3.19 |
| Distributions from net investment income | (.68) | (.62) | (.48) | (.49) | (.49) | (.46) |
| Distributions from net realized gain | – | –B | (2.81) | (.58) | – | (.61) |
| Total distributions | (.68) | (.63)C | (3.29) | (1.07) | (.49) | (1.08)C |
| Redemption fees added to paid in capitalA | – | – | – | – | –B | –B |
| Net asset value, end of period | $32.79 | $30.67 | $31.73 | $31.54 | $29.74 | $27.59 |
| Total ReturnD,E,F | 9.16% | (1.56)% | 11.73% | 9.84% | 9.87% | 13.49% |
| Ratios to Average Net AssetsG,H | | | | | | |
| Expenses before reductions | 1.06%I | 1.06% | 1.08% | 1.12% | 1.12% | 1.13% |
| Expenses net of fee waivers, if any | 1.06%I | 1.06% | 1.07% | 1.11% | 1.12% | 1.13% |
| Expenses net of all reductions | 1.05%I | 1.05% | 1.06% | 1.09% | 1.11% | 1.12% |
| Net investment income (loss) | 1.31%I | 1.88% | 2.14% | 1.66% | 1.87% | 1.78% |
| Supplemental Data | | | | | | |
| Net assets, end of period (000 omitted) | $245,746 | $249,158 | $268,246 | $173,999 | $160,040 | $178,116 |
| Portfolio turnover rateJ | 53%I | 80%K | 56% | 106% | 37% | 73% |
A Calculated based on average shares outstanding during the period.
B Amount represents less than $.005 per share.
C Total distributions per share do not sum due to rounding.
D Total returns for periods of less than one year are not annualized.
E Total returns would have been lower if certain expenses had not been reduced during the applicable periods shown.
F Total returns do not include the effect of the sales charges.
G Fees and expenses of any underlying mutual funds or exchange-traded funds (ETFs) are not included in the Fund's expense ratio. The Fund indirectly bears its proportionate share of these expenses. For additional expense information related to investments in Fidelity Central Funds, please refer to the "Investments in Fidelity Central Funds" note found in the Notes to Financial Statements section of the most recent Annual or Semi-Annual report.
H Expense ratios reflect operating expenses of the class. Expenses before reductions do not reflect amounts reimbursed, waived, or reduced through arrangements with the investment adviser, brokerage services, or other offset arrangements, if applicable, and do not represent the amount paid by the class during periods when reimbursements, waivers or reductions occur.
I Annualized
J Amount does not include the portfolio activity of any underlying mutual funds or exchange-traded funds (ETFs).
K Portfolio turnover rate excludes securities received or delivered in-kind.
See accompanying notes which are an integral part of the financial statements.
Fidelity Advisor Utilities Fund Class M
| | Six months ended (Unaudited) January 31, | Years endedJuly 31, | | | | |
| | 2021 | 2020 | 2019 | 2018 | 2017 | 2016 |
| Selected Per–Share Data | | | | | | |
| Net asset value, beginning of period | $30.71 | $31.77 | $31.58 | $29.77 | $27.62 | $25.49 |
| Income from Investment Operations | | | | | | |
| Net investment income (loss)A | .17 | .51 | .58 | .41 | .42 | .36 |
| Net realized and unrealized gain (loss) | 2.60 | (1.03) | 2.81 | 2.38 | 2.14 | 2.77 |
| Total from investment operations | 2.77 | (.52) | 3.39 | 2.79 | 2.56 | 3.13 |
| Distributions from net investment income | (.60) | (.53) | (.39) | (.40) | (.41) | (.39) |
| Distributions from net realized gain | – | –B | (2.81) | (.58) | – | (.61) |
| Total distributions | (.60) | (.54)C | (3.20) | (.98) | (.41) | (1.00) |
| Redemption fees added to paid in capitalA | – | – | – | – | –B | –B |
| Net asset value, end of period | $32.88 | $30.71 | $31.77 | $31.58 | $29.77 | $27.62 |
| Total ReturnD,E,F | 9.03% | (1.82)% | 11.38% | 9.53% | 9.51% | 13.19% |
| Ratios to Average Net AssetsG,H | | | | | | |
| Expenses before reductions | 1.34%I | 1.33% | 1.36% | 1.41% | 1.41% | 1.43% |
| Expenses net of fee waivers, if any | 1.34%I | 1.33% | 1.36% | 1.41% | 1.41% | 1.43% |
| Expenses net of all reductions | 1.33%I | 1.33% | 1.35% | 1.39% | 1.41% | 1.42% |
| Net investment income (loss) | 1.03%I | 1.60% | 1.86% | 1.36% | 1.57% | 1.47% |
| Supplemental Data | | | | | | |
| Net assets, end of period (000 omitted) | $60,639 | $58,773 | $61,741 | $46,669 | $48,152 | $56,403 |
| Portfolio turnover rateJ | 53%I | 80%K | 56% | 106% | 37% | 73% |
A Calculated based on average shares outstanding during the period.
B Amount represents less than $.005 per share.
C Total distributions per share do not sum due to rounding.
D Total returns for periods of less than one year are not annualized.
E Total returns would have been lower if certain expenses had not been reduced during the applicable periods shown.
F Total returns do not include the effect of the sales charges.
G Fees and expenses of any underlying mutual funds or exchange-traded funds (ETFs) are not included in the Fund's expense ratio. The Fund indirectly bears its proportionate share of these expenses. For additional expense information related to investments in Fidelity Central Funds, please refer to the "Investments in Fidelity Central Funds" note found in the Notes to Financial Statements section of the most recent Annual or Semi-Annual report.
H Expense ratios reflect operating expenses of the class. Expenses before reductions do not reflect amounts reimbursed, waived, or reduced through arrangements with the investment adviser, brokerage services, or other offset arrangements, if applicable, and do not represent the amount paid by the class during periods when reimbursements, waivers or reductions occur.
I Annualized
J Amount does not include the portfolio activity of any underlying mutual funds or exchange-traded funds (ETFs).
K Portfolio turnover rate excludes securities received or delivered in-kind.
See accompanying notes which are an integral part of the financial statements.
Fidelity Advisor Utilities Fund Class C
| | Six months ended (Unaudited) January 31, | Years endedJuly 31, | | | | |
| | 2021 | 2020 | 2019 | 2018 | 2017 | 2016 |
| Selected Per–Share Data | | | | | | |
| Net asset value, beginning of period | $29.83 | $30.90 | $30.81 | $29.07 | $26.98 | $24.91 |
| Income from Investment Operations | | | | | | |
| Net investment income (loss)A | .09 | .35 | .42 | .26 | .29 | .25 |
| Net realized and unrealized gain (loss) | 2.51 | (1.01) | 2.74 | 2.33 | 2.09 | 2.70 |
| Total from investment operations | 2.60 | (.66) | 3.16 | 2.59 | 2.38 | 2.95 |
| Distributions from net investment income | (.41) | (.40) | (.26) | (.27) | (.29) | (.27) |
| Distributions from net realized gain | – | –B | (2.81) | (.58) | – | (.61) |
| Total distributions | (.41) | (.41)C | (3.07) | (.85) | (.29) | (.88) |
| Redemption fees added to paid in capitalA | – | – | – | – | –B | –B |
| Net asset value, end of period | $32.02 | $29.83 | $30.90 | $30.81 | $29.07 | $26.98 |
| Total ReturnD,E,F | 8.74% | (2.28)% | 10.87% | 9.04% | 9.01% | 12.64% |
| Ratios to Average Net AssetsG,H | | | | | | |
| Expenses before reductions | 1.82%I | 1.81% | 1.83% | 1.87% | 1.87% | 1.88% |
| Expenses net of fee waivers, if any | 1.82%I | 1.81% | 1.83% | 1.87% | 1.87% | 1.88% |
| Expenses net of all reductions | 1.81%I | 1.80% | 1.82% | 1.85% | 1.86% | 1.88% |
| Net investment income (loss) | .56%I | 1.12% | 1.39% | .90% | 1.11% | 1.02% |
| Supplemental Data | | | | | | |
| Net assets, end of period (000 omitted) | $56,588 | $63,458 | $66,525 | $53,099 | $56,964 | $70,957 |
| Portfolio turnover rateJ | 53%I | 80%K | 56% | 106% | 37% | 73% |
A Calculated based on average shares outstanding during the period.
B Amount represents less than $.005 per share.
C Total distributions per share do not sum due to rounding.
D Total returns for periods of less than one year are not annualized.
E Total returns would have been lower if certain expenses had not been reduced during the applicable periods shown.
F Total returns do not include the effect of the contingent deferred sales charge.
G Fees and expenses of any underlying mutual funds or exchange-traded funds (ETFs) are not included in the Fund's expense ratio. The Fund indirectly bears its proportionate share of these expenses. For additional expense information related to investments in Fidelity Central Funds, please refer to the "Investments in Fidelity Central Funds" note found in the Notes to Financial Statements section of the most recent Annual or Semi-Annual report.
H Expense ratios reflect operating expenses of the class. Expenses before reductions do not reflect amounts reimbursed, waived, or reduced through arrangements with the investment adviser, brokerage services, or other offset arrangements, if applicable, and do not represent the amount paid by the class during periods when reimbursements, waivers or reductions occur.
I Annualized
J Amount does not include the portfolio activity of any underlying mutual funds or exchange-traded funds (ETFs).
K Portfolio turnover rate excludes securities received or delivered in-kind.
See accompanying notes which are an integral part of the financial statements.
Fidelity Advisor Utilities Fund Class I
| | Six months ended (Unaudited) January 31, | Years endedJuly 31, | | | | |
| | 2021 | 2020 | 2019 | 2018 | 2017 | 2016 |
| Selected Per–Share Data | | | | | | |
| Net asset value, beginning of period | $31.40 | $32.47 | $32.21 | $30.35 | $28.14 | $25.97 |
| Income from Investment Operations | | | | | | |
| Net investment income (loss)A | .26 | .71 | .76 | .59 | .59 | .53 |
| Net realized and unrealized gain (loss) | 2.67 | (1.07) | 2.88 | 2.43 | 2.17 | 2.78 |
| Total from investment operations | 2.93 | (.36) | 3.64 | 3.02 | 2.76 | 3.31 |
| Distributions from net investment income | (.77) | (.71) | (.58) | (.58) | (.55) | (.53) |
| Distributions from net realized gain | – | –B | (2.81) | (.58) | – | (.61) |
| Total distributions | (.77) | (.71) | (3.38)C | (1.16) | (.55) | (1.14) |
| Redemption fees added to paid in capitalA | – | – | – | – | –B | –B |
| Net asset value, end of period | $33.56 | $31.40 | $32.47 | $32.21 | $30.35 | $28.14 |
| Total ReturnD,E | 9.34% | (1.30)% | 12.04% | 10.14% | 10.17% | 13.81% |
| Ratios to Average Net AssetsF,G | | | | | | |
| Expenses before reductions | .78%H | .79% | .81% | .84% | .85% | .84% |
| Expenses net of fee waivers, if any | .78%H | .78% | .80% | .84% | .85% | .84% |
| Expenses net of all reductions | .78%H | .78% | .79% | .82% | .84% | .84% |
| Net investment income (loss) | 1.59%H | 2.15% | 2.41% | 1.93% | 2.14% | 2.06% |
| Supplemental Data | | | | | | |
| Net assets, end of period (000 omitted) | $153,401 | $187,833 | $229,777 | $55,462 | $46,943 | $62,600 |
| Portfolio turnover rateI | 53%H | 80%J | 56% | 106% | 37% | 73% |
A Calculated based on average shares outstanding during the period.
B Amount represents less than $.005 per share.
C Total distributions per share do not sum due to rounding.
D Total returns for periods of less than one year are not annualized.
E Total returns would have been lower if certain expenses had not been reduced during the applicable periods shown.
F Fees and expenses of any underlying mutual funds or exchange-traded funds (ETFs) are not included in the Fund's expense ratio. The Fund indirectly bears its proportionate share of these expenses. For additional expense information related to investments in Fidelity Central Funds, please refer to the "Investments in Fidelity Central Funds" note found in the Notes to Financial Statements section of the most recent Annual or Semi-Annual report.
G Expense ratios reflect operating expenses of the class. Expenses before reductions do not reflect amounts reimbursed, waived, or reduced through arrangements with the investment adviser, brokerage services, or other offset arrangements, if applicable, and do not represent the amount paid by the class during periods when reimbursements, waivers or reductions occur.
H Annualized
I Amount does not include the portfolio activity of any underlying mutual funds or exchange-traded funds (ETFs).
J Portfolio turnover rate excludes securities received or delivered in-kind.
See accompanying notes which are an integral part of the financial statements.
Fidelity Advisor Utilities Fund Class Z
| | Six months ended (Unaudited) January 31, | Years endedJuly 31, | |
| | 2021 | 2020 | 2019 A |
| Selected Per–Share Data | | | |
| Net asset value, beginning of period | $31.42 | $32.48 | $33.14 |
| Income from Investment Operations | | | |
| Net investment income (loss)B | .28 | .74 | .63 |
| Net realized and unrealized gain (loss) | 2.66 | (1.04) | 2.13 |
| Total from investment operations | 2.94 | (.30) | 2.76 |
| Distributions from net investment income | (.83) | (.75) | (.61) |
| Distributions from net realized gain | – | –C | (2.81) |
| Total distributions | (.83) | (.76)D | (3.42) |
| Net asset value, end of period | $33.53 | $31.42 | $32.48 |
| Total ReturnE,F | 9.37% | (1.15)% | 9.04% |
| Ratios to Average Net AssetsG,H | | | |
| Expenses before reductions | .65%I | .65% | .66%I |
| Expenses net of fee waivers, if any | .65%I | .65% | .66%I |
| Expenses net of all reductions | .65%I | .64% | .64%I |
| Net investment income (loss) | 1.72%I | 2.29% | 2.41%I |
| Supplemental Data | | | |
| Net assets, end of period (000 omitted) | $55,784 | $52,034 | $17,071 |
| Portfolio turnover rateJ | 53%I | 80%K | 56% |
A For the period October 2, 2018 (commencement of sale of shares) to July 31, 2019.
B Calculated based on average shares outstanding during the period.
C Amount represents less than $.005 per share.
D Total distributions per share do not sum due to rounding.
E Total returns for periods of less than one year are not annualized.
F Total returns would have been lower if certain expenses had not been reduced during the applicable periods shown.
G Fees and expenses of any underlying mutual funds or exchange-traded funds (ETFs) are not included in the Fund's expense ratio. The Fund indirectly bears its proportionate share of these expenses. For additional expense information related to investments in Fidelity Central Funds, please refer to the "Investments in Fidelity Central Funds" note found in the Notes to Financial Statements section of the most recent Annual or Semi-Annual report.
H Expense ratios reflect operating expenses of the class. Expenses before reductions do not reflect amounts reimbursed, waived, or reduced through arrangements with the investment adviser, brokerage services, or other offset arrangements, if applicable, and do not represent the amount paid by the class during periods when reimbursements, waivers or reductions occur.
I Annualized
J Amount does not include the portfolio activity of any underlying mutual funds or exchange-traded funds (ETFs).
K Portfolio turnover rate excludes securities received or delivered in-kind.
See accompanying notes which are an integral part of the financial statements.
Notes to Financial Statements (Unaudited)
For the period ended January 31, 2021
1. Organization.
Fidelity Advisor Biotechnology Fund, Fidelity Advisor Communications Equipment Fund, Fidelity Advisor Consumer Discretionary Fund, Fidelity Advisor Energy Fund, Fidelity Advisor Financial Services Fund, Fidelity Advisor Health Care Fund, Fidelity Advisor Industrials Fund, Fidelity Advisor Semiconductors Fund, Fidelity Advisor Technology Fund and Fidelity Advisor Utilities Fund (the Funds) are funds of Fidelity Advisor Series VII (the Trust) and are authorized to issue an unlimited number of shares. The Trust is registered under the Investment Company Act of 1940, as amended (the 1940 Act), as an open-end management investment company organized as a Massachusetts business trust. The Funds are non-diversified with the exception of Fidelity Advisor Financial Services Fund and Fidelity Advisor Health Care Fund. Each class has exclusive voting rights with respect to matters that affect that class. Class C shares will automatically convert to Class A shares after a holding period of ten years from the initial date of purchase, with certain exceptions.
2. Investments in Fidelity Central Funds.
The Funds invest in Fidelity Central Funds, which are open-end investment companies generally available only to other investment companies and accounts managed by the investment adviser and its affiliates. The Funds' Schedules of Investments list each of the Fidelity Central Funds held as of period end, if any, as an investment of each Fund, but do not include the underlying holdings of each Fidelity Central Fund. As an Investing Fund, each Fund indirectly bears its proportionate share of the expenses of the underlying Fidelity Central Funds.
The Money Market Central Funds seek preservation of capital and current income and are managed by the investment adviser. Annualized expenses of the Money Market Central Funds as of their most recent shareholder report date ranged from less than .005% to .01%.
A complete unaudited list of holdings for each Fidelity Central Fund is available upon request or at the Securities and Exchange Commission (the SEC) website at www.sec.gov. In addition, the financial statements of the Fidelity Central Funds are available on the SEC website or upon request.
3. Significant Accounting Policies.
Each Fund is an investment company and applies the accounting and reporting guidance of the Financial Accounting Standards Board (FASB) Accounting Standards Codification Topic 946 Financial Services - Investment Companies. The financial statements have been prepared in conformity with accounting principles generally accepted in the United States of America (GAAP), which require management to make certain estimates and assumptions at the date of the financial statements. Actual results could differ from those estimates. Subsequent events, if any, through the date that the financial statements were issued have been evaluated in the preparation of the financial statements. The following summarizes the significant accounting policies of the Funds:
Investment Valuation. Investments are valued as of 4:00 p.m. Eastern time on the last calendar day of the period. The Board of Trustees (the Board) has delegated the day to day responsibility for the valuation of each Fund's investments to the Fair Value Committee (the Committee) established by each Fund's investment adviser. In accordance with valuation policies and procedures approved by the Board, each Fund attempts to obtain prices from one or more third party pricing vendors or brokers to value its investments. When current market prices, quotations or currency exchange rates are not readily available or reliable, investments will be fair valued in good faith by the Committee, in accordance with procedures adopted by the Board. Factors used in determining fair value vary by investment type and may include market or investment specific events, changes in interest rates and credit quality. The frequency with which these procedures are used cannot be predicted and they may be utilized to a significant extent. The Committee oversees each Fund's valuation policies and procedures and reports to the Board on the Committee's activities and fair value determinations. The Board monitors the appropriateness of the procedures used in valuing each Fund's investments and ratifies the fair value determinations of the Committee.
Each Fund categorizes the inputs to valuation techniques used to value its investments into a disclosure hierarchy consisting of three levels as shown below:
- Level 1 – quoted prices in active markets for identical investments
- Level 2 – other significant observable inputs (including quoted prices for similar investments, interest rates, prepayment speeds, etc.)
- Level 3 – unobservable inputs (including the Fund's own assumptions based on the best information available)
Valuation techniques used to value each Fund's investments by major category are as follows:
Equity securities, including restricted securities, for which market quotations are readily available, are valued at the last reported sale price or official closing price as reported by a third party pricing vendor on the primary market or exchange on which they are traded and are categorized as Level 1 in the hierarchy. In the event there were no sales during the day or closing prices are not available, securities are valued at the last quoted bid price or may be valued using the last available price and are generally categorized as Level 2 in the hierarchy. For foreign equity securities, when market or security specific events arise, comparisons to the valuation of American Depositary Receipts (ADRs), futures contracts, Exchange-Traded Funds (ETFs) and certain indexes as well as quoted prices for similar securities may be used and would be categorized as Level 2 in the hierarchy. For equity securities, including restricted securities, where observable inputs are limited, assumptions about market activity and risk are used and these securities may be categorized as Level 3 in the hierarchy. Securities, including private placements or other restricted securities, for which observable inputs are not available are valued using alternate valuation approaches, including the market approach, the income approach and cost approach, and are categorized as Level 3 in the hierarchy. The market approach considers factors including the price of recent investments in the same or a similar security or financial metrics of comparable securities. The income approach considers factors including expected future cash flows, security specific risks and corresponding discount rates. The cost approach considers factors including the value of the security's underlying assets and liabilities.
Debt securities, including restricted securities, are valued based on evaluated prices received from third party pricing vendors or from brokers who make markets in such securities. Corporate bonds are valued by pricing vendors who utilize matrix pricing which considers yield or price of bonds of comparable quality, coupon, maturity and type or by broker-supplied prices. When independent prices are unavailable or unreliable, debt securities may be valued utilizing pricing methodologies which consider similar factors that would be used by third party pricing vendors. Debt securities are generally categorized as Level 2 in the hierarchy but may be Level 3 depending on the circumstances.
Investments in open-end mutual funds, including the Fidelity Central Funds, are valued at their closing net asset value (NAV) each business day and are categorized as Level 1 in the hierarchy.
The following provides information on Level 3 securities held by Fidelity Advisor Biotechnology Fund and Fidelity Advisor Technology Fund that were valued at period end based on unobservable inputs. These amounts exclude valuations provided by a broker.
Fidelity Advisor Biotechnology Fund:
| Asset Type | Fair Value | Valuation Technique(s) | Unobservable Input | Amount or Range/Weighted Average | Impact to Valuation from an Increase in Input(a) |
| Equities | $ 40,535,822 | Recovery value | Recovery value | 0.0% | Increase |
| | | Market approach | Transaction price | $0.59 - $50.79 / $20.93 | Increase |
| | | | Premium rate | 24.8% - 30.9% / 28.1% | Increase |
| | | Discounted cash flow | Discount rate | 8.0% | Decrease |
| | | | Discount for lack of marketability | 10.0% | Decrease |
(a) Represents the directional change in the fair value of the Level 3 investments that could have resulted from an increase in the corresponding input as of period end. A decrease to the unobservable input would have had the opposite effect. Significant changes in these inputs may have resulted in a significantly higher or lower fair value measurement at period end.
Fidelity Advisor Technology Fund:
| Asset Type | Fair Value | Valuation Technique(s) | Unobservable Input | Amount or Range/Weighted Average | Impact to Valuation from an Increase in Input(a) |
| Equities | $ 40,213,889 | Market comparable | Enterprise value/Sales multiple (EV/S) | 2.2 - 23.2 / 12.9 | Increase |
| | | | Discount rate | 32.5% | Decrease |
| | | | Premium rate | 1.3% - 90.0% / 27.7% | Increase |
| | | Recovery value | Recovery value | 0.0% | Increase |
| | | Market approach | Transaction price | $1.11 - $109.57 / $24.48 | Increase |
| | | | Discount rate | 75.0% | Decrease |
| Preferred Securities | $ 4,035,056 | Market approach | Transaction price | $100.00 | Increase |
(a) Represents the directional change in the fair value of the Level 3 investments that could have resulted from an increase in the corresponding input as of period end. A decrease to the unobservable input would have had the opposite effect. Significant changes in these inputs may have resulted in a significantly higher or lower fair value measurement at period end.
Changes in valuation techniques may result in transfers in or out of an assigned level within the disclosure hierarchy. The aggregate value of investments by input level as of January 31, 2021, as well as a roll forward of Level 3 investments, is included at the end of each Fund's Schedule of Investments.
Foreign Currency. Certain Funds may use foreign currency contracts to facilitate transactions in foreign-denominated securities. Gains and losses from these transactions may arise from changes in the value of the foreign currency or if the counterparties do not perform under the contracts' terms.
Foreign-denominated assets, including investment securities, and liabilities are translated into U.S. dollars at the exchange rates at period end. Purchases and sales of investment securities, income and dividends received, and expenses denominated in foreign currencies are translated into U.S. dollars at the exchange rate in effect on the transaction date.
The effects of exchange rate fluctuations on investments are included with the net realized and unrealized gain (loss) on investment securities. Other foreign currency transactions resulting in realized and unrealized gain (loss) are disclosed separately.
Investment Transactions and Income. For financial reporting purposes, the Funds' investment holdings and NAV include trades executed through the end of the last business day of the period. The NAV per share for processing shareholder transactions is calculated as of the close of business of the New York Stock Exchange (NYSE), normally 4:00 p.m. Eastern time and includes trades executed through the end of the prior business day. Gains and losses on securities sold are determined on the basis of identified cost and for certain Funds include proceeds received from litigation. Dividend income is recorded on the ex-dividend date, except for certain dividends from foreign securities where the ex-dividend date may have passed, which are recorded as soon as the Funds are informed of the ex-dividend date. Non-cash dividends included in dividend income, if any, are recorded at the fair market value of the securities received. Income and capital gain distributions from Fidelity Central Funds, if any, are recorded on the ex-dividend date. Certain distributions received by the Funds represent a return of capital or capital gain. The Funds determine the components of these distributions subsequent to the ex-dividend date, based upon receipt of tax filings or other correspondence relating to the underlying investment. These distributions are recorded as a reduction of cost of investments and/or as a realized gain. Interest income is accrued as earned and includes coupon interest and amortization of premium and accretion of discount on debt securities as applicable. Investment income is recorded net of foreign taxes withheld where recovery of such taxes is uncertain.
Class Allocations and Expenses. Investment income, realized and unrealized capital gains and losses, common expenses of each Fund, and certain fund-level expense reductions, if any, are allocated daily on a pro-rata basis to each class based on the relative net assets of each class to the total net assets of each Fund. Each class differs with respect to transfer agent and distribution and service plan fees incurred. Certain expense reductions may also differ by class. For the reporting period, the allocated portion of income and expenses to each class as a percent of its average net assets may vary due to the timing of recording these transactions in relation to fluctuating net assets of the classes. Expenses directly attributable to a fund are charged to that fund. Expenses attributable to more than one fund are allocated among the respective funds on the basis of relative net assets or other appropriate methods. Expense estimates are accrued in the period to which they relate and adjustments are made when actual amounts are known.
Deferred Trustee Compensation. Under a Deferred Compensation Plan (the Plan) for certain Funds, certain independent Trustees have elected to defer receipt of a portion of their annual compensation. Deferred amounts are invested in affiliated mutual funds, are marked-to-market and remain in a fund until distributed in accordance with the Plan. The investment of deferred amounts and the offsetting payable to the Trustees presented below are included in the accompanying Statement of Assets and Liabilities in other receivables and other payables and accrued expenses, as applicable.
| Fidelity Advisor Energy Fund | $86,596 |
| Fidelity Advisor Technology Fund | 138,683 |
Income Tax Information and Distributions to Shareholders. Each year, each Fund intends to qualify as a regulated investment company under Subchapter M of the Internal Revenue Code, including distributing substantially all of its taxable income and realized gains. As a result, no provision for U.S. Federal income taxes is required. Each Fund files a U.S. federal tax return, in addition to state and local tax returns as required. Each Fund's federal income tax returns are subject to examination by the Internal Revenue Service (IRS) for a period of three fiscal years after they are filed. State and local tax returns may be subject to examination for an additional fiscal year depending on the jurisdiction. Foreign taxes are provided for based on each Fund's understanding of the tax rules and rates that exist in the foreign markets in which it invests. An estimated deferred tax liability for net unrealized appreciation on the applicable securities is included in Other payables and accrued expenses on each applicable Fund's Statement of Assets & Liabilities.
Distributions are declared and recorded on the ex-dividend date. Income and capital gain distributions are declared separately for each class. Income and capital gain distributions are determined in accordance with income tax regulations, which may differ from GAAP.
Capital accounts within the financial statements are adjusted for permanent book-tax differences. These adjustments have no impact on net assets or the results of operations. Capital accounts are not adjusted for temporary book-tax differences which will reverse in a subsequent period.
Book-tax differences are primarily due to foreign currency transactions, certain foreign taxes, passive foreign investment companies (PFIC), deferred Trustees compensation, net operating losses, capital loss carryforwards, defaulted bonds, partnerships, losses deferred due to wash sales and excise tax regulations.
As of period end, the cost and unrealized appreciation (depreciation) in securities, and derivatives if applicable, for federal income tax purposes were as follows for each Fund:
| | Tax cost | Gross unrealized appreciation | Gross unrealized depreciation | Net unrealized appreciation (depreciation) |
| Fidelity Advisor Biotechnology Fund | $2,120,756,833 | $972,413,198 | $(78,816,419) | $893,596,779 |
| Fidelity Advisor Communications Equipment Fund | 14,039,410 | 6,894,830 | (232,755) | 6,662,075 |
| Fidelity Advisor Consumer Discretionary Fund | 341,263,648 | 250,724,155 | (5,442,547) | 245,281,608 |
| Fidelity Advisor Energy Fund | 489,889,916 | 42,691,450 | (87,312,812) | (44,621,362) |
| Fidelity Advisor Financial Services Fund | 280,871,469 | 57,270,423 | (14,627,401) | 42,643,022 |
| Fidelity Advisor Health Care Fund | 4,759,728,913 | 2,274,201,410 | (93,845,026) | 2,180,356,384 |
| Fidelity Advisor Industrials Fund | 477,372,055 | 105,788,473 | (15,983,668) | 89,804,805 |
| Fidelity Advisor Semiconductors Fund | 285,323,047 | 217,365,585 | (2,127,476) | 215,238,109 |
| Fidelity Advisor Technology Fund | 2,319,140,772 | 1,953,108,193 | (21,813,914) | 1,931,294,279 |
| Fidelity Advisor Utilities Fund | 484,229,073 | 109,956,769 | (9,301,921) | 100,654,848 |
Capital loss carryforwards are only available to offset future capital gains of the Funds to the extent provided by regulations and may be limited. The capital loss carryforward information presented below, including any applicable limitation, is estimated as of prior fiscal period end and is subject to adjustment.
| | No expiration | | |
| | Short-term | Long-term | Total capital loss carryforward |
| Fidelity Advisor Communications Equipment Fund | (1,092,952) | – | (1,092,952) |
| Fidelity Advisor Energy Fund | (163,889,041) | (113,158,508) | (277,047,549) |
| Fidelity Advisor Utilities Fund | (13,464,169) | – | (13,464,169) |
In addition, certain of the Funds elected to defer to the next fiscal year capital losses recognized during the period November 1, 2019 to July 31, 2020, and ordinary losses recognized during the period January 1, 2020 to July 31, 2020. Loss deferrals were as follows:
| | Capital losses | Ordinary losses |
| Fidelity Advisor Biotechnology Fund | $(15,917,227) | $– |
| Fidelity Advisor Communications Equipment Fund | – | (17,116) |
| Fidelity Advisor Consumer Discretionary Fund | – | (687,868) |
| Fidelity Advisor Industrials Fund | (1,998,398) | (197,196) |
Restricted Securities (including Private Placements). The Funds may invest in securities that are subject to legal or contractual restrictions on resale. These securities generally may be resold in transactions exempt from registration or to the public if the securities are registered. Disposal of these securities may involve time-consuming negotiations and expense, and prompt sale at an acceptable price may be difficult. Information regarding restricted securities is included at the end of each applicable Fund's Schedule of Investments.
Consolidated Subsidiary. The Funds included in the table below hold certain investments through a wholly-owned subsidiary ("Subsidiary"), which may be subject to federal and state taxes upon disposition.
As of period end, investments in Subsidiaries were as follows:
| | $ Amount | % of Net Assets |
| Fidelity Advisor Biotechnology Fund | 14,522,990 | .52% |
The financial statements have been consolidated to include the Subsidiary accounts where applicable. Accordingly, all inter-company transactions and balances have been eliminated.
At period end, any estimated tax liability for these investments is presented as "Deferred taxes" in the Statement of Assets and Liabilities and included in "Change in net unrealized appreciation (depreciation) on investment securities" in the Statement of Operations. The tax liability incurred may differ materially depending on conditions when these investments are disposed. Any cash held by a Subsidiary is restricted as to its use and is presented as "Restricted cash" in the Statement of Assets and Liabilities, if applicable.
4. Purchases and Sales of Investments.
Purchases and sales of securities, other than short-term securities, are noted in the table below.
| | Purchases ($) | Sales ($) |
| Fidelity Advisor Biotechnology Fund | 1,151,271,382 | 1,180,570,676 |
| Fidelity Advisor Communications Equipment Fund | 5,536,626 | 6,646,464 |
| Fidelity Advisor Consumer Discretionary Fund | 175,771,574 | 143,457,515 |
| Fidelity Advisor Energy Fund | 69,892,626 | 78,949,816 |
| Fidelity Advisor Financial Services Fund | 86,334,145 | 126,835,797 |
| Fidelity Advisor Health Care Fund | 1,643,990,199 | 1,266,612,400 |
| Fidelity Advisor Industrials Fund | 501,263,605 | 463,393,048 |
| Fidelity Advisor Semiconductors Fund | 123,632,235 | 110,776,905 |
| Fidelity Advisor Technology Fund | 1,143,282,985 | 1,205,389,646 |
| Fidelity Advisor Utilities Fund | 151,504,292 | 236,432,702 |
5. Fees and Other Transactions with Affiliates.
Management Fee. Fidelity Management & Research Company LLC (the investment adviser) and its affiliates provide the Funds with investment management related services for which the Funds pay a monthly management fee. The management fee is the sum of an individual fund fee rate and an annualized group fee rate. The individual fund fee rate is applied to each Fund's average net assets. The group fee rate is based upon the monthly average net assets of a group of registered investment companies with which the investment adviser has management contracts. The group fee rate decreases as assets under management increase and increases as assets under management decrease. For the reporting period, each Fund's annualized management fee rate expressed as a percentage of each Fund's average net assets was as follows:
| | Individual Rate | Group Rate | Total |
| Fidelity Advisor Biotechnology Fund | .30% | .23% | .53% |
| Fidelity Advisor Communications Equipment Fund | .30% | .23% | .53% |
| Fidelity Advisor Consumer Discretionary Fund | .30% | .23% | .53% |
| Fidelity Advisor Energy Fund | .30% | .23% | .53% |
| Fidelity Advisor Financial Services Fund | .30% | .23% | .53% |
| Fidelity Advisor Health Care Fund | .30% | .23% | .53% |
| Fidelity Advisor Industrials Fund | .30% | .23% | .53% |
| Fidelity Advisor Semiconductors Fund | .30% | .23% | .53% |
| Fidelity Advisor Technology Fund | .30% | .23% | .53% |
| Fidelity Advisor Utilities Fund | .30% | .23% | .53% |
Distribution and Service Plan Fees. In accordance with Rule 12b-1 of the 1940 Act, each Fund has adopted separate Distribution and Service Plans for each class of shares. Certain classes pay Fidelity Distributors Company LLC (FDC), an affiliate of the investment adviser, separate Distribution and Service Fees, each of which is based on an annual percentage of each class' average net assets. In addition, FDC may pay financial intermediaries for selling shares of each Fund and providing shareholder support services. For the period, the Distribution and Service Fee rates, total fees and amounts retained by FDC were as follows:
| | Distribution Fee | Service Fee | Total Fees | Retained by FDC |
| Fidelity Advisor Biotechnology Fund | | | | |
| Class A | -% | .25% | $970,486 | $11,651 |
| Class M | .25% | .25% | 392,494 | 854 |
| Class C | .75% | .25% | 2,004,249 | 137,217 |
| | | | $3,367,229 | $149,722 |
| Fidelity Advisor Communications Equipment Fund | | | | |
| Class A | -% | .25% | $11,925 | $621 |
| Class M | .25% | .25% | 9,858 | – |
| Class C | .75% | .25% | 12,543 | 2,190 |
| | | | $34,326 | $2,811 |
| Fidelity Advisor Consumer Discretionary Fund | | | | |
| Class A | -% | .25% | $229,298 | $5,150 |
| Class M | .25% | .25% | 96,524 | – |
| Class C | .75% | .25% | 367,408 | 30,401 |
| | | | $693,230 | $35,551 |
| Fidelity Advisor Energy Fund | | | | |
| Class A | -% | .25% | $143,845 | $8,113 |
| Class M | .25% | .25% | 109,928 | 1,416 |
| Class C | .75% | .25% | 216,968 | 43,828 |
| | | | $470,741 | $53,357 |
| Fidelity Advisor Financial Services Fund | | | | |
| Class A | -% | .25% | $142,259 | $4,201 |
| Class M | .25% | .25% | 92,860 | 102 |
| Class C | .75% | .25% | 215,953 | 18,707 |
| | | | $451,072 | $23,101 |
| Fidelity Advisor Health Care Fund | | | | |
| Class A | -% | .25% | $1,823,086 | $36,523 |
| Class M | .25% | .25% | 908,250 | 4,440 |
| Class C | .75% | .25% | 3,427,554 | 450,683 |
| | | | $6,158,890 | $491,646 |
| Fidelity Advisor Industrials Fund | | | | |
| Class A | -% | .25% | $275,334 | $3,196 |
| Class M | .25% | .25% | 126,312 | 802 |
| Class C | .75% | .25% | 288,915 | 15,358 |
| | | | $690,561 | $19,356 |
| Fidelity Advisor Semiconductors Fund | | | | |
| Class A | -% | .25% | $209,013 | $7,006 |
| Class M | .25% | .25% | 86,617 | 874 |
| Class C | .75% | .25% | 329,138 | 42,281 |
| | | | $624,768 | $50,161 |
| Fidelity Advisor Technology Fund | | | | |
| Class A | -% | .25% | $1,878,582 | $46,524 |
| Class M | .25% | .25% | 1,305,490 | 11,918 |
| Class C | .75% | .25% | 1,915,341 | 324,194 |
| | | | $5,099,413 | $382,636 |
| Fidelity Advisor Utilities Fund | | | | |
| Class A | -% | .25% | $305,140 | $7,389 |
| Class M | .25% | .25% | 149,266 | 796 |
| Class C | .75% | .25% | 299,297 | 54,166 |
| | | | $753,703 | $62,351 |
Sales Load. FDC may receive a front-end sales charge of up to 5.75% for selling Class A shares and 3.50% for selling Class M shares, some of which is paid to financial intermediaries for selling shares of each Fund. Depending on the holding period, FDC may receive contingent deferred sales charges levied on Class A, Class M and Class C redemptions. The deferred sales charges are 1.00% for Class C shares, 1.00% for certain purchases of Class A shares and .25% for certain purchases of Class M shares.
For the period, sales charge amounts retained by FDC were as follows:
| | Retained by FDC |
| Fidelity Advisor Biotechnology Fund | |
| Class A | $146,838 |
| Class M | 11,570 |
| Class C(a) | 10,387 |
| | $168,795 |
| Fidelity Advisor Communications Equipment Fund | |
| Class A | $2,747 |
| Class M | 311 |
| Class C(a) | 92 |
| | $3,150 |
| Fidelity Advisor Consumer Discretionary Fund | |
| Class A | $60,318 |
| Class M | 6,367 |
| Class C(a) | 2,190 |
| | $68,875 |
| Fidelity Advisor Energy Fund | |
| Class A | $20,997 |
| Class M | 4,711 |
| Class C(a) | 8,480 |
| | $34,188 |
| Fidelity Advisor Financial Services Fund | |
| Class A | $14,237 |
| Class M | 1,633 |
| Class C(a) | 4,070 |
| | $19,940 |
| Fidelity Advisor Health Care Fund | |
| Class A | $361,977 |
| Class M | 28,078 |
| Class C(a) | 27,597 |
| | $417,652 |
| Fidelity Advisor Industrials Fund | |
| Class A | $23,393 |
| Class M | 3,985 |
| Class C(a) | 1,110 |
| | $28,488 |
| Fidelity Advisor Semiconductors Fund | |
| Class A | $61,815 |
| Class M | 3,828 |
| Class C(a) | 3,741 |
| | $69,384 |
| Fidelity Advisor Technology Fund | |
| Class A | $323,202 |
| Class M | 30,800 |
| Class C(a) | 27,007 |
| | $381,009 |
| Fidelity Advisor Utilities Fund | |
| Class A | $30,090 |
| Class M | 6,056 |
| Class C(a) | 4,398 |
| | $40,544 |
(a) When Class C shares are initially sold, FDC pays commissions from its own resources to financial intermediaries through which the sales are made.
Transfer Agent Fees. Fidelity Investments Institutional Operations Company LLC (FIIOC), an affiliate of the investment adviser, is the transfer, dividend disbursing and shareholder servicing agent for each class of the Funds. FIIOC receives account fees and asset-based fees that vary according to the account size and type of account of the shareholders of the respective classes of each Fund, except for Class Z. FIIOC receives an asset-based fee of Class Z's average net assets. FIIOC pays for typesetting, printing and mailing of shareholder reports, except proxy statements. For the period, transfer agent fees for each class were as follows:
| | Amount | % of Class-Level Average Net Assets(a) |
| Fidelity Advisor Biotechnology Fund | | |
| Class A | $726,493 | .19 |
| Class M | 168,905 | .22 |
| Class C | 369,719 | .18 |
| Class I | 1,030,599 | .17 |
| Class Z | 16,199 | .04 |
| | $2,311,915 | |
| Fidelity Advisor Communications Equipment Fund | | |
| Class A | $13,437 | .28 |
| Class M | 5,742 | .29 |
| Class C | 3,578 | .29 |
| Class I | 1,221 | .16 |
| | $23,978 | |
| Fidelity Advisor Consumer Discretionary Fund | | |
| Class A | $172,005 | .19 |
| Class M | 38,750 | .20 |
| Class C | 70,752 | .19 |
| Class I | 130,251 | .16 |
| Class Z | 11,975 | .04 |
| | $423,733 | |
| Fidelity Advisor Energy Fund | | |
| Class A | $157,580 | .27 |
| Class M | 60,957 | .28 |
| Class C | 55,150 | .25 |
| Class I | 145,900 | .19 |
| Class Z | 8,664 | .04 |
| | $428,251 | |
| Fidelity Advisor Financial Services Fund | | |
| Class A | $124,104 | .22 |
| Class M | 41,490 | .22 |
| Class C | 47,790 | .22 |
| Class I | 50,707 | .17 |
| Class Z | 6,091 | .04 |
| | $270,182 | |
| Fidelity Advisor Health Care Fund | | |
| Class A | $1,300,018 | .18 |
| Class M | 329,999 | .18 |
| Class C | 617,787 | .18 |
| Class I | 2,382,649 | .17 |
| Class Z | 148,915 | .04 |
| | $4,779,368 | |
| Fidelity Advisor Industrials Fund | | |
| Class A | $209,895 | .19 |
| Class M | 50,983 | .20 |
| Class C | 57,407 | .20 |
| Class I | 145,929 | .17 |
| Class Z | 8,129 | .04 |
| | $472,343 | |
| Fidelity Advisor Semiconductors Fund | | |
| Class A | $157,411 | .19 |
| Class M | 35,806 | .21 |
| Class C | 64,523 | .20 |
| Class I | 126,440 | .17 |
| Class Z | 2,317 | .04 |
| | $386,497 | |
| Fidelity Advisor Technology Fund | | |
| Class A | $1,293,329 | .17 |
| Class M | 439,915 | .17 |
| Class C | 353,255 | .18 |
| Class I | 958,783 | .16 |
| Class Z | 78,206 | .04 |
| | $3,123,488 | |
| Fidelity Advisor Utilities Fund | | |
| Class A | $244,995 | .20 |
| Class M | 68,578 | .23 |
| Class C | 61,496 | .21 |
| Class I | 147,865 | .17 |
| Class Z | 12,135 | .04 |
| | $535,069 | |
(a) Annualized
Accounting Fees. Fidelity Service Company, Inc. (FSC), an affiliate of the investment adviser, maintains each Fund's accounting records. The accounting fee is based on the level of average net assets for each month. For the period, the fees were equivalent to the following annualized rates:
| | % of Average Net Assets |
| Fidelity Advisor Biotechnology Fund | .03 |
| Fidelity Advisor Communications Equipment Fund | .04 |
| Fidelity Advisor Consumer Discretionary Fund | .04 |
| Fidelity Advisor Energy Fund | .04 |
| Fidelity Advisor Financial Services Fund | .04 |
| Fidelity Advisor Health Care Fund | .02 |
| Fidelity Advisor Industrials Fund | .04 |
| Fidelity Advisor Semiconductors Fund | .04 |
| Fidelity Advisor Technology Fund | .03 |
| Fidelity Advisor Utilities Fund | .04 |
Brokerage Commissions. A portion of portfolio transactions were placed with brokerage firms which are affiliates of the investment adviser. Brokerage commissions are included in net realized gain (loss) and change in net unrealized appreciation (depreciation) in the Statement of Operations. The commissions paid to these affiliated firms were as follows:
| | Amount |
| Fidelity Advisor Biotechnology Fund | $ 35,493 |
| Fidelity Advisor Communications Equipment Fund | 303 |
| Fidelity Advisor Consumer Discretionary Fund | 1,214 |
| Fidelity Advisor Energy Fund | 7,439 |
| Fidelity Advisor Financial Services Fund | 2,812 |
| Fidelity Advisor Health Care Fund | 23,381 |
| Fidelity Advisor Industrials Fund | 9,415 |
| Fidelity Advisor Semiconductors Fund | 1,809 |
| Fidelity Advisor Technology Fund | 18,508 |
| Fidelity Advisor Utilities Fund | 4,379 |
Interfund Lending Program. Pursuant to an Exemptive Order issued by the SEC, each Fund, along with other registered investment companies having management contracts with Fidelity Management & Research Company LLC (FMR), or other affiliated entities of FMR, may participate in an interfund lending program. This program provides an alternative credit facility allowing each Fund to borrow from, or lend money to, other participating affiliated funds. At period end, there were no interfund loans outstanding. Activity in this program during the period for which loans were outstanding was as follows:
| | Borrower or Lender | Average Loan Balance | Weighted Average Interest Rate | Interest Expense |
| Fidelity Advisor Biotechnology Fund | Borrower | $8,588,000 | .33% | $315 |
| Fidelity Advisor Consumer Discretionary Fund | Borrower | $5,616,250 | .33% | $204 |
| Fidelity Advisor Energy Fund | Borrower | $10,027,000 | .34% | $189 |
| Fidelity Advisor Financial Services Fund | Borrower | $8,160,000 | .34% | $380 |
| Fidelity Advisor Health Care Fund | Borrower | $12,265,111 | .33% | $1,024 |
| Fidelity Advisor Technology Fund | Borrower | $10,769,000 | .33% | $1,590 |
| Fidelity Advisor Utilities Fund | Borrower | $8,564,000 | .33% | $391 |
Interfund Trades. Funds may purchase from or sell securities to other Fidelity Funds under procedures adopted by the Board. The procedures have been designed to ensure these interfund trades are executed in accordance with Rule 17a-7 of the 1940 Act. Interfund trades are included within the respective purchases and sales amounts shown in the Purchases and Sales of Investments note and are noted in the table below.
| | Purchases ($) | Sales ($) |
| Fidelity Advisor Biotechnology Fund | 116,884,558 | 69,328,590 |
| Fidelity Advisor Communications Equipment Fund | 697,485 | 43,879 |
| Fidelity Advisor Consumer Discretionary Fund | 15,818,194 | 9,315,219 |
| Fidelity Advisor Energy Fund | 2,747,269 | 3,674,950 |
| Fidelity Advisor Financial Services Fund | 1,508,401 | 10,012,844 |
| Fidelity Advisor Health Care Fund | 197,763,971 | 53,658,576 |
| Fidelity Advisor Industrials Fund | 33,306,415 | 40,010,244 |
| Fidelity Advisor Semiconductors Fund | 13,232,840 | 20,207,670 |
| Fidelity Advisor Technology Fund | 114,334,033 | 117,362,604 |
| Fidelity Advisor Utilities Fund | 1,099,585 | 7,943,092 |
Prior Fiscal Year Affiliated Exchanges In-Kind. During the prior period, Fidelity Advisor Consumer Discretionary Fund, Fidelity Advisor Energy Fund, Fidelity Advisor Financial Services Fund, Fidelity Advisor Health Care Fund, Fidelity Advisor Industrials Fund, Fidelity Advisor Technology Fund and Fidelity Advisor Utilities Fund received investments and cash in exchange for shares of the Fund. The amount of in-kind exchanges is included in share transactions in the accompanying Statement of Changes in Net Assets as well as the Notes to Financial Statements.
| | Shares | Value of investments and cash |
| Fidelity Advisor Consumer Discretionary Fund | 340,887 | $10,509,560 |
| Fidelity Advisor Energy Fund | 1,418,542 | 37,704,833 |
| Fidelity Advisor Financial Services Fund | 1,072,326 | 22,465,229 |
| Fidelity Advisor Health Care Fund | 2,311,335 | 122,939,907 |
| Fidelity Advisor Industrials Fund | 331,589 | 13,207,212 |
| Fidelity Advisor Technology Fund | 1,742,932 | 97,220,739 |
| Fidelity Advisor Utilities Fund | 757,866 | 24,994,414 |
6. Committed Line of Credit.
Certain Funds participate with other funds managed by the investment adviser or an affiliate in a $4.25 billion credit facility (the "line of credit") to be utilized for temporary or emergency purposes to fund shareholder redemptions or for other short-term liquidity purposes. The participating funds have agreed to pay commitment fees on their pro-rata portion of the line of credit, which are reflected in Miscellaneous expenses on the Statement of Operations, and are listed below.
| | Amount |
| Fidelity Advisor Biotechnology Fund | $2,601 |
| Fidelity Advisor Communications Equipment Fund | 18 |
| Fidelity Advisor Consumer Discretionary Fund | 495 |
| Fidelity Advisor Energy Fund | 395 |
| Fidelity Advisor Financial Services Fund | 284 |
| Fidelity Advisor Health Care Fund | 5,962 |
| Fidelity Advisor Industrials Fund | 523 |
| Fidelity Advisor Semiconductors Fund | 413 |
| Fidelity Advisor Technology Fund | 3,860 |
| Fidelity Advisor Utilities Fund | 606 |
During the period, there were no borrowings on this line of credit.
7. Security Lending.
Funds lend portfolio securities from time to time in order to earn additional income. Lending agents are used, including National Financial Services (NFS), an affiliate of the investment adviser. Pursuant to a securities lending agreement, NFS will receive a fee, which is capped at 9.9% of a fund's daily lending revenue, for its services as lending agent. A fund may lend securities to certain qualified borrowers, including NFS. On the settlement date of the loan, a fund receives collateral (in the form of U.S. Treasury obligations, letters of credit and/or cash) against the loaned securities and maintains collateral in an amount not less than 100% of the market value of the loaned securities during the period of the loan. The market value of the loaned securities is determined at the close of business of a fund and any additional required collateral is delivered to a fund on the next business day. A fund or borrower may terminate the loan at any time, and if the borrower defaults on its obligation to return the securities loaned because of insolvency or other reasons, a fund may apply collateral received from the borrower against the obligation. A fund may experience delays and costs in recovering the securities loaned. Any cash collateral received is invested in the Fidelity Securities Lending Cash Central Fund. Any loaned securities are identified as such in the Schedule of Investments, and the value of loaned securities and cash collateral at period end, as applicable, are presented in the Statement of Assets and Liabilities. Security lending income represents the income earned on investing cash collateral, less rebates paid to borrowers and any lending agent fees associated with the loan, plus any premium payments received for lending certain types of securities. Security lending income is presented in the Statement of Operations as a component of income from Fidelity Central Funds. Affiliated security lending activity, if any, was as follows:
| | Total Security Lending Income Fees Paid to NFS | Security Lending Income From Securities Loaned to NFS | Value of Securities Loaned to NFS at Period End |
| Fidelity Advisor Biotechnology Fund | $37,897 | $73,485 | $517,272 |
| Fidelity Advisor Communications Equipment Fund | $840 | $496 | $– |
| Fidelity Advisor Consumer Discretionary Fund | $440 | $273 | $– |
| Fidelity Advisor Energy Fund | $2,245 | $– | $– |
| Fidelity Advisor Financial Services Fund | $38 | $– | $– |
| Fidelity Advisor Health Care Fund | $18,223 | $39,164 | $– |
| Fidelity Advisor Industrials Fund | $210 | $– | $– |
| Fidelity Advisor Semiconductors Fund | $203 | $– | $– |
| Fidelity Advisor Technology Fund | $1,788 | $85 | $– |
| Fidelity Advisor Utilities Fund | $191 | $– | $– |
8. Bank Borrowings.
Each Fund is permitted to have bank borrowings for temporary or emergency purposes to fund shareholder redemptions or for other short-term liquidity requirements. Each Fund has established borrowing arrangements with certain banks. The interest rate on the borrowings is the bank's base rate, as revised from time to time. Any open loans, including accrued interest, at period end are presented under the caption "Notes payable" in the Statement of Assets and Liabilities, if applicable. Activity in this program during the period for which loans were outstanding was as follows:
| | Average Loan Balance | Weighted Average Interest Rate | Interest Expense |
| Fidelity Advisor Financial Services Fund | $30,656,000 | .60% | $511 |
9. Expense Reductions.
The investment adviser contractually agreed to reimburse expenses of each class of each Fund to the extent annual operating expenses exceeded certain levels of class-level average net assets as noted in the table below. This reimbursement will remain in place through November 30, 2021. Some expenses, for example the compensation of the independent Trustees, and certain other expenses such as interest expense, are excluded from this reimbursement.
The following classes of each applicable Fund were in reimbursement during the period:
| | Expense Limitations | Reimbursement |
| Fidelity Advisor Communications Equipment Fund | | |
| Class A | 1.40% | $28,297 |
| Class M | 1.65% | 11,975 |
| Class C | 2.15% | 7,633 |
| Class I | 1.15% | 3,569 |
Commissions paid to certain brokers with whom the investment adviser, or its affiliates, places trades on behalf of certain Funds include an amount in addition to trade execution, which may be rebated back to the Funds to offset expenses. In addition, through arrangements with each applicable Fund's custodian, credits realized as a result of certain uninvested cash balances were used to reduce each applicable Fund's or class' expenses. All of the applicable expense reductions are noted in the table below.
| | Brokerage service rebates | Custodian credits |
| Fidelity Advisor Biotechnology Fund | $33,729 | $43 |
| Fidelity Advisor Consumer Discretionary Fund | 2,951 | – |
| Fidelity Advisor Financial Services Fund | 9,569 | – |
| Fidelity Advisor Health Care Fund | 64,427 | 123 |
| Fidelity Advisor Industrials Fund | 2,827 | – |
| Fidelity Advisor Technology Fund | 59,533 | – |
| Fidelity Advisor Utilities Fund | 24,630 | – |
In addition, during the period the investment adviser or an affiliate reimbursed and/or waived a portion of fund-level operating expenses as follows:
| | Fund-Level Amount |
| Fidelity Advisor Biotechnology Fund | $4,173 |
| Fidelity Advisor Communications Equipment Fund | 27 |
| Fidelity Advisor Consumer Discretionary Fund | 805 |
| Fidelity Advisor Energy Fund | 651 |
| Fidelity Advisor Financial Services Fund | 450 |
| Fidelity Advisor Health Care Fund | 9,399 |
| Fidelity Advisor Industrials Fund | 873 |
| Fidelity Advisor Semiconductors Fund | 705 |
| Fidelity Advisor Technology Fund | 6,390 |
| Fidelity Advisor Utilities Fund | 878 |
10. Distributions to Shareholders.
Distributions to shareholders of each class were as follows:
| | Six months ended
January 31, 2021 | Year ended
July 31, 2020 |
| Fidelity Advisor Biotechnology Fund | | |
| Distributions to shareholders | | |
| Class A | $65,073,691 | $40,863,434 |
| Class M | 13,799,393 | 8,608,302 |
| Class C | 38,343,013 | 29,571,463 |
| Class I | 96,636,150 | 61,591,087 |
| Class Z | 6,517,393 | 2,303,394 |
| Total | $220,369,640 | $142,937,680 |
| Fidelity Advisor Consumer Discretionary Fund | | |
| Distributions to shareholders | | |
| Class A | $2,799,807 | $4,116,798 |
| Class M | 644,893 | 929,194 |
| Class C | 1,412,829 | 2,338,201 |
| Class I | 2,190,120 | 3,149,331 |
| Class Z | 778,378 | 723,471 |
| Total | $7,826,027 | $11,256,995 |
| Fidelity Advisor Energy Fund | | |
| Distributions to shareholders | | |
| Class A | $3,957,441 | $2,688,540 |
| Class M | 1,322,704 | 985,221 |
| Class C | 1,232,239 | 659,426 |
| Class I | 5,542,085 | 3,336,904 |
| Class Z | 1,451,982 | 1,110,508 |
| Total | $13,506,451 | $8,780,599 |
| Fidelity Advisor Financial Services Fund | | |
| Distributions to shareholders | | |
| Class A | $3,032,829 | $1,824,086 |
| Class M | 897,549 | 493,589 |
| Class C | 858,669 | 317,172 |
| Class I | 1,637,605 | 1,626,928 |
| Class Z | 806,152 | 473,236 |
| Total | $7,232,804 | $4,735,011 |
| Fidelity Advisor Health Care Fund | | |
| Distributions to shareholders | | |
| Class A | $85,255,075 | $3,927,602 |
| Class M | 21,586,352 | 1,147,016 |
| Class C | 45,636,053 | 2,538,507 |
| Class I | 163,297,129 | 9,099,909 |
| Class Z | 40,256,853 | 2,607,868 |
| Total | $356,031,462 | $19,320,902 |
| Fidelity Advisor Industrials Fund | | |
| Distributions to shareholders | | |
| Class A | $1,360,584 | $18,388,918 |
| Class M | 326,687 | 4,119,707 |
| Class C | 410,014 | 5,971,134 |
| Class I | 1,091,334 | 13,357,871 |
| Class Z | 227,127 | 2,089,800 |
| Total | $3,415,746 | $43,927,430 |
| Fidelity Advisor Semiconductors Fund | | |
| Distributions to shareholders | | |
| Class A | $8,071,169 | $1,274,755 |
| Class M | 1,689,234 | 264,058 |
| Class C | 3,556,245 | 523,732 |
| Class I | 7,098,112 | 1,293,451 |
| Class Z | 517,662 | 140,905 |
| Total | $20,932,422 | $3,496,901 |
| Fidelity Advisor Technology Fund | | |
| Distributions to shareholders | | |
| Class A | $121,012,095 | $24,794,599 |
| Class M | 44,308,570 | 8,680,589 |
| Class C | 36,326,191 | 6,376,707 |
| Class I | 89,512,609 | 18,523,848 |
| Class Z | 28,017,125 | 3,992,905 |
| Total | $319,176,590 | $62,368,648 |
| Fidelity Advisor Utilities Fund | | |
| Distributions to shareholders | | |
| Class A | $5,044,517 | $5,344,171 |
| Class M | 1,092,413 | 1,063,561 |
| Class C | 758,565 | 924,262 |
| Class I | 3,725,913 | 5,554,769 |
| Class Z | 1,426,998 | 1,044,627 |
| Total | $12,048,406 | $13,931,390 |
11. Share Transactions.
Share transactions for each class were as follows and may contain automatic conversions between classes or exchanges between affiliated funds:
| | Shares | Shares | Dollars | Dollars |
| | Six months ended January 31, 2021 | Year ended July 31, 2020 | Six months ended January 31, 2021 | Year ended July 31, 2020 |
| Fidelity Advisor Biotechnology Fund | | | | |
| Class A | | | | |
| Shares sold | 2,311,468 | 4,476,939 | $77,806,426 | $129,852,578 |
| Reinvestment of distributions | 1,730,026 | 1,386,979 | 59,374,482 | 38,627,357 |
| Shares redeemed | (2,547,244) | (6,779,279) | (84,269,418) | (181,633,714) |
| Net increase (decrease) | 1,494,250 | (915,361) | $52,911,490 | $(13,153,779) |
| Class M | | | | |
| Shares sold | 522,638 | 875,738 | $16,237,331 | $23,191,732 |
| Reinvestment of distributions | 427,175 | 326,946 | 13,669,581 | 8,546,370 |
| Shares redeemed | (501,689) | (1,197,844) | (15,488,910) | (30,411,303) |
| Net increase (decrease) | 448,124 | 4,840 | $14,418,002 | $1,326,799 |
| Class C | | | | |
| Shares sold | 704,214 | 1,316,924 | $19,512,844 | $31,385,640 |
| Reinvestment of distributions | 1,314,550 | 1,155,478 | 37,162,311 | 27,049,731 |
| Shares redeemed | (2,046,006) | (6,033,882) | (56,827,277) | (140,899,467) |
| Net increase (decrease) | (27,242) | (3,561,480) | $(152,122) | $(82,464,096) |
| Class I | | | | |
| Shares sold | 4,439,844 | 8,470,953 | $156,822,304 | $257,423,341 |
| Reinvestment of distributions | 2,222,658 | 1,716,365 | 81,860,416 | 50,993,195 |
| Shares redeemed | (4,178,052) | (14,414,703) | (147,531,016) | (407,260,427) |
| Net increase (decrease) | 2,484,450 | (4,227,385) | $91,151,704 | $(98,843,891) |
| Class Z | | | | |
| Shares sold | 797,960 | 1,769,931 | $28,408,632 | $54,979,279 |
| Reinvestment of distributions | 144,794 | 65,751 | 5,340,056 | 1,955,433 |
| Shares redeemed | (556,035) | (1,058,458) | (19,636,366) | (31,746,874) |
| Net increase (decrease) | 386,719 | 777,224 | $14,112,322 | $25,187,838 |
| Fidelity Advisor Communications Equipment Fund | | | | |
| Class A | | | | |
| Shares sold | 99,810 | 217,044 | $1,494,342 | $2,771,341 |
| Shares redeemed | (175,338) | (445,959) | (2,480,079) | (6,207,767) |
| Net increase (decrease) | (75,528) | (228,915) | $(985,737) | $(3,436,426) |
| Class M | | | | |
| Shares sold | 10,416 | 36,130 | $151,083 | $462,021 |
| Shares redeemed | (32,221) | (85,605) | (435,435) | (1,118,547) |
| Net increase (decrease) | (21,805) | (49,475) | $(284,352) | $(656,526) |
| Class C | | | | |
| Shares sold | 8,326 | 84,351 | $104,944 | $980,333 |
| Shares redeemed | (33,061) | (256,986) | (409,344) | (3,133,279) |
| Net increase (decrease) | (24,735) | (172,635) | $(304,400) | $(2,152,946) |
| Class I | | | | |
| Shares sold | 40,390 | 33,038 | $603,251 | $466,923 |
| Shares redeemed | (30,762) | (217,484) | (455,086) | (3,137,525) |
| Net increase (decrease) | 9,628 | (184,446) | $148,165 | $(2,670,602) |
| Fidelity Advisor Consumer Discretionary Fund | | | | |
| Class A | | | | |
| Shares sold | 687,438 | 987,448 | $26,745,414 | $29,191,888 |
| Reinvestment of distributions | 66,769 | 132,999 | 2,706,144 | 4,013,924 |
| Shares redeemed | (500,215) | (1,723,422) | (19,128,622) | (49,014,820) |
| Net increase (decrease) | 253,992 | (602,975) | $10,322,936 | $(15,809,008) |
| Class M | | | | |
| Shares sold | 140,247 | 155,773 | $5,095,945 | $4,255,414 |
| Reinvestment of distributions | 17,054 | 33,065 | 639,182 | 926,158 |
| Shares redeemed | (101,058) | (283,850) | (3,559,836) | (7,619,627) |
| Net increase (decrease) | 56,243 | (95,012) | $2,175,291 | $(2,438,055) |
| Class C | | | | |
| Shares sold | 276,270 | 330,132 | $8,425,676 | $7,749,039 |
| Reinvestment of distributions | 43,840 | 94,530 | 1,398,073 | 2,269,668 |
| Shares redeemed | (299,346) | (938,311) | (9,085,553) | (21,317,477) |
| Net increase (decrease) | 20,764 | (513,649) | $738,196 | $(11,298,770) |
| Class I | | | | |
| Shares sold | 1,684,495 | 1,960,114 | $71,822,417 | $61,846,005 |
| Reinvestment of distributions | 44,468 | 86,481 | 1,963,243 | 2,831,372 |
| Shares redeemed | (1,179,797) | (3,309,001) | (49,135,954) | (100,848,947) |
| Net increase (decrease) | 549,166 | (1,262,406) | $24,649,706 | $(36,171,570) |
| Class Z | | | | |
| Shares sold | 690,537 | 1,633,004(a) | $29,227,009 | $53,010,630(a) |
| Reinvestment of distributions | 14,813 | 21,250 | 656,091 | 697,006 |
| Shares redeemed | (682,597) | (538,980) | (28,789,916) | (15,367,644) |
| Net increase (decrease) | 22,753 | 1,115,274 | $1,093,184 | $38,339,992 |
| Fidelity Advisor Energy Fund | | | | |
| Class A | | | | |
| Shares sold | 1,201,840 | 2,921,562 | $20,574,482 | $51,419,972 |
| Reinvestment of distributions | 210,429 | 95,010 | 3,850,848 | 2,593,762 |
| Shares redeemed | (1,389,534) | (2,978,037) | (23,435,611) | (63,901,347) |
| Net increase (decrease) | 22,735 | 38,535 | $989,719 | $(9,887,613) |
| Class M | | | | |
| Shares sold | 298,981 | 536,631 | $5,538,060 | $10,688,495 |
| Reinvestment of distributions | 68,479 | 34,199 | 1,287,399 | 957,921 |
| Shares redeemed | (422,594) | (1,050,158) | (7,524,405) | (23,326,366) |
| Net increase (decrease) | (55,134) | (479,328) | $(698,946) | $(11,679,950) |
| Class C | | | | |
| Shares sold | 257,980 | 952,342 | $4,287,606 | $14,926,711 |
| Reinvestment of distributions | 71,624 | 25,382 | 1,205,425 | 638,866 |
| Shares redeemed | (589,674) | (1,543,989) | (9,138,315) | (30,880,652) |
| Net increase (decrease) | (260,070) | (566,265) | $(3,645,284) | $(15,315,075) |
| Class I | | | | |
| Shares sold | 2,226,823 | 7,515,819 | $40,987,570 | $141,901,116 |
| Reinvestment of distributions | 263,571 | 107,684 | 5,089,551 | 3,095,929 |
| Shares redeemed | (3,026,814) | (6,438,806) | (54,542,538) | (143,255,421) |
| Net increase (decrease) | (536,420) | 1,184,697 | $(8,465,417) | $1,741,624 |
| Class Z | | | | |
| Shares sold | 1,287,994 | 3,592,181(a) | $24,174,888 | $80,138,784(a) |
| Reinvestment of distributions | 73,062 | 37,631 | 1,407,175 | 1,079,250 |
| Shares redeemed | (1,008,841) | (1,614,597) | (18,481,234) | (34,040,181) |
| Net increase (decrease) | 352,215 | 2,015,215 | $7,100,829 | $47,177,853 |
| Fidelity Advisor Financial Services Fund | | | | |
| Class A | | | | |
| Shares sold | 397,263 | 1,136,964 | $8,285,281 | $22,282,321 |
| Reinvestment of distributions | 129,953 | 74,672 | 2,873,251 | 1,748,061 |
| Shares redeemed | (794,234) | (2,181,699) | (15,707,150) | (41,948,958) |
| Net increase (decrease) | (267,018) | (970,063) | $(4,548,618) | $(17,918,576) |
| Class M | | | | |
| Shares sold | 190,909 | 410,506 | $3,958,235 | $8,117,860 |
| Reinvestment of distributions | 40,416 | 21,004 | 884,297 | 486,870 |
| Shares redeemed | (347,581) | (744,724) | (6,784,906) | (14,078,849) |
| Net increase (decrease) | (116,256) | (313,214) | $(1,942,374) | $(5,474,119) |
| Class C | | | | |
| Shares sold | 143,899 | 294,424 | $2,791,279 | $5,246,784 |
| Reinvestment of distributions | 41,102 | 13,952 | 850,822 | 306,244 |
| Shares redeemed | (514,880) | (1,385,106) | (9,527,226) | (24,631,507) |
| Net increase (decrease) | (329,879) | (1,076,730) | $(5,885,125) | $(19,078,479) |
| Class I | | | | |
| Shares sold | 1,373,183 | 3,650,938 | $32,020,946 | $69,558,772 |
| Reinvestment of distributions | 67,057 | 65,088 | 1,527,568 | 1,567,314 |
| Shares redeemed | (2,556,948) | (3,960,034) | (49,108,074) | (78,384,078) |
| Net increase (decrease) | (1,116,708) | (244,008) | $(15,559,560) | $(7,257,992) |
| Class Z | | | | |
| Shares sold | 362,271 | 2,376,630(a) | $7,941,193 | $46,381,804(a) |
| Reinvestment of distributions | 34,717 | 19,154 | 789,123 | 460,276 |
| Shares redeemed | (753,068) | (1,052,466) | (15,235,376) | (21,123,539) |
| Net increase (decrease) | (356,080) | 1,343,318 | $(6,505,060) | $25,718,541 |
| Fidelity Advisor Health Care Fund | | | | |
| Class A | | | | |
| Shares sold | 2,609,735 | 4,416,062 | $167,369,248 | $241,671,523 |
| Reinvestment of distributions | 1,258,717 | 67,108 | 80,205,471 | 3,732,529 |
| Shares redeemed | (2,180,202) | (4,802,715) | (138,323,317) | (249,141,197) |
| Net increase (decrease) | 1,688,250 | (319,545) | $109,251,402 | $(3,737,145) |
| Class M | | | | |
| Shares sold | 349,629 | 725,698 | $20,706,294 | $36,630,755 |
| Reinvestment of distributions | 359,459 | 21,832 | 21,182,916 | 1,127,617 |
| Shares redeemed | (529,816) | (1,282,976) | (31,295,167) | (62,338,333) |
| Net increase (decrease) | 179,272 | (535,446) | $10,594,043 | $(24,579,961) |
| Class C | | | | |
| Shares sold | 1,176,268 | 2,329,497 | $58,408,745 | $99,233,205 |
| Reinvestment of distributions | 903,358 | 55,297 | 44,381,998 | 2,409,588 |
| Shares redeemed | (1,542,379) | (3,760,176) | (76,633,438) | (154,683,543) |
| Net increase (decrease) | 537,247 | (1,375,382) | $26,157,305 | $(53,040,750) |
| Class I | | | | |
| Shares sold | 9,883,005 | 17,332,018 | $691,366,370 | $1,021,555,878 |
| Reinvestment of distributions | 2,063,584 | 131,180 | 144,306,442 | 7,969,368 |
| Shares redeemed | (5,450,742) | (12,512,534) | (378,985,396) | (710,787,677) |
| Net increase (decrease) | 6,495,847 | 4,950,664 | $456,687,416 | $318,737,569 |
| Class Z | | | | |
| Shares sold | 2,568,961 | 6,860,756(a) | $180,790,744 | $395,026,855(a) |
| Reinvestment of distributions | 465,787 | 36,769 | 32,581,809 | 2,234,471 |
| Shares redeemed | (1,416,790) | (2,206,058) | (99,599,604) | (128,072,955) |
| Net increase (decrease) | 1,617,958 | 4,691,467 | $113,772,949 | $269,188,371 |
| Fidelity Advisor Industrials Fund | | | | |
| Class A | | | | |
| Shares sold | 388,536 | 800,781 | $15,375,817 | $27,338,916 |
| Reinvestment of distributions | 31,089 | 468,175 | 1,282,420 | 17,640,658 |
| Shares redeemed | (695,507) | (2,258,552) | (26,720,400) | (74,625,361) |
| Net increase (decrease) | (275,882) | (989,596) | $(10,062,163) | $(29,645,787) |
| Class M | | | | |
| Shares sold | 98,606 | 131,299 | $3,789,176 | $4,482,960 |
| Reinvestment of distributions | 8,025 | 110,476 | 321,903 | 4,059,928 |
| Shares redeemed | (141,722) | (492,314) | (5,279,965) | (16,081,940) |
| Net increase (decrease) | (35,091) | (250,539) | $(1,168,886) | $(7,539,052) |
| Class C | | | | |
| Shares sold | 140,457 | 141,731 | $4,838,108 | $4,356,577 |
| Reinvestment of distributions | 11,359 | 169,191 | 407,004 | 5,586,569 |
| Shares redeemed | (361,472) | (1,123,620) | (12,147,291) | (33,504,075) |
| Net increase (decrease) | (209,656) | (812,698) | $(6,902,179) | $(23,560,929) |
| Class I | | | | |
| Shares sold | 2,014,839 | 1,036,149 | $82,636,376 | $39,146,978 |
| Reinvestment of distributions | 19,975 | 300,144 | 876,709 | 11,996,658 |
| Shares redeemed | (761,135) | (3,220,419) | (31,309,849) | (116,057,356) |
| Net increase (decrease) | 1,273,679 | (1,884,126) | $52,203,236 | $(64,913,720) |
| Class Z | | | | |
| Shares sold | 388,267 | 1,106,449(a) | $16,154,426 | $41,438,832(a) |
| Reinvestment of distributions | 3,549 | 50,287 | 155,552 | 2,004,432 |
| Shares redeemed | (140,059) | (613,430) | (5,663,037) | (20,747,469) |
| Net increase (decrease) | 251,757 | 543,306 | $10,646,941 | $22,695,795 |
| Fidelity Advisor Semiconductors Fund | | | | |
| Class A | | | | |
| Shares sold | 732,469 | 1,918,310 | $26,633,798 | $49,422,318 |
| Reinvestment of distributions | 209,691 | 45,175 | 7,894,869 | 1,246,388 |
| Shares redeemed | (576,718) | (1,538,083) | (20,316,697) | (37,609,605) |
| Net increase (decrease) | 365,442 | 425,402 | $14,211,970 | $13,059,101 |
| Class M | | | | |
| Shares sold | 106,582 | 307,639 | $3,652,514 | $7,466,667 |
| Reinvestment of distributions | 46,894 | 9,966 | 1,671,302 | 261,204 |
| Shares redeemed | (108,394) | (313,869) | (3,639,201) | (7,526,473) |
| Net increase (decrease) | 45,082 | 3,736 | $1,684,615 | $201,398 |
| Class C | | | | |
| Shares sold | 203,190 | 708,636 | $6,173,287 | $15,319,387 |
| Reinvestment of distributions | 112,361 | 21,740 | 3,542,734 | 509,143 |
| Shares redeemed | (356,503) | (784,252) | (10,649,036) | (16,605,105) |
| Net increase (decrease) | (40,952) | (53,876) | $(933,015) | $(776,575) |
| Class I | | | | |
| Shares sold | 1,066,413 | 2,212,446 | $40,581,447 | $59,935,860 |
| Reinvestment of distributions | 170,390 | 43,044 | 6,832,623 | 1,260,337 |
| Shares redeemed | (829,138) | (2,288,478) | (30,463,752) | (59,322,282) |
| Net increase (decrease) | 407,665 | (32,988) | $16,950,318 | $1,873,915 |
| Class Z | | | | |
| Shares sold | 118,135 | 581,503 | $4,456,992 | $15,181,099 |
| Reinvestment of distributions | 11,859 | 4,479 | 474,851 | 130,911 |
| Shares redeemed | (47,504) | (443,607) | (1,792,237) | (10,785,339) |
| Net increase (decrease) | 82,490 | 142,375 | $3,139,606 | $4,526,671 |
| Fidelity Advisor Technology Fund | | | | |
| Class A | | | | |
| Shares sold | 1,747,012 | 4,045,407 | $148,986,323 | $244,306,097 |
| Reinvestment of distributions | 1,308,690 | 405,797 | 115,478,824 | 23,718,843 |
| Shares redeemed | (2,124,065) | (3,730,933) | (180,878,812) | (216,583,380) |
| Net increase (decrease) | 931,637 | 720,271 | $83,586,335 | $51,441,560 |
| Class M | | | | |
| Shares sold | 671,409 | 1,410,824 | $53,364,850 | $79,216,290 |
| Reinvestment of distributions | 530,802 | 156,168 | 43,573,509 | 8,545,526 |
| Shares redeemed | (868,566) | (1,596,821) | (69,161,426) | (88,333,760) |
| Net increase (decrease) | 333,645 | (29,829) | $27,776,933 | $(571,944) |
| Class C | | | | |
| Shares sold | 573,748 | 1,534,539 | $39,322,750 | $74,482,342 |
| Reinvestment of distributions | 509,172 | 129,222 | 35,687,911 | 6,128,996 |
| Shares redeemed | (864,277) | (1,706,549) | (59,253,166) | (80,576,120) |
| Net increase (decrease) | 218,643 | (42,788) | $15,757,495 | $35,218 |
| Class I | | | | |
| Shares sold | 2,654,304 | 6,639,669 | $246,567,911 | $434,536,634 |
| Reinvestment of distributions | 859,806 | 269,988 | 83,530,124 | 17,244,124 |
| Shares redeemed | (2,750,364) | (6,277,501) | (253,671,996) | (401,652,852) |
| Net increase (decrease) | 763,746 | 632,156 | $76,426,039 | $50,127,906 |
| Class Z | | | | |
| Shares sold | 1,423,475 | 4,274,206(a) | $133,190,454 | $266,397,357(a) |
| Reinvestment of distributions | 257,979 | 60,687 | 25,013,683 | 3,867,591 |
| Shares redeemed | (1,026,788) | (1,311,989) | (95,851,664) | (84,755,784) |
| Net increase (decrease) | 654,666 | 3,022,904 | $62,352,473 | $185,509,164 |
| Fidelity Advisor Utilities Fund | | | | |
| Class A | | | | |
| Shares sold | 453,965 | 2,392,457 | $14,636,336 | $77,895,527 |
| Reinvestment of distributions | 150,513 | 152,614 | 4,887,149 | 5,172,093 |
| Shares redeemed | (1,234,066) | (2,875,150) | (38,828,258) | (88,551,028) |
| Net increase (decrease) | (629,588) | (330,079) | $(19,304,773) | $(5,483,408) |
| Class M | | | | |
| Shares sold | 104,189 | 475,312 | $3,322,574 | $15,397,803 |
| Reinvestment of distributions | 33,030 | 30,852 | 1,075,800 | 1,048,650 |
| Shares redeemed | (206,549) | (535,502) | (6,584,128) | (16,771,407) |
| Net increase (decrease) | (69,330) | (29,338) | $(2,185,754) | $(324,954) |
| Class C | | | | |
| Shares sold | 119,242 | 843,228 | $3,711,318 | $26,750,146 |
| Reinvestment of distributions | 23,775 | 27,506 | 754,630 | 910,715 |
| Shares redeemed | (503,321) | (896,060) | (15,551,103) | (27,330,917) |
| Net increase (decrease) | (360,304) | (25,326) | $(11,085,155) | $329,944 |
| Class I | | | | |
| Shares sold | 712,879 | 4,228,842 | $23,462,717 | $139,366,410 |
| Reinvestment of distributions | 110,504 | 156,807 | 3,670,947 | 5,431,804 |
| Shares redeemed | (2,233,168) | (5,481,417) | (72,539,390) | (172,916,612) |
| Net increase (decrease) | (1,409,785) | (1,095,768) | $(45,405,726) | $(28,118,398) |
| Class Z | | | | |
| Shares sold | 544,144 | 2,355,739(a) | $17,877,202 | $77,042,807(a) |
| Reinvestment of distributions | 32,015 | 28,120 | 1,062,593 | 973,507 |
| Shares redeemed | (568,769) | (1,253,225) | (18,651,808) | (38,887,243) |
| Net increase (decrease) | 7,390 | 1,130,634 | $287,987 | $39,129,071 |
(a) Amount includes in-kind exchanges (see the Prior fiscal Year Affiliated Exchanges In-Kind note for additional details).
12. Other.
The Funds' organizational documents provide former and current trustees and officers with a limited indemnification against liabilities arising in connection with the performance of their duties to the Funds. In the normal course of business, the Funds may also enter into contracts that provide general indemnifications. The Funds' maximum exposure under these arrangements is unknown as this would be dependent on future claims that may be made against the Funds. The risk of material loss from such claims is considered remote.
13. Coronavirus (COVID-19) Pandemic.
An outbreak of COVID-19 first detected in China during December 2019 has since spread globally and was declared a pandemic by the World Health Organization during March 2020. Developments that disrupt global economies and financial markets, such as the COVID-19 pandemic, may magnify factors that affect the Funds' performance.
Shareholder Expense Example
As a shareholder, you incur two types of costs: (1) transaction costs, which may include sales charges (loads) on purchase payments or redemption proceeds, as applicable and (2) ongoing costs, which generally include management fees, distribution and/or service (12b-1) fees and other Fund expenses. This Example is intended to help you understand your ongoing costs (in dollars) of investing in a fund and to compare these costs with the ongoing costs of investing in other mutual funds.
The Example is based on an investment of $1,000 invested at the beginning of the period and held for the entire period (August 1, 2020 to January 31, 2021).
Actual Expenses
The first line of the accompanying table provides information about actual account values and actual expenses. You may use the information in this line, together with the amount you invested, to estimate the expenses that you paid over the period. Simply divide your account value by $1,000.00 (for example, an $8,600 account value divided by $1,000.00 = 8.6), then multiply the result by the number in the first line for a class/Fund under the heading entitled "Expenses Paid During Period" to estimate the expenses you paid on your account during this period. If any fund is a shareholder of any underlying mutual funds or exchange-traded funds (ETFs) (the Underlying Funds), such fund indirectly bears its proportional share of the expenses of the Underlying Funds in addition to the direct expenses incurred presented in the table. These fees and expenses are not included in the annualized expense ratio used to calculate the expense estimate in the table below.
Hypothetical Example for Comparison Purposes
The second line of the accompanying table provides information about hypothetical account values and hypothetical expenses based on the actual expense ratio and an assumed rate of return of 5% per year before expenses, which is not the actual return. The hypothetical account values and expenses may not be used to estimate the actual ending account balance or expenses you paid for the period. You may use this information to compare the ongoing costs of investing in the Fund and other funds. To do so, compare this 5% hypothetical example with the 5% hypothetical examples that appear in the shareholder reports of the other funds. If any fund is a shareholder of any Underlying Funds, such fund indirectly bears its proportional share of the expenses of the Underlying Funds in addition to the direct expenses as presented in the table. These fees and expenses are not included in the annualized expense ratio used to calculate the expense estimate in the table below.
Please note that the expenses shown in the table are meant to highlight your ongoing costs only and do not reflect any transaction costs. Therefore, the second line of the table is useful in comparing ongoing costs only, and will not help you determine the relative total costs of owning different funds. In addition, if these transactional costs were included, your costs would have been higher.
| | Annualized Expense Ratio-A | Beginning
Account Value
August 1, 2020 | Ending
Account Value
January 31, 2021 | Expenses Paid
During Period-B
August 1, 2020
to January 31, 2021 |
| Fidelity Advisor Biotechnology Fund | | | | |
| Class A | 1.01% | | | |
| Actual | | $1,000.00 | $1,190.20 | $5.58 |
| Hypothetical-C | | $1,000.00 | $1,020.11 | $5.14 |
| Class M | 1.29% | | | |
| Actual | | $1,000.00 | $1,188.50 | $7.12 |
| Hypothetical-C | | $1,000.00 | $1,018.70 | $6.56 |
| Class C | 1.76% | | | |
| Actual | | $1,000.00 | $1,185.70 | $9.70 |
| Hypothetical-C | | $1,000.00 | $1,016.33 | $8.94 |
| Class I | .75% | | | |
| Actual | | $1,000.00 | $1,192.10 | $4.14 |
| Hypothetical-C | | $1,000.00 | $1,021.42 | $3.82 |
| Class Z | .62% | | | |
| Actual | | $1,000.00 | $1,192.90 | $3.43 |
| Hypothetical-C | | $1,000.00 | $1,022.08 | $3.16 |
| Fidelity Advisor Communications Equipment Fund | | | | |
| Class A | 1.39% | | | |
| Actual | | $1,000.00 | $1,117.30 | $7.42 |
| Hypothetical-C | | $1,000.00 | $1,018.20 | $7.07 |
| Class M | 1.64% | | | |
| Actual | | $1,000.00 | $1,115.70 | $8.75 |
| Hypothetical-C | | $1,000.00 | $1,016.94 | $8.34 |
| Class C | 2.14% | | | |
| Actual | | $1,000.00 | $1,112.40 | $11.39 |
| Hypothetical-C | | $1,000.00 | $1,014.42 | $10.87 |
| Class I | 1.14% | | | |
| Actual | | $1,000.00 | $1,118.40 | $6.09 |
| Hypothetical-C | | $1,000.00 | $1,019.46 | $5.80 |
| Fidelity Advisor Consumer Discretionary Fund | | | | |
| Class A | 1.06% | | | |
| Actual | | $1,000.00 | $1,226.60 | $5.95 |
| Hypothetical-C | | $1,000.00 | $1,019.86 | $5.40 |
| Class M | 1.32% | | | |
| Actual | | $1,000.00 | $1,224.90 | $7.40 |
| Hypothetical-C | | $1,000.00 | $1,018.55 | $6.72 |
| Class C | 1.82% | | | |
| Actual | | $1,000.00 | $1,222.40 | $10.20 |
| Hypothetical-C | | $1,000.00 | $1,016.03 | $9.25 |
| Class I | .79% | | | |
| Actual | | $1,000.00 | $1,228.40 | $4.44 |
| Hypothetical-C | | $1,000.00 | $1,021.22 | $4.02 |
| Class Z | .66% | | | |
| Actual | | $1,000.00 | $1,229.20 | $3.71 |
| Hypothetical-C | | $1,000.00 | $1,021.88 | $3.36 |
| Fidelity Advisor Energy Fund | | | | |
| Class A | 1.16% | | | |
| Actual | | $1,000.00 | $1,166.00 | $6.33 |
| Hypothetical-C | | $1,000.00 | $1,019.36 | $5.90 |
| Class M | 1.41% | | | |
| Actual | | $1,000.00 | $1,164.30 | $7.69 |
| Hypothetical-C | | $1,000.00 | $1,018.10 | $7.17 |
| Class C | 1.89% | | | |
| Actual | | $1,000.00 | $1,161.40 | $10.30 |
| Hypothetical-C | | $1,000.00 | $1,015.68 | $9.60 |
| Class I | .83% | | | |
| Actual | | $1,000.00 | $1,168.00 | $4.54 |
| Hypothetical-C | | $1,000.00 | $1,021.02 | $4.23 |
| Class Z | .68% | | | |
| Actual | | $1,000.00 | $1,168.60 | $3.72 |
| Hypothetical-C | | $1,000.00 | $1,021.78 | $3.47 |
| Fidelity Advisor Financial Services Fund | | | | |
| Class A | 1.11% | | | |
| Actual | | $1,000.00 | $1,282.30 | $6.39 |
| Hypothetical-C | | $1,000.00 | $1,019.61 | $5.65 |
| Class M | 1.37% | | | |
| Actual | | $1,000.00 | $1,280.70 | $7.88 |
| Hypothetical-C | | $1,000.00 | $1,018.30 | $6.97 |
| Class C | 1.87% | | | |
| Actual | | $1,000.00 | $1,277.40 | $10.73 |
| Hypothetical-C | | $1,000.00 | $1,015.78 | $9.50 |
| Class I | .81% | | | |
| Actual | | $1,000.00 | $1,284.30 | $4.66 |
| Hypothetical-C | | $1,000.00 | $1,021.12 | $4.13 |
| Class Z | .69% | | | |
| Actual | | $1,000.00 | $1,285.10 | $3.97 |
| Hypothetical-C | | $1,000.00 | $1,021.73 | $3.52 |
| Fidelity Advisor Health Care Fund | | | | |
| Class A | .99% | | | |
| Actual | | $1,000.00 | $1,124.40 | $5.30 |
| Hypothetical-C | | $1,000.00 | $1,020.21 | $5.04 |
| Class M | 1.24% | | | |
| Actual | | $1,000.00 | $1,122.90 | $6.64 |
| Hypothetical-C | | $1,000.00 | $1,018.95 | $6.31 |
| Class C | 1.74% | | | |
| Actual | | $1,000.00 | $1,120.20 | $9.30 |
| Hypothetical-C | | $1,000.00 | $1,016.43 | $8.84 |
| Class I | .73% | | | |
| Actual | | $1,000.00 | $1,125.90 | $3.91 |
| Hypothetical-C | | $1,000.00 | $1,021.53 | $3.72 |
| Class Z | .60% | | | |
| Actual | | $1,000.00 | $1,126.70 | $3.22 |
| Hypothetical-C | | $1,000.00 | $1,022.18 | $3.06 |
| Fidelity Advisor Industrials Fund | | | | |
| Class A | 1.05% | | | |
| Actual | | $1,000.00 | $1,161.60 | $5.72 |
| Hypothetical-C | | $1,000.00 | $1,019.91 | $5.35 |
| Class M | 1.31% | | | |
| Actual | | $1,000.00 | $1,159.90 | $7.13 |
| Hypothetical-C | | $1,000.00 | $1,018.60 | $6.67 |
| Class C | 1.81% | | | |
| Actual | | $1,000.00 | $1,157.20 | $9.84 |
| Hypothetical-C | | $1,000.00 | $1,016.08 | $9.20 |
| Class I | .78% | | | |
| Actual | | $1,000.00 | $1,163.20 | $4.25 |
| Hypothetical-C | | $1,000.00 | $1,021.27 | $3.97 |
| Class Z | .65% | | | |
| Actual | | $1,000.00 | $1,163.80 | $3.55 |
| Hypothetical-C | | $1,000.00 | $1,021.93 | $3.31 |
| Fidelity Advisor Semiconductors Fund | | | | |
| Class A | 1.06% | | | |
| Actual | | $1,000.00 | $1,358.50 | $6.30 |
| Hypothetical-C | | $1,000.00 | $1,019.86 | $5.40 |
| Class M | 1.33% | | | |
| Actual | | $1,000.00 | $1,356.60 | $7.90 |
| Hypothetical-C | | $1,000.00 | $1,018.50 | $6.77 |
| Class C | 1.82% | | | |
| Actual | | $1,000.00 | $1,353.20 | $10.80 |
| Hypothetical-C | | $1,000.00 | $1,016.03 | $9.25 |
| Class I | .79% | | | |
| Actual | | $1,000.00 | $1,360.20 | $4.70 |
| Hypothetical-C | | $1,000.00 | $1,021.22 | $4.02 |
| Class Z | .67% | | | |
| Actual | | $1,000.00 | $1,361.00 | $3.99 |
| Hypothetical-C | | $1,000.00 | $1,021.83 | $3.41 |
| Fidelity Advisor Technology Fund | | | | |
| Class A | .99% | | | |
| Actual | | $1,000.00 | $1,246.30 | $5.61 |
| Hypothetical-C | | $1,000.00 | $1,020.21 | $5.04 |
| Class M | 1.24% | | | |
| Actual | | $1,000.00 | $1,244.90 | $7.02 |
| Hypothetical-C | | $1,000.00 | $1,018.95 | $6.31 |
| Class C | 1.75% | | | |
| Actual | | $1,000.00 | $1,241.70 | $9.89 |
| Hypothetical-C | | $1,000.00 | $1,016.38 | $8.89 |
| Class I | .73% | | | |
| Actual | | $1,000.00 | $1,248.00 | $4.14 |
| Hypothetical-C | | $1,000.00 | $1,021.53 | $3.72 |
| Class Z | .61% | | | |
| Actual | | $1,000.00 | $1,248.80 | $3.46 |
| Hypothetical-C | | $1,000.00 | $1,022.13 | $3.11 |
| Fidelity Advisor Utilities Fund | | | | |
| Class A | 1.06% | | | |
| Actual | | $1,000.00 | $1,091.60 | $5.59 |
| Hypothetical-C | | $1,000.00 | $1,019.86 | $5.40 |
| Class M | 1.34% | | | |
| Actual | | $1,000.00 | $1,090.30 | $7.06 |
| Hypothetical-C | | $1,000.00 | $1,018.45 | $6.82 |
| Class C | 1.82% | | | |
| Actual | | $1,000.00 | $1,087.40 | $9.58 |
| Hypothetical-C | | $1,000.00 | $1,016.03 | $9.25 |
| Class I | .78% | | | |
| Actual | | $1,000.00 | $1,093.40 | $4.12 |
| Hypothetical-C | | $1,000.00 | $1,021.27 | $3.97 |
| Class Z | .65% | | | |
| Actual | | $1,000.00 | $1,093.70 | $3.43 |
| Hypothetical-C | | $1,000.00 | $1,021.93 | $3.31 |
A Annualized expense ratio reflects expenses net of applicable fee waivers.
B Expenses are equal to the annualized expense ratio, multiplied by the average account value over the period, multiplied by 184/ 365 (to reflect the one-half year period). The fees and expenses of any Underlying Funds are not included in each annualized expense ratio.
C 5% return per year before expenses
Board Approval of Investment Advisory Contracts and Management Fees
Fidelity Advisor Focus Funds
At its January 2021 meeting, the Board of Trustees, including the Independent Trustees (together, the Board), voted to continue the management contract with Fidelity Management & Research Company LLC (FMR), and the sub-advisory agreements and sub-subadvisory agreements, in each case, where applicable (together, the Advisory Contracts) for each fund for four months from February 1, 2021 through May 31, 2021, in connection with changes to the Board's meeting calendar.
The Board considered that the approval of each fund's Advisory Contracts will not result in any changes in (i) the investment process or strategies employed in the management of each fund's assets; (ii) the fees and expenses paid by shareholders; (iii) the nature, extent or quality of services provided under each fund's Advisory Contracts; or (iv) the day-to-day management of each fund or the persons primarily responsible for such management. The Board also considered that since its last approval of each fund's Advisory Contracts, FMR had provided additional information on each fund in support of the annual contract renewal process, including competitive analyses on total expenses and management fees and in-depth reviews of fund performance and fund profitability information. The Board also considered the findings of certain ad hoc committees that had been previously formed to discuss matters relevant to all of the Fidelity funds, including economies of scale, fall-out benefits and retail vs. institutional funds. The Board concluded that each fund's Advisory Contracts are fair and reasonable, and that each fund's Advisory Contracts should be renewed, without modification, through May 31, 2021, with the understanding that the Board will consider the annual renewal for a full one year period in May 2021.
In connection with its consideration of future renewals of each fund's Advisory Contracts, the Board will consider: (i) the nature, extent and quality of services provided to the funds, including shareholder and administrative services and investment performance; (ii) the competitiveness of the management fee and total expenses for each fund; (iii) the costs of the services and profitability, including the revenues earned and the expenses incurred in conducting the business of developing, marketing, distributing, managing, administering, and servicing each fund and its shareholders, to the extent applicable; and (iv) whether there have been economies of scale in respect of the Fidelity funds, whether the Fidelity funds (including the funds) have appropriately benefited from any such economies of scale, and whether there is the potential for realization of any further economies.
Based on its evaluation of all of the conclusions noted above, and after considering all factors it believed relevant, the Board ultimately concluded that each fund's management fee structures are fair and reasonable, and that the continuation of the funds' Advisory Contracts should be approved for four months from February 1, 2021 through May 31, 2021.
AFOC-SANN-0321
1.700839.124
Fidelity Advisor® Global Real Estate Fund
Semi-Annual Report
January 31, 2021
Contents
To view a fund's proxy voting guidelines and proxy voting record for the 12-month period ended June 30, visit http://www.fidelity.com/proxyvotingresults or visit the Securities and Exchange Commission's (SEC) web site at http://www.sec.gov.
You may also call 1-877-208-0098 to request a free copy of the proxy voting guidelines.
Standard & Poor's, S&P and S&P 500 are registered service marks of The McGraw-Hill Companies, Inc. and have been licensed for use by Fidelity Distributors Corporation.
Other third-party marks appearing herein are the property of their respective owners.
All other marks appearing herein are registered or unregistered trademarks or service marks of FMR LLC or an affiliated company. © 2021 FMR LLC. All rights reserved.
This report and the financial statements contained herein are submitted for the general information of the shareholders of the Fund. This report is not authorized for distribution to prospective investors in the Fund unless preceded or accompanied by an effective prospectus.
A fund files its complete schedule of portfolio holdings with the SEC for the first and third quarters of each fiscal year on Form N-PORT. Forms N-PORT are available on the SEC’s web site at http://www.sec.gov. A fund's Forms N-PORT may be reviewed and copied at the SEC’s Public Reference Room in Washington, DC. Information regarding the operation of the SEC's Public Reference Room may be obtained by calling 1-800-SEC-0330.
For a complete list of a fund's portfolio holdings, view the most recent holdings listing, semiannual report, or annual report on Fidelity's web site at http://www.fidelity.com, http://www.institutional.fidelity.com, or http://www.401k.com, as applicable.
NOT FDIC INSURED •MAY LOSE VALUE •NO BANK GUARANTEE
Neither the Fund nor Fidelity Distributors Corporation is a bank.
Note to Shareholders:
Early in 2020, the outbreak and spread of a new coronavirus emerged as a public health emergency that had a major influence on financial markets, primarily based on its impact on the global economy and the outlook for corporate earnings. The virus causes a respiratory disease known as COVID-19. On March 11, the World Health Organization declared the COVID-19 outbreak a pandemic, citing sustained risk of further global spread.
In the weeks following, as the crisis worsened, we witnessed an escalating human tragedy with wide-scale social and economic consequences from coronavirus-containment measures. The outbreak of COVID-19 prompted a number of measures to limit the spread, including travel and border restrictions, quarantines, and restrictions on large gatherings. In turn, these resulted in lower consumer activity, diminished demand for a wide range of products and services, disruption in manufacturing and supply chains, and – given the wide variability in outcomes regarding the outbreak – significant market uncertainty and volatility. Amid the turmoil, global governments and central banks took unprecedented action to help support consumers, businesses, and the broader economies, and to limit disruption to financial systems.
The situation continues to unfold, and the extent and duration of its impact on financial markets and the economy remain highly uncertain. Extreme events such as the coronavirus crisis are “exogenous shocks” that can have significant adverse effects on mutual funds and their investments. Although multiple asset classes may be affected by market disruption, the duration and impact may not be the same for all types of assets.
Fidelity is committed to helping you stay informed amid news about COVID-19 and during increased market volatility, and we’re taking extra steps to be responsive to customer needs. We encourage you to visit our websites, where we offer ongoing updates, commentary, and analysis on the markets and our funds.
Investment Summary (Unaudited)
Top Ten Stocks as of January 31, 2021
| | % of fund's net assets |
| Prologis (REIT), Inc. | 7.1 |
| Digital Realty Trust, Inc. | 4.8 |
| Duke Realty Corp. | 3.7 |
| Vonovia SE | 3.4 |
| Mitsui Fudosan Co. Ltd. | 2.9 |
| Welltower, Inc. | 2.9 |
| Mitsubishi Estate Co. Ltd. | 2.7 |
| Ventas, Inc. | 2.3 |
| UOL Group Ltd. | 2.3 |
| Equity Lifestyle Properties, Inc. | 2.1 |
| | 34.2 |
Top Five Countries as of January 31, 2021
| (excluding cash equivalents) | % of fund's net assets |
| United States of America | 52.8 |
| Japan | 8.9 |
| Germany | 5.5 |
| Australia | 5.3 |
| Singapore | 4.9 |
Top Five REIT Sectors as of January 31, 2021
| | % of fund's net assets |
| REITs - Diversified | 23.0 |
| REITs - Apartments | 10.5 |
| REITs - Warehouse/Industrial | 8.6 |
| REITs - Health Care | 7.7 |
| REITs - Shopping Centers | 5.6 |
Asset Allocation (% of fund's net assets)
| As of January 31, 2021* |
| | Stocks | 100.5% |
| | Short-Term Investments and Net Other Assets (Liabilities)** | (0.5)% |

* Foreign investments - 47.7%
** Short-Term Investments and Net Other Assets (Liabilities) are not included in the pie chart
Schedule of Investments January 31, 2021 (Unaudited)
Showing Percentage of Net Assets
| Common Stocks - 100.5% | | | |
| | | Shares | Value |
| Australia - 5.3% | | | |
| Abacus Property Group unit | | 19,581 | $40,854 |
| Arena (REIT) unit | | 17,990 | 39,734 |
| Charter Hall Retail REIT | | 8,362 | 22,751 |
| Ingenia Communities Group unit | | 19,182 | 73,592 |
| National Storage (REIT) unit | | 51,749 | 75,539 |
|
| TOTAL AUSTRALIA | | | 252,470 |
|
| Austria - 0.8% | | | |
| CA Immobilien Anlagen AG | | 853 | 36,748 |
| Bailiwick of Guernsey - 1.5% | | | |
| Sirius Real Estate Ltd. | | 55,856 | 72,628 |
| Belgium - 1.1% | | | |
| Aedifica SA | | 314 | 37,991 |
| Inclusio SA | | 575 | 14,863 |
|
| TOTAL BELGIUM | | | 52,854 |
|
| Canada - 3.8% | | | |
| Boardwalk (REIT) | | 2,192 | 59,345 |
| Dream Industrial (REIT) | | 9,311 | 92,327 |
| Flagship Communities (REIT) | | 1,756 | 27,271 |
|
| TOTAL CANADA | | | 178,943 |
|
| Cayman Islands - 1.6% | | | |
| CK Asset Holdings Ltd. | | 15,494 | 77,837 |
| France - 2.6% | | | |
| ARGAN SA | | 468 | 50,206 |
| Gecina SA | | 511 | 72,927 |
|
| TOTAL FRANCE | | | 123,133 |
|
| Germany - 5.5% | | | |
| Instone Real Estate Group BV (a)(b) | | 3,969 | 100,907 |
| Vonovia SE | | 2,440 | 163,273 |
|
| TOTAL GERMANY | | | 264,180 |
|
| Hong Kong - 3.8% | | | |
| Link (REIT) | | 9,784 | 85,432 |
| Sino Land Ltd. | | 67,544 | 94,086 |
|
| TOTAL HONG KONG | | | 179,518 |
|
| Ireland - 1.9% | | | |
| Hibernia (REIT) PLC | | 67,785 | 90,157 |
| Italy - 0.6% | | | |
| COIMA RES SpA (b) | | 4,031 | 30,721 |
| Japan - 8.9% | | | |
| Advance Residence Investment Corp. | | 11 | 32,555 |
| Kenedix Residential Investment Corp. | | 28 | 48,678 |
| LaSalle Logiport REIT | | 28 | 43,893 |
| Mitsubishi Estate Co. Ltd. | | 8,222 | 129,674 |
| Mitsui Fudosan Co. Ltd. | | 6,894 | 139,433 |
| Mitsui Fudosan Logistics Park, Inc. | | 6 | 30,016 |
|
| TOTAL JAPAN | | | 424,249 |
|
| Luxembourg - 1.3% | | | |
| Aroundtown SA | | 8,707 | 60,609 |
| Singapore - 4.9% | | | |
| CapitaMall Trust | | 39,838 | 64,177 |
| Mapletree Commercial Trust | | 18,642 | 29,049 |
| Parkway Life REIT | | 10,599 | 33,112 |
| UOL Group Ltd. | | 19,850 | 109,381 |
|
| TOTAL SINGAPORE | | | 235,719 |
|
| Sweden - 0.8% | | | |
| Catena AB | | 861 | 40,184 |
| United Kingdom - 3.3% | | | |
| Assura PLC | | 36,144 | 35,904 |
| Grainger Trust PLC | | 18,631 | 68,107 |
| Segro PLC | | 1,964 | 25,677 |
| U & I Group PLC (a) | | 24,404 | 29,090 |
|
| TOTAL UNITED KINGDOM | | | 158,778 |
|
| United States of America - 52.8% | | | |
| American Assets Trust, Inc. | | 891 | 24,618 |
| American Homes 4 Rent Class A | | 2,347 | 70,950 |
| Americold Realty Trust | | 1,415 | 49,398 |
| Apartment Income (REIT) Corp. | | 1,321 | 51,215 |
| Brandywine Realty Trust (SBI) | | 2,016 | 22,176 |
| Crown Castle International Corp. | | 163 | 25,959 |
| CubeSmart | | 2,139 | 74,523 |
| DiamondRock Hospitality Co. | | 3,513 | 28,807 |
| Digital Realty Trust, Inc. | | 1,579 | 227,297 |
| Duke Realty Corp. | | 4,413 | 174,578 |
| Equinix, Inc. | | 104 | 76,956 |
| Equity Lifestyle Properties, Inc. | | 1,689 | 102,759 |
| Extra Space Storage, Inc. | | 751 | 85,456 |
| Gaming & Leisure Properties | | 1,870 | 76,913 |
| Highwoods Properties, Inc. (SBI) | | 881 | 33,029 |
| Invitation Homes, Inc. | | 2,462 | 72,580 |
| Kimco Realty Corp. | | 2,790 | 46,063 |
| Lexington Corporate Properties Trust | | 3,401 | 34,860 |
| Mack-Cali Realty Corp. | | 1,447 | 18,420 |
| Medical Properties Trust, Inc. | | 2,184 | 46,104 |
| Mid-America Apartment Communities, Inc. | | 575 | 76,331 |
| National Retail Properties, Inc. | | 1,553 | 60,567 |
| Piedmont Office Realty Trust, Inc. Class A | | 1,669 | 25,669 |
| Prologis (REIT), Inc. | | 3,291 | 339,634 |
| Regency Centers Corp. | | 1,033 | 48,737 |
| Ryman Hospitality Properties, Inc. | | 150 | 9,728 |
| Spirit Realty Capital, Inc. | | 1,005 | 38,753 |
| Sun Communities, Inc. | | 518 | 74,141 |
| UDR, Inc. | | 2,598 | 99,893 |
| Ventas, Inc. | | 2,393 | 110,246 |
| VEREIT, Inc. | | 1,871 | 65,915 |
| VICI Properties, Inc. | | 2,462 | 62,239 |
| Washington REIT (SBI) | | 1,338 | 29,356 |
| Welltower, Inc. | | 2,300 | 139,380 |
|
| TOTAL UNITED STATES OF AMERICA | | | 2,523,250 |
|
| TOTAL COMMON STOCKS | | | |
| (Cost $4,321,124) | | | 4,801,978 |
| TOTAL INVESTMENT IN SECURITIES - 100.5% | | | |
| (Cost $4,321,124) | | | 4,801,978 |
| NET OTHER ASSETS (LIABILITIES) - (0.5)% | | | (23,547) |
| NET ASSETS - 100% | | | $4,778,431 |
Categorizations in the Schedule of Investments are based on country or territory of incorporation.
Legend
(a) Non-income producing
(b) Security exempt from registration under Rule 144A of the Securities Act of 1933. These securities may be resold in transactions exempt from registration, normally to qualified institutional buyers. At the end of the period, the value of these securities amounted to $131,628 or 2.8% of net assets.
Affiliated Central Funds
Information regarding fiscal year to date income earned by the Fund from investments in Fidelity Central Funds is as follows:
| Fund | Income earned |
| Fidelity Cash Central Fund | $16 |
| Total | $16 |
Amounts in the income column in the above table include any capital gain distributions from underlying funds, which are presented in the corresponding line-item in the Statement of Operations, if applicable.
Investment Valuation
The following is a summary of the inputs used, as of January 31, 2021, involving the Fund's assets and liabilities carried at fair value. The inputs or methodology used for valuing securities may not be an indication of the risk associated with investing in those securities. For more information on valuation inputs, and their aggregation into the levels used below, please refer to the Investment Valuation section in the accompanying Notes to Financial Statements.
| | Valuation Inputs at Reporting Date: |
| Description | Total | Level 1 | Level 2 | Level 3 |
| Investments in Securities: | | | | |
| Equities: | | | | |
| Real Estate | $4,801,978 | $4,801,978 | $-- | $-- |
| Total Investments in Securities: | $4,801,978 | $4,801,978 | $-- | $-- |
See accompanying notes which are an integral part of the financial statements.
Financial Statements
Statement of Assets and Liabilities
| | | January 31, 2021 (Unaudited) |
| Assets | | |
Investment in securities, at value — See accompanying schedule:
Unaffiliated issuers (cost $4,321,124) | | $4,801,978 |
| Receivable for investments sold | | 16,300 |
| Receivable for fund shares sold | | 235 |
| Dividends receivable | | 10,405 |
| Distributions receivable from Fidelity Central Funds | | 4 |
| Prepaid expenses | | 19 |
| Receivable from investment adviser for expense reductions | | 5,838 |
| Other receivables | | 184 |
| Total assets | | 4,834,963 |
| Liabilities | | |
| Payable to custodian bank | $2,803 | |
| Payable for investments purchased | 10,344 | |
| Accrued management fee | 2,700 | |
| Audit fees payable | 30,524 | |
| Custody fees payable | 7,646 | |
| Distribution and service plan fees payable | 867 | |
| Other affiliated payables | 901 | |
| Other payables and accrued expenses | 747 | |
| Total liabilities | | 56,532 |
| Net Assets | | $4,778,431 |
| Net Assets consist of: | | |
| Paid in capital | | $4,602,175 |
| Total accumulated earnings (loss) | | 176,256 |
| Net Assets | | $4,778,431 |
| Net Asset Value and Maximum Offering Price | | |
| Class A: | | |
| Net Asset Value and redemption price per share ($2,050,498 ÷ 201,867 shares)(a) | | $10.16 |
| Maximum offering price per share (100/94.25 of $10.16) | | $10.78 |
| Class M: | | |
| Net Asset Value and redemption price per share ($691,587 ÷ 68,138 shares)(a) | | $10.15 |
| Maximum offering price per share (100/96.50 of $10.15) | | $10.52 |
| Class C: | | |
| Net Asset Value and offering price per share ($177,631 ÷ 17,441 shares)(a) | | $10.18 |
| Class I: | | |
| Net Asset Value, offering price and redemption price per share ($1,247,008 ÷ 122,664 shares) | | $10.17 |
| Class Z: | | |
| Net Asset Value, offering price and redemption price per share ($611,707 ÷ 59,975 shares) | | $10.20 |
(a) Redemption price per share is equal to net asset value less any applicable contingent deferred sales charge.
See accompanying notes which are an integral part of the financial statements.
Statement of Operations
| | | Six months ended January 31, 2021 (Unaudited) |
| Investment Income | | |
| Dividends | | $62,851 |
| Income from Fidelity Central Funds | | 16 |
| Income before foreign taxes withheld | | 62,867 |
| Less foreign taxes withheld | | (2,697) |
| Total income | | 60,170 |
| Expenses | | |
| Management fee | $14,310 | |
| Transfer agent fees | 4,344 | |
| Distribution and service plan fees | 5,031 | |
| Accounting fees and expenses | 820 | |
| Custodian fees and expenses | 10,225 | |
| Independent trustees' fees and expenses | 10 | |
| Registration fees | 27,500 | |
| Audit | 30,084 | |
| Legal | 5 | |
| Miscellaneous | 278 | |
| Total expenses before reductions | 92,607 | |
| Expense reductions | (63,718) | |
| Total expenses after reductions | | 28,889 |
| Net investment income (loss) | | 31,281 |
| Realized and Unrealized Gain (Loss) | | |
| Net realized gain (loss) on: | | |
| Investment securities: | | |
| Unaffiliated issuers (net of foreign taxes of $108) | 45,564 | |
| Fidelity Central Funds | (1) | |
| Foreign currency transactions | 61 | |
| Total net realized gain (loss) | | 45,624 |
| Change in net unrealized appreciation (depreciation) on: | | |
| Investment securities: | | |
| Unaffiliated issuers (net of decrease in deferred foreign taxes of $10) | 179,935 | |
| Assets and liabilities in foreign currencies | (62) | |
| Total change in net unrealized appreciation (depreciation) | | 179,873 |
| Net gain (loss) | | 225,497 |
| Net increase (decrease) in net assets resulting from operations | | $256,778 |
See accompanying notes which are an integral part of the financial statements.
Statement of Changes in Net Assets
| | Six months ended January 31, 2021 (Unaudited) | Year ended July 31, 2020 |
| Increase (Decrease) in Net Assets | | |
| Operations | | |
| Net investment income (loss) | $31,281 | $73,270 |
| Net realized gain (loss) | 45,624 | (39,415) |
| Change in net unrealized appreciation (depreciation) | 179,873 | (288,457) |
| Net increase (decrease) in net assets resulting from operations | 256,778 | (254,602) |
| Distributions to shareholders | (55,566) | (292,523) |
| Share transactions - net increase (decrease) | 702,429 | (2,100,606) |
| Total increase (decrease) in net assets | 903,641 | (2,647,731) |
| Net Assets | | |
| Beginning of period | 3,874,790 | 6,522,521 |
| End of period | $4,778,431 | $3,874,790 |
See accompanying notes which are an integral part of the financial statements.
Financial Highlights
Fidelity Advisor Global Real Estate Fund Class A
| | Six months ended (Unaudited) January 31, | Years endedJuly 31, | | | |
| | 2021 | 2020 | 2019 | 2018 | 2017 A |
| Selected Per–Share Data | | | | | |
| Net asset value, beginning of period | $9.69 | $10.72 | $10.13 | $9.81 | $10.00 |
| Income from Investment Operations | | | | | |
| Net investment income (loss)B | .07 | .15 | .22 | .18 | .15 |
| Net realized and unrealized gain (loss) | .53 | (.58) | .58 | .42 | (.26) |
| Total from investment operations | .60 | (.43) | .80 | .60 | (.11) |
| Distributions from net investment income | (.13) | (.23) | (.15) | (.13) | (.07) |
| Distributions from net realized gain | – | (.37) | (.06) | (.14) | (.01) |
| Total distributions | (.13) | (.60) | (.21) | (.28)C | (.08) |
| Net asset value, end of period | $10.16 | $9.69 | $10.72 | $10.13 | $9.81 |
| Total ReturnD,E,F | 6.23% | (4.61)% | 8.25% | 6.16% | (1.00)% |
| Ratios to Average Net AssetsG,H | | | | | |
| Expenses before reductions | 4.47%I | 4.22% | 4.56% | 5.86% | 8.94%I |
| Expenses net of fee waivers, if any | 1.40%I | 1.40% | 1.40% | 1.40% | 1.40%I |
| Expenses net of all reductions | 1.39%I | 1.39% | 1.39% | 1.38% | 1.39%I |
| Net investment income (loss) | 1.47%I | 1.47% | 2.09% | 1.80% | 1.65%I |
| Supplemental Data | | | | | |
| Net assets, end of period (000 omitted) | $2,050 | $1,732 | $3,290 | $1,001 | $657 |
| Portfolio turnover rateJ | 39%I | 52% | 60% | 46% | 59%I |
A For the period August 11, 2016 (commencement of operations) to July 31, 2017.
B Calculated based on average shares outstanding during the period.
C Total distributions per share do not sum due to rounding.
D Total returns for periods of less than one year are not annualized.
E Total returns would have been lower if certain expenses had not been reduced during the applicable periods shown.
F Total returns do not include the effect of the sales charges.
G Fees and expenses of any underlying mutual funds or exchange-traded funds (ETFs) are not included in the Fund's expense ratio. The Fund indirectly bears its proportionate share of these expenses. For additional expense information related to investments in Fidelity Central Funds, please refer to the "Investments in Fidelity Central Funds" note found in the Notes to Financial Statements section of the most recent Annual or Semi-Annual report.
H Expense ratios reflect operating expenses of the class. Expenses before reductions do not reflect amounts reimbursed, waived, or reduced through arrangements with the investment adviser, brokerage services, or other offset arrangements, if applicable, and do not represent the amount paid by the class during periods when reimbursements, waivers or reductions occur.
I Annualized
J Amount does not include the portfolio activity of any underlying mutual funds or exchange-traded funds (ETFs).
See accompanying notes which are an integral part of the financial statements.
Fidelity Advisor Global Real Estate Fund Class M
| | Six months ended (Unaudited) January 31, | Years endedJuly 31, | | | |
| | 2021 | 2020 | 2019 | 2018 | 2017 A |
| Selected Per–Share Data | | | | | |
| Net asset value, beginning of period | $9.67 | $10.71 | $10.11 | $9.79 | $10.00 |
| Income from Investment Operations | | | | | |
| Net investment income (loss)B | .06 | .12 | .19 | .15 | .13 |
| Net realized and unrealized gain (loss) | .53 | (.58) | .60 | .42 | (.27) |
| Total from investment operations | .59 | (.46) | .79 | .57 | (.14) |
| Distributions from net investment income | (.11) | (.21) | (.13) | (.11) | (.06) |
| Distributions from net realized gain | – | (.37) | (.06) | (.14) | (.01) |
| Total distributions | (.11) | (.58) | (.19) | (.25) | (.07) |
| Net asset value, end of period | $10.15 | $9.67 | $10.71 | $10.11 | $9.79 |
| Total ReturnC,D,E | 6.06% | (4.87)% | 8.06% | 5.90% | (1.30)% |
| Ratios to Average Net AssetsF,G | | | | | |
| Expenses before reductions | 4.72%H | 4.46% | 4.79% | 5.90% | 9.20%H |
| Expenses net of fee waivers, if any | 1.65%H | 1.66% | 1.65% | 1.65% | 1.65%H |
| Expenses net of all reductions | 1.64%H | 1.64% | 1.64% | 1.63% | 1.64%H |
| Net investment income (loss) | 1.22%H | 1.22% | 1.84% | 1.54% | 1.40%H |
| Supplemental Data | | | | | |
| Net assets, end of period (000 omitted) | $692 | $658 | $810 | $570 | $550 |
| Portfolio turnover rateI | 39%H | 52% | 60% | 46% | 59%H |
A For the period August 11, 2016 (commencement of operations) to July 31, 2017.
B Calculated based on average shares outstanding during the period.
C Total returns for periods of less than one year are not annualized.
D Total returns would have been lower if certain expenses had not been reduced during the applicable periods shown.
E Total returns do not include the effect of the sales charges.
F Fees and expenses of any underlying mutual funds or exchange-traded funds (ETFs) are not included in the Fund's expense ratio. The Fund indirectly bears its proportionate share of these expenses. For additional expense information related to investments in Fidelity Central Funds, please refer to the "Investments in Fidelity Central Funds" note found in the Notes to Financial Statements section of the most recent Annual or Semi-Annual report.
G Expense ratios reflect operating expenses of the class. Expenses before reductions do not reflect amounts reimbursed, waived, or reduced through arrangements with the investment adviser, brokerage services, or other offset arrangements, if applicable, and do not represent the amount paid by the class during periods when reimbursements, waivers or reductions occur.
H Annualized
I Amount does not include the portfolio activity of any underlying mutual funds or exchange-traded funds (ETFs).
See accompanying notes which are an integral part of the financial statements.
Fidelity Advisor Global Real Estate Fund Class C
| | Six months ended (Unaudited) January 31, | Years endedJuly 31, | | | |
| | 2021 | 2020 | 2019 | 2018 | 2017 A |
| Selected Per–Share Data | | | | | |
| Net asset value, beginning of period | $9.63 | $10.63 | $10.08 | $9.76 | $10.00 |
| Income from Investment Operations | | | | | |
| Net investment income (loss)B | .04 | .07 | .14 | .10 | .08 |
| Net realized and unrealized gain (loss) | .51 | (.58) | .59 | .42 | (.26) |
| Total from investment operations | .55 | (.51) | .73 | .52 | (.18) |
| Distributions from net investment income | – | (.12) | (.12) | (.06) | (.05) |
| Distributions from net realized gain | – | (.37) | (.06) | (.14) | (.01) |
| Total distributions | – | (.49) | (.18) | (.20) | (.06) |
| Net asset value, end of period | $10.18 | $9.63 | $10.63 | $10.08 | $9.76 |
| Total ReturnC,D,E | 5.71% | (5.31)% | 7.52% | 5.38% | (1.77)% |
| Ratios to Average Net AssetsF,G | | | | | |
| Expenses before reductions | 5.33%H | 4.46% | 5.04% | 6.26% | 9.75%H |
| Expenses net of fee waivers, if any | 2.15%H | 2.16% | 2.15% | 2.15% | 2.15%H |
| Expenses net of all reductions | 2.14%H | 2.15% | 2.14% | 2.13% | 2.14%H |
| Net investment income (loss) | .72%H | .71% | 1.34% | 1.04% | .90%H |
| Supplemental Data | | | | | |
| Net assets, end of period (000 omitted) | $178 | $185 | $1,060 | $614 | $737 |
| Portfolio turnover rateI | 39%H | 52% | 60% | 46% | 59%H |
A For the period August 11, 2016 (commencement of operations) to July 31, 2017.
B Calculated based on average shares outstanding during the period.
C Total returns for periods of less than one year are not annualized.
D Total returns would have been lower if certain expenses had not been reduced during the applicable periods shown.
E Total returns do not include the effect of the contingent deferred sales charge.
F Fees and expenses of any underlying mutual funds or exchange-traded funds (ETFs) are not included in the Fund's expense ratio. The Fund indirectly bears its proportionate share of these expenses. For additional expense information related to investments in Fidelity Central Funds, please refer to the "Investments in Fidelity Central Funds" note found in the Notes to Financial Statements section of the most recent Annual or Semi-Annual report.
G Expense ratios reflect operating expenses of the class. Expenses before reductions do not reflect amounts reimbursed, waived, or reduced through arrangements with the investment adviser, brokerage services, or other offset arrangements, if applicable, and do not represent the amount paid by the class during periods when reimbursements, waivers or reductions occur.
H Annualized
I Amount does not include the portfolio activity of any underlying mutual funds or exchange-traded funds (ETFs).
See accompanying notes which are an integral part of the financial statements.
Fidelity Advisor Global Real Estate Fund Class I
| | Six months ended (Unaudited) January 31, | Years endedJuly 31, | | | |
| | 2021 | 2020 | 2019 | 2018 | 2017 A |
| Selected Per–Share Data | | | | | |
| Net asset value, beginning of period | $9.71 | $10.75 | $10.15 | $9.82 | $10.00 |
| Income from Investment Operations | | | | | |
| Net investment income (loss)B | .08 | .17 | .24 | .20 | .17 |
| Net realized and unrealized gain (loss) | .54 | (.58) | .59 | .43 | (.26) |
| Total from investment operations | .62 | (.41) | .83 | .63 | (.09) |
| Distributions from net investment income | (.16) | (.26) | (.17) | (.16) | (.08) |
| Distributions from net realized gain | – | (.37) | (.06) | (.14) | (.01) |
| Total distributions | (.16) | (.63) | (.23) | (.30) | (.09) |
| Net asset value, end of period | $10.17 | $9.71 | $10.75 | $10.15 | $9.82 |
| Total ReturnC,D | 6.35% | (4.40)% | 8.55% | 6.48% | (.80)% |
| Ratios to Average Net AssetsE,F | | | | | |
| Expenses before reductions | 4.11%G | 3.97% | 4.20% | 5.41% | 8.74%G |
| Expenses net of fee waivers, if any | 1.15%G | 1.16% | 1.15% | 1.15% | 1.15%G |
| Expenses net of all reductions | 1.15%G | 1.14% | 1.14% | 1.13% | 1.14%G |
| Net investment income (loss) | 1.71%G | 1.71% | 2.34% | 2.04% | 1.90%G |
| Supplemental Data | | | | | |
| Net assets, end of period (000 omitted) | $1,247 | $1,066 | $1,056 | $986 | $863 |
| Portfolio turnover rateH | 39%G | 52% | 60% | 46% | 59%G |
A For the period August 11, 2016 (commencement of operations) to July 31, 2017.
B Calculated based on average shares outstanding during the period.
C Total returns for periods of less than one year are not annualized.
D Total returns would have been lower if certain expenses had not been reduced during the applicable periods shown.
E Fees and expenses of any underlying mutual funds or exchange-traded funds (ETFs) are not included in the Fund's expense ratio. The Fund indirectly bears its proportionate share of these expenses. For additional expense information related to investments in Fidelity Central Funds, please refer to the "Investments in Fidelity Central Funds" note found in the Notes to Financial Statements section of the most recent Annual or Semi-Annual report.
F Expense ratios reflect operating expenses of the class. Expenses before reductions do not reflect amounts reimbursed, waived, or reduced through arrangements with the investment adviser, brokerage services, or other offset arrangements, if applicable, and do not represent the amount paid by the class during periods when reimbursements, waivers or reductions occur.
G Annualized
H Amount does not include the portfolio activity of any underlying mutual funds or exchange-traded funds (ETFs).
See accompanying notes which are an integral part of the financial statements.
Fidelity Advisor Global Real Estate Fund Class Z
| | Six months ended (Unaudited) January 31, | Years endedJuly 31, | |
| | 2021 | 2020 | 2019 A |
| Selected Per–Share Data | | | |
| Net asset value, beginning of period | $9.73 | $10.76 | $10.01 |
| Income from Investment Operations | | | |
| Net investment income (loss)B | .09 | .19 | .22 |
| Net realized and unrealized gain (loss) | .54 | (.59) | .76 |
| Total from investment operations | .63 | (.40) | .98 |
| Distributions from net investment income | (.16) | (.26) | (.17) |
| Distributions from net realized gain | – | (.37) | (.06) |
| Total distributions | (.16) | (.63) | (.23) |
| Net asset value, end of period | $10.20 | $9.73 | $10.76 |
| Total ReturnC,D | 6.44% | (4.29)% | 10.17% |
| Ratios to Average Net AssetsE,F | | | |
| Expenses before reductions | 3.70%G | 3.54% | 3.87%G |
| Expenses net of fee waivers, if any | 1.00%G | 1.02% | 1.00%G |
| Expenses net of all reductions | 1.00%G | 1.00% | 1.00%G |
| Net investment income (loss) | 1.86%G | 1.86% | 2.50%G |
| Supplemental Data | | | |
| Net assets, end of period (000 omitted) | $612 | $233 | $306 |
| Portfolio turnover rateH | 39%G | 52% | 60% |
A For the period October 2, 2018 (commencement of sale of shares) to July 31, 2019.
B Calculated based on average shares outstanding during the period.
C Total returns for periods of less than one year are not annualized.
D Total returns would have been lower if certain expenses had not been reduced during the applicable periods shown.
E Fees and expenses of any underlying mutual funds or exchange-traded funds (ETFs) are not included in the Fund's expense ratio. The Fund indirectly bears its proportionate share of these expenses. For additional expense information related to investments in Fidelity Central Funds, please refer to the "Investments in Fidelity Central Funds" note found in the Notes to Financial Statements section of the most recent Annual or Semi-Annual report.
F Expense ratios reflect operating expenses of the class. Expenses before reductions do not reflect amounts reimbursed, waived, or reduced through arrangements with the investment adviser, brokerage services, or other offset arrangements, if applicable, and do not represent the amount paid by the class during periods when reimbursements, waivers or reductions occur.
G Annualized
H Amount does not include the portfolio activity of any underlying mutual funds or exchange-traded funds (ETFs).
See accompanying notes which are an integral part of the financial statements.
Notes to Financial Statements (Unaudited)
For the period ended January 31, 2021
1. Organization.
Fidelity Advisor Global Real Estate Fund (the Fund) is a fund of Fidelity Advisor Series VII (the Trust) and is authorized to issue an unlimited number of shares. The Trust is registered under the Investment Company Act of 1940, as amended (the 1940 Act), as an open-end management investment company organized as a Massachusetts business trust. The Fund offers Class A, Class M, Class C, Class I and Class Z shares, each of which has equal rights as to assets and voting privileges. Each class has exclusive voting rights with respect to matters that affect that class. Class C shares will automatically convert to Class A shares after a holding period of ten years from the initial date of purchase, with certain exceptions.
2. Investments in Fidelity Central Funds.
The Fund invests in Fidelity Central Funds, which are open-end investment companies generally available only to other investment companies and accounts managed by the investment adviser and its affiliates. The Fund's Schedule of Investments lists each of the Fidelity Central Funds held as of period end, if any, as an investment of the Fund, but does not include the underlying holdings of each Fidelity Central Fund. As an Investing Fund, the Fund indirectly bears its proportionate share of the expenses of the underlying Fidelity Central Funds.
The Money Market Central Funds seek preservation of capital and current income and are managed by the investment adviser. Annualized expenses of the Money Market Central Funds as of their most recent shareholder report date ranged from less than .005% to .01%.
A complete unaudited list of holdings for each Fidelity Central Fund is available upon request or at the Securities and Exchange Commission (the SEC) website at www.sec.gov. In addition, the financial statements of the Fidelity Central Funds are available on the SEC website or upon request.
3. Significant Accounting Policies.
The Fund is an investment company and applies the accounting and reporting guidance of the Financial Accounting Standards Board (FASB) Accounting Standards Codification Topic 946 Financial Services - Investment Companies. The financial statements have been prepared in conformity with accounting principles generally accepted in the United States of America (GAAP), which require management to make certain estimates and assumptions at the date of the financial statements. Actual results could differ from those estimates. Subsequent events, if any, through the date that the financial statements were issued have been evaluated in the preparation of the financial statements. The following summarizes the significant accounting policies of the Fund:
Investment Valuation. Investments are valued as of 4:00 p.m. Eastern time on the last calendar day of the period. The Board of Trustees (the Board) has delegated the day to day responsibility for the valuation of the Fund's investments to the Fair Value Committee (the Committee) established by the Fund's investment adviser. In accordance with valuation policies and procedures approved by the Board, the Fund attempts to obtain prices from one or more third party pricing vendors or brokers to value its investments. When current market prices, quotations or currency exchange rates are not readily available or reliable, investments will be fair valued in good faith by the Committee, in accordance with procedures adopted by the Board. Factors used in determining fair value vary by investment type and may include market or investment specific events. The frequency with which these procedures are used cannot be predicted and they may be utilized to a significant extent. The Committee oversees the Fund's valuation policies and procedures and reports to the Board on the Committee's activities and fair value determinations. The Board monitors the appropriateness of the procedures used in valuing the Fund's investments and ratifies the fair value determinations of the Committee.
The Fund categorizes the inputs to valuation techniques used to value its investments into a disclosure hierarchy consisting of three levels as shown below:
- Level 1 – quoted prices in active markets for identical investments
- Level 2 – other significant observable inputs (including quoted prices for similar investments, interest rates, prepayment speeds, etc.)
- Level 3 – unobservable inputs (including the Fund's own assumptions based on the best information available)
Valuation techniques used to value the Fund's investments by major category are as follows:
Equity securities, including restricted securities, for which market quotations are readily available, are valued at the last reported sale price or official closing price as reported by a third party pricing vendor on the primary market or exchange on which they are traded and are categorized as Level 1 in the hierarchy. In the event there were no sales during the day or closing prices are not available, securities are valued at the last quoted bid price or may be valued using the last available price and are generally categorized as Level 2 in the hierarchy. For foreign equity securities, when market or security specific events arise, comparisons to the valuation of American Depositary Receipts (ADRs), futures contracts, Exchange-Traded Funds (ETFs) and certain indexes as well as quoted prices for similar securities may be used and would be categorized as Level 2 in the hierarchy. For equity securities, including restricted securities, where observable inputs are limited, assumptions about market activity and risk are used and these securities may be categorized as Level 3 in the hierarchy.
Investments in open-end mutual funds, including the Fidelity Central Funds, are valued at their closing net asset value (NAV) each business day and are categorized as Level 1 in the hierarchy.
Changes in valuation techniques may result in transfers in or out of an assigned level within the disclosure hierarchy. The aggregate value of investments by input level as of January 31, 2021 is included at the end of the Fund's Schedule of Investments.
Foreign Currency. Certain Funds may use foreign currency contracts to facilitate transactions in foreign-denominated securities. Gains and losses from these transactions may arise from changes in the value of the foreign currency or if the counterparties do not perform under the contracts' terms.
Foreign-denominated assets, including investment securities, and liabilities are translated into U.S. dollars at the exchange rates at period end. Purchases and sales of investment securities, income and dividends received, and expenses denominated in foreign currencies are translated into U.S. dollars at the exchange rate in effect on the transaction date.
The effects of exchange rate fluctuations on investments are included with the net realized and unrealized gain (loss) on investment securities. Other foreign currency transactions resulting in realized and unrealized gain (loss) are disclosed separately.
Investment Transactions and Income. For financial reporting purposes, the Fund's investment holdings and NAV include trades executed through the end of the last business day of the period. The NAV per share for processing shareholder transactions is calculated as of the close of business of the New York Stock Exchange (NYSE), normally 4:00 p.m. Eastern time and includes trades executed through the end of the prior business day. Gains and losses on securities sold are determined on the basis of identified cost. Dividend income is recorded on the ex-dividend date, except for certain dividends from foreign securities where the ex-dividend date may have passed, which are recorded as soon as the Fund is informed of the ex-dividend date. Non-cash dividends included in dividend income, if any, are recorded at the fair market value of the securities received. Income and capital gain distributions from Fidelity Central Funds, if any, are recorded on the ex-dividend date. Certain distributions received by the Fund represent a return of capital or capital gain. The Fund determines the components of these distributions subsequent to the ex-dividend date, based upon receipt of tax filings or other correspondence relating to the underlying investment. These distributions are recorded as a reduction of cost of investments and/or as a realized gain. Investment income is recorded net of foreign taxes withheld where recovery of such taxes is uncertain.
Class Allocations and Expenses. Investment income, realized and unrealized capital gains and losses, common expenses of the Fund, and certain fund-level expense reductions, if any, are allocated daily on a pro-rata basis to each class based on the relative net assets of each class to the total net assets of the Fund. Each class differs with respect to transfer agent and distribution and service plan fees incurred. Certain expense reductions may also differ by class. For the reporting period, the allocated portion of income and expenses to each class as a percent of its average net assets may vary due to the timing of recording these transactions in relation to fluctuating net assets of the classes. Expenses directly attributable to a fund are charged to that fund. Expenses attributable to more than one fund are allocated among the respective funds on the basis of relative net assets or other appropriate methods. Expense estimates are accrued in the period to which they relate and adjustments are made when actual amounts are known.
Income Tax Information and Distributions to Shareholders. Each year, the Fund intends to qualify as a regulated investment company under Subchapter M of the Internal Revenue Code, including distributing substantially all of its taxable income and realized gains. As a result, no provision for U.S. Federal income taxes is required. The Fund files a U.S. federal tax return, in addition to state and local tax returns as required. The Fund's federal income tax returns are subject to examination by the Internal Revenue Service (IRS) for a period of three fiscal years after they are filed. State and local tax returns may be subject to examination for an additional fiscal year depending on the jurisdiction. Foreign taxes are provided for based on the Fund's understanding of the tax rules and rates that exist in the foreign markets in which it invests. The Fund is subject to a tax imposed on capital gains by certain countries in which it invests. An estimated deferred tax liability for net unrealized appreciation on the applicable securities is included in Other payables and accrued expenses on the Statement of Assets & Liabilities.
Distributions are declared and recorded on the ex-dividend date. Income and capital gain distributions are declared separately for each class. Income and capital gain distributions are determined in accordance with income tax regulations, which may differ from GAAP.
Capital accounts within the financial statements are adjusted for permanent book-tax differences. These adjustments have no impact on net assets or the results of operations. Capital accounts are not adjusted for temporary book-tax differences which will reverse in a subsequent period.
Book-tax differences are primarily due to foreign currency transactions, partnerships, passive foreign investment companies (PFIC), capital loss carryforwards and losses deferred due to wash sales and excise tax regulations.
As of period end, the cost and unrealized appreciation (depreciation) in securities, and derivatives if applicable, for federal income tax purposes were as follows:
| Gross unrealized appreciation | $673,722 |
| Gross unrealized depreciation | (266,362) |
| Net unrealized appreciation (depreciation) | $407,360 |
| Tax cost | $4,394,618 |
Capital loss carryforwards are only available to offset future capital gains of the Fund to the extent provided by regulations and may be limited. The capital loss carryforward information presented below, including any applicable limitation, is estimated as of prior fiscal period end and is subject to adjustment.
| No expiration | |
| Short-term | $(202,055) |
| Long-term | (12,456) |
| Total capital loss carryforward | $(214,511) |
The Fund elected to defer to its next fiscal year approximately $38,721 of ordinary losses recognized during the period January 1,2019 to July 31, 2020.
Restricted Securities (including Private Placements). The Fund may invest in securities that are subject to legal or contractual restrictions on resale. These securities generally may be resold in transactions exempt from registration or to the public if the securities are registered. Disposal of these securities may involve time-consuming negotiations and expense, and prompt sale at an acceptable price may be difficult. Information regarding restricted securities is included at the end of the Fund's Schedule of Investments.
4. Purchases and Sales of Investments.
Purchases and sales of securities, other than short-term securities, are noted in the table below.
| | Purchases ($) | Sales ($) |
| Fidelity Advisor Global Real Estate Fund | 1,658,448 | 810,940 |
5. Fees and Other Transactions with Affiliates.
Management Fee. Fidelity Management & Research Company LLC (the investment adviser) and its affiliates provide the Fund with investment management related services for which the Fund pays a monthly management fee. The management fee is the sum of an individual fund fee rate that is based on an annual rate of .45% of the Fund's average net assets and an annualized group fee rate that averaged .23% during the period. The group fee rate is based upon the monthly average net assets of a group of registered investment companies with which the investment adviser has management contracts. The group fee rate decreases as assets under management increase and increases as assets under management decrease. For the reporting period, the total annualized management fee rate was .68% of the Fund's average net assets.
Distribution and Service Plan Fees. In accordance with Rule 12b-1 of the 1940 Act, the Fund has adopted separate Distribution and Service Plans for each class of shares. Certain classes pay Fidelity Distributors Company LLC (FDC), an affiliate of the investment adviser, separate Distribution and Service Fees, each of which is based on an annual percentage of each class' average net assets. In addition, FDC may pay financial intermediaries for selling shares of the Fund and providing shareholder support services. For the period, the Distribution and Service Fee rates, total fees and amounts retained by FDC were as follows:
| | Distribution Fee | Service Fee | Total Fees | Retained by FDC |
| Class A | -% | .25% | $2,349 | $1,438 |
| Class M | .25% | .25% | 1,674 | 1,292 |
| Class C | .75% | .25% | 1,008 | 196 |
| | | | $5,031 | $2,926 |
Sales Load. FDC may receive a front-end sales charge of up to 5.75% for selling Class A shares and 3.50% for selling Class M shares, some of which is paid to financial intermediaries for selling shares of the Fund. Depending on the holding period, FDC may receive contingent deferred sales charges levied on Class A, Class M and Class C redemptions. The deferred sales charges are 1.00% for Class C shares, 1.00% for certain purchases of Class A shares and .25% for certain purchases of Class M shares.
For the period, sales charge amounts retained by FDC were as follows:
| | Retained by FDC |
| Class A | $352 |
| Class M | 46 |
| Class C(a) | 24 |
| | $422 |
(a) When Class C shares are initially sold, FDC pays commissions from its own resources to financial intermediaries through which the sales are made.
Transfer Agent Fees. Fidelity Investments Institutional Operations Company LLC (FIIOC), an affiliate of the investment adviser, is the transfer, dividend disbursing and shareholder servicing agent for each class of the Fund. FIIOC receives account fees and asset-based fees that vary according to the account size and type of account of the shareholders of the respective classes of the Fund, except for Class Z. FIIOC receives an asset-based fee of Class Z's average net assets. FIIOC pays for typesetting, printing and mailing of shareholder reports, except proxy statements.
For the period, transfer agent fees for each class were as follows:
| | Amount | % of Class-Level Average Net Assets(a) |
| Class A | $2,473 | .26 |
| Class M | 715 | .21 |
| Class C | 303 | .30 |
| Class I | 789 | .13 |
| Class Z | 64 | .04 |
| | $4,344 | |
(a) Annualized
Accounting Fees. Fidelity Service Company, Inc. (FSC), an affiliate of the investment adviser, maintains the Fund's accounting records. The accounting fee is based on the level of average net assets for each month. For the period, the fees were equivalent to the following annualized rates:
| | % of Average Net Assets |
| Fidelity Advisor Global Real Estate Fund | .04 |
Brokerage Commissions. A portion of portfolio transactions were placed with brokerage firms which are affiliates of the investment adviser. Brokerage commissions are included in net realized gain (loss) and change in net unrealized appreciation (depreciation) in the Statement of Operations. The commissions paid to these affiliated firms were as follows:
| | Amount |
| Fidelity Advisor Global Real Estate Fund | $27 |
Interfund Trades. Funds may purchase from or sell securities to other Fidelity Funds under procedures adopted by the Board. The procedures have been designed to ensure these interfund trades are executed in accordance with Rule 17a-7 of the 1940 Act. Interfund trades are included within the respective purchases and sales amounts shown in the Purchases and Sales of Investments note, and amounted to $28,757 and $53,074, respectively.
6. Committed Line of Credit.
Certain Funds participate with other funds managed by the investment adviser or an affiliate in a $4.25 billion credit facility (the "line of credit") to be utilized for temporary or emergency purposes to fund shareholder redemptions or for other short-term liquidity purposes. The participating funds have agreed to pay commitment fees on their pro-rata portion of the line of credit, which are reflected in Miscellaneous expenses on the Statement of Operations, and are listed below.
| | Amount |
| Fidelity Advisor Global Real Estate Fund | $4 |
During the period, there were no borrowings on this line of credit.
7. Expense Reductions.
The investment adviser contractually agreed to reimburse expenses of each class to the extent annual operating expenses exceeded certain levels of class-level average net assets as noted in the table below. This reimbursement will remain in place through November 30, 2021. Some expenses, for example the compensation of the independent Trustees, and certain miscellaneous expenses such as proxy and shareholder meeting expenses, are excluded from this reimbursement.
The following classes were in reimbursement during the period:
| | Expense Limitations | Reimbursement |
| Class A | 1.40% | $28,830 |
| Class M | 1.65% | 10,290 |
| Class C | 2.15% | 3,209 |
| Class I | 1.15% | 17,381 |
| Class Z | 1.00% | 3,876 |
| | | $63,586 |
Commissions paid to certain brokers with whom the investment adviser, or its affiliates, places trades on behalf of the Fund include an amount in addition to trade execution, which may be rebated back to the Fund to offset expenses. This amount totaled $123 for the period. In addition, through arrangements with the Fund's custodian, credits realized as a result of certain uninvested cash balances were used to reduce the Fund's expenses. During the period, custodian credits reduced the Fund's expenses by $2.
In addition, during the period the investment adviser or an affiliate reimbursed and/or waived a portion of fund-level operating expenses in the amount of $7.
8. Distributions to Shareholders.
Distributions to shareholders of each class were as follows:
| | Six months ended
January 31, 2021 | Year ended
July 31, 2020 |
| Distributions to shareholders | | |
| Class A | $26,351 | $122,644 |
| Class M | 7,125 | 42,186 |
| Class C | – | 39,171 |
| Class I | 19,213 | 62,776 |
| Class Z | 2,877 | 25,746 |
| Total | $55,566 | $292,523 |
9. Share Transactions.
Share transactions for each class were as follows and may contain automatic conversions between classes or exchanges between affiliated funds:
| | Shares | Shares | Dollars | Dollars |
| | Six months ended January 31, 2021 | Year ended July 31, 2020 | Six months ended January 31, 2021 | Year ended July 31, 2020 |
| Class A | | | | |
| Shares sold | 25,354 | 67,738 | $252,480 | $745,778 |
| Reinvestment of distributions | 2,601 | 11,335 | 26,351 | 122,644 |
| Shares redeemed | (4,871) | (207,100) | (48,377) | (2,288,710) |
| Net increase (decrease) | 23,084 | (128,027) | $230,454 | $(1,420,288) |
| Class M | | | | |
| Shares sold | 6,623 | 6,383 | $64,540 | $70,605 |
| Reinvestment of distributions | 704 | 3,899 | 7,125 | 42,186 |
| Shares redeemed | (7,274) | (17,790) | (71,609) | (189,680) |
| Net increase (decrease) | 53 | (7,508) | $56 | $(76,889) |
| Class C | | | | |
| Shares sold | 4,169 | 4,308 | $40,901 | $45,165 |
| Reinvestment of distributions | – | 3,627 | – | 39,171 |
| Shares redeemed | (5,941) | (88,473) | (59,760) | (826,012) |
| Net increase (decrease) | (1,772) | (80,538) | $(18,859) | $(741,676) |
| Class I | | | | |
| Shares sold | 19,282 | 19,620 | $188,516 | $193,070 |
| Reinvestment of distributions | 1,513 | 5,477 | 15,327 | 59,313 |
| Shares redeemed | (7,959) | (13,550) | (78,921) | (124,872) |
| Net increase (decrease) | 12,836 | 11,547 | $124,922 | $127,511 |
| Class Z | | | | |
| Shares sold | 41,732 | 33,783 | $422,453 | $378,938 |
| Reinvestment of distributions | 281 | 2,125 | 2,850 | 23,031 |
| Shares redeemed | (6,031) | (40,352) | (59,447) | (391,233) |
| Net increase (decrease) | 35,982 | (4,444) | $365,856 | $10,736 |
10. Other.
The Fund's organizational documents provide former and current trustees and officers with a limited indemnification against liabilities arising in connection with the performance of their duties to the Fund. In the normal course of business, the Fund may also enter into contracts that provide general indemnifications. The Fund's maximum exposure under these arrangements is unknown as this would be dependent on future claims that may be made against the Fund. The risk of material loss from such claims is considered remote.
At the end of the period, the investment adviser or its affiliates were the owners of record of 49% of the total outstanding shares of the Fund.
11. Coronavirus (COVID-19) Pandemic.
An outbreak of COVID-19 first detected in China during December 2019 has since spread globally and was declared a pandemic by the World Health Organization during March 2020. Developments that disrupt global economies and financial markets, such as the COVID-19 pandemic, may magnify factors that affect the Fund's performance.
Shareholder Expense Example
As a shareholder, you incur two types of costs: (1) transaction costs, which may include sales charges (loads) on purchase payments or redemption proceeds, as applicable and (2) ongoing costs, which generally include management fees, distribution and/or service (12b-1) fees and other Fund expenses. This Example is intended to help you understand your ongoing costs (in dollars) of investing in a fund and to compare these costs with the ongoing costs of investing in other mutual funds.
The Example is based on an investment of $1,000 invested at the beginning of the period and held for the entire period (August 1, 2020 to January 31, 2021).
Actual Expenses
The first line of the accompanying table provides information about actual account values and actual expenses. You may use the information in this line, together with the amount you invested, to estimate the expenses that you paid over the period. Simply divide your account value by $1,000.00 (for example, an $8,600 account value divided by $1,000.00 = 8.6), then multiply the result by the number in the first line for a class/Fund under the heading entitled "Expenses Paid During Period" to estimate the expenses you paid on your account during this period. If any fund is a shareholder of any underlying mutual funds or exchange-traded funds (ETFs) (the Underlying Funds), such fund indirectly bears its proportional share of the expenses of the Underlying Funds in addition to the direct expenses incurred presented in the table. These fees and expenses are not included in the annualized expense ratio used to calculate the expense estimate in the table below.
Hypothetical Example for Comparison Purposes
The second line of the accompanying table provides information about hypothetical account values and hypothetical expenses based on the actual expense ratio and an assumed rate of return of 5% per year before expenses, which is not the actual return. The hypothetical account values and expenses may not be used to estimate the actual ending account balance or expenses you paid for the period. You may use this information to compare the ongoing costs of investing in the Fund and other funds. To do so, compare this 5% hypothetical example with the 5% hypothetical examples that appear in the shareholder reports of the other funds. If any fund is a shareholder of any Underlying Funds, such fund indirectly bears its proportional share of the expenses of the Underlying Funds in addition to the direct expenses as presented in the table. These fees and expenses are not included in the annualized expense ratio used to calculate the expense estimate in the table below.
Please note that the expenses shown in the table are meant to highlight your ongoing costs only and do not reflect any transaction costs. Therefore, the second line of the table is useful in comparing ongoing costs only, and will not help you determine the relative total costs of owning different funds. In addition, if these transactional costs were included, your costs would have been higher.
| | Annualized Expense Ratio-A | Beginning
Account Value
August 1, 2020 | Ending
Account Value
January 31, 2021 | Expenses Paid
During Period-B
August 1, 2020
to January 31, 2021 |
| Fidelity Advisor Global Real Estate Fund | | | | |
| Class A | 1.40% | | | |
| Actual | | $1,000.00 | $1,062.30 | $7.28 |
| Hypothetical-C | | $1,000.00 | $1,018.15 | $7.12 |
| Class M | 1.65% | | | |
| Actual | | $1,000.00 | $1,060.60 | $8.57 |
| Hypothetical-C | | $1,000.00 | $1,016.89 | $8.39 |
| Class C | 2.15% | | | |
| Actual | | $1,000.00 | $1,057.10 | $11.15 |
| Hypothetical-C | | $1,000.00 | $1,014.37 | $10.92 |
| Class I | 1.15% | | | |
| Actual | | $1,000.00 | $1,063.50 | $5.98 |
| Hypothetical-C | | $1,000.00 | $1,019.41 | $5.85 |
| Class Z | 1.00% | | | |
| Actual | | $1,000.00 | $1,064.40 | $5.20 |
| Hypothetical-C | | $1,000.00 | $1,020.16 | $5.09 |
A Annualized expense ratio reflects expenses net of applicable fee waivers.
B Expenses are equal to the annualized expense ratio, multiplied by the average account value over the period, multiplied by 184/ 365 (to reflect the one-half year period). The fees and expenses of any Underlying Funds are not included in each annualized expense ratio.
C 5% return per year before expenses
Board Approval of Investment Advisory Contracts
Fidelity Advisor Global Real Estate Fund
At its January 2021 meeting, the Board of Trustees, including the Independent Trustees (together, the Board), voted to continue the management contract with Fidelity Management & Research Company LLC (FMR), and the sub-advisory agreements and sub-subadvisory agreements, in each case, where applicable (together, the Advisory Contracts) for the fund for four months from February 1, 2021 through May 31, 2021, in connection with changes to the Board's meeting calendar.
The Board considered that the approval of the fund's Advisory Contracts will not result in any changes in (i) the investment process or strategies employed in the management of the fund's assets; (ii) the fees and expenses paid by shareholders; (iii) the nature, extent or quality of services provided under the fund's Advisory Contracts; or (iv) the day-to-day management of the fund or the persons primarily responsible for such management. The Board also considered that since its last approval of the fund's Advisory Contracts, FMR had provided additional information on the fund in support of the annual contract renewal process, including competitive analyses on total expenses and management fees and in-depth reviews of fund performance and fund profitability information. The Board also considered the findings of certain ad hoc committees that had been previously formed to discuss matters relevant to all of the Fidelity funds, including economies of scale, fall-out benefits and retail vs. institutional funds. The Board concluded that the fund's Advisory Contracts are fair and reasonable, and that the fund's Advisory Contracts should be renewed, without modification, through May 31, 2021, with the understanding that the Board will consider the annual renewal for a full one year period in May 2021.
In connection with its consideration of future renewals of the fund's Advisory Contracts, the Board will consider: (i) the nature, extent and quality of services provided to the funds, including shareholder and administrative services and investment performance; (ii) the competitiveness of the management fee and total expenses for the fund; (iii) the costs of the services and profitability, including the revenues earned and the expenses incurred in conducting the business of developing, marketing, distributing, managing, administering, and servicing the fund and its shareholders, to the extent applicable; and (iv) whether there have been economies of scale in respect of the Fidelity funds, whether the Fidelity funds (including the fund) have appropriately benefited from any such economies of scale, and whether there is the potential for realization of any further economies.
Based on its evaluation of all of the conclusions noted above, and after considering all factors it believed relevant, the Board ultimately concluded that the fund's management fee structure is fair and reasonable, and that the continuation of the fund's Advisory Contracts should be approved for four months from February 1, 2021 through May 31, 2021.
AGRE-SANN-0321
1.9881281.104