UNITED STATES
SECURITIES AND EXCHANGE COMMISSION
Washington, D.C. 20549
FORM N-CSR
CERTIFIED SHAREHOLDER REPORT OF REGISTERED
MANAGEMENT INVESTMENT COMPANIES
Investment Company Act file number 811-03010
Fidelity Advisor Series VII
(Exact name of registrant as specified in charter)
245 Summer St., Boston, MA 02210
(Address of principal executive offices) (Zip code)
Margaret Carey, Secretary
245 Summer St.
Boston, Massachusetts 02210
(Name and address of agent for service)
Registrant's telephone number, including area code:
617-563-7000
| |
Date of fiscal year end: | July 31 |
|
|
Date of reporting period: | January 31, 2024 |
Item 1.
Reports to Stockholders
Fidelity Advisor Focus Funds®
Fidelity Advisor® Biotechnology Fund
Fidelity Advisor® Consumer Discretionary Fund
Fidelity Advisor® Energy Fund
Fidelity Advisor® Financials Fund
Fidelity Advisor® Health Care Fund
Fidelity Advisor® Industrials Fund
Fidelity Advisor® Semiconductors Fund
Fidelity Advisor® Technology Fund
Fidelity Advisor® Utilities Fund
Semi-Annual Report
January 31, 2024
Contents
To view a fund's proxy voting guidelines and proxy voting record for the 12-month period ended June 30, visit http://www.fidelity.com/proxyvotingresults or visit the Securities and Exchange Commission's (SEC) web site at http://www.sec.gov.
You may also call 1-877-208-0098 to request a free copy of the proxy voting guidelines.
Standard & Poor's, S&P and S&P 500 are registered service marks of The McGraw-Hill Companies, Inc. and have been licensed for use by Fidelity Distributors Corporation.
Other third-party marks appearing herein are the property of their respective owners.
All other marks appearing herein are registered or unregistered trademarks or service marks of FMR LLC or an affiliated company. © 2024 FMR LLC. All rights reserved.
This report and the financial statements contained herein are submitted for the general information of the shareholders of the Funds. This report is not authorized for distribution to prospective investors in the Funds unless preceded or accompanied by an effective prospectus.
A fund files its complete schedule of portfolio holdings with the SEC for the first and third quarters of each fiscal year on Form N-PORT. Forms N-PORT are available on the SEC's web site at http://www.sec.gov. A fund's Forms N-PORT may be reviewed and copied at the SEC's Public Reference Room in Washington, DC. Information regarding the operation of the SEC's Public Reference Room may be obtained by calling 1-800-SEC-0330.
For a complete list of a fund's portfolio holdings, view the most recent holdings listing, semiannual report, or annual report on Fidelity's web site at http://www.fidelity.com, http://www.institutional.fidelity.com, or http://www.401k.com, as applicable.
NOT FDIC INSURED •MAY LOSE VALUE •NO BANK GUARANTEE
Neither the Funds nor Fidelity Distributors Corporation is a bank.
Top Holdings (% of Fund's net assets) |
| |
| AbbVie, Inc. | 23.7 | |
| Amgen, Inc. | 13.4 | |
| Regeneron Pharmaceuticals, Inc. | 8.2 | |
| Cytokinetics, Inc. | 3.7 | |
| Ascendis Pharma A/S sponsored ADR | 3.7 | |
| Alnylam Pharmaceuticals, Inc. | 3.5 | |
| Gilead Sciences, Inc. | 3.5 | |
| Vaxcyte, Inc. | 2.5 | |
| Argenx SE ADR | 2.4 | |
| Sarepta Therapeutics, Inc. | 1.6 | |
| | 66.2 | |
| |
| Industries (% of Fund's net assets) |
| |
| Biotechnology | 94.5 | |
| Pharmaceuticals | 3.6 | |
| Health Care Providers & Services | 0.2 | |
| Health Care Technology | 0.2 | |
| Financial Services | 0.1 | |
| |
Fidelity Advisor® Biotechnology Fund
Showing Percentage of Net Assets
| Common Stocks - 96.6% |
| | | Shares | Value ($) |
| Biotechnology - 93.0% | | | |
| Biotechnology - 93.0% | | | |
| AbbVie, Inc. | | 2,429,180 | 399,357,190 |
| Acelyrin, Inc. (a) | | 764,147 | 5,822,800 |
| Aerovate Therapeutics, Inc. (a)(b) | | 224,000 | 4,325,440 |
| Allakos, Inc. (b) | | 1,918,400 | 2,436,368 |
| Allogene Therapeutics, Inc. (b) | | 526,700 | 1,853,984 |
| Alnylam Pharmaceuticals, Inc. (b) | | 342,486 | 59,219,254 |
| ALX Oncology Holdings, Inc. (a)(b) | | 649,295 | 9,356,341 |
| Amgen, Inc. | | 718,103 | 225,671,049 |
| Annexon, Inc. (b) | | 1,315,548 | 5,466,102 |
| Apogee Therapeutics, Inc. (a) | | 470,123 | 15,749,121 |
| Arcellx, Inc. (b) | | 220,700 | 13,648,088 |
| Argenx SE ADR (b) | | 104,900 | 39,915,499 |
| Arrowhead Pharmaceuticals, Inc. (b) | | 399,890 | 12,836,469 |
| Ascendis Pharma A/S sponsored ADR (a)(b) | | 474,825 | 61,694,012 |
| Astria Therapeutics, Inc. (b) | | 1,069,551 | 13,936,250 |
| Astria Therapeutics, Inc. warrants (b)(c) | | 247,630 | 2 |
| AVROBIO, Inc. (c)(d)(e) | | 136,300 | 1,689,995 |
| Blueprint Medicines Corp. (b) | | 223,626 | 17,784,976 |
| BridgeBio Pharma, Inc. (e) | | 393,764 | 13,502,168 |
| Cargo Therapeutics, Inc. | | 189,051 | 4,161,013 |
| Celldex Therapeutics, Inc. (b) | | 513,652 | 18,090,823 |
| Cogent Biosciences, Inc. (b) | | 1,198,600 | 5,309,798 |
| Crinetics Pharmaceuticals, Inc. (b) | | 576,300 | 21,023,424 |
| Cytokinetics, Inc. (b) | | 805,171 | 62,908,010 |
| Dianthus Therapeutics, Inc. (b) | | 197,696 | 3,756,224 |
| Dianthus Therapeutics, Inc. (unlisted) (e) | | 302,966 | 5,468,536 |
| Exact Sciences Corp. (b) | | 105,000 | 6,867,000 |
| Fusion Pharmaceuticals, Inc. (b) | | 646,714 | 7,514,817 |
| Fusion Pharmaceuticals, Inc. (e) | | 505,596 | 5,875,026 |
| Gilead Sciences, Inc. | | 742,750 | 58,127,615 |
| Insmed, Inc. (b) | | 381,000 | 10,591,800 |
| Janux Therapeutics, Inc. (a)(b) | | 391,585 | 3,351,968 |
| Keros Therapeutics, Inc. (b) | | 409,600 | 22,675,456 |
| Kymera Therapeutics, Inc. (b) | | 9,900 | 324,522 |
| Madrigal Pharmaceuticals, Inc. (a)(b) | | 53,400 | 11,572,314 |
| Monte Rosa Therapeutics, Inc. (a)(b) | | 632,258 | 3,347,806 |
| Moonlake Immunotherapeutics (a)(b) | | 204,962 | 11,453,277 |
| Morphic Holding, Inc. (b) | | 217,512 | 6,892,955 |
| Neurocrine Biosciences, Inc. (b) | | 30,900 | 4,318,893 |
| Nuvalent, Inc. Class A (b) | | 338,477 | 25,443,316 |
| ORIC Pharmaceuticals, Inc. (a)(b) | | 581,716 | 6,393,059 |
| Regeneron Pharmaceuticals, Inc. (b) | | 146,800 | 138,400,104 |
| Revolution Medicines, Inc. (b) | | 456,000 | 12,654,000 |
| Sarepta Therapeutics, Inc. (b) | | 221,100 | 26,308,689 |
| Scholar Rock Holding Corp. (a)(b) | | 1,257,080 | 17,536,266 |
| Scholar Rock Holding Corp. warrants 12/31/25 (b)(e) | | 6,000 | 45,931 |
| Shattuck Labs, Inc. (a)(b) | | 1,398,244 | 13,199,423 |
| Spyre Therapeutics, Inc. (b) | | 24,000 | 621,840 |
| Spyre Therapeutics, Inc. (e) | | 455,168 | 11,203,733 |
| Tango Therapeutics, Inc. (a)(b) | | 406,869 | 4,780,711 |
| Tango Therapeutics, Inc. (e) | | 317,852 | 3,734,761 |
| Tyra Biosciences, Inc. (a)(b) | | 604,900 | 8,105,660 |
| Vaxcyte, Inc. (b) | | 598,729 | 42,761,225 |
| Verve Therapeutics, Inc. (a)(b) | | 374,194 | 4,048,779 |
| Viking Therapeutics, Inc. (a)(b) | | 705,587 | 17,032,870 |
| Viridian Therapeutics, Inc. (a)(b) | | 1,284,907 | 24,734,460 |
| Xenon Pharmaceuticals, Inc. (b) | | 495,158 | 22,391,045 |
| Zentalis Pharmaceuticals, Inc. (a)(b) | | 613,646 | 7,271,705 |
| | | | 1,564,563,962 |
| Pharmaceuticals - 3.6% | | | |
| Pharmaceuticals - 3.6% | | | |
| Afferent Pharmaceuticals, Inc. rights 12/31/24 (b)(c) | | 1,915,787 | 383,157 |
| Amylyx Pharmaceuticals, Inc. (b) | | 260,100 | 4,161,600 |
| CymaBay Therapeutics, Inc. (b) | | 230,000 | 5,407,300 |
| Edgewise Therapeutics, Inc. (b) | | 566,300 | 10,097,129 |
| Enliven Therapeutics, Inc. (a)(b) | | 676,113 | 10,614,974 |
| Enliven Therapeutics, Inc. rights (b)(c) | | 739,725 | 7 |
| Ikena Oncology, Inc. (b) | | 1,208,666 | 1,619,612 |
| Intra-Cellular Therapies, Inc. (b) | | 110,600 | 7,447,804 |
| Longboard Pharmaceuticals, Inc. (b) | | 339,270 | 7,206,095 |
| Neumora Therapeutics, Inc. (a) | | 306,900 | 4,572,810 |
| Structure Therapeutics, Inc. ADR | | 224,700 | 9,801,414 |
| | | | 61,311,902 |
| TOTAL COMMON STOCKS (Cost $1,064,917,538) | | | 1,625,875,864 |
| | | | |
| Convertible Preferred Stocks - 2.0% |
| | | Shares | Value ($) |
| Biotechnology - 1.5% | | | |
| Biotechnology - 1.5% | | | |
| Bright Peak Therapeutics AG Series B (b)(c)(e) | | 1,920,122 | 3,187,403 |
| Fog Pharmaceuticals, Inc. Series D (b)(c)(e) | | 239,281 | 1,447,650 |
| LifeMine Therapeutics, Inc. Series C (b)(c)(e) | | 1,950,028 | 3,685,553 |
| Rapport Therapeutics, Inc. Series B (c)(e) | | 1,430,189 | 2,602,944 |
| Sonoma Biotherapeutics, Inc.: | | | |
| Series B (b)(c)(e) | | 1,967,762 | 5,431,023 |
| Series B1 (b)(c)(e) | | 1,049,456 | 3,284,797 |
| T-Knife Therapeutics, Inc. Series B (b)(c)(e) | | 1,300,097 | 5,135,383 |
| Treeline Biosciences Series A (b)(c)(e) | | 47,600 | 371,280 |
| | | | 25,146,033 |
| Financial Services - 0.1% | | | |
| Diversified Financial Services - 0.1% | | | |
| Kartos Therapeutics, Inc. Series C (c)(e) | | 530,692 | 3,014,331 |
| Health Care Providers & Services - 0.2% | | | |
| Health Care Facilities - 0.2% | | | |
| Boundless Bio, Inc. Series B (b)(c)(e) | | 3,703,704 | 3,370,371 |
| Health Care Technology - 0.2% | | | |
| Health Care Technology - 0.2% | | | |
| Wugen, Inc. Series B (b)(c)(e) | | 580,277 | 3,290,171 |
| Pharmaceuticals - 0.0% | | | |
| Pharmaceuticals - 0.0% | | | |
| Afferent Pharmaceuticals, Inc. Series C (b)(c)(e) | | 1,915,787 | 19 |
| TOTAL CONVERTIBLE PREFERRED STOCKS (Cost $43,818,204) | | | 34,820,925 |
| | | | |
| Money Market Funds - 7.8% |
| | | Shares | Value ($) |
| Fidelity Cash Central Fund 5.39% (f) | | 21,885,142 | 21,889,519 |
| Fidelity Securities Lending Cash Central Fund 5.39% (f)(g) | | 109,057,905 | 109,068,811 |
| TOTAL MONEY MARKET FUNDS (Cost $130,954,207) | | | 130,958,330 |
| | | | |
| TOTAL INVESTMENT IN SECURITIES - 106.4% (Cost $1,239,689,949) | 1,791,655,119 |
NET OTHER ASSETS (LIABILITIES) - (6.4)% | (108,446,215) |
| NET ASSETS - 100.0% | 1,683,208,904 |
| | |
Legend
| (a) | Security or a portion of the security is on loan at period end. |
| (d) | Security or a portion of the security purchased on a delayed delivery or when-issued basis. |
| (e) | Restricted securities (including private placements) - Investment in securities not registered under the Securities Act of 1933 (excluding 144A issues). At the end of the period, the value of restricted securities (excluding 144A issues) amounted to $76,341,075 or 4.5% of net assets. |
| (f) | Affiliated fund that is generally available only to investment companies and other accounts managed by Fidelity Investments. The rate quoted is the annualized seven-day yield of the fund at period end. A complete unaudited listing of the fund's holdings as of its most recent quarter end is available upon request. In addition, each Fidelity Central Fund's financial statements are available on the SEC's website or upon request. |
| (g) | Investment made with cash collateral received from securities on loan. |
| Additional information on each restricted holding is as follows: |
| Security | Acquisition Date | Acquisition Cost ($) |
| Afferent Pharmaceuticals, Inc. Series C | 7/01/15 | 0 |
| | | |
| AVROBIO, Inc. | 1/30/24 | 1,689,995 |
| | | |
| Boundless Bio, Inc. Series B | 4/23/21 | 5,000,000 |
| | | |
| BridgeBio Pharma, Inc. | 9/25/23 | 10,737,944 |
| | | |
| Bright Peak Therapeutics AG Series B | 5/14/21 | 7,499,997 |
| | | |
| Dianthus Therapeutics, Inc. (unlisted) | 5/03/23 - 1/22/24 | 4,142,189 |
| | | |
| Fog Pharmaceuticals, Inc. Series D | 11/17/22 | 2,575,405 |
| | | |
| Fusion Pharmaceuticals, Inc. | 2/13/23 | 1,719,026 |
| | | |
| Kartos Therapeutics, Inc. Series C | 8/22/23 | 3,000,002 |
| | | |
| LifeMine Therapeutics, Inc. Series C | 2/15/22 | 3,971,408 |
| | | |
| Rapport Therapeutics, Inc. Series B | 8/11/23 | 2,398,813 |
| | | |
| Scholar Rock Holding Corp. warrants 12/31/25 | 6/17/22 | 0 |
| | | |
| Sonoma Biotherapeutics, Inc. Series B | 7/26/21 | 3,888,888 |
| | | |
| Sonoma Biotherapeutics, Inc. Series B1 | 7/26/21 | 3,111,112 |
| | | |
| Spyre Therapeutics, Inc. | 6/22/23 - 12/07/23 | 6,651,451 |
| | | |
| T-Knife Therapeutics, Inc. Series B | 6/30/21 | 7,500,000 |
| | | |
| Tango Therapeutics, Inc. | 8/09/23 | 1,636,938 |
| | | |
| Treeline Biosciences Series A | 7/30/21 | 372,589 |
| | | |
| Wugen, Inc. Series B | 7/09/21 | 4,499,990 |
| | | |
Affiliated Central Funds
Fiscal year to date information regarding the Fund's investments in Fidelity Central Funds, including the ownership percentage, is presented below.
| Affiliate | Value, beginning of period ($) | Purchases ($) | Sales Proceeds ($) | Dividend Income ($) | Realized Gain (loss) ($) | Change in Unrealized appreciation (depreciation) ($) | Value, end of period ($) | % ownership, end of period |
| Fidelity Cash Central Fund 5.39% | 14,192,363 | 314,847,261 | 307,150,105 | 280,206 | - | - | 21,889,519 | 0.0% |
| Fidelity Securities Lending Cash Central Fund 5.39% | 200,794,912 | 334,583,187 | 426,309,288 | 765,736 | - | - | 109,068,811 | 0.4% |
| Total | 214,987,275 | 649,430,448 | 733,459,393 | 1,045,942 | - | - | 130,958,330 | |
| | | | | | | | | |
Amounts in the dividend income column in the above table include any capital gain distributions from underlying funds, which are presented in the corresponding line item in the Statement of Operations, if applicable.
Amounts in the dividend income column for Fidelity Securities Lending Cash Central Fund represents the income earned on investing cash collateral, less rebates paid to borrowers and any lending agent fees associated with the loan, plus any premium payments received for lending certain types of securities.
Amounts included in the purchases and sales proceeds columns may include in-kind transactions, if applicable.
Investment Valuation
The following is a summary of the inputs used, as of January 31, 2024, involving the Fund's assets and liabilities carried at fair value. The inputs or methodology used for valuing securities may not be an indication of the risk associated with investing in those securities. For more information on valuation inputs, and their aggregation into the levels used below, please refer to the Investment Valuation section in the accompanying Notes to Financial Statements.
| Valuation Inputs at Reporting Date: |
| Description | Total ($) | Level 1 ($) | Level 2 ($) | Level 3 ($) |
Investments in Securities: | | | | |
|
| Common Stocks | 1,625,875,864 | 1,607,084,503 | 16,718,200 | 2,073,161 |
|
| Convertible Preferred Stocks | 34,820,925 | - | - | 34,820,925 |
|
| Money Market Funds | 130,958,330 | 130,958,330 | - | - |
| Total Investments in Securities: | 1,791,655,119 | 1,738,042,833 | 16,718,200 | 36,894,086 |
The following is a reconciliation of Investments in Securities for which Level 3 inputs were used in determining value:
| |
| Investments in Securities: | |
| Convertible Preferred Stocks | | | |
| Beginning Balance | $ | 39,058,366 | |
| Net Realized Gain (Loss) on Investment Securities | | - | |
| Net Unrealized Gain (Loss) on Investment Securities | | (1,858,108) | |
| Cost of Purchases | | 5,398,815 | |
| Proceeds of Sales | | (3,734,583) | |
| Amortization/Accretion | | - | |
| Transfers into Level 3 | | - | |
| Transfers out of Level 3 | | (4,043,565) | |
| Ending Balance | $ | 34,820,925 | |
| The change in unrealized gain (loss) for the period attributable to Level 3 securities held at January 31, 2024 | $ | (1,860,614) | |
| Other Investments in Securities | | | |
| Beginning Balance | $ | 3,827,453 | |
| Net Realized Gain (Loss) on Investment Securities | | - | |
| Net Unrealized Gain (Loss) on Investment Securities | | (1,685,891) | |
| Cost of Purchases | | 1,689,995 | |
| Proceeds of Sales | | - | |
| Amortization/Accretion | | - | |
| Transfers into Level 3 | | - | |
| Transfers out of Level 3 | | (1,758,396) | |
| Ending Balance | $ | 2,073,161 | |
| The change in unrealized gain (loss) for the period attributable to Level 3 securities held at January 31, 2024 | $ | (1,685,891) | |
| The information used in the above reconciliation represents fiscal year to date activity for any Investments in Securities identified as using Level 3 inputs at either the beginning or the end of the current fiscal period. Cost of purchases and proceeds of sales may include securities received and/or delivered through in-kind transactions, corporate actions or exchanges. Transfers into Level 3 were attributable to a lack of observable market data resulting from decreases in market activity, decreases in liquidity, security restructurings or corporate actions. Transfers out of Level 3 were attributable to observable market data becoming available for those securities. Transfers in or out of Level 3 represent the beginning value of any Security or Instrument where a change in the pricing level occurred from the beginning to the end of the period. Realized and unrealized gains (losses) disclosed in the reconciliation are included in Net Gain (Loss) on the Fund's Statement of Operations. | |
Fidelity Advisor® Biotechnology Fund
| Statement of Assets and Liabilities |
| | | | January 31, 2024 (Unaudited) |
| | | | | |
| Assets | | | | |
| Investment in securities, at value (including securities loaned of $105,171,978) - See accompanying schedule: | | | | |
Unaffiliated issuers (cost $1,108,735,742) | $ | 1,660,696,789 | | |
Fidelity Central Funds (cost $130,954,207) | | 130,958,330 | | |
| | | | | |
| | | | | |
| Total Investment in Securities (cost $1,239,689,949) | | | $ | 1,791,655,119 |
| Receivable for fund shares sold | | | | 1,321,131 |
| Dividends receivable | | | | 3,765,229 |
| Distributions receivable from Fidelity Central Funds | | | | 180,083 |
| Prepaid expenses | | | | 5,097 |
Total assets | | | | 1,796,926,659 |
| Liabilities | | | | |
| Payable for investments purchased | | | | |
Regular delivery | $ | 62,755 | | |
Delayed delivery | | 1,689,995 | | |
| Payable for fund shares redeemed | | 1,591,936 | | |
| Accrued management fee | | 731,137 | | |
| Distribution and service plan fees payable | | 276,593 | | |
| Other affiliated payables | | 285,266 | | |
| Other payables and accrued expenses | | 44,365 | | |
| Collateral on securities loaned | | 109,035,708 | | |
| Total Liabilities | | | | 113,717,755 |
| Net Assets | | | $ | 1,683,208,904 |
| Net Assets consist of: | | | | |
| Paid in capital | | | $ | 1,182,905,229 |
| Total accumulated earnings (loss) | | | | 500,303,675 |
| Net Assets | | | $ | 1,683,208,904 |
| | | | | |
| Net Asset Value and Maximum Offering Price | | | | |
| Class A : | | | | |
Net Asset Value and redemption price per share ($673,288,497 ÷ 23,631,524 shares)(a) | | | $ | 28.49 |
| Maximum offering price per share (100/94.25 of $28.49) | | | $ | 30.23 |
| Class M : | | | | |
Net Asset Value and redemption price per share ($121,231,478 ÷ 4,649,059 shares)(a) | | | $ | 26.08 |
| Maximum offering price per share (100/96.50 of $26.08) | | | $ | 27.03 |
| Class C : | | | | |
Net Asset Value and offering price per share ($101,768,297 ÷ 4,545,151 shares)(a) | | | $ | 22.39 |
| Class I : | | | | |
Net Asset Value, offering price and redemption price per share ($715,600,915 ÷ 22,987,744 shares) | | | $ | 31.13 |
| Class Z : | | | | |
Net Asset Value, offering price and redemption price per share ($71,319,717 ÷ 2,286,645 shares) | | | $ | 31.19 |
(a)Redemption price per share is equal to net asset value less any applicable contingent deferred sales charge. |
| Statement of Operations |
| | | | Six months ended January 31, 2024 (Unaudited) |
| Investment Income | | | | |
| Dividends | | | $ | 10,346,038 |
| Income from Fidelity Central Funds (including $765,736 from security lending) | | | | 1,045,942 |
| Total Income | | | | 11,391,980 |
| Expenses | | | | |
| Management fee | $ | 3,960,459 | | |
| Transfer agent fees | | 1,344,612 | | |
| Distribution and service plan fees | | 1,521,294 | | |
| Accounting fees | | 210,216 | | |
| Custodian fees and expenses | | 3,156 | | |
| Independent trustees' fees and expenses | | 4,454 | | |
| Registration fees | | 70,714 | | |
| Audit | | 34,805 | | |
| Legal | | 3,987 | | |
| Interest | | 10,909 | | |
| Miscellaneous | | 4,573 | | |
| Total expenses before reductions | | 7,169,179 | | |
| Expense reductions | | (65,874) | | |
| Total expenses after reductions | | | | 7,103,305 |
| Net Investment income (loss) | | | | 4,288,675 |
| Realized and Unrealized Gain (Loss) | | | | |
| Net realized gain (loss) on: | | | | |
| Investment Securities: | | | | |
| Unaffiliated issuers | | 1,816,724 | | |
| Total net realized gain (loss) | | | | 1,816,724 |
| Change in net unrealized appreciation (depreciation) on: | | | | |
| Investment Securities: | | | | |
| Unaffiliated issuers | | 190,769,569 | | |
| Unfunded commitments | | 100,846 | | |
| Total change in net unrealized appreciation (depreciation) | | | | 190,870,415 |
| Net gain (loss) | | | | 192,687,139 |
| Net increase (decrease) in net assets resulting from operations | | | $ | 196,975,814 |
| Statement of Changes in Net Assets |
| |
| | Six months ended January 31, 2024 (Unaudited) | | Year ended July 31, 2023 |
| Increase (Decrease) in Net Assets | | | | |
| Operations | | | | |
| Net investment income (loss) | $ | 4,288,675 | $ | 1,917,025 |
| Net realized gain (loss) | | 1,816,724 | | 80,783,949 |
| Change in net unrealized appreciation (depreciation) | | 190,870,415 | | 158,023,113 |
| Net increase (decrease) in net assets resulting from operations | | 196,975,814 | | 240,724,087 |
| Distributions to shareholders | | (18,817,059) | | - |
| | | | | |
| Share transactions - net increase (decrease) | | (128,087,809) | | (240,917,348) |
| Total increase (decrease) in net assets | | 50,070,946 | | (193,261) |
| | | | | |
| Net Assets | | | | |
| Beginning of period | | 1,633,137,958 | | 1,633,331,219 |
| End of period | $ | 1,683,208,904 | $ | 1,633,137,958 |
| | | | | |
| | | | | |
Financial Highlights
| Fidelity Advisor® Biotechnology Fund Class A |
| |
| | Six months ended (Unaudited) January 31, 2024 | | Years ended July 31, 2023 | | 2022 | | 2021 | | 2020 | | 2019 |
Selected Per-Share Data | | | | | | | | | | | | |
| Net asset value, beginning of period | $ | 25.34 | $ | 22.00 | $ | 32.58 | $ | 31.03 | $ | 25.48 | $ | 27.80 |
| Income from Investment Operations | | | | | | | | | | | | |
Net investment income (loss) A,B | | .06 | | .02 | | (.06) | | .07 | | .03 | | .03 |
| Net realized and unrealized gain (loss) | | 3.41 | | 3.32 | | (5.16) | | 4.42 | | 7.40 | | (1.76) |
| Total from investment operations | | 3.47 | | 3.34 | | (5.22) | | 4.49 | | 7.43 | | (1.73) |
| Distributions from net investment income | | (.32) | | - | | (.11) | | (.13) | | - | | - |
| Distributions from net realized gain | | - | | - | | (5.25) | | (2.81) | | (1.88) | | (.59) |
| Total distributions | | (.32) | | - | | (5.36) | | (2.94) | | (1.88) | | (.59) |
| Net asset value, end of period | $ | 28.49 | $ | 25.34 | $ | 22.00 | $ | 32.58 | $ | 31.03 | $ | 25.48 |
Total Return C,D,E | | 13.83% | | 15.18% | | (18.95)% | | 14.03% | | 30.00% | | (6.17)% |
Ratios to Average Net Assets B,F,G | | | | | | | | | | | | |
| Expenses before reductions | | 1.01% H | | 1.01% | | 1.00% | | 1.01% | | 1.02% | | 1.04% |
| Expenses net of fee waivers, if any | | 1.00% H | | 1.00% | | 1.00% | | 1.00% | | 1.02% | | 1.03% |
| Expenses net of all reductions | | 1.00% H | | 1.00% | | 1.00% | | 1.00% | | 1.02% | | 1.03% |
| Net investment income (loss) | | .50% H | | .07% | | (.23)% | | .20% | | .11% | | .13% |
| Supplemental Data | | | | | | | | | | | | |
| Net assets, end of period (000 omitted) | $ | 673,288 | $ | 636,505 | $ | 594,911 | $ | 808,610 | $ | 722,896 | $ | 616,894 |
Portfolio turnover rate I | | 87% H | | 78% | | 43% | | 72% | | 66% | | 62% |
ACalculated based on average shares outstanding during the period.
BNet investment income (loss) is affected by the timing of the declaration of dividends by any underlying mutual funds or exchange-traded funds (ETFs). Net investment income (loss) of any mutual funds or ETFs is not included in the Fund's net investment income (loss) ratio.
CTotal returns for periods of less than one year are not annualized.
DTotal returns would have been lower if certain expenses had not been reduced during the applicable periods shown.
ETotal returns do not include the effect of the sales charges.
FFees and expenses of any underlying mutual funds or exchange-traded funds (ETFs) are not included in the Fund's expense ratio. The Fund indirectly bears its proportionate share of these expenses. For additional expense information related to investments in Fidelity Central Funds, please refer to the "Investments in Fidelity Central Funds" note found in the Notes to Financial Statements section of the most recent Annual or Semi-Annual report.
GExpense ratios reflect operating expenses of the class. Expenses before reductions do not reflect amounts reimbursed, waived, or reduced through arrangements with the investment adviser, brokerage services, or other offset arrangements, if applicable, and do not represent the amount paid by the class during periods when reimbursements, waivers or reductions occur.
HAnnualized.
IAmount does not include the portfolio activity of any underlying mutual funds or exchange-traded funds (ETFs).
| Fidelity Advisor® Biotechnology Fund Class M |
| |
| | Six months ended (Unaudited) January 31, 2024 | | Years ended July 31, 2023 | | 2022 | | 2021 | | 2020 | | 2019 |
Selected Per-Share Data | | | | | | | | | | | | |
| Net asset value, beginning of period | $ | 23.17 | $ | 20.17 | $ | 30.35 | $ | 29.08 | $ | 24.02 | $ | 26.32 |
| Income from Investment Operations | | | | | | | | | | | | |
Net investment income (loss) A,B | | .03 | | (.05) | | (.13) | | (.02) | | (.05) | | (.04) |
| Net realized and unrealized gain (loss) | | 3.11 | | 3.05 | | (4.73) | | 4.14 | | 6.96 | | (1.67) |
| Total from investment operations | | 3.14 | | 3.00 | | (4.86) | | 4.12 | | 6.91 | | (1.71) |
| Distributions from net investment income | | (.23) | | - | | (.07) | | (.07) | | - | | - |
| Distributions from net realized gain | | - | | - | | (5.25) | | (2.78) | | (1.85) | | (.59) |
| Total distributions | | (.23) | | - | | (5.32) | | (2.85) | | (1.85) | | (.59) |
| Net asset value, end of period | $ | 26.08 | $ | 23.17 | $ | 20.17 | $ | 30.35 | $ | 29.08 | $ | 24.02 |
Total Return C,D,E | | 13.70% | | 14.87% | | (19.18)% | | 13.69% | | 29.64% | | (6.44)% |
Ratios to Average Net Assets B,F,G | | | | | | | | | | | | |
| Expenses before reductions | | 1.28% H | | 1.29% | | 1.28% | | 1.28% | | 1.32% | | 1.34% |
| Expenses net of fee waivers, if any | | 1.27% H | | 1.28% | | 1.28% | | 1.28% | | 1.32% | | 1.34% |
| Expenses net of all reductions | | 1.27% H | | 1.28% | | 1.28% | | 1.28% | | 1.31% | | 1.34% |
| Net investment income (loss) | | .23% H | | (.20)% | | (.51)% | | (.07)% | | (.18)% | | (.18)% |
| Supplemental Data | | | | | | | | | | | | |
| Net assets, end of period (000 omitted) | $ | 121,231 | $ | 113,960 | $ | 109,815 | $ | 161,619 | $ | 144,568 | $ | 119,312 |
Portfolio turnover rate I | | 87% H | | 78% | | 43% | | 72% | | 66% | | 62% |
ACalculated based on average shares outstanding during the period.
BNet investment income (loss) is affected by the timing of the declaration of dividends by any underlying mutual funds or exchange-traded funds (ETFs). Net investment income (loss) of any mutual funds or ETFs is not included in the Fund's net investment income (loss) ratio.
CTotal returns for periods of less than one year are not annualized.
DTotal returns would have been lower if certain expenses had not been reduced during the applicable periods shown.
ETotal returns do not include the effect of the sales charges.
FFees and expenses of any underlying mutual funds or exchange-traded funds (ETFs) are not included in the Fund's expense ratio. The Fund indirectly bears its proportionate share of these expenses. For additional expense information related to investments in Fidelity Central Funds, please refer to the "Investments in Fidelity Central Funds" note found in the Notes to Financial Statements section of the most recent Annual or Semi-Annual report.
GExpense ratios reflect operating expenses of the class. Expenses before reductions do not reflect amounts reimbursed, waived, or reduced through arrangements with the investment adviser, brokerage services, or other offset arrangements, if applicable, and do not represent the amount paid by the class during periods when reimbursements, waivers or reductions occur.
HAnnualized.
IAmount does not include the portfolio activity of any underlying mutual funds or exchange-traded funds (ETFs).
| Fidelity Advisor® Biotechnology Fund Class C |
| |
| | Six months ended (Unaudited) January 31, 2024 | | Years ended July 31, 2023 | | 2022 | | 2021 | | 2020 | | 2019 |
Selected Per-Share Data | | | | | | | | | | | | |
| Net asset value, beginning of period | $ | 19.75 | $ | 17.27 | $ | 26.79 | $ | 25.97 | $ | 21.71 | $ | 23.96 |
| Income from Investment Operations | | | | | | | | | | | | |
Net investment income (loss) A,B | | (.02) | | (.13) | | (.21) | | (.15) | | (.15) | | (.14) |
| Net realized and unrealized gain (loss) | | 2.66 | | 2.61 | | (4.07) | | 3.71 | | 6.26 | | (1.52) |
| Total from investment operations | | 2.64 | | 2.48 | | (4.28) | | 3.56 | | 6.11 | | (1.66) |
| Distributions from net investment income | | - | | - | | - | | (.01) | | - | | - |
| Distributions from net realized gain | | - | | - | | (5.24) | | (2.73) | | (1.85) | | (.59) |
| Total distributions | | - | | - | | (5.24) | | (2.74) | | (1.85) | | (.59) |
| Net asset value, end of period | $ | 22.39 | $ | 19.75 | $ | 17.27 | $ | 26.79 | $ | 25.97 | $ | 21.71 |
Total Return C,D,E | | 13.37% | | 14.36% | | (19.54)% | | 13.15% | | 29.07% | | (6.87)% |
Ratios to Average Net Assets B,F,G | | | | | | | | | | | | |
| Expenses before reductions | | 1.77% H | | 1.76% | | 1.75% | | 1.75% | | 1.77% | | 1.78% |
| Expenses net of fee waivers, if any | | 1.76% H | | 1.76% | | 1.74% | | 1.75% | | 1.77% | | 1.77% |
| Expenses net of all reductions | | 1.76% H | | 1.76% | | 1.74% | | 1.75% | | 1.76% | | 1.77% |
| Net investment income (loss) | | (.26)% H | | (.69)% | | (.97)% | | (.55)% | | (.63)% | | (.61)% |
| Supplemental Data | | | | | | | | | | | | |
| Net assets, end of period (000 omitted) | $ | 101,768 | $ | 119,843 | $ | 168,797 | $ | 328,417 | $ | 384,420 | $ | 398,749 |
Portfolio turnover rate I | | 87% H | | 78% | | 43% | | 72% | | 66% | | 62% |
ACalculated based on average shares outstanding during the period.
BNet investment income (loss) is affected by the timing of the declaration of dividends by any underlying mutual funds or exchange-traded funds (ETFs). Net investment income (loss) of any mutual funds or ETFs is not included in the Fund's net investment income (loss) ratio.
CTotal returns for periods of less than one year are not annualized.
DTotal returns would have been lower if certain expenses had not been reduced during the applicable periods shown.
ETotal returns do not include the effect of the contingent deferred sales charge.
FFees and expenses of any underlying mutual funds or exchange-traded funds (ETFs) are not included in the Fund's expense ratio. The Fund indirectly bears its proportionate share of these expenses. For additional expense information related to investments in Fidelity Central Funds, please refer to the "Investments in Fidelity Central Funds" note found in the Notes to Financial Statements section of the most recent Annual or Semi-Annual report.
GExpense ratios reflect operating expenses of the class. Expenses before reductions do not reflect amounts reimbursed, waived, or reduced through arrangements with the investment adviser, brokerage services, or other offset arrangements, if applicable, and do not represent the amount paid by the class during periods when reimbursements, waivers or reductions occur.
HAnnualized.
IAmount does not include the portfolio activity of any underlying mutual funds or exchange-traded funds (ETFs).
| Fidelity Advisor® Biotechnology Fund Class I |
| |
| | Six months ended (Unaudited) January 31, 2024 | | Years ended July 31, 2023 | | 2022 | | 2021 | | 2020 | | 2019 |
Selected Per-Share Data | | | | | | | | | | | | |
| Net asset value, beginning of period | $ | 27.71 | $ | 23.99 | $ | 35.00 | $ | 33.16 | $ | 27.08 | $ | 29.42 |
| Income from Investment Operations | | | | | | | | | | | | |
Net investment income (loss) A,B | | .10 | | .09 | | .01 | | .17 | | .11 | | .11 |
| Net realized and unrealized gain (loss) | | 3.73 | | 3.63 | | (5.61) | | 4.72 | | 7.88 | | (1.86) |
| Total from investment operations | | 3.83 | | 3.72 | | (5.60) | | 4.89 | | 7.99 | | (1.75) |
| Distributions from net investment income | | (.41) | | - | | (.16) | | (.21) | | - | | - |
| Distributions from net realized gain | | - | | - | | (5.25) | | (2.85) | | (1.91) | | (.59) |
| Total distributions | | (.41) | | - | | (5.41) | | (3.05) C | | (1.91) | | (.59) |
| Net asset value, end of period | $ | 31.13 | $ | 27.71 | $ | 23.99 | $ | 35.00 | $ | 33.16 | $ | 27.08 |
Total Return D,E | | 14.00% | | 15.51% | | (18.74)% | | 14.34% | | 30.32% | | (5.89)% |
Ratios to Average Net Assets B,F,G | | | | | | | | | | | | |
| Expenses before reductions | | .74% H | | .74% | | .73% | | .74% | | .75% | | .76% |
| Expenses net of fee waivers, if any | | .73% H | | .73% | | .73% | | .74% | | .75% | | .76% |
| Expenses net of all reductions | | .73% H | | .73% | | .73% | | .74% | | .75% | | .76% |
| Net investment income (loss) | | .78% H | | .34% | | .04% | | .47% | | .38% | | .40% |
| Supplemental Data | | | | | | | | | | | | |
| Net assets, end of period (000 omitted) | $ | 715,601 | $ | 701,786 | $ | 697,079 | $ | 1,129,492 | $ | 1,092,145 | $ | 1,006,084 |
Portfolio turnover rate I | | 87% H | | 78% | | 43% | | 72% | | 66% | | 62% |
ACalculated based on average shares outstanding during the period.
BNet investment income (loss) is affected by the timing of the declaration of dividends by any underlying mutual funds or exchange-traded funds (ETFs). Net investment income (loss) of any mutual funds or ETFs is not included in the Fund's net investment income (loss) ratio.
CTotal distributions per share do not sum due to rounding.
DTotal returns for periods of less than one year are not annualized.
ETotal returns would have been lower if certain expenses had not been reduced during the applicable periods shown.
FFees and expenses of any underlying mutual funds or exchange-traded funds (ETFs) are not included in the Fund's expense ratio. The Fund indirectly bears its proportionate share of these expenses. For additional expense information related to investments in Fidelity Central Funds, please refer to the "Investments in Fidelity Central Funds" note found in the Notes to Financial Statements section of the most recent Annual or Semi-Annual report.
GExpense ratios reflect operating expenses of the class. Expenses before reductions do not reflect amounts reimbursed, waived, or reduced through arrangements with the investment adviser, brokerage services, or other offset arrangements, if applicable, and do not represent the amount paid by the class during periods when reimbursements, waivers or reductions occur.
HAnnualized.
IAmount does not include the portfolio activity of any underlying mutual funds or exchange-traded funds (ETFs).
| Fidelity Advisor® Biotechnology Fund Class Z |
| |
| | Six months ended (Unaudited) January 31, 2024 | | Years ended July 31, 2023 | | 2022 | | 2021 | | 2020 | | 2019 A |
Selected Per-Share Data | | | | | | | | | | | | |
| Net asset value, beginning of period | $ | 27.81 | $ | 24.04 | $ | 35.05 | $ | 33.22 | $ | 27.10 | $ | 30.06 |
| Income from Investment Operations | | | | | | | | | | | | |
Net investment income (loss) B,C | | .12 | | .13 | | .05 | | .21 | | .15 | | .16 |
| Net realized and unrealized gain (loss) | | 3.73 | | 3.64 | | (5.62) | | 4.74 | | 7.90 | | (2.53) |
| Total from investment operations | | 3.85 | | 3.77 | | (5.57) | | 4.95 | | 8.05 | | (2.37) |
| Distributions from net investment income | | (.47) | | - | | (.19) | | (.26) | | (.02) | | - |
| Distributions from net realized gain | | - | | - | | (5.25) | | (2.87) | | (1.91) | | (.59) |
| Total distributions | | (.47) | | - | | (5.44) | | (3.12) D | | (1.93) | | (.59) |
| Net asset value, end of period | $ | 31.19 | $ | 27.81 | $ | 24.04 | $ | 35.05 | $ | 33.22 | $ | 27.10 |
Total Return E,F | | 14.04% | | 15.68% | | (18.63)% | | 14.49% | | 30.53% | | (7.83)% |
Ratios to Average Net Assets C,G,H | | | | | | | | | | | | |
| Expenses before reductions | | .61% I | | .61% | | .61% | | .61% | | .62% | | .63% I |
| Expenses net of fee waivers, if any | | .60% I | | .60% | | .60% | | .61% | | .62% | | .63% I |
| Expenses net of all reductions | | .60% I | | .60% | | .60% | | .61% | | .62% | | .62% I |
| Net investment income (loss) | | .90% I | | .47% | | .16% | | .60% | | .51% | | .73% I |
| Supplemental Data | | | | | | | | | | | | |
| Net assets, end of period (000 omitted) | $ | 71,320 | $ | 61,044 | $ | 62,729 | $ | 89,641 | $ | 62,743 | $ | 30,116 |
Portfolio turnover rate J | | 87% I | | 78% | | 43% | | 72% | | 66% | | 62% |
AFor the period October 2, 2018 (commencement of sale of shares) through July 31, 2019.
BCalculated based on average shares outstanding during the period.
CNet investment income (loss) is affected by the timing of the declaration of dividends by any underlying mutual funds or exchange-traded funds (ETFs). Net investment income (loss) of any mutual funds or ETFs is not included in the Fund's net investment income (loss) ratio.
DTotal distributions per share do not sum due to rounding.
ETotal returns for periods of less than one year are not annualized.
FTotal returns would have been lower if certain expenses had not been reduced during the applicable periods shown.
GFees and expenses of any underlying mutual funds or exchange-traded funds (ETFs) are not included in the Fund's expense ratio. The Fund indirectly bears its proportionate share of these expenses. For additional expense information related to investments in Fidelity Central Funds, please refer to the "Investments in Fidelity Central Funds" note found in the Notes to Financial Statements section of the most recent Annual or Semi-Annual report.
HExpense ratios reflect operating expenses of the class. Expenses before reductions do not reflect amounts reimbursed, waived, or reduced through arrangements with the investment adviser, brokerage services, or other offset arrangements, if applicable, and do not represent the amount paid by the class during periods when reimbursements, waivers or reductions occur.
IAnnualized.
JAmount does not include the portfolio activity of any underlying mutual funds or exchange-traded funds (ETFs).
Top Holdings (% of Fund's net assets) |
| |
| Amazon.com, Inc. | 24.4 | |
| Tesla, Inc. | 9.4 | |
| The Home Depot, Inc. | 5.0 | |
| Lowe's Companies, Inc. | 4.4 | |
| TJX Companies, Inc. | 4.0 | |
| Hilton Worldwide Holdings, Inc. | 3.0 | |
| NIKE, Inc. Class B | 2.9 | |
| McDonald's Corp. | 2.9 | |
| Dick's Sporting Goods, Inc. | 2.3 | |
| Booking Holdings, Inc. | 2.3 | |
| | 60.6 | |
| |
| Industries (% of Fund's net assets) |
| |
| Broadline Retail | 25.0 | |
| Specialty Retail | 23.7 | |
| Hotels, Restaurants & Leisure | 18.8 | |
| Automobiles | 11.0 | |
| Textiles, Apparel & Luxury Goods | 10.8 | |
| Household Durables | 4.1 | |
| Automobile Components | 3.6 | |
| Consumer Staples Distribution & Retail | 2.1 | |
| Building Products | 0.7 | |
| Leisure Products | 0.3 | |
| Commercial Services & Supplies | 0.2 | |
| |
Fidelity Advisor® Consumer Discretionary Fund
Showing Percentage of Net Assets
| Common Stocks - 100.3% |
| | | Shares | Value ($) |
| Automobile Components - 3.6% | | | |
| Automotive Parts & Equipment - 3.6% | | | |
| Adient PLC (a) | | 80,721 | 2,801,826 |
| Aptiv PLC (a) | | 121,610 | 9,890,541 |
| Magna International, Inc. Class A (b) | | 61,370 | 3,488,885 |
| | | | 16,181,252 |
| Automobiles - 11.0% | | | |
| Automobile Manufacturers - 11.0% | | | |
| General Motors Co. | | 180,200 | 6,991,760 |
| Tesla, Inc. (a) | | 226,025 | 42,332,222 |
| | | | 49,323,982 |
| Broadline Retail - 25.0% | | | |
| Broadline Retail - 25.0% | | | |
| Amazon.com, Inc. (a) | | 706,669 | 109,675,029 |
| Ollie's Bargain Outlet Holdings, Inc. (a) | | 36,043 | 2,592,573 |
| | | | 112,267,602 |
| Building Products - 0.7% | | | |
| Building Products - 0.7% | | | |
| The AZEK Co., Inc. (a) | | 83,891 | 3,234,837 |
| Commercial Services & Supplies - 0.2% | | | |
| Diversified Support Services - 0.2% | | | |
| Vestis Corp. | | 30,275 | 647,885 |
| Consumer Staples Distribution & Retail - 2.1% | | | |
| Consumer Staples Merchandise Retail - 1.1% | | | |
| Dollar Tree, Inc. (a) | | 36,524 | 4,770,765 |
| Food Distributors - 1.0% | | | |
| Performance Food Group Co. (a) | | 63,872 | 4,642,217 |
TOTAL CONSUMER STAPLES DISTRIBUTION & RETAIL | | | 9,412,982 |
| Hotels, Restaurants & Leisure - 18.8% | | | |
| Casinos & Gaming - 2.6% | | | |
| Caesars Entertainment, Inc. (a) | | 50,541 | 2,217,234 |
| Churchill Downs, Inc. | | 29,134 | 3,524,340 |
| Penn Entertainment, Inc. (a) | | 90,905 | 2,049,908 |
| Red Rock Resorts, Inc. | | 69,420 | 3,795,886 |
| | | | 11,587,368 |
| Hotels, Resorts & Cruise Lines - 8.1% | | | |
| Booking Holdings, Inc. (a) | | 2,927 | 10,266,365 |
| Hilton Worldwide Holdings, Inc. | | 71,845 | 13,719,521 |
| Marriott International, Inc. Class A | | 35,824 | 8,588,088 |
| Royal Caribbean Cruises Ltd. (a) | | 31,370 | 3,999,675 |
| | | | 36,573,649 |
| Restaurants - 8.1% | | | |
| Aramark | | 58,999 | 1,715,691 |
| Brinker International, Inc. (a) | | 26,720 | 1,143,349 |
| Chipotle Mexican Grill, Inc. (a) | | 2,913 | 7,016,747 |
| Domino's Pizza, Inc. | | 19,979 | 8,515,449 |
| Dutch Bros, Inc. (a) | | 22,330 | 599,561 |
| McDonald's Corp. | | 44,331 | 12,976,570 |
| Starbucks Corp. | | 48,570 | 4,518,467 |
| | | | 36,485,834 |
TOTAL HOTELS, RESTAURANTS & LEISURE | | | 84,646,851 |
| Household Durables - 4.1% | | | |
| Home Furnishings - 1.9% | | | |
| Tempur Sealy International, Inc. | | 171,415 | 8,551,894 |
| Homebuilding - 2.2% | | | |
| KB Home | | 66,990 | 3,991,934 |
| PulteGroup, Inc. | | 55,930 | 5,848,041 |
| | | | 9,839,975 |
TOTAL HOUSEHOLD DURABLES | | | 18,391,869 |
| Leisure Products - 0.3% | | | |
| Leisure Products - 0.3% | | | |
| Brunswick Corp. | | 17,800 | 1,436,104 |
| Specialty Retail - 23.7% | | | |
| Apparel Retail - 5.9% | | | |
| Aritzia, Inc. (a) | | 177,000 | 4,306,348 |
| Burlington Stores, Inc. (a) | | 22,013 | 4,207,785 |
| TJX Companies, Inc. | | 190,659 | 18,095,446 |
| | | | 26,609,579 |
| Automotive Retail - 1.0% | | | |
| O'Reilly Automotive, Inc. (a) | | 4,280 | 4,378,654 |
| Home Improvement Retail - 11.0% | | | |
| Floor & Decor Holdings, Inc. Class A (a)(b) | | 73,268 | 7,367,830 |
| Lowe's Companies, Inc. | | 91,747 | 19,527,431 |
| The Home Depot, Inc. | | 63,493 | 22,410,489 |
| | | | 49,305,750 |
| Homefurnishing Retail - 1.3% | | | |
| Wayfair LLC Class A (a) | | 13,895 | 698,224 |
| Williams-Sonoma, Inc. (b) | | 26,370 | 5,099,694 |
| | | | 5,797,918 |
| Other Specialty Retail - 4.5% | | | |
| Academy Sports & Outdoors, Inc. | | 77,800 | 4,880,394 |
| Bath & Body Works, Inc. | | 24,508 | 1,045,511 |
| Dick's Sporting Goods, Inc. | | 70,394 | 10,493,634 |
| Five Below, Inc. (a) | | 13,650 | 2,449,629 |
| Sally Beauty Holdings, Inc. (a) | | 113,780 | 1,401,770 |
| | | | 20,270,938 |
TOTAL SPECIALTY RETAIL | | | 106,362,839 |
| Textiles, Apparel & Luxury Goods - 10.8% | | | |
| Apparel, Accessories & Luxury Goods - 5.5% | | | |
| Levi Strauss & Co. Class A (b) | | 88,810 | 1,445,827 |
| lululemon athletica, Inc. (a) | | 19,470 | 8,835,875 |
| LVMH Moet Hennessy Louis Vuitton SE | | 2,077 | 1,728,186 |
| PVH Corp. | | 43,419 | 5,221,569 |
| Tapestry, Inc. | | 145,804 | 5,655,737 |
| VF Corp. | | 107,340 | 1,766,816 |
| | | | 24,654,010 |
| Footwear - 5.3% | | | |
| Deckers Outdoor Corp. (a) | | 10,452 | 7,877,986 |
| NIKE, Inc. Class B | | 127,912 | 12,986,905 |
| On Holding AG (a)(b) | | 31,484 | 836,215 |
| Skechers U.S.A., Inc. Class A (sub. vtg.) (a) | | 21,600 | 1,348,704 |
| Wolverine World Wide, Inc. | | 113,980 | 952,873 |
| | | | 24,002,683 |
TOTAL TEXTILES, APPAREL & LUXURY GOODS | | | 48,656,693 |
| TOTAL COMMON STOCKS (Cost $245,580,994) | | | 450,562,896 |
| | | | |
| Money Market Funds - 2.4% |
| | | Shares | Value ($) |
| Fidelity Cash Central Fund 5.39% (c) | | 969,520 | 969,714 |
| Fidelity Securities Lending Cash Central Fund 5.39% (c)(d) | | 9,803,770 | 9,804,750 |
| TOTAL MONEY MARKET FUNDS (Cost $10,774,464) | | | 10,774,464 |
| | | | |
| TOTAL INVESTMENT IN SECURITIES - 102.7% (Cost $256,355,458) | 461,337,360 |
NET OTHER ASSETS (LIABILITIES) - (2.7)% | (12,090,874) |
| NET ASSETS - 100.0% | 449,246,486 |
| | |
Legend
| (b) | Security or a portion of the security is on loan at period end. |
| (c) | Affiliated fund that is generally available only to investment companies and other accounts managed by Fidelity Investments. The rate quoted is the annualized seven-day yield of the fund at period end. A complete unaudited listing of the fund's holdings as of its most recent quarter end is available upon request. In addition, each Fidelity Central Fund's financial statements are available on the SEC's website or upon request. |
| (d) | Investment made with cash collateral received from securities on loan. |
Affiliated Central Funds
Fiscal year to date information regarding the Fund's investments in Fidelity Central Funds, including the ownership percentage, is presented below.
| Affiliate | Value, beginning of period ($) | Purchases ($) | Sales Proceeds ($) | Dividend Income ($) | Realized Gain (loss) ($) | Change in Unrealized appreciation (depreciation) ($) | Value, end of period ($) | % ownership, end of period |
| Fidelity Cash Central Fund 5.39% | 7,175,962 | 28,458,591 | 34,664,839 | 35,809 | - | - | 969,714 | 0.0% |
| Fidelity Securities Lending Cash Central Fund 5.39% | 8,748,675 | 62,006,842 | 60,950,767 | 12,136 | - | - | 9,804,750 | 0.0% |
| Total | 15,924,637 | 90,465,433 | 95,615,606 | 47,945 | - | - | 10,774,464 | |
| | | | | | | | | |
Amounts in the dividend income column in the above table include any capital gain distributions from underlying funds, which are presented in the corresponding line item in the Statement of Operations, if applicable.
Amounts in the dividend income column for Fidelity Securities Lending Cash Central Fund represents the income earned on investing cash collateral, less rebates paid to borrowers and any lending agent fees associated with the loan, plus any premium payments received for lending certain types of securities.
Amounts included in the purchases and sales proceeds columns may include in-kind transactions, if applicable.
Investment Valuation
The following is a summary of the inputs used, as of January 31, 2024, involving the Fund's assets and liabilities carried at fair value. The inputs or methodology used for valuing securities may not be an indication of the risk associated with investing in those securities. For more information on valuation inputs, and their aggregation into the levels used below, please refer to the Investment Valuation section in the accompanying Notes to Financial Statements.
| Valuation Inputs at Reporting Date: |
| Description | Total ($) | Level 1 ($) | Level 2 ($) | Level 3 ($) |
Investments in Securities: | | | | |
|
| Common Stocks | 450,562,896 | 448,834,710 | 1,728,186 | - |
|
| Money Market Funds | 10,774,464 | 10,774,464 | - | - |
| Total Investments in Securities: | 461,337,360 | 459,609,174 | 1,728,186 | - |
Fidelity Advisor® Consumer Discretionary Fund
| Statement of Assets and Liabilities |
| | | | January 31, 2024 (Unaudited) |
| | | | | |
| Assets | | | | |
| Investment in securities, at value (including securities loaned of $9,322,201) - See accompanying schedule: | | | | |
Unaffiliated issuers (cost $245,580,994) | $ | 450,562,896 | | |
Fidelity Central Funds (cost $10,774,464) | | 10,774,464 | | |
| | | | | |
| | | | | |
| Total Investment in Securities (cost $256,355,458) | | | $ | 461,337,360 |
| Foreign currency held at value (cost $21,151) | | | | 19,714 |
| Receivable for investments sold | | | | 2,036,466 |
| Receivable for fund shares sold | | | | 90,112 |
| Dividends receivable | | | | 149,796 |
| Distributions receivable from Fidelity Central Funds | | | | 2,574 |
| Prepaid expenses | | | | 854 |
| Other receivables | | | | 2,314 |
Total assets | | | | 463,639,190 |
| Liabilities | | | | |
| Payable to custodian bank | $ | 14,825 | | |
| Payable for investments purchased | | 1,747,965 | | |
| Payable for fund shares redeemed | | 2,428,143 | | |
| Accrued management fee | | 199,432 | | |
| Distribution and service plan fees payable | | 89,443 | | |
| Other affiliated payables | | 78,527 | | |
| Other payables and accrued expenses | | 29,794 | | |
| Collateral on securities loaned | | 9,804,575 | | |
| Total Liabilities | | | | 14,392,704 |
| Net Assets | | | $ | 449,246,486 |
| Net Assets consist of: | | | | |
| Paid in capital | | | $ | 232,918,423 |
| Total accumulated earnings (loss) | | | | 216,328,063 |
| Net Assets | | | $ | 449,246,486 |
| | | | | |
| Net Asset Value and Maximum Offering Price | | | | |
| Class A : | | | | |
Net Asset Value and redemption price per share ($209,985,569 ÷ 5,425,068 shares)(a) | | | $ | 38.71 |
| Maximum offering price per share (100/94.25 of $38.71) | | | $ | 41.07 |
| Class M : | | | | |
Net Asset Value and redemption price per share ($33,747,875 ÷ 956,337 shares)(a) | | | $ | 35.29 |
| Maximum offering price per share (100/96.50 of $35.29) | | | $ | 36.57 |
| Class C : | | | | |
Net Asset Value and offering price per share ($35,392,401 ÷ 1,219,798 shares)(a) | | | $ | 29.01 |
| Class I : | | | | |
Net Asset Value, offering price and redemption price per share ($134,348,058 ÷ 3,138,964 shares) | | | $ | 42.80 |
| Class Z : | | | | |
Net Asset Value, offering price and redemption price per share ($35,772,583 ÷ 831,078 shares) | | | $ | 43.04 |
(a)Redemption price per share is equal to net asset value less any applicable contingent deferred sales charge. |
| Statement of Operations |
| | | | Six months ended January 31, 2024 (Unaudited) |
| Investment Income | | | | |
| Dividends | | | $ | 1,706,024 |
| Income from Fidelity Central Funds (including $12,136 from security lending) | | | | 47,945 |
| Total Income | | | | 1,753,969 |
| Expenses | | | | |
| Management fee | $ | 1,217,434 | | |
| Transfer agent fees | | 386,980 | | |
| Distribution and service plan fees | | 524,125 | | |
| Accounting fees | | 82,395 | | |
| Custodian fees and expenses | | 3,075 | | |
| Independent trustees' fees and expenses | | 1,367 | | |
| Registration fees | | 59,920 | | |
| Audit | | 32,960 | | |
| Legal | | 560 | | |
| Miscellaneous | | 1,066 | | |
| Total expenses before reductions | | 2,309,882 | | |
| Expense reductions | | (20,210) | | |
| Total expenses after reductions | | | | 2,289,672 |
| Net Investment income (loss) | | | | (535,703) |
| Realized and Unrealized Gain (Loss) | | | | |
| Net realized gain (loss) on: | | | | |
| Investment Securities: | | | | |
| Unaffiliated issuers | | 7,294,392 | | |
| Redemptions in-kind | | 15,311,646 | | |
| Foreign currency transactions | | (1,906) | | |
| Total net realized gain (loss) | | | | 22,604,132 |
| Change in net unrealized appreciation (depreciation) on: | | | | |
| Investment Securities: | | | | |
| Unaffiliated issuers | | (14,471,114) | | |
| Assets and liabilities in foreign currencies | | (470) | | |
| Total change in net unrealized appreciation (depreciation) | | | | (14,471,584) |
| Net gain (loss) | | | | 8,132,548 |
| Net increase (decrease) in net assets resulting from operations | | | $ | 7,596,845 |
| Statement of Changes in Net Assets |
| |
| | Six months ended January 31, 2024 (Unaudited) | | Year ended July 31, 2023 |
| Increase (Decrease) in Net Assets | | | | |
| Operations | | | | |
| Net investment income (loss) | $ | (535,703) | $ | (990,830) |
| Net realized gain (loss) | | 22,604,132 | | 11,406,804 |
| Change in net unrealized appreciation (depreciation) | | (14,471,584) | | 43,207,276 |
| Net increase (decrease) in net assets resulting from operations | | 7,596,845 | | 53,623,250 |
| Distributions to shareholders | | - | | (17,163,089) |
| | | | | |
| Share transactions - net increase (decrease) | | (66,460,317) | | 30,658,500 |
| Total increase (decrease) in net assets | | (58,863,472) | | 67,118,661 |
| | | | | |
| Net Assets | | | | |
| Beginning of period | | 508,109,958 | | 440,991,297 |
| End of period | $ | 449,246,486 | $ | 508,109,958 |
| | | | | |
| | | | | |
Financial Highlights
| Fidelity Advisor® Consumer Discretionary Fund Class A |
| |
| | Six months ended (Unaudited) January 31, 2024 | | Years ended July 31, 2023 | | 2022 | | 2021 | | 2020 | | 2019 |
Selected Per-Share Data | | | | | | | | | | | | |
| Net asset value, beginning of period | $ | 37.68 | $ | 35.05 | $ | 45.74 | $ | 33.70 | $ | 29.83 | $ | 28.22 |
| Income from Investment Operations | | | | | | | | | | | | |
Net investment income (loss) A,B | | (.05) | | (.09) | | (.16) | | (.20) | | (.04) | | (.02) |
| Net realized and unrealized gain (loss) | | 1.08 | | 4.07 | | (7.62) | | 12.82 | | 4.73 | | 1.90 |
| Total from investment operations | | 1.03 | | 3.98 | | (7.78) | | 12.62 | | 4.69 | | 1.88 |
| Distributions from net realized gain | | - | | (1.35) | | (2.91) | | (.58) | | (.82) | | (.27) |
| Total distributions | | - | | (1.35) | | (2.91) | | (.58) | | (.82) | | (.27) |
| Net asset value, end of period | $ | 38.71 | $ | 37.68 | $ | 35.05 | $ | 45.74 | $ | 33.70 | $ | 29.83 |
Total Return C,D,E | | 2.73% | | 12.14% | | (18.26)% | | 37.68% | | 16.03% | | 6.81% |
Ratios to Average Net Assets B,F,G | | | | | | | | | | | | |
| Expenses before reductions | | 1.04% H | | 1.04% | | 1.01% | | 1.03% | | 1.07% | | 1.08% |
| Expenses net of fee waivers, if any | | 1.03% H | | 1.04% | | 1.01% | | 1.03% | | 1.07% | | 1.08% |
| Expenses net of all reductions | | 1.03% H | | 1.04% | | 1.01% | | 1.03% | | 1.06% | | 1.07% |
| Net investment income (loss) | | (.28)% H | | (.27)% | | (.38)% | | (.48)% | | (.14)% | | (.09)% |
| Supplemental Data | | | | | | | | | | | | |
| Net assets, end of period (000 omitted) | $ | 209,986 | $ | 203,468 | $ | 188,092 | $ | 259,488 | $ | 159,603 | $ | 159,298 |
Portfolio turnover rate I | | 25% H,J | | 43% | | 34% | | 35% | | 41% J | | 60% |
ACalculated based on average shares outstanding during the period.
BNet investment income (loss) is affected by the timing of the declaration of dividends by any underlying mutual funds or exchange-traded funds (ETFs). Net investment income (loss) of any mutual funds or ETFs is not included in the Fund's net investment income (loss) ratio.
CTotal returns for periods of less than one year are not annualized.
DTotal returns would have been lower if certain expenses had not been reduced during the applicable periods shown.
ETotal returns do not include the effect of the sales charges.
FFees and expenses of any underlying mutual funds or exchange-traded funds (ETFs) are not included in the Fund's expense ratio. The Fund indirectly bears its proportionate share of these expenses. For additional expense information related to investments in Fidelity Central Funds, please refer to the "Investments in Fidelity Central Funds" note found in the Notes to Financial Statements section of the most recent Annual or Semi-Annual report.
GExpense ratios reflect operating expenses of the class. Expenses before reductions do not reflect amounts reimbursed, waived, or reduced through arrangements with the investment adviser, brokerage services, or other offset arrangements, if applicable, and do not represent the amount paid by the class during periods when reimbursements, waivers or reductions occur.
HAnnualized.
IAmount does not include the portfolio activity of any underlying mutual funds or exchange-traded funds (ETFs).
JPortfolio turnover rate excludes securities received or delivered in-kind.
| Fidelity Advisor® Consumer Discretionary Fund Class M |
| |
| | Six months ended (Unaudited) January 31, 2024 | | Years ended July 31, 2023 | | 2022 | | 2021 | | 2020 | | 2019 |
Selected Per-Share Data | | | | | | | | | | | | |
| Net asset value, beginning of period | $ | 34.40 | $ | 32.20 | $ | 42.23 | $ | 31.23 | $ | 27.78 | $ | 26.36 |
| Income from Investment Operations | | | | | | | | | | | | |
Net investment income (loss) A,B | | (.09) | | (.16) | | (.24) | | (.29) | | (.11) | | (.09) |
| Net realized and unrealized gain (loss) | | .98 | | 3.71 | | (7.02) | | 11.87 | | 4.38 | | 1.78 |
| Total from investment operations | | .89 | | 3.55 | | (7.26) | | 11.58 | | 4.27 | | 1.69 |
| Distributions from net realized gain | | - | | (1.35) | | (2.77) | | (.58) | | (.82) | | (.27) |
| Total distributions | | - | | (1.35) | | (2.77) | | (.58) | | (.82) | | (.27) |
| Net asset value, end of period | $ | 35.29 | $ | 34.40 | $ | 32.20 | $ | 42.23 | $ | 31.23 | $ | 27.78 |
Total Return C,D,E | | 2.59% | | 11.87% | | (18.49)% | | 37.32% | | 15.70% | | 6.56% |
Ratios to Average Net Assets B,F,G | | | | | | | | | | | | |
| Expenses before reductions | | 1.30% H | | 1.31% | | 1.28% | | 1.30% | | 1.34% | | 1.34% |
| Expenses net of fee waivers, if any | | 1.29% H | | 1.30% | | 1.27% | | 1.30% | | 1.34% | | 1.34% |
| Expenses net of all reductions | | 1.29% H | | 1.30% | | 1.27% | | 1.29% | | 1.33% | | 1.34% |
| Net investment income (loss) | | (.54)% H | | (.53)% | | (.64)% | | (.75)% | | (.41)% | | (.35)% |
| Supplemental Data | | | | | | | | | | | | |
| Net assets, end of period (000 omitted) | $ | 33,748 | $ | 35,811 | $ | 35,219 | $ | 48,288 | $ | 33,896 | $ | 32,792 |
Portfolio turnover rate I | | 25% H,J | | 43% | | 34% | | 35% | | 41% J | | 60% |
ACalculated based on average shares outstanding during the period.
BNet investment income (loss) is affected by the timing of the declaration of dividends by any underlying mutual funds or exchange-traded funds (ETFs). Net investment income (loss) of any mutual funds or ETFs is not included in the Fund's net investment income (loss) ratio.
CTotal returns for periods of less than one year are not annualized.
DTotal returns would have been lower if certain expenses had not been reduced during the applicable periods shown.
ETotal returns do not include the effect of the sales charges.
FFees and expenses of any underlying mutual funds or exchange-traded funds (ETFs) are not included in the Fund's expense ratio. The Fund indirectly bears its proportionate share of these expenses. For additional expense information related to investments in Fidelity Central Funds, please refer to the "Investments in Fidelity Central Funds" note found in the Notes to Financial Statements section of the most recent Annual or Semi-Annual report.
GExpense ratios reflect operating expenses of the class. Expenses before reductions do not reflect amounts reimbursed, waived, or reduced through arrangements with the investment adviser, brokerage services, or other offset arrangements, if applicable, and do not represent the amount paid by the class during periods when reimbursements, waivers or reductions occur.
HAnnualized.
IAmount does not include the portfolio activity of any underlying mutual funds or exchange-traded funds (ETFs).
JPortfolio turnover rate excludes securities received or delivered in-kind.
| Fidelity Advisor® Consumer Discretionary Fund Class C |
| |
| | Six months ended (Unaudited) January 31, 2024 | | Years ended July 31, 2023 | | 2022 | | 2021 | | 2020 | | 2019 |
Selected Per-Share Data | | | | | | | | | | | | |
| Net asset value, beginning of period | $ | 28.35 | $ | 26.92 | $ | 35.82 | $ | 26.69 | $ | 23.97 | $ | 22.90 |
| Income from Investment Operations | | | | | | | | | | | | |
Net investment income (loss) A,B | | (.14) | | (.25) | | (.36) | | (.40) | | (.21) | | (.19) |
| Net realized and unrealized gain (loss) | | .80 | | 3.03 | | (5.87) | | 10.11 | | 3.75 | | 1.53 |
| Total from investment operations | | .66 | | 2.78 | | (6.23) | | 9.71 | | 3.54 | | 1.34 |
| Distributions from net realized gain | | - | | (1.35) | | (2.67) | | (.58) | | (.82) | | (.27) |
| Total distributions | | - | | (1.35) | | (2.67) | | (.58) | | (.82) | | (.27) |
| Net asset value, end of period | $ | 29.01 | $ | 28.35 | $ | 26.92 | $ | 35.82 | $ | 26.69 | $ | 23.97 |
Total Return C,D,E | | 2.33% | | 11.32% | | (18.88)% | | 36.66% | | 15.14% | | 6.02% |
Ratios to Average Net Assets B,F,G | | | | | | | | | | | | |
| Expenses before reductions | | 1.80% H | | 1.80% | | 1.77% | | 1.79% | | 1.82% | | 1.83% |
| Expenses net of fee waivers, if any | | 1.79% H | | 1.79% | | 1.76% | | 1.79% | | 1.82% | | 1.83% |
| Expenses net of all reductions | | 1.79% H | | 1.79% | | 1.76% | | 1.79% | | 1.82% | | 1.82% |
| Net investment income (loss) | | (1.03)% H | | (1.02)% | | (1.13)% | | (1.24)% | | (.90)% | | (.83)% |
| Supplemental Data | | | | | | | | | | | | |
| Net assets, end of period (000 omitted) | $ | 35,392 | $ | 43,294 | $ | 54,035 | $ | 85,549 | $ | 65,223 | $ | 70,890 |
Portfolio turnover rate I | | 25% H,J | | 43% | | 34% | | 35% | | 41% J | | 60% |
ACalculated based on average shares outstanding during the period.
BNet investment income (loss) is affected by the timing of the declaration of dividends by any underlying mutual funds or exchange-traded funds (ETFs). Net investment income (loss) of any mutual funds or ETFs is not included in the Fund's net investment income (loss) ratio.
CTotal returns for periods of less than one year are not annualized.
DTotal returns would have been lower if certain expenses had not been reduced during the applicable periods shown.
ETotal returns do not include the effect of the contingent deferred sales charge.
FFees and expenses of any underlying mutual funds or exchange-traded funds (ETFs) are not included in the Fund's expense ratio. The Fund indirectly bears its proportionate share of these expenses. For additional expense information related to investments in Fidelity Central Funds, please refer to the "Investments in Fidelity Central Funds" note found in the Notes to Financial Statements section of the most recent Annual or Semi-Annual report.
GExpense ratios reflect operating expenses of the class. Expenses before reductions do not reflect amounts reimbursed, waived, or reduced through arrangements with the investment adviser, brokerage services, or other offset arrangements, if applicable, and do not represent the amount paid by the class during periods when reimbursements, waivers or reductions occur.
HAnnualized.
IAmount does not include the portfolio activity of any underlying mutual funds or exchange-traded funds (ETFs).
JPortfolio turnover rate excludes securities received or delivered in-kind.
| Fidelity Advisor® Consumer Discretionary Fund Class I |
| |
| | Six months ended (Unaudited) January 31, 2024 | | Years ended July 31, 2023 | | 2022 | | 2021 | | 2020 | | 2019 |
Selected Per-Share Data | | | | | | | | | | | | |
| Net asset value, beginning of period | $ | 41.61 | $ | 38.45 | $ | 49.91 | $ | 36.63 | $ | 32.27 | $ | 30.42 |
| Income from Investment Operations | | | | | | | | | | | | |
Net investment income (loss) A,B | | - C | | - C | | (.05) | | (.10) | | .04 | | .06 |
| Net realized and unrealized gain (loss) | | 1.19 | | 4.51 | | (8.36) | | 13.96 | | 5.14 | | 2.06 |
| Total from investment operations | | 1.19 | | 4.51 | | (8.41) | | 13.86 | | 5.18 | | 2.12 |
| Distributions from net realized gain | | - | | (1.35) | | (3.05) | | (.58) | | (.82) | | (.27) |
| Total distributions | | - | | (1.35) | | (3.05) | | (.58) | | (.82) | | (.27) |
| Net asset value, end of period | $ | 42.80 | $ | 41.61 | $ | 38.45 | $ | 49.91 | $ | 36.63 | $ | 32.27 |
Total Return D,E | | 2.86% | | 12.45% | | (18.04)% | | 38.05% | | 16.34% | | 7.10% |
Ratios to Average Net Assets B,F,G | | | | | | | | | | | | |
| Expenses before reductions | | .77% H | | .77% | | .75% | | .77% | | .79% | | .80% |
| Expenses net of fee waivers, if any | | .76% H | | .76% | | .74% | | .76% | | .79% | | .80% |
| Expenses net of all reductions | | .76% H | | .76% | | .74% | | .76% | | .79% | | .80% |
| Net investment income (loss) | | (.01)% H | | .01% | | (.11)% | | (.22)% | | .13% | | .19% |
| Supplemental Data | | | | | | | | | | | | |
| Net assets, end of period (000 omitted) | $ | 134,348 | $ | 139,088 | $ | 118,859 | $ | 259,846 | $ | 134,907 | $ | 159,613 |
Portfolio turnover rate I | | 25% H,J | | 43% | | 34% | | 35% | | 41% J | | 60% |
ACalculated based on average shares outstanding during the period.
BNet investment income (loss) is affected by the timing of the declaration of dividends by any underlying mutual funds or exchange-traded funds (ETFs). Net investment income (loss) of any mutual funds or ETFs is not included in the Fund's net investment income (loss) ratio.
CAmount represents less than $.005 per share.
DTotal returns for periods of less than one year are not annualized.
ETotal returns would have been lower if certain expenses had not been reduced during the applicable periods shown.
FFees and expenses of any underlying mutual funds or exchange-traded funds (ETFs) are not included in the Fund's expense ratio. The Fund indirectly bears its proportionate share of these expenses. For additional expense information related to investments in Fidelity Central Funds, please refer to the "Investments in Fidelity Central Funds" note found in the Notes to Financial Statements section of the most recent Annual or Semi-Annual report.
GExpense ratios reflect operating expenses of the class. Expenses before reductions do not reflect amounts reimbursed, waived, or reduced through arrangements with the investment adviser, brokerage services, or other offset arrangements, if applicable, and do not represent the amount paid by the class during periods when reimbursements, waivers or reductions occur.
HAnnualized.
IAmount does not include the portfolio activity of any underlying mutual funds or exchange-traded funds (ETFs).
JPortfolio turnover rate excludes securities received or delivered in-kind.
| Fidelity Advisor® Consumer Discretionary Fund Class Z |
| |
| | Six months ended (Unaudited) January 31, 2024 | | Years ended July 31, 2023 | | 2022 | | 2021 | | 2020 | | 2019 A |
Selected Per-Share Data | | | | | | | | | | | | |
| Net asset value, beginning of period | $ | 41.82 | $ | 38.59 | $ | 50.10 | $ | 36.72 | $ | 32.31 | $ | 31.56 |
| Income from Investment Operations | | | | | | | | | | | | |
Net investment income (loss) B,C | | .02 | | .05 | | - D | | (.04) | | .09 | | .10 |
| Net realized and unrealized gain (loss) | | 1.20 | | 4.53 | | (8.38) | | 14.00 | | 5.14 | | .92 |
| Total from investment operations | | 1.22 | | 4.58 | | (8.38) | | 13.96 | | 5.23 | | 1.02 |
| Distributions from net realized gain | | - | | (1.35) | | (3.13) | | (.58) | | (.82) | | (.27) |
| Total distributions | | - | | (1.35) | | (3.13) | | (.58) | | (.82) | | (.27) |
| Net asset value, end of period | $ | 43.04 | $ | 41.82 | $ | 38.59 | $ | 50.10 | $ | 36.72 | $ | 32.31 |
Total Return E,F | | 2.92% | | 12.59% | | (17.93)% | | 38.23% | | 16.48% | | 3.36% |
Ratios to Average Net Assets C,G,H | | | | | | | | | | | | |
| Expenses before reductions | | .64% I | | .64% | | .62% | | .64% | | .66% | | .67% I |
| Expenses net of fee waivers, if any | | .63% I | | .64% | | .62% | | .64% | | .66% | | .66% I |
| Expenses net of all reductions | | .63% I | | .64% | | .62% | | .64% | | .66% | | .66% I |
| Net investment income (loss) | | .12% I | | .13% | | .01% | | (.09)% | | .26% | | .39% I |
| Supplemental Data | | | | | | | | | | | | |
| Net assets, end of period (000 omitted) | $ | 35,773 | $ | 86,450 | $ | 44,785 | $ | 87,644 | $ | 48,668 | $ | 6,786 |
Portfolio turnover rate J | | 25% I,K | | 43% | | 34% | | 35% | | 41% K | | 60% |
AFor the period October 2, 2018 (commencement of sale of shares) through July 31, 2019.
BCalculated based on average shares outstanding during the period.
CNet investment income (loss) is affected by the timing of the declaration of dividends by any underlying mutual funds or exchange-traded funds (ETFs). Net investment income (loss) of any mutual funds or ETFs is not included in the Fund's net investment income (loss) ratio.
DAmount represents less than $.005 per share.
ETotal returns for periods of less than one year are not annualized.
FTotal returns would have been lower if certain expenses had not been reduced during the applicable periods shown.
GFees and expenses of any underlying mutual funds or exchange-traded funds (ETFs) are not included in the Fund's expense ratio. The Fund indirectly bears its proportionate share of these expenses. For additional expense information related to investments in Fidelity Central Funds, please refer to the "Investments in Fidelity Central Funds" note found in the Notes to Financial Statements section of the most recent Annual or Semi-Annual report.
HExpense ratios reflect operating expenses of the class. Expenses before reductions do not reflect amounts reimbursed, waived, or reduced through arrangements with the investment adviser, brokerage services, or other offset arrangements, if applicable, and do not represent the amount paid by the class during periods when reimbursements, waivers or reductions occur.
IAnnualized.
JAmount does not include the portfolio activity of any underlying mutual funds or exchange-traded funds (ETFs).
KPortfolio turnover rate excludes securities received or delivered in-kind.
Top Holdings (% of Fund's net assets) |
| |
| Exxon Mobil Corp. | 24.1 | |
| Canadian Natural Resources Ltd. | 5.5 | |
| Chevron Corp. | 5.3 | |
| Marathon Petroleum Corp. | 4.8 | |
| Schlumberger Ltd. | 4.8 | |
| Occidental Petroleum Corp. | 4.8 | |
| Cenovus Energy, Inc. (Canada) | 4.7 | |
| Hess Corp. | 4.1 | |
| Valero Energy Corp. | 3.9 | |
| ConocoPhillips Co. | 3.6 | |
| | 65.6 | |
| |
| Industries (% of Fund's net assets) |
| |
| Oil, Gas & Consumable Fuels | 82.2 | |
| Energy Equipment & Services | 16.6 | |
| Machinery | 0.6 | |
| Independent Power and Renewable Electricity Producers | 0.5 | |
| |
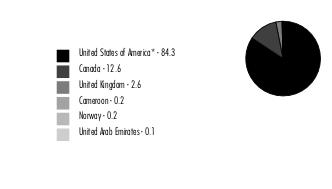
Geographic Diversification (% of Fund's net assets) |
|
* Includes Short-Term investments and Net Other Assets (Liabilities). Percentages are adjusted for the effect of derivatives, if applicable. |
| |
Fidelity Advisor® Energy Fund
Showing Percentage of Net Assets
| Common Stocks - 99.9% |
| | | Shares | Value ($) |
| Energy Equipment & Services - 16.6% | | | |
| Oil & Gas Drilling - 3.5% | | | |
| Noble Corp. PLC | | 148,300 | 6,544,479 |
| Odfjell Drilling Ltd. | | 691,156 | 2,579,369 |
| Patterson-UTI Energy, Inc. | | 1,180,996 | 13,097,246 |
| Shelf Drilling Ltd. (a)(b)(c) | | 513,728 | 1,470,271 |
| Valaris Ltd. (a) | | 247,500 | 15,312,825 |
| | | | 39,004,190 |
| Oil & Gas Equipment & Services - 13.1% | | | |
| Halliburton Co. | | 990,400 | 35,307,760 |
| NOV, Inc. | | 628,100 | 12,254,231 |
| Oceaneering International, Inc. (a) | | 473,500 | 9,839,330 |
| ProFrac Holding Corp. (a)(b) | | 279,500 | 2,210,845 |
| ProPetro Holding Corp. (a) | | 425,100 | 3,596,346 |
| Schlumberger Ltd. | | 1,093,318 | 53,244,587 |
| TechnipFMC PLC | | 1,519,700 | 29,390,998 |
| | | | 145,844,097 |
TOTAL ENERGY EQUIPMENT & SERVICES | | | 184,848,287 |
| Independent Power and Renewable Electricity Producers - 0.5% | | | |
| Independent Power Producers & Energy Traders - 0.5% | | | |
| Vistra Corp. | | 127,100 | 5,214,913 |
| Machinery - 0.6% | | | |
| Industrial Machinery & Supplies & Components - 0.6% | | | |
| Chart Industries, Inc. (a)(b) | | 58,300 | 6,804,776 |
| Oil, Gas & Consumable Fuels - 82.2% | | | |
| Integrated Oil & Gas - 41.4% | | | |
| Cenovus Energy, Inc. (Canada) | | 3,234,500 | 52,398,683 |
| Chevron Corp. | | 396,708 | 58,486,660 |
| Exxon Mobil Corp. | | 2,605,661 | 267,888,008 |
| Imperial Oil Ltd. | | 214,100 | 12,349,626 |
| Occidental Petroleum Corp. | | 914,400 | 52,642,008 |
| Occidental Petroleum Corp. warrants 8/3/27 (a) | | 36,987 | 1,319,696 |
| Suncor Energy, Inc. | | 437,800 | 14,497,271 |
| | | | 459,581,952 |
| Oil & Gas Exploration & Production - 24.2% | | | |
| Antero Resources Corp. (a) | | 428,600 | 9,574,924 |
| APA Corp. | | 123,100 | 3,856,723 |
| Canadian Natural Resources Ltd. | | 951,400 | 60,886,203 |
| Chord Energy Corp. | | 40,430 | 6,216,517 |
| Civitas Resources, Inc. | | 12,944 | 838,901 |
| ConocoPhillips Co. | | 361,450 | 40,435,412 |
| Devon Energy Corp. | | 149,200 | 6,269,384 |
| Diamondback Energy, Inc. | | 115,600 | 17,772,344 |
| EOG Resources, Inc. | | 84,386 | 9,602,283 |
| Hess Corp. | | 323,500 | 45,461,455 |
| National Energy Services Reunited Corp. (a) | | 1,636,771 | 12,112,105 |
| Northern Oil & Gas, Inc. | | 60,030 | 2,011,005 |
| Ovintiv, Inc. | | 531,200 | 22,533,504 |
| Pioneer Natural Resources Co. | | 74,525 | 17,128,081 |
| Range Resources Corp. | | 381,500 | 11,078,760 |
| SM Energy Co. | | 99,300 | 3,682,044 |
| | | | 269,459,645 |
| Oil & Gas Refining & Marketing - 10.0% | | | |
| Marathon Petroleum Corp. | | 323,378 | 53,551,397 |
| Phillips 66 Co. | | 100,018 | 14,433,598 |
| Valero Energy Corp. | | 310,300 | 43,100,670 |
| | | | 111,085,665 |
| Oil & Gas Storage & Transportation - 6.6% | | | |
| Cheniere Energy, Inc. | | 231,600 | 37,980,084 |
| Energy Transfer LP | | 1,745,700 | 24,963,510 |
| Golar LNG Ltd. | | 119,400 | 2,604,114 |
| New Fortress Energy, Inc. (b) | | 233,100 | 7,745,913 |
| | | | 73,293,621 |
TOTAL OIL, GAS & CONSUMABLE FUELS | | | 913,420,883 |
| TOTAL COMMON STOCKS (Cost $680,882,562) | | | 1,110,288,859 |
| | | | |
| Money Market Funds - 1.4% |
| | | Shares | Value ($) |
| Fidelity Cash Central Fund 5.39% (d) | | 5,178,065 | 5,179,101 |
| Fidelity Securities Lending Cash Central Fund 5.39% (d)(e) | | 10,501,339 | 10,502,389 |
| TOTAL MONEY MARKET FUNDS (Cost $15,681,490) | | | 15,681,490 |
| | | | |
| TOTAL INVESTMENT IN SECURITIES - 101.3% (Cost $696,564,052) | 1,125,970,349 |
NET OTHER ASSETS (LIABILITIES) - (1.3)% | (14,504,434) |
| NET ASSETS - 100.0% | 1,111,465,915 |
| | |
Legend
| (b) | Security or a portion of the security is on loan at period end. |
| (c) | Security exempt from registration under Rule 144A of the Securities Act of 1933. These securities may be resold in transactions exempt from registration, normally to qualified institutional buyers. At the end of the period, the value of these securities amounted to $1,470,271 or 0.1% of net assets. |
| (d) | Affiliated fund that is generally available only to investment companies and other accounts managed by Fidelity Investments. The rate quoted is the annualized seven-day yield of the fund at period end. A complete unaudited listing of the fund's holdings as of its most recent quarter end is available upon request. In addition, each Fidelity Central Fund's financial statements are available on the SEC's website or upon request. |
| (e) | Investment made with cash collateral received from securities on loan. |
Affiliated Central Funds
Fiscal year to date information regarding the Fund's investments in Fidelity Central Funds, including the ownership percentage, is presented below.
| Affiliate | Value, beginning of period ($) | Purchases ($) | Sales Proceeds ($) | Dividend Income ($) | Realized Gain (loss) ($) | Change in Unrealized appreciation (depreciation) ($) | Value, end of period ($) | % ownership, end of period |
| Fidelity Cash Central Fund 5.39% | 4,273,105 | 97,944,996 | 97,039,000 | 108,719 | - | - | 5,179,101 | 0.0% |
| Fidelity Securities Lending Cash Central Fund 5.39% | 39,722,849 | 463,727,656 | 492,948,116 | 36,147 | - | - | 10,502,389 | 0.0% |
| Total | 43,995,954 | 561,672,652 | 589,987,116 | 144,866 | - | - | 15,681,490 | |
| | | | | | | | | |
Amounts in the dividend income column in the above table include any capital gain distributions from underlying funds, which are presented in the corresponding line item in the Statement of Operations, if applicable.
Amounts in the dividend income column for Fidelity Securities Lending Cash Central Fund represents the income earned on investing cash collateral, less rebates paid to borrowers and any lending agent fees associated with the loan, plus any premium payments received for lending certain types of securities.
Amounts included in the purchases and sales proceeds columns may include in-kind transactions, if applicable.
Investment Valuation
The following is a summary of the inputs used, as of January 31, 2024, involving the Fund's assets and liabilities carried at fair value. The inputs or methodology used for valuing securities may not be an indication of the risk associated with investing in those securities. For more information on valuation inputs, and their aggregation into the levels used below, please refer to the Investment Valuation section in the accompanying Notes to Financial Statements.
| Valuation Inputs at Reporting Date: |
| Description | Total ($) | Level 1 ($) | Level 2 ($) | Level 3 ($) |
Investments in Securities: | | | | |
|
| Common Stocks | 1,110,288,859 | 1,110,288,859 | - | - |
|
| Money Market Funds | 15,681,490 | 15,681,490 | - | - |
| Total Investments in Securities: | 1,125,970,349 | 1,125,970,349 | - | - |
Fidelity Advisor® Energy Fund
| Statement of Assets and Liabilities |
| | | | January 31, 2024 (Unaudited) |
| | | | | |
| Assets | | | | |
| Investment in securities, at value (including securities loaned of $9,880,392) - See accompanying schedule: | | | | |
Unaffiliated issuers (cost $680,882,562) | $ | 1,110,288,859 | | |
Fidelity Central Funds (cost $15,681,490) | | 15,681,490 | | |
| | | | | |
| | | | | |
| Total Investment in Securities (cost $696,564,052) | | | $ | 1,125,970,349 |
| Foreign currency held at value (cost $50,348) | | | | 50,376 |
| Receivable for fund shares sold | | | | 610,686 |
| Dividends receivable | | | | 413,352 |
| Distributions receivable from Fidelity Central Funds | | | | 14,330 |
| Prepaid expenses | | | | 2,235 |
| Other receivables | | | | 140,801 |
Total assets | | | | 1,127,202,129 |
| Liabilities | | | | |
| Payable for investments purchased | $ | 2,474,822 | | |
| Payable for fund shares redeemed | | 1,723,389 | | |
| Accrued management fee | | 485,380 | | |
| Distribution and service plan fees payable | | 181,782 | | |
| Other affiliated payables | | 185,210 | | |
| Other payables and accrued expenses | | 183,566 | | |
| Collateral on securities loaned | | 10,502,065 | | |
| Total Liabilities | | | | 15,736,214 |
| Net Assets | | | $ | 1,111,465,915 |
| Net Assets consist of: | | | | |
| Paid in capital | | | $ | 858,145,792 |
| Total accumulated earnings (loss) | | | | 253,320,123 |
| Net Assets | | | $ | 1,111,465,915 |
| | | | | |
| Net Asset Value and Maximum Offering Price | | | | |
| Class A : | | | | |
Net Asset Value and redemption price per share ($351,192,555 ÷ 8,266,822 shares)(a) | | | $ | 42.48 |
| Maximum offering price per share (100/94.25 of $42.48) | | | $ | 45.07 |
| Class M : | | | | |
Net Asset Value and redemption price per share ($100,144,273 ÷ 2,289,999 shares)(a) | | | $ | 43.73 |
| Maximum offering price per share (100/96.50 of $43.73) | | | $ | 45.32 |
| Class C : | | | | |
Net Asset Value and offering price per share ($79,428,427 ÷ 2,046,174 shares)(a) | | | $ | 38.82 |
| Class I : | | | | |
Net Asset Value, offering price and redemption price per share ($485,020,928 ÷ 10,762,360 shares) | | | $ | 45.07 |
| Class Z : | | | | |
Net Asset Value, offering price and redemption price per share ($95,679,732 ÷ 2,126,526 shares) | | | $ | 44.99 |
(a)Redemption price per share is equal to net asset value less any applicable contingent deferred sales charge. |
| Statement of Operations |
| | | | Six months ended January 31, 2024 (Unaudited) |
| Investment Income | | | | |
| Dividends | | | $ | 17,264,737 |
| Income from Fidelity Central Funds (including $36,147 from security lending) | | | | 144,866 |
| Total Income | | | | 17,409,603 |
| Expenses | | | | |
| Management fee | $ | 3,398,055 | | |
| Transfer agent fees | | 1,042,606 | | |
| Distribution and service plan fees | | 1,188,472 | | |
| Accounting fees | | 183,171 | | |
| Custodian fees and expenses | | 22,213 | | |
| Independent trustees' fees and expenses | | 3,930 | | |
| Registration fees | | 75,168 | | |
| Audit | | 28,042 | | |
| Legal | | 1,105 | | |
| Interest | | 5,888 | | |
| Miscellaneous | | 2,897 | | |
| Total expenses before reductions | | 5,951,547 | | |
| Expense reductions | | (55,073) | | |
| Total expenses after reductions | | | | 5,896,474 |
| Net Investment income (loss) | | | | 11,513,129 |
| Realized and Unrealized Gain (Loss) | | | | |
| Net realized gain (loss) on: | | | | |
| Investment Securities: | | | | |
| Unaffiliated issuers | | 66,208,267 | | |
| Redemptions in-kind | | 42,342,401 | | |
| Foreign currency transactions | | (32,081) | | |
| Total net realized gain (loss) | | | | 108,518,587 |
| Change in net unrealized appreciation (depreciation) on: | | | | |
| Investment Securities: | | | | |
| Unaffiliated issuers | | (163,162,222) | | |
| Assets and liabilities in foreign currencies | | (490) | | |
| Total change in net unrealized appreciation (depreciation) | | | | (163,162,712) |
| Net gain (loss) | | | | (54,644,125) |
| Net increase (decrease) in net assets resulting from operations | | | $ | (43,130,996) |
| Statement of Changes in Net Assets |
| |
| | Six months ended January 31, 2024 (Unaudited) | | Year ended July 31, 2023 |
| Increase (Decrease) in Net Assets | | | | |
| Operations | | | | |
| Net investment income (loss) | $ | 11,513,129 | $ | 35,265,025 |
| Net realized gain (loss) | | 108,518,587 | | 43,349,912 |
| Change in net unrealized appreciation (depreciation) | | (163,162,712) | | 113,842,540 |
| Net increase (decrease) in net assets resulting from operations | | (43,130,996) | | 192,457,477 |
| Distributions to shareholders | | (23,514,165) | | (33,434,847) |
| | | | | |
| Share transactions - net increase (decrease) | | (183,176,892) | | (175,324,623) |
| Total increase (decrease) in net assets | | (249,822,053) | | (16,301,993) |
| | | | | |
| Net Assets | | | | |
| Beginning of period | | 1,361,287,968 | | 1,377,589,961 |
| End of period | $ | 1,111,465,915 | $ | 1,361,287,968 |
| | | | | |
| | | | | |
Financial Highlights
| Fidelity Advisor® Energy Fund Class A |
| |
| | Six months ended (Unaudited) January 31, 2024 | | Years ended July 31, 2023 | | 2022 | | 2021 | | 2020 | | 2019 |
Selected Per-Share Data | | | | | | | | | | | | |
| Net asset value, beginning of period | $ | 44.81 | $ | 39.49 | $ | 23.59 | $ | 16.59 | $ | 27.88 | $ | 37.52 |
| Income from Investment Operations | | | | | | | | | | | | |
Net investment income (loss) A,B | | .37 | | .96 | | .80 | | .65 C | | .57 | | .35 |
| Net realized and unrealized gain (loss) | | (1.82) | | 5.26 | | 15.68 | | 6.94 | | (11.42) | | (9.76) |
| Total from investment operations | | (1.45) | | 6.22 | | 16.48 | | 7.59 | | (10.85) | | (9.41) |
| Distributions from net investment income | | (.88) | | (.90) | | (.58) | | (.59) | | (.44) | | (.18) D |
| Distributions from net realized gain | | - | | - | | - | | - | | - | | (.05) D |
| Total distributions | | (.88) | | (.90) | | (.58) | | (.59) | | (.44) | | (.23) |
| Net asset value, end of period | $ | 42.48 | $ | 44.81 | $ | 39.49 | $ | 23.59 | $ | 16.59 | $ | 27.88 |
Total Return E,F,G | | (3.23)% | | 15.94% | | 71.12% | | 46.78% | | (39.54)% | | (25.07)% |
Ratios to Average Net Assets B,H,I | | | | | | | | | | | | |
| Expenses before reductions | | 1.01% J | | 1.01% | | 1.05% | | 1.11% | | 1.14% | | 1.10% |
| Expenses net of fee waivers, if any | | 1.01% J | | 1.01% | | 1.04% | | 1.11% | | 1.14% | | 1.10% |
| Expenses net of all reductions | | 1.01% J | | 1.01% | | 1.04% | | 1.11% | | 1.12% | | 1.09% |
| Net investment income (loss) | | 1.67% J | | 2.29% | | 2.43% | | 3.15% C | | 2.62% | | 1.14% |
| Supplemental Data | | | | | | | | | | | | |
| Net assets, end of period (000 omitted) | $ | 351,193 | $ | 379,351 | $ | 361,023 | $ | 175,221 | $ | 114,321 | $ | 190,992 |
Portfolio turnover rate K | | 35% J,L | | 21% | | 37% | | 45% | | 84% L | | 47% |
ACalculated based on average shares outstanding during the period.
BNet investment income (loss) is affected by the timing of the declaration of dividends by any underlying mutual funds or exchange-traded funds (ETFs). Net investment income (loss) of any mutual funds or ETFs is not included in the Fund's net investment income (loss) ratio.
CNet investment income per share reflects one or more large, non-recurring dividend(s) which amounted to $.11 per share. Excluding such non-recurring dividend(s), the ratio of net investment income (loss) to average net assets would have been 2.60%.
DThe amount shown reflects reclassifications related to book to tax differences that were made in the year shown.
ETotal returns for periods of less than one year are not annualized.
FTotal returns would have been lower if certain expenses had not been reduced during the applicable periods shown.
GTotal returns do not include the effect of the sales charges.
HFees and expenses of any underlying mutual funds or exchange-traded funds (ETFs) are not included in the Fund's expense ratio. The Fund indirectly bears its proportionate share of these expenses. For additional expense information related to investments in Fidelity Central Funds, please refer to the "Investments in Fidelity Central Funds" note found in the Notes to Financial Statements section of the most recent Annual or Semi-Annual report.
IExpense ratios reflect operating expenses of the class. Expenses before reductions do not reflect amounts reimbursed, waived, or reduced through arrangements with the investment adviser, brokerage services, or other offset arrangements, if applicable, and do not represent the amount paid by the class during periods when reimbursements, waivers or reductions occur.
JAnnualized.
KAmount does not include the portfolio activity of any underlying mutual funds or exchange-traded funds (ETFs).
LPortfolio turnover rate excludes securities received or delivered in-kind.
| Fidelity Advisor® Energy Fund Class M |
| |
| | Six months ended (Unaudited) January 31, 2024 | | Years ended July 31, 2023 | | 2022 | | 2021 | | 2020 | | 2019 |
Selected Per-Share Data | | | | | | | | | | | | |
| Net asset value, beginning of period | $ | 46.03 | $ | 40.53 | $ | 24.20 | $ | 17.00 | $ | 28.53 | $ | 38.36 |
| Income from Investment Operations | | | | | | | | | | | | |
Net investment income (loss) A,B | | .32 | | .88 | | .73 | | .60 C | | .53 | | .27 |
| Net realized and unrealized gain (loss) | | (1.87) | | 5.39 | | 16.11 | | 7.13 | | (11.71) | | (9.97) |
| Total from investment operations | | (1.55) | | 6.27 | | 16.84 | | 7.73 | | (11.18) | | (9.70) |
| Distributions from net investment income | | (.75) | | (.77) | | (.51) | | (.53) | | (.35) | | (.08) D |
| Distributions from net realized gain | | - | | - | | - | | - | | - | | (.05) D |
| Total distributions | | (.75) | | (.77) | | (.51) | | (.53) | | (.35) | | (.13) |
| Net asset value, end of period | $ | 43.73 | $ | 46.03 | $ | 40.53 | $ | 24.20 | $ | 17.00 | $ | 28.53 |
Total Return E,F,G | | (3.35)% | | 15.64% | | 70.66% | | 46.37% | | (39.66)% | | (25.28)% |
Ratios to Average Net Assets B,H,I | | | | | | | | | | | | |
| Expenses before reductions | | 1.27% J | | 1.27% | | 1.31% | | 1.38% | | 1.40% | | 1.37% |
| Expenses net of fee waivers, if any | | 1.26% J | | 1.27% | | 1.31% | | 1.38% | | 1.40% | | 1.36% |
| Expenses net of all reductions | | 1.26% J | | 1.27% | | 1.31% | | 1.38% | | 1.38% | | 1.36% |
| Net investment income (loss) | | 1.41% J | | 2.04% | | 2.16% | | 2.88% C | | 2.36% | | .88% |
| Supplemental Data | | | | | | | | | | | | |
| Net assets, end of period (000 omitted) | $ | 100,144 | $ | 109,406 | $ | 114,014 | $ | 62,519 | $ | 43,768 | $ | 87,147 |
Portfolio turnover rate K | | 35% J,L | | 21% | | 37% | | 45% | | 84% L | | 47% |
ACalculated based on average shares outstanding during the period.
BNet investment income (loss) is affected by the timing of the declaration of dividends by any underlying mutual funds or exchange-traded funds (ETFs). Net investment income (loss) of any mutual funds or ETFs is not included in the Fund's net investment income (loss) ratio.
CNet investment income per share reflects one or more large, non-recurring dividend(s) which amounted to $.11 per share. Excluding such non-recurring dividend(s), the ratio of net investment income (loss) to average net assets would have been 2.34%.
DThe amount shown reflects reclassifications related to book to tax differences that were made in the year shown.
ETotal returns for periods of less than one year are not annualized.
FTotal returns would have been lower if certain expenses had not been reduced during the applicable periods shown.
GTotal returns do not include the effect of the sales charges.
HFees and expenses of any underlying mutual funds or exchange-traded funds (ETFs) are not included in the Fund's expense ratio. The Fund indirectly bears its proportionate share of these expenses. For additional expense information related to investments in Fidelity Central Funds, please refer to the "Investments in Fidelity Central Funds" note found in the Notes to Financial Statements section of the most recent Annual or Semi-Annual report.
IExpense ratios reflect operating expenses of the class. Expenses before reductions do not reflect amounts reimbursed, waived, or reduced through arrangements with the investment adviser, brokerage services, or other offset arrangements, if applicable, and do not represent the amount paid by the class during periods when reimbursements, waivers or reductions occur.
JAnnualized.
KAmount does not include the portfolio activity of any underlying mutual funds or exchange-traded funds (ETFs).
LPortfolio turnover rate excludes securities received or delivered in-kind.
| Fidelity Advisor® Energy Fund Class C |
| |
| | Six months ended (Unaudited) January 31, 2024 | | Years ended July 31, 2023 | | 2022 | | 2021 | | 2020 | | 2019 |
Selected Per-Share Data | | | | | | | | | | | | |
| Net asset value, beginning of period | $ | 40.83 | $ | 36.08 | $ | 21.60 | $ | 15.23 | $ | 25.58 | $ | 34.39 |
| Income from Investment Operations | | | | | | | | | | | | |
Net investment income (loss) A,B | | .19 | | .59 | | .51 | | .45 C | | .39 | | .12 |
| Net realized and unrealized gain (loss) | | (1.65) | | 4.80 | | 14.38 | | 6.38 | | (10.52) | | (8.93) |
| Total from investment operations | | (1.46) | | 5.39 | | 14.89 | | 6.83 | | (10.13) | | (8.81) |
| Distributions from net investment income | | (.55) | | (.64) | | (.41) | | (.46) | | (.22) | | - |
| Total distributions | | (.55) | | (.64) | | (.41) | | (.46) | | (.22) | | - |
| Net asset value, end of period | $ | 38.82 | $ | 40.83 | $ | 36.08 | $ | 21.60 | $ | 15.23 | $ | 25.58 |
Total Return D,E,F | | (3.57)% | | 15.09% | | 69.86% | | 45.68% | | (39.95)% | | (25.62)% |
Ratios to Average Net Assets B,G,H | | | | | | | | | | | | |
| Expenses before reductions | | 1.76% I | | 1.76% | | 1.79% | | 1.84% | | 1.86% | | 1.82% |
| Expenses net of fee waivers, if any | | 1.75% I | | 1.75% | | 1.78% | | 1.84% | | 1.86% | | 1.82% |
| Expenses net of all reductions | | 1.75% I | | 1.75% | | 1.78% | | 1.84% | | 1.84% | | 1.81% |
| Net investment income (loss) | | .93% I | | 1.55% | | 1.69% | | 2.42% C | | 1.90% | | .42% |
| Supplemental Data | | | | | | | | | | | | |
| Net assets, end of period (000 omitted) | $ | 79,428 | $ | 94,348 | $ | 105,747 | $ | 56,068 | $ | 45,212 | $ | 90,437 |
Portfolio turnover rate J | | 35% I,K | | 21% | | 37% | | 45% | | 84% K | | 47% |
ACalculated based on average shares outstanding during the period.
BNet investment income (loss) is affected by the timing of the declaration of dividends by any underlying mutual funds or exchange-traded funds (ETFs). Net investment income (loss) of any mutual funds or ETFs is not included in the Fund's net investment income (loss) ratio.
CNet investment income per share reflects one or more large, non-recurring dividend(s) which amounted to $.10 per share. Excluding such non-recurring dividend(s), the ratio of net investment income (loss) to average net assets would have been 1.88%.
DTotal returns for periods of less than one year are not annualized.
ETotal returns would have been lower if certain expenses had not been reduced during the applicable periods shown.
FTotal returns do not include the effect of the contingent deferred sales charge.
GFees and expenses of any underlying mutual funds or exchange-traded funds (ETFs) are not included in the Fund's expense ratio. The Fund indirectly bears its proportionate share of these expenses. For additional expense information related to investments in Fidelity Central Funds, please refer to the "Investments in Fidelity Central Funds" note found in the Notes to Financial Statements section of the most recent Annual or Semi-Annual report.
HExpense ratios reflect operating expenses of the class. Expenses before reductions do not reflect amounts reimbursed, waived, or reduced through arrangements with the investment adviser, brokerage services, or other offset arrangements, if applicable, and do not represent the amount paid by the class during periods when reimbursements, waivers or reductions occur.
IAnnualized.
JAmount does not include the portfolio activity of any underlying mutual funds or exchange-traded funds (ETFs).
KPortfolio turnover rate excludes securities received or delivered in-kind.
| Fidelity Advisor® Energy Fund Class I |
| |
| | Six months ended (Unaudited) January 31, 2024 | | Years ended July 31, 2023 | | 2022 | | 2021 | | 2020 | | 2019 |
Selected Per-Share Data | | | | | | | | | | | | |
| Net asset value, beginning of period | $ | 47.54 | $ | 41.83 | $ | 24.95 | $ | 17.51 | $ | 29.39 | $ | 39.57 |
| Income from Investment Operations | | | | | | | | | | | | |
Net investment income (loss) A,B | | .46 | | 1.14 | | .97 | | .74 C | | .67 | | .47 |
| Net realized and unrealized gain (loss) | | (1.93) | | 5.57 | | 16.57 | | 7.35 | | (12.02) | | (10.31) |
| Total from investment operations | | (1.47) | | 6.71 | | 17.54 | | 8.09 | | (11.35) | | (9.84) |
| Distributions from net investment income | | (1.00) | | (1.00) | | (.66) | | (.65) | | (.53) | | (.30) D |
| Distributions from net realized gain | | - | | - | | - | | - | | - | | (.05) D |
| Total distributions | | (1.00) | | (1.00) | | (.66) | | (.65) | | (.53) | | (.34) E |
| Net asset value, end of period | $ | 45.07 | $ | 47.54 | $ | 41.83 | $ | 24.95 | $ | 17.51 | $ | 29.39 |
Total Return F,G | | (3.08)% | | 16.25% | | 71.63% | | 47.26% | | (39.33)% | | (24.85)% |
Ratios to Average Net Assets B,H,I | | | | | | | | | | | | |
| Expenses before reductions | | .74% J | | .74% | | .76% | | .79% | | .82% | | .80% |
| Expenses net of fee waivers, if any | | .73% J | | .74% | | .76% | | .79% | | .82% | | .80% |
| Expenses net of all reductions | | .73% J | | .74% | | .76% | | .79% | | .80% | | .79% |
| Net investment income (loss) | | 1.94% J | | 2.57% | | 2.71% | | 3.47% C | | 2.95% | | 1.44% |
| Supplemental Data | | | | | | | | | | | | |
| Net assets, end of period (000 omitted) | $ | 485,021 | $ | 511,737 | $ | 533,005 | $ | 177,248 | $ | 154,575 | $ | 224,599 |
Portfolio turnover rate K | | 35% J,L | | 21% | | 37% | | 45% | | 84% L | | 47% |
ACalculated based on average shares outstanding during the period.
BNet investment income (loss) is affected by the timing of the declaration of dividends by any underlying mutual funds or exchange-traded funds (ETFs). Net investment income (loss) of any mutual funds or ETFs is not included in the Fund's net investment income (loss) ratio.
CNet investment income per share reflects one or more large, non-recurring dividend(s) which amounted to $.12 per share. Excluding such non-recurring dividend(s), the ratio of net investment income (loss) to average net assets would have been 2.93%.
DThe amount shown reflects reclassifications related to book to tax differences that were made in the year shown.
ETotal distributions per share do not sum due to rounding.
FTotal returns for periods of less than one year are not annualized.
GTotal returns would have been lower if certain expenses had not been reduced during the applicable periods shown.
HFees and expenses of any underlying mutual funds or exchange-traded funds (ETFs) are not included in the Fund's expense ratio. The Fund indirectly bears its proportionate share of these expenses. For additional expense information related to investments in Fidelity Central Funds, please refer to the "Investments in Fidelity Central Funds" note found in the Notes to Financial Statements section of the most recent Annual or Semi-Annual report.
IExpense ratios reflect operating expenses of the class. Expenses before reductions do not reflect amounts reimbursed, waived, or reduced through arrangements with the investment adviser, brokerage services, or other offset arrangements, if applicable, and do not represent the amount paid by the class during periods when reimbursements, waivers or reductions occur.
JAnnualized.
KAmount does not include the portfolio activity of any underlying mutual funds or exchange-traded funds (ETFs).
LPortfolio turnover rate excludes securities received or delivered in-kind.
| Fidelity Advisor® Energy Fund Class Z |
| |
| | Six months ended (Unaudited) January 31, 2024 | | Years ended July 31, 2023 | | 2022 | | 2021 | | 2020 | | 2019 A |
Selected Per-Share Data | | | | | | | | | | | | |
| Net asset value, beginning of period | $ | 47.46 | $ | 41.75 | $ | 24.91 | $ | 17.48 | $ | 29.35 | $ | 39.35 |
| Income from Investment Operations | | | | | | | | | | | | |
Net investment income (loss) B,C | | .50 | | 1.19 | | 1.02 | | .80 D | | .69 | | .45 |
| Net realized and unrealized gain (loss) | | (1.94) | | 5.56 | | 16.52 | | 7.30 | | (11.97) | | (10.03) |
| Total from investment operations | | (1.44) | | 6.75 | | 17.54 | | 8.10 | | (11.28) | | (9.58) |
| Distributions from net investment income | | (1.03) | | (1.04) | | (.70) | | (.67) | | (.59) | | (.37) E |
| Distributions from net realized gain | | - | | - | | - | | - | | - | | (.05) E |
| Total distributions | | (1.03) | | (1.04) | | (.70) | | (.67) | | (.59) | | (.42) |
| Net asset value, end of period | $ | 44.99 | $ | 47.46 | $ | 41.75 | $ | 24.91 | $ | 17.48 | $ | 29.35 |
Total Return F,G | | (3.02)% | | 16.40% | | 71.83% | | 47.47% | | (39.22)% | | (24.34)% |
Ratios to Average Net Assets C,H,I | | | | | | | | | | | | |
| Expenses before reductions | | .61% J | | .62% | | .63% | | .65% | | .66% | | .65% J |
| Expenses net of fee waivers, if any | | .60% J | | .61% | | .62% | | .64% | | .66% | | .64% J |
| Expenses net of all reductions | | .60% J | | .61% | | .62% | | .64% | | .64% | | .64% J |
| Net investment income (loss) | | 2.07% J | | 2.69% | | 2.85% | | 3.62% D | | 3.10% | | 1.82% J |
| Supplemental Data | | | | | | | | | | | | |
| Net assets, end of period (000 omitted) | $ | 95,680 | $ | 266,447 | $ | 263,802 | $ | 81,903 | $ | 40,742 | $ | 9,255 |
Portfolio turnover rate K | | 35% J,L | | 21% | | 37% | | 45% | | 84% L | | 47% |
AFor the period October 2, 2018 (commencement of sale of shares) through July 31, 2019.
BCalculated based on average shares outstanding during the period.
CNet investment income (loss) is affected by the timing of the declaration of dividends by any underlying mutual funds or exchange-traded funds (ETFs). Net investment income (loss) of any mutual funds or ETFs is not included in the Fund's net investment income (loss) ratio.
DNet investment income per share reflects one or more large, non-recurring dividend(s) which amounted to $.12 per share. Excluding such non-recurring dividend(s), the ratio of net investment income (loss) to average net assets would have been 3.07%.
EThe amount shown reflects reclassifications related to book to tax differences that were made in the year shown.
FTotal returns for periods of less than one year are not annualized.
GTotal returns would have been lower if certain expenses had not been reduced during the applicable periods shown.
HFees and expenses of any underlying mutual funds or exchange-traded funds (ETFs) are not included in the Fund's expense ratio. The Fund indirectly bears its proportionate share of these expenses. For additional expense information related to investments in Fidelity Central Funds, please refer to the "Investments in Fidelity Central Funds" note found in the Notes to Financial Statements section of the most recent Annual or Semi-Annual report.
IExpense ratios reflect operating expenses of the class. Expenses before reductions do not reflect amounts reimbursed, waived, or reduced through arrangements with the investment adviser, brokerage services, or other offset arrangements, if applicable, and do not represent the amount paid by the class during periods when reimbursements, waivers or reductions occur.
JAnnualized.
KAmount does not include the portfolio activity of any underlying mutual funds or exchange-traded funds (ETFs).
LPortfolio turnover rate excludes securities received or delivered in-kind.
Top Holdings (% of Fund's net assets) |
| |
| MasterCard, Inc. Class A | 9.8 | |
| Wells Fargo & Co. | 7.7 | |
| Bank of America Corp. | 6.4 | |
| Reinsurance Group of America, Inc. | 3.8 | |
| Chubb Ltd. | 3.3 | |
| Citigroup, Inc. | 3.0 | |
| Morgan Stanley | 2.5 | |
| Moody's Corp. | 2.5 | |
| Apollo Global Management, Inc. | 2.3 | |
| PNC Financial Services Group, Inc. | 2.2 | |
| | 43.5 | |
| |
| Industries (% of Fund's net assets) |
| |
| Banks | 36.2 | |
| Insurance | 21.5 | |
| Financial Services | 19.5 | |
| Capital Markets | 18.2 | |
| Consumer Finance | 3.5 | |
| Professional Services | 1.0 | |
| |
Fidelity Advisor® Financials Fund
Showing Percentage of Net Assets
| Common Stocks - 99.9% |
| | | Shares | Value ($) |
| Banks - 36.2% | | | |
| Diversified Banks - 22.7% | | | |
| Bank of America Corp. | | 817,556 | 27,805,080 |
| Citigroup, Inc. | | 231,905 | 13,026,104 |
| KeyCorp | | 473,000 | 6,872,690 |
| PNC Financial Services Group, Inc. | | 62,700 | 9,480,867 |
| U.S. Bancorp | | 188,100 | 7,813,674 |
| Wells Fargo & Co. | | 659,328 | 33,085,079 |
| | | | 98,083,494 |
| Regional Banks - 13.5% | | | |
| Associated Banc-Corp. | | 203,900 | 4,283,939 |
| BOK Financial Corp. | | 28,800 | 2,414,592 |
| Cadence Bank | | 96,224 | 2,561,483 |
| East West Bancorp, Inc. (a) | | 71,100 | 5,176,791 |
| Eastern Bankshares, Inc. | | 159,300 | 2,223,828 |
| First Hawaiian, Inc. | | 121,500 | 2,635,335 |
| First Interstate Bancsystem, Inc. | | 146,052 | 4,019,351 |
| Heartland Financial U.S.A., Inc. | | 75,628 | 2,682,525 |
| M&T Bank Corp. | | 58,588 | 8,091,003 |
| Popular, Inc. | | 102,571 | 8,764,692 |
| Truist Financial Corp. | | 197,900 | 7,334,174 |
| UMB Financial Corp. | | 37,100 | 3,060,750 |
| WesBanco, Inc. | | 84,400 | 2,476,296 |
| Wintrust Financial Corp. | | 24,366 | 2,363,015 |
| | | | 58,087,774 |
TOTAL BANKS | | | 156,171,268 |
| Capital Markets - 18.2% | | | |
| Asset Management & Custody Banks - 7.6% | | | |
| AllianceBernstein Holding LP | | 168,100 | 5,639,755 |
| Bank of New York Mellon Corp. | | 103,600 | 5,745,656 |
| Blue Owl Capital, Inc. Class A | | 175,400 | 2,725,716 |
| Carlyle Group LP | | 46,900 | 1,876,938 |
| Northern Trust Corp. | | 63,800 | 5,081,032 |
| Patria Investments Ltd. | | 281,300 | 4,014,151 |
| State Street Corp. | | 104,800 | 7,741,576 |
| | | | 32,824,824 |
| Financial Exchanges & Data - 4.3% | | | |
| Bolsa Mexicana de Valores S.A.B. de CV | | 1,735,900 | 3,516,883 |
| MarketAxess Holdings, Inc. | | 18,100 | 4,081,731 |
| Moody's Corp. | | 27,500 | 10,781,100 |
| | | | 18,379,714 |
| Investment Banking & Brokerage - 6.3% | | | |
| Lazard, Inc. Class A | | 107,852 | 4,204,071 |
| Morgan Stanley | | 124,000 | 10,817,760 |
| Raymond James Financial, Inc. | | 47,750 | 5,261,095 |
| Stifel Financial Corp. | | 66,900 | 4,880,355 |
| Virtu Financial, Inc. Class A | | 124,060 | 2,082,967 |
| | | | 27,246,248 |
TOTAL CAPITAL MARKETS | | | 78,450,786 |
| Consumer Finance - 3.5% | | | |
| Consumer Finance - 3.5% | | | |
| Discover Financial Services | | 74,100 | 7,819,032 |
| FirstCash Holdings, Inc. | | 41,971 | 4,817,012 |
| OneMain Holdings, Inc. | | 57,400 | 2,732,240 |
| | | | 15,368,284 |
| Financial Services - 19.5% | | | |
| Commercial & Residential Mortgage Finance - 1.5% | | | |
| Essent Group Ltd. | | 76,800 | 4,236,288 |
| Walker & Dunlop, Inc. | | 23,500 | 2,269,865 |
| | | | 6,506,153 |
| Diversified Financial Services - 3.5% | | | |
| Apollo Global Management, Inc. | | 99,500 | 9,989,800 |
| Corebridge Financial, Inc. | | 211,301 | 5,107,145 |
| | | | 15,096,945 |
| Multi-Sector Holdings - 0.6% | | | |
| Cannae Holdings, Inc. (b) | | 128,540 | 2,602,935 |
| Transaction & Payment Processing Services - 13.9% | | | |
| Fiserv, Inc. (b) | | 56,600 | 8,029,842 |
| FleetCor Technologies, Inc. (b) | | 15,000 | 4,348,950 |
| Global Payments, Inc. | | 42,100 | 5,608,983 |
| MasterCard, Inc. Class A | | 93,800 | 42,137,772 |
| | | | 60,125,547 |
TOTAL FINANCIAL SERVICES | | | 84,331,580 |
| Insurance - 21.5% | | | |
| Insurance Brokers - 4.6% | | | |
| Arthur J. Gallagher & Co. | | 25,700 | 5,966,512 |
| BRP Group, Inc. (b) | | 202,504 | 4,544,190 |
| Marsh & McLennan Companies, Inc. | | 47,800 | 9,265,552 |
| | | | 19,776,254 |
| Life & Health Insurance - 1.3% | | | |
| Globe Life, Inc. | | 46,427 | 5,702,164 |
| Multi-Line Insurance - 0.0% | | | |
| Assurant, Inc. | | 200 | 33,590 |
| Property & Casualty Insurance - 11.7% | | | |
| American Financial Group, Inc. | | 49,200 | 5,923,680 |
| Beazley PLC | | 483,300 | 3,334,987 |
| Chubb Ltd. | | 59,000 | 14,455,000 |
| Direct Line Insurance Group PLC (b) | | 1,510,900 | 3,243,610 |
| Fidelity National Financial, Inc. | | 83,400 | 4,172,502 |
| First American Financial Corp. | | 49,819 | 3,006,577 |
| Hartford Financial Services Group, Inc. | | 85,500 | 7,435,080 |
| Hiscox Ltd. | | 423,800 | 5,580,279 |
| Lancashire Holdings Ltd. | | 426,200 | 3,278,548 |
| | | | 50,430,263 |
| Reinsurance - 3.9% | | | |
| Enstar Group Ltd. (b) | | 1,149 | 306,657 |
| Reinsurance Group of America, Inc. | | 94,900 | 16,502,161 |
| | | | 16,808,818 |
TOTAL INSURANCE | | | 92,751,089 |
| Professional Services - 1.0% | | | |
| Research & Consulting Services - 1.0% | | | |
| Dun & Bradstreet Holdings, Inc. | | 365,000 | 4,230,350 |
| TOTAL COMMON STOCKS (Cost $349,755,765) | | | 431,303,357 |
| | | | |
| Money Market Funds - 1.4% |
| | | Shares | Value ($) |
| Fidelity Cash Central Fund 5.39% (c) | | 1,037,696 | 1,037,904 |
| Fidelity Securities Lending Cash Central Fund 5.39% (c)(d) | | 4,941,406 | 4,941,900 |
| TOTAL MONEY MARKET FUNDS (Cost $5,979,804) | | | 5,979,804 |
| | | | |
| TOTAL INVESTMENT IN SECURITIES - 101.3% (Cost $355,735,569) | 437,283,161 |
NET OTHER ASSETS (LIABILITIES) - (1.3)% | (5,774,553) |
| NET ASSETS - 100.0% | 431,508,608 |
| | |
Legend
| (a) | Security or a portion of the security is on loan at period end. |
| (c) | Affiliated fund that is generally available only to investment companies and other accounts managed by Fidelity Investments. The rate quoted is the annualized seven-day yield of the fund at period end. A complete unaudited listing of the fund's holdings as of its most recent quarter end is available upon request. In addition, each Fidelity Central Fund's financial statements are available on the SEC's website or upon request. |
| (d) | Investment made with cash collateral received from securities on loan. |
Affiliated Central Funds
Fiscal year to date information regarding the Fund's investments in Fidelity Central Funds, including the ownership percentage, is presented below.
| Affiliate | Value, beginning of period ($) | Purchases ($) | Sales Proceeds ($) | Dividend Income ($) | Realized Gain (loss) ($) | Change in Unrealized appreciation (depreciation) ($) | Value, end of period ($) | % ownership, end of period |
| Fidelity Cash Central Fund 5.39% | - | 53,046,060 | 52,008,156 | 28,298 | - | - | 1,037,904 | 0.0% |
| Fidelity Securities Lending Cash Central Fund 5.39% | 3,295,125 | 32,331,811 | 30,685,036 | 2,011 | - | - | 4,941,900 | 0.0% |
| Total | 3,295,125 | 85,377,871 | 82,693,192 | 30,309 | - | - | 5,979,804 | |
| | | | | | | | | |
Amounts in the dividend income column in the above table include any capital gain distributions from underlying funds, which are presented in the corresponding line item in the Statement of Operations, if applicable.
Amounts in the dividend income column for Fidelity Securities Lending Cash Central Fund represents the income earned on investing cash collateral, less rebates paid to borrowers and any lending agent fees associated with the loan, plus any premium payments received for lending certain types of securities.
Amounts included in the purchases and sales proceeds columns may include in-kind transactions, if applicable.
Investment Valuation
The following is a summary of the inputs used, as of January 31, 2024, involving the Fund's assets and liabilities carried at fair value. The inputs or methodology used for valuing securities may not be an indication of the risk associated with investing in those securities. For more information on valuation inputs, and their aggregation into the levels used below, please refer to the Investment Valuation section in the accompanying Notes to Financial Statements.
| Valuation Inputs at Reporting Date: |
| Description | Total ($) | Level 1 ($) | Level 2 ($) | Level 3 ($) |
Investments in Securities: | | | | |
|
| Common Stocks | 431,303,357 | 431,303,357 | - | - |
|
| Money Market Funds | 5,979,804 | 5,979,804 | - | - |
| Total Investments in Securities: | 437,283,161 | 437,283,161 | - | - |
Fidelity Advisor® Financials Fund
| Statement of Assets and Liabilities |
| | | | January 31, 2024 (Unaudited) |
| | | | | |
| Assets | | | | |
| Investment in securities, at value (including securities loaned of $4,703,526) - See accompanying schedule: | | | | |
Unaffiliated issuers (cost $349,755,765) | $ | 431,303,357 | | |
Fidelity Central Funds (cost $5,979,804) | | 5,979,804 | | |
| | | | | |
| | | | | |
| Total Investment in Securities (cost $355,735,569) | | | $ | 437,283,161 |
| Receivable for fund shares sold | | | | 155,252 |
| Dividends receivable | | | | 352,389 |
| Distributions receivable from Fidelity Central Funds | | | | 4,896 |
| Prepaid expenses | | | | 1,090 |
Total assets | | | | 437,796,788 |
| Liabilities | | | | |
| Payable for investments purchased | $ | 430,117 | | |
| Payable for fund shares redeemed | | 523,557 | | |
| Accrued management fee | | 186,261 | | |
| Distribution and service plan fees payable | | 94,664 | | |
| Other affiliated payables | | 74,779 | | |
| Other payables and accrued expenses | | 36,902 | | |
| Collateral on securities loaned | | 4,941,900 | | |
| Total Liabilities | | | | 6,288,180 |
| Net Assets | | | $ | 431,508,608 |
| Net Assets consist of: | | | | |
| Paid in capital | | | $ | 348,348,383 |
| Total accumulated earnings (loss) | | | | 83,160,225 |
| Net Assets | | | $ | 431,508,608 |
| | | | | |
| Net Asset Value and Maximum Offering Price | | | | |
| Class A : | | | | |
Net Asset Value and redemption price per share ($176,706,825 ÷ 6,289,850 shares)(a) | | | $ | 28.09 |
| Maximum offering price per share (100/94.25 of $28.09) | | | $ | 29.80 |
| Class M : | | | | |
Net Asset Value and redemption price per share ($66,892,122 ÷ 2,411,501 shares)(a) | | | $ | 27.74 |
| Maximum offering price per share (100/96.50 of $27.74) | | | $ | 28.75 |
| Class C : | | | | |
Net Asset Value and offering price per share ($36,552,563 ÷ 1,400,624 shares)(a) | | | $ | 26.10 |
| Class I : | | | | |
Net Asset Value, offering price and redemption price per share ($107,942,372 ÷ 3,710,041 shares) | | | $ | 29.09 |
| Class Z : | | | | |
Net Asset Value, offering price and redemption price per share ($43,414,726 ÷ 1,494,645 shares) | | | $ | 29.05 |
(a)Redemption price per share is equal to net asset value less any applicable contingent deferred sales charge. |
| Statement of Operations |
| | | | Six months ended January 31, 2024 (Unaudited) |
| Investment Income | | | | |
| Dividends | | | $ | 6,098,163 |
| Interest | | | | 40,453 |
| Income from Fidelity Central Funds (including $2,011 from security lending) | | | | 30,309 |
| Total Income | | | | 6,168,925 |
| Expenses | | | | |
| Management fee | $ | 1,093,530 | | |
| Transfer agent fees | | 355,181 | | |
| Distribution and service plan fees | | 537,953 | | |
| Accounting fees | | 74,079 | | |
| Custodian fees and expenses | | 19,207 | | |
| Independent trustees' fees and expenses | | 1,260 | | |
| Registration fees | | 59,941 | | |
| Audit | | 28,061 | | |
| Legal | | 2,899 | | |
| Miscellaneous | | 1,111 | | |
| Total expenses before reductions | | 2,173,222 | | |
| Expense reductions | | (17,941) | | |
| Total expenses after reductions | | | | 2,155,281 |
| Net Investment income (loss) | | | | 4,013,644 |
| Realized and Unrealized Gain (Loss) | | | | |
| Net realized gain (loss) on: | | | | |
| Investment Securities: | | | | |
| Unaffiliated issuers | | 6,032,559 | | |
| Redemptions in-kind | | 7,051,602 | | |
| Foreign currency transactions | | 2,235 | | |
| Total net realized gain (loss) | | | | 13,086,396 |
| Change in net unrealized appreciation (depreciation) on investment securities | | | | 20,077,707 |
| Net gain (loss) | | | | 33,164,103 |
| Net increase (decrease) in net assets resulting from operations | | | $ | 37,177,747 |
| Statement of Changes in Net Assets |
| |
| | Six months ended January 31, 2024 (Unaudited) | | Year ended July 31, 2023 |
| Increase (Decrease) in Net Assets | | | | |
| Operations | | | | |
| Net investment income (loss) | $ | 4,013,644 | $ | 10,530,140 |
| Net realized gain (loss) | | 13,086,396 | | (3,804,150) |
| Change in net unrealized appreciation (depreciation) | | 20,077,707 | | 9,650,146 |
| Net increase (decrease) in net assets resulting from operations | | 37,177,747 | | 16,376,136 |
| Distributions to shareholders | | (8,982,095) | | (30,785,451) |
| | | | | |
| Share transactions - net increase (decrease) | | (69,948,064) | | (23,222,656) |
| Total increase (decrease) in net assets | | (41,752,412) | | (37,631,971) |
| | | | | |
| Net Assets | | | | |
| Beginning of period | | 473,261,020 | | 510,892,991 |
| End of period | $ | 431,508,608 | $ | 473,261,020 |
| | | | | |
| | | | | |
Financial Highlights
| Fidelity Advisor® Financials Fund Class A |
| |
| | Six months ended (Unaudited) January 31, 2024 | | Years ended July 31, 2023 | | 2022 | | 2021 | | 2020 | | 2019 |
Selected Per-Share Data | | | | | | | | | | | | |
| Net asset value, beginning of period | $ | 25.84 | $ | 26.31 | $ | 28.41 | $ | 18.00 | $ | 21.47 | $ | 21.84 |
| Income from Investment Operations | | | | | | | | | | | | |
Net investment income (loss) A,B | | .24 | | .51 | | .44 | | .42 | | .40 | | .27 |
| Net realized and unrealized gain (loss) | | 2.65 | | .50 | | (1.32) | | 10.55 | | (3.59) | | .07 |
| Total from investment operations | | 2.89 | | 1.01 | | (.88) | | 10.97 | | (3.19) | | .34 |
| Distributions from net investment income | | (.64) | | (.45) | | (.43) | | (.45) | | (.28) | | (.18) |
| Distributions from net realized gain | | - | | (1.03) | | (.80) | | (.11) | | - | | (.53) |
| Total distributions | | (.64) | | (1.48) | | (1.22) C | | (.56) | | (.28) | | (.71) |
| Net asset value, end of period | $ | 28.09 | $ | 25.84 | $ | 26.31 | $ | 28.41 | $ | 18.00 | $ | 21.47 |
Total Return D,E,F | | 11.21% | | 4.17% | | (3.40)% | | 61.84% | | (15.15)% | | 2.05% |
Ratios to Average Net Assets B,G,H | | | | | | | | | | | | |
| Expenses before reductions | | 1.06% I | | 1.05% | | 1.03% | | 1.07% | | 1.09% | | 1.08% |
| Expenses net of fee waivers, if any | | 1.05% I | | 1.04% | | 1.03% | | 1.07% | | 1.09% | | 1.07% |
| Expenses net of all reductions | | 1.05% I | | 1.04% | | 1.03% | | 1.06% | | 1.08% | | 1.07% |
| Net investment income (loss) | | 1.89% I | | 2.02% | | 1.55% | | 1.76% | | 1.97% | | 1.31% |
| Supplemental Data | | | | | | | | | | | | |
| Net assets, end of period (000 omitted) | $ | 176,707 | $ | 169,271 | $ | 189,413 | $ | 181,251 | $ | 104,761 | $ | 145,799 |
Portfolio turnover rate J | | 46% I,K | | 55% | | 40% | | 51% | | 88% K | | 51% |
ACalculated based on average shares outstanding during the period.
BNet investment income (loss) is affected by the timing of the declaration of dividends by any underlying mutual funds or exchange-traded funds (ETFs). Net investment income (loss) of any mutual funds or ETFs is not included in the Fund's net investment income (loss) ratio.
CTotal distributions per share do not sum due to rounding.
DTotal returns for periods of less than one year are not annualized.
ETotal returns would have been lower if certain expenses had not been reduced during the applicable periods shown.
FTotal returns do not include the effect of the sales charges.
GFees and expenses of any underlying mutual funds or exchange-traded funds (ETFs) are not included in the Fund's expense ratio. The Fund indirectly bears its proportionate share of these expenses. For additional expense information related to investments in Fidelity Central Funds, please refer to the "Investments in Fidelity Central Funds" note found in the Notes to Financial Statements section of the most recent Annual or Semi-Annual report.
HExpense ratios reflect operating expenses of the class. Expenses before reductions do not reflect amounts reimbursed, waived, or reduced through arrangements with the investment adviser, brokerage services, or other offset arrangements, if applicable, and do not represent the amount paid by the class during periods when reimbursements, waivers or reductions occur.
IAnnualized.
JAmount does not include the portfolio activity of any underlying mutual funds or exchange-traded funds (ETFs).
KPortfolio turnover rate excludes securities received or delivered in-kind.
| Fidelity Advisor® Financials Fund Class M |
| |
| | Six months ended (Unaudited) January 31, 2024 | | Years ended July 31, 2023 | | 2022 | | 2021 | | 2020 | | 2019 |
Selected Per-Share Data | | | | | | | | | | | | |
| Net asset value, beginning of period | $ | 25.49 | $ | 25.98 | $ | 28.08 | $ | 17.79 | $ | 21.23 | $ | 21.60 |
| Income from Investment Operations | | | | | | | | | | | | |
Net investment income (loss) A,B | | .21 | | .44 | | .37 | | .36 | | .34 | | .21 |
| Net realized and unrealized gain (loss) | | 2.61 | | .49 | | (1.31) | | 10.44 | | (3.55) | | .07 |
| Total from investment operations | | 2.82 | | .93 | | (.94) | | 10.80 | | (3.21) | | .28 |
| Distributions from net investment income | | (.57) | | (.39) | | (.37) | | (.39) | | (.23) | | (.13) |
| Distributions from net realized gain | | - | | (1.03) | | (.80) | | (.11) | | - | | (.53) |
| Total distributions | | (.57) | | (1.42) | | (1.16) C | | (.51) C | | (.23) | | (.65) C |
| Net asset value, end of period | $ | 27.74 | $ | 25.49 | $ | 25.98 | $ | 28.08 | $ | 17.79 | $ | 21.23 |
Total Return D,E,F | | 11.12% | | 3.88% | | (3.63)% | | 61.48% | | (15.38)% | | 1.77% |
Ratios to Average Net Assets B,G,H | | | | | | | | | | | | |
| Expenses before reductions | | 1.30% I | | 1.29% | | 1.28% | | 1.32% | | 1.35% | | 1.34% |
| Expenses net of fee waivers, if any | | 1.29% I | | 1.28% | | 1.28% | | 1.32% | | 1.35% | | 1.34% |
| Expenses net of all reductions | | 1.29% I | | 1.28% | | 1.28% | | 1.31% | | 1.34% | | 1.33% |
| Net investment income (loss) | | 1.65% I | | 1.78% | | 1.30% | | 1.51% | | 1.72% | | 1.04% |
| Supplemental Data | | | | | | | | | | | | |
| Net assets, end of period (000 omitted) | $ | 66,892 | $ | 64,588 | $ | 69,176 | $ | 60,508 | $ | 34,828 | $ | 48,210 |
Portfolio turnover rate J | | 46% I,K | | 55% | | 40% | | 51% | | 88% K | | 51% |
ACalculated based on average shares outstanding during the period.
BNet investment income (loss) is affected by the timing of the declaration of dividends by any underlying mutual funds or exchange-traded funds (ETFs). Net investment income (loss) of any mutual funds or ETFs is not included in the Fund's net investment income (loss) ratio.
CTotal distributions per share do not sum due to rounding.
DTotal returns for periods of less than one year are not annualized.
ETotal returns would have been lower if certain expenses had not been reduced during the applicable periods shown.
FTotal returns do not include the effect of the sales charges.
GFees and expenses of any underlying mutual funds or exchange-traded funds (ETFs) are not included in the Fund's expense ratio. The Fund indirectly bears its proportionate share of these expenses. For additional expense information related to investments in Fidelity Central Funds, please refer to the "Investments in Fidelity Central Funds" note found in the Notes to Financial Statements section of the most recent Annual or Semi-Annual report.
HExpense ratios reflect operating expenses of the class. Expenses before reductions do not reflect amounts reimbursed, waived, or reduced through arrangements with the investment adviser, brokerage services, or other offset arrangements, if applicable, and do not represent the amount paid by the class during periods when reimbursements, waivers or reductions occur.
IAnnualized.
JAmount does not include the portfolio activity of any underlying mutual funds or exchange-traded funds (ETFs).
KPortfolio turnover rate excludes securities received or delivered in-kind.
| Fidelity Advisor® Financials Fund Class C |
| |
| | Six months ended (Unaudited) January 31, 2024 | | Years ended July 31, 2023 | | 2022 | | 2021 | | 2020 | | 2019 |
Selected Per-Share Data | | | | | | | | | | | | |
| Net asset value, beginning of period | $ | 23.92 | $ | 24.44 | $ | 26.48 | $ | 16.80 | $ | 20.04 | $ | 20.41 |
| Income from Investment Operations | | | | | | | | | | | | |
Net investment income (loss) A,B | | .14 | | .30 | | .21 | | .22 | | .23 | | .11 |
| Net realized and unrealized gain (loss) | | 2.45 | | .46 | | (1.23) | | 9.85 | | (3.37) | | .07 |
| Total from investment operations | | 2.59 | | .76 | | (1.02) | | 10.07 | | (3.14) | | .18 |
| Distributions from net investment income | | (.41) | | (.25) | | (.23) | | (.28) | | (.10) | | (.03) |
| Distributions from net realized gain | | - | | (1.03) | | (.80) | | (.11) | | - | | (.53) |
| Total distributions | | (.41) | | (1.28) | | (1.02) C | | (.39) | | (.10) | | (.55) C |
| Net asset value, end of period | $ | 26.10 | $ | 23.92 | $ | 24.44 | $ | 26.48 | $ | 16.80 | $ | 20.04 |
Total Return D,E,F | | 10.84% | | 3.38% | | (4.13)% | | 60.62% | | (15.79)% | | 1.29% |
Ratios to Average Net Assets B,G,H | | | | | | | | | | | | |
| Expenses before reductions | | 1.81% I | | 1.79% | | 1.79% | | 1.83% | | 1.84% | | 1.83% |
| Expenses net of fee waivers, if any | | 1.80% I | | 1.79% | | 1.78% | | 1.82% | | 1.84% | | 1.82% |
| Expenses net of all reductions | | 1.80% I | | 1.79% | | 1.78% | | 1.82% | | 1.83% | | 1.82% |
| Net investment income (loss) | | 1.15% I | | 1.27% | | .80% | | 1.00% | | 1.22% | | .56% |
| Supplemental Data | | | | | | | | | | | | |
| Net assets, end of period (000 omitted) | $ | 36,553 | $ | 41,339 | $ | 58,177 | $ | 57,856 | $ | 41,947 | $ | 71,609 |
Portfolio turnover rate J | | 46% I,K | | 55% | | 40% | | 51% | | 88% K | | 51% |
ACalculated based on average shares outstanding during the period.
BNet investment income (loss) is affected by the timing of the declaration of dividends by any underlying mutual funds or exchange-traded funds (ETFs). Net investment income (loss) of any mutual funds or ETFs is not included in the Fund's net investment income (loss) ratio.
CTotal distributions per share do not sum due to rounding.
DTotal returns for periods of less than one year are not annualized.
ETotal returns would have been lower if certain expenses had not been reduced during the applicable periods shown.
FTotal returns do not include the effect of the contingent deferred sales charge.
GFees and expenses of any underlying mutual funds or exchange-traded funds (ETFs) are not included in the Fund's expense ratio. The Fund indirectly bears its proportionate share of these expenses. For additional expense information related to investments in Fidelity Central Funds, please refer to the "Investments in Fidelity Central Funds" note found in the Notes to Financial Statements section of the most recent Annual or Semi-Annual report.
HExpense ratios reflect operating expenses of the class. Expenses before reductions do not reflect amounts reimbursed, waived, or reduced through arrangements with the investment adviser, brokerage services, or other offset arrangements, if applicable, and do not represent the amount paid by the class during periods when reimbursements, waivers or reductions occur.
IAnnualized.
JAmount does not include the portfolio activity of any underlying mutual funds or exchange-traded funds (ETFs).
KPortfolio turnover rate excludes securities received or delivered in-kind.
| Fidelity Advisor® Financials Fund Class I |
| |
| | Six months ended (Unaudited) January 31, 2024 | | Years ended July 31, 2023 | | 2022 | | 2021 | | 2020 | | 2019 |
Selected Per-Share Data | | | | | | | | | | | | |
| Net asset value, beginning of period | $ | 26.77 | $ | 27.20 | $ | 29.32 | $ | 18.55 | $ | 22.11 | $ | 22.47 |
| Income from Investment Operations | | | | | | | | | | | | |
Net investment income (loss) A,B | | .29 | | .60 | | .54 | | .52 | | .47 | | .33 |
| Net realized and unrealized gain (loss) | | 2.74 | | .52 | | (1.37) | | 10.86 | | (3.69) | | .08 |
| Total from investment operations | | 3.03 | | 1.12 | | (.83) | | 11.38 | | (3.22) | | .41 |
| Distributions from net investment income | | (.71) | | (.53) | | (.50) | | (.50) | | (.34) | | (.25) |
| Distributions from net realized gain | | - | | (1.03) | | (.80) | | (.11) | | - | | (.53) |
| Total distributions | | (.71) | | (1.55) C | | (1.29) C | | (.61) | | (.34) | | (.77) C |
| Net asset value, end of period | $ | 29.09 | $ | 26.77 | $ | 27.20 | $ | 29.32 | $ | 18.55 | $ | 22.11 |
Total Return D,E | | 11.35% | | 4.47% | | (3.13)% | | 62.31% | | (14.91)% | | 2.36% |
Ratios to Average Net Assets B,F,G | | | | | | | | | | | | |
| Expenses before reductions | | .78% H | | .77% | | .76% | | .79% | | .80% | | .80% |
| Expenses net of fee waivers, if any | | .78% H | | .77% | | .76% | | .79% | | .80% | | .79% |
| Expenses net of all reductions | | .78% H | | .77% | | .76% | | .78% | | .78% | | .79% |
| Net investment income (loss) | | 2.17% H | | 2.29% | | 1.82% | | 2.04% | | 2.27% | | 1.59% |
| Supplemental Data | | | | | | | | | | | | |
| Net assets, end of period (000 omitted) | $ | 107,942 | $ | 110,244 | $ | 131,118 | $ | 118,424 | $ | 85,299 | $ | 107,059 |
Portfolio turnover rate I | | 46% H,J | | 55% | | 40% | | 51% | | 88% J | | 51% |
ACalculated based on average shares outstanding during the period.
BNet investment income (loss) is affected by the timing of the declaration of dividends by any underlying mutual funds or exchange-traded funds (ETFs). Net investment income (loss) of any mutual funds or ETFs is not included in the Fund's net investment income (loss) ratio.
CTotal distributions per share do not sum due to rounding.
DTotal returns for periods of less than one year are not annualized.
ETotal returns would have been lower if certain expenses had not been reduced during the applicable periods shown.
FFees and expenses of any underlying mutual funds or exchange-traded funds (ETFs) are not included in the Fund's expense ratio. The Fund indirectly bears its proportionate share of these expenses. For additional expense information related to investments in Fidelity Central Funds, please refer to the "Investments in Fidelity Central Funds" note found in the Notes to Financial Statements section of the most recent Annual or Semi-Annual report.
GExpense ratios reflect operating expenses of the class. Expenses before reductions do not reflect amounts reimbursed, waived, or reduced through arrangements with the investment adviser, brokerage services, or other offset arrangements, if applicable, and do not represent the amount paid by the class during periods when reimbursements, waivers or reductions occur.
HAnnualized.
IAmount does not include the portfolio activity of any underlying mutual funds or exchange-traded funds (ETFs).
JPortfolio turnover rate excludes securities received or delivered in-kind.
| Fidelity Advisor® Financials Fund Class Z |
| |
| | Six months ended (Unaudited) January 31, 2024 | | Years ended July 31, 2023 | | 2022 | | 2021 | | 2020 | | 2019 A |
Selected Per-Share Data | | | | | | | | | | | | |
| Net asset value, beginning of period | $ | 26.71 | $ | 27.16 | $ | 29.28 | $ | 18.53 | $ | 22.09 | $ | 21.99 |
| Income from Investment Operations | | | | | | | | | | | | |
Net investment income (loss) B,C | | .30 | | .63 | | .57 | | .54 | | .49 | | .25 |
| Net realized and unrealized gain (loss) | | 2.75 | | .51 | | (1.37) | | 10.86 | | (3.67) | | .66 |
| Total from investment operations | | 3.05 | | 1.14 | | (.80) | | 11.40 | | (3.18) | | .91 |
| Distributions from net investment income | | (.71) | | (.57) | | (.53) | | (.54) | | (.38) | | (.29) |
| Distributions from net realized gain | | - | | (1.03) | | (.80) | | (.11) | | - | | (.53) |
| Total distributions | | (.71) | | (1.59) D | | (1.32) D | | (.65) | | (.38) | | (.81) D |
| Net asset value, end of period | $ | 29.05 | $ | 26.71 | $ | 27.16 | $ | 29.28 | $ | 18.53 | $ | 22.09 |
Total Return E,F | | 11.47% | | 4.58% | | (3.03)% | | 62.53% | | (14.79)% | | 4.72% |
Ratios to Average Net Assets C,G,H | | | | | | | | | | | | |
| Expenses before reductions | | .65% I | | .64% | | .64% | | .66% | | .67% | | .66% I |
| Expenses net of fee waivers, if any | | .64% I | | .64% | | .63% | | .66% | | .67% | | .65% I |
| Expenses net of all reductions | | .64% I | | .64% | | .63% | | .65% | | .65% | | .65% I |
| Net investment income (loss) | | 2.30% I | | 2.42% | | 1.95% | | 2.17% | | 2.40% | | 1.44% I |
| Supplemental Data | | | | | | | | | | | | |
| Net assets, end of period (000 omitted) | $ | 43,415 | $ | 87,819 | $ | 63,009 | $ | 49,214 | $ | 30,790 | $ | 7,041 |
Portfolio turnover rate J | | 46% I,K | | 55% | | 40% | | 51% | | 88% K | | 51% |
AFor the period October 2, 2018 (commencement of sale of shares) through July 31, 2019.
BCalculated based on average shares outstanding during the period.
CNet investment income (loss) is affected by the timing of the declaration of dividends by any underlying mutual funds or exchange-traded funds (ETFs). Net investment income (loss) of any mutual funds or ETFs is not included in the Fund's net investment income (loss) ratio.
DTotal distributions per share do not sum due to rounding.
ETotal returns for periods of less than one year are not annualized.
FTotal returns would have been lower if certain expenses had not been reduced during the applicable periods shown.
GFees and expenses of any underlying mutual funds or exchange-traded funds (ETFs) are not included in the Fund's expense ratio. The Fund indirectly bears its proportionate share of these expenses. For additional expense information related to investments in Fidelity Central Funds, please refer to the "Investments in Fidelity Central Funds" note found in the Notes to Financial Statements section of the most recent Annual or Semi-Annual report.
HExpense ratios reflect operating expenses of the class. Expenses before reductions do not reflect amounts reimbursed, waived, or reduced through arrangements with the investment adviser, brokerage services, or other offset arrangements, if applicable, and do not represent the amount paid by the class during periods when reimbursements, waivers or reductions occur.
IAnnualized.
JAmount does not include the portfolio activity of any underlying mutual funds or exchange-traded funds (ETFs).
KPortfolio turnover rate excludes securities received or delivered in-kind.
Top Holdings (% of Fund's net assets) |
| |
| Boston Scientific Corp. | 10.0 | |
| Eli Lilly & Co. | 8.0 | |
| UnitedHealth Group, Inc. | 7.1 | |
| Danaher Corp. | 6.7 | |
| Merck & Co., Inc. | 4.8 | |
| Regeneron Pharmaceuticals, Inc. | 4.6 | |
| Penumbra, Inc. | 4.1 | |
| CVS Health Corp. | 3.6 | |
| Cigna Group | 3.6 | |
| Thermo Fisher Scientific, Inc. | 2.8 | |
| | 55.3 | |
| |
| Industries (% of Fund's net assets) |
| |
| Health Care Equipment & Supplies | 24.8 | |
| Health Care Providers & Services | 23.3 | |
| Biotechnology | 19.3 | |
| Pharmaceuticals | 16.8 | |
| Life Sciences Tools & Services | 13.4 | |
| Health Care Technology | 2.2 | |
| Financial Services | 0.2 | |
| |
Fidelity Advisor® Health Care Fund
Showing Percentage of Net Assets
| Common Stocks - 98.8% |
| | | Shares | Value ($) |
| Biotechnology - 18.7% | | | |
| Biotechnology - 18.7% | | | |
| Acelyrin, Inc. (a) | | 600,000 | 4,572,000 |
| Acumen Pharmaceuticals, Inc. (b) | | 600,000 | 1,908,000 |
| Allogene Therapeutics, Inc. (a)(b) | | 2,883,755 | 10,150,818 |
| Alnylam Pharmaceuticals, Inc. (b) | | 234,000 | 40,460,940 |
| Arcellx, Inc. (b) | | 280,000 | 17,315,200 |
| Arcus Biosciences, Inc. (b) | | 450,000 | 6,813,000 |
| Argenx SE ADR (b) | | 176,000 | 66,969,760 |
| Ascendis Pharma A/S sponsored ADR (b) | | 545,000 | 70,811,850 |
| Avidity Biosciences, Inc. (a)(b) | | 794,880 | 9,721,382 |
| Blueprint Medicines Corp. (b) | | 510,000 | 40,560,300 |
| Cargo Therapeutics, Inc. (a) | | 640,301 | 14,093,025 |
| Caris Life Sciences, Inc. (b)(c)(d) | | 1,098,028 | 3,030,557 |
| Celldex Therapeutics, Inc. (b) | | 450,000 | 15,849,000 |
| Cytokinetics, Inc. (a)(b) | | 1,000,000 | 78,130,000 |
| Immunocore Holdings PLC ADR (a)(b) | | 236,462 | 17,093,838 |
| Janux Therapeutics, Inc. (b) | | 350,000 | 2,996,000 |
| Keros Therapeutics, Inc. (b) | | 420,000 | 23,251,200 |
| Legend Biotech Corp. ADR (b) | | 1,200,000 | 66,072,000 |
| Morphic Holding, Inc. (b) | | 250,000 | 7,922,500 |
| Nuvalent, Inc. Class A (a)(b) | | 425,300 | 31,969,801 |
| Poseida Therapeutics, Inc. (a)(b) | | 1,292,498 | 4,446,193 |
| Regeneron Pharmaceuticals, Inc. (b) | | 235,000 | 221,553,300 |
| Repligen Corp. (a)(b) | | 64,000 | 12,121,600 |
| Spyre Therapeutics, Inc. (a)(b) | | 330,000 | 8,550,300 |
| Summit Therapeutics, Inc. (b) | | 93,740 | 367,461 |
| Vaxcyte, Inc. (b) | | 920,000 | 65,706,400 |
| Viridian Therapeutics, Inc. (b) | | 750,000 | 14,437,500 |
| Xencor, Inc. (b) | | 91,200 | 1,705,440 |
| Xenon Pharmaceuticals, Inc. (b) | | 780,000 | 35,271,600 |
| Zentalis Pharmaceuticals, Inc. (b) | | 560,000 | 6,636,000 |
| | | | 900,486,965 |
| Health Care Equipment & Supplies - 24.8% | | | |
| Health Care Equipment - 24.8% | | | |
| Boston Scientific Corp. (b) | | 7,600,000 | 480,775,999 |
| Edwards Lifesciences Corp. (b) | | 950,000 | 74,546,500 |
| Glaukos Corp. (b) | | 600,000 | 53,418,000 |
| Inspire Medical Systems, Inc. (a)(b) | | 380,000 | 80,130,600 |
| Insulet Corp. (b) | | 400,000 | 76,348,000 |
| Intuitive Surgical, Inc. (b) | | 136,000 | 51,437,920 |
| Masimo Corp. (a)(b) | | 670,000 | 86,389,800 |
| Outset Medical, Inc. (a)(b) | | 600,000 | 1,824,000 |
| Penumbra, Inc. (b) | | 785,000 | 197,969,150 |
| PROCEPT BioRobotics Corp. (a)(b) | | 400,000 | 18,520,000 |
| Shockwave Medical, Inc. (b) | | 75,000 | 16,968,750 |
| Stryker Corp. | | 180,000 | 60,386,400 |
| | | | 1,198,715,119 |
| Health Care Providers & Services - 23.3% | | | |
| Health Care Facilities - 2.2% | | | |
| Acadia Healthcare Co., Inc. (b) | | 480,000 | 39,427,200 |
| Surgery Partners, Inc. (b) | | 2,180,000 | 66,904,200 |
| | | | 106,331,400 |
| Health Care Services - 10.0% | | | |
| agilon health, Inc. (a)(b) | | 6,500,000 | 38,285,000 |
| BrightSpring Health Services, Inc. (a) | | 1,750,000 | 19,285,000 |
| Cigna Group | | 570,000 | 171,541,500 |
| CVS Health Corp. | | 2,350,000 | 174,769,500 |
| LifeStance Health Group, Inc. (b) | | 5,400,000 | 32,292,000 |
| Privia Health Group, Inc. (a)(b) | | 2,280,000 | 45,964,800 |
| | | | 482,137,800 |
| Managed Health Care - 11.1% | | | |
| Alignment Healthcare, Inc. (b) | | 2,785,231 | 18,661,048 |
| Centene Corp. (b) | | 1,780,000 | 134,051,800 |
| Humana, Inc. | | 28,000 | 10,585,680 |
| Molina Healthcare, Inc. (b) | | 82,500 | 29,406,300 |
| UnitedHealth Group, Inc. | | 670,000 | 342,865,800 |
| | | | 535,570,628 |
TOTAL HEALTH CARE PROVIDERS & SERVICES | | | 1,124,039,828 |
| Health Care Technology - 1.9% | | | |
| Health Care Technology - 1.9% | | | |
| Evolent Health, Inc. | | 803,226 | 23,622,877 |
| Evolent Health, Inc. Class A (b) | | 320,000 | 9,411,200 |
| Phreesia, Inc. (b) | | 800,000 | 20,384,000 |
| Veeva Systems, Inc. Class A (b) | | 185,000 | 38,370,850 |
| | | | 91,788,927 |
| Life Sciences Tools & Services - 13.4% | | | |
| Life Sciences Tools & Services - 13.4% | | | |
| 10X Genomics, Inc. (a)(b) | | 1,596,306 | 66,518,071 |
| Bruker Corp. | | 630,000 | 45,051,300 |
| Danaher Corp. | | 1,340,000 | 321,479,400 |
| IQVIA Holdings, Inc. (b) | | 240,000 | 49,975,200 |
| Lonza Group AG | | 42,000 | 20,534,041 |
| Thermo Fisher Scientific, Inc. | | 250,000 | 134,745,000 |
| West Pharmaceutical Services, Inc. | | 28,000 | 10,444,840 |
| | | | 648,747,852 |
| Pharmaceuticals - 16.7% | | | |
| Pharmaceuticals - 16.7% | | | |
| AstraZeneca PLC (United Kingdom) | | 585,000 | 77,557,453 |
| Edgewise Therapeutics, Inc. (b) | | 300,000 | 5,349,000 |
| Eli Lilly & Co. | | 600,000 | 387,366,000 |
| Enliven Therapeutics, Inc. (b) | | 280,000 | 4,396,000 |
| Merck & Co., Inc. | | 1,900,000 | 229,482,000 |
| Pharvaris BV (b) | | 458,789 | 13,717,791 |
| Royalty Pharma PLC | | 1,760,000 | 49,966,400 |
| Structure Therapeutics, Inc. ADR | | 380,000 | 16,575,600 |
| UCB SA | | 128,000 | 12,076,174 |
| Verona Pharma PLC ADR (b) | | 400,000 | 7,340,000 |
| | | | 803,826,418 |
| TOTAL COMMON STOCKS (Cost $3,081,464,298) | | | 4,767,605,109 |
| | | | |
| Convertible Preferred Stocks - 1.2% |
| | | Shares | Value ($) |
| Biotechnology - 0.6% | | | |
| Biotechnology - 0.6% | | | |
| Asimov, Inc. Series B (b)(c)(d) | | 67,547 | 3,044,343 |
| Caris Life Sciences, Inc. Series D (b)(c)(d) | | 2,082,481 | 5,747,648 |
| Cleerly, Inc. Series C (b)(c)(d) | | 882,089 | 9,535,382 |
| Element Biosciences, Inc. Series C (b)(c)(d) | | 376,690 | 5,646,583 |
| ElevateBio LLC Series C (b)(c)(d) | | 163,300 | 540,523 |
| Inscripta, Inc. Series E (b)(c)(d) | | 826,424 | 2,727,199 |
| | | | 27,241,678 |
| Financial Services - 0.2% | | | |
| Diversified Financial Services - 0.1% | | | |
| Thriveworks TopCo LLC Series B (b)(c)(d)(e) | | 327,591 | 3,803,332 |
| Specialized Finance - 0.1% | | | |
| Saluda Medical, Inc. Series E (c)(d) | | 781,583 | 6,745,061 |
TOTAL FINANCIAL SERVICES | | | 10,548,393 |
| Health Care Providers & Services - 0.0% | | | |
| Health Care Services - 0.0% | | | |
| dMed Biopharmaceutical Co. Ltd. Series C (b)(c)(d) | | 236,142 | 1,400,322 |
| Health Care Technology - 0.3% | | | |
| Health Care Technology - 0.3% | | | |
| Aledade, Inc.: | | | |
| Series B1 (b)(c)(d) | | 130,618 | 6,269,664 |
| Series E1 (b)(c)(d) | | 46,526 | 2,233,248 |
| Omada Health, Inc. Series E (b)(c)(d) | | 1,456,953 | 6,177,481 |
| Wugen, Inc. Series B (b)(c)(d) | | 300,054 | 1,701,306 |
| | | | 16,381,699 |
| Pharmaceuticals - 0.1% | | | |
| Pharmaceuticals - 0.1% | | | |
| Galvanize Therapeutics Series B (b)(c)(d) | | 2,552,870 | 2,833,686 |
| TOTAL CONVERTIBLE PREFERRED STOCKS (Cost $91,163,913) | | | 58,405,778 |
| | | | |
| Money Market Funds - 3.8% |
| | | Shares | Value ($) |
Fidelity Securities Lending Cash Central Fund 5.39% (f)(g) (Cost $182,968,787) | | 182,950,492 | 182,968,787 |
| | | | |
| TOTAL INVESTMENT IN SECURITIES - 103.8% (Cost $3,355,596,998) | 5,008,979,674 |
NET OTHER ASSETS (LIABILITIES) - (3.8)% | (181,328,362) |
| NET ASSETS - 100.0% | 4,827,651,312 |
| | |
Legend
| (a) | Security or a portion of the security is on loan at period end. |
| (c) | Restricted securities (including private placements) - Investment in securities not registered under the Securities Act of 1933 (excluding 144A issues). At the end of the period, the value of restricted securities (excluding 144A issues) amounted to $61,436,335 or 1.3% of net assets. |
| (e) | Investment is owned by a wholly-owned subsidiary (Subsidiary) that is treated as a corporation for U.S. tax purposes. |
| (f) | Affiliated fund that is generally available only to investment companies and other accounts managed by Fidelity Investments. The rate quoted is the annualized seven-day yield of the fund at period end. A complete unaudited listing of the fund's holdings as of its most recent quarter end is available upon request. In addition, each Fidelity Central Fund's financial statements are available on the SEC's website or upon request. |
| (g) | Investment made with cash collateral received from securities on loan. |
| Additional information on each restricted holding is as follows: |
| Security | Acquisition Date | Acquisition Cost ($) |
| Aledade, Inc. Series B1 | 5/07/21 | 5,001,455 |
| | | |
| Aledade, Inc. Series E1 | 5/20/22 | 2,317,665 |
| | | |
| Asimov, Inc. Series B | 10/29/21 | 6,260,303 |
| | | |
| Caris Life Sciences, Inc. | 10/06/22 | 6,148,957 |
| | | |
| Caris Life Sciences, Inc. Series D | 5/11/21 | 16,868,096 |
| | | |
| Cleerly, Inc. Series C | 7/08/22 | 10,391,538 |
| | | |
| dMed Biopharmaceutical Co. Ltd. Series C | 12/01/20 | 3,353,960 |
| | | |
| Element Biosciences, Inc. Series C | 6/21/21 | 7,743,503 |
| | | |
| ElevateBio LLC Series C | 3/09/21 | 685,044 |
| | | |
| Galvanize Therapeutics Series B | 3/29/22 | 4,419,746 |
| | | |
| Inscripta, Inc. Series E | 3/30/21 | 7,297,324 |
| | | |
| Omada Health, Inc. Series E | 12/22/21 | 8,734,725 |
| | | |
| Saluda Medical, Inc. Series E | 4/06/23 | 6,310,345 |
| | | |
| Thriveworks TopCo LLC Series B | 7/23/21 - 2/25/22 | 9,402,913 |
| | | |
| Wugen, Inc. Series B | 7/09/21 | 2,326,889 |
| | | |
Affiliated Central Funds
Fiscal year to date information regarding the Fund's investments in Fidelity Central Funds, including the ownership percentage, is presented below.
| Affiliate | Value, beginning of period ($) | Purchases ($) | Sales Proceeds ($) | Dividend Income ($) | Realized Gain (loss) ($) | Change in Unrealized appreciation (depreciation) ($) | Value, end of period ($) | % ownership, end of period |
| Fidelity Cash Central Fund 5.39% | 41,922,825 | 383,131,480 | 425,054,305 | 478,097 | - | - | - | 0.0% |
| Fidelity Securities Lending Cash Central Fund 5.39% | 260,931,533 | 414,913,046 | 492,875,792 | 121,365 | - | - | 182,968,787 | 0.7% |
| Total | 302,854,358 | 798,044,526 | 917,930,097 | 599,462 | - | - | 182,968,787 | |
| | | | | | | | | |
Amounts in the dividend income column in the above table include any capital gain distributions from underlying funds, which are presented in the corresponding line item in the Consolidated Statement of Operations, if applicable.
Amounts in the dividend income column for Fidelity Securities Lending Cash Central Fund represents the income earned on investing cash collateral, less rebates paid to borrowers and any lending agent fees associated with the loan, plus any premium payments received for lending certain types of securities.
Amounts included in the purchases and sales proceeds columns may include in-kind transactions, if applicable.
Investment Valuation
The following is a summary of the inputs used, as of January 31, 2024, involving the Fund's assets and liabilities carried at fair value. The inputs or methodology used for valuing securities may not be an indication of the risk associated with investing in those securities. For more information on valuation inputs, and their aggregation into the levels used below, please refer to the Investment Valuation section in the accompanying Notes to Consolidated Financial Statements.
| Valuation Inputs at Reporting Date: |
| Description | Total ($) | Level 1 ($) | Level 2 ($) | Level 3 ($) |
Investments in Securities: | | | | |
|
| Common Stocks | 4,767,605,109 | 4,666,483,058 | 98,091,494 | 3,030,557 |
|
| Convertible Preferred Stocks | 58,405,778 | - | - | 58,405,778 |
|
| Money Market Funds | 182,968,787 | 182,968,787 | - | - |
| Total Investments in Securities: | 5,008,979,674 | 4,849,451,845 | 98,091,494 | 61,436,335 |
The following is a reconciliation of consolidated Investments in Securities for which Level 3 inputs were used in determining value:
| |
| Investments in Securities: | |
| Preferred Stocks | | | |
| Beginning Balance | $ | 71,533,558 | |
| Net Realized Gain (Loss) on Investment Securities | | - | |
| Net Unrealized Gain (Loss) on Investment Securities | | (9,605,077) | |
| Cost of Purchases | | - | |
| Proceeds of Sales | | (3,522,703) | |
| Amortization/Accretion | | - | |
| Transfers into Level 3 | | - | |
| Transfers out of Level 3 | | - | |
| Ending Balance | $ | 58,405,778 | |
| The change in unrealized gain (loss) for the period attributable to Level 3 securities held at January 31, 2024 | $ | (9,607,442) | |
| Other Investments in Securities | | | |
| Beginning Balance | $ | 6,148,957 | |
| Net Realized Gain (Loss) on Investment Securities | | - | |
| Net Unrealized Gain (Loss) on Investment Securities | | (3,118,400) | |
| Cost of Purchases | | - | |
| Proceeds of Sales | | - | |
| Amortization/Accretion | | - | |
| Transfers into Level 3 | | - | |
| Transfers out of Level 3 | | - | |
| Ending Balance | $ | 3,030,557 | |
| The change in unrealized gain (loss) for the period attributable to Level 3 securities held at January 31, 2024 | $ | (3,118,400) | |
| The information used in the above reconciliation represents fiscal year to date activity for any Investments in Securities identified as using Level 3 inputs at either the beginning or the end of the current fiscal period. Cost of purchases and proceeds of sales may include securities received and/or delivered through in-kind transactions, corporate actions or exchanges. Transfers into Level 3 were attributable to a lack of observable market data resulting from decreases in market activity, decreases in liquidity, security restructurings or corporate actions. Transfers out of Level 3 were attributable to observable market data becoming available for those securities. Transfers in or out of Level 3 represent the beginning value of any Security or Instrument where a change in the pricing level occurred from the beginning to the end of the period. Realized and unrealized gains (losses) disclosed in the reconciliation are included in Net Gain (Loss) on the Fund's consolidated Statement of Operations. | |
Fidelity Advisor® Health Care Fund
| Consolidated Statement of Assets and Liabilities |
| | | | January 31, 2024 (Unaudited) |
| | | | | |
| Assets | | | | |
| Investment in securities, at value (including securities loaned of $177,722,014) - See accompanying schedule: | | | | |
Unaffiliated issuers (cost $3,172,628,211) | $ | 4,826,010,887 | | |
Fidelity Central Funds (cost $182,968,787) | | 182,968,787 | | |
| | | | | |
| | | | | |
| Total Investment in Securities (cost $3,355,596,998) | | | $ | 5,008,979,674 |
| Foreign currency held at value (cost $867,717) | | | | 867,478 |
| Receivable for investments sold | | | | 27,570,495 |
| Receivable for fund shares sold | | | | 2,953,489 |
| Dividends receivable | | | | 3,033,916 |
| Distributions receivable from Fidelity Central Funds | | | | 43,403 |
| Prepaid expenses | | | | 8,679 |
Total assets | | | | 5,043,457,134 |
| Liabilities | | | | |
| Payable to custodian bank | $ | 1,250,357 | | |
| Payable for investments purchased | | 21,616,458 | | |
| Payable for fund shares redeemed | | 6,397,739 | | |
| Accrued management fee | | 2,122,765 | | |
| Distribution and service plan fees payable | | 679,371 | | |
| Other affiliated payables | | 708,351 | | |
| Other payables and accrued expenses | | 63,872 | | |
| Collateral on securities loaned | | 182,966,909 | | |
| Total Liabilities | | | | 215,805,822 |
| Net Assets | | | $ | 4,827,651,312 |
| Net Assets consist of: | | | | |
| Paid in capital | | | $ | 3,134,424,930 |
| Total accumulated earnings (loss) | | | | 1,693,226,382 |
| Net Assets | | | $ | 4,827,651,312 |
| | | | | |
| Net Asset Value and Maximum Offering Price | | | | |
| Class A : | | | | |
Net Asset Value and redemption price per share ($1,452,056,897 ÷ 24,087,765 shares)(a) | | | $ | 60.28 |
| Maximum offering price per share (100/94.25 of $60.28) | | | $ | 63.96 |
| Class M : | | | | |
Net Asset Value and redemption price per share ($300,043,670 ÷ 5,453,606 shares)(a) | | | $ | 55.02 |
| Maximum offering price per share (100/96.50 of $55.02) | | | $ | 57.02 |
| Class C : | | | | |
Net Asset Value and offering price per share ($296,454,408 ÷ 6,660,880 shares)(a) | | | $ | 44.51 |
| Class I : | | | | |
Net Asset Value, offering price and redemption price per share ($2,169,047,687 ÷ 32,335,434 shares) | | | $ | 67.08 |
| Class Z : | | | | |
Net Asset Value, offering price and redemption price per share ($610,048,650 ÷ 9,062,779 shares) | | | $ | 67.31 |
(a)Redemption price per share is equal to net asset value less any applicable contingent deferred sales charge. |
| Consolidated Statement of Operations |
| | | | Six months ended January 31, 2024 (Unaudited) |
| Investment Income | | | | |
| Dividends | | | $ | 16,228,460 |
| Income from Fidelity Central Funds (including $121,365 from security lending) | | | | 599,462 |
| Total Income | | | | 16,827,922 |
| Expenses | | | | |
| Management fee | $ | 13,114,224 | | |
| Transfer agent fees | | 3,890,713 | | |
| Distribution and service plan fees | | 4,062,528 | | |
| Accounting fees | | 461,263 | | |
| Custodian fees and expenses | | 26,598 | | |
| Independent trustees' fees and expenses | | 15,288 | | |
| Registration fees | | 102,275 | | |
| Audit | | 27,553 | | |
| Legal | | 5,865 | | |
| Interest | | 37,301 | | |
| Miscellaneous | | 11,636 | | |
| Total expenses before reductions | | 21,755,244 | | |
| Expense reductions | | (214,557) | | |
| Total expenses after reductions | | | | 21,540,687 |
| Net Investment income (loss) | | | | (4,712,765) |
| Realized and Unrealized Gain (Loss) | | | | |
| Net realized gain (loss) on: | | | | |
| Investment Securities: | | | | |
| Unaffiliated issuers | | 98,629,034 | | |
| Foreign currency transactions | | 17,584 | | |
| Total net realized gain (loss) | | | | 98,646,618 |
| Change in net unrealized appreciation (depreciation) on: | | | | |
| Investment Securities: | | | | |
| Unaffiliated issuers | | (103,385,673) | | |
| Assets and liabilities in foreign currencies | | 17,008 | | |
| Total change in net unrealized appreciation (depreciation) | | | | (103,368,665) |
| Net gain (loss) | | | | (4,722,047) |
| Net increase (decrease) in net assets resulting from operations | | | $ | (9,434,812) |
| Consolidated Statement of Changes in Net Assets |
| |
| | Six months ended January 31, 2024 (Unaudited) | | Year ended July 31, 2023 |
| Increase (Decrease) in Net Assets | | | | |
| Operations | | | | |
| Net investment income (loss) | $ | (4,712,765) | $ | (17,932,909) |
| Net realized gain (loss) | | 98,646,618 | | 45,561,038 |
| Change in net unrealized appreciation (depreciation) | | (103,368,665) | | 188,268,771 |
| Net increase (decrease) in net assets resulting from operations | | (9,434,812) | | 215,896,900 |
| | | | | |
| Share transactions - net increase (decrease) | | (834,842,694) | | (425,461,599) |
| Total increase (decrease) in net assets | | (844,277,506) | | (209,564,699) |
| | | | | |
| Net Assets | | | | |
| Beginning of period | | 5,671,928,818 | | 5,881,493,517 |
| End of period | $ | 4,827,651,312 | $ | 5,671,928,818 |
| | | | | |
| | | | | |
Consolidated Financial Highlights
| Fidelity Advisor® Health Care Fund Class A |
| |
| | Six months ended (Unaudited) January 31, 2024 | | Years ended July 31, 2023 | | 2022 | | 2021 | | 2020 | | 2019 |
Selected Per-Share Data | | | | | | | | | | | | |
| Net asset value, beginning of period | $ | 59.73 | $ | 57.59 | $ | 69.58 | $ | 61.07 | $ | 49.21 | $ | 50.14 |
| Income from Investment Operations | | | | | | | | | | | | |
Net investment income (loss) A,B | | (.09) | | (.24) | | (.26) | | (.26) | | (.04) | | (.07) |
| Net realized and unrealized gain (loss) | | .64 | | 2.38 | | (7.58) | | 12.55 | | 12.08 | | 1.36 |
| Total from investment operations | | .55 | | 2.14 | | (7.84) | | 12.29 | | 12.04 | | 1.29 |
| Distributions from net investment income | | - | | - | | - | | (.16) | | - | | - |
| Distributions from net realized gain | | - | | - | | (4.15) | | (3.62) | | (.18) | | (2.22) |
| Total distributions | | - | | - | | (4.15) | | (3.78) | | (.18) | | (2.22) |
| Net asset value, end of period | $ | 60.28 | $ | 59.73 | $ | 57.59 | $ | 69.58 | $ | 61.07 | $ | 49.21 |
Total Return C,D,E | | .92% | | 3.72% | | (11.90)% | | 20.70% | | 24.50% | | 2.87% |
Ratios to Average Net Assets B,F,G | | | | | | | | | | | | |
| Expenses before reductions | | .98% H | | .98% | | .97% | | .98% | | 1.01% | | 1.02% |
| Expenses net of fee waivers, if any | | .97% H | | .97% | | .97% | | .98% | | 1.00% | | 1.02% |
| Expenses net of all reductions | | .97% H | | .97% | | .97% | | .98% | | 1.00% | | 1.02% |
| Net investment income (loss) | | (.30)% H | | (.42)% | | (.42)% | | (.39)% | | (.07)% | | (.14)% |
| Supplemental Data | | | | | | | | | | | | |
| Net assets, end of period (000 omitted) | $ | 1,452,057 | $ | 1,535,212 | $ | 1,488,238 | $ | 1,735,235 | $ | 1,372,082 | $ | 1,121,411 |
Portfolio turnover rate I | | 40% H | | 47% | | 33% | | 38% | | 53% J | | 45% |
ACalculated based on average shares outstanding during the period.
BNet investment income (loss) is affected by the timing of the declaration of dividends by any underlying mutual funds or exchange-traded funds (ETFs). Net investment income (loss) of any mutual funds or ETFs is not included in the Fund's net investment income (loss) ratio.
CTotal returns for periods of less than one year are not annualized.
DTotal returns would have been lower if certain expenses had not been reduced during the applicable periods shown.
ETotal returns do not include the effect of the sales charges.
FFees and expenses of any underlying mutual funds or exchange-traded funds (ETFs) are not included in the Fund's expense ratio. The Fund indirectly bears its proportionate share of these expenses. For additional expense information related to investments in Fidelity Central Funds, please refer to the "Investments in Fidelity Central Funds" note found in the Notes to Consolidated Financial Statements section of the most recent Annual or Semi-Annual report.
GExpense ratios reflect operating expenses of the class. Expenses before reductions do not reflect amounts reimbursed, waived, or reduced through arrangements with the investment adviser, brokerage services, or other offset arrangements, if applicable, and do not represent the amount paid by the class during periods when reimbursements, waivers or reductions occur.
HAnnualized.
IAmount does not include the portfolio activity of any underlying mutual funds or exchange-traded funds (ETFs).
JPortfolio turnover rate excludes securities received or delivered in-kind.
| Fidelity Advisor® Health Care Fund Class M |
| |
| | Six months ended (Unaudited) January 31, 2024 | | Years ended July 31, 2023 | | 2022 | | 2021 | | 2020 | | 2019 |
Selected Per-Share Data | | | | | | | | | | | | |
| Net asset value, beginning of period | $ | 54.58 | $ | 52.76 | $ | 64.25 | $ | 56.62 | $ | 45.75 | $ | 46.89 |
| Income from Investment Operations | | | | | | | | | | | | |
Net investment income (loss) A,B | | (.14) | | (.36) | | (.38) | | (.39) | | (.16) | | (.18) |
| Net realized and unrealized gain (loss) | | .58 | | 2.18 | | (6.96) | | 11.61 | | 11.21 | | 1.26 |
| Total from investment operations | | .44 | | 1.82 | | (7.34) | | 11.22 | | 11.05 | | 1.08 |
| Distributions from net investment income | | - | | - | | - | | (.02) | | - | | - |
| Distributions from net realized gain | | - | | - | | (4.15) | | (3.57) | | (.18) | | (2.22) |
| Total distributions | | - | | - | | (4.15) | | (3.59) | | (.18) | | (2.22) |
| Net asset value, end of period | $ | 55.02 | $ | 54.58 | $ | 52.76 | $ | 64.25 | $ | 56.62 | $ | 45.75 |
Total Return C,D,E | | .81% | | 3.45% | | (12.12)% | | 20.39% | | 24.19% | | 2.61% |
Ratios to Average Net Assets B,F,G | | | | | | | | | | | | |
| Expenses before reductions | | 1.23% H | | 1.23% | | 1.22% | | 1.23% | | 1.26% | | 1.28% |
| Expenses net of fee waivers, if any | | 1.22% H | | 1.23% | | 1.22% | | 1.23% | | 1.26% | | 1.28% |
| Expenses net of all reductions | | 1.22% H | | 1.23% | | 1.22% | | 1.23% | | 1.26% | | 1.28% |
| Net investment income (loss) | | (.55)% H | | (.67)% | | (.67)% | | (.65)% | | (.33)% | | (.40)% |
| Supplemental Data | | | | | | | | | | | | |
| Net assets, end of period (000 omitted) | $ | 300,044 | $ | 315,963 | $ | 330,452 | $ | 402,175 | $ | 349,280 | $ | 306,758 |
Portfolio turnover rate I | | 40% H | | 47% | | 33% | | 38% | | 53% J | | 45% |
ACalculated based on average shares outstanding during the period.
BNet investment income (loss) is affected by the timing of the declaration of dividends by any underlying mutual funds or exchange-traded funds (ETFs). Net investment income (loss) of any mutual funds or ETFs is not included in the Fund's net investment income (loss) ratio.
CTotal returns for periods of less than one year are not annualized.
DTotal returns would have been lower if certain expenses had not been reduced during the applicable periods shown.
ETotal returns do not include the effect of the sales charges.
FFees and expenses of any underlying mutual funds or exchange-traded funds (ETFs) are not included in the Fund's expense ratio. The Fund indirectly bears its proportionate share of these expenses. For additional expense information related to investments in Fidelity Central Funds, please refer to the "Investments in Fidelity Central Funds" note found in the Notes to Consolidated Financial Statements section of the most recent Annual or Semi-Annual report.
GExpense ratios reflect operating expenses of the class. Expenses before reductions do not reflect amounts reimbursed, waived, or reduced through arrangements with the investment adviser, brokerage services, or other offset arrangements, if applicable, and do not represent the amount paid by the class during periods when reimbursements, waivers or reductions occur.
HAnnualized.
IAmount does not include the portfolio activity of any underlying mutual funds or exchange-traded funds (ETFs).
JPortfolio turnover rate excludes securities received or delivered in-kind.
| Fidelity Advisor® Health Care Fund Class C |
| |
| | Six months ended (Unaudited) January 31, 2024 | | Years ended July 31, 2023 | | 2022 | | 2021 | | 2020 | | 2019 |
Selected Per-Share Data | | | | | | | | | | | | |
| Net asset value, beginning of period | $ | 44.26 | $ | 43.00 | $ | 53.40 | $ | 47.63 | $ | 38.70 | $ | 40.21 |
| Income from Investment Operations | | | | | | | | | | | | |
Net investment income (loss) A,B | | (.22) | | (.51) | | (.55) | | (.58) | | (.34) | | (.34) |
| Net realized and unrealized gain (loss) | | .47 | | 1.77 | | (5.70) | | 9.71 | | 9.45 | | 1.05 |
| Total from investment operations | | .25 | | 1.26 | | (6.25) | | 9.13 | | 9.11 | | .71 |
| Distributions from net realized gain | | - | | - | | (4.15) | | (3.36) | | (.18) | | (2.22) |
| Total distributions | | - | | - | | (4.15) | | (3.36) | | (.18) | | (2.22) |
| Net asset value, end of period | $ | 44.51 | $ | 44.26 | $ | 43.00 | $ | 53.40 | $ | 47.63 | $ | 38.70 |
Total Return C,D,E | | .56% | | 2.93% | | (12.56)% | | 19.78% | | 23.58% | | 2.10% |
Ratios to Average Net Assets B,F,G | | | | | | | | | | | | |
| Expenses before reductions | | 1.73% H | | 1.73% | | 1.72% | | 1.73% | | 1.76% | | 1.77% |
| Expenses net of fee waivers, if any | | 1.72% H | | 1.73% | | 1.72% | | 1.73% | | 1.76% | | 1.77% |
| Expenses net of all reductions | | 1.72% H | | 1.73% | | 1.72% | | 1.73% | | 1.75% | | 1.77% |
| Net investment income (loss) | | (1.05)% H | | (1.17)% | | (1.17)% | | (1.15)% | | (.82)% | | (.88)% |
| Supplemental Data | | | | | | | | | | | | |
| Net assets, end of period (000 omitted) | $ | 296,454 | $ | 365,165 | $ | 501,742 | $ | 697,626 | $ | 654,487 | $ | 585,093 |
Portfolio turnover rate I | | 40% H | | 47% | | 33% | | 38% | | 53% J | | 45% |
ACalculated based on average shares outstanding during the period.
BNet investment income (loss) is affected by the timing of the declaration of dividends by any underlying mutual funds or exchange-traded funds (ETFs). Net investment income (loss) of any mutual funds or ETFs is not included in the Fund's net investment income (loss) ratio.
CTotal returns for periods of less than one year are not annualized.
DTotal returns would have been lower if certain expenses had not been reduced during the applicable periods shown.
ETotal returns do not include the effect of the contingent deferred sales charge.
FFees and expenses of any underlying mutual funds or exchange-traded funds (ETFs) are not included in the Fund's expense ratio. The Fund indirectly bears its proportionate share of these expenses. For additional expense information related to investments in Fidelity Central Funds, please refer to the "Investments in Fidelity Central Funds" note found in the Notes to Consolidated Financial Statements section of the most recent Annual or Semi-Annual report.
GExpense ratios reflect operating expenses of the class. Expenses before reductions do not reflect amounts reimbursed, waived, or reduced through arrangements with the investment adviser, brokerage services, or other offset arrangements, if applicable, and do not represent the amount paid by the class during periods when reimbursements, waivers or reductions occur.
HAnnualized.
IAmount does not include the portfolio activity of any underlying mutual funds or exchange-traded funds (ETFs).
JPortfolio turnover rate excludes securities received or delivered in-kind.
| Fidelity Advisor® Health Care Fund Class I |
| |
| | Six months ended (Unaudited) January 31, 2024 | | Years ended July 31, 2023 | | 2022 | | 2021 | | 2020 | | 2019 |
Selected Per-Share Data | | | | | | | | | | | | |
| Net asset value, beginning of period | $ | 66.37 | $ | 63.83 | $ | 76.48 | $ | 66.81 | $ | 53.77 | $ | 54.43 |
| Income from Investment Operations | | | | | | | | | | | | |
Net investment income (loss) A,B | | (.01) | | (.10) | | (.11) | | (.10) | | .11 | | .07 |
| Net realized and unrealized gain (loss) | | .72 | | 2.64 | | (8.39) | | 13.76 | | 13.22 | | 1.49 |
| Total from investment operations | | .71 | | 2.54 | | (8.50) | | 13.66 | | 13.33 | | 1.56 |
| Distributions from net investment income | | - | | - | | - | | (.30) | | - | | - |
| Distributions from net realized gain | | - | | - | | (4.15) | | (3.69) | | (.29) | | (2.22) |
| Total distributions | | - | | - | | (4.15) | | (3.99) | | (.29) | | (2.22) |
| Net asset value, end of period | $ | 67.08 | $ | 66.37 | $ | 63.83 | $ | 76.48 | $ | 66.81 | $ | 53.77 |
Total Return C,D | | 1.07% | | 3.98% | | (11.68)% | | 21.01% | | 24.84% | | 3.14% |
Ratios to Average Net Assets B,E,F | | | | | | | | | | | | |
| Expenses before reductions | | .72% G | | .72% | | .71% | | .72% | | .74% | | .76% |
| Expenses net of fee waivers, if any | | .71% G | | .71% | | .71% | | .72% | | .74% | | .76% |
| Expenses net of all reductions | | .71% G | | .71% | | .71% | | .72% | | .74% | | .76% |
| Net investment income (loss) | | (.04)% G | | (.16)% | | (.16)% | | (.13)% | | .19% | | .13% |
| Supplemental Data | | | | | | | | | | | | |
| Net assets, end of period (000 omitted) | $ | 2,169,048 | $ | 2,593,539 | $ | 2,743,740 | $ | 3,410,787 | $ | 2,546,323 | $ | 1,783,417 |
Portfolio turnover rate H | | 40% G | | 47% | | 33% | | 38% | | 53% I | | 45% |
ACalculated based on average shares outstanding during the period.
BNet investment income (loss) is affected by the timing of the declaration of dividends by any underlying mutual funds or exchange-traded funds (ETFs). Net investment income (loss) of any mutual funds or ETFs is not included in the Fund's net investment income (loss) ratio.
CTotal returns for periods of less than one year are not annualized.
DTotal returns would have been lower if certain expenses had not been reduced during the applicable periods shown.
EFees and expenses of any underlying mutual funds or exchange-traded funds (ETFs) are not included in the Fund's expense ratio. The Fund indirectly bears its proportionate share of these expenses. For additional expense information related to investments in Fidelity Central Funds, please refer to the "Investments in Fidelity Central Funds" note found in the Notes to Consolidated Financial Statements section of the most recent Annual or Semi-Annual report.
FExpense ratios reflect operating expenses of the class. Expenses before reductions do not reflect amounts reimbursed, waived, or reduced through arrangements with the investment adviser, brokerage services, or other offset arrangements, if applicable, and do not represent the amount paid by the class during periods when reimbursements, waivers or reductions occur.
GAnnualized.
HAmount does not include the portfolio activity of any underlying mutual funds or exchange-traded funds (ETFs).
IPortfolio turnover rate excludes securities received or delivered in-kind.
| Fidelity Advisor® Health Care Fund Class Z |
| |
| | Six months ended (Unaudited) January 31, 2024 | | Years ended July 31, 2023 | | 2022 | | 2021 | | 2020 | | 2019 A |
Selected Per-Share Data | | | | | | | | | | | | |
| Net asset value, beginning of period | $ | 66.56 | $ | 63.93 | $ | 76.55 | $ | 66.88 | $ | 53.84 | $ | 57.87 |
| Income from Investment Operations | | | | | | | | | | | | |
Net investment income (loss) B,C | | .03 | | (.02) | | (.03) | | (.01) | | .19 | | .13 |
| Net realized and unrealized gain (loss) | | .72 | | 2.65 | | (8.38) | | 13.77 | | 13.22 | | (1.94) |
| Total from investment operations | | .75 | | 2.63 | | (8.41) | | 13.76 | | 13.41 | | (1.81) |
| Distributions from net investment income | | - | | - | | - | | (.37) | | - | | - |
| Distributions from net realized gain | | - | | - | | (4.21) | | (3.73) | | (.37) | | (2.22) |
| Total distributions | | - | | - | | (4.21) | | (4.09) D | | (.37) | | (2.22) |
| Net asset value, end of period | $ | 67.31 | $ | 66.56 | $ | 63.93 | $ | 76.55 | $ | 66.88 | $ | 53.84 |
Total Return E,F | | 1.13% | | 4.11% | | (11.56)% | | 21.15% | | 24.98% | | (2.86)% |
Ratios to Average Net Assets C,G,H | | | | | | | | | | | | |
| Expenses before reductions | | .59% I | | .59% | | .59% | | .60% | | .61% | | .62% I |
| Expenses net of fee waivers, if any | | .58% I | | .59% | | .59% | | .60% | | .61% | | .62% I |
| Expenses net of all reductions | | .58% I | | .59% | | .59% | | .59% | | .61% | | .62% I |
| Net investment income (loss) | | .09% I | | (.03)% | | (.04)% | | (.01)% | | .32% | | .30% I |
| Supplemental Data | | | | | | | | | | | | |
| Net assets, end of period (000 omitted) | $ | 610,049 | $ | 862,051 | $ | 817,321 | $ | 952,460 | $ | 610,481 | $ | 238,873 |
Portfolio turnover rate J | | 40% I | | 47% | | 33% | | 38% | | 53% K | | 45% |
AFor the period October 2, 2018 (commencement of sale of shares) through July 31, 2019.
BCalculated based on average shares outstanding during the period.
CNet investment income (loss) is affected by the timing of the declaration of dividends by any underlying mutual funds or exchange-traded funds (ETFs). Net investment income (loss) of any mutual funds or ETFs is not included in the Fund's net investment income (loss) ratio.
DTotal distributions per share do not sum due to rounding.
ETotal returns for periods of less than one year are not annualized.
FTotal returns would have been lower if certain expenses had not been reduced during the applicable periods shown.
GFees and expenses of any underlying mutual funds or exchange-traded funds (ETFs) are not included in the Fund's expense ratio. The Fund indirectly bears its proportionate share of these expenses. For additional expense information related to investments in Fidelity Central Funds, please refer to the "Investments in Fidelity Central Funds" note found in the Notes to Consolidated Financial Statements section of the most recent Annual or Semi-Annual report.
HExpense ratios reflect operating expenses of the class. Expenses before reductions do not reflect amounts reimbursed, waived, or reduced through arrangements with the investment adviser, brokerage services, or other offset arrangements, if applicable, and do not represent the amount paid by the class during periods when reimbursements, waivers or reductions occur.
IAnnualized.
JAmount does not include the portfolio activity of any underlying mutual funds or exchange-traded funds (ETFs).
KPortfolio turnover rate excludes securities received or delivered in-kind.
Top Holdings (% of Fund's net assets) |
| |
| Union Pacific Corp. | 6.3 | |
| General Electric Co. | 6.3 | |
| The Boeing Co. | 5.6 | |
| Ingersoll Rand, Inc. | 4.9 | |
| Parker Hannifin Corp. | 4.4 | |
| FedEx Corp. | 4.1 | |
| TransDigm Group, Inc. | 4.1 | |
| ITT, Inc. | 3.6 | |
| Howmet Aerospace, Inc. | 3.6 | |
| Trane Technologies PLC | 3.6 | |
| | 46.5 | |
| |
| Industries (% of Fund's net assets) |
| |
| Machinery | 22.2 | |
| Ground Transportation | 17.5 | |
| Aerospace & Defense | 17.0 | |
| Building Products | 9.1 | |
| Electrical Equipment | 8.2 | |
| Industrial Conglomerates | 6.3 | |
| Construction & Engineering | 5.2 | |
| Air Freight & Logistics | 4.1 | |
| Professional Services | 3.5 | |
| Commercial Services & Supplies | 2.7 | |
| Construction Materials | 2.3 | |
| Trading Companies & Distributors | 1.5 | |
| |
Fidelity Advisor® Industrials Fund
Showing Percentage of Net Assets
| Common Stocks - 99.6% |
| | | Shares | Value ($) |
| Aerospace & Defense - 17.0% | | | |
| Aerospace & Defense - 17.0% | | | |
| General Dynamics Corp. | | 35,500 | 9,407,145 |
| Howmet Aerospace, Inc. | | 311,258 | 17,511,375 |
| Lockheed Martin Corp. | | 21,020 | 9,026,198 |
| The Boeing Co. (a) | | 128,904 | 27,203,900 |
| TransDigm Group, Inc. | | 18,214 | 19,902,074 |
| | | | 83,050,692 |
| Air Freight & Logistics - 4.1% | | | |
| Air Freight & Logistics - 4.1% | | | |
| FedEx Corp. | | 83,300 | 20,099,457 |
| Building Products - 9.1% | | | |
| Building Products - 9.1% | | | |
| Carlisle Companies, Inc. | | 19,024 | 5,978,482 |
| Fortune Brands Innovations, Inc. | | 43,800 | 3,398,442 |
| Johnson Controls International PLC | | 120,557 | 6,352,148 |
| Simpson Manufacturing Co. Ltd. | | 25,579 | 4,629,543 |
| The AZEK Co., Inc. (a) | | 171,400 | 6,609,184 |
| Trane Technologies PLC | | 69,400 | 17,492,270 |
| | | | 44,460,069 |
| Commercial Services & Supplies - 2.7% | | | |
| Diversified Support Services - 0.4% | | | |
| Cintas Corp. | | 3,200 | 1,934,624 |
| Environmental & Facilities Services - 2.3% | | | |
| Waste Connections, Inc. (United States) | | 73,000 | 11,333,980 |
TOTAL COMMERCIAL SERVICES & SUPPLIES | | | 13,268,604 |
| Construction & Engineering - 5.2% | | | |
| Construction & Engineering - 5.2% | | | |
| AECOM | | 75,558 | 6,663,460 |
| Quanta Services, Inc. | | 47,400 | 9,197,970 |
| Willscot Mobile Mini Holdings (a) | | 202,600 | 9,582,980 |
| | | | 25,444,410 |
| Construction Materials - 2.3% | | | |
| Construction Materials - 2.3% | | | |
| Eagle Materials, Inc. | | 50,200 | 11,359,256 |
| Electrical Equipment - 8.2% | | | |
| Electrical Components & Equipment - 8.2% | | | |
| AMETEK, Inc. | | 52,934 | 8,577,955 |
| Eaton Corp. PLC | | 66,516 | 16,368,257 |
| Regal Rexnord Corp. | | 96,405 | 12,866,211 |
| Vertiv Holdings Co. | | 35,600 | 2,005,348 |
| | | | 39,817,771 |
| Ground Transportation - 17.5% | | | |
| Cargo Ground Transportation - 7.6% | | | |
| Knight-Swift Transportation Holdings, Inc. Class A | | 254,600 | 14,608,948 |
| Saia, Inc. (a) | | 34,300 | 15,454,894 |
| XPO, Inc. (a) | | 80,000 | 6,835,200 |
| | | | 36,899,042 |
| Passenger Ground Transportation - 3.1% | | | |
| Uber Technologies, Inc. (a) | | 230,800 | 15,064,316 |
| Rail Transportation - 6.8% | | | |
| CSX Corp. | | 68,983 | 2,462,693 |
| Union Pacific Corp. | | 125,700 | 30,662,000 |
| | | | 33,124,693 |
TOTAL GROUND TRANSPORTATION | | | 85,088,051 |
| Industrial Conglomerates - 6.3% | | | |
| Industrial Conglomerates - 6.3% | | | |
| General Electric Co. | | 231,537 | 30,660,130 |
| Machinery - 22.2% | | | |
| Construction Machinery & Heavy Transportation Equipment - 2.0% | | | |
| Caterpillar, Inc. | | 31,800 | 9,549,858 |
| Industrial Machinery & Supplies & Components - 20.2% | | | |
| Chart Industries, Inc. (a) | | 71,500 | 8,345,480 |
| Dover Corp. | | 102,900 | 15,412,362 |
| Fortive Corp. | | 148,975 | 11,646,866 |
| Ingersoll Rand, Inc. | | 299,143 | 23,889,560 |
| ITT, Inc. | | 145,909 | 17,622,889 |
| Parker Hannifin Corp. | | 46,513 | 21,605,289 |
| | | | 98,522,446 |
TOTAL MACHINERY | | | 108,072,304 |
| Professional Services - 3.5% | | | |
| Research & Consulting Services - 3.5% | | | |
| KBR, Inc. | | 124,500 | 6,487,695 |
| Leidos Holdings, Inc. | | 96,200 | 10,627,214 |
| | | | 17,114,909 |
| Trading Companies & Distributors - 1.5% | | | |
| Trading Companies & Distributors - 1.5% | | | |
| W.W. Grainger, Inc. | | 8,300 | 7,433,812 |
| TOTAL COMMON STOCKS (Cost $396,645,151) | | | 485,869,465 |
| | | | |
| Money Market Funds - 0.5% |
| | | Shares | Value ($) |
Fidelity Cash Central Fund 5.39% (b) (Cost $2,402,119) | | 2,401,638 | 2,402,119 |
| | | | |
| TOTAL INVESTMENT IN SECURITIES - 100.1% (Cost $399,047,270) | 488,271,584 |
NET OTHER ASSETS (LIABILITIES) - (0.1)% | (482,680) |
| NET ASSETS - 100.0% | 487,788,904 |
| | |
Legend
| (b) | Affiliated fund that is generally available only to investment companies and other accounts managed by Fidelity Investments. The rate quoted is the annualized seven-day yield of the fund at period end. A complete unaudited listing of the fund's holdings as of its most recent quarter end is available upon request. In addition, each Fidelity Central Fund's financial statements are available on the SEC's website or upon request. |
Affiliated Central Funds
Fiscal year to date information regarding the Fund's investments in Fidelity Central Funds, including the ownership percentage, is presented below.
| Affiliate | Value, beginning of period ($) | Purchases ($) | Sales Proceeds ($) | Dividend Income ($) | Realized Gain (loss) ($) | Change in Unrealized appreciation (depreciation) ($) | Value, end of period ($) | % ownership, end of period |
| Fidelity Cash Central Fund 5.39% | 2,126,016 | 44,517,599 | 44,241,496 | 48,087 | - | - | 2,402,119 | 0.0% |
| Fidelity Securities Lending Cash Central Fund 5.39% | - | 53,166,649 | 53,166,649 | 2,556 | - | - | - | 0.0% |
| Total | 2,126,016 | 97,684,248 | 97,408,145 | 50,643 | - | - | 2,402,119 | |
| | | | | | | | | |
Amounts in the dividend income column in the above table include any capital gain distributions from underlying funds, which are presented in the corresponding line item in the Statement of Operations, if applicable.
Amounts in the dividend income column for Fidelity Securities Lending Cash Central Fund represents the income earned on investing cash collateral, less rebates paid to borrowers and any lending agent fees associated with the loan, plus any premium payments received for lending certain types of securities.
Amounts included in the purchases and sales proceeds columns may include in-kind transactions, if applicable.
Investment Valuation
The following is a summary of the inputs used, as of January 31, 2024, involving the Fund's assets and liabilities carried at fair value. The inputs or methodology used for valuing securities may not be an indication of the risk associated with investing in those securities. For more information on valuation inputs, and their aggregation into the levels used below, please refer to the Investment Valuation section in the accompanying Notes to Financial Statements.
| Valuation Inputs at Reporting Date: |
| Description | Total ($) | Level 1 ($) | Level 2 ($) | Level 3 ($) |
Investments in Securities: | | | | |
|
| Common Stocks | 485,869,465 | 485,869,465 | - | - |
|
| Money Market Funds | 2,402,119 | 2,402,119 | - | - |
| Total Investments in Securities: | 488,271,584 | 488,271,584 | - | - |
Fidelity Advisor® Industrials Fund
| Statement of Assets and Liabilities |
| | | | January 31, 2024 (Unaudited) |
| | | | | |
| Assets | | | | |
| Investment in securities, at value - See accompanying schedule: | | | | |
Unaffiliated issuers (cost $396,645,151) | $ | 485,869,465 | | |
Fidelity Central Funds (cost $2,402,119) | | 2,402,119 | | |
| | | | | |
| | | | | |
| Total Investment in Securities (cost $399,047,270) | | | $ | 488,271,584 |
| Receivable for investments sold | | | | 491,686 |
| Receivable for fund shares sold | | | | 90,656 |
| Dividends receivable | | | | 88,460 |
| Distributions receivable from Fidelity Central Funds | | | | 7,885 |
| Prepaid expenses | | | | 1,638 |
Total assets | | | | 488,951,909 |
| Liabilities | | | | |
| Payable for investments purchased | $ | 485,799 | | |
| Payable for fund shares redeemed | | 254,696 | | |
| Accrued management fee | | 210,566 | | |
| Transfer agent fee payable | | 67,819 | | |
| Distribution and service plan fees payable | | 98,156 | | |
| Other affiliated payables | | 13,882 | | |
| Other payables and accrued expenses | | 32,087 | | |
| Total Liabilities | | | | 1,163,005 |
| Net Assets | | | $ | 487,788,904 |
| Net Assets consist of: | | | | |
| Paid in capital | | | $ | 390,314,709 |
| Total accumulated earnings (loss) | | | | 97,474,195 |
| Net Assets | | | $ | 487,788,904 |
| | | | | |
| Net Asset Value and Maximum Offering Price | | | | |
| Class A : | | | | |
Net Asset Value and redemption price per share ($233,964,454 ÷ 6,135,496 shares)(a) | | | $ | 38.13 |
| Maximum offering price per share (100/94.25 of $38.13) | | | $ | 40.46 |
| Class M : | | | | |
Net Asset Value and redemption price per share ($57,049,752 ÷ 1,560,217 shares)(a) | | | $ | 36.57 |
| Maximum offering price per share (100/96.50 of $36.57) | | | $ | 37.90 |
| Class C : | | | | |
Net Asset Value and offering price per share ($31,709,776 ÷ 1,026,398 shares)(a) | | | $ | 30.89 |
| Class I : | | | | |
Net Asset Value, offering price and redemption price per share ($128,724,553 ÷ 3,091,716 shares) | | | $ | 41.64 |
| Class Z : | | | | |
Net Asset Value, offering price and redemption price per share ($36,340,369 ÷ 873,190 shares) | | | $ | 41.62 |
(a)Redemption price per share is equal to net asset value less any applicable contingent deferred sales charge. |
| Statement of Operations |
| | | | Six months ended January 31, 2024 (Unaudited) |
| Investment Income | | | | |
| Dividends | | | $ | 2,240,347 |
| Special dividends | | | | 651,490 |
| Income from Fidelity Central Funds (including $2,556 from security lending) | | | | 50,643 |
| Total Income | | | | 2,942,480 |
| Expenses | | | | |
| Management fee | $ | 1,257,541 | | |
| Transfer agent fees | | 401,303 | | |
| Distribution and service plan fees | | 560,586 | | |
| Accounting fees | | 83,913 | | |
| Custodian fees and expenses | | 9,539 | | |
| Independent trustees' fees and expenses | | 1,438 | | |
| Registration fees | | 56,924 | | |
| Audit | | 29,253 | | |
| Legal | | 1,012 | | |
| Interest | | 3,445 | | |
| Miscellaneous | | 1,473 | | |
| Total expenses before reductions | | 2,406,427 | | |
| Expense reductions | | (21,016) | | |
| Total expenses after reductions | | | | 2,385,411 |
| Net Investment income (loss) | | | | 557,069 |
| Realized and Unrealized Gain (Loss) | | | | |
| Net realized gain (loss) on: | | | | |
| Investment Securities: | | | | |
| Unaffiliated issuers | | (1,309,287) | | |
| Redemptions in-kind | | 11,201,399 | | |
| Total net realized gain (loss) | | | | 9,892,112 |
| Change in net unrealized appreciation (depreciation) on investment securities | | | | 12,195,857 |
| Net gain (loss) | | | | 22,087,969 |
| Net increase (decrease) in net assets resulting from operations | | | $ | 22,645,038 |
| Statement of Changes in Net Assets |
| |
| | Six months ended January 31, 2024 (Unaudited) | | Year ended July 31, 2023 |
| Increase (Decrease) in Net Assets | | | | |
| Operations | | | | |
| Net investment income (loss) | $ | 557,069 | $ | (375,128) |
| Net realized gain (loss) | | 9,892,112 | | 64,106,491 |
| Change in net unrealized appreciation (depreciation) | | 12,195,857 | | 32,286,790 |
| Net increase (decrease) in net assets resulting from operations | | 22,645,038 | | 96,018,153 |
| Distributions to shareholders | | (39,770,332) | | (17,549,942) |
| | | | | |
| Share transactions - net increase (decrease) | | (53,807,899) | | 8,937,216 |
| Total increase (decrease) in net assets | | (70,933,193) | | 87,405,427 |
| | | | | |
| Net Assets | | | | |
| Beginning of period | | 558,722,097 | | 471,316,670 |
| End of period | $ | 487,788,904 | $ | 558,722,097 |
| | | | | |
| | | | | |
Financial Highlights
| Fidelity Advisor® Industrials Fund Class A |
| |
| | Six months ended (Unaudited) January 31, 2024 | | Years ended July 31, 2023 | | 2022 | | 2021 | | 2020 | | 2019 |
Selected Per-Share Data | | | | | | | | | | | | |
| Net asset value, beginning of period | $ | 39.24 | $ | 34.23 | $ | 45.64 | $ | 33.85 | $ | 38.95 | $ | 42.62 |
| Income from Investment Operations | | | | | | | | | | | | |
Net investment income (loss) A,B | | .04 C | | (.05) D | | (.14) | | (.17) | | .18 E | | .24 |
| Net realized and unrealized gain (loss) | | 2.19 | | 6.24 | | (2.62) | | 12.20 | | (2.46) | | (.02) |
| Total from investment operations | | 2.23 | | 6.19 | | (2.76) | | 12.03 | | (2.28) | | .22 |
| Distributions from net investment income | | - | | (.02) | | - | | - | | (.25) | | (.19) |
| Distributions from net realized gain | | (3.34) | | (1.16) | | (8.65) | | (.24) | | (2.57) | | (3.70) |
| Total distributions | | (3.34) | | (1.18) | | (8.65) | | (.24) | | (2.82) | | (3.89) |
| Net asset value, end of period | $ | 38.13 | $ | 39.24 | $ | 34.23 | $ | 45.64 | $ | 33.85 | $ | 38.95 |
Total Return F,G,H | | 5.71% | | 18.68% | | (7.79)% | | 35.63% | | (6.58)% | | 2.06% |
Ratios to Average Net Assets B,I,J | | | | | | | | | | | | |
| Expenses before reductions | | 1.04% K | | 1.03% | | 1.02% | | 1.03% | | 1.05% | | 1.04% |
| Expenses net of fee waivers, if any | | 1.03% K | | 1.03% | | 1.01% | | 1.03% | | 1.05% | | 1.04% |
| Expenses net of all reductions | | 1.03% K | | 1.03% | | 1.01% | | 1.01% | | 1.03% | | 1.03% |
| Net investment income (loss) | | .06% C,K | | (.13)% D | | (.35)% | | (.40)% | | .49% E | | .63% |
| Supplemental Data | | | | | | | | | | | | |
| Net assets, end of period (000 omitted) | $ | 233,964 | $ | 226,370 | $ | 214,576 | $ | 264,130 | $ | 199,835 | $ | 268,483 |
Portfolio turnover rate L | | 33% K,M | | 189% M | | 106% | | 205% | | 219% M | | 125% |
ACalculated based on average shares outstanding during the period.
BNet investment income (loss) is affected by the timing of the declaration of dividends by any underlying mutual funds or exchange-traded funds (ETFs). Net investment income (loss) of any mutual funds or ETFs is not included in the Fund's net investment income (loss) ratio.
CNet investment income per share reflects one or more large, non-recurring dividend(s) which amounted to $.05 per share. Such dividends are not annualized in the ratio of net investment income (loss) to average net assets. Excluding such non-recurring dividend(s) the ratio of net investment income (loss) to average net assets would have been (.08)%.
DNet investment income per share reflects one or more large, non-recurring dividend(s) which amounted to $.04 per share. Excluding such non-recurring dividend(s), the ratio of net investment income (loss) to average net assets would have been (.25)%.
ENet investment income per share reflects one or more large, non-recurring dividend(s) which amounted to $.07 per share. Excluding such non-recurring dividend(s), the ratio of net investment income (loss) to average net assets would have been .29%.
FTotal returns for periods of less than one year are not annualized.
GTotal returns would have been lower if certain expenses had not been reduced during the applicable periods shown.
HTotal returns do not include the effect of the sales charges.
IFees and expenses of any underlying mutual funds or exchange-traded funds (ETFs) are not included in the Fund's expense ratio. The Fund indirectly bears its proportionate share of these expenses. For additional expense information related to investments in Fidelity Central Funds, please refer to the "Investments in Fidelity Central Funds" note found in the Notes to Financial Statements section of the most recent Annual or Semi-Annual report.
JExpense ratios reflect operating expenses of the class. Expenses before reductions do not reflect amounts reimbursed, waived, or reduced through arrangements with the investment adviser, brokerage services, or other offset arrangements, if applicable, and do not represent the amount paid by the class during periods when reimbursements, waivers or reductions occur.
KAnnualized.
LAmount does not include the portfolio activity of any underlying mutual funds or exchange-traded funds (ETFs).
MPortfolio turnover rate excludes securities received or delivered in-kind.
| Fidelity Advisor® Industrials Fund Class M |
| |
| | Six months ended (Unaudited) January 31, 2024 | | Years ended July 31, 2023 | | 2022 | | 2021 | | 2020 | | 2019 |
Selected Per-Share Data | | | | | | | | | | | | |
| Net asset value, beginning of period | $ | 37.77 | $ | 33.05 | $ | 44.31 | $ | 32.96 | $ | 37.99 | $ | 41.65 |
| Income from Investment Operations | | | | | | | | | | | | |
Net investment income (loss) A,B | | (.01) C | | (.13) D | | (.23) | | (.27) | | .08 E | | .14 |
| Net realized and unrealized gain (loss) | | 2.11 | | 6.01 | | (2.53) | | 11.86 | | (2.39) | | (.03) |
| Total from investment operations | | 2.10 | | 5.88 | | (2.76) | | 11.59 | | (2.31) | | .11 |
| Distributions from net investment income | | - | | - | | - | | - | | (.15) | | (.07) |
| Distributions from net realized gain | | (3.30) | | (1.16) | | (8.50) | | (.24) | | (2.57) | | (3.70) |
| Total distributions | | (3.30) | | (1.16) | | (8.50) | | (.24) | | (2.72) | | (3.77) |
| Net asset value, end of period | $ | 36.57 | $ | 37.77 | $ | 33.05 | $ | 44.31 | $ | 32.96 | $ | 37.99 |
Total Return F,G,H | | 5.60% | | 18.39% | | (8.03)% | | 35.25% | | (6.82)% | | 1.78% |
Ratios to Average Net Assets B,I,J | | | | | | | | | | | | |
| Expenses before reductions | | 1.29% K | | 1.29% | | 1.27% | | 1.29% | | 1.31% | | 1.31% |
| Expenses net of fee waivers, if any | | 1.28% K | | 1.28% | | 1.27% | | 1.29% | | 1.31% | | 1.30% |
| Expenses net of all reductions | | 1.28% K | | 1.28% | | 1.27% | | 1.27% | | 1.30% | | 1.30% |
| Net investment income (loss) | | (.19)% C,K | | (.38)% D | | (.60)% | | (.66)% | | .23% E | | .37% |
| Supplemental Data | | | | | | | | | | | | |
| Net assets, end of period (000 omitted) | $ | 57,050 | $ | 54,175 | $ | 49,501 | $ | 56,680 | $ | 45,157 | $ | 61,570 |
Portfolio turnover rate L | | 33% K,M | | 189% M | | 106% | | 205% | | 219% M | | 125% |
ACalculated based on average shares outstanding during the period.
BNet investment income (loss) is affected by the timing of the declaration of dividends by any underlying mutual funds or exchange-traded funds (ETFs). Net investment income (loss) of any mutual funds or ETFs is not included in the Fund's net investment income (loss) ratio.
CNet investment income per share reflects one or more large, non-recurring dividend(s) which amounted to $.05 per share. Such dividends are not annualized in the ratio of net investment income (loss) to average net assets. Excluding such non-recurring dividend(s) the ratio of net investment income (loss) to average net assets would have been (.33)%.
DNet investment income per share reflects one or more large, non-recurring dividend(s) which amounted to $.04 per share. Excluding such non-recurring dividend(s), the ratio of net investment income (loss) to average net assets would have been (.51)%.
ENet investment income per share reflects one or more large, non-recurring dividend(s) which amounted to $.07 per share. Excluding such non-recurring dividend(s), the ratio of net investment income (loss) to average net assets would have been .03%.
FTotal returns for periods of less than one year are not annualized.
GTotal returns would have been lower if certain expenses had not been reduced during the applicable periods shown.
HTotal returns do not include the effect of the sales charges.
IFees and expenses of any underlying mutual funds or exchange-traded funds (ETFs) are not included in the Fund's expense ratio. The Fund indirectly bears its proportionate share of these expenses. For additional expense information related to investments in Fidelity Central Funds, please refer to the "Investments in Fidelity Central Funds" note found in the Notes to Financial Statements section of the most recent Annual or Semi-Annual report.
JExpense ratios reflect operating expenses of the class. Expenses before reductions do not reflect amounts reimbursed, waived, or reduced through arrangements with the investment adviser, brokerage services, or other offset arrangements, if applicable, and do not represent the amount paid by the class during periods when reimbursements, waivers or reductions occur.
KAnnualized.
LAmount does not include the portfolio activity of any underlying mutual funds or exchange-traded funds (ETFs).
MPortfolio turnover rate excludes securities received or delivered in-kind.
| Fidelity Advisor® Industrials Fund Class C |
| |
| | Six months ended (Unaudited) January 31, 2024 | | Years ended July 31, 2023 | | 2022 | | 2021 | | 2020 | | 2019 |
Selected Per-Share Data | | | | | | | | | | | | |
| Net asset value, beginning of period | $ | 32.48 | $ | 28.72 | $ | 39.46 | $ | 29.52 | $ | 34.27 | $ | 38.09 |
| Income from Investment Operations | | | | | | | | | | | | |
Net investment income (loss) A,B | | (.09) C | | (.26) D | | (.37) | | (.41) | | (.08) E | | (.04) |
| Net realized and unrealized gain (loss) | | 1.80 | | 5.18 | | (2.19) | | 10.59 | | (2.15) | | (.08) |
| Total from investment operations | | 1.71 | | 4.92 | | (2.56) | | 10.18 | | (2.23) | | (.12) |
| Distributions from net investment income | | - | | - | | - | | - | | (.03) | | - |
| Distributions from net realized gain | | (3.30) | | (1.16) | | (8.18) | | (.24) | | (2.49) | | (3.70) |
| Total distributions | | (3.30) | | (1.16) | | (8.18) | | (.24) | | (2.52) | | (3.70) |
| Net asset value, end of period | $ | 30.89 | $ | 32.48 | $ | 28.72 | $ | 39.46 | $ | 29.52 | $ | 34.27 |
Total Return F,G,H | | 5.30% | | 17.81% | | (8.48)% | | 34.58% | | (7.27)% | | 1.28% |
Ratios to Average Net Assets B,I,J | | | | | | | | | | | | |
| Expenses before reductions | | 1.79% K | | 1.79% | | 1.77% | | 1.79% | | 1.81% | | 1.80% |
| Expenses net of fee waivers, if any | | 1.78% K | | 1.78% | | 1.77% | | 1.79% | | 1.81% | | 1.80% |
| Expenses net of all reductions | | 1.78% K | | 1.78% | | 1.77% | | 1.77% | | 1.79% | | 1.79% |
| Net investment income (loss) | | (.70)% C,K | | (.89)% D | | (1.10)% | | (1.16)% | | (.26)% E | | (.12)% |
| Supplemental Data | | | | | | | | | | | | |
| Net assets, end of period (000 omitted) | $ | 31,710 | $ | 33,293 | $ | 37,417 | $ | 55,576 | $ | 53,969 | $ | 90,512 |
Portfolio turnover rate L | | 33% K,M | | 189% M | | 106% | | 205% | | 219% M | | 125% |
ACalculated based on average shares outstanding during the period.
BNet investment income (loss) is affected by the timing of the declaration of dividends by any underlying mutual funds or exchange-traded funds (ETFs). Net investment income (loss) of any mutual funds or ETFs is not included in the Fund's net investment income (loss) ratio.
CNet investment income per share reflects one or more large, non-recurring dividend(s) which amounted to $.04 per share. Such dividends are not annualized in the ratio of net investment income (loss) to average net assets. Excluding such non-recurring dividend(s) the ratio of net investment income (loss) to average net assets would have been (.83)%.
DNet investment income per share reflects one or more large, non-recurring dividend(s) which amounted to $.04 per share. Excluding such non-recurring dividend(s), the ratio of net investment income (loss) to average net assets would have been (1.01)%.
ENet investment income per share reflects one or more large, non-recurring dividend(s) which amounted to $.06 per share. Excluding such non-recurring dividend(s), the ratio of net investment income (loss) to average net assets would have been (.46)%.
FTotal returns for periods of less than one year are not annualized.
GTotal returns would have been lower if certain expenses had not been reduced during the applicable periods shown.
HTotal returns do not include the effect of the contingent deferred sales charge.
IFees and expenses of any underlying mutual funds or exchange-traded funds (ETFs) are not included in the Fund's expense ratio. The Fund indirectly bears its proportionate share of these expenses. For additional expense information related to investments in Fidelity Central Funds, please refer to the "Investments in Fidelity Central Funds" note found in the Notes to Financial Statements section of the most recent Annual or Semi-Annual report.
JExpense ratios reflect operating expenses of the class. Expenses before reductions do not reflect amounts reimbursed, waived, or reduced through arrangements with the investment adviser, brokerage services, or other offset arrangements, if applicable, and do not represent the amount paid by the class during periods when reimbursements, waivers or reductions occur.
KAnnualized.
LAmount does not include the portfolio activity of any underlying mutual funds or exchange-traded funds (ETFs).
MPortfolio turnover rate excludes securities received or delivered in-kind.
| Fidelity Advisor® Industrials Fund Class I |
| |
| | Six months ended (Unaudited) January 31, 2024 | | Years ended July 31, 2023 | | 2022 | | 2021 | | 2020 | | 2019 |
Selected Per-Share Data | | | | | | | | | | | | |
| Net asset value, beginning of period | $ | 42.55 | $ | 36.95 | $ | 48.64 | $ | 35.97 | $ | 41.20 | $ | 44.85 |
| Income from Investment Operations | | | | | | | | | | | | |
Net investment income (loss) A,B | | .09 C | | .05 D | | (.03) | | (.06) | | .29 E | | .37 |
| Net realized and unrealized gain (loss) | | 2.39 | | 6.77 | | (2.84) | | 12.97 | | (2.60) | | (.02) |
| Total from investment operations | | 2.48 | | 6.82 | | (2.87) | | 12.91 | | (2.31) | | .35 |
| Distributions from net investment income | | - | | (.06) | | - | | - | | (.35) | | (.30) |
| Distributions from net realized gain | | (3.39) | | (1.16) | | (8.82) | | (.24) | | (2.57) | | (3.70) |
| Total distributions | | (3.39) | | (1.22) | | (8.82) | | (.24) | | (2.92) | | (4.00) |
| Net asset value, end of period | $ | 41.64 | $ | 42.55 | $ | 36.95 | $ | 48.64 | $ | 35.97 | $ | 41.20 |
Total Return F,G | | 5.86% | | 19.02% | | (7.55)% | | 35.98% | | (6.32)% | | 2.31% |
Ratios to Average Net Assets B,H,I | | | | | | | | | | | | |
| Expenses before reductions | | .77% J | | .76% | | .75% | | .76% | | .78% | | .78% |
| Expenses net of fee waivers, if any | | .76% J | | .76% | | .75% | | .76% | | .78% | | .77% |
| Expenses net of all reductions | | .76% J | | .76% | | .75% | | .74% | | .76% | | .77% |
| Net investment income (loss) | | .32% C,J | | .14% D | | (.08)% | | (.14)% | | .76% E | | .90% |
| Supplemental Data | | | | | | | | | | | | |
| Net assets, end of period (000 omitted) | $ | 128,725 | $ | 140,764 | $ | 145,849 | $ | 248,090 | $ | 123,603 | $ | 219,218 |
Portfolio turnover rate K | | 33% J,L | | 189% L | | 106% | | 205% | | 219% L | | 125% |
ACalculated based on average shares outstanding during the period.
BNet investment income (loss) is affected by the timing of the declaration of dividends by any underlying mutual funds or exchange-traded funds (ETFs). Net investment income (loss) of any mutual funds or ETFs is not included in the Fund's net investment income (loss) ratio.
CNet investment income per share reflects one or more large, non-recurring dividend(s) which amounted to $.06 per share. Such dividends are not annualized in the ratio of net investment income (loss) to average net assets. Excluding such non-recurring dividend(s) the ratio of net investment income (loss) to average net assets would have been .19%.
DNet investment income per share reflects one or more large, non-recurring dividend(s) which amounted to $.05 per share. Excluding such non-recurring dividend(s), the ratio of net investment income (loss) to average net assets would have been .02%.
ENet investment income per share reflects one or more large, non-recurring dividend(s) which amounted to $.08 per share. Excluding such non-recurring dividend(s), the ratio of net investment income (loss) to average net assets would have been .56%.
FTotal returns for periods of less than one year are not annualized.
GTotal returns would have been lower if certain expenses had not been reduced during the applicable periods shown.
HFees and expenses of any underlying mutual funds or exchange-traded funds (ETFs) are not included in the Fund's expense ratio. The Fund indirectly bears its proportionate share of these expenses. For additional expense information related to investments in Fidelity Central Funds, please refer to the "Investments in Fidelity Central Funds" note found in the Notes to Financial Statements section of the most recent Annual or Semi-Annual report.
IExpense ratios reflect operating expenses of the class. Expenses before reductions do not reflect amounts reimbursed, waived, or reduced through arrangements with the investment adviser, brokerage services, or other offset arrangements, if applicable, and do not represent the amount paid by the class during periods when reimbursements, waivers or reductions occur.
JAnnualized.
KAmount does not include the portfolio activity of any underlying mutual funds or exchange-traded funds (ETFs).
LPortfolio turnover rate excludes securities received or delivered in-kind.
| Fidelity Advisor® Industrials Fund Class Z |
| |
| | Six months ended (Unaudited) January 31, 2024 | | Years ended July 31, 2023 | | 2022 | | 2021 | | 2020 | | 2019 A |
Selected Per-Share Data | | | | | | | | | | | | |
| Net asset value, beginning of period | $ | 42.52 | $ | 36.91 | $ | 48.61 | $ | 35.90 | $ | 41.15 | $ | 46.84 |
| Income from Investment Operations | | | | | | | | | | | | |
Net investment income (loss) B,C | | .12 D | | .10 E | | .02 | | - F | | .34 G | | .34 |
| Net realized and unrealized gain (loss) | | 2.38 | | 6.75 | | (2.83) | | 12.95 | | (2.60) | | (1.94) |
| Total from investment operations | | 2.50 | | 6.85 | | (2.81) | | 12.95 | | (2.26) | | (1.60) |
| Distributions from net investment income | | - | | (.08) | | - | | - | | (.42) | | (.39) |
| Distributions from net realized gain | | (3.40) | | (1.16) | | (8.89) | | (.24) | | (2.57) | | (3.70) |
| Total distributions | | (3.40) | | (1.24) | | (8.89) | | (.24) | | (2.99) | | (4.09) |
| Net asset value, end of period | $ | 41.62 | $ | 42.52 | $ | 36.91 | $ | 48.61 | $ | 35.90 | $ | 41.15 |
Total Return H,I | | 5.92% | | 19.14% | | (7.42)% | | 36.16% | | (6.21)% | | (1.92)% |
Ratios to Average Net Assets C,J,K | | | | | | | | | | | | |
| Expenses before reductions | | .64% L | | .64% | | .63% | | .64% | | .65% | | .64% L |
| Expenses net of fee waivers, if any | | .63% L | | .63% | | .62% | | .64% | | .65% | | .64% L |
| Expenses net of all reductions | | .63% L | | .63% | | .62% | | .62% | | .63% | | .64% L |
| Net investment income (loss) | | .45% D,L | | .26% E | | .04% | | (.01)% | | .89% G | | 1.04% L |
| Supplemental Data | | | | | | | | | | | | |
| Net assets, end of period (000 omitted) | $ | 36,340 | $ | 104,120 | $ | 23,974 | $ | 50,167 | $ | 29,168 | $ | 11,077 |
Portfolio turnover rate M | | 33% L,N | | 189% N | | 106% | | 205% | | 219% N | | 125% |
AFor the period October 2, 2018 (commencement of sale of shares) through July 31, 2019.
BCalculated based on average shares outstanding during the period.
CNet investment income (loss) is affected by the timing of the declaration of dividends by any underlying mutual funds or exchange-traded funds (ETFs). Net investment income (loss) of any mutual funds or ETFs is not included in the Fund's net investment income (loss) ratio.
DNet investment income per share reflects one or more large, non-recurring dividend(s) which amounted to $.06 per share. Such dividends are not annualized in the ratio of net investment income (loss) to average net assets. Excluding such non-recurring dividend(s) the ratio of net investment income (loss) to average net assets would have been .32%.
ENet investment income per share reflects one or more large, non-recurring dividend(s) which amounted to $.05 per share. Excluding such non-recurring dividend(s), the ratio of net investment income (loss) to average net assets would have been .14%.
FAmount represents less than $.005 per share.
GNet investment income per share reflects one or more large, non-recurring dividend(s) which amounted to $.08 per share. Excluding such non-recurring dividend(s), the ratio of net investment income (loss) to average net assets would have been .69%.
HTotal returns for periods of less than one year are not annualized.
ITotal returns would have been lower if certain expenses had not been reduced during the applicable periods shown.
JFees and expenses of any underlying mutual funds or exchange-traded funds (ETFs) are not included in the Fund's expense ratio. The Fund indirectly bears its proportionate share of these expenses. For additional expense information related to investments in Fidelity Central Funds, please refer to the "Investments in Fidelity Central Funds" note found in the Notes to Financial Statements section of the most recent Annual or Semi-Annual report.
KExpense ratios reflect operating expenses of the class. Expenses before reductions do not reflect amounts reimbursed, waived, or reduced through arrangements with the investment adviser, brokerage services, or other offset arrangements, if applicable, and do not represent the amount paid by the class during periods when reimbursements, waivers or reductions occur.
LAnnualized.
MAmount does not include the portfolio activity of any underlying mutual funds or exchange-traded funds (ETFs).
NPortfolio turnover rate excludes securities received or delivered in-kind.
Top Holdings (% of Fund's net assets) |
| |
| NVIDIA Corp. | 24.8 | |
| NXP Semiconductors NV | 7.1 | |
| ON Semiconductor Corp. | 6.8 | |
| Marvell Technology, Inc. | 5.6 | |
| ASML Holding NV (depository receipt) | 5.1 | |
| Micron Technology, Inc. | 5.0 | |
| Taiwan Semiconductor Manufacturing Co. Ltd. sponsored ADR | 4.9 | |
| Broadcom, Inc. | 4.9 | |
| Lam Research Corp. | 4.8 | |
| GlobalFoundries, Inc. | 4.6 | |
| | 73.6 | |
| |
| Industries (% of Fund's net assets) |
| |
| Semiconductors & Semiconductor Equipment | 97.5 | |
| Technology Hardware, Storage & Peripherals | 0.1 | |
| Electronic Equipment, Instruments & Components | 0.0 | |
| Financial Services | 0.0 | |
| Metals & Mining | 0.0 | |
| |
Geographic Diversification (% of Fund's net assets) |
|
* Includes Short-Term investments and Net Other Assets (Liabilities). Percentages are adjusted for the effect of derivatives, if applicable. |
| |
Fidelity Advisor® Semiconductors Fund
Showing Percentage of Net Assets
| Common Stocks - 97.3% |
| | | Shares | Value ($) |
| Electronic Equipment, Instruments & Components - 0.0% | | | |
| Electronic Equipment & Instruments - 0.0% | | | |
| Aeva Technologies, Inc. (a) | | 118,100 | 100,621 |
| Semiconductors & Semiconductor Equipment - 97.3% | | | |
| Semiconductor Materials & Equipment - 15.2% | | | |
| Applied Materials, Inc. | | 56,900 | 9,348,670 |
| ASML Holding NV (depository receipt) | | 100,000 | 86,982,000 |
| Lam Research Corp. | | 100,746 | 83,132,577 |
| Nova Ltd. (a)(b) | | 193,532 | 28,025,369 |
| Teradyne, Inc. | | 558,200 | 53,916,538 |
| | | | 261,405,154 |
| Semiconductors - 82.1% | | | |
| Advanced Micro Devices, Inc. (a) | | 321,774 | 53,958,282 |
| Allegro MicroSystems LLC (a)(b) | | 589,900 | 15,302,006 |
| Broadcom, Inc. | | 70,825 | 83,573,500 |
| Cirrus Logic, Inc. (a) | | 72,428 | 5,591,442 |
| GaN Systems, Inc. (c) | | 226,949 | 22,848 |
| GaN Systems, Inc. (c) | | 226,949 | 2 |
| GlobalFoundries, Inc. (a) | | 1,420,265 | 78,086,170 |
| Impinj, Inc. (a) | | 220,059 | 21,341,322 |
| Lattice Semiconductor Corp. (a) | | 366,129 | 22,282,611 |
| MACOM Technology Solutions Holdings, Inc. (a) | | 276,762 | 23,865,187 |
| Marvell Technology, Inc. | | 1,429,151 | 96,753,523 |
| Microchip Technology, Inc. | | 632,377 | 53,865,873 |
| Micron Technology, Inc. | | 1,004,000 | 86,093,000 |
| Monolithic Power Systems, Inc. | | 71,373 | 43,017,935 |
| NVIDIA Corp. | | 692,027 | 425,783,451 |
| NXP Semiconductors NV | | 582,253 | 122,605,014 |
| ON Semiconductor Corp. (a) | | 1,647,176 | 117,163,629 |
| Qorvo, Inc. (a) | | 261,900 | 26,121,906 |
| Qualcomm, Inc. | | 118,000 | 17,524,180 |
| Silicon Motion Tech Corp. sponsored ADR | | 155,929 | 9,820,408 |
| Synaptics, Inc. (a) | | 210,211 | 22,452,637 |
| Taiwan Semiconductor Manufacturing Co. Ltd. sponsored ADR | | 746,500 | 84,324,640 |
| Wolfspeed, Inc. (a)(b) | | 54,700 | 1,780,485 |
| | | | 1,411,330,051 |
TOTAL SEMICONDUCTORS & SEMICONDUCTOR EQUIPMENT | | | 1,672,735,205 |
| TOTAL COMMON STOCKS (Cost $986,049,465) | | | 1,672,835,826 |
| | | | |
| Convertible Preferred Stocks - 0.3% |
| | | Shares | Value ($) |
| Electronic Equipment, Instruments & Components - 0.0% | | | |
| Electronic Components - 0.0% | | | |
| Menlo Micro, Inc. Series C (a)(c)(d) | | 79,800 | 55,860 |
| Financial Services - 0.0% | | | |
| Diversified Financial Services - 0.0% | | | |
| Akeana Series C (c)(d) | | 11,132 | 142,053 |
| Tenstorrent Holdings, Inc. Series C1 (c)(d) | | 1,740 | 101,581 |
| | | | 243,634 |
| Metals & Mining - 0.0% | | | |
| Precious Metals & Minerals - 0.0% | | | |
| Diamond Foundry, Inc. Series C (a)(c)(d) | | 18,335 | 459,108 |
| Semiconductors & Semiconductor Equipment - 0.2% | | | |
| Semiconductor Materials & Equipment - 0.1% | | | |
| Astera Labs, Inc.: | | | |
| Series A (a)(c)(d) | | 30,452 | 324,923 |
| Series B (a)(c)(d) | | 5,185 | 55,324 |
| Series C (a)(c)(d) | | 19,433 | 207,350 |
| Series D (a)(c)(d) | | 123,852 | 1,321,501 |
| | | | 1,909,098 |
| Semiconductors - 0.1% | | | |
| Alif Semiconductor Series C (a)(c)(d) | | 48,363 | 924,701 |
| Retym, Inc. Series C (c)(d) | | 55,074 | 462,071 |
| SiMa.ai: | | | |
| Series B (a)(c)(d) | | 30,638 | 209,564 |
| Series B1 (a)(c)(d) | | 18,145 | 141,894 |
| | | | 1,738,230 |
TOTAL SEMICONDUCTORS & SEMICONDUCTOR EQUIPMENT | | | 3,647,328 |
| Technology Hardware, Storage & Peripherals - 0.1% | | | |
| Technology Hardware, Storage & Peripherals - 0.1% | | | |
| Lightmatter, Inc.: | | | |
| Series C (c)(d) | | 32,553 | 711,609 |
| Series C2 (c)(d) | | 5,113 | 132,887 |
| | | | 844,496 |
| TOTAL CONVERTIBLE PREFERRED STOCKS (Cost $4,843,326) | | | 5,250,426 |
| | | | |
| Preferred Securities - 0.0% |
| | | Principal Amount (e) | Value ($) |
| Financial Services - 0.0% | | | |
| Diversified Financial Services - 0.0% | | | |
Tenstorrent Holdings, Inc. 5% 11/6/25 (c)(d) (Cost $66,031) | | 66,031 | 70,871 |
| | | | |
| Money Market Funds - 4.7% |
| | | Shares | Value ($) |
| Fidelity Cash Central Fund 5.39% (f) | | 50,827,802 | 50,837,968 |
| Fidelity Securities Lending Cash Central Fund 5.39% (f)(g) | | 28,784,297 | 28,787,175 |
| TOTAL MONEY MARKET FUNDS (Cost $79,625,143) | | | 79,625,143 |
| | | | |
| TOTAL INVESTMENT IN SECURITIES - 102.3% (Cost $1,070,583,965) | 1,757,782,266 |
NET OTHER ASSETS (LIABILITIES) - (2.3)% | (38,735,738) |
| NET ASSETS - 100.0% | 1,719,046,528 |
| | |
Legend
| (b) | Security or a portion of the security is on loan at period end. |
| (d) | Restricted securities (including private placements) - Investment in securities not registered under the Securities Act of 1933 (excluding 144A issues). At the end of the period, the value of restricted securities (excluding 144A issues) amounted to $5,321,297 or 0.3% of net assets. |
| (e) | Amount is stated in United States dollars unless otherwise noted. |
| (f) | Affiliated fund that is generally available only to investment companies and other accounts managed by Fidelity Investments. The rate quoted is the annualized seven-day yield of the fund at period end. A complete unaudited listing of the fund's holdings as of its most recent quarter end is available upon request. In addition, each Fidelity Central Fund's financial statements are available on the SEC's website or upon request. |
| (g) | Investment made with cash collateral received from securities on loan. |
| Additional information on each restricted holding is as follows: |
| Security | Acquisition Date | Acquisition Cost ($) |
| Akeana Series C | 1/23/24 | 142,053 |
| | | |
| Alif Semiconductor Series C | 3/08/22 | 981,698 |
| | | |
| Astera Labs, Inc. Series A | 5/17/22 | 309,682 |
| | | |
| Astera Labs, Inc. Series B | 5/17/22 | 52,729 |
| | | |
| Astera Labs, Inc. Series C | 8/24/21 | 65,330 |
| | | |
| Astera Labs, Inc. Series D | 5/17/22 - 5/27/22 | 1,259,513 |
| | | |
| Diamond Foundry, Inc. Series C | 3/15/21 | 440,040 |
| | | |
| Lightmatter, Inc. Series C | 5/19/23 | 535,718 |
| | | |
| Lightmatter, Inc. Series C2 | 12/18/23 | 132,947 |
| | | |
| Menlo Micro, Inc. Series C | 2/09/22 | 105,775 |
| | | |
| Retym, Inc. Series C | 5/17/23 - 6/20/23 | 428,575 |
| | | |
| SiMa.ai Series B | 5/10/21 | 157,093 |
| | | |
| SiMa.ai Series B1 | 4/25/22 - 10/17/22 | 128,665 |
| | | |
| Tenstorrent Holdings, Inc. Series C1 | 4/23/21 | 103,509 |
| | | |
| Tenstorrent Holdings, Inc. 5% 11/6/25 | 11/06/23 | 66,031 |
| | | |
Affiliated Central Funds
Fiscal year to date information regarding the Fund's investments in Fidelity Central Funds, including the ownership percentage, is presented below.
| Affiliate | Value, beginning of period ($) | Purchases ($) | Sales Proceeds ($) | Dividend Income ($) | Realized Gain (loss) ($) | Change in Unrealized appreciation (depreciation) ($) | Value, end of period ($) | % ownership, end of period |
| Fidelity Cash Central Fund 5.39% | 62,347,605 | 221,254,735 | 232,764,372 | 1,243,547 | - | - | 50,837,968 | 0.1% |
| Fidelity Securities Lending Cash Central Fund 5.39% | 39,629,775 | 118,446,799 | 129,289,399 | 100,835 | - | - | 28,787,175 | 0.1% |
| Total | 101,977,380 | 339,701,534 | 362,053,771 | 1,344,382 | - | - | 79,625,143 | |
| | | | | | | | | |
Amounts in the dividend income column in the above table include any capital gain distributions from underlying funds, which are presented in the corresponding line item in the Statement of Operations, if applicable.
Amounts in the dividend income column for Fidelity Securities Lending Cash Central Fund represents the income earned on investing cash collateral, less rebates paid to borrowers and any lending agent fees associated with the loan, plus any premium payments received for lending certain types of securities.
Amounts included in the purchases and sales proceeds columns may include in-kind transactions, if applicable.
Investment Valuation
The following is a summary of the inputs used, as of January 31, 2024, involving the Fund's assets and liabilities carried at fair value. The inputs or methodology used for valuing securities may not be an indication of the risk associated with investing in those securities. For more information on valuation inputs, and their aggregation into the levels used below, please refer to the Investment Valuation section in the accompanying Notes to Financial Statements.
| Valuation Inputs at Reporting Date: |
| Description | Total ($) | Level 1 ($) | Level 2 ($) | Level 3 ($) |
Investments in Securities: | | | | |
|
| Common Stocks | 1,672,835,826 | 1,672,812,976 | - | 22,850 |
|
| Convertible Preferred Stocks | 5,250,426 | - | - | 5,250,426 |
|
| Preferred Securities | 70,871 | - | - | 70,871 |
|
| Money Market Funds | 79,625,143 | 79,625,143 | - | - |
| Total Investments in Securities: | 1,757,782,266 | 1,752,438,119 | - | 5,344,147 |
Fidelity Advisor® Semiconductors Fund
| Statement of Assets and Liabilities |
| | | | January 31, 2024 (Unaudited) |
| | | | | |
| Assets | | | | |
| Investment in securities, at value (including securities loaned of $27,825,647) - See accompanying schedule: | | | | |
Unaffiliated issuers (cost $990,958,822) | $ | 1,678,157,123 | | |
Fidelity Central Funds (cost $79,625,143) | | 79,625,143 | | |
| | | | | |
| | | | | |
| Total Investment in Securities (cost $1,070,583,965) | | | $ | 1,757,782,266 |
| Receivable for investments sold | | | | 60,280,008 |
| Receivable for fund shares sold | | | | 4,066,257 |
| Distributions receivable from Fidelity Central Funds | | | | 229,899 |
| Prepaid expenses | | | | 1,470 |
Total assets | | | | 1,822,359,900 |
| Liabilities | | | | |
| Payable for investments purchased | $ | 71,407,451 | | |
| Payable for fund shares redeemed | | 1,822,628 | | |
| Accrued management fee | | 712,053 | | |
| Distribution and service plan fees payable | | 298,035 | | |
| Other affiliated payables | | 253,238 | | |
| Other payables and accrued expenses | | 32,792 | | |
| Collateral on securities loaned | | 28,787,175 | | |
| Total Liabilities | | | | 103,313,372 |
| Net Assets | | | $ | 1,719,046,528 |
| Net Assets consist of: | | | | |
| Paid in capital | | | $ | 1,029,599,582 |
| Total accumulated earnings (loss) | | | | 689,446,946 |
| Net Assets | | | $ | 1,719,046,528 |
| | | | | |
| Net Asset Value and Maximum Offering Price | | | | |
| Class A : | | | | |
Net Asset Value and redemption price per share ($688,481,127 ÷ 10,760,941 shares)(a) | | | $ | 63.98 |
| Maximum offering price per share (100/94.25 of $63.98) | | | $ | 67.88 |
| Class M : | | | | |
Net Asset Value and redemption price per share ($110,063,122 ÷ 1,841,727 shares)(a) | | | $ | 59.76 |
| Maximum offering price per share (100/96.50 of $59.76) | | | $ | 61.93 |
| Class C : | | | | |
Net Asset Value and offering price per share ($146,824,065 ÷ 2,864,122 shares)(a) | | | $ | 51.26 |
| Class I : | | | | |
Net Asset Value, offering price and redemption price per share ($649,339,125 ÷ 9,388,723 shares) | | | $ | 69.16 |
| Class Z : | | | | |
Net Asset Value, offering price and redemption price per share ($124,339,089 ÷ 1,794,504 shares) | | | $ | 69.29 |
(a)Redemption price per share is equal to net asset value less any applicable contingent deferred sales charge. |
| Statement of Operations |
| | | | Six months ended January 31, 2024 (Unaudited) |
| Investment Income | | | | |
| Dividends | | | $ | 4,200,563 |
| Income from Fidelity Central Funds (including $100,835 from security lending) | | | | 1,344,382 |
| Total Income | | | | 5,544,945 |
| Expenses | | | | |
| Management fee | $ | 3,727,766 | | |
| Transfer agent fees | | 1,150,641 | | |
| Distribution and service plan fees | | 1,570,307 | | |
| Accounting fees | | 201,003 | | |
| Custodian fees and expenses | | 10,712 | | |
| Independent trustees' fees and expenses | | 3,908 | | |
| Registration fees | | 114,588 | | |
| Audit | | 25,066 | | |
| Legal | | 1,225 | | |
| Miscellaneous | | 2,650 | | |
| Total expenses before reductions | | 6,807,866 | | |
| Expense reductions | | (61,534) | | |
| Total expenses after reductions | | | | 6,746,332 |
| Net Investment income (loss) | | | | (1,201,387) |
| Realized and Unrealized Gain (Loss) | | | | |
| Net realized gain (loss) on: | | | | |
| Investment Securities: | | | | |
| Unaffiliated issuers | | 9,852,951 | | |
| Total net realized gain (loss) | | | | 9,852,951 |
| Change in net unrealized appreciation (depreciation) on investment securities | | | | 104,902,573 |
| Net gain (loss) | | | | 114,755,524 |
| Net increase (decrease) in net assets resulting from operations | | | $ | 113,554,137 |
| Statement of Changes in Net Assets |
| |
| | Six months ended January 31, 2024 (Unaudited) | | Year ended July 31, 2023 |
| Increase (Decrease) in Net Assets | | | | |
| Operations | | | | |
| Net investment income (loss) | $ | (1,201,387) | $ | (649,806) |
| Net realized gain (loss) | | 9,852,951 | | 49,397,259 |
| Change in net unrealized appreciation (depreciation) | | 104,902,573 | | 374,257,020 |
| Net increase (decrease) in net assets resulting from operations | | 113,554,137 | | 423,004,473 |
| Distributions to shareholders | | (51,831,814) | | (22,158,679) |
| | | | | |
| Share transactions - net increase (decrease) | | 225,587,106 | | 216,742,474 |
| Total increase (decrease) in net assets | | 287,309,429 | | 617,588,268 |
| | | | | |
| Net Assets | | | | |
| Beginning of period | | 1,431,737,099 | | 814,148,831 |
| End of period | $ | 1,719,046,528 | $ | 1,431,737,099 |
| | | | | |
| | | | | |
Financial Highlights
| Fidelity Advisor® Semiconductors Fund Class A |
| |
| | Six months ended (Unaudited) January 31, 2024 | | Years ended July 31, 2023 | | 2022 | | 2021 | | 2020 | | 2019 |
Selected Per-Share Data | | | | | | | | | | | | |
| Net asset value, beginning of period | $ | 62.13 | $ | 42.85 | $ | 46.29 | $ | 29.79 | $ | 23.03 | $ | 25.06 |
| Income from Investment Operations | | | | | | | | | | | | |
Net investment income (loss) A,B | | (.06) | | (.05) | | (.13) | | (.08) | | .14 | | .15 |
| Net realized and unrealized gain (loss) | | 3.98 | | 20.53 | | (.83) | | 18.29 | | 6.90 | | 1.25 |
| Total from investment operations | | 3.92 | | 20.48 | | (.96) | | 18.21 | | 7.04 | | 1.40 |
| Distributions from net investment income | | - | | - | | - | | (.04) | | (.07) | | (.10) |
| Distributions from net realized gain | | (2.07) | | (1.20) | | (2.48) | | (1.67) | | (.20) | | (3.33) |
| Total distributions | | (2.07) | | (1.20) | | (2.48) | | (1.71) | | (.28) C | | (3.43) |
| Net asset value, end of period | $ | 63.98 | $ | 62.13 | $ | 42.85 | $ | 46.29 | $ | 29.79 | $ | 23.03 |
Total Return D,E,F | | 6.51% | | 49.31% | | (3.21)% | | 62.45% | | 30.65% | | 10.18% |
Ratios to Average Net Assets B,G,H | | | | | | | | | | | | |
| Expenses before reductions | | 1.00% I | | 1.01% | | 1.01% | | 1.04% | | 1.10% | | 1.12% |
| Expenses net of fee waivers, if any | | .99% I | | 1.00% | | 1.01% | | 1.04% | | 1.09% | | 1.11% |
| Expenses net of all reductions | | .99% I | | 1.00% | | 1.01% | | 1.03% | | 1.08% | | 1.11% |
| Net investment income (loss) | | (.21)% I | | (.10)% | | (.27)% | | (.21)% | | .53% | | .70% |
| Supplemental Data | | | | | | | | | | | | |
| Net assets, end of period (000 omitted) | $ | 688,481 | $ | 581,690 | $ | 319,402 | $ | 279,755 | $ | 140,072 | $ | 98,459 |
Portfolio turnover rate J | | 27% I | | 40% | | 32% | | 41% | | 136% | | 110% |
ACalculated based on average shares outstanding during the period.
BNet investment income (loss) is affected by the timing of the declaration of dividends by any underlying mutual funds or exchange-traded funds (ETFs). Net investment income (loss) of any mutual funds or ETFs is not included in the Fund's net investment income (loss) ratio.
CTotal distributions per share do not sum due to rounding.
DTotal returns for periods of less than one year are not annualized.
ETotal returns would have been lower if certain expenses had not been reduced during the applicable periods shown.
FTotal returns do not include the effect of the sales charges.
GFees and expenses of any underlying mutual funds or exchange-traded funds (ETFs) are not included in the Fund's expense ratio. The Fund indirectly bears its proportionate share of these expenses. For additional expense information related to investments in Fidelity Central Funds, please refer to the "Investments in Fidelity Central Funds" note found in the Notes to Financial Statements section of the most recent Annual or Semi-Annual report.
HExpense ratios reflect operating expenses of the class. Expenses before reductions do not reflect amounts reimbursed, waived, or reduced through arrangements with the investment adviser, brokerage services, or other offset arrangements, if applicable, and do not represent the amount paid by the class during periods when reimbursements, waivers or reductions occur.
IAnnualized.
JAmount does not include the portfolio activity of any underlying mutual funds or exchange-traded funds (ETFs).
| Fidelity Advisor® Semiconductors Fund Class M |
| |
| | Six months ended (Unaudited) January 31, 2024 | | Years ended July 31, 2023 | | 2022 | | 2021 | | 2020 | | 2019 |
Selected Per-Share Data | | | | | | | | | | | | |
| Net asset value, beginning of period | $ | 58.24 | $ | 40.34 | $ | 43.75 | $ | 28.25 | $ | 21.89 | $ | 24.04 |
| Income from Investment Operations | | | | | | | | | | | | |
Net investment income (loss) A,B | | (.12) | | (.15) | | (.23) | | (.17) | | .06 | | .08 |
| Net realized and unrealized gain (loss) | | 3.71 | | 19.25 | | (.76) | | 17.31 | | 6.55 | | 1.16 |
| Total from investment operations | | 3.59 | | 19.10 | | (.99) | | 17.14 | | 6.61 | | 1.24 |
| Distributions from net investment income | | - | | - | | - | | - | | (.05) | | (.06) |
| Distributions from net realized gain | | (2.07) | | (1.20) | | (2.42) | | (1.64) | | (.20) | | (3.33) |
| Total distributions | | (2.07) | | (1.20) | | (2.42) | | (1.64) | | (.25) | | (3.39) |
| Net asset value, end of period | $ | 59.76 | $ | 58.24 | $ | 40.34 | $ | 43.75 | $ | 28.25 | $ | 21.89 |
Total Return C,D,E | | 6.37% | | 48.95% | | (3.43)% | | 61.98% | | 30.28% | | 9.84% |
Ratios to Average Net Assets B,F,G | | | | | | | | | | | | |
| Expenses before reductions | | 1.23% H | | 1.25% | | 1.26% | | 1.30% | | 1.38% | | 1.44% |
| Expenses net of fee waivers, if any | | 1.22% H | | 1.25% | | 1.25% | | 1.30% | | 1.38% | | 1.43% |
| Expenses net of all reductions | | 1.22% H | | 1.25% | | 1.25% | | 1.29% | | 1.37% | | 1.43% |
| Net investment income (loss) | | (.45)% H | | (.35)% | | (.52)% | | (.47)% | | .24% | | .38% |
| Supplemental Data | | | | | | | | | | | | |
| Net assets, end of period (000 omitted) | $ | 110,063 | $ | 94,006 | $ | 48,499 | $ | 49,963 | $ | 29,262 | $ | 22,587 |
Portfolio turnover rate I | | 27% H | | 40% | | 32% | | 41% | | 136% | | 110% |
ACalculated based on average shares outstanding during the period.
BNet investment income (loss) is affected by the timing of the declaration of dividends by any underlying mutual funds or exchange-traded funds (ETFs). Net investment income (loss) of any mutual funds or ETFs is not included in the Fund's net investment income (loss) ratio.
CTotal returns for periods of less than one year are not annualized.
DTotal returns would have been lower if certain expenses had not been reduced during the applicable periods shown.
ETotal returns do not include the effect of the sales charges.
FFees and expenses of any underlying mutual funds or exchange-traded funds (ETFs) are not included in the Fund's expense ratio. The Fund indirectly bears its proportionate share of these expenses. For additional expense information related to investments in Fidelity Central Funds, please refer to the "Investments in Fidelity Central Funds" note found in the Notes to Financial Statements section of the most recent Annual or Semi-Annual report.
GExpense ratios reflect operating expenses of the class. Expenses before reductions do not reflect amounts reimbursed, waived, or reduced through arrangements with the investment adviser, brokerage services, or other offset arrangements, if applicable, and do not represent the amount paid by the class during periods when reimbursements, waivers or reductions occur.
HAnnualized.
IAmount does not include the portfolio activity of any underlying mutual funds or exchange-traded funds (ETFs).
| Fidelity Advisor® Semiconductors Fund Class C |
| |
| | Six months ended (Unaudited) January 31, 2024 | | Years ended July 31, 2023 | | 2022 | | 2021 | | 2020 | | 2019 |
Selected Per-Share Data | | | | | | | | | | | | |
| Net asset value, beginning of period | $ | 50.38 | $ | 35.24 | $ | 38.59 | $ | 25.18 | $ | 19.59 | $ | 21.88 |
| Income from Investment Operations | | | | | | | | | | | | |
Net investment income (loss) A,B | | (.23) | | (.31) | | (.40) | | (.31) | | (.05) | | (.01) |
| Net realized and unrealized gain (loss) | | 3.18 | | 16.65 | | (.61) | | 15.35 | | 5.86 | | .98 |
| Total from investment operations | | 2.95 | | 16.34 | | (1.01) | | 15.04 | | 5.81 | | .97 |
| Distributions from net investment income | | - | | - | | - | | - | | (.01) | | - |
| Distributions from net realized gain | | (2.07) | | (1.20) | | (2.34) | | (1.63) | | (.20) | | (3.26) |
| Total distributions | | (2.07) | | (1.20) | | (2.34) | | (1.63) | | (.22) C | | (3.26) |
| Net asset value, end of period | $ | 51.26 | $ | 50.38 | $ | 35.24 | $ | 38.59 | $ | 25.18 | $ | 19.59 |
Total Return D,E,F | | 6.09% | | 48.18% | | (3.93)% | | 61.17% | | 29.73% | | 9.33% |
Ratios to Average Net Assets B,G,H | | | | | | | | | | | | |
| Expenses before reductions | | 1.75% I | | 1.76% | | 1.76% | | 1.79% | | 1.85% | | 1.87% |
| Expenses net of fee waivers, if any | | 1.74% I | | 1.76% | | 1.76% | | 1.79% | | 1.85% | | 1.87% |
| Expenses net of all reductions | | 1.74% I | | 1.76% | | 1.76% | | 1.79% | | 1.83% | | 1.87% |
| Net investment income (loss) | | (.97)% I | | (.86)% | | (1.03)% | | (.97)% | | (.23)% | | (.06)% |
| Supplemental Data | | | | | | | | | | | | |
| Net assets, end of period (000 omitted) | $ | 146,824 | $ | 129,390 | $ | 88,592 | $ | 86,217 | $ | 57,320 | $ | 45,659 |
Portfolio turnover rate J | | 27% I | | 40% | | 32% | | 41% | | 136% | | 110% |
ACalculated based on average shares outstanding during the period.
BNet investment income (loss) is affected by the timing of the declaration of dividends by any underlying mutual funds or exchange-traded funds (ETFs). Net investment income (loss) of any mutual funds or ETFs is not included in the Fund's net investment income (loss) ratio.
CTotal distributions per share do not sum due to rounding.
DTotal returns for periods of less than one year are not annualized.
ETotal returns would have been lower if certain expenses had not been reduced during the applicable periods shown.
FTotal returns do not include the effect of the contingent deferred sales charge.
GFees and expenses of any underlying mutual funds or exchange-traded funds (ETFs) are not included in the Fund's expense ratio. The Fund indirectly bears its proportionate share of these expenses. For additional expense information related to investments in Fidelity Central Funds, please refer to the "Investments in Fidelity Central Funds" note found in the Notes to Financial Statements section of the most recent Annual or Semi-Annual report.
HExpense ratios reflect operating expenses of the class. Expenses before reductions do not reflect amounts reimbursed, waived, or reduced through arrangements with the investment adviser, brokerage services, or other offset arrangements, if applicable, and do not represent the amount paid by the class during periods when reimbursements, waivers or reductions occur.
IAnnualized.
JAmount does not include the portfolio activity of any underlying mutual funds or exchange-traded funds (ETFs).
| Fidelity Advisor® Semiconductors Fund Class I |
| |
| | Six months ended (Unaudited) January 31, 2024 | | Years ended July 31, 2023 | | 2022 | | 2021 | | 2020 | | 2019 |
Selected Per-Share Data | | | | | | | | | | | | |
| Net asset value, beginning of period | $ | 66.91 | $ | 45.93 | $ | 49.39 | $ | 31.68 | $ | 24.42 | $ | 26.33 |
| Income from Investment Operations | | | | | | | | | | | | |
Net investment income (loss) A,B | | .01 | | .08 | | (.01) | | .03 | | .22 | | .23 |
| Net realized and unrealized gain (loss) | | 4.31 | | 22.10 | | (.92) | | 19.47 | | 7.34 | | 1.35 |
| Total from investment operations | | 4.32 | | 22.18 | | (.93) | | 19.50 | | 7.56 | | 1.58 |
| Distributions from net investment income | | - | | - | | - | | (.12) | | (.10) | | (.16) |
| Distributions from net realized gain | | (2.07) | | (1.20) | | (2.53) | | (1.67) | | (.20) | | (3.33) |
| Total distributions | | (2.07) | | (1.20) | | (2.53) | | (1.79) | | (.30) | | (3.49) |
| Net asset value, end of period | $ | 69.16 | $ | 66.91 | $ | 45.93 | $ | 49.39 | $ | 31.68 | $ | 24.42 |
Total Return C,D | | 6.64% | | 49.71% | | (2.96)% | | 62.86% | | 31.08% | | 10.46% |
Ratios to Average Net Assets B,E,F | | | | | | | | | | | | |
| Expenses before reductions | | .74% G | | .74% | | .75% | | .77% | | .81% | | .83% |
| Expenses net of fee waivers, if any | | .73% G | | .74% | | .74% | | .77% | | .81% | | .82% |
| Expenses net of all reductions | | .73% G | | .74% | | .74% | | .76% | | .79% | | .82% |
| Net investment income (loss) | | .04% G | | .16% | | (.01)% | | .06% | | .81% | | .98% |
| Supplemental Data | | | | | | | | | | | | |
| Net assets, end of period (000 omitted) | $ | 649,339 | $ | 530,775 | $ | 309,873 | $ | 257,502 | $ | 126,660 | $ | 98,451 |
Portfolio turnover rate H | | 27% G | | 40% | | 32% | | 41% | | 136% | | 110% |
ACalculated based on average shares outstanding during the period.
BNet investment income (loss) is affected by the timing of the declaration of dividends by any underlying mutual funds or exchange-traded funds (ETFs). Net investment income (loss) of any mutual funds or ETFs is not included in the Fund's net investment income (loss) ratio.
CTotal returns for periods of less than one year are not annualized.
DTotal returns would have been lower if certain expenses had not been reduced during the applicable periods shown.
EFees and expenses of any underlying mutual funds or exchange-traded funds (ETFs) are not included in the Fund's expense ratio. The Fund indirectly bears its proportionate share of these expenses. For additional expense information related to investments in Fidelity Central Funds, please refer to the "Investments in Fidelity Central Funds" note found in the Notes to Financial Statements section of the most recent Annual or Semi-Annual report.
FExpense ratios reflect operating expenses of the class. Expenses before reductions do not reflect amounts reimbursed, waived, or reduced through arrangements with the investment adviser, brokerage services, or other offset arrangements, if applicable, and do not represent the amount paid by the class during periods when reimbursements, waivers or reductions occur.
GAnnualized.
HAmount does not include the portfolio activity of any underlying mutual funds or exchange-traded funds (ETFs).
| Fidelity Advisor® Semiconductors Fund Class Z |
| |
| | Six months ended (Unaudited) January 31, 2024 | | Years ended July 31, 2023 | | 2022 | | 2021 | | 2020 | | 2019 A |
Selected Per-Share Data | | | | | | | | | | | | |
| Net asset value, beginning of period | $ | 66.99 | $ | 45.93 | $ | 49.35 | $ | 31.65 | $ | 24.38 | $ | 26.00 |
| Income from Investment Operations | | | | | | | | | | | | |
Net investment income (loss) B,C | | .05 | | .14 | | .06 | | .08 | | .26 | | .17 |
| Net realized and unrealized gain (loss) | | 4.32 | | 22.12 | | (.92) | | 19.45 | | 7.33 | | 1.76 |
| Total from investment operations | | 4.37 | | 22.26 | | (.86) | | 19.53 | | 7.59 | | 1.93 |
| Distributions from net investment income | | - | | - | | - | | (.16) | | (.11) | | (.22) |
| Distributions from net realized gain | | (2.07) | | (1.20) | | (2.56) | | (1.67) | | (.20) | | (3.33) |
| Total distributions | | (2.07) | | (1.20) | | (2.56) | | (1.83) | | (.32) D | | (3.55) |
| Net asset value, end of period | $ | 69.29 | $ | 66.99 | $ | 45.93 | $ | 49.35 | $ | 31.65 | $ | 24.38 |
Total Return E,F | | 6.71% | | 49.89% | | (2.83)% | | 63.06% | | 31.22% | | 12.03% |
Ratios to Average Net Assets C,G,H | | | | | | | | | | | | |
| Expenses before reductions | | .62% I | | .62% | | .62% | | .64% | | .68% | | .69% I |
| Expenses net of fee waivers, if any | | .61% I | | .62% | | .62% | | .64% | | .68% | | .69% I |
| Expenses net of all reductions | | .61% I | | .62% | | .62% | | .64% | | .66% | | .68% I |
| Net investment income (loss) | | .17% I | | .28% | | .11% | | .18% | | .94% | | .91% I |
| Supplemental Data | | | | | | | | | | | | |
| Net assets, end of period (000 omitted) | $ | 124,339 | $ | 95,876 | $ | 47,782 | $ | 26,856 | $ | 7,920 | $ | 2,629 |
Portfolio turnover rate J | | 27% I | | 40% | | 32% | | 41% | | 136% | | 110% |
AFor the period October 2, 2018 (commencement of sale of shares) through July 31, 2019.
BCalculated based on average shares outstanding during the period.
CNet investment income (loss) is affected by the timing of the declaration of dividends by any underlying mutual funds or exchange-traded funds (ETFs). Net investment income (loss) of any mutual funds or ETFs is not included in the Fund's net investment income (loss) ratio.
DTotal distributions per share do not sum due to rounding.
ETotal returns for periods of less than one year are not annualized.
FTotal returns would have been lower if certain expenses had not been reduced during the applicable periods shown.
GFees and expenses of any underlying mutual funds or exchange-traded funds (ETFs) are not included in the Fund's expense ratio. The Fund indirectly bears its proportionate share of these expenses. For additional expense information related to investments in Fidelity Central Funds, please refer to the "Investments in Fidelity Central Funds" note found in the Notes to Financial Statements section of the most recent Annual or Semi-Annual report.
HExpense ratios reflect operating expenses of the class. Expenses before reductions do not reflect amounts reimbursed, waived, or reduced through arrangements with the investment adviser, brokerage services, or other offset arrangements, if applicable, and do not represent the amount paid by the class during periods when reimbursements, waivers or reductions occur.
IAnnualized.
JAmount does not include the portfolio activity of any underlying mutual funds or exchange-traded funds (ETFs).
Top Holdings (% of Fund's net assets) |
| |
| Microsoft Corp. | 19.5 | |
| NVIDIA Corp. | 14.4 | |
| Apple, Inc. | 14.3 | |
| Marvell Technology, Inc. | 4.8 | |
| Salesforce, Inc. | 4.3 | |
| NXP Semiconductors NV | 4.3 | |
| ServiceNow, Inc. | 4.3 | |
| ON Semiconductor Corp. | 3.7 | |
| Cisco Systems, Inc. | 3.7 | |
| Okta, Inc. | 2.9 | |
| | 76.2 | |
| |
| Industries (% of Fund's net assets) |
| |
| Semiconductors & Semiconductor Equipment | 34.3 | |
| Software | 32.6 | |
| Technology Hardware, Storage & Peripherals | 14.8 | |
| IT Services | 5.0 | |
| Communications Equipment | 3.7 | |
| Ground Transportation | 2.6 | |
| Interactive Media & Services | 1.2 | |
| Hotels, Restaurants & Leisure | 1.1 | |
| Entertainment | 0.9 | |
| Electronic Equipment, Instruments & Components | 0.6 | |
| Aerospace & Defense | 0.2 | |
| Broadline Retail | 0.1 | |
| Chemicals | 0.1 | |
| Financial Services | 0.1 | |
| Metals & Mining | 0.1 | |
| Consumer Staples Distribution & Retail | 0.0 | |
| Life Sciences Tools & Services | 0.0 | |
| Pharmaceuticals | 0.0 | |
| |
Fidelity Advisor® Technology Fund
Showing Percentage of Net Assets
| Common Stocks - 95.8% |
| | | Shares | Value ($) |
| Chemicals - 0.1% | | | |
| Commodity Chemicals - 0.1% | | | |
| LG Chemical Ltd. | | 9,410 | 3,051,557 |
| Communications Equipment - 3.7% | | | |
| Communications Equipment - 3.7% | | | |
| Cisco Systems, Inc. | | 3,937,800 | 197,598,804 |
| Consumer Staples Distribution & Retail - 0.0% | | | |
| Food Retail - 0.0% | | | |
| Maplebear, Inc. (unlisted) (i) | | 29,110 | 676,706 |
| Electronic Equipment, Instruments & Components - 0.4% | | | |
| Electronic Equipment & Instruments - 0.4% | | | |
| Keysight Technologies, Inc. (a) | | 126,300 | 19,356,738 |
| Entertainment - 0.9% | | | |
| Movies & Entertainment - 0.9% | | | |
| Netflix, Inc. (a) | | 89,766 | 50,637,898 |
| Ground Transportation - 2.6% | | | |
| Cargo Ground Transportation - 0.0% | | | |
| TuSimple Holdings, Inc. (a)(b) | | 86,300 | 19,884 |
| Passenger Ground Transportation - 2.6% | | | |
| Lyft, Inc. (a) | | 713,642 | 8,913,389 |
| Uber Technologies, Inc. (a) | | 1,958,764 | 127,848,526 |
| | | | 136,761,915 |
TOTAL GROUND TRANSPORTATION | | | 136,781,799 |
| Hotels, Restaurants & Leisure - 1.1% | | | |
| Hotels, Resorts & Cruise Lines - 1.1% | | | |
| Airbnb, Inc. Class A (a) | | 405,500 | 58,448,770 |
| Interactive Media & Services - 0.9% | | | |
| Interactive Media & Services - 0.9% | | | |
| Snap, Inc. Class A (a) | | 3,041,667 | 48,332,089 |
| IT Services - 5.0% | | | |
| Internet Services & Infrastructure - 5.0% | | | |
| MongoDB, Inc. Class A (a) | | 119,242 | 47,758,806 |
| Okta, Inc. (a) | | 1,865,758 | 154,204,899 |
| Shopify, Inc. Class A (a) | | 777,400 | 62,246,418 |
| | | | 264,210,123 |
| Life Sciences Tools & Services - 0.0% | | | |
| Life Sciences Tools & Services - 0.0% | | | |
| Eden Biologics, Inc. (a)(c) | | 387,462 | 0 |
| Pharmaceuticals - 0.0% | | | |
| Pharmaceuticals - 0.0% | | | |
| Chime Biologics Wuhan Co. Ltd. (a)(c) | | 387,462 | 201,802 |
| Semiconductors & Semiconductor Equipment - 34.0% | | | |
| Semiconductor Materials & Equipment - 2.0% | | | |
| ASML Holding NV (Netherlands) | | 53,700 | 46,589,483 |
| Teradyne, Inc. | | 637,400 | 61,566,466 |
| | | | 108,155,949 |
| Semiconductors - 32.0% | | | |
| GlobalFoundries, Inc. (a) | | 2,529,506 | 139,072,240 |
| Marvell Technology, Inc. | | 3,738,260 | 253,080,202 |
| Microchip Technology, Inc. | | 291,600 | 24,838,488 |
| NVIDIA Corp. | | 1,246,000 | 766,626,420 |
| NXP Semiconductors NV | | 1,081,245 | 227,677,760 |
| ON Semiconductor Corp. (a) | | 2,803,200 | 199,391,616 |
| Taiwan Semiconductor Manufacturing Co. Ltd. | | 4,502,000 | 90,142,007 |
| Xsight Labs Ltd. warrants 1/11/34 (a)(c)(d) | | 27,709 | 50,153 |
| | | | 1,700,878,886 |
TOTAL SEMICONDUCTORS & SEMICONDUCTOR EQUIPMENT | | | 1,809,034,835 |
| Software - 32.3% | | | |
| Application Software - 8.5% | | | |
| Bill Holdings, Inc. (a) | | 423,300 | 33,038,565 |
| Convoy, Inc. warrants (a)(c)(d) | | 5,358 | 0 |
| CoreWeave, Inc. (c)(d) | | 23,100 | 7,157,766 |
| Datadog, Inc. Class A (a) | | 401,488 | 49,961,167 |
| Dynatrace, Inc. (a) | | 704,300 | 40,145,100 |
| HashiCorp, Inc. (a) | | 997,579 | 21,807,077 |
| HubSpot, Inc. (a) | | 44,003 | 26,885,833 |
| Intuit, Inc. | | 18,100 | 11,427,073 |
| Manhattan Associates, Inc. (a) | | 136,877 | 33,200,885 |
| Pine Labs Private Ltd. (a)(c)(d) | | 3,660 | 1,281,549 |
| Salesforce, Inc. (a) | | 816,239 | 229,436,621 |
| | | | 454,341,636 |
| Systems Software - 23.8% | | | |
| Microsoft Corp. | | 2,607,500 | 1,036,689,848 |
| ServiceNow, Inc. (a) | | 297,169 | 227,453,153 |
| | | | 1,264,143,001 |
TOTAL SOFTWARE | | | 1,718,484,637 |
| Technology Hardware, Storage & Peripherals - 14.8% | | | |
| Technology Hardware, Storage & Peripherals - 14.8% | | | |
| Apple, Inc. | | 4,125,216 | 760,689,830 |
| Seagate Technology Holdings PLC | | 303,655 | 26,017,160 |
| | | | 786,706,990 |
| TOTAL COMMON STOCKS (Cost $2,496,306,573) | | | 5,093,522,748 |
| | | | |
| Preferred Stocks - 1.5% |
| | | Shares | Value ($) |
| Convertible Preferred Stocks - 1.4% | | | |
| Aerospace & Defense - 0.2% | | | |
| Aerospace & Defense - 0.2% | | | |
| Relativity Space, Inc. Series E (a)(c)(d) | | 482,616 | 10,323,156 |
| | | | |
| Broadline Retail - 0.1% | | | |
| Broadline Retail - 0.1% | | | |
| Meesho Series F (a)(c)(d) | | 46,600 | 2,374,736 |
| | | | |
| Consumer Staples Distribution & Retail - 0.0% | | | |
| Food Retail - 0.0% | | | |
| GoBrands, Inc. Series G (a)(c)(d) | | 14,100 | 646,908 |
| | | | |
| Electronic Equipment, Instruments & Components - 0.2% | | | |
| Electronic Equipment & Instruments - 0.1% | | | |
| Enevate Corp. Series E (a)(c)(d) | | 9,477,386 | 7,961,004 |
| | | | |
| Technology Distributors - 0.1% | | | |
| VAST Data Ltd.: | | | |
| Series A(c)(d) | | 30,141 | 426,495 |
| Series A1(c)(d) | | 74,185 | 1,049,718 |
| Series A2(c)(d) | | 85,337 | 1,207,519 |
| Series B(c)(d) | | 67,904 | 960,842 |
| Series C(c)(d) | | 1,979 | 28,003 |
| Series E(c)(d) | | 64,886 | 918,137 |
| | | | 4,590,714 |
TOTAL ELECTRONIC EQUIPMENT, INSTRUMENTS & COMPONENTS | | | 12,551,718 |
| | | | |
| Financial Services - 0.0% | | | |
| Diversified Financial Services - 0.0% | | | |
| Akeana Series C (c)(d) | | 35,600 | 454,284 |
| Tenstorrent Holdings, Inc. Series C1 (c)(d) | | 12,823 | 748,607 |
| | | | 1,202,891 |
| Hotels, Restaurants & Leisure - 0.0% | | | |
| Casinos & Gaming - 0.0% | | | |
| Discord, Inc. Series I (a)(c)(d) | | 500 | 138,240 |
| | | | |
| Interactive Media & Services - 0.3% | | | |
| Interactive Media & Services - 0.3% | | | |
| ByteDance Ltd. Series E1 (a)(c)(d) | | 26,036 | 5,757,341 |
| Reddit, Inc.: | | | |
| Series D(a)(c)(d) | | 94,300 | 3,052,491 |
| Series E(a)(c)(d) | | 5,300 | 171,561 |
| Series F(a)(c)(d) | | 154,614 | 5,004,855 |
| | | | 13,986,248 |
| Metals & Mining - 0.1% | | | |
| Precious Metals & Minerals - 0.1% | | | |
| Diamond Foundry, Inc. Series C (a)(c)(d) | | 151,757 | 3,799,995 |
| | | | |
| Semiconductors & Semiconductor Equipment - 0.3% | | | |
| Semiconductor Materials & Equipment - 0.2% | | | |
| Astera Labs, Inc.: | | | |
| Series A(a)(c)(d) | | 144,502 | 1,541,836 |
| Series B(a)(c)(d) | | 24,603 | 262,514 |
| Series C(a)(c)(d) | | 135,400 | 1,444,718 |
| Series D(a)(c)(d) | | 590,802 | 6,303,857 |
| | | | 9,552,925 |
| Semiconductors - 0.1% | | | |
| Retym, Inc. Series C (c)(d) | | 139,441 | 1,169,910 |
| SiMa.ai: | | | |
| Series B(a)(c)(d) | | 231,000 | 1,580,040 |
| Series B1(a)(c)(d) | | 100,683 | 787,341 |
| Xsight Labs Ltd.: | | | |
| Series D(a)(c)(d) | | 101,300 | 520,682 |
| Series D1(c)(d) | | 92,364 | 688,112 |
| | | | 4,746,085 |
TOTAL SEMICONDUCTORS & SEMICONDUCTOR EQUIPMENT | | | 14,299,010 |
| | | | |
| Software - 0.2% | | | |
| Application Software - 0.2% | | | |
| Convoy, Inc. Series D (a)(c)(d) | | 81,762 | 1 |
| Databricks, Inc.: | | | |
| Series G(a)(c)(d) | | 37,800 | 2,907,576 |
| Series H(a)(c)(d) | | 99,786 | 7,675,539 |
| Series I(c)(d) | | 1,265 | 97,304 |
| | | | 10,680,420 |
| Technology Hardware, Storage & Peripherals - 0.0% | | | |
| Technology Hardware, Storage & Peripherals - 0.0% | | | |
| Lightmatter, Inc.: | | | |
| Series C(c)(d) | | 82,421 | 1,801,723 |
| Series C2(c)(d) | | 12,946 | 336,467 |
| | | | 2,138,190 |
| TOTAL CONVERTIBLE PREFERRED STOCKS | | | 72,141,512 |
| Nonconvertible Preferred Stocks - 0.1% | | | |
| Software - 0.1% | | | |
| Application Software - 0.1% | | | |
| Pine Labs Private Ltd.: | | | |
| Series 1(a)(c)(d) | | 8,747 | 3,062,762 |
| Series A(a)(c)(d) | | 2,186 | 765,428 |
| Series B(a)(c)(d) | | 2,378 | 832,657 |
| Series B2(a)(c)(d) | | 1,923 | 673,338 |
| Series C(a)(c)(d) | | 3,578 | 1,252,837 |
| Series C1(a)(c)(d) | | 754 | 264,013 |
| Series D(a)(c)(d) | | 806 | 282,221 |
| | | | 7,133,256 |
| TOTAL PREFERRED STOCKS (Cost $85,487,438) | | | 79,274,768 |
| | | | |
| Corporate Bonds - 0.1% |
| | | Principal Amount (e) | Value ($) |
| Convertible Bonds - 0.0% | | | |
| Software - 0.0% | | | |
| Application Software - 0.0% | | | |
| Convoy, Inc. 15% 9/30/26 (c)(d) | | 35,680 | 0 |
| | | | |
| Nonconvertible Bonds - 0.1% | | | |
| Financial Services - 0.1% | | | |
| Diversified Financial Services - 0.1% | | | |
| Ant International Co. Ltd. 3.55% 8/14/24 (c)(d) | | 2,982,393 | 2,986,270 |
| | | | |
| TOTAL CORPORATE BONDS (Cost $3,018,073) | | | 2,986,270 |
| | | | |
| Preferred Securities - 0.0% |
| | | Principal Amount (e) | Value ($) |
| Electronic Equipment, Instruments & Components - 0.0% | | | |
| Electronic Equipment & Instruments - 0.0% | | | |
| Enevate Corp. 6% (c)(d)(f) | | 492,835 | 515,275 |
| Financial Services - 0.0% | | | |
| Diversified Financial Services - 0.0% | | | |
| Tenstorrent Holdings, Inc. 5% 11/6/25 (c)(d) | | 294,497 | 316,085 |
| TOTAL PREFERRED SECURITIES (Cost $787,332) | | | 831,360 |
| | | | |
| Money Market Funds - 2.7% |
| | | Shares | Value ($) |
| Fidelity Cash Central Fund 5.39% (g) | | 141,257,956 | 141,286,208 |
| Fidelity Securities Lending Cash Central Fund 5.39% (g)(h) | | 100 | 100 |
| TOTAL MONEY MARKET FUNDS (Cost $141,286,308) | | | 141,286,308 |
| | | | |
| TOTAL INVESTMENT IN SECURITIES - 100.1% (Cost $2,726,885,724) | 5,317,901,454 |
NET OTHER ASSETS (LIABILITIES) - (0.1)% | (2,805,308) |
| NET ASSETS - 100.0% | 5,315,096,146 |
| | |
Legend
| (b) | Security or a portion of the security is on loan at period end. |
| (d) | Restricted securities (including private placements) - Investment in securities not registered under the Securities Act of 1933 (excluding 144A issues). At the end of the period, the value of restricted securities (excluding 144A issues) amounted to $91,581,866 or 1.7% of net assets. |
| (e) | Amount is stated in United States dollars unless otherwise noted. |
| (f) | Security is perpetual in nature with no stated maturity date. |
| (g) | Affiliated fund that is generally available only to investment companies and other accounts managed by Fidelity Investments. The rate quoted is the annualized seven-day yield of the fund at period end. A complete unaudited listing of the fund's holdings as of its most recent quarter end is available upon request. In addition, each Fidelity Central Fund's financial statements are available on the SEC's website or upon request. |
| (h) | Investment made with cash collateral received from securities on loan. |
| (i) | Equity security is subject to lock-up or market standoff agreement and valued at a discount to the market price of the equivalent equity security. As of period end, the total fair value of equity securities discounted due to contractual sale restrictions is $676,706 and all restrictions are set to expire on or before June 30, 2024. Under normal market conditions, there are no circumstances that could cause the restrictions to lapse. |
| Additional information on each restricted holding is as follows: |
| Security | Acquisition Date | Acquisition Cost ($) |
| Akeana Series C | 1/23/24 | 454,284 |
| | | |
| Ant International Co. Ltd. 3.55% 8/14/24 | 8/14/23 | 2,982,393 |
| | | |
| Astera Labs, Inc. Series A | 5/17/22 | 1,469,513 |
| | | |
| Astera Labs, Inc. Series B | 5/17/22 | 250,200 |
| | | |
| Astera Labs, Inc. Series C | 8/24/21 | 455,188 |
| | | |
| Astera Labs, Inc. Series D | 5/17/22 - 5/27/22 | 6,008,161 |
| | | |
| ByteDance Ltd. Series E1 | 11/18/20 | 2,852,873 |
| | | |
| Convoy, Inc. Series D | 10/30/19 | 1,107,057 |
| | | |
| Convoy, Inc. warrants | 3/24/23 | 0 |
| | | |
| Convoy, Inc. 15% 9/30/26 | 3/24/23 | 35,680 |
| | | |
| CoreWeave, Inc. | 11/29/23 | 7,157,766 |
| | | |
| Databricks, Inc. Series G | 2/01/21 | 2,234,836 |
| | | |
| Databricks, Inc. Series H | 8/31/21 | 7,332,688 |
| | | |
| Databricks, Inc. Series I | 9/14/23 | 92,978 |
| | | |
| Diamond Foundry, Inc. Series C | 3/15/21 | 3,642,168 |
| | | |
| Discord, Inc. Series I | 9/15/21 | 275,312 |
| | | |
| Enevate Corp. Series E | 1/29/21 | 10,507,436 |
| | | |
| Enevate Corp. 6% | 11/02/23 | 492,835 |
| | | |
| GoBrands, Inc. Series G | 3/02/21 | 3,521,014 |
| | | |
| Lightmatter, Inc. Series C | 5/19/23 | 1,356,386 |
| | | |
| Lightmatter, Inc. Series C2 | 12/18/23 | 336,619 |
| | | |
| Meesho Series F | 9/21/21 | 3,572,929 |
| | | |
| Pine Labs Private Ltd. | 6/30/21 | 1,364,668 |
| | | |
| Pine Labs Private Ltd. Series 1 | 6/30/21 | 3,261,406 |
| | | |
| Pine Labs Private Ltd. Series A | 6/30/21 | 815,072 |
| | | |
| Pine Labs Private Ltd. Series B | 6/30/21 | 886,661 |
| | | |
| Pine Labs Private Ltd. Series B2 | 6/30/21 | 717,010 |
| | | |
| Pine Labs Private Ltd. Series C | 6/30/21 | 1,334,093 |
| | | |
| Pine Labs Private Ltd. Series C1 | 6/30/21 | 281,136 |
| | | |
| Pine Labs Private Ltd. Series D | 6/30/21 | 300,525 |
| | | |
| Reddit, Inc. Series D | 2/04/19 | 2,045,018 |
| | | |
| Reddit, Inc. Series E | 5/18/21 | 225,113 |
| | | |
| Reddit, Inc. Series F | 8/11/21 | 9,554,279 |
| | | |
| Relativity Space, Inc. Series E | 5/27/21 | 11,020,585 |
| | | |
| Retym, Inc. Series C | 5/17/23 - 6/20/23 | 1,085,102 |
| | | |
| SiMa.ai Series B | 5/10/21 | 1,184,429 |
| | | |
| SiMa.ai Series B1 | 4/25/22 - 10/17/22 | 713,934 |
| | | |
| Tenstorrent Holdings, Inc. Series C1 | 4/23/21 | 762,398 |
| | | |
| Tenstorrent Holdings, Inc. 5% 11/6/25 | 11/06/23 | 294,497 |
| | | |
| VAST Data Ltd. Series A | 11/28/23 | 331,551 |
| | | |
| VAST Data Ltd. Series A1 | 11/28/23 | 816,035 |
| | | |
| VAST Data Ltd. Series A2 | 11/28/23 | 938,707 |
| | | |
| VAST Data Ltd. Series B | 11/28/23 | 746,944 |
| | | |
| VAST Data Ltd. Series C | 11/28/23 | 21,769 |
| | | |
| VAST Data Ltd. Series E | 11/28/23 | 1,427,492 |
| | | |
| Xsight Labs Ltd. warrants 1/11/34 | 1/11/24 | 0 |
| | | |
| Xsight Labs Ltd. Series D | 2/16/21 | 809,995 |
| | | |
| Xsight Labs Ltd. Series D1 | 1/11/24 | 738,543 |
| | | |
Affiliated Central Funds
Fiscal year to date information regarding the Fund's investments in Fidelity Central Funds, including the ownership percentage, is presented below.
| Affiliate | Value, beginning of period ($) | Purchases ($) | Sales Proceeds ($) | Dividend Income ($) | Realized Gain (loss) ($) | Change in Unrealized appreciation (depreciation) ($) | Value, end of period ($) | % ownership, end of period |
| Fidelity Cash Central Fund 5.39% | 12,460,075 | 557,488,738 | 428,662,605 | 2,157,066 | - | - | 141,286,208 | 0.3% |
| Fidelity Securities Lending Cash Central Fund 5.39% | 5,023,259 | 34,343,285 | 39,366,444 | 2,813 | - | - | 100 | 0.0% |
| Total | 17,483,334 | 591,832,023 | 468,029,049 | 2,159,879 | - | - | 141,286,308 | |
| | | | | | | | | |
Amounts in the dividend income column in the above table include any capital gain distributions from underlying funds, which are presented in the corresponding line item in the Statement of Operations, if applicable.
Amounts in the dividend income column for Fidelity Securities Lending Cash Central Fund represents the income earned on investing cash collateral, less rebates paid to borrowers and any lending agent fees associated with the loan, plus any premium payments received for lending certain types of securities.
Amounts included in the purchases and sales proceeds columns may include in-kind transactions, if applicable.
Investment Valuation
The following is a summary of the inputs used, as of January 31, 2024, involving the Fund's assets and liabilities carried at fair value. The inputs or methodology used for valuing securities may not be an indication of the risk associated with investing in those securities. For more information on valuation inputs, and their aggregation into the levels used below, please refer to the Investment Valuation section in the accompanying Notes to Financial Statements.
| Valuation Inputs at Reporting Date: |
| Description | Total ($) | Level 1 ($) | Level 2 ($) | Level 3 ($) |
Investments in Securities: | | | | |
|
| Common Stocks | 5,093,522,748 | 4,944,371,725 | 140,459,753 | 8,691,270 |
|
| Preferred Stocks | 79,274,768 | - | - | 79,274,768 |
|
| Corporate Bonds | 2,986,270 | - | - | 2,986,270 |
|
| Preferred Securities | 831,360 | - | - | 831,360 |
|
| Money Market Funds | 141,286,308 | 141,286,308 | - | - |
| Total Investments in Securities: | 5,317,901,454 | 5,085,658,033 | 140,459,753 | 91,783,668 |
The following is a reconciliation of Investments in Securities for which Level 3 inputs were used in determining value:
| |
| Investments in Securities: | |
| Preferred Stocks | | | |
| Beginning Balance | $ | 74,365,732 | |
| Net Realized Gain (Loss) on Investment Securities | | - | |
| Net Unrealized Gain (Loss) on Investment Securities | | 316,975 | |
| Cost of Purchases | | 5,904,922 | |
| Proceeds of Sales | | - | |
| Amortization/Accretion | | - | |
| Transfers into Level 3 | | - | |
| Transfers out of Level 3 | | (1,312,861) | |
| Ending Balance | $ | 79,274,768 | |
| The change in unrealized gain (loss) for the period attributable to Level 3 securities held at January 31, 2024 | $ | 316,975 | |
| Other Investments in Securities | | | |
| Beginning Balance | $ | 6,662,283 | |
| Net Realized Gain (Loss) on Investment Securities | | (3,985,179) | |
| Net Unrealized Gain (Loss) on Investment Securities | | 3,164,866 | |
| Cost of Purchases | | 10,927,491 | |
| Proceeds of Sales | | (4,260,561) | |
| Amortization/Accretion | | - | |
| Transfers into Level 3 | | - | |
| Transfers out of Level 3 | | - | |
| Ending Balance | $ | 12,508,900 | |
| The change in unrealized gain (loss) for the period attributable to Level 3 securities held at January 31, 2024 | $ | (1,013,578) | |
| The information used in the above reconciliation represents fiscal year to date activity for any Investments in Securities identified as using Level 3 inputs at either the beginning or the end of the current fiscal period. Cost of purchases and proceeds of sales may include securities received and/or delivered through in-kind transactions, corporate actions or exchanges. Transfers into Level 3 were attributable to a lack of observable market data resulting from decreases in market activity, decreases in liquidity, security restructurings or corporate actions. Transfers out of Level 3 were attributable to observable market data becoming available for those securities. Transfers in or out of Level 3 represent the beginning value of any Security or Instrument where a change in the pricing level occurred from the beginning to the end of the period. Realized and unrealized gains (losses) disclosed in the reconciliation are included in Net Gain (Loss) on the Fund's Statement of Operations. | |
Fidelity Advisor® Technology Fund
| Statement of Assets and Liabilities |
| | | | January 31, 2024 (Unaudited) |
| | | | | |
| Assets | | | | |
| Investment in securities, at value (including securities loaned of $23) - See accompanying schedule: | | | | |
Unaffiliated issuers (cost $2,585,599,416) | $ | 5,176,615,146 | | |
Fidelity Central Funds (cost $141,286,308) | | 141,286,308 | | |
| | | | | |
| | | | | |
| Total Investment in Securities (cost $2,726,885,724) | | | $ | 5,317,901,454 |
| Receivable for investments sold | | | | 54,316,916 |
| Receivable for fund shares sold | | | | 5,241,042 |
| Dividends receivable | | | | 55,470 |
| Interest receivable | | | | 53,020 |
| Distributions receivable from Fidelity Central Funds | | | | 318,065 |
| Prepaid expenses | | | | 6,720 |
| Other receivables | | | | 148,950 |
Total assets | | | | 5,378,041,637 |
| Liabilities | | | | |
| Payable for investments purchased | $ | 54,378,244 | | |
| Payable for fund shares redeemed | | 4,387,727 | | |
| Accrued management fee | | 2,255,117 | | |
| Distribution and service plan fees payable | | 952,551 | | |
| Other affiliated payables | | 737,768 | | |
| Other payables and accrued expenses | | 233,984 | | |
| Collateral on securities loaned | | 100 | | |
| Total Liabilities | | | | 62,945,491 |
| Net Assets | | | $ | 5,315,096,146 |
| Net Assets consist of: | | | | |
| Paid in capital | | | $ | 2,630,794,971 |
| Total accumulated earnings (loss) | | | | 2,684,301,175 |
| Net Assets | | | $ | 5,315,096,146 |
| | | | | |
| Net Asset Value and Maximum Offering Price | | | | |
| Class A : | | | | |
Net Asset Value and redemption price per share ($2,062,730,486 ÷ 20,960,894 shares)(a) | | | $ | 98.41 |
| Maximum offering price per share (100/94.25 of $98.41) | | | $ | 104.41 |
| Class M : | | | | |
Net Asset Value and redemption price per share ($670,930,613 ÷ 7,498,438 shares)(a) | | | $ | 89.48 |
| Maximum offering price per share (100/96.50 of $89.48) | | | $ | 92.73 |
| Class C : | | | | |
Net Asset Value and offering price per share ($312,953,819 ÷ 4,332,553 shares)(a) | | | $ | 72.23 |
| Class I : | | | | |
Net Asset Value, offering price and redemption price per share ($1,697,658,749 ÷ 15,289,019 shares) | | | $ | 111.04 |
| Class Z : | | | | |
Net Asset Value, offering price and redemption price per share ($570,822,479 ÷ 5,141,648 shares) | | | $ | 111.02 |
(a)Redemption price per share is equal to net asset value less any applicable contingent deferred sales charge. |
| Statement of Operations |
| | | | Six months ended January 31, 2024 (Unaudited) |
| Investment Income | | | | |
| Dividends | | | $ | 13,260,880 |
| Interest | | | | 51,162 |
| Income from Fidelity Central Funds (including $2,813 from security lending) | | | | 2,159,879 |
| Total Income | | | | 15,471,921 |
| Expenses | | | | |
| Management fee | $ | 12,784,752 | | |
| Transfer agent fees | | 3,680,875 | | |
| Distribution and service plan fees | | 5,305,967 | | |
| Accounting fees | | 479,514 | | |
| Custodian fees and expenses | | 28,699 | | |
| Independent trustees' fees and expenses | | 13,980 | | |
| Registration fees | | 117,617 | | |
| Audit | | 36,065 | | |
| Legal | | 4,147 | | |
| Interest | | 2,547 | | |
| Miscellaneous | | 10,096 | | |
| Total expenses before reductions | | 22,464,259 | | |
| Expense reductions | | (211,116) | | |
| Total expenses after reductions | | | | 22,253,143 |
| Net Investment income (loss) | | | | (6,781,222) |
| Realized and Unrealized Gain (Loss) | | | | |
| Net realized gain (loss) on: | | | | |
| Investment Securities: | | | | |
| Unaffiliated issuers | | 131,411,049 | | |
| Redemptions in-kind | | 75,184,814 | | |
| Foreign currency transactions | | (441) | | |
| Total net realized gain (loss) | | | | 206,595,422 |
| Change in net unrealized appreciation (depreciation) on: | | | | |
| Investment Securities: | | | | |
| Unaffiliated issuers | | 152,454,456 | | |
| Assets and liabilities in foreign currencies | | (2,478) | | |
| Total change in net unrealized appreciation (depreciation) | | | | 152,451,978 |
| Net gain (loss) | | | | 359,047,400 |
| Net increase (decrease) in net assets resulting from operations | | | $ | 352,266,178 |
| Statement of Changes in Net Assets |
| |
| | Six months ended January 31, 2024 (Unaudited) | | Year ended July 31, 2023 |
| Increase (Decrease) in Net Assets | | | | |
| Operations | | | | |
| Net investment income (loss) | $ | (6,781,222) | $ | (9,304,481) |
| Net realized gain (loss) | | 206,595,422 | | 139,820,713 |
| Change in net unrealized appreciation (depreciation) | | 152,451,978 | | 1,053,544,131 |
| Net increase (decrease) in net assets resulting from operations | | 352,266,178 | | 1,184,060,363 |
| Distributions to shareholders | | (196,413,935) | | (117,622,896) |
| | | | | |
| Share transactions - net increase (decrease) | | 39,486,823 | | 221,530,897 |
| Total increase (decrease) in net assets | | 195,339,066 | | 1,287,968,364 |
| | | | | |
| Net Assets | | | | |
| Beginning of period | | 5,119,757,080 | | 3,831,788,716 |
| End of period | $ | 5,315,096,146 | $ | 5,119,757,080 |
| | | | | |
| | | | | |
Financial Highlights
| Fidelity Advisor® Technology Fund Class A |
| |
| | Six months ended (Unaudited) January 31, 2024 | | Years ended July 31, 2023 | | 2022 | | 2021 | | 2020 | | 2019 |
Selected Per-Share Data | | | | | | | | | | | | |
| Net asset value, beginning of period | $ | 95.17 | $ | 75.41 | $ | 102.43 | $ | 76.36 | $ | 52.61 | $ | 60.37 |
| Income from Investment Operations | | | | | | | | | | | | |
Net investment income (loss) A,B | | (.15) | | (.21) | | (.37) | | (.39) | | (.12) | | .02 |
| Net realized and unrealized gain (loss) | | 7.14 | | 22.28 | | (13.94) | | 33.48 | | 25.35 | | 1.84 |
| Total from investment operations | | 6.99 | | 22.07 | | (14.31) | | 33.09 | | 25.23 | | 1.86 |
| Distributions from net realized gain | | (3.75) | | (2.31) | | (12.71) | | (7.02) | | (1.48) | | (9.62) |
| Total distributions | | (3.75) | | (2.31) | | (12.71) | | (7.02) | | (1.48) | | (9.62) |
| Net asset value, end of period | $ | 98.41 | $ | 95.17 | $ | 75.41 | $ | 102.43 | $ | 76.36 | $ | 52.61 |
Total Return C,D,E | | 7.49% | | 30.51% | | (16.78)% | | 44.80% | | 48.83% | | 7.26% |
Ratios to Average Net Assets B,F,G | | | | | | | | | | | | |
| Expenses before reductions | | .97% H | | .98% | | .97% | | .98% | | 1.01% | | 1.03% |
| Expenses net of fee waivers, if any | | .96% H | | .98% | | .97% | | .98% | | 1.01% | | 1.03% |
| Expenses net of all reductions | | .96% H | | .98% | | .97% | | .98% | | 1.01% | | 1.02% |
| Net investment income (loss) | | (.33)% H | | (.29)% | | (.41)% | | (.43)% | | (.20)% | | .04% |
| Supplemental Data | | | | | | | | | | | | |
| Net assets, end of period (000 omitted) | $ | 2,062,730 | $ | 1,906,585 | $ | 1,467,792 | $ | 1,848,643 | $ | 1,339,059 | $ | 884,749 |
Portfolio turnover rate I | | 19% H,J | | 30% | | 20% | | 44% | | 40% J | | 88% |
ACalculated based on average shares outstanding during the period.
BNet investment income (loss) is affected by the timing of the declaration of dividends by any underlying mutual funds or exchange-traded funds (ETFs). Net investment income (loss) of any mutual funds or ETFs is not included in the Fund's net investment income (loss) ratio.
CTotal returns for periods of less than one year are not annualized.
DTotal returns would have been lower if certain expenses had not been reduced during the applicable periods shown.
ETotal returns do not include the effect of the sales charges.
FFees and expenses of any underlying mutual funds or exchange-traded funds (ETFs) are not included in the Fund's expense ratio. The Fund indirectly bears its proportionate share of these expenses. For additional expense information related to investments in Fidelity Central Funds, please refer to the "Investments in Fidelity Central Funds" note found in the Notes to Financial Statements section of the most recent Annual or Semi-Annual report.
GExpense ratios reflect operating expenses of the class. Expenses before reductions do not reflect amounts reimbursed, waived, or reduced through arrangements with the investment adviser, brokerage services, or other offset arrangements, if applicable, and do not represent the amount paid by the class during periods when reimbursements, waivers or reductions occur.
HAnnualized.
IAmount does not include the portfolio activity of any underlying mutual funds or exchange-traded funds (ETFs).
JPortfolio turnover rate excludes securities received or delivered in-kind.
| Fidelity Advisor® Technology Fund Class M |
| |
| | Six months ended (Unaudited) January 31, 2024 | | Years ended July 31, 2023 | | 2022 | | 2021 | | 2020 | | 2019 |
Selected Per-Share Data | | | | | | | | | | | | |
| Net asset value, beginning of period | $ | 86.92 | $ | 69.25 | $ | 95.15 | $ | 71.37 | $ | 49.28 | $ | 57.23 |
| Income from Investment Operations | | | | | | | | | | | | |
Net investment income (loss) A,B | | (.24) | | (.36) | | (.55) | | (.57) | | (.25) | | (.10) |
| Net realized and unrealized gain (loss) | | 6.51 | | 20.34 | | (12.76) | | 31.22 | | 23.71 | | 1.63 |
| Total from investment operations | | 6.27 | | 19.98 | | (13.31) | | 30.65 | | 23.46 | | 1.53 |
| Distributions from net realized gain | | (3.71) | | (2.31) | | (12.59) | | (6.87) | | (1.37) | | (9.48) |
| Total distributions | | (3.71) | | (2.31) | | (12.59) | | (6.87) | | (1.37) | | (9.48) |
| Net asset value, end of period | $ | 89.48 | $ | 86.92 | $ | 69.25 | $ | 95.15 | $ | 71.37 | $ | 49.28 |
Total Return C,D,E | | 7.37% | | 30.20% | | (16.99)% | | 44.47% | | 48.44% | | 7.00% |
Ratios to Average Net Assets B,F,G | | | | | | | | | | | | |
| Expenses before reductions | | 1.21% H | | 1.22% | | 1.21% | | 1.23% | | 1.26% | | 1.28% |
| Expenses net of fee waivers, if any | | 1.21% H | | 1.22% | | 1.21% | | 1.23% | | 1.26% | | 1.28% |
| Expenses net of all reductions | | 1.21% H | | 1.22% | | 1.21% | | 1.22% | | 1.26% | | 1.28% |
| Net investment income (loss) | | (.57)% H | | (.53)% | | (.65)% | | (.68)% | | (.45)% | | (.22)% |
| Supplemental Data | | | | | | | | | | | | |
| Net assets, end of period (000 omitted) | $ | 670,931 | $ | 624,612 | $ | 484,293 | $ | 624,534 | $ | 464,093 | $ | 321,915 |
Portfolio turnover rate I | | 19% H,J | | 30% | | 20% | | 44% | | 40% J | | 88% |
ACalculated based on average shares outstanding during the period.
BNet investment income (loss) is affected by the timing of the declaration of dividends by any underlying mutual funds or exchange-traded funds (ETFs). Net investment income (loss) of any mutual funds or ETFs is not included in the Fund's net investment income (loss) ratio.
CTotal returns for periods of less than one year are not annualized.
DTotal returns would have been lower if certain expenses had not been reduced during the applicable periods shown.
ETotal returns do not include the effect of the sales charges.
FFees and expenses of any underlying mutual funds or exchange-traded funds (ETFs) are not included in the Fund's expense ratio. The Fund indirectly bears its proportionate share of these expenses. For additional expense information related to investments in Fidelity Central Funds, please refer to the "Investments in Fidelity Central Funds" note found in the Notes to Financial Statements section of the most recent Annual or Semi-Annual report.
GExpense ratios reflect operating expenses of the class. Expenses before reductions do not reflect amounts reimbursed, waived, or reduced through arrangements with the investment adviser, brokerage services, or other offset arrangements, if applicable, and do not represent the amount paid by the class during periods when reimbursements, waivers or reductions occur.
HAnnualized.
IAmount does not include the portfolio activity of any underlying mutual funds or exchange-traded funds (ETFs).
JPortfolio turnover rate excludes securities received or delivered in-kind.
| Fidelity Advisor® Technology Fund Class C |
| |
| | Six months ended (Unaudited) January 31, 2024 | | Years ended July 31, 2023 | | 2022 | | 2021 | | 2020 | | 2019 |
Selected Per-Share Data | | | | | | | | | | | | |
| Net asset value, beginning of period | $ | 71.04 | $ | 57.35 | $ | 80.98 | $ | 61.67 | $ | 42.81 | $ | 51.18 |
| Income from Investment Operations | | | | | | | | | | | | |
Net investment income (loss) A,B | | (.37) | | (.58) | | (.83) | | (.85) | | (.46) | | (.30) |
| Net realized and unrealized gain (loss) | | 5.27 | | 16.58 | | (10.43) | | 26.79 | | 20.52 | | 1.22 |
| Total from investment operations | | 4.90 | | 16.00 | | (11.26) | | 25.94 | | 20.06 | | .92 |
| Distributions from net realized gain | | (3.71) | | (2.31) | | (12.37) | | (6.63) | | (1.20) | | (9.29) |
| Total distributions | | (3.71) | | (2.31) | | (12.37) | | (6.63) | | (1.20) | | (9.29) |
| Net asset value, end of period | $ | 72.23 | $ | 71.04 | $ | 57.35 | $ | 80.98 | $ | 61.67 | $ | 42.81 |
Total Return C,D,E | | 7.09% | | 29.50% | | (17.41)% | | 43.73% | | 47.69% | | 6.44% |
Ratios to Average Net Assets B,F,G | | | | | | | | | | | | |
| Expenses before reductions | | 1.74% H | | 1.75% | | 1.73% | | 1.75% | | 1.77% | | 1.79% |
| Expenses net of fee waivers, if any | | 1.73% H | | 1.74% | | 1.73% | | 1.74% | | 1.77% | | 1.79% |
| Expenses net of all reductions | | 1.73% H | | 1.74% | | 1.73% | | 1.74% | | 1.77% | | 1.78% |
| Net investment income (loss) | | (1.09)% H | | (1.05)% | | (1.17)% | | (1.20)% | | (.96)% | | (.72)% |
| Supplemental Data | | | | | | | | | | | | |
| Net assets, end of period (000 omitted) | $ | 312,954 | $ | 313,457 | $ | 288,008 | $ | 410,661 | $ | 343,585 | $ | 240,358 |
Portfolio turnover rate I | | 19% H,J | | 30% | | 20% | | 44% | | 40% J | | 88% |
ACalculated based on average shares outstanding during the period.
BNet investment income (loss) is affected by the timing of the declaration of dividends by any underlying mutual funds or exchange-traded funds (ETFs). Net investment income (loss) of any mutual funds or ETFs is not included in the Fund's net investment income (loss) ratio.
CTotal returns for periods of less than one year are not annualized.
DTotal returns would have been lower if certain expenses had not been reduced during the applicable periods shown.
ETotal returns do not include the effect of the contingent deferred sales charge.
FFees and expenses of any underlying mutual funds or exchange-traded funds (ETFs) are not included in the Fund's expense ratio. The Fund indirectly bears its proportionate share of these expenses. For additional expense information related to investments in Fidelity Central Funds, please refer to the "Investments in Fidelity Central Funds" note found in the Notes to Financial Statements section of the most recent Annual or Semi-Annual report.
GExpense ratios reflect operating expenses of the class. Expenses before reductions do not reflect amounts reimbursed, waived, or reduced through arrangements with the investment adviser, brokerage services, or other offset arrangements, if applicable, and do not represent the amount paid by the class during periods when reimbursements, waivers or reductions occur.
HAnnualized.
IAmount does not include the portfolio activity of any underlying mutual funds or exchange-traded funds (ETFs).
JPortfolio turnover rate excludes securities received or delivered in-kind.
| Fidelity Advisor® Technology Fund Class I |
| |
| | Six months ended (Unaudited) January 31, 2024 | | Years ended July 31, 2023 | | 2022 | | 2021 | | 2020 | | 2019 |
Selected Per-Share Data | | | | | | | | | | | | |
| Net asset value, beginning of period | $ | 107.03 | $ | 84.29 | $ | 112.95 | $ | 83.56 | $ | 57.41 | $ | 64.86 |
| Income from Investment Operations | | | | | | | | | | | | |
Net investment income (loss) A,B | | (.04) | | (.02) | | (.15) | | (.17) | | .04 | | .17 |
| Net realized and unrealized gain (loss) | | 8.07 | | 25.07 | | (15.67) | | 36.76 | | 27.72 | | 2.15 |
| Total from investment operations | | 8.03 | | 25.05 | | (15.82) | | 36.59 | | 27.76 | | 2.32 |
| Distributions from net investment income | | - | | - | | - | | - | | - | | (.01) |
| Distributions from net realized gain | | (4.02) | | (2.31) | | (12.84) | | (7.20) | | (1.61) | | (9.76) |
| Total distributions | | (4.02) | | (2.31) | | (12.84) | | (7.20) | | (1.61) | | (9.77) |
| Net asset value, end of period | $ | 111.04 | $ | 107.03 | $ | 84.29 | $ | 112.95 | $ | 83.56 | $ | 57.41 |
Total Return C,D | | 7.64% | | 30.84% | | (16.56)% | | 45.18% | | 49.22% | | 7.56% |
Ratios to Average Net Assets B,E,F | | | | | | | | | | | | |
| Expenses before reductions | | .71% G | | .72% | | .71% | | .72% | | .74% | | .76% |
| Expenses net of fee waivers, if any | | .70% G | | .71% | | .71% | | .72% | | .74% | | .76% |
| Expenses net of all reductions | | .70% G | | .71% | | .71% | | .72% | | .74% | | .76% |
| Net investment income (loss) | | (.07)% G | | (.03)% | | (.15)% | | (.18)% | | .07% | | .30% |
| Supplemental Data | | | | | | | | | | | | |
| Net assets, end of period (000 omitted) | $ | 1,697,659 | $ | 1,515,475 | $ | 1,129,418 | $ | 1,470,830 | $ | 1,035,091 | $ | 674,914 |
Portfolio turnover rate H | | 19% G,I | | 30% | | 20% | | 44% | | 40% I | | 88% |
ACalculated based on average shares outstanding during the period.
BNet investment income (loss) is affected by the timing of the declaration of dividends by any underlying mutual funds or exchange-traded funds (ETFs). Net investment income (loss) of any mutual funds or ETFs is not included in the Fund's net investment income (loss) ratio.
CTotal returns for periods of less than one year are not annualized.
DTotal returns would have been lower if certain expenses had not been reduced during the applicable periods shown.
EFees and expenses of any underlying mutual funds or exchange-traded funds (ETFs) are not included in the Fund's expense ratio. The Fund indirectly bears its proportionate share of these expenses. For additional expense information related to investments in Fidelity Central Funds, please refer to the "Investments in Fidelity Central Funds" note found in the Notes to Financial Statements section of the most recent Annual or Semi-Annual report.
FExpense ratios reflect operating expenses of the class. Expenses before reductions do not reflect amounts reimbursed, waived, or reduced through arrangements with the investment adviser, brokerage services, or other offset arrangements, if applicable, and do not represent the amount paid by the class during periods when reimbursements, waivers or reductions occur.
GAnnualized.
HAmount does not include the portfolio activity of any underlying mutual funds or exchange-traded funds (ETFs).
IPortfolio turnover rate excludes securities received or delivered in-kind.
| Fidelity Advisor® Technology Fund Class Z |
| |
| | Six months ended (Unaudited) January 31, 2024 | | Years ended July 31, 2023 | | 2022 | | 2021 | | 2020 | | 2019 A |
Selected Per-Share Data | | | | | | | | | | | | |
| Net asset value, beginning of period | $ | 107.07 | $ | 84.22 | $ | 112.81 | $ | 83.44 | $ | 57.34 | $ | 67.88 |
| Income from Investment Operations | | | | | | | | | | | | |
Net investment income (loss) B,C | | .02 | | .08 | | (.04) | | (.06) | | .12 | | .23 |
| Net realized and unrealized gain (loss) | | 8.07 | | 25.08 | | (15.63) | | 36.72 | | 27.68 | | (.90) |
| Total from investment operations | | 8.09 | | 25.16 | | (15.67) | | 36.66 | | 27.80 | | (.67) |
| Distributions from net investment income | | - | | - | | - | | - | | - | | (.11) |
| Distributions from net realized gain | | (4.14) | | (2.31) | | (12.92) | | (7.29) | | (1.70) | | (9.76) |
| Total distributions | | (4.14) | | (2.31) | | (12.92) | | (7.29) | | (1.70) | | (9.87) |
| Net asset value, end of period | $ | 111.02 | $ | 107.07 | $ | 84.22 | $ | 112.81 | $ | 83.44 | $ | 57.34 |
Total Return D,E | | 7.70% | | 31.00% | | (16.46)% | | 45.37% | | 49.39% | | 2.88% |
Ratios to Average Net Assets C,F,G | | | | | | | | | | | | |
| Expenses before reductions | | .59% H | | .60% | | .59% | | .60% | | .62% | | .63% H |
| Expenses net of fee waivers, if any | | .58% H | | .59% | | .59% | | .60% | | .62% | | .63% H |
| Expenses net of all reductions | | .58% H | | .59% | | .59% | | .60% | | .62% | | .62% H |
| Net investment income (loss) | | .05% H | | .09% | | (.04)% | | (.06)% | | .19% | | .53% H |
| Supplemental Data | | | | | | | | | | | | |
| Net assets, end of period (000 omitted) | $ | 570,822 | $ | 759,629 | $ | 462,278 | $ | 524,383 | $ | 298,255 | $ | 31,619 |
Portfolio turnover rate I | | 19% H,J | | 30% | | 20% | | 44% | | 40% J | | 88% |
AFor the period October 2, 2018 (commencement of sale of shares) through July 31, 2019.
BCalculated based on average shares outstanding during the period.
CNet investment income (loss) is affected by the timing of the declaration of dividends by any underlying mutual funds or exchange-traded funds (ETFs). Net investment income (loss) of any mutual funds or ETFs is not included in the Fund's net investment income (loss) ratio.
DTotal returns for periods of less than one year are not annualized.
ETotal returns would have been lower if certain expenses had not been reduced during the applicable periods shown.
FFees and expenses of any underlying mutual funds or exchange-traded funds (ETFs) are not included in the Fund's expense ratio. The Fund indirectly bears its proportionate share of these expenses. For additional expense information related to investments in Fidelity Central Funds, please refer to the "Investments in Fidelity Central Funds" note found in the Notes to Financial Statements section of the most recent Annual or Semi-Annual report.
GExpense ratios reflect operating expenses of the class. Expenses before reductions do not reflect amounts reimbursed, waived, or reduced through arrangements with the investment adviser, brokerage services, or other offset arrangements, if applicable, and do not represent the amount paid by the class during periods when reimbursements, waivers or reductions occur.
HAnnualized.
IAmount does not include the portfolio activity of any underlying mutual funds or exchange-traded funds (ETFs).
JPortfolio turnover rate excludes securities received or delivered in-kind.
Top Holdings (% of Fund's net assets) |
| |
| NextEra Energy, Inc. | 14.2 | |
| Sempra | 9.1 | |
| Duke Energy Corp. | 8.3 | |
| Southern Co. | 7.6 | |
| PG&E Corp. | 6.1 | |
| Edison International | 4.9 | |
| Constellation Energy Corp. | 4.9 | |
| FirstEnergy Corp. | 4.9 | |
| American Electric Power Co., Inc. | 4.8 | |
| Entergy Corp. | 4.7 | |
| | 69.5 | |
| |
| Industries (% of Fund's net assets) |
| |
| Electric Utilities | 71.7 | |
| Multi-Utilities | 16.5 | |
| Independent Power and Renewable Electricity Producers | 7.8 | |
| Water Utilities | 0.9 | |
| Gas Utilities | 0.5 | |
| Electrical Equipment | 0.2 | |
| |
Fidelity Advisor® Utilities Fund
Showing Percentage of Net Assets
| Common Stocks - 97.6% |
| | | Shares | Value ($) |
| Electric Utilities - 71.7% | | | |
| Electric Utilities - 71.7% | | | |
| American Electric Power Co., Inc. | | 398,176 | 31,113,473 |
| Constellation Energy Corp. | | 259,015 | 31,599,830 |
| Duke Energy Corp. | | 560,185 | 53,682,529 |
| Edison International | | 472,109 | 31,857,915 |
| Entergy Corp. | | 301,800 | 30,107,568 |
| Evergy, Inc. | | 277,000 | 14,063,290 |
| Eversource Energy | | 437,081 | 23,698,532 |
| Exelon Corp. | | 95,400 | 3,320,874 |
| FirstEnergy Corp. | | 860,568 | 31,565,634 |
| Fortum Corp. | | 144,000 | 1,974,828 |
| NextEra Energy, Inc. | | 1,567,348 | 91,893,614 |
| NRG Energy, Inc. | | 64,563 | 3,424,422 |
| PG&E Corp. | | 2,344,098 | 39,544,933 |
| PPL Corp. | | 1,009,834 | 26,457,651 |
| Southern Co. | | 711,272 | 49,447,629 |
| | | | 463,752,722 |
| Electrical Equipment - 0.2% | | | |
| Electrical Components & Equipment - 0.2% | | | |
| Sunrun, Inc. (a)(b) | | 79,500 | 1,151,160 |
| Gas Utilities - 0.5% | | | |
| Gas Utilities - 0.5% | | | |
| UGI Corp. (b) | | 135,700 | 3,004,398 |
| Independent Power and Renewable Electricity Producers - 7.8% | | | |
| Independent Power Producers & Energy Traders - 6.2% | | | |
| Energy Harbor Corp. (a) | | 142,300 | 11,426,690 |
| The AES Corp. | | 726,000 | 12,109,680 |
| Vistra Corp. | | 399,873 | 16,406,789 |
| | | | 39,943,159 |
| Renewable Electricity - 1.6% | | | |
| Clearway Energy, Inc. Class A | | 93,226 | 2,093,856 |
| NextEra Energy Partners LP | | 207,700 | 6,199,845 |
| Sunnova Energy International, Inc. (a)(b) | | 218,574 | 2,299,398 |
| | | | 10,593,099 |
TOTAL INDEPENDENT POWER AND RENEWABLE ELECTRICITY PRODUCERS | | | 50,536,258 |
| Multi-Utilities - 16.5% | | | |
| Multi-Utilities - 16.5% | | | |
| DTE Energy Co. | | 134,217 | 14,149,156 |
| NiSource, Inc. | | 843,644 | 21,909,435 |
| Public Service Enterprise Group, Inc. | | 205,809 | 11,934,864 |
| Sempra | | 822,973 | 58,891,948 |
| | | | 106,885,403 |
| Water Utilities - 0.9% | | | |
| Water Utilities - 0.9% | | | |
| Essential Utilities, Inc. (b) | | 159,418 | 5,716,729 |
| TOTAL COMMON STOCKS (Cost $554,655,817) | | | 631,046,670 |
| | | | |
| Money Market Funds - 2.5% |
| | | Shares | Value ($) |
| Fidelity Cash Central Fund 5.39% (c) | | 3,825,128 | 3,825,893 |
| Fidelity Securities Lending Cash Central Fund 5.39% (c)(d) | | 11,946,845 | 11,948,040 |
| TOTAL MONEY MARKET FUNDS (Cost $15,773,933) | | | 15,773,933 |
| | | | |
| TOTAL INVESTMENT IN SECURITIES - 100.1% (Cost $570,429,750) | 646,820,603 |
NET OTHER ASSETS (LIABILITIES) - (0.1)% | (490,404) |
| NET ASSETS - 100.0% | 646,330,199 |
| | |
Legend
| (b) | Security or a portion of the security is on loan at period end. |
| (c) | Affiliated fund that is generally available only to investment companies and other accounts managed by Fidelity Investments. The rate quoted is the annualized seven-day yield of the fund at period end. A complete unaudited listing of the fund's holdings as of its most recent quarter end is available upon request. In addition, each Fidelity Central Fund's financial statements are available on the SEC's website or upon request. |
| (d) | Investment made with cash collateral received from securities on loan. |
Affiliated Central Funds
Fiscal year to date information regarding the Fund's investments in Fidelity Central Funds, including the ownership percentage, is presented below.
| Affiliate | Value, beginning of period ($) | Purchases ($) | Sales Proceeds ($) | Dividend Income ($) | Realized Gain (loss) ($) | Change in Unrealized appreciation (depreciation) ($) | Value, end of period ($) | % ownership, end of period |
| Fidelity Cash Central Fund 5.39% | - | 150,108,642 | 146,282,749 | 143,646 | - | - | 3,825,893 | 0.0% |
| Fidelity Securities Lending Cash Central Fund 5.39% | 1,061,200 | 23,566,061 | 12,679,221 | 3,628 | - | - | 11,948,040 | 0.0% |
| Total | 1,061,200 | 173,674,703 | 158,961,970 | 147,274 | - | - | 15,773,933 | |
| | | | | | | | | |
Amounts in the dividend income column in the above table include any capital gain distributions from underlying funds, which are presented in the corresponding line item in the Statement of Operations, if applicable.
Amounts in the dividend income column for Fidelity Securities Lending Cash Central Fund represents the income earned on investing cash collateral, less rebates paid to borrowers and any lending agent fees associated with the loan, plus any premium payments received for lending certain types of securities.
Amounts included in the purchases and sales proceeds columns may include in-kind transactions, if applicable.
Investment Valuation
The following is a summary of the inputs used, as of January 31, 2024, involving the Fund's assets and liabilities carried at fair value. The inputs or methodology used for valuing securities may not be an indication of the risk associated with investing in those securities. For more information on valuation inputs, and their aggregation into the levels used below, please refer to the Investment Valuation section in the accompanying Notes to Financial Statements.
| Valuation Inputs at Reporting Date: |
| Description | Total ($) | Level 1 ($) | Level 2 ($) | Level 3 ($) |
Investments in Securities: | | | | |
|
| Common Stocks | 631,046,670 | 631,046,670 | - | - |
|
| Money Market Funds | 15,773,933 | 15,773,933 | - | - |
| Total Investments in Securities: | 646,820,603 | 646,820,603 | - | - |
Fidelity Advisor® Utilities Fund
| Statement of Assets and Liabilities |
| | | | January 31, 2024 (Unaudited) |
| | | | | |
| Assets | | | | |
| Investment in securities, at value (including securities loaned of $11,456,621) - See accompanying schedule: | | | | |
Unaffiliated issuers (cost $554,655,817) | $ | 631,046,670 | | |
Fidelity Central Funds (cost $15,773,933) | | 15,773,933 | | |
| | | | | |
| | | | | |
| Total Investment in Securities (cost $570,429,750) | | | $ | 646,820,603 |
| Receivable for investments sold | | | | 14,244,588 |
| Receivable for fund shares sold | | | | 396,076 |
| Dividends receivable | | | | 173,683 |
| Distributions receivable from Fidelity Central Funds | | | | 22,546 |
| Prepaid expenses | | | | 1,092 |
Total assets | | | | 661,658,588 |
| Liabilities | | | | |
| Payable for investments purchased | $ | 1,639,016 | | |
| Payable for fund shares redeemed | | 1,179,591 | | |
| Accrued management fee | | 290,525 | | |
| Distribution and service plan fees payable | | 130,422 | | |
| Other affiliated payables | | 109,588 | | |
| Other payables and accrued expenses | | 31,207 | | |
| Collateral on securities loaned | | 11,948,040 | | |
| Total Liabilities | | | | 15,328,389 |
| Net Assets | | | $ | 646,330,199 |
| Net Assets consist of: | | | | |
| Paid in capital | | | $ | 549,501,174 |
| Total accumulated earnings (loss) | | | | 96,829,025 |
| Net Assets | | | $ | 646,330,199 |
| | | | | |
| Net Asset Value and Maximum Offering Price | | | | |
| Class A : | | | | |
Net Asset Value and redemption price per share ($291,108,415 ÷ 8,369,320 shares)(a) | | | $ | 34.78 |
| Maximum offering price per share (100/94.25 of $34.78) | | | $ | 36.90 |
| Class M : | | | | |
Net Asset Value and redemption price per share ($60,717,794 ÷ 1,740,401 shares)(a) | | | $ | 34.89 |
| Maximum offering price per share (100/96.50 of $34.89) | | | $ | 36.16 |
| Class C : | | | | |
Net Asset Value and offering price per share ($49,544,013 ÷ 1,462,621 shares)(a) | | | $ | 33.87 |
| Class I : | | | | |
Net Asset Value, offering price and redemption price per share ($179,227,131 ÷ 5,020,583 shares) | | | $ | 35.70 |
| Class Z : | | | | |
Net Asset Value, offering price and redemption price per share ($65,732,846 ÷ 1,842,696 shares) | | | $ | 35.67 |
(a)Redemption price per share is equal to net asset value less any applicable contingent deferred sales charge. |
| Statement of Operations |
| | | | Six months ended January 31, 2024 (Unaudited) |
| Investment Income | | | | |
| Dividends | | | $ | 9,481,449 |
| Income from Fidelity Central Funds (including $3,628 from security lending) | | | | 147,274 |
| Total Income | | | | 9,628,723 |
| Expenses | | | | |
| Management fee | $ | 1,833,399 | | |
| Transfer agent fees | | 581,763 | | |
| Distribution and service plan fees | | 791,184 | | |
| Accounting fees | | 110,841 | | |
| Custodian fees and expenses | | 5,593 | | |
| Independent trustees' fees and expenses | | 2,177 | | |
| Registration fees | | 71,306 | | |
| Audit | | 25,981 | | |
| Legal | | 961 | | |
| Interest | | 13,559 | | |
| Miscellaneous | | 1,607 | | |
| Total expenses before reductions | | 3,438,371 | | |
| Expense reductions | | (30,362) | | |
| Total expenses after reductions | | | | 3,408,009 |
| Net Investment income (loss) | | | | 6,220,714 |
| Realized and Unrealized Gain (Loss) | | | | |
| Net realized gain (loss) on: | | | | |
| Investment Securities: | | | | |
| Unaffiliated issuers | | 24,869,283 | | |
| Foreign currency transactions | | 104 | | |
| Total net realized gain (loss) | | | | 24,869,387 |
| Change in net unrealized appreciation (depreciation) on: | | | | |
| Investment Securities: | | | | |
| Unaffiliated issuers | | (66,891,404) | | |
| Assets and liabilities in foreign currencies | | 121 | | |
| Total change in net unrealized appreciation (depreciation) | | | | (66,891,283) |
| Net gain (loss) | | | | (42,021,896) |
| Net increase (decrease) in net assets resulting from operations | | | $ | (35,801,182) |
| Statement of Changes in Net Assets |
| |
| | Six months ended January 31, 2024 (Unaudited) | | Year ended July 31, 2023 |
| Increase (Decrease) in Net Assets | | | | |
| Operations | | | | |
| Net investment income (loss) | $ | 6,220,714 | $ | 15,393,791 |
| Net realized gain (loss) | | 24,869,387 | | 16,244,128 |
| Change in net unrealized appreciation (depreciation) | | (66,891,283) | | (49,018,005) |
| Net increase (decrease) in net assets resulting from operations | | (35,801,182) | | (17,380,086) |
| Distributions to shareholders | | (17,275,171) | | (42,208,285) |
| | | | | |
| Share transactions - net increase (decrease) | | (119,193,626) | | 47,417,119 |
| Total increase (decrease) in net assets | | (172,269,979) | | (12,171,252) |
| | | | | |
| Net Assets | | | | |
| Beginning of period | | 818,600,178 | | 830,771,430 |
| End of period | $ | 646,330,199 | $ | 818,600,178 |
| | | | | |
| | | | | |
Financial Highlights
| Fidelity Advisor® Utilities Fund Class A |
| |
| | Six months ended (Unaudited) January 31, 2024 | | Years ended July 31, 2023 | | 2022 | | 2021 | | 2020 | | 2019 |
Selected Per-Share Data | | | | | | | | | | | | |
| Net asset value, beginning of period | $ | 37.27 | $ | 39.71 | $ | 34.53 | $ | 30.67 | $ | 31.73 | $ | 31.54 |
| Income from Investment Operations | | | | | | | | | | | | |
Net investment income (loss) A,B | | .30 | | .64 | | .52 | | .56 | | .60 | | .67 |
| Net realized and unrealized gain (loss) | | (1.88) | | (1.29) | | 5.84 | | 3.98 | | (1.03) | | 2.81 |
| Total from investment operations | | (1.58) | | (.65) | | 6.36 | | 4.54 | | (.43) | | 3.48 |
| Distributions from net investment income | | (.42) | | (.64) | | (.67) | | (.68) | | (.62) | | (.48) |
| Distributions from net realized gain | | (.49) | | (1.15) | | (.51) | | - | | - C | | (2.81) |
| Total distributions | | (.91) | | (1.79) | | (1.18) | | (.68) | | (.63) D | | (3.29) |
| Net asset value, end of period | $ | 34.78 | $ | 37.27 | $ | 39.71 | $ | 34.53 | $ | 30.67 | $ | 31.73 |
Total Return E,F,G | | (4.26)% | | (1.58)% | | 18.70% | | 14.95% | | (1.56)% | | 11.73% |
Ratios to Average Net Assets B,H,I | | | | | | | | | | | | |
| Expenses before reductions | | 1.02% J | | 1.01% | | 1.02% | | 1.05% | | 1.06% | | 1.08% |
| Expenses net of fee waivers, if any | | 1.02% J | | 1.01% | | 1.02% | | 1.04% | | 1.06% | | 1.07% |
| Expenses net of all reductions | | 1.02% J | | 1.01% | | 1.02% | | 1.03% | | 1.05% | | 1.06% |
| Net investment income (loss) | | 1.73% J | | 1.71% | | 1.41% | | 1.70% | | 1.88% | | 2.14% |
| Supplemental Data | | | | | | | | | | | | |
| Net assets, end of period (000 omitted) | $ | 291,108 | $ | 327,807 | $ | 322,060 | $ | 254,388 | $ | 249,158 | $ | 268,246 |
Portfolio turnover rate K | | 89% J | | 66% | | 36% | | 45% | | 80% L | | 56% |
ACalculated based on average shares outstanding during the period.
BNet investment income (loss) is affected by the timing of the declaration of dividends by any underlying mutual funds or exchange-traded funds (ETFs). Net investment income (loss) of any mutual funds or ETFs is not included in the Fund's net investment income (loss) ratio.
CAmount represents less than $.005 per share.
DTotal distributions per share do not sum due to rounding.
ETotal returns for periods of less than one year are not annualized.
FTotal returns would have been lower if certain expenses had not been reduced during the applicable periods shown.
GTotal returns do not include the effect of the sales charges.
HFees and expenses of any underlying mutual funds or exchange-traded funds (ETFs) are not included in the Fund's expense ratio. The Fund indirectly bears its proportionate share of these expenses. For additional expense information related to investments in Fidelity Central Funds, please refer to the "Investments in Fidelity Central Funds" note found in the Notes to Financial Statements section of the most recent Annual or Semi-Annual report.
IExpense ratios reflect operating expenses of the class. Expenses before reductions do not reflect amounts reimbursed, waived, or reduced through arrangements with the investment adviser, brokerage services, or other offset arrangements, if applicable, and do not represent the amount paid by the class during periods when reimbursements, waivers or reductions occur.
JAnnualized.
KAmount does not include the portfolio activity of any underlying mutual funds or exchange-traded funds (ETFs).
LPortfolio turnover rate excludes securities received or delivered in-kind.
| Fidelity Advisor® Utilities Fund Class M |
| |
| | Six months ended (Unaudited) January 31, 2024 | | Years ended July 31, 2023 | | 2022 | | 2021 | | 2020 | | 2019 |
Selected Per-Share Data | | | | | | | | | | | | |
| Net asset value, beginning of period | $ | 37.37 | $ | 39.81 | $ | 34.57 | $ | 30.71 | $ | 31.77 | $ | 31.58 |
| Income from Investment Operations | | | | | | | | | | | | |
Net investment income (loss) A,B | | .26 | | .54 | | .42 | | .47 | | .51 | | .58 |
| Net realized and unrealized gain (loss) | | (1.88) | | (1.29) | | 5.85 | | 3.99 | | (1.03) | | 2.81 |
| Total from investment operations | | (1.62) | | (.75) | | 6.27 | | 4.46 | | (.52) | | 3.39 |
| Distributions from net investment income | | (.37) | | (.54) | | (.51) | | (.60) | | (.53) | | (.39) |
| Distributions from net realized gain | | (.49) | | (1.15) | | (.51) | | - | | - C | | (2.81) |
| Total distributions | | (.86) | | (1.69) | | (1.03) D | | (.60) | | (.54) D | | (3.20) |
| Net asset value, end of period | $ | 34.89 | $ | 37.37 | $ | 39.81 | $ | 34.57 | $ | 30.71 | $ | 31.77 |
Total Return E,F,G | | (4.37)% | | (1.85)% | | 18.37% | | 14.63% | | (1.82)% | | 11.38% |
Ratios to Average Net Assets B,H,I | | | | | | | | | | | | |
| Expenses before reductions | | 1.29% J | | 1.28% | | 1.30% | | 1.32% | | 1.33% | | 1.36% |
| Expenses net of fee waivers, if any | | 1.28% J | | 1.27% | | 1.29% | | 1.32% | | 1.33% | | 1.36% |
| Expenses net of all reductions | | 1.28% J | | 1.27% | | 1.29% | | 1.31% | | 1.33% | | 1.35% |
| Net investment income (loss) | | 1.46% J | | 1.45% | | 1.14% | | 1.42% | | 1.60% | | 1.86% |
| Supplemental Data | | | | | | | | | | | | |
| Net assets, end of period (000 omitted) | $ | 60,718 | $ | 68,733 | $ | 71,690 | $ | 58,065 | $ | 58,773 | $ | 61,741 |
Portfolio turnover rate K | | 89% J | | 66% | | 36% | | 45% | | 80% L | | 56% |
ACalculated based on average shares outstanding during the period.
BNet investment income (loss) is affected by the timing of the declaration of dividends by any underlying mutual funds or exchange-traded funds (ETFs). Net investment income (loss) of any mutual funds or ETFs is not included in the Fund's net investment income (loss) ratio.
CAmount represents less than $.005 per share.
DTotal distributions per share do not sum due to rounding.
ETotal returns for periods of less than one year are not annualized.
FTotal returns would have been lower if certain expenses had not been reduced during the applicable periods shown.
GTotal returns do not include the effect of the sales charges.
HFees and expenses of any underlying mutual funds or exchange-traded funds (ETFs) are not included in the Fund's expense ratio. The Fund indirectly bears its proportionate share of these expenses. For additional expense information related to investments in Fidelity Central Funds, please refer to the "Investments in Fidelity Central Funds" note found in the Notes to Financial Statements section of the most recent Annual or Semi-Annual report.
IExpense ratios reflect operating expenses of the class. Expenses before reductions do not reflect amounts reimbursed, waived, or reduced through arrangements with the investment adviser, brokerage services, or other offset arrangements, if applicable, and do not represent the amount paid by the class during periods when reimbursements, waivers or reductions occur.
JAnnualized.
KAmount does not include the portfolio activity of any underlying mutual funds or exchange-traded funds (ETFs).
LPortfolio turnover rate excludes securities received or delivered in-kind.
| Fidelity Advisor® Utilities Fund Class C |
| |
| | Six months ended (Unaudited) January 31, 2024 | | Years ended July 31, 2023 | | 2022 | | 2021 | | 2020 | | 2019 |
Selected Per-Share Data | | | | | | | | | | | | |
| Net asset value, beginning of period | $ | 36.30 | $ | 38.73 | $ | 33.60 | $ | 29.83 | $ | 30.90 | $ | 30.81 |
| Income from Investment Operations | | | | | | | | | | | | |
Net investment income (loss) A,B | | .17 | | .35 | | .24 | | .30 | | .35 | | .42 |
| Net realized and unrealized gain (loss) | | (1.83) | | (1.26) | | 5.67 | | 3.88 | | (1.01) | | 2.74 |
| Total from investment operations | | (1.66) | | (.91) | | 5.91 | | 4.18 | | (.66) | | 3.16 |
| Distributions from net investment income | | (.28) | | (.37) | | (.27) | | (.41) | | (.40) | | (.26) |
| Distributions from net realized gain | | (.49) | | (1.15) | | (.51) | | - | | - C | | (2.81) |
| Total distributions | | (.77) | | (1.52) | | (.78) | | (.41) | | (.41) D | | (3.07) |
| Net asset value, end of period | $ | 33.87 | $ | 36.30 | $ | 38.73 | $ | 33.60 | $ | 29.83 | $ | 30.90 |
Total Return E,F,G | | (4.61)% | | (2.34)% | | 17.78% | | 14.10% | | (2.28)% | | 10.87% |
Ratios to Average Net Assets B,H,I | | | | | | | | | | | | |
| Expenses before reductions | | 1.78% J | | 1.77% | | 1.78% | | 1.80% | | 1.81% | | 1.83% |
| Expenses net of fee waivers, if any | | 1.77% J | | 1.76% | | 1.78% | | 1.80% | | 1.81% | | 1.83% |
| Expenses net of all reductions | | 1.77% J | | 1.76% | | 1.78% | | 1.79% | | 1.80% | | 1.82% |
| Net investment income (loss) | | .97% J | | .96% | | .65% | | .94% | | 1.12% | | 1.39% |
| Supplemental Data | | | | | | | | | | | | |
| Net assets, end of period (000 omitted) | $ | 49,544 | $ | 58,042 | $ | 61,087 | $ | 49,312 | $ | 63,458 | $ | 66,525 |
Portfolio turnover rate K | | 89% J | | 66% | | 36% | | 45% | | 80% L | | 56% |
ACalculated based on average shares outstanding during the period.
BNet investment income (loss) is affected by the timing of the declaration of dividends by any underlying mutual funds or exchange-traded funds (ETFs). Net investment income (loss) of any mutual funds or ETFs is not included in the Fund's net investment income (loss) ratio.
CAmount represents less than $.005 per share.
DTotal distributions per share do not sum due to rounding.
ETotal returns for periods of less than one year are not annualized.
FTotal returns would have been lower if certain expenses had not been reduced during the applicable periods shown.
GTotal returns do not include the effect of the contingent deferred sales charge.
HFees and expenses of any underlying mutual funds or exchange-traded funds (ETFs) are not included in the Fund's expense ratio. The Fund indirectly bears its proportionate share of these expenses. For additional expense information related to investments in Fidelity Central Funds, please refer to the "Investments in Fidelity Central Funds" note found in the Notes to Financial Statements section of the most recent Annual or Semi-Annual report.
IExpense ratios reflect operating expenses of the class. Expenses before reductions do not reflect amounts reimbursed, waived, or reduced through arrangements with the investment adviser, brokerage services, or other offset arrangements, if applicable, and do not represent the amount paid by the class during periods when reimbursements, waivers or reductions occur.
JAnnualized.
KAmount does not include the portfolio activity of any underlying mutual funds or exchange-traded funds (ETFs).
LPortfolio turnover rate excludes securities received or delivered in-kind.
| Fidelity Advisor® Utilities Fund Class I |
| |
| | Six months ended (Unaudited) January 31, 2024 | | Years ended July 31, 2023 | | 2022 | | 2021 | | 2020 | | 2019 |
Selected Per-Share Data | | | | | | | | | | | | |
| Net asset value, beginning of period | $ | 38.22 | $ | 40.68 | $ | 35.39 | $ | 31.40 | $ | 32.47 | $ | 32.21 |
| Income from Investment Operations | | | | | | | | | | | | |
Net investment income (loss) A,B | | .36 | | .76 | | .64 | | .66 | | .71 | | .76 |
| Net realized and unrealized gain (loss) | | (1.92) | | (1.33) | | 5.98 | | 4.10 | | (1.07) | | 2.88 |
| Total from investment operations | | (1.56) | | (.57) | | 6.62 | | 4.76 | | (.36) | | 3.64 |
| Distributions from net investment income | | (.47) | | (.74) | | (.81) | | (.77) | | (.71) | | (.58) |
| Distributions from net realized gain | | (.49) | | (1.15) | | (.51) | | - | | - C | | (2.81) |
| Total distributions | | (.96) | | (1.89) | | (1.33) D | | (.77) | | (.71) | | (3.38) D |
| Net asset value, end of period | $ | 35.70 | $ | 38.22 | $ | 40.68 | $ | 35.39 | $ | 31.40 | $ | 32.47 |
Total Return E,F | | (4.11)% | | (1.34)% | | 19.00% | | 15.30% | | (1.30)% | | 12.04% |
Ratios to Average Net Assets B,G,H | | | | | | | | | | | | |
| Expenses before reductions | | .76% I | | .75% | | .76% | | .77% | | .79% | | .81% |
| Expenses net of fee waivers, if any | | .75% I | | .74% | | .75% | | .77% | | .78% | | .80% |
| Expenses net of all reductions | | .75% I | | .74% | | .75% | | .76% | | .78% | | .79% |
| Net investment income (loss) | | 1.99% I | | 1.98% | | 1.68% | | 1.97% | | 2.15% | | 2.41% |
| Supplemental Data | | | | | | | | | | | | |
| Net assets, end of period (000 omitted) | $ | 179,227 | $ | 255,201 | $ | 269,667 | $ | 143,582 | $ | 187,833 | $ | 229,777 |
Portfolio turnover rate J | | 89% I | | 66% | | 36% | | 45% | | 80% K | | 56% |
ACalculated based on average shares outstanding during the period.
BNet investment income (loss) is affected by the timing of the declaration of dividends by any underlying mutual funds or exchange-traded funds (ETFs). Net investment income (loss) of any mutual funds or ETFs is not included in the Fund's net investment income (loss) ratio.
CAmount represents less than $.005 per share.
DTotal distributions per share do not sum due to rounding.
ETotal returns for periods of less than one year are not annualized.
FTotal returns would have been lower if certain expenses had not been reduced during the applicable periods shown.
GFees and expenses of any underlying mutual funds or exchange-traded funds (ETFs) are not included in the Fund's expense ratio. The Fund indirectly bears its proportionate share of these expenses. For additional expense information related to investments in Fidelity Central Funds, please refer to the "Investments in Fidelity Central Funds" note found in the Notes to Financial Statements section of the most recent Annual or Semi-Annual report.
HExpense ratios reflect operating expenses of the class. Expenses before reductions do not reflect amounts reimbursed, waived, or reduced through arrangements with the investment adviser, brokerage services, or other offset arrangements, if applicable, and do not represent the amount paid by the class during periods when reimbursements, waivers or reductions occur.
IAnnualized.
JAmount does not include the portfolio activity of any underlying mutual funds or exchange-traded funds (ETFs).
KPortfolio turnover rate excludes securities received or delivered in-kind.
| Fidelity Advisor® Utilities Fund Class Z |
| |
| | Six months ended (Unaudited) January 31, 2024 | | Years ended July 31, 2023 | | 2022 | | 2021 | | 2020 | | 2019 A |
Selected Per-Share Data | | | | | | | | | | | | |
| Net asset value, beginning of period | $ | 38.20 | $ | 40.66 | $ | 35.38 | $ | 31.42 | $ | 32.48 | $ | 33.14 |
| Income from Investment Operations | | | | | | | | | | | | |
Net investment income (loss) B,C | | .38 | | .81 | | .69 | | .71 | | .74 | | .63 |
| Net realized and unrealized gain (loss) | | (1.93) | | (1.33) | | 5.98 | | 4.08 | | (1.04) | | 2.13 |
| Total from investment operations | | (1.55) | | (.52) | | 6.67 | | 4.79 | | (.30) | | 2.76 |
| Distributions from net investment income | | (.50) | | (.79) | | (.88) | | (.83) | | (.75) | | (.61) |
| Distributions from net realized gain | | (.49) | | (1.15) | | (.51) | | - | | - D | | (2.81) |
| Total distributions | | (.98) E | | (1.94) | | (1.39) | | (.83) | | (.76) E | | (3.42) |
| Net asset value, end of period | $ | 35.67 | $ | 38.20 | $ | 40.66 | $ | 35.38 | $ | 31.42 | $ | 32.48 |
Total Return F,G | | (4.06)% | | (1.21)% | | 19.17% | | 15.41% | | (1.15)% | | 9.04% |
Ratios to Average Net Assets C,H,I | | | | | | | | | | | | |
| Expenses before reductions | | .63% J | | .62% | | .63% | | .64% | | .65% | | .66% J |
| Expenses net of fee waivers, if any | | .62% J | | .62% | | .63% | | .64% | | .65% | | .66% J |
| Expenses net of all reductions | | .62% J | | .62% | | .63% | | .63% | | .64% | | .64% J |
| Net investment income (loss) | | 2.12% J | | 2.10% | | 1.81% | | 2.10% | | 2.29% | | 2.41% J |
| Supplemental Data | | | | | | | | | | | | |
| Net assets, end of period (000 omitted) | $ | 65,733 | $ | 108,817 | $ | 106,266 | $ | 54,746 | $ | 52,034 | $ | 17,071 |
Portfolio turnover rate K | | 89% J | | 66% | | 36% | | 45% | | 80% L | | 56% |
AFor the period October 2, 2018 (commencement of sale of shares) through July 31, 2019.
BCalculated based on average shares outstanding during the period.
CNet investment income (loss) is affected by the timing of the declaration of dividends by any underlying mutual funds or exchange-traded funds (ETFs). Net investment income (loss) of any mutual funds or ETFs is not included in the Fund's net investment income (loss) ratio.
DAmount represents less than $.005 per share.
ETotal distributions per share do not sum due to rounding.
FTotal returns for periods of less than one year are not annualized.
GTotal returns would have been lower if certain expenses had not been reduced during the applicable periods shown.
HFees and expenses of any underlying mutual funds or exchange-traded funds (ETFs) are not included in the Fund's expense ratio. The Fund indirectly bears its proportionate share of these expenses. For additional expense information related to investments in Fidelity Central Funds, please refer to the "Investments in Fidelity Central Funds" note found in the Notes to Financial Statements section of the most recent Annual or Semi-Annual report.
IExpense ratios reflect operating expenses of the class. Expenses before reductions do not reflect amounts reimbursed, waived, or reduced through arrangements with the investment adviser, brokerage services, or other offset arrangements, if applicable, and do not represent the amount paid by the class during periods when reimbursements, waivers or reductions occur.
JAnnualized.
KAmount does not include the portfolio activity of any underlying mutual funds or exchange-traded funds (ETFs).
LPortfolio turnover rate excludes securities received or delivered in-kind.
For the period ended January 31, 2024
1. Organization.
Fidelity Advisor Biotechnology Fund, Fidelity Advisor Consumer Discretionary Fund, Fidelity Advisor Energy Fund, Fidelity Advisor Financials Fund, Fidelity Advisor Health Care Fund, Fidelity Advisor Industrials Fund, Fidelity Advisor Semiconductors Fund, Fidelity Advisor Technology Fund and Fidelity Advisor Utilities Fund (the Funds) are funds of Fidelity Advisor Series VII (the Trust) and are authorized to issue an unlimited number of shares. The Trust is registered under the Investment Company Act of 1940, as amended (the 1940 Act), as an open-end management investment company organized as a Massachusetts business trust. The Funds are non-diversified with the exception of Fidelity Advisor Financials Fund and Fidelity Advisor Health Care Fund. Each Fund offers Class A, Class M, Class C, Class I and Class Z shares, each of which has equal rights as to assets and voting privileges. Class A, Class M, Class C, Class I and Class Z are Fidelity Advisor classes. Each class has exclusive voting rights with respect to matters that affect that class. Class C shares will automatically convert to Class A shares after a holding period of eight years from the initial date of purchase, with certain exceptions. Investments in emerging markets, if applicable, can be subject to social, economic, regulatory, and political uncertainties and can be extremely volatile. The financial statements for Fidelity Advisor Health Care Fund have been consolidated to include the Subsidiary accounts (see Consolidated Subsidiary note below).
2. Investments in Fidelity Central Funds.
Funds may invest in Fidelity Central Funds, which are open-end investment companies generally available only to other investment companies and accounts managed by the investment adviser and its affiliates. The Schedule of Investments lists any Fidelity Central Funds held as an investment as of period end, but does not include the underlying holdings of each Fidelity Central Fund. An investing fund indirectly bears its proportionate share of the expenses of the underlying Fidelity Central Funds.
Based on its investment objective, each Fidelity Central Fund may invest or participate in various investment vehicles or strategies that are similar to those of the investing fund. These strategies are consistent with the investment objectives of the investing fund and may involve certain economic risks which may cause a decline in value of each of the Fidelity Central Funds and thus a decline in the value of the investing fund.
| Fidelity Central Fund | Investment Manager | Investment Objective | Investment Practices | Expense RatioA |
| Fidelity Money Market Central Funds | Fidelity Management & Research Company LLC (FMR) | Each fund seeks to obtain a high level of current income consistent with the preservation of capital and liquidity. | Short-term Investments | Less than .005% |
A Expenses expressed as a percentage of average net assets and are as of each underlying Central Fund's most recent annual or semi-annual shareholder report.
A complete unaudited list of holdings for each Fidelity Central Fund is available upon request or at the Securities and Exchange Commission website at www.sec.gov. In addition, the financial statements of the Fidelity Central Funds which contain the significant accounting policies (including investment valuation policies) of those funds, and are not covered by the Report of Independent Registered Public Accounting Firm, are available on the Securities and Exchange Commission website or upon request.
3. Significant Accounting Policies.
Each Fund is an investment company and applies the accounting and reporting guidance of the Financial Accounting Standards Board (FASB) Accounting Standards Codification Topic 946 Financial Services - Investment Companies. The financial statements have been prepared in conformity with accounting principles generally accepted in the United States of America (GAAP), which require management to make certain estimates and assumptions at the date of the financial statements. Actual results could differ from those estimates. Subsequent events, if any, through the date that the financial statements were issued have been evaluated in the preparation of the financial statements. Each Fund's Schedule of Investments lists any underlying mutual funds or exchange-traded funds (ETFs) but does not include the underlying holdings of these funds. The following summarizes the significant accounting policies of each Fund:
Investment Valuation. Investments are valued as of 4:00 p.m. Eastern time on the last calendar day of the period. The Board of Trustees (the Board) has designated each Fund's investment adviser as the valuation designee responsible for the fair valuation function and performing fair value determinations as needed. The investment adviser has established a Fair Value Committee (the Committee) to carry out the day-to-day fair valuation responsibilities and has adopted policies and procedures to govern the fair valuation process and the activities of the Committee. In accordance with these fair valuation policies and procedures, which have been approved by the Board, each Fund attempts to obtain prices from one or more third party pricing services or brokers to value its investments. When current market prices, quotations or currency exchange rates are not readily available or reliable, investments will be fair valued in good faith by the Committee, in accordance with the policies and procedures. Factors used in determining fair value vary by investment type and may include market or investment specific events, transaction data, estimated cash flows, and market observations of comparable investments. The frequency that the fair valuation procedures are used cannot be predicted and they may be utilized to a significant extent. The Committee manages each Fund's fair valuation practices and maintains the fair valuation policies and procedures. Each Fund's investment adviser reports to the Board information regarding the fair valuation process and related material matters.
Each Fund categorizes the inputs to valuation techniques used to value its investments into a disclosure hierarchy consisting of three levels as shown below:
Level 1 - unadjusted quoted prices in active markets for identical investments
Level 2 - other significant observable inputs (including quoted prices for similar investments, interest rates, prepayment speeds, etc.)
Level 3 - unobservable inputs (including the Fund's own assumptions based on the best information available)
Valuation techniques used to value each Fund's investments by major category are as follows:
Equity securities, including restricted securities, for which market quotations are readily available, are valued at the last reported sale price or official closing price as reported by a third party pricing service on the primary market or exchange on which they are traded and are categorized as Level 1 in the hierarchy. In the event there were no sales during the day or closing prices are not available, securities are valued at the last quoted bid price or may be valued using the last available price and are generally categorized as Level 2 in the hierarchy. For foreign equity securities, when market or security specific events arise, comparisons to the valuation of American Depositary Receipts (ADRs), futures contracts, ETFs and certain indexes as well as quoted prices for similar securities may be used and would be categorized as Level 2 in the hierarchy. For equity securities, including restricted securities, where observable inputs are limited, assumptions about market activity and risk are used and these securities may be categorized as Level 3 in the hierarchy. Securities, including private placements or other restricted securities, for which observable inputs are not available are valued using alternate valuation approaches, including the market approach, the income approach and cost approach, and are categorized as Level 3 in the hierarchy. The market approach considers factors including the price of recent investments in the same or a similar security or financial metrics of comparable securities. The income approach considers factors including expected future cash flows, security specific risks and corresponding discount rates. The cost approach considers factors including the value of the security's underlying assets and liabilities.
Debt securities, including restricted securities, are valued based on evaluated prices received from third party pricing services or from brokers who make markets in such securities. Corporate bonds and preferred securities are valued by pricing services who utilize matrix pricing which considers yield or price of bonds of comparable quality, coupon, maturity and type or by broker-supplied prices. When independent prices are unavailable or unreliable, debt securities may be valued utilizing pricing methodologies which consider similar factors that would be used by third party pricing services. Debt securities are generally categorized as Level 2 in the hierarchy but may be Level 3 depending on the circumstances.
Investments in open-end mutual funds, including the Fidelity Central Funds, are valued at their closing net asset value (NAV) each business day and are categorized as Level 1 in the hierarchy.
The following provides information on Level 3 securities held by the Fund that were valued at period end based on unobservable inputs. These amounts exclude valuations provided by a broker.
Fidelity Advisor Biotechnology Fund
| Asset Type | Fair Value | Valuation Technique(s) | Unobservable Input | Amount or Range/Weighted Average | Impact to Valuation from an Increase in InputA |
| Equities | $36,894,086 | Market approach | Transaction price | $0.00 - $12.40 / $4.08 | Increase |
| | | | Discount rate | 5.0% - 35.0% / 23.8% | Decrease |
| | | | Premium rate | 10.0% | Increase |
| | | Recovery value | Recovery value | $0.00 | Increase |
| | | Discounted cash flow | Discount rate | 4.7% - 6.2% / 5.2% | Decrease |
| | | | Probability rate | 0.0% - 90.0% / 45.0% | Increase |
| | | | Term | 0.2 - 7.2 / 3.7 | Increase |
| | | Black scholes | Discount rate | 4.1% - 4.3% / 4.2% | Increase |
| | | | Volatility | 75.0% - 100.0% / 84.5% | Increase |
| | | | Term | 2.0 - 3.0 / 2.9 | Increase |
A Represents the directional change in the fair value of the Level 3 investments that could have resulted from an increase in the corresponding input as of period end. A decrease to the unobservable input would have had the opposite effect. Significant changes in these inputs may have resulted in a significantly higher or lower fair value measurement at period end.
Fidelity Advisor Health Care Fund
| Asset Type | Fair Value | Valuation Technique(s) | Unobservable Input | Amount or Range/Weighted Average | Impact to Valuation from an Increase in InputA |
| Equities | $61,436,335 | Market comparable | Enterprise value/Revenue multiple (EV/R) | 2.3 - 20.0 / 5.6 | Increase |
| | | Market approach | Transaction price | $7.75 - $20.56 / $13.55 | Increase |
| | | | Discount rate | 10.0% - 65.0% / 23.1% | Decrease |
| | | Black scholes | Discount rate | 4.1% - 4.6% / 4.2% | Increase |
| | | | Volatility | 45.0% - 90.0% / 60.6% | Increase |
| | | | Term | 1.5 - 4.0 / 3.0 | Increase |
A Represents the directional change in the fair value of the Level 3 investments that could have resulted from an increase in the corresponding input as of period end. A decrease to the unobservable input would have had the opposite effect. Significant changes in these inputs may have resulted in a significantly higher or lower fair value measurement at period end.
Fidelity Advisor Technology Fund
| Asset Type | Fair Value | Valuation Technique(s) | Unobservable Input | Amount or Range/Weighted Average | Impact to Valuation from an Increase in InputA |
| Equities | $87,966,038 | Market comparable | Enterprise value/Revenue multiple (EV/R) | 1.0 - 30.8 / 10.3 | Increase |
| | | Market approach | Transaction price | $1.11 - $59.45 / $6.72 | Increase |
| | | | Discount rate | 30.0% - 75.0% / 31.1% | Decrease |
| | | | Premium rate | 20.0% - 45.0% / 26.0% | Increase |
| | | Recovery value | Recovery value | $0.00 | Increase |
| | | Discounted cash flow | Weighted average cost of capital (WACC) | 27.8% | Decrease |
| | | | Exit multiple | 1.5 | Increase |
| | | Black scholes | Discount rate | 4.0% - 4.3% / 4.1% | Increase |
| | | | Volatility | 50.0% - 100.0% / 79.4% | Increase |
| | | | Term | 2.0 - 5.0 / 3.8 | Increase |
| Corporate Bonds | $2,986,270 | Recovery value | Recovery value | $0.00 | Increase |
| | | Discounted cash flow | Discount rate | 3.5% | Decrease |
| Preferred Securities | $831,360 | Market approach | Transaction price | $100.00 | Increase |
| | | | Discount rate | 27.1% - 35.4% / 32.2% | Decrease |
| | | | Probability rate | 10.0% - 60.0% / 42.0% | Increase |
| | | Black scholes | Discount rate | 4.2% - 4.3% / 4.2% | Increase |
| | | | Volatility | 70.0% - 100.0% / 88.6% | Increase |
| | | | Term | 2.0 - 3.0 / 2.6 | Increase |
A Represents the directional change in the fair value of the Level 3 investments that could have resulted from an increase in the corresponding input as of period end. A decrease to the unobservable input would have had the opposite effect. Significant changes in these inputs may have resulted in a significantly higher or lower fair value measurement at period end.
Changes in valuation techniques may result in transfers in or out of an assigned level within the disclosure hierarchy. The aggregate value of investments by input level as of January 31, 2024, as well as a roll forward of Level 3 investments, is included at the end of each Fund's Schedule of Investments.
Foreign Currency. Certain Funds may use foreign currency contracts to facilitate transactions in foreign-denominated securities. Gains and losses from these transactions may arise from changes in the value of the foreign currency or if the counterparties do not perform under the contracts' terms.
Foreign-denominated assets, including investment securities, and liabilities are translated into U.S. dollars at the exchange rates at period end. Purchases and sales of investment securities, income and dividends received, and expenses denominated in foreign currencies are translated into U.S. dollars at the exchange rate in effect on the transaction date.
The effects of exchange rate fluctuations on investments are included with the net realized and unrealized gain (loss) on investment securities. Other foreign currency transactions resulting in realized and unrealized gain (loss) are disclosed separately.
Investment Transactions and Income. For financial reporting purposes, the Funds' investment holdings and NAV include trades executed through the end of the last business day of the period. The NAV per share for processing shareholder transactions is calculated as of the close of business of the New York Stock Exchange (NYSE), normally 4:00 p.m. Eastern time and includes trades executed through the end of the prior business day. Gains and losses on securities sold are determined on the basis of identified cost and for certain Funds include proceeds received from litigation. Commissions paid to certain brokers with whom the investment adviser, or its affiliates, places trades on behalf of a fund include an amount in addition to trade execution, which may be rebated back to a fund. Any such rebates are included in net realized gain (loss) on investments in the Statement of Operations. Dividend income is recorded on the ex-dividend date, except for certain dividends from foreign securities where the ex-dividend date may have passed, which are recorded as soon as the Funds are informed of the ex-dividend date. Non-cash dividends included in dividend income, if any, are recorded at the fair market value of the securities received. Income and capital gain distributions from Fidelity Central Funds, if any, are recorded on the ex-dividend date. Certain distributions received by the Funds represent a return of capital or capital gain. The Funds determine the components of these distributions subsequent to the ex-dividend date, based upon receipt of tax filings or other correspondence relating to the underlying investment. These distributions are recorded as a reduction of cost of investments and/or as a realized gain. Large, non-recurring dividends recognized by the Funds are presented separately on the Statement of Operations as "Special Dividends" and the impact of these dividends is presented in the Financial Highlights. Interest income is accrued as earned and includes coupon interest and amortization of premium and accretion of discount on debt securities as applicable. Investment income is recorded net of foreign taxes withheld where recovery of such taxes is uncertain. Funds may file withholding tax reclaims in certain jurisdictions to recover a portion of amounts previously withheld. Any withholding tax reclaims income is included in the Statement of Operations in dividends. Any receivables for withholding tax reclaims are included in the Statement of Assets and Liabilities in dividends receivable.
Class Allocations and Expenses. Investment income, realized and unrealized capital gains and losses, common expenses of a fund, and certain fund-level expense reductions, if any, are allocated daily on a pro-rata basis to each class based on the relative net assets of each class to the total net assets of a fund. Each class differs with respect to transfer agent and distribution and service plan fees incurred, as applicable. Certain expense reductions may also differ by class, if applicable. For the reporting period, the allocated portion of income and expenses to each class as a percent of its average net assets may vary due to the timing of recording these transactions in relation to fluctuating net assets of the classes. Expenses directly attributable to a fund are charged to that fund. Expenses attributable to more than one fund are allocated among the respective funds on the basis of relative net assets or other appropriate methods. Expenses included in the accompanying financial statements reflect the expenses of that fund and do not include any expenses associated with any underlying mutual funds or exchange-traded funds (ETFs). Although not included in a fund's expenses, a fund indirectly bears its proportionate share of these expenses through the net asset value of each underlying mutual fund or exchange-traded fund (ETF). Expense estimates are accrued in the period to which they relate and adjustments are made when actual amounts are known.
Deferred Trustee Compensation. Under a Deferred Compensation Plan (the Plan) for certain Funds, certain independent Trustees have elected to defer receipt of a portion of their annual compensation. Deferred amounts are invested in affiliated mutual funds, are marked-to-market and remain in a fund until distributed in accordance with the Plan. The investment of deferred amounts and the offsetting payable to the Trustees presented below are included in the accompanying Statement of Assets and Liabilities in other receivables and other payables and accrued expenses, as applicable.
| Fidelity Advisor Energy Fund | 92,804 |
| Fidelity Advisor Technology Fund | 148,950 |
Income Tax Information and Distributions to Shareholders. Each year, each Fund intends to qualify as a regulated investment company under Subchapter M of the Internal Revenue Code, including distributing substantially all of its taxable income and realized gains. As a result, no provision for U.S. Federal income taxes is required. Each Fund files a U.S. federal tax return, in addition to state and local tax returns as required. Each Fund's federal income tax returns are subject to examination by the Internal Revenue Service (IRS) for a period of three fiscal years after they are filed. State and local tax returns may be subject to examination for an additional fiscal year depending on the jurisdiction. Foreign taxes are provided for based on each Fund's understanding of the tax rules and rates that exist in the foreign markets in which it invests.
Distributions are declared and recorded on the ex-dividend date. Income and capital gain distributions are declared separately for each class. Income and capital gain distributions are determined in accordance with income tax regulations, which may differ from GAAP.
Capital accounts within the financial statements are adjusted for permanent book-tax differences. These adjustments have no impact on net assets or the results of operations. Capital accounts are not adjusted for temporary book-tax differences which will reverse in a subsequent period.
Book-tax differences are primarily due to foreign currency transactions, partnerships, certain foreign taxes, passive foreign investment companies (PFIC), deferred Trustee compensation, redemptions in-kind, net operating losses, capital loss carryforwards and losses deferred due to wash sales and excise tax regulations.
As of period end, the cost and unrealized appreciation (depreciation) in securities, and derivatives if applicable, for federal income tax purposes were as follows for each Fund:
| | Tax cost | Gross unrealized appreciation | Gross unrealized depreciation | Net unrealized appreciation (depreciation) |
| Fidelity Advisor Biotechnology Fund | $1,249,683,822 | $588,495,071 | $(46,523,774) | $541,971,297 |
Fidelity Advisor Consumer Discretionary Fund | 257,745,915 | 211,691,326 | (8,099,881) | 203,591,445 |
| Fidelity Advisor Energy Fund | 701,637,040 | 436,748,525 | (12,415,216) | 424,333,309 |
| Fidelity Advisor Financials Fund | 358,184,825 | 89,449,283 | (10,350,947) | 79,098,336 |
| Fidelity Advisor Health Care Fund | 3,365,102,442 | 1,916,231,225 | (272,353,993) | 1,643,877,232 |
| Fidelity Advisor Industrials Fund | 400,072,083 | 96,866,486 | (8,666,985) | 88,199,501 |
Fidelity Advisor Semiconductors Fund | 1,074,328,443 | 714,986,002 | (31,532,179) | 683,453,823 |
| Fidelity Advisor Technology Fund | 2,788,474,176 | 2,707,672,306 | (178,245,028) | 2,529,427,278 |
| Fidelity Advisor Utilities Fund | 575,844,855 | 99,164,658 | (28,188,910) | 70,975,748 |
Capital loss carryforwards are only available to offset future capital gains of the Funds to the extent provided by regulations and may be limited. The capital loss carryforward information presented below, including any applicable limitation, is estimated as of prior fiscal period end and is subject to adjustment.
| | Short-term | Long-term | Total capital loss carryforward |
| Fidelity Advisor Biotechnology Fund | $(28,267,198) | $- | $(28,267,198) |
Fidelity Advisor Consumer Discretionary Fund | (6,500,519) | - | (6,500,519) |
| Fidelity Advisor Energy Fund | (189,871,773) | (88,148,356) | (278,020,129) |
| Fidelity Advisor Financials Fund | (6,017,984) | - | (6,017,984) |
| Fidelity Advisor Health Care Fund | (16,082,102) | - | (16,082,102) |
Delayed Delivery Transactions and When-Issued Securities. During the period, certain Funds transacted in securities on a delayed delivery or when-issued basis. Payment and delivery may take place after the customary settlement period for that security. The price of the underlying securities and the date when the securities will be delivered and paid for are fixed at the time the transaction is negotiated. Securities purchased on a delayed delivery or when-issued basis are identified as such in the Schedule of Investments. Compensation for interest forgone in the purchase of a delayed delivery or when-issued debt security may be received. With respect to purchase commitments, each applicable Fund identifies securities as segregated in its records with a value at least equal to the amount of the commitment. Payables and receivables associated with the purchases and sales of delayed delivery securities having the same coupon, settlement date and broker are offset. Delayed delivery or when-issued securities that have been purchased from and sold to different brokers are reflected as both payables and receivables in the Statement of Assets and Liabilities under the caption "Delayed delivery", as applicable. Losses may arise due to changes in the value of the underlying securities or if the counterparty does not perform under the contract's terms, or if the issuer does not issue the securities due to political, economic, or other factors.
Restricted Securities (including Private Placements). Funds may invest in securities that are subject to legal or contractual restrictions on resale. These securities generally may be resold in transactions exempt from registration or to the public if the securities are registered. Disposal of these securities may involve time-consuming negotiations and expense, and prompt sale at an acceptable price may be difficult. Information regarding restricted securities held at period end is included at the end of the Schedule of Investments, if applicable.
Consolidated Subsidiary. The Funds included in the table below hold certain investments through a wholly-owned subsidiary ("Subsidiary"), which may be subject to federal and state taxes upon disposition.
As of period end, investments in Subsidiaries were as follows:
| | $ Amount | % of Net Assets |
| Fidelity Advisor Health Care Fund | 3,803,332 | .08 |
The financial statements have been consolidated to include the Subsidiary accounts where applicable. Accordingly, all inter-company transactions and balances have been eliminated.
At period end, any estimated tax liability for these investments is presented as "Deferred taxes" in the Statement of Assets and Liabilities and included in "Change in net unrealized appreciation (depreciation) on investment securities" in the Consolidated Statement of Operations. The tax liability incurred may differ materially depending on conditions when these investments are disposed. Any cash held by a Subsidiary is restricted as to its use and is presented as "Restricted cash" in the Consolidated Statement of Assets and Liabilities, if applicable.
4. Purchases and Sales of Investments.
Purchases and sales of securities, other than short-term securities and in-kind transactions, as applicable, are noted in the table below.
| | Purchases ($) | Sales ($) |
| Fidelity Advisor Biotechnology Fund | 662,249,393 | 807,140,048 |
| Fidelity Advisor Consumer Discretionary Fund | 58,961,077 | 102,119,241 |
| Fidelity Advisor Energy Fund | 228,610,912 | 364,383,385 |
| Fidelity Advisor Financials Fund | 98,018,478 | 156,563,607 |
| Fidelity Advisor Health Care Fund | 1,009,968,313 | 1,837,084,289 |
| Fidelity Advisor Industrials Fund | 79,414,565 | 150,102,603 |
| Fidelity Advisor Semiconductors Fund | 402,450,256 | 192,249,324 |
| Fidelity Advisor Technology Fund | 473,340,961 | 585,861,245 |
| Fidelity Advisor Utilities Fund | 311,472,476 | 457,827,900 |
Unaffiliated Redemptions In-Kind. Shares that were redeemed in-kind for investments, including accrued interest and cash, if any, are shown in the table below. The net realized gain or loss on investments delivered through in-kind redemptions is included in the "Net realized gain (loss) on: Redemptions in-kind" line in the accompanying Statement of Operations. The amount of the in-kind redemptions is included in share transactions in the accompanying Statement of Changes in Net Assets. There was no gain or loss for federal income tax purposes.
| | Shares | Total net realized gain or loss ($) | Total Proceeds ($) | Participating classes |
| Fidelity Advisor Consumer Discretionary Fund | 493,122 | 15,311,646 | 19,147,937 | Class I |
| Fidelity Advisor Energy Fund | 1,253,395 | 42,342,401 | 57,668,686 | Class I |
| Fidelity Advisor Financials Fund | 629,921 | 7,051,602 | 15,955,906 | Class I |
| Fidelity Advisor Industrials Fund | 553,097 | 11,201,399 | 22,245,575 | Class I |
| Fidelity Advisor Technology Fund | 1,690,112 | 75,184,814 | 169,535,169 | Class I |
Prior Fiscal Year Unaffiliated Redemptions In-Kind. Shares that were redeemed in-kind for investments, including accrued interest and cash, if any, are shown in the table below; along with realized gain or loss on investments delivered through in-kind redemptions. The amount of the in-kind redemptions is included in share transactions in the accompanying Statement of Changes in Net Assets. There was no gain or loss for federal income tax purposes.
| | Shares | Total net realized gain or loss ($) | Total Proceeds ($) | Participating classes |
| Fidelity Advisor Industrials Fund | 634,301 | 16,690,939 | 26,323,494 | Class C |
5. Fees and Other Transactions with Affiliates.
Management Fee. Fidelity Management & Research Company LLC (the investment adviser) and its affiliates provide the Funds with investment management related services for which the Funds pay a monthly management fee. The management fee is the sum of an individual fund fee rate and an annualized group fee rate. The individual fund fee rate is applied to each Fund's average net assets. The group fee rate is based upon the monthly average net assets of a group of registered investment companies with which the investment adviser has management contracts. The group fee rate decreases as assets under management increase and increases as assets under management decrease. For the reporting period, each Fund's annualized management fee rate expressed as a percentage of each Fund's average net assets was as follows:
| | Individual Rate | Group Rate | Total |
| Fidelity Advisor Biotechnology Fund | .30% | .22% | .52% |
| Fidelity Advisor Consumer Discretionary Fund | .30% | .22% | .52% |
| Fidelity Advisor Energy Fund | .30% | .22% | .52% |
| Fidelity Advisor Financials Fund | .30% | .22% | .52% |
| Fidelity Advisor Health Care Fund | .30% | .22% | .52% |
| Fidelity Advisor Industrials Fund | .30% | .22% | .52% |
| Fidelity Advisor Semiconductors Fund | .30% | .22% | .52% |
| Fidelity Advisor Technology Fund | .30% | .22% | .52% |
| Fidelity Advisor Utilities Fund | .30% | .22% | .52% |
Distribution and Service Plan Fees. In accordance with Rule 12b-1 of the 1940 Act, each Fund has adopted separate Distribution and Service Plans for each class of shares. Certain classes pay Fidelity Distributors Company LLC (FDC), an affiliate of the investment adviser, separate Distribution and Service Fees, each of which is based on an annual percentage of each class' average net assets. In addition, FDC may pay financial intermediaries for selling shares of each Fund and providing shareholder support services. For the period, the Distribution and Service Fee rates, total fees and amounts retained by FDC were as follows:
| | Distribution Fee | Service Fee | Total Fees | Retained by FDC |
| Fidelity Advisor Biotechnology Fund | | | | |
| Class A | - % | .25% | $749,879 | $ - |
| Class M | .25% | .25% | 269,522 | - |
| Class C | .75% | .25% | 501,893 | 19,420 |
| | | | $1,521,294 | $19,420 |
| Fidelity Advisor Consumer Discretionary Fund | | | | |
| Class A | - % | .25% | $250,172 | $289 |
| Class M | .25% | .25% | 83,434 | - |
| Class C | .75% | .25% | 190,519 | 10,398 |
| | | | $524,125 | $10,687 |
| Fidelity Advisor Energy Fund | | | | |
| Class A | - % | .25% | $470,735 | $3,372 |
| Class M | .25% | .25% | 271,390 | - |
| Class C | .75% | .25% | 446,347 | 57,916 |
| | | | $1,188,472 | $61,288 |
| Fidelity Advisor Financials Fund | | | | |
| Class A | - % | .25% | $202,276 | $ - |
| Class M | .25% | .25% | 153,882 | - |
| Class C | .75% | .25% | 181,795 | 9,333 |
| | | | $537,953 | $9,333 |
| Fidelity Advisor Health Care Fund | | | | |
| Class A | - % | .25% | $1,778,225 | $1,998 |
| Class M | .25% | .25% | 729,080 | - |
| Class C | .75% | .25% | 1,555,223 | 83,235 |
| | | | $4,062,528 | $85,233 |
| Fidelity Advisor Industrials Fund | | | | |
| Class A | - % | .25% | $274,125 | $ - |
| Class M | .25% | .25% | 131,958 | - |
| Class C | .75% | .25% | 154,503 | 6,437 |
| | | | $560,586 | $6,437 |
| Fidelity Advisor Semiconductors Fund | | | | |
| Class A | - % | .25% | $723,240 | $11,644 |
| Class M | .25% | .25% | 228,508 | - |
| Class C | .75% | .25% | 618,559 | 108,891 |
| | | | $1,570,307 | $120,535 |
| Fidelity Advisor Technology Fund | | | | |
| Class A | - % | .25% | $2,324,824 | $10,773 |
| Class M | .25% | .25% | 1,519,636 | - |
| Class C | .75% | .25% | 1,461,507 | 135,916 |
| | | | $5,305,967 | $146,689 |
| Fidelity Advisor Utilities Fund | | | | |
| Class A | - % | .25% | $374,556 | $3,513 |
| Class M | .25% | .25% | 156,974 | - |
| Class C | .75% | .25% | 259,654 | 46,847 |
| | | | $791,184 | $50,360 |
Sales Load. FDC may receive a front-end sales charge of up to 5.75% for selling Class A shares and 3.50% for selling Class M shares, some of which is paid to financial intermediaries for selling shares of each Fund. Depending on the holding period, FDC may receive contingent deferred sales charges levied on Class A, Class M and Class C redemptions. The deferred sales charges are 1.00% for Class C shares, 1.00% for certain purchases of Class A shares and .25% for certain purchases of Class M shares.
For the period, sales charge amounts retained by FDC were as follows:
| | Retained by FDC |
| Fidelity Advisor Biotechnology Fund | |
| Class A | $30,535 |
| Class M | 3,168 |
Class CA | 556 |
| | $34,259 |
| Fidelity Advisor Consumer Discretionary Fund | |
| Class A | $27,740 |
| Class M | 1,590 |
Class CA | 42 |
| | $29,372 |
| Fidelity Advisor Energy Fund | |
| Class A | $61,011 |
| Class M | 5,496 |
Class CA | 289 |
| | $66,796 |
| Fidelity Advisor Financials Fund | |
| Class A | $9,056 |
| Class M | 1,602 |
Class CA | 118 |
| | $10,776 |
| Fidelity Advisor Health Care Fund | |
| Class A | $90,866 |
| Class M | 10,124 |
Class CA | 1,271 |
| | $102,261 |
| Fidelity Advisor Industrials Fund | |
| Class A | $12,096 |
| Class M | 1,667 |
Class CA | 37 |
| | $13,800 |
| Fidelity Advisor Semiconductors Fund | |
| Class A | $399,541 |
| Class M | 11,317 |
Class CA | 945 |
| | $411,803 |
| Fidelity Advisor Technology Fund | |
| Class A | $335,434 |
| Class M | 18,826 |
Class CA | 1,269 |
| | $355,529 |
| Fidelity Advisor Utilities Fund | |
| Class A | $40,893 |
| Class M | 5,282 |
Class CA | 641 |
| | $46,816 |
A When Class C shares are initially sold, FDC pays commissions from its own resources to financial intermediaries through which the sales are made.
Transfer Agent Fees. Fidelity Investments Institutional Operations Company LLC (FIIOC), an affiliate of the investment adviser, is the transfer, dividend disbursing and shareholder servicing agent for each class of the Funds.
During November 2023, the Board approved a change in the transfer agent fees effective December 1, 2023 to a fixed annual rate of class-level average net assets as follows:
| | % of Class-Level Average Net Assets |
| Fidelity Advisor Biotechnology Fund | |
| Class A | 0.1903 |
| Class M | 0.2000 |
| Class C | 0.2000 |
| Class I | 0.1685 |
| Fidelity Advisor Consumer Discretionary Fund | |
| Class A | 0.1852 |
| Class M | 0.1966 |
| Class C | 0.1935 |
| Class I | 0.1674 |
| Fidelity Advisor Energy Fund | |
| Class A | 0.1947 |
| Class M | 0.2000 |
| Class C | 0.1869 |
| Class I | 0.1705 |
| Fidelity Advisor Financials Fund | |
| Class A | 0.1976 |
| Class M | 0.1869 |
| Class C | 0.1947 |
| Class I | 0.1737 |
| Fidelity Advisor Health Care Fund | |
| Class A | 0.1777 |
| Class M | 0.1808 |
| Class C | 0.1825 |
| Class I | 0.1682 |
| Fidelity Advisor Industrials Fund | |
| Class A | 0.1826 |
| Class M | 0.1827 |
| Class C | 0.1899 |
| Class I | 0.1650 |
| Fidelity Advisor Semiconductors Fund | |
| Class A | 0.1685 |
| Class M | 0.1551 |
| Class C | 0.1746 |
| Class I | 0.1642 |
| Fidelity Advisor Technology Fund | |
| Class A | 0.1674 |
| Class M | 0.1602 |
| Class C | 0.1813 |
| Class I | 0.1597 |
| Fidelity Advisor Utilities Fund | |
| Class A | 0.1841 |
| Class M | 0.1996 |
| Class C | 0.1879 |
| Class I | 0.1669 |
Prior to December 1, 2023, FIIOC received account fees and asset-based fees that varied according to the account size and type of account of the shareholders of the respective classes of each Fund, except for Class Z. FIIOC received an asset-based fee of Class Z's average net assets. FIIOC pays for typesetting, printing and mailing of shareholder reports, except proxy statements. For the period, transfer agent fees for each class were as follows:
| | Amount | % of Class-Level Average Net AssetsA |
| Fidelity Advisor Biotechnology Fund | | |
| Class A | $575,105 | .19 |
| Class M | 114,775 | .21 |
| Class C | 101,141 | .20 |
| Class I | 540,152 | .17 |
| Class Z | 13,439 | .04 |
| | $1,344,612 | |
| Fidelity Advisor Consumer Discretionary Fund | | |
| Class A | $188,620 | .19 |
| Class M | 33,406 | .20 |
| Class C | 37,432 | .20 |
| Class I | 115,094 | .17 |
| Class Z | 12,428 | .04 |
| | $386,980 | |
| Fidelity Advisor Energy Fund | | |
| Class A | $362,859 | .19 |
| Class M | 108,289 | .20 |
| Class C | 82,887 | .19 |
| Class I | 446,939 | .17 |
| Class Z | 41,632 | .04 |
| | $1,042,606 | |
| Fidelity Advisor Financials Fund | | |
| Class A | $162,050 | .20 |
| Class M | 57,954 | .19 |
| Class C | 35,433 | .19 |
| Class I | 87,663 | .17 |
| Class Z | 12,081 | .04 |
| | $355,181 | |
| Fidelity Advisor Health Care Fund | | |
| Class A | $1,274,126 | .18 |
| Class M | 266,355 | .18 |
| Class C | 284,302 | .18 |
| Class I | 1,916,130 | .17 |
| Class Z | 149,800 | .04 |
| | $3,890,713 | |
| Fidelity Advisor Industrials Fund | | |
| Class A | $202,957 | .19 |
| Class M | 48,927 | .19 |
| Class C | 29,632 | .19 |
| Class I | 109,257 | .17 |
| Class Z | 10,530 | .04 |
| | $401,303 | |
| Fidelity Advisor Semiconductors Fund | | |
| Class A | $498,121 | .17 |
| Class M | 72,775 | .16 |
| Class C | 110,069 | .18 |
| Class I | 448,693 | .17 |
| Class Z | 20,983 | .04 |
| | $1,150,641 | |
| Fidelity Advisor Technology Fund | | |
| Class A | $1,578,701 | .17 |
| Class M | 493,806 | .16 |
| Class C | 268,469 | .18 |
| Class I | 1,205,235 | .16 |
| Class Z | 134,664 | .04 |
| | $3,680,875 | |
| Fidelity Advisor Utilities Fund | | |
| Class A | $279,780 | .19 |
| Class M | 63,948 | .20 |
| Class C | 49,481 | .19 |
| Class I | 170,990 | .17 |
| Class Z | 17,564 | .04 |
| | $581,763 | |
A Annualized
Accounting Fees. Fidelity Service Company, Inc. (FSC), an affiliate of the investment adviser, maintains each Fund's accounting records.
During November 2023, the Board approved a change in the accounting fees effective December 1, 2023 to a fixed annual rate of average net assets as follows:
| | % of Average Net Assets |
| Fidelity Advisor Biotechnology Fund | 0.0275 |
| Fidelity Advisor Consumer Discretionary Fund | 0.0353 |
| Fidelity Advisor Energy Fund | 0.0283 |
| Fidelity Advisor Financials Fund | 0.0354 |
| Fidelity Advisor Health Care Fund | 0.0174 |
| Fidelity Advisor Industrials Fund | 0.0344 |
| Fidelity Advisor Semiconductors Fund | 0.0281 |
| Fidelity Advisor Technology Fund | 0.0192 |
| Fidelity Advisor Utilities Fund | 0.0308 |
Prior to December 1, 2023, the accounting fee was based on the level of average net assets for each month. For the period, the fees were equivalent to the following annualized rates:
| | % of Average Net Assets |
| Fidelity Advisor Biotechnology Fund | .03 |
| Fidelity Advisor Consumer Discretionary Fund | .04 |
| Fidelity Advisor Energy Fund | .03 |
| Fidelity Advisor Financials Fund | .04 |
| Fidelity Advisor Health Care Fund | .02 |
| Fidelity Advisor Industrials Fund | .03 |
| Fidelity Advisor Semiconductors Fund | .03 |
| Fidelity Advisor Technology Fund | .02 |
Fidelity Advisor Utilities Fund | .03 |
Subsequent Event - Management Fee. Effective March 1, 2024, each Fund's management contract will be amended to incorporate administrative services previously covered under separate services agreements (Transfer Agent and Accounting agreements). The amended contract incorporates a management fee rate that may vary by class. The investment adviser or an affiliate will pay certain expenses of managing and operating each Fund out of each class's management fee.
Each class of each Fund will pay a management fee to the investment adviser. The management fee will be calculated and paid to the investment adviser every month.
When determining a class's management fee, a mandate rate will be calculated based on the monthly average net assets of a group of funds advised by FMR within a designated asset class. A discount rate will be subtracted from the mandate rate once each Fund's monthly average net assets reach a certain level. The mandate rate and discount rate may vary by class.
The annual management fee rate for a class of shares of each Fund will be the lesser of (1) the class's mandate rate reduced by the class's discount rate (if applicable) or (2) the amount set forth in the following table.
| | Maximum Management Fee Rate % |
| Fidelity Adviser Biotechnology Fund | |
| Class A | .71 |
| Class M | .72 |
| Class C | .72 |
| Class I | .69 |
| Class Z | .56 |
| Fidelity Adviser Consumer Discretionary Fund | |
| Class A | .70 |
| Class M | .72 |
| Class C | .71 |
| Class I | .69 |
| Class Z | .56 |
| Fidelity Adviser Energy Fund | |
| Class A | .72 |
| Class M | .72 |
| Class C | .71 |
| Class I | .69 |
| Class Z | .56 |
| Fidelity Financials Fund | |
| Class A | .72 |
| Class M | .71 |
| Class C | .71 |
| Class I | .69 |
| Class Z | .56 |
| Fidelity Adviser Health Care Fund | |
| Class A | .69 |
| Class M | .69 |
| Class C | .69 |
| Class I | .68 |
| Class Z | .55 |
| Fidelity Adviser Industrials Fund | |
| Class A | .70 |
| Class M | .70 |
| Class C | .71 |
| Class I | .68 |
| Class Z | .56 |
| Fidelity Adviser Semiconductors Fund | |
| Class A | .69 |
| Class M | .68 |
| Class C | .70 |
| Class I | .69 |
| Class Z | .56 |
| Fidelity Adviser Technology Fund | |
| Class A | .68 |
| Class M | .67 |
| Class C | .69 |
| Class I | .67 |
| Class Z | .55 |
| Fidelity Adviser Utilities Fund | |
| Class A | .71 |
| Class M | .72 |
| Class C | .71 |
| Class I | .69 |
| Class Z | .57 |
One-twelfth of the management fee rate for a class will be applied to the average net assets of the class for the month, giving a dollar amount which is the management fee for the class for that month.
A different management fee rate may be applicable to each class of each Fund. The difference between classes is the result of separate arrangements for class-level services and/or waivers of certain expenses. It is not the result of any difference in advisory or custodial fees or other expenses related to the management of each Fund's assets, which do not vary by class.
Effective March 1, 2024, each Fund's sub-advisory agreements with FMR Investment Management (UK) Limited, Fidelity Management & Research (Hong Kong) Limited, and Fidelity Management & Research (Japan) Limited will be amended to provide that the investment adviser will pay each sub-adviser monthly fees equal to 110% of the sub-adviser's costs for providing sub-advisory services.
Brokerage Commissions. A portion of portfolio transactions were placed with brokerage firms which are affiliates of the investment adviser. Brokerage commissions are included in net realized gain (loss) and change in net unrealized appreciation (depreciation) in the Statement of Operations. The commissions paid to these affiliated firms were as follows:
| | Amount |
| Fidelity Advisor Biotechnology Fund | $32,434 |
| Fidelity Advisor Consumer Discretionary Fund | 621 |
| Fidelity Advisor Energy Fund | 6,238 |
| Fidelity Advisor Financials Fund | 1,267 |
| Fidelity Advisor Health Care Fund | 18,370 |
| Fidelity Advisor Industrials Fund | 1,961 |
| Fidelity Advisor Semiconductors Fund | 3,398 |
| Fidelity Advisor Technology Fund | 4,748 |
| Fidelity Advisor Utilities Fund | 4,928 |
Interfund Lending Program. Pursuant to an Exemptive Order issued by the Securities and Exchange Commission (the SEC), each Fund, along with other registered investment companies having management contracts with Fidelity Management & Research Company LLC (FMR), or other affiliated entities of FMR, may participate in an interfund lending program. This program provides an alternative credit facility allowing each Fund to borrow from, or lend money to, other participating affiliated funds. At period end, there were no interfund loans outstanding. Activity in this program during the period for which loans were outstanding was as follows:
| | Borrower or Lender | Average Loan Balance | Weighted Average Interest Rate | Interest Expense |
| Fidelity Advisor Biotechnology Fund | Borrower | $ 11,723,000 | 5.58% | $10,909 |
| Fidelity Advisor Energy Fund | Borrower | $6,345,333 | 5.57% | $5,888 |
| Fidelity Advisor Health Care Fund | Borrower | $ 17,223,286 | 5.57% | $37,301 |
| Fidelity Advisor Industrials Fund | Borrower | $ 5,571,750 | 5.57% | $3,445 |
| Fidelity Advisor Technology Fund | Borrower | $ 4,118,000 | 5.57% | $2,547 |
| Fidelity Advisor Utilities Fund | Borrower | $ 14,616,167 | 5.57% | $13,559 |
Interfund Trades. Funds may purchase from or sell securities to other Fidelity Funds under procedures adopted by the Board. The procedures have been designed to ensure these interfund trades are executed in accordance with Rule 17a-7 of the 1940 Act. Any interfund trades are included within the respective purchases and sales amounts shown in the Purchases and Sales of Investments note. Interfund trades during the period are noted in the table below.
| | Purchases ($) | Sales ($) | Realized Gain (Loss) ($) |
| Fidelity Advisor Biotechnology Fund | 21,850,138 | 48,013,280 | 1,403,689 |
| Fidelity Advisor Consumer Discretionary Fund | 8,686,259 | 2,366,220 | (276,458) |
| Fidelity Advisor Energy Fund | 17,321,484 | 3,410,490 | 786,371 |
| Fidelity Advisor Financials Fund | 4,321,503 | 8,370,588 | 414,634 |
| Fidelity Advisor Health Care Fund | 54,574,586 | 146,027,320 | (27,455,750) |
| Fidelity Advisor Industrials Fund | 1,373,060 | 1,462,420 | (114,328) |
| Fidelity Advisor Semiconductors Fund | 10,291,820 | 152,100 | (1,875) |
| Fidelity Advisor Technology Fund | 12,890,751 | 7,952,372 | 2,083,504 |
| Fidelity Advisor Utilities Fund | 728,567 | 19,857,435 | 2,039,757 |
Other. During the period, the investment adviser reimbursed the Funds for certain losses as follows:
| | Amount ($) |
| Fidelity Advisor Biotechnology Fund | 1,891 |
6. Committed Line of Credit.
Certain Funds participate with other funds managed by the investment adviser or an affiliate in a $4.25 billion credit facility (the "line of credit") to be utilized for temporary or emergency purposes to fund shareholder redemptions or for other short-term liquidity purposes. The participating funds have agreed to pay commitment fees on their pro-rata portion of the line of credit, which are reflected in Miscellaneous expenses on the Statement of Operations, and are listed below. During the period, there were no borrowings on this line of credit.
| | Amount |
| Fidelity Advisor Biotechnology Fund | $1,203 |
| Fidelity Advisor Consumer Discretionary Fund | 377 |
| Fidelity Advisor Energy Fund | 1,066 |
| Fidelity Advisor Financials Fund | 340 |
| Fidelity Advisor Health Care Fund | 4,116 |
| Fidelity Advisor Industrials Fund | 393 |
| Fidelity Advisor Semiconductors Fund | 1,104 |
| Fidelity Advisor Technology Fund | 3,883 |
| Fidelity Advisor Utilities Fund | 583 |
7. Security Lending.
Funds lend portfolio securities from time to time in order to earn additional income. Lending agents are used, including National Financial Services (NFS), an affiliate of the investment adviser. Pursuant to a securities lending agreement, NFS will receive a fee, which is capped at 9.9% of a fund's daily lending revenue, for its services as lending agent. A fund may lend securities to certain qualified borrowers, including NFS. On the settlement date of the loan, a fund receives collateral (in the form of U.S. Treasury obligations, letters of credit and/or cash) against the loaned securities and maintains collateral in an amount not less than 100% of the market value of the loaned securities during the period of the loan. The market value of the loaned securities is determined at the close of business of a fund and any additional required collateral is delivered to a fund on the next business day. A fund or borrower may terminate the loan at any time, and if the borrower defaults on its obligation to return the securities loaned because of insolvency or other reasons, a fund may apply collateral received from the borrower against the obligation. A fund may experience delays and costs in recovering the securities loaned. Any cash collateral received is invested in the Fidelity Securities Lending Cash Central Fund. Any loaned securities are identified as such in the Schedule of Investments, and the value of loaned securities and cash collateral at period end, as applicable, are presented in the Statement of Assets and Liabilities. Security lending income represents the income earned on investing cash collateral, less rebates paid to borrowers and any lending agent fees associated with the loan, plus any premium payments received for lending certain types of securities. Security lending income is presented in the Statement of Operations as a component of income from Fidelity Central Funds. Affiliated security lending activity, if any, was as follows:
| | Total Security Lending Fees Paid to NFS | Security Lending Income From Securities Loaned to NFS | Value of Securities Loaned to NFS at Period End |
| Fidelity Advisor Biotechnology Fund | $79,861 | $8,593 | $- |
| Fidelity Advisor Consumer Discretionary Fund | $1,173 | $69 | $- |
| Fidelity Advisor Energy Fund | $3,785 | $- | $- |
| Fidelity Advisor Financials Fund | $213 | $- | $- |
| Fidelity Advisor Health Care Fund | $12,997 | $193 | $142,505 |
| Fidelity Advisor Industrials Fund | $272 | $- | $- |
| Fidelity Advisor Semiconductors Fund | $10,903 | $2,765 | $- |
| Fidelity Advisor Technology Fund | $280 | $206 | $- |
| Fidelity Advisor Utilities Fund | $380 | $- | $- |
8. Expense Reductions.
Through arrangements with each applicable Fund's custodian and each class' transfer agent, credits realized as a result of certain uninvested cash balances were used to reduce each applicable Fund's or class' expenses. All of the applicable expense reductions are noted in the table below.
| | Custodian credits | Transfer Agent credits |
| Fidelity Advisor Biotechnology Fund | $460 | $- |
| Class M | - | 427 |
| Fidelity Advisor Energy Fund | - | - |
| Class M | - | 151 |
| Fidelity Advisor Financials Fund | - | - |
| Class M | - | 20 |
| Fidelity Advisor Health Care Fund | 190 | - |
| Fidelity Advisor Industrials Fund | - | - |
| Class M | - | 76 |
| Fidelity Advisor Technology Fund | 353 | - |
| Fidelity Advisor Utilities Fund | - | - |
| Class M | - | 67 |
In addition, during the period the investment adviser or an affiliate reimbursed and/or waived a portion of fund-level operating expenses as follows:
| | Fund-Level Amount |
| Fidelity Advisor Biotechnology Fund | $64,987 |
| Fidelity Advisor Consumer Discretionary Fund | 20,210 |
| Fidelity Advisor Energy Fund | 54,922 |
| Fidelity Advisor Financials Fund | 17,921 |
| Fidelity Advisor Health Care Fund | 214,367 |
| Fidelity Advisor Industrials Fund | 20,940 |
| Fidelity Advisor Semiconductors Fund | 61,534 |
| Fidelity Advisor Technology Fund | 210,763 |
| Fidelity Advisor Utilities Fund | 30,295 |
9. Distributions to Shareholders.
Distributions to shareholders of each class were as follows:
| | Six months ended January 31, 2024 | Year ended July 31, 2023 |
| Fidelity Advisor Biotechnology Fund | | |
| Distributions to shareholders | | |
| Class A | $7,399,424 | $- |
| Class M | 1,088,438 | - |
| Class I | 9,290,645 | - |
| Class Z | 1,038,552 | - |
Total | $18,817,059 | $- |
| Fidelity Advisor Consumer Discretionary Fund | | |
| Distributions to shareholders | | |
| Class A | $- | $6,880,690 |
| Class M | - | 1,398,366 |
| Class C | - | 2,489,252 |
| Class I | - | 3,782,125 |
| Class Z | - | 2,612,656 |
Total | $- | $17,163,089 |
| Fidelity Advisor Energy Fund | | |
| Distributions to shareholders | | |
| Class A | $7,318,037 | $8,545,498 |
| Class M | 1,764,969 | 2,095,293 |
| Class C | 1,178,876 | 1,833,534 |
| Class I | 11,020,177 | 13,584,550 |
| Class Z | 2,232,106 | 7,375,972 |
Total | $23,514,165 | $33,434,847 |
| Fidelity Advisor Financials Fund | | |
| Distributions to shareholders | | |
| Class A | $3,936,144 | $10,343,831 |
| Class M | 1,359,712 | 3,691,281 |
| Class C | 580,285 | 2,770,639 |
| Class I | 2,558,939 | 7,089,508 |
| Class Z | 547,015 | 6,890,192 |
Total | $8,982,095 | $30,785,451 |
| Fidelity Advisor Health Care Fund | | |
| Distributions to shareholders | | |
| Class A | $- | $- |
| Class M | - | - |
| Class C | - | - |
| Class I | - | - |
| Class Z | - | - |
Total | $- | $- |
| Fidelity Advisor Industrials Fund | | |
| Distributions to shareholders | | |
| Class A | $19,091,633 | $7,071,012 |
| Class M | 4,801,657 | 1,678,793 |
| Class C | 3,163,271 | 1,387,568 |
| Class I | 9,988,265 | 4,233,189 |
| Class Z | 2,725,506 | 3,179,380 |
Total | $39,770,332 | $17,549,942 |
| Fidelity Advisor Semiconductors Fund | | |
| Distributions to shareholders | | |
| Class A | $21,083,170 | $8,928,808 |
| Class M | 3,540,848 | 1,417,206 |
| Class C | 5,533,446 | 2,898,996 |
| Class I | 18,203,721 | 7,802,658 |
| Class Z | 3,470,629 | 1,111,011 |
Total | $51,831,814 | $22,158,679 |
| Fidelity Advisor Technology Fund | | |
| Distributions to shareholders | | |
| Class A | $75,971,395 | $44,657,722 |
| Class M | 26,863,953 | 15,873,515 |
| Class C | 15,432,652 | 11,031,237 |
| Class I | 58,230,400 | 31,149,239 |
| Class Z | 19,915,535 | 14,911,183 |
Total | $196,413,935 | $117,622,896 |
| Fidelity Advisor Utilities Fund | | |
| Distributions to shareholders | | |
| Class A | $7,597,835 | $15,827,969 |
| Class M | 1,498,943 | 3,178,096 |
| Class C | 1,134,625 | 2,595,233 |
| Class I | 5,038,505 | 14,746,535 |
| Class Z | 2,005,263 | 5,860,452 |
Total | $17,275,171 | $42,208,285 |
10. Share Transactions.
Share transactions for each class were as follows and may contain in-kind transactions, automatic conversions between classes or exchanges between affiliated funds:
| | Shares | Shares | Dollars | Dollars |
| | Six months ended January 31, 2024 | Year ended July 31, 2023 | Six months ended January 31, 2024 | Year ended July 31, 2023 |
| Fidelity Advisor Biotechnology Fund | | | | |
| Class A | | | | |
| Shares sold | 1,343,267 | 3,200,209 | $33,757,673 | $78,997,743 |
| Reinvestment of distributions | 273,310 | - | 6,909,268 | - |
| Shares redeemed | (3,100,491) | (5,129,445) | (75,689,518) | (126,229,442) |
| Net increase (decrease) | (1,483,914) | (1,929,236) | $(35,022,577) | $(47,231,699) |
| Class M | | | | |
| Shares sold | 151,298 | 585,052 | $3,522,473 | $13,155,289 |
| Reinvestment of distributions | 46,475 | - | 1,075,432 | - |
| Shares redeemed | (466,528) | (1,112,087) | (10,581,894) | (25,079,956) |
| Net increase (decrease) | (268,755) | (527,035) | $(5,983,989) | $(11,924,667) |
| Class C | | | | |
| Shares sold | 151,797 | 406,454 | $3,003,859 | $7,809,259 |
| Shares redeemed | (1,675,816) | (4,111,528) | (32,084,134) | (79,272,567) |
| Net increase (decrease) | (1,524,019) | (3,705,074) | $(29,080,275) | $(71,463,308) |
| Class I | | | | |
| Shares sold | 1,913,529 | 3,930,484 | $52,456,681 | $105,588,310 |
| Reinvestment of distributions | 282,262 | - | 7,793,263 | - |
| Shares redeemed | (4,529,949) | (7,664,664) | (121,193,926) | (205,027,950) |
| Net increase (decrease) | (2,334,158) | (3,734,180) | $(60,943,982) | $(99,439,640) |
| Class Z | | | | |
| Shares sold | 538,073 | 772,947 | $14,749,488 | $20,513,188 |
| Reinvestment of distributions | 32,151 | - | 889,286 | - |
| Shares redeemed | (478,829) | (1,187,102) | (12,695,760) | (31,371,222) |
| Net increase (decrease) | 91,395 | (414,155) | $2,943,014 | $(10,858,034) |
| Fidelity Advisor Consumer Discretionary Fund | | | | |
| Class A | | | | |
| Shares sold | 470,162 | 982,071 | $17,438,746 | $32,708,559 |
| Reinvestment of distributions | - | 213,159 | - | 6,684,934 |
| Shares redeemed | (445,404) | (1,161,794) | (16,357,629) | (37,480,011) |
| Net increase (decrease) | 24,758 | 33,436 | $1,081,117 | $1,913,482 |
| Class M | | | | |
| Shares sold | 46,820 | 139,907 | $1,611,608 | $4,259,426 |
| Reinvestment of distributions | - | 48,202 | - | 1,382,434 |
| Shares redeemed | (131,643) | (240,619) | (4,377,432) | (7,160,832) |
| Net increase (decrease) | (84,823) | (52,510) | $(2,765,824) | $(1,518,972) |
| Class C | | | | |
| Shares sold | 62,924 | 166,292 | $1,757,404 | $4,242,334 |
| Reinvestment of distributions | - | 104,574 | - | 2,479,122 |
| Shares redeemed | (370,247) | (750,676) | (10,254,370) | (18,507,976) |
| Net increase (decrease) | (307,323) | (479,810) | $(8,496,966) | $(11,786,520) |
| Class I | | | | |
| Shares sold | 1,102,478 | 1,961,206 | $43,841,316 | $72,509,098 |
| Reinvestment of distributions | - | 105,097 | - | 3,632,142 |
| Shares redeemed | (1,306,496) | (1,814,837) | (52,335,029) | (64,112,469) |
| Net increase (decrease) | (204,018) | 251,466 | $(8,493,713) | $12,028,771 |
| Class Z | | | | |
| Shares sold | 246,514 | 1,607,768 | $9,867,140 | $55,088,683 |
| Reinvestment of distributions | - | 73,211 | - | 2,541,170 |
| Shares redeemed | (1,482,833) | (774,213) | (57,652,071) | (27,608,114) |
| Net increase (decrease) | (1,236,319) | 906,766 | $(47,784,931) | $30,021,739 |
| Fidelity Advisor Energy Fund | | | | |
| Class A | | | | |
| Shares sold | 908,852 | 2,965,090 | $41,116,617 | $125,359,435 |
| Reinvestment of distributions | 167,874 | 200,714 | 7,094,348 | 8,281,444 |
| Shares redeemed | (1,275,878) | (3,841,903) | (56,372,285) | (159,054,801) |
| Net increase (decrease) | (199,152) | (676,099) | $(8,161,320) | $(25,413,922) |
| Class M | | | | |
| Shares sold | 180,013 | 390,349 | $8,340,375 | $16,951,245 |
| Reinvestment of distributions | 39,715 | 48,467 | 1,727,981 | 2,057,403 |
| Shares redeemed | (306,678) | (875,129) | (13,836,478) | (37,005,996) |
| Net increase (decrease) | (86,950) | (436,313) | $(3,768,122) | $(17,997,348) |
| Class C | | | | |
| Shares sold | 194,587 | 662,408 | $7,943,864 | $25,703,152 |
| Reinvestment of distributions | 29,115 | 46,957 | 1,125,304 | 1,773,567 |
| Shares redeemed | (488,152) | (1,329,293) | (19,774,732) | (50,167,462) |
| Net increase (decrease) | (264,450) | (619,928) | $(10,705,564) | $(22,690,743) |
| Class I | | | | |
| Shares sold | 4,006,242 | 5,904,399 | $191,298,602 | $264,297,953 |
| Reinvestment of distributions | 226,380 | 282,440 | 10,144,089 | 12,342,610 |
| Shares redeemed | (4,234,809) | (8,165,711) | (196,931,026) | (357,278,979) |
| Net increase (decrease) | (2,187) | (1,978,872) | $4,511,665 | $(80,638,416) |
| Class Z | | | | |
| Shares sold | 1,163,278 | 3,968,517 | $56,433,731 | $175,402,328 |
| Reinvestment of distributions | 42,781 | 162,239 | 1,913,609 | 7,071,987 |
| Shares redeemed | (4,693,239) | (4,835,412) | (223,400,891) | (211,058,509) |
| Net increase (decrease) | (3,487,180) | (704,656) | $(165,053,551) | $(28,584,194) |
| Fidelity Advisor Financials Fund | | | | |
| Class A | | | | |
| Shares sold | 377,635 | 1,007,482 | $9,740,590 | $25,570,300 |
| Reinvestment of distributions | 136,530 | 408,292 | 3,770,958 | 9,950,068 |
| Shares redeemed | (774,601) | (2,063,576) | (19,715,949) | (51,294,760) |
| Net increase (decrease) | (260,436) | (647,802) | $(6,204,401) | $(15,774,392) |
| Class M | | | | |
| Shares sold | 93,868 | 382,498 | $2,458,268 | $9,695,969 |
| Reinvestment of distributions | 49,122 | 150,930 | 1,340,046 | 3,634,395 |
| Shares redeemed | (264,864) | (663,018) | (6,648,514) | (16,163,119) |
| Net increase (decrease) | (121,874) | (129,590) | $(2,850,200) | $(2,832,755) |
| Class C | | | | |
| Shares sold | 47,180 | 158,220 | $1,154,119 | $3,741,582 |
| Reinvestment of distributions | 22,503 | 121,519 | 577,888 | 2,753,627 |
| Shares redeemed | (396,918) | (931,916) | (9,321,137) | (21,566,685) |
| Net increase (decrease) | (327,235) | (652,177) | $(7,589,130) | $(15,071,476) |
| Class I | | | | |
| Shares sold | 1,069,099 | 1,989,855 | $27,832,076 | $52,766,831 |
| Reinvestment of distributions | 87,544 | 277,356 | 2,502,894 | 6,989,374 |
| Shares redeemed | (1,565,280) | (2,968,307) | (40,488,740) | (75,651,884) |
| Net increase (decrease) | (408,637) | (701,096) | $(10,153,770) | $(15,895,679) |
| Class Z | | | | |
| Shares sold | 974,352 | 3,844,623 | $27,188,495 | $99,675,825 |
| Reinvestment of distributions | 14,544 | 239,686 | 415,095 | 6,020,924 |
| Shares redeemed | (2,781,895) | (3,116,457) | (70,754,153) | (79,345,103) |
| Net increase (decrease) | (1,792,999) | 967,852 | $(43,150,563) | $26,351,646 |
| Fidelity Advisor Health Care Fund | | | | |
| Class A | | | | |
| Shares sold | 1,414,516 | 3,952,012 | $80,365,020 | $229,948,864 |
| Shares redeemed | (3,031,248) | (4,091,037) | (171,292,309) | (237,824,749) |
| Net increase (decrease) | (1,616,732) | (139,025) | $(90,927,289) | $(7,875,885) |
| Class M | | | | |
| Shares sold | 117,536 | 323,729 | $6,142,345 | $17,197,627 |
| Shares redeemed | (453,074) | (798,274) | (23,398,439) | (42,502,451) |
| Net increase (decrease) | (335,538) | (474,545) | $(17,256,094) | $(25,304,824) |
| Class C | | | | |
| Shares sold | 196,036 | 724,395 | $8,317,894 | $31,252,102 |
| Shares redeemed | (1,785,189) | (4,142,787) | (74,884,674) | (179,275,708) |
| Net increase (decrease) | (1,589,153) | (3,418,392) | $(66,566,780) | $(148,023,606) |
| Class I | | | | |
| Shares sold | 2,640,583 | 7,285,756 | $166,645,986 | $469,523,346 |
| Shares redeemed | (9,379,649) | (11,196,061) | (587,738,691) | (721,560,464) |
| Net increase (decrease) | (6,739,066) | (3,910,305) | $(421,092,705) | $(252,037,118) |
| Class Z | | | | |
| Shares sold | 1,481,518 | 5,264,645 | $93,821,273 | $334,148,597 |
| Shares redeemed | (5,369,713) | (5,098,057) | (332,821,099) | (326,368,763) |
| Net increase (decrease) | (3,888,195) | 166,588 | $(238,999,826) | $7,779,834 |
| Fidelity Advisor Industrials Fund | | | | |
| Class A | | | | |
| Shares sold | 347,481 | 406,707 | $12,883,414 | $14,207,996 |
| Reinvestment of distributions | 476,633 | 199,881 | 18,092,981 | 6,692,020 |
| Shares redeemed | (457,145) | (1,106,776) | (17,188,671) | (38,331,064) |
| Net increase (decrease) | 366,969 | (500,188) | $13,787,724 | $(17,431,048) |
| Class M | | | | |
| Shares sold | 98,790 | 126,166 | $3,638,107 | $4,217,090 |
| Reinvestment of distributions | 130,912 | 51,559 | 4,766,508 | 1,664,332 |
| Shares redeemed | (103,811) | (241,056) | (3,772,832) | (8,188,209) |
| Net increase (decrease) | 125,891 | (63,331) | $4,631,783 | $(2,306,787) |
| Class C | | | | |
| Shares sold | 74,233 | 76,596 | $2,344,233 | $2,255,873 |
| Reinvestment of distributions | 101,765 | 49,445 | 3,132,328 | 1,376,542 |
| Shares redeemed | (174,649) | (403,651) | (5,385,409) | (11,609,090) |
| Net increase (decrease) | 1,349 | (277,610) | $91,152 | $(7,976,675) |
| Class I | | | | |
| Shares sold | 913,227 | 1,580,336 | $37,299,325 | $62,430,757 |
| Reinvestment of distributions | 219,293 | 106,079 | 9,085,300 | 3,845,348 |
| Shares redeemed | (1,349,063) | (2,324,872) | (54,743,716) | (89,149,470) |
| Net increase (decrease) | (216,543) | (638,457) | $(8,359,091) | $(22,873,365) |
| Class Z | | | | |
| Shares sold | 352,060 | 2,596,658 | $14,502,094 | $89,451,331 |
| Reinvestment of distributions | 62,886 | 86,441 | 2,604,125 | 3,128,307 |
| Shares redeemed | (1,990,575) | (883,875) | (81,065,686) | (33,054,547) |
| Net increase (decrease) | (1,575,629) | 1,799,224 | $(63,959,467) | $59,525,091 |
| Fidelity Advisor Semiconductors Fund | | | | |
| Class A | | | | |
| Shares sold | 1,975,940 | 3,139,559 | $115,053,135 | $151,745,716 |
| Reinvestment of distributions | 344,838 | 219,674 | 20,876,501 | 8,824,286 |
| Shares redeemed | (922,144) | (1,450,894) | (53,339,721) | (63,995,324) |
| Net increase (decrease) | 1,398,634 | 1,908,339 | $82,589,915 | $96,574,678 |
| Class M | | | | |
| Shares sold | 269,803 | 543,026 | $14,868,060 | $24,086,971 |
| Reinvestment of distributions | 61,148 | 37,061 | 3,458,547 | 1,398,675 |
| Shares redeemed | (103,377) | (168,156) | (5,660,310) | (6,902,970) |
| Net increase (decrease) | 227,574 | 411,931 | $12,666,297 | $18,582,676 |
| Class C | | | | |
| Shares sold | 496,509 | 750,418 | $23,473,123 | $29,626,090 |
| Reinvestment of distributions | 113,850 | 88,413 | 5,527,406 | 2,894,656 |
| Shares redeemed | (314,567) | (784,500) | (14,674,709) | (28,516,396) |
| Net increase (decrease) | 295,792 | 54,331 | $14,325,820 | $4,004,350 |
| Class I | | | | |
| Shares sold | 2,512,658 | 4,070,496 | $157,578,025 | $212,088,692 |
| Reinvestment of distributions | 273,927 | 177,505 | 17,923,026 | 7,666,452 |
| Shares redeemed | (1,330,316) | (3,061,827) | (82,889,751) | (145,241,848) |
| Net increase (decrease) | 1,456,269 | 1,186,174 | $92,611,300 | $74,513,296 |
| Class Z | | | | |
| Shares sold | 640,479 | 773,142 | $40,411,054 | $40,811,429 |
| Reinvestment of distributions | 44,183 | 20,319 | 2,895,741 | 877,292 |
| Shares redeemed | (321,370) | (402,594) | (19,913,021) | (18,621,247) |
| Net increase (decrease) | 363,292 | 390,867 | $23,393,774 | $23,067,474 |
| Fidelity Advisor Technology Fund | | | | |
| Class A | | | | |
| Shares sold | 1,578,220 | 2,719,769 | $145,125,907 | $206,725,335 |
| Reinvestment of distributions | 764,238 | 628,818 | 72,564,339 | 42,658,884 |
| Shares redeemed | (1,416,008) | (2,778,801) | (130,039,971) | (202,519,149) |
| Net increase (decrease) | 926,450 | 569,786 | $87,650,275 | $46,865,070 |
| Class M | | | | |
| Shares sold | 565,218 | 889,665 | $47,359,150 | $63,637,995 |
| Reinvestment of distributions | 307,072 | 252,456 | 26,518,754 | 15,667,387 |
| Shares redeemed | (559,918) | (949,000) | (47,014,969) | (63,257,879) |
| Net increase (decrease) | 312,372 | 193,121 | $26,862,935 | $16,047,503 |
| Class C | | | | |
| Shares sold | 393,014 | 560,367 | $27,063,696 | $32,443,071 |
| Reinvestment of distributions | 217,845 | 213,030 | 15,194,658 | 10,843,236 |
| Shares redeemed | (690,541) | (1,383,227) | (47,154,774) | (76,050,104) |
| Net increase (decrease) | (79,682) | (609,830) | $(4,896,420) | $(32,763,797) |
| Class I | | | | |
| Shares sold | 4,463,022 | 4,444,591 | $455,918,062 | $375,313,502 |
| Reinvestment of distributions | 518,428 | 387,393 | 55,528,866 | 29,507,702 |
| Shares redeemed | (3,851,352) | (4,072,906) | (392,164,245) | (338,992,438) |
| Net increase (decrease) | 1,130,098 | 759,078 | $119,282,683 | $65,828,766 |
| Class Z | | | | |
| Shares sold | 1,744,717 | 3,452,388 | $179,636,107 | $279,946,819 |
| Reinvestment of distributions | 147,530 | 169,093 | 15,797,497 | 12,873,087 |
| Shares redeemed | (3,845,158) | (2,016,130) | (384,846,254) | (167,266,551) |
| Net increase (decrease) | (1,952,911) | 1,605,351 | $(189,412,650) | $125,553,355 |
| Fidelity Advisor Utilities Fund | | | | |
| Class A | | | | |
| Shares sold | 479,564 | 2,215,949 | $16,917,971 | $84,107,146 |
| Reinvestment of distributions | 208,949 | 413,410 | 7,362,079 | 15,411,688 |
| Shares redeemed | (1,115,740) | (1,942,608) | (39,113,288) | (72,156,394) |
| Net increase (decrease) | (427,227) | 686,751 | $(14,833,238) | $27,362,440 |
| Class M | | | | |
| Shares sold | 66,318 | 249,639 | $2,336,599 | $9,574,291 |
| Reinvestment of distributions | 41,401 | 83,223 | 1,466,793 | 3,114,610 |
| Shares redeemed | (206,678) | (294,172) | (7,304,876) | (10,991,952) |
| Net increase (decrease) | (98,959) | 38,690 | $(3,501,484) | $1,696,949 |
| Class C | | | | |
| Shares sold | 153,783 | 551,415 | $5,251,394 | $20,505,123 |
| Reinvestment of distributions | 32,706 | 70,929 | 1,130,476 | 2,585,729 |
| Shares redeemed | (322,790) | (600,716) | (11,089,851) | (21,673,319) |
| Net increase (decrease) | (136,301) | 21,628 | $(4,707,981) | $1,417,533 |
| Class I | | | | |
| Shares sold | 688,243 | 4,966,694 | $24,917,967 | $194,190,345 |
| Reinvestment of distributions | 136,677 | 377,332 | 4,926,349 | 14,409,343 |
| Shares redeemed | (2,481,290) | (5,296,143) | (89,431,874) | (200,737,485) |
| Net increase (decrease) | (1,656,370) | 47,883 | $(59,587,558) | $7,862,203 |
| Class Z | | | | |
| Shares sold | 786,388 | 2,267,279 | $28,115,065 | $86,908,960 |
| Reinvestment of distributions | 44,201 | 135,003 | 1,578,440 | 5,151,177 |
| Shares redeemed | (1,836,628) | (2,167,228) | (66,256,870) | (82,982,143) |
| Net increase (decrease) | (1,006,039) | 235,054 | $(36,563,365) | $9,077,994 |
11. Other.
A fund's organizational documents provide former and current trustees and officers with a limited indemnification against liabilities arising in connection with the performance of their duties to the fund. In the normal course of business, a fund may also enter into contracts that provide general indemnifications. A fund's maximum exposure under these arrangements is unknown as this would be dependent on future claims that may be made against a fund. The risk of material loss from such claims is considered remote.
12. Risk and Uncertainties.
Many factors affect a fund's performance. Developments that disrupt global economies and financial markets, such as pandemics, epidemics, outbreaks of infectious diseases, war, terrorism, and environmental disasters, may significantly affect a fund's investment performance. The effects of these developments to a fund will be impacted by the types of securities in which a fund invests, the financial condition, industry, economic sector, and geographic location of an issuer, and a fund's level of investment in the securities of that issuer. Significant concentrations in security types, issuers, industries, sectors, and geographic locations may magnify the factors that affect a fund's performance.
As a shareholder, you incur two types of costs: (1) transaction costs, which may include sales charges (loads) on purchase payments or redemption proceeds, as applicable and (2) ongoing costs, which generally include management fees, distribution and/or service (12b-1) fees and other Fund expenses. This Example is intended to help you understand your ongoing costs (in dollars) of investing in a fund and to compare these costs with the ongoing costs of investing in other mutual funds.
| The Example is based on an investment of $1,000 invested at the beginning of the period and held for the entire period (August 1, 2023 to January 31, 2024). |
Actual Expenses
The first line of the accompanying table provides information about actual account values and actual expenses. You may use the information in this line, together with the amount you invested, to estimate the expenses that you paid over the period. Simply divide your account value by $1,000.00 (for example, an $8,600 account value divided by $1,000.00 = 8.6), then multiply the result by the number in the first line for a class/Fund under the heading entitled "Expenses Paid During Period" to estimate the expenses you paid on your account during this period. If any fund is a shareholder of any underlying mutual funds or exchange-traded funds (ETFs) (the Underlying Funds), such fund indirectly bears its proportional share of the expenses of the Underlying Funds in addition to the direct expenses incurred presented in the table. These fees and expenses are not included in the annualized expense ratio used to calculate the expense estimate in the table below.
Hypothetical Example for Comparison Purposes
The second line of the accompanying table provides information about hypothetical account values and hypothetical expenses based on the actual expense ratio and an assumed rate of return of 5% per year before expenses, which is not the actual return. The hypothetical account values and expenses may not be used to estimate the actual ending account balance or expenses you paid for the period. You may use this information to compare the ongoing costs of investing in the Fund and other funds. To do so, compare this 5% hypothetical example with the 5% hypothetical examples that appear in the shareholder reports of the other funds. If any fund is a shareholder of any Underlying Funds, such fund indirectly bears its proportional share of the expenses of the Underlying Funds in addition to the direct expenses as presented in the table. These fees and expenses are not included in the annualized expense ratio used to calculate the expense estimate in the table below.
Please note that the expenses shown in the table are meant to highlight your ongoing costs only and do not reflect any transaction costs. Therefore, the second line of the table is useful in comparing ongoing costs only, and will not help you determine the relative total costs of owning different funds. In addition, if these transactional costs were included, your costs would have been higher.
| | | | | Annualized Expense Ratio- A | | Beginning Account Value August 1, 2023 | | Ending Account Value January 31, 2024 | | Expenses Paid During Period- C August 1, 2023 to January 31, 2024 |
| Fidelity Advisor® Biotechnology Fund | | | | | | | | | | |
| Class A | | | | 1.00% | | | | | | |
| Actual | | | | | | $ 1,000 | | $ 1,138.30 | | $ 5.37 |
Hypothetical-B | | | | | | $ 1,000 | | $ 1,020.11 | | $ 5.08 |
| Class M | | | | 1.27% | | | | | | |
| Actual | | | | | | $ 1,000 | | $ 1,137.00 | | $ 6.82 |
Hypothetical-B | | | | | | $ 1,000 | | $ 1,018.75 | | $ 6.44 |
| Class C | | | | 1.76% | | | | | | |
| Actual | | | | | | $ 1,000 | | $ 1,133.70 | | $ 9.44 |
Hypothetical-B | | | | | | $ 1,000 | | $ 1,016.29 | | $ 8.92 |
| Class I | | | | .73% | | | | | | |
| Actual | | | | | | $ 1,000 | | $ 1,140.00 | | $ 3.93 |
Hypothetical-B | | | | | | $ 1,000 | | $ 1,021.47 | | $ 3.71 |
Class Z ** | | | | .60% | | | | | | |
| Actual | | | | | | $ 1,000 | | $ 1,140.40 | | $ 3.23 |
Hypothetical-B | | | | | | $ 1,000 | | $ 1,022.12 | | $ 3.05 |
| Fidelity Advisor® Consumer Discretionary Fund | | | | | | | | | | |
| Class A | | | | 1.03% | | | | | | |
| Actual | | | | | | $ 1,000 | | $ 1,027.30 | | $ 5.25 |
Hypothetical-B | | | | | | $ 1,000 | | $ 1,019.96 | | $ 5.23 |
| Class M | | | | 1.29% | | | | | | |
| Actual | | | | | | $ 1,000 | | $ 1,025.90 | | $ 6.57 |
Hypothetical-B | | | | | | $ 1,000 | | $ 1,018.65 | | $ 6.55 |
| Class C | | | | 1.79% | | | | | | |
| Actual | | | | | | $ 1,000 | | $ 1,023.30 | | $ 9.10 |
Hypothetical-B | | | | | | $ 1,000 | | $ 1,016.14 | | $ 9.07 |
Class I ** | | | | .76% | | | | | | |
| Actual | | | | | | $ 1,000 | | $ 1,028.60 | | $ 3.88 |
Hypothetical-B | | | | | | $ 1,000 | | $ 1,021.32 | | $ 3.86 |
Class Z ** | | | | .63% | | | | | | |
| Actual | | | | | | $ 1,000 | | $ 1,029.20 | | $ 3.21 |
Hypothetical-B | | | | | | $ 1,000 | | $ 1,021.97 | | $ 3.20 |
| Fidelity Advisor® Energy Fund | | | | | | | | | | |
| Class A | | | | 1.01% | | | | | | |
| Actual | | | | | | $ 1,000 | | $ 967.70 | | $ 5.00 |
Hypothetical-B | | | | | | $ 1,000 | | $ 1,020.06 | | $ 5.13 |
| Class M | | | | 1.26% | | | | | | |
| Actual | | | | | | $ 1,000 | | $ 966.50 | | $ 6.23 |
Hypothetical-B | | | | | | $ 1,000 | | $ 1,018.80 | | $ 6.39 |
| Class C | | | | 1.75% | | | | | | |
| Actual | | | | | | $ 1,000 | | $ 964.30 | | $ 8.64 |
Hypothetical-B | | | | | | $ 1,000 | | $ 1,016.34 | | $ 8.87 |
| Class I | | | | .73% | | | | | | |
| Actual | | | | | | $ 1,000 | | $ 969.20 | | $ 3.61 |
Hypothetical-B | | | | | | $ 1,000 | | $ 1,021.47 | | $ 3.71 |
Class Z ** | | | | .60% | | | | | | |
| Actual | | | | | | $ 1,000 | | $ 969.80 | | $ 2.97 |
Hypothetical-B | | | | | | $ 1,000 | | $ 1,022.12 | | $ 3.05 |
| Fidelity Advisor® Financials Fund | | | | | | | | | | |
| Class A | | | | 1.05% | | | | | | |
| Actual | | | | | | $ 1,000 | | $ 1,112.10 | | $ 5.57 |
Hypothetical-B | | | | | | $ 1,000 | | $ 1,019.86 | | $ 5.33 |
| Class M | | | | 1.29% | | | | | | |
| Actual | | | | | | $ 1,000 | | $ 1,111.20 | | $ 6.85 |
Hypothetical-B | | | | | | $ 1,000 | | $ 1,018.65 | | $ 6.55 |
| Class C | | | | 1.80% | | | | | | |
| Actual | | | | | | $ 1,000 | | $ 1,108.40 | | $ 9.54 |
Hypothetical-B | | | | | | $ 1,000 | | $ 1,016.09 | | $ 9.12 |
Class I ** | | | | .78% | | | | | | |
| Actual | | | | | | $ 1,000 | | $ 1,113.50 | | $ 4.14 |
Hypothetical-B | | | | | | $ 1,000 | | $ 1,021.22 | | $ 3.96 |
Class Z ** | | | | .64% | | | | | | |
| Actual | | | | | | $ 1,000 | | $ 1,114.70 | | $ 3.40 |
Hypothetical-B | | | | | | $ 1,000 | | $ 1,021.92 | | $ 3.25 |
| Fidelity Advisor® Health Care Fund | | | | | | | | | | |
| Class A | | | | .97% | | | | | | |
| Actual | | | | | | $ 1,000 | | $ 1,009.20 | | $ 4.90 |
Hypothetical-B | | | | | | $ 1,000 | | $ 1,020.26 | | $ 4.93 |
| Class M | | | | 1.22% | | | | | | |
| Actual | | | | | | $ 1,000 | | $ 1,008.10 | | $ 6.16 |
Hypothetical-B | | | | | | $ 1,000 | | $ 1,019.00 | | $ 6.19 |
| Class C | | | | 1.72% | | | | | | |
| Actual | | | | | | $ 1,000 | | $ 1,005.60 | | $ 8.67 |
Hypothetical-B | | | | | | $ 1,000 | | $ 1,016.49 | | $ 8.72 |
| Class I | | | | .71% | | | | | | |
| Actual | | | | | | $ 1,000 | | $ 1,010.70 | | $ 3.59 |
Hypothetical-B | | | | | | $ 1,000 | | $ 1,021.57 | | $ 3.61 |
Class Z ** | | | | .58% | | | | | | |
| Actual | | | | | | $ 1,000 | | $ 1,011.30 | | $ 2.93 |
Hypothetical-B | | | | | | $ 1,000 | | $ 1,022.22 | | $ 2.95 |
| Fidelity Advisor® Industrials Fund | | | | | | | | | | |
| Class A | | | | 1.03% | | | | | | |
| Actual | | | | | | $ 1,000 | | $ 1,057.10 | | $ 5.33 |
Hypothetical-B | | | | | | $ 1,000 | | $ 1,019.96 | | $ 5.23 |
| Class M | | | | 1.28% | | | | | | |
| Actual | | | | | | $ 1,000 | | $ 1,056.00 | | $ 6.62 |
Hypothetical-B | | | | | | $ 1,000 | | $ 1,018.70 | | $ 6.50 |
| Class C | | | | 1.78% | | | | | | |
| Actual | | | | | | $ 1,000 | | $ 1,053.00 | | $ 9.19 |
Hypothetical-B | | | | | | $ 1,000 | | $ 1,016.19 | | $ 9.02 |
Class I ** | | | | .76% | | | | | | |
| Actual | | | | | | $ 1,000 | | $ 1,058.60 | | $ 3.93 |
Hypothetical-B | | | | | | $ 1,000 | | $ 1,021.32 | | $ 3.86 |
Class Z ** | | | | .63% | | | | | | |
| Actual | | | | | | $ 1,000 | | $ 1,059.20 | | $ 3.26 |
Hypothetical-B | | | | | | $ 1,000 | | $ 1,021.97 | | $ 3.20 |
| Fidelity Advisor® Semiconductors Fund | | | | | | | | | | |
| Class A | | | | .99% | | | | | | |
| Actual | | | | | | $ 1,000 | | $ 1,065.10 | | $ 5.14 |
Hypothetical-B | | | | | | $ 1,000 | | $ 1,020.16 | | $ 5.03 |
| Class M | | | | 1.22% | | | | | | |
| Actual | | | | | | $ 1,000 | | $ 1,063.70 | | $ 6.33 |
Hypothetical-B | | | | | | $ 1,000 | | $ 1,019.00 | | $ 6.19 |
| Class C | | | | 1.74% | | | | | | |
| Actual | | | | | | $ 1,000 | | $ 1,060.90 | | $ 9.01 |
Hypothetical-B | | | | | | $ 1,000 | | $ 1,016.39 | | $ 8.82 |
| Class I | | | | .73% | | | | | | |
| Actual | | | | | | $ 1,000 | | $ 1,066.40 | | $ 3.79 |
Hypothetical-B | | | | | | $ 1,000 | | $ 1,021.47 | | $ 3.71 |
Class Z ** | | | | .61% | | | | | | |
| Actual | | | | | | $ 1,000 | | $ 1,067.10 | | $ 3.17 |
Hypothetical-B | | | | | | $ 1,000 | | $ 1,022.07 | | $ 3.10 |
| Fidelity Advisor® Technology Fund | | | | | | | | | | |
| Class A | | | | .96% | | | | | | |
| Actual | | | | | | $ 1,000 | | $ 1,074.90 | | $ 5.01 |
Hypothetical-B | | | | | | $ 1,000 | | $ 1,020.31 | | $ 4.88 |
| Class M | | | | 1.21% | | | | | | |
| Actual | | | | | | $ 1,000 | | $ 1,073.70 | | $ 6.31 |
Hypothetical-B | | | | | | $ 1,000 | | $ 1,019.05 | | $ 6.14 |
| Class C | | | | 1.73% | | | | | | |
| Actual | | | | | | $ 1,000 | | $ 1,070.90 | | $ 9.01 |
Hypothetical-B | | | | | | $ 1,000 | | $ 1,016.44 | | $ 8.77 |
| Class I | | | | .70% | | | | | | |
| Actual | | | | | | $ 1,000 | | $ 1,076.40 | | $ 3.65 |
Hypothetical-B | | | | | | $ 1,000 | | $ 1,021.62 | | $ 3.56 |
Class Z ** | | | | .58% | | | | | | |
| Actual | | | | | | $ 1,000 | | $ 1,077.00 | | $ 3.03 |
Hypothetical-B | | | | | | $ 1,000 | | $ 1,022.22 | | $ 2.95 |
| Fidelity Advisor® Utilities Fund | | | | | | | | | | |
| Class A | | | | 1.02% | | | | | | |
| Actual | | | | | | $ 1,000 | | $ 957.40 | | $ 5.02 |
Hypothetical-B | | | | | | $ 1,000 | | $ 1,020.01 | | $ 5.18 |
| Class M | | | | 1.28% | | | | | | |
| Actual | | | | | | $ 1,000 | | $ 956.30 | | $ 6.29 |
Hypothetical-B | | | | | | $ 1,000 | | $ 1,018.70 | | $ 6.50 |
| Class C | | | | 1.77% | | | | | | |
| Actual | | | | | | $ 1,000 | | $ 953.90 | | $ 8.69 |
Hypothetical-B | | | | | | $ 1,000 | | $ 1,016.24 | | $ 8.97 |
| Class I | | | | .75% | | | | | | |
| Actual | | | | | | $ 1,000 | | $ 958.90 | | $ 3.69 |
Hypothetical-B | | | | | | $ 1,000 | | $ 1,021.37 | | $ 3.81 |
| Class Z | | | | .62% | | | | | | |
| Actual | | | | | | $ 1,000 | | $ 959.40 | | $ 3.05 |
Hypothetical-B | | | | | | $ 1,000 | | $ 1,022.02 | | $ 3.15 |
| |
A Annualized expense ratio reflects expenses net of applicable fee waivers.
B 5% return per year before expenses
C Expenses are equal to the annualized expense ratio, multiplied by the average account value over the period, multiplied by 184/ 366 (to reflect the one-half year period). The fees and expenses of any Underlying Funds are not included in each annualized expense ratio.
** If fees and changes to the expense contract and/or expense cap, effective March 1, 2024, had been in effect during the current period, the restated annualized expense ratio and the expenses paid in the actual and hypothetical examples above would have been as shown in table below:
| | | | | Annualized Expense Ratio- A | | Expenses Paid |
| Fidelity Advisor® Biotechnology Fund | | | | | | |
| Class Z | | | | .56% | | |
| Actual | | | | | | $ 3.01 |
Hypothetical- B | | | | | | $ 2.85 |
| Fidelity Advisor® Consumer Discretionary Fund | | | | | | |
| Class I | | | | .72% | | |
| Actual | | | | | | $ 3.67 |
Hypothetical- B | | | | | | $ 3.66 |
| Class Z | | | | .59% | | |
| Actual | | | | | | $ 3.01 |
Hypothetical- B | | | | | | $ 3.00 |
| Fidelity Advisor® Energy Fund | | | | | | |
| Class Z | | | | .57% | | |
| Actual | | | | | | $ 2.82 |
Hypothetical- B | | | | | | $ 2.90 |
| Fidelity Advisor® Financials Fund | | | | | | |
| Class I | | | | .73% | | |
| Actual | | | | | | $ 3.88 |
Hypothetical- B | | | | | | $ 3.71 |
| Class Z | | | | .60% | | |
| Actual | | | | | | $ 3.19 |
Hypothetical- B | | | | | | $ 3.05 |
| Fidelity Advisor® Health Care Fund | | | | | | |
| Class Z | | | | .55% | | |
| Actual | | | | | | $ 2.78 |
Hypothetical- B | | | | | | $ 2.80 |
| Fidelity Advisor® Industrials Fund | | | | | | |
| Class I | | | | .72% | | |
| Actual | | | | | | $ 3.73 |
Hypothetical- B | | | | | | $ 3.66 |
| Class Z | | | | .56% | | |
| Actual | | | | | | $ 2.90 |
Hypothetical- B | | | | | | $ 2.85 |
| Fidelity Advisor® Semiconductors Fund | | | | | | |
| Class Z | | | | .57% | | |
| Actual | | | | | | $ 2.96 |
Hypothetical- B | | | | | | $ 2.90 |
| Fidelity Advisor® Technology Fund | | | | | | |
| Class Z | | | | .55% | | |
| Actual | | | | | | $ 2.87 |
Hypothetical- B | | | | | | $ 2.80 |
| | | | | | |
| | | | | | | |
| A Annualized expense ratio reflects expenses net of applicable fee waivers. | | | | | | |
| B 5% return per year before expenses | | | | | | |
Board Approval of Investment Advisory Contracts
At its January 2024 meeting, the Board of Trustees, including the Independent Trustees (together, the Board), approved an amended and restated management contract with Fidelity Management & Research Company LLC (FMR) (the Management Contract), and amended and restated sub-advisory agreements (the Sub-Advisory Contracts, and together with the Management Contract, the Advisory Contracts) for each fund, including each fund's sub-advisory agreements with FMR Investment Management (UK) Limited (FMR UK), Fidelity Management & Research (Hong Kong) Limited (FMR H.K.), and Fidelity Management & Research (Japan) Limited (FMR Japan). The Advisory Contracts will be effective March 1, 2024. The Board will consider the annual renewal of each fund's Advisory Contracts in May 2024, following its review of additional materials provided by FMR.
Management Contract. The Board approved the Management Contract, which implements a new fee structure combining the management fee, transfer agent fee (TA Fee), and pricing and bookkeeping fee (P&B Fee) of each fund and each class of each fund into a single class-level fee based on tiered schedules and subject to a maximum class-level rate (the Unified Fee). In exchange for the Unified Fee, each fund will receive investment advisory, management, administrative, transfer agent, pricing and bookkeeping services under a single agreement - the Management Contract.
In its consideration of the Management Contract over several meetings, the Board received, reviewed and discussed a comprehensive set of analyses regarding the Unified Fee including (i) the legal framework, (ii) design goals for the Unified Fee, (iii) calculation methodology for the Unified Fee and illustrative examples, (iv) annual and cumulative projected impacts under various scenarios, both in the aggregate and at the fund/class level, (v) explanations of schedules, rate levers and maximum rates and (vi) shareholder benefits and projected savings.
The Board considered that the maximum Unified Fee for each class of each fund would be no higher than the sum of (i) the lowest contractual management fee rate under each fund's existing management contract, which is the individual fund fee rate, if any, plus the lowest contractual marginal group fee rate and (ii) the TA and P&B Fee rates, which are fixed fee rates since December 1, 2023 (together, the Unified Fee Cap). The Board noted that Fidelity has represented that, as a result of this Unified Fee Cap, the Unified Fee would be no greater than the fee rates previously authorized to be charged to each fund for the same services. The Board noted that certain expenses such as third-party expenses, Rule 12b-1 fees, and certain other miscellaneous expenses would be outside the scope of the Unified Fee and the calculation of such fees would not change as a result of the Unified Fee. The Board considered that, under the Management Contract, a different management fee rate will be applicable to each class of each fund. The Board noted that Fidelity has represented that the difference in expenses between classes is based on differences in class-specific expenses and not due to any difference in advisory or third-party custodial fees or other expenses related to the management of a fund's assets.
The Board considered Fidelity's representations that implementation of the Unified Fee, which includes the Unified Fee Cap, would cause all funds subject to the Unified Fee, including each fund, to experience an immediate reduction on contractual fee rates for services provided under the current management contracts. The Board considered that some funds would not experience lower net total fees as a result of existing fee caps. The Board further considered that, in addition to the contractual fee savings, the Unified Fee offers funds and their shareholders greater protection from future rate increases for services previously offered under separate agreements that are now covered by the Management Contract because such rate increases would require shareholder approval.
Sub-Advisory Contracts. In connection with the Unified Fee changes, the Board considered the Sub-Advisory Contracts, which simplified the calculation of the fees paid by FMR to the sub-advisers under the agreements. The Board noted that the agreements with FMR UK, FMR H.K., and FMR Japan were amended to provide that FMR will compensate each sub-adviser at a fee rate equal to 110% of the sub-adviser's costs incurred in providing services under the agreement. The Board considered that, under the Sub-Advisory Contracts, FMR, and not each fund, will continue to pay the sub-advisory fees to each applicable sub-adviser.
The Board further considered that the approval of each fund's Advisory Contracts will not result in any changes in the investment process or strategies employed in the management of each fund's assets or the day-to-day management of each fund or the persons primarily responsible for such management. Further, the Board considered that the Management Contract would not change the obligations and services of FMR and its affiliates on behalf of each fund, and, in particular, there would be no change in the nature and level of advisory, management, administration, transfer agent, and pricing and bookkeeping services provided to each fund by FMR, its affiliates, and each applicable sub-adviser.
In connection with its consideration of future renewals of each fund's Advisory Contracts, the Board will consider: (i) the nature, extent and quality of services provided to the funds, including shareholder and administrative services and investment performance; (ii) the competitiveness of the management fee and total expenses for each fund; (iii) the costs of the services and profitability, including the revenues earned and the expenses incurred in conducting the business of developing, marketing, distributing, managing, administering, and servicing each fund and its shareholders, to the extent applicable; and (iv) whether there have been economies of scale in respect of the Fidelity funds, whether the Fidelity funds (including the fund[s]) have appropriately benefited from any such economies of scale, and whether there is the potential for realization of any further economies.
Based on its evaluation of all of the conclusions and representations noted above, and after considering all factors it believed relevant, the Board concluded that each fund's management fee structure is fair and reasonable, and that the funds' Advisory Contracts should be approved.
The Securities and Exchange Commission adopted Rule 22e-4 under the Investment Company Act of 1940 (the Liquidity Rule) to promote effective liquidity risk management throughout the open-end investment company industry, thereby reducing the risk that funds will be unable to meet their redemption obligations and mitigating dilution of the interests of fund shareholders.
The Funds have adopted and implemented a liquidity risk management program (the Program) reasonably designed to assess and manage each Fund's liquidity risk and to comply with the requirements of the Liquidity Rule. Each Fund's Board of Trustees (the Board) has designated each Fund's investment adviser as administrator of the Program. The Fidelity advisers have established a Liquidity Risk Management Committee (the LRM Committee) to manage the Program for each of the Fidelity Funds. The LRM Committee monitors the adequacy and effectiveness of implementation of the Program and on a periodic basis assesses each Fund's liquidity risk based on a variety of factors including (1) the Fund's investment strategy, (2) portfolio liquidity and cash flow projections during normal and reasonably foreseeable stressed conditions, (3) shareholder redemptions, (4) borrowings and other funding sources and (5) certain factor specific to ETFs including the effect of the Fund's prices and spreads, market participants, and basket compositions on the overall liquidity of the Fund's portfolio, as applicable.
In accordance with the Program, each of the Fund's portfolio investments is classified into one of four defined liquidity categories based on a determination of a reasonable expectation for how long it would take to convert the investment to cash (or sell or dispose of the investment) without significantly changing its market value.
- Highly liquid investments - cash or convertible to cash within three business days or less
- Moderately liquid investments - convertible to cash in three to seven calendar days
- Less liquid investments - can be sold or disposed of, but not settled, within seven calendar days
- Illiquid investments - cannot be sold or disposed of within seven calendar days
Liquidity classification determinations take into account a variety of factors including various market, trading and investment-specific considerations, as well as market depth, and generally utilize analysis from a third-party liquidity metrics service.
The Liquidity Rule places a 15% limit on a fund's illiquid investments and requires funds that do not primarily hold assets that are highly liquid investments to determine and maintain a minimum percentage of the fund's net assets to be invested in highly liquid investments (highly liquid investment minimum or HLIM). The Program includes provisions reasonably designed to comply with the 15% limit on illiquid investments and for determining, periodically reviewing and complying with the HLIM requirement as applicable.
At a recent meeting of the Fund's Board of Trustees, the LRM Committee provided a written report to the Board pertaining to the operation, adequacy, and effectiveness of the Program for the period December 1, 2022 through November 30, 2023. The report concluded that the Program is operating effectively and is reasonably designed to assess and manage the Fund's liquidity risk.
1.700839.127
AFOC-SANN-0324
Fidelity Advisor® Real Estate Fund
Semi-Annual Report
January 31, 2024
Contents
To view a fund's proxy voting guidelines and proxy voting record for the 12-month period ended June 30, visit http://www.fidelity.com/proxyvotingresults or visit the Securities and Exchange Commission's (SEC) web site at http://www.sec.gov.
You may also call 1-877-208-0098 to request a free copy of the proxy voting guidelines.
Standard & Poor's, S&P and S&P 500 are registered service marks of The McGraw-Hill Companies, Inc. and have been licensed for use by Fidelity Distributors Corporation.
Other third-party marks appearing herein are the property of their respective owners.
All other marks appearing herein are registered or unregistered trademarks or service marks of FMR LLC or an affiliated company. © 2024 FMR LLC. All rights reserved.
This report and the financial statements contained herein are submitted for the general information of the shareholders of the Fund. This report is not authorized for distribution to prospective investors in the Fund unless preceded or accompanied by an effective prospectus.
A fund files its complete schedule of portfolio holdings with the SEC for the first and third quarters of each fiscal year on Form N-PORT. Forms N-PORT are available on the SEC's web site at http://www.sec.gov. A fund's Forms N-PORT may be reviewed and copied at the SEC's Public Reference Room in Washington, DC. Information regarding the operation of the SEC's Public Reference Room may be obtained by calling 1-800-SEC-0330.
For a complete list of a fund's portfolio holdings, view the most recent holdings listing, semiannual report, or annual report on Fidelity's web site at http://www.fidelity.com, http://www.institutional.fidelity.com, or http://www.401k.com, as applicable.
NOT FDIC INSURED •MAY LOSE VALUE •NO BANK GUARANTEE
Neither the Fund nor Fidelity Distributors Corporation is a bank.
Top Holdings (% of Fund's net assets) |
| |
| Prologis, Inc. | 11.8 | |
| Equinix, Inc. | 7.9 | |
| Crown Castle, Inc. | 7.8 | |
| American Tower Corp. | 5.6 | |
| Ventas, Inc. | 5.3 | |
| CubeSmart | 5.2 | |
| CBRE Group, Inc. | 4.7 | |
| Digital Realty Trust, Inc. | 4.0 | |
| Mid-America Apartment Communities, Inc. | 3.5 | |
| Welltower, Inc. | 3.4 | |
| | 59.2 | |
| |
| Top REIT Sectors (% of Fund's net assets) |
| |
| REITs - Diversified | 21.6 | |
| REITs - Warehouse/Industrial | 17.5 | |
| REITs - Apartments | 11.0 | |
| REITs - Health Care | 8.7 | |
| REITs - Management/Investment | 7.5 | |
| |
Asset Allocation (% of Fund's net assets) |
|
|
Showing Percentage of Net Assets
| Common Stocks - 99.3% |
| | | Shares | Value ($) |
| Equity Real Estate Investment Trusts (REITs) - 92.5% | | | |
| REITs - Apartments - 11.0% | | | |
| Essex Property Trust, Inc. | | 32,147 | 7,498,931 |
| Invitation Homes, Inc. | | 167,300 | 5,509,189 |
| Mid-America Apartment Communities, Inc. | | 65,700 | 8,303,166 |
| UDR, Inc. | | 123,200 | 4,437,664 |
| | | | 25,748,950 |
| REITs - Diversified - 21.6% | | | |
| Crown Castle, Inc. | | 167,700 | 18,153,525 |
| Digital Realty Trust, Inc. | | 66,600 | 9,354,636 |
| Equinix, Inc. | | 22,300 | 18,503,871 |
| Lamar Advertising Co. Class A | | 33,900 | 3,548,652 |
| Outfront Media, Inc. | | 71,600 | 932,232 |
| | | | 50,492,916 |
| REITs - Health Care - 8.7% | | | |
| Ventas, Inc. | | 267,205 | 12,395,640 |
| Welltower, Inc. | | 92,500 | 8,002,175 |
| | | | 20,397,815 |
| REITs - Hotels - 2.8% | | | |
| Ryman Hospitality Properties, Inc. | | 59,700 | 6,561,030 |
| REITs - Management/Investment - 7.5% | | | |
| American Tower Corp. | | 66,500 | 13,010,725 |
| NNN (REIT), Inc. | | 113,500 | 4,578,590 |
| | | | 17,589,315 |
| REITs - Manufactured Homes - 3.0% | | | |
| Equity Lifestyle Properties, Inc. | | 99,606 | 6,742,330 |
| Sun Communities, Inc. | | 1,800 | 225,630 |
| | | | 6,967,960 |
| REITs - Office Property - 2.3% | | | |
| Alexandria Real Estate Equities, Inc. | | 33,300 | 4,025,970 |
| Douglas Emmett, Inc. (a) | | 98,300 | 1,331,965 |
| | | | 5,357,935 |
| REITs - Regional Malls - 1.6% | | | |
| Tanger, Inc. | | 141,000 | 3,792,900 |
| REITs - Shopping Centers - 5.5% | | | |
| Kite Realty Group Trust | | 72,500 | 1,551,500 |
| SITE Centers Corp. | | 495,800 | 6,604,056 |
| Urban Edge Properties | | 263,100 | 4,543,737 |
| | | | 12,699,293 |
| REITs - Single Tenant - 3.9% | | | |
| Four Corners Property Trust, Inc. | | 276,900 | 6,482,229 |
| NETSTREIT Corp. (a) | | 138,600 | 2,518,362 |
| | | | 9,000,591 |
| REITs - Storage - 7.1% | | | |
| CubeSmart | | 281,000 | 12,144,820 |
| Extra Space Storage, Inc. | | 30,400 | 4,390,976 |
| | | | 16,535,796 |
| REITs - Warehouse/Industrial - 17.5% | | | |
| Americold Realty Trust | | 231,900 | 6,377,250 |
| EastGroup Properties, Inc. | | 19,500 | 3,459,885 |
| Prologis, Inc. | | 216,916 | 27,481,088 |
| Terreno Realty Corp. | | 60,700 | 3,625,611 |
| | | | 40,943,834 |
TOTAL EQUITY REAL ESTATE INVESTMENT TRUSTS (REITS) | | | 216,088,335 |
| Real Estate Management & Development - 6.8% | | | |
| Real Estate Services - 6.8% | | | |
| CBRE Group, Inc. (b) | | 125,700 | 10,849,167 |
| CoStar Group, Inc. (b) | | 60,000 | 5,008,800 |
| | | | 15,857,967 |
| TOTAL COMMON STOCKS (Cost $188,155,538) | | | 231,946,302 |
| | | | |
| Money Market Funds - 1.9% |
| | | Shares | Value ($) |
| Fidelity Cash Central Fund 5.39% (c) | | 1,041,883 | 1,042,091 |
| Fidelity Securities Lending Cash Central Fund 5.39% (c)(d) | | 3,354,940 | 3,355,275 |
| TOTAL MONEY MARKET FUNDS (Cost $4,397,366) | | | 4,397,366 |
| | | | |
| TOTAL INVESTMENT IN SECURITIES - 101.2% (Cost $192,552,904) | 236,343,668 |
NET OTHER ASSETS (LIABILITIES) - (1.2)% | (2,735,326) |
| NET ASSETS - 100.0% | 233,608,342 |
| | |
Legend
| (a) | Security or a portion of the security is on loan at period end. |
| (c) | Affiliated fund that is generally available only to investment companies and other accounts managed by Fidelity Investments. The rate quoted is the annualized seven-day yield of the fund at period end. A complete unaudited listing of the fund's holdings as of its most recent quarter end is available upon request. In addition, each Fidelity Central Fund's financial statements are available on the SEC's website or upon request. |
| (d) | Investment made with cash collateral received from securities on loan. |
Affiliated Central Funds
Fiscal year to date information regarding the Fund's investments in Fidelity Central Funds, including the ownership percentage, is presented below.
| Affiliate | Value, beginning of period ($) | Purchases ($) | Sales Proceeds ($) | Dividend Income ($) | Realized Gain (loss) ($) | Change in Unrealized appreciation (depreciation) ($) | Value, end of period ($) | % ownership, end of period |
| Fidelity Cash Central Fund 5.39% | 3,119,380 | 31,280,241 | 33,357,530 | 26,452 | - | - | 1,042,091 | 0.0% |
| Fidelity Securities Lending Cash Central Fund 5.39% | 478,200 | 3,782,688 | 905,613 | 2,220 | - | - | 3,355,275 | 0.0% |
| Total | 3,597,580 | 35,062,929 | 34,263,143 | 28,672 | - | - | 4,397,366 | |
| | | | | | | | | |
Amounts in the dividend income column in the above table include any capital gain distributions from underlying funds, which are presented in the corresponding line item in the Statement of Operations, if applicable.
Amounts in the dividend income column for Fidelity Securities Lending Cash Central Fund represents the income earned on investing cash collateral, less rebates paid to borrowers and any lending agent fees associated with the loan, plus any premium payments received for lending certain types of securities.
Amounts included in the purchases and sales proceeds columns may include in-kind transactions, if applicable.
Investment Valuation
The following is a summary of the inputs used, as of January 31, 2024, involving the Fund's assets and liabilities carried at fair value. The inputs or methodology used for valuing securities may not be an indication of the risk associated with investing in those securities. For more information on valuation inputs, and their aggregation into the levels used below, please refer to the Investment Valuation section in the accompanying Notes to Financial Statements.
| Valuation Inputs at Reporting Date: |
| Description | Total ($) | Level 1 ($) | Level 2 ($) | Level 3 ($) |
Investments in Securities: | | | | |
|
| Common Stocks | 231,946,302 | 231,946,302 | - | - |
|
| Money Market Funds | 4,397,366 | 4,397,366 | - | - |
| Total Investments in Securities: | 236,343,668 | 236,343,668 | - | - |
| Statement of Assets and Liabilities |
| | | | January 31, 2024 (Unaudited) |
| | | | | |
| Assets | | | | |
| Investment in securities, at value (including securities loaned of $3,208,008) - See accompanying schedule: | | | | |
Unaffiliated issuers (cost $188,155,538) | $ | 231,946,302 | | |
Fidelity Central Funds (cost $4,397,366) | | 4,397,366 | | |
| | | | | |
| | | | | |
| Total Investment in Securities (cost $192,552,904) | | | $ | 236,343,668 |
| Receivable for investments sold | | | | 421,900 |
| Receivable for fund shares sold | | | | 1,208,902 |
| Dividends receivable | | | | 216,898 |
| Distributions receivable from Fidelity Central Funds | | | | 5,189 |
| Prepaid expenses | | | | 1,129 |
| Other receivables | | | | 95,055 |
Total assets | | | | 238,292,741 |
| Liabilities | | | | |
| Payable for investments purchased | $ | 448,441 | | |
| Payable for fund shares redeemed | | 544,522 | | |
| Accrued management fee | | 104,301 | | |
| Distribution and service plan fees payable | | 56,630 | | |
| Other affiliated payables | | 45,972 | | |
| Other payables and accrued expenses | | 129,258 | | |
| Collateral on securities loaned | | 3,355,275 | | |
| Total Liabilities | | | | 4,684,399 |
| Net Assets | | | $ | 233,608,342 |
| Net Assets consist of: | | | | |
| Paid in capital | | | $ | 199,468,190 |
| Total accumulated earnings (loss) | | | | 34,140,152 |
| Net Assets | | | $ | 233,608,342 |
| | | | | |
| Net Asset Value and Maximum Offering Price | | | | |
| Class A : | | | | |
Net Asset Value and redemption price per share ($83,170,288 ÷ 5,206,422 shares)(a) | | | $ | 15.97 |
| Maximum offering price per share (100/94.25 of $15.97) | | | $ | 16.94 |
| Class M : | | | | |
Net Asset Value and redemption price per share ($78,826,612 ÷ 4,960,705 shares)(a) | | | $ | 15.89 |
| Maximum offering price per share (100/96.50 of $15.89) | | | $ | 16.47 |
| Class C : | | | | |
Net Asset Value and offering price per share ($5,557,980 ÷ 367,435 shares)(a) | | | $ | 15.13 |
| Class I : | | | | |
Net Asset Value, offering price and redemption price per share ($60,265,548 ÷ 3,705,259 shares) | | | $ | 16.26 |
| Class Z : | | | | |
Net Asset Value, offering price and redemption price per share ($5,787,914 ÷ 356,246 shares) | | | $ | 16.25 |
(a)Redemption price per share is equal to net asset value less any applicable contingent deferred sales charge. |
| Statement of Operations |
| | | | Six months ended January 31, 2024 (Unaudited) |
| Investment Income | | | | |
| Dividends | | | $ | 3,575,757 |
| Income from Fidelity Central Funds (including $2,220 from security lending) | | | | 28,672 |
| Total Income | | | | 3,604,429 |
| Expenses | | | | |
| Management fee | $ | 612,529 | | |
| Transfer agent fees | | 244,453 | | |
| Distribution and service plan fees | | 329,267 | | |
| Accounting fees | | 41,496 | | |
| Custodian fees and expenses | | 7,195 | | |
| Independent trustees' fees and expenses | | 702 | | |
| Registration fees | | 46,848 | | |
| Audit | | 28,155 | | |
| Legal | | 370 | | |
| Miscellaneous | | 841 | | |
| Total expenses before reductions | | 1,311,856 | | |
| Expense reductions | | (10,328) | | |
| Total expenses after reductions | | | | 1,301,528 |
| Net Investment income (loss) | | | | 2,302,901 |
| Realized and Unrealized Gain (Loss) | | | | |
| Net realized gain (loss) on: | | | | |
| Investment Securities: | | | | |
| Unaffiliated issuers | | (362,656) | | |
| Total net realized gain (loss) | | | | (362,656) |
| Change in net unrealized appreciation (depreciation) on investment securities | | | | (2,762,672) |
| Net gain (loss) | | | | (3,125,328) |
| Net increase (decrease) in net assets resulting from operations | | | $ | (822,427) |
| Statement of Changes in Net Assets |
| |
| | Six months ended January 31, 2024 (Unaudited) | | Year ended July 31, 2023 |
| Increase (Decrease) in Net Assets | | | | |
| Operations | | | | |
| Net investment income (loss) | $ | 2,302,901 | $ | 5,878,612 |
| Net realized gain (loss) | | (362,656) | | (4,606,425) |
| Change in net unrealized appreciation (depreciation) | | (2,762,672) | | (51,993,325) |
| Net increase (decrease) in net assets resulting from operations | | (822,427) | | (50,721,138) |
| Distributions to shareholders | | (4,260,352) | | (43,497,468) |
| | | | | |
| Share transactions - net increase (decrease) | | (19,926,803) | | (57,482,753) |
| Total increase (decrease) in net assets | | (25,009,582) | | (151,701,359) |
| | | | | |
| Net Assets | | | | |
| Beginning of period | | 258,617,924 | | 410,319,283 |
| End of period | $ | 233,608,342 | $ | 258,617,924 |
| | | | | |
| | | | | |
Financial Highlights
| Fidelity Advisor® Real Estate Fund Class A |
| |
| | Six months ended (Unaudited) January 31, 2024 | | Years ended July 31, 2023 | | 2022 | | 2021 | | 2020 | | 2019 |
Selected Per-Share Data | | | | | | | | | | | | |
| Net asset value, beginning of period | $ | 16.24 | $ | 21.95 | $ | 24.66 | $ | 19.62 | $ | 22.91 | $ | 22.07 |
| Income from Investment Operations | | | | | | | | | | | | |
Net investment income (loss) A,B | | .15 | | .34 | | .22 | | .26 | | .41 | | .37 |
| Net realized and unrealized gain (loss) | | (.14) | | (3.09) | | (1.47) | | 5.50 | | (1.91) | | 1.63 |
| Total from investment operations | | .01 | | (2.75) | | (1.25) | | 5.76 | | (1.50) | | 2.00 |
| Distributions from net investment income | | (.28) | | (.26) | | (.17) | | (.24) | | (.38) | | (.43) |
| Distributions from net realized gain | | - | | (2.69) | | (1.30) | | (.48) | | (1.41) | | (.73) |
| Total distributions | | (.28) | | (2.96) C | | (1.46) C | | (.72) | | (1.79) | | (1.16) |
| Net asset value, end of period | $ | 15.97 | $ | 16.24 | $ | 21.95 | $ | 24.66 | $ | 19.62 | $ | 22.91 |
Total Return D,E,F | | .08% | | (11.70)% | | (5.65)% | | 30.38% | | (7.21)% | | 9.62% |
Ratios to Average Net Assets B,G,H | | | | | | | | | | | | |
| Expenses before reductions | | 1.11% I | | 1.11% | | 1.07% | | 1.09% | | 1.10% | | 1.10% |
| Expenses net of fee waivers, if any | | 1.11% I | | 1.10% | | 1.07% | | 1.09% | | 1.10% | | 1.09% |
| Expenses net of all reductions | | 1.11% I | | 1.10% | | 1.07% | | 1.08% | | 1.09% | | 1.09% |
| Net investment income (loss) | | 1.97% I | | 1.96% | | .95% | | 1.24% | | 1.93% | | 1.68% |
| Supplemental Data | | | | | | | | | | | | |
| Net assets, end of period (000 omitted) | $ | 83,170 | $ | 91,784 | $ | 122,949 | $ | 138,134 | $ | 115,736 | $ | 151,536 |
Portfolio turnover rate J | | 28% I | | 31% | | 48% | | 53% | | 56% | | 49% |
ACalculated based on average shares outstanding during the period.
BNet investment income (loss) is affected by the timing of the declaration of dividends by any underlying mutual funds or exchange-traded funds (ETFs). Net investment income (loss) of any mutual funds or ETFs is not included in the Fund's net investment income (loss) ratio.
CTotal distributions per share do not sum due to rounding.
DTotal returns for periods of less than one year are not annualized.
ETotal returns would have been lower if certain expenses had not been reduced during the applicable periods shown.
FTotal returns do not include the effect of the sales charges.
GFees and expenses of any underlying mutual funds or exchange-traded funds (ETFs) are not included in the Fund's expense ratio. The Fund indirectly bears its proportionate share of these expenses. For additional expense information related to investments in Fidelity Central Funds, please refer to the "Investments in Fidelity Central Funds" note found in the Notes to Financial Statements section of the most recent Annual or Semi-Annual report.
HExpense ratios reflect operating expenses of the class. Expenses before reductions do not reflect amounts reimbursed, waived, or reduced through arrangements with the investment adviser, brokerage services, or other offset arrangements, if applicable, and do not represent the amount paid by the class during periods when reimbursements, waivers or reductions occur.
IAnnualized.
JAmount does not include the portfolio activity of any underlying mutual funds or exchange-traded funds (ETFs).
| Fidelity Advisor® Real Estate Fund Class M |
| |
| | Six months ended (Unaudited) January 31, 2024 | | Years ended July 31, 2023 | | 2022 | | 2021 | | 2020 | | 2019 |
Selected Per-Share Data | | | | | | | | | | | | |
| Net asset value, beginning of period | $ | 16.16 | $ | 21.87 | $ | 24.59 | $ | 19.58 | $ | 22.87 | $ | 22.05 |
| Income from Investment Operations | | | | | | | | | | | | |
Net investment income (loss) A,B | | .13 | | .30 | | .17 | | .21 | | .36 | | .32 |
| Net realized and unrealized gain (loss) | | (.13) | | (3.08) | | (1.46) | | 5.49 | | (1.90) | | 1.62 |
| Total from investment operations | | - C | | (2.78) | | (1.29) | | 5.70 | | (1.54) | | 1.94 |
| Distributions from net investment income | | (.27) | | (.24) | | (.13) | | (.22) | | (.34) | | (.39) |
| Distributions from net realized gain | | - | | (2.69) | | (1.30) | | (.48) | | (1.41) | | (.73) |
| Total distributions | | (.27) | | (2.93) | | (1.43) | | (.69) D | | (1.75) | | (1.12) |
| Net asset value, end of period | $ | 15.89 | $ | 16.16 | $ | 21.87 | $ | 24.59 | $ | 19.58 | $ | 22.87 |
Total Return E,F,G | | (.04)% | | (11.87)% | | (5.83)% | | 30.14% | | (7.42)% | | 9.35% |
Ratios to Average Net Assets B,H,I | | | | | | | | | | | | |
| Expenses before reductions | | 1.34% J | | 1.31% | | 1.29% | | 1.31% | | 1.31% | | 1.32% |
| Expenses net of fee waivers, if any | | 1.33% J | | 1.31% | | 1.28% | | 1.31% | | 1.31% | | 1.31% |
| Expenses net of all reductions | | 1.33% J | | 1.31% | | 1.28% | | 1.30% | | 1.30% | | 1.31% |
| Net investment income (loss) | | 1.75% J | | 1.75% | | .73% | | 1.03% | | 1.71% | | 1.46% |
| Supplemental Data | | | | | | | | | | | | |
| Net assets, end of period (000 omitted) | $ | 78,827 | $ | 84,126 | $ | 100,892 | $ | 118,778 | $ | 98,724 | $ | 128,754 |
Portfolio turnover rate K | | 28% J | | 31% | | 48% | | 53% | | 56% | | 49% |
ACalculated based on average shares outstanding during the period.
BNet investment income (loss) is affected by the timing of the declaration of dividends by any underlying mutual funds or exchange-traded funds (ETFs). Net investment income (loss) of any mutual funds or ETFs is not included in the Fund's net investment income (loss) ratio.
CAmount represents less than $.005 per share.
DTotal distributions per share do not sum due to rounding.
ETotal returns for periods of less than one year are not annualized.
FTotal returns would have been lower if certain expenses had not been reduced during the applicable periods shown.
GTotal returns do not include the effect of the sales charges.
HFees and expenses of any underlying mutual funds or exchange-traded funds (ETFs) are not included in the Fund's expense ratio. The Fund indirectly bears its proportionate share of these expenses. For additional expense information related to investments in Fidelity Central Funds, please refer to the "Investments in Fidelity Central Funds" note found in the Notes to Financial Statements section of the most recent Annual or Semi-Annual report.
IExpense ratios reflect operating expenses of the class. Expenses before reductions do not reflect amounts reimbursed, waived, or reduced through arrangements with the investment adviser, brokerage services, or other offset arrangements, if applicable, and do not represent the amount paid by the class during periods when reimbursements, waivers or reductions occur.
JAnnualized.
KAmount does not include the portfolio activity of any underlying mutual funds or exchange-traded funds (ETFs).
| Fidelity Advisor® Real Estate Fund Class C |
| |
| | Six months ended (Unaudited) January 31, 2024 | | Years ended July 31, 2023 | | 2022 | | 2021 | | 2020 | | 2019 |
Selected Per-Share Data | | | | | | | | | | | | |
| Net asset value, beginning of period | $ | 15.38 | $ | 21.00 | $ | 23.74 | $ | 18.97 | $ | 22.26 | $ | 21.54 |
| Income from Investment Operations | | | | | | | | | | | | |
Net investment income (loss) A,B | | .09 | | .20 | | .03 | | .09 | | .23 | | .19 |
| Net realized and unrealized gain (loss) | | (.13) | | (2.97) | | (1.39) | | 5.30 | | (1.85) | | 1.58 |
| Total from investment operations | | (.04) | | (2.77) | | (1.36) | | 5.39 | | (1.62) | | 1.77 |
| Distributions from net investment income | | (.21) | | (.16) | | (.08) | | (.15) | | (.26) | | (.32) |
| Distributions from net realized gain | | - | | (2.69) | | (1.30) | | (.48) | | (1.41) | | (.73) |
| Total distributions | | (.21) | | (2.85) | | (1.38) | | (.62) C | | (1.67) | | (1.05) |
| Net asset value, end of period | $ | 15.13 | $ | 15.38 | $ | 21.00 | $ | 23.74 | $ | 18.97 | $ | 22.26 |
Total Return D,E,F | | (.25)% | | (12.38)% | | (6.35)% | | 29.36% | | (7.95)% | | 8.72% |
Ratios to Average Net Assets B,G,H | | | | | | | | | | | | |
| Expenses before reductions | | 1.86% I | | 1.87% | | 1.86% | | 1.88% | | 1.89% | | 1.88% |
| Expenses net of fee waivers, if any | | 1.86% I | | 1.86% | | 1.86% | | 1.88% | | 1.89% | | 1.88% |
| Expenses net of all reductions | | 1.86% I | | 1.86% | | 1.86% | | 1.87% | | 1.88% | | 1.88% |
| Net investment income (loss) | | 1.22% I | | 1.20% | | .15% | | .46% | | 1.14% | | .89% |
| Supplemental Data | | | | | | | | | | | | |
| Net assets, end of period (000 omitted) | $ | 5,558 | $ | 6,937 | $ | 12,375 | $ | 16,069 | $ | 20,774 | $ | 28,982 |
Portfolio turnover rate J | | 28% I | | 31% | | 48% | | 53% | | 56% | | 49% |
ACalculated based on average shares outstanding during the period.
BNet investment income (loss) is affected by the timing of the declaration of dividends by any underlying mutual funds or exchange-traded funds (ETFs). Net investment income (loss) of any mutual funds or ETFs is not included in the Fund's net investment income (loss) ratio.
CTotal distributions per share do not sum due to rounding.
DTotal returns for periods of less than one year are not annualized.
ETotal returns would have been lower if certain expenses had not been reduced during the applicable periods shown.
FTotal returns do not include the effect of the contingent deferred sales charge.
GFees and expenses of any underlying mutual funds or exchange-traded funds (ETFs) are not included in the Fund's expense ratio. The Fund indirectly bears its proportionate share of these expenses. For additional expense information related to investments in Fidelity Central Funds, please refer to the "Investments in Fidelity Central Funds" note found in the Notes to Financial Statements section of the most recent Annual or Semi-Annual report.
HExpense ratios reflect operating expenses of the class. Expenses before reductions do not reflect amounts reimbursed, waived, or reduced through arrangements with the investment adviser, brokerage services, or other offset arrangements, if applicable, and do not represent the amount paid by the class during periods when reimbursements, waivers or reductions occur.
IAnnualized.
JAmount does not include the portfolio activity of any underlying mutual funds or exchange-traded funds (ETFs).
| Fidelity Advisor® Real Estate Fund Class I |
| |
| | Six months ended (Unaudited) January 31, 2024 | | Years ended July 31, 2023 | | 2022 | | 2021 | | 2020 | | 2019 |
Selected Per-Share Data | | | | | | | | | | | | |
| Net asset value, beginning of period | $ | 16.54 | $ | 22.26 | $ | 24.96 | $ | 19.84 | $ | 23.15 | $ | 22.28 |
| Income from Investment Operations | | | | | | | | | | | | |
Net investment income (loss) A,B | | .18 | | .40 | | .27 | | .31 | | .46 | | .43 |
| Net realized and unrealized gain (loss) | | (.15) | | (3.14) | | (1.48) | | 5.56 | | (1.92) | | 1.65 |
| Total from investment operations | | .03 | | (2.74) | | (1.21) | | 5.87 | | (1.46) | | 2.08 |
| Distributions from net investment income | | (.31) | | (.29) | | (.19) | | (.27) | | (.44) | | (.48) |
| Distributions from net realized gain | | - | | (2.69) | | (1.30) | | (.48) | | (1.41) | | (.73) |
| Total distributions | | (.31) | | (2.98) | | (1.49) | | (.75) | | (1.85) | | (1.21) |
| Net asset value, end of period | $ | 16.26 | $ | 16.54 | $ | 22.26 | $ | 24.96 | $ | 19.84 | $ | 23.15 |
Total Return C,D | | .18% | | (11.43)% | | (5.43)% | | 30.65% | | (6.99)% | | 9.93% |
Ratios to Average Net Assets B,E,F | | | | | | | | | | | | |
| Expenses before reductions | | .82% G | | .84% | | .86% | | .88% | | .86% | | .81% |
| Expenses net of fee waivers, if any | | .81% G | | .83% | | .86% | | .87% | | .86% | | .81% |
| Expenses net of all reductions | | .81% G | | .83% | | .86% | | .87% | | .85% | | .81% |
| Net investment income (loss) | | 2.26% G | | 2.23% | | 1.15% | | 1.46% | | 2.17% | | 1.96% |
| Supplemental Data | | | | | | | | | | | | |
| Net assets, end of period (000 omitted) | $ | 60,266 | $ | 69,081 | $ | 160,565 | $ | 197,873 | $ | 180,346 | $ | 225,407 |
Portfolio turnover rate H | | 28% G | | 31% | | 48% | | 53% | | 56% | | 49% |
ACalculated based on average shares outstanding during the period.
BNet investment income (loss) is affected by the timing of the declaration of dividends by any underlying mutual funds or exchange-traded funds (ETFs). Net investment income (loss) of any mutual funds or ETFs is not included in the Fund's net investment income (loss) ratio.
CTotal returns for periods of less than one year are not annualized.
DTotal returns would have been lower if certain expenses had not been reduced during the applicable periods shown.
EFees and expenses of any underlying mutual funds or exchange-traded funds (ETFs) are not included in the Fund's expense ratio. The Fund indirectly bears its proportionate share of these expenses. For additional expense information related to investments in Fidelity Central Funds, please refer to the "Investments in Fidelity Central Funds" note found in the Notes to Financial Statements section of the most recent Annual or Semi-Annual report.
FExpense ratios reflect operating expenses of the class. Expenses before reductions do not reflect amounts reimbursed, waived, or reduced through arrangements with the investment adviser, brokerage services, or other offset arrangements, if applicable, and do not represent the amount paid by the class during periods when reimbursements, waivers or reductions occur.
GAnnualized.
HAmount does not include the portfolio activity of any underlying mutual funds or exchange-traded funds (ETFs).
| Fidelity Advisor® Real Estate Fund Class Z |
| |
| | Six months ended (Unaudited) January 31, 2024 | | Years ended July 31, 2023 | | 2022 | | 2021 | | 2020 | | 2019 A |
Selected Per-Share Data | | | | | | | | | | | | |
| Net asset value, beginning of period | $ | 16.52 | $ | 22.29 | $ | 24.97 | $ | 19.85 | $ | 23.16 | $ | 21.91 |
| Income from Investment Operations | | | | | | | | | | | | |
Net investment income (loss) B,C | | .19 | | .43 | | .33 | | .36 | | .50 | | .40 |
| Net realized and unrealized gain (loss) | | (.13) | | (3.15) | | (1.48) | | 5.56 | | (1.92) | | 1.94 |
| Total from investment operations | | .06 | | (2.72) | | (1.15) | | 5.92 | | (1.42) | | 2.34 |
| Distributions from net investment income | | (.33) | | (.36) | | (.23) | | (.32) | | (.48) | | (.36) |
| Distributions from net realized gain | | - | | (2.69) | | (1.30) | | (.48) | | (1.41) | | (.73) |
| Total distributions | | (.33) | | (3.05) | | (1.53) | | (.80) | | (1.89) | | (1.09) |
| Net asset value, end of period | $ | 16.25 | $ | 16.52 | $ | 22.29 | $ | 24.97 | $ | 19.85 | $ | 23.16 |
Total Return D,E | | .34% | | (11.30)% | | (5.21)% | | 30.95% | | (6.80)% | | 11.22% |
Ratios to Average Net Assets C,F,G | | | | | | | | | | | | |
| Expenses before reductions | | .67% H | | .65% | | .64% | | .64% | | .65% | | .65% H |
| Expenses net of fee waivers, if any | | .66% H | | .65% | | .63% | | .64% | | .65% | | .64% H |
| Expenses net of all reductions | | .66% H | | .65% | | .63% | | .64% | | .64% | | .64% H |
| Net investment income (loss) | | 2.41% H | | 2.41% | | 1.38% | | 1.69% | | 2.38% | | 2.20% H |
| Supplemental Data | | | | | | | | | | | | |
| Net assets, end of period (000 omitted) | $ | 5,788 | $ | 6,690 | $ | 13,539 | $ | 16,573 | $ | 9,157 | $ | 6,634 |
Portfolio turnover rate I | | 28% H | | 31% | | 48% | | 53% | | 56% | | 49% |
AFor the period October 2, 2018 (commencement of sale of shares) through July 31, 2019.
BCalculated based on average shares outstanding during the period.
CNet investment income (loss) is affected by the timing of the declaration of dividends by any underlying mutual funds or exchange-traded funds (ETFs). Net investment income (loss) of any mutual funds or ETFs is not included in the Fund's net investment income (loss) ratio.
DTotal returns for periods of less than one year are not annualized.
ETotal returns would have been lower if certain expenses had not been reduced during the applicable periods shown.
FFees and expenses of any underlying mutual funds or exchange-traded funds (ETFs) are not included in the Fund's expense ratio. The Fund indirectly bears its proportionate share of these expenses. For additional expense information related to investments in Fidelity Central Funds, please refer to the "Investments in Fidelity Central Funds" note found in the Notes to Financial Statements section of the most recent Annual or Semi-Annual report.
GExpense ratios reflect operating expenses of the class. Expenses before reductions do not reflect amounts reimbursed, waived, or reduced through arrangements with the investment adviser, brokerage services, or other offset arrangements, if applicable, and do not represent the amount paid by the class during periods when reimbursements, waivers or reductions occur.
HAnnualized.
IAmount does not include the portfolio activity of any underlying mutual funds or exchange-traded funds (ETFs).
For the period ended January 31, 2024
1. Organization.
Fidelity Advisor Real Estate Fund (the Fund) is a non-diversified fund of Fidelity Advisor Series VII (the Trust) and is authorized to issue an unlimited number of shares. The Trust is registered under the Investment Company Act of 1940, as amended (the 1940 Act), as an open-end management investment company organized as a Massachusetts business trust. The Fund offers Class A, Class M, Class C, Class I and Class Z shares, each of which has equal rights as to assets and voting privileges. Class A, Class M, Class C, Class I and Class Z are Fidelity Advisor classes. Each class has exclusive voting rights with respect to matters that affect that class. Class C shares will automatically convert to Class A shares after a holding period of eight years from the initial date of purchase, with certain exceptions.
2. Investments in Fidelity Central Funds.
Funds may invest in Fidelity Central Funds, which are open-end investment companies generally available only to other investment companies and accounts managed by the investment adviser and its affiliates. The Schedule of Investments lists any Fidelity Central Funds held as an investment as of period end, but does not include the underlying holdings of each Fidelity Central Fund. An investing fund indirectly bears its proportionate share of the expenses of the underlying Fidelity Central Funds.
Based on its investment objective, each Fidelity Central Fund may invest or participate in various investment vehicles or strategies that are similar to those of the investing fund. These strategies are consistent with the investment objectives of the investing fund and may involve certain economic risks which may cause a decline in value of each of the Fidelity Central Funds and thus a decline in the value of the investing fund.
| Fidelity Central Fund | Investment Manager | Investment Objective | Investment Practices | Expense RatioA |
| Fidelity Money Market Central Funds | Fidelity Management & Research Company LLC (FMR) | Each fund seeks to obtain a high level of current income consistent with the preservation of capital and liquidity. | Short-term Investments | Less than .005% |
A Expenses expressed as a percentage of average net assets and are as of each underlying Central Fund's most recent annual or semi-annual shareholder report.
A complete unaudited list of holdings for each Fidelity Central Fund is available upon request or at the Securities and Exchange Commission website at www.sec.gov. In addition, the financial statements of the Fidelity Central Funds which contain the significant accounting policies (including investment valuation policies) of those funds, and are not covered by the Report of Independent Registered Public Accounting Firm, are available on the Securities and Exchange Commission website or upon request.
3. Significant Accounting Policies.
The Fund is an investment company and applies the accounting and reporting guidance of the Financial Accounting Standards Board (FASB) Accounting Standards Codification Topic 946 Financial Services - Investment Companies. The financial statements have been prepared in conformity with accounting principles generally accepted in the United States of America (GAAP), which require management to make certain estimates and assumptions at the date of the financial statements. Actual results could differ from those estimates. Subsequent events, if any, through the date that the financial statements were issued have been evaluated in the preparation of the financial statements. The Fund's Schedule of Investments lists any underlying mutual funds or exchange-traded funds (ETFs) but does not include the underlying holdings of these funds. The following summarizes the significant accounting policies of the Fund:
Investment Valuation. Investments are valued as of 4:00 p.m. Eastern time on the last calendar day of the period. The Board of Trustees (the Board) has designated the Fund's investment adviser as the valuation designee responsible for the fair valuation function and performing fair value determinations as needed. The investment adviser has established a Fair Value Committee (the Committee) to carry out the day-to-day fair valuation responsibilities and has adopted policies and procedures to govern the fair valuation process and the activities of the Committee. In accordance with these fair valuation policies and procedures, which have been approved by the Board, the Fund attempts to obtain prices from one or more third party pricing services or brokers to value its investments. When current market prices, quotations or currency exchange rates are not readily available or reliable, investments will be fair valued in good faith by the Committee, in accordance with the policies and procedures. Factors used in determining fair value vary by investment type and may include market or investment specific events, transaction data, estimated cash flows, and market observations of comparable investments. The frequency that the fair valuation procedures are used cannot be predicted and they may be utilized to a significant extent. The Committee manages the Fund's fair valuation practices and maintains the fair valuation policies and procedures. The Fund's investment adviser reports to the Board information regarding the fair valuation process and related material matters.
The Fund categorizes the inputs to valuation techniques used to value its investments into a disclosure hierarchy consisting of three levels as shown below:
Level 1 - unadjusted quoted prices in active markets for identical investments
Level 2 - other significant observable inputs (including quoted prices for similar investments, interest rates, prepayment speeds, etc.)
Level 3 - unobservable inputs (including the Fund's own assumptions based on the best information available)
Valuation techniques used to value the Fund's investments by major category are as follows:
Equity securities, including restricted securities, for which market quotations are readily available, are valued at the last reported sale price or official closing price as reported by a third party pricing service on the primary market or exchange on which they are traded and are categorized as Level 1 in the hierarchy. In the event there were no sales during the day or closing prices are not available, securities are valued at the last quoted bid price or may be valued using the last available price and are generally categorized as Level 2 in the hierarchy. For foreign equity securities, when market or security specific events arise, comparisons to the valuation of American Depositary Receipts (ADRs), futures contracts, ETFs and certain indexes as well as quoted prices for similar securities may be used and would be categorized as Level 2 in the hierarchy. For equity securities, including restricted securities, where observable inputs are limited, assumptions about market activity and risk are used and these securities may be categorized as Level 3 in the hierarchy.
Investments in open-end mutual funds, including the Fidelity Central Funds, are valued at their closing net asset value (NAV) each business day and are categorized as Level 1 in the hierarchy.
Changes in valuation techniques may result in transfers in or out of an assigned level within the disclosure hierarchy. The aggregate value of investments by input level as of January 31, 2024 is included at the end of the Fund's Schedule of Investments.
Investment Transactions and Income. For financial reporting purposes, the Fund's investment holdings and NAV include trades executed through the end of the last business day of the period. The NAV per share for processing shareholder transactions is calculated as of the close of business of the New York Stock Exchange (NYSE), normally 4:00 p.m. Eastern time and includes trades executed through the end of the prior business day. Gains and losses on securities sold are determined on the basis of identified cost. Commissions paid to certain brokers with whom the investment adviser, or its affiliates, places trades on behalf of a fund include an amount in addition to trade execution, which may be rebated back to a fund. Any such rebates are included in net realized gain (loss) on investments in the Statement of Operations. Dividend income is recorded on the ex-dividend date, except for certain dividends from foreign securities where the ex-dividend date may have passed, which are
recorded as soon as the Fund is informed of the ex-dividend date. Non-cash dividends included in dividend income, if any, are recorded at the fair market value of the securities received. Income and capital gain distributions from Fidelity Central Funds, if any, are recorded on the ex-dividend date. Certain distributions received by the Fund represent a return of capital or capital gain. The Fund determines the components of these distributions subsequent to the ex-dividend date, based upon receipt of tax filings or other correspondence relating to the underlying investment. These distributions are recorded as a reduction of cost of investments and/or as a realized gain.
Class Allocations and Expenses. Investment income, realized and unrealized capital gains and losses, common expenses of a fund, and certain fund-level expense reductions, if any, are allocated daily on a pro-rata basis to each class based on the relative net assets of each class to the total net assets of a fund. Each class differs with respect to transfer agent and distribution and service plan fees incurred, as applicable. Certain expense reductions may also differ by class, if applicable. For the reporting period, the allocated portion of income and expenses to each class as a percent of its average net assets may vary due to the timing of recording these transactions in relation to fluctuating net assets of the classes. Expenses directly attributable to a fund are charged to that fund. Expenses attributable to more than one fund are allocated among the respective funds on the basis of relative net assets or other appropriate methods. Expenses included in the accompanying financial statements reflect the expenses of that fund and do not include any expenses associated with any underlying mutual funds or exchange-traded funds (ETFs). Although not included in a fund's expenses, a fund indirectly bears its proportionate share of these expenses through the net asset value of each underlying mutual fund or exchange-traded fund (ETF). Expense estimates are accrued in the period to which they relate and adjustments are made when actual amounts are known.
Deferred Trustee Compensation. Under a Deferred Compensation Plan (the Plan) for certain Funds, certain independent Trustees have elected to defer receipt of a portion of their annual compensation. Deferred amounts are invested in affiliated mutual funds, are marked-to-market and remain in a fund until distributed in accordance with the Plan. The investment of deferred amounts and the offsetting payable to the Trustees presented below are included in the accompanying Statement of Assets and Liabilities in other receivables and other payables and accrued expenses, as applicable.
| Fidelity Advisor Real Estate Fund | $95,055 |
Income Tax Information and Distributions to Shareholders. Each year, the Fund intends to qualify as a regulated investment company under Subchapter M of the Internal Revenue Code, including distributing substantially all of its taxable income and realized gains. As a result, no provision for U.S. Federal income taxes is required. The Fund files a U.S. federal tax return, in addition to state and local tax returns as required. The Fund's federal income tax returns are subject to examination by the Internal Revenue Service (IRS) for a period of three fiscal years after they are filed. State and local tax returns may be subject to examination for an additional fiscal year depending on the jurisdiction.
Distributions are declared and recorded on the ex-dividend date. Income and capital gain distributions are declared separately for each class. Income and capital gain distributions are determined in accordance with income tax regulations, which may differ from GAAP.
Capital accounts within the financial statements are adjusted for permanent book-tax differences. These adjustments have no impact on net assets or the results of operations. Capital accounts are not adjusted for temporary book-tax differences which will reverse in a subsequent period.
Book-tax differences are primarily due to deferred Trustee compensation and losses deferred due to wash sales and excise tax regulations.
As of period end, the cost and unrealized appreciation (depreciation) in securities, and derivatives if applicable, for federal income tax purposes were as follows:
| Gross unrealized appreciation | $59,160,577 |
| Gross unrealized depreciation | (16,288,648) |
| Net unrealized appreciation (depreciation) | $42,871,929 |
| Tax cost | $193,471,739 |
The Fund elected to defer to its next fiscal year approximately $7,042,237 of capital losses recognized during the period November 1, 2022 to July 31, 2023.
4. Purchases and Sales of Investments.
Purchases and sales of securities, other than short-term securities and in-kind transactions, as applicable, are noted in the table below.
| | Purchases ($) | Sales ($) |
| Fidelity Advisor Real Estate Fund | 33,220,658 | 53,235,234 |
5. Fees and Other Transactions with Affiliates.
Management Fee. Fidelity Management & Research Company LLC (the investment adviser) and its affiliates provide the Fund with investment management related services for which the Fund pays a monthly management fee. The management fee is the sum of an individual fund fee rate that is based on an annual rate of .30% of the Fund's average net assets and an annualized group fee rate that averaged .22% during the period. The group fee rate is based upon the monthly average net assets of a group of registered investment companies with which the investment adviser has management contracts. The group fee rate decreases as assets under management increase and increases as assets under management decrease. For the reporting period, the total annualized management fee rate was .52% of the Fund's average net assets.
Distribution and Service Plan Fees. In accordance with Rule 12b-1 of the 1940 Act, the Fund has adopted separate Distribution and Service Plans for each class of shares. Certain classes pay Fidelity Distributors Company LLC (FDC), an affiliate of the investment adviser, separate Distribution and Service Fees, each of which is based on an annual percentage of each class' average net assets. In addition, FDC may pay financial intermediaries for selling shares of the Fund and providing shareholder support services. For the period, the Distribution and Service Fee rates, total fees and amounts retained by FDC were as follows:
| | Distribution Fee | Service Fee | Total Fees | Retained by FDC |
| Class A | - % | .25% | $104,004 | $ - |
| Class M | .25% | .25% | 195,642 | - |
| Class C | .75% | .25% | 29,621 | 1,615 |
| | | | $329,267 | $1,615 |
Sales Load. FDC may receive a front-end sales charge of up to 5.75% for selling Class A shares and 3.50% for selling Class M shares, some of which is paid to financial intermediaries for selling shares of the Fund. Depending on the holding period, FDC may receive contingent deferred sales charges levied on Class A, Class M and Class C redemptions. The deferred sales charges are 1.00% for Class C shares, 1.00% for certain purchases of Class A shares and .25% for certain purchases of Class M shares.
For the period, sales charge amounts retained by FDC were as follows:
| | Retained by FDC |
| Class A | $4,193 |
| Class M | 965 |
Class C A | 95 |
| | $5,253 |
A When Class C shares are initially sold, FDC pays commissions from its own resources to financial intermediaries through which the sales are made.
Transfer Agent Fees. Fidelity Investments Institutional Operations Company LLC (FIIOC), an affiliate of the investment adviser, is the transfer, dividend disbursing and shareholder servicing agent for each class of the Fund.
During November 2023, the Board approved a change in the transfer agent fees effective December 1, 2023 to a fixed annual rate of class-level average net assets as follows:
| | % of Class-Level Average Net Assets |
| Class A | .2000 |
| Class M | .2000 |
| Class C | .2000 |
| Class I | .1941 |
| | |
Prior to December 1, 2023, FIIOC received account fees and asset-based fees that varied according to the account size and type of account of the shareholders of the respective classes of the Fund, except for Class Z. FIIOC received an asset-based fee of Class Z's average net assets. FIIOC pays for typesetting, printing and mailing of shareholder reports, except proxy statements.
For the period, transfer agent fees for each class were as follows:
| | Amount | % of Class-Level Average Net AssetsA |
| Class A | $97,364 | .23 |
| Class M | 80,270 | .21 |
| Class C | 6,980 | .24 |
| Class I | 58,523 | .19 |
| Class Z | 1,316 | .04 |
| | $244,453 | |
A Annualized
Accounting Fees. Fidelity Service Company, Inc. (FSC), an affiliate of the investment adviser, maintains the Fund's accounting records.
During November 2023, the Board approved a change in the accounting fees effective December 1, 2023 to a fixed annual rate of average net assets as follows:
| | % of Average Net Assets |
| Fidelity Advisor Real Estate Fund | .0354 |
Prior to December 1, 2023, the accounting fee was based on the level of average net assets for each month. For the period, the fees were equivalent to the following annualized rates:
| | % of Average Net Assets |
| Fidelity Advisor Real Estate Fund | .04 |
Subsequent Event - Management Fee. Effective March 1, 2024, the Fund's management contract will be amended to incorporate administrative services previously covered under separate services agreements (Transfer Agent and Accounting agreements). The amended contract incorporates a management fee rate that may vary by class. The investment adviser or an affiliate will pay certain expenses of managing and operating the Fund out of each class's management fee.
Each class of the Fund will pay a management fee to the investment adviser. The management fee will be calculated and paid to the investment adviser every month.
When determining a class's management fee, a mandate rate will be calculated based on the monthly average net assets of a group of funds advised by FMR within a designated asset class. A discount rate will be subtracted from the mandate rate once the Fund's monthly average net assets reach a certain level. The mandate rate and discount rate may vary by class.
The annual management fee rate for a class of shares of the Fund will be the lesser of (1) the class's mandate rate reduced by the class's discount rate (if applicable) or (2) the amount set forth in the following table.
| | Maximum Management Fee Rate % |
| Class A | .72 |
| Class M | .72 |
| Class C | .72 |
| Class I | .71 |
| Class Z | .56 |
One-twelfth of the management fee rate for a class will be applied to the average net assets of the class for the month, giving a dollar amount which is the management fee for the class for that month.
A different management fee rate may be applicable to each class of the Fund. The difference between classes is the result of separate arrangements for class-level services and/or waivers of certain expenses. It is not the result of any difference in advisory or custodial fees or other expenses related to the management of the Fund's assets, which do not vary by class.
Effective March 1, 2024, the Fund's sub-advisory agreements with FMR Investment Management (UK) Limited, Fidelity Management & Research (Hong Kong) Limited, and Fidelity Management & Research (Japan) Limited will be amended to provide that the investment adviser will pay each sub-adviser monthly fees equal to 110% of the sub-adviser's costs for providing sub-advisory services.
Brokerage Commissions. A portion of portfolio transactions were placed with brokerage firms which are affiliates of the investment adviser. Brokerage commissions are included in net realized gain (loss) and change in net unrealized appreciation (depreciation) in the Statement of Operations. The commissions paid to these affiliated firms were as follows:
| | Amount |
| Fidelity Advisor Real Estate Fund | $ 644 |
Interfund Trades. Funds may purchase from or sell securities to other Fidelity Funds under procedures adopted by the Board. The procedures have been designed to ensure these interfund trades are executed in accordance with Rule 17a-7 of the 1940 Act. Any interfund trades are included within the respective purchases and sales amounts shown in the Purchases and Sales of Investments note. Interfund trades during the period are noted in the table below.
| | Purchases ($) | Sales ($) | Realized Gain (Loss) ($) |
| Fidelity Advisor Real Estate Fund | 1,633,679 | 4,100,478 | 281,935 |
6. Committed Line of Credit.
Certain Funds participate with other funds managed by the investment adviser or an affiliate in a $4.25 billion credit facility (the "line of credit") to be utilized for temporary or emergency purposes to fund shareholder redemptions or for other short-term liquidity purposes. The participating funds have agreed to pay commitment fees on their pro-rata portion of the line of credit, which are reflected in Miscellaneous expenses on the Statement of Operations, and are listed below. During the period, there were no borrowings on this line of credit.
| | Amount |
| Fidelity Advisor Real Estate Fund | $190 |
7. Security Lending.
Funds lend portfolio securities from time to time in order to earn additional income. Lending agents are used, including National Financial Services (NFS), an affiliate of the investment adviser. Pursuant to a securities lending agreement, NFS will receive a fee, which is capped at 9.9% of a fund's daily lending revenue, for its services as lending agent. A fund may lend securities to certain qualified borrowers, including NFS. On the settlement date of the loan, a fund receives collateral (in the form of U.S. Treasury obligations, letters of credit and/or cash) against the loaned securities and maintains collateral in an amount not less than 100% of the market value of the loaned securities during the period of the loan. The market value of the loaned securities is determined at the close of business of a fund and any additional required collateral is delivered to a fund on the next business day. A fund or borrower may terminate the loan at any time, and if the borrower defaults on its obligation to return the securities loaned because of insolvency or other reasons, a fund may apply collateral received from the borrower against the obligation. A fund may experience delays and costs in recovering the securities loaned. Any cash collateral received is invested in the Fidelity Securities Lending Cash Central Fund. Any loaned securities are identified as such in the Schedule of Investments, and the value of loaned securities and cash collateral at period end, as applicable, are presented in the Statement of Assets and Liabilities. Security lending income represents the income earned on investing cash collateral, less rebates paid to borrowers and any lending agent fees associated with the loan, plus any premium payments received for lending certain types of securities. Security lending income is presented in the Statement of Operations as a component of income from Fidelity Central Funds. Affiliated security lending activity, if any, was as follows:
| | Total Security Lending Fees Paid to NFS | Security Lending Income From Securities Loaned to NFS | Value of Securities Loaned to NFS at Period End |
| Fidelity Advisor Real Estate Fund | $184 | $ - | $- |
8. Expense Reductions.
Through arrangements with each class' transfer agent, credits realized as a result of certain uninvested cash balances were used to reduce the Fund's expenses. During the period, transfer agent credits reduced each class' expenses as noted in the table below.
| | Expense reduction |
| | |
| Class M | $83 |
| | |
In addition, during the period the investment adviser or an affiliate reimbursed and/or waived a portion of fund-level operating expenses in the amount of $10,245.
9. Distributions to Shareholders.
Distributions to shareholders of each class were as follows:
| | Year ended January 31, 2024 | Year ended July 31, 2023 |
| Fidelity Advisor Real Estate Fund | | |
| Distributions to shareholders | | |
| Class A | $1,518,310 | $15,393,613 |
| Class M | 1,341,402 | 13,294,219 |
| Class C | 84,828 | 1,438,033 |
| Class I | 1,183,474 | 12,249,509 |
| Class Z | 132,338 | 1,122,094 |
Total | $4,260,352 | $43,497,468 |
10. Share Transactions.
Share transactions for each class were as follows and may contain in-kind transactions, automatic conversions between classes or exchanges between affiliated funds:
| | Shares | Shares | Dollars | Dollars |
| | Six months ended January 31, 2024 | Year ended July 31, 2023 | Six months ended January 31, 2024 | Year ended July 31, 2023 |
| Fidelity Advisor Real Estate Fund | | | | |
| Class A | | | | |
| Shares sold | 248,507 | 548,565 | $3,822,066 | $9,379,631 |
| Reinvestment of distributions | 92,785 | 988,337 | 1,494,294 | 15,169,887 |
| Shares redeemed | (785,474) | (1,486,572) | (12,020,809) | (25,486,524) |
| Net increase (decrease) | (444,182) | 50,330 | $(6,704,449) | $(937,006) |
| Class M | | | | |
| Shares sold | 216,161 | 415,463 | $3,321,080 | $7,039,884 |
| Reinvestment of distributions | 83,532 | 868,723 | 1,338,273 | 13,263,543 |
| Shares redeemed | (545,528) | (691,075) | (8,332,348) | (11,816,775) |
| Net increase (decrease) | (245,835) | 593,111 | $(3,672,995) | $8,486,652 |
| Class C | | | | |
| Shares sold | 16,794 | 34,213 | $247,402 | $548,005 |
| Reinvestment of distributions | 5,452 | 97,245 | 82,977 | 1,414,160 |
| Shares redeemed | (105,766) | (269,790) | (1,533,270) | (4,377,700) |
| Net increase (decrease) | (83,520) | (138,332) | $(1,202,891) | $(2,415,535) |
| Class I | | | | |
| Shares sold | 377,799 | 1,212,683 | $5,897,979 | $21,265,339 |
| Reinvestment of distributions | 71,167 | 773,432 | 1,166,781 | 12,074,421 |
| Shares redeemed | (921,462) | (5,020,909) | (14,694,900) | (92,269,058) |
| Net increase (decrease) | (472,496) | (3,034,794) | $(7,630,140) | $(58,929,298) |
| Class Z | | | | |
| Shares sold | 78,741 | 147,772 | $1,257,831 | $2,504,135 |
| Reinvestment of distributions | 7,489 | 66,006 | 122,385 | 1,033,635 |
| Shares redeemed | (134,885) | (416,258) | (2,096,544) | (7,225,336) |
| Net increase (decrease) | (48,655) | (202,480) | $(716,328) | $(3,687,566) |
11. Other.
A fund's organizational documents provide former and current trustees and officers with a limited indemnification against liabilities arising in connection with the performance of their duties to the fund. In the normal course of business, a fund may also enter into contracts that provide general indemnifications. A fund's maximum exposure under these arrangements is unknown as this would be dependent on future claims that may be made against a fund. The risk of material loss from such claims is considered remote.
12. Risk and Uncertainties.
Many factors affect a fund's performance. Developments that disrupt global economies and financial markets, such as pandemics, epidemics, outbreaks of infectious diseases, war, terrorism, and environmental disasters, may significantly affect a fund's investment performance. The effects of these developments to a fund will be impacted by the types of securities in which a fund invests, the financial condition, industry, economic sector, and geographic location of an issuer, and a fund's level of investment in the securities of that issuer. Significant concentrations in security types, issuers, industries, sectors, and geographic locations may magnify the factors that affect a fund's performance.
As a shareholder, you incur two types of costs: (1) transaction costs, which may include sales charges (loads) on purchase payments or redemption proceeds, as applicable and (2) ongoing costs, which generally include management fees, distribution and/or service (12b-1) fees and other Fund expenses. This Example is intended to help you understand your ongoing costs (in dollars) of investing in a fund and to compare these costs with the ongoing costs of investing in other mutual funds.
| The Example is based on an investment of $1,000 invested at the beginning of the period and held for the entire period (August 1, 2023 to January 31, 2024). |
Actual Expenses
The first line of the accompanying table provides information about actual account values and actual expenses. You may use the information in this line, together with the amount you invested, to estimate the expenses that you paid over the period. Simply divide your account value by $1,000.00 (for example, an $8,600 account value divided by $1,000.00 = 8.6), then multiply the result by the number in the first line for a class/Fund under the heading entitled "Expenses Paid During Period" to estimate the expenses you paid on your account during this period. If any fund is a shareholder of any underlying mutual funds or exchange-traded funds (ETFs) (the Underlying Funds), such fund indirectly bears its proportional share of the expenses of the Underlying Funds in addition to the direct expenses incurred presented in the table. These fees and expenses are not included in the annualized expense ratio used to calculate the expense estimate in the table below.
Hypothetical Example for Comparison Purposes
The second line of the accompanying table provides information about hypothetical account values and hypothetical expenses based on the actual expense ratio and an assumed rate of return of 5% per year before expenses, which is not the actual return. The hypothetical account values and expenses may not be used to estimate the actual ending account balance or expenses you paid for the period. You may use this information to compare the ongoing costs of investing in the Fund and other funds. To do so, compare this 5% hypothetical example with the 5% hypothetical examples that appear in the shareholder reports of the other funds. If any fund is a shareholder of any Underlying Funds, such fund indirectly bears its proportional share of the expenses of the Underlying Funds in addition to the direct expenses as presented in the table. These fees and expenses are not included in the annualized expense ratio used to calculate the expense estimate in the table below.
Please note that the expenses shown in the table are meant to highlight your ongoing costs only and do not reflect any transaction costs. Therefore, the second line of the table is useful in comparing ongoing costs only, and will not help you determine the relative total costs of owning different funds. In addition, if these transactional costs were included, your costs would have been higher.
| | | | | Annualized Expense Ratio- A | | Beginning Account Value August 1, 2023 | | Ending Account Value January 31, 2024 | | Expenses Paid During Period- C August 1, 2023 to January 31, 2024 |
| Fidelity Advisor® Real Estate Fund | | | | | | | | | | |
Class A ** | | | | 1.11% | | | | | | |
| Actual | | | | | | $ 1,000 | | $ 1,000.80 | | $ 5.58 |
Hypothetical-B | | | | | | $ 1,000 | | $ 1,019.56 | | $ 5.63 |
| Class M | | | | 1.33% | | | | | | |
| Actual | | | | | | $ 1,000 | | $ 999.60 | | $ 6.69 |
Hypothetical-B | | | | | | $ 1,000 | | $ 1,018.45 | | $ 6.75 |
| Class C | | | | 1.86% | | | | | | |
| Actual | | | | | | $ 1,000 | | $ 997.50 | | $ 9.34 |
Hypothetical-B | | | | | | $ 1,000 | | $ 1,015.79 | | $ 9.42 |
Class I ** | | | | .81% | | | | | | |
| Actual | | | | | | $ 1,000 | | $ 1,001.80 | | $ 4.08 |
Hypothetical-B | | | | | | $ 1,000 | | $ 1,021.06 | | $ 4.12 |
Class Z ** | | | | .66% | | | | | | |
| Actual | | | | | | $ 1,000 | | $ 1,003.40 | | $ 3.32 |
Hypothetical-B | | | | | | $ 1,000 | | $ 1,021.82 | | $ 3.35 |
| |
A Annualized expense ratio reflects expenses net of applicable fee waivers.
B 5% return per year before expenses
C Expenses are equal to the annualized expense ratio, multiplied by the average account value over the period, multiplied by 184/ 366 (to reflect the one-half year period). The fees and expenses of any Underlying Funds are not included in each annualized expense ratio.
** If fees and changes to the expense contract and/or expense cap, effective March 1, 2024, had been in effect during the current period, the restated annualized expense ratio and the expenses paid in the actual and hypothetical examples above would have been as shown in table below:
| | | | | Annualized Expense Ratio- A | | Expenses Paid |
| Fidelity Advisor® Real Estate Fund | | | | | | |
| Class A | | | | 1.03% | | |
| Actual | | | | | | $ 5.18 |
Hypothetical- B | | | | | | $ 5.23 |
| Class I | | | | .77% | | |
| Actual | | | | | | $ 3.87 |
Hypothetical- B | | | | | | $ 3.91 |
| Class Z | | | | .62% | | |
| Actual | | | | | | $ 3.12 |
Hypothetical- B | | | | | | $ 3.15 |
| | | | | | | |
| A Annualized expense ratio reflects expenses net of applicable fee waivers. | | | | | | |
| B 5% return per year before expenses | | | | | | |
Board Approval of Investment Advisory Contracts
At its January 2024 meeting, the Board of Trustees, including the Independent Trustees (together, the Board), approved an amended and restated management contract with Fidelity Management & Research Company LLC (FMR) (the Management Contract), and amended and restated sub-advisory agreements (the Sub-Advisory Contracts, and together with the Management Contract, the Advisory Contracts) for the fund, including the fund's sub-advisory agreements with FMR Investment Management (UK) Limited (FMR UK), Fidelity Management & Research (Hong Kong) Limited (FMR H.K.), and Fidelity Management & Research (Japan) Limited (FMR Japan). The Advisory Contracts will be effective March 1, 2024. The Board will consider the annual renewal of the fund's Advisory Contracts in May 2024, following its review of additional materials provided by FMR.
Management Contract. The Board approved the Management Contract, which implements a new fee structure combining the management fee, transfer agent fee (TA Fee), and pricing and bookkeeping fee (P&B Fee) of the fund and each class into a single class-level fee based on tiered schedules and subject to a maximum class-level rate (the Unified Fee). In exchange for the Unified Fee, the fund will receive investment advisory, management, administrative, transfer agent, pricing and bookkeeping services under a single agreement - the Management Contract.
In its consideration of the Management Contract over several meetings, the Board received, reviewed and discussed a comprehensive set of analyses regarding the Unified Fee including (i) the legal framework, (ii) design goals for the Unified Fee, (iii) calculation methodology for the Unified Fee and illustrative examples, (iv) annual and cumulative projected impacts under various scenarios, both in the aggregate and at the fund/class level, (v) explanations of schedules, rate levers and maximum rates and (vi) shareholder benefits and projected savings.
The Board considered that the maximum Unified Fee for each class of the fund would be no higher than the sum of (i) the lowest contractual management fee rate under the fund's existing management contract, which is the individual fund fee rate, if any, plus the lowest contractual marginal group fee rate and (ii) the TA and P&B Fee rates, which are fixed fee rates since December 1, 2023 (together, the Unified Fee Cap). The Board noted that Fidelity has represented that, as a result of this Unified Fee Cap, the Unified Fee would be no greater than the fee rates previously authorized to be charged to the fund for the same services. The Board noted that certain expenses such as third-party expenses, Rule 12b-1 fees, and certain other miscellaneous expenses would be outside the scope of the Unified Fee and the calculation of such fees would not change as a result of the Unified Fee. The Board considered that, under the Management Contract, a different management fee rate will be applicable to each class of the fund. The Board noted that Fidelity has represented that the difference in expenses between classes is based on differences in class-specific expenses and not due to any difference in advisory or third-party custodial fees or other expenses related to the management of the fund's assets.
The Board considered Fidelity's representations that implementation of the Unified Fee, which includes the Unified Fee Cap, would cause all funds subject to the Unified Fee, including the fund, to experience an immediate reduction on contractual fee rates for services provided under the current management contracts. The Board considered that some funds would not experience lower net total fees as a result of existing fee caps. The Board further considered that, in addition to the contractual fee savings, the Unified Fee offers funds and their shareholders greater protection from future rate increases for services previously offered under separate agreements that are now covered by the Management Contract because such rate increases would require shareholder approval.
Sub-Advisory Contracts. In connection with the Unified Fee changes, the Board considered the Sub-Advisory Contracts, which simplified the calculation of the fees paid by FMR to the sub-advisers under the agreements. The Board noted that the agreements with FMR UK, FMR H.K., and FMR Japan were amended to provide that FMR will compensate each sub-adviser at a fee rate equal to 110% of the sub-adviser's costs incurred in providing services under the agreement. The Board considered that, under the Sub-Advisory Contracts, FMR, and not the fund, will continue to pay the sub-advisory fees to each applicable sub-adviser.
The Board further considered that the approval of the fund's Advisory Contracts will not result in any changes in the investment process or strategies employed in the management of the fund's assets or the day-to-day management of the fund or the persons primarily responsible for such management. Further, the Board considered that the Management Contract would not change the obligations and services of FMR and its affiliates on behalf of the fund, and, in particular, there would be no change in the nature and level of advisory, management, administration, transfer agent, and pricing and bookkeeping services provided to the fund by FMR, its affiliates, and each applicable sub-adviser.
In connection with its consideration of future renewals of the fund's Advisory Contracts, the Board will consider: (i) the nature, extent and quality of services provided to the funds, including shareholder and administrative services and investment performance; (ii) the competitiveness of the management fee and total expenses for the fund; (iii) the costs of the services and profitability, including the revenues earned and the expenses incurred in conducting the business of developing, marketing, distributing, managing, administering, and servicing the fund and its shareholders, to the extent applicable; and (iv) whether there have been economies of scale in respect of the Fidelity funds, whether the Fidelity funds (including the fund) have appropriately benefited from any such economies of scale, and whether there is the potential for realization of any further economies.
Based on its evaluation of all of the conclusions and representations noted above, and after considering all factors it believed relevant, the Board concluded that the fund's management fee structure is fair and reasonable, and that the fund's Advisory Contracts should be approved.
The Securities and Exchange Commission adopted Rule 22e-4 under the Investment Company Act of 1940 (the Liquidity Rule) to promote effective liquidity risk management throughout the open-end investment company industry, thereby reducing the risk that funds will be unable to meet their redemption obligations and mitigating dilution of the interests of fund shareholders.
The Fund has adopted and implemented a liquidity risk management program (the Program) reasonably designed to assess and manage the Fund's liquidity risk and to comply with the requirements of the Liquidity Rule. The Fund's Board of Trustees (the Board) has designated the Fund's investment adviser as administrator of the Program. The Fidelity advisers have established a Liquidity Risk Management Committee (the LRM Committee) to manage the Program for each of the Fidelity Funds. The LRM Committee monitors the adequacy and effectiveness of implementation of the Program and on a periodic basis assesses each Fund's liquidity risk based on a variety of factors including (1) the Fund's investment strategy, (2) portfolio liquidity and cash flow projections during normal and reasonably foreseeable stressed conditions, (3) shareholder redemptions, (4) borrowings and other funding sources and (5) certain factors specific to ETFs including the effect of the Fund's prices and spreads, market participants, and basket compositions on the overall liquidity of the Fund's portfolio, as applicable.
In accordance with the Program, each of the Fund's portfolio investments is classified into one of four defined liquidity categories based on a determination of a reasonable expectation for how long it would take to convert the investment to cash (or sell or dispose of the investment) without significantly changing its market value.
- Highly liquid investments - cash or convertible to cash within three business days or less
- Moderately liquid investments - convertible to cash in three to seven calendar days
- Less liquid investments - can be sold or disposed of, but not settled, within seven calendar days
- Illiquid investments - cannot be sold or disposed of within seven calendar days
Liquidity classification determinations take into account a variety of factors including various market, trading and investment-specific considerations, as well as market depth, and generally utilize analysis from a third-party liquidity metrics service.
The Liquidity Rule places a 15% limit on a fund's illiquid investments and requires funds that do not primarily hold assets that are highly liquid investments to determine and maintain a minimum percentage of the fund's net assets to be invested in highly liquid investments (highly liquid investment minimum or HLIM). The Program includes provisions reasonably designed to comply with the 15% limit on illiquid investments and for determining, periodically reviewing and complying with the HLIM requirement as applicable.
At a recent meeting of the Fund's Board of Trustees, the LRM Committee provided a written report to the Board pertaining to the operation, adequacy, and effectiveness of the Program for the period December 1, 2022 through November 30, 2023. The report concluded that the Program is operating effectively and is reasonably designed to assess and manage the Fund's liquidity risk.
1.783109.122
ARE-SANN-0324
Fidelity Advisor® Global Real Estate Fund
Semi-Annual Report
January 31, 2024
Contents
To view a fund's proxy voting guidelines and proxy voting record for the 12-month period ended June 30, visit http://www.fidelity.com/proxyvotingresults or visit the Securities and Exchange Commission's (SEC) web site at http://www.sec.gov.
You may also call 1-877-208-0098 to request a free copy of the proxy voting guidelines.
Standard & Poor's, S&P and S&P 500 are registered service marks of The McGraw-Hill Companies, Inc. and have been licensed for use by Fidelity Distributors Corporation.
Other third-party marks appearing herein are the property of their respective owners.
All other marks appearing herein are registered or unregistered trademarks or service marks of FMR LLC or an affiliated company. © 2024 FMR LLC. All rights reserved.
This report and the financial statements contained herein are submitted for the general information of the shareholders of the Fund. This report is not authorized for distribution to prospective investors in the Fund unless preceded or accompanied by an effective prospectus.
A fund files its complete schedule of portfolio holdings with the SEC for the first and third quarters of each fiscal year on Form N-PORT. Forms N-PORT are available on the SEC's web site at http://www.sec.gov. A fund's Forms N-PORT may be reviewed and copied at the SEC's Public Reference Room in Washington, DC. Information regarding the operation of the SEC's Public Reference Room may be obtained by calling 1-800-SEC-0330.
For a complete list of a fund's portfolio holdings, view the most recent holdings listing, semiannual report, or annual report on Fidelity's web site at http://www.fidelity.com, http://www.institutional.fidelity.com, or http://www.401k.com, as applicable.
NOT FDIC INSURED •MAY LOSE VALUE •NO BANK GUARANTEE
Neither the Fund nor Fidelity Distributors Corporation is a bank.
Top Holdings (% of Fund's net assets) |
| |
| Prologis, Inc. | 9.3 | |
| Equinix, Inc. | 5.9 | |
| Ventas, Inc. | 4.3 | |
| Public Storage | 3.3 | |
| Digital Realty Trust, Inc. | 2.9 | |
| Mitsui Fudosan Co. Ltd. | 2.7 | |
| Grainger Trust PLC | 2.7 | |
| Kimco Realty Corp. | 2.4 | |
| Dream Industrial (REIT) | 2.4 | |
| Sun Communities, Inc. | 2.3 | |
| | 38.2 | |
| |
| Top REIT Sectors (% of Fund's net assets) |
| |
| REITs - Diversified | 16.8 | |
| REITs - Shopping Centers | 16.3 | |
| REITs - Apartments | 13.1 | |
| REITs - Warehouse/Industrial | 11.6 | |
| REITs - Health Care | 7.7 | |
| |
Asset Allocation (% of Fund's net assets) |
|
|
Geographic Diversification (% of Fund's net assets) |
|
* Includes Short-Term investments and Net Other Assets (Liabilities). Percentages are adjusted for the effect of derivatives, if applicable. |
| |
Showing Percentage of Net Assets
| Common Stocks - 99.5% |
| | | Shares | Value ($) |
| Australia - 5.0% | | | |
| Arena (REIT) unit | | 29,058 | 65,886 |
| Charter Hall Retail REIT | | 29,408 | 71,051 |
| Goodman Group unit | | 1,250 | 20,749 |
| National Storage REIT unit | | 26,740 | 40,102 |
| Scentre Group unit | | 36,858 | 73,275 |
TOTAL AUSTRALIA | | | 271,063 |
| Belgium - 0.5% | | | |
| Shurgard Self Storage Europe SARL | | 322 | 14,988 |
| Xior Student Housing NV | | 430 | 12,895 |
TOTAL BELGIUM | | | 27,883 |
| Canada - 4.2% | | | |
| Boardwalk (REIT) | | 1,924 | 99,889 |
| Dream Industrial (REIT) | | 12,752 | 127,288 |
TOTAL CANADA | | | 227,177 |
| France - 2.9% | | | |
| ARGAN SA | | 363 | 32,247 |
| Covivio | | 1,262 | 61,591 |
| Unibail-Rodamco-Westfield NV (a) | | 885 | 64,061 |
TOTAL FRANCE | | | 157,899 |
| Germany - 1.1% | | | |
| Vonovia SE | | 1,966 | 61,246 |
| Hong Kong - 1.0% | | | |
| Link (REIT) | | 10,473 | 52,529 |
| Japan - 8.3% | | | |
| Advance Residence Investment Corp. | | 20 | 44,043 |
| GLP J-REIT | | 22 | 19,642 |
| LaSalle Logiport REIT | | 74 | 74,936 |
| Mitsubishi Estate Co. Ltd. | | 7,490 | 103,781 |
| Mitsui Fudosan Co. Ltd. | | 5,894 | 147,962 |
| Mitsui Fudosan Logistics Park, Inc. | | 19 | 56,961 |
TOTAL JAPAN | | | 447,325 |
| Singapore - 4.1% | | | |
| CapitaMall Trust | | 76,297 | 113,741 |
| CDL Hospitality Trusts unit | | 19,223 | 14,724 |
| Mapletree Pan Asia Commercial Trust | | 16,224 | 17,569 |
| UOL Group Ltd. | | 15,703 | 72,918 |
TOTAL SINGAPORE | | | 218,952 |
| Spain - 1.8% | | | |
| Lar Espana Real Estate Socimi SA | | 3,900 | 26,173 |
| Merlin Properties Socimi SA | | 7,120 | 73,137 |
TOTAL SPAIN | | | 99,310 |
| Sweden - 1.6% | | | |
| Catena AB | | 1,713 | 73,316 |
| Swedish Logistic Property AB (a) | | 3,717 | 11,197 |
TOTAL SWEDEN | | | 84,513 |
| United Kingdom - 7.6% | | | |
| Assura PLC | | 107,220 | 60,521 |
| Grainger Trust PLC | | 43,312 | 144,469 |
| Helical PLC | | 6,213 | 16,181 |
| Londonmetric Properity PLC | | 6,700 | 16,447 |
| Segro PLC | | 3,750 | 41,906 |
| Shaftesbury Capital PLC | | 32,154 | 54,318 |
| Unite Group PLC | | 5,888 | 75,887 |
TOTAL UNITED KINGDOM | | | 409,729 |
| United States of America - 61.4% | | | |
| American Homes 4 Rent Class A | | 2,606 | 91,340 |
| Americold Realty Trust | | 1,806 | 49,665 |
| Apartment Income (REIT) Corp. | | 2,142 | 70,022 |
| CubeSmart | | 2,548 | 110,125 |
| DiamondRock Hospitality Co. | | 7,588 | 69,354 |
| Digital Realty Trust, Inc. | | 1,100 | 154,506 |
| Elme Communities (SBI) | | 755 | 10,932 |
| Equinix, Inc. | | 383 | 317,802 |
| Equity Lifestyle Properties, Inc. | | 467 | 31,611 |
| Equity Residential (SBI) | | 1,601 | 96,364 |
| Extra Space Storage, Inc. | | 406 | 58,643 |
| Flagship Communities (REIT) | | 4,753 | 76,856 |
| Gaming & Leisure Properties | | 647 | 29,536 |
| Invitation Homes, Inc. | | 1,984 | 65,333 |
| Kimco Realty Corp. | | 6,571 | 132,734 |
| Mid-America Apartment Communities, Inc. | | 882 | 111,467 |
| NNN (REIT), Inc. | | 2,962 | 119,487 |
| Phillips Edison & Co., Inc. | | 1,497 | 51,961 |
| Prologis, Inc. | | 3,973 | 503,340 |
| Public Storage | | 623 | 176,427 |
| Realty Income Corp. | | 1,594 | 86,698 |
| Regency Centers Corp. | | 1,907 | 119,512 |
| Ryman Hospitality Properties, Inc. | | 481 | 52,862 |
| SITE Centers Corp. | | 2,706 | 36,044 |
| Sun Communities, Inc. | | 988 | 123,846 |
| Tanger, Inc. | | 579 | 15,575 |
| Terreno Realty Corp. | | 507 | 30,283 |
| UDR, Inc. | | 3,125 | 112,563 |
| Urban Edge Properties | | 2,807 | 48,477 |
| Ventas, Inc. | | 5,020 | 232,878 |
| Welltower, Inc. | | 1,424 | 123,190 |
TOTAL UNITED STATES OF AMERICA | | | 3,309,433 |
| TOTAL COMMON STOCKS (Cost $4,700,955) | | | 5,367,059 |
| | | | |
| Money Market Funds - 0.8% |
| | | Shares | Value ($) |
Fidelity Cash Central Fund 5.39% (b) (Cost $40,256) | | 40,248 | 40,256 |
| | | | |
| TOTAL INVESTMENT IN SECURITIES - 100.3% (Cost $4,741,211) | 5,407,315 |
NET OTHER ASSETS (LIABILITIES) - (0.3)% | (14,296) |
| NET ASSETS - 100.0% | 5,393,019 |
| | |
Legend
| (b) | Affiliated fund that is generally available only to investment companies and other accounts managed by Fidelity Investments. The rate quoted is the annualized seven-day yield of the fund at period end. A complete unaudited listing of the fund's holdings as of its most recent quarter end is available upon request. In addition, each Fidelity Central Fund's financial statements are available on the SEC's website or upon request. |
Affiliated Central Funds
Fiscal year to date information regarding the Fund's investments in Fidelity Central Funds, including the ownership percentage, is presented below.
| Affiliate | Value, beginning of period ($) | Purchases ($) | Sales Proceeds ($) | Dividend Income ($) | Realized Gain (loss) ($) | Change in Unrealized appreciation (depreciation) ($) | Value, end of period ($) | % ownership, end of period |
| Fidelity Cash Central Fund 5.39% | 128,414 | 314,361 | 402,519 | 1,829 | - | - | 40,256 | 0.0% |
| Total | 128,414 | 314,361 | 402,519 | 1,829 | - | - | 40,256 | |
| | | | | | | | | |
Amounts in the dividend income column in the above table include any capital gain distributions from underlying funds, which are presented in the corresponding line item in the Statement of Operations, if applicable.
Amounts included in the purchases and sales proceeds columns may include in-kind transactions, if applicable.
Investment Valuation
The following is a summary of the inputs used, as of January 31, 2024, involving the Fund's assets and liabilities carried at fair value. The inputs or methodology used for valuing securities may not be an indication of the risk associated with investing in those securities. For more information on valuation inputs, and their aggregation into the levels used below, please refer to the Investment Valuation section in the accompanying Notes to Financial Statements.
| Valuation Inputs at Reporting Date: |
| Description | Total ($) | Level 1 ($) | Level 2 ($) | Level 3 ($) |
Investments in Securities: | | | | |
|
| Equities: | | | | |
Real Estate | 5,367,059 | 4,315,944 | 1,051,115 | - |
|
| Money Market Funds | 40,256 | 40,256 | - | - |
| Total Investments in Securities: | 5,407,315 | 4,356,200 | 1,051,115 | - |
| Statement of Assets and Liabilities |
| | | | January 31, 2024 (Unaudited) |
| | | | | |
| Assets | | | | |
| Investment in securities, at value - See accompanying schedule: | | | | |
Unaffiliated issuers (cost $4,700,955) | $ | 5,367,059 | | |
Fidelity Central Funds (cost $40,256) | | 40,256 | | |
| | | | | |
| | | | | |
| Total Investment in Securities (cost $4,741,211) | | | $ | 5,407,315 |
| Cash | | | | 6,322 |
| Foreign currency held at value (cost $60) | | | | 60 |
| Receivable for investments sold | | | | 5,102 |
| Receivable for fund shares sold | | | | 1,502 |
| Dividends receivable | | | | 13,448 |
| Distributions receivable from Fidelity Central Funds | | | | 225 |
| Prepaid expenses | | | | 8 |
| Receivable from investment adviser for expense reductions | | | | 5,839 |
| Other receivables | | | | 579 |
Total assets | | | | 5,440,400 |
| Liabilities | | | | |
| Payable for investments purchased | $ | 1,032 | | |
| Payable for fund shares redeemed | | 62 | | |
| Accrued management fee | | 3,068 | | |
| Distribution and service plan fees payable | | 1,203 | | |
| Other affiliated payables | | 968 | | |
| Audit fee payable | | 32,452 | | |
| Custody fee payable | | 8,592 | | |
| Other payables and accrued expenses | | 4 | | |
| Total Liabilities | | | | 47,381 |
| Net Assets | | | $ | 5,393,019 |
| Net Assets consist of: | | | | |
| Paid in capital | | | $ | 5,651,098 |
| Total accumulated earnings (loss) | | | | (258,079) |
| Net Assets | | | $ | 5,393,019 |
| | | | | |
| Net Asset Value and Maximum Offering Price | | | | |
| Class A : | | | | |
Net Asset Value and redemption price per share ($2,764,532 ÷ 273,264 shares)(a) | | | $ | 10.12 |
| Maximum offering price per share (100/94.25 of $10.12) | | | $ | 10.74 |
| Class M : | | | | |
Net Asset Value and redemption price per share ($940,655 ÷ 93,120 shares)(a) | | | $ | 10.10 |
| Maximum offering price per share (100/96.50 of $10.10) | | | $ | 10.47 |
| Class C : | | | | |
Net Asset Value and offering price per share ($261,100 ÷ 25,767 shares)(a) | | | $ | 10.13 |
| Class I : | | | | |
Net Asset Value, offering price and redemption price per share ($1,092,494 ÷ 107,877 shares) | | | $ | 10.13 |
| Class Z : | | | | |
Net Asset Value, offering price and redemption price per share ($334,238 ÷ 32,734 shares) | | | $ | 10.21 |
(a)Redemption price per share is equal to net asset value less any applicable contingent deferred sales charge. |
| Statement of Operations |
| | | | Six months ended January 31, 2024 (Unaudited) |
| Investment Income | | | | |
| Dividends | | | $ | 78,210 |
| Income from Fidelity Central Funds | | | | 1,829 |
| Income before foreign taxes withheld | | | $ | 80,039 |
| Less foreign taxes withheld | | | | (3,292) |
| Total Income | | | | 76,747 |
| Expenses | | | | |
| Management fee | $ | 17,096 | | |
| Transfer agent fees | | 5,143 | | |
| Distribution and service plan fees | | 6,656 | | |
| Accounting fees and expenses | | 900 | | |
| Custodian fees and expenses | | 8,645 | | |
| Independent trustees' fees and expenses | | 15 | | |
| Registration fees | | 27,207 | | |
| Audit | | 31,990 | | |
| Legal | | 4 | | |
| Miscellaneous | | 10 | | |
| Total expenses before reductions | | 97,666 | | |
| Expense reductions | | (67,479) | | |
| Total expenses after reductions | | | | 30,187 |
| Net Investment income (loss) | | | | 46,560 |
| Realized and Unrealized Gain (Loss) | | | | |
| Net realized gain (loss) on: | | | | |
| Investment Securities: | | | | |
| Unaffiliated issuers | | (6,090) | | |
| Foreign currency transactions | | (104) | | |
| Total net realized gain (loss) | | | | (6,194) |
| Change in net unrealized appreciation (depreciation) on: | | | | |
| Investment Securities: | | | | |
| Unaffiliated issuers | | 21,722 | | |
| Assets and liabilities in foreign currencies | | (253) | | |
| Total change in net unrealized appreciation (depreciation) | | | | 21,469 |
| Net gain (loss) | | | | 15,275 |
| Net increase (decrease) in net assets resulting from operations | | | $ | 61,835 |
| Statement of Changes in Net Assets |
| |
| | Six months ended January 31, 2024 (Unaudited) | | Year ended July 31, 2023 |
| Increase (Decrease) in Net Assets | | | | |
| Operations | | | | |
| Net investment income (loss) | $ | 46,560 | $ | 133,483 |
| Net realized gain (loss) | | (6,194) | | (689,970) |
| Change in net unrealized appreciation (depreciation) | | 21,469 | | (11,330) |
| Net increase (decrease) in net assets resulting from operations | | 61,835 | | (567,817) |
| Distributions to shareholders | | (127,792) | | (76,041) |
| | | | | |
| Share transactions - net increase (decrease) | | 221,268 | | (1,482,271) |
| Total increase (decrease) in net assets | | 155,311 | | (2,126,129) |
| | | | | |
| Net Assets | | | | |
| Beginning of period | | 5,237,708 | | 7,363,837 |
| End of period | $ | 5,393,019 | $ | 5,237,708 |
| | | | | |
| | | | | |
Financial Highlights
| Fidelity Advisor® Global Real Estate Fund Class A |
| |
| | Six months ended (Unaudited) January 31, 2024 | | Years ended July 31, 2023 | | 2022 | | 2021 | | 2020 | | 2019 |
Selected Per-Share Data | | | | | | | | | | | | |
| Net asset value, beginning of period | $ | 10.21 | $ | 11.18 | $ | 12.49 | $ | 9.69 | $ | 10.72 | $ | 10.13 |
| Income from Investment Operations | | | | | | | | | | | | |
Net investment income (loss) A,B | | .09 | | .23 | | .17 | | .17 | | .15 | | .22 |
| Net realized and unrealized gain (loss) | | .07 | | (1.11) | | (1.33) | | 2.76 | | (.58) | | .58 |
| Total from investment operations | | .16 | | (.88) | | (1.16) | | 2.93 | | (.43) | | .80 |
| Distributions from net investment income | | (.25) | | (.09) | | (.15) | | (.13) | | (.23) | | (.15) |
| Distributions from net realized gain | | - | | - | | - | | - | | (.37) | | (.06) |
| Total distributions | | (.25) | | (.09) | | (.15) | | (.13) | | (.60) | | (.21) |
| Net asset value, end of period | $ | 10.12 | $ | 10.21 | $ | 11.18 | $ | 12.49 | $ | 9.69 | $ | 10.72 |
Total Return C,D,E | | 1.46% | | (7.81)% | | (9.40)% | | 30.59% | | (4.61)% | | 8.25% |
Ratios to Average Net Assets B,F,G | | | | | | | | | | | | |
| Expenses before reductions | | 3.86% H | | 3.85% | | 3.19% | | 4.19% | | 4.22% | | 4.56% |
| Expenses net of fee waivers, if any | | 1.19% H | | 1.20% | | 1.28% | | 1.38% | | 1.40% | | 1.40% |
| Expenses net of all reductions | | 1.19% H | | 1.19% | | 1.28% | | 1.37% | | 1.39% | | 1.39% |
| Net investment income (loss) | | 1.84% H | | 2.31% | | 1.45% | | 1.60% | | 1.47% | | 2.09% |
| Supplemental Data | | | | | | | | | | | | |
| Net assets, end of period (000 omitted) | $ | 2,765 | $ | 2,771 | $ | 3,021 | $ | 2,747 | $ | 1,732 | $ | 3,290 |
Portfolio turnover rate I | | 31% H | | 84% | | 33% | | 32% | | 52% | | 60% |
ACalculated based on average shares outstanding during the period.
BNet investment income (loss) is affected by the timing of the declaration of dividends by any underlying mutual funds or exchange-traded funds (ETFs). Net investment income (loss) of any mutual funds or ETFs is not included in the Fund's net investment income (loss) ratio.
CTotal returns for periods of less than one year are not annualized.
DTotal returns would have been lower if certain expenses had not been reduced during the applicable periods shown.
ETotal returns do not include the effect of the sales charges.
FFees and expenses of any underlying mutual funds or exchange-traded funds (ETFs) are not included in the Fund's expense ratio. The Fund indirectly bears its proportionate share of these expenses. For additional expense information related to investments in Fidelity Central Funds, please refer to the "Investments in Fidelity Central Funds" note found in the Notes to Financial Statements section of the most recent Annual or Semi-Annual report.
GExpense ratios reflect operating expenses of the class. Expenses before reductions do not reflect amounts reimbursed, waived, or reduced through arrangements with the investment adviser, brokerage services, or other offset arrangements, if applicable, and do not represent the amount paid by the class during periods when reimbursements, waivers or reductions occur.
HAnnualized.
IAmount does not include the portfolio activity of any underlying mutual funds or exchange-traded funds (ETFs).
| Fidelity Advisor® Global Real Estate Fund Class M |
| |
| | Six months ended (Unaudited) January 31, 2024 | | Years ended July 31, 2023 | | 2022 | | 2021 | | 2020 | | 2019 |
Selected Per-Share Data | | | | | | | | | | | | |
| Net asset value, beginning of period | $ | 10.19 | $ | 11.16 | $ | 12.46 | $ | 9.67 | $ | 10.71 | $ | 10.11 |
| Income from Investment Operations | | | | | | | | | | | | |
Net investment income (loss) A,B | | .08 | | .20 | | .14 | | .14 | | .12 | | .19 |
| Net realized and unrealized gain (loss) | | .05 | | (1.11) | | (1.31) | | 2.76 | | (.58) | | .60 |
| Total from investment operations | | .13 | | (.91) | | (1.17) | | 2.90 | | (.46) | | .79 |
| Distributions from net investment income | | (.22) | | (.06) | | (.13) | | (.11) | | (.21) | | (.13) |
| Distributions from net realized gain | | - | | - | | - | | - | | (.37) | | (.06) |
| Total distributions | | (.22) | | (.06) | | (.13) | | (.11) | | (.58) | | (.19) |
| Net asset value, end of period | $ | 10.10 | $ | 10.19 | $ | 11.16 | $ | 12.46 | $ | 9.67 | $ | 10.71 |
Total Return C,D,E | | 1.24% | | (8.09)% | | (9.51)% | | 30.20% | | (4.87)% | | 8.06% |
Ratios to Average Net Assets B,F,G | | | | | | | | | | | | |
| Expenses before reductions | | 4.10% H | | 4.03% | | 3.39% | | 4.41% | | 4.46% | | 4.79% |
| Expenses net of fee waivers, if any | | 1.44% H | | 1.45% | | 1.52% | | 1.63% | | 1.66% | | 1.65% |
| Expenses net of all reductions | | 1.43% H | | 1.45% | | 1.52% | | 1.62% | | 1.64% | | 1.64% |
| Net investment income (loss) | | 1.59% H | | 2.05% | | 1.21% | | 1.35% | | 1.22% | | 1.84% |
| Supplemental Data | | | | | | | | | | | | |
| Net assets, end of period (000 omitted) | $ | 941 | $ | 918 | $ | 1,070 | $ | 876 | $ | 658 | $ | 810 |
Portfolio turnover rate I | | 31% H | | 84% | | 33% | | 32% | | 52% | | 60% |
ACalculated based on average shares outstanding during the period.
BNet investment income (loss) is affected by the timing of the declaration of dividends by any underlying mutual funds or exchange-traded funds (ETFs). Net investment income (loss) of any mutual funds or ETFs is not included in the Fund's net investment income (loss) ratio.
CTotal returns for periods of less than one year are not annualized.
DTotal returns would have been lower if certain expenses had not been reduced during the applicable periods shown.
ETotal returns do not include the effect of the sales charges.
FFees and expenses of any underlying mutual funds or exchange-traded funds (ETFs) are not included in the Fund's expense ratio. The Fund indirectly bears its proportionate share of these expenses. For additional expense information related to investments in Fidelity Central Funds, please refer to the "Investments in Fidelity Central Funds" note found in the Notes to Financial Statements section of the most recent Annual or Semi-Annual report.
GExpense ratios reflect operating expenses of the class. Expenses before reductions do not reflect amounts reimbursed, waived, or reduced through arrangements with the investment adviser, brokerage services, or other offset arrangements, if applicable, and do not represent the amount paid by the class during periods when reimbursements, waivers or reductions occur.
HAnnualized.
IAmount does not include the portfolio activity of any underlying mutual funds or exchange-traded funds (ETFs).
| Fidelity Advisor® Global Real Estate Fund Class C |
| |
| | Six months ended (Unaudited) January 31, 2024 | | Years ended July 31, 2023 | | 2022 | | 2021 | | 2020 | | 2019 |
Selected Per-Share Data | | | | | | | | | | | | |
| Net asset value, beginning of period | $ | 10.21 | $ | 11.17 | $ | 12.47 | $ | 9.63 | $ | 10.63 | $ | 10.08 |
| Income from Investment Operations | | | | | | | | | | | | |
Net investment income (loss) A,B | | .05 | | .16 | | .09 | | .09 | | .07 | | .14 |
| Net realized and unrealized gain (loss) | | .06 | | (1.11) | | (1.33) | | 2.75 | | (.58) | | .59 |
| Total from investment operations | | .11 | | (.95) | | (1.24) | | 2.84 | | (.51) | | .73 |
| Distributions from net investment income | | (.19) | | (.01) | | (.06) | | - | | (.12) | | (.12) |
| Distributions from net realized gain | | - | | - | | - | | - | | (.37) | | (.06) |
| Total distributions | | (.19) | | (.01) | | (.06) | | - | | (.49) | | (.18) |
| Net asset value, end of period | $ | 10.13 | $ | 10.21 | $ | 11.17 | $ | 12.47 | $ | 9.63 | $ | 10.63 |
Total Return C,D,E | | .98% | | (8.53)% | | (9.97)% | | 29.49% | | (5.31)% | | 7.52% |
Ratios to Average Net Assets B,F,G | | | | | | | | | | | | |
| Expenses before reductions | | 4.62% H | | 4.59% | | 3.93% | | 5.02% | | 4.46% | | 5.04% |
| Expenses net of fee waivers, if any | | 1.94% H | | 1.94% | | 2.02% | | 2.14% | | 2.16% | | 2.15% |
| Expenses net of all reductions | | 1.93% H | | 1.93% | | 2.02% | | 2.13% | | 2.15% | | 2.14% |
| Net investment income (loss) | | 1.09% H | | 1.57% | | .72% | | .85% | | .71% | | 1.34% |
| Supplemental Data | | | | | | | | | | | | |
| Net assets, end of period (000 omitted) | $ | 261 | $ | 193 | $ | 203 | $ | 223 | $ | 185 | $ | 1,060 |
Portfolio turnover rate I | | 31% H | | 84% | | 33% | | 32% | | 52% | | 60% |
ACalculated based on average shares outstanding during the period.
BNet investment income (loss) is affected by the timing of the declaration of dividends by any underlying mutual funds or exchange-traded funds (ETFs). Net investment income (loss) of any mutual funds or ETFs is not included in the Fund's net investment income (loss) ratio.
CTotal returns for periods of less than one year are not annualized.
DTotal returns would have been lower if certain expenses had not been reduced during the applicable periods shown.
ETotal returns do not include the effect of the contingent deferred sales charge.
FFees and expenses of any underlying mutual funds or exchange-traded funds (ETFs) are not included in the Fund's expense ratio. The Fund indirectly bears its proportionate share of these expenses. For additional expense information related to investments in Fidelity Central Funds, please refer to the "Investments in Fidelity Central Funds" note found in the Notes to Financial Statements section of the most recent Annual or Semi-Annual report.
GExpense ratios reflect operating expenses of the class. Expenses before reductions do not reflect amounts reimbursed, waived, or reduced through arrangements with the investment adviser, brokerage services, or other offset arrangements, if applicable, and do not represent the amount paid by the class during periods when reimbursements, waivers or reductions occur.
HAnnualized.
IAmount does not include the portfolio activity of any underlying mutual funds or exchange-traded funds (ETFs).
| Fidelity Advisor® Global Real Estate Fund Class I |
| |
| | Six months ended (Unaudited) January 31, 2024 | | Years ended July 31, 2023 | | 2022 | | 2021 | | 2020 | | 2019 |
Selected Per-Share Data | | | | | | | | | | | | |
| Net asset value, beginning of period | $ | 10.23 | $ | 11.21 | $ | 12.51 | $ | 9.71 | $ | 10.75 | $ | 10.15 |
| Income from Investment Operations | | | | | | | | | | | | |
Net investment income (loss) A,B | | .10 | | .25 | | .20 | | .20 | | .17 | | .24 |
| Net realized and unrealized gain (loss) | | .07 | | (1.11) | | (1.32) | | 2.76 | | (.58) | | .59 |
| Total from investment operations | | .17 | | (.86) | | (1.12) | | 2.96 | | (.41) | | .83 |
| Distributions from net investment income | | (.27) | | (.12) | | (.18) | | (.16) | | (.26) | | (.17) |
| Distributions from net realized gain | | - | | - | | - | | - | | (.37) | | (.06) |
| Total distributions | | (.27) | | (.12) | | (.18) | | (.16) | | (.63) | | (.23) |
| Net asset value, end of period | $ | 10.13 | $ | 10.23 | $ | 11.21 | $ | 12.51 | $ | 9.71 | $ | 10.75 |
Total Return C,D | | 1.60% | | (7.61)% | | (9.12)% | | 30.82% | | (4.40)% | | 8.55% |
Ratios to Average Net Assets B,E,F | | | | | | | | | | | | |
| Expenses before reductions | | 3.57% G | | 3.31% | | 2.94% | | 3.81% | | 3.97% | | 4.20% |
| Expenses net of fee waivers, if any | | .94% G | | .95% | | 1.02% | | 1.13% | | 1.16% | | 1.15% |
| Expenses net of all reductions | | .94% G | | .95% | | 1.02% | | 1.12% | | 1.14% | | 1.14% |
| Net investment income (loss) | | 2.09% G | | 2.55% | | 1.71% | | 1.85% | | 1.71% | | 2.34% |
| Supplemental Data | | | | | | | | | | | | |
| Net assets, end of period (000 omitted) | $ | 1,092 | $ | 1,162 | $ | 1,766 | $ | 1,483 | $ | 1,066 | $ | 1,056 |
Portfolio turnover rate H | | 31% G | | 84% | | 33% | | 32% | | 52% | | 60% |
ACalculated based on average shares outstanding during the period.
BNet investment income (loss) is affected by the timing of the declaration of dividends by any underlying mutual funds or exchange-traded funds (ETFs). Net investment income (loss) of any mutual funds or ETFs is not included in the Fund's net investment income (loss) ratio.
CTotal returns for periods of less than one year are not annualized.
DTotal returns would have been lower if certain expenses had not been reduced during the applicable periods shown.
EFees and expenses of any underlying mutual funds or exchange-traded funds (ETFs) are not included in the Fund's expense ratio. The Fund indirectly bears its proportionate share of these expenses. For additional expense information related to investments in Fidelity Central Funds, please refer to the "Investments in Fidelity Central Funds" note found in the Notes to Financial Statements section of the most recent Annual or Semi-Annual report.
FExpense ratios reflect operating expenses of the class. Expenses before reductions do not reflect amounts reimbursed, waived, or reduced through arrangements with the investment adviser, brokerage services, or other offset arrangements, if applicable, and do not represent the amount paid by the class during periods when reimbursements, waivers or reductions occur.
GAnnualized.
HAmount does not include the portfolio activity of any underlying mutual funds or exchange-traded funds (ETFs).
| Fidelity Advisor® Global Real Estate Fund Class Z |
| |
| | Six months ended (Unaudited) January 31, 2024 | | Years ended July 31, 2023 | | 2022 | | 2021 | | 2020 | | 2019 A |
Selected Per-Share Data | | | | | | | | | | | | |
| Net asset value, beginning of period | $ | 10.31 | $ | 11.28 | $ | 12.56 | $ | 9.73 | $ | 10.76 | $ | 10.01 |
| Income from Investment Operations | | | | | | | | | | | | |
Net investment income (loss) B,C | | .11 | | .28 | | .22 | | .22 | | .19 | | .22 |
| Net realized and unrealized gain (loss) | | .06 | | (1.13) | | (1.32) | | 2.77 | | (.59) | | .76 |
| Total from investment operations | | .17 | | (.85) | | (1.10) | | 2.99 | | (.40) | | .98 |
| Distributions from net investment income | | (.27) | | (.12) | | (.18) | | (.16) | | (.26) | | (.17) |
| Distributions from net realized gain | | - | | - | | - | | - | | (.37) | | (.06) |
| Total distributions | | (.27) | | (.12) | | (.18) | | (.16) | | (.63) | | (.23) |
| Net asset value, end of period | $ | 10.21 | $ | 10.31 | $ | 11.28 | $ | 12.56 | $ | 9.73 | $ | 10.76 |
Total Return D,E | | 1.58% | | (7.48)% | | (8.93)% | | 31.07% | | (4.29)% | | 10.17% |
Ratios to Average Net Assets C,F,G | | | | | | | | | | | | |
| Expenses before reductions | | 3.29% H | | 3.38% | | 2.71% | | 3.72% | | 3.54% | | 3.87% H |
| Expenses net of fee waivers, if any | | .79% H | | .80% | | .89% | | .97% | | 1.02% | | 1.00% H |
| Expenses net of all reductions | | .78% H | | .80% | | .89% | | .96% | | 1.00% | | 1.00% H |
| Net investment income (loss) | | 2.24% H | | 2.70% | | 1.84% | | 2.01% | | 1.86% | | 2.50% H |
| Supplemental Data | | | | | | | | | | | | |
| Net assets, end of period (000 omitted) | $ | 334 | $ | 194 | $ | 1,303 | $ | 1,180 | $ | 233 | $ | 306 |
Portfolio turnover rate I | | 31% H | | 84% | | 33% | | 32% | | 52% | | 60% |
AFor the period October 2, 2018 (commencement of sale of shares) through July 31, 2019.
BCalculated based on average shares outstanding during the period.
CNet investment income (loss) is affected by the timing of the declaration of dividends by any underlying mutual funds or exchange-traded funds (ETFs). Net investment income (loss) of any mutual funds or ETFs is not included in the Fund's net investment income (loss) ratio.
DTotal returns for periods of less than one year are not annualized.
ETotal returns would have been lower if certain expenses had not been reduced during the applicable periods shown.
FFees and expenses of any underlying mutual funds or exchange-traded funds (ETFs) are not included in the Fund's expense ratio. The Fund indirectly bears its proportionate share of these expenses. For additional expense information related to investments in Fidelity Central Funds, please refer to the "Investments in Fidelity Central Funds" note found in the Notes to Financial Statements section of the most recent Annual or Semi-Annual report.
GExpense ratios reflect operating expenses of the class. Expenses before reductions do not reflect amounts reimbursed, waived, or reduced through arrangements with the investment adviser, brokerage services, or other offset arrangements, if applicable, and do not represent the amount paid by the class during periods when reimbursements, waivers or reductions occur.
HAnnualized.
IAmount does not include the portfolio activity of any underlying mutual funds or exchange-traded funds (ETFs).
For the period ended January 31, 2024
1. Organization.
Fidelity Advisor Global Real Estate Fund (the Fund) is a fund of Fidelity Advisor Series VII (the Trust) and is authorized to issue an unlimited number of shares. The Trust is registered under the Investment Company Act of 1940, as amended (the 1940 Act), as an open-end management investment company organized as a Massachusetts business trust. The Fund offers Class A, Class M, Class C, Class I and Class Z shares, each of which has equal rights as to assets and voting privileges. Class A, Class M, Class C, Class I and Class Z are Fidelity Advisor classes. Each class has exclusive voting rights with respect to matters that affect that class. Class C shares will automatically convert to Class A shares after a holding period of eight years from the initial date of purchase, with certain exceptions.
2. Investments in Fidelity Central Funds.
Funds may invest in Fidelity Central Funds, which are open-end investment companies generally available only to other investment companies and accounts managed by the investment adviser and its affiliates. The Schedule of Investments lists any Fidelity Central Funds held as an investment as of period end, but does not include the underlying holdings of each Fidelity Central Fund. An investing fund indirectly bears its proportionate share of the expenses of the underlying Fidelity Central Funds.
Based on its investment objective, each Fidelity Central Fund may invest or participate in various investment vehicles or strategies that are similar to those of the investing fund. These strategies are consistent with the investment objectives of the investing fund and may involve certain economic risks which may cause a decline in value of each of the Fidelity Central Funds and thus a decline in the value of the investing fund.
| Fidelity Central Fund | Investment Manager | Investment Objective | Investment Practices | Expense RatioA |
| Fidelity Money Market Central Funds | Fidelity Management & Research Company LLC (FMR) | Each fund seeks to obtain a high level of current income consistent with the preservation of capital and liquidity. | Short-term Investments | Less than .005% |
A Expenses expressed as a percentage of average net assets and are as of each underlying Central Fund's most recent annual or semi-annual shareholder report.
A complete unaudited list of holdings for each Fidelity Central Fund is available upon request or at the Securities and Exchange Commission website at www.sec.gov. In addition, the financial statements of the Fidelity Central Funds which contain the significant accounting policies (including investment valuation policies) of those funds, and are not covered by the Report of Independent Registered Public Accounting Firm, are available on the Securities and Exchange Commission website or upon request.
3. Significant Accounting Policies.
The Fund is an investment company and applies the accounting and reporting guidance of the Financial Accounting Standards Board (FASB) Accounting Standards Codification Topic 946 Financial Services - Investment Companies. The financial statements have been prepared in conformity with accounting principles generally accepted in the United States of America (GAAP), which require management to make certain estimates and assumptions at the date of the financial statements. Actual results could differ from those estimates. Subsequent events, if any, through the date that the financial statements were issued have been evaluated in the preparation of the financial statements. The Fund's Schedule of Investments lists any underlying mutual funds or exchange-traded funds (ETFs) but does not include the underlying holdings of these funds. The following summarizes the significant accounting policies of the Fund:
Investment Valuation. Investments are valued as of 4:00 p.m. Eastern time on the last calendar day of the period. The Board of Trustees (the Board) has designated the Fund's investment adviser as the valuation designee responsible for the fair valuation function and performing fair value determinations as needed. The investment adviser has established a Fair Value Committee (the Committee) to carry out the day-to-day fair valuation responsibilities and has adopted policies and procedures to govern the fair valuation process and the activities of the Committee. In accordance with these fair valuation policies and procedures, which have been approved by the Board, the Fund attempts to obtain prices from one or more third party pricing services or brokers to value its investments. When current market prices, quotations or currency exchange rates are not readily available or reliable, investments will be fair valued in good faith by the Committee, in accordance with the policies and procedures. Factors used in determining fair value vary by investment type and may include market or investment specific events, transaction data, estimated cash flows, and market observations of comparable investments. The frequency that the fair valuation procedures are used cannot be predicted and they may be utilized to a significant extent. The Committee manages the Fund's fair valuation practices and maintains the fair valuation policies and procedures. The Fund's investment adviser reports to the Board information regarding the fair valuation process and related material matters.
The Fund categorizes the inputs to valuation techniques used to value its investments into a disclosure hierarchy consisting of three levels as shown below:
Level 1 - unadjusted quoted prices in active markets for identical investments
Level 2 - other significant observable inputs (including quoted prices for similar investments, interest rates, prepayment speeds, etc.)
Level 3 - unobservable inputs (including the Fund's own assumptions based on the best information available)
Valuation techniques used to value the Fund's investments by major category are as follows:
Equity securities, including restricted securities, for which market quotations are readily available, are valued at the last reported sale price or official closing price as reported by a third party pricing service on the primary market or exchange on which they are traded and are categorized as Level 1 in the hierarchy. In the event there were no sales during the day or closing prices are not available, securities are valued at the last quoted bid price or may be valued using the last available price and are generally categorized as Level 2 in the hierarchy. For foreign equity securities, when market or security specific events arise, comparisons to the valuation of American Depositary Receipts (ADRs), futures contracts, ETFs and certain indexes as well as quoted prices for similar securities may be used and would be categorized as Level 2 in the hierarchy. For equity securities, including restricted securities, where observable inputs are limited, assumptions about market activity and risk are used and these securities may be categorized as Level 3 in the hierarchy.
Investments in open-end mutual funds, including the Fidelity Central Funds, are valued at their closing net asset value (NAV) each business day and are categorized as Level 1 in the hierarchy.
Changes in valuation techniques may result in transfers in or out of an assigned level within the disclosure hierarchy. The aggregate value of investments by input level as of January 31, 2024 is included at the end of the Fund's Schedule of Investments.
Foreign Currency. Certain Funds may use foreign currency contracts to facilitate transactions in foreign-denominated securities. Gains and losses from these transactions may arise from changes in the value of the foreign currency or if the counterparties do not perform under the contracts' terms.
Foreign-denominated assets, including investment securities, and liabilities are translated into U.S. dollars at the exchange rates at period end. Purchases and sales of investment securities, income and dividends received, and expenses denominated in foreign currencies are translated into U.S. dollars at the exchange rate in effect on the transaction date.
The effects of exchange rate fluctuations on investments are included with the net realized and unrealized gain (loss) on investment securities. Other foreign currency transactions resulting in realized and unrealized gain (loss) are disclosed separately.
Investment Transactions and Income. For financial reporting purposes, the Fund's investment holdings and NAV include trades executed through the end of the last business day of the period. The NAV per share for processing shareholder transactions is calculated as of the close of business of the New York Stock Exchange (NYSE), normally 4:00 p.m. Eastern time and includes trades executed through the end of the prior business day. Gains and losses on securities sold are determined on the basis of identified cost. Commissions paid to certain brokers with whom the investment adviser, or its affiliates, places trades on behalf of a fund include an amount in addition to trade execution, which may be rebated back to a fund. Any such rebates are included in net realized gain (loss) on investments in the Statement of Operations. Dividend income is recorded on the ex-dividend date, except for certain dividends from foreign securities where the ex-dividend date may have passed, which are recorded as soon as the Fund is informed of the ex-dividend date. Non-cash dividends included in dividend income, if any, are recorded at the fair market value of the securities received. Income and capital gain distributions from Fidelity Central Funds, if any, are recorded on the ex-dividend date. Certain distributions received by the Fund represent a return of capital or capital gain. The Fund determines the components of these distributions subsequent to the ex-dividend date, based upon receipt of tax filings or other correspondence relating to the underlying investment. These distributions are recorded as a reduction of cost of investments and/or as a realized gain. Investment income is recorded net of foreign taxes withheld where recovery of such taxes is uncertain. Funds may file withholding tax reclaims in certain jurisdictions to recover a portion of amounts previously withheld. Any withholding tax reclaims income is included in the Statement of Operations in foreign taxes withheld. Any receivables for withholding tax reclaims are included in the Statement of Assets and Liabilities in dividends receivable.
Class Allocations and Expenses. Investment income, realized and unrealized capital gains and losses, common expenses of a fund, and certain fund-level expense reductions, if any, are allocated daily on a pro-rata basis to each class based on the relative net assets of each class to the total net assets of a fund. Each class differs with respect to transfer agent and distribution and service plan fees incurred, as applicable. Certain expense reductions may also differ by class, if applicable. For the reporting period, the allocated portion of income and expenses to each class as a percent of its average net assets may vary due to the timing of recording these transactions in relation to fluctuating net assets of the classes. Expenses directly attributable to a fund are charged to that fund. Expenses attributable to more than one fund are allocated among the respective funds on the basis of relative net assets or other appropriate methods. Expenses included in the accompanying financial statements reflect the expenses of that fund and do not include any expenses associated with any underlying mutual funds or exchange-traded funds (ETFs). Although not included in a fund's expenses, a fund indirectly bears its proportionate share of these expenses through the net asset value of each underlying mutual fund or exchange-traded fund (ETF). Expense estimates are accrued in the period to which they relate and adjustments are made when actual amounts are known.
Income Tax Information and Distributions to Shareholders. Each year, the Fund intends to qualify as a regulated investment company under Subchapter M of the Internal Revenue Code, including distributing substantially all of its taxable income and realized gains. As a result, no provision for U.S. Federal income taxes is required. The Fund files a U.S. federal tax return, in addition to state and local tax returns as required. The Fund's federal income tax returns are subject to examination by the Internal Revenue Service (IRS) for a period of three fiscal years after they are filed. State and local tax returns may be subject to examination for an additional fiscal year depending on the jurisdiction. Foreign taxes are provided for based on the Fund's understanding of the tax rules and rates that exist in the foreign markets in which it invests.
Distributions are declared and recorded on the ex-dividend date. Income and capital gain distributions are declared separately for each class. Income and capital gain distributions are determined in accordance with income tax regulations, which may differ from GAAP.
Capital accounts within the financial statements are adjusted for permanent book-tax differences. These adjustments have no impact on net assets or the results of operations. Capital accounts are not adjusted for temporary book-tax differences which will reverse in a subsequent period.
Book-tax differences are primarily due to foreign currency transactions, passive foreign investment companies (PFIC), capital loss carryforwards and losses deferred due to wash sales.
As of period end, the cost and unrealized appreciation (depreciation) in securities, and derivatives if applicable, for federal income tax purposes were as follows:
| Gross unrealized appreciation | $841,096 |
| Gross unrealized depreciation | (215,831) |
| Net unrealized appreciation (depreciation) | $625,265 |
| Tax cost | $4,782,050 |
Capital loss carryforwards are only available to offset future capital gains of the Fund to the extent provided by regulations and may be limited. The capital loss carryforward information presented below, including any applicable limitation, is estimated as of prior fiscal period end and is subject to adjustment.
Short-term | $(531,240) |
Long-term | (340,454) |
| Total capital loss carryforward | $(871,694) |
4. Purchases and Sales of Investments.
Purchases and sales of securities, other than short-term securities and in-kind transactions, as applicable, are noted in the table below.
| | Purchases ($) | Sales ($) |
| Fidelity Advisor Global Real Estate Fund | 1,015,412 | 778,461 |
5. Fees and Other Transactions with Affiliates.
Management Fee. Fidelity Management & Research Company LLC (the investment adviser) and its affiliates provide the Fund with investment management related services for which the Fund pays a monthly management fee. The management fee is the sum of an individual fund fee rate that is based on an annual rate of .45% of the Fund's average net assets and an annualized group fee rate that averaged .22% during the period. The group fee rate is based upon the monthly average net assets of a group of registered investment companies with which the investment adviser has management contracts. The group fee rate decreases as assets under management increase and increases as assets under management decrease. For the reporting period, the total annualized management fee rate was .67% of the Fund's average net assets.
Distribution and Service Plan Fees. In accordance with Rule 12b-1 of the 1940 Act, the Fund has adopted separate Distribution and Service Plans for each class of shares. Certain classes pay Fidelity Distributors Company LLC (FDC), an affiliate of the investment adviser, separate Distribution and Service Fees, each of which is based on an annual percentage of each class' average net assets. In addition, FDC may pay financial intermediaries for selling shares of the Fund and providing shareholder support services. For the period, the Distribution and Service Fee rates, total fees and amounts retained by FDC were as follows:
| | Distribution Fee | Service Fee | Total Fees | Retained by FDC |
| Class A | -% | .25% | $3,306 | $1,347 |
| Class M | .25% | .25% | 2,186 | 1,316 |
| Class C | .75% | .25% | 1,164 | 405 |
| | | | $6,656 | $3,068 |
Sales Load. FDC may receive a front-end sales charge of up to 5.75% for selling Class A shares and 3.50% for selling Class M shares, some of which is paid to financial intermediaries for selling shares of the Fund. Depending on the holding period, FDC may receive contingent deferred sales charges levied on Class A, Class M and Class C redemptions. The deferred sales charges are 1.00% for Class C shares, 1.00% for certain purchases of Class A shares and .25% for certain purchases of Class M shares.
For the period, sales charge amounts retained by FDC were as follows:
| | Retained by FDC |
| Class A | $346 |
| Class M | 88 |
Class CA | 2 |
| | $436 |
A When Class C shares are initially sold, FDC pays commissions from its own resources to financial intermediaries through which the sales are made.
Transfer Agent Fees. Fidelity Investments Institutional Operations Company LLC (FIIOC), an affiliate of the investment adviser, is the transfer, dividend disbursing and shareholder servicing agent for each class of the Fund.
During November 2023, the Board approved a change in the transfer agent fees effective December 1, 2023 to a fixed annual rate of class-level average net assets as follows:
| | % of Class-Level Average Net Assets |
| Class A | 0.2000 |
| Class M | 0.1995 |
| Class C | 0.2000 |
| Class I | 0.1333 |
Prior to December 1, 2023, FIIOC received account fees and asset-based fees that varied according to the account size and type of account of the shareholders of the respective classes of the Fund, except for Class Z. FIIOC received an asset-based fee of Class Z's average net assets. FIIOC pays for typesetting, printing and mailing of shareholder reports, except proxy statements.
For the period, transfer agent fees for each class were as follows:
| | Amount | % of Class-Level Average Net AssetsA |
| Class A | $3,129 | .24 |
| Class M | 917 | .21 |
| Class C | 274 | .24 |
| Class I | 769 | .14 |
| Class Z | 54 | .04 |
| | $5,143 | |
A Annualized
Accounting Fees. Fidelity Service Company, Inc. (FSC), an affiliate of the investment adviser, maintains the Fund's accounting records.
During November 2023, the Board approved a change in the accounting fees effective December 1, 2023 to a fixed annual rate of average net assets as follows:
| | % of Average Net Assets |
| Fidelity Advisor Global Real Estate Fund | 0.0354 |
Prior to December 1, 2023, the accounting fee was based on the level of average net assets for each month. For the period, the fees were equivalent to the following annualized rates:
| | % of Average Net Assets |
| Fidelity Advisor Global Real Estate Fund | .04 |
Subsequent Event - Management Fee. Effective March 1, 2024, the Fund's management contract will be amended to incorporate administrative services previously covered under separate services agreements (Transfer Agent and Accounting agreements). The amended contract incorporates a management fee rate that may vary by class. The investment adviser or an affiliate will pay certain expenses of managing and operating the Fund out of each class's management fee.
Each class of the Fund will pay a management fee to the investment adviser. The management fee will be calculated and paid to the investment adviser every month.
When determining a class's management fee, a mandate rate will be calculated based on the monthly average net assets of a group of funds advised by FMR within a designated asset class. A discount rate will be subtracted from the mandate rate once the Fund's monthly average net assets reach a certain level. The mandate rate and discount rate may vary by class.
The annual management fee rate for a class of shares of the Fund will be the lesser of (1) the class's mandate rate reduced by the class's discount rate (if applicable) or (2) the amount set forth in the following table.
| | Maximum Management Fee Rate % |
| Class A | 0.87 |
| Class M | 0.87 |
| Class C | 0.87 |
| Class I | 0.80 |
| Class Z | 0.71 |
One-twelfth of the management fee rate for a class will be applied to the average net assets of the class for the month, giving a dollar amount which is the management fee for the class for that month.
A different management fee rate may be applicable to each class of the Fund. The difference between classes is the result of separate arrangements for class-level services and/or waivers of certain expenses. It is not the result of any difference in advisory or custodial fees or other expenses related to the management of the Fund's assets, which do not vary by class.
Effective March 1, 2024, the Fund's sub-advisory agreements with FMR Investment Management (UK) Limited, Fidelity Management & Research (Hong Kong) Limited, and Fidelity Management & Research (Japan) Limited will be amended to provide that the investment adviser will pay each sub-adviser monthly fees equal to 110% of the sub-adviser's costs for providing sub-advisory services.
Brokerage Commissions. A portion of portfolio transactions were placed with brokerage firms which are affiliates of the investment adviser. Brokerage commissions are included in net realized gain (loss) and change in net unrealized appreciation (depreciation) in the Statement of Operations. The commissions paid to these affiliated firms were as follows:
| | Amount |
| Fidelity Advisor Global Real Estate Fund | $ 40 |
Interfund Trades. Funds may purchase from or sell securities to other Fidelity Funds under procedures adopted by the Board. The procedures have been designed to ensure these interfund trades are executed in accordance with Rule 17a-7 of the 1940 Act. Any interfund trades are included within the respective purchases and sales amounts shown in the Purchases and Sales of Investments note. Interfund trades during the period are noted in the table below.
| | Purchases ($) | Sales ($) | Realized Gain (Loss) ($) |
| Fidelity Advisor Global Real Estate Fund | 61,945 | 46,575 | (6,336) |
6. Committed Line of Credit.
Certain Funds participate with other funds managed by the investment adviser or an affiliate in a $4.25 billion credit facility (the "line of credit") to be utilized for temporary or emergency purposes to fund shareholder redemptions or for other short-term liquidity purposes. The participating funds have agreed to pay commitment fees on their pro-rata portion of the line of credit, which are reflected in Miscellaneous expenses on the Statement of Operations, and are listed below. During the period, there were no borrowings on this line of credit.
| | Amount |
| Fidelity Advisor Global Real Estate Fund | $4 |
7. Expense Reductions.
The investment adviser contractually agreed to reimburse expenses of each class to the extent annual operating expenses exceeded certain levels of class-level average net assets as noted in the table below. This reimbursement will remain in place through November 30, 2024. Some expenses, for example the compensation of the independent Trustees, and certain miscellaneous expenses such as proxy and shareholder meeting expenses, are excluded from this reimbursement.
The following classes were in reimbursement during the period:
| | Expense Limitations | Reimbursement |
| Class A | 1.20% | $35,158 |
| Class M | 1.45% | 11,585 |
| Class C | 1.95% | 3,107 |
| Class I | .95% | 14,078 |
| Class Z | .80% | 3,165 |
| | | $67,093 |
Through arrangements with the Fund's custodian, credits realized as a result of certain uninvested cash balances were used to reduce the Fund's expenses. During the period, custodian credits reduced the Fund's expenses by $162.
In addition, during the period the investment adviser or an affiliate reimbursed and/or waived a portion of fund-level operating expenses in the amount of $224.
8. Distributions to Shareholders.
Distributions to shareholders of each class were as follows:
| | Six months ended January 31, 2024 | Year ended July 31, 2023 |
| Fidelity Advisor Global Real Estate Fund | | |
| Distributions to shareholders | | |
| Class A | $65,583 | $23,736 |
| Class M | 20,354 | 5,995 |
| Class C | 4,497 | 136 |
| Class I | 28,380 | 43,870 |
| Class Z | 8,978 | 2,304 |
Total | $127,792 | $76,041 |
9. Share Transactions.
Share transactions for each class were as follows and may contain in-kind transactions, automatic conversions between classes or exchanges between affiliated funds:
| | Shares | Shares | Dollars | Dollars |
| | Six months ended January 31, 2024 | Year ended July 31, 2023 | Six months ended January 31, 2024 | Year ended July 31, 2023 |
| Fidelity Advisor Global Real Estate Fund | | | | |
| Class A | | | | |
| Shares sold | 12,039 | 40,105 | $117,587 | $395,082 |
| Reinvestment of distributions | 6,294 | 2,489 | 65,583 | 23,736 |
| Shares redeemed | (16,426) | (41,363) | (158,655) | (410,949) |
| Net increase (decrease) | 1,907 | 1,231 | $24,515 | $7,869 |
| Class M | | | | |
| Shares sold | 7,581 | 7,122 | $77,861 | $70,044 |
| Reinvestment of distributions | 1,957 | 629 | 20,354 | 5,995 |
| Shares redeemed | (6,514) | (13,581) | (62,200) | (130,257) |
| Net increase (decrease) | 3,024 | (5,830) | $36,015 | $(54,218) |
| Class C | | | | |
| Shares sold | 8,077 | 5,080 | $79,880 | $50,554 |
| Reinvestment of distributions | 431 | 14 | 4,497 | 136 |
| Shares redeemed | (1,599) | (4,441) | (15,623) | (44,663) |
| Net increase (decrease) | 6,909 | 653 | $68,754 | $6,027 |
| Class I | | | | |
| Shares sold | 4,055 | 267,118 | $40,842 | $2,612,072 |
| Reinvestment of distributions | 2,677 | 4,304 | 27,921 | 41,084 |
| Shares redeemed | (12,409) | (315,343) | (114,474) | (3,144,342) |
| Net increase (decrease) | (5,677) | (43,921) | $(45,711) | $(491,186) |
| Class Z | | | | |
| Shares sold | 15,102 | 79,530 | $149,138 | $764,368 |
| Reinvestment of distributions | 577 | 240 | 6,068 | 2,304 |
| Shares redeemed | (1,734) | (176,559) | (17,511) | (1,717,435) |
| Net increase (decrease) | 13,945 | (96,789) | $137,695 | $(950,763) |
10. Other.
A fund's organizational documents provide former and current trustees and officers with a limited indemnification against liabilities arising in connection with the performance of their duties to the fund. In the normal course of business, a fund may also enter into contracts that provide general indemnifications. A fund's maximum exposure under these arrangements is unknown as this would be dependent on future claims that may be made against a fund. The risk of material loss from such claims is considered remote.
At the end of the period, the investment adviser or its affiliates were owners of record of more than 10% of the outstanding shares as follows:
| Fund | Affiliated % |
Fidelity Advisor Global Real Estate Fund | 46% |
11. Risk and Uncertainties.
Many factors affect a fund's performance. Developments that disrupt global economies and financial markets, such as pandemics, epidemics, outbreaks of infectious diseases, war, terrorism, and environmental disasters, may significantly affect a fund's investment performance. The effects of these developments to a fund will be impacted by the types of securities in which a fund invests, the financial condition, industry, economic sector, and geographic location of an issuer, and a fund's level of investment in the securities of that issuer. Significant concentrations in security types, issuers, industries, sectors, and geographic locations may magnify the factors that affect a fund's performance.
As a shareholder, you incur two types of costs: (1) transaction costs, which may include sales charges (loads) on purchase payments or redemption proceeds, as applicable and (2) ongoing costs, which generally include management fees, distribution and/or service (12b-1) fees and other Fund expenses. This Example is intended to help you understand your ongoing costs (in dollars) of investing in a fund and to compare these costs with the ongoing costs of investing in other mutual funds.
| The Example is based on an investment of $1,000 invested at the beginning of the period and held for the entire period (August 1, 2023 to January 31, 2024). |
Actual Expenses
The first line of the accompanying table provides information about actual account values and actual expenses. You may use the information in this line, together with the amount you invested, to estimate the expenses that you paid over the period. Simply divide your account value by $1,000.00 (for example, an $8,600 account value divided by $1,000.00 = 8.6), then multiply the result by the number in the first line for a class/Fund under the heading entitled "Expenses Paid During Period" to estimate the expenses you paid on your account during this period. If any fund is a shareholder of any underlying mutual funds or exchange-traded funds (ETFs) (the Underlying Funds), such fund indirectly bears its proportional share of the expenses of the Underlying Funds in addition to the direct expenses incurred presented in the table. These fees and expenses are not included in the annualized expense ratio used to calculate the expense estimate in the table below.
Hypothetical Example for Comparison Purposes
The second line of the accompanying table provides information about hypothetical account values and hypothetical expenses based on the actual expense ratio and an assumed rate of return of 5% per year before expenses, which is not the actual return. The hypothetical account values and expenses may not be used to estimate the actual ending account balance or expenses you paid for the period. You may use this information to compare the ongoing costs of investing in the Fund and other funds. To do so, compare this 5% hypothetical example with the 5% hypothetical examples that appear in the shareholder reports of the other funds. If any fund is a shareholder of any Underlying Funds, such fund indirectly bears its proportional share of the expenses of the Underlying Funds in addition to the direct expenses as presented in the table. These fees and expenses are not included in the annualized expense ratio used to calculate the expense estimate in the table below.
Please note that the expenses shown in the table are meant to highlight your ongoing costs only and do not reflect any transaction costs. Therefore, the second line of the table is useful in comparing ongoing costs only, and will not help you determine the relative total costs of owning different funds. In addition, if these transactional costs were included, your costs would have been higher.
| | | | | Annualized Expense Ratio- A | | Beginning Account Value August 1, 2023 | | Ending Account Value January 31, 2024 | | Expenses Paid During Period- C August 1, 2023 to January 31, 2024 |
| Fidelity Advisor® Global Real Estate Fund | | | | | | | | | | |
| Class A | | | | 1.19% | | | | | | |
| Actual | | | | | | $ 1,000 | | $ 1,014.60 | | $ 6.03 |
Hypothetical-B | | | | | | $ 1,000 | | $ 1,019.15 | | $ 6.04 |
| Class M | | | | 1.44% | | | | | | |
| Actual | | | | | | $ 1,000 | | $ 1,012.40 | | $ 7.28 |
Hypothetical-B | | | | | | $ 1,000 | | $ 1,017.90 | | $ 7.30 |
| Class C | | | | 1.94% | | | | | | |
| Actual | | | | | | $ 1,000 | | $ 1,009.80 | | $ 9.80 |
Hypothetical-B | | | | | | $ 1,000 | | $ 1,015.38 | | $ 9.83 |
| Class I | | | | .94% | | | | | | |
| Actual | | | | | | $ 1,000 | | $ 1,016.00 | | $ 4.76 |
Hypothetical-B | | | | | | $ 1,000 | | $ 1,020.41 | | $ 4.77 |
| Class Z | | | | .79% | | | | | | |
| Actual | | | | | | $ 1,000 | | $ 1,015.80 | | $ 4.00 |
Hypothetical-B | | | | | | $ 1,000 | | $ 1,021.17 | | $ 4.01 |
| |
A Annualized expense ratio reflects expenses net of applicable fee waivers.
B 5% return per year before expenses
C Expenses are equal to the annualized expense ratio, multiplied by the average account value over the period, multiplied by 184/ 366 (to reflect the one-half year period). The fees and expenses of any Underlying Funds are not included in each annualized expense ratio.
Board Approval of Investment Advisory Contracts
At its January 2024 meeting, the Board of Trustees, including the Independent Trustees (together, the Board), approved an amended and restated management contract with Fidelity Management & Research Company LLC (FMR) (the Management Contract), and amended and restated sub-advisory agreements (the Sub-Advisory Contracts, and together with the Management Contract, the Advisory Contracts) for the fund, including the fund's sub-advisory agreements with FMR Investment Management (UK) Limited (FMR UK), Fidelity Management & Research (Hong Kong) Limited (FMR H.K.), and Fidelity Management & Research (Japan) Limited (FMR Japan). The Advisory Contracts will be effective March 1, 2024. The Board will consider the annual renewal of the fund's Advisory Contracts in May 2024, following its review of additional materials provided by FMR.
Management Contract. The Board approved the Management Contract, which implements a new fee structure combining the management fee, transfer agent fee (TA Fee), and pricing and bookkeeping fee (P&B Fee) of the fund and each class into a single class-level fee based on tiered schedules and subject to a maximum class-level rate (the Unified Fee). In exchange for the Unified Fee, the fund will receive investment advisory, management, administrative, transfer agent, pricing and bookkeeping services under a single agreement - the Management Contract.
In its consideration of the Management Contract over several meetings, the Board received, reviewed and discussed a comprehensive set of analyses regarding the Unified Fee including (i) the legal framework, (ii) design goals for the Unified Fee, (iii) calculation methodology for the Unified Fee and illustrative examples, (iv) annual and cumulative projected impacts under various scenarios, both in the aggregate and at the fund/class level, (v) explanations of schedules, rate levers and maximum rates and (vi) shareholder benefits and projected savings.
The Board considered that the maximum Unified Fee for each class of the fund would be no higher than the sum of (i) the lowest contractual management fee rate under the fund's existing management contract, which is the individual fund fee rate, if any, plus the lowest contractual marginal group fee rate and (ii) the TA and P&B Fee rates, which are fixed fee rates since December 1, 2023 (together, the Unified Fee Cap). The Board noted that Fidelity has represented that, as a result of this Unified Fee Cap, the Unified Fee would be no greater than the fee rates previously authorized to be charged to the fund for the same services. The Board noted that certain expenses such as third-party expenses, Rule 12b-1 fees, and certain other miscellaneous expenses would be outside the scope of the Unified Fee and the calculation of such fees would not change as a result of the Unified Fee. The Board considered that, under the Management Contract, a different management fee rate will be applicable to each class of the fund. The Board noted that Fidelity has represented that the difference in expenses between classes is based on differences in class-specific expenses and not due to any difference in advisory or third-party custodial fees or other expenses related to the management of the fund's assets.
The Board considered Fidelity's representations that implementation of the Unified Fee, which includes the Unified Fee Cap, would cause all funds subject to the Unified Fee, including the fund, to experience an immediate reduction on contractual fee rates for services provided under the current management contracts. The Board considered that some funds would not experience lower net total fees as a result of existing fee caps. The Board further considered that, in addition to the contractual fee savings, the Unified Fee offers funds and their shareholders greater protection from future rate increases for services previously offered under separate agreements that are now covered by the Management Contract because such rate increases would require shareholder approval.
Sub-Advisory Contracts. In connection with the Unified Fee changes, the Board considered the Sub-Advisory Contracts, which simplified the calculation of the fees paid by FMR to the sub-advisers under the agreements. The Board noted that the agreements with FMR UK, FMR H.K., and FMR Japan were amended to provide that FMR will compensate each sub-adviser at a fee rate equal to 110% of the sub-adviser's costs incurred in providing services under the agreement. The Board considered that, under the Sub-Advisory Contracts, FMR, and not the fund, will continue to pay the sub-advisory fees to each applicable sub-adviser.
The Board further considered that the approval of the fund's Advisory Contracts will not result in any changes in the investment process or strategies employed in the management of the fund's assets or the day-to-day management of the fund or the persons primarily responsible for such management. Further, the Board considered that the Management Contract would not change the obligations and services of FMR and its affiliates on behalf of the fund, and, in particular, there would be no change in the nature and level of advisory, management, administration, transfer agent, and pricing and bookkeeping services provided to the fund by FMR, its affiliates, and each applicable sub-adviser.
In connection with its consideration of future renewals of the fund's Advisory Contracts, the Board will consider: (i) the nature, extent and quality of services provided to the funds, including shareholder and administrative services and investment performance; (ii) the competitiveness of the management fee and total expenses for the fund; (iii) the costs of the services and profitability, including the revenues earned and the expenses incurred in conducting the business of developing, marketing, distributing, managing, administering, and servicing the fund and its shareholders, to the extent applicable; and (iv) whether there have been economies of scale in respect of the Fidelity funds, whether the Fidelity funds (including the fund) have appropriately benefited from any such economies of scale, and whether there is the potential for realization of any further economies.
Based on its evaluation of all of the conclusions and representations noted above, and after considering all factors it believed relevant, the Board concluded that the fund's management fee structure is fair and reasonable, and that the fund's Advisory Contracts should be approved.
The Securities and Exchange Commission adopted Rule 22e-4 under the Investment Company Act of 1940 (the Liquidity Rule) to promote effective liquidity risk management throughout the open-end investment company industry, thereby reducing the risk that funds will be unable to meet their redemption obligations and mitigating dilution of the interests of fund shareholders.
The Fund has adopted and implemented a liquidity risk management program (the Program) reasonably designed to assess and manage the Fund's liquidity risk and to comply with the requirements of the Liquidity Rule. The Fund's Board of Trustees (the Board) has designated the Fund's investment adviser as administrator of the Program. The Fidelity advisers have established a Liquidity Risk Management Committee (the LRM Committee) to manage the Program for each of the Fidelity Funds. The LRM Committee monitors the adequacy and effectiveness of implementation of the Program and on a periodic basis assesses each Fund's liquidity risk based on a variety of factors including (1) the Fund's investment strategy, (2) portfolio liquidity and cash flow projections during normal and reasonably foreseeable stressed conditions, (3) shareholder redemptions, (4) borrowings and other funding sources and (5) certain factors specific to ETFs including the effect of the Fund's prices and spreads, market participants, and basket compositions on the overall liquidity of the Fund's portfolio, as applicable.
In accordance with the Program, each of the Fund's portfolio investments is classified into one of four defined liquidity categories based on a determination of a reasonable expectation for how long it would take to convert the investment to cash (or sell or dispose of the investment) without significantly changing its market value.
- Highly liquid investments - cash or convertible to cash within three business days or less
- Moderately liquid investments - convertible to cash in three to seven calendar days
- Less liquid investments - can be sold or disposed of, but not settled, within seven calendar days
- Illiquid investments - cannot be sold or disposed of within seven calendar days
Liquidity classification determinations take into account a variety of factors including various market, trading and investment-specific considerations, as well as market depth, and generally utilize analysis from a third-party liquidity metrics service.
The Liquidity Rule places a 15% limit on a fund's illiquid investments and requires funds that do not primarily hold assets that are highly liquid investments to determine and maintain a minimum percentage of the fund's net assets to be invested in highly liquid investments (highly liquid investment minimum or HLIM). The Program includes provisions reasonably designed to comply with the 15% limit on illiquid investments and for determining, periodically reviewing and complying with the HLIM requirement as applicable.
At a recent meeting of the Fund's Board of Trustees, the LRM Committee provided a written report to the Board pertaining to the operation, adequacy, and effectiveness of the Program for the period December 1, 2022 through November 30, 2023. The report concluded that the Program is operating effectively and is reasonably designed to assess and manage the Fund's liquidity risk.
1.9881281.107
AGRE-SANN-0324
Item 2.
Code of Ethics
Not applicable.
Item 3.
Audit Committee Financial Expert
Not applicable.
Item 4.
Principal Accountant Fees and Services
Not applicable.
Item 5.
Audit Committee of Listed Registrants
Not applicable.
Item 6.
Investments
(a)
Not applicable.
(b)
Not applicable
Item 7.
Disclosure of Proxy Voting Policies and Procedures for Closed-End Management Investment Companies
Not applicable.
Item 8.
Portfolio Managers of Closed-End Management Investment Companies
Not applicable.
Item 9.
Purchase of Equity Securities by Closed-End Management Investment Company and Affiliated Purchasers
Not applicable.
Item 10.
Submission of Matters to a Vote of Security Holders
There were no material changes to the procedures by which shareholders may recommend nominees to the Fidelity Advisor Series VII’s Board of Trustees.
Item 11.
Controls and Procedures
(a)(i) The President and Treasurer and the Chief Financial Officer have concluded that the Fidelity Advisor Series VII’s (the “Trust”) disclosure controls and procedures (as defined in Rule 30a-3(c) under the Investment Company Act) provide reasonable
assurances that material information relating to the Trust is made known to them by the appropriate persons, based on their evaluation of these controls and procedures as of a date within 90 days of the filing date of this report.
(a)(ii) There was no change in the Trust’s internal control over financial reporting (as defined in Rule 30a-3(d) under the Investment Company Act) that occurred during the period covered by this report that has materially affected, or is reasonably likely to materially affect, the Trust’s internal control over financial reporting.
Item 12.
Disclosure of Securities Lending Activities for Closed-End Management
Investment Companies
Not applicable.
Item 18.
Recovery of Erroneously Awarded Compensation
(a)
Not applicable.
(b)
Not applicable.
Item 19.
Exhibits
SIGNATURES
Pursuant to the requirements of the Securities Exchange Act of 1934 and the Investment Company Act of 1940, the registrant has duly caused this report to be signed on its behalf by the undersigned, thereunto duly authorized.
Fidelity Advisor Series VII
| |
By: | /s/Stacie M. Smith |
| Stacie M. Smith |
| President and Treasurer |
|
|
Date: | March 21, 2024 |
Pursuant to the requirements of the Securities Exchange Act of 1934 and the Investment Company Act of 1940, this report has been signed below by the following persons on behalf of the registrant and in the capacities and on the dates indicated.
| |
By: | /s/Stacie M. Smith |
| Stacie M. Smith |
| President and Treasurer |
|
|
Date: | March 21, 2024 |
| |
By: | /s/John J. Burke III |
| John J. Burke III |
| Chief Financial Officer |
|
|
Date: | March 21, 2024 |